UNITED STATES
SECURITIES AND EXCHANGE COMMISSION
Washington, D.C. 20549
FORM N-CSR
CERTIFIED SHAREHOLDER REPORT OF REGISTERED
MANAGEMENT INVESTMENT COMPANIES
Investment Company Act file number 811-7440
DIMENSIONAL EMERGING MARKETS VALUE FUND
(Exact name of registrant as specified in charter)
6300 Bee Cave Road, Building One, Austin, TX 78746
(Address of principal executive offices) (Zip code)
Catherine L. Newell, Esquire, President and General Counsel
Dimensional Emerging Markets Value Fund,
6300 Bee Cave Road, Building One, Austin, TX 78746
(Name and address of agent for service)
Registrant’s telephone number, including area code: 512-306-7400
Date of fiscal year end: October 31
Date of reporting period: October 31, 2021
| ITEM 1. | REPORTS TO STOCKHOLDERS. |

Annual Report
Year Ended: October 31, 2021
DFA INVESTMENT DIMENSIONS GROUP INC. / DIMENSIONAL INVESTMENT GROUP INC. / THE DFA INVESTMENT TRUST COMPANY / DIMENSIONAL EMERGING MARKETS VALUE FUND
DFA Investment Dimensions Group Inc.
Large Cap International Portfolio
International Core Equity Portfolio
Global Small Company Portfolio
International Small Company Portfolio
Japanese Small Company Portfolio
Asia Pacific Small Company Portfolio
United Kingdom Small Company Portfolio
Continental Small Company Portfolio
DFA International Real Estate Securities Portfolio
DFA Global Real Estate Securities Portfolio
DFA International Small Cap Value Portfolio
International Vector Equity Portfolio
International High Relative Profitability Portfolio
World ex U.S. Value Portfolio
World ex U.S. Core Equity Portfolio
World Core Equity Portfolio
Selectively Hedged Global Equity Portfolio
Emerging Markets Portfolio
Emerging Markets Small Cap Portfolio
Emerging Markets Value Portfolio
Emerging Markets Core Equity Portfolio
Emerging Markets Targeted Value Portfolio
Dimensional Investment Group Inc.
DFA International Value Portfolio
The DFA Investment Trust Company
The DFA International Value Series
The Japanese Small Company Series
The Asia Pacific Small Company Series
The United Kingdom Small Company Series
The Continental Small Company Series
The Canadian Small Company Series
The Emerging Markets Series
The Emerging Markets Small Cap Series
Dimensional Emerging Markets Value Fund

December 2021
Dear Shareholder,
As we near the end of a year that saw us mark four decades since our founding, we want to thank you for entrusting us with your investments. We built Dimensional to implement the great ideas in finance, with the goal of transforming the investor experience for the better.
We are proud of the role Dimensional has played over the past 40 years in helping drive down costs, providing solutions that can improve diversification, and contributing to investor education. We’re committed to continuing to enhance our research-driven strategies, our efficient implementation, and the services we provide.
Just this past year, we launched an expanded offering for separately managed accounts, broadened our suite of fixed income solutions, and became one of the first asset managers to convert mutual funds into exchange-traded funds, offering greater choice in how investors access Dimensional’s strategies.
We have always focused on empowering financial professionals so they can meet their clients’ evolving needs. The solutions we have recently developed will help further that mission, offering more ability to customize and tailor investments to investors’ specific situations. It’s all part of our enduring tradition of innovation to enable the best possible experience for investors.
For 40 years, we have trusted markets. And for 40 years, we have built trust with financial professionals and investors around the world. The advances made in the industry have been profound for investors, and we believe this is just the beginning. We look forward to many more years of innovating on behalf of our clients and investors.
| | |
| Sincerely, | | |
| |
 | |  |
| |
| David P. Butler | | Gerard O’Reilly |
| CO-CHIEF EXECUTIVE OFFICER | | CO-CHIEF EXECUTIVE OFFICER and |
| | CHIEF INVESTMENT OFFICER |
ANNUAL REPORT
Table of Contents
i
TABLE OF CONTENTS
CONTINUED
This report is submitted for the information of the Portfolio’s shareholders. It is not authorized for distribution to prospective investors unless preceded or accompanied by an effective prospectus.
ii
DFA INVESTMENT DIMENSIONS GROUP INC.
DIMENSIONAL INVESTMENT GROUP INC.
THE DFA INVESTMENT TRUST COMPANY
DIMENSIONAL EMERGING MARKETS VALUE FUND
DEFINITIONS OF ABBREVIATIONS AND FOOTNOTES
Schedules of Investments/Summary Schedules of Portfolio Holdings
| | |
| Investment Abbreviations | | |
ADR | | American Depositary Receipt |
SA | | Special Assessment |
REIT | | Real Estate Investment Trust |
GDR | | Global Depositary Receipt |
AUD | | Australian Dollars |
CHF | | Swiss Franc |
DKK | | Danish Krone |
EUR | | Euro |
GBP | | British Pounds |
HKD | | Hong Kong Dollar |
ILS | | Israeli New Shekel |
JPY | | Japanese Yen |
NOK | | Norwegian Krone |
SEK | | Swedish Krona |
| |
| Investment Footnotes | | |
» | | Securities that have been fair value factored. See Note B to Financial Statements. |
‡ | | Calculated as a percentage of total net assets. Percentages shown parenthetically next to the category headings have been calculated as a percentage of total investments. “Other Securities” are those securities that are not among the top 50 holdings in unaffiliated issuers of the Fund or do not represent more than 1.0% of the net assets of the Fund. Some of the individual securities within this category may include Total or Partial Securities on Loan and/or Non-Income Producing Securities. |
# | | Total or Partial Securities on Loan. |
* | | Non-Income Producing Securities. |
† | | See Note B to Financial Statements. |
@ | | Security purchased with cash collateral received from Securities on Loan. |
§ | | Affiliated Fund. |
†† | | Security valued using significant unobservable inputs (Level 3). |
W | | Rule 144A, Section 4(2), or other security that is restricted as to resale to institutional investors. This security has been deemed liquid based upon the Fund’s Liquidity Guidelines. The liquidity determination is unaudited. |
1
DEFINITIONS OF ABBREVIATIONS AND FOOTNOTES
CONTINUED
Financial Highlights
| | |
** | | The Net Investment Income (Loss) per share and the ratio of Net Investment Income to Average Net Assets includes the current year effect of an estimation related to a one time distribution from a real estate investment trust. Net Investment Income (Loss) per share, Net Gain (Loss) per share and the ratio of Net Investment Income to Average Net Assets for the DFA Global Real Estate Securities Portfolio would have been $0.39, $2.11 and 3.39%, respectively had the current year effect of this estimation not been considered. |
(A) | | Computed using average shares outstanding. |
(B) | | Non-Annualized |
(C) | | Represents the combined ratios for the respective Portfolio and its respective pro-rata share of its Master Fund(s) and/or Underlying Fund(s). |
(D) | | Annualized |
(E) | | Because of commencement of operations and related preliminary transaction costs, these ratios are not necessarily indicative of future ratios. |
(F) | | Represents the combined ratios for the respective Portfolio and its respective pro-rata share of its Master Fund(s). |
All Statements, Schedules and Notes to Financial Statements
| | |
— | | Amounts designated as — are either zero or rounded to zero. |
SEC | | Securities and Exchange Commission |
ʊ | | Commencement of Operations. |
2
DFA INVESTMENT DIMENSIONS GROUP INC.
PERFORMANCE CHARTS
(Unaudited)
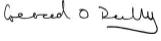
Large Cap International Portfolio vs.
MSCI World ex USA Index (net dividends)
October 31, 2011-October 31, 2021
| | |
 | | Past performance is not predictive of future performance. The returns shown do not reflect the deduction of taxes that a shareholder would pay on fund distributions or the redemption of fund shares. MSCI data © MSCI 2021, all rights reserved. |
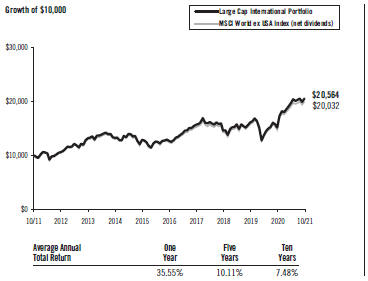
International Core Equity Portfolio vs.
MSCI World ex USA Index (net dividends)
October 31, 2011-October 31, 2021
| | |
 | | Past performance is not predictive of future performance. The returns shown do not reflect the deduction of taxes that a shareholder would pay on fund distributions or the redemption of fund shares. MSCI data © MSCI 2021, all rights reserved. |
3
DFA INVESTMENT DIMENSIONS GROUP INC.
PERFORMANCE CHARTS
(Unaudited)
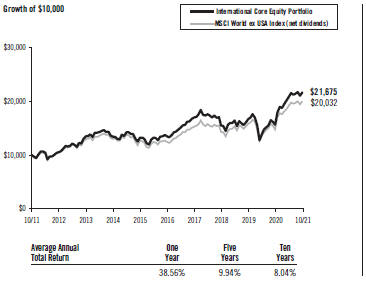
Global Small Company Portfolio vs.
MSCI All Country World Small Cap Index (net dividends)
January 18, 2017-October 31, 2021
| | |
 | | Past performance is not predictive of future performance. The returns shown do not reflect the deduction of taxes that a shareholder would pay on fund distributions or the redemption of fund shares. MSCI data © MSCI 2021, all rights reserved. |
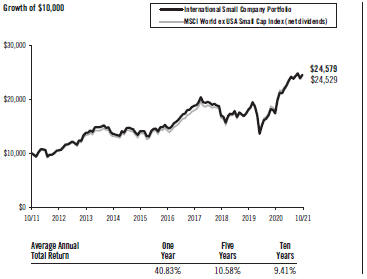
International Small Company Portfolio vs.
MSCI World ex USA Small Cap Index (net dividends)
October 31, 2011-October 31, 2021
| | |
 | | Past performance is not predictive of future performance. The returns shown do not reflect the deduction of taxes that a shareholder would pay on fund distributions or the redemption of fund shares. MSCI data © MSCI 2021, all rights reserved. |
4
DFA INVESTMENT DIMENSIONS GROUP INC.
PERFORMANCE CHARTS
(Unaudited)
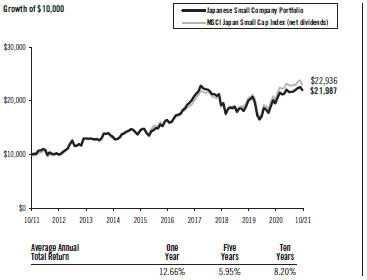
Japanese Small Company Portfolio vs.
MSCI Japan Small Cap Index (net dividends)
October 31, 2011-October 31, 2021
| | |
 | | Past performance is not predictive of future performance. The returns shown do not reflect the deduction of taxes that a shareholder would pay on fund distributions or the redemption of fund shares. MSCI data © MSCI 2021, all rights reserved. |
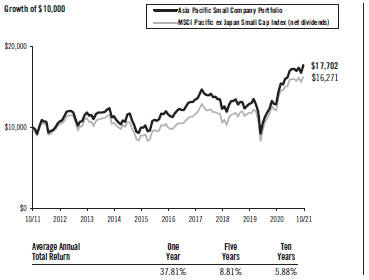
Asia Pacific Small Company Portfolio vs.
MSCI Pacific ex Japan Small Cap Index (net dividends)
October 31, 2011-October 31, 2021
| | |
 | | Past performance is not predictive of future performance. The returns shown do not reflect the deduction of taxes that a shareholder would pay on fund distributions or the redemption of fund shares. MSCI data © MSCI 2021, all rights reserved. |
5
DFA INVESTMENT DIMENSIONS GROUP INC.
PERFORMANCE CHARTS
(Unaudited)
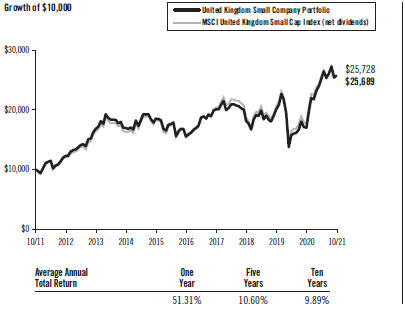
United Kingdom Small Company Portfolio vs.
MSCI United Kingdom Small Cap Index (net dividends)
October 31, 2011-October 31, 2021
| | |
 | | Past performance is not predictive of future performance. The returns shown do not reflect the deduction of taxes that a shareholder would pay on fund distributions or the redemption of fund shares. MSCI data © MSCI 2021, all rights reserved. |
Continental Small Company Portfolio vs.
MSCI Europe ex UK Small Cap Index (net dividends)
October 31, 2011-October 31, 2021
| | |
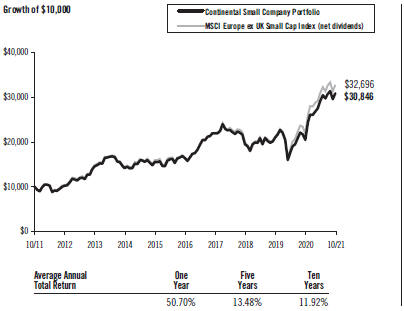 | | Past performance is not predictive of future performance. The returns shown do not reflect the deduction of taxes that a shareholder would pay on fund distributions or the redemption of fund shares. MSCI data © MSCI 2021, all rights reserved. |
6
DFA INVESTMENT DIMENSIONS GROUP INC.
PERFORMANCE CHARTS
(Unaudited)
DFA International Real Estate Securities Portfolio vs.
S&P Global ex U.S. REIT Index (net dividends)
October 31, 2011-October 31, 2021
| | |
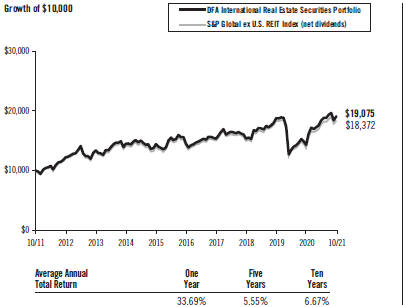 | | Past performance is not predictive of future performance. The returns shown do not reflect the deduction of taxes that a shareholder would pay on fund distributions or the redemption of fund shares. Copyright 2021 S&P Dow Jones Indices LLC, a division of S&P Global. All rights reserved. |
DFA Global Real Estate Securities Portfolio vs.
S&P Global REIT Index (net dividends)
October 31, 2011-October 31, 2021
| | |
 | | Past performance is not predictive of future performance. The returns shown do not reflect the deduction of taxes that a shareholder would pay on fund distributions or the redemption of fund shares. Copyright 2021 S&P Dow Jones Indices LLC, a division of S&P Global. All rights reserved. |
7
DFA INVESTMENT DIMENSIONS GROUP INC.
PERFORMANCE CHARTS
(Unaudited)
DFA International Small Cap Value Portfolio vs.
MSCI World ex USA Small Cap Index (net dividends)
October 31, 2011-October 31, 2021
| | |
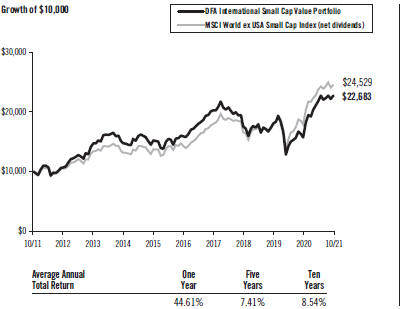 | | Past performance is not predictive of future performance. The returns shown do not reflect the deduction of taxes that a shareholder would pay on fund distributions or the redemption of fund shares. MSCI data © MSCI 2021, all rights reserved. |
International Vector Equity Portfolio vs.
MSCI World ex USA Index (net dividends)
October 31, 2011-October 31, 2021
| | |
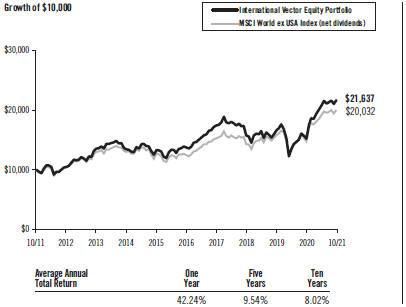 | | Past performance is not predictive of future performance. The returns shown do not reflect the deduction of taxes that a shareholder would pay on fund distributions or the redemption of fund shares. MSCI data © MSCI 2021, all rights reserved. |
8
DFA INVESTMENT DIMENSIONS GROUP INC.
PERFORMANCE CHARTS
(Unaudited)
International High Relative Profitability Portfolio vs.
MSCI World ex USA Index (net dividends)
May 16, 2017-October 31, 2021
| | |
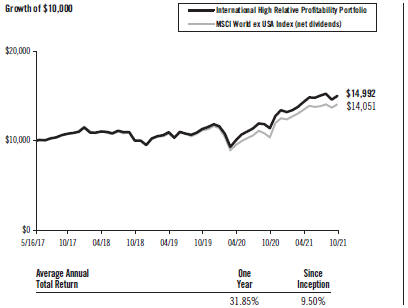 | | Past performance is not predictive of future performance. The returns shown do not reflect the deduction of taxes that a shareholder would pay on fund distributions or the redemption of fund shares. MSCI data © MSCI 2021, all rights reserved. |
World Ex U.S. Value Portfolio vs.
MSCI All Country World ex USA Index (net dividends)
October 31, 2011-October 31, 2021
| | |
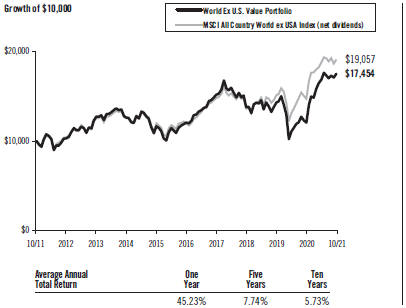 | | Past performance is not predictive of future performance. The returns shown do not reflect the deduction of taxes that a shareholder would pay on fund distributions or the redemption of fund shares. MSCI data © MSCI 2021, all rights reserved. |
9
DFA INVESTMENT DIMENSIONS GROUP INC.
PERFORMANCE CHARTS
(Unaudited)
World Ex U.S. Core Equity Portfolio vs.
MSCI All Country World ex USA Index (net dividends)
April 9, 2013-October 31, 2021
| | |
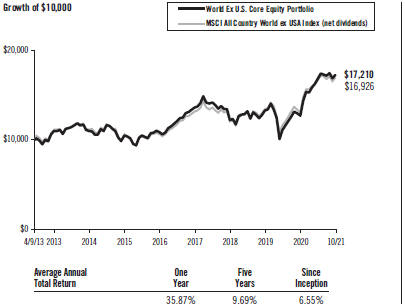 | | Past performance is not predictive of future performance. The returns shown do not reflect the deduction of taxes that a shareholder would pay on fund distributions or the redemption of fund shares. MSCI data © MSCI 2021, all rights reserved. |
World Core Equity Portfolio vs.
MSCI All Country World Index (net dividends)
March 7, 2012-October 31, 2021
| | |
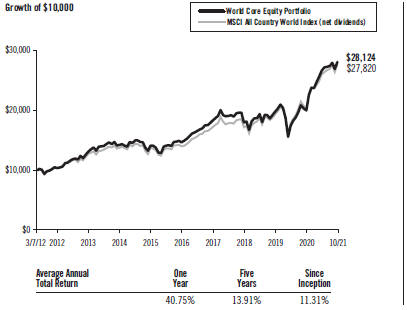 | | Past performance is not predictive of future performance. The returns shown do not reflect the deduction of taxes that a shareholder would pay on fund distributions or the redemption of fund shares. MSCI data © MSCI 2021, all rights reserved. |
10
DFA INVESTMENT DIMENSIONS GROUP INC.
PERFORMANCE CHARTS
(Unaudited)
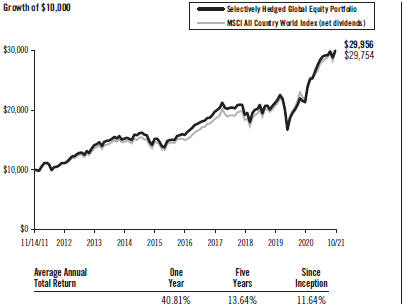
Selectively Hedged Global Equity Portfolio vs.
MSCI All Country World Index (net dividends)
November 14, 2011-October 31, 2021
| | |
 | | Past performance is not predictive of future performance. The returns shown do not reflect the deduction of taxes that a shareholder would pay on fund distributions or the redemption of fund shares. MSCI data © MSCI 2021, all rights reserved. |
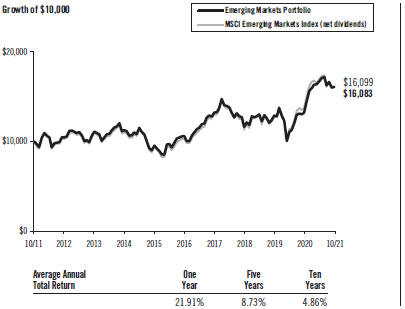
Emerging Markets Portfolio vs.
MSCI Emerging Markets Index (net dividends)
October 31, 2011-October 31, 2021
| | |
 | | Past performance is not predictive of future performance. The returns shown do not reflect the deduction of taxes that a shareholder would pay on fund distributions or the redemption of fund shares. MSCI data © MSCI 2021, all rights reserved. |
11
DFA INVESTMENT DIMENSIONS GROUP INC.
PERFORMANCE CHARTS
(Unaudited)
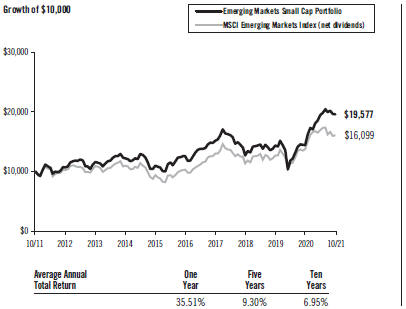
Emerging Markets Small Cap Portfolio vs.
MSCI Emerging Markets Index (net dividends)
October 31, 2011-October 31, 2021
| | |
 | | Past performance is not predictive of future performance. The returns shown do not reflect the deduction of taxes that a shareholder would pay on fund distributions or the redemption of fund shares. MSCI data © MSCI 2021, all rights reserved. |
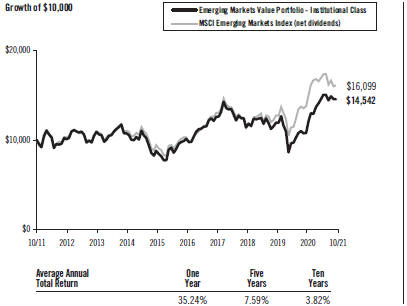
Emerging Markets Value Portfolio — Institutional Class vs.
MSCI Emerging Markets Index (net dividends)
October 31, 2011-October 31, 2021
| | |
 | | Past performance is not predictive of future performance. The returns shown do not reflect the deduction of taxes that a shareholder would pay on fund distributions or the redemption of fund shares. MSCI data © MSCI 2021, all rights reserved. |
12
DFA INVESTMENT DIMENSIONS GROUP INC.
PERFORMANCE CHARTS
(Unaudited)
Emerging Markets Value Portfolio — Class R2 vs.
MSCI Emerging Markets Index (net dividends)
October 31, 2011-October 31, 2021
| | |
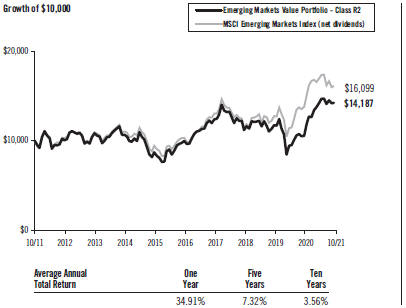 | | Past performance is not predictive of future performance. The returns shown do not reflect the deduction of taxes that a shareholder would pay on fund distributions or the redemption of fund shares. MSCI data © MSCI 2021, all rights reserved. |
Emerging Markets Core Equity Portfolio vs.
MSCI Emerging Markets Index (net dividends)
October 31, 2011-October 31, 2021
| | |
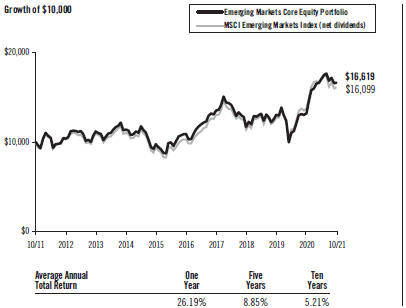 | | Past performance is not predictive of future performance. The returns shown do not reflect the deduction of taxes that a shareholder would pay on fund distributions or the redemption of fund shares. MSCI data © MSCI 2021, all rights reserved. |
13
DFA INVESTMENT DIMENSIONS GROUP INC.
PERFORMANCE CHARTS
(Unaudited)
Emerging Markets Targeted Value Portfolio vs.
MSCI Emerging Markets Index (net dividends)
November 14, 2018-October 31, 2021
| | |
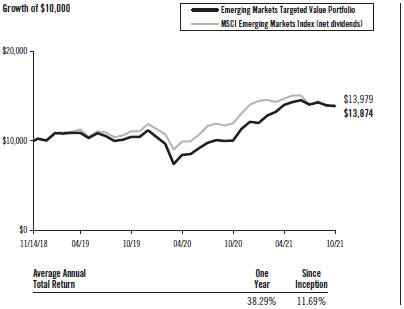 | | Past performance is not predictive of future performance. The returns shown do not reflect the deduction of taxes that a shareholder would pay on fund distributions or the redemption of fund shares. MSCI data © MSCI 2021, all rights reserved. |
14
MANAGEMENT’S DISCUSSION AND ANALYSIS
| | |
| International Equity Market Review | | 12 Months Ended October 31, 2021 |
Performance of non-U.S. developed markets was positive for the period. As measured by the MSCI World ex USA indices, small-cap stocks outperformed large-cap stocks, and mid-cap stocks, a subset of the large-cap universe, underperformed large-cap stocks and small-cap stocks. Value stocks outperformed growth stocks as measured by the MSCI World ex USA indices.
12 Months Ended October 31, 2021
| | | | |
| | | Return in U.S. Dollars | |
MSCI World ex USA Index | | | 35.59 | % |
MSCI World ex USA Mid Cap Index | | | 31.20 | % |
MSCI World ex USA Small Cap Index | | | 37.19 | % |
MSCI World ex USA Value Index | | | 40.88 | % |
MSCI World ex USA Growth Index | | | 30.25 | % |
For the 12 Months Ended October 31, 2021, the U.S. dollar appreciated against some non-U.S. developed markets currencies and depreciated against others. Overall, currency movements did not have a material overall impact on the U.S. dollar-denominated returns of developed markets.
12 Months Ended October 31, 2021
| | | | | | | | |
Ten Largest Foreign Developed Markets by Market Cap | | Local Return | | | Return in U.S. Dollars | |
Japan | | | 30.75 | % | | | 19.88 | % |
United Kingdom | | | 35.57 | % | | | 43.72 | % |
Canada | | | 38.56 | % | | | 49.05 | % |
France | | | 48.30 | % | | | 47.33 | % |
Switzerland | | | 28.36 | % | | | 28.75 | % |
Germany | | | 33.47 | % | | | 32.60 | % |
Australia | | | 27.93 | % | | | 36.82 | % |
Netherlands | | | 60.71 | % | | | 59.67 | % |
Sweden | | | 40.26 | % | | | 45.36 | % |
Hong Kong | | | 18.26 | % | | | 17.91 | % |
Source: Returns are of MSCI standard indices net of foreign withholding taxes on dividends. Copyright MSCI 2021, all rights reserved.
Emerging markets had positive performance for the period but underperformed both U.S. and non-U.S. developed markets. As measured by the MSCI Emerging Markets indices, small-cap stocks outperformed large-cap stocks, and mid-cap stocks, a subset of the large-cap universe, outperformed large-cap stocks but underperformed small-cap stocks. Value stocks outperformed growth stocks as measured by the MSCI Emerging Markets indices.
15
12 Months Ended October 31, 2021
| | | | |
| | | Return in U.S. Dollars | |
MSCI Emerging Markets Index | | | 16.96 | % |
MSCI Emerging Markets Mid Cap Index | | | 31.20 | % |
MSCI Emerging Markets Small Cap Index | | | 44.29 | % |
MSCI Emerging Markets Value Index | | | 28.31 | % |
MSCI Emerging Markets Growth Index | | | 7.38 | % |
For the 12 Months Ended October 31, 2021, the U.S. dollar depreciated against some emerging markets currencies and appreciated against others. Overall, currency movements had a positive impact on the U.S. dollar denominated returns of emerging markets.
12 Months Ended October 31, 2021
| | | | | | | | |
Ten Largest Emerging Markets by Market Cap Dollars | | Local Return | | | Return in U.S. | |
China | | | -9.52 | % | | | -9.21 | % |
Taiwan | | | 38.36 | % | | | 42.32 | % |
Korea | | | 27.78 | % | | | 24.08 | % |
India | | | 51.78 | % | | | 50.21 | % |
Russia | | | 64.53 | % | | | 81.80 | % |
Brazil | | | 10.38 | % | | | 12.91 | % |
Saudi Arabia | | | 56.07 | % | | | 56.04 | % |
South Africa | | | 18.16 | % | | | 26.32 | % |
Mexico | | | 42.35 | % | | | 47.44 | % |
Thailand | | | 34.75 | % | | | 26.57 | % |
Source: Returns are of MSCI standard indices net of foreign withholding taxes on dividends. Copyright MSCI 2021, all rights reserved.
For Portfolios investing in non-U.S. equities traded outside of the U.S. market time zone, differences in the valuation timing and methodology between a Portfolio and its benchmark index may impact relative performance over the referenced period. The Portfolios price foreign exchange rates at the closing of the U.S. market, while their benchmark indices use rates at 4 p.m. London time. The Portfolios also may use fair value pricing to price certain portfolio securities at the closing of the U.S. market, while benchmark indices may use local market closing prices. For the one-year period ended October 31, 2021, these differences generally detracted from the Portfolios’ relative performance.
Large Cap International Portfolio
The Large Cap International Portfolio invests in developed ex U.S. large company stocks. The investment strategy is process driven, emphasizing broad diversification. with increased exposure to stocks with smaller total market capitalizations, lower relative price (value) stocks, and higher-profitability stocks within the large-cap segment of developed ex U.S. markets. As of October 31, 2021, the Portfolio held approximately 1,380 securities in 22 eligible developed markets. Average cash exposure throughout the year was less than 1% of the Portfolio’s assets.
16
For the 12 months ended October 31, 2021, total returns were 35.55% for the Portfolio and 35.59% for the MSCI World ex USA Index (net dividends), the Portfolio’s benchmark. The Portfolio’s greater emphasis on higher-profitability stocks detracted from performance relative to the benchmark, as these stocks generally underperformed lower-profitability stocks. Conversely, the Portfolio’s emphasis on value stocks contributed positively to performance relative to the benchmark, as value stocks outperformed growth stocks in developed ex US markets. These two drivers offset each other, and the portfolio performed in line with the benchmark.
International Core Equity Portfolio
The International Core Equity Portfolio invests in a broadly diversified group of stocks in developed ex U.S. markets, with increased exposure to stocks with smaller market capitalization, lower relative price (value), and higher profitability. The investment strategy is process driven, emphasizing broad diversification. As of October 31, 2021, the Portfolio held approximately 5,270 securities in 22 eligible developed markets. Average cash exposure throughout the year was less than 1% of the Portfolio’s assets.
For the 12 months ended October 31, 2021, total returns were 38.56% for the Portfolio and 35.59% for the MSCI World ex USA Index (net dividends), the Portfolio’s benchmark. The Portfolio’s emphasis on low relative price (value) stocks contributed positively to performance relative to the benchmark, as value stocks outperformed high relative price (growth) stocks in developed ex US markets. With small-cap stocks outperforming large-cap stocks for the period, the Portfolio’s inclusion of and emphasis on small-caps also contributed positively to performance relative to the benchmark, which is composed primarily of large-and mid-cap stocks.
Global Small Company Portfolio
The Global Small Company Portfolio is designed to capture the returns of global small company stocks by purchasing shares of seven funds (which shall be collectively referred to below as the “Underlying Funds”) managed by Dimensional that individually invest in Canada, the United States, the United Kingdom, Europe (including Israel and excluding the U.K.), Japan, the Asia Pacific region (ex Japan), and emerging markets. The Underlying Funds generally exclude stocks with the lowest profitability and highest relative price. The Underlying Funds also generally exclude certain companies with high asset growth. The investment strategy is process driven, emphasizing broad diversification. As of October 31, 2021, the Underlying Funds collectively held approximately 11,420 securities in 44 eligible developed and emerging markets.
For the 12 months ended October 31, 2021, total returns were 49.81% for the Portfolio and 45.22% for the MSCI All Country World Small Cap Index (net dividends), the Portfolio’s benchmark. The Underlying Funds’ greater emphasis on stocks with smaller market capitalizations contributed positively to performance relative to the benchmark, as these stocks outperformed. The Underlying Funds’ exclusion of stocks with the lowest profitability and highest relative price also contributed positively to relative performance, as did the Underlying Funds’ exclusion of stocks with high asset growth, as those stocks underperformed.
17
International Small Company Portfolio
The International Small Company Portfolio invests in developed ex U.S. small company stocks by purchasing shares of five Master Funds managed by Dimensional that invest individually in Canada, the United Kingdom, Europe (including Israel and excluding the U.K.), Japan, and the Asia Pacific region (ex Japan). The Portfolio generally excludes stocks with the lowest profitability and highest relative price. Additionally, the Portfolio generally excludes certain companies with high asset growth. The investment strategy is process driven, emphasizing broad diversification. As of October 31, 2021, the Master Funds collectively held approximately 4,460 securities in 22 eligible developed markets. Average cash exposure throughout the year was less than 1% of the Portfolio’s assets.
For the 12 months ended October 31, 2021, total returns were 40.83% for the Portfolio and 37.19% for the MSCI World ex USA Small Cap Index (net dividends), the Portfolio’s benchmark. The Master Funds’ exclusion of stocks with the lowest profitability and highest relative price contributed positively to performance relative to the benchmark, as did the Master Funds’ exclusion of stocks with high asset growth, as those stocks underperformed. The Master Funds’ greater emphasis on stocks with smaller market capitalizations also contributed positively to performance relative to the benchmark, as these stocks outperformed.
Japanese Small Company Portfolio
The Japanese Small Company Portfolio invests in Japanese small company stocks by purchasing shares of the Japanese Small Company Series, a Master Fund managed by Dimensional that invests in such securities. The Master Fund generally excludes stocks with the lowest profitability and highest relative price. Additionally, the Master Fund generally excludes certain companies with high asset growth. The investment strategy is process driven, emphasizing broad diversification. As of October 31, 2021, the Master Fund held approximately 1,820 securities. Average cash exposure throughout the year was less than 1% of the Master Fund’s assets.
For the 12 months ended October 31, 2021, total returns were 12.66% for the Portfolio and 13.18% for the MSCI Japan Small Cap Index (net dividends), the Portfolio’s benchmark. The Master Fund’s greater emphasis on stocks with smaller market capitalizations detracted from performance relative to the benchmark, as these stocks underperformed. The Master Fund’s exclusion of real estate investment trusts (REITs) also detracted from relative performance, as REITs generally outperformed. Conversely, the Master Fund’s exclusion of stocks with the lowest profitability and highest relative price contributed positively to performance relative to the benchmark, as did the Master Fund’s exclusion of stocks with high asset growth, as those stocks underperformed.
Asia Pacific Small Company Portfolio
The Asia Pacific Small Company Portfolio invests in small company stocks in Australia, Hong Kong, New Zealand, and Singapore by purchasing shares of the Asia Pacific Small Company Series, a Master Fund managed by Dimensional that invests in such securities. The Master Fund generally excludes stocks with the lowest profitability and highest relative price. Additionally, the Master Fund generally excludes certain companies with high asset growth. The investment strategy is process driven, emphasizing broad diversification. As of October 31, 2021, the Master Fund held approximately 830 securities in 4 eligible countries. Average cash exposure throughout the year was less than 1% of the Master Fund’s assets.
18
For the 12 months ended October 31, 2021, total returns were 37.81% for the Portfolio and 34.27% for the MSCI Pacific ex Japan Small Cap Index (net dividends), the Portfolio’s benchmark. The Master Fund’s emphasis on stocks with smaller market capitalizations, particularly in Australia, contributed positively to performance relative to the benchmark, as larger stocks held by the index underperformed. The Master Fund’s exclusion of real estate investment trusts (REITs) also contributed positively to relative performance, as REITs generally underperformed.
United Kingdom Small Company Portfolio
The United Kingdom Small Company Portfolio invests in small company stocks in the U.K. by purchasing shares of The United Kingdom Small Company Series, a Master Fund managed by Dimensional that invests in such securities. The Master Fund generally excludes stocks with the lowest profitability and highest relative price. Additionally, the Master Fund generally excludes certain companies with high asset growth. The investment strategy is process driven, emphasizing broad diversification. As of October 31, 2021, the Master Fund held approximately 330 securities. Average cash exposure throughout the year was less than 1% of the Master Fund’s assets.
For the 12 months ended October 31, 2021, total returns were 51.31% for the Portfolio and 45.72% for the MSCI United Kingdom Small Cap Index (net dividends), the Portfolio’s benchmark. The Master Fund’s greater emphasis on stocks with smaller market capitalizations contributed positively to performance relative to the benchmark, as these stocks outperformed. The Master Fund’s exclusion of stocks with the lowest profitability and highest relative price also contributed positively to relative performance, as those securities underperformed for the period.
Continental Small Company Portfolio
The Continental Small Company Portfolio invests in small company stocks in the developed markets of Europe (excluding the U.K.) and Israel by purchasing shares of the Continental Small Company Series, a Master Fund managed by Dimensional that invests in such securities. The Master Fund generally excludes stocks with the lowest profitability and highest relative price. Additionally, the Master Fund generally excludes certain companies with high asset growth. The investment strategy is process driven, emphasizing broad diversification. As of October 31, 2021, the Master Fund held approximately 1,160 securities in 15 eligible countries. Average cash exposure throughout the year was less than 1% of the Portfolio’s assets.
For the 12 months ended October 31, 2021, total returns were 50.70% for the Portfolio and 49.80% for the MSCI Europe ex U.K. Small Cap Index (net dividends), the Portfolio’s benchmark. The Master Fund’s exclusion of stocks with the lowest profitability and highest relative price contributed positively to relative performance, as did the Master Fund’s exclusion of stocks with high asset growth, as those securities underperformed for the year. Additionally, the Master Fund’s exclusion of real estate investment trusts (REITs) contributed positively to relative performance, as REITs generally underperformed.
| | |
| Global Real Estate Market Review | | 12 Months Ended October 31, 2021 |
Publicly traded global real estate investment trusts (REITs) had positive returns for the period. Global REITs outperformed U.S., developed non-U.S., and emerging markets equities. The U.S. REIT market, the world’s largest, had positive performance for the period and outperformed non-U.S. REITs. Among non-U.S. REIT markets, South Africa, the Netherlands, and Canada were among the strongest performers, while Malaysia, New Zealand, and Singapore lagged. At the REIT industry level, retail REITs and hotel and resort REITs generally outperformed, while specialized and health care REITs generally underperformed.
19
12 Months Ended October 31, 2021
| | | | |
| | | Return in U.S. Dollars | |
Dow Jones U.S. Select REIT IndexSM | | | 56.10 | % |
S&P Global ex U.S. REIT Index | | | 32.85 | % |
S&P Global REIT Index | | | 44.12 | % |
Source: Returns are of Standard and Poor’s (S&P) indices net of foreign withholding taxes on dividends. Copyright S&P, 2021. All rights reserved. Dow Jones and S&P have different REIT eligibility criteria which can result in performance differences across different indices representing the same region.
For Portfolios investing in non-U.S. REITs and REIT-like securities traded outside of the U.S. market time zone, differences in the valuation timing and methodology between a Portfolio and its benchmark index may impact relative performance over the referenced period. The Portfolios price foreign exchange rates at the closing of the U.S. market, while their benchmark indices use rates at 4 p.m. London time. The Portfolios also may use fair value pricing to price certain portfolio securities at the closing of the U.S. market, while benchmark indices may use local market closing prices. For the one-year period ended October 31, 2021, these differences did not have material overall impact on the Portfolios’ relative performance.
DFA International Real Estate Securities Portfolio
The DFA International Real Estate Securities Portfolio invests in a broadly diversified portfolio of real estate securities in developed ex U.S. and emerging markets. As of October 31, 2021, the Portfolio held approximately 300 securities in 22 eligible developed ex U.S. and emerging markets. Average cash exposure throughout the year was less than 1% of the Portfolio’s assets.
For the 12 months ended October 31, 2021, total returns were 33.69% for the Portfolio and 32.85% for the S&P Global ex US REIT Index (net dividends), the Portfolio’s benchmark. Withholding tax rate differences between the Portfolio and the benchmark contributed positively to performance relative to the benchmark as the Portfolio’s actual tax rate was lower than the assumed tax rates of the benchmark. Additionally, Thailand is not an eligible market for the Portfolio but the benchmark holds Thai securities, which contributed positively to relative performance as those securities underperformed.
DFA Global Real Estate Securities Portfolio
The DFA Global Real Estate Securities Portfolio invests in a broadly diversified group of real estate securities in domestic and international markets, including emerging markets. During the period covered by this report, the Portfolio’s investments included the DFA International Real Estate Securities Portfolio, the DFA Real Estate Securities Portfolio, and individual securities. As of October 31, 2021, the Portfolio held, either directly or through the underlying portfolios, approximately 460 securities in 23 eligible developed and emerging markets. Average cash exposure throughout the year was less than 1% of the Portfolio’s assets.
20
For the 12 months ended October 31, 2021, total returns were 42.08% for the Portfolio and 44.12% for the S&P Global REIT Index (net dividends), the Portfolio’s benchmark. Differences in REIT eligibility between the Portfolio and the benchmark detracted from the Portfolio’s performance relative to the benchmark, most notably among tower REITs. The Portfolio includes tower REITs, which are excluded by the benchmark, and these securities generally underperformed.
| | |
| International Equity Market Review | | 12 Months Ended October 31, 2021 |
Performance of non-U.S. developed markets was positive for the period. As measured by the MSCI World ex USA indices, small-cap stocks outperformed large-cap stocks, and mid-cap stocks, a subset of the large-cap universe, underperformed large-cap stocks and small-cap stocks. Value stocks outperformed growth stocks as measured by the MSCI World ex USA indices.
12 Months Ended October 31, 2021
| | | | |
| | | Return in U.S. Dollars | |
MSCI World ex USA Index | | | 35.59 | % |
MSCI World ex USA Mid Cap Index | | | 31.20 | % |
MSCI World ex USA Small Cap Index | | | 37.19 | % |
MSCI World ex USA Value Index | | | 40.88 | % |
MSCI World ex USA Growth Index | | | 30.25 | % |
For the 12 Months Ended October 31, 2021, the U.S. dollar appreciated against some non-U.S. developed markets currencies and depreciated against others. Overall, currency movements did not have a material overall impact on the U.S. dollar-denominated returns of developed markets.
12 Months Ended October 31, 2021
| | | | | | | | |
Ten Largest Foreign Developed Markets by Market Cap | | Local Return | | | Return in U.S. Dollars | |
Japan | | | 30.75 | % | | | 19.88 | % |
United Kingdom | | | 35.57 | % | | | 43.72 | % |
Canada | | | 38.56 | % | | | 49.05 | % |
France | | | 48.30 | % | | | 47.33 | % |
Switzerland | | | 28.36 | % | | | 28.75 | % |
Germany | | | 33.47 | % | | | 32.60 | % |
Australia | | | 27.93 | % | | | 36.82 | % |
Netherlands | | | 60.71 | % | | | 59.67 | % |
Sweden | | | 40.26 | % | | | 45.36 | % |
Hong Kong | | | 18.26 | % | | | 17.91 | % |
Source: Returns are of MSCI standard indices net of foreign withholding taxes on dividends. Copyright MSCI 2021, all rights reserved.
21
Emerging markets had positive performance for the period but underperformed both U.S. and non-U.S. developed markets. As measured by the MSCI Emerging Markets indices, small-cap stocks outperformed large-cap stocks, and mid-cap stocks, a subset of the large-cap universe, outperformed large-cap stocks but underperformed small-cap stocks. Value stocks outperformed growth stocks as measured by the MSCI Emerging Markets indices.
12 Months Ended October 31, 2021
| | | | |
| | | Return in U.S. Dollars | |
MSCI Emerging Markets Index | | | 16.96 | % |
MSCI Emerging Markets Mid Cap Index | | | 31.20 | % |
MSCI Emerging Markets Small Cap Index | | | 44.29 | % |
MSCI Emerging Markets Value Index | | | 28.31 | % |
MSCI Emerging Markets Growth Index | | | 7.38 | % |
For the 12 Months Ended October 31, 2021, the U.S. dollar depreciated against some emerging markets currencies and appreciated against others. Overall, currency movements had a positive impact on the U.S. dollar denominated returns of emerging markets.
12 Months Ended October 31, 2021
| | | | | | | | |
Ten Largest Emerging Markets by Market Cap Dollars | | Local Return | | | Return in U.S. | |
China | | | -9.52 | % | | | -9.21 | % |
Taiwan | | | 38.36 | % | | | 42.32 | % |
Korea | | | 27.78 | % | | | 24.08 | % |
India | | | 51.78 | % | | | 50.21 | % |
Russia | | | 64.53 | % | | | 81.80 | % |
Brazil | | | 10.38 | % | | | 12.91 | % |
Saudi Arabia | | | 56.07 | % | | | 56.04 | % |
South Africa | | | 18.16 | % | | | 26.32 | % |
Mexico | | | 42.35 | % | | | 47.44 | % |
Thailand | | | 34.75 | % | | | 26.57 | % |
Source: Returns are of MSCI standard indices net of foreign withholding taxes on dividends. Copyright MSCI 2021, all rights reserved.
For Portfolios investing in non-U.S. equities traded outside of the U.S. market time zone, differences in the valuation timing and methodology between a Portfolio and its benchmark index may impact relative performance over the referenced period. The Portfolios price foreign exchange rates at the closing of the U.S. market, while their benchmark indices use rates at 4 p.m. London time. The Portfolios also may use fair value pricing to price certain portfolio securities at the closing of the U.S. market, while benchmark indices may use local market closing prices. For the one-year period ended October 31, 2021, these differences generally detracted from the Portfolios’ relative performance.
22
DFA International Small Cap Value Portfolio
The DFA International Small Cap Value Portfolio invests in small-cap value stocks in developed ex U.S. markets, with an emphasis on those with higher profitability. Additionally, the Portfolio generally excludes certain companies with high asset growth. The investment strategy is process driven, emphasizing broad diversification. As of October 31, 2021, the Portfolio held approximately 1,980 securities in 22 eligible developed markets. Average cash exposure throughout the year was less than 1% of the Portfolio’s assets.
For the 12 months ended October 31, 2021, total returns were 44.61% for the Portfolio and 37.19% for the MSCI World ex USA Small Cap Index (net dividends), the Portfolio’s benchmark. With low relative price (value) stocks outperforming high relative price (growth) stocks, the Portfolio’s focus on value stocks contributed positively to performance relative to the style-neutral benchmark.
International Vector Equity Portfolio
The International Vector Equity Portfolio invests in a broadly diversified group of stocks in developed ex U.S. markets, with increased exposure to stocks with smaller market capitalization, lower relative price (value), and higher profitability. The Portfolio’s increased exposure to small capitalization and value stocks may be achieved by decreasing the allocation to or excluding the largest high relative price (growth) stocks in developed ex U.S. markets. The investment strategy is process driven, emphasizing broad diversification. As of October 31, 2021, the Portfolio held approximately 5,000 securities in 22 eligible developed markets. Average cash exposure throughout the year was less than 1% of the Portfolio’s assets.
For the 12 months ended October 31, 2021, total returns were 42.24% for the Portfolio and 35.59% for the MSCI World ex USA Index (net dividends), the Portfolio’s benchmark. With low relative price (value) stocks outperforming high relative price (growth) stocks, the Portfolio’s greater emphasis on value stocks contributed positively to performance relative to the style-neutral benchmark. The Portfolio’s inclusion of and emphasis on stocks with smaller market capitalizations also contributed positively to performance relative to the benchmark, which is composed primarily of large-and mid-cap stocks, as small caps outperformed large caps.
International High Relative Profitability Portfolio
The International High Relative Profitability Portfolio invests in developed ex U.S. large-cap stocks with higher profitability. The investment strategy is process driven, emphasizing broad diversification, with increased exposure to stocks with smaller total market capitalizations, lower relative price (value), and higher profitability within the large cap high relative profitability segment of developed ex U.S. markets. As of October 31, 2021, the Portfolio held approximately 550 securities in 22 eligible developed markets. Average cash exposure throughout the year was less than 1% of the Portfolio’s assets.
For the 12 months ended October 31, 2021, total returns were 31.85% for the Portfolio and 35.59% for the MSCI World ex USA Index (net dividends), the Portfolio’s benchmark. The Portfolio’s focus on stocks with high profitability detracted from performance relative to the benchmark, as high-profitability stocks generally underperformed low profitability stocks for the period.
23
World ex U.S. Value Portfolio
The World ex U.S. Value Portfolio is designed to capture the returns of value stocks across all market capitalizations in developed ex U.S. and emerging markets. The Portfolio may pursue its objective by holding direct securities; by purchasing shares of funds managed by Dimensional: the DFA International Value Series, the DFA International Small Cap Value Portfolio, and the Dimensional Emerging Markets Value Fund (the “Underlying Funds”); or by a combination of securities and Underlying Funds. The investment strategy is process driven, emphasizing broad diversification. As of October 31, 2021, the Portfolio, directly and through the Underlying Funds, held approximately 5,690 securities in 44 eligible developed ex U.S. and emerging markets.
For the 12 months ended October 31, 2021, total returns were 45.23% for the Portfolio and 29.66% for the MSCI All Country World ex USA Index (net dividends), the Portfolio’s benchmark. The Underlying Funds’ focus on low relative price (value) stocks contributed positively to performance relative to the style-neutral benchmark, as value stocks outperformed high relative price (growth) stocks globally. With small-caps outperforming large-caps globally for the period, the Underlying Funds’ inclusion of and emphasis on small-cap stocks also contributed positively to performance relative to the benchmark, which is composed primarily of large- and mid-cap stocks.
World ex U.S. Core Equity Portfolio
The World ex U.S. Core Equity Portfolio invests in a broadly diversified group of stocks in developed ex U.S. and emerging markets with increased exposure to stocks with smaller market capitalization, lower relative price (value), and higher profitability. The investment strategy is process driven, emphasizing broad diversification. As of October 31, 2021, the Portfolio held approximately 9,790 securities in 46 eligible developed ex U.S. and emerging markets. Average cash exposure throughout the year was less than 1% of the Portfolio’s assets.
For the 12 months ended October 31, 2021, total returns were 35.87% for the Portfolio and 29.66% for the MSCI All Country World ex USA Index (net dividends), the Portfolio’s benchmark. The Portfolio’s greater emphasis on low relative price (value) stocks contributed positively to performance relative to the benchmark, as value stocks outperformed high relative price (growth) stocks in developed ex U.S. and emerging markets. With small-caps outperforming large-caps in developed ex U.S. and emerging markets for the period, the Portfolio’s inclusion of and emphasis on small-cap stocks also contributed positively to performance relative to the benchmark, which is composed primarily of large- and mid-cap stocks.
World Core Equity Portfolio
The World Core Equity Portfolio seeks long-term capital appreciation generally by investing in a combination of mutual funds managed by Dimensional. During the period covered by this report, the Portfolio’s investments included the U.S. Core Equity 1 Portfolio, International Core Equity Portfolio, and Emerging Markets Core Equity Portfolio (collectively, the “Underlying Funds”). The investment strategy is process driven, emphasizing broad diversification. As of October 31, 2021, the Underlying Funds collectively held more than 14,130 equity securities in 47 eligible developed and emerging markets.
For the 12 months ended October 31, 2021, total returns were 40.75% for the Portfolio and 37.28% for the MSCI All Country World Index (net dividends), the Portfolio’s benchmark. With low relative price (value) stocks outperforming high relative price (growth) stocks globally, the Underlying Funds’ greater emphasis on value stocks contributed positively to performance relative to the benchmark. With small-caps outperforming large-caps globally for the period, the Underlying Funds’ inclusion of and emphasis on small-cap stocks also contributed positively to performance relative to the benchmark, which is composed primarily of large- and mid-cap stocks.
24
Selectively Hedged Global Equity Portfolio
The Selectively Hedged Global Equity Portfolio seeks long-term capital appreciation by investing in a combination of other mutual funds managed by Dimensional. During the period covered by this report, the Portfolio invests in the U.S. Core Equity 2 Portfolio, International Core Equity Portfolio, and Emerging Markets Core Equity Portfolio (the “Underlying Funds”). The Portfolio hedges foreign currency exposure on a selective basis to capture positive forward currency premiums. The investment strategy is process driven, emphasizing broad diversification. As of October 31, 2021, the Underlying Funds collectively held approximately 14,180 securities in 47 eligible developed and emerging markets.
For the 12 months ended October 31, 2021, total returns were 40.81% for the Portfolio and 37.28% for the MSCI All Country World Index (net dividends), the Portfolio’s benchmark. With low relative price (value) stocks outperforming high relative price (growth) stocks globally, the Underlying Funds’ greater emphasis on value stocks contributed positively to performance relative to the benchmark. With small-caps outperforming large-caps globally for the period, the Underlying Funds’ inclusion of and emphasis on small-cap stocks also contributed positively to performance relative to the benchmark, which is composed primarily of large- and mid-cap stocks. The Portfolio’s strategy of selectively hedging foreign currency exposure contributed positively to performance relative to the benchmark (which does not hedge currency exposure), as the U.S. dollar generally strengthened against the currencies to which the Portfolio had hedged its exposure.
Emerging Markets Portfolio
The Emerging Markets Portfolio invests in large-cap stocks in emerging markets by purchasing shares of The Emerging Markets Series, a Master Fund managed by Dimensional that invests in such securities. The investment strategy is process driven, emphasizing broad diversification with increased exposure to stocks with smaller market capitalizations, lower relative price (value), and higher-profitability within the large-cap segment of emerging markets. As of October 31, 2021, the Master Fund held approximately 1,720 securities in 24 eligible emerging markets. Average cash exposure throughout the year was less than 1% of the Master Fund’s assets.
For the 12 months ended October 31, 2021, total returns were 21.91% for the Portfolio and 16.96% for the MSCI Emerging Markets Index (net dividends), the Portfolio’s benchmark. The Master Fund’s greater emphasis on low relative price (value) stocks contributed positively to performance relative to the benchmark, as value stocks outperformed high relative price (growth) stocks in emerging markets for the period. The Master Fund’s greater allocation to stocks with smaller market capitalizations within the large cap universe also contributed positively to relative performance, as these stocks outperformed their larger counterparts in emerging markets. The Master Fund’s emphasis on stocks with higher profitability also contributed positively to performance relative to the benchmark, as these stocks generally outperformed.
Emerging Markets Small Cap Portfolio
The Emerging Markets Small Cap Portfolio invests in small company stocks in emerging markets by purchasing shares of The Emerging Markets Small Cap Series, a Master Fund managed by Dimensional that invests in such securities. The Master Fund generally excludes stocks with the lowest profitability and highest relative price. Additionally, the Master Fund generally excludes certain companies that with high asset growth. The Master Fund’s investment strategy is process driven, emphasizing broad diversification. As of October 31, 2021, the Master Fund held approximately 4,960 securities in 21 eligible emerging markets. Average cash exposure throughout the year was less than 1% of the Master Fund’s assets.
25
For the 12 months ended October 31, 2021, total returns were 35.51% for the Portfolio and 16.96% for the MSCI Emerging Markets Index (net dividends), the Portfolio’s benchmark. With small-cap stocks outperforming large-cap stocks in emerging markets, the Master Fund’s inclusion of stocks with smaller market capitalizations contributed positively to performance relative to the benchmark, which is composed primarily of large- and mid-cap stocks.
Emerging Markets Value Portfolio
The Emerging Markets Value Portfolio invests in value stocks of large and small companies in emerging markets by purchasing shares of the Dimensional Emerging Markets Value Fund, a Master Fund managed by Dimensional that invests in such securities. The investment strategy is process driven, emphasizing broad diversification with increased exposure to stocks with smaller market capitalizations, lower relative price (value), and higher profitability within the value segment of emerging markets. As of October 31, 2021, the Master Fund held approximately 3,260 securities in 22 eligible emerging markets. Average cash exposure throughout the year was less than 1% of the Master Fund’s assets.
For the 12 months ended October 31, 2021, total returns were 34.91% for the Portfolio’s Class R2 shares, 35.24% for the Portfolio’s Institutional Class shares, and 16.96% for the MSCI Emerging Markets Index (net dividends), the Portfolio’s benchmark. The Master Fund’s focus on low relative price (value) stocks contributed positively to performance relative to the style-neutral benchmark, as value stocks outperformed high relative price (growth) stocks in emerging markets for the period. With small-cap stocks outperforming large-cap stocks, the Master Fund’s inclusion of small-caps also contributed positively to performance relative to the benchmark, which is composed primarily of large- and mid-cap stocks.
Emerging Markets Core Equity Portfolio
The Emerging Markets Core Equity Portfolio invests in a broadly diversified group of stocks in emerging markets, with increased exposure to stocks with smaller market capitalization, lower relative price (value), and higher profitability. The investment strategy is process driven, emphasizing broad diversification. As of October 31, 2021, the Portfolio held approximately 6,340 securities in 24 eligible emerging markets. Average cash exposure throughout the year was less than 1% of the Portfolio’s assets.
For the 12 months ended October 31, 2021, total returns were 26.19% for the Portfolio and 16.96% for the MSCI Emerging Markets Index (net dividends), the Portfolio’s benchmark. With low relative price (value) stocks outperforming high relative price (growth) stocks, the Portfolio’s greater emphasis on value stocks contributed positively to performance relative to the benchmark. With small-cap stocks outperforming large-cap stocks in emerging markets for the period, the Portfolio’s inclusion of and emphasis on small-caps also contributed positively to performance relative to the benchmark, which is composed primarily of large- and mid-cap stocks.
26
Emerging Markets Targeted Value Portfolio
The Emerging Markets Targeted Value Portfolio invests in value stocks of small- and mid-cap companies in emerging markets. The investment strategy is process driven, emphasizing broad diversification with increased exposure to smaller total market capitalizations, lower relative price (value) stocks, and higher-profitability stocks within the small- and mid-cap value segment of emerging markets. Additionally, the Portfolio generally excludes certain companies with high asset growth. As of October 31, 2021, the Portfolio held approximately 2,710 securities in 21 eligible emerging markets. Average cash exposure throughout the year was less than 1% of the Portfolio’s assets.
For the 12 months ended October 31, 2021, total returns were 38.29% for the Portfolio and 16.96% for the MSCI Emerging Markets Index (net dividends), the Portfolio’s benchmark. The Portfolio’s focus on low relative price (value) stocks contributed positively to performance relative to the style-neutral benchmark, as value stocks outperformed high relative price (growth) stocks in emerging markets for the period. With small-cap and mid-cap stocks outperforming large-cap stocks, the Portfolio’s focus on small- and mid-cap stocks also contributed positively to relative performance, which is composed primarily of large- and mid-cap stocks.
27
DFA INVESTMENT DIMENSIONS GROUP INC.
DISCLOSURE OF FUND EXPENSES
(Unaudited)
The following Expense Tables are shown so that you can understand the impact of fees on your investment. All mutual funds have operating expenses. As a shareholder of the fund, you incur ongoing costs, which include costs for portfolio management, administrative services, and shareholder reports, among others. Operating expenses and legal and audit services, which are deducted from a fund’s gross income, directly reduce the investment return of the fund. A fund’s expenses are expressed as a percentage of its average net assets. This figure is known as the expense ratio. The following examples are intended to help you understand the ongoing costs, in dollars, of investing in the fund and to compare these costs with those of other mutual funds. The examples are based on an investment of $1,000 made at the beginning of the period shown and held for the entire period.
The Expense Tables below illustrate your fund’s costs in two ways.
Actual Fund Return
This section helps you to estimate the actual expenses after fee waivers that you paid over the period. The “Ending Account Value” shown is derived from the fund’s actual return, and “Expenses Paid During Period” reflects the dollar amount that would have been paid by an investor who started with $1,000 in the fund. You may use the information here, together with the amount you invested, to estimate the expenses that you paid over the period.
To do so, simply divide your account value by $1,000 (for example, a $7,500 account value divided by $1,000 = 7.5), then multiply the result by the number given for your fund under the heading “Expenses Paid During Period.”
Hypothetical Example for Comparison Purposes
This section is intended to help you compare your fund’s costs with those of other mutual funds. The hypothetical “Ending Account Value” and “Expenses Paid During Period” are derived from the fund’s actual expense ratio and an assumed 5% annual return before expenses. In this case, because the return used is not the fund’s actual return, the results do not apply to your investment. The example is useful in making comparisons because the SEC requires all mutual funds to calculate expenses based on a 5% annual return. You can assess your fund’s costs by comparing this hypothetical example with the hypothetical examples that appear in shareholder reports of other funds.
Please note that the expenses shown in the tables are meant to highlight and help you compare ongoing costs only and do not reflect any transactional costs, if applicable. The “Annualized Expense Ratio” represents the actual expenses for the six-month period indicated.
Six Months Ended October 31, 2021
EXPENSE TABLES
| | | | | | | | | | | | | | | | |
| | | Beginning
Account
Value
05/01/21 | | | Ending
Account
Value
10/31/21 | | | Annualized
Expense
Ratio (1) | | | Expenses
Paid
During
Period (1) | |
Large Cap International Portfolio | | | | | | | | | | | | | | | | |
Actual Fund Return | | $ | 1,000.00 | | | $ | 1,045.30 | | | | 0.19 | % | | $ | 0.98 | |
Hypothetical 5% Annual Return | | $ | 1,000.00 | | | $ | 1,024.25 | | | | 0.19 | % | | $ | 0.97 | |
International Core Equity Portfolio | | | | | | | | | | | | | | | | |
Actual Fund Return | | $ | 1,000.00 | | | $ | 1,042.30 | | | | 0.25 | % | | $ | 1.29 | |
Hypothetical 5% Annual Return | | $ | 1,000.00 | | | $ | 1,023.95 | | | | 0.25 | % | | $ | 1.28 | |
28
DISCLOSURE OF FUND EXPENSES
CONTINUED
| | | | | | | | | | | | | | | | |
| | | Beginning
Account
Value
05/01/21 | | | Ending
Account
Value
10/31/21 | | | Annualized
Expense
Ratio (1) | | | Expenses
Paid
During
Period (1) | |
Global Small Company Portfolio (2) | | | | | | | | | | | | | | | | |
Actual Fund Return | | $ | 1,000.00 | | | $ | 1,041.60 | | | | 0.47 | % | | $ | 2.42 | |
Hypothetical 5% Annual Return | | $ | 1,000.00 | | | $ | 1,022.84 | | | | 0.47 | % | | $ | 2.40 | |
International Small Company Portfolio (2) | | | | | | | | | | | | | | | | |
Actual Fund Return | | $ | 1,000.00 | | | $ | 1,045.20 | | | | 0.46 | % | | $ | 2.37 | |
Hypothetical 5% Annual Return | | $ | 1,000.00 | | | $ | 1,022.89 | | | | 0.46 | % | | $ | 2.35 | |
Japanese Small Company Portfolio (3) | | | | | | | | | | | | | | | | |
Actual Fund Return | | $ | 1,000.00 | | | $ | 1,015.30 | | | | 0.47 | % | | $ | 2.39 | |
Hypothetical 5% Annual Return | | $ | 1,000.00 | | | $ | 1,022.84 | | | | 0.47 | % | | $ | 2.40 | |
Asia Pacific Small Company Portfolio (3) | | | | | | | | | | | | | | | | |
Actual Fund Return | | $ | 1,000.00 | | | $ | 1,041.00 | | | | 0.48 | % | | $ | 2.47 | |
Hypothetical 5% Annual Return | | $ | 1,000.00 | | | $ | 1,022.79 | | | | 0.48 | % | | $ | 2.45 | |
United Kingdom Small Company Portfolio (3) | | | | | | | | | | | | | | | | |
Actual Fund Return | | $ | 1,000.00 | | | $ | 1,015.30 | | | | 0.59 | % | | $ | 3.00 | |
Hypothetical 5% Annual Return | | $ | 1,000.00 | | | $ | 1,022.23 | | | | 0.59 | % | | $ | 3.01 | |
Continental Small Company Portfolio (3) | | | | | | | | | | | | | | | | |
Actual Fund Return | | $ | 1,000.00 | | | $ | 1,057.00 | | | | 0.47 | % | | $ | 2.44 | |
Hypothetical 5% Annual Return | | $ | 1,000.00 | | | $ | 1,022.84 | | | | 0.47 | % | | $ | 2.40 | |
DFA International Real Estate Securities Portfolio | | | | | | | | | | | | | | | | |
Actual Fund Return | | $ | 1,000.00 | | | $ | 1,037.00 | | | | 0.27 | % | | $ | 1.39 | |
Hypothetical 5% Annual Return | | $ | 1,000.00 | | | $ | 1,023.84 | | | | 0.27 | % | | $ | 1.38 | |
DFA Global Real Estate Securities Portfolio (4) | | | | | | | | | | | | | | | | |
Actual Fund Return | | $ | 1,000.00 | | | $ | 1,089.30 | | | | 0.24 | % | | $ | 1.26 | |
Hypothetical 5% Annual Return | | $ | 1,000.00 | | | $ | 1,024.00 | | | | 0.24 | % | | $ | 1.22 | |
DFA International Small Cap Value Portfolio | | | | | | | | | | | | | | | | |
Actual Fund Return | | $ | 1,000.00 | | | $ | 1,040.70 | | | | 0.53 | % | | $ | 2.73 | |
Hypothetical 5% Annual Return | | $ | 1,000.00 | | | $ | 1,022.53 | | | | 0.53 | % | | $ | 2.70 | |
International Vector Equity Portfolio | | | | | | | | | | | | | | | | |
Actual Fund Return | | $ | 1,000.00 | | | $ | 1,043.00 | | | | 0.42 | % | | $ | 2.16 | |
Hypothetical 5% Annual Return | | $ | 1,000.00 | | | $ | 1,023.09 | | | | 0.42 | % | | $ | 2.14 | |
International High Relative Profitability Portfolio | | | | | | | | | | | | | | | | |
Actual Fund Return | | $ | 1,000.00 | | | $ | 1,051.40 | | | | 0.30 | % | | $ | 1.55 | |
Hypothetical 5% Annual Return | | $ | 1,000.00 | | | $ | 1,023.69 | | | | 0.30 | % | | $ | 1.53 | |
29
DISCLOSURE OF FUND EXPENSES
CONTINUED
| | | | | | | | | | | | | | | | |
| | | Beginning
Account
Value
05/01/21 | | | Ending
Account
Value
10/31/21 | | | Annualized
Expense
Ratio (1) | | | Expenses
Paid
During
Period (1) | |
World ex U.S. Value Portfolio (2) | | | | | | | | | | | | | | | | |
Actual Fund Return | | $ | 1,000.00 | | | $ | 1,037.20 | | | | 0.44 | % | | $ | 2.26 | |
Hypothetical 5% Annual Return | | $ | 1,000.00 | | | $ | 1,022.99 | | | | 0.44 | % | | $ | 2.24 | |
World ex U.S. Core Equity Portfolio | | | | | | | | | | | | | | | | |
Actual Fund Return | | $ | 1,000.00 | | | $ | 1,023.90 | | | | 0.32 | % | | $ | 1.63 | |
Hypothetical 5% Annual Return | | $ | 1,000.00 | | | $ | 1,023.59 | | | | 0.32 | % | | $ | 1.63 | |
World Core Equity Portfolio (2) | | | | | | | | | | | | | | | | |
Actual Fund Return | | $ | 1,000.00 | | | $ | 1,055.60 | | | | 0.28 | % | | $ | 1.45 | |
Hypothetical 5% Annual Return | | $ | 1,000.00 | | | $ | 1,023.79 | | | | 0.28 | % | | $ | 1.43 | |
Selectively Hedged Global Equity Portfolio (2) | | | | | | | | | | | | | | | | |
Actual Fund Return | | $ | 1,000.00 | | | $ | 1,054.70 | | | | 0.32 | % | | $ | 1.66 | |
Hypothetical 5% Annual Return | | $ | 1,000.00 | | | $ | 1,023.59 | | | | 0.32 | % | | $ | 1.63 | |
Emerging Markets Portfolio (3) | | | | | | | | | | | | | | | | |
Actual Fund Return | | $ | 1,000.00 | | | $ | 963.10 | | | | 0.39 | % | | $ | 1.93 | |
Hypothetical 5% Annual Return | | $ | 1,000.00 | | | $ | 1,023.24 | | | | 0.39 | % | | $ | 1.99 | |
Emerging Markets Small Cap Portfolio (3) | | | | | | | | | | | | | | | | |
Actual Fund Return | | $ | 1,000.00 | | | $ | 1,006.80 | | | | 0.63 | % | | $ | 3.19 | |
Hypothetical 5% Annual Return | | $ | 1,000.00 | | | $ | 1,022.03 | | | | 0.63 | % | | $ | 3.21 | |
Emerging Markets Value Portfolio (3) | | | | | | | | | | | | | | | | |
Actual Fund Return | | | | | | | | | | | | | | | | |
Class R2 Shares | | $ | 1,000.00 | | | $ | 998.50 | | | | 0.74 | % | | $ | 3.73 | |
Institutional Class Shares | | $ | 1,000.00 | | | $ | 999.50 | | | | 0.49 | % | | $ | 2.47 | |
Hypothetical 5% Annual Return | | | | | | | | | | | | | | | | |
Class R2 Shares | | $ | 1,000.00 | | | $ | 1,021.48 | | | | 0.74 | % | | $ | 3.77 | |
Institutional Class Shares | | $ | 1,000.00 | | | $ | 1,022.74 | | | | 0.49 | % | | $ | 2.50 | |
Emerging Markets Core Equity Portfolio | | | | | | | | | | | | |
Actual Fund Return | | $ | 1,000.00 | | | $ | 975.10 | | | | 0.42 | % | | $ | 2.09 | |
Hypothetical 5% Annual Return | | $ | 1,000.00 | | | $ | 1,023.09 | | | | 0.42 | % | | $ | 2.14 | |
Emerging Markets Targeted Value Portfolio | | | | | | | | | | | | |
Actual Fund Return | | $ | 1,000.00 | | | $ | 991.70 | | | | 0.72 | % | | $ | 3.61 | |
Hypothetical 5% Annual Return | | $ | 1,000.00 | | | $ | 1,021.58 | | | | 0.72 | % | | $ | 3.67 | |
| (1) | Expenses are equal to the fund’s annualized expense ratio for the six-month period, multiplied by the average account value over the period, multiplied by the number of days in the most recent six-month period (184), then divided by the number of days in the year (365) to reflect the six-month period. |
30
DISCLOSURE OF FUND EXPENSES
CONTINUED
| (2) | The Portfolio is a Fund of Funds. The expenses shown reflect the direct expenses of the Fund of Funds and the Fund of Funds’ portion of the expenses of its Underlying Funds (Affiliated Investment Companies). |
| (3) | The Portfolio is a Feeder Fund. The expenses shown reflect the direct expenses of the Feeder Fund and the allocation of the Feeder Fund’s portion of the expenses of its Master Fund (Affiliated Investment Company). |
| (4) | The Portfolio invests directly and indirectly through other funds. The expenses shown reflect the direct expenses of the fund and the fund’s portion of the expenses of its Master and/or Underlying Funds (Affiliated Investment Companies). |
31
DFA INVESTMENT DIMENSIONS GROUP INC.
DISCLOSURE OF PORTFOLIO HOLDINGS
(Unaudited)
The SEC requires that all funds file a complete Schedule of Investments with the SEC for their first and third fiscal quarters as an exhibit to their reports on Form N-PORT. For DFA Investment Dimensions Group Inc., this would be for the fiscal quarters ending January 31 and July 31. Such Form N-PORT filing must be made within 60 days of the end of the quarter. DFA Investment Dimensions Group Inc. filed its most recent Form N-PORT with the SEC on September 24, 2021. They are available upon request, without charge, by calling collect: (512) 306-7400; by mailing a request to Dimensional Fund Advisors LP, 6300 Bee Cave Road, Building One, Austin, TX 78746; or by visiting the SEC’s website at http://www.sec.gov.
SEC regulations permit a fund to include in its reports to shareholders a “Summary Schedule of Portfolio Holdings” in lieu of a full Schedule of Investments. The Summary Schedule of Portfolio Holdings reports the fund’s 50 largest holdings in unaffiliated issuers and any investments that exceed one percent of the fund’s net assets at the end of the reporting period. The regulations also require that the Summary Schedule of Portfolio Holdings identify each category of investments that are held.
A fund is required to file a complete Schedule of Investments with the SEC on Form N-CSR within ten days after mailing the annual and semi-annual reports to shareholders. It will be available upon request, without charge, by calling collect: (512) 306-7400; by mailing a request to Dimensional Fund Advisors LP, 6300 Bee Cave Road, Building One, Austin, TX 78746; or by visiting the SEC’s website at http://www.sec.gov.
PORTFOLIO HOLDINGS
The SEC requires that all funds present their categories of portfolio holdings in a table, chart, or graph format in their annual and semi-annual shareholder reports, whether or not a Schedule of Investments is used. The following table, which presents portfolio holdings as a percentage of total investments before short-term investments and collateral for loaned securities, is provided in compliance with this requirement. The categories shown below represent broad industry sectors. Each industry sector consists of one or more specific industry classifications.
The categories of industry classification for the Affiliated Investment Companies are represented in their Disclosures of Portfolio Holdings, which are included elsewhere in the report. Refer to the Schedule of Investments/Summary Schedule of Portfolio Holdings for each of the underlying Affiliated Investment Company’s holdings, which reflect the investments by category or country.
FEEDER FUNDS
| | | | |
| | | Affiliated Investment Companies | |
Japanese Small Company Portfolio | | | 100.0 | % |
Asia Pacific Small Company Portfolio | | | 100.0 | % |
United Kingdom Small Company Portfolio | | | 100.0 | % |
Continental Small Company Portfolio | | | 100.0 | % |
Emerging Markets Portfolio | | | 100.0 | % |
Emerging Markets Small Cap Portfolio | | | 100.0 | % |
Emerging Markets Value Portfolio | | | 100.0 | % |
FUNDS OF FUNDS
| | | | |
| | | Affiliated Investment Companies | |
Global Small Company Portfolio | | | 100.0 | % |
International Small Company Portfolio | | | 100.0 | % |
World ex U.S. Value Portfolio | | | 100.0 | % |
World Core Equity Portfolio | | | 100.0 | % |
Selectively Hedged Global Equity Portfolio | | | 100.0 | % |
32
DISCLOSURE OF PORTFOLIO HOLDINGS
CONTINUED
INTERNATIONAL EQUITY PORTFOLIOS
| | | | |
| Large Cap International Portfolio | |
Communication Services | | | 5.4 | % |
Consumer Discretionary | | | 12.8 | % |
Consumer Staples | | | 9.7 | % |
Energy | | | 4.7 | % |
Financials | | | 16.5 | % |
Health Care | | | 10.8 | % |
Industrials | | | 16.9 | % |
Information Technology | | | 8.6 | % |
Materials | | | 9.6 | % |
Real Estate | | | 1.6 | % |
Utilities | | | 3.4 | % |
| | | | |
| | | 100.0 | % |
| | | | |
| International Core Equity Portfolio | |
Communication Services | | | 5.4 | % |
Consumer Discretionary | | | 14.0 | % |
Consumer Staples | | | 7.7 | % |
Energy | | | 5.1 | % |
Financials | | | 15.6 | % |
Health Care | | | 7.7 | % |
Industrials | | | 19.3 | % |
Information Technology | | | 7.7 | % |
Materials | | | 11.9 | % |
Real Estate | | | 2.4 | % |
Utilities | | | 3.2 | % |
| | | | |
| | | 100.0 | % |
| | | | |
DFA International Real Estate Securities
Portfolio | |
Real Estate | | | 100.0 | % |
| | | | |
| | | 100.0 | % |
| | | | |
| DFA Global Real Estate Securities Portfolio | |
Affiliated Investment Companies | | | 42.8 | % |
Real Estate | | | 57.2 | % |
| | | | |
| | | 100.0 | % |
| | | | |
DFA International Small Cap Value
Portfolio | |
Communication Services | | | 3.0 | % |
Consumer Discretionary | | | 13.5 | % |
Consumer Staples | | | 4.6 | % |
Energy | | | 6.9 | % |
Financials | | | 21.8 | % |
Health Care | | | 2.5 | % |
Industrials | | | 22.9 | % |
Information Technology | | | 3.9 | % |
Materials | | | 16.0 | % |
Real Estate | | | 3.4 | % |
Utilities | | | 1.5 | % |
| | | | |
| | | 100.0 | % |
| | | | |
| International Vector Equity Portfolio | |
Communication Services | | | 5.1 | % |
Consumer Discretionary | | | 13.1 | % |
Consumer Staples | | | 6.5 | % |
Energy | | | 5.9 | % |
Financials | | | 18.8 | % |
Health Care | | | 5.6 | % |
Industrials | | | 20.4 | % |
Information Technology | | | 7.0 | % |
Materials | | | 12.6 | % |
Real Estate | | | 2.6 | % |
Utilities | | | 2.4 | % |
| | | | |
| | | 100.0 | % |
| | | | |
International High Relative Profitability
Portfolio | |
Communication Services | | | 8.4 | % |
Consumer Discretionary | | | 16.6 | % |
Consumer Staples | | | 11.2 | % |
Energy | | | 2.2 | % |
Financials | | | 6.1 | % |
Health Care | | | 13.1 | % |
Industrials | | | 19.6 | % |
Information Technology | | | 10.9 | % |
Materials | | | 8.9 | % |
Real Estate | | | 0.6 | % |
Utilities | | | 2.4 | % |
| | | | |
| | | 100.0 | % |
| | | | |
| World ex U.S. Core Equity Portfolio | |
Communication Services | | | 5.7 | % |
Consumer Discretionary | | | 13.4 | % |
Consumer Staples | | | 7.4 | % |
Energy | | | 5.0 | % |
Financials | | | 15.7 | % |
Health Care | | | 6.4 | % |
Industrials | | | 16.6 | % |
Information Technology | | | 11.4 | % |
Materials | | | 12.0 | % |
Real Estate | | | 3.2 | % |
Utilities | | | 3.2 | % |
| | | | |
| | | 100.0 | % |
| | | | |
| Emerging Markets Core Equity Portfolio | |
Communication Services | | | 8.2 | % |
Consumer Discretionary | | | 12.5 | % |
Consumer Staples | | | 6.1 | % |
Energy | | | 5.0 | % |
Financials | | | 16.5 | % |
Health Care | | | 4.0 | % |
Industrials | | | 8.4 | % |
Information Technology | | | 20.8 | % |
Materials | | | 11.6 | % |
Real Estate | | | 3.7 | % |
Utilities | | | 3.2 | % |
| | | | |
| | | 100.0 | % |
| | | | |
| Emerging Markets Targeted Value Portfolio | |
Communication Services | | | 3.7 | % |
Consumer Discretionary | | | 10.2 | % |
Consumer Staples | | | 5.1 | % |
Energy | | | 3.2 | % |
Financials | | | 17.4 | % |
Health Care | | | 4.5 | % |
Industrials | | | 16.1 | % |
Information Technology | | | 12.9 | % |
Materials | | | 16.8 | % |
Real Estate | | | 6.9 | % |
Utilities | | | 3.2 | % |
| | | | |
| | | 100.0 | % |
33
LARGE CAP INTERNATIONAL PORTFOLIO
SUMMARY SCHEDULE OF PORTFOLIO HOLDINGS
October 31, 2021
| | | | | | | | | | | | | | |
| | | | | Shares | | | Value» | | | Percentage
of Net Assets‡ | |
COMMON STOCKS — (94.7%) | | | | | | | | | | | | |
AUSTRALIA — (5.9%) | | | | | | | | | | | | |
# | | BHP Group Ltd. | | | 697,375 | | | $ | 19,154,786 | | | | 0.3 | % |
| | Commonwealth Bank of Australia | | | 310,658 | | | | 24,623,436 | | | | 0.4 | % |
| | CSL Ltd. | | | 124,326 | | | | 28,289,174 | | | | 0.5 | % |
| | National Australia Bank Ltd. | | | 811,247 | | | | 17,638,112 | | | | 0.3 | % |
| | Other Securities | | | | | | | 278,968,879 | | | | 4.6 | % |
| | | | | | | | | | | | | | |
TOTAL AUSTRALIA | | | | | | | 368,674,387 | | | | 6.1 | % |
| | | | | | | | | | | | | | |
AUSTRIA — (0.2%) | | | | | | | | | | | | |
| | Other Securities | | | | | | | 13,795,690 | | | | 0.2 | % |
| | | | | | | | | | | | | | |
BELGIUM — (0.8%) | | | | | | | | | | | | |
| | Other Securities | | | | | | | 53,333,536 | | | | 0.9 | % |
| | | | | | | | | | | | | | |
CANADA — (10.2%) | | | | | | | | | | | | |
| | Bank of Montreal | | | 161,778 | | | | 17,554,531 | | | | 0.3 | % |
| | Canadian National Railway Co. | | | 142,360 | | | | 18,919,984 | | | | 0.3 | % |
| | Royal Bank of Canada | | | 310,579 | | | | 32,327,720 | | | | 0.5 | % |
| | Royal Bank of Canada | | | 206,240 | | | | 21,451,022 | | | | 0.4 | % |
* | | Shopify, Inc., Class A | | | 12,023 | | | | 17,634,495 | | | | 0.3 | % |
# | | Toronto-Dominion Bank | | | 286,785 | | | | 20,794,780 | | | | 0.3 | % |
| | Other Securities | | | | | | | 506,410,874 | | | | 8.4 | % |
| | | | | | | | | | | | | | |
TOTAL CANADA | | | | 635,093,406 | | | | 10.5 | % |
| | | | | | | | | | | | | | |
DENMARK — (2.3%) | | | | | | | | | | | | |
| | Novo Nordisk AS, Class B | | | 461,515 | | | | 50,607,362 | | | | 0.8 | % |
| | Other Securities | | | | | | | 92,833,766 | | | | 1.6 | % |
| | | | | | | | | | | | | | |
TOTAL DENMARK | | | | 143,441,128 | | | | 2.4 | % |
| | | | | | | | | | | | | | |
FINLAND — (1.2%) | | | | | | | | | | | | |
| | Other Securities | | | | | | | 78,570,294 | | | | 1.3 | % |
| | | | | | | | | | | | | | |
FRANCE — (9.2%) | | | | | | | | | | | | |
| | Air Liquide SA | | | 137,694 | | | | 22,989,071 | | | | 0.4 | % |
* | | Airbus SE | | | 172,375 | | | | 22,112,614 | | | | 0.4 | % |
# | | BNP Paribas SA | | | 263,532 | | | | 17,640,097 | | | | 0.3 | % |
# | | Cie Generale des Etablissements Michelin SCA | | | 108,150 | | | | 17,003,063 | | | | 0.3 | % |
| | L’Oreal SA | | | 51,173 | | | | 23,409,331 | | | | 0.4 | % |
| | LVMH Moet Hennessy Louis Vuitton SE | | | 80,391 | | | | 63,036,311 | | | | 1.0 | % |
| | Sanofi | | | 213,213 | | | | 21,415,989 | | | | 0.4 | % |
| | Schneider Electric SE | | | 116,541 | | | | 20,093,775 | | | | 0.3 | % |
| | TotalEnergies SE | | | 551,438 | | | | 27,613,230 | | | | 0.5 | % |
| | Other Securities | | | | | | | 338,616,033 | | | | 5.5 | % |
| | | | | | | | | | | | | | |
TOTAL FRANCE | | | | 573,929,514 | | | | 9.5 | % |
| | | | | | | | | | | | | | |
GERMANY — (6.8%) | | | | | | | | | | | | |
| | Bayer AG | | | 332,314 | | | | 18,728,437 | | | | 0.3 | % |
| | Daimler AG | | | 320,152 | | | | 31,779,061 | | | | 0.5 | % |
| | Deutsche Post AG | | | 337,563 | | | | 20,897,505 | | | | 0.3 | % |
| | Deutsche Telekom AG | | | 1,271,712 | | | | 23,650,219 | | | | 0.4 | % |
| | SAP SE | | | 212,517 | | | | 30,774,818 | | | | 0.5 | % |
34
LARGE CAP INTERNATIONAL PORTFOLIO
CONTINUED
| | | | | | | | | | | | |
| | | Shares | | | Value» | | | Percentage
of Net Assets‡ | |
GERMANY — (Continued) | | | | | | | | | | | | |
Siemens AG | | | 146,649 | | | $ | 23,842,470 | | | | 0.4 | % |
Other Securities | | | | | | | 275,187,107 | | | | 4.6 | % |
| | | | | | | | | | | | |
TOTAL GERMANY | | | | | | | 424,859,617 | | | | 7.0 | % |
| | | | | | | | | | | | |
HONG KONG — (2.2%) | | | | | | | | | | | | |
AIA Group Ltd. | | | 3,249,000 | | | | 36,411,572 | | | | 0.6 | % |
Hong Kong Exchanges & Clearing Ltd. | | | 349,451 | | | | 21,051,524 | | | | 0.4 | % |
Other Securities | | | | | | | 79,524,888 | | | | 1.3 | % |
| | | | | | | | | | | | |
TOTAL HONG KONG | | | | | | | 136,987,984 | | | | 2.3 | % |
| | | | | | | | | | | | |
IRELAND — (0.6%) | | | | | | | | | | | | |
Other Securities | | | | | | | 38,275,588 | | | | 0.6 | % |
| | | | | | | | | | | | |
ISRAEL — (0.6%) | | | | | | | | | | | | |
Other Securities | | | | | | | 37,231,801 | | | | 0.6 | % |
| | | | | | | | | | | | |
ITALY — (2.0%) | | | | | | | | | | | | |
Enel SpA | | | 2,271,536 | | | | 19,016,805 | | | | 0.3 | % |
Other Securities | | | | | | | 105,047,911 | | | | 1.8 | % |
| | | | | | | | | | | | |
TOTAL ITALY | | | | | | | 124,064,716 | | | | 2.1 | % |
| | | | | | | | | | | | |
JAPAN — (21.0%) | | | | | | | | | | | | |
Hitachi Ltd. | | | 297,615 | | | | 17,149,927 | | | | 0.3 | % |
KDDI Corp. | | | 742,300 | | | | 22,699,521 | | | | 0.4 | % |
Keyence Corp. | | | 32,004 | | | | 19,318,086 | | | | 0.3 | % |
Recruit Holdings Co. Ltd. | | | 356,200 | | | | 23,694,067 | | | | 0.4 | % |
SoftBank Group Corp. | | | 428,176 | | | | 23,180,319 | | | | 0.4 | % |
Sony Group Corp. | | | 367,700 | | | | 42,578,294 | | | | 0.7 | % |
Tokyo Electron Ltd. | | | 43,700 | | | | 20,365,638 | | | | 0.4 | % |
Toyota Motor Corp. | | | 2,420,615 | | | | 42,709,706 | | | | 0.7 | % |
Other Securities | | | | | | | 1,100,287,924 | | | | 18.2 | % |
| | | | | | | | | | | | |
TOTAL JAPAN | | | | | | | 1,311,983,482 | | | | 21.8 | % |
| | | | | | | | | | | | |
NETHERLANDS — (4.4%) | | | | | | | | | | | | |
ASML Holding NV | | | 30,871 | | | | 25,094,815 | | | | 0.4 | % |
ASML Holding NV | | | 74,552 | | | | 60,601,830 | | | | 1.0 | % |
Koninklijke Ahold Delhaize NV | | | 678,021 | | | | 22,057,687 | | | | 0.4 | % |
Stellantis NV | | | 850,830 | | | | 16,988,474 | | | | 0.3 | % |
Other Securities | | | | | | | 150,780,777 | | | | 2.5 | % |
| | | | | | | | | | | | |
TOTAL NETHERLANDS | | | | | | | 275,523,583 | | | | 4.6 | % |
| | | | | | | | | | | | |
NEW ZEALAND — (0.4%) | | | | | | | | | | | | |
Other Securities | | | | | | | 22,492,321 | | | | 0.4 | % |
| | | | | | | | | | | | |
NORWAY — (0.7%) | | | | | | | | | | | | |
Other Securities | | | | | | | 46,171,001 | | | | 0.8 | % |
| | | | | | | | | | | | |
PORTUGAL — (0.2%) | | | | | | | | | | | | |
Other Securities | | | | | | | 12,070,216 | | | | 0.2 | % |
| | | | | | | | | | | | |
SINGAPORE — (0.8%) | | | | | | | | | | | | |
Other Securities | | | | | | | 48,200,489 | | | | 0.8 | % |
| | | | | | | | | | | | |
35
LARGE CAP INTERNATIONAL PORTFOLIO
CONTINUED
| | | | | | | | | | | | |
| | | Shares | | | Value» | | | Percentage
of Net Assets‡ | |
SPAIN — (2.0%) | | | | | | | | | | | | |
Iberdrola SA | | | 2,078,325 | | | $ | 24,564,084 | | | | 0.4 | % |
Other Securities | | | | | | | 100,642,846 | | | | 1.7 | % |
| | | | | | | | | | | | |
TOTAL SPAIN | | | | | | | 125,206,930 | | | | 2.1 | % |
| | | | | | | | | | | | |
SWEDEN — (3.4%) | | | | | | | | | | | | |
Other Securities | | | | | | | 213,759,707 | | | | 3.5 | % |
| | | | | | | | | | | | |
SWITZERLAND — (7.6%) | | | | | | | | | | | | |
Nestle SA | | | 835,482 | | | | 110,206,070 | | | | 1.8 | % |
Novartis AG | | | 422,743 | | | | 34,966,216 | | | | 0.6 | % |
Roche Holding AG | | | 8,668 | | | | 3,728,306 | | | | 0.1 | % |
Roche Holding AG | | | 205,381 | | | | 79,563,359 | | | | 1.3 | % |
Other Securities | | | | | | | 244,093,241 | | | | 4.0 | % |
| | | | | | | | | | | | |
TOTAL SWITZERLAND | | | | | | | 472,557,192 | | | | 7.8 | % |
| | | | | | | | | | | | |
UNITED KINGDOM — (12.2%) | | | | | | | | | | | | |
AstraZeneca PLC, Sponsored ADR | | | 505,883 | | | | 31,556,982 | | | | 0.5 | % |
BP PLC, Sponsored ADR | | | 637,244 | | | | 18,346,269 | | | | 0.3 | % |
Diageo PLC, Sponsored ADR | | | 105,239 | | | | 21,013,071 | | | | 0.4 | % |
Royal Dutch Shell PLC, Sponsored ADR, Class B | | | 918,709 | | | | 42,113,621 | | | | 0.7 | % |
Unilever PLC, Sponsored ADR | | | 450,191 | | | | 24,121,234 | | | | 0.4 | % |
Other Securities | | | | | | | 623,554,407 | | | | 10.3 | % |
| | | | | | | | | | | | |
TOTAL UNITED KINGDOM | | | | | | | 760,705,584 | | | | 12.6 | % |
| | | | | | | | | | | | |
UNITED STATES — (0.0%) | | | | | | | | | | | | |
Other Securities | | | | | | | 292,740 | | | | 0.0 | % |
| | | | | | | | | | | | |
TOTAL COMMON STOCKS | | | | | | | 5,917,220,906 | | | | 98.1 | % |
| | | | | | | | | | | | |
PREFERRED STOCKS — (0.5%) | | | | | | | | | | | | |
GERMANY — (0.5%) | | | | | | | | | | | | |
Other Securities | | | | | | | 32,731,659 | | | | 0.5 | % |
| | | | | | | | | | | | |
TOTAL INVESTMENT SECURITIES
(Cost $3,905,702,782) | | | | | | | 5,949,952,565 | | | | | |
| | | | | | | | | | | | |
| | | | | | Value† | | | | |
SECURITIES LENDING COLLATERAL — (4.8%) | | | | | | | | | | | | |
@§ The DFA Short Term Investment Fund | | | 26,026,332 | | | | 301,124,657 | | | | 5.0 | % |
| | | | | | | | | | | | |
TOTAL INVESTMENTS—(100.0%)
(Cost $4,206,796,383) | | | | | | $ | 6,251,077,222 | | | | 103.6 | % |
| | | | | | | | | | | | |
As of October 31, 2021, Large Cap International Portfolio had entered into the following outstanding futures contracts:
| | | | | | | | | | | | | | | | | | | | |
Description | | Number of
Contracts | | | Expiration
Date | | | Notional
Value | | | Market
Value | | | Unrealized
Appreciation
(Depreciation) | |
Long Position Contracts: | | | | | | | | | | | | | | | | | | | | |
S&P 500® Emini Index | | | 229 | | | | 12/17/21 | | | $ | 51,002,305 | | | $ | 52,635,650 | | | $ | 1,633,345 | |
| | | | | | | | | | | | | | | | | | | | |
Total Futures Contracts | | | | | | | | | | $ | 51,002,305 | | | $ | 52,635,650 | | | $ | 1,633,345 | |
| | | | | | | | | | | | | | | | | | | | |
36
LARGE CAP INTERNATIONAL PORTFOLIO
CONTINUED
Summary of the Portfolio’s investments as of October 31, 2021, based on their valuation inputs, is as follows (see Security Valuation Note):
| | | | | | | | | | | | | | | | |
| | | Investments in Securities (Market Value) | |
| | | Level 1 | | | Level 2 | | | Level 3 | | | Total | |
Common Stocks | | | | | | | | | | | | | | | | |
Australia | | $ | 3,641,424 | | | $ | 365,032,963 | | | | — | | | $ | 368,674,387 | |
Austria | | | — | | | | 13,795,690 | | | | — | | | | 13,795,690 | |
Belgium | | | — | | | | 53,333,536 | | | | — | | | | 53,333,536 | |
Canada | | | 632,493,032 | | | | 2,600,374 | | | | — | | | | 635,093,406 | |
Denmark | | | 5,020,496 | | | | 138,420,632 | | | | — | | | | 143,441,128 | |
Finland | | | 79,111 | | | | 78,491,183 | | | | — | | | | 78,570,294 | |
France | | | 3,422,750 | | | | 570,506,764 | | | | — | | | | 573,929,514 | |
Germany | | | 14,497,008 | | | | 410,362,609 | | | | — | | | | 424,859,617 | |
Hong Kong | | | 369,693 | | | | 136,618,291 | | | | — | | | | 136,987,984 | |
Ireland | | | 11,995,930 | | | | 26,279,658 | | | | — | | | | 38,275,588 | |
Israel | | | 6,778,941 | | | | 30,452,860 | | | | — | | | | 37,231,801 | |
Italy | | | 2,313,854 | | | | 121,750,862 | | | | — | | | | 124,064,716 | |
Japan | | | 19,253,418 | | | | 1,292,730,064 | | | | — | | | | 1,311,983,482 | |
Netherlands | | | 79,527,665 | | | | 195,995,918 | | | | — | | | | 275,523,583 | |
New Zealand | | | — | | | | 22,492,321 | | | | — | | | | 22,492,321 | |
Norway | | | 89,985 | | | | 46,081,016 | | | | — | | | | 46,171,001 | |
Portugal | | | — | | | | 12,070,216 | | | | — | | | | 12,070,216 | |
Singapore | | | 1,156,488 | | | | 47,044,001 | | | | — | | | | 48,200,489 | |
Spain | | | 5,033,888 | | | | 120,173,042 | | | | — | | | | 125,206,930 | |
Sweden | | | — | | | | 213,759,707 | | | | — | | | | 213,759,707 | |
Switzerland | | | 37,734,810 | | | | 434,822,382 | | | | — | | | | 472,557,192 | |
United Kingdom | | | 226,190,003 | | | | 534,515,581 | | | | — | | | | 760,705,584 | |
United States | | | 292,740 | | | | — | | | | — | | | | 292,740 | |
Preferred Stocks | | | | | | | | | | | | | | | | |
Germany | | | — | | | | 32,731,659 | | | | — | | | | 32,731,659 | |
Securities Lending Collateral | | | — | | | | 301,124,657 | | | | — | | | | 301,124,657 | |
Futures Contracts** | | | 1,633,345 | | | | — | | | | — | | | | 1,633,345 | |
| | | | | | | | | | | | | | | | |
TOTAL | | $ | 1,051,524,581 | | | $ | 5,201,185,986 | | | | — | | | $ | 6,252,710,567 | |
| | | | | | | | | | | | | | | | |
| ** | Valued at the unrealized appreciation/(depreciation) on the investment. |
See accompanying Notes to Financial Statements.
37
INTERNATIONAL CORE EQUITY PORTFOLIO
SUMMARY SCHEDULE OF PORTFOLIO HOLDINGS
October 31, 2021
| | | | | | | | | | | | | | |
| | | | | Shares | | | Value» | | | Percentage
of Net Assets‡ | |
COMMON STOCKS — (94.9%) | | | | | | | | | | | | |
AUSTRALIA — (6.0%) | | | | | | | | | | | | |
# BHP Group Ltd. | | | 4,074,214 | | | $ | 111,906,362 | | | | 0.3 | % |
Commonwealth Bank of Australia | | | 931,529 | | | | 73,835,033 | | | | 0.2 | % |
CSL Ltd. | | | 345,823 | | | | 78,688,665 | | | | 0.2 | % |
Other Securities | | | | | | | 1,896,076,660 | | | | 5.5 | % |
| | | | | | | | | | | | | | |
TOTAL AUSTRALIA | | | | | | | 2,160,506,720 | | | | 6.2 | % |
| | | | | | | | | | | | | | |
AUSTRIA — (0.5%) | | | | | | | | | | | | |
Other Securities | | | | | | | 194,447,574 | | | | 0.6 | % |
| | | | | | | | | | | | | | |
BELGIUM — (1.1%) | | | | | | | | | | | | |
Other Securities | | | | | | | 386,927,579 | | | | 1.1 | % |
| | | | | | | | | | | | | | |
CANADA — (10.3%) | | | | | | | | | | | | |
Bank of Montreal | | | 931,374 | | | | 101,063,393 | | | | 0.3 | % |
Canadian Natural Resources Ltd. | | | 3,046,549 | | | | 129,508,798 | | | | 0.4 | % |
National Bank of Canada | | | 950,404 | | | | 78,683,253 | | | | 0.2 | % |
# Royal Bank of Canada | | | 886,501 | | | | 92,274,611 | | | | 0.3 | % |
Royal Bank of Canada | | | 1,145,629 | | | | 119,156,872 | | | | 0.4 | % |
Other Securities | | | | | | | 3,146,620,950 | | | | 9.0 | % |
| | | | | | | | | | | | | | |
TOTAL CANADA | | | | | | | 3,667,307,877 | | | | 10.6 | % |
| | | | | | | | | | | | | | |
CHINA — (0.0%) | | | | | | | | | | | | |
Other Securities | | | | | | | 2,457,607 | | | | 0.0 | % |
| | | | | | | | | | | | | | |
DENMARK — (2.2%) | | | | | | | | | | | | |
Novo Nordisk AS, Class B | | | 891,477 | | | | 97,754,784 | | | | 0.3 | % |
Novo Nordisk AS, Sponsored ADR | | | 595,283 | | | | 65,558,517 | | | | 0.2 | % |
Other Securities | | | | | | | 642,917,309 | | | | 1.8 | % |
| | | | | | | | | | | | | | |
TOTAL DENMARK | | | | | | | 806,230,610 | | | | 2.3 | % |
| | | | | | | | | | | | | | |
FINLAND — (1.6%) | | | | | | | | | | | | |
Other Securities | | | | | | | 578,977,510 | | | | 1.7 | % |
| | | | | | | | | | | | | | |
FRANCE — (7.6%) | | | | | | | | | | | | |
Air Liquide SA | | | 519,420 | | | | 86,721,161 | | | | 0.3 | % |
Cie de Saint-Gobain | | | 974,295 | | | | 67,238,565 | | | | 0.2 | % |
# Cie Generale des Etablissements Michelin SCA | | | 571,661 | | | | 89,875,074 | | | | 0.3 | % |
LVMH Moet Hennessy Louis Vuitton SE | | | 248,440 | | | | 194,807,144 | | �� | | 0.6 | % |
# Orange SA | | | 7,330,798 | | | | 79,941,979 | | | | 0.2 | % |
Teleperformance | | | 179,034 | | | | 74,784,588 | | | | 0.2 | % |
TotalEnergies SE | | | 1,973,714 | | | | 98,833,628 | | | | 0.3 | % |
Other Securities | | | | | | | 2,022,503,162 | | | | 5.7 | % |
| | | | | | | | | | | | | | |
TOTAL FRANCE | | | | | | | 2,714,705,301 | | | | 7.8 | % |
| | | | | | | | | | | | | | |
GERMANY — (6.4%) | | | | | | | | | | | | |
Allianz SE | | | 276,267 | | | | 64,152,055 | | | | 0.2 | % |
Bayer AG | | | 1,277,637 | | | | 72,004,622 | | | | 0.2 | % |
Bayerische Motoren Werke AG | | | 951,135 | | | | 96,098,876 | | | | 0.3 | % |
Daimler AG | | | 1,688,994 | | | | 167,653,626 | | | | 0.5 | % |
Deutsche Telekom AG | | | 5,639,652 | | | | 104,881,456 | | | | 0.3 | % |
38
INTERNATIONAL CORE EQUITY PORTFOLIO
CONTINUED
| | | | | | | | | | | | |
| | | | | | | | | Percentage | |
| | | Shares | | | Value» | | | of Net Assets‡ | |
GERMANY — (Continued) | | | | | | | | | | | | |
Other Securities | | | | | | $ | 1,774,833,658 | | | | 5.1 | % |
| | | | | | | | | | | | |
TOTAL GERMANY | | | | | | | 2,279,624,293 | | | | 6.6 | % |
| | | | | | | | | | | | |
HONG KONG — (2.2%) | | | | | | | | | | | | |
AIA Group Ltd. | | | 10,843,200 | | | | 121,519,838 | | | | 0.4 | % |
Other Securities | | | | | | | 677,631,236 | | | | 1.9 | % |
| | | | | | | | | | | | |
TOTAL HONG KONG | | | | | | | 799,151,074 | | | | 2.3 | % |
| | | | | | | | | | | | |
IRELAND — (0.8%) | | | | | | | | | | | | |
Kingspan Group PLC | | | 602,633 | | | | 69,378,104 | | | | 0.2 | % |
Other Securities | | | | | | | 213,112,214 | | | | 0.6 | % |
| | | | | | | | | | | | |
TOTAL IRELAND | | | | | | | 282,490,318 | | | | 0.8 | % |
| | | | | | | | | | | | |
ISRAEL — (0.9%) | | | | | | | | | | | | |
Other Securities | | | | | | | 309,186,961 | | | | 0.9 | % |
| | | | | | | | | | | | |
ITALY — (2.5%) | | | | | | | | | | | | |
Other Securities | | | | | | | 882,981,445 | | | | 2.6 | % |
| | | | | | | | | | | | |
JAPAN — (21.5%) | | | | | | | | | | | | |
Hitachi Ltd. | | | 1,314,685 | | | | 75,758,117 | | | | 0.2 | % |
KDDI Corp. | | | 2,741,900 | | | | 83,847,255 | | | | 0.3 | % |
Recruit Holdings Co. Ltd. | | | 1,002,100 | | | | 66,658,688 | | | | 0.2 | % |
SoftBank Group Corp. | | | 2,487,563 | | | | 134,670,077 | | | | 0.4 | % |
Sony Group Corp. | | | 1,141,000 | | | | 132,123,562 | | | | 0.4 | % |
Takeda Pharmaceutical Co. Ltd. | | | 2,631,263 | | | | 73,848,531 | | | | 0.2 | % |
Toyota Motor Corp. | | | 12,059,470 | | | | 212,779,157 | | | | 0.6 | % |
Other Securities | | | | | | | 6,889,456,635 | | | | 19.9 | % |
| | | | | | | | | | | | |
TOTAL JAPAN | | | | | | | 7,669,142,022 | | | | 22.2 | % |
| | | | | | | | | | | | |
NETHERLANDS — (4.0%) | | | | | | | | | | | | |
ASM International NV | | | 168,914 | | | | 76,447,873 | | | | 0.2 | % |
ASML Holding NV | | | 127,591 | | | | 103,718,671 | | | | 0.3 | % |
ASML Holding NV | | | 182,526 | | | | 148,371,735 | | | | 0.4 | % |
Koninklijke Ahold Delhaize NV | | | 3,630,618 | | | | 118,112,911 | | | | 0.4 | % |
Stellantis NV | | | 5,527,990 | | | | 110,377,040 | | | | 0.3 | % |
Other Securities | | | | | | | 861,900,774 | | | | 2.5 | % |
| | | | | | | | | | | | |
TOTAL NETHERLANDS | | | | | | | 1,418,929,004 | | | | 4.1 | % |
| | | | | | | | | | | | |
NEW ZEALAND — (0.5%) | | | | | | | | | | | | |
Other Securities | | | | | | | 171,395,575 | | | | 0.5 | % |
| | | | | | | | | | | | |
NORWAY — (0.9%) | | | | | | | | | | | | |
Other Securities | | | | | | | 339,507,956 | | | | 1.0 | % |
| | | | | | | | | | | | |
PORTUGAL — (0.2%) | | | | | | | | | | | | |
Other Securities | | | | | | | 83,459,275 | | | | 0.3 | % |
| | | | | | | | | | | | |
SINGAPORE — (0.8%) | | | | | | | | | | | | |
Other Securities | | | | | | | 286,151,766 | | | | 0.8 | % |
| | | | | | | | | | | | |
39
INTERNATIONAL CORE EQUITY PORTFOLIO
CONTINUED
| | | | | | | | | | | | |
| | | | | | | | | Percentage | |
| | | Shares | | | Value» | | | of Net Assets‡ | |
SPAIN — (1.9%) | | | | | | | | | | | | |
Iberdrola SA | | | 8,431,582 | | | $ | 99,654,363 | | | | 0.3 | % |
Other Securities | | | | | | | 569,227,515 | | | | 1.6 | % |
| | | | | | | | | | | | |
TOTAL SPAIN | | | | | | | 668,881,878 | | | | 1.9 | % |
| | | | | | | | | | | | |
SWEDEN — (3.5%) | | | | | | | | | | | | |
Volvo AB, Class B | | | 2,990,796 | | | | 69,742,821 | | | | 0.2 | % |
Other Securities | | | | | | | 1,171,765,002 | | | | 3.4 | % |
| | | | | | | | | | | | |
TOTAL SWEDEN | | | | | | | 1,241,507,823 | | | | 3.6 | % |
| | | | | | | | | | | | |
SWITZERLAND — (6.9%) | | | | | | | | | | | | |
Nestle SA | | | 2,748,677 | | | | 362,570,217 | | | | 1.1 | % |
Novartis AG, Sponsored ADR | | | 953,193 | | | | 78,886,253 | | | | 0.2 | % |
Roche Holding AG | | | 634,350 | | | | 245,743,359 | | | | 0.7 | % |
Sika AG | | | 223,952 | | | | 75,870,373 | | | | 0.2 | % |
Other Securities | | | | | | | 1,701,728,084 | | | | 4.9 | % |
| | | | | | | | | | | | |
TOTAL SWITZERLAND | | | | | | | 2,464,798,286 | | | | 7.1 | % |
| | | | | | | | | | | | |
UNITED KINGDOM — (12.6%) | | | | | | | | | | | | |
Ashtead Group PLC | | | 958,609 | | | | 80,341,144 | | | | 0.2 | % |
AstraZeneca PLC, Sponsored ADR | | | 1,444,584 | | | | 90,113,150 | | | | 0.3 | % |
BP PLC, Sponsored ADR | | | 3,664,680 | | | | 105,506,137 | | | | 0.3 | % |
HSBC Holdings PLC, Sponsored ADR | | | 3,036,261 | | | | 91,300,368 | | | | 0.3 | % |
Rio Tinto PLC, Sponsored ADR | | | 1,793,636 | | | | 113,483,350 | | | | 0.3 | % |
Royal Dutch Shell PLC, Sponsored ADR, Class B | | | 3,096,174 | | | | 141,928,616 | | | | 0.4 | % |
Vodafone Group PLC | | | 49,455,687 | | | | 72,890,318 | | | | 0.2 | % |
Other Securities | | | | | | | 3,816,782,436 | | | | 11.0 | % |
| | | | | | | | | | | | |
TOTAL UNITED KINGDOM | | | | | | | 4,512,345,519 | | | | 13.0 | % |
| | | | | | | | | | | | |
UNITED STATES — (0.0%) | | | | | | | | | | | | |
Other Securities | | | | | | | 6,492,442 | | | | 0.0 | % |
| | | | | | | | | | | | |
TOTAL COMMON STOCKS | | | | | | | 33,927,606,415 | | | | 98.0 | % |
| | | | | | | | | | | | |
PREFERRED STOCKS — (0.6%) | | | | | | | | | | | | |
AUSTRALIA — (0.0%) | | | | | | | | | | | | |
Other Security | | | | | | | 28,885 | | | | 0.0 | % |
| | | | | | | | | | | | |
GERMANY — (0.6%) | | | | | | | | | | | | |
Volkswagen AG | | | 363,964 | | | | 81,684,955 | | | | 0.3 | % |
Other Securities | | | | | | | 132,503,943 | | | | 0.3 | % |
| | | | | | | | | | | | |
TOTAL GERMANY | | | | | | | 214,188,898 | | | | 0.6 | % |
| | | | | | | | | | | | |
TOTAL PREFERRED STOCKS | | | | | | | 214,217,783 | | | | 0.6 | % |
| | | | | | | | | | | | |
RIGHTS/WARRANTS — (0.0%) | | | | | | | | | | | | |
AUSTRIA — (0.0%) | | | | | | | | | | | | |
Other Securities | | | | | | | 7,891 | | | | 0.0 | % |
| | | | | | | | | | | | |
CANADA — (0.0%) | | | | | | | | | | | | |
Other Securities | | | | | | | 757,963 | | | | 0.0 | % |
| | | | | | | | | | | | |
40
INTERNATIONAL CORE EQUITY PORTFOLIO
CONTINUED
| | | | | | | | | | | | |
| | | | | | | | | Percentage | |
| | | Shares | | | Value» | | | of Net Assets‡ | |
HONG KONG — (0.0%) | | | | | | | | | | | | |
Other Security | | | | | | $ | 566 | | | | 0.0 | % |
| | | | | | | | | | | | |
NEW ZEALAND — (0.0%) | | | | | | | | | | | | |
Other Security | | | | | | | 3,862 | | | | 0.0 | % |
| | | | | | | | | | | | |
SPAIN — (0.0%) | | | | | | | | | | | | |
Other Security | | | | | | | 613,459 | | | | 0.0 | % |
| | | | | | | | | | | | |
TOTAL RIGHTS/WARRANTS | | | | | | | 1,383,741 | | | | 0.0 | % |
| | | | | | | | | | | | |
TOTAL INVESTMENT SECURITIES
(Cost $24,808,815,099) | | | | | | | 34,143,207,939 | | | | | |
| | | | | | | | | | | | |
| | | |
| | | | | | Value† | | | | |
SECURITIES LENDING COLLATERAL — (4.5%) | | | | | | | | | | | | |
@§ The DFA Short Term Investment Fund | | | 137,857,195 | | | | 1,595,007,746 | | | | 4.6 | % |
| | | | | | | | | | | | |
TOTAL INVESTMENTS—(100.0%)
(Cost $26,403,662,509) | | | | | | $ | 35,738,215,685 | | | | 103.2 | % |
| | | | | | | | | | | | |
As of October 31, 2021, International Core Equity Portfolio had entered into the following outstanding futures contracts:
| | | | | | | | | | | | | | | | | | | | |
Description | | Number of
Contracts | | | Expiration
Date | | | Notional
Value | | | Market
Value | | | Unrealized
Appreciation
(Depreciation) | |
Long Position Contracts: | | | | | | | | | | | | | | | | | | | | |
S&P 500® Emini Index. | | | 1,302 | | | | 12/17/21 | | | $ | 290,261,986 | | | $ | 299,264,700 | | | $ | 9,002,714 | |
| | | | | | | | | | | | | | | | | | | | |
Total Futures Contracts | | | | | | | | | | $ | 290,261,986 | | | $ | 299,264,700 | | | $ | 9,002,714 | |
| | | | | | | | | | | | | | | | | | | | |
Summary of the Portfolio’s investments as of October 31, 2021, based on their valuation inputs, is as follows (see Security Valuation Note):
| | | | | | | | | | | | | | | | |
| | | Investments in Securities (Market Value) | |
| | | Level 1 | | | Level 2 | | | Level 3 | | | Total | |
Common Stocks | | | | | | | | | | | | | | | | |
Australia | | $ | 46,638,769 | | | $ | 2,113,867,699 | | | $ | 252 | | | $ | 2,160,506,720 | |
Austria | | | 73,164 | | | | 194,374,410 | | | | — | | | | 194,447,574 | |
Belgium | | | 9,610,059 | | | | 377,317,520 | | | | — | | | | 386,927,579 | |
Canada | | | 3,658,586,313 | | | | 8,721,564 | | | | — | | | | 3,667,307,877 | |
China | | | — | | | | 2,457,607 | | | | — | | | | 2,457,607 | |
Denmark | | | 65,558,517 | | | | 740,672,093 | | | | — | | | | 806,230,610 | |
Finland | | | 5,717,227 | | | | 573,260,283 | | | | — | | | | 578,977,510 | |
France | | | 40,903,587 | | | | 2,673,775,577 | | | | 26,137 | | | | 2,714,705,301 | |
Germany | | | 58,770,155 | | | | 2,220,854,138 | | | | — | | | | 2,279,624,293 | |
Hong Kong | | | 515,573 | | | | 798,067,272 | | | | 568,229 | | | | 799,151,074 | |
Ireland | | | 50,884,763 | | | | 231,605,555 | | | | — | | | | 282,490,318 | |
Israel | | | 35,296,542 | | | | 273,890,419 | | | | — | | | | 309,186,961 | |
Italy | | | 20,609,882 | | | | 862,371,563 | | | | — | | | | 882,981,445 | |
Japan | | | 155,933,205 | | | | 7,513,208,817 | | | | — | | | | 7,669,142,022 | |
Netherlands | | | 227,661,850 | | | | 1,191,267,154 | | | | — | | | | 1,418,929,004 | |
New Zealand | | | 239,560 | | | | 171,156,015 | | | | — | | | | 171,395,575 | |
Norway | | | 14,691,274 | | | | 324,816,682 | | | | — | | | | 339,507,956 | |
41
INTERNATIONAL CORE EQUITY PORTFOLIO
CONTINUED
| | | | | | | | | | | | | | | | |
| | | Investments in Securities (Market Value) | |
| | | Level 1 | | | Level 2 | | | Level 3 | | | Total | |
Portugal | | $ | 409,650 | | | $ | 83,049,625 | | | | — | | | $ | 83,459,275 | |
Singapore | | | 4,041,299 | | | | 281,571,751 | | | $ | 538,716 | | | | 286,151,766 | |
Spain | | | 8,871,267 | | | | 660,010,611 | | | | — | | | | 668,881,878 | |
Sweden | | | 2,091,261 | | | | 1,239,416,562 | | | | — | | | | 1,241,507,823 | |
Switzerland | | | 137,578,979 | | | | 2,327,219,307 | | | | — | | | | 2,464,798,286 | |
United Kingdom | | | 860,422,845 | | | | 3,651,922,648 | | | | 26 | | | | 4,512,345,519 | |
United States | | | 5,590,831 | | | | 901,611 | | | | — | | | | 6,492,442 | |
Preferred Stocks | | | | | | | | | | | | | | | | |
Australia | | | — | | | | 28,885 | | | | — | | | | 28,885 | |
Germany | | | — | | | | 214,188,898 | | | | — | | | | 214,188,898 | |
Rights/Warrants | | | | | | | | | | | | | | | | |
Austria | | | — | | | | 7,891 | | | | — | | | | 7,891 | |
Canada | | | — | | | | 757,963 | | | | — | | | | 757,963 | |
Hong Kong | | | — | | | | 566 | | | | — | | | | 566 | |
New Zealand | | | — | | | | 3,862 | | | | — | | | | 3,862 | |
Spain | | | — | | | | 613,459 | | | | — | | | | 613,459 | |
Securities Lending Collateral | | | — | | | | 1,595,007,746 | | | | — | | | | 1,595,007,746 | |
Futures Contracts** | | | 9,002,714 | | | | — | | | | — | | | | 9,002,714 | |
| | | | | | | | | | | | | | | | |
TOTAL | | $ | 5,419,699,286 | | | $ | 30,326,385,753 | | | $ | 1,133,360^ | | | $ | 35,747,218,399 | |
| | | | | | | | | | | | | | | | |
| ** | Valued at the unrealized appreciation/(depreciation) on the investment. |
| ^ | A reconciliation of Level 3 investments is presented when the Fund had a significant amount of Level 3 investments at the beginning and/or end of the reporting period in relation to net assets. |
See accompanying Notes to Financial Statements.
42
GLOBAL SMALL COMPANY PORTFOLIO
SCHEDULE OF INVESTMENTS
October 31, 2021
| | | | | | | | |
| | | Shares | | | Value† | |
AFFILIATED INVESTMENT COMPANIES — (100.0%) | | | | | | | | |
Investment in U.S. Small Cap Portfolio of DFA Investment Dimensions Group Inc. | | | 1,204,052 | | | $ | 58,396,527 | |
Investment in The Emerging Markets Small Cap Series of The DFA Investment Trust Company | | | | | | | 12,011,785 | |
Investment in The Continental Small Company Series of The DFA Investment Trust Company | | | | | | | 11,897,087 | |
Investment in The Japanese Small Company Series of The DFA Investment Trust Company | | | | | | | 6,406,413 | |
Investment in The United Kingdom Small Company Series of The DFA Investment Trust Company | | | | | | | 4,054,102 | |
Investment in The Asia Pacific Small Company Series of The DFA Investment Trust Company | | | | | | | 3,177,403 | |
Investment in The Canadian Small Company Series of The DFA Investment Trust Company | | | | | | | 3,127,151 | |
| | | | | | | | |
TOTAL INVESTMENTS IN AFFILIATED INVESTMENT COMPANIES
(Cost $78,885,692) | | | | | | $ | 99,070,468 | |
| | | | | | | | |
Summary of the Portfolio’s investments as of October 31, 2021, based on their valuation inputs, is as follows (see Security Valuation Note):
| | | | | | | | | | | | | | | | |
| | | Investments in Securities (Market Value) | |
| | | Level 1 | | | Level 2 | | | Level 3 | | | Total | |
Affiliated Investment Companies | | $ | 99,070,468 | | | | — | | | | — | | | $ | 99,070,468 | |
| | | | | | | | | | | | | | | | |
TOTAL | | $ | 99,070,468 | | | | — | | | | — | | | $ | 99,070,468 | |
| | | | | | | | | | | | | | | | |
See accompanying Notes to Financial Statements.
43
INTERNATIONAL SMALL COMPANY PORTFOLIO
SCHEDULE OF INVESTMENTS
October 31, 2021
| | | | | | | | |
| | | | | | Value† | |
AFFILIATED INVESTMENT COMPANIES — (99.3%) | | | | | | | | |
Investment in The Continental Small Company Series of The DFA Investment Trust Company | | | | | | $ | 5,658,750,566 | |
Investment in The Japanese Small Company Series of The DFA Investment Trust Company | | | | | | | 3,029,775,727 | |
Investment in The United Kingdom Small Company Series of The DFA Investment Trust Company | | | | | | | 1,849,071,649 | |
Investment in The Asia Pacific Small Company Series of The DFA Investment Trust Company | | | | | | | 1,438,166,259 | |
Investment in The Canadian Small Company Series of The DFA Investment Trust Company | | | | | | | 1,405,629,159 | |
| | | | | | | | |
TOTAL INVESTMENTS IN AFFILIATED INVESTMENT COMPANIES | | | | | | $ | 13,381,393,360 | |
| | | | | | | | |
| | | | | | | | |
| | | Shares | | | | |
TEMPORARY CASH INVESTMENTS — (0.7%) | | | | | | | | |
State Street Institutional U.S. Government Money Market Fund, 0.025%
(Cost $89,678,174) | | | 89,678,174 | | | | 89,678,174 | |
| | | | | | | | |
TOTAL INVESTMENTS — (100.0%)
(Cost $10,315,829,273) | | | | | | $ | 13,471,071,534 | |
| | | | | | | | |
As of October 31, 2021, International Small Company Portfolio had entered into the following outstanding futures contracts:
| | | | | | | | | | | | | | | | | | | | |
Description | | Number of
Contracts | | | Expiration
Date | | | Notional
Value | | | Market
Value | | | Unrealized
Appreciation
(Depreciation) | |
Long Position Contracts: | | | | | | | | | | | | | | | | | | | | |
S&P 500® Emini Index | | | 376 | | | | 12/17/21 | | | $ | 84,282,399 | | | $ | 86,423,600 | | | $ | 2,141,201 | |
| | | | | | | | | | | | | | | | | | | | |
Total Futures Contracts | | | | | | | | | | $ | 84,282,399 | | | $ | 86,423,600 | | | $ | 2,141,201 | |
| | | | | | | | | | | | | | | | | | | | |
Summary of the Portfolio’s investments as of October 31, 2021, based on their valuation inputs, is as follows (see Security Valuation Note):
| | | | | | | | | | | | | | | | |
| | | Investments in Securities (Market Value) | |
| | | Level 1 | | | Level 2 | | | Level 3 | | | Total | |
Affiliated Investment Companies | | $ | 13,381,393,360 | | | | — | | | | — | | | $ | 13,381,393,360 | |
Temporary Cash Investments | | | 89,678,174 | | | | — | | | | — | | | | 89,678,174 | |
Futures Contracts** | | | 2,141,201 | | | | — | | | | — | | | | 2,141,201 | |
| | | | | | | | | | | | | | | | |
TOTAL | | $ | 13,473,212,735 | | | | — | | | | — | | | $ | 13,473,212,735 | |
| | | | | | | | | | | | | | | | |
| ** | Valued at the unrealized appreciation/(depreciation) on the investment. |
See accompanying Notes to Financial Statements.
44
JAPANESE SMALL COMPANY PORTFOLIO
SCHEDULE OF INVESTMENTS
October 31, 2021
| | | | |
| | | Value† | |
AFFILIATED INVESTMENT COMPANIES — (100.0%) | | | | |
Investment in The Japanese Small Company Series of The DFA Investment Trust Company | | $ | 379,961,001 | |
| | | | |
TOTAL INVESTMENTS IN AFFILIATED INVESTMENT COMPANIES | | $ | 379,961,001 | |
| | | | |
Summary of the Portfolio’s Master Fund’s investments as of October 31, 2021, based on their valuation inputs, is located in this report (See Security Valuation Note).
See accompanying Notes to Financial Statements.
45
ASIA PACIFIC SMALL COMPANY PORTFOLIO
SCHEDULE OF INVESTMENTS
October 31, 2021
| | | | |
| | | Value† | |
AFFILIATED INVESTMENT COMPANIES — (100.0%) | | | | |
Investment in The Asia Pacific Small Company Series of The DFA Investment Trust Company | | $ | 381,648,225 | |
| | | | |
TOTAL INVESTMENTS IN AFFILIATED INVESTMENT COMPANIES | | $ | 381,648,225 | |
| | | | |
Summary of the Portfolio’s Master Fund’s investments as of October 31, 2021, based on their valuation inputs, is located in this report (See Security Valuation Note).
See accompanying Notes to Financial Statements.
46
UNITED KINGDOM SMALL COMPANY PORTFOLIO
SCHEDULE OF INVESTMENTS
October 31, 2021
| | | | |
| | | Value† | |
AFFILIATED INVESTMENT COMPANIES — (100.0%) | | | | |
Investment in The United Kingdom Small Company Series of The DFA Investment Trust Company | | $ | 44,159,149 | |
| | | | |
TOTAL INVESTMENTS IN AFFILIATED INVESTMENT COMPANIES | | $ | 44,159,149 | |
| | | | |
Summary of the Portfolio’s Master Fund’s investments as of October 31, 2021, based on their valuation inputs, is located in this report (See Security Valuation Note).
See accompanying Notes to Financial Statements.
47
CONTINENTAL SMALL COMPANY PORTFOLIO
SCHEDULE OF INVESTMENTS
October 31, 2021
| | | | |
| | | Value† | |
AFFILIATED INVESTMENT COMPANIES — (100.0%) | | | | |
Investment in The Continental Small Company Series of The DFA Investment Trust Company | | $ | 868,047,933 | |
| | | | |
TOTAL INVESTMENTS IN AFFILIATED INVESTMENT COMPANIES | | $ | 868,047,933 | |
| | | | |
Summary of the Portfolio’s Master Fund’s investments as of October 31, 2021, based on their valuation inputs, is located in this report (See Security Valuation Note).
See accompanying Notes to Financial Statements.
48
DFA INTERNATIONAL REAL ESTATE SECURITIES PORTFOLIO
SUMMARY SCHEDULE OF PORTFOLIO HOLDINGS
October 31, 2021
| | | | | | | | | | | | | | |
| | | Shares | | | Value» | | | Percentage
of Net Assets‡ | |
COMMON STOCKS — (95.0%) | | | | | | | | | | | | |
AUSTRALIA — (19.6%) | | | | | | | | | | | | |
| | Charter Hall Group | | | 5,103,518 | | | $ | 66,957,724 | | | | 1.1 | % |
| | Dexus | | | 11,937,669 | | | | 97,922,093 | | | | 1.6 | % |
| | Goodman Group | | | 18,809,830 | | | | 311,432,106 | | | | 5.2 | % |
| | GPT Group | | | 21,254,256 | | | | 82,977,593 | | | | 1.4 | % |
†† | | GPT Group | | | 38,018,670 | | | | 134,418 | | | | 0.0 | % |
| | Mirvac Group | | | 43,745,807 | | | | 93,360,751 | | | | 1.6 | % |
| | Scentre Group | | | 57,493,866 | | | | 131,136,895 | | | | 2.2 | % |
| | Stockland | | | 26,479,587 | | | | 91,273,558 | | | | 1.5 | % |
| | Vicinity Centres | | | 42,897,822 | | | | 56,023,859 | | | | 0.9 | % |
| | Other Securities | | | | | | | 287,438,324 | | | | 4.8 | % |
| | | | | | | | | | | | | | |
TOTAL AUSTRALIA | | | | | | | 1,218,657,321 | | | | 20.3 | % |
| | | | | | | | | | | | | | |
BELGIUM — (3.9%) | | | | | | | | | | | | |
| | Aedifica SA | | | 389,502 | | | | 51,940,122 | | | | 0.9 | % |
| | Cofinimmo SA | | | 314,243 | | | | 50,698,042 | | | | 0.8 | % |
| | Warehouses De Pauw CVA | | | 1,524,898 | | | | 69,438,532 | | | | 1.2 | % |
| | Other Securities | | | | | | | 71,261,415 | | | | 1.2 | % |
| | | | | | | | | | | | | | |
TOTAL BELGIUM | | | | | | | 243,338,111 | | | | 4.1 | % |
| | | | | | | | | | | | | | |
CANADA — (5.8%) | | | | | | | | | | | | |
# | | Canadian Apartment Properties REIT | | | 923,055 | | | | 45,071,278 | | | | 0.8 | % |
| | Other Securities | | | | | | | 311,548,139 | | | | 5.1 | % |
| | | | | | | | | | | | | | |
TOTAL CANADA | | | | | | | 356,619,417 | | | | 5.9 | % |
| | | | | | | | | | | | | | |
CHINA — (0.2%) | | | | | | | | | | | | |
| | Other Securities | | | | | | | 10,098,158 | | | | 0.2 | % |
| | | | | | | | | | | | | | |
FRANCE — (3.7%) | | | | | | | | | | | | |
| | Covivio | | | 557,125 | | | | 48,254,803 | | | | 0.8 | % |
| | Gecina SA | | | 491,633 | | | | 68,798,473 | | | | 1.2 | % |
| | Klepierre SA | | | 2,234,429 | | | | 53,193,397 | | | | 0.9 | % |
| | Other Securities | | | | | | | 59,983,959 | | | | 0.9 | % |
| | | | | | | | | | | | | | |
TOTAL FRANCE | | | | | | | 230,230,632 | | | | 3.8 | % |
| | | | | | | | | | | | | | |
GERMANY — (0.7%) | | | | | | | | | | | | |
| | Other Securities | | | | | | | 44,088,240 | | | | 0.7 | % |
| | | | | | | | | | | | | | |
HONG KONG — (4.1%) | | | | | | | | | | | | |
| | Link REIT | | | 23,247,323 | | | | 205,958,230 | | | | 3.5 | % |
| | Other Securities | | | | | | | 46,113,463 | | | | 0.7 | % |
| | | | | | | | | | | | | | |
TOTAL HONG KONG | | | | | | | 252,071,693 | | | | 4.2 | % |
| | | | | | | | | | | | | | |
IRELAND — (0.4%) | | | | | | | | | | | | |
| | Other Securities | | | | | | | 23,157,845 | | | | 0.4 | % |
| | | | | | | | | | | | | | |
ITALY — (0.1%) | | | | | | | | | | | | |
| | Other Securities | | | | | | | 5,351,126 | | | | 0.1 | % |
| | | | | | | | | | | | | | |
JAPAN — (24.0%) | | | | | | | | | | | | |
| | Activia Properties, Inc. | | | 7,779 | | | | 31,891,349 | | | | 0.5 | % |
49
DFA INTERNATIONAL REAL ESTATE SECURITIES PORTFOLIO
CONTINUED
| | | | | | | | | | | | | | |
| | | Shares | | | Value» | | | Percentage
of Net Assets‡ | |
JAPAN — (Continued) | | | | | | | | | | | | |
| | Advance Residence Investment Corp. | | | 14,540 | | | $ | 47,788,683 | | | | 0.8 | % |
# | | Daiwa House REIT Investment Corp. | | | 23,517 | | | | 67,485,151 | | | | 1.1 | % |
| | GLP J-Reit | | | 47,682 | | | | 77,776,065 | | | | 1.3 | % |
| | Industrial & Infrastructure Fund Investment Corp. | | | 21,064 | | | | 38,621,832 | | | | 0.6 | % |
| | Japan Hotel REIT Investment Corp. | | | 52,128 | | | | 31,480,545 | | | | 0.5 | % |
| | Japan Metropolitan Fund Invest | | | 78,535 | | | | 72,135,891 | | | | 1.2 | % |
| | Japan Prime Realty Investment Corp. | | | 9,165 | | | | 33,616,379 | | | | 0.6 | % |
| | Japan Real Estate Investment Corp. | | | 14,050 | | | | 86,115,725 | | | | 1.4 | % |
| | Nippon Building Fund, Inc. | | | 16,723 | | | | 108,648,387 | | | | 1.8 | % |
| | Nippon Prologis REIT, Inc. | | | 23,171 | | | | 77,391,924 | | | | 1.3 | % |
| | Nomura Real Estate Master Fund, Inc. | | | 47,837 | | | | 71,634,291 | | | | 1.2 | % |
| | Orix JREIT, Inc. | | | 29,058 | | | | 48,210,264 | | | | 0.8 | % |
# | | Sekisui House Reit, Inc. | | | 46,502 | | | | 35,155,170 | | | | 0.6 | % |
| | United Urban Investment Corp. | | | 33,229 | | | | 41,421,902 | | | | 0.7 | % |
| | Other Securities | | | | | | | 617,628,524 | | | | 10.4 | % |
| | | | | | | | | | | | | | |
TOTAL JAPAN | | | | | | | 1,487,002,082 | | | | 24.8 | % |
| | | | | | | | | | | | | | |
MALAYSIA — (0.4%) | | | | | | | | | | | | |
| | Other Securities | | | | | | | 27,388,672 | | | | 0.5 | % |
| | | | | | | | | | | | | | |
MEXICO — (1.3%) | | | | | | | | | | | | |
| | Fibra Uno Administracion SA de CV | | | 33,788,024 | | | | 33,610,780 | | | | 0.6 | % |
| | Other Securities | | | | | | | 49,038,844 | | | | 0.8 | % |
| | | | | | | | | | | | | | |
TOTAL MEXICO | | | | | | | 82,649,624 | | | | 1.4 | % |
| | | | | | | | | | | | | | |
NETHERLANDS — (2.4%) | | | | | | | | | | | | |
* | | Unibail-Rodamco-Westfield (BFYM460) | | | 1,117,588 | | | | 79,801,027 | | | | 1.3 | % |
| | Other Securities | | | | | | | 68,911,523 | | | | 1.2 | % |
| | | | | | | | | | | | | | |
TOTAL NETHERLANDS | | | | | | | 148,712,550 | | | | 2.5 | % |
| | | | | | | | | | | | | | |
NEW ZEALAND — (1.4%) | | | | | | | | | | | | |
| | Other Securities | | | | | | | 85,320,715 | | | | 1.4 | % |
| | | | | | | | | | | | | | |
SINGAPORE — (9.4%) | | | | | | | | | | | | |
| | Ascendas Real Estate Investment Trust | | | 36,985,780 | | | | 84,713,371 | | | | 1.4 | % |
| | CapitaLand Integrated Commercial Trust | | | 52,713,611 | | | | 83,944,071 | | | | 1.4 | % |
| | Frasers Logistics & Commercial Trust | | | 28,518,533 | | | | 32,112,798 | | | | 0.5 | % |
# | | Mapletree Commercial Trust | | | 23,802,806 | | | | 38,501,573 | | | | 0.7 | % |
# | | Mapletree Industrial Trust | | | 21,528,890 | | | | 43,948,391 | | | | 0.7 | % |
| | Mapletree Logistics Trust | | | 33,641,897 | | | | 50,447,153 | | | | 0.9 | % |
| | Other Securities | | | | | | | 252,147,248 | | | | 4.2 | % |
| | | | | | | | | | | | | | |
TOTAL SINGAPORE | | | | | | | 585,814,605 | | | | 9.8 | % |
| | | | | | | | | | | | | | |
SOUTH AFRICA — (1.6%) | | | | | | | | | | | | |
| | Other Securities | | | | | | | 99,204,219 | | | | 1.7 | % |
| | | | | | | | | | | | | | |
SPAIN — (1.3%) | | | | | | | | | | | | |
| | Inmobiliaria Colonial Socimi SA | | | 3,238,453 | | | | 31,490,561 | | | | 0.5 | % |
| | Merlin Properties Socimi SA | | | 4,130,353 | | | | 44,730,390 | | | | 0.8 | % |
| | Other Security | | | | | | | 6,047,686 | | | | 0.1 | % |
| | | | | | | | | | | | | | |
TOTAL SPAIN | | | | | | | 82,268,637 | | | | 1.4 | % |
| | | | | | | | | | | | | | |
50
DFA INTERNATIONAL REAL ESTATE SECURITIES PORTFOLIO
CONTINUED
| | | | | | | | | | | | |
| | | Shares | | | Value» | | | Percentage
of Net Assets‡ | |
TAIWAN — (0.3%) | | | | | | | | | | | | |
Other Securities | | | | | | $ | 16,362,370 | | | | 0.3 | % |
| | | | | | | | | | | | |
TURKEY — (0.2%) | | | | | | | | | | | | |
Other Securities | | | | | | | 14,687,885 | | | | 0.2 | % |
| | | | | | | | | | | | |
UNITED KINGDOM — (14.2%) | | | | | | | | | | | | |
Big Yellow Group PLC | | | 1,977,824 | | | | 39,989,352 | | | | 0.7 | % |
British Land Co. PLC | | | 9,943,872 | | | | 67,140,760 | | | | 1.1 | % |
Derwent London PLC | | | 1,186,768 | | | | 54,894,880 | | | | 0.9 | % |
Land Securities Group PLC | | | 7,899,894 | | | | 74,215,378 | | | | 1.2 | % |
LondonMetric Property PLC | | | 10,440,495 | | | | 37,340,880 | | | | 0.6 | % |
Safestore Holdings PLC | | | 2,716,328 | | | | 44,652,930 | | | | 0.7 | % |
Segro PLC | | | 13,385,069 | | | | 236,574,996 | | | | 4.0 | % |
Tritax Big Box REIT PLC | | | 20,179,674 | | | | 62,101,613 | | | | 1.0 | % |
UNITE Group PLC | | | 3,594,188 | | | | 53,664,055 | | | | 0.9 | % |
Other Securities | | | | | | | 213,644,130 | | | | 3.7 | % |
| | | | | | | | | | | | |
TOTAL UNITED KINGDOM | | | | | | | 884,218,974 | | | | 14.8 | % |
TOTAL COMMON STOCKS | | | | | | | 5,897,242,876 | | | | 98.5 | % |
| | | | | | | | | | | | |
RIGHTS/WARRANTS — (0.0%) | | | | | | | | | | | | |
UNITED KINGDOM — (0.0%) | | | | | | | | | | | | |
Other Security | | | | | | | 79 | | | | 0.0 | % |
| | | | | | | | | | | | |
TOTAL INVESTMENT SECURITIES
(Cost $5,055,209,691) | | | | | | | 5,897,242,955 | | | | | |
| | | | | | | | | | | | |
| | | |
| | | | | | Value† | | | | |
SECURITIES LENDING COLLATERAL — (5.0%) | | | | | | | | | | | | |
@§ The DFA Short Term Investment Fund | | | 26,840,639 | | | | 310,546,189 | | | | 5.2 | % |
| | | | | | | | | | | | |
TOTAL INVESTMENTS—(100.0%)
(Cost $5,365,727,338) | | | | | | $ | 6,207,789,144 | | | | 103.7 | % |
| | | | | | | | | | | | |
As of October 31, 2021, DFA International Real Estate Securities Portfolio had entered into the following outstanding futures contracts:
| | | | | | | | | | | | | | | | | | | | |
Description | | Number of
Contracts | | | Expiration
Date | | | Notional
Value | | | Market Value | | | Unrealized
Appreciation
(Depreciation) | |
Long Position Contracts: | | | | | | | | | | | | | | | | | | | | |
S&P 500® Emini Index | | | 181 | | | | 12/17/21 | | | $ | 40,192,987 | | | $ | 41,602,850 | | | $ | 1,409,863 | |
| | | | | | | | | | | | | | | | | | | | |
Total Futures Contracts | | | | | | | | | | $ | 40,192,987 | | | $ | 41,602,850 | | | $ | 1,409,863 | |
| | | | | | | | | | | | | | | | | | | | |
51
DFA INTERNATIONAL REAL ESTATE SECURITIES PORTFOLIO
CONTINUED
Summary of the Portfolio’s investments as of October 31, 2021, based on their valuation inputs, is as follows (see Security Valuation Note):
| | | | | | | | | | | | | | | | |
| | | Investments in Securities (Market Value) | |
| | | Level 1 | | | Level 2 | | | Level 3 | | | Total | |
Common Stocks | | | | | | | | | | | | | | | | |
Australia | | $ | 545,228 | | | $ | 1,217,977,675 | | | $ | 134,418 | | | $ | 1,218,657,321 | |
Belgium | | | — | | | | 243,338,111 | | | | — | | | | 243,338,111 | |
Canada | | | 356,619,417 | | | | — | | | | — | | | | 356,619,417 | |
China | | | — | | | | 10,098,158 | | | | — | | | | 10,098,158 | |
France | | | — | | | | 230,230,632 | | | | — | | | | 230,230,632 | |
Germany | | | — | | | | 44,088,240 | | | | — | | | | 44,088,240 | |
Hong Kong | | | — | | | | 252,071,693 | | | | — | | | | 252,071,693 | |
Ireland | | | — | | | | 23,157,845 | | | | — | | | | 23,157,845 | |
Italy | | | — | | | | 5,351,126 | | | | — | | | | 5,351,126 | |
Japan | | | — | | | | 1,487,002,082 | | | | — | | | | 1,487,002,082 | |
Malaysia | | | — | | | | 27,388,672 | | | | — | | | | 27,388,672 | |
Mexico | | | 82,649,624 | | | | — | | | | — | | | | 82,649,624 | |
Netherlands | | | 15,109,381 | | | | 133,603,169 | | | | — | | | | 148,712,550 | |
New Zealand | | | — | | | | 85,320,715 | | | | — | | | | 85,320,715 | |
Singapore | | | — | | | | 585,814,605 | | | | — | | | | 585,814,605 | |
South Africa | | | — | | | | 99,204,219 | | | | — | | | | 99,204,219 | |
Spain | | | — | | | | 82,268,637 | | | | — | | | | 82,268,637 | |
Taiwan | | | — | | | | 16,362,370 | | | | — | | | | 16,362,370 | |
Turkey | | | — | | | | 14,687,885 | | | | — | | | | 14,687,885 | |
United Kingdom | | | — | | | | 884,218,974 | | | | — | | | | 884,218,974 | |
Rights/Warrants | | | | | | | | | | | | | | | | |
United Kingdom | | | — | | | | 79 | | | | — | | | | 79 | |
Securities Lending Collateral | | | — | | | | 310,546,189 | | | | — | | | | 310,546,189 | |
Futures Contracts** | | | 1,409,863 | | | | — | | | | — | | | | 1,409,863 | |
| | | | | | | | | | | | | | | | |
TOTAL | | $ | 456,333,513 | | | $ | 5,752,731,076 | | | $ | 134,418^ | | | $ | 6,209,199,007 | |
| | | | | | | | | | | | | | | | |
| ** | Valued at the unrealized appreciation/(depreciation) on the investment. |
| ^ | A reconciliation of Level 3 investments is presented when the Fund had a significant amount of Level 3 investments at the beginning and/or end of the reporting period in relation to net assets. |
See accompanying Notes to Financial Statements.
52
DFA GLOBAL REAL ESTATE SECURITIES PORTFOLIO
SUMMARY SCHEDULE OF PORTFOLIO HOLDINGS
October 31, 2021
| | | | | | | | | | | | |
| | | Shares | | | Value» | | | Percentage
of Net Assets‡ | |
COMMON STOCKS — (56.0%) | | | | | | | | | | | | |
UNITED STATES — (56.0%) | | | | | | | | | | | | |
Alexandria Real Estate Equities, Inc. | | | 588,622 | | | $ | 120,161,295 | | | | 1.1 | % |
American Campus Communities, Inc. | | | 578,584 | | | | 31,081,533 | | | | 0.3 | % |
American Homes 4 Rent, Class A | | | 1,198,179 | | | | 48,646,084 | | | | 0.5 | % |
American Tower Corp. | | | 1,814,073 | | | | 511,514,164 | | | | 4.9 | % |
Apartment Income REIT Corp. | | | 646,305 | | | | 34,648,414 | | | | 0.3 | % |
# AvalonBay Communities, Inc. | | | 595,358 | | | | 140,909,331 | | | | 1.3 | % |
# Boston Properties, Inc. | | | 631,669 | | | | 71,782,865 | | | | 0.7 | % |
Camden Property Trust | | | 416,002 | | | | 67,849,926 | | | | 0.6 | % |
Crown Castle International Corp. | | | 1,756,044 | | | | 316,614,733 | | | | 3.0 | % |
CubeSmart | | | 842,810 | | | | 46,362,978 | | | | 0.4 | % |
CyrusOne, Inc. | | | 516,104 | | | | 42,330,850 | | | | 0.4 | % |
Digital Realty Trust, Inc. | | | 1,067,765 | | | | 168,503,963 | | | | 1.6 | % |
Duke Realty Corp. | | | 1,595,075 | | | | 89,707,018 | | | | 0.9 | % |
EastGroup Properties, Inc. | | | 168,150 | | | | 33,256,707 | | | | 0.3 | % |
Equinix, Inc. | | | 362,611 | | | | 303,530,790 | | | | 2.9 | % |
Equity LifeStyle Properties, Inc. | | | 725,843 | | | | 61,340,992 | | | | 0.6 | % |
Equity Residential | | | 1,590,294 | | | | 137,401,402 | | | | 1.3 | % |
# Essex Property Trust, Inc. | | | 277,372 | | | | 94,287,064 | | | | 0.9 | % |
Extra Space Storage, Inc. | | | 562,241 | | | | 110,969,506 | | | | 1.1 | % |
Federal Realty Investment Trust | | | 306,103 | | | | 36,839,496 | | | | 0.4 | % |
# First Industrial Realty Trust, Inc. | | | 541,190 | | | | 31,513,494 | | | | 0.3 | % |
Gaming & Leisure Properties, Inc. | | | 925,101 | | | | 44,858,148 | | | | 0.4 | % |
Healthcare Trust of America, Inc., Class A | | | 916,797 | | | | 30,611,852 | | | | 0.3 | % |
Healthpeak Properties, Inc. | | | 2,298,884 | | | | 81,633,371 | | | | 0.8 | % |
* Host Hotels & Resorts, Inc. | | | 2,961,527 | | | | 49,842,499 | | | | 0.5 | % |
Invitation Homes, Inc. | | | 2,420,656 | | | | 99,852,054 | | | | 0.9 | % |
# Iron Mountain, Inc. | | | 1,203,218 | | | | 54,914,870 | | | | 0.5 | % |
Kimco Realty Corp. | | | 2,552,009 | | | | 57,675,411 | | | | 0.5 | % |
Lamar Advertising Co., Class A | | | 362,565 | | | | 41,042,358 | | | | 0.4 | % |
Life Storage, Inc. | | | 325,915 | | | | 43,610,619 | | | | 0.4 | % |
Medical Properties Trust, Inc. | | | 2,423,399 | | | | 51,691,101 | | | | 0.5 | % |
Mid-America Apartment Communities, Inc. | | | 488,169 | | | | 99,688,894 | | | | 0.9 | % |
National Retail Properties, Inc. | | | 734,753 | | | | 33,328,396 | | | | 0.3 | % |
Prologis, Inc. | | | 3,087,440 | | | | 447,555,242 | | | | 4.2 | % |
Public Storage | | | 665,891 | | | | 221,195,672 | | | | 2.1 | % |
# Realty Income Corp. | | | 1,593,474 | | | | 113,821,848 | | | | 1.1 | % |
Regency Centers Corp. | | | 710,556 | | | | 50,030,220 | | | | 0.5 | % |
Rexford Industrial Realty, Inc. | | | 594,593 | | | | 39,956,650 | | | | 0.4 | % |
SBA Communications Corp. | | | 465,813 | | | | 160,859,203 | | | | 1.5 | % |
Simon Property Group, Inc. | | | 1,393,026 | | | | 204,189,751 | | | | 1.9 | % |
# STORE Capital Corp. | | | 1,063,612 | | | | 36,513,800 | | | | 0.3 | % |
Sun Communities, Inc. | | | 469,155 | | | | 91,944,997 | | | | 0.9 | % |
UDR, Inc. | | | 1,265,344 | | | | 70,264,552 | | | | 0.7 | % |
Ventas, Inc. | | | 1,657,835 | | | | 88,478,673 | | | | 0.8 | % |
VEREIT, Inc. | | | 967,276 | | | | 48,653,993 | | | | 0.5 | % |
# VICI Properties, Inc. | | | 1,061,807 | | | | 31,164,036 | | | | 0.3 | % |
# Welltower, Inc. | | | 1,786,156 | | | | 143,606,942 | | | | 1.4 | % |
WP Carey, Inc. | | | 761,497 | | | | 58,719,034 | | | | 0.6 | % |
Other Securities | | | | | | | 1,025,814,639 | | | | 9.7 | % |
| | | | | | | | | | | | |
TOTAL UNITED STATES | | | | | | | 6,020,771,430 | | | | 57.1 | % |
| | | | | | | | | | | | |
TOTAL COMMON STOCKS | | | | | | | 6,020,771,430 | | | | 57.1 | % |
| | | | | | | | | | | | |
53
DFA GLOBAL REAL ESTATE SECURITIES PORTFOLIO
CONTINUED
| | | | | | | | | | | | |
| | | Shares | | | Value» | | | Percentage
of Net Assets‡ | |
PREFERRED STOCKS — (0.0%) | | | | | | | | | | | | |
UNITED STATES — (0.0%) | | | | | | | | | | | | |
Other Security | | | | | | $ | 1,327,734 | | | | 0.0 | % |
| | | |
| | | | | | Value† | | | | |
AFFILIATED INVESTMENT COMPANIES — (42.0%) | | | | | | | | | | | | |
* DFA International Real Estate Securities Portfolio of DFA Investment Dimensions Group, Inc | | | 727,520,729 | | | | 3,666,704,472 | | | | 34.8 | % |
DFA Real Estate Securities Portfolio of DFA Investment Dimensions Group, Inc. | | | 17,169,966 | | | | 839,611,357 | | | | 8.0 | % |
| | | | | | | | | | | | |
TOTAL INVESTMENTS IN AFFILIATED INVESTMENT COMPANIES | | | | | | | 4,506,315,829 | | | | 42.8 | % |
| | | | | | | | | | | | |
TOTAL INVESTMENT SECURITIES
(Cost $7,986,961,434) | | | | | | | 10,528,414,993 | | | | | |
| | | | | | | | | | | | |
SECURITIES LENDING COLLATERAL — (2.0%) | | | | | | | | | | | | |
@§ The DFA Short Term Investment Fund | | | 18,759,320 | | | | 217,045,336 | | | | 2.1 | % |
| | | | | | | | | | | | |
TOTAL INVESTMENTS—(100.0%)
(Cost $8,203,997,508) | | | | | | $ | 10,745,460,329 | | | | 102.0 | % |
| | | | | | | | | | | | |
Summary of the Portfolio’s investments as of October 31, 2021, based on their valuation inputs, is as follows (see Security Valuation Note):
| | | | | | | | | | | | | | | | |
| | | Investments in Securities (Market Value) | |
| | | Level 1 | | | Level 2 | | | Level 3 | | | Total | |
Common Stocks | | | | | | | | | | | | | | | | |
United States | | $ | 6,020,722,361 | | | $ | 49,069 | | | | — | | | $ | 6,020,771,430 | |
Preferred Stocks | | | | | | | | | | | | | | | | |
United States | | | 1,327,734 | | | | — | | | | — | | | | 1,327,734 | |
Affiliated Investment Companies | | | 4,506,315,829 | | | | — | | | | — | | | | 4,506,315,829 | |
Securities Lending Collateral | | | — | | | | 217,045,336 | | | | — | | | | 217,045,336 | |
| | | | | | | | | | | | | | | | |
TOTAL | | $ | 10,528,365,924 | | | $ | 217,094,405 | | | | — | | | $ | 10,745,460,329 | |
| | | | | | | | | | | | | | | | |
See accompanying Notes to Financial Statements.
54
DFA INTERNATIONAL SMALL CAP VALUE PORTFOLIO
SUMMARY SCHEDULE OF PORTFOLIO HOLDINGS
October 31, 2021
| | | | | | | | | | | | | | |
| | | | | Shares | | | Value» | | | Percentage
of Net Assets‡ | |
COMMON STOCKS — (96.8%) | | | | | | | | | | | | |
AUSTRALIA — (7.8%) | | | | | | | | | | | | |
# | | Bank of Queensland Ltd. | | | 8,692,277 | | | $ | 57,872,526 | | | | 0.5 | % |
| | Downer EDI Ltd. | | | 10,150,069 | | | | 48,529,011 | | | | 0.4 | % |
# | | IGO Ltd. | | | 11,106,754 | | | | 81,332,717 | | | | 0.6 | % |
| | OZ Minerals Ltd. | | | 3,084,453 | | | | 58,672,023 | | | | 0.5 | % |
| | Other Securities | | | | | | | 759,692,150 | | | | 5.9 | % |
| | | | | | | | | | | | |
TOTAL AUSTRALIA | | | | | | | 1,006,098,427 | | | | 7.9 | % |
| | | | | | | | | | | | |
AUSTRIA — (1.0%) | | | | | | | | | | | | |
| | Other Securities | | | | | | | 127,262,202 | | | | 1.0 | % |
| | | | | | | | | | | | |
BELGIUM — (1.8%) | | | | | | | | | | | | |
| | Ackermans & van Haaren NV | | | 331,435 | | | | 56,995,531 | | | | 0.4 | % |
| | D’ieteren Group | | | 304,704 | | | | 52,538,365 | | | | 0.4 | % |
| | Other Securities | | | | | | | 129,199,361 | | | | 1.1 | % |
| | | | | | | | | | | | |
TOTAL BELGIUM | | | | | | | 238,733,257 | | | | 1.9 | % |
| | | | | | | | | | | | |
CANADA — (10.9%) | | | | | | | | | | | | |
# | | Alamos Gold, Inc., Class A | | | 7,320,411 | | | | 54,299,752 | | | | 0.4 | % |
| | ARC Resources Ltd. | | | 5,961,374 | | | | 57,176,393 | | | | 0.5 | % |
# | | Canadian Western Bank | | | 1,903,542 | | | | 60,893,041 | | | | 0.5 | % |
* | | Home Capital Group, Inc., Class B | | | 1,308,749 | | | | 42,468,778 | | | | 0.3 | % |
| | Linamar Corp. | | | 947,126 | | | | 52,093,461 | | | | 0.4 | % |
#* | | MEG Energy Corp. | | | 5,060,206 | | | | 45,343,960 | | | | 0.4 | % |
| | Tourmaline Oil Corp. | | | 1,682,234 | | | | 60,800,199 | | | | 0.5 | % |
| | TransAlta Corp. | | | 4,562,378 | | | | 51,168,234 | | | | 0.4 | % |
# | | Whitecap Resources, Inc. | | | 6,857,444 | | | | 41,169,043 | | | | 0.3 | % |
# | | Yamana Gold, Inc. | | | 12,036,191 | | | | 47,265,585 | | | | 0.4 | % |
| | Other Securities | | | | | | | 902,483,007 | | | | 7.0 | % |
| | | | | | | | | | | | |
TOTAL CANADA | | | | | | | 1,415,161,453 | | | | 11.1 | % |
| | | | | | | | | | | | | | |
CHINA — (0.0%) | | | | | | | | | | | | |
| | Other Securities | | | | | | | 806,719 | | | | 0.0 | % |
| | | | | | | | | | | | |
DENMARK — (2.5%) | | | | | | | | | | | | |
* | | Jyske Bank AS | | | 1,162,241 | | | | 56,702,266 | | | | 0.4 | % |
| | Sydbank AS | | | 1,555,575 | | | | 53,457,498 | | | | 0.4 | % |
| | Other Securities | | | | | | | 211,307,402 | | | | 1.7 | % |
| | | | | | | | | | | | |
TOTAL DENMARK | | | | | | | 321,467,166 | | | | 2.5 | % |
| | | | | | | | | | | | |
FINLAND — (2.2%) | | | | | | | | | | | | |
| | Cargotec Oyj, Class B | | | 846,300 | | | | 43,825,174 | | | | 0.4 | % |
| | Konecranes Oyj, Class A | | | 1,038,552 | | | | 43,198,178 | | | | 0.3 | % |
| | Other Securities | | | | | | | 202,439,039 | | | | 1.6 | % |
| | | | | | | | | | | | |
TOTAL FINLAND | | | | | | | 289,462,391 | | | | 2.3 | % |
| | | | | | | | | | | | |
FRANCE — (4.1%) | | | | | | | | | | | | |
* | | Elis SA | | | 3,022,710 | | | | 57,393,983 | | | | 0.5 | % |
| | Rexel SA | | | 2,914,413 | | | | 57,927,440 | | | | 0.5 | % |
55
DFA INTERNATIONAL SMALL CAP VALUE PORTFOLIO
CONTINUED
| | | | | | | | | | | | | | |
| | | | | Shares | | | Value» | | | Percentage
of Net Assets‡ | |
FRANCE — (Continued) | | | | | | | | | | | | |
| | Other Securities | | | | | | $ | 412,053,956 | | | | 3.1 | % |
| | | | | | | | | | | | |
TOTAL FRANCE | | | | | | | 527,375,379 | | | | 4.1 | % |
| | | | | | | | | | | | |
GERMANY — (6.6%) | | | | | | | | | | | | |
| | Aurubis AG | | | 1,029,677 | | | | 88,727,111 | | | | 0.7 | % |
* | | Commerzbank AG | | | 10,806,353 | | | | 78,917,487 | | | | 0.6 | % |
| | Freenet AG | | | 1,864,258 | | | | 48,014,410 | | | | 0.4 | % |
* | | K+S AG | | | 3,414,677 | | | | 58,842,642 | | | | 0.5 | % |
| | Lanxess AG | | | 1,151,558 | | | | 77,594,697 | | | | 0.6 | % |
| | Other Securities | | | | | | | 509,049,380 | | | | 3.9 | % |
| | | | | | | | | | | | |
TOTAL GERMANY | | | | | | | 861,145,727 | | | | 6.7 | % |
| | | | | | | | | | | | |
GREECE — (0.0%) | | | | | | | | | | | | |
| | Other Securities | | | | | | | 1,986 | | | | 0.0 | % |
| | | | | | | | | | | | |
HONG KONG — (2.3%) | | | | | | | | | | | | |
| | Other Securities | | | | | | | 298,086,830 | | | | 2.3 | % |
| | | | | | | | | | | | |
IRELAND — (0.3%) | | | | | | | | | | | | |
| | Other Securities | | | | | | | 34,253,029 | | | | 0.3 | % |
| | | | | | | | | | | | |
ISRAEL — (1.1%) | | | | | | | | | | | | |
| | Other Securities | | | | | | | 144,772,065 | | | | 1.1 | % |
| | | | | | | | | | | | |
ITALY — (3.7%) | | | | | | | | | | | | |
# | | Banco BPM SpA | | | 22,089,452 | | | | 68,693,581 | | | | 0.5 | % |
| | Unipol Gruppo SpA | | | 10,135,870 | | | | 58,214,242 | | | | 0.5 | % |
| | Other Securities | | | | | | | 347,407,845 | | | | 2.7 | % |
| | | | | | | | | | | | |
TOTAL ITALY | | | | | | | 474,315,668 | | | | 3.7 | % |
| | | | | | | | | | | | |
JAPAN — (21.9%) | | | | | | | | | | | | |
| | Other Securities | | | | | | | 2,846,865,637 | | | | 22.3 | % |
| | | | | | | | | | | | |
NETHERLANDS — (2.7%) | | | | | | | | | | | | |
| | APERAM SA | | | 1,047,061 | | | | 62,429,558 | | | | 0.5 | % |
| | ASR Nederland NV | | | 2,645,910 | | | | 123,680,962 | | | | 1.0 | % |
| | SBM Offshore NV | | | 4,276,666 | | | | 67,521,170 | | | | 0.5 | % |
| | Other Securities | | | | | | | 102,713,495 | | | | 0.8 | % |
| | | | | | | | | | | | |
TOTAL NETHERLANDS | | | | | | | 356,345,185 | | | | 2.8 | % |
| | | | | | | | | | | | |
NEW ZEALAND — (0.4%) | | | | | | | | | | | | |
| | Other Securities | | | | | | | 46,628,416 | | | | 0.4 | % |
| | | | | | | | | | | | |
NORWAY — (0.7%) | | | | | | | | | | | | |
| | Other Securities | | | | | | | 96,207,378 | | | | 0.7 | % |
| | | | | | | | | | | | |
PORTUGAL — (0.3%) | | | | | | | | | | | | |
| | Other Securities | | | | | | | 34,955,180 | | | | 0.3 | % |
| | | | | | | | | | | | |
SINGAPORE — (0.9%) | | | | | | | | | | | | |
| | Other Securities | | | | | | | 116,403,677 | | | | 0.9 | % |
| | | | | | | | | | | | |
56
DFA INTERNATIONAL SMALL CAP VALUE PORTFOLIO
CONTINUED
| | | | | | | | | | | | | | |
| | | | | Shares | | | Value» | | | Percentage
of Net Assets‡ | |
SPAIN — (2.1%) | | | | | | | | | | | | |
# | | Bankinter SA | | | 10,292,835 | | | $ | 56,672,453 | | | | 0.4 | % |
| | Other Securities | | | | | | | 218,447,235 | | | | 1.7 | % |
| | | | | | | | | | | | |
TOTAL SPAIN | | | | | | | 275,119,688 | | | | 2.1 | % |
| | | | | | | | | | | | |
SWEDEN — (3.4%) | | | | | | | | | | | | |
| | Lindab International AB | | | 1,604,743 | | | | 52,575,849 | | | | 0.4 | % |
| | Other Securities | | | | | | | 392,270,937 | | | | 3.1 | % |
| | | | | | | | | | | | |
TOTAL SWEDEN | | | | | | | 444,846,786 | | | | 3.5 | % |
| | | | | | | | | | | | | | |
SWITZERLAND — (5.3%) | | | | | | | | | | | | |
| | Allreal Holding AG | | | 283,546 | | | | 59,968,770 | | | | 0.5 | % |
| | Helvetia Holding AG | | | 529,875 | | | | 63,050,268 | | | | 0.5 | % |
| | Siegfried Holding AG | | | 64,976 | | | | 62,496,657 | | | | 0.5 | % |
| | Other Securities | | | | | | | 503,233,754 | | | | 3.9 | % |
| | | | | | | | | | | | |
TOTAL SWITZERLAND | | | | | | | 688,749,449 | | | | 5.4 | % |
| | | | | | | | | | | | |
UNITED KINGDOM — (14.8%) | | | | | | | | | | | | |
| | Bellway PLC | | | 2,165,422 | | | | 98,253,559 | | | | 0.8 | % |
| | Close Brothers Group PLC | | | 3,165,895 | | | | 62,363,565 | | | | 0.5 | % |
| | Drax Group PLC | | | 6,150,470 | | | | 44,731,273 | | | | 0.4 | % |
| | Grafton Group PLC | | | 5,481,699 | | | | 100,685,089 | | | | 0.8 | % |
| | Man Group PLC | | | 19,186,374 | | | | 60,940,067 | | | | 0.5 | % |
* | | Meggitt PLC | | | 8,865,721 | | | | 91,022,660 | | | | 0.7 | % |
| | Paragon Banking Group PLC | | | 6,577,529 | | | | 49,308,900 | | | | 0.4 | % |
* | | Playtech PLC | | | 4,272,115 | | | | 40,644,360 | | | | 0.3 | % |
| | Redrow PLC | | | 6,678,500 | | | | 58,802,405 | | | | 0.5 | % |
| | Royal Mail PLC | | | 10,200,913 | | | | 58,806,428 | | | | 0.5 | % |
| | Travis Perkins PLC | | | 4,636,653 | | | | 98,022,794 | | | | 0.8 | % |
| | Vesuvius PLC | | | 6,801,719 | | | | 43,855,831 | | | | 0.4 | % |
| | Vistry Group PLC | | | 5,262,888 | | | | 88,130,772 | | | | 0.7 | % |
| | Other Securities | | | | | | | 1,029,460,043 | | | | 7.7 | % |
| | | | | | | | | | | | |
TOTAL UNITED KINGDOM | | | | | | | 1,925,027,746 | | | | 15.0 | % |
| | | | | | | | | | | | |
UNITED STATES — (0.0%) | | | | | | | | | | | | |
| | Other Security | | | | | | | 1,846,620 | | | | 0.0 | % |
| | | | | | | | | | | | |
TOTAL COMMON STOCKS | | | | | | | 12,571,938,061 | | | | 98.3 | % |
| | | | | | | | | | | | |
PREFERRED STOCKS — (0.2%) | | | | | | | | | | | | |
GERMANY — (0.2%) | | | | | | | | | | | | |
| | Other Securities | | | | | | | 30,269,615 | | | | 0.3 | % |
| | | | | | | | | | | | |
RIGHTS/WARRANTS — (0.0%) | | | | | | | | | | | | |
AUSTRIA — (0.0%) | | | | | | | | | | | | |
| | Other Security | | | | | | | 503 | | | | 0.0 | % |
| | | | | | | | | | | | |
CANADA — (0.0%) | | | | | | | | | | | | |
| | Other Security | | | | | | | 39,007 | | | | 0.0 | % |
| | | | | | | | | | | | |
NEW ZEALAND — (0.0%) | | | | | | | | | | | | |
| | Other Security | | | | | | | 30,165 | | | | 0.0 | % |
| | | | | | | | | | | | |
57
DFA INTERNATIONAL SMALL CAP VALUE PORTFOLIO
CONTINUED
| | | | | | | | | | | | |
| | | Shares | | | Value» | | | Percentage
of Net Assets‡ | |
SINGAPORE — (0.0%) | | | | | | | | | | | | |
Other Securities | | | | | | $ | 17,360 | | | | 0.0 | % |
| | | | | | | | | | | | |
SPAIN — (0.0%) | | | | | | | | | | | | |
Other Security | | | | | | | 10,407 | | | | 0.0 | % |
| | | | | | | | | | | | |
TOTAL RIGHTS/WARRANTS | | | | | | | 97,442 | | | | 0.0 | % |
| | | | | | | | | | | | |
TOTAL INVESTMENT SECURITIES
(Cost $10,248,353,766) | | | | | | | 12,602,305,118 | | | | | |
| | | | | | | | | | | | |
| | | |
| | | | | | Value† | | | | |
SECURITIES LENDING COLLATERAL — (3.0%) | | | | | | | | | | | | |
@§ The DFA Short Term Investment Fund | | | 33,153,941 | | | | 383,591,098 | | | | 3.0 | % |
| | | | | | | | | | | | |
TOTAL INVESTMENTS—(100.0%)
(Cost $10,631,897,697) | | | | | | $ | 12,985,896,216 | | | | 101.6 | % |
| | | | | | | | | | | | |
As of October 31, 2021, DFA International Small Cap Value Portfolio had entered into the following outstanding futures contracts:
| | | | | | | | | | | | | | | | | | | | |
Description | | Number of
Contracts | | | Expiration
Date | | | Notional
Value | | | Market
Value | | | Unrealized
Appreciation
(Depreciation) | |
Long Position Contracts: | | | | | | | | | | | | | | | | | | | | |
S&P 500® Emini Index | | | 510 | | | | 12/17/21 | | | $ | 112,721,849 | | | $ | 117,223,500 | | | $ | 4,501,651 | |
Total Futures Contracts | | | | | | | | | | $ | 112,721,849 | | | $ | 117,223,500 | | | $ | 4,501,651 | |
| | | | | | | | | | | | | | | | | | | | |
Summary of the Portfolio’s investments as of October 31, 2021, based on their valuation inputs, is as follows (see Security Valuation Note):
| | | | | | | | | | | | | | | | |
| | | Investments in Securities (Market Value) | |
| | | Level 1 | | | Level 2 | | | Level 3 | | | Total | |
Common Stocks | | | | | | | | | | | | | | | | |
Australia | | | — | | | $ | 1,006,098,427 | | | | — | | | $ | 1,006,098,427 | |
Austria | | | — | | | | 127,262,202 | | | | — | | | | 127,262,202 | |
Belgium | | $ | 825,516 | | | | 237,907,741 | | | | — | | | | 238,733,257 | |
Canada | | | 1,412,654,957 | | | | 2,506,496 | | | | — | | | | 1,415,161,453 | |
China | | | — | | | | 806,719 | | | | — | | | | 806,719 | |
Denmark | | | — | | | | 321,467,166 | | | | — | | | | 321,467,166 | |
Finland | | | — | | | | 289,462,391 | | | | — | | | | 289,462,391 | |
France | | | — | | | | 527,375,379 | | | | — | | | | 527,375,379 | |
Germany | | | 15,404,577 | | | | 845,741,150 | | | | — | | | | 861,145,727 | |
Greece | | | — | | | | — | | | $ | 1,986 | | | | 1,986 | |
Hong Kong | | | — | | | | 297,553,804 | | | | 533,026 | | | | 298,086,830 | |
Ireland | | | — | | | | 34,253,029 | | | | — | | | | 34,253,029 | |
Israel | | | 1,517,258 | | | | 143,254,807 | | | | — | | | | 144,772,065 | |
Italy | | | — | | | | 474,315,668 | | | | — | | | | 474,315,668 | |
Japan | | | 18,249,171 | | | | 2,828,616,466 | | | | — | | | | 2,846,865,637 | |
Netherlands | | | — | | | | 356,345,185 | | | | — | | | | 356,345,185 | |
New Zealand | | | — | | | | 46,628,416 | | | | — | | | | 46,628,416 | |
Norway | | | — | | | | 96,207,378 | | | | — | | | | 96,207,378 | |
Portugal | | | — | | | | 34,955,180 | | | | — | | | | 34,955,180 | |
58
DFA INTERNATIONAL SMALL CAP VALUE PORTFOLIO
CONTINUED
| | | | | | | | | | | | | | | | |
| | | Investments in Securities (Market Value) | |
| | | Level 1 | | | Level 2 | | | Level 3 | | | Total | |
Singapore | | | — | | | $ | 115,028,770 | | | $ | 1,374,907 | | | $ | 116,403,677 | |
Spain | | | — | | | | 275,119,688 | | | | — | | | | 275,119,688 | |
Sweden | | $ | 4,722,188 | | | | 440,124,598 | | | | — | | | | 444,846,786 | |
Switzerland | | | 1,311,051 | | | | 687,438,398 | | | | — | | | | 688,749,449 | |
United Kingdom | | | — | | | | 1,925,027,746 | | | | — | | | | 1,925,027,746 | |
United States | | | 1,846,620 | | | | — | | | | — | | | | 1,846,620 | |
Preferred Stocks | | | | | | | | | | | | | | | | |
Germany | | | — | | | | 30,269,615 | | | | — | | | | 30,269,615 | |
Rights/Warrants | | | | | | | | | | | | | | | | |
Austria | | | — | | | | 503 | | | | — | | | | 503 | |
Canada | | | — | | | | 39,007 | | | | — | | | | 39,007 | |
New Zealand | | | — | | | | 30,165 | | | | — | | | | 30,165 | |
Singapore | | | — | | | | 17,360 | | | | — | | | | 17,360 | |
Spain | | | — | | | | 10,407 | | | | — | | | | 10,407 | |
Securities Lending Collateral | | | — | | | | 383,591,098 | | | | — | | | | 383,591,098 | |
Futures Contracts** | | | 4,501,651 | | | | — | | | | — | | | | 4,501,651 | |
| | | | | | | | | | | | | | | | |
TOTAL | | $ | 1,461,032,989 | | | $ | 11,527,454,959 | | | $ | 1,909,919^ | | | $ | 12,990,397,867 | |
| | | | | | | | | | | | | | | | |
| ** | Valued at the unrealized appreciation/(depreciation) on the investment. |
| ^ | A reconciliation of Level 3 investments is presented when the Fund had a significant amount of Level 3 investments at the beginning and/or end of the reporting period in relation to net assets. |
See accompanying Notes to Financial Statements.
59
INTERNATIONAL VECTOR EQUITY PORTFOLIO
SUMMARY SCHEDULE OF PORTFOLIO HOLDINGS
October 31, 2021
| | | | | | | | | | | | | | |
| | | | | Shares | | | Value» | | | Percentage
of Net Assets‡ | |
COMMON STOCKS — (95.8%) | | | | | | | | | | | | |
AUSTRALIA — (6.0%) | | | | | | | | | | | | |
| | National Australia Bank Ltd. | | | 308,973 | | | $ | 6,717,683 | | | | 0.2 | % |
| | Westpac Banking Corp. | | | 357,485 | | | | 6,954,916 | | | | 0.2 | % |
| | Other Securities | | | | | | | 215,373,029 | | | | 5.8 | % |
| | | | | | | | | | | | |
TOTAL AUSTRALIA | | | | | | | 229,045,628 | | | | 6.2 | % |
| | | | | | | | | | | | |
AUSTRIA — (0.7%) | | | | | | | | | | | | |
| | Other Securities | | | | | | | 28,127,457 | | | | 0.8 | % |
| | | | | | | | | | | | |
BELGIUM — (1.2%) | | | | | | | | | | | | |
| | Other Securities | | | | | | | 43,782,692 | | | | 1.2 | % |
| | | | | | | | | | | | |
CANADA — (9.9%) | | | | | | | | | | | | |
| | Bank of Nova Scotia | | | 102,743 | | | | 6,735,831 | | | | 0.2 | % |
| | Canadian Natural Resources Ltd. | | | 218,739 | | | | 9,298,595 | | | | 0.3 | % |
| | Royal Bank of Canada | | | 73,948 | | | | 7,697,141 | | | | 0.2 | % |
| | Suncor Energy, Inc. | | | 242,441 | | | | 6,376,198 | | | | 0.2 | % |
| | Tourmaline Oil Corp. | | | 211,983 | | | | 7,661,603 | | | | 0.2 | % |
| | Other Securities | | | | | | | 341,427,029 | | | | 9.1 | % |
| | | | | | | | | | | | |
TOTAL CANADA | | | | | | | 379,196,397 | | | | 10.2 | % |
| | | | | | | | | | | | | | |
CHINA — (0.0%) | | | | | | | | | | | | |
| | Other Securities | | | | | | | 248,576 | | | | 0.0 | % |
| | | | | | | | | | | | |
DENMARK — (2.4%) | | | | | | | | | | | | |
| | Novo Nordisk AS, Class B | | | 58,933 | | | | 6,462,290 | | | | 0.2 | % |
# | | Pandora AS | | | 42,629 | | | | 5,965,313 | | | | 0.2 | % |
| | Other Securities | | | | | | | 78,578,314 | | | | 2.0 | % |
| | | | | | | | | | | | |
TOTAL DENMARK | | | | | | | 91,005,917 | | | | 2.4 | % |
| | | | | | | | | | | | | | |
FINLAND — (1.7%) | | | | | | | | | | | | |
| | Other Securities | | | | | | | 64,132,489 | | | | 1.7 | % |
| | | | | | | | | | | | |
FRANCE — (7.2%) | | | | | | | | | | | | |
| | Arkema SA | | | 56,478 | | | | 7,725,851 | | | | 0.2 | % |
# | | BNP Paribas SA | | | 106,510 | | | | 7,129,482 | | | | 0.2 | % |
| | Carrefour SA | | | 467,430 | | | | 8,462,285 | | | | 0.2 | % |
| | Cie de Saint-Gobain | | | 85,238 | | | | 5,882,490 | | | | 0.2 | % |
| | Cie Generale des Etablissements Michelin SCA | | | 51,511 | | | | 8,098,427 | | | | 0.2 | % |
| | Engie SA | | | 450,025 | | | | 6,401,672 | | | | 0.2 | % |
# | | Orange SA | | | 1,316,569 | | | | 14,357,118 | | | | 0.4 | % |
| | TotalEnergies SE | | | 308,861 | | | | 15,466,199 | | | | 0.4 | % |
| | Other Securities | | | | | | | 201,686,521 | | | | 5.4 | % |
| | | | | | | | | | | | |
TOTAL FRANCE | | | | | | | 275,210,045 | | | | 7.4 | % |
| | | | | | | | | | | | |
GERMANY — (6.1%) | | | | | | | | | | | | |
| | Allianz SE | | | 36,861 | | | | 8,559,505 | | | | 0.2 | % |
| | Bayerische Motoren Werke AG | | | 59,479 | | | | 6,009,520 | | | | 0.2 | % |
* | | Commerzbank AG | | | 883,755 | | | | 6,453,954 | | | | 0.2 | % |
| | Daimler AG | | | 163,910 | | | | 16,270,103 | | | | 0.5 | % |
| | KION Group AG | | | 61,526 | | | | 6,720,408 | | | | 0.2 | % |
60
INTERNATIONAL VECTOR EQUITY PORTFOLIO
CONTINUED
| | | | | | | | | | | | | | |
| | | | | Shares | | | Value» | | | Percentage
of Net Assets‡ | |
GERMANY — (Continued) | | | | | | | | | | | | |
| | Other Securities | | | | | | $ | 190,211,492 | | | | 5.0 | % |
| | | | | | | | | | | | |
TOTAL GERMANY | | | | | | | 234,224,982 | | | | 6.3 | % |
| | | | | | | | | | | | |
HONG KONG — (2.2%) | | | | | | | | | | | | |
| | Other Securities | | | | | | | 83,786,185 | | | | 2.3 | % |
| | | | | | | | | | | | |
IRELAND — (0.8%) | | | | | | | | | | | | |
# | | CRH PLC, Sponsored ADR | | | 242,922 | | | | 11,645,681 | | | | 0.3 | % |
| | Other Securities | | | | | | | 18,814,777 | | | | 0.5 | % |
| | | | | | | | | | | | |
TOTAL IRELAND | | | | | | | 30,460,458 | | | | 0.8 | % |
| | | | | | | | | | | | |
ISRAEL — (1.1%) | | | | | | | | | | | | |
| | Other Securities | | | | | | | 40,476,578 | | | | 1.1 | % |
| | | | | | | | | | | | |
ITALY — (2.6%) | | | | | | | | | | | | |
| | UniCredit SpA | | | 476,352 | | | | 6,297,103 | | | | 0.2 | % |
| | Other Securities | | | | | | | 92,977,039 | | | | 2.5 | % |
| | | | | | | | | | | | |
TOTAL ITALY | | | | | | | 99,274,142 | | | | 2.7 | % |
| | | | | | | | | | | | |
JAPAN — (22.8%) | | | | | | | | | | | | |
| | ENEOS Holdings, Inc. | | | 1,499,070 | | | | 6,044,624 | | | | 0.2 | % |
| | Mitsubishi UFJ Financial Group, Inc. | | | 1,117,000 | | | | 6,125,063 | | | | 0.2 | % |
| | SoftBank Group Corp. | | | 189,600 | | | | 10,264,444 | | | | 0.3 | % |
| | Sony Group Corp., Sponsored ADR | | | 54,920 | | | | 6,359,187 | | | | 0.2 | % |
| | Toyota Motor Corp. | | | 430,090 | | | | 7,588,575 | | | | 0.2 | % |
# | | Toyota Motor Corp., Sponsored ADR | | | 34,806 | | | | 6,145,695 | | | | 0.2 | % |
| | Other Securities | | | | | | | 825,746,654 | | | | 22.1 | % |
| | | | | | | | | | | | |
TOTAL JAPAN | | | | | | | 868,274,242 | | | | 23.4 | % |
| | | | | | | | | | | | |
NETHERLANDS — (4.0%) | | | | | | | | | | | | |
# | | Aegon NV | | | 1,281,817 | | | | 6,501,745 | | | | 0.2 | % |
| | ASML Holding NV | | | 9,650 | | | | 7,844,024 | | | | 0.2 | % |
| | ASR Nederland NV | | | 149,446 | | | | 6,985,735 | | | | 0.2 | % |
| | Koninklijke Ahold Delhaize NV | | | 417,882 | | | | 13,594,727 | | | | 0.4 | % |
| | Randstad NV | | | 97,050 | | | | 6,972,790 | | | | 0.2 | % |
W | | Signify NV | | | 139,981 | | | | 6,782,973 | | | | 0.2 | % |
| | Stellantis NV | | | 684,296 | | | | 13,663,295 | | | | 0.4 | % |
| | Other Securities | | | | | | | 92,009,344 | | | | 2.4 | % |
| | | | | | | | | | | | |
TOTAL NETHERLANDS | | | | | | | 154,354,633 | | | | 4.2 | % |
| | | | | | | | | | | | |
NEW ZEALAND — (0.5%) | | | | | | | | | | | | |
| | Other Securities | | | | | | | 18,848,422 | | | | 0.5 | % |
| | | | | | | | | | | | |
NORWAY — (0.9%) | | | | | | | | | | | | |
| | Other Securities | | | | | | | 34,154,176 | | | | 0.9 | % |
| | | | | | | | | | | | |
PORTUGAL — (0.3%) | | | | | | | | | | | | |
| | Other Securities | | | | | | | 9,398,212 | | | | 0.3 | % |
| | | | | | | | | | | | |
SINGAPORE — (0.8%) | | | | | | | | | | | | |
| | Other Securities | | | | | | | 31,551,712 | | | | 0.8 | % |
| | | | | | | | | | | | |
61
INTERNATIONAL VECTOR EQUITY PORTFOLIO
CONTINUED
| | | | | | | | | | | | |
| | | Shares | | | Value» | | | Percentage
of Net Assets‡ | |
SPAIN — (2.0%) | | | | | | | | | | | | |
# Banco Santander SA | | | 1,654,793 | | | $ | 6,276,767 | | | | 0.2 | % |
Other Securities | | | | | | | 68,632,226 | | | | 1.8 | % |
| | | | | | | | | | | | |
TOTAL SPAIN | | | | | | | 74,908,993 | | | | 2.0 | % |
| | | | | | | | | | | | |
SWEDEN — (3.5%) | | | | | | | | | | | | |
Other Securities | | | | | | | 134,529,860 | | | | 3.6 | % |
| | | | | | | | | | | | |
SWITZERLAND — (7.2%) | | | | | | | | | | | | |
Georg Fischer AG | | | 4,182 | | | | 6,327,583 | | | | 0.2 | % |
Julius Baer Group Ltd. | | | 127,245 | | | | 9,203,895 | | | | 0.3 | % |
Nestle SA | | | 126,847 | | | | 16,732,029 | | | | 0.5 | % |
Swiss Life Holding AG | | | 11,301 | | | | 6,199,347 | | | | 0.2 | % |
Swisscom AG | | | 15,415 | | | | 8,393,842 | | | | 0.2 | % |
Zurich Insurance Group AG | | | 14,535 | | | | 6,442,211 | | | | 0.2 | % |
Other Securities | | | | | | | 222,040,181 | | | | 5.8 | % |
| | | | | | | | | | | | |
TOTAL SWITZERLAND | | | | | | | 275,339,088 | | | | 7.4 | % |
| | | | | | | | | | | | |
UNITED KINGDOM — (11.9%) | | | | | | | | | | | | |
BP PLC | | | 2,030,060 | | | | 9,725,815 | | | | 0.3 | % |
* BT Group PLC | | | 3,604,399 | | | | 6,847,741 | | | | 0.2 | % |
HSBC Holdings PLC, Sponsored ADR | | | 320,826 | | | | 9,647,238 | | | | 0.3 | % |
Kingfisher PLC | | | 1,314,662 | | | | 6,033,761 | | | | 0.2 | % |
Royal Dutch Shell PLC, Sponsored ADR, Class B | | | 311,988 | | | | 14,301,530 | | | | 0.4 | % |
Other Securities | | | | | | | 407,199,866 | | | | 10.8 | % |
| | | | | | | | | | | | |
TOTAL UNITED KINGDOM | | | | | | | 453,755,951 | | | | 12.2 | % |
| | | | | | | | | | | | |
UNITED STATES — (0.0%) | | | | | | | | | | | | |
Other Securities | | | | | | | 772,717 | | | | 0.0 | % |
| | | | | | | | | | | | |
TOTAL COMMON STOCKS | | | | | | | 3,654,859,552 | | | | 98.4 | % |
| | | | | | | | | | | | |
PREFERRED STOCKS — (0.5%) | | | | | | | | | | | | |
GERMANY — (0.5%) | | | | | | | | | | | | |
Volkswagen AG | | | 30,000 | | | | 6,732,942 | | | | 0.2 | % |
Other Securities | | | | | | | 12,861,997 | | | | 0.3 | % |
| | | | | | | | | | | | |
TOTAL GERMANY | | | | | | | 19,594,939 | | | | 0.5 | % |
| | | | | | | | | | | | |
RIGHTS/WARRANTS — (0.0%) | | | | | | | | | | | | |
AUSTRIA — (0.0%) | | | | | | | | | | | | |
Other Securities | | | | | | | 1,803 | | | | 0.0 | % |
| | | | | | | | | | | | |
CANADA — (0.0%) | | | | | | | | | | | | |
Other Securities | | | | | | | 149,605 | | | | 0.0 | % |
| | | | | | | | | | | | |
HONG KONG — (0.0%) | | | | | | | | | | | | |
Other Security | | | | | | | 362 | | | | 0.0 | % |
| | | | | | | | | | | | |
NEW ZEALAND — (0.0%) | | | | | | | | | | | | |
Other Security | | | | | | | 4,499 | | | | 0.0 | % |
| | | | | | | | | | | | |
PORTUGAL — (0.0%) | | | | | | | | | | | | |
Other Security | | | | | | | 1,564 | | | | 0.0 | % |
| | | | | | | | | | | | |
62
INTERNATIONAL VECTOR EQUITY PORTFOLIO
CONTINUED
| | | | | | | | | | | | |
| | | Shares | | | Value» | | | Percentage
of Net Assets‡ | |
SPAIN — (0.0%) | | | | | | | | | | | | |
Other Security | | | | | | $ | 82,748 | | | | 0.0 | % |
| | | | | | | | | | | | |
TOTAL RIGHTS/WARRANTS | | | | | | | 240,581 | | | | 0.0 | % |
| | | | | | | | | | | | |
TOTAL INVESTMENT SECURITIES
(Cost $2,695,410,139) | | | | | | | 3,674,695,072 | | | | | |
| | | | | | | | | | | | |
| | | |
| | | | | | Value† | | | | |
SECURITIES LENDING COLLATERAL — (3.7%) | | | | | | | | | | | | |
@§ The DFA Short Term Investment Fund | | | 12,358,512 | | | | 142,987,985 | | | | 3.8 | % |
| | | | | | | | | | | | |
TOTAL INVESTMENTS—(100.0%)
(Cost $2,838,377,627) | | | | | | $ | 3,817,683,057 | | | | 102.7 | % |
| | | | | | | | | | | | |
As of October 31, 2021, International Vector Equity Portfolio had entered into the following outstanding futures contracts:
| | | | | | | | | | | | | | | | | | | | |
Description | | Number of
Contracts | | | Expiration
Date | | | Notional
Value | | | Market
Value | | | Unrealized
Appreciation
(Depreciation) | |
Long Position Contracts: | | | | | | | | | | | | | | | | | | | | |
S&P 500® Emini Index | | | 78 | | | | 12/17/21 | | | $ | 17,102,224 | | | $ | 17,928,300 | | | $ | 826,076 | |
| | | | | | | | | | | | | | | | | | | | |
Total Futures Contracts | | | | | | | | | | $ | 17,102,224 | | | $ | 17,928,300 | | | $ | 826,076 | |
| | | | | | | | | | | | | | | | | | | | |
Summary of the Portfolio’s investments as of October 31, 2021, based on their valuation inputs, is as follows (see Security Valuation Note):
| | | | | | | | | | | | | | | | |
| | | Investments in Securities (Market Value) | |
| | | Level 1 | | | Level 2 | | | Level 3 | | | Total | |
Common Stocks | | | | | | | | | | | | | | | | |
Australia | | $ | 235,357 | | | $ | 228,810,221 | | | $ | 50 | | | $ | 229,045,628 | |
Austria | | | — | | | | 28,127,457 | | | | — | | | | 28,127,457 | |
Belgium | | | 1,989,595 | | | | 41,793,097 | | | | — | | | | 43,782,692 | |
Canada | | | 377,787,675 | | | | 1,408,722 | | | | — | | | | 379,196,397 | |
China | | | — | | | | 248,576 | | | | — | | | | 248,576 | |
Denmark | | | — | | | | 91,005,917 | | | | — | | | | 91,005,917 | |
Finland | | | — | | | | 64,132,489 | | | | — | | | | 64,132,489 | |
France | | | 351,761 | | | | 274,856,393 | | | | 1,891 | | | | 275,210,045 | |
Germany | | | 8,560,250 | | | | 225,664,732 | | | | — | | | | 234,224,982 | |
Hong Kong | | | 117,300 | | | | 83,579,229 | | | | 89,656 | | | | 83,786,185 | |
Ireland | | | 11,645,681 | | | | 18,814,777 | | | | — | | | | 30,460,458 | |
Israel | | | 3,121,274 | | | | 37,355,304 | | | | — | | | | 40,476,578 | |
Italy | | | 1,153,965 | | | | 98,120,177 | | | | — | | | | 99,274,142 | |
Japan | | | 17,470,956 | | | | 850,803,286 | | | | — | | | | 868,274,242 | |
Netherlands | | | 17,090,712 | | | | 137,263,921 | | | | — | | | | 154,354,633 | |
New Zealand | | | 10,554 | | | | 18,837,868 | | | | — | | | | 18,848,422 | |
Norway | | | 45,021 | | | | 34,109,155 | | | | — | | | | 34,154,176 | |
Portugal | | | — | | | | 9,398,212 | | | | — | | | | 9,398,212 | |
Singapore | | | 334,947 | | | | 31,154,416 | | | | 62,349 | | | | 31,551,712 | |
Spain | | | 3,623,676 | | | | 71,285,317 | | | | — | | | | 74,908,993 | |
Sweden | | | 372,233 | | | | 134,157,627 | | | | — | | | | 134,529,860 | |
Switzerland | | | 16,241,831 | | | | 259,097,257 | | | | — | | | | 275,339,088 | |
63
INTERNATIONAL VECTOR EQUITY PORTFOLIO
CONTINUED
| | | | | | | | | | | | | | | | |
| | | Investments in Securities (Market Value) | |
| | | Level 1 | | | Level 2 | | | Level 3 | | | Total | |
United Kingdom | | $ | 57,737,822 | | | $ | 396,018,129 | | | | — | | | $ | 453,755,951 | |
United States | | | 575,239 | | | | 197,478 | | | | — | | | | 772,717 | |
Preferred Stocks | | | | | | | | | | | | | | | | |
Germany | | | — | | | | 19,594,939 | | | | — | | | | 19,594,939 | |
Rights/Warrants | | | | | | | | | | | | | | | | |
Austria | | | — | | | | 1,803 | | | | — | | | | 1,803 | |
Canada | | | — | | | | 149,605 | | | | — | | | | 149,605 | |
Hong Kong | | | — | | | | 362 | | | | — | | | | 362 | |
New Zealand | | | — | | | | 4,499 | | | | — | | | | 4,499 | |
Portugal | | | — | | | | 1,564 | | | | — | | | | 1,564 | |
Spain | | | — | | | | 82,748 | | | | — | | | | 82,748 | |
Securities Lending Collateral | | | — | | | | 142,987,985 | | | | — | | | | 142,987,985 | |
Futures Contracts** | | | 826,076 | | | | — | | | | — | | | | 826,076 | |
| | | | | | | | | | | | | | | | |
TOTAL | | $ | 519,291,925 | | | $ | 3,299,063,262 | | | $ | 153,946^ | | | $ | 3,818,509,133 | |
| | | | | | | | | | | | | | | | |
| ** | Valued at the unrealized appreciation/(depreciation) on the investment |
| ^ | A reconciliation of Level 3 investments is presented when the Fund had a significant amount of Level 3 investments at the beginning and/or end of the reporting period in relation to net assets. |
See accompanying Notes to Financial Statements.
64
INTERNATIONAL HIGH RELATIVE PROFITABILITY PORTFOLIO
SUMMARY SCHEDULE OF PORTFOLIO HOLDINGS
October 31, 2021
| | | | | | | | | | | | |
| | | Shares | | | Value» | | | Percentage
of Net Assets‡ | |
COMMON STOCKS — (95.1%) | | | | | | | | | | | | |
AUSTRALIA — (6.0%) | | | | | | | | | | | | |
# BHP Group Ltd., Sponsored ADR | | | 261,477 | | | $ | 14,339,399 | | | | 0.7 | % |
CSL Ltd. | | | 93,279 | | | | 21,224,731 | | | | 1.0 | % |
Wesfarmers Ltd. | | | 252,587 | | | | 10,928,358 | | | | 0.5 | % |
Other Securities | | | | | | | 89,562,204 | | | | 4.0 | % |
| | | | | | | | | | | | |
TOTAL AUSTRALIA | | | | | | | 136,054,692 | | | | 6.2 | % |
| | | | | | | | | | | | |
AUSTRIA — (0.1%) | | | | | | | | | | | | |
Other Securities | | | | | | | 3,304,905 | | | | 0.2 | % |
| | | | | | | | | | | | |
BELGIUM — (0.7%) | | | | | | | | | | | | |
Other Securities | | | | | | | 15,930,310 | | | | 0.7 | % |
| | | | | | | | | | | | |
CANADA — (9.6%) | | | | | | | | | | | | |
Canadian National Railway Co. | | | 103,129 | | | | 13,706,091 | | | | 0.6 | % |
Constellation Software, Inc. | | | 6,141 | | | | 10,792,351 | | | | 0.5 | % |
National Bank of Canada | | | 138,986 | | | | 11,506,549 | | | | 0.5 | % |
Royal Bank of Canada | | | 185,318 | | | | 19,289,484 | | | | 0.9 | % |
Royal Bank of Canada | | | 64,164 | | | | 6,673,698 | | | | 0.3 | % |
TC Energy Corp. | | | 200,669 | | | | 10,855,518 | | | | 0.5 | % |
Other Securities | | | | | | | 144,179,424 | | | | 6.6 | % |
| | | | | | | | | | | | |
TOTAL CANADA | | | | | | | 217,003,115 | | | | 9.9 | % |
| | | | | | | | | | | | |
DENMARK — (2.7%) | | | | | | | | | | | | |
Novo Nordisk AS, Class B | | | 490,008 | | | | 53,731,758 | | | | 2.4 | % |
Other Securities | | | | | | | 7,642,730 | | | | 0.4 | % |
| | | | | | | | | | | | |
TOTAL DENMARK | | | | | | | 61,374,488 | | | | 2.8 | % |
| | | | | | | | | | | | |
FINLAND — (0.9%) | | | | | | | | | | | | |
Other Securities | | | | | | | 20,021,880 | | | | 0.9 | % |
| | | | | | | | | | | | |
FRANCE — (9.1%) | | | | | | | | | | | | |
Air Liquide SA | | | 66,793 | | | | 11,151,605 | | | | 0.5 | % |
* Airbus SE | | | 114,996 | | | | 14,751,919 | | | | 0.7 | % |
Capgemini SE | | | 55,952 | | | | 13,045,927 | | | | 0.6 | % |
Kering SA | | | 17,329 | | | | 13,006,013 | | | | 0.6 | % |
Legrand SA | | | 107,350 | | | | 11,710,814 | | | | 0.5 | % |
LVMH Moet Hennessy Louis Vuitton SE | | | 59,150 | | | | 46,380,786 | | | | 2.1 | % |
Other Securities | | | | | | | 96,011,168 | | | | 4.4 | % |
| | | | | | | | | | | | |
TOTAL FRANCE | | | | | | | 206,058,232 | | | | 9.4 | % |
| | | | | | | | | | | | |
GERMANY — (7.1%) | | | | | | | | | | | | |
Bayer AG | | | 204,634 | | | | 11,532,692 | | | | 0.5 | % |
Daimler AG | | | 196,327 | | | | 19,487,892 | | | | 0.9 | % |
Deutsche Post AG | | | 218,448 | | | | 13,523,455 | | | | 0.6 | % |
Deutsche Telekom AG | | | 837,113 | | | | 15,567,916 | | | | 0.7 | % |
E.ON SE | | | 886,740 | | | | 11,243,686 | | | | 0.5 | % |
Other Securities | | | | | | | 88,913,803 | | | | 4.1 | % |
| | | | | | | | | | | | |
TOTAL GERMANY | | | | | | | 160,269,444 | | | | 7.3 | % |
| | | | | | | | | | | | |
65
INTERNATIONAL HIGH RELATIVE PROFITABILITY PORTFOLIO
CONTINUED
| | | | | | | | | | | | |
| | | Shares | | | Value» | | | Percentage
of Net Assets‡ | |
HONG KONG — (2.3%) | | | | | | | | | | | | |
Hong Kong Exchanges & Clearing Ltd. | | | 293,437 | | | $ | 17,677,145 | | | | 0.8 | % |
Techtronic Industries Co. Ltd. | | | 571,500 | | | | 11,741,611 | | | | 0.5 | % |
Other Securities | | | | | | | 22,099,748 | | | | 1.1 | % |
| | | | | | | | | | | | |
TOTAL HONG KONG | | | | | | | 51,518,504 | | | | 2.4 | % |
| | | | | | | | | | | | |
IRELAND — (0.6%) | | | | | | | | | | | | |
Other Securities | | | | | | | 13,209,635 | | | | 0.6 | % |
| | | | | | | | | | | | |
ISRAEL — (0.4%) | | | | | | | | | | | | |
Other Securities | | | | | | | 9,746,523 | | | | 0.4 | % |
| | | | | | | | | | | | |
ITALY — (1.7%) | | | | | | | | | | | | |
Other Securities | | | | | | | 39,537,219 | | | | 1.8 | % |
| | | | | | | | | | | | |
JAPAN — (20.7%) | | | | | | | | | | | | |
Daikin Industries Ltd. | | | 49,600 | | | | 10,863,132 | | | | 0.5 | % |
Hitachi Ltd. | | | 263,500 | | | | 15,184,066 | | | | 0.7 | % |
Hoya Corp. | | | 78,800 | | | | 11,600,027 | | | | 0.5 | % |
KDDI Corp. | | | 456,200 | | | | 13,950,588 | | | | 0.6 | % |
Nintendo Co. Ltd. | | | 25,600 | | | | 11,306,418 | | | | 0.5 | % |
Recruit Holdings Co. Ltd. | | | 234,200 | | | | 15,578,749 | | | | 0.7 | % |
SoftBank Group Corp. | | | 427,500 | | | | 23,143,722 | | | | 1.1 | % |
Sony Group Corp. | | | 328,700 | | | | 38,062,239 | | | | 1.7 | % |
Tokyo Electron Ltd. | | | 33,900 | | | | 15,798,515 | | | | 0.7 | % |
Other Securities | | | | | | | 314,033,352 | | | | 14.5 | % |
| | | | | | | | | | | | |
TOTAL JAPAN | | | | | | | 469,520,808 | | | | 21.5 | % |
| | | | | | | | | | | | |
NETHERLANDS — (4.5%) | | | | | | | | | | | | |
ASML Holding NV | | | 14,189 | | | | 11,534,233 | | | | 0.5 | % |
ASML Holding NV | | | 52,224 | | | | 42,451,845 | | | | 2.0 | % |
Koninklijke Ahold Delhaize NV | | | 441,808 | | | | 14,373,098 | | | | 0.7 | % |
Wolters Kluwer NV | | | 135,723 | | | | 14,212,699 | | | | 0.7 | % |
Other Securities | | | | | | | 19,962,958 | | | | 0.8 | % |
| | | | | | | | | | | | |
TOTAL NETHERLANDS | | | | | | | 102,534,833 | | | | 4.7 | % |
| | | | | | | | | | | | |
NEW ZEALAND — (0.2%) | | | | | | | | | | | | |
Other Securities | | | | | | | 5,796,298 | | | | 0.3 | % |
| | | | | | | | | | | | |
NORWAY — (0.7%) | | | | | | | | | | | | |
Other Securities | | | | | | | 16,637,032 | | | | 0.8 | % |
| | | | | | | | | | | | |
PORTUGAL — (0.1%) | | | | | | | | | | | | |
Other Security | | | | | | | 1,495,116 | | | | 0.1 | % |
| | | | | | | | | | | | |
SINGAPORE — (0.8%) | | | | | | | | | | | | |
Other Securities | | | | | | | 17,435,745 | | | | 0.8 | % |
| | | | | | | | | | | | |
SPAIN — (1.8%) | | | | | | | | | | | | |
Iberdrola SA | | | 961,878 | | | | 11,368,609 | | | | 0.5 | % |
Other Securities | | | | | | | 29,892,893 | | | | 1.4 | % |
| | | | | | | | | | | | |
TOTAL SPAIN | | | | | | | 41,261,502 | | | | 1.9 | % |
| | | | | | | | | | | | |
66
INTERNATIONAL HIGH RELATIVE PROFITABILITY PORTFOLIO
CONTINUED
| | | | | | | | | | | | | | |
| | | | | | | | | | | Percentage | |
| | | | | Shares | | | Value» | | | of Net Assets‡ | |
SWEDEN — (2.8%) | | | | | | | | | | | | |
| | Other Securities | | | | | | $ | 63,574,460 | | | | 2.9 | % |
| | | | | | | | | | | | | | |
SWITZERLAND — (8.9%) | | | | | | | | | | | | |
| | Geberit AG | | | 14,079 | | | | 10,995,031 | | | | 0.5 | % |
# | | Givaudan SA | | | 2,412 | | | | 11,365,189 | | | | 0.5 | % |
| | Nestle SA | | | 290,751 | | | | 38,352,143 | | | | 1.7 | % |
| | Partners Group Holding AG | | | 7,501 | | | | 13,103,903 | | | | 0.6 | % |
| | Roche Holding AG | | | 8,192 | | | | 3,523,567 | | | | 0.2 | % |
| | Roche Holding AG | | | 183,630 | | | | 71,137,153 | | | | 3.3 | % |
| | Sika AG | | | 36,778 | | | | 12,459,637 | | | | 0.6 | % |
| | Other Securities | | | | | | | 41,007,174 | | | | 1.9 | % |
| | | | | | | | | | | | | | |
TOTAL SWITZERLAND | | | | | | | 201,943,797 | | | | 9.3 | % |
| | | | | | | | | | | | | | |
UNITED KINGDOM — (13.4%) | | | | | | | | | | | | |
| | Ashtead Group PLC | | | 224,550 | | | | 18,819,564 | | | | 0.9 | % |
| | AstraZeneca PLC | | | 67,346 | | | | 8,425,072 | | | | 0.4 | % |
| | AstraZeneca PLC, Sponsored ADR | | | 411,126 | | | | 25,646,040 | | | | 1.2 | % |
| | BAE Systems PLC | | | 1,647,985 | | | | 12,426,073 | | | | 0.6 | % |
| | Diageo PLC | | | 80,730 | | | | 4,016,454 | | | | 0.2 | % |
| | Diageo PLC, Sponsored ADR | | | 106,135 | | | | 21,191,975 | | | | 1.0 | % |
| | Ferguson PLC | | | 94,077 | | | | 14,155,179 | | | | 0.6 | % |
# | | Rio Tinto PLC, Sponsored ADR | | | 251,488 | | | | 15,911,646 | | | | 0.7 | % |
| | SSE PLC | | | 501,447 | | | | 11,292,383 | | | | 0.5 | % |
| | Unilever PLC | | | 48,760 | | | | 2,610,702 | | | | 0.1 | % |
| | Unilever PLC | | | 62,170 | | | | 3,328,181 | | | | 0.2 | % |
| | Unilever PLC, Sponsored ADR | | | 508,666 | | | | 27,254,324 | | | | 1.2 | % |
| | Other Securities | | | | | | | 138,375,077 | | | | 6.3 | % |
| | | | | | | | | | | | | | |
TOTAL UNITED KINGDOM | | | | | | | 303,452,670 | | | | 13.9 | % |
| | | | | | | | | | | | | | |
TOTAL COMMON STOCKS | | | | | | | 2,157,681,208 | | | | 98.8 | % |
| | | | | | | | | | | | | | |
PREFERRED STOCKS — (0.7%) | | | | | | | | | | | | |
GERMANY — (0.7%) | | | | | | | | | | | | |
| | Other Securities | | | | | | | 16,278,674 | | | | 0.8 | % |
| | | | | | | | | | | | | | |
TOTAL INVESTMENT SECURITIES
(Cost $1,682,823,541) | | | | | | | 2,173,959,882 | | | | | |
| | | | | | | | | | | | | | |
| | | | |
| | | | | | | | Value† | | | | |
SECURITIES LENDING COLLATERAL — (4.2%) | | | | | | | | | | | | |
@§ | | The DFA Short Term Investment Fund | | | 8,322,937 | | | | 96,296,385 | | | | 4.4 | % |
| | | | | | | | | | | | | | |
TOTAL INVESTMENTS—(100.0%)
(Cost $1,779,114,946) | | | | | | $ | 2,270,256,267 | | | | 104.0 | % |
| | | | | | | | | | | | | | |
67
INTERNATIONAL HIGH RELATIVE PROFITABILITY PORTFOLIO
CONTINUED
Summary of the Portfolio’s investments as of October 31, 2021, based on their valuation inputs, is as follows (see Security Valuation Note):
| | | | | | | | | | | | | | | | |
| | | Investments in Securities (Market Value) | |
| | | Level 1 | | | Level 2 | | | Level 3 | | | Total | |
Common Stocks | | | | | | | | | | | | | | | | |
Australia | | $ | 14,339,399 | | | $ | 121,715,293 | | | | — | | | $ | 136,054,692 | |
Austria | | | — | | | | 3,304,905 | | | | — | | | | 3,304,905 | |
Belgium | | | — | | | | 15,930,310 | | | | — | | | | 15,930,310 | |
Canada | | | 217,003,115 | | | | — | | | | — | | | | 217,003,115 | |
Denmark | | | — | | | | 61,374,488 | | | | — | | | | 61,374,488 | |
Finland | | | 744,131 | | | | 19,277,749 | | | | — | | | | 20,021,880 | |
France | | | 2,455,556 | | | | 203,602,676 | | | | — | | | | 206,058,232 | |
Germany | | | 436,098 | | | | 159,833,346 | | | | — | | | | 160,269,444 | |
Hong Kong | | | — | | | | 51,518,504 | | | | — | | | | 51,518,504 | |
Ireland | | | 4,037,123 | | | | 9,172,512 | | | | — | | | | 13,209,635 | |
Israel | | | 3,274,027 | | | | 6,472,496 | | | | — | | | | 9,746,523 | |
Italy | | | 4,326,692 | | | | 35,210,527 | | | | — | | | | 39,537,219 | |
Japan | | | — | | | | 469,520,808 | | | | — | | | | 469,520,808 | |
Netherlands | | | 42,451,845 | | | | 60,082,988 | | | | — | | | | 102,534,833 | |
New Zealand | | | — | | | | 5,796,298 | | | | — | | | | 5,796,298 | |
Norway | | | — | | | | 16,637,032 | | | | — | | | | 16,637,032 | |
Portugal | | | — | | | | 1,495,116 | | | | — | | | | 1,495,116 | |
Singapore | | | — | | | | 17,435,745 | | | | — | | | | 17,435,745 | |
Spain | | | — | | | | 41,261,502 | | | | — | | | | 41,261,502 | |
Sweden | | | — | | | | 63,574,460 | | | | — | | | | 63,574,460 | |
Switzerland | | | 5,763,361 | | | | 196,180,436 | | | | — | | | | 201,943,797 | |
United Kingdom | | | 105,766,135 | | | | 197,686,535 | | | | — | | | | 303,452,670 | |
Preferred Stocks | | | | | | | | | | | | | | | | |
Germany | | | — | | | | 16,278,674 | | | | — | | | | 16,278,674 | |
Securities Lending Collateral | | | — | | | | 96,296,385 | | | | — | | | | 96,296,385 | |
| | | | | | | | | | | | | | | | |
TOTAL | | $ | 400,597,482 | | | $ | 1,869,658,785 | | | | — | | | $ | 2,270,256,267 | |
| | | | | | | | | | | | | | | | |
See accompanying Notes to Financial Statements.
68
WORLD EX U.S. VALUE PORTFOLIO
SCHEDULE OF INVESTMENTS
October 31, 2021
| | | | | | | | |
| | | Shares | | | Value† | |
AFFILIATED INVESTMENT COMPANIES — (100.0%) | | | | | | | | |
Investment in The DFA International Value Series of The DFA Investment Trust Company | | | | | | $ | 186,926,657 | |
Investment in Dimensional Emerging Markets Value Fund | | | | | | | 94,194,508 | |
Investment in DFA International Small Cap Value Portfolio of DFA Investment Dimensions Group Inc. | | | 1,238,231 | | | | 27,414,434 | |
| | | | | | | | |
TOTAL INVESTMENTS IN AFFILIATED INVESTMENT COMPANIES
(Cost $259,828,811) | | | | | | $ | 308,535,599 | |
| | | | | | | | |
Summary of the Portfolio’s investments as of October 31, 2021, based on their valuation inputs, is as follows (see Security Valuation Note):
| | | | | | | | | | | | | | | | |
| | | Investments in Securities (Market Value) | |
| | | Level 1 | | | Level 2 | | | Level 3 | | | Total | |
Affiliated Investment Companies | | $ | 308,535,599 | | | | — | | | | — | | | $ | 308,535,599 | |
| | | | | | | | | | | | | | | | |
TOTAL | | $ | 308,535,599 | | | | — | | | | — | | | $ | 308,535,599 | |
| | | | | | | | | | | | | | | | |
See accompanying Notes to Financial Statements.
69
WORLD EX U.S. CORE EQUITY PORTFOLIO
SUMMARY SCHEDULE OF PORTFOLIO HOLDINGS
October 31, 2021
| | | | | | | | | | | | | | |
| | | | | Shares | | | Value» | | | Percentage
of Net Assets‡ | |
COMMON STOCKS — (95.9%) | | | | | | | | | | | | |
AUSTRALIA — (4.2%) | | | | | | | | | | | | |
# | | BHP Group Ltd. | | | 352,621 | | | $ | 9,685,435 | | | | 0.3 | % |
| | Commonwealth Bank of Australia | | | 87,813 | | | | 6,960,251 | | | | 0.2 | % |
| | CSL Ltd. | | | 28,867 | | | | 6,568,405 | | | | 0.2 | % |
| | Other Securities | | | | | | | 151,335,210 | | | | 3.6 | % |
| | | | | | | | | | | | | | |
TOTAL AUSTRALIA | | | | | | | 174,549,301 | | | | 4.3 | % |
| | | | | | | | | | | | | | |
AUSTRIA — (0.4%) | | | | | | | | | | | | |
| | Other Securities | | | | | | | 16,069,401 | | | | 0.4 | % |
| | | | | | | | | | | | | | |
BELGIUM — (0.7%) | | | | | | | | | | | | |
| | Other Securities | | | | | | | 30,014,556 | | | | 0.7 | % |
| | | | | | | | | | | | | | |
BRAZIL — (1.0%) | | | | | | | | | | | | |
| | Vale SA | | | 628,010 | | | | 7,968,353 | | | | 0.2 | % |
| | Other Securities | | | | | | | 34,429,696 | | | | 0.8 | % |
| | | | | | | | | | | | | | |
TOTAL BRAZIL | | | | | | | 42,398,049 | | | | 1.0 | % |
| | | | | | | | | | | | | | |
CANADA — (7.2%) | | | | | | | | | | | | |
| | Bank of Montreal | | | 65,266 | | | | 7,082,014 | | | | 0.2 | % |
| | Canadian Natural Resources Ltd. | | | 164,318 | | | | 6,983,781 | | | | 0.2 | % |
| | Canadian Natural Resources Ltd. | | | 155,586 | | | | 6,613,961 | | | | 0.2 | % |
| | Magna International, Inc. | | | 87,254 | | | | 7,093,750 | | | | 0.2 | % |
| | National Bank of Canada | | | 93,086 | | | | 7,706,522 | | | | 0.2 | % |
# | | Royal Bank of Canada | | | 120,786 | | | | 12,572,441 | | | | 0.3 | % |
| | Royal Bank of Canada | | | 97,598 | | | | 10,151,168 | | | | 0.3 | % |
# | | Toronto-Dominion Bank | | | 89,325 | | | | 6,476,956 | | | | 0.2 | % |
| | Other Securities | | | | | | | 236,312,112 | | | | 5.6 | % |
| | | | | | | | | | | | | | |
TOTAL CANADA | | | | | | | 300,992,705 | | | | 7.4 | % |
| | | | | | | | | | | | | | |
CHILE — (0.1%) | | | | | | | | | | | | |
| | Other Securities | | | | | | | 4,449,703 | | | | 0.1 | % |
| | | | | | | | | | | | | | |
CHINA — (9.1%) | | | | | | | | | | | | |
* | | Alibaba Group Holding Ltd., Sponsored ADR | | | 44,024 | | | | 7,261,319 | | | | 0.2 | % |
| | China Construction Bank Corp., Class H | | | 10,898,000 | | | | 7,416,968 | | | | 0.2 | % |
| | Ping An Insurance Group Co. of China Ltd., Class H | | | 908,000 | | | | 6,503,758 | | | | 0.2 | % |
| | Tencent Holdings Ltd. | | | 442,200 | | | | 26,898,934 | | | | 0.7 | % |
| | Other Securities | | | | | | | 331,912,367 | | | | 8.0 | % |
| | | | | | | | | | | | | | |
TOTAL CHINA | | | | | | | 379,993,346 | | | | 9.3 | % |
| | | | | | | | | | | | | | |
COLOMBIA — (0.1%) | | | | | | | | | | | | |
| | Other Securities | | | | | | | 2,328,978 | | | | 0.1 | % |
| | | | | | | | | | | | | | |
CZECH REPUBLIC — (0.0%) | | | | | | | | | | | | |
| | Other Securities | | | | | | | 1,213,913 | | | | 0.0 | % |
| | | | | | | | | | | | | | |
DENMARK — (1.6%) | | | | | | | | | | | | |
| | Novo Nordisk AS, Class B | | | 144,089 | | | | 15,800,059 | | | | 0.4 | % |
| | Other Securities | | | | | | | 51,971,890 | | | | 1.3 | % |
| | | | | | | | | | | | | | |
TOTAL DENMARK | | | | | | | 67,771,949 | | | | 1.7 | % |
| | | | | | | | | | | | | | |
70
WORLDEX U.S. CORE EQUITY PORTFOLIO
CONTINUED
| | | | | | | | | | | | |
| | | Shares | | | Value» | | | Percentage
of Net Assets‡ | |
EGYPT — (0.0%) | | | | | | | | | | | | |
Other Securities | | | | | | $ | 260,407 | | | | 0.0 | % |
| | | | | | | | | | | | |
FINLAND — (1.1%) | | | | | | | | | | | | |
Other Securities | | | | | | | 46,026,912 | | | | 1.1 | % |
| | | | | | | | | | | | |
FRANCE — (5.3%) | | | | | | | | | | | | |
LVMH Moet Hennessy Louis Vuitton SE | | | 21,810 | | | | 17,101,690 | | | | 0.4 | % |
TotalEnergies SE | | | 176,070 | | | | 8,816,696 | | | | 0.2 | % |
Vinci SA | | | 66,251 | | | | 7,082,907 | | | | 0.2 | % |
Other Securities | | | | | | | 188,380,663 | | | | 4.6 | % |
| | | | | | | | | | | | |
TOTAL FRANCE | | | | | | | 221,381,956 | | | | 5.4 | % |
| | | | | | | | | | | | |
GERMANY — (4.4%) | | | | | | | | | | | | |
Bayerische Motoren Werke AG | | | 72,976 | | | | 7,373,203 | | | | 0.2 | % |
Daimler AG | | | 116,609 | | | | 11,574,891 | | | | 0.3 | % |
Deutsche Telekom AG | | | 371,759 | | | | 6,913,658 | | | | 0.2 | % |
Other Securities | | | | | | | 156,515,437 | | | | 3.8 | % |
| | | | | | | | | | | | |
TOTAL GERMANY | | | | | | | 182,377,189 | | | | 4.5 | % |
| | | | | | | | | | | | |
GREECE — (0.1%) | | | | | | | | | | | | |
Other Securities | | | | | | | 2,353,597 | | | | 0.1 | % |
| | | | | | | | | | | | |
HONG KONG — (1.5%) | | | | | | | | | | | | |
AIA Group Ltd. | | | 608,200 | | | | 6,816,103 | | | | 0.2 | % |
Other Securities | | | | | | | 56,280,980 | | | | 1.3 | % |
| | | | | | | | | | | | |
TOTAL HONG KONG | | | | | | | 63,097,083 | | | | 1.5 | % |
| | | | | | | | | | | | |
HUNGARY — (0.1%) | | | | | | | | | | | | |
Other Securities | | | | | | | 3,161,564 | | | | 0.1 | % |
| | | | | | | | | | | | |
INDIA — (4.3%) | | | | | | | | | | | | |
Infosys Ltd. | | | 347,300 | | | | 7,787,308 | | | | 0.2 | % |
Reliance Industries Ltd. | | | 235,961 | | | | 8,019,213 | | | | 0.2 | % |
Other Securities | | | | | | | 166,007,354 | | | | 4.0 | % |
| | | | | | | | | | | | |
TOTAL INDIA | | | | | | | 181,813,875 | | | | 4.4 | % |
| | | | | | | | | | | | |
INDONESIA — (0.5%) | | | | | | | | | | | | |
Other Securities | | | | | | | 19,227,175 | | | | 0.5 | % |
| | | | | | | | | | | | |
IRELAND — (0.6%) | | | | | | | | | | | | |
CRH PLC, Sponsored ADR | | | 218,452 | | | | 10,472,589 | | | | 0.3 | % |
Other Securities | | | | | | | 15,784,034 | | | | 0.3 | % |
| | | | | | | | | | | | |
TOTAL IRELAND | | | | | | | 26,256,623 | | | | 0.6 | % |
| | | | | | | | | | | | |
ISRAEL — (0.6%) | | | | | | | | | | | | |
Other Securities | | | | | | | 25,711,150 | | | | 0.6 | % |
| | | | | | | | | | | | |
ITALY — (1.8%) | | | | | | | | | | | | |
Other Securities | | | | | | | 74,742,658 | | | | 1.8 | % |
| | | | | | | | | | | | |
JAPAN — (14.5%) | | | | | | | | | | | | |
SoftBank Group Corp. | | | 157,844 | | | | 8,545,258 | | | | 0.2 | % |
71
WORLDEX U.S. CORE EQUITY PORTFOLIO
CONTINUED
| | | | | | | | | | | | |
| | | Shares | | | Value» | | | Percentage
of Net Assets‡ | |
JAPAN — (Continued) | | | | | | | | | | | | |
Sony Group Corp. | | | 104,000 | | | $ | 12,042,814 | | | | 0.3 | % |
Toyota Motor Corp. | | | 1,130,315 | | | | 19,943,453 | | | | 0.5 | % |
Other Securities | | | | | | | 564,955,502 | | | | 13.8 | % |
| | | | | | | | | | | | |
TOTAL JAPAN | | | | | | | 605,487,027 | | | | 14.8 | % |
| | | | | | | | | | | | |
MALAYSIA — (0.5%) | | | | | | | | | | | | |
Other Securities | | | | | | | 22,509,416 | | | | 0.5 | % |
| | | | | | | | | | | | |
MEXICO — (0.6%) | | | | | | | | | | | | |
Other Securities | | | | | | | 27,022,855 | | | | 0.7 | % |
| | | | | | | | | | | | |
NETHERLANDS — (2.6%) | | | | | | | | | | | | |
ASML Holding NV | | | 20,610 | | | | 16,753,457 | | | | 0.4 | % |
Koninklijke Ahold Delhaize NV | | | 261,210 | | | | 8,497,794 | | | | 0.2 | % |
Stellantis NV | | | 444,798 | | | | 8,881,266 | | | | 0.2 | % |
Other Securities | | | | | | | 75,007,080 | | | | 1.9 | % |
| | | | | | | | | | | | |
TOTAL NETHERLANDS | | | | | | | 109,139,597 | | | | 2.7 | % |
| | | | | | | | | | | | |
NEW ZEALAND — (0.3%) | | | | | | | | | | | | |
Other Securities | | | | | | | 14,483,709 | | | | 0.3 | % |
| | | | | | | | | | | | |
NORWAY — (0.7%) | | | | | | | | | | | | |
Other Securities | | | | | | | 27,941,992 | | | | 0.7 | % |
| | | | | | | | | | | | |
PERU — (0.0%) | | | | | | | | | | | | |
Other Securities | | | | | | | 282,164 | | | | 0.0 | % |
| | | | | | | | | | | | |
PHILIPPINES — (0.2%) | | | | | | | | | | | | |
Other Securities | | | | | | | 10,411,825 | | | | 0.2 | % |
| | | | | | | | | | | | |
POLAND — (0.3%) | | | | | | | | | | | | |
Other Securities | | | | | | | 12,195,746 | | | | 0.3 | % |
| | | | | | | | | | | | |
PORTUGAL — (0.1%) | | | | | | | | | | | | |
Other Securities | | | | | | | 5,437,389 | | | | 0.1 | % |
| | | | | | | | | | | | |
QATAR — (0.1%) | | | | | | | | | | | | |
Other Securities | | | | | | | 6,173,656 | | | | 0.1 | % |
| | | | | | | | | | | | |
RUSSIA — (0.3%) | | | | | | | | | | | | |
Other Securities | | | | | | | 10,829,184 | | | | 0.3 | % |
| | | | | | | | | | | | |
SAUDI ARABIA — (0.8%) | | | | | | | | | | | | |
Other Securities | | | | | | | 35,528,203 | | | | 0.9 | % |
| | | | | | | | | | | | |
SINGAPORE — (0.6%) | | | | | | | | | | | | |
Other Securities | | | | | | | 24,238,196 | | | | 0.6 | % |
| | | | | | | | | | | | |
SOUTH AFRICA — (1.6%) | | | | | | | | | | | | |
Other Securities | | | | | | | 65,849,684 | | | | 1.6 | % |
| | | | | | | | | | | | |
SOUTH KOREA — (4.3%) | | | | | | | | | | | | |
Samsung Electronics Co. Ltd. | | | 661,530 | | | | 39,607,861 | | | | 1.0 | % |
SK Hynix, Inc. | | | 79,671 | | | | 7,023,044 | | | | 0.2 | % |
72
WORLDEX U.S. CORE EQUITY PORTFOLIO
CONTINUED
| | | | | | | | | | | | | | |
| | | | | | | | | | | Percentage | |
| | | | | Shares | | | Value» | | | of Net Assets‡ | |
SOUTH KOREA — (Continued) | | | | | | | | | | | | |
| | Other Securities | | | | | | $ | 132,948,484 | | | | 3.2 | % |
| | | | | | | | | | | | | | |
TOTAL SOUTH KOREA | | | | | | | 179,579,389 | | | | 4.4 | % |
| | | | | | | | | | | | | | |
SPAIN — (1.3%) | | | | | | | | | | | | |
| | Iberdrola SA | | | 581,973 | | | | 6,878,441 | | | | 0.2 | % |
| | Other Securities | | | | | | | 45,927,278 | | | | 1.1 | % |
| | | | | | | | | | | | |
TOTAL SPAIN | | | | | | | 52,805,719 | | | | 1.3 | % |
| | | | | | | | | | | | | | |
SWEDEN — (2.3%) | | | | | | | | | | | | |
| | Volvo AB, Class B | | | 272,897 | | | | 6,363,726 | | | | 0.2 | % |
| | Other Securities | | | | | | | 91,247,321 | | | | 2.2 | % |
| | | | | | | | | | | | |
TOTAL SWEDEN | | | | | | | 97,611,047 | | | | 2.4 | % |
| | | | | | | | | | | | | | |
SWITZERLAND — (5.0%) | | | | | | | | | | | | |
| | Nestle SA | | | 285,492 | | | | 37,658,443 | | | | 0.9 | % |
| | Novartis AG | | | 100,236 | | | | 8,290,790 | | | | 0.2 | % |
| | Roche Holding AG | | | 58,789 | | | | 22,774,504 | | | | 0.6 | % |
| | Sika AG | | | 19,260 | | | | 6,524,895 | | | | 0.2 | % |
| | Other Securities | | | | | | | 131,916,854 | | | | 3.2 | % |
| | | | | | | | | | | | |
TOTAL SWITZERLAND | | | | | | | 207,165,486 | | | | 5.1 | % |
| | | | | | | | | | | | | | |
TAIWAN — (5.4%) | | | | | | | | | | | | |
| | Taiwan Semiconductor Manufacturing Co. Ltd. | | | 1,170,000 | | | | 24,827,739 | | | | 0.6 | % |
| | Taiwan Semiconductor Manufacturing Co. Ltd., Sponsored ADR | | | 129,369 | | | | 14,709,255 | | | | 0.4 | % |
| | Other Securities | | | | | | | 186,023,734 | | | | 4.5 | % |
| | | | | | | | | | | | | | |
TOTAL TAIWAN | | | | | | | 225,560,728 | | | | 5.5 | % |
| | | | | | | | | | | | | | |
THAILAND — (0.6%) | | | | | | | | | | | | |
| | Other Securities | | | | | | | 27,137,999 | | | | 0.7 | % |
| | | | | | | | | | | | | | |
TURKEY — (0.2%) | | | | | | | | | | | | |
| | Other Securities | | | | | | | 7,084,237 | | | | 0.2 | % |
| | | | | | | | | | | | | | |
UNITED ARAB EMIRATES — (0.2%) | | | | | | | | | | | | |
| | Other Securities | | | | | | | 6,426,386 | | | | 0.2 | % |
| | | | | | | | | | | | | | |
UNITED KINGDOM — (8.7%) | | | | | | | | | | | | |
| | Ashtead Group PLC | | | 76,598 | | | | 6,419,688 | | | | 0.2 | % |
| | AstraZeneca PLC, Sponsored ADR | | | 149,455 | | | | 9,323,003 | | | | 0.2 | % |
| | BP PLC, Sponsored ADR | | | 305,930 | | | | 8,807,725 | | | | 0.2 | % |
| | HSBC Holdings PLC, Sponsored ADR | | | 230,666 | | | | 6,936,127 | | | | 0.2 | % |
| # | | Rio Tinto PLC, Sponsored ADR | | | 172,914 | | | | 10,940,269 | | | | 0.3 | % |
| | Royal Dutch Shell PLC, Sponsored ADR, Class B | | | 341,272 | | | | 15,643,908 | | | | 0.4 | % |
| | Unilever PLC, Sponsored ADR | | | 123,174 | | | | 6,599,663 | | | | 0.2 | % |
| | Other Securities | | | | | | | 298,729,185 | | | | 7.2 | % |
| | | | | | | | | | | | | | |
TOTAL UNITED KINGDOM | | | | | | | 363,399,568 | | | | 8.9 | % |
| | | | | | | | | | | | | | |
UNITED STATES — (0.0%) | | | | | | | | | | | | |
| | Other Securities | | | | | | | 908,535 | | | | 0.0 | % |
| | | | | | | | | | | | | | |
TOTAL COMMON STOCKS | | | | | | | 4,011,401,827 | | | | 98.1 | % |
| | | | | | | | | | | | |
73
WORLDEX U.S. CORE EQUITY PORTFOLIO
CONTINUED
| | | | | | | | | | | | |
| | | | | | | | | Percentage | |
| | | Shares | | | Value» | | | of Net Assets‡ | |
PREFERRED STOCKS — (0.6%) | | | | | | | | | | | | |
BRAZIL — (0.2%) | | | | | | | | | | | | |
Other Securities | | | | | | $ | 10,076,015 | | | | 0.3 | % |
| | | | | | | | | | | | |
CHILE — (0.0%) | | | | | | | | | | | | |
Other Securities | | | | | | | 196,528 | | | | 0.0 | % |
| | | | | | | | | | | | |
COLOMBIA — (0.0%) | | | | | | | | | | | | |
Other Securities | | | | | | | 309,579 | | | | 0.0 | % |
| | | | | | | | | | | | |
GERMANY — (0.4%) | | | | | | | | | | | | |
Other Securities | | | | | | | 17,118,576 | | | | 0.4 | % |
| | | | | | | | | | | | |
PHILIPPINES — (0.0%) | | | | | | | | | | | | |
Other Security | | | | | | | 48,159 | | | | 0.0 | % |
| | | | | | | | | | | | |
SOUTH KOREA — (0.0%) | | | | | | | | | | | | |
Other Securities | | | | | | | 40,073 | | | | 0.0 | % |
| | | | | | | | | | | | |
THAILAND — (0.0%) | | | | | | | | | | | | |
Other Security | | | | | | | 146,079 | | | | 0.0 | % |
| | | | | | | | | | | | |
TOTAL PREFERRED STOCKS | | | | | | | 27,935,009 | | | | 0.7 | % |
| | | | | | | | | | | | |
RIGHTS/WARRANTS — (0.0%) | | | | | | | | | | | | |
AUSTRIA — (0.0%) | | | | | | | | | | | | |
Other Securities | | | | | | | 348 | | | | 0.0 | % |
| | | | | | | | | | | | |
CANADA — (0.0%) | | | | | | | | | | | | |
Other Security | | | | | | | 52,504 | | | | 0.0 | % |
| | | | | | | | | | | | |
HONG KONG — (0.0%) | | | | | | | | | | | | |
Other Security | | | | | | | 304 | | | | 0.0 | % |
| | | | | | | | | | | | |
NEW ZEALAND — (0.0%) | | | | | | | | | | | | |
Other Security | | | | | | | 1,054 | | | | 0.0 | % |
| | | | | | | | | | | | |
SOUTH KOREA — (0.0%) | | | | | | | | | | | | |
Other Security | | | | | | | 403 | | | | 0.0 | % |
| | | | | | | | | | | | |
SPAIN — (0.0%) | | | | | | | | | | | | |
Other Security | | | | | | | 65,085 | | | | 0.0 | % |
| | | | | | | | | | | | |
TAIWAN — (0.0%) | | | | | | | | | | | | |
Other Securities | | | | | | | 2,200 | | | | 0.0 | % |
| | | | | | | | | | | | |
THAILAND — (0.0%) | | | | | | | | | | | | |
Other Securities | | | | | | | 112,544 | | | | 0.0 | % |
| | | | | | | | | | | | |
TOTAL RIGHTS/WARRANTS | | | | | | | 234,442 | | | | 0.0 | % |
| | | | | | | | | | | | |
TOTAL INVESTMENT SECURITIES
(Cost $3,030,242,478) | | | | | | | 4,039,571,278 | | | | | |
| | | | | | | | | | | | |
74
WORLDEX U.S. CORE EQUITY PORTFOLIO
CONTINUED
| | | | | | | | | | | | |
| | | | | | | | | Percentage | |
| | | Shares | | | Value† | | | of Net Assets‡ | |
SECURITIES LENDING COLLATERAL — (3.5%) | | | | | | | | | | | | |
@§ The DFA Short Term Investment Fund | | | 12,493,822 | | | $ | 144,553,518 | | | | 3.5 | % |
| | | | | | | | | | | | |
TOTAL INVESTMENTS—(100.0%)
(Cost $3,174,772,909) | | | | | | $ | 4,184,124,796 | | | | 102.3 | % |
| | | | | | | | | | | | |
As of October 31, 2021, World ex U.S. Core Equity Portfolio had entered into the following outstanding futures contracts:
| | | | | | | | | | | | | | | | | | | | |
Description | | Number of
Contracts | | | Expiration
Date | | | Notional
Value | | | Market
Value | | | Unrealized
Appreciation
(Depreciation) | |
Long Position Contracts: | | | | | | | | | | | | | | | | | | | | |
S&P 500® Emini Index | | | 158 | | | | 12/17/21 | | | $ | 35,282,412 | | | $ | 36,316,300 | | | $ | 1,033,888 | |
| | | | | | | | | | | | | | | | | | | | |
Total Futures Contracts | | | | | | | | | | $ | 35,282,412 | | | $ | 36,316,300 | | | $ | 1,033,888 | |
| | | | | | | | | | | | | | | | | | | | |
Summary of the Portfolio’s investments as of October 31, 2021, based on their valuation inputs, is as follows (see Security Valuation Note):
| | | | | | | | | | | | | | | | |
| | | Investments in Securities (Market Value) | |
| | | Level 1 | | | Level 2 | | | Level 3 | | | Total | |
Common Stocks | | | | | | | | | | | | | | | | |
Australia | | $ | 932,297 | | | $ | 173,617,004 | | | | — | | | $ | 174,549,301 | |
Austria | | | — | | | | 16,069,401 | | | | — | | | | 16,069,401 | |
Belgium | | | 305,632 | | | | 29,708,924 | | | | — | | | | 30,014,556 | |
Brazil | | | 42,398,049 | | | | — | | | | — | | | | 42,398,049 | |
Canada | | | 300,295,695 | | | | 697,010 | | | | — | | | | 300,992,705 | |
Chile | | | 949,520 | | | | 3,500,183 | | | | — | | | | 4,449,703 | |
China | | | 35,900,636 | | | | 342,341,550 | | | $ | 1,751,160 | | | | 379,993,346 | |
Colombia | | | 2,328,978 | | | | — | | | | — | | | | 2,328,978 | |
Czech Republic | | | — | | | | 1,213,913 | | | | — | | | | 1,213,913 | |
Denmark | | | — | | | | 67,771,949 | | | | — | | | | 67,771,949 | |
Egypt | | | 121,360 | | | | 139,047 | | | | — | | | | 260,407 | |
Finland | | | — | | | | 46,026,912 | | | | — | | | | 46,026,912 | |
France | | | 552,196 | | | | 220,827,504 | | | | 2,256 | | | | 221,381,956 | |
Germany | | | 1,589,887 | | | | 180,787,302 | | | | — | | | | 182,377,189 | |
Greece | | | — | | | | 2,352,157 | | | | 1,440 | | | | 2,353,597 | |
Hong Kong | | | 623,146 | | | | 62,411,909 | | | | 62,028 | | | | 63,097,083 | |
Hungary | | | — | | | | 3,161,564 | | | | — | | | | 3,161,564 | |
India | | | 3,431,397 | | | | 178,382,005 | | | | 473 | | | | 181,813,875 | |
Indonesia | | | 166,221 | | | | 18,948,801 | | | | 112,153 | | | | 19,227,175 | |
Ireland | | | 10,472,589 | | | | 15,784,034 | | | | — | | | | 26,256,623 | |
Israel | | | 2,125,667 | | | | 23,585,483 | | | | — | | | | 25,711,150 | |
Italy | | | 659,759 | | | | 74,082,899 | | | | — | | | | 74,742,658 | |
Japan | | | 4,432,921 | | | | 601,054,106 | | | | — | | | | 605,487,027 | |
Malaysia | | | — | | | | 22,509,237 | | | | 179 | | | | 22,509,416 | |
Mexico | | | 26,892,787 | | | | 129,870 | | | | 198 | | | | 27,022,855 | |
Netherlands | | | 18,193,004 | | | | 90,946,593 | | | | — | | | | 109,139,597 | |
New Zealand | | | — | | | | 14,483,709 | | | | — | | | | 14,483,709 | |
Norway | | | 188,284 | | | | 27,753,708 | | | | — | | | | 27,941,992 | |
Peru | | | 281,575 | | | | 589 | | | | — | | | | 282,164 | |
Philippines | | | 27,536 | | | | 10,384,289 | | | | — | | | | 10,411,825 | |
Poland | | | — | | | | 12,195,746 | | | | — | | | | 12,195,746 | |
75
WORLDEX U.S. CORE EQUITY PORTFOLIO
CONTINUED
| | | | | | | | | | | | | | | | |
| | | Investments in Securities (Market Value) | |
| | | Level 1 | | | Level 2 | | | Level 3 | | | Total | |
Portugal | | | — | | | $ | 5,437,389 | | | | — | | | $ | 5,437,389 | |
Qatar | | | — | | | | 6,173,656 | | | | — | | | | 6,173,656 | |
Russia | | $ | 4,840,114 | | | | 5,989,070 | | | | — | | | | 10,829,184 | |
Saudi Arabia | | | 52,343 | | | | 35,475,860 | | | | — | | | | 35,528,203 | |
Singapore | | | 412,749 | | | | 23,782,381 | | | $ | 43,066 | | | | 24,238,196 | |
South Africa | | | 8,360,502 | | | | 57,489,182 | | | | — | | | | 65,849,684 | |
South Korea | | | 778,135 | | | | 178,742,201 | | | | 59,053 | | | | 179,579,389 | |
Spain | | | 642,129 | | | | 52,163,590 | | | | — | | | | 52,805,719 | |
Sweden | | | 138,422 | | | | 97,472,625 | | | | — | | | | 97,611,047 | |
Switzerland | | | 9,164,251 | | | | 198,001,235 | | | | — | | | | 207,165,486 | |
Taiwan | | | 14,904,075 | | | | 210,647,008 | | | | 9,645 | | | | 225,560,728 | |
Thailand | | | 27,137,999 | | | | — | | | | — | | | | 27,137,999 | |
Turkey | | | — | | | | 7,084,237 | | | | — | | | | 7,084,237 | |
United Arab Emirates | | | — | | | | 6,424,573 | | | | 1,813 | | | | 6,426,386 | |
United Kingdom | | | 84,487,086 | | | | 278,912,482 | | | | — | | | | 363,399,568 | |
United States | | | 812,227 | | | | 96,308 | | | | — | | | | 908,535 | |
Preferred Stocks | | | | | | | | | | | | | | | | |
Brazil | | | 10,076,015 | | | | — | | | | — | | | | 10,076,015 | |
Chile | | | — | | | | 196,528 | | | | — | | | | 196,528 | |
Colombia | | | 309,579 | | | | — | | | | — | | | | 309,579 | |
Germany | | | — | | | | 17,118,576 | | | | — | | | | 17,118,576 | |
Philippines | | | — | | | | 48,159 | | | | — | | | | 48,159 | |
South Korea | | | — | | | | 40,073 | | | | — | | | | 40,073 | |
Thailand | | | 146,079 | | | | — | | | | — | | | | 146,079 | |
Rights/Warrants | | | | | | | | | | | | | | | | |
Austria | | | — | | | | 348 | | | | — | | | | 348 | |
Canada . | | | — | | | | 52,504 | | | | — | | | | 52,504 | |
Hong Kong | | | — | | | | 304 | | | | — | | | | 304 | |
New Zealand | | | — | | | | 1,054 | | | | — | | | | 1,054 | |
South Korea | | | — | | | | 403 | | | | — | | | | 403 | |
Spain | | | — | | | | 65,085 | | | | — | | | | 65,085 | |
Taiwan | | | — | | | | 2,200 | | | | — | | | | 2,200 | |
Thailand | | | — | | | | 112,544 | | | | — | | | | 112,544 | |
Securities Lending Collateral | | | — | | | | 144,553,518 | | | | — | | | | 144,553,518 | |
Futures Contracts** | | | 1,033,888 | | | | — | | | | — | | | | 1,033,888 | |
| | | | | | | | | | | | | | | | |
TOTAL | | $ | 616,164,729 | | | $ | 3,566,950,491 | | | $ | 2,043,464^ | | | $ | 4,185,158,684 | |
| | | | | | | | | | | | | | | | |
| ** | Valued at the unrealized appreciation/(depreciation) on the investment. |
| ^ | A reconciliation of Level 3 investments is presented when the Fund had a significant amount of Level 3 investments at the beginning and/or end of the reporting period in relation to net assets. |
See accompanying Notes to Financial Statements.
76
WORLD CORE EQUITY PORTFOLIO
SCHEDULE OF INVESTMENTS
October 31, 2021
| | | | | | | | |
| | | Shares | | | Value† | |
AFFILIATED INVESTMENT COMPANIES — (100.0%) | | | | | | | | |
Investment in U.S. Core Equity 1 Portfolio of DFA Investment Dimensions Group, Inc. | | | 17,742,691 | | | $ | 643,172,559 | |
Investment in International Core Equity Portfolio of DFA Investment Dimensions Group, Inc. | | | 19,309,539 | | | | 315,517,875 | |
Investment in Emerging Markets Core Equity Portfolio of DFA Investment Dimensions Group, Inc. | | | 5,209,080 | | | | 131,060,446 | |
| | | | | | | | |
TOTAL INVESTMENTS IN AFFILIATED INVESTMENT COMPANIES
(Cost $682,661,848) | | | | | | $ | 1,089,750,880 | |
| | | | | | | | |
Summary of the Portfolio’s investments as of October 31, 2021, based on their valuation inputs, is as follows (see Security Valuation Note):
| | | | | | | | | | | | | | | | |
| | | Investments in Securities (Market Value) | |
| | | Level 1 | | | Level 2 | | | Level 3 | | | Total | |
Affiliated Investment Companies | | $ | 1,089,750,880 | | | | — | | | | — | | | $ | 1,089,750,880 | |
| | | | | | | | | | | | | | | | |
TOTAL | | $ | 1,089,750,880 | | | | — | | | | — | | | $ | 1,089,750,880 | |
| | | | | | | | | | | | | | | | |
See accompanying Notes to Financial Statements.
77
SELECTIVELY HEDGED GLOBAL EQUITY PORTFOLIO
SCHEDULE OF INVESTMENTS
October 31, 2021
| | | | | | | | |
| | | Shares | | | Value† | |
AFFILIATED INVESTMENT COMPANIES — (100.0%) | | | | | | | | |
Investment in U.S. Core Equity 2 Portfolio of DFA Investment Dimensions Group, Inc. | | | 5,644,718 | | | $ | 187,178,852 | |
Investment in International Core Equity Portfolio of DFA Investment Dimensions Group, Inc. | | | 5,747,864 | | | | 93,920,091 | |
Investment in Emerging Markets Core Equity Portfolio of DFA Investment Dimensions Group, Inc. | | | 2,498,237 | | | | 62,855,657 | |
| | | | | | | | |
TOTAL INVESTMENTS IN AFFILIATED INVESTMENT COMPANIES
(Cost $190,773,800) | | | | | | $ | 343,954,600 | |
| | | | | | | | |
As of October 31, 2021, Selectively Hedged Global Equity Portfolio had entered into the following forward currency contracts and the net unrealized forward currency gain (loss) is reflected in the accompanying financial statements:
| | | | | | | | | | | | | | | | | | | | |
| | | | | | | | | | | | | Settlement | | | Unrealized Foreign Exchange Appreciation | |
Currency Purchased | | | Currency Sold | | | Counterparty | | Date | | | (Depreciation) | |
ILS | | | 2,265,832 | | | USD | | | 713,918 | | | Morgan Stanley and Co. International | | | 11/01/21 | | | $ | 2,132 | |
USD | | | 19,857,625 | | | JPY | | | 2,202,126,242 | | | Bank of America Corp. | | | 11/10/21 | | | | 535,437 | |
NOK | | | 6,629,263 | | | USD | | | 769,251 | | | Goldman Sachs International | | | 11/16/21 | | | | 15,412 | |
USD | | | 14,963,512 | | | HKD | | | 116,386,099 | | | JP Morgan | | | 11/29/21 | | | | 3,661 | |
USD | | | 22,817,692 | | | EUR | | | 19,565,224 | | | State Street Bank and Trust | | | 12/28/21 | | | | 166,590 | |
USD | | | 1,964,512 | | | DKK | | | 12,529,657 | | | JP Morgan | | | 01/21/22 | | | | 13,141 | |
| | | | | | | | | | | | | | | | | | | | |
Total Appreciation | | | | | | | | | | | | $ | 736,373 | |
USD | | | 35,127 | | | ILS | | | 113,357 | | | Citibank NA | | | 11/01/21 | | | $ | (696 | ) |
USD | | | 37,935 | | | ILS | | | 121,724 | | | State Street Bank and Trust | | | 11/01/21 | | | | (532 | ) |
USD | | | 630,307 | | | ILS | | | 2,030,751 | | | UBS AG | | | 11/01/21 | | | | (11,453 | ) |
JPY | | | 106,015,644 | | | USD | | | 953,413 | | | Barclays Capital | | | 11/10/21 | | | | (23,197 | ) |
USD | | | 757,141 | | | NOK | | | 6,629,263 | | | Citibank NA | | | 11/16/21 | | | | (27,522 | ) |
USD | | | 157,223 | | | SEK | | | 1,351,755 | | | Citibank NA | | | 12/29/21 | | | | (331 | ) |
USD | | | 2,811,009 | | | SEK | | | 24,612,841 | | | HSBC Bank | | | 12/29/21 | | | | (57,748 | ) |
USD | | | 10,576,368 | | | GBP | | | 7,766,559 | | | Australia & New Zealand Banking Group Ltd. | | | 01/04/22 | | | | (56,290 | ) |
USD | | | 5,096,818 | | | AUD | | | 6,974,500 | | | HSBC Bank | | | 01/06/22 | | | | (151,024 | ) |
USD | | | 5,805,964 | | | CHF | | | 5,357,395 | | | HSBC Bank | | | 01/10/22 | | | | (58,029 | ) |
USD | | | 720,747 | | | ILS | | | 2,285,364 | | | Morgan Stanley and Co. International | | | 01/27/22 | | | | (2,174 | ) |
| | | | | | | | | | | | | | | | | | | | |
Total (Depreciation) | | | | | | | | | | | | $ | (388,996 | ) |
| | | | | | | | | | | | | | | | | | | | |
Total Appreciation (Depreciation) | | | | | | | | | $ | 347,377 | |
| | | | | | | | | | | | | | | | | | | | |
As of October 31, 2021, Selectively Hedged Global Equity Portfolio had entered into the following outstanding futures contracts:
| | | | | | | | | | | | | | | | | | | | |
| | | | | | | | | | | | | | | Unrealized | |
| | | Number of | | | Expiration | | | Notional | | | Market | | | Appreciation | |
Description | | Contracts | | | Date | | | Value | | | Value | | | (Depreciation) | |
Long Position Contracts: | | | | | | | | | | | | | | | | | | | | |
S&P 500® Emini Index | | | 19 | | | | 12/17/21 | | | $ | 4,265,025 | | | $ | 4,367,150 | | | $ | 102,125 | |
| | | | | | | | | | | | | | | | | | | | |
Total Futures Contracts | | | | | | | | | | $ | 4,265,025 | | | $ | 4,367,150 | | | $ | 102,125 | |
| | | | | | | | | | | | | | | | | | | | |
78
SELECTIVELY HEDGED GLOBAL EQUITY PORTFOLIO
CONTINUED
Summary of the Portfolio’s investments as of October 31, 2021, based on their valuation inputs, is as follows (see Security Valuation Note):
| | | | | | | | | | | | | | | | |
| | | Investments in Securities (Market Value) | |
| | | Level 1 | | | Level 2 | | | Level 3 | | | Total | |
Affiliated Investment Companies | | $ | 343,954,600 | | | | — | | | | — | | | $ | 343,954,600 | |
Forward Currency Contracts** | | | — | | | $ | 347,377 | | | | — | | | | 347,377 | |
Futures Contracts** | | | 102,125 | | | | — | | | | — | | | | 102,125 | |
| | | | | | | | | | | | | | | | |
TOTAL | | $ | 344,056,725 | | | $ | 347,377 | | | | — | | | $ | 344,404,102 | |
| | | | | | | | | | | | | | | | |
| ** | Valued at the unrealized appreciation/(depreciation) on the investment. |
See accompanying Notes to Financial Statements.
79
EMERGING MARKETS PORTFOLIO
SCHEDULE OF INVESTMENTS
October 31, 2021
| | | | |
| | | Value† | |
AFFILIATED INVESTMENT COMPANIES — (100.0%) | | | | |
Investment in The Emerging Markets Series of The DFA Investment Trust Company | | $ | 6,228,860,498 | |
| | | | |
TOTAL INVESTMENTS IN AFFILIATED INVESTMENT COMPANIES | | $ | 6,228,860,498 | |
| | | | |
Summary of the Portfolio’s Master Fund’s investments as of October 31, 2021, based on their valuation inputs, is located in this report (See Security Valuation Note).
See accompanying Notes to Financial Statements.
80
EMERGING MARKETS SMALL CAP PORTFOLIO
SCHEDULE OF INVESTMENTS
October 31, 2021
| | | | |
| | | Value† | |
AFFILIATED INVESTMENT COMPANIES — (100.0%) | | | | |
Investment in The Emerging Markets Small Cap Series of The DFA Investment Trust Company | | $ | 5,116,706,982 | |
| | | | |
TOTAL INVESTMENTS IN AFFILIATED INVESTMENT COMPANIES | | $ | 5,116,706,982 | |
| | | | |
Summary of the Portfolio’s Master Fund’s investments as of October 31, 2021, based on their valuation inputs, is located in this report (See Security Valuation Note).
See accompanying Notes to Financial Statements.
81
EMERGING MARKETS VALUE PORTFOLIO
SCHEDULE OF INVESTMENTS
October 31, 2021
| | | | |
| | | Value† | |
AFFILIATED INVESTMENT COMPANIES — (100.0%) | | | | |
Investment in Dimensional Emerging Markets Value Fund | | $ | 13,194,407,897 | |
| | | | |
TOTAL INVESTMENTS IN AFFILIATED INVESTMENT COMPANIES | | $ | 13,194,407,897 | |
| | | | |
Summary of the Portfolio’s Master Fund’s investments as of October 31, 2021, based on their valuation inputs, is located in this report (See Security Valuation Note).
See accompanying Notes to Financial Statements.
82
EMERGING MARKETS CORE EQUITY PORTFOLIO
SUMMARY SCHEDULE OF PORTFOLIO HOLDINGS
October 31, 2021
| | | | | | | | | | | | | | |
| | | | | Shares | | | Value» | | | Percentage
of Net Assets‡ | |
COMMON STOCKS — (97.3%) | | | | | | | | | | | | |
BRAZIL — (3.2%) | | | | | | | | | | | | |
| | Petroleo Brasileiro SA | | | 16,003,488 | | | $ | 78,460,703 | | | | 0.3 | % |
| | Vale SA | | | 15,469,805 | | | | 196,284,906 | | | | 0.7 | % |
| | Other Securities | | | | | | | 672,451,903 | | | | 2.2 | % |
| | | | | | | | | | | | | | |
TOTAL BRAZIL | | | | | | | 947,197,512 | | | | 3.2 | % |
| | | | | | | | | | | | | | |
CHILE — (0.4%) | | | | | | | | | | | | |
| | Other Securities | | | | | | | 127,309,381 | | | | 0.4 | % |
| | | | | | | | | | | | | | |
CHINA — (30.7%) | | | | | | | | | | | | |
* | | Alibaba Group Holding Ltd. | | | 7,662,500 | | | | 157,561,366 | | | | 0.6 | % |
* | | Alibaba Group Holding Ltd., Sponsored ADR | | | 2,528,930 | | | | 417,121,714 | | | | 1.5 | % |
| | ANTA Sports Products Ltd. | | | 4,074,000 | | | | 63,121,416 | | | | 0.2 | % |
* | | Baidu, Inc., Sponsored ADR | | | 559,862 | | | | 90,832,011 | | | | 0.3 | % |
| | Bank of China Ltd., Class H | | | 204,333,702 | | | | 72,314,014 | | | | 0.3 | % |
| | BYD Co. Ltd., Class H | | | 3,071,300 | | | | 117,469,796 | | | | 0.4 | % |
| | China Construction Bank Corp., Class H | | | 375,913,302 | | | | 255,839,332 | | | | 0.9 | % |
| | China Merchants Bank Co. Ltd., Class H | | | 19,175,646 | | | | 160,694,568 | | | | 0.6 | % |
| | China Petroleum & Chemical Corp., Class H | | | 144,228,400 | | | | 70,272,792 | | | | 0.3 | % |
| | Geely Automobile Holdings Ltd. | | | 29,475,000 | | | | 102,297,101 | | | | 0.4 | % |
# | | Great Wall Motor Co. Ltd., Class H | | | 15,115,250 | | | | 68,011,736 | | | | 0.3 | % |
| | Industrial & Commercial Bank of China Ltd., Class H | | | 265,967,725 | | | | 145,793,419 | | | | 0.5 | % |
* | | JD.com, Inc., ADR | | | 933,460 | | | | 73,071,249 | | | | 0.3 | % |
# | | Lenovo Group Ltd. | | | 63,424,000 | | | | 68,876,434 | | | | 0.3 | % |
| | Li Ning Co. Ltd. | | | 7,957,583 | | | | 87,812,377 | | | | 0.3 | % |
*W | | Meituan, Class B | | | 2,761,100 | | | | 93,956,395 | | | | 0.3 | % |
| | NetEase, Inc., ADR | | | 1,143,858 | | | | 111,629,102 | | | | 0.4 | % |
* | | NIO, Inc., ADR | | | 1,820,873 | | | | 71,760,605 | | | | 0.3 | % |
| | PetroChina Co. Ltd., Class H | | | 142,684,000 | | | | 68,794,722 | | | | 0.3 | % |
| | Ping An Insurance Group Co. of China Ltd., Class H | | | 30,207,000 | | | | 216,364,567 | | | | 0.8 | % |
| | Sunny Optical Technology Group Co. Ltd. | | | 2,316,400 | | | | 62,156,979 | | | | 0.2 | % |
| | Tencent Holdings Ltd. | | | 16,149,900 | | | | 982,395,071 | | | | 3.4 | % |
*W | | Xiaomi Corp., Class B | | | 25,612,600 | | | | 70,013,439 | | | | 0.3 | % |
| | Yum China Holdings, Inc. | | | 1,340,150 | | | | 76,495,762 | | | | 0.3 | % |
| | Other Securities | | | | | | | 5,378,529,482 | | | | 17.7 | % |
| | | | | | | | | | | | | | |
TOTAL CHINA | | | | | | | 9,083,185,449 | | | | 31.2 | % |
| | | | | | | | | | | | | | |
COLOMBIA — (0.2%) | | | | | | | | | | | | |
| | Other Securities | | | | | | | 47,310,651 | | | | 0.2 | % |
| | | | | | | | | | | | | | |
CZECH REPUBLIC — (0.1%) | | | | | | | | | | | | |
| | Other Securities | | | | | | | 32,595,311 | | | | 0.1 | % |
| | | | | | | | | | | | | | |
EGYPT — (0.0%) | | | | | | | | | | | | |
| | Other Securities | | | | | | | 15,832,090 | | | | 0.1 | % |
| | | | | | | | | | | | | | |
GREECE — (0.2%) | | | | | | | | | | | | |
| | Other Securities | | | | | | | 63,285,471 | | | | 0.2 | % |
| | | | | | | | | | | | | | |
HONG KONG — (0.2%) | | | | | | | | | | | | |
| | Other Securities | | | | | | | 47,921,347 | | | | 0.2 | % |
| | | | | | | | | | | | | | |
83
EMERGING MARKETS CORE EQUITY PORTFOLIO
CONTINUED
| | | | | | | | | | | | | | |
| | | | | Shares | | | Value» | | | Percentage
of Net Assets‡ | |
HUNGARY — (0.2%) | | | | | | | | | | | | |
| | Other Securities | | | | | | $ | 73,889,087 | | | | 0.2 | % |
| | | | | | | | | | | | | | |
INDIA — (13.6%) | | | | | | | | | | | | |
| | HCL Technologies Ltd. | | | 4,015,915 | | | | 61,559,527 | | | | 0.2 | % |
| | HDFC Bank Ltd. | | | 5,989,118 | | | | 127,277,274 | | | | 0.5 | % |
| | Housing Development Finance Corp. Ltd. | | | 2,600,724 | | | | 99,045,387 | | | | 0.4 | % |
| | ICICI Bank Ltd., Sponsored ADR | | | 3,949,896 | | | | 83,540,300 | | | | 0.3 | % |
| | Infosys Ltd. | | | 7,880,895 | | | | 176,708,768 | | | | 0.6 | % |
| | Infosys Ltd., Sponsored ADR | | | 4,067,156 | | | | 90,616,236 | | | | 0.3 | % |
| | Reliance Industries Ltd. | | | 8,205,897 | | | | 278,880,128 | | | | 1.0 | % |
| | Tata Consultancy Services Ltd. | | | 2,369,939 | | | | 107,922,513 | | | | 0.4 | % |
| | Other Securities | | | | | | | 2,980,329,039 | | | | 10.0 | % |
| | | | | | | | | | | | | | |
TOTAL INDIA | | | | | | | 4,005,879,172 | | | | 13.7 | % |
| | | | | | | | | | | | | | |
INDONESIA — (1.7%) | | | | | | | | | | | | |
| | Bank Central Asia Tbk PT | | | 112,444,000 | | | | 59,457,835 | | | | 0.2 | % |
| | Other Securities | | | | | | | 438,804,458 | | | | 1.5 | % |
| | | | | | | | | | | | | | |
TOTAL INDONESIA | | | | | | | 498,262,293 | | | | 1.7 | % |
| | | | | | | | | | | | | | |
MALAYSIA — (1.6%) | | | | | | | | | | | | |
| | Other Securities | | | | | | | 473,866,456 | | | | 1.6 | % |
| | | | | | | | | | | | | | |
MEXICO — (2.2%) | | | | | | | | | | | | |
| | America Movil SAB de CV, Sponsored ADR, Class L | | | 3,763,327 | | | | 66,911,954 | | | | 0.2 | % |
# | | Grupo Mexico SAB de CV, Class B | | | 14,035,878 | | | | 61,507,524 | | | | 0.2 | % |
| | Other Securities | | | | | | | 512,945,325 | | | | 1.8 | % |
| | | | | | | | | | | | | | |
TOTAL MEXICO | | | | | | | 641,364,803 | | | | 2.2 | % |
| | | | | | | | | | | | | | |
NETHERLANDS — (0.1%) | | | | | | | | | | | | |
| | Other Security | | | | | | | 17,726,005 | | | | 0.1 | % |
| | | | | | | | | | | | | | |
PERU — (0.1%) | | | | | | | | | | | | |
| | Other Securities | | | | | | | 22,712,384 | | | | 0.1 | % |
| | | | | | | | | | | | | | |
PHILIPPINES — (0.8%) | | | | | | | | | | | | |
| | Other Securities | | | | | | | 239,469,348 | | | | 0.8 | % |
| | | | | | | | | | | | | | |
POLAND — (0.9%) | | | | | | | | | | | | |
| | Other Securities | | | | | | | 262,412,729 | | | | 0.9 | % |
| | | | | | | | | | | | | | |
QATAR — (0.4%) | | | | | | | | | | | | |
| | Other Securities | | | | | | | 116,866,510 | | | | 0.4 | % |
| | | | | | | | | | | | | | |
RUSSIA — (1.1%) | | | | | | | | | | | | |
| | Lukoil PJSC, Sponsored ADR | | | 635,884 | | | | 64,816,193 | | | | 0.2 | % |
| | Sberbank of Russia PJSC, Sponsored ADR | | | 3,020,548 | | | | 60,577,132 | | | | 0.2 | % |
| | Other Securities | | | | | | | 197,113,128 | | | | 0.7 | % |
| | | | | | | | | | | | | | |
TOTAL RUSSIA | | | | | | | 322,506,453 | | | | 1.1 | % |
| | | | | | | | | | | | | | |
SAUDI ARABIA — (3.0%) | | | | | | | | | | | | |
| | Al Rajhi Bank | | | 2,676,919 | | | | 99,028,345 | | | | 0.4 | % |
84
EMERGING MARKETS CORE EQUITY PORTFOLIO
CONTINUED
| | | | | | | | | | | | | | |
| | | | | Shares | | | Value» | | | Percentage
of Net Assets‡ | |
SAUDI ARABIA — (Continued) | | | | | | | | | | | | |
| | Other Securities | | | | | | $ | 796,982,344 | | | | 2.7 | % |
| | | | | | | | | | | | | | |
TOTAL SAUDI ARABIA | | | | | | | 896,010,689 | | | | 3.1 | % |
| | | | | | | | | | | | | | |
SOUTH AFRICA — (3.9%) | | | | | | | | | | | | |
* | | MTN Group Ltd. | | | 12,072,408 | | | | 108,254,825 | | | | 0.4 | % |
| | Other Securities | | | | | | | 1,049,667,231 | | | | 3.6 | % |
| | | | | | | | | | | | | | |
TOTAL SOUTH AFRICA | | | | | | | 1,157,922,056 | | | | 4.0 | % |
| | | | | | | | | | | | | | |
SOUTH KOREA — (13.7%) | | | | | | | | | | | | |
| | LG Chem Ltd. | | | 114,526 | | | | 82,178,689 | | | | 0.3 | % |
| | LG Electronics, Inc. | | | 633,563 | | | | 65,544,546 | | | | 0.2 | % |
| | Samsung Electronics Co. Ltd. | | | 17,111,392 | | | | 1,024,512,331 | | | | 3.5 | % |
| | SK Hynix, Inc. | | | 1,965,870 | | | | 173,292,552 | | | | 0.6 | % |
| | Other Securities | | | | | | | 2,695,542,105 | | | | 9.3 | % |
| | | | | | | | | | | | | | |
TOTAL SOUTH KOREA | | | | | | | 4,041,070,223 | | | | 13.9 | % |
| | | | | | | | | | | | | | |
TAIWAN — (16.0%) | | | | | | | | | | | | |
| | Hon Hai Precision Industry Co. Ltd. | | | 22,635,403 | | | | 87,380,306 | | | | 0.3 | % |
| | MediaTek, Inc. | | | 2,798,823 | | | | 92,116,776 | | | | 0.3 | % |
| | Taiwan Semiconductor Manufacturing Co. Ltd. | | | 41,439,652 | | | | 879,361,426 | | | | 3.0 | % |
| | Taiwan Semiconductor Manufacturing Co. Ltd., Sponsored ADR | | | 3,788,624 | | | | 430,766,549 | | | | 1.5 | % |
| | Other Securities | | | | | | | 3,227,131,145 | | | | 11.1 | % |
| | | | | | | | | | | | | | |
TOTAL TAIWAN | | | | | | | 4,716,756,202 | | | | 16.2 | % |
| | | | | | | | | | | | | | |
THAILAND — (2.0%) | | | | | | | | | | | | |
| | Other Securities | | | | | | | 603,577,687 | | | | 2.1 | % |
| | | | | | | | | | | | | | |
TURKEY — (0.4%) | | | | | | | | | | | | |
| | Other Securities | | | | | | | 132,234,912 | | | | 0.4 | % |
| | | | | | | | | | | | | | |
UNITED ARAB EMIRATES — (0.6%) | | | | | | | | | | | | |
| | Other Securities | | | | | | | 166,250,278 | | | | 0.6 | % |
| | | | | | | | | | | | | | |
UNITED KINGDOM — (0.0%) | | | | | | | | | | | | |
| | Other Security | | | | | | | 1,063,633 | | | | 0.0 | % |
| | | | | | | | | | | | | | |
UNITED STATES — (0.0%) | | | | | | | | | | | | |
| | Other Security | | | | | | | 6,426,925 | | | | 0.0 | % |
| | | | | | | | | | | | | | |
TOTAL COMMON STOCKS | | | | | | | 28,760,905,057 | | | | 98.7 | % |
| | | | | | | | | | | | | | |
PREFERRED STOCKS — (0.9%) | | | | | | | | | | | | |
BRAZIL — (0.9%) | | | | | | | | | | | | |
| | Petroleo Brasileiro SA | | | 22,001,222 | | | | 106,228,658 | | | | 0.4 | % |
| | Other Securities | | | | | | | 140,970,851 | | | | 0.5 | % |
| | | | | | | | | | | | | | |
TOTAL BRAZIL | | | | | | | 247,199,509 | | | | 0.9 | % |
| | | | | | | | | | | | | | |
CHILE — (0.0%) | | | | | | | | | | | | |
| | Other Securities | | | | | | | 2,680,141 | | | | 0.0 | % |
| | | | | | | | | | | | | | |
85
EMERGING MARKETS CORE EQUITY PORTFOLIO
CONTINUED
| | | | | | | | | | | | | | |
| | | | | Shares | | | Value» | | | Percentage
of Net Assets‡ | |
COLOMBIA — (0.0%) | | | | | | | | | | | | |
| | Other Securities | | | | | | $ | 10,245,894 | | | | 0.0 | % |
| | | | | | | | | | | | | | |
PHILIPPINES — (0.0%) | | | | | | | | | | | | |
| | Other Security | | | | | | | 1,037,601 | | | | 0.0 | % |
| | | | | | | | | | | | | | |
SOUTH KOREA — (0.0%) | | | | | | | | | | | | |
| | Other Securities | | | | | | | 631,698 | | | | 0.0 | % |
| | | | | | | | | | | | | | |
THAILAND — (0.0%) | | | | | | | | | | | | |
| | Other Security | | | | | | | 990,448 | | | | 0.0 | % |
| | | | | | | | | | | | | | |
TOTAL PREFERRED STOCKS | | | | | | | 262,785,291 | | | | 0.9 | % |
| | | | | | | | | | | | | | |
RIGHTS/WARRANTS — (0.0%) | | | | | | | | | | | | |
INDIA — (0.0%) | | | | | | | | | | | | |
| | Other Securities | | | | | | | 6,071 | | | | 0.0 | % |
| | | | | | | | | | | | | | |
INDONESIA — (0.0%) | | | | | | | | | | | | |
| | Other Security | | | | | | | 12,246 | | | | 0.0 | % |
| | | | | | | | | | | | | | |
SOUTH KOREA — (0.0%) | | | | | | | | | | | | |
| | Other Securities | | | | | | | 31,054 | | | | 0.0 | % |
| | | | | | | | | | | | | | |
TAIWAN — (0.0%) | | | | | | | | | | | | |
| | Other Securities | | | | | | | 48,707 | | | | 0.0 | % |
| | | | | | | | | | | | | | |
THAILAND — (0.0%) | | | | | | | | | | | | |
| | Other Securities | | | | | | | 1,519,834 | | | | 0.0 | % |
| | | | | | | | | | | | | | |
TOTAL RIGHTS/WARRANTS | | | | | | | 1,617,912 | | | | 0.0 | % |
| | | | | | | | | | | | | | |
TOTAL INVESTMENT SECURITIES
(Cost $19,747,315,249) | | | | | | | 29,025,308,260 | | | | | |
| | | | | | | | | | | | | | |
| | | | |
| | | | | | | | Value† | | | | |
SECURITIES LENDING COLLATERAL — (1.8%) | | | | | | | | | | | | |
@§ | | The DFA Short Term Investment Fund | | | 45,348,297 | | | | 524,679,798 | | | | 1.8 | % |
| | | | | | | | | | | | | | |
TOTAL INVESTMENTS—(100.0%)
(Cost $20,271,918,513) | | | | | | $ | 29,549,988,058 | | | | 101.4 | % |
| | | | | | | | | | | | | | |
As of October 31, 2021, Emerging Markets Core Equity Portfolio had entered into the following outstanding futures contracts:
| | | | | | | | | | | | | | | | | | | | |
Description | | Number of
Contracts | | | Expiration
Date | | | Notional
Value | | | Market
Value | | | Unrealized
Appreciation
(Depreciation) | |
Long Position Contracts: | | | | | | | | | | | | | | | | | | | | |
S&P 500® Emini Index | | | 954 | | | | 12/17/21 | | | $ | 211,221,711 | | | $ | 219,276,900 | | | $ | 8,055,189 | |
| | | | | | | | | | | | | | | | | | | | |
Total Futures Contracts | | | | | | | | | | $ | 211,221,711 | | | $ | 219,276,900 | | | $ | 8,055,189 | |
| | | | | | | | | | | | | | | | | | | | |
86
EMERGING MARKETS CORE EQUITY PORTFOLIO
CONTINUED
Summary of the Portfolio’s investments as of October 31, 2021, based on their valuation inputs, is as follows (see Security Valuation Note):
| | | | | | | | | | | | | | | | |
| | | Investments in Securities (Market Value) | |
| | | Level 1 | | | Level 2 | | | Level 3 | | | Total | |
Common Stocks | | | | | | | | | | | | | | | | |
Brazil | | $ | 947,197,512 | | | | — | | | | — | | | $ | 947,197,512 | |
Chile | | | 36,082,220 | | | $ | 91,227,161 | | | | — | | | | 127,309,381 | |
China | | | 1,184,682,150 | | | | 7,858,395,835 | | | $ | 40,107,464 | | | | 9,083,185,449 | |
Colombia | | | 47,310,651 | | | | — | | | | — | | | | 47,310,651 | |
Czech Republic | | | — | | | | 32,595,311 | | | | — | | | | 32,595,311 | |
Egypt | | | 145,411 | | | | 15,686,679 | | | | — | | | | 15,832,090 | |
Greece | | | — | | | | 63,122,281 | | | | 163,190 | | | | 63,285,471 | |
Hong Kong | | | 8,975,910 | | | | 38,713,664 | | | | 231,773 | | | | 47,921,347 | |
Hungary | | | — | | | | 73,889,087 | | | | — | | | | 73,889,087 | |
India | | | 191,856,639 | | | | 3,814,001,078 | | | | 21,455 | | | | 4,005,879,172 | |
Indonesia | | | 17,328,641 | | | | 479,259,643 | | | | 1,674,009 | | | | 498,262,293 | |
Malaysia | | | — | | | | 473,866,285 | | | | 171 | | | | 473,866,456 | |
Mexico | | | 638,275,178 | | | | 3,067,747 | | | | 21,878 | | | | 641,364,803 | |
Netherlands | | | — | | | | 17,726,005 | | | | — | | | | 17,726,005 | |
Peru | | | 22,702,879 | | | | 9,505 | | | | — | | | | 22,712,384 | |
Philippines | | | 4,858,542 | | | | 234,610,013 | | | | 793 | | | | 239,469,348 | |
Poland | | | — | | | | 262,412,729 | | | | — | | | | 262,412,729 | |
Qatar | | | — | | | | 116,866,510 | | | | — | | | | 116,866,510 | |
Russia | | | 26,384,415 | | | | 296,122,038 | | | | — | | | | 322,506,453 | |
Saudi Arabia | | | 1,705,833 | | | | 894,304,856 | | | | — | | | | 896,010,689 | |
South Africa | | | 146,449,939 | | | | 1,011,472,117 | | | | — | | | | 1,157,922,056 | |
South Korea | | | 66,853,722 | | | | 3,973,125,838 | | | | 1,090,663 | | | | 4,041,070,223 | |
Taiwan | | | 443,781,892 | | | | 4,272,626,468 | | | | 347,842 | | | | 4,716,756,202 | |
Thailand | | | 603,577,687 | | | | — | | | | — | | | | 603,577,687 | |
Turkey | | | 476,082 | | | | 131,758,830 | | | | — | | | | 132,234,912 | |
United Arab Emirates | | | — | | | | 166,201,301 | | | | 48,977 | | | | 166,250,278 | |
United Kingdom | | | — | | | | 1,063,633 | | | | — | | | | 1,063,633 | |
United States | | | 6,426,925 | | | | — | | | | — | | | | 6,426,925 | |
Preferred Stocks | | | | | | | | | | | | | | | | |
Brazil | | | 247,134,443 | | | | 65,066 | | | | — | | | | 247,199,509 | |
Chile | | | — | | | | 2,680,141 | | | | — | | | | 2,680,141 | |
Colombia | | | 10,245,894 | | | | — | | | | — | | | | 10,245,894 | |
Philippines | | | — | | | | 1,037,601 | | | | — | | | | 1,037,601 | |
South Korea | | | — | | | | 631,698 | | | | — | | | | 631,698 | |
Thailand | | | 990,448 | | | | — | | | | — | | | | 990,448 | |
Rights/Warrants | | | | | | | | | | | | | | | | |
India | | | — | | | | 6,071 | | | | — | | | | 6,071 | |
Indonesia | | | — | | | | 12,246 | | | | — | | | | 12,246 | |
South Korea | | | — | | | | 31,054 | | | | — | | | | 31,054 | |
Taiwan | | | — | | | | 48,707 | | | | — | | | | 48,707 | |
Thailand | | | — | | | | 1,519,834 | | | | — | | | | 1,519,834 | |
Securities Lending Collateral | | | — | | | | 524,679,798 | | | | — | | | | 524,679,798 | |
Futures Contracts** | | | 8,055,189 | | | | — | | | | — | | | | 8,055,189 | |
| | | | | | | | | | | | | | | | |
TOTAL | | $ | 4,661,498,202 | | | $ | 24,852,836,830 | | | $ | 43,708,215 | ^ | | $ | 29,558,043,247 | |
| | | | | | | | | | | | | | | | |
| ** | Valued at the unrealized appreciation/(depreciation) on the investment. |
| ^ | A reconciliation of Level 3 investments is presented when the Fund had a significant amount of Level 3 investments at the beginning and/or end of the reporting period in relation to net assets. |
See accompanying Notes to Financial Statements.
87
EMERGING MARKETS TARGETED VALUE PORTFOLIO
SUMMARY SCHEDULE OF PORTFOLIO HOLDINGS
October 31, 2021
| | | | | | | | | | | | | | |
| | | | | Shares | | | Value» | | | Percentage
of Net Assets‡ | |
COMMON STOCKS — (98.0%) | | | | | | | | | | | | |
BRAZIL — (2.4%) | | | | | | | | | | | | |
| | Other Securities | | | | | | $ | 5,693,992 | | | | 2.4 | % |
| | | | | | | | | | | | | | |
CHILE — (0.3%) | | | | | | | | | | | | |
| | Other Securities | | | | | | | 680,494 | | | | 0.3 | % |
| | | | | | | | | | | | | | |
CHINA — (25.2%) | | | | | | | | | | | | |
| | China Conch Venture Holdings Ltd. | | | 201,500 | | | | 979,158 | | | | 0.4 | % |
| | China Gas Holdings Ltd. | | | 390,000 | | | | 973,448 | | | | 0.4 | % |
| | China National Building Material Co. Ltd., Class H | | | 900,000 | | | | 1,127,964 | | | | 0.5 | % |
| | China Resources Gas Group Ltd. | | | 130,000 | | | | 697,754 | | | | 0.3 | % |
| | Fosun International Ltd. | | | 530,500 | | | | 621,543 | | | | 0.3 | % |
| | Kingboard Holdings Ltd. | | | 150,500 | | | | 655,850 | | | | 0.3 | % |
| | Kunlun Energy Co. Ltd. | | | 730,000 | | | | 664,869 | | | | 0.3 | % |
| | PICC Property & Casualty Co. Ltd., Class H | | | 1,102,000 | | | | 1,025,902 | | | | 0.5 | % |
| | Sunac China Holdings Ltd. | | | 398,000 | | | | 851,133 | | | | 0.4 | % |
* | | Tencent Music Entertainment Group, ADR | | | 87,413 | | | | 687,066 | | | | 0.3 | % |
* | | Trip.com Group Ltd., ADR | | | 35,214 | | | | 1,005,712 | | | | 0.4 | % |
* | | Vipshop Holdings Ltd., ADR | | | 58,456 | | | | 652,369 | | | | 0.3 | % |
| | Wharf Holdings Ltd. | | | 231,000 | | | | 803,134 | | | | 0.4 | % |
| | Other Securities | | | | | | | 48,925,303 | | | | 20.6 | % |
| | | | | | | | | | | | | | |
TOTAL CHINA | | | | | | | 59,671,205 | | | | 25.4 | % |
| | | | | | | | | | | | | | |
COLOMBIA — (0.1%) | | | | | | | | | | | | |
| | Other Securities | | | | | | | 270,047 | | | | 0.1 | % |
| | | | | | | | | | | | | | |
GREECE — (0.3%) | | | | | | | | | | | | |
| | Other Securities | | | | | | | 765,948 | | | | 0.3 | % |
| | | | | | | | | | | | | | |
HONG KONG — (0.3%) | | | | | | | | | | | | |
| | Other Securities | | | | | | | 693,395 | | | | 0.3 | % |
| | | | | | | | | | | | | | |
INDIA — (15.1%) | | | | | | | | | | | | |
| | Adani Enterprises Ltd. | | | 31,994 | | | | 609,262 | | | | 0.3 | % |
* | | Adani Transmission Ltd. | | | 32,300 | | | | 770,635 | | | | 0.3 | % |
| | Cipla Ltd. | | | 50,763 | | | | 617,870 | | | | 0.3 | % |
| | IndusInd Bank Ltd. | | | 50,201 | | | | 769,331 | | | | 0.3 | % |
| | Tata Consumer Products Ltd. | | | 82,391 | | | | 895,635 | | | | 0.4 | % |
* | | Tata Motors Ltd. | | | 152,580 | | | | 983,071 | | | | 0.4 | % |
| | Tata Steel Ltd. | | | 85,210 | | | | 1,504,263 | | | | 0.7 | % |
| | UPL Ltd. | | | 75,705 | | | | 755,897 | | | | 0.3 | % |
| | Other Securities | | | | | | | 28,693,377 | | | | 12.1 | % |
| | | | | | | | | | | | | | |
TOTAL INDIA | | | | | | | 35,599,341 | | | | 15.1 | % |
| | | | | | | | | | | | | | |
INDONESIA — (1.9%) | | | | | | | | | | | | |
| | Other Securities | | | | | | | 4,393,850 | | | | 1.9 | % |
| | | | | | | | | | | | | | |
MALAYSIA — (1.8%) | | | | | | | | | | | | |
| | Other Securities | | | | | | | 4,248,060 | | | | 1.8 | % |
| | | | | | | | | | | | | | |
MEXICO — (2.0%) | | | | | | | | | | | | |
| | Grupo Televisa SAB | | | 384,935 | | | | 778,919 | | | | 0.3 | % |
88
EMERGING MARKETS TARGETED VALUE PORTFOLIO
CONTINUED
| | | | | | | | | | | | | | |
| | | | | Shares | | | Value» | | | Percentage
of Net Assets‡ | |
MEXICO — (Continued) | | | | | | | | | | | | |
| | Other Securities | | | | | | $ | 3,840,109 | | | | 1.7 | % |
| | | | | | | | | | | | | | |
TOTAL MEXICO | | | | | | | 4,619,028 | | | | 2.0 | % |
| | | | | | | | | | | | | | |
PHILIPPINES — (0.6%) | | | | | | | | | | | | |
| | Other Securities | | | | | | | 1,443,052 | | | | 0.6 | % |
| | | | | | | | | | | | | | |
POLAND — (1.3%) | | | | | | | | | | | | |
| | Other Securities | | | | | | | 3,074,860 | | | | 1.3 | % |
| | | | | | | | | | | | | | |
QATAR — (0.8%) | | | | | | | | | | | | |
| | Other Securities | | | | | | | 1,892,996 | | | | 0.8 | % |
| | | | | | | | | | | | | | |
RUSSIA — (0.8%) | | | | | | | | | | | | |
| | Tatneft PJSC, Sponsored ADR | | | 13,583 | | | | 619,589 | | | | 0.3 | % |
| | Other Securities | | | | | | | 1,199,307 | | | | 0.5 | % |
| | | | | | | | | | | | | | |
TOTAL RUSSIA | | | | | | | 1,818,896 | | | | 0.8 | % |
| | | | | | | | | | | | | | |
SAUDI ARABIA — (3.3%) | | | | | | | | | | | | |
* | | Bank AlBilad | | | 57,250 | | | | 644,845 | | | | 0.3 | % |
| | Sahara International Petrochemical Co. | | | 64,085 | | | | 752,557 | | | | 0.3 | % |
* | | Saudi Kayan Petrochemical Co. | | | 131,174 | | | | 714,071 | | | | 0.3 | % |
| | Other Securities | | | | | | | 5,805,131 | | | | 2.5 | % |
| | | | | | | | | | | | | | |
TOTAL SAUDI ARABIA | | | | | | | 7,916,604 | | | | 3.4 | % |
| | | | | | | | | | | | | | |
SOUTH AFRICA — (3.7%) | | | | | | | | | | | | |
| | Aspen Pharmacare Holdings Ltd. | | | 54,209 | | | | 861,200 | | | | 0.4 | % |
| | Nedbank Group Ltd. | | | 54,959 | | | | 626,260 | | | | 0.3 | % |
| | Old Mutual Ltd. | | | 654,522 | | | | 668,597 | | | | 0.3 | % |
| | Other Securities | | | | | | | 6,654,516 | | | | 2.7 | % |
| | | | | | | | | | | | | | |
TOTAL SOUTH AFRICA | | | | | | | 8,810,573 | | | | 3.7 | % |
| | | | | | | | | | | | | | |
SOUTH KOREA — (16.7%) | | | | | | | | | | | | |
| | E-MART, Inc. | | | 4,144 | | | | 596,537 | | | | 0.3 | % |
| | Hankook Tire & Technology Co. Ltd. | | | 16,838 | | | | 596,593 | | | | 0.3 | % |
* | | Hanwha Solutions Corp. | | | 20,018 | | | | 702,287 | | | | 0.3 | % |
* | | Korean Air Lines Co. Ltd. | | | 23,980 | | | | 625,217 | | | | 0.3 | % |
| | Samsung Fire & Marine Insurance Co. Ltd. | | | 3,347 | | | | 663,451 | | | | 0.3 | % |
* | | Samsung Heavy Industries Co. Ltd. | | | 122,648 | | | | 670,248 | | | | 0.3 | % |
| | Woori Financial Group, Inc. | | | 94,919 | | | | 1,079,053 | | | | 0.5 | % |
| | Other Securities | | | | | | | 34,609,901 | | | | 14.5 | % |
| | | | | | | | | | | | | | |
TOTAL SOUTH KOREA | | | | | | | 39,543,287 | | | | 16.8 | % |
| | | | | | | | | | | | | | |
TAIWAN — (17.8%) | | | | | | | | | | | | |
# | | AU Optronics Corp. | | | 1,126,000 | | | | 773,813 | | | | 0.3 | % |
| | China Development Financial Holding Corp. | | | 1,938,000 | | | | 990,567 | | | | 0.4 | % |
| | Compal Electronics, Inc. | | | 862,000 | | | | 758,611 | | | | 0.3 | % |
# | | Innolux Corp. | | | 1,286,000 | | | | 773,569 | | | | 0.3 | % |
| | Lite-On Technology Corp. | | | 399,000 | | | | 880,505 | | | | 0.4 | % |
| | Pegatron Corp. | | | 253,000 | | | | 619,354 | | | | 0.3 | % |
| | Pou Chen Corp. | | | 489,000 | | | | 599,718 | | | | 0.3 | % |
| | Shanghai Commercial & Savings Bank Ltd. | | | 389,000 | | | | 616,045 | | | | 0.3 | % |
# | | Shin Kong Financial Holding Co. Ltd. | | | 1,923,698 | | | | 677,981 | | | | 0.3 | % |
89
EMERGING MARKETS TARGETED VALUE PORTFOLIO
CONTINUED
| | | | | | | | | | | | | | |
| | | | | Shares | | | Value» | | | Percentage
of Net Assets‡ | |
TAIWAN — (Continued) | | | | | | | | | | | | |
| | SinoPac Financial Holdings Co. Ltd. | | | 1,542,000 | | | $ | 785,321 | | | | 0.3 | % |
| | Taishin Financial Holding Co. Ltd. | | | 1,583,166 | | | | 1,039,341 | | | | 0.5 | % |
| | Wistron Corp. | | | 567,000 | | | | 595,889 | | | | 0.3 | % |
| | Other Securities | | | | | | | 33,098,981 | | | | 14.0 | % |
| | | | | | | | | | | | | | |
TOTAL TAIWAN | | | | | | | 42,209,695 | | | | 18.0 | % |
| | | | | | | | | | | | | | |
THAILAND — (2.1%) | | | | | | | | | | | | |
| | Other Securities | | | | | | | 4,901,616 | | | | 2.1 | % |
| | | | | | | | | | | | | | |
TURKEY — (0.6%) | | | | | | | | | | | | |
| | Other Se curities | | | | | | | 1,351,815 | | | | 0.6 | % |
| | | | | | | | | | | | | | |
UNITED ARAB EMIRATES — (0.9%) | | | | | | | | | | | | |
| | Emaar Properties PJSC | | | 564,538 | | | | 618,017 | | | | 0.3 | % |
| | Other Securities | | | | | | | 1,418,721 | | | | 0.6 | % |
| | | | | | | | | | | | | | |
TOTAL UNITED ARAB EMIRATES | | | | | | | 2,036,738 | | | | 0.9 | % |
| | | | | | | | | | | | | | |
TOTAL COMMON STOCKS | | | | | | | 231,635,492 | | | | 98.6 | % |
| | | | | | | | | | | | | | |
PREFERRED STOCKS — (0.7%) | | | | | | | | | | | | |
BRAZIL — (0.6%) | | | | | | | | | | | | |
| | Gerdau SA | | | 158,000 | | | | 753,074 | | | | 0.3 | % |
| | Other Securities | | | | | | | 686,500 | | | | 0.3 | % |
| | | | | | | | | | | | | | |
TOTAL BRAZIL | | | | | | | 1,439,574 | | | | 0.6 | % |
| | | | | | | | | | | | | | |
COLOMBIA — (0.0%) | | | | | | | | | | | | |
| | Other Security | | | | | | | 73,569 | | | | 0.0 | % |
| | | | | | | | | | | | | | |
PHILIPPINES — (0.0%) | | | | | | | | | | | | |
| | Other Security | | | | | | | 18,457 | | | | 0.0 | % |
| | | | | | | | | | | | | | |
SOUTH KOREA — (0.0%) | | | | | | | | | | | | |
| | Other Security | | | | | | | 31,128 | | | | 0.0 | % |
| | | | | | | | | | | | | | |
THAILAND — (0.1%) | | | | | | | | | | | | |
| | Other Security | | | | | | | 108,296 | | | | 0.1 | % |
| | | | | | | | | | | | | | |
TOTAL PREFERRED STOCKS | | | | | | | 1,671,024 | | | | 0.7 | % |
| | | | | | | | | | | | | | |
RIGHTS/WARRANTS — (0.0%) | | | | | | | | | | | | |
SOUTH KOREA — (0.0%) | | | | | | | | | | | | |
| | Other Security | | | | | | | 343 | | | | 0.0 | % |
| | | | | | | | | | | | | | |
TAIWAN — (0.0%) | | | | | | | | | | | | |
| | Other Securities | | | | | | | 589 | | | | 0.0 | % |
| | | | | | | | | | | | | | |
THAILAND — (0.0%) | | | | | | | | | | | | |
| | Other Securities | | | | | | | 52,590 | | | | 0.0 | % |
| | | | | | | | | | | | | | |
TOTAL RIGHTS/WARRANTS | | | | | | | 53,522 | | | | 0.0 | % |
| | | | | | | | | | | | | | |
TOTAL INVESTMENT SECURITIES
(Cost $185,842,031) | | | | | | | 233,360,038 | | | | | |
| | | | | | | | | | | | | | |
90
EMERGING MARKETS TARGETED VALUE PORTFOLIO
CONTINUED
| | | | | | | | | | | | | | |
| | | | | Shares | | | Value† | | | Percentage
of Net Assets‡ | |
SECURITIES LENDING COLLATERAL — (1.3%) | | | | | | | | | | | | |
@§ | | The DFA Short Term Investment Fund | | | 265,309 | | | $ | 3,069,622 | | | | 1.3 | % |
| | | | | | | | | | | | | | |
TOTAL INVESTMENTS—(100.0%)
(Cost $188,911,449) | | | | | | $ | 236,429,660 | | | | 100.6 | % |
| | | | | | | | | | | | | | |
As of October 31, 2021, Emerging Markets Targeted Value Portfolio had entered into the following outstanding futures contracts:
| | | | | | | | | | | | | | | | | | | | |
Description | | Number of
Contracts | | | Expiration
Date | | | Notional
Value | | | Market
Value | | | Unrealized
Appreciation
(Depreciation) | |
Long Position Contracts: | | | | | | | | | | | | | | | | | | | | |
S&P 500® Emini Index | | | 7 | | | | 12/17/21 | | | $ | 1,555,098 | | | $ | 1,608,950 | | | $ | 53,852 | |
| | | | | | | | | | | | | | | | | | | | |
Total Futures Contracts | | | | | | | | | | $ | 1,555,098 | | | $ | 1,608,950 | | | $ | 53,852 | |
| | | | | | | | | | | | | | | | | | | | |
Summary of the Portfolio’s investments as of October 31, 2021, based on their valuation inputs, is as follows (see Security Valuation Note):
| | | | | | | | | | | | | | | | |
| | | Investments in Securities (Market Value) | |
| | | Level 1 | | | Level 2 | | | Level 3 | | | Total | |
Common Stocks | | | | | | | | | | | | | | | | |
Brazil | | $ | 5,693,992 | | | | — | | | | — | | | $ | 5,693,992 | |
Chile | | | — | | | $ | 680,494 | | | | — | | | | 680,494 | |
China | | | 4,693,278 | | | | 54,051,577 | | | $ | 926,350 | | | | 59,671,205 | |
Colombia | | | 270,047 | | | | — | | | | — | | | | 270,047 | |
Greece | | | — | | | | 765,948 | | | | — | | | | 765,948 | |
Hong Kong | | | 152,642 | | | | 540,753 | | | | — | | | | 693,395 | |
India | | | 66,956 | | | | 35,532,385 | | | | — | | | | 35,599,341 | |
Indonesia | | | — | | | | 4,376,392 | | | | 17,458 | | | | 4,393,850 | |
Malaysia | | | — | | | | 4,248,060 | | | | — | | | | 4,248,060 | |
Mexico | | | 4,399,671 | | | | 219,357 | | | | — | | | | 4,619,028 | |
Philippines | | | — | | | | 1,443,052 | | | | — | | | | 1,443,052 | |
Poland | | | — | | | | 3,074,860 | | | | — | | | | 3,074,860 | |
Qatar | | | — | | | | 1,892,996 | | | | — | | | | 1,892,996 | |
Russia | | | 1,592,248 | | | | 226,648 | | | | — | | | | 1,818,896 | |
Saudi Arabia | | | 12,592 | | | | 7,904,012 | | | | — | | | | 7,916,604 | |
South Africa | | | 171,056 | | | | 8,639,517 | | | | — | | | | 8,810,573 | |
South Korea | | | — | | | | 39,535,609 | | | | 7,678 | | | | 39,543,287 | |
Taiwan | | | — | | | | 42,205,746 | | | | 3,949 | | | | 42,209,695 | |
Thailand | | | 4,901,616 | | | | — | | | | — | | | | 4,901,616 | |
Turkey | | | — | | | | 1,351,815 | | | | — | | | | 1,351,815 | |
United Arab Emirates | | | 17,497 | | | | 2,019,241 | | | | — | | | | 2,036,738 | |
Preferred Stocks | | | | | | | | | | | | | | | | |
Brazil | | | 1,439,574 | | | | — | | | | — | | | | 1,439,574 | |
Colombia | | | 73,569 | | | | — | | | | — | | | | 73,569 | |
Philippines | | | — | | | | 18,457 | | | | — | | | | 18,457 | |
South Korea | | | — | | | | 31,128 | | | | — | | | | 31,128 | |
Thailand | | | 108,296 | | | | — | | | | — | | | | 108,296 | |
Rights/Warrants | | | | | | | | | | | | | | | | |
South Korea | | | — | | | | 343 | | | | — | | | | 343 | |
Taiwan | | | — | | | | 589 | | | | — | | | | 589 | |
Thailand | | | — | | | | 52,590 | | | | — | | | | 52,590 | |
91
EMERGING MARKETS TARGETED VALUE PORTFOLIO
CONTINUED
| | | | | | | | | | | | | | | | |
| | | Investments in Securities (Market Value) | |
| | | Level 1 | | | Level 2 | | | Level 3 | | | Total | |
Securities Lending Collateral | | | — | | | $ | 3,069,622 | | | | — | | | $ | 3,069,622 | |
Futures Contracts** | | $ | 53,852 | | | | — | | | | — | | | | 53,852 | |
| | | | | | | | | | | | | | | | |
TOTAL | | $ | 23,646,886 | | | $ | 211,881,191 | | | $ | 955,435^ | | | $ | 236,483,512 | |
| | | | | | | | | | | | | | | | |
| ** | Valued at the unrealized appreciation/(depreciation) on the investment. |
| ^ | A reconciliation of Level 3 investments is presented when the Fund had a significant amount of Level 3 investments at the beginning and/or end of the reporting period in relation to net assets. |
See accompanying Notes to Financial Statements.
92
DFA INVESTMENT DIMENSIONS GROUP INC.
STATEMENTS OF ASSETS AND LIABILITIES
OCTOBER 31, 2021
(Amounts in thousands, except share and per share amounts)
| | | | | | | | | | | | | | | | |
| | | | | | | | | | | | International | |
| | | Large Cap | | | International | | | Global Small | | | Small | |
| | | International | | | Core Equity | | | Company | | | Company | |
| | | Portfolio* | | | Portfolio* | | | Portfolio | | | Portfolio | |
ASSETS: | | | | | | | | | | | | | | | | |
Investments in Affiliated Investment Companies at Value | | | — | | | | — | | | $ | 99,070 | | | $ | 13,381,393 | |
Investment Securities at Value (including $342,264, $1,784,215, $0 and $0 of securities on loan, respectively) | | $ | 5,949,952 | | | $ | 34,143,208 | | | | — | | | | — | |
Temporary Cash Investments at Value & Cost | | | — | | | | — | | | | — | | | | 89,678 | |
Collateral from Securities on Loan Invested in Affiliate at Value (including cost of $301,094, $1,594,847, $0 and $0, respectively) | | | 301,125 | | | | 1,595,008 | | | | — | | | | — | |
Segregated Cash for Futures Contracts | | | 2,634 | | | | 14,973 | | | | — | | | | 4,324 | |
Foreign Currencies at Value | | | 35,275 | | | | 283,418 | | | | — | | | | — | |
Cash | | | 18,300 | | | | 74,182 | | | | 70 | | | | — | |
Receivables: | | | | | | | | | | | | | | | | |
Investment Securities Sold | | | 6,947 | | | | 30,873 | | | | — | | | | — | |
Dividends, Interest and Tax Reclaims | | | 20,875 | | | | 116,268 | | | | — | | | | 2 | |
Securities Lending Income | | | 130 | | | | 1,198 | | | | — | | | | — | |
Fund Shares Sold | | | 2,476 | | | | 21,616 | | | | 559 | | | | 7,286 | |
Futures Margin Variation | | | 109 | | | | 618 | | | | — | | | | 179 | |
Unrealized Gain on Foreign Currency Contracts | | | 8 | | | | — | | | | — | | | | — | |
Prepaid Expenses and Other Assets | | | 30 | | | | 184 | | | | 11 | | | | 436 | |
| | | | | | | | | | | | | | | | |
Total Assets | | | 6,337,861 | | | | 36,281,546 | | | | 99,710 | | | | 13,483,298 | |
| | | | | | | | | | | | | | | | |
LIABILITIES: | | | | | | | | | | | | | | | | |
Payables: | | | | | | | | | | | | | | | | |
Upon Return of Securities Loaned | | | 301,155 | | | | 1,595,091 | | | | — | | | | — | |
Investment Securities Purchased | | | 513 | | | | 27,701 | | | | 2 | | | | — | |
Fund Shares Redeemed | | | 2,325 | | | | 18,560 | | | | 47 | | | | 13,113 | |
Due to Advisor | | | 707 | | | | 5,802 | | | | 18 | | | | 3,405 | |
Unrealized Loss on Foreign Currency Contracts | | | 1 | | | | 22 | | | | — | | | | — | |
Accrued Expenses and Other Liabilities | | | 979 | | | | 4,787 | | | | 12 | | | | 927 | |
| | | | | | | | | | | | | | | | |
Total Liabilities | | | 305,680 | | | | 1,651,963 | | | | 79 | | | | 17,445 | |
| | | | | | | | | | | | | | | | |
NET ASSETS | | $ | 6,032,181 | | | $ | 34,629,583 | | | $ | 99,631 | | | $ | 13,465,853 | |
| | | | | | | | | | | | | | | | |
NET ASSET VALUE, OFFERING AND REDEMPTION PRICE PER SHARE: | | | | | | | | | | | | | | | | |
Institutional Class Shares — based on net assets of $6,032,181; $34,629,583; $99,631 and $13,465,853 and shares outstanding of 218,311,626, 2,118,648,313, 6,419,115 and 578,162,359, respectively | | $ | 27.63 | | | $ | 16.35 | | | $ | 15.52 | | | $ | 23.29 | |
| | | | | | | | | | | | | | | | |
NUMBER OF SHARES AUTHORIZED | | | 1,500,000,000 | | | | 7,000,000,000 | | | | 100,000,000 | | | | 3,000,000,000 | |
| | | | | | | | | | | | | | | | |
Investments in Affiliated Investment Companies at Cost | | $ | — | | | $ | — | | | $ | 78,886 | | | | N/A | |
| | | | | | | | | | | | | | | | |
Investment Securities at Cost | | $ | 3,905,702 | | | $ | 24,808,816 | | | | N/A | | | | N/A | |
| | | | | | | | | | | | | | | | |
Foreign Currencies at Cost | | $ | 34,595 | | | $ | 279,476 | | | $ | — | | | $ | — | |
| | | | | | | | | | | | | | | | |
NET ASSETS CONSIST OF: | | | | | | | | | | | | | | | | |
Paid-In Capital | | $ | 4,366,527 | | | $ | 26,524,050 | | | $ | 76,801 | | | $ | 9,852,598 | |
Total Distributable Earnings (Loss) | | | 1,665,654 | | | | 8,105,533 | | | | 22,830 | | | | 3,613,255 | |
| | | | | | | | | | | | | | | | |
NET ASSETS | | $ | 6,032,181 | | | $ | 34,629,583 | | | $ | 99,631 | | | $ | 13,465,853 | |
| | | | | | | | | | | | | | | | |
| * | See Note K in the Notes to Financial Statements for additional information about securities lending collateral. |
See accompanying Notes to Financial Statements.
93
DFA INVESTMENT DIMENSIONS GROUP INC.
STATEMENTS OF ASSETS AND LIABILITIES
OCTOBER 31, 2021
(Amounts in thousands, except share and per share amounts)
| | | | | | | | | | | | | | | | |
| | | | | | Asia Pacific | | | United | | | Continental | |
| | | Japanese Small | | | Small | | | Kingdom Small | | | Small | |
| | | Company | | | Company | | | Company | | | Company | |
| | | Portfolio | | | Portfolio | | | Portfolio | | | Portfolio | |
ASSETS: | | | | | | | | | | | | | | | | |
Investments in Affiliated Investment Companies at Value | | $ | 379,961 | | | $ | 381,648 | | | $ | 44,159 | | | $ | 868,048 | |
Receivables: | | | | | | | | | | | | | | | | |
Fund Shares Sold | | | 11 | | | | 16 | | | | — | | | | 6 | |
Prepaid Expenses and Other Assets | | | 8 | | | | 8 | | | | 8 | | | | 8 | |
| | | | | | | | | | | | | | | | |
Total Assets | | | 379,980 | | | | 381,672 | | | | 44,167 | | | | 868,062 | |
| | | | | | | | | | | | | | | | |
LIABILITIES: | | | | | | | | | | | | | | | | |
Payables: | | | | | | | | | | | | | | | | |
Fund Shares Redeemed | | | — | | | | 40 | | | | — | | | | 1 | |
Due to Advisor | | | 96 | | | | 95 | | | | 22 | | | | 217 | |
Accrued Expenses and Other Liabilities | | | 47 | | | | 47 | | | | 12 | | | | 85 | |
| | | | | | | | | | | | | | | | |
Total Liabilities | | | 143 | | | | 182 | | | | 34 | | | | 303 | |
| | | | | | | | | | | | | | | | |
NET ASSETS | | $ | 379,837 | | | $ | 381,490 | | | $ | 44,133 | | | $ | 867,759 | |
| | | | | | | | | | | | | | | | |
| | | | | | | | | | | | | | | | |
NET ASSET VALUE, OFFERING AND REDEMPTION PRICE PER SHARE: | | | | | | | | | | | | | | | | |
Institutional Class Shares — based on net assets of $379,837; $381,490; $44,133 and $867,759 and shares outstanding of 14,721,628, 14,162,754, 1,391,361 and 24,600,910, respectively | | $ | 25.80 | | | $ | 26.94 | | | $ | 31.72 | | | $ | 35.27 | |
| | | | | | | | | | | | | | | | |
NUMBER OF SHARES AUTHORIZED | | | 1,000,000,000 | | | | 1,000,000,000 | | | | 1,000,000,000 | | | | 1,000,000,000 | |
| | | | | | | | | | | | | | | | |
NET ASSETS CONSIST OF: | | | | | | | | | | | | | | | | |
Paid-In Capital | | $ | 290,278 | | | $ | 294,720 | | | $ | 38,037 | | | $ | 613,892 | |
Total Distributable Earnings (Loss) | | | 89,559 | | | | 86,770 | | | | 6,096 | | | | 253,867 | |
| | | | | | | | | | | | | | | | |
NET ASSETS | | $ | 379,837 | | | $ | 381,490 | | | $ | 44,133 | | | $ | 867,759 | |
| | | | | | | | | | | | | | | | |
See accompanying Notes to Financial Statements.
94
DFA INVESTMENT DIMENSIONS GROUP INC.
STATEMENTS OF ASSETS AND LIABILITIES
OCTOBER 31, 2021
(Amounts in thousands, except share and per share amounts)
| | | | | | | | | | | | | | | | |
| | | DFA | | | | | | | | | | |
| | | International | | | DFA Global | | | DFA | | | | |
| | | Real Estate | | | Real Estate | | | International | | | International | |
| | | Securities | | | Securities | | | Small Cap | | | Vector Equity | |
| | | Portfolio* | | | Portfolio* | | | Value Portfolio* | | | Portfolio* | |
ASSETS: | | | | | | | | | | | | | | | | |
Investments in Affiliated Investment Companies at Value | | | — | | | $ | 4,506,316 | | | | — | | | | — | |
Investment Securities at Value (including $310,687, $211,568, $437,113 and $181,628 of securities on loan, respectively) | | $ | 5,897,243 | | | | 6,022,099 | | | $ | 12,602,305 | | | $ | 3,674,695 | |
Collateral from Securities on Loan Invested in Affiliate at Value (including cost of $310,518, $217,036, $383,544 and $142,967, respectively) | | | 310,546 | | | | 217,045 | | | | 383,591 | | | | 142,988 | |
Segregated Cash for Futures Contracts | | | 2,081 | | | | — | | | | 6,452 | | | | 897 | |
Foreign Currencies at Value | | | 17,182 | | | | — | | | | 136,909 | | | | 16,369 | |
Cash | | | 44,548 | | | | 4,792 | | | | 4,539 | | | | 10,358 | |
Receivables: | | | | | | | | | | | | | | | | |
Investment Securities Sold | | | 10,245 | | | | — | | | | 12,985 | | | | 6,881 | |
Dividends, Interest and Tax Reclaims | | | 22,704 | | | | 1,721 | | | | 57,301 | | | | 13,318 | |
Securities Lending Income | | | 265 | | | | 8 | | | | 347 | | | | 183 | |
Fund Shares Sold | | | 884 | | | | 7,352 | | | | 4,118 | | | | 1,111 | |
Futures Margin Variation | | | 86 | | | | — | | | | 812 | | | | 37 | |
Unrealized Gain on Foreign Currency Contracts | | | — | | | | — | | | | 10 | | | | — | |
Prepaid Expenses and Other Assets | | | 11 | | | | 63 | | | | 59 | | | | 24 | |
| | | | | | | | | | | | | | | | |
Total Assets | | | 6,305,795 | | | | 10,759,396 | | | | 13,209,428 | | | | 3,866,861 | |
| | | | | | | | | | | | | | | | |
LIABILITIES: | | | | | | | | | | | | | | | | |
Payables: | | | | | | | | | | | | | | | | |
Upon Return of Securities Loaned | | | 310,621 | | | | 217,101 | | | | 383,569 | | | | 142,982 | |
Investment Securities Purchased | | | 4,511 | | | | — | | | | 30,876 | | | | 4,505 | |
Fund Shares Redeemed | | | 1,173 | | | | 3,450 | | | | 3,217 | | | | 853 | |
Due to Advisor | | | 1,201 | | | | 513 | | | | 4,849 | | | | 1,094 | |
Unrealized Loss on Foreign Currency Contracts | | | 4 | | | | — | | | | 34 | | | | — | |
Accrued Expenses and Other Liabilities | | | 821 | | | | 746 | | | | 2,172 | | | | 637 | |
| | | | | | | | | | | | | | | | |
Total Liabilities | | | 318,331 | | | | 221,810 | | | | 424,717 | | | | 150,071 | |
| | | | | | | | | | | | | | | | |
NET ASSETS | | $ | 5,987,464 | | | $ | 10,537,586 | | | $ | 12,784,711 | | | $ | 3,716,790 | |
| | | | | | | | | | | | | | | | |
NET ASSET VALUE, OFFERING AND REDEMPTION PRICE PER SHARE: | | | | | | | | | | | | | | | | |
Institutional Class Shares — based on net assets of $5,987,464; $10,537,586; $12,784,711 and $3,716,790 and shares outstanding of 1,187,541,223, 792,605,237, 577,420,362 and 256,206,800, respectively | | $ | 5.04 | | | $ | 13.29 | | | $ | 22.14 | | | $ | 14.51 | |
| | | | | | | | | | | | | | | | |
NUMBER OF SHARES AUTHORIZED | | | 4,000,000,000 | | | | 3,000,000,000 | | | | 4,600,000,000 | | | | 1,500,000,000 | |
| | | | | | | | | | | | | | | | |
Investments in Affiliated Investment Companies at Cost | | $ | — | | | $ | 3,743,815 | | | $ | — | | | $ | — | |
| | | | | | | | | | | | | | | | |
Investment Securities at Cost | | $ | 5,055,210 | | | $ | 4,243,147 | | | $ | 10,248,354 | | | $ | 2,695,410 | |
| | | | | | | | | | | | | | | | |
Foreign Currencies at Cost | | $ | 17,485 | | | $ | — | | | $ | 135,649 | | | $ | 16,345 | |
| | | | | | | | | | | | | | | | |
NET ASSETS CONSIST OF: | | | | | | | | | | | | | | | | |
Paid-In Capital | | $ | 6,063,665 | | | $ | 7,974,123 | | | $ | 10,333,896 | | | $ | 2,665,068 | |
Total Distributable Earnings (Loss) | | | (76,201 | ) | | | 2,563,463 | | | | 2,450,815 | | | | 1,051,722 | |
| | | | | | | | | | | | | | | | |
NET ASSETS | | $ | 5,987,464 | | | $ | 10,537,586 | | | $ | 12,784,711 | | | $ | 3,716,790 | |
| | | | | | | | | | | | | | | | |
| * | See Note K in the Notes to Financial Statements for additional information about securities lending collateral. |
See accompanying Notes to Financial Statements.
95
DFA INVESTMENT DIMENSIONS GROUP INC.
STATEMENTS OF ASSETS AND LIABILITIES
OCTOBER 31, 2021
(Amounts in thousands, except share and per share amounts)
| | | | | | | | | | | | |
| | | International | | | | | | | |
| | | High Relative | | | | | | World ex U.S. | |
| | | Profitability | | | World ex U.S. | | | Core Equity | |
| | | Portfolio* | | | Value Portfolio | | | Portfolio* | |
ASSETS: | | | | | | | | | | | | |
Investments in Affiliated Investment Companies at Value | | | — | | | $ | 308,536 | | | | — | |
Investment Securities at Value (including $102,860, $0 and $199,817 of securities on loan, respectively) | | $ | 2,173,960 | | | | — | | | $ | 4,039,571 | |
Collateral from Securities on Loan Invested in Affiliate at Value (including cost of $96,291, $0 and $144,530, respectively) | | | 96,296 | | | | — | | | | 144,554 | |
Segregated Cash for Futures Contracts | | | — | | | | — | | | | 1,817 | |
Foreign Currencies at Value | | | 2,016 | | | | — | | | | 39,827 | |
Cash | | | 8,287 | | | | 213 | | | | 3,684 | |
Receivables: | | | | | | | | | | | | |
Investment Securities Sold | | | — | | | | — | | | | 2,665 | |
Dividends, Interest and Tax Reclaims | | | 5,172 | | | | — | | | | 11,097 | |
Securities Lending Income | | | 29 | | | | — | | | | 259 | |
Fund Shares Sold | | | 2,938 | | | | 35 | | | | 1,607 | |
Futures Margin Variation | | | 288 | | | | — | | | | 75 | |
Prepaid Expenses and Other Assets | | | 21 | | | | 17 | | | | 20 | |
| | | | | | | | | | | | |
Total Assets | | | 2,289,007 | | | | 308,801 | | | | 4,245,176 | |
| | | | | | | | | | | | |
LIABILITIES: | | | | | | | | | | | | |
Payables: | | | | | | | | | | | | |
Upon Return of Securities Loaned | | | 96,300 | | | | — | | | | 144,566 | |
Investment Securities Purchased | | | 7,603 | | | | — | | | | 135 | |
Fund Shares Redeemed | | | 615 | | | | 51 | | | | 2,409 | |
Due to Advisor | | | 453 | | | | 47 | | | | 863 | |
Unrealized Loss on Foreign Currency Contracts | | | 8 | | | | — | | | | — | |
Deferred Taxes Payable | | | — | | | | — | | | | 7,065 | |
Accrued Expenses and Other Liabilities | | | 304 | | | | 37 | | | | 972 | |
| | | | | | | | | | | | |
Total Liabilities | | | 105,283 | | | | 135 | | | | 156,010 | |
| | | | | | | | | | | | |
NET ASSETS | | $ | 2,183,724 | | | $ | 308,666 | | | $ | 4,089,166 | |
| | | | | | | | | | | | |
NET ASSET VALUE, OFFERING AND REDEMPTION PRICE PER SHARE: | | | | | | | | | | | | |
Institutional Class Shares — based on net assets of $2,183,724; $308,666 and $4,089,166 and shares outstanding of 159,050,400, 24,367,707 and 295,469,031, respectively | | $ | 13.73 | | | $ | 12.67 | | | $ | 13.84 | |
| | | | | | | | | | | | |
NUMBER OF SHARES AUTHORIZED | | | 500,000,000 | | | | 1,000,000,000 | | | | 1,500,000,000 | |
| | | | | | | | | | | | |
Investments in Affiliated Investment Companies at Cost | | $ | — | | | $ | 259,829 | | | $ | — | |
| | | | | | | | | | | | |
Investment Securities at Cost | | $ | 1,682,824 | | | | N/A | | | $ | 3,030,242 | |
| | | | | | | | | | | | |
Foreign Currencies at Cost | | $ | 2,017 | | | $ | — | | | $ | 39,385 | |
| | | | | | | | | | | | |
NET ASSETS CONSIST OF: | | | | | | | | | | | | |
Paid-In Capital | | $ | 1,672,659 | | | $ | 269,354 | | | $ | 3,187,770 | |
Total Distributable Earnings (Loss) | | | 511,065 | | | | 39,312 | | | | 901,396 | |
| | | | | | | | | | | | |
NET ASSETS | | $ | 2,183,724 | | | $ | 308,666 | | | $ | 4,089,166 | |
| | | | | | | | | | | | |
| * | See Note K in the Notes to Financial Statements for additional information about securities lending collateral. |
See accompanying Notes to Financial Statements.
96
DFA INVESTMENT DIMENSIONS GROUP INC.
STATEMENTS OF ASSETS AND LIABILITIES
OCTOBER 31, 2021
(Amounts in thousands, except share and per share amounts)
| | | | | | | | | | | | | | | | |
| | | | | | Selectively | | | | | | | |
| | | World Core | | | Hedged Global | | | Emerging | | | Emerging | |
| | | Equity | | | Equity | | | Markets | | | Markets Small | |
| | | Portfolio | | | Portfolio | | | Portfolio | | | Cap Portfolio | |
ASSETS: | | | | | | | | | | | | | | | | |
Investments in Affiliated Investment Companies at Value | | $ | 1,089,751 | | | $ | 343,955 | | | $ | 6,228,860 | | | $ | 5,116,707 | |
Segregated Cash for Futures Contracts | | | — | | | | 218 | | | | — | | | | — | |
Cash | | | — | | | | 4,196 | | | | — | | | | — | |
Receivables: | | | | | | | | | | | | | | | | |
Investment Securities/Affiliated Investment Companies Sold | | | 368 | | | | — | | | | — | | | | — | |
Fund Shares Sold | | | 157 | | | | 55 | | | | 2,023 | | | | 3,291 | |
Futures Margin Variation | | | — | | | | 9 | | | | — | | | | — | |
Unrealized Gain on Forward Currency Contracts | | | — | | | | 736 | | | | — | | | | — | |
Prepaid Expenses and Other Assets | | | 7 | | | | 16 | | | | 41 | | | | 27 | |
| | | | | | | | | | | | | | | | |
Total Assets | | | 1,090,283 | | | | 349,185 | | | | 6,230,924 | | | | 5,120,025 | |
| | | | | | | | | | | | | | | | |
LIABILITIES: | | | | | | | | | | | | | | | | |
Payables: | | | | | | | | | | | | | | | | |
Fund Shares Redeemed | | | 1,334 | | | | 36 | | | | 4,275 | | | | 2,148 | |
Due to Advisor | | | 28 | | | | 12 | | | | 1,017 | | | | 1,419 | |
Line of Credit | | | 142 | | | | — | | | | — | | | | — | |
Unrealized Loss on Forward Currency Contracts | | | — | | | | 389 | | | | — | | | | — | |
Accrued Expenses and Other Liabilities | | | 65 | | | | 41 | | | | 445 | | | | 534 | |
| | | | | | | | | | | | | | | | |
Total Liabilities | | | 1,569 | | | | 478 | | | | 5,737 | | | | 4,101 | |
| | | | | | | | | | | | | | | | |
NET ASSETS | | $ | 1,088,714 | | | $ | 348,707 | | | $ | 6,225,187 | | | $ | 5,115,924 | |
| | | | | | | | | | | | | | | | |
NET ASSET VALUE, OFFERING AND REDEMPTION | | | | | | | | | | | | | | | | |
PRICE PER SHARE: | | | | | | | | | | | | | | | | |
Institutional Class Shares — based on net assets of $1,088,714; $348,707; $6,225,187 and $5,115,924 and shares outstanding of 48,268,788, 15,601,153, 188,337,679 and 196,539,681, respectively | | $ | 22.56 | | | $ | 22.35 | | | $ | 33.05 | | | $ | 26.03 | |
| | | | | | | | | | | | | | | | |
NUMBER OF SHARES AUTHORIZED | | | 1,000,000,000 | | | | 1,000,000,000 | | | | 1,500,000,000 | | | | 1,500,000,000 | |
| | | | | | | | | | | | | | | | |
Investments in Affiliated Investment Companies at Cost | | $ | 682,662 | | | $ | 190,774 | | | | N/A | | | | N/A | |
| | | | | | | | | | | | | | | | |
NET ASSETS CONSIST OF: | | | | | | | | | | | | | | | | |
Paid-In Capital | | $ | 695,365 | | | $ | 180,810 | | | $ | 3,544,746 | | | $ | 3,846,582 | |
Total Distributable Earnings (Loss) | | | 393,349 | | | | 167,897 | | | | 2,680,441 | | | | 1,269,342 | |
| | | | | | | | | | | | | | | | |
NET ASSETS | | $ | 1,088,714 | | | $ | 348,707 | | | $ | 6,225,187 | | | $ | 5,115,924 | |
| | | | | | | | | | | | | | | | |
See accompanying Notes to Financial Statements.
97
DFA INVESTMENT DIMENSIONS GROUP INC.
STATEMENTS OF ASSETS AND LIABILITIES
OCTOBER 31, 2021
(Amounts in thousands, except share and per share amounts)
| | | | | | | | | | | | |
| | | | | | Emerging | | | | |
| | | Emerging | | | Markets Core | | | Emerging | |
| | | Markets Value | | | Equity | | | Markets Targeted | |
| | | Portfolio | | | Portfolio* | | | Value Portfolio* | |
ASSETS: | | | | | | | | | | | | |
Investments in Affiliated Investment Companies at Value | | $ | 13,194,408 | | | | — | | | | — | |
Investment Securities at Value (including $0, $1,647,460 and $9,396 of securities on loan, respectively) | | | — | | | $ | 29,025,308 | | | $ | 233,360 | |
Collateral from Securities on Loan Invested in Affiliate at Value (including cost of $0, $524,603 and $3,069, respectively) | | | — | | | | 524,680 | | | | 3,070 | |
Segregated Cash for Futures Contracts | | | — | | | | 10,971 | | | | 81 | |
Foreign Currencies at Value | | | — | | | | 183,033 | | | | 1,076 | |
Cash | | | — | | | | 95,121 | | | | 1,955 | |
Receivables: | | | | | | | | | | | | |
Investment Securities/Affiliated Investment Companies Sold | | | — | | | | 11,615 | | | | 537 | |
Dividends and Interest | | | — | | | | 31,502 | | | | 202 | |
Securities Lending Income | | | — | | | | 4,030 | | | | 33 | |
Fund Shares Sold | | | 84,657 | | | | 15,300 | | | | 140 | |
Futures Margin Variation | | | — | | | | 453 | | | | — | |
Unrealized Gain on Foreign Currency Contracts | | | — | | | | 2 | | | | 1 | |
Prepaid Expenses and Other Assets | | | 107 | | | | 128 | | | | 21 | |
| | | | | | | | | | | | |
Total Assets | | | 13,279,172 | | | | 29,902,143 | | | | 240,476 | |
| | | | | | | | | | | | |
LIABILITIES: | | | | | | | | | | | | |
Payables: | | | | | | | | | | | | |
Upon Return of Securities Loaned | | | — | | | | 524,700 | | | | 3,070 | |
Investment Securities/Affiliated Investment Companies Purchased | | | — | | | | 15,765 | | | | 593 | |
Fund Shares Redeemed | | | 2,706 | | | | 21,531 | | | | 78 | |
Due to Advisor | | | 3,540 | | | | 8,230 | | | | 104 | |
Futures Margin Variation | | | — | | | | — | | | | 13 | |
Deferred Taxes Payable | | | — | | | | 169,435 | | | | 1,566 | |
Accrued Expenses and Other Liabilities | | | 1,216 | | | | 7,113 | | | | 131 | |
| | | | | | | | | | | | |
Total Liabilities | | | 7,462 | | | | 746,774 | | | | 5,555 | |
| | | | | | | | | | | | |
NET ASSETS | | $ | 13,271,710 | | | $ | 29,155,369 | | | $ | 234,921 | |
| | | | | | | | | | | | |
NET ASSET VALUE, OFFERING AND REDEMPTION PRICE PER SHARE: | | | | | | | | | | | | |
Class R2 Shares — based on net assets of $13,709; $0 and $0 and shares outstanding of 438,273, 0 and 0, respectively | | $ | 31.28 | | | | N/A | | | | N/A | |
| | | | | | | | | | | | |
NUMBER OF SHARES AUTHORIZED | | | 200,000,000 | | | | N/A | | | | N/A | |
| | | | | | | | | | | | |
Institutional Class Shares — based on net assets of $13,258,001; $29,155,369 and $234,921 and shares outstanding of 421,137,868, 1,158,977,701 and 17,895,390, respectively | | $ | 31.48 | | | $ | 25.16 | | | $ | 13.13 | |
| | | | | | | | | | | | |
NUMBER OF SHARES AUTHORIZED | | | 3,000,000,000 | | | | 5,000,000,000 | | | | 500,000,000 | |
| | | | | | | | | | | | |
Investment Securities at Cost | | | N/A | | | $ | 19,747,315 | | | $ | 185,842 | |
| | | | | | | | | | | | |
Foreign Currencies at Cost | | $ | — | | | $ | 178,854 | | | $ | 1,000 | |
| | | | | | | | | | | | |
NET ASSETS CONSIST OF: | | | | | | | | | | | | |
Paid-In Capital | | $ | 12,155,659 | | | $ | 22,212,258 | | | $ | 170,520 | |
Total Distributable Earnings (Loss) | | | 1,116,051 | | | | 6,943,111 | | | | 64,401 | |
| | | | | | | | | | | | |
NET ASSETS | | $ | 13,271,710 | | | $ | 29,155,369 | | | $ | 234,921 | |
| | | | | | | | | | | | |
| * | See Note K in the Notes to Financial Statements for additional information about securities lending collateral. |
See accompanying Notes to Financial Statements.
98
DFA INVESTMENT DIMENSIONS GROUP INC.
STATEMENTS OF OPERATIONS
FOR THE YEAR ENDED OCTOBER 31, 2021
(Amounts in thousands)
| | | | | | | | | | | | | | | | |
| | | | | | | | | | | | International | |
| | | Large Cap | | | International | | | Global Small | | | Small | |
| | | International | | | Core Equity | | | Company | | | Company | |
| | | Portfolio# | | | Portfolio# | | | Portfolio* | | | Portfolio* | |
Investment Income | | | | | | | | | | | | | | | | |
Net Investment Income Allocated from Affiliated Investment Companies | | | | | | | | | | | | | | | | |
Dividends (Net of Foreign Taxes Withheld of $0, $0, $90 and $29,819, respectively) | | | — | | | | — | | | $ | 826 | | | $ | 284,123 | |
Income from Securities Lending | | | — | | | | — | | | | 61 | | | | 13,194 | |
Expenses Allocated from Affiliated Investment Companies | | | — | | | | — | | | | (55 | ) | | | (15,068 | ) |
| | | | | | | | | | | | | | | | |
Income Distributions Received from Affiliated Investment Companies | | | — | | | | — | | | | 505 | | | | — | |
| | | | | | | | | | | | | | | | |
Total Net Investment Income Allocated and/or Distributions Received from Affiliated Investment Companies | | | — | | | | — | | | | 1,337 | | | | 282,249 | |
| | | | | | | | | | | | | | | | |
Fund Investment Income | | | | | | | | | | | | | | | | |
Dividends (Net of Foreign Taxes Withheld of $14,631, $80,927, $0 and $0, respectively) | | $ | 161,747 | | | $ | 889,766 | | | | — | | | | — | |
Income from Securities Lending | | | 1,923 | | | | 18,444 | | | | — | | | | — | |
| | | | | | | | | | | | | | | | |
Total Fund Investment Income | | | 163,670 | | | | 908,210 | | | | — | | | | — | |
| | | | | | | | | | | | | | | | |
Fund Expenses | | | | | | | | | | | | | | | | |
Investment Management Fees | | | 8,782 | | | | 68,526 | | | | 320 | | | | 40,800 | |
Accounting & Transfer Agent Fees | | | 1,031 | | | | 6,043 | | | | 8 | | | | 1,690 | |
Custodian Fees | | | 402 | | | | 2,378 | | | | — | | | | 2 | |
Filing Fees | | | 144 | | | | 762 | | | | 18 | | | | 212 | |
Shareholders’ Reports | | | 167 | | | | 534 | | | | 9 | | | | 354 | |
Directors’/Trustees’ Fees & Expenses | | | 63 | | | | 347 | | | | — | | | | 137 | |
Professional Fees | | | 103 | | | | 573 | | | | — | | | | 38 | |
Previously Waived Fees Recovered by Advisor (Note C) | | | — | | | | 183 | | | | 31 | | | | — | |
Other | | | 189 | | | | 1,031 | | | | — | | | | 101 | |
| | | | | | | | | | | | | | | | |
Total Fund Expenses | | | 10,881 | | | | 80,377 | | | | 386 | | | | 43,334 | |
| | | | | | | | | | | | | | | | |
Fees Waived, Expenses Reimbursed by Advisor (Note C) | | | — | | | | — | | | | 221 | | | | — | |
Fees Paid Indirectly (Note C) | | | 15 | | | | 245 | | | | — | | | | — | |
| | | | | | | | | | | | | | | | |
Net Expenses | | | 10,866 | | | | 80,132 | | | | 165 | | | | 43,334 | |
| | | | | | | | | | | | | | | | |
Net Investment Income (Loss) | | | 152,804 | | | | 828,078 | | | | 1,172 | | | | 238,915 | |
| | | | | | | | | | | | | | | | |
Realized and Unrealized Gain (Loss) | | | | | | | | | | | | | | | | |
Net Realized Gain (Loss) on: | | | | | | | | | | | | | | | | |
Investment Securities Sold** | | | 88,328 | | | | 210,041 | | | | — | | | | — | |
Affiliated Investment Companies Shares Sold | | | (10 | ) | | | (21 | ) | | | 336 | | | | — | |
Transactions Allocated from Affiliated Investment Company** | | | — | | | | — | | | | 2,035 | | | | 837,220 | |
Futures | | | 14,606 | | | | 79,338 | | | | 35 | | | | 26,350 | |
Foreign Currency Transactions | | | 515 | | | | 769 | | | | — | | | | — | |
Change in Unrealized Appreciation (Depreciation) of: | | | | | | | | | | | | | | | | |
Investment Securities and Foreign Currency | | | 1,375,966 | | | | 8,427,366 | | | | — | | | | — | |
Affiliated Investment Companies Shares | | | (9 | ) | | | (71 | ) | | | 14,525 | | | | — | |
Transactions Allocated from Affiliated Investment Company | | | — | | | | — | | | | 5,844 | | | | 2,927,439 | |
Futures | | | 2,380 | | | | 10,863 | | | | — | | | | 3,416 | |
Translation of Foreign Currency-Denominated Amounts | | | (315 | ) | | | (1,813 | ) | | | — | | | | — | |
| | | | | | | | | | | | | | | | |
Net Realized and Unrealized Gain (Loss) | | | 1,481,461 | | | | 8,726,472 | | | | 22,775 | | | | 3,794,425 | |
| | | | | | | | | | | | | | | | |
Net Increase (Decrease) in Net Assets Resulting from Operations | | $ | 1,634,265 | | | $ | 9,554,550 | | | $ | 23,947 | | | $ | 4,033,340 | |
| | | | | | | | | | | | | | | | |
| ** | Net of foreign capital gain taxes withheld of $0, $0, $5 and $0, respectively. |
| * | Investment Income and Realized and Unrealized Gain (Loss) were allocated from the Portfolio’s Master Fund (Affiliated Investment Company). |
| # | Portion of income is from investment in affiliated fund. |
See accompanying Notes to Financial Statements.
99
DFA INVESTMENT DIMENSIONS GROUP INC.
STATEMENTS OF OPERATIONS
FOR THE YEAR ENDED OCTOBER 31, 2021
(Amounts in thousands)
| | | | | | | | | | | | | | | | |
| | | | | | Asia Pacific | | | United | | | Continental | |
| | | Japanese Small | | | Small | | | Kingdom Small | | | Small | |
| | | Company | | | Company | | | Company | | | Company | |
| | | Portfolio* | | | Portfolio* | | | Portfolio* | | | Portfolio* | |
Investment Income | | | | | | | | | | | | | | | | |
Net Investment Income Allocated from Affiliated Investment Companies | | | | | | | | | | | | | | | | |
Dividends (Net of Foreign Taxes Withheld of $1,105, $166, $10 and $2,693, respectively) | | $ | 9,959 | | | $ | 14,311 | | | $ | 856 | | | $ | 16,238 | |
Income from Securities Lending | | | 294 | | | | 858 | | | | 7 | | | | 890 | |
Expenses Allocated from Affiliated Investment Companies | | | (583 | ) | | | (533 | ) | | | (40 | ) | | | (941 | ) |
| | | | | | | | | | | | | | | | |
Total Net Investment Income Allocated and/or Distributions Received from Affiliated Investment Companies | | | 9,670 | | | | 14,636 | | | | 823 | | | | 16,187 | |
| | | | | | | | | | | | | | | | |
Fund Expenses | | | | | | | | | | | | | | | | |
Investment Management Fees | | | 2,007 | | | | 1,843 | | | | 145 | | | | 3,230 | |
Accounting & Transfer Agent Fees | | | 81 | | | | 83 | | | | 1 | | | | 152 | |
Filing Fees | | | 27 | | | | 28 | | | | 12 | | | | 40 | |
Shareholders’ Reports | | | 9 | | | | 8 | | | | 3 | | | | 9 | |
Directors’/Trustees’ Fees & Expenses | | | 5 | | | | 6 | | | | — | | | | 8 | |
Professional Fees | | | 1 | | | | 2 | | | | — | | | | 2 | |
Previously Waived Fees Recovered by Advisor (Note C) | | | — | | | | — | | | | 57 | | | | — | |
Other | | | 3 | | | | 2 | | | | 1 | | | | 9 | |
| | | | | | | | | | | | | | | | |
Total Fund Expenses | | | 2,133 | | | | 1,972 | | | | 219 | | | | 3,450 | |
| | | | | | | | | | | | | | | | |
Fees Waived, Expenses Reimbursed by Advisor (Note C) | | | 473 | | | | 436 | | | | 54 | | | | 769 | |
| | | | | | | | | | | | | | | | |
Net Expenses | | | 1,660 | | | | 1,536 | | | | 165 | | | | 2,681 | |
| | | | | | | | | | | | | | | | |
Net Investment Income (Loss) | | | 8,010 | | | | 13,100 | | | | 658 | | | | 13,506 | |
| | | | | | | | | | | | | | | | |
Realized and Unrealized Gain (Loss) | | | | | | | | | | | | | | | | |
Net Realized Gain (Loss) on: | | | | | | | | | | | | | | | | |
Transactions Allocated from Affiliated Investment Company** | | | 17,921 | | | | 49,285 | | | | 1,117 | | | | 44,052 | |
Change in Unrealized Appreciation (Depreciation) of: | | | | | | | | | | | | | | | | |
Transactions Allocated from Affiliated Investment Company | | | 31,604 | | | | 75,175 | | | | 7,530 | | | | 216,160 | |
| | | | | | | | | | | | | | | | |
Net Realized and Unrealized Gain (Loss) | | | 49,525 | | | | 124,460 | | | | 8,647 | | | | 260,212 | |
| | | | | | | | | | | | | | | | |
Net Increase (Decrease) in Net Assets Resulting from Operations | | $ | 57,535 | | | $ | 137,560 | | | $ | 9,305 | | | $ | 273,718 | |
| | | | | | | | | | | | | | | | |
| ** | Net of foreign capital gain taxes withheld of $0, $0, $0 and $0, respectively. |
| * | Investment Income and Realized and Unrealized Gain (Loss) were allocated from the Portfolio’s Master Fund (Affiliated Investment Company). |
See accompanying Notes to Financial Statements.
100
DFA INVESTMENT DIMENSIONS GROUP INC.
STATEMENTS OF OPERATIONS
FOR THE YEAR ENDED OCTOBER 31, 2021
(Amounts in thousands)
| | | | | | | | | | | | | | | | |
| | | DFA
International
Real Estate
Securities
Portfolio# | | | DFA Global
Real Estate
Securities
Portfolio# | | | DFA
International
Small Cap
Value Portfolio# | | | International
Vector Equity
Portfolio# | |
Investment Income | | | | | | | | | | | | | | | | |
Net Investment Income Allocated from Affiliated Investment Companies | | | | | | | | | | | | | | | | |
Income Distributions Received from Affiliated Investment Companies | | | — | | | $ | 21,150 | | | | — | | | | — | |
| | | | | | | | | | | | | | | | |
Total Net Investment Income Allocated and/or Distributions Received from Affiliated Investment Companies | | | — | | | | 21,150 | | | | — | | | | — | |
| | | | | | | | | | | | | | | | |
Fund Investment Income | | | | | | | | | | | | | | | | |
Dividends (Net of Foreign Taxes Withheld of $24,220, $8, $30,819 and $9,168, respectively) | | $ | 195,427 | | | | 113,826 | | | $ | 320,122 | | | $ | 94,876 | |
Income from Securities Lending | | | 4,635 | | | | 1,499 | | | | 7,328 | | | | 2,437 | |
| | | | | | | | | | | | | | | | |
Total Fund Investment Income | | | 200,062 | | | | 115,325 | | | | 327,450 | | | | 97,313 | |
| | | | | | | | | | | | | | | | |
Fund Expenses | | | | | | | | | | | | | | | | |
Investment Management Fees | | | 13,522 | | | | 18,667 | | | | 60,881 | | | | 13,086 | |
Accounting & Transfer Agent Fees | | | 682 | | | | 1,647 | | | | 2,185 | | | | 753 | |
Custodian Fees | | | 449 | | | | 31 | | | | 1,300 | | | | 344 | |
Filing Fees | | | 57 | | | | 201 | | | | 223 | | | | 137 | |
Shareholders’ Reports | | | 96 | | | | 351 | | | | 296 | | | | 98 | |
Directors’/Trustees’ Fees & Expenses | | | 60 | | | | 99 | | | | 132 | | | | 38 | |
Professional Fees | | | 89 | | | | 32 | | | | 193 | | | | 63 | |
Previously Waived Fees Recovered by Advisor (Note C) | | | — | | | | 26 | | | | — | | | | — | |
Other | | | 124 | | | | 97 | | | | 397 | | | | 120 | |
| | | | | | | | | | | | | | | | |
Total Fund Expenses | | | 15,079 | | | | 21,151 | | | | 65,607 | | | | 14,639 | |
| | | | | | | | | | | | | | | | |
Fees Waived, Expenses Reimbursed by Advisor (Note C) | | | — | | | | 9,038 | | | | — | | | | — | |
Fees Paid Indirectly (Note C) | | | 219 | | | | 3 | | | | 46 | | | | 5 | |
| | | | | | | | | | | | | | | | |
Net Expenses | | | 14,860 | | | | 12,110 | | | | 65,561 | | | | 14,634 | |
| | | | | | | | | | | | | | | | |
Net Investment Income (Loss) | | | 185,202 | | | | 124,365 | | | | 261,889 | | | | 82,679 | |
| | | | | | | | | | | | | | | | |
Realized and Unrealized Gain (Loss) | | | | | | | | | | | | | | | | |
Capital Gain Distributions Received from Investment Securities | | | — | | | | 1,045 | | | | — | | | | — | |
Net Realized Gain (Loss) on: | | | | | | | | | | | | | | | | |
Investment Securities Sold** | | | (56,022 | ) | | | 43,747 | | | | 541,397 | | | | 191,536 | |
Affiliated Investment Companies Shares Sold | | | (43 | ) | | | 60,992 | | | | (1 | ) | | | (7 | ) |
Futures | | | 13,260 | | | | 1,671 | | | | 26,234 | | | | (437 | ) |
Foreign Currency Transactions | | | (485 | ) | | | — | | | | 1,071 | | | | 49 | |
Change in Unrealized Appreciation (Depreciation) of: | | | | | | | | | | | | | | | | |
Investment Securities and Foreign Currency | | | 1,378,475 | | | | 1,755,986 | | | | 3,392,048 | | | | 860,557 | |
Affiliated Investment Companies Shares | | | (2 | ) | | | 1,097,358 | | | | (25 | ) | | | (8 | ) |
Futures | | | 3,086 | | | | — | | | | 9,695 | | | | 826 | |
Translation of Foreign Currency-Denominated Amounts | | | (414 | ) | | | — | | | | (1,012 | ) | | | (279 | ) |
| | | | | | | | | | | | | | | | |
Net Realized and Unrealized Gain (Loss) | | | 1,337,855 | | | | 2,960,799 | | | | 3,969,407 | | | | 1,052,237 | |
| | | | | | | | | | | | | | | | |
Net Increase (Decrease) in Net Assets Resulting from Operations | | $ | 1,523,057 | | | $ | 3,085,164 | | | $ | 4,231,296 | | | $ | 1,134,916 | |
| | | | | | | | | | | | | | | | |
| ** | Net of foreign capital gain taxes withheld of $0, $0, $0 and $0, respectively. |
| # | Portion of income is from investment in affiliated fund. |
See accompanying Notes to Financial Statements.
101
DFA INVESTMENT DIMENSIONS GROUP INC.
STATEMENTS OF OPERATIONS
FOR THE YEAR ENDED OCTOBER 31, 2021
(Amounts in thousands)
| | | | | | | | | | | | |
| | | International
High Relative
Profitability
Portfolio# | | | World ex U.S.
Value Portfolio* | | | World ex U.S.
Core Equity
Portfolio# | |
Investment Income | | | | | | | | | | | | |
Net Investment Income Allocated from Affiliated Investment Companies | | | | | | | | | | | | |
Dividends (Net of Foreign Taxes Withheld of $0, $1,009 and $0, respectively) | | | — | | | $ | 9,505 | | | | — | |
Income from Securities Lending | | | — | | | | 155 | | | | — | |
Expenses Allocated from Affiliated Investment Companies | | | — | | | | (505 | ) | | | — | |
| | | | | | | | | | | | |
Income Distributions Received from Affiliated Investment Companies | | | — | | | | 549 | | | | — | |
| | | | | | | | | | | | |
Total Net Investment Income Allocated and/or Distributions Received from Affiliated Investment Companies | | | — | | | | 9,704 | | | | — | |
| | | | | | | | | | | | |
Fund Investment Income | | | | | | | | | | | | |
Dividends (Net of Foreign Taxes Withheld of $4,074, $0 and $11,197, respectively) | | $ | 50,756 | | | | — | | | $ | 108,246 | |
Income from Securities Lending | | | 524 | | | | — | | | | 2,908 | |
| | | | | | | | | | | | |
Total Fund Investment Income | | | 51,280 | | | | — | | | | 111,154 | |
| | | | | | | | | | | | |
Fund Expenses | | | | | | | | | | | | |
Investment Management Fees | | | 4,939 | | | | 1,121 | | | | 10,401 | |
Accounting & Transfer Agent Fees | | | 460 | | | | 18 | | | | 768 | |
Custodian Fees | | | 159 | | | | — | | | | 809 | |
Filing Fees | | | 130 | | | | 29 | | | | 157 | |
Shareholders’ Reports | | | 92 | | | | 5 | | | | 117 | |
Directors’/Trustees’ Fees & Expenses | | | 22 | | | | 3 | | | | 43 | |
Professional Fees | | | 29 | | | | 4 | | | | 148 | |
Other | | | 68 | | | | 4 | | | | 154 | |
| | | | | | | | | | | | |
Total Fund Expenses | | | 5,899 | | | | 1,184 | | | | 12,597 | |
| | | | | | | | | | | | |
Fees Waived, Expenses Reimbursed by Advisor (Note C) | | | — | | | | 564 | | | | — | |
Fees Paid Indirectly (Note C) | | | 11 | | | | — | | | | 9 | |
| | | | | | | | | | | | |
Net Expenses | | | 5,888 | | | | 620 | | | | 12,588 | |
| | | | | | | | | | | | |
Net Investment Income (Loss) | | | 45,392 | | | | 9,084 | | | | 98,566 | |
| | | | | | | | | | | | |
Realized and Unrealized Gain (Loss) | | | | | | | | | | | | |
Net Realized Gain (Loss) on: | | | | | | | | | | | | |
Investment Securities Sold** | | | 43,197 | | | | — | | | | 21,498 | |
Affiliated Investment Companies Shares Sold | | | (6 | ) | | | 252 | | | | (2 | ) |
Transactions Allocated from Affiliated Investment Company** | | | — | | | | 8,125 | | | | — | |
Futures | | | 2,062 | | | | — | | | | 8,882 | |
Foreign Currency Transactions | | | (81 | ) | | | — | | | | (357 | ) |
Change in Unrealized Appreciation (Depreciation) of: | | | | | | | | | | | | |
Investment Securities and Foreign Currency | | | 399,054 | | | | — | | | | 991,909 | |
Affiliated Investment Companies Shares | | | (2 | ) | | | 7,908 | | | | (6 | ) |
Transactions Allocated from Affiliated Investment Company | | | — | | | | 68,735 | | | | — | |
Futures | | | 145 | | | | — | | | | 1,632 | |
Translation of Foreign Currency-Denominated Amounts | | | (61 | ) | | | — | | | | (210 | ) |
| | | | | | | | | | | | |
Net Realized and Unrealized Gain (Loss) | | | 444,308 | | | | 85,020 | | | | 1,023,346 | |
| | | | | | | | | | | | |
Net Increase (Decrease) in Net Assets Resulting from Operations | | $ | 489,700 | | | $ | 94,104 | | | $ | 1,121,912 | |
| | | | | | | | | | | | |
| | | | | | | | | | | | |
| ** | Net of foreign capital gain taxes withheld of $0, $84 and $16, respectively. |
| * | Investment Income and Realized and Unrealized Gain (Loss) were allocated from the Portfolio’s Master Fund (Affiliated Investment Company). |
| # | Portion of income is from investment in affiliated fund. |
See accompanying Notes to Financial Statements.
102
DFA INVESTMENT DIMENSIONS GROUP INC.
STATEMENTS OF OPERATIONS
FOR THE YEAR ENDED OCTOBER 31, 2021
(Amounts in thousands)
| | | | | | | | | | | | | | | | |
| | | World Core
Equity
Portfolio | | | Selectively
Hedged Global
Equity
Portfolio | | | Emerging
Markets
Portfolio* | | | Emerging
Markets Small
Cap Portfolio* | |
Investment Income | | | | | | | | | | | | | | | | |
Net Investment Income Allocated from Affiliated Investment Companies | | | | | | | | | | | | | | | | |
Dividends (Net of Foreign Taxes Withheld of $0, $0, $19,835 and $14,911, respectively) | | | — | | | $ | 2 | | | $ | 159,499 | | | $ | 129,476 | |
Interest | | | — | | | | — | | | | 477 | | | | 79 | |
Income from Securities Lending | | | — | | | | — | | | | 4,669 | | | | 18,767 | |
Expenses Allocated from Affiliated Investment Companies | | | — | | | | — | | | | (9,503 | ) | | | (14,427 | ) |
| | | | | | | | | | | | | | | | |
Income Distributions Received from Affiliated Investment Companies | | $ | 16,932 | | | | 5,639 | | | | — | | | | — | |
| | | | | | | | | | | | | | | | |
Total Net Investment Income Allocated and/or Distributions Received from Affiliated Investment Companies | | | 16,932 | | | | 5,641 | | | | 155,142 | | | | 133,895 | |
| | | | | | | | | | | | | | | | |
Fund Expenses | | | | | | | | | | | | | | | | |
Investment Management Fees | | | 2,333 | | | | 854 | | | | 20,224 | | | | 29,660 | |
Accounting & Transfer Agent Fees | | | 143 | | | | 65 | | | | 752 | | | | 654 | |
Custodian Fees | | | 1 | | | | 3 | | | | — | | | | — | |
Filing Fees | | | 66 | | | | 27 | | | | 154 | | | | 127 | |
Shareholders’ Reports | | | 13 | | | | 12 | | | | 191 | | | | 107 | |
Directors’/Trustees’ Fees & Expenses | | | 11 | | | | 4 | | | | 73 | | | | 61 | |
Professional Fees | | | 3 | | | | 1 | | | | 21 | | | | 17 | |
Previously Waived Fees Recovered by Advisor (Note C) | | | 129 | | | | — | | | | — | | | | — | |
Other | | | 7 | | | | 3 | | | | 36 | | | | 30 | |
| | | | | | | | | | | | | | | | |
Total Fund Expenses | | | 2,706 | | | | 969 | | | | 21,451 | | | | 30,656 | |
| | | | | | | | | | | | | | | | |
Fees Waived, Expenses Reimbursed by Advisor (Note C) | | | 2,035 | | | | 722 | | | | 6,401 | | | | 10,859 | |
Fees Paid Indirectly (Note C) | | | — | | | | 1 | | | | — | | | | — | |
| | | | | | | | | | | | | | | | |
Net Expenses | | | 671 | | | | 246 | | | | 15,050 | | | | 19,797 | |
| | | | | | | | | | | | | | | | |
Net Investment Income (Loss) | | | 16,261 | | | | 5,395 | | | | 140,092 | | | | 114,098 | |
| | | | | | | | | | | | | | | | |
Realized and Unrealized Gain (Loss) | | | | | | | | | | | | | | | | |
Net Realized Gain (Loss) on: | | | | | | | | | | | | | | | | |
Affiliated Investment Companies Shares Sold | | | 10,552 | | | | 15,611 | | | | — | | | | — | |
Transactions Allocated from Affiliated Investment Company** | | | — | | | | — | | | | 398,700 | | | | 592,687 | |
Futures | | | (18 | ) | | | 1,247 | | | | — | | | | — | |
Forward Currency Contracts | | | — | | | | 694 | | | | — | | | | — | |
Change in Unrealized Appreciation (Depreciation) of: | | | | | | | | | | | | | | | | |
Investment Securities and Foreign Currency | | | — | | | | (19 | ) | | | — | | | | — | |
Affiliated Investment Companies Shares | | | 283,947 | | | | 88,688 | | | | — | | | | — | |
Transactions Allocated from Affiliated Investment Company | | | — | | | | — | | | | 691,616 | | | | 923,652 | |
Futures | | | — | | | | 196 | | | | — | | | | — | |
Forward Currency Contracts | | | — | | | | 121 | | | | — | | | | — | |
| | | | | | | | | | | | | | | | |
Net Realized and Unrealized Gain (Loss) | | | 294,481 | | | | 106,538 | | | | 1,090,316 | | | | 1,516,339 | |
| | | | | | | | | | | | | | | | |
Net Increase (Decrease) in Net Assets Resulting from Operations | | $ | 310,742 | | | $ | 111,933 | | | $ | 1,230,408 | | | $ | 1,630,437 | |
| | | | | | | | | | | | | | | | |
| ** | Net of foreign capital gain taxes withheld of $0, $0, $49 and $2,304, respectively. |
| * | Investment Income and Realized and Unrealized Gain (Loss) were allocated from the Portfolio’s Master Fund (Affiliated Investment Company). |
See accompanying Notes to Financial Statements.
103
DFA INVESTMENT DIMENSIONS GROUP INC.
STATEMENTS OF OPERATIONS
FOR THE YEAR ENDED OCTOBER 31, 2021
(Amounts in thousands)
| | | | | | | | | | | | |
| | | Emerging
Markets Value
Portfolio* | | | Emerging
Markets Core
Equity
Portfolio# | | | Emerging
Markets Targeted
Value Portfolio# | |
Investment Income | | | | | | | | | | | | |
Net Investment Income Allocated from Affiliated Investment Companies | | | | | | | | | | | | |
Dividends (Net of Foreign Taxes Withheld of $60,043, $0 and $0, respectively) | | $ | 475,745 | | | | — | | | | — | |
Interest | | | 49 | | | | — | | | | — | |
Income from Securities Lending | | | 14,264 | | | | — | | | | — | |
Expenses Allocated from Affiliated Investment Companies | | | (20,912 | ) | | | — | | | | — | |
| | | | | | | | | | | | |
Total Net Investment Income Allocated and/or Distributions Received from Affiliated Investment Companies | | | 469,146 | | | | — | | | | — | |
| | | | | | | | | | | | |
Fund Investment Income | | | | | | | | | | | | |
Dividends (Net of Foreign Taxes Withheld of $0, $94,860 and $840, respectively) | | | — | | | $ | 758,089 | | | $ | 6,549 | |
Income from Securities Lending | | | — | | | | 36,836 | | | | 227 | |
| | | | | | | | | | | | |
Total Fund Investment Income | | | — | | | | 794,925 | | | | 6,776 | |
| | | | | | | | | | | | |
Fund Expenses | | | | | | | | | | | | |
Investment Management Fees | | | 60,987 | | | | 106,295 | | | | 1,293 | |
Accounting & Transfer Agent Fees | | | 1,274 | | | | 5,232 | | | | 41 | |
Custodian Fees | | | — | | | | 9,238 | | | | 128 | |
Shareholder Servicing Fees Class R2 Shares | | | 36 | | | | — | | | | — | |
Filing Fees | | | 179 | | | | 458 | | | | 47 | |
Shareholders’ Reports | | | 362 | | | | 721 | | | | 2 | |
Directors’/Trustees’ Fees & Expenses | | | 163 | | | | 333 | | | | 3 | |
Professional Fees | | | 16 | | | | 710 | | | | 17 | |
Previously Waived Fees Recovered by Advisor (Note C) | | | — | | | | — | | | | 135 | |
Other | | | 79 | | | | 1,092 | | | | 28 | |
| | | | | | | | | | | | |
Total Fund Expenses | | | 63,096 | | | | 124,079 | | | | 1,694 | |
| | | | | | | | | | | | |
Class R2 Shares | | | 15 | | | | — | | | | — | |
Institutional Class Shares | | | 14,397 | | | | — | | | | — | |
Fees Paid Indirectly (Note C) | | | — | | | | 148 | | | | 2 | |
| | | | | | | | | | | | |
Net Expenses | | | 48,684 | | | | 123,931 | | | | 1,692 | |
| | | | | | | | | | | | |
Net Investment Income (Loss) | | | 420,462 | | | | 670,994 | | | | 5,084 | |
| | | | | | | | | | | | |
Realized and Unrealized Gain (Loss) | | | | | | | | | | | | |
Net Realized Gain (Loss) on: | | | | | | | | | | | | |
Investment Securities Sold** | | | — | | | | 544,729 | | | | 17,753 | |
Affiliated Investment Companies Shares Sold | | | — | | | | (14 | ) | | | — | |
Transactions Allocated from Affiliated Investment Company** | | | 675,824 | | | | — | | | | — | |
Futures | | | — | | | | 67,395 | | | | 348 | |
Foreign Currency Transactions | | | — | | | | (15,240 | ) | | | (82 | ) |
Change in Unrealized Appreciation (Depreciation) of: | | | | | | | | | | | | |
Investment Securities and Foreign Currency | | | — | | | | 5,134,175 | | | | 42,862 | |
Affiliated Investment Companies Shares | | | — | | | | (32 | ) | | | — | |
Transactions Allocated from Affiliated Investment Company | | | 3,251,339 | | | | — | | | | — | |
Futures | | | — | | | | 15,950 | | | | 67 | |
Translation of Foreign Currency-Denominated Amounts | | | — | | | | 100 | | | | 2 | |
| | | | | | | | | | | | |
Net Realized and Unrealized Gain (Loss) | | | 3,927,163 | | | | 5,747,063 | | | | 60,950 | |
| | | | | | | | | | | | |
Net Increase (Decrease) in Net Assets Resulting from Operations | | $ | 4,347,625 | | | $ | 6,418,057 | | | $ | 66,034 | |
| | | | | | | | | | | | |
| ** | Net of foreign capital gain taxes withheld of $11,984, $257 and $239, respectively. |
| * | Investment Income and Realized and Unrealized Gain (Loss) were allocated from the Portfolio’s Master Fund (Affiliated Investment Company). |
| # | Portion of income is from investment in affiliated fund. |
See accompanying Notes to Financial Statements.
104
DFA INVESTMENT DIMENSIONS GROUP INC.
STATEMENTS OF CHANGES IN NET ASSETS
(Amounts in thousands)
| | | | | | | | | | | | | | | | | | | | | | | | |
| | | Large Cap International
Portfolio | | | International Core
Equity Portfolio | | | Global Small
Company
Portfolio*** | |
| | | Year
Ended
Oct 31,
2021 | | | Year
Ended
Oct 31,
2020 | | | Year
Ended
Oct 31,
2021 | | | Year
Ended
Oct 31,
2020 | | | Year
Ended
Oct 31,
2021 | | | Year
Ended
Oct 31,
2020 | |
Increase (Decrease) in Net Assets | | | | | | | | | | | | | | | | | | | | | | | | |
Operations: | | | | | | | | | | | | | | | | | | | | | | | | |
Net Investment Income (Loss) | | $ | 152,804 | | | $ | 117,936 | | | $ | 828,078 | | | $ | 608,730 | | | $ | 1,172 | | | $ | 616 | |
Capital Gain Distributions Received from Investment Securities | | | — | | | | — | | | | — | | | | — | | | | — | | | | 535 | |
Net Realized Gain (Loss) on: | | | | | | | | | | | | | | | | | | | | | | | | |
Investment Securities Sold*,** | | | 88,328 | | | | (380,110 | ) | | | 210,041 | | | | (1,030,907 | ) | | | — | | | | — | |
Affiliated Investment Companies Shares Sold | | | (10 | ) | | | (71 | ) | | | (21 | ) | | | (170 | ) | | | 336 | | | | (712 | ) |
Transactions Allocated from Affiliated Investment Company*,** | | | — | | | | — | | | | — | | | | — | | | | 2,035 | | | | (193 | ) |
Futures | | | 14,606 | | | | 16,935 | | | | 79,338 | | | | 86,315 | | | | 35 | | | | 18 | |
Foreign Currency Transactions | | | 515 | | | | 4,070 | | | | 769 | | | | 5,368 | | | | — | | | | — | |
Change in Unrealized Appreciation (Depreciation) of: | | | | | | | | | | | | | | | | | | | | | | | | |
Investment Securities and Foreign Currency | | | 1,375,966 | | | | (141,807 | ) | | | 8,427,366 | | | | (1,938,314 | ) | | | — | | | | 9 | |
Affiliated Investment Companies Shares | | | (9 | ) | | | 27 | | | | (71 | ) | | | 97 | | | | 14,525 | | | | (202 | ) |
Transactions Allocated from Affiliated Investment Company | | | — | | | | — | | | | — | | | | — | | | | 5,844 | | | | (79 | ) |
Futures | | | 2,380 | | | | (1,346 | ) | | | 10,863 | | | | (6,655 | ) | | | — | | | | — | |
Translation of Foreign Currency-Denominated Amounts | | | (315 | ) | | | 207 | | | | (1,813 | ) | | | 640 | | | | — | | |
| —
|
|
| | | | | | | | | | | | | | | | | | | | | | | | |
Net Increase (Decrease) in Net Assets Resulting from Operations | | | 1,634,265 | | | | (384,159 | ) | | | 9,554,550 | | | | (2,274,896 | ) | | | 23,947 | | | | (8 | ) |
| | | | | | | | | | | | | | | | | | | | | | | | |
Distributions: | | | | | | | | | | | | | | | | | | | | | | | | |
Institutional Class Shares | | | (144,492 | ) | | | (119,035 | ) | | | (761,635 | ) | | | (616,813 | ) | | | (727 | ) | | | (627 | ) |
Capital Share Transactions (1): | | | | | | | | | | | | | | | | | | | | | | | | |
Shares Issued | | | 711,780 | | | | 1,926,246 | | | | 5,674,163 | | | | 8,116,550 | | | | 44,864 | | | | 15,132 | |
Shares Issued in Lieu of Cash Distributions | | | 134,111 | | | | 109,607 | | | | 732,468 | | | | 589,210 | | | | 727 | | | | 627 | |
Shares Redeemed | | | (1,003,971 | ) | | | (2,188,646 | ) | | | (5,535,524 | ) | | | (11,407,917 | ) | | | (12,748 | ) | | | (12,842 | ) |
| | | | | | | | | | | | | | | | | | | | | | | | |
Net Increase (Decrease) from Capital Share Transactions | | | (158,080 | ) | | | (152,793 | ) | | | 871,107 | | | | (2,702,157 | ) | | | 32,843 | | | | 2,917 | |
| | | | | | | | | | | | | | | | | | | | | | | | |
Total Increase (Decrease) in Net Assets | | | 1,331,693 | | | | (655,987 | ) | | | 9,664,022 | | | | (5,593,866 | ) | | | 56,063 | | | | 2,282 | |
Net Assets | | | | | | | | | | | | | | | | | | | | | | | | |
Beginning of Year | | | 4,700,488 | | | | 5,356,475 | | | | 24,965,561 | | | | 30,559,427 | | | | 43,568 | | | | 41,286 | |
| | | | | | | | | | | | | | | | | | | | | | | | |
End of Year | | $ | 6,032,181 | | | $ | 4,700,488 | | | $ | 34,629,583 | | | $ | 24,965,561 | | | $ | 99,631 | | | $ | 43,568 | |
| | | | | | | | | | | | | | | | | | | | | | | | |
(1) Shares Issued and Redeemed: | | | | | | | | | | | | | | | | | | | | | | | | |
Shares Issued | | | 26,957 | | | | 94,221 | | | | 365,542 | | | | 716,205 | | | | 3,098 | | | | 1,667 | |
Shares Issued in Lieu of Cash Distributions | | | 5,054 | | | | 5,201 | | | | 47,003 | | | | 47,443 | | | | 58 | | | | 54 | |
Shares Redeemed | | | (38,575 | ) | | | (109,723 | ) | | | (359,922 | ) | | | (1,014,855 | ) | | | (886 | ) | | | (1,300 | ) |
| | | | | | | | | | | | | | | | | | | | | | | | |
Net Increase (Decrease) from Shares Issued and Redeemed | | | (6,564 | ) | | | (10,301 | ) | | | 52,623 | | | | (251,207 | ) | | | 2,270 | | | | 421 | |
| | | | | | | | | | | | | | | | | | | | | | | | |
| * | Net of foreign capital gain taxes withheld for the fiscal year ended October 31, 2021 of $0, $0 and $5, respectively. |
| ** | Net of foreign capital gain taxes withheld for the fiscal year ended October 31, 2020 of $0, $0 and $0, respectively. |
| *** | Investment Income and Realized and Unrealized Gain (Loss) were allocated from the Portfolio’s Master Fund (Affiliated Investment Company). |
See accompanying Notes to Financial Statements.
105
DFA INVESTMENT DIMENSIONS GROUP INC.
STATEMENTS OF CHANGES IN NET ASSETS
(Amounts in thousands)
| | | | | | | | | | | | | | | | | | | | | | | | |
| | | International Small
Company Portfolio*** | | | Japanese Small
Company Portfolio*** | | | Asia Pacific Small
Company Portfolio*** | |
| | | Year
Ended
Oct 31,
2021 | | | Year
Ended
Oct 31,
2020 | | | Year
Ended
Oct 31,
2021 | | | Year
Ended
Oct 31,
2020 | | | Year
Ended
Oct 31,
2021 | | | Year
Ended
Oct 31,
2020 | |
Increase (Decrease) in Net Assets | | | | | | | | | | | | | | | | | | | | | | | | |
Operations: | | | | | | | | | | | | | | | | | | | | | | | | |
Net Investment Income (Loss) | | $ | 238,915 | | | $ | 219,740 | | | $ | 8,010 | | | $ | 8,936 | | | $ | 13,100 | | | $ | 12,909 | |
Net Realized Gain (Loss) on: | | | | | | | | | | | | | | | | | | | | | | | | |
Transactions Allocated from Affiliated Investment Company*,** | | | 837,220 | | | | (279,498 | ) | | | 17,921 | | | | (2,944 | ) | | | 49,285 | | | | (3,570 | ) |
Futures | | | 26,350 | | | | 13,320 | | | | — | | | | — | | | | — | | | | — | |
Change in Unrealized Appreciation (Depreciation) of: | | | | | | | | | | | | | | | | | | | | | | | | |
Transactions Allocated from Affiliated Investment Company | | | 2,927,439 | | | | (573,955 | ) | | | 31,604 | | | | (15,236 | ) | | | 75,175 | | | | 1,830 | |
Futures | | | 3,416 | | | | (2,575 | ) | | | — | | | | — | | | | — | | | | — | |
| | | | | | | | | | | | | | | | | | | | | | | | |
Net Increase (Decrease) in Net Assets Resulting from Operations | | | 4,033,340 | | | | (622,968 | ) | | | 57,535 | | | | (9,244 | ) | | | 137,560 | | | | 11,169 | |
| | | | | | | | | | | | | | | | | | | | | | | | |
Distributions: | | | | | | | | | | | | | | | | | | | | | | | | |
Institutional Class Shares | | | (220,133 | ) | | | (529,962 | ) | | | (10,581 | ) | | | (23,243 | ) | | | (12,808 | ) | | | (14,178 | ) |
Capital Share Transactions (1): | | | | | | | | | | | | | | | | | | | | | | | | |
Shares Issued | | | 2,604,837 | | | | 2,566,857 | | | | 19,129 | | | | 67,280 | | | | 13,533 | | | | 71,668 | |
Shares Issued in Lieu of Cash Distributions | | | 214,868 | | | | 511,580 | | | | 10,580 | | | | 23,242 | | | | 12,805 | | | | 14,174 | |
Shares Redeemed | | | (3,315,191 | ) | | | (4,527,485 | ) | | | (163,522 | ) | | | (231,407 | ) | | | (148,282 | ) | | | (44,800 | ) |
| | | | | | | | | | | | | | | | | | | | | | | | |
Net Increase (Decrease) from Capital Share Transactions | | | (495,486 | ) | | | (1,449,048 | ) | | | (133,813 | ) | | | (140,885 | ) | | | (121,944 | ) | | | 41,042 | |
| | | | | | | | | | | | | | | | | | | | | | | | |
Total Increase (Decrease) in Net Assets | | | 3,317,721 | | | | (2,601,978 | ) | | | (86,859 | ) | | | (173,372 | ) | | | 2,808 | | | | 38,033 | |
Net Assets | | | | | | | | | | | | | | | | | | | | | | | | |
Beginning of Year | | | 10,148,132 | | | | 12,750,110 | | | | 466,696 | | | | 640,068 | | | | 378,682 | | | | 340,649 | |
| | | | | | | | | | | | | | | | | | | | | | | | |
End of Year | | $ | 13,465,853 | | | $ | 10,148,132 | | | $ | 379,837 | | | $ | 466,696 | | | $ | 381,490 | | | $ | 378,682 | |
| | | | | | | | | | | | | | | | | | | | | | | | |
(1) Shares Issued and Redeemed: | | | | | | | | | | | | | | | | | | | | | | | | |
Shares Issued | | | 116,406 | | | | 166,813 | | | | 736 | | | | 3,412 | | | | 520 | | | | 4,296 | |
Shares Issued in Lieu of Cash Distributions | | | 10,453 | | | | 27,715 | | | | 418 | | | | 928 | | | | 559 | | | | 681 | |
Shares Redeemed | | | (151,391 | ) | | | (292,110 | ) | | | (6,381 | ) | | | (10,105 | ) | | | (5,727 | ) | | | (2,301 | ) |
| | | | | | | | | | | | | | | | | | | | | | | | |
Net Increase (Decrease) from Shares Issued and Redeemed | | | (24,532 | ) | | | (97,582 | ) | | | (5,227 | ) | | | (5,765 | ) | | | (4,648 | ) | | | 2,676 | |
| | | | | | | | | | | | | | | | | | | | | | | | |
| * | Net of foreign capital gain taxes withheld for the fiscal year ended October 31, 2021 of $0, $0 and $0, respectively. |
| ** | Net of foreign capital gain taxes withheld for the fiscal year ended October 31, 2020 of $0, $0 and $0, respectively. |
| *** | Investment Income and Realized and Unrealized Gain (Loss) were allocated from the Portfolio’s Master Fund (Affiliated Investment Company). |
See accompanying Notes to Financial Statements.
106
DFA INVESTMENT DIMENSIONS GROUP INC.
STATEMENTS OF CHANGES IN NET ASSETS
(Amounts in thousands)
| | | | | | | | | | | | | | | | | | | | | | | | |
| | | United Kingdom Small
Company Portfolio*** | | | Continental Small Company
Portfolio*** | | | DFA International Real
Estate Securities Portfolio | |
| | | Year
Ended
Oct 31,
2021 | | | Year
Ended
Oct 31,
2020 | | | Year
Ended
Oct 31,
2021 | | | Year
Ended
Oct 31,
2020 | | | Year
Ended
Oct 31,
2021 | | | Year
Ended
Oct 31,
2020 | |
Increase (Decrease) in Net Assets | | | | | | | | | | | | | | | | | | | | | | | | |
Operations: | | | | | | | | | | | | | | | | | | | | | | | | |
Net Investment Income (Loss) | | $ | 658 | | | $ | 377 | | | $ | 13,506 | | | $ | 9,756 | | | $ | 185,202 | | | $ | 190,031 | |
Net Realized Gain (Loss) on: | | | | | | | | | | | | | | | | | | | | | | | | |
Investment Securities Sold*,** | | | — | | | | — | | | | — | | | | — | | | | (56,022 | ) | | | (107,519 | ) |
Affiliated Investment Companies Shares Sold | | | — | | | | — | | | | — | | | | — | | | | (43 | ) | | | (33 | ) |
Transactions Allocated from Affiliated Investment Company*,** | | | 1,117 | | | | 78 | | | | 44,052 | | | | (23,161 | ) | | | — | | | | — | |
Futures | | | — | | | | — | | | | — | | | | — | | | | 13,260 | | | | 21,374 | |
Foreign Currency Transactions | | | — | | | | — | | | | — | | | | — | | | | (485 | ) | | | 1,329 | |
Change in Unrealized Appreciation (Depreciation) of: | | | | | | | | | | | | | | | | | | | | | | | | |
Investment Securities and Foreign Currency | | | — | | | | — | | | | — | | | | — | | | | 1,378,475 | | | | (1,553,230 | ) |
Affiliated Investment Companies Shares | | | — | | | | — | | | | — | | | | — | | | | (2 | ) | | | 14 | |
Transactions Allocated from Affiliated Investment Company | | | 7,530 | | | | (3,815 | ) | | | 216,160 | | | | (31,479 | ) | | | — | | | | — | |
Futures | | | — | | | | — | | | | — | | | | — | | | | 3,086 | | | | (2,070 | ) |
Translation of Foreign Currency-Denominated Amounts | | | — | | | | — | | | | — | | | | — | | | | (414 | ) | | | 310 | |
| | | | | | | | | | | | | | | | | | | | | | | | |
Net Increase (Decrease) in Net Assets Resulting from Operations | | | 9,305 | | | | (3,360 | ) | | | 273,718 | | | | (44,884 | ) | | | 1,523,057 | | | | (1,449,794 | ) |
| | | | | | | | | | | | | | | | | | | | | | | | |
Distributions: | | | | | | | | | | | | | | | | | | | | | | | | |
Institutional Class Shares | | | (589 | ) | | | (2,447 | ) | | | (13,461 | ) | | | (8,902 | ) | | | — | | | | (717,271 | ) |
Capital Share Transactions (1): | | | | | | | | | | | | | | | | | | | | | | | | |
Shares Issued | | | 26,424 | | | | 3,517 | | | | 76,760 | | | | 73,968 | | | | 714,047 | | | | 1,196,937 | |
Shares Issued in Lieu of Cash Distributions | | | 588 | | | | 2,447 | | | | 13,460 | | | | 8,888 | | | | — | | | | 707,587 | |
Shares Redeemed | | | (8,462 | ) | | | (9,830 | ) | | | (20,462 | ) | | | (148,431 | ) | | | (896,488 | ) | | | (1,388,574 | ) |
| | | | | | | | | | | | | | | | | | | | | | | | |
Net Increase (Decrease) from Capital Share Transactions | | | 18,550 | | | | (3,866 | ) | | | 69,758 | | | | (65,575 | ) | | | (182,441 | ) | | | 515,950 | |
| | | | | | | | | | | | | | | | | | | | | | | | |
Total Increase (Decrease) in Net Assets | | | 27,266 | | | | (9,673 | ) | | | 330,015 | | | | (119,361 | ) | | | 1,340,616 | | | | (1,651,115 | ) |
Net Assets | | | | | | | | | | | | | | | | | | | | | | | | |
Beginning of Year | | | 16,867 | | | | 26,540 | | | | 537,744 | | | | 657,105 | | | | 4,646,848 | | | | 6,297,963 | |
| | | | | | | | | | | | | | | | | | | | | | | | |
End of Year | | $ | 44,133 | | | $ | 16,867 | | | $ | 867,759 | | | $ | 537,744 | | | $ | 5,987,464 | | | $ | 4,646,848 | |
| | | | | | | | | | | | | | | | | | | | | | | | |
(1) Shares Issued and Redeemed: | | | | | | | | | | | | | | | | | | | | | | | | |
Shares Issued | | | 855 | | | | 153 | | | | 2,229 | | | | 2,953 | | | | 148,690 | | | | 304,948 | |
Shares Issued in Lieu of Cash Distributions | | | 20 | | | | 88 | | | | 418 | | | | 361 | | | | — | | | | 144,701 | |
Shares Redeemed | | | (274 | ) | | | (404 | ) | | | (622 | ) | | | (7,187 | ) | | | (192,731 | ) | | | (341,397 | ) |
| | | | | | | | | | | | | | | | | | | | | | | | |
Net Increase (Decrease) from Shares Issued and Redeemed | | | 601 | | | | (163 | ) | | | 2,025 | | | | (3,873 | ) | | | (44,041 | ) | | | 108,252 | |
| | | | | | | | | | | | | | | | | | | | | | | | |
| * | Net of foreign capital gain taxes withheld for the fiscal year ended October 31, 2021 of $0, $0 and $0, respectively. |
| ** | Net of foreign capital gain taxes withheld for the fiscal year ended October 31, 2020 of $0, $0 and $0, respectively. |
| *** | Investment Income and Realized and Unrealized Gain (Loss) were allocated from the Portfolio’s Master Fund (Affiliated Investment Company). |
See accompanying Notes to Financial Statements.
107
DFA INVESTMENT DIMENSIONS GROUP INC.
STATEMENTS OF CHANGES IN NET ASSETS
(Amounts in thousands)
| | | | | | | | | | | | | | | | | | | | | | | | |
| | | DFA Global Real Estate
Securities Portfolio | | | DFA International Small
Cap Value Portfolio | | | International Vector Equity
Portfolio | |
| | | Year
Ended
Oct 31,
2021 | | | Year
Ended
Oct 31,
2020 | | | Year
Ended
Oct 31,
2021 | | | Year
Ended
Oct 31,
2020 | | | Year
Ended
Oct 31,
2021 | | | Year
Ended
Oct 31,
2020 | |
Increase (Decrease) in Net Assets | | | | | | | | | | | | | | | | | | | | | | | | |
Operations: | | | | | | | | | | | | | | | | | | | | | | | | |
Net Investment Income (Loss) | | $ | 124,365 | | | $ | 513,699 | | | $ | 261,889 | | | $ | 228,060 | | | $ | 82,679 | | | $ | 59,466 | |
Capital Gain Distributions Received from Investment Securities | | | 1,045 | | | | 1,750 | | | | — | | | | — | | | | — | | | | — | |
Net Realized Gain (Loss) on: | | | | | | | | | | | | | | | | | | | | | | | | |
Investment Securities Sold*,** | | | 43,747 | | | | (42,440 | ) | | | 541,397 | | | | (411,850 | ) | | | 191,536 | | | | (76,225 | ) |
Affiliated Investment Companies Shares Sold | | | 60,992 | | | | 22,534 | | | | (1 | ) | | | (2 | ) | | | (7 | ) | | | (7 | ) |
Futures | | | 1,671 | | | | (362 | ) | | | 26,234 | | | | 35,047 | | | | (437 | ) | | | (8,170 | ) |
Foreign Currency Transactions | | | — | | | | — | | | | 1,071 | | | | 6,447 | | | | 49 | | | | 296 | |
Change in Unrealized Appreciation (Depreciation) of: | | | | | | | | | | | | | | | | | | | | | | | | |
Investment Securities and Foreign Currency | | | 1,755,986 | | | | (868,809 | ) | | | 3,392,048 | | | | (1,526,362 | ) | | | 860,557 | | | | (125,231 | ) |
Affiliated Investment Companies Shares | | | 1,097,358 | | | | (1,432,797 | ) | | | (25 | ) | | | (8 | ) | | | (8 | ) | | | 15 | |
Futures | | | — | | | | — | | | | 9,695 | | | | (7,947 | ) | | | 826 | | | | — | |
Translation of Foreign Currency-Denominated Amounts | | | — | | | | — | | | | (1,012 | ) | | | (289 | ) | | | (279 | ) | | | 132 | |
| | | | | | | | | | | | | | | | | | | | | | | | |
Net Increase (Decrease) in Net Assets Resulting from Operations | | | 3,085,164 | | | | (1,806,425 | ) | | | 4,231,296 | | | | (1,676,904 | ) | | | 1,134,916 | | | | (149,724 | ) |
| | | | | | | | | | | | | | | | | | | | | | | | |
Distributions: | | | | | | | | | | | | | | | | | | | | | | | | |
Institutional Class Shares | | | (186,953 | ) | | | (599,021 | ) | | | (258,254 | ) | | | (430,950 | ) | | | (74,200 | ) | | | (57,640 | ) |
Capital Share Transactions (1): | | | | | | | | | | | | | | | | | | | | | | | | |
Shares Issued | | | 2,211,113 | | | | 2,435,290 | | | | 1,538,249 | | | | 2,667,860 | | | | 397,948 | | | | 1,704,392 | |
Shares Issued in Lieu of Cash Distributions | | | 179,038 | | | | 567,176 | | | | 226,985 | | | | 385,828 | | | | 73,824 | | | | 56,357 | |
Shares Redeemed | | | (1,976,601 | ) | | | (2,640,206 | ) | | | (2,841,493 | ) | | | (4,485,990 | ) | | | (538,557 | ) | | | (1,408,660 | ) |
| | | | | | | | | | | | | | | | | | | | | | | | |
Net Increase (Decrease) from Capital Share Transactions | | | 413,550 | | | | 362,260 | | | | (1,076,259 | ) | | | (1,432,302 | ) | | | (66,785 | ) | | | 352,089 | |
| | | | | | | | | | | | | | | | | | | | | | | | |
Total Increase (Decrease) in Net Assets | | | 3,311,761 | | | | (2,043,186 | ) | | | 2,896,783 | | | | (3,540,156 | ) | | | 993,931 | | | | 144,725 | |
Net Assets | | | | | | | | | | | | | | | | | | | | | | | | |
Beginning of Year | | | 7,225,825 | | | | 9,269,011 | | | | 9,887,928 | | | | 13,428,084 | | | | 2,722,859 | | | | 2,578,134 | |
| | | | | | | | | | | | | | | | | | | | | | | | |
End of Year | | $ | 10,537,586 | | | $ | 7,225,825 | | | $ | 12,784,711 | | | $ | 9,887,928 | | | $ | 3,716,790 | | | $ | 2,722,859 | |
| | | | | | | | | | | | | | | | | | | | | | | | |
(1) Shares Issued and Redeemed: | | | | | | | | | | | | | | | | | | | | | | | | |
Shares Issued | | | 189,077 | | | | 243,141 | | | | 74,227 | | | | 181,563 | | | | 29,258 | | | | 184,973 | |
Shares Issued in Lieu of Cash Distributions | | | 16,811 | | | | 49,884 | | | | 11,757 | | | | 20,438 | | | | 5,458 | | | | 5,172 | |
Shares Redeemed | | | (168,470 | ) | | | (267,327 | ) | | | (140,273 | ) | | | (292,999 | ) | | | (39,764 | ) | | | (150,794 | ) |
| | | | | | | | | | | | | | | | | | | | | | | | |
Net Increase (Decrease) from Shares Issued and Redeemed | | | 37,418 | | | | 25,698 | | | | (54,289 | ) | | | (90,998 | ) | | | (5,048 | ) | | | 39,351 | |
| | | | | | | | | | | | | | | | | | | | | | | | |
| * | Net of foreign capital gain taxes withheld for the fiscal year ended October 31, 2021 of $0, $0 and $0, respectively. |
| ** | Net of foreign capital gain taxes withheld for the fiscal year ended October 31, 2020 of $0, $0 and $0, respectively. |
See accompanying Notes to Financial Statements.
108
DFA INVESTMENT DIMENSIONS GROUP INC.
STATEMENTS OF CHANGES IN NET ASSETS
(Amounts in thousands)
| | | | | | | | | | | | | | | | |
| | | International High Relative
Profitability Portfolio | | | World ex U.S. Value
Portfolio*** | |
| | | Year
Ended
Oct 31,
2021 | | | Year
Ended
Oct 31,
2020 | | | Year
Ended
Oct 31,
2021 | | | Year
Ended
Oct 31,
2020 | |
Increase (Decrease) in Net Assets | | | | | | | | | | | | | | | | |
Operations: | | | | | | | | | | | | | | | | |
Net Investment Income (Loss) | | $ | 45,392 | | | $ | 19,772 | | | $ | 9,084 | | | $ | 6,168 | |
Capital Gain Distributions Received from Investment Securities | | | — | | | | — | | | | — | | | | 440 | |
Net Realized Gain (Loss) on: | | | | | | | | | | | | | | | | |
Investment Securities Sold*,** | | | 43,197 | | | | (18,047 | ) | | | — | | | | — | |
Affiliated Investment Companies Shares Sold | | | (6 | ) | | | (1 | ) | | | 252 | | | | (1,457 | ) |
Transactions Allocated from Affiliated Investment Company*,** | | | — | | | | — | | | | 8,125 | | | | (14,842 | ) |
Futures | | | 2,062 | | | | 3,996 | | | | — | | | | 100 | |
Foreign Currency Transactions | | | (81 | ) | | | (53 | ) | | | — | | | | — | |
Change in Unrealized Appreciation (Depreciation) of: | | | | | | | | | | | | | | | | |
Investment Securities and Foreign Currency | | | 399,054 | | | | 56,853 | | | | — | | | | (42 | ) |
Affiliated Investment Companies Shares | | | (2 | ) | | | 5 | | | | 7,908 | | | | (3,499 | ) |
Transactions Allocated from Affiliated Investment Company | | | — | | | | — | | | | 68,735 | | | | (36,036 | ) |
Futures | | | 145 | | | | (145 | ) | | | — | | | | — | |
Translation of Foreign Currency-Denominated Amounts | | | (61 | ) | | | 60 | | | | — | | | | — | |
| | | | | | | | | | | | | | | | |
Net Increase (Decrease) in Net Assets Resulting from Operations | | | 489,700 | | | | 62,440 | | | | 94,104 | | | | (49,168 | ) |
| | | | | | | | | | | | | | | | |
Distributions: | | | | | | | | | | | | | | | | |
Institutional Class Shares | | | (43,180 | ) | | | (18,018 | ) | | | (8,755 | ) | | | (6,579 | ) |
Capital Share Transactions (1): | | | | | | | | | | | | | | | | |
Shares Issued | | | 559,296 | | | | 1,014,049 | | | | 60,323 | | | | 54,277 | |
Shares Issued in Lieu of Cash Distributions | | | 42,393 | | | | 17,687 | | | | 8,749 | | | | 6,573 | |
Shares Redeemed | | | (339,830 | ) | | | (259,261 | ) | | | (52,670 | ) | | | (100,557 | ) |
| | | | | | | | | | | | | | | | |
Net Increase (Decrease) from Capital Share Transactions | | | 261,859 | | | | 772,475 | | | | 16,402 | | | | (39,707 | ) |
| | | | | | | | | | | | | | | | |
Total Increase (Decrease) in Net Assets | | | 708,379 | | | | 816,897 | | | | 101,751 | | | | (95,454 | ) |
Net Assets | | | | | | | | | | | | | | | | |
Beginning of Year | | | 1,475,345 | | | | 658,448 | | | | 206,915 | | | | 302,369 | |
| | | | | | | | | | | | | | | | |
End of Year | | $ | 2,183,724 | | | $ | 1,475,345 | | | $ | 308,666 | | | $ | 206,915 | |
| | | | | | | | | | | | | | | | |
(1) Shares Issued and Redeemed: | | | | | | | | | | | | | | | | |
Shares Issued | | | 42,975 | | | | 101,501 | | | | 4,967 | | | | 6,299 | |
Shares Issued in Lieu of Cash Distributions | | | 3,204 | | | | 1,705 | | | | 723 | | | | 672 | |
Shares Redeemed | | | (25,822 | ) | | | (25,836 | ) | | | (4,335 | ) | | | (11,524 | ) |
| | | | | | | | | | | | | | | | |
Net Increase (Decrease) from Shares Issued and Redeemed | | | 20,357 | | | | 77,370 | | | | 1,355 | | | | (4,553 | ) |
| | | | | | | | | | | | | | | | |
| * | Net of foreign capital gain taxes withheld for the fiscal year ended October 31, 2021 of $0 and $84, respectively. |
| ** | Net of foreign capital gain taxes withheld for the fiscal year ended October 31, 2020 of $0 and $2, respectively. |
| *** | Investment Income and Realized and Unrealized Gain (Loss) were allocated from the Portfolio’s Master Fund (Affiliated Investment Company). |
See accompanying Notes to Financial Statements.
109
DFA INVESTMENT DIMENSIONS GROUP INC.
STATEMENTS OF CHANGES IN NET ASSETS
(Amounts in thousands)
| | | | | | | | | | | | | | | | | | | | | | | | |
| | | World ex U.S. Core Equity | | | World Core Equity | | | Selectively Hedged | |
| | | Portfolio | | | Portfolio | | | Global Equity Portfolio | |
| | | Year | | | Year | | | Year | | | Year | | | Year | | | Year | |
| | | Ended | | | Ended | | | Ended | | | Ended | | | Ended | | | Ended | |
| | | Oct 31, | | | Oct 31, | | | Oct 31, | | | Oct 31, | | | Oct 31, | | | Oct 31, | |
| | | 2021 | | | 2020 | | | 2021 | | | 2020 | | | 2021 | | | 2020 | |
Increase (Decrease) in Net Assets | | | | | | | | | | | | | | | | | | | | | | | | |
Operations: | | | | | | | | | | | | | | | | | | | | | | | | |
Net Investment Income (Loss) | | $ | 98,566 | | | $ | 77,826 | | | $ | 16,261 | | | $ | 14,907 | | | $ | 5,395 | | | $ | 5,790 | |
Capital Gain Distributions Received from Investment Securities | | | — | | | | — | | | | — | | | | 8,146 | | | | — | | | | 4,097 | |
Net Realized Gain (Loss) on: | | | | | | | | | | | | | | | | | | | | | | | | |
Investment Securities Sold*,** | | | 21,498 | | | | (110,980 | ) | | | — | | | | — | | | | — | | | | — | |
Affiliated Investment Companies Shares Sold | | | (2 | ) | | | (23 | ) | | | 10,552 | | | | (19,813 | ) | | | 15,611 | | | | (689 | ) |
Futures | | | 8,882 | | | | 13,484 | | | | (18 | ) | | | (122 | ) | | | 1,247 | | | | 460 | |
Foreign Currency Transactions | | | (357 | ) | | | 1,255 | | | | — | | | | — | | | | — | | | | — | |
Forward Currency Contracts | | | — | | | | — | | | | — | | | | — | | | | 694 | | | | (1,961 | ) |
Change in Unrealized Appreciation (Depreciation) of: | | | | | | | | | | | | | | | | | | | | | | | | |
Investment Securities and Foreign Currency | | | 991,909 | | | | (169,554 | ) | | | — | | | | — | | | | (19 | ) | | | — | |
Affiliated Investment Companies Shares | | | (6 | ) | | | 17 | | | | 283,947 | | | | 3,079 | | | | 88,688 | | | | (13,537 | ) |
Futures | | | 1,632 | | | | (598 | ) | | | — | | | | — | | | | 196 | | | | (146 | ) |
Translation of Foreign Currency-Denominated Amounts | | | (210 | ) | | | 101 | | | | — | | | | — | | | | — | | | | — | |
Forward Currency Contracts | | | — | | | | — | | | | — | | | | — | | | | 121 | | | | 710 | |
| | | | | | | | | | | | | | | | | | | | | | | | |
Net Increase (Decrease) in Net Assets Resulting from Operations | | | 1,121,912 | | | | (188,472 | ) | | | 310,742 | | | | 6,197 | | | | 111,933 | | | | (5,276 | ) |
| | | | | | | | | | | | | | | | | | | | | | | | |
Distributions: | | | | | | | | | | | | | | | | | | | | | | | | |
Institutional Class Shares | | | (98,429 | ) | | | (75,535 | ) | | | (16,210 | ) | | | (16,437 | ) | | | (6,934 | ) | | | (9,635 | ) |
Capital Share Transactions (1): | | | | | | | | | | | | | | | | | | | | | | | | |
Shares Issued | | | 608,060 | | | | 1,273,174 | | | | 205,873 | | | | 198,881 | | | | 40,778 | | | | 64,436 | |
Shares Issued in Lieu of Cash Distributions | | | 97,865 | | | | 74,685 | | | | 15,000 | | | | 15,264 | | | | 6,900 | | | | 9,598 | |
Shares Redeemed | | | (850,479 | ) | | | (1,592,928 | ) | | | (196,293 | ) | | | (313,856 | ) | | | (92,479 | ) | | | (146,446 | ) |
| | | | | | | | | | | | | | | | | | | | | | | | |
Net Increase (Decrease) from Capital Share Transactions | | | (144,554 | ) | | | (245,069 | ) | | | 24,580 | | | | (99,711 | ) | | | (44,801 | ) | | | (72,412 | ) |
| | | | | | | | | | | | | | | | | | | | | | | | |
Total Increase (Decrease) in Net Assets | | | 878,929 | | | | (509,076 | ) | | | 319,112 | | | | (109,951 | ) | | | 60,198 | | | | (87,323 | ) |
Net Assets | | | | | | | | | | | | | | | | | | | | | | | | |
Beginning of Year | | | 3,210,237 | | | | 3,719,313 | | | | 769,602 | | | | 879,553 | | | | 288,509 | | | | 375,832 | |
| | | | | | | | | | | | | | | | | | | | | | | | |
End of Year | | $ | 4,089,166 | | | $ | 3,210,237 | | | $ | 1,088,714 | | | $ | 769,602 | | | $ | 348,707 | | | $ | 288,509 | |
| | | | | | | | | | | | | | | | | | | | | | | | |
(1) Shares Issued and Redeemed: | | | | | | | | | | | | | | | | | | | | | | | | |
Shares Issued | | | 45,421 | | | | 135,315 | | | | 9,724 | | | | 13,724 | | | | 2,016 | | | | 4,300 | |
Shares Issued in Lieu of Cash Distributions | | | 7,267 | | | | 7,310 | | | | 711 | | | | 969 | | | | 372 | | | | 564 | |
Shares Redeemed | | | (64,633 | ) | | | (168,321 | ) | | | (9,418 | ) | | | (20,996 | ) | | | (4,584 | ) | | | (9,787 | ) |
| | | | | | | | | | | | | | | | | | | | | | | | |
Net Increase (Decrease) from Shares Issued and Redeemed | | | (11,945 | ) | | | (25,696 | ) | | | 1,017 | | | | (6,303 | ) | | | (2,196 | ) | | | (4,923 | ) |
| | | | | | | | | | | | | | | | | | | | | | | | |
| * | Net of foreign capital gain taxes withheld for the fiscal year ended October 31, 2021 of $16, $0 and $0, respectively. |
| ** | Net of foreign capital gain taxes withheld for the fiscal year ended October 31, 2020 of $2, $0 and $0, respectively. |
See accompanying Notes to Financial Statements.
110
DFA INVESTMENT DIMENSIONS GROUP INC.
STATEMENTS OF CHANGES IN NET ASSETS
(Amounts in thousands)
| | | | | | | | | | | | | | | | | | | | | | | | |
| | | Emerging Markets | | | Emerging Markets | | | Emerging Markets Value | |
| | | Portfolio*** | | | Small Cap Portfolio*** | | | Portfolio*** | |
| | | Year | | | Year | | | Year | | | Year | | | Year | | | Year | |
| | | Ended | | | Ended | | | Ended | | | Ended | | | Ended | | | Ended | |
| | | Oct 31, | | | Oct 31, | | | Oct 31, | | | Oct 31, | | | Oct 31, | | | Oct 31, | |
| | | 2021 | | | 2020 | | | 2021 | | | 2020 | | | 2021 | | | 2020 | |
Increase (Decrease) in Net Assets | | | | | | | | | | | | | | | | | | | | | | | | |
Operations: | | | | | | | | | | | | | | | | | | | | | | | | |
Net Investment Income (Loss) | | $ | 140,092 | | | $ | 118,848 | | | $ | 114,098 | | | $ | 120,972 | | | $ | 420,462 | | | $ | 419,152 | |
Net Realized Gain (Loss) on: | | | | | | | | | | | | | | | | | | | | | | | | |
Transactions Allocated from Affiliated Investment Company*,** | | | 398,700 | | | | 62,124 | | | | 592,687 | | | | (377,221 | ) | | | 675,824 | | | | (1,030,841 | ) |
Change in Unrealized Appreciation (Depreciation) of: | | | | | | | | | | | | | | | | | | | | | | | | |
Transactions Allocated from Affiliated Investment Company | | | 691,616 | | | | 28,554 | | | | 923,652 | | | | 126,768 | | | | 3,251,339 | | | | (1,128,949 | ) |
| | | | | | | | | | | | | | | | | | | | | | | | |
Net Increase (Decrease) in Net Assets Resulting from Operations | | | 1,230,408 | | | | 209,526 | | | | 1,630,437 | | | | (129,481 | ) | | | 4,347,625 | | | | (1,740,638 | ) |
| | | | | | | | | | | | | | | | | | | | | | | | |
Distributions: | | | | | | | | | | | | | | | | | | | | | | | | |
Class R2 Shares | | | — | | | | — | | | | — | | | | — | | | | (349 | ) | | | (569 | ) |
Institutional Class Shares | | | (122,695 | ) | | | (118,156 | ) | | | (128,503 | ) | | | (170,927 | ) | | | (381,943 | ) | | | (441,483 | ) |
| | | | | | | | | | | | | | | | | | | | | | | | |
Total Distributions | | | (122,695 | ) | | | (118,156 | ) | | | (128,503 | ) | | | (170,927 | ) | | | (382,292 | ) | | | (442,052 | ) |
| | | | | | | | | | | | | | | | | | | | | | | | |
Capital Share Transactions (1): | | | | | | | | | | | | | | | | | | | | | | | | |
Shares Issued | | | 1,466,367 | | | | 1,949,203 | | | | 453,465 | | | | 767,311 | | | | 1,803,325 | | | | 3,023,264 | |
Shares Issued in Lieu of Cash Distributions | | | 118,246 | | | | 110,017 | | | | 120,830 | | | | 161,476 | | | | 368,413 | | | | 425,730 | |
Shares Redeemed | | | (2,119,497 | ) | | | (2,466,550 | ) | | | (1,840,038 | ) | | | (2,172,505 | ) | | | (5,474,850 | ) | | | (5,847,897 | ) |
| | | | | | | | | | | | | | | | | | | | | | | | |
Net Increase (Decrease) from Capital Share Transactions | | | (534,884 | ) | | | (407,330 | ) | | | (1,265,743 | ) | | | (1,243,718 | ) | | | (3,303,112 | ) | | | (2,398,903 | ) |
| | | | | | | | | | | | | | | | | | | | | | | | |
Total Increase (Decrease) in Net Assets | | | 572,829 | | | | (315,960 | ) | | | 236,191 | | | | (1,544,126 | ) | | | 662,221 | | | | (4,581,593 | ) |
Net Assets | | | | | | | | | | | | | | | | | | | | | | | | |
Beginning of Year | | | 5,652,358 | | | | 5,968,318 | | | | 4,879,733 | | | | 6,423,859 | | | | 12,609,489 | | | | 17,191,082 | |
| | | | | | | | | | | | | | | | | | | | | | | | |
End of Year | | $ | 6,225,187 | | | $ | 5,652,358 | | | $ | 5,115,924 | | | $ | 4,879,733 | | | $ | 13,271,710 | | | $ | 12,609,489 | |
| | | | | | | | | | | | | | | | | | | | | | | | |
(1) Shares Issued and Redeemed: | | | | | | | | | | | | | | | | | | | | | | | | |
Shares Issued | | | 43,254 | | | | 81,083 | | | | 18,380 | | | | 43,649 | | | | 58,117 | | | | 131,688 | |
Shares Issued in Lieu of Cash Distributions | | | 3,525 | | | | 4,148 | | | | 5,119 | | | | 8,071 | | | | 12,138 | | | | 16,867 | |
Shares Redeemed | | | (62,966 | ) | | | (97,296 | ) | | | (75,078 | ) | | | (123,692 | ) | | | (175,638 | ) | | | (250,369 | ) |
| | | | | | | | | | | | | | | | | | | | | | | | |
Net Increase (Decrease) from Shares Issued and Redeemed | | | (16,187 | ) | | | (12,065 | ) | | | (51,579 | ) | | | (71,972 | ) | | | (105,383 | ) | | | (101,814 | ) |
| | | | | | | | | | | | | | | | | | | | | | | | |
| * | Net of foreign capital gain taxes withheld for the fiscal year ended October 31, 2021 of $49, $2,304 and $11,984, respectively. |
| ** | Net of foreign capital gain taxes withheld for the fiscal year ended October 31, 2020 of $0, $162 and $365, respectively. |
| *** | Investment Income and Realized and Unrealized Gain (Loss) were allocated from the Portfolio’s Master Fund (Affiliated Investment Company). |
See accompanying Notes to Financial Statements.
111
DFA INVESTMENT DIMENSIONS GROUP INC.
STATEMENTS OF CHANGES IN NET ASSETS
(Amounts in thousands)
| | | | | | | | | | | | | | | | |
| | | Emerging Markets Core | | | Emerging Markets Targeted | |
| | | Equity Portfolio | | | Value Portfolio | |
| | | Year | | | Year | | | Year | | | Year | |
| | | Ended | | | Ended | | | Ended | | | Ended | |
| | | Oct 31, | | | Oct 31, | | | Oct 31, | | | Oct 31, | |
| | | 2021 | | | 2020 | | | 2021 | | | 2020 | |
Increase (Decrease) in Net Assets | | | | | | | | | | | | | | | | |
Operations: | | | | | | | | | | | | | | | | |
Net Investment Income (Loss) | | $ | 670,994 | | | $ | 561,952 | | | $ | 5,084 | | | $ | 3,141 | |
Net Realized Gain (Loss) on: | | | | | | | | | | | | | | | | |
Investment Securities Sold*,** | | | 544,729 | | | | (1,673,803 | ) | | | 17,753 | | | | 1,473 | |
Affiliated Investment Companies Shares Sold | | | (14 | ) | | | (9 | ) | | | — | | | | — | |
Futures | | | 67,395 | | | | 69,434 | | | | 348 | | | | (609 | ) |
Foreign Currency Transactions | | | (15,240 | ) | | | (17,720 | ) | | | (82 | ) | | | 36 | |
Change in Unrealized Appreciation (Depreciation) of: | | | | | | | | | | | | | | | | |
Investment Securities and Foreign Currency | | | 5,134,175 | | | | 760,317 | | | | 42,862 | | | | 3,387 | |
Affiliated Investment Companies Shares | | | (32 | ) | | | 17 | | | | — | | | | — | |
Futures | | | 15,950 | | | | (12,657 | ) | | | 67 | | | | (13 | ) |
Translation of Foreign Currency-Denominated Amounts | | | 100 | | | | (579 | ) | | | 2 | | | | (4 | ) |
| | | | | | | | | | | | | | | | |
Net Increase (Decrease) in Net Assets Resulting from Operations | | | 6,418,057 | | | | (313,048 | ) | | | 66,034 | | | | 7,411 | |
| | | | | | | | | | | | | | | | |
Distributions: | | | | | | | | | | | | | | | | |
Institutional Class Shares | | | (590,306 | ) | | | (585,760 | ) | | | (4,500 | ) | | | (3,875 | ) |
Capital Share Transactions (1): | | | | | | | | | | | | | | | | |
Shares Issued | | | 4,891,169 | | | | 6,136,399 | | | | 53,547 | | | | 116,272 | |
Shares Issued in Lieu of Cash Distributions | | | 560,095 | | | | 555,504 | | | | 4,385 | | | | 3,875 | |
Shares Redeemed | | | (6,904,346 | ) | | | (9,635,005 | ) | | | (54,708 | ) | | | (67,880 | ) |
| | | | | | | | | | | | | | | | |
Net Increase (Decrease) from Capital Share Transactions | | | (1,453,082 | ) | | | (2,943,102 | ) | | | 3,224 | | | | 52,267 | |
| | | | | | | | | | | | | | | | |
Total Increase (Decrease) in Net Assets | | | 4,374,669 | | | | (3,841,910 | ) | | | 64,758 | | | | 55,803 | |
Net Assets | | | | | | | | | | | | | | | | |
Beginning of Year | | | 24,780,700 | | | | 28,622,610 | | | | 170,163 | | | | 114,360 | |
| | | | | | | | | | | | | | | | |
End of Year | | $ | 29,155,369 | | | $ | 24,780,700 | | | $ | 234,921 | | | $ | 170,163 | |
| | | | | | | | | | | | | | | | |
(1) Shares Issued and Redeemed: | | | | | | | | | | | | | | | | |
Shares Issued | | | 191,908 | | | | 329,136 | | | | 4,233 | | | | 14,050 | |
Shares Issued in Lieu of Cash Distributions | | | 22,111 | | | | 28,643 | | | | 389 | | | | 366 | |
Shares Redeemed | | | (273,309 | ) | | | (529,560 | ) | | | (4,246 | ) | | | (7,864 | ) |
| | | | | | | | | | | | | | | | |
Net Increase (Decrease) from Shares Issued and Redeemed | | | (59,290 | ) | | | (171,781 | ) | | | 376 | | | | 6,552 | |
| | | | | | | | | | | | | | | | |
| * | Net of foreign capital gain taxes withheld for the fiscal year ended October 31, 2021 of $257 and $239, respectively. |
| ** | Net of foreign capital gain taxes withheld for the fiscal year ended October 31, 2020 of $72 and $0, respectively. |
See accompanying Notes to Financial Statements.
112
DFA INVESTMENT DIMENSIONS GROUP INC.
FINANCIAL HIGHLIGHTS
(for a share outstanding throughout each period)
| | | | | | | | | | | | | | | | | | | | | | | | | | | | | | | | | | | | | | | | |
| | | Large Cap International Portfolio | | | International Core Equity Portfolio | |
| | | Year
Ended
Oct 31,
2021 | | | Year
Ended
Oct 31,
2020 | | | Year
Ended
Oct 31,
2019 | | | Year
Ended
Oct 31,
2018 | | | Year
Ended
Oct 31,
2017 | | | Year
Ended
Oct 31,
2021 | | | Year
Ended
Oct 31,
2020 | | | Year
Ended
Oct 31,
2019 | | | Year
Ended
Oct 31,
2018 | | | Year
Ended
Oct 31,
2017 | |
Net Asset Value, Beginning of Year | | $ | 20.90 | | | $ | 22.78 | | | $ | 21.29 | | | $ | 23.52 | | | $ | 19.52 | | | $ | 12.08 | | | $ | 13.19 | | | $ | 12.65 | | | $ | 14.23 | | | $ | 11.58 | |
| | | | | | | | | | | | | | | | | | | | | | | | | | | | | | | | | | | | | | | | |
Income from Investment Operations (A) | | | | | | | | | | | | | | | | | | | | | | | | | | | | | | | | | | | | | | | | |
Net Investment Income (Loss) | | | 0.70 | | | | 0.49 | | | | 0.70 | | | | 0.66 | | | | 0.58 | | | | 0.40 | | | | 0.28 | | | | 0.41 | | | | 0.38 | | | | 0.34 | |
Net Gains (Losses) on Securities (Realized and Unrealized) | | | 6.70 | | | | (1.87 | ) | | | 1.47 | | | | (2.25 | ) | | | 4.00 | | | | 4.24 | | | | (1.11 | ) | | | 0.53 | | | | (1.60 | ) | | | 2.63 | |
| | | | | | | | | | | | | | | | | | | | | | | | | | | | | | | | | | | | | | | | |
Total from Investment Operations | | | 7.40 | | | | (1.38 | ) | | | 2.17 | | | | (1.59 | ) | | | 4.58 | | | | 4.64 | | | | (0.83 | ) | | | 0.94 | | | | (1.22 | ) | | | 2.97 | |
| | | | | | | | | | | | | | | | | | | | | | | | | | | | | | | | | | | | | | | | |
Less Distributions: | | | | | | | | | | | | | | | | | | | | | | | | | | | | | | | | | | | | | | | | |
Net Investment Income | | | (0.67 | ) | | | (0.50 | ) | | | (0.68 | ) | | | (0.64 | ) | | | (0.58 | ) | | | (0.37 | ) | | | (0.28 | ) | | | (0.40 | ) | | | (0.36 | ) | | | (0.32 | ) |
| | | | | | | | | | | | | | | | | | | | | | | | | | | | | | | | | | | | | | | | |
Total Distributions | | | (0.67 | ) | | | (0.50 | ) | | | (0.68 | ) | | | (0.64 | ) | | | (0.58 | ) | | | (0.37 | ) | | | (0.28 | ) | | | (0.40 | ) | | | (0.36 | ) | | | (0.32 | ) |
| | | | | | | | | | | | | | | | | | | | | | | | | | | | | | | | | | | | | | | | |
Net Asset Value, End of Year | | $ | 27.63 | | | $ | 20.90 | | | $ | 22.78 | | | $ | 21.29 | | | $ | 23.52 | | | $ | 16.35 | | | $ | 12.08 | | | $ | 13.19 | | | $ | 12.65 | | | $ | 14.23 | |
| | | | | | | | | | | | | | | | | | | | | | | | | | | | | | | | | | | | | | | | |
Total Return | | | 35.55 | % | | | (6.05 | %) | | | 10.38 | % | | | (6.97 | %) | | | 23.79 | % | | | 38.56 | % | | | (6.32 | %) | | | 7.67 | % | | | (8.79 | %) | | | 26.02 | % |
| | | | | | | | | | | | | | | | | | | | | | | | | | | | | | | | | | | | | | | | |
Net Assets, End of Year (thousands) | | $ | 6,032,181 | | | $ | 4,700,488 | | | $ | 5,356,475 | | | $ | 4,587,406 | | | $ | 4,723,090 | | | $ | 34,629,583 | | | $ | 24,965,561 | | | $ | 30,559,427 | | | $ | 27,174,589 | | | $ | 25,443,968 | |
Ratio of Expenses to Average Net Assets | | | 0.19 | % | | | 0.22 | % | | | 0.23 | % | | | 0.23 | % | | | 0.25 | % | | | 0.25 | % | | | 0.30 | % | | | 0.29 | % | | | 0.30 | % | | | 0.30 | % |
Ratio of Expenses to Average Net Assets (Excluding Fees Waived, Expenses Reimbursed by Advisor and Fees Paid Indirectly) | | | 0.19 | % | | | 0.23 | % | | | 0.24 | % | | | 0.23 | % | | | 0.25 | % | | | 0.25 | % | | | 0.30 | % | | | 0.31 | % | | | 0.30 | % | | | 0.32 | % |
Ratio of Net Investment Income to Average Net Assets | | | 2.65 | % | | | 2.31 | % | | | 3.22 | % | | | 2.78 | % | | | 2.72 | % | | | 2.56 | % | | | 2.24 | % | | | 3.21 | % | | | 2.67 | % | | | 2.62 | % |
Portfolio Turnover Rate | | | 14 | % | | | 19 | % | | | 7 | % | | | 8 | % | | | 10 | % | | | 8 | % | | | 4 | % | | | 6 | % | | | 4 | % | | | 6 | % |
| | | | | | | | | | | | | | | | | | | | | | | | | | | | | | | | | | | | | | | | |
See page 1-2 for the Definitions of Abbreviations and Footnotes.
See accompanying Notes to Financial Statements.
113
DFA INVESTMENT DIMENSIONS GROUP INC.
FINANCIAL HIGHLIGHTS
(for a share outstanding throughout each period)
| | | | | | | | | | | | | | | | | | | | | | | | | | | | | | | | | | | | | | | | |
| | | Global Small Company Portfolio | | | International Small Company Portfolio | |
| | | Year
Ended
Oct 31,
2021 | | | Year
Ended
Oct 31,
2020 | | | Year
Ended
Oct 31,
2019 | | | Year
Ended
Oct 31,
2018 | | | Period
Jan 18,
2017 ʊ to
Oct 31,
2017 | | | Year
Ended
Oct 31,
2021 | | | Year
Ended
Oct 31,
2020 | | | Year
Ended
Oct 31,
2019 | | | Year
Ended
Oct 31,
2018 | | | Year
Ended
Oct 31,
2017 | |
Net Asset Value, Beginning of Period | | $ | 10.50 | | | $ | 11.07 | | | $ | 10.73 | | | $ | 11.53 | | | $ | 10.00 | | | $ | 16.84 | | | $ | 18.21 | | | $ | 18.46 | | | $ | 21.52 | | | $ | 17.78 | |
| | | | | | | | | | | | | | | | | | | | | | | | | | | | | | | | | | | | | | | | |
Income from Investment Operations (A) | | | | | | | | | | | | | | | | | | | | | | | | | | | | | | | | | | | | | | | | |
Net Investment Income (Loss) | | | 0.22 | | | | 0.15 | | | | 0.18 | | | | 0.19 | | | | 0.14 | | | | 0.41 | | | | 0.33 | | | | 0.43 | | | | 0.46 | | | | 0.41 | |
Net Gains (Losses) on Securities (Realized and Unrealized) | | | 4.97 | | | | (0.55 | ) | | | 0.27 | | | | (0.75 | ) | | | 1.39 | | | | 6.42 | | | | (0.93 | ) | | | 0.58 | | | | (2.41 | ) | | | 4.13 | |
| | | | | | | | | | | | | | | | | | | | | | | | | | | | | | | | | | | | | | | | |
Total from Investment Operations | | | 5.19 | | | | (0.40 | ) | | | 0.45 | | | | (0.56 | ) | | | 1.53 | | | | 6.83 | | | | (0.60 | ) | | | 1.01 | | | | (1.95 | ) | | | 4.54 | |
| | | | | | | | | | | | | | | | | | | | | | | | | | | | | | | | | | | | | | | | |
Less Distributions: | | | | | | | | | | | | | | | | | | | | | | | | | | | | | | | | | | | | | | | | |
Net Investment Income | | | (0.17 | ) | | | (0.17 | ) | | | (0.11 | ) | | | (0.17 | ) | | | — | | | | (0.38 | ) | | | (0.37 | ) | | | (0.44 | ) | | | (0.44 | ) | | | (0.34 | ) |
Net Realized Gains | | | — | | | | — | | | | — | | | | (0.07 | ) | | | — | | | | — | | | | (0.40 | ) | | | (0.82 | ) | | | (0.67 | ) | | | (0.46 | ) |
| | | | | | | | | | | | | | | | | | | | | | | | | | | | | | | | | | | | | | | | |
Total Distributions | | | (0.17 | ) | | | (0.17 | ) | | | (0.11 | ) | | | (0.24 | ) | | | — | | | | (0.38 | ) | | | (0.77 | ) | | | (1.26 | ) | | | (1.11 | ) | | | (0.80 | ) |
| | | | | | | | | | | | | | | | | | | | | | | | | | | | | | | | | | | | | | | | |
Net Asset Value, End of Period | | $ | 15.52 | | | $ | 10.50 | | | $ | 11.07 | | | $ | 10.73 | | | $ | 11.53 | | | $ | 23.29 | | | $ | 16.84 | | | $ | 18.21 | | | $ | 18.46 | | | $ | 21.52 | |
| | | | | | | | | | | | | | | | | | | | | | | | | | | | | | | | | | | | | | | | |
Total Return | | | 49.81 | % | | | (3.75 | %) | | | 4.29 | % | | | (5.02 | %) | | | 15.30 | %(B) | | | 40.83 | % | | | (3.64 | %) | | | 6.44 | % | | | (9.54 | %) | | | 26.54 | % |
| | | | | | | | | | | | | | | | | | | | | | | | | | | | | | | | | | | | | | | | |
Net Assets, End of Period (thousands) | | $ | 99,631 | | | $ | 43,568 | | | $ | 41,286 | | | $ | 31,380 | | | $ | 15,021 | | | $ | 13,465,853 | | | $ | 10,148,132 | | | $ | 12,750,110 | | | $ | 12,656,204 | | | $ | 13,490,290 | |
Ratio of Expenses to Average Net Assets *(C) | | | 0.47 | % | | | 0.47 | % | | | 0.49 | % | | | 0.49 | % | | | 0.42 | %(D)(E) | | | 0.46 | % | | | 0.53 | % | | | 0.54 | % | | | 0.53 | % | | | 0.53 | % |
Ratio of Expenses to Average Net Assets (Excluding Fees Waived, Expenses Reimbursed by Advisor) *(C) | | | 0.71 | % | | | 0.85 | % | | | 0.93 | % | | | 0.90 | % | | | 1.14 | %(D)(E) | | | 0.46 | % | | | 0.53 | % | | | 0.54 | % | | | 0.53 | % | | | 0.53 | % |
Ratio of Net Investment Income to Average Net Assets | | | 1.49 | % | | | 1.50 | % | | | 1.69 | % | | | 1.58 | % | | | 1.74 | %(D)(E) | | | 1.90 | % | | | 1.96 | % | | | 2.44 | % | | | 2.18 | % | | | 2.14 | % |
| | | | | | | | | | | | | | | | | | | | | | | | | | | | | | | | | | | | | | | | |
* The Ratio of Expenses to Average Net Assets is inclusive of acquired fund fees and expenses incurred by the Portfolio indirectly as a result of Portfolio’s investment in Underlying Funds as follows: | | | 0.24 | % | | | 0.27 | % | | | 0.27 | % | | | 0.26 | % | | | 0.27 | % | | | 0.12 | % | | | 0.12 | % | | | 0.12 | % | | | 0.12 | % | | | 0.12 | % |
| | | | | | | | | | | | | | | | | | | | | | | | | | | | | | | | | | | | | | | | |
See page 1-2 for the Definitions of Abbreviations and Footnotes.
See accompanying Notes to Financial Statements.
114
DFA INVESTMENT DIMENSIONS GROUP INC.
FINANCIAL HIGHLIGHTS
(for a share outstanding throughout each period)
| | | | | | | | | | | | | | | | | | | | | | | | | | | | | | | | | | | | | | | | |
| | | Japanese Small Company Portfolio | | | Asia Pacific Small Company Portfolio | |
| | | Year
Ended
Oct 31,
2021 | | | Year
Ended
Oct 31,
2020 | | | Year
Ended
Oct 31,
2019 | | | Year
Ended
Oct 31,
2018 | | | Year
Ended
Oct 31,
2017 | | | Year
Ended
Oct 31,
2021 | | | Year
Ended
Oct 31,
2020 | | | Year
Ended
Oct 31,
2019 | | | Year
Ended
Oct 31,
2018 | | | Year
Ended
Oct 31,
2017 | |
Net Asset Value, Beginning of Year | | $ | 23.39 | | | $ | 24.89 | | | $ | 25.70 | | | $ | 28.56 | | | $ | 23.01 | | | $ | 20.13 | | | $ | 21.11 | | | $ | 20.83 | | | $ | 23.71 | | | $ | 21.27 | |
| | | | | | | | | | | | | | | | | | | | | | | | | | | | | | | | | | | | | | | | |
Income from Investment Operations (A) | | | | | | | | | | | | | | | | | | | | | | | | | | | | | | | | | | | | | | | | |
Net Investment Income (Loss) | | | 0.44 | | | | 0.40 | | | | 0.45 | | | | 0.43 | | | | 0.37 | | | | 0.75 | | | | 0.75 | | | | 0.77 | | | | 0.84 | | | | 0.74 | |
Net Gains (Losses) on Securities (Realized and Unrealized) | | | 2.51 | | | | (0.91 | ) | | | 0.37 | | | | (2.59 | ) | | | 5.61 | | | | 6.74 | | | | (0.77 | ) | | | 0.19 | | | | (2.76 | ) | | | 2.45 | |
| | | | | | | | | | | | | | | | | | | | | | | | | | | | | | | | | | | | | | | | |
Total from Investment Operations | | | 2.95 | | | | (0.51 | ) | | | 0.82 | | | | (2.16 | ) | | | 5.98 | | | | 7.49 | | | | (0.02 | ) | | | 0.96 | | | | (1.92 | ) | | | 3.19 | |
| | | | | | | | | | | | | | | | | | | | | | | | | | | | | | | | | | | | | | | | |
Less Distributions: | | | | | | | | | | | | | | | | | | | | | | | | | | | | | | | | | | | | | | | | |
Net Investment Income | | | (0.54 | ) | | | (0.61 | ) | | | (0.28 | ) | | | (0.70 | ) | | | (0.43 | ) | | | (0.68 | ) | | | (0.96 | ) | | | (0.68 | ) | | | (0.96 | ) | | | (0.75 | ) |
Net Realized Gains | | | — | | | | (0.38 | ) | | | (1.35 | ) | | | — | | | | — | | | | — | | | | — | | | | — | | | | — | | | | — | |
| | | | | | | | | | | | | | | | | | | | | | | | | | | | | | | | | | | | | | | | |
Total Distributions | | | (0.54 | ) | | | (0.99 | ) | | | (1.63 | ) | | | (0.70 | ) | | | (0.43 | ) | | | (0.68 | ) | | | (0.96 | ) | | | (0.68 | ) | | | (0.96 | ) | | | (0.75 | ) |
| | | | | | | | | | | | | | | | | | | | | | | | | | | | | | | | | | | | | | | | |
Net Asset Value, End of Year | | $ | 25.80 | | | $ | 23.39 | | | $ | 24.89 | | | $ | 25.70 | | | $ | 28.56 | | | $ | 26.94 | | | $ | 20.13 | | | $ | 21.11 | | | $ | 20.83 | | | $ | 23.71 | |
| | | | | | | | | | | | | | | | | | | | | | | | | | | | | | | | | | | | | | | | |
Total Return | | | 12.66 | % | | | (2.32 | %) | | | 4.01 | % | | | (7.82 | %) | | | 26.56 | % | | | 37.81 | % | | | (0.23 | %) | | | 4.81 | % | | | (8.51 | %) | | | 15.70 | % |
| | | | | | | | | | | | | | | | | | | | | | | | | | | | | | | | | | | | | | | | |
Net Assets, End of Year (thousands) | | $ | 379,837 | | | $ | 466,696 | | | $ | 640,068 | | | $ | 622,650 | | | $ | 647,978 | | | $ | 381,490 | | | $ | 378,682 | | | $ | 340,649 | | | $ | 346,335 | | | $ | 332,153 | |
Ratio of Expenses to Average Net Assets (F) | | | 0.47 | % | | | 0.54 | % | | | 0.55 | % | | | 0.53 | % | | | 0.54 | % | | | 0.48 | % | | | 0.54 | % | | | 0.57 | % | | | 0.54 | % | | | 0.54 | % |
Ratio of Expenses to Average Net Assets (Excluding Fees Waived, Expenses Reimbursed by Advisor) (F) | | | 0.57 | % | | | 0.64 | % | | | 0.65 | % | | | 0.63 | % | | | 0.64 | % | | | 0.58 | % | | | 0.64 | % | | | 0.67 | % | | | 0.64 | % | | | 0.64 | % |
Ratio of Net Investment Income to Average Net Assets | | | 1.69 | % | | | 1.74 | % | | | 1.91 | % | | | 1.49 | % | | | 1.50 | % | | | 3.01 | % | | | 3.92 | % | | | 3.65 | % | | | 3.57 | % | | | 3.41 | % |
| | | | | | | | | | | | | | | | | | | | | | | | | | | | | | | | | | | | | | | | |
See page 1-2 for the Definitions of Abbreviations and Footnotes.
See accompanying Notes to Financial Statements.
115
DFA INVESTMENT DIMENSIONS GROUP INC.
FINANCIAL HIGHLIGHTS
(for a share outstanding throughout each period)
| | | | | | | | | | | | | | | | | | | | | | | | | | | | | | | | | | | | | | | | |
| | | United Kingdom Small Company Portfolio | | | Continental Small Company Portfolio | |
| | | Year
Ended
Oct 31,
2021 | | | Year
Ended
Oct 31,
2020 | | | Year
Ended
Oct 31,
2019 | | | Year
Ended
Oct 31,
2018 | | | Year
Ended
Oct 31,
2017 | | | Year
Ended
Oct 31,
2021 | | | Year
Ended
Oct 31,
2020 | | | Year
Ended
Oct 31,
2019 | | | Year
Ended
Oct 31,
2018 | | | Year
Ended
Oct 31,
2017 | |
Net Asset Value, Beginning of Year | | $ | 21.35 | | | $ | 27.85 | | | $ | 26.95 | | | $ | 32.67 | | | $ | 27.21 | | | $ | 23.82 | | | $ | 24.84 | | | $ | 24.37 | | | $ | 28.24 | | | $ | 21.48 | |
| | | | | | | | | | | | | | | | | | | | | | | | | | | | | | | | | | | | | | | | |
Income from Investment Operations (A) | | | | | | | | | | | | | | | | | | | | | | | | | | | | | | | | | | | | | | | | |
Net Investment Income (Loss) | | | 0.58 | | | | 0.43 | | | | 0.76 | | | | 0.85 | | | | 0.87 | | | | 0.57 | | | | 0.40 | | | | 0.55 | | | | 0.61 | | | | 0.45 | |
Net Gains (Losses) on Securities (Realized and Unrealized) | | | 10.31 | | | | (4.00 | ) | | | 1.68 | | | | (3.65 | ) | | | 6.67 | | | | 11.45 | | | | (1.04 | ) | | | 1.23 | | | | (3.68 | ) | | | 6.73 | |
| | | | | | | | | | | | | | | | | | | | | | | | | | | | | | | | | | | | | | | | |
Total from Investment Operations | | | 10.89 | | | | (3.57 | ) | | | 2.44 | | | | (2.80 | ) | | | 7.54 | | | | 12.02 | | | | (0.64 | ) | | | 1.78 | | | | (3.07 | ) | | | 7.18 | |
| | | | | | | | | | | | | | | | | | | | | | | | | | | | | | | | | | | | | | | | |
Less Distributions: | | | | | | | | | | | | | | | | | | | | | | | | | | | | | | | | | | | | | | | | |
Net Investment Income | | | (0.52 | ) | | | (0.68 | ) | | | (0.47 | ) | | | (0.79 | ) | | | (0.93 | ) | | | (0.57 | ) | | | (0.38 | ) | | | (0.51 | ) | | | (0.59 | ) | | | (0.42 | ) |
Net Realized Gains | | | — | | | | (2.25 | ) | | | (1.07 | ) | | | (2.13 | ) | | | (1.15 | ) | | | — | | | | — | | | | (0.80 | ) | | | (0.21 | ) | | | — | |
| | | | | | | | | | | | | | | | | | | | | | | | | | | | | | | | | | | | | | | | |
Total Distributions | | | (0.52 | ) | | | (2.93 | ) | | | (1.54 | ) | | | (2.92 | ) | | | (2.08 | ) | | | (0.57 | ) | | | (0.38 | ) | | | (1.31 | ) | | | (0.80 | ) | | | (0.42 | ) |
| | | | | | | | | | | | | | | | | | | | | | | | | | | | | | | | | | | | | | | | |
Net Asset Value, End of Year | | $ | 31.72 | | | $ | 21.35 | | | $ | 27.85 | | | $ | 26.95 | | | $ | 32.67 | | | $ | 35.27 | | | $ | 23.82 | | | $ | 24.84 | | | $ | 24.37 | | | $ | 28.24 | |
| | | | | | | | | | | | | | | | | | | | | | | | | | | | | | | | | | | | | | | | |
Total Return | | | 51.31 | % | | | (15.27 | %) | | | 10.14 | % | | | (9.34 | %) | | | 29.28 | % | | | 50.70 | % | | | (2.63 | %) | | | 7.94 | % | | | (11.14 | %) | | | 33.68 | % |
| | | | | | | | | | | | | | | | | | | | | | | | | | | | | | | | | | | | | | | | |
Net Assets, End of Year (thousands) | | $ | 44,133 | | | $ | 16,867 | | | $ | 26,540 | | | $ | 36,351 | | | $ | 45,177 | | | $ | 867,759 | | | $ | 537,744 | | | $ | 657,105 | | | $ | 645,651 | | | $ | 592,347 | |
Ratio of Expenses to Average Net Assets (F) | | | 0.59 | % | | | 0.59 | % | | | 0.59 | % | | | 0.58 | % | | | 0.59 | % | | | 0.47 | % | | | 0.54 | % | | | 0.56 | % | | | 0.54 | % | | | 0.56 | % |
Ratio of Expenses to Average Net Assets (Excluding Fees Waived, Expenses Reimbursed by Advisor) (F) | | | 0.74 | % | | | 0.86 | % | | | 0.82 | % | | | 0.68 | % | | | 0.71 | % | | | 0.57 | % | | | 0.64 | % | | | 0.66 | % | | | 0.64 | % | | | 0.66 | % |
Ratio of Net Investment Income to Average Net Assets | | | 1.88 | % | | | 1.89 | % | | | 2.92 | % | | | 2.75 | % | | | 2.93 | % | | | 1.76 | % | | | 1.68 | % | | | 2.30 | % | | | 2.16 | % | | | 1.78 | % |
| | | | | | | | | | | | | | | | | | | | | | | | | | | | | | | | | | | | | | | | |
See page 1-2 for the Definitions of Abbreviations and Footnotes.
See accompanying Notes to Financial Statements.
116
DFA INVESTMENT DIMENSIONS GROUP INC.
FINANCIAL HIGHLIGHTS
(for a share outstanding throughout each period)
| | | | | | | | | | | | | | | | | | | | | | | | | | | | | | | | | | | | | | | | | | |
| | | DFA International Real Estate Securities Portfolio | | | | | DFA Global Real Estate Securities Portfolio | |
| | | Year | | | Year | | | Year | | | Year | | | Year | | | | | Year | | | Year | | | Year | | | Year | | | Year | |
| | | Ended | | | Ended | | | Ended | | | Ended | | | Ended | | | | | Ended | | | Ended | | | Ended | | | Ended | | | Ended | |
| | | Oct 31, | | | Oct 31, | | | Oct 31, | | | Oct 31, | | | Oct 31, | | | | | Oct 31, | | | Oct 31, | | | Oct 31, | | | Oct 31, | | | Oct 31, | |
| | | 2021 | | | 2020 | | | 2019 | | | 2018 | | | 2017 | | | | | 2021 | | | 2020 | | | 2019 | | | 2018 | | | 2017 | |
Net Asset Value, Beginning of Year | | $ | 3.77 | | | $ | 5.61 | | | $ | 4.85 | | | $ | 5.07 | | | $ | 5.23 | | | | | $ | 9.57 | | | $ | 12.71 | | | $ | 10.71 | | | $ | 10.90 | | | $ | 10.84 | |
| | | | | | | | | | | | | | | | | | | | | | | | | | | | | | | | | | | | | | | | | | |
Income from Investment Operations (A) | | | | | | | | | | | | | | | | | | | | | | | | | | | | | | | | | | | | | | | | | | |
Net Investment Income (Loss) | | | 0.16 | | | | 0.15 | | | | 0.20 | | | | 0.22 | | | | 0.21 | | | | | | 0.16 | | | | 0.68 | | | | 0.34 | ** | | | 0.48 | | | | 0.43 | |
Net Gains (Losses) on Securities (Realized and Unrealized) | | | 1.11 | | | | (1.35 | ) | | | 0.83 | | | | (0.22 | ) | | | 0.04 | | | | | | 3.80 | | | | (3.00 | ) | | | 2.16 | ** | | | (0.26 | ) | | | 0.15 | |
| | | | | | | | | | | | | | | | | | | | | | | | | | | | | | | | | | | | | | | | | | |
Total from Investment Operations | | | 1.27 | | | | (1.20 | ) | | | 1.03 | | | | — | | | | 0.25 | | | | | | 3.96 | | | | (2.32 | ) | | | 2.50 | | | | 0.22 | | | | 0.58 | |
| | | | | | | | | | | | | | | | | | | | | | | | | | | | | | | | | | | | | | | | | | |
Less Distributions: | | | | | | | | | | | | | | | | | | | | | | | | | | | | | | | | | | | | | | | | | | |
Net Investment Income | | | — | | | | (0.64 | ) | | | (0.27 | ) | | | (0.22 | ) | | | (0.41 | ) | | | | | (0.20 | ) | | | (0.70 | ) | | | (0.50 | ) | | | (0.34 | ) | | | (0.49 | ) |
Net Realized Gains | | | — | | | | — | | | | — | | | | — | | | | — | | | | | | (0.04 | ) | | | (0.12 | ) | | | (— | ) | | | (0.07 | ) | | | (0.03 | ) |
| | | | | | | | | | | | | | | | | | | | | | | | | | | | | | | | | | | | | | | | | | |
Total Distributions | | | — | | | | (0.64 | ) | | | (0.27 | ) | | | (0.22 | ) | | | (0.41 | ) | | | | | (0.24 | ) | | | (0.82 | ) | | | (0.50 | ) | | | (0.41 | ) | | | (0.52 | ) |
| | | | | | | | | | | | | | | | | | | | | | | | | | | | | | | | | | | | | | | | | | |
Net Asset Value, End of Year | | $ | 5.04 | | | $ | 3.77 | | | $ | 5.61 | | | $ | 4.85 | | | $ | 5.07 | | | | | $ | 13.29 | | | $ | 9.57 | | | $ | 12.71 | | | $ | 10.71 | | | $ | 10.90 | |
| | | | | | | | | | | | | | | | | | | | | | | | | | | | | | | | | | | | | | | | | | |
Total Return | | | 33.69 | % | | | (23.98 | %) | | | 22.54 | % | | | (0.24 | %) | | | 5.46 | % | | | | | 42.08 | % | | | (19.28 | %) | | | 24.55 | % | | | 1.91 | % | | | 5.82 | % |
| | | | | | | | | | | | | | | | | | | | | | | | | | | | | | | | | | | | | | | | | | |
Net Assets, End of Year (thousands) | | $ | 5,987,464 | | | $ | 4,646,848 | | | $ | 6,297,963 | | | $ | 5,442,507 | | | $ | 5,497,753 | | | | | $ | 10,537,586 | | | $ | 7,225,825 | | | $ | 9,269,011 | | | $ | 7,475,924 | | | $ | 6,753,782 | |
Ratio of Expenses to Average Net Assets * | | | 0.27 | % | | | 0.26 | % | | | 0.27 | % | | | 0.28 | % | | | 0.28 | % | | | | | 0.24 | %(C) | | | 0.24 | %(C) | | | 0.24 | %(C) | | | 0.24 | %(C) | | | 0.24 | %(C) |
Ratio of Expenses to Average Net Assets (Excluding Fees Waived, Expenses Reimbursed by Advisor and Fees Paid Indirectly) * | | | 0.27 | % | | | 0.27 | % | | | 0.28 | % | | | 0.28 | % | | | 0.28 | % | | | | | 0.34 | %(C) | | | 0.34 | %(C) | | | 0.35 | %(C) | | | 0.35 | %(C) | | | 0.37 | %(C) |
Ratio of Net Investment Income to Average Net Assets | | | 3.29 | % | | | 3.61 | % | | | 4.01 | % | | | 4.27 | % | | | 4.19 | % | | | | | 1.33 | % | | | 6.44 | % | | | 2.95 | %** | | | 4.42 | % | | | 4.03 | % |
Portfolio Turnover Rate | | | 8 | % | | | 12 | % | | | 8 | % | | | 5 | % | | | 1 | % | | | | | 1 | % | | | 0 | % | | | 0 | % | | | 3 | % | | | 2 | % |
| | | | | | | | | | | | | | | | | | | | | | | | | | | | | | | | | | | | | | | | | | |
* The Ratio of Expenses to Average Net Assets is inclusive of acquired fund fees and expenses incurred by the Portfolio indirectly as a result of Portfolio’s investment in Underlying Funds as follows: | | | N/A | | | | N/A | | | | N/A | | | | N/A | | | | N/A | | | | | | 0.11 | % | | | 0.12 | % | | | 0.13 | % | | | 0.13 | % | | | 0.15 | % |
| | | | | | | | | | | | | | | | | | | | | | | | | | | | | | | | | | | | | | | | | | |
See page 1-2 for the Definitions of Abbreviations and Footnotes.
See accompanying Notes to Financial Statements.
117
DFA INVESTMENT DIMENSIONS GROUP INC.
FINANCIAL HIGHLIGHTS
(for a share outstanding throughout each period)
| | | | | | | | | | | | | | | | | | | | | | | | | | | | | | | | | | | | | | | | | | |
| | | DFA International Small Cap Value Portfolio | | | | | International Vector Equity Portfolio | |
| | | Year | | | Year | | | Year | | | Year | | | Year | | | | | Year | | | Year | | | Year | | | Year | | | Year | |
| | | Ended | | | Ended | | | Ended | | | Ended | | | Ended | | | | | Ended | | | Ended | | | Ended | | | Ended | | | Ended | |
| | | Oct 31, | | | Oct 31, | | | Oct 31, | | | Oct 31, | | | Oct 31, | | | | | Oct 31, | | | Oct 31, | | | Oct 31, | | | Oct 31, | | | Oct 31, | |
| | | 2021 | | | 2020 | | | 2019 | | | 2018 | | | 2017 | | | | | 2021 | | | 2020 | | | 2019 | | | 2018 | | | 2017 | |
Net Asset Value, Beginning of Year | | $ | 15.65 | | | $ | 18.58 | | | $ | 19.24 | | | $ | 23.51 | | | $ | 19.31 | | | | | $ | 10.42 | | | $ | 11.62 | | | $ | 11.74 | | | $ | 13.33 | | | $ | 10.78 | |
| | | | | | | | | | | | | | | | | | | | | | | | | | | | | | | | | | | | | | | | | | |
Income from Investment Operations (A) | | | | | | | | | | | | | | | | | | | | | | | | | | | | | | | | | | | | | | | | | | |
Net Investment Income (Loss) | | | 0.44 | | | | 0.33 | | | | 0.45 | | | | 0.47 | | | | 0.39 | | | | | | 0.32 | | | | 0.23 | | | | 0.33 | | | | 0.32 | | | | 0.28 | |
Net Gains (Losses) on Securities (Realized and Unrealized) | | | 6.48 | | | | (2.65 | ) | | | (0.01 | ) | | | (3.44 | ) | | | 4.72 | | | | | | 4.06 | | | | (1.20 | ) | | | 0.24 | | | | (1.56 | ) | | | 2.57 | |
| | | | | | | | | | | | | | | | | | | | | | | | | | | | | | | | | | | | | | | | | | |
Total from Investment Operation | | | 6.92 | | | | (2.32 | ) | | | 0.44 | | | | (2.97 | ) | | | 5.11 | | | | | | 4.38 | | | | (0.97 | ) | | | 0.57 | | | | (1.24 | ) | | | 2.85 | |
| | | | | | | | | | | | | | | | | | | | | | | | | | | | | | | | | | | | | | | | | | |
Less Distributions: | | | | | | | | | | | | | | | | | | | | | | | | | | | | | | | | | | | | | | | | | | |
Net Investment Income | | | (0.43 | ) | | | (0.32 | ) | | | (0.48 | ) | | | (0.56 | ) | | | (0.29 | ) | | | | | (0.29 | ) | | | (0.23 | ) | | | (0.34 | ) | | | (0.30 | ) | | | (0.28 | ) |
Net Realized Gains | | | — | | | | (0.29 | ) | | | (0.62 | ) | | | (0.74 | ) | | | (0.62 | ) | | | | | — | | | | — | | | | (0.35 | ) | | | (0.05 | ) | | | (0.02 | ) |
| | | | | | | | | | | | | | | | | | | | | | | | | | | | | | | | | | | | | | | | | | |
Total Distributions | | | (0.43 | ) | | | (0.61 | ) | | | (1.10 | ) | | | (1.30 | ) | | | (0.91 | ) | | | | | (0.29 | ) | | | (0.23 | ) | | | (0.69 | ) | | | (0.35 | ) | | | (0.30 | ) |
| | | | | | | | | | | | | | | | | | | | | | | | | | | | | | | | | | | | | | | | | | |
Net Asset Value, End of Year | | $ | 22.14 | | | $ | 15.65 | | | $ | 18.58 | | | $ | 19.24 | | | $ | 23.51 | | | | | $ | 14.51 | | | $ | 10.42 | | | $ | 11.62 | | | $ | 11.74 | | | $ | 13.33 | |
| | | | | | | | | | | | | | | | | | | | | | | | | | | | | | | | | | | | | | | | | | |
Total Return | | | 44.61 | % | | | (13.03 | %) | | | 2.94 | % | | | (13.37 | %) | | | 27.49 | % | | | | | 42.24 | % | | | (8.41 | %) | | | 5.49 | % | | | (9.52 | %) | | | 26.83 | % |
| | | | | | | | | | | | | | | | | | | | | | | | | | | | | | | | | | | | | | | | | | |
Net Assets, End of Year (thousands) | | $ | 12,784,711 | | | $ | 9,887,928 | | | $ | 13,428,084 | | | $ | 13,787,695 | | | $ | 16,162,471 | | | | | $ | 3,716,790 | | | $ | 2,722,859 | | | $ | 2,578,134 | | | $ | 2,441,217 | | | $ | 2,529,852 | |
Ratio of Expenses to Average Net Assets | | | 0.53 | % | | | 0.65 | % | | | 0.68 | % | | | 0.68 | % | | | 0.68 | % | | | | | 0.42 | % | | | 0.47 | % | | | 0.50 | % | | | 0.48 | % | | | 0.49 | % |
Ratio of Expenses to Average Net Assets (Excluding Fees Paid Indirectly) | | | 0.53 | % | | | 0.66 | % | | | 0.69 | % | | | 0.68 | % | | | 0.68 | % | | | | | 0.42 | % | | | 0.48 | % | | | 0.50 | % | | | 0.48 | % | | | 0.49 | % |
Ratio of Net Investment Income to Average Net Assets | | | 2.13 | % | | | 2.02 | % | | | 2.48 | % | | | 2.10 | % | | | 1.85 | % | | | | | 2.35 | % | | | 2.20 | % | | | 2.94 | % | | | 2.40 | % | | | 2.36 | % |
Portfolio Turnover Rate | | | 15 | % | | | 14 | % | | | 18 | % | | | 23 | % | | | 21 | % | | | | | 15 | % | | | 18 | % | | | 17 | % | | | 12 | % | | | 5 | % |
| | | | | | | | | | | | | | | | | | | | | | | | | | | | | | | | | | | | | | | | | | |
See page 1-2 for the Definitions of Abbreviations and Footnotes.
See accompanying Notes to Financial Statements.
118
DFA INVESTMENT DIMENSIONS GROUP INC.
FINANCIAL HIGHLIGHTS
(for a share outstanding throughout each period)
| | | | | | | | | | | | | | | | | | | | | | | | | | | | | | | | | | | | | | | | |
| | | International High Relative Profitability Portfolio | | | World Ex U.S. Value Portfolio | |
| | | Year | | | Year | | | Year | | | Year | | | Period May 16, | | | Year | | | Year | | | Year | | | Year | | | Year | |
| | | Ended | | | Ended | | | Ended | | | Ended | | | 2017 ʊ to | | | Ended | | | Ended | | | Ended | | | Ended | | | Ended | |
| | | Oct 31, | | | Oct 31, | | | Oct 31, | | | Oct 31, | | | Oct 31, | | | Oct 31, | | | Oct 31, | | | Oct 31, | | | Oct 31, | | | Oct 31, | |
| | | 2021 | | | 2020 | | | 2019 | | | 2018 | | | 2017 | | | 2021 | | | 2020 | | | 2019 | | | 2018 | | | 2017 | |
Net Asset Value, Beginning of Period | | $ | 10.64 | | | $ | 10.74 | | | $ | 9.71 | | | $ | 10.68 | | | $ | 10.00 | | | $ | 8.99 | | | $ | 10.97 | | | $ | 11.16 | | | $ | 12.71 | | | $ | 10.31 | |
| | | | | | | | | | | | | | | | | | | | | | | | | | | | | | | | | | | | | | | | |
Income from Investment Operations (A) | | | | | | | | | | | | | | | | | | | | | | | | | | | | | | | | | | | | | | | | |
Net Investment Income (Loss) | | | 0.30 | | | | 0.21 | | | | 0.27 | | | | 0.26 | | | | 0.08 | | | | 0.38 | | | | 0.25 | | | | 0.35 | | | | 0.34 | | | | 0.31 | |
Net Gains (Losses) on Securities (Realized and Unrealized) | | | 3.08 | | | | (0.13 | ) | | | 1.00 | | | | (1.01 | ) | | | 0.66 | | | | 3.66 | | | | (1.96 | ) | | | 0.04 | | | | (1.48 | ) | | | 2.33 | |
| | | | | | | | | | | | | | | | | | | | | | | | | | | | | | | | | | | | | | | | |
Total from Investment Operations | | | 3.38 | | | | 0.08 | | | | 1.27 | | | | (0.75 | ) | | | 0.74 | | | | 4.04 | | | | (1.71 | ) | | | 0.39 | | | | (1.14 | ) | | | 2.64 | |
| | | | | | | | | | | | | | | | | | | | | | | | | | | | | | | | | | | | | | | | |
Less Distributions: | | | | | | | | | | | | | | | | | | | | | | | | | | | | | | | | | | | | | | | | |
Net Investment Income | | | (0.29 | ) | | | (0.18 | ) | | | (0.24 | ) | | | (0.22 | ) | | | (0.06 | ) | | | (0.36 | ) | | | (0.27 | ) | | | (0.35 | ) | | | (0.41 | ) | | | (0.24 | ) |
Net Realized Gains | | | — | | | | — | | | | — | | | | — | | | | — | | | | — | | | | — | | | | (0.23 | ) | | | — | | | | — | |
| | | | | | | | | | | | | | | | | | | | | | | | | | | | | | | | | | | | | | | | |
Total Distributions | | | (0.29 | ) | | | (0.18 | ) | | | (0.24 | ) | | | (0.22 | ) | | | (0.06 | ) | | | (0.36 | ) | | | (0.27 | ) | | | (0.58 | ) | | | (0.41 | ) | | | (0.24 | ) |
| | | | | | | | | | | | | | | | | | | | | | | | | | | | | | | | | | | | | | | | |
Net Asset Value, End of Period | | $ | 13.73 | | | $ | 10.64 | | | $ | 10.74 | | | $ | 9.71 | | | $ | 10.68 | | | $ | 12.67 | | | $ | 8.99 | | | $ | 10.97 | | | $ | 11.16 | | | $ | 12.71 | |
| | | | | | | | | | | | | | | | | | | | | | | | | | | | | | | | | | | | | | | | |
Total Return | | | 31.85 | % | | | 0.80 | % | | | 13.19 | % | | | (7.20 | %) | | | 7.38 | %(B) | | | 45.23 | % | | | (15.76 | %) | | | 3.75 | % | | | (9.22 | %) | | | 25.97 | % |
| | | | | | | | | | | | | | | | | | | | | | | | | | | | | | | | | | | | | | | | |
Net Assets, End of Period (thousands) | | $ | 2,183,724 | | | $ | 1,475,345 | | | $ | 658,448 | | | $ | 266,868 | | | $ | 67,793 | | | $ | 308,666 | | | $ | 206,915 | | | $ | 302,369 | | | $ | 240,668 | | | $ | 246,551 | |
Ratio of Expenses to Average Net Assets * | | | 0.30 | % | | | 0.30 | % | | | 0.33 | % | | | 0.35 | % | | | 0.31 | %(D)(E) | | | 0.44 | %(C) | | | 0.50 | %(C) | | | 0.54 | %(C) | | | 0.52 | %(C) | | | 0.52 | %(C) |
Ratio of Expenses to Average Net Assets (Excluding Fees Waived, Expenses Reimbursed by Advisor and Fees Paid Indirectly) * | | | 0.30 | % | | | 0.31 | % | | | 0.34 | % | | | 0.35 | % | | | 0.65 | %(D)(E) | | | 0.64 | %(C) | | | 0.71 | %(C) | | | 0.76 | %(C) | | | 0.74 | %(C) | | | 0.75 | %(C) |
Ratio of Net Investment Income to Average Net Assets | | | 2.30 | % | | | 1.97 | % | | | 2.69 | % | | | 2.41 | % | | | 1.76 | %(D)(E) | | | 3.14 | % | | | 2.56 | % | | | 3.25 | % | | | 2.72 | % | | | 2.69 | % |
Portfolio Turnover Rate | | | 15 | % | | | 15 | % | | | 9 | % | | | 9 | % | | | 2 | %(B) | | | N/A | | | | N/A | | | | N/A | | | | N/A | | | | N/A | |
| | | | | | | | | | | | | | | | | | | | | | | | | | | | | | | | | | | | | | | | |
* The Ratio of Expenses to Average Net Assets is inclusive of acquired fund fees and expenses incurred by the Portfolio indirectly as a result of Portfolio’s investment in Underlying Funds as follows: | | | N/A | | | | N/A | | | | N/A | | | | N/A | | | | N/A | | | | 0.20 | % | | | 0.23 | % | | | 0.24 | % | | | 0.24 | % | | | 0.25 | % |
| | | | | | | | | | | | | | | | | | | | | | | | | | | | | | | | | | | | | | | | |
See page 1-2 for the Definitions of Abbreviations and Footnotes.
See accompanying Notes to Financial Statements.
119
DFA INVESTMENT DIMENSIONS GROUP INC.
FINANCIAL HIGHLIGHTS
(for a share outstanding throughout each period)
| | | | | | | | | | | | | | | | | | | | |
| | | World Ex U.S. Core Equity Portfolio | |
| | | Year | | | Year | | | Year | | | Year | | | Year | |
| | | Ended | | | Ended | | | Ended | | | Ended | | | Ended | |
| | | Oct 31, | | | Oct 31, | | | Oct 31, | | | Oct 31, | | | Oct 31, | |
| | | 2021 | | | 2020 | | | 2019 | | | 2018 | | | 2017 | |
Net Asset Value, Beginning of Period | | $ | 10.44 | | | $ | 11.17 | | | $ | 10.65 | | | $ | 12.15 | | | $ | 9.93 | |
| | | | | | | | | | | | | | | | | | | | |
Income from Investment Operations (A) | | | | | | | | | | | | | | | | | | | | |
Net Investment Income (Loss) | | | 0.33 | | | | 0.24 | | | | 0.33 | | | | 0.31 | | | | 0.27 | |
Net Gains (Losses) on Securities (Realized and Unrealized) | | | 3.40 | | | | (0.74 | ) | | | 0.56 | | | | (1.52 | ) | | | 2.21 | |
| | | | | | | | | | | | | | | | | | | | |
Total from Investment Operations | | | 3.73 | | | | (0.50 | ) | | | 0.89 | | | | (1.21 | ) | | | 2.48 | |
| | | | | | | | | | | | | | | | | | | | |
Less Distributions: | | | | | | | | | | | | | | | | | | | | |
Net Investment Income | | | (0.33 | ) | | | (0.23 | ) | | | (0.32 | ) | | | (0.29 | ) | | | (0.26 | ) |
Net Realized Gains | | | — | | | | — | | | | (0.05 | ) | | | — | | | | — | |
| | | | | | | | | | | | | | | | | | | | |
Total Distributions | | | (0.33 | ) | | | (0.23 | ) | | | (0.37 | ) | | | (0.29 | ) | | | (0.26 | ) |
| | | | | | | | | | | | | | | | | | | | |
Net Asset Value, End of Period | | $ | 13.84 | | | $ | 10.44 | | | $ | 11.17 | | | $ | 10.65 | | | $ | 12.15 | |
| | | | | | | | | | | | | | | | | | | | |
Total Return | | | 35.87 | % | | | (4.42 | %) | | | 8.64 | % | | | (10.22 | %) | | | 25.33 | % |
| | | | | | | | | | | | | | | | | | | | |
Net Assets, End of Period (thousands) | | $ | 4,089,166 | | | $ | 3,210,237 | | | $ | 3,719,313 | | | $ | 3,129,791 | | | $ | 2,805,367 | |
Ratio of Expenses to Average Net Assets | | | 0.32 | % | | | 0.35 | % | | | 0.37 | % | | | 0.39 | % | | | 0.40 | % |
Ratio of Expenses to Average Net Assets (Excluding Fees Waived, Expenses Reimbursed by Advisor and Fees Paid Indirectly) | | | 0.32 | % | | | 0.36 | % | | | 0.38 | % | | | 0.37 | % | | | 0.40 | % |
Ratio of Net Investment Income to Average Net Assets | | | 2.49 | % | | | 2.26 | % | | | 3.02 | % | | | 2.56 | % | | | 2.48 | % |
Portfolio Turnover Rate | | | 6 | % | | | 13 | % | | | 8 | % | | | 4 | % | | | 4 | % |
| | | | | | | | | | | | | | | | | | | | |
See page 1-2 for the Definitions of Abbreviations and Footnotes.
See accompanying Notes to Financial Statements.
120
DFA INVESTMENT DIMENSIONS GROUP INC.
FINANCIAL HIGHLIGHTS
(for a share outstanding throughout each period)
| | | | | | | | | | | | | | | | | | | | | | | | | | | | | | | | | | | | | | | | |
| | | World Core Equity Portfolio | | | Selectively Hedged Global Equity Portfolio | |
| | | Year | | | Year | | | Year | | | Year | | | Year | | | Year | | | Year | | | Year | | | Year | | | Year | |
| | | Ended | | | Ended | | | Ended | | | Ended | | | Ended | | | Ended | | | Ended | | | Ended | | | Ended | | | Ended | |
| | | Oct 31, | | | Oct 31, | | | Oct 31, | | | Oct 31, | | | Oct 31, | | | Oct 31, | | | Oct 31, | | | Oct 31, | | | Oct 31, | | | Oct 31, | |
| | | 2021 | | | 2020 | | | 2019 | | | 2018 | | | 2017 | | | 2021 | | | 2020 | | | 2019 | | | 2018 | | | 2017 | |
Net Asset Value, Beginning of Year | | $ | 16.29 | | | $ | 16.42 | | | $ | 15.40 | | | $ | 16.06 | | | $ | 13.14 | | | $ | 16.21 | | | $ | 16.54 | | | $ | 15.71 | | | $ | 16.52 | | | $ | 13.67 | |
| | | | | | | | | | | | | | | | | | | | | | | | | | | | | | | | | | | | | | | | |
Income from Investment Operations (A) | | | | | | | | | | | | | | | | | | | | | | | | | | | | | | | | | | | | | | | | |
Net Investment Income (Loss) | | | 0.34 | | | | 0.29 | | | | 0.35 | | | | 0.31 | | | | 0.29 | | | | 0.33 | | | | 0.28 | | | | 0.35 | | | | 0.31 | | | | 0.29 | |
Net Gains (Losses) on Securities (Realized and Unrealized) | | | 6.27 | | | | (0.10 | ) | | | 1.13 | | | | (0.64 | ) | | | 2.98 | | | | 6.21 | | | | (0.18 | ) | | | 1.12 | | | | (0.66 | ) | | | 2.98 | |
| | | | | | | | | | | | | | | | | | | | | | | | | | | | | | | | | | | | | | | | |
Total from Investment Operations | | | 6.61 | | | | 0.19 | | | | 1.48 | | | | (0.33 | ) | | | 3.27 | | | | 6.54 | | | | 0.10 | | | | 1.47 | | | | (0.35 | ) | | | 3.27 | |
| | | | | | | | | | | | | | | | | | | | | | | | | | | | | | | | | | | | | | | | |
Less Distributions: | | | | | | | | | | | | | | | | | | | | | | | | | | | | | | | | | | | | | | | | |
Net Investment Income | | | (0.34 | ) | | | (0.29 | ) | | | (0.35 | ) | | | (0.30 | ) | | | (0.30 | ) | | | (0.20 | ) | | | (0.43 | ) | | | (0.44 | ) | | | (0.27 | ) | | | (0.30 | ) |
Net Realized Gains | | | — | | | | (0.03 | ) | | | (0.11 | ) | | | (0.03 | ) | | | (0.05 | ) | | | (0.20 | ) | | | — | | | | (0.20 | ) | | | (0.19 | ) | | | (0.12 | ) |
| | | | | | | | | | | | | | | | | | | | | | | | | | | | | | | | | | | | | | | | |
Total Distributions | | | (0.34 | ) | | | (0.32 | ) | | | (0.46 | ) | | | (0.33 | ) | | | (0.35 | ) | | | (0.40 | ) | | | (0.43 | ) | | | (0.64 | ) | | | (0.46 | ) | | | (0.42 | ) |
| | | | | | | | | | | | | | | | | | | | | | | | | | | | | | | | | | | | | | | | |
Net Asset Value, End of Year | | $ | 22.56 | | | $ | 16.29 | | | $ | 16.42 | | | $ | 15.40 | | | $ | 16.06 | | | $ | 22.35 | | | $ | 16.21 | | | $ | 16.54 | | | $ | 15.71 | | | $ | 16.52 | |
| | | | | | | | | | | | | | | | | | | | | | | | | | | | | | | | | | | | | | | | |
Total Return | | | 40.75 | % | | | 1.25 | % | | | 9.94 | % | | | (2.16 | %) | | | 25.14 | % | | | 40.81 | % | | | 0.47 | % | | | 10.10 | % | | | (2.28 | %) | | | 24.54 | % |
| | | | | | | | | | | | | | | | | | | | | | | | | | | | | | | | | | | | | | | | |
Net Assets, End of Year (thousands) | | $ | 1,088,714 | | | $ | 769,602 | | | $ | 879,553 | | | $ | 741,512 | | | $ | 546,891 | | | $ | 348,707 | | | $ | 288,509 | | | $ | 375,832 | | | $ | 403,195 | | | $ | 402,204 | |
Ratio of Expenses to Average Net Assets *(C) | | | 0.28 | % | | | 0.32 | % | | | 0.33 | % | | | 0.35 | % | | | 0.35 | % | | | 0.32 | % | | | 0.36 | % | | | 0.37 | % | | | 0.34 | % | | | 0.35 | % |
Ratio of Expenses to Average Net Assets (Excluding Fees Waived, Expenses Reimbursed by Advisor) *(C) | | | 0.46 | % | | | 0.56 | % | | | 0.60 | % | | | 0.59 | % | | | 0.60 | % | | | 0.53 | % | | | 0.61 | % | | | 0.63 | % | | | 0.60 | % | | | 0.62 | % |
Ratio of Net Investment Income to Average Net Assets | | | 1.64 | % | | | 1.81 | % | | | 2.23 | % | | | 1.89 | % | | | 1.95 | % | | | 1.60 | % | | | 1.78 | % | | | 2.25 | % | | | 1.87 | % | | | 1.90 | % |
| | | | | | | | | | | | | | | | | | | | | | | | | | | | | | | | | | | | | | | | |
* The Ratio of Expenses to Average Net Assets is inclusive of acquired fund fees and expenses incurred by the Portfolio indirectly as a result of Portfolio’s investment in Underlying Funds as follows: | | | 0.22 | % | | | 0.25 | % | | | 0.27 | % | | | 0.27 | % | | | 0.28 | % | | | 0.25 | % | | | 0.28 | % | | | 0.30 | % | | | 0.29 | % | | | 0.29 | % |
| | | | | | | | | | | | | | | | | | | | | | | | | | | | | | | | | | | | | | | | |
See page 1-2 for the Definitions of Abbreviations and Footnotes.
See accompanying Notes to Financial Statements.
121
DFA INVESTMENT DIMENSIONS GROUP INC.
FINANCIAL HIGHLIGHTS
(for a share outstanding throughout each period)
| | | | | | | | | | | | | | | | | | | | | | | | | | | | | | | | | | | | | | | | |
| | | Emerging Markets Portfolio | | | Emerging Markets Small Cap Portfolio | |
| | | Year | | | Year | | | Year | | | Year | | | Year | | | Year | | | Year | | | Year | | | Year | | | Year | |
| | | Ended | | | Ended | | | Ended | | | Ended | | | Ended | | | Ended | | | Ended | | | Ended | | | Ended | | | Ended | |
| | | Oct 31, | | | Oct 31, | | | Oct 31, | | | Oct 31, | | | Oct 31, | | | Oct 31, | | | Oct 31, | | | Oct 31, | | | Oct 31, | | | Oct 31, | |
| | | 2021 | | | 2020 | | | 2019 | | | 2018 | | | 2017 | | | 2021 | | | 2020 | | | 2019 | | | 2018 | | | 2017 | |
Net Asset Value, Beginning of Year | | $ | 27.64 | | | $ | 27.56 | | | $ | 25.46 | | | $ | 29.55 | | | $ | 24.12 | | | $ | 19.67 | | | $ | 20.07 | | | $ | 18.72 | | | $ | 23.49 | | | $ | 20.39 | |
| | | | | | | | | | | | | | | | | | | | | | | | | | | | | | | | | | | | | | | | |
Income from Investment Operations (A) | | | | | | | | | | | | | | | | | | | | | | | | | | | | | | | | | | | | | | | | |
Net Investment Income (Loss) | | | 0.74 | | | | 0.55 | | | | 0.73 | | | | 0.61 | | | | 0.49 | | | | 0.52 | | | | 0.41 | | | | 0.48 | | | | 0.53 | | | | 0.49 | |
Net Gains (Losses) on Securities (Realized and Unrealized) | | | 5.32 | | | | 0.07 | | | | 2.05 | | | | (4.14 | ) | | | 5.43 | | | | 6.41 | | | | (0.24 | ) | | | 1.87 | | | | (4.22 | ) | | | 3.58 | |
| | | | | | | | | | | | | | | | | | | | | | | | | | | | | | | | | | | | | | | | |
Total from Investment Operations | | | 6.06 | | | | 0.62 | | | | 2.78 | | | | (3.53 | ) | | | 5.92 | | | | 6.93 | | | | 0.17 | | | | 2.35 | | | | (3.69 | ) | | | 4.07 | |
| | | | | | | | | | | | | | | | | | | | | | | | | | | | | | | | | | | | | | | | |
Less Distributions: | | | | | | | | | | | | | | | | | | | | | | | | | | | | | | | | | | | | | | | | |
Net Investment Income | | | (0.65 | ) | | | (0.54 | ) | | | (0.68 | ) | | | (0.56 | ) | | | (0.49 | ) | | | (0.57 | ) | | | (0.44 | ) | | | (0.46 | ) | | | (0.53 | ) | | | (0.51 | ) |
Net Realized Gains | | | — | | | | — | | | | — | | | | — | | | | — | | | | — | | | | (0.13 | ) | | | (0.54 | ) | | | (0.55 | ) | | | (0.46 | ) |
| | | | | | | | | | | | | | | | | | | | | | | | | | | | | | | | | | | | | | | | |
Total Distributions | | | (0.65 | ) | | | (0.54 | ) | | | (0.68 | ) | | | (0.56 | ) | | | (0.49 | ) | | | (0.57 | ) | | | (0.57 | ) | | | (1.00 | ) | | | (1.08 | ) | | | (0.97 | ) |
| | | | | | | | | | | | | | | | | | | | | | | | | | | | | | | | | | | | | | | | |
Net Asset Value, End of Year | | $ | 33.05 | | | $ | 27.64 | | | $ | 27.56 | | | $ | 25.46 | | | $ | 29.55 | | | $ | 26.03 | | | $ | 19.67 | | | $ | 20.07 | | | $ | 18.72 | | | $ | 23.49 | |
| | | | | | | | | | | | | | | | | | | | | | | | | | | | | | | | | | | | | | | | |
Total Return | | | 21.91 | % | | | 2.36 | % | | | 11.06 | % | | | (12.14 | %) | | | 24.83 | % | | | 35.51 | % | | | 0.81 | % | | | 12.96 | % | | | (16.45 | %) | | | 21.00 | % |
| | | | | | | | | | | | | | | | | | | | | | | | | | | | | | | | | | | | | | | | |
Net Assets, End of Year (thousands) | | $ | 6,225,187 | | | $ | 5,652,358 | | | $ | 5,968,318 | | | $ | 5,394,188 | | | $ | 6,632,914 | | | $ | 5,115,924 | | | $ | 4,879,733 | | | $ | 6,423,859 | | | $ | 6,304,406 | | | $ | 7,249,717 | |
Ratio of Expenses to Average Net Assets (F) | | | 0.39 | % | | | 0.44 | % | | | 0.48 | % | | | 0.47 | % | | | 0.50 | % | | | 0.63 | % | | | 0.69 | % | | | 0.72 | % | | | 0.70 | % | | | 0.73 | % |
Ratio of Expenses to Average Net Assets (Excluding Fees Waived, Expenses Reimbursed by Advisor) (F) | | | 0.49 | % | | | 0.54 | % | | | 0.58 | % | | | 0.57 | % | | | 0.60 | % | | | 0.83 | % | | | 0.89 | % | | | 0.92 | % | | | 0.90 | % | | | 0.93 | % |
Ratio of Net Investment Income to Average Net Assets | | | 2.19 | % | | | 2.07 | % | | | 2.70 | % | | | 2.08 | % | | | 1.88 | % | | | 2.10 | % | | | 2.20 | % | | | 2.44 | % | | | 2.31 | % | | | 2.32 | % |
| | | | | | | | | | | | | | | | | | | | | | | | | | | | | | | | | | | | | | | | |
See page 1-2 for the Definitions of Abbreviations and Footnotes.
See accompanying Notes to Financial Statements.
122
DFA INVESTMENT DIMENSIONS GROUP INC.
FINANCIAL HIGHLIGHTS
(for a share outstanding throughout each period)
| | | | | | | | | | | | | | | | | | | | |
| | | Emerging Markets Value Portfolio-Class R2 Shares | |
| | | Year | | | Year | | | Year | | | Year | | | Year | |
| | | Ended | | | Ended | | | Ended | | | Ended | | | Ended | |
| | | Oct 31, | | | Oct 31, | | | Oct 31, | | | Oct 31, | | | Oct 31, | |
| | | 2021 | | | 2020 | | | 2019 | | | 2018 | | | 2017 | |
Net Asset Value, Beginning of Year | | $ | 23.78 | | | $ | 27.16 | | | $ | 26.64 | | | $ | 30.13 | | | $ | 24.71 | |
| | | | | | | | | | | | | | | | | | | | |
Income from Investment Operations (A) | | | | | | | | | | | | | | | | | | | | |
Net Investment Income (Loss) | | | 0.82 | | | | 0.59 | | | | 0.63 | | | | 0.63 | | | | 0.31 | |
Net Gains (Losses) on Securities (Realized and Unrealized) | | | 7.45 | | | | (3.27 | ) | | | 0.56 | | | | (3.48 | ) | | | 5.60 | |
| | | | | | | | | | | | | | | | | | | | |
Total from Investment Operations | | | 8.27 | | | | (2.68 | ) | | | 1.19 | | | | (2.85 | ) | | | 5.91 | |
| | | | | | | | | | | | | | | | | | | | |
Less Distributions: | | | | | | | | | | | | | | | | | | | | |
Net Investment Income | | | (0.77 | ) | | | (0.70 | ) | | | (0.67 | ) | | | (0.64 | ) | | | (0.49 | ) |
| | | | | | | | | | | | | | | | | | | | |
Total Distributions | | | (0.77 | ) | | | (0.70 | ) | | | (0.67 | ) | | | (0.64 | ) | | | (0.49 | ) |
| | | | | | | | | | | | | | | | | | | | |
Net Asset Value, End of Year | | $ | 31.28 | | | $ | 23.78 | | | $ | 27.16 | | | $ | 26.64 | | | $ | 30.13 | |
| | | | | | | | | | | | | | | | | | | | |
Total Return | | | 34.91 | % | | | (9.98 | %) | | | 4.57 | % | | | (9.66 | %) | | | 24.11 | % |
| | | | | | | | | | | | | | | | | | | | |
Net Assets, End of Year (thousands) | | $ | 13,709 | | | $ | 12,587 | | | $ | 29,146 | | | $ | 25,150 | | | $ | 31,198 | |
Ratio of Expenses to Average Net Assets (F) | | | 0.74 | % | | | 0.77 | % | | | 0.81 | % | | | 0.80 | % | | | 0.81 | % |
Ratio of Expenses to Average Net Assets (Excluding Fees Waived, Expenses Reimbursed by Advisor) (F) | | | 0.84 | % | | | 0.87 | % | | | 0.91 | % | | | 0.90 | % | | | 0.91 | % |
Ratio of Net Investment Income to Average Net Assets | | | 2.68 | % | | | 2.41 | % | | | 2.29 | % | | | 2.07 | % | | | 1.19 | % |
| | | | | | | | | | | | | | | | | | | | |
See page 1-2 for the Definitions of Abbreviations and Footnotes.
See accompanying Notes to Financial Statements.
123
DFA INVESTMENT DIMENSIONS GROUP INC.
FINANCIAL HIGHLIGHTS
(for a share outstanding throughout each period)
| | | | | | | | | | | | | | | | | | | | |
| | | Emerging Markets Value Portfolio-Institutional Class Shares | |
| | | Year | | | Year | | | Year | | | Year | | | Year | |
| | | Ended | | | Ended | | | Ended | | | Ended | | | Ended | |
| | | Oct 31, | | | Oct 31, | | | Oct 31, | | | Oct 31, | | | Oct 31, | |
| | | 2021 | | | 2020 | | | 2019 | | | 2018 | | | 2017 | |
Net Asset Value, Beginning of Year | | $ | 23.93 | | | $ | 27.34 | | | $ | 26.81 | | | $ | 30.32 | | | $ | 24.84 | |
| | | | | | | | | | | | | | | | | | | | |
Income from Investment Operations (A) | | | | | | | | | | | | | | | | | | | | |
Net Investment Income (Loss) | | | 0.90 | | | | 0.71 | | | | 0.70 | | | | 0.73 | | | | 0.61 | |
Net Gains (Losses) on Securities (Realized and Unrealized) | | | 7.50 | | | | (3.35 | ) | | | 0.57 | | | | (3.53 | ) | | | 5.40 | |
| | | | | | | | | | | | | | | | | | | | |
Total from Investment Operations | | | 8.40 | | | | (2.64 | ) | | | 1.27 | | | | (2.80 | ) | | | 6.01 | |
| | | | | | | | | | | | | | | | | | | | |
Less Distributions: | | | | | | | | | | | | | | | | | | | | |
Net Investment Income | | | (0.85 | ) | | | (0.77 | ) | | | (0.74 | ) | | | (0.71 | ) | | | (0.53 | ) |
| | | | | | | | | | | | | | | | | | | | |
Total Distributions | | | (0.85 | ) | | | (0.77 | ) | | | (0.74 | ) | | | (0.71 | ) | | | (0.53 | ) |
| | | | | | | | | | | | | | | | | | | | |
Net Asset Value, End of Year | | $ | 31.48 | | | $ | 23.93 | | | $ | 27.34 | | | $ | 26.81 | | | $ | 30.32 | |
| | | | | | | | | | | | | | | | | | | | |
Total Return | | | 35.24 | % | | | (9.75 | %) | | | 4.83 | % | | | (9.45 | %) | | | 24.41 | % |
| | | | | | | | | | | | | | | | | | | | |
Net Assets, End of Year (thousands) | | $ | 13,258,001 | | | $ | 12,596,902 | | | $ | 17,161,936 | | | $ | 16,431,410 | | | $ | 19,383,230 | |
Ratio of Expenses to Average Net Assets (F) | | | 0.49 | % | | | 0.52 | % | | | 0.56 | % | | | 0.54 | % | | | 0.57 | % |
Ratio of Expenses to Average Net Assets (Excluding Fees Waived, Expenses Reimbursed by Advisor) (F) | | | 0.59 | % | | | 0.62 | % | | | 0.66 | % | | | 0.64 | % | | | 0.67 | % |
Ratio of Net Investment Income to Average Net Assets | | | 2.92 | % | | | 2.87 | % | | | 2.54 | % | | | 2.37 | % | | | 2.23 | % |
| | | | | | | | | | | | | | | | | | | | |
See page 1-2 for the Definitions of Abbreviations and Footnotes.
See accompanying Notes to Financial Statements.
124
DFA INVESTMENT DIMENSIONS GROUP INC.
FINANCIAL HIGHLIGHTS
(for a share outstanding throughout each period)
| | | | | | | | | | | | | | | | | | | | | | | | | | | | | | | | |
| | | Emerging Markets Core Equity Portfolio | | | Emerging
Markets Targeted
Value Portfolio | |
| | | | | | | | | | | | | | | | | | | | | | | | Period | |
| | | Year | | | Year | | | Year | | | Year | | | Year | | | Year | | | Year | | | Nov 14, | |
| | | Ended | | | Ended | | | Ended | | | Ended | | | Ended | | | Ended | | | Ended | | | 2018 ʊ to | |
| | | Oct 31, | | | Oct 31, | | | Oct 31, | | | Oct 31, | | | Oct 31, | | | Oct 31, | | | Oct 31, | | | Oct 31, | |
| | | 2021 | | | 2020 | | | 2019 | | | 2018 | | | 2017 | | | 2021 | | | 2020 | | | 2019 | |
Net Asset Value, Beginning of Year | | $ | 20.34 | | | $ | 20.59 | | | $ | 18.95 | | | $ | 22.38 | | | $ | 18.40 | | | $ | 9.71 | | | $ | 10.43 | | | $ | 10.00 | |
| | | | | | | | | | | | | | | | | | | | | | | | | | | | | | | | |
Income from Investment Operations (A) | | | | | | | | | | | | | | | | | | | | | | | | | | | | | | | | |
Net Investment Income (Loss) | | | 0.57 | | | | 0.43 | | | | 0.53 | | | | 0.50 | | | | 0.42 | | | | 0.28 | | | | 0.21 | | | | 0.24 | |
Net Gains (Losses) on Securities (Realized and Unrealized) | | | 4.76 | | | | (0.22 | ) | | | 1.64 | | | | (3.47 | ) | | | 3.95 | | | | 3.39 | | | | (0.59 | ) | | | 0.20 | |
| | | | | | | | | | | | | | | | | | | | | | | | | | | | | | | | |
Total from Investment Operations | | | 5.33 | | | | 0.21 | | | | 2.17 | | | | (2.97 | ) | | | 4.37 | | | | 3.67 | | | | (0.38 | ) | | | 0.44 | |
| | | | | | | | | | | | | | | | | | | | | | | | | | | | | | | | |
Less Distributions: | | | | | | | | | | | | | | | | | | | | | | | | | | | | | | | | |
Net Investment Income | | | (0.51 | ) | | | (0.46 | ) | | | (0.53 | ) | | | (0.46 | ) | | | (0.39 | ) | | | (0.23 | ) | | | (0.23 | ) | | | (0.01 | ) |
Net Realized Gains | | | — | | | | — | | | | — | | | | — | | | | — | | | | (0.02 | ) | | | (0.11 | ) | | | — | |
| | | | | | | | | | | | | | | | | | | | | | | | | | | | | | | | |
Total Distributions | | | (0.51 | ) | | | (0.46 | ) | | | (0.53 | ) | | | (0.46 | ) | | | (0.39 | ) | | | (0.25 | ) | | | (0.34 | ) | | | (0.01 | ) |
| | | | | | | | | | | | | | | | | | | | | | | | | | | | | | | | |
Net Asset Value, End of Year | | $ | 25.16 | | | $ | 20.34 | | | $ | 20.59 | | | $ | 18.95 | | | $ | 22.38 | | | $ | 13.13 | | | $ | 9.71 | | | $ | 10.43 | |
| | | | | | | | | | | | | | | | | | | | | | | | | | | | | | | | |
Total Return | | | 26.19 | % | | | 1.13 | % | | | 11.61 | % | | | (13.48 | %) | | �� | 24.02 | % | | | 38.29 | % | | | (3.89 | %) | | | 4.38 | %(B) |
| | | | | | | | | | | | | | | | | | | | | | | | | | | | | | | | |
Net Assets, End of Year (thousands) | | $ | 29,155,369 | | | $ | 24,780,700 | | | $ | 28,622,610 | | | $ | 25,372,759 | | | $ | 27,085,722 | | | $ | 234,921 | | | $ | 170,163 | | | $ | 114,360 | |
Ratio of Expenses to Average Net Assets | | | 0.42 | % | | | 0.49 | % | | | 0.52 | % | | | 0.52 | % | | | 0.55 | % | | | 0.72 | % | | | 0.84 | % | | | 0.85 | %(D)(E) |
Ratio of Expenses to Average Net Assets (Excluding Fees Waived, Expenses Reimbursed by Advisor and Fees Paid Indirectly) | | | 0.42 | % | | | 0.50 | % | | | 0.53 | % | | | 0.52 | % | | | 0.56 | % | | | 0.72 | % | | | 0.87 | % | | | 0.95 | %(D)(E) |
Ratio of Net Investment Income to Average Net Assets | | | 2.26 | % | | | 2.19 | % | | | 2.62 | % | | | 2.25 | % | | | 2.08 | % | | | 2.19 | % | | | 2.26 | % | | | 2.30 | %(D)(E) |
Portfolio Turnover Rate | | | 10 | % | | | 15 | % | | | 4 | % | | | 4 | % | | | 4 | % | | | 29 | % | | | 34 | % | | | 12 | %(B) |
| | | | | | | | | | | | | | | | | | | | | | | | | | | | | | | | |
See page 1-2 for the Definitions of Abbreviations and Footnotes.
See accompanying Notes to Financial Statements.
125
DFA INVESTMENT DIMENSIONS GROUP INC.
NOTES TO FINANCIAL STATEMENTS
A. Organization:
DFA Investment Dimensions Group Inc. (the “Fund”) is an open-end management investment company registered under the Investment Company Act of 1940, whose shares are generally offered to institutional investors, retirement plans and clients of registered investment advisors. The Fund consists of one hundred operational portfolios, of which twenty-two (the “Portfolios”) are included in this section of the report. The remaining operational portfolios are presented in separate reports. The Portfolios are investment companies, and accordingly, follow the accounting and reporting guidance under the Financial Accounting Standards Board (“FASB”) Accounting Standards Certification (“ASC”), Topic 946, “Financial Services-Investment Companies.”
Of the Portfolios, seven invest all of their assets in a corresponding series or fund (each such Portfolio, a “Feeder Fund”). Of the Feeder Funds, six invest all of their assets in a corresponding series of The DFA Investment Trust Company (“DFAITC”) and one invests all of its assets in the Dimensional Emerging Markets Value Fund (“DEM”) (each such series within DFAITC and DEM, a “Master Fund”, treated as partnerships for federal income tax purposes). Six of the Portfolios generally allocate their assets among other funds managed by Dimensional Fund Advisors LP (each such Portfolio, a “Fund of Funds”). The Fund of Funds may also invest in affiliated and unaffiliated registered and unregistered money market funds. The International Small Company Portfolio invests in five Master Funds within DFAITC. The Global Small Company Portfolio invests in six Master Funds within DFAITC and one underlying fund within the Fund (each such underlying fund within the Fund, an “Underlying Fund”). The DFA Global Real Estate Securities Portfolio invests in two Underlying Funds within the Fund and directly in securities. The World ex U.S. Value Portfolio invests in three Master/Underlying Funds within the Fund, DFAITC, and DEM. The World Core Equity Portfolio and Selectively Hedged Global Equity Portfolio each invest in three Underlying Funds within the Fund. As of October 31, 2021, the following Portfolios were the owner of record of the following approximate percentages of the total outstanding shares of the following Master/Underlying Funds as detailed below:
| | | | | | |
| | | | | Percentage | |
| | | | | Ownership | |
Feeder Funds | | Master/Underlying Funds | | at 10/31/21 | |
Japanese Small Company Portfolio | | The Japanese Small Company Series | | | 11 | % |
Asia Pacific Small Company Portfolio | | The Asia Pacific Small Company Series | | | 21 | % |
United Kingdom Small Company Portfolio | | The United Kingdom Small Company Series | | | 2 | % |
Continental Small Company Portfolio | | The Continental Small Company Series | | | 13 | % |
Emerging Markets Portfolio | | The Emerging Markets Series | | | 99 | % |
Emerging Markets Small Cap Portfolio | | The Emerging Markets Small Cap Series | | | 99 | % |
Emerging Markets Value Portfolio | | Dimensional Emerging Markets Value Fund | | | 98 | % |
| | |
| | | | | Percentage | |
| | | | | Ownership | |
Funds of Funds | | Underlying Funds | | at 10/31/21 | |
International Small Company Portfolio | | The Continental Small Company Series | | | 87 | % |
| | The Japanese Small Company Series | | | 89 | % |
| | The United Kingdom Small Company Series | | | 97 | % |
| | The Asia Pacific Small Company Series | | | 79 | % |
| | The Canadian Small Company Series | | | 97 | % |
| | |
Global Small Company Portfolio | | U.S. Small Cap Portfolio | | | — | |
| | The Continental Small Company Series | | | — | |
| | The Japanese Small Company Series | | | — | |
| | The Asia Pacific Small Company Series | | | — | |
126
| | | | | | |
| | | | | Percentage | |
| | | | | Ownership | |
Funds of Funds | | Underlying Funds | | at 10/31/21 | |
| | The Canadian Small Company Series | | | — | |
| | The Emerging Markets Small Cap Series | | | — | |
| | The United Kingdom Small Company Series | | | — | |
| | |
DFA Global Real Estate Securities Portfolio* | | DFA Real Estate Securities Portfolio | | | 7 | % |
| | DFA International Real Estate Securities Portfolio | | | 61 | % |
| | |
World ex U.S. Value Portfolio | | Dimensional Emerging Markets Value Fund | | | 1 | % |
| | DFA International Small Cap Value Portfolio | | | — | |
| | The DFA International Value Series | | | 2 | % |
| | |
World Core Equity Portfolio | | U.S. Core Equity 1 Portfolio | | | 2 | % |
| | International Core Equity Portfolio | | | 1 | % |
| | Emerging Markets Core Equity Portfolio | | | — | |
| | |
Selectively Hedged Global Equity Portfolio | | U.S. Core Equity 2 Portfolio | | | 1 | % |
| | International Core Equity Portfolio | | | — | |
| | Emerging Markets Core Equity Portfolio | | | — | |
| * | DFA Global Real Estate Securities Portfolio invests in two Underlying Funds as indicated and securities listed on its Summary Schedule of Investments. |
To achieve its investment objective, each Feeder Fund and Fund of Funds invests substantially all of its assets in corresponding Master and/or Underlying Funds as indicated above. The DFA Global Real Estate Securities Portfolio may pursue its investment objective by investing its assets in its Underlying Funds and/or directly in securities of companies in the real estate industry. Each Feeder Fund and Fund of Funds also invests in short-term temporary cash investments and futures. In addition, each Fund of Funds may engage in forward currency contracts.
The financial statements of the Feeder Funds’ Master Funds are included elsewhere in this report and should be read in conjunction with the financial statements of the Feeder Funds.
B. Significant Accounting Policies:
The following significant accounting policies are in conformity with accounting principles generally accepted in the United States of America. Such policies are consistently followed by the Fund in preparation of its financial statements. The preparation of financial statements in accordance with accounting principles generally accepted in the United States of America requires management to make estimates and assumptions that affect the fair value of investments, the reported amounts of assets and liabilities, the disclosure of contingent assets and liabilities at the date of the financial statements, and the reported amounts of increases and decreases in net assets from operations during the reporting period. Actual results could differ from those estimates, and those differences could be material.
1. Security Valuation: The Portfolios use a fair value hierarchy, which prioritizes the inputs-to-valuation techniques used to measure fair value into three broad levels described below:
| | • | | Level 1 – inputs are quoted prices in active markets for identical securities (including equity securities, open-end investment companies, and futures contracts) |
| | • | | Level 2 – other significant observable inputs (including quoted prices for similar securities, interest rates, prepayment speeds, credit risk, etc.) |
| | • | | Level 3 – significant unobservable inputs (including the Portfolios’ own assumptions in determining the fair value of investments) |
127
Securities held by Large Cap International Portfolio, International Core Equity Portfolio, DFA International Real Estate Securities Portfolio, DFA Global Real Estate Securities Portfolio, DFA International Small Cap Value Portfolio, International Vector Equity Portfolio, World ex U.S. Core Equity Portfolio, Emerging Markets Core Equity Portfolio, International High Relative Profitability Portfolio and Emerging Markets Targeted Value Portfolio (the “International Equity Portfolios”), including over-the-counter securities, are valued at the last quoted sale price of the day. International equity securities are subject to a fair value factor, as described later in this note. Securities held by the International Equity Portfolios that are listed on Nasdaq are valued at the Nasdaq Official Closing Price (“NOCP”). If there is no last reported sale price or NOCP for the day, the International Equity Portfolios value the securities within the range of the most recent quoted bid and ask prices. Price information on listed securities is taken from the exchange where the security is primarily traded. Generally, securities issued by open-end management investment companies are valued using their respective net asset values or public offering prices, as appropriate, for purchase orders placed at the close of the New York Stock Exchange (NYSE). These securities are generally categorized as Level 1 in the hierarchy.
Securities for which no market quotations are readily available (including restricted securities), or for which market quotations have become unreliable, are valued in good faith at fair value in accordance with procedures adopted by the Board of Directors of the Fund. Fair value pricing may also be used if events that have a significant effect on the value of an investment (as determined in the discretion of Dimensional Fund Advisors LP) occur before the net asset value of the Portfolio is calculated. When fair value pricing is used, the prices of securities used by the International Equity Portfolios may differ from the quoted or published prices for the same securities on their primary markets or exchanges. These securities are generally categorized as Level 2 or Level 3 in the hierarchy.
The International Equity Portfolios will also apply a fair value price in the circumstances described below. Generally, trading in foreign securities markets is completed each day at various times prior to the close of the NYSE. For example, trading in the Japanese securities markets is completed each day at the close of the Tokyo Stock Exchange (normally, 2:00 a.m. ET), which is fourteen hours before the close of the NYSE (normally, 4:00 p.m. ET) and the time at which the net asset values of the International Equity Portfolios are computed. Due to the time differences between the closings of the relevant foreign securities exchanges and the pricing of the International Equity Portfolios’ shares (at the close of the NYSE), the International Equity Portfolios will fair-value their foreign investments when it is determined that the market quotations for the foreign investments are either unreliable or not readily available. The fair value prices will attempt to reflect the impact of the U.S. financial markets’ perceptions and trading activities on the International Equity Portfolios’ foreign investments since the last calculated closing prices of the foreign investments on their primary foreign securities markets or exchanges. For these purposes, the Board of Directors of the Fund has determined that movements in relevant indices or other appropriate market indicators, after the close of the Tokyo Stock Exchange or the London Stock Exchange, demonstrate that market quotations may be unreliable. Fair valuation of portfolio securities may occur on a daily basis. The fair value pricing by the International Equity Portfolios uses data furnished by an independent pricing service (and that data draws upon, among other information, the market values of foreign investments). When an International Equity Portfolio uses fair value pricing, the values assigned to the International Equity Portfolio’s foreign investments may not be the quoted or published prices of the investments on their primary markets or exchanges. These securities are generally categorized as Level 2 in the hierarchy.
Debt securities held by the Portfolios are valued on the basis of evaluated prices provided by one or more pricing services or other reasonably reliable sources including broker/dealers that typically handle the purchase and sale of such securities. Securities that are traded over-the-counter and on a stock exchange generally will be valued according to the broadest and most representative market, and it is expected that for bonds and other fixed income securities, this ordinarily will be the over-the-counter market. Securities for which quotations are not readily available (including restricted securities), or for which market quotations have become unreliable, are valued in good faith at fair value in accordance with procedures adopted by the Board of Directors of the Fund. These securities are generally categorized as Level 2 or Level 3 in the hierarchy.
Listed derivatives, such as futures, that are actively traded are valued based on quoted prices from the exchange and are categorized as Level 1 in the hierarchy. Over-the-counter derivative contracts, which include forward currency contracts, do not require material subjectivity as pricing inputs are observed from quoted markets and are categorized as Level 2 in the hierarchy.
128
Shares held by the Portfolios in other investment companies (such as the Master/Underlying Funds) are valued at their respective daily net asset values as reported by their administrator. The Feeder Funds’, International Small Company Portfolio’s, Global Small Company Portfolio’s and World ex U.S. Value Portfolio’s investments in series of either DFAITC or DEM reflect their proportionate interest in the net assets of such corresponding Master Fund(s). These valuations are classified as Level 1 in the hierarchy.
A summary of the inputs used to value the Portfolios’ investments by each major security type, industry and/or country is disclosed previously in this note. A valuation hierarchy table has been included at the end of the Summary Schedule of Portfolio Holdings/Schedule of Investments (except for the Feeder Funds). The methodology or inputs used for valuing securities are not necessarily an indication of the risk associated with investing in those securities.
2. Foreign Currency Translation: Securities and other assets and liabilities of the Portfolios whose values are initially expressed in foreign currencies are translated to U.S. dollars using the mean between the most recent bid and ask prices for the U.S. dollar as quoted by generally recognized reliable sources. To facilitate the translation, the Portfolios enter into foreign currency contracts. A foreign currency contract is a spot agreement between two parties to buy and sell currencies at current market exchange rates, for settlement generally within two business days. Dividend and interest income and certain expenses are translated to U.S. dollars at the rate of exchange on their respective accrual dates. Receivables and payables denominated in foreign currencies are marked-to-market daily based on daily exchange rates and exchange gains or losses are realized upon ultimate receipt or disbursement. The Portfolios also enter into forward currency contracts for the purpose of hedging against fluctuations in currency exchange rates. These contracts are marked-to-market daily based on daily forward exchange rates.
The International Equity Portfolios do not isolate the effect of foreign exchange rate fluctuations from the effect of fluctuations in the market prices of securities, whether realized or unrealized. However, the Selectively Hedged Global Equity Portfolio does isolate the effect of foreign currency rate fluctuations when determining the realized gain or loss upon the sale or maturity of foreign currency-denominated debt obligations pursuant to U.S. Federal income tax regulations; such amounts are categorized as foreign exchange gain or loss for income tax reporting purposes.
Realized gains or losses on foreign currency transactions represent net foreign exchange gains or losses from the disposition of foreign currencies, currency gains or losses realized between the trade and settlement dates of securities transactions, and the difference between amounts of interest, dividends and any foreign withholding taxes recorded on the books of the International Equity Portfolios and Selectively Hedged Global Equity Portfolio and the U.S. dollar equivalent amounts actually received or paid.
3. Deferred Compensation Plan: Each eligible Director of the Fund may elect to participate in the Fee Deferral Plan for Independent Directors and Trustees (the “Plan”). Under the Plan, effective January 1, 2002, such Directors may defer payment of all or a portion of their total fees earned as a Director. These deferred amounts may be treated as though such amounts had been invested in shares of the following funds: the U.S. Large Cap Value Portfolio, U.S. Core Equity 1 Portfolio, U.S. Large Company Portfolio, U.S. Vector Equity Portfolio, U.S. Micro Cap Portfolio, DFA International Value Portfolio, International Core Equity Portfolio, Emerging Markets Portfolio, Emerging Markets Core Equity Portfolio, DFA Inflation-Protected Securities Portfolio, and/or DFA Two-Year Global Fixed Income Portfolio. Contributions made under the Plan and the change in unrealized appreciation (depreciation) and income are included in Directors’/ Trustees’ Fees & Expenses.
The Directors may receive their distributions of proceeds by one of the following methods: lump sum, annual installments over a period of agreed-upon years, or quarterly installments over a period of agreed-upon years. Each Director shall have the right in a notice of election (the “Notice”) to defer the receipt of the Director’s deferred compensation until a date specified by such Director in the Notice. The date may not be sooner than the earlier of: (i) the first business day of January following the year in which such Director ceases to be a member of the Board of Directors of the Fund; and (ii) five years following the effective date of the Director’s first deferral election. If a Director who elects to defer fees fails to designate in the Notice a time or date as of which payment of the Director’s deferred fee account shall commence, payment of such amount shall commence as of the first business day of January following the year in which the Director ceases to be a member of the Board (unless the Director files an amended Notice selecting a different distribution date).
129
4. Other: Security transactions are accounted for as of the trade date. Costs used in determining realized gains and losses on the sale of investment securities/affiliated investment companies and foreign currency are accounted for on the basis of identified cost. Dividend income and distributions to shareholders are recorded on the ex-dividend date. Distributions received on securities and from the investment in affiliated investment companies that represent a return of capital or capital gains are recorded as a reduction of cost of investments or as a realized gain, respectively. The Portfolios estimate the character of received distributions that may be considered return of capital distributions. Interest income is recorded on an accrual basis. Discount and premium on debt securities purchased are amortized over the lives of the respective securities, using the effective interest method. Expenses directly attributable to a Portfolio are directly charged. Common expenses of the Fund or the Portfolios are allocated using methods approved by the Board, generally based on average net assets.
Organizational costs are expensed during the fiscal year of inception of the Portfolios. Offering costs are amortized over a twelve-month period from the inception of the Portfolios.
Class R2 Shares and Institutional Class Shares have equal rights to assets and earnings of a Portfolio. Income, gains and losses, and common expenses of a Portfolio are allocated to each class of shares based on its relative net assets. Each class will bear its own class-specific expenses, if any.
The Feeder Funds, International Small Company Portfolio, Global Small Company Portfolio, and World ex U.S. Value Portfolio recognize their pro-rata shares of net investment income and realized and unrealized gains/losses on a daily basis from their respective Master Fund(s) within DFAITC or DEM, which are treated as partnerships for federal income tax purposes.
The Portfolios may be subject to taxes imposed by countries in which they invest with respect to their investments in issuers existing or operating in such countries. Such taxes are generally based on income earned or repatriated and capital gains realized on the sale of such investments. The Portfolios accrue such taxes when the related income or capital gains are earned or throughout the holding period. Some countries require governmental approval for the repatriation of investment income, capital or the proceeds of sales earned by foreign investors. Additionally, if there is a deterioration in a country’s balance of payments or for other reasons, a country may impose temporary restrictions on foreign capital remittances abroad.
The Emerging Markets Portfolio, Emerging Markets Small Cap Portfolio, Emerging Markets Value Portfolio, World ex U.S. Core Portfolio, Emerging Markets Core Equity Portfolio and Emerging Markets Targeted Value Portfolio are subject to tax on short-term and long-term capital gains for investments in India. Such taxes are accrued on a daily basis and due upon sale of individual securities.
C. Investment Advisor:
The Advisor, Dimensional Fund Advisors LP, provides investment management services to the Portfolios. For the year ended October 31, 2021, the Portfolios’ investment management fees were accrued daily and paid monthly to the Advisor based on the following effective annual rates of average daily net assets:
| | | | |
Large Cap International Portfolio | | | 0.15 | %* |
International Core Equity Portfolio | | | 0.21 | %* |
Global Small Company Portfolio | | | 0.41 | %* |
International Small Company Portfolio | | | 0.32 | %* |
Japanese Small Company Portfolio | | | 0.42 | %* |
Asia Pacific Small Company Portfolio | | | 0.42 | %* |
United Kingdom Small Company Portfolio | | | 0.42 | %* |
Continental Small Company Portfolio | | | 0.42 | %* |
DFA International Real Estate Securities Portfolio | | | 0.24 | % |
DFA Global Real Estate Securities Portfolio | | | 0.20 | % |
130
| | | | |
DFA International Small Cap Value Portfolio | | | 0.50 | %* |
International Vector Equity Portfolio | | | 0.37 | %* |
International High Relative Profitability Portfolio | | | 0.25 | % |
World ex U.S. Value Portfolio | | | 0.39 | %* |
World ex U.S. Core Equity Portfolio | | | 0.26 | %* |
World Core Equity Portfolio | | | 0.23 | %* |
Selectively Hedged Global Equity Portfolio | | | 0.25 | %* |
Emerging Markets Portfolio | | | 0.32 | %* |
Emerging Markets Small Cap Portfolio | | | 0.55 | %* |
Emerging Markets Value Portfolio | | | 0.42 | %* |
Emerging Markets Core Equity Portfolio | | | 0.36 | %* |
Emerging Markets Targeted Value Portfolio | | | 0.56 | %* |
| * | Effective as of February 28, 2021, the management fees payable by the following Portfolios were reduced as follows: |
| | | | | | | | |
| | | Management Fee Prior to | | | Management Fee Effective | |
| Portfolio | | February 28, 2021 | | | February 28, 2021 | |
Large Cap International Portfolio | | | 0.18 | % | | | 0.14 | % |
International Core Equity Portfolio | | | 0.24 | % | | | 0.20 | % |
Global Small Company Portfolio | | | 0.43 | % | | | 0.40 | % |
International Small Company Portfolio | | | 0.38 | % | | | 0.30 | % |
Japanese Small Company Portfolio | | | 0.47 | % | | | 0.40 | % |
Asia Pacific Small Company Portfolio | | | 0.47 | % | | | 0.40 | % |
United Kingdom Small Company Portfolio | | | 0.47 | % | | | 0.40 | % |
Continental Small Company Portfolio | | | 0.47 | % | | | 0.40 | % |
DFA International Small Cap Value Portfolio | | | 0.60 | % | | | 0.45 | % |
International Vector Equity Portfolio | | | 0.42 | % | | | 0.35 | % |
World ex U.S. Value Portfolio | | | 0.43 | % | | | 0.37 | % |
World ex U.S. Core Equity Portfolio | | | 0.29 | % | | | 0.25 | % |
World Core Equity Portfolio | | | 0.27 | % | | | 0.22 | % |
Selectively Hedged Global Equity Portfolio | | | 0.28 | % | | | 0.24 | % |
Emerging Markets Portfolio | | | 0.37 | % | | | 0.29 | % |
Emerging Markets Small Cap Portfolio | | | 0.60 | % | | | 0.52 | % |
Emerging Markets Value Portfolio | | | 0.45 | % | | | 0.41 | % |
Emerging Markets Core Equity Portfolio | | | 0.42 | % | | | 0.33 | % |
Emerging Markets Targeted Value Portfolio | | | 0.65 | % | | | 0.52 | % |
Pursuant to Amended and Restated Fee Waiver and/or Expense Assumption Agreements (each, a “Fee Waiver Agreement”), the Advisor has contractually agreed to waive certain fees, and in certain instances, assume certain expenses of the Portfolios, as described in the notes below. The Fee Waiver Agreements for the non-Feeder Funds, and a portion of the Fee Waiver Agreement for certain Feeder Funds below, will remain in effect through February 28, 2022, may only be terminated by the Fund’s Board of Directors prior to that date and shall continue in effect from year to year thereafter unless terminated by the Fund or the Advisor. The Fee Waiver Agreement with respect to the total management fees paid by the Feeder Funds, as described in the notes below, will remain in effect permanently, unless terminated by a Feeder Fund. During the year ended October 31, 2021, the Portfolios had expense limits based on a percentage of average net assets on an annualized basis, and the Advisor recovered previously waived fees and/or assumed expenses (amounts in thousands), as listed below. The net amount of waived fees/expenses assumed (recovered previously waived fees/expenses assumed) during the year ended October 31, 2021, and the previously waived fees/expenses assumed subject to future recovery by the Advisor as of October 31, 2021, are also reflected below (amounts in thousands). At any time that the Portfolio Expenses (defined below) of a class of a Portfolio are less than the applicable Expense Limitation Amount/Total Management Fee Limit listed below, the Advisor retains the right to recover fees previously waived and/or expenses previously assumed to the extent that the expense ratio following such recovery would be less than the Expense Limitation Amount/Total Management Fee
131
Limit that was in place when such prior year fees were waived and/or expenses assumed, and less than the current Expense Limitation Amount/Total Management Fee Limit in place for the Portfolio. The Advisor, however, will not be reimbursed by a Feeder Portfolio in connection with its Permanent Fee Waiver. The Fund, on behalf of a Portfolio, is also not obligated to reimburse the Advisor for fees previously waived or expenses previously assumed by the Advisor more than thirty-six months before the date of recovery. With respect to the World ex U.S. Value Portfolio, World Core Equity Portfolio and Selectively Hedged Global Equity Portfolio, the Advisor shall also not be reimbursed for any management fees previously waived to offset a Portfolio’s proportionate share of the management fees paid by such Portfolio through its investment in other funds managed by the Advisor.
| | | | | | | | | | | | | | | | | | | | |
| | | | | | | | | | | | | | | Previously | |
| | | | | | | | | Recovery | | | | | | Waived Fees/ | |
| | | Expense | | | Total | | | of Previously | | | Waived Fees/ | | | Expenses Assumed | |
| | | Limitation | | | Management | | | Waived Fees/ | | | Expenses | | | Subject to Future | |
Institutional Class Shares | | Amount | | | Fee Limit | | | Expenses Assumed | | | Assumed | | | Recovery | |
Large Cap International Portfolio (1) | | | 0.24 | % | | | — | | | | — | | | | — | | | | — | |
International Core Equity Portfolio (1) | | | 0.30 | % | | | — | | | $ | 183 | | | | — | | | | — | |
Global Small Company Portfolio (2) | | | 0.47 | % | | | — | | | | 31 | | | $ | 221 | | | $ | 530 | |
International Small Company Portfolio (3) | | | 0.45 | % | | | — | | | | — | | | | — | | | | — | |
Japanese Small Company Portfolio (4) | | | 0.47 | % | | | 0.40 | % | | | — | | | | 473 | | | | — | |
Asia Pacific Small Company Portfolio (4) | | | 0.47 | % | | | 0.40 | % | | | — | | | | 436 | | | | — | |
United Kingdom Small Company Portfolio (4) | | | 0.47 | % | | | 0.40 | % | | | 57 | | | | 54 | | | | 42 | |
Continental Small Company Portfolio (4) | | | 0.47 | % | | | 0.40 | % | | | — | | | | 769 | | | | — | |
DFA International Real Estate Securities Portfolio (1) | | | 0.29 | % | | | — | | | | — | | | | — | | | | — | |
DFA Global Real Estate Securities Portfolio (5) | | | 0.24 | % | | | — | | | | 26 | | | | 9,038 | | | | 26,057 | |
International Vector Equity Portfolio (1) | | | 0.60 | % | | | — | | | | — | | | | — | | | | — | |
International High Relative Profitability Portfolio (2) | | | 0.35 | % | | | — | | | | — | | | | — | | | | — | |
World ex U.S. Value Portfolio (6) | | | 0.60 | % | | | 0.37 | % | | | — | | | | 564 | | | | — | |
World ex U.S. Core Equity Portfolio (7) | | | 0.39 | % | | | — | | | | — | | | | — | | | | — | |
World Core Equity Portfolio (8) | | | 0.27 | % | | | 0.22 | % | | | 129 | | | | 2,035 | | | | 595 | |
Selectively Hedged Global Equity Portfolio (9) | | | 0.40 | % | | | 0.24 | % | | | — | | | | 722 | | | | — | |
Emerging Markets Portfolio (10) | | | 0.49 | % | | | 0.29 | % | | | — | | | | 6,401 | | | | — | |
Emerging Markets Small Cap Portfolio (11) | | | — | | | | 0.52 | % | | | — | | | | 10,859 | | | | — | |
Emerging Markets Value Portfolio (11) | | | — | | | | 0.41 | % | | | — | | | | 14,397 | | | | — | |
132
| | | | | | | | | | | | | | | | | | | | |
| | | | | | | | | | | | | | | Previously | |
| | | | | | | | | Recovery | | | | | | Waived Fees/ | |
| | | Expense | | | Total | | | of Previously | | | Waived Fees/ | | | Expenses Assumed | |
| | | Limitation | | | Management | | | Waived Fees/ | | | Expenses | | | Subject to Future | |
Institutional Class Shares | | Amount | | | Fee Limit | | | Expenses Assumed | | | Assumed | | | Recovery | |
Emerging Markets Core Equity Portfolio (1) | | | 0.54 | % | | | — | | | | — | | | | — | | | | — | |
Emerging Markets Targeted Value Portfolio (2) | | | 0.85 | % | | | — | | | $ | 135 | | | | — | | | | — | |
Class R2 Shares | | | | | | | | | | | | | | | | | | | | |
Emerging Markets Value Portfolio (12) | | | 0.96 | % | | | 0.41 | % | | | — | | | $ | 15 | | | | — | |
| (1) | The Advisor has contractually agreed to waive all or a portion of its management fee and assume each Portfolio’s ordinary operating expenses (excluding the expenses a Portfolio incurs indirectly through investment in other investment companies) (“Portfolio Expenses”) to the extent necessary to limit the Portfolio Expenses of each Portfolio to the rates listed above as a percentage of average net assets on an annualized basis (the “Expense Limitation Amount”). The Fee Waiver Agreement for the Large Cap International Portfolio became effective on January 1, 2017. In addition, prior to January 1, 2017, the Advisor had contractually agreed to waive all or a portion of its management fee and assume each of the International Core Equity Portfolio’s and Emerging Markets Core Equity Portfolio’s Portfolio Expenses to the extent necessary to limit the Portfolio Expenses of each such Portfolio to 0.49% and 0.85%, respectively, as a percentage of average net assets on an annualized basis. |
| (2) | The Advisor has contractually agreed to waive all or a portion of its management fee and to assume the ordinary operating expenses of a class of the Portfolio (including the expenses that the Portfolio bears as a shareholder of other funds managed by the Advisor, excluding money market funds, but excluding the expenses that the Portfolio incurs indirectly through its investment in unaffiliated investment companies) (“Portfolio Expenses”) to the extent necessary to limit the Portfolio Expenses of a class of the Portfolio to the rate listed above as a percentage of the average net assets of a class of the Portfolio on an annualized basis (the “Expense Limitation Amount”). |
| (3) | The Advisor has contractually agreed to waive all or a portion of its management fee and to assume the other direct expenses of a class of the Portfolio (excluding expenses incurred through its investment in other investment companies) (“Portfolio Expenses”) to the extent necessary to limit the Portfolio Expenses of a class of the Portfolio to the rate listed above as a percentage of the average net assets of a class of the Portfolio on an annualized basis (the “Expense Limitation Amount”). |
| (4) | Effective February 28, 2021, the Advisor has contractually agreed to permanently waive all or a portion of the management fee of each Portfolio to the extent necessary to limit the total management fees paid to the Advisor by each Portfolio, including the proportionate share of the management fees a Portfolio pays indirectly through its investment in other funds managed by the Advisor, except for the fees paid indirectly through its investment of securities lending cash collateral in the Money Market Series, to 0.40% of the average net assets of a class of a Portfolio on an annualized basis (the “Permanent Fee Waiver”). From February 28, 2020 to February 27, 2021, the Permanent Fee Waiver Limit was 0.47%. From July 21, 2015 to February 27, 2020, the Permanent Fee Waiver Limit was 0.50%. In addition to the Permanent Fee Waiver, the Advisor has contractually agreed to further waive all or a portion of its management fee and to assume the other direct expenses of a class of each Portfolio (excluding expenses incurred through its investment in other investment companies managed by the Advisor) (“Portfolio Expenses”) to the extent necessary to limit the Portfolio Expenses of each class of a Portfolio to the rates listed above as a percentage of the average net assets of a class of a Portfolio on an annualized basis (the “Expense Limitation Amount”). |
| (5) | The Advisor has contractually agreed to waive all or a portion of its management fee and to assume the expenses of the Portfolio (including the expenses that the Portfolio bears as a shareholder of its Master/Underlying Funds but excluding the expenses that the Portfolio incurs indirectly through investment of its securities lending cash collateral in the Money Market Series and its investment in unaffiliated investment companies) (“Portfolio Expenses”) to the extent necessary to limit the Portfolio Expenses of the Portfolio to the rate listed above as a percentage of the Portfolio’s average net assets on an annualized basis (the “Expense Limitation Amount”). |
| (6) | Effective February 28, 2021, the Advisor has contractually agreed to waive up to the full amount of the Portfolio’s management fee of 0.37% to the extent necessary to offset the proportionate share of the management fees paid by the Portfolio through its investment in its Master/Underlying Funds, except for the fees paid through its investment of securities lending cash collateral in the Money Market Series (the Total Management Fee Limit ). From February 28, 2020 to February 27, 2021, the Total Management Fee Limit was 0.43%. Prior to February 28, 2020, the Total Management Fee Limit was 0.47%. In addition, under the Fee Waiver Agreement, the Advisor also has agreed to waive all or a portion of the management fee that remains payable by the Portfolio (i.e., the management fee remaining after the proportionate share of the Master/Underlying Funds’ management fees have been offset (the “Remaining Management Fee”)) to the extent necessary to reduce the Portfolio’s ordinary operating expenses (including expenses incurred through its investment in other investment companies but excluding the expenses that the Portfolio incurs indirectly through investment of its securities lending cash collateral in the Money Market Series) (“Portfolio Expenses”) to the rate listed above as a percentage of average net assets on an annualized basis (the “Expense Limitation Amount”). The maximum amount that may be waived to limit Portfolio Expenses is the amount of the Remaining Management Fee. |
| (7) | The Advisor has contractually agreed to waive all or a portion of its management fee and to assume the expenses of a class of the Portfolio (including the expenses that the Portfolio bears as a shareholder of its Master/ Underlying Funds but excluding the expenses that the Portfolio incurs indirectly through its investment of its securities lending cash collateral in the Money Market Series and its investment in unaffiliated investment companies) (“Portfolio Expenses”) to the extent necessary to limit the Portfolio Expenses of a class of the Portfolio to the rate listed above as a percentage of average net assets of a class of the Portfolio on an annualized basis (the “Expense Limitation Amount”). |
| (8) | Effective February 28, 2021, the Advisor has contractually agreed to waive up to the full amount of the Portfolio’s management fee of 0.22% to the extent necessary to offset the proportionate share of the management fees paid by the Portfolio through its investment in its Master/Underlying Funds, except for the fees paid through its investment of securities lending cash collateral in the Money Market Series |
133
| | (including the Portfolio’s proportionate share of any management fees that a Master/Underlying Fund paid through its investment in an affiliated cash management fund) (the “Total Management Fee Limit”). From February 28, 2020 to February 27, 2021, the Total Management Fee Limit was 0.27%. Prior to February 28, 2020, the Total Management Fee Limit was 0.30%. In addition, under the Fee Waiver Agreement, the Advisor has also agreed to assume the expenses of a class of the Portfolio to the extent necessary to reduce the ordinary operating expenses (including expenses incurred through its investment in other investment companies but excluding the expenses that the Portfolio incurs indirectly through investment of its securities lending cash collateral in the Money Market Series) (“Portfolio Expenses”) of a class of the Portfolio so that such Portfolio Expenses do not exceed the rate listed above as a percentage of the average net assets of a class of the Portfolio on an annualized basis (the “Expense Limitation Amount”). From February 28, 2019 to February 27, 2021, the Expense Limitation Amount was 0.32% of the average net assets of such class of the Portfolio on an annualized basis. From June 27, 2014 to February 27, 2019, the Expense Limitation Amount was 0.35% of the average net assets of such class of the Portfolio on an annualized basis. |
| (9) | Effective February 28, 2021, the Advisor has contractually agreed to waive up to the full amount of the Portfolio’s management fee of 0.24% to the extent necessary to offset the proportionate share of the management fees paid by the Portfolio through its investment in its Master/Underlying Funds, except for the fees paid through its investment of securities lending cash collateral in the Money Market Series (the “Total Management Fee Limit”). From February 28, 2020 to February 27, 2021, the Total Management Fee Limit was 0.28%. Prior to February 28, 2020, the Total Management Fee Limit was 0.30%. In addition, under the Fee Waiver Agreement, the Advisor has also agreed to waive all or a portion of the management fee and to assume the expenses of a class of the Portfolio to the extent necessary to reduce the ordinary operating expenses (including expenses incurred through its investment in other investment companies but excluding the expenses that the Portfolio incurs indirectly through investment of its securities lending cash collateral in the Money Market Series) (“Portfolio Expenses”) of the Portfolio to the rate listed above as a percentage of average net assets of a class of the Portfolio on an annualized basis (the “Expense Limitation Amount”). |
| (10) | Effective February 28, 2021, the Advisor has contractually agreed to permanently waive all or a portion of the management fee of the Portfolio to the extent necessary to limit the total management fees paid to the Advisor by the Portfolio, including the proportionate share of the management fees the Portfolio pays indirectly through its investment in other funds managed by the Advisor, except for the fees paid indirectly through its investment of securities lending cash collateral in the Money Market Series, to 0.29% of the average net assets of a class of the Portfolio on an annualized basis (the “Permanent Fee Waiver”). From February 28, 2020 to February 27, 2021, the Permanent Fee Waiver Limit was 0.37%. From July 21, 2015 to February 27, 2020, the Permanent Fee Waiver Limit was 0.42%. Effective January 1, 2017, in addition to the Permanent Fee Waiver, the Advisor has contractually agreed to further waive all or a portion of its management fee and to assume the other direct expenses of a class of the Portfolio (excluding expenses incurred through its investment in other investment companies managed by the Advisor) (“Portfolio Expenses”) to the extent necessary to limit the Portfolio Expenses of each class of the Portfolio to the rate listed above as a percentage of the average net assets of a class of the Portfolio on an annualized basis (the “Expense Limitation Amount”). |
| (11) | Effective February 28, 2021, the Advisor has contractually agreed to permanently waive all or a portion of the management fee of each Portfolio to the extent necessary to limit the total management fees paid to the Advisor by a Portfolio, including the proportionate share of the management fees a Portfolio pays indirectly through its investment in other funds managed by the Advisor, except for the fees paid indirectly through its investment of securities lending cash collateral in The DFA Short Term Investment Fund (the “Money Market Series”), to the rate listed above as a percentage of the average net assets of a class of a Portfolio on an annualized basis (the “Permanent Fee Waiver”). From February 28, 2020 to February 27, 2021, the Permanent Fee Waiver Limits for the Emerging Markets Small Cap Portfolio and Emerging Markets Value Portfolio were 0.60% and 0.45%, respectively. From July 21, 2015 to February 27, 2020, the Permanent Fee Waiver Limits for the Emerging Markets Small Cap Portfolio and Emerging Markets Value Portfolio were 0.65% and 0.50%, respectively. |
| (12) | Effective February 28, 2021, the Advisor has contractually agreed to permanently waive all or a portion of the management fee of the Portfolio to the extent necessary to limit the total management fees paid to the Advisor by the Portfolio, including the proportionate share of the management fees the Portfolio pays indirectly through its investment in other funds managed by the Advisor, except for the fees paid indirectly through its investment of securities lending cash collateral in the Money Market Series, to 0.41% of the average net assets of a class of the Portfolio on an annualized basis (the “Permanent Fee Waiver”). From February 28, 2020 to February 27, 2021, the Permanent Fee Waiver Limit was 0.45%. From July 21, 2015 to February 27, 2020, the Permanent Fee Waiver Limit was 0.50%. In addition to the Permanent Fee Waiver, the Advisor has contractually agreed to assume the direct expenses of the Class R2 shares of the Portfolio (excluding management fees and custodian fees) to the extent necessary to limit the annualized expenses of the Class R2 shares of the Portfolio (excluding the expenses the Portfolio incurs indirectly through investment in other investment companies) to the rate listed above as a percentage of the average net assets of the Class R2 shares of the Portfolio (the “Annualized Expense Ratio”). |
Earned Income Credit:
Additionally, Portfolios have entered into arrangements with their custodian whereby net interest earned on uninvested cash balances was used to reduce a portion of the Portfolios’ custody expenses. Custody expense in the accompanying financial statements is presented before reduction for credits. The impact of such credits is generally less than one basis point of each Portfolio’s net assets. During the year ended October 31, 2021, expenses reduced were as follows (amounts in thousands):
| | | | |
| | | Fees Paid | |
| | | Indirectly | |
Large Cap International Portfolio | | $ | 15 | |
International Core Equity Portfolio | | | 245 | |
Global Small Company Portfolio | | | — | |
DFA International Real Estate Securities Portfolio | | | 219 | |
DFA Global Real Estate Securities Portfolio | | | 3 | |
DFA International Small Cap Value Portfolio | | | 46 | |
134
| | | | |
| | | Fees Paid
Indirectly | |
International Vector Equity Portfolio | | $ | 5 | |
International High Relative Profitability Portfolio | | | 11 | |
World ex U.S. Value Portfolio | | | — | |
World ex U.S. Core Equity Portfolio | | | 9 | |
Selectively Hedged Global Equity Portfolio | | | 1 | |
Emerging Markets Core Equity Portfolio | | | 148 | |
Emerging Markets Targeted Value Portfolio | | | 2 | |
Fees Paid to Officers and Directors/Trustees:
Certain Officers and Directors of the Advisor are also Officers and Directors of the Fund; however, such Officers and Directors (with the exception of the Chief Compliance Officer (“CCO”)) receive no compensation from the Fund. For the year ended October 31, 2021, the total related amount paid by the Fund to the CCO was $133 (in thousands). The total related amounts paid by each of the Portfolios are included in Other Expenses on the Statements of Operations.
D. Deferred Compensation:
As of October 31, 2021, the total liability for deferred compensation to Directors is included in Accrued Expenses and Other Liabilities on the Statements of Assets and Liabilities as follows (amounts in thousands):
| | | | |
Large Cap International Portfolio | | $ | 131 | |
International Core Equity Portfolio | | | 560 | |
Global Small Company Portfolio | | | 1 | |
International Small Company Portfolio | | | 349 | |
Japanese Small Company Portfolio | | | 15 | |
Asia Pacific Small Company Portfolio | | | 11 | |
United Kingdom Small Company Portfolio | | | 1 | |
Continental Small Company Portfolio | | | 12 | |
DFA International Real Estate Securities Portfolio | | | 113 | |
DFA Global Real Estate Securities Portfolio | | | 140 | |
DFA International Small Cap Value Portfolio | | | 443 | |
International Vector Equity Portfolio | | | 58 | |
International High Relative Profitability Portfolio | | | 15 | |
World ex U.S. Value Portfolio | | | 5 | |
World ex U.S. Core Equity Portfolio | | | 49 | |
World Core Equity Portfolio | | | 11 | |
Selectively Hedged Global Equity Portfolio | | | 6 | |
Emerging Markets Portfolio | | | 171 | |
Emerging Markets Small Cap Portfolio | | | 149 | |
Emerging Markets Value Portfolio | | | 575 | |
Emerging Markets Core Equity Portfolio | | | 562 | |
Emerging Markets Targeted Value Portfolio | | | 2 | |
135
E. Purchases and Sales of Securities:
For the year ended October 31, 2021, the Portfolios’ transactions related to investment securities, other than short-term securities, in-kind redemptions and U.S. government securities (amounts in thousands), were as follows:
| | | | | | | | |
| | | Purchases | | | Sales | |
Large Cap International Portfolio | | $ | 760,745 | | | $ | 920,316 | |
International Core Equity Portfolio | | $ | 3,297,695 | | | $ | 2,389,163 | |
DFA International Real Estate Securities Portfolio | | $ | 479,799 | | | $ | 465,185 | |
DFA Global Real Estate Securities Portfolio | | $ | 444,129 | | | $ | 44,271 | |
DFA International Small Cap Value Portfolio | | $ | 1,790,234 | | | $ | 2,589,583 | |
International Vector Equity Portfolio | | $ | 504,971 | | | $ | 561,230 | |
International High Relative Profitability Portfolio | | $ | 557,166 | | | $ | 286,057 | |
World ex U.S. Core Equity Portfolio | | $ | 224,877 | | | $ | 367,855 | |
Emerging Markets Core Equity Portfolio | | $ | 2,983,183 | | | $ | 4,376,483 | |
Emerging Markets Targeted Value Portfolio | | $ | 68,912 | | | $ | 65,297 | |
There were no purchases or sales of long-term U.S. government securities.
For the year ended October 31, 2021, transactions related to Affiliated Investment Companies, excluding in-kind redemptions, are presented below.
The amounts presented below may differ from the respective amounts presented in the corresponding Schedule of Investments/Summary Schedule of Portfolio Holdings, Statements of Assets and Liabilities or Statements of Operations due to rounding. The amounts are as follows (amounts in thousands):
| | | | | | | | | | | | | | | | | | | | | | | | | | | | | | | | | | | | |
| | | Balance at
October 31, 2020 | | | Purchases
at Cost | | | Proceeds
from
Sales | | | Net Realized
Gain/(Loss)
on Sales | | | Change in
Unrealized
Appreciation/
Depreciation | | | Balance at
October 31, 2021 | | | Shares as of
October 31, 2021 | | | Dividend
Income | | | Capital Gain
Distributions | |
Large Cap International Portfolio | | | | | | | | | | | | | | | | | | | | | | | | | | | | | | | | | | | | |
The DFA Short Term Investment Fund | | $ | 174,366 | | | $ | 1,590,749 | | | $ | 1,463,971 | | | $ | (10 | ) | | $ | (9 | ) | | $ | 301,125 | | | | 26,026 | | | $ | 147 | | | | — | |
| | | | | | | | | | | | | | | | | | | | | | | | | | | | | | | | | | | | |
Total | | $ | 174,366 | | | $ | 1,590,749 | | | $ | 1,463,971 | | | $ | (10 | ) | | $ | (9 | ) | | $ | 301,125 | | | | 26,026 | | | $ | 147 | | | | — | |
| | | | | | | | | | | | | | | | | | | | | | | | | | | | | | | | | | | | |
International Core Equity Portfolio | | | | | | | | | | | | | | | | | | | | | | | | | | | | | | | | | | | | |
The DFA Short Term Investment Fund | | $ | 1,094,988 | | | $ | 6,232,681 | | | $ | 5,732,569 | | | $ | (21 | ) | | $ | (71 | ) | | $ | 1,595,008 | | | | 137,857 | | | $ | 901 | | | | — | |
| | | | | | | | | | | | | | | | | | | | | | | | | | | | | | | | | | | | |
Total | | $ | 1,094,988 | | | $ | 6,232,681 | | | $ | 5,732,569 | | | $ | (21 | ) | | $ | (71 | ) | | $ | 1,595,008 | | | | 137,857 | | | $ | 901 | | | | — | |
| | | | | | | | | | | | | | | | | | | | | | | | | | | | | | | | | | | | |
Global Small Company Portfolio | | | | | | | | | | | | | | | | | | | | | | | | | | | | | | | | | | | | |
U.S. Small Cap Portfolio | | $ | 24,896 | | | $ | 23,482 | | | $ | 4,842 | | | $ | 336 | | | $ | 14,525 | | | $ | 58,397 | | | | 1,204 | | | $ | 505 | | | | — | |
| | | | | | | | | | | | | | | | | | | | | | | | | | | | | | | | | | | | |
Total | | $ | 24,896 | | | $ | 23,482 | | | $ | 4,842 | | | $ | 336 | | | $ | 14,525 | | | $ | 58,397 | | | | 1,204 | | | $ | 505 | | | | — | |
| | | | | | | | | | | | | | | | | | | | | | | | | | | | | | | | | | | | |
DFA International Real Estate Securities Portfolio | | | | | | | | | | | | | | | | | | | | | | | | | | | | | | | | | | | | |
The DFA Short Term Investment Fund | | $ | 379,347 | | | $ | 3,575,577 | | | $ | 3,644,333 | | | $ | (43 | ) | | $ | (2 | ) | | $ | 310,546 | | | | 26,841 | | | $ | 197 | | | | — | |
| | | | | | | | | | | | | | | | | | | | | | | | | | | | | | | | | | | | |
Total | | $ | 379,347 | | | $ | 3,575,577 | | | $ | 3,644,333 | | | $ | (43 | ) | | $ | (2 | ) | | $ | 310,546 | | | | 26,841 | | | $ | 197 | | | | — | |
| | | | | | | | | | | | | | | | | | | | | | | | | | | | | | | | | | | | |
136
| | | | | | | | | | | | | | | | | | | | | | | | | | | | | | | | | | | | |
| | | Balance at
October 31, 2020 | | | Purchases
at Cost | | | Proceeds
from
Sales | | | Net Realized
Gain/(Loss)
on Sales | | | Change in
Unrealized
Appreciation/
Depreciation | | | Balance at
October 31, 2021 | | | Shares as of
October 31, 2021 | | | Dividend
Income | | | Capital Gain
Distributions | |
DFA Global Real Estate Securities Portfolio | | | | | | | | | | | | | | | | | | | | | | | | | | | | | | | | | | | | |
DFA International Real Estate Securities Portfolio | | $ | 2,587,797 | | | $ | 364,344 | | | $ | 151,100 | | | $ | (26,491 | ) | | $ | 892,154 | | | $ | 3,666,704 | | | | 727,521 | | | | — | | | | — | |
DFA Real Estate Securities Portfolio | | | 720,976 | | | | — | | | | 174,066 | | | | 87,490 | | | | 205,211 | | | | 839,611 | | | | 17,170 | | | $ | 21,150 | | | $ | 1,045 | |
The DFA Short Term Investment Fund | | | 72,156 | | | | 789,441 | | | | 644,538 | | | | (7 | ) | | | (7 | ) | | | 217,045 | | | | 18,759 | | | | 64 | | | | — | |
| | | | | | | | | | | | | | | | | | | | | | | | | | | | | | | | | | | | |
Total | | $ | 3,380,929 | | | $ | 1,153,785 | | | $ | 969,704 | | | $ | 60,992 | | | $ | 1,097,358 | | | $ | 4,723,360 | | | | 763,450 | | | $ | 21,214 | | | $ | 1,045 | |
| | | | | | | | | | | | | | | | | | | | | | | | | | | | | | | | | | | | |
DFA International Small Cap Value Portfolio | | | | | | | | | | | | | | | | | | | | | | | | | | | | | | | | | | | | |
The DFA Short Term Investment Fund | | $ | 419,762 | | | $ | 1,651,783 | | | $ | 1,687,928 | | | $ | (1 | ) | | $ | (25 | ) | | $ | 383,591 | | | | 33,154 | | | $ | 241 | | | | — | |
| | | | | | | | | | | | | | | | | | | | | | | | | | | | | | | | | | | | |
Total | | $ | 419,762 | | | $ | 1,651,783 | | | $ | 1,687,928 | | | $ | (1 | ) | | $ | (25 | ) | | $ | 383,591 | | | | 33,154 | | | $ | 241 | | | | — | |
| | | | | | | | | | | | | | | | | | | | | | | | | | | | | | | | | | | | |
International Vector Equity Portfolio | | | | | | | | | | | | | | | | | | | | | | | | | | | | | | | | | | | | |
The DFA Short Term Investment Fund | | $ | 123,777 | | | $ | 653,553 | | | $ | 634,327 | | | $ | (7 | ) | | $ | (8 | ) | | $ | 142,988 | | | | 12,359 | | | $ | 94 | | | | — | |
| | | | | | | | | | | | | | | | | | | | | | | | | | | | | | | | | | | | |
Total | | $ | 123,777 | | | $ | 653,553 | | | $ | 634,327 | | | $ | (7 | ) | | $ | (8 | ) | | $ | 142,988 | | | | 12,359 | | | $ | 94 | | | | — | |
| | | | | | | | | | | | | | | | | | | | | | | | | | | | | | | | | | | | |
International High Relative Profitability Portfolio | | | | | | | | | | | | | | | | | | | | | | | | | | | | | | | | | | | | |
The DFA Short Term Investment Fund | | $ | 48,097 | | | $ | 751,910 | | | $ | 703,703 | | | $ | (6 | ) | | $ | (2 | ) | | $ | 96,296 | | | | 8,323 | | | | — | | | | — | |
| | | | | | | | | | | | | | | | | | | | | | | | | | | | | | | | | | | | |
Total | | $ | 48,097 | | | $ | 751,910 | | | $ | 703,703 | | | $ | (6 | ) | | $ | (2 | ) | | $ | 96,296 | | | | 8,323 | | | | — | | | | — | |
| | | | | | | | | | | | | | | | | | | | | | | | | | | | | | | | | | | | |
World ex U.S. Value Portfolio | | | | | | | | | | | | | | | | | | | | | | | | | | | | | | | | | | | | |
DFA International Small Cap Value Portfolio | | $ | 18,901 | | | $ | 7,152 | | | $ | 6,799 | | | $ | 252 | | | $ | 7,908 | | | $ | 27,414 | | | | 1,238 | | | $ | 549 | | | | — | |
| | | | | | | | | | | | | | | | | | | | | | | | | | | | | | | | | | | | |
Total | | $ | 18,901 | | | $ | 7,152 | | | $ | 6,799 | | | $ | 252 | | | $ | 7,908 | | | $ | 27,414 | | | | 1,238 | | | $ | 549 | | | | — | |
| | | | | | | | | | | | | | | | | | | | | | | | | | | | | | | | | | | | |
World ex U.S. Core Equity Portfolio | | | | | | | | | | | | | | | | | | | | | | | | | | | | | | | | | | | | |
The DFA Short Term Investment Fund | | $ | 119,096 | | | $ | 626,628 | | | $ | 601,163 | | | $ | (2 | ) | | $ | (5 | ) | | $ | 144,554 | | | | 12,494 | | | $ | 87 | | | | — | |
| | | | | | | | | | | | | | | | | | | | | | | | | | | | | | | | | | | | |
Total | | $ | 119,096 | | | $ | 626,628 | | | $ | 601,163 | | | $ | (2 | ) | | $ | (5 | ) | | $ | 144,554 | | | | 12,494 | | | $ | 87 | | | | — | |
| | | | | | | | | | | | | | | | | | | | | | | | | | | | | | | | | | | | |
137
| | | | | | | | | | | | | | | | | | | | | | | | | | | | | | | | | | | | |
| | | Balance at
October 31, 2020 | | | Purchases
at Cost | | | Proceeds
from
Sales | | | Net Realized
Gain/(Loss)
on Sales | | | Change in
Unrealized
Appreciation/
Depreciation | | | Balance at
October 31, 2021 | | | Shares as of
October 31, 2021 | | | Dividend
Income | | | Capital Gain
Distributions | |
World Core Equity Portfolio | | | | | | | | | | | | | | | | | | | | | | | | | | | | | | | | | | | | |
U.S. Core Equity 1 Portfolio | | $ | 436,142 | | | $ | 78,579 | | | $ | 60,974 | | | $ | 8,638 | | | $ | 180,788 | | | $ | 643,173 | | | | 17,743 | | | $ | 7,321 | | | | — | |
International Core Equity Portfolio | | | 230,682 | | | | 45,577 | | | | 41,748 | | | | 1,241 | | | | 79,766 | | | | 315,518 | | | | 19,310 | | | | 7,024 | | | | — | |
Emerging Markets Core Equity Portfolio | | | 102,184 | | | | 20,360 | | | | 15,550 | | | | 673 | | | | 23,393 | | | | 131,060 | | | | 5,209 | | | | 2,586 | | | | — | |
| | | | | | | | | | | | | | | | | | | | | | | | | | | | | | | | | | | | |
Total | | $ | 769,008 | | | $ | 144,516 | | | $ | 118,272 | | | $ | 10,552 | | | $ | 283,947 | | | $ | 1,089,751 | | | | 42,262 | | | $ | 16,931 | | | | — | |
| | | | | | | | | | | | | | | | | | | | | | | | | | | | | | | | | | | | |
Selectively Hedged Global Equity Portfolio | | | | | | | | | | | | | | | | | | | | | | | | | | | | | | | | | | | | |
U.S. Core Equity 2 Portfolio | | $ | 147,786 | | | $ | 14,404 | | | $ | 37,969 | | | $ | 9,881 | | | $ | 53,077 | | | $ | 187,179 | | | | 5,645 | | | $ | 2,172 | | | | — | |
International Core Equity Portfolio | | | 79,764 | | | | 9,174 | | | | 22,426 | | | | 3,250 | | | | 24,158 | | | | 93,920 | | | | 5,748 | | | | 2,181 | | | | — | |
Emerging Markets Core Equity Portfolio | | | 57,734 | | | | 10,596 | | | | 19,407 | | | | 2,480 | | | | 11,453 | | | | 62,856 | | | | 2,498 | | | | 1,285 | | | | — | |
| | | | | | | | | | | | | | | | | | | | | | | | | | | | | | | | | | | | |
Total | | $ | 285,284 | | | $ | 34,174 | | | $ | 79,802 | | | $ | 15,611 | | | $ | 88,688 | | | $ | 343,955 | | | | 13,891 | | | $ | 5,638 | | | | — | |
| | | | | | | | | | | | | | | | | | | | | | | | | | | | | | | | | | | | |
Emerging Markets Core Equity Portfolio | | | | | | | | | | | | | | | | | | | | | | | | | | | | | | | | | | | | |
The DFA Short Term Investment Fund | | $ | 447,352 | | | $ | 2,246,309 | | | $ | 2,168,935 | | | $ | (14 | ) | | $ | (32 | ) | | $ | 524,680 | | | | 45,348 | | | $ | 353 | | | | — | |
| | | | | | | | | | | | | | | | | | | | | | | | | | | | | | | | | | | | |
Total | | $ | 447,352 | | | $ | 2,246,309 | | | $ | 2,168,935 | | | $ | (14 | ) | | $ | (32 | ) | | $ | 524,680 | | | | 45,348 | | | $ | 353 | | | | — | |
| | | | | | | | | | | | | | | | | | | | | | | | | | | | | | | | | | | | |
Emerging Markets Targeted Value Portfolio | | | | | | | | | | | | | | | | | | | | | | | | | | | | | | | | | | | | |
The DFA Short Term Investment Fund | | $ | 2,037 | | | $ | 23,447 | | | $ | 22,414 | | | | — | | | | — | | | $ | 3,070 | | | | 265 | | | | — | | | | — | |
| | | | | | | | | | | | | | | | | | | | | | | | | | | | | | | | | | | | |
Total | | $ | 2,037 | | | $ | 23,447 | | | $ | 22,414 | | | | — | | | | — | | | $ | 3,070 | | | | 265 | | | | — | | | | — | |
| | | | | | | | | | | | | | | | | | | | | | | | | | | | | | | | | | | | |
F. Federal Income Taxes:
Each Portfolio has qualified and intends to continue to qualify as a regulated investment company under Subchapter M of the Internal Revenue Code for federal income tax purposes and to distribute substantially all of its taxable income and net capital gains to its shareholders. Accordingly, no provision has been made for federal income taxes.
Distributions from net investment income and net realized capital gains are determined in accordance with U.S. federal income tax regulations, which may differ from those amounts determined under accounting principles generally accepted in the United States of America. These book/tax differences are either temporary or permanent in nature. To the extent that these differences are permanent, they are charged or credited to paid-in capital or distributable earnings as appropriate, in the period that the differences arise. Accordingly, the permanent differences as of October 31, 2021, can occur as a result of realized gains on securities considered to be “passive foreign investment companies,” non-deductible expenses, realized foreign capital gains tax, the use of accumulated earnings and profits distributed to shareholders on redemptions of shares as part of the dividends paid deduction for income tax purposes, net foreign currency gains/losses, distributions received from real estate investment trusts and distribution redesignations, and were reclassified to the accounts mentioned above. These reclassifications had no effect on net assets or net asset value per share.
138
The tax character of dividends and distributions declared and paid during the years ended October 31, 2020, and October 31, 2021, were as follows (amounts in thousands):
| | | | | | | | | | | | | | | | |
| | | Net Investment
Income and
Short-Term
Capital Gains | | | Long-Term
Capital Gains | | | Tax Exempt
Income | | | Total | |
Large Cap International Portfolio | | | | | | | | | | | | | | | | |
2020 | | $ | 119,035 | | | | — | | | | — | | | $ | 119,035 | |
2021 | | | 144,492 | | | | — | | | | — | | | | 144,492 | |
International Core Equity Portfolio | | | | | | | | | | | | | | | | |
2020 | | | 616,813 | | | | — | | | | — | | | | 616,813 | |
2021 | | | 761,635 | | | | — | | | | — | | | | 761,635 | |
Global Small Company Portfolio | | | | | | | | | | | | | | | | |
2020 | | | 627 | | | | — | | | | — | | | | 627 | |
2021 | | | 727 | | | | — | | | | — | | | | 727 | |
International Small Company Portfolio | | | | | | | | | | | | | | | | |
2020 | | | 251,539 | | | $ | 278,423 | | | | — | | | | 529,962 | |
2021 | | | 220,133 | | | | — | | | | — | | | | 220,133 | |
Japanese Small Company Portfolio | | | | | | | | | | | | | | | | |
2020 | | | 14,224 | | | | 9,019 | | | | — | | | | 23,243 | |
2021 | | | 10,581 | | | | — | | | | — | | | | 10,581 | |
Asia Pacific Small Company Portfolio | | | | | | | | | | | | | | | | |
2020 | | | 14,178 | | | | — | | | | — | | | | 14,178 | |
2021 | | | 12,808 | | | | — | | | | — | | | | 12,808 | |
United Kingdom Small Company Portfolio | | | | | | | | | | | | | | | | |
2020 | | | 969 | | | | 1,478 | | | | — | | | | 2,447 | |
2021 | | | 588 | | | | — | | | | — | | | | 588 | |
Continental Small Company Portfolio | | | | | | | | | | | | | | | | |
2020 | | | 8,902 | | | | — | | | | — | | | | 8,902 | |
2021 | | | 13,462 | | | | — | | | | — | | | | 13,462 | |
DFA International Real Estate Securities Portfolio | | | | | | | | | | | | | | | | |
2020 | | | 717,271 | | | | — | | | | — | | | | 717,271 | |
2021 | | | — | | | | — | | | | — | | | | — | |
DFA Global Real Estate Securities Portfolio | | | | | | | | | | | | | | | | |
2020 | | | 509,001 | | | | 90,019 | | | | — | | | | 599,020 | |
2021 | | | 153,865 | | | | 33,088 | | | | — | | | | 186,953 | |
DFA International Small Cap Value Portfolio | | | | | | | | | | | | | | | | |
2020 | | | 224,481 | | | | 206,468 | | | | — | | | | 430,949 | |
2021 | | | 258,254 | | | | — | | | | — | | | | 258,254 | |
International Vector Equity Portfolio | | | | | | | | | | | | | | | | |
2020 | | | 57,641 | | | | — | | | | — | | | | 57,641 | |
2021 | | | 74,200 | | | | — | | | | — | | | | 74,200 | |
International High Relative Profitability Portfolio | | | | | | | | | | | | | | | | |
2020 | | | 18,018 | | | | — | | | | — | | | | 18,018 | |
2021 | | | 43,180 | | | | — | | | | — | | | | 43,180 | |
139
| | | | | | | | | | | | | | | | |
| | | Net Investment
Income and
Short-Term
Capital Gains | | | Long-Term
Capital Gains | | | Tax Exempt
Income | | | Total | |
World ex U.S. Value Portfolio | | | | | | | | | | | | | | | | |
2020 | | $ | 6,579 | | | | — | | | | — | | | $ | 6,579 | |
2021 | | | 8,755 | | | | — | | | | — | | | | 8,755 | |
World ex U.S. Core Equity Portfolio | | | | | | | | | | | | | | | | |
2020 | | | 75,535 | | | | — | | | | — | | | | 75,535 | |
2021 | | | 98,429 | | | | — | | | | — | | | | 98,429 | |
World Core Equity Portfolio | | | | | | | | | | | | | | | | |
2020 | | | 14,888 | | | $ | 1,549 | | | | — | | | | 16,437 | |
2021 | | | 16,210 | | | | — | | | | — | | | | 16,210 | |
Selectively Hedged Global Equity Portfolio | | | | | | | | | | | | | | | | |
2020 | | | 9,635 | | | | — | | | | — | | | | 9,635 | |
2021 | | | 3,648 | | | | 3,286 | | | | — | | | | 6,934 | |
Emerging Markets Portfolio | | | | | | | | | | | | | | | | |
2020 | | | 118,156 | | | | — | | | | — | | | | 118,156 | |
2021 | | | 122,695 | | | | — | | | | — | | | | 122,695 | |
Emerging Markets Small Cap Portfolio | | | | | | | | | | | | | | | | |
2020 | | | 129,179 | | | | 41,749 | | | | — | | | | 170,928 | |
2021 | | | 128,503 | | | | — | | | | — | | | | 128,503 | |
Emerging Markets Value Portfolio | | | | | | | | | | | | | | | | |
2020 | | | 442,052 | | | | — | | | | — | | | | 442,052 | |
2021 | | | 382,292 | | | | — | | | | — | | | | 382,292 | |
Emerging Markets Core Equity Portfolio | | | | | | | | | | | | | | | | |
2020 | | | 585,760 | | | | — | | | | — | | | | 585,760 | |
2021 | | | 590,306 | | | | — | | | | — | | | | 590,306 | |
Emerging Markets Targeted Value Portfolio | | | | | | | | | | | | | | | | |
2020 | | | 3,854 | | | | 21 | | | | — | | | | 3,875 | |
2021 | | | 4,500 | | | | — | | | | — | | | | 4,500 | |
As of October 31, 2021, the following net investment income and short-term capital gains and long-term capital gains distributions designated for federal income tax purposes are due to the use of accumulated earnings and profits distributed to shareholders upon redemption of shares (amounts in thousands):
| | | | | | | | | | | | |
| | | Net Investment
Income and
Short-Term
Capital Gains | | | Long-Term
Capital Gains | | | Total | |
Large Cap International Portfolio | | $ | (6,059 | ) | | | — | | | $ | (6,059 | ) |
International Core Equity Portfolio | | | (40,609 | ) | | | — | | | | (40,609 | ) |
Global Small Company Portfolio | | | (165 | ) | | $ | (59 | ) | | | (224 | ) |
International Small Company Portfolio | | | (43,307 | ) | | | (45,638 | ) | | | (88,945 | ) |
Japanese Small Company Portfolio | | | (1,060 | ) | | | (1,545 | ) | | | (2,605 | ) |
Asia Pacific Small Company Portfolio | | | (1,655 | ) | | | (2,324 | ) | | | (3,979 | ) |
United Kingdom Small Company Portfolio | | | (111 | ) | | | (88 | ) | | | (199 | ) |
Continental Small Company Portfolio | | | (356 | ) | | | — | | | | (356 | ) |
DFA International Real Estate Securities Portfolio | | | (6,036 | ) | | | — | | | | (6,036 | ) |
140
| | | | | | | | | | | | |
| | | Net Investment
Income and
Short-Term
Capital Gains | | | Long-Term
Capital Gains | | | Total | |
DFA Global Real Estate Securities Portfolio | | $ | (8,798 | ) | | | — | | | $ | (8,798 | ) |
DFA International Small Cap Value Portfolio | | | (32,335 | ) | | | — | | | | (32,335 | ) |
International Vector Equity Portfolio | | | (8,670 | ) | | | — | | | | (8,670 | ) |
International High Relative Profitability Portfolio | | | (2,917 | ) | | | — | | | | (2,917 | ) |
World ex U.S. Value Portfolio | | | — | | | | — | | | | — | |
World ex U.S. Core Equity Portfolio | | | (4,928 | ) | | | — | | | | (4,928 | ) |
World Core Equity Portfolio | | | (300 | ) | | $ | (797 | ) | | | (1,097 | ) |
Selectively Hedged Global Equity Portfolio | | | (740 | ) | | | (1,080 | ) | | | (1,820 | ) |
Emerging Markets Portfolio | | | (14,565 | ) | | | (31,396 | ) | | | (45,961 | ) |
Emerging Markets Small Cap Portfolio | | | (23,056 | ) | | | (15,794 | ) | | | (38,850 | ) |
Emerging Markets Value Portfolio | | | (51,755 | ) | | | — | | | | (51,755 | ) |
Emerging Markets Core Equity Portfolio | | | (47,544 | ) | | | — | | | | (47,544 | ) |
Emerging Markets Targeted Value Portfolio | | | (1,223 | ) | | | (2,056 | ) | | | (3,279 | ) |
As of October 31, 2021, the components of distributable earnings (accumulated losses) were as follows (amounts in thousands):
| | | | | | | | | | | | | | | | | | | | |
| | | Undistributed
Net Investment
Income and
Short-Term
Capital Gains | | | Undistributed
Long-Term
Capital Gains | | | Capital Loss
Carryforwards | | | Unrealized
Appreciation
(Depreciation) | | | Total Net
Distributable
Earnings
(Accumulated
Losses) | |
Large Cap International Portfolio | | $ | 40,692 | | | | — | | | $ | (384,020 | ) | | $ | 2,009,082 | | | $ | 1,665,754 | |
International Core Equity Portfolio | | | 306,366 | | | | — | | | | (1,265,730 | ) | | | 9,065,458 | | | | 8,106,094 | |
Global Small Company Portfolio | | | 1,302 | | | $ | 1,952 | | | | — | | | | 19,576 | | | | 22,830 | |
International Small Company Portfolio | | | 306,340 | | | | 367,879 | | | | — | | | | 2,939,662 | | | | 3,613,881 | |
Japanese Small Company Portfolio | | | 8,625 | | | | 9,423 | | | | — | | | | 71,540 | | | | 89,588 | |
Asia Pacific Small Company Portfolio | | | 13,486 | | | | 26,996 | | | | — | | | | 46,304 | | | | 86,786 | |
United Kingdom Small Company Portfolio | | | 609 | | | | 742 | | | | — | | | | 4,745 | | | | 6,096 | |
Continental Small Company Portfolio | | | 10,051 | | | | 13,197 | | | | — | | | | 230,638 | | | | 253,886 | |
DFA International Real Estate Securities Portfolio | | | 448,351 | | | | — | | | | (537,282 | ) | | | 12,844 | | | | (76,087 | ) |
DFA Global Real Estate Securities Portfolio | | | 50,047 | | | | 96,158 | | | | — | | | | 2,417,397 | | | | 2,563,602 | |
DFA International Small Cap Value Portfolio | | | 284,171 | | | | 38,835 | | | | — | | | | 2,128,251 | | | | 2,451,257 | |
International Vector Equity Portfolio | | | 39,502 | | | | 68,984 | | | | — | | | | 943,294 | | | | 1,051,780 | |
International High Relative Profitability Portfolio | | | 10,940 | | | | 10,953 | | | | — | | | | 489,184 | | | | 511,077 | |
World ex U.S. Value Portfolio | | | 3,321 | | | | — | | | | (9,885 | ) | | | 45,894 | | | | 39,330 | |
World ex U.S. Core Equity Portfolio | | | 23,587 | | | | — | | | | (100,475 | ) | | | 978,330 | | | | 901,442 | |
World Core Equity Portfolio | | | — | | | | 8,329 | | | | — | | | | 385,030 | | | | 393,359 | |
Selectively Hedged Global Equity Portfolio | | | 5,390 | | | | 13,787 | | | | — | | | | 148,706 | | | | 167,883 | |
Emerging Markets Portfolio | | | 21,567 | | | | 214,849 | | | | — | | | | 2,444,325 | | | | 2,680,741 | |
Emerging Markets Small Cap Portfolio | | | 155,079 | | | | 93,645 | | | | — | | | | 1,020,899 | | | | 1,269,623 | |
141
| | | | | | | | | | | | | | | | | | | | |
| | | Undistributed
Net Investment
Income and
Short-Term
Capital Gains | | | Undistributed
Long-Term
Capital Gains | | | Capital Loss
Carryforwards | | | Unrealized
Appreciation
(Depreciation) | | | Total Net
Distributable
Earnings
(Accumulated
Losses) | |
Emerging Markets Value Portfolio | | $ | 181,485 | | | | — | | | $ | (1,710,597 | ) | | $ | 2,636,910 | | | $ | 1,107,798 | |
Emerging Markets Core Equity Portfolio | | | 182,437 | | | | — | | | | (2,148,189 | ) | | | 8,909,426 | | | | 6,943,674 | |
Emerging Markets Targeted Value Portfolio | | | 10,796 | | | $ | 10,941 | | | | — | | | | 42,666 | | | | 64,403 | |
For federal income tax purposes, the Fund measures its capital loss carryforwards annually at October 31, its fiscal year end. Capital loss carryforwards may be carried forward and applied against future capital gains. As of October 31, 2021, the Portfolios had the following capital loss carryforwards available to offset future realized capital gains with no expiration date (amounts in thousands):
| | | | | | | | |
| | | Unlimited | | | Total | |
Large Cap International Portfolio | | $ | 384,020 | | | $ | 384,020 | |
International Core Equity Portfolio | | | 1,265,730 | | | | 1,265,730 | |
Global Small Company Portfolio | | | — | | | | — | |
International Small Company Portfolio | | | — | | | | — | |
Japanese Small Company Portfolio | | | — | | | | — | |
Asia Pacific Small Company Portfolio | | | — | | | | — | |
United Kingdom Small Company Portfolio | | | — | | | | — | |
Continental Small Company Portfolio | | | — | | | | — | |
DFA International Real Estate Securities Portfolio | | | 537,282 | | | | 537,282 | |
DFA Global Real Estate Securities Portfolio | | | — | | | | — | |
DFA International Small Cap Value Portfolio | | | — | | | | — | |
International Vector Equity Portfolio | | | — | | | | — | |
International High Relative Profitability Portfolio | | | — | | | | — | |
World ex U.S. Value Portfolio | | | 9,885 | | | | 9,885 | |
World ex U.S. Core Equity Portfolio | | | 100,475 | | | | 100,475 | |
World Core Equity Portfolio | | | — | | | | — | |
Selectively Hedged Global Equity Portfolio | | | — | | | | — | |
Emerging Markets Portfolio | | | — | | | | — | |
Emerging Markets Small Cap Portfolio | | | — | | | | — | |
Emerging Markets Value Portfolio | | | 1,710,597 | | | | 1,710,597 | |
Emerging Markets Core Equity Portfolio | | | 2,148,189 | | | | 2,148,189 | |
Emerging Markets Targeted Value Portfolio | | | — | | | | — | |
During the year ended October 31, 2021, the following Portfolios used the following capital loss carryforwards to offset realized capital gains for federal income tax purposes (amounts in thousands):
| | | | |
Large Cap International Portfolio | | $ | 101,782 | |
International Core Equity Portfolio | | | 272,686 | |
Global Small Company Portfolio | | | 254 | |
International Small Company Portfolio | | | 311,522 | |
Japanese Small Company Portfolio | | | 4,708 | |
Asia Pacific Small Company Portfolio | | | 17,670 | |
United Kingdom Small Company Portfolio | | | 55 | |
142
| | | | |
Continental Small Company Portfolio | | $ | 27,023 | |
DFA International Small Cap Value Portfolio | | | 427,289 | |
International Vector Equity Portfolio | | | 117,093 | |
International High Relative Profitability Portfolio | | | 26,305 | |
World ex U.S. Value Portfolio | | | 7,883 | |
World ex U.S. Core Equity Portfolio | | | 29,244 | |
World Core Equity Portfolio | | | 1,459 | |
Emerging Markets Portfolio | | | 149,571 | |
Emerging Markets Small Cap Portfolio | | | 395,108 | |
Emerging Markets Value Portfolio | | | 637,239 | |
Emerging Markets Core Equity Portfolio | | | 591,832 | |
As of October 31, 2021, the total cost and aggregate gross unrealized appreciation (depreciation) of securities for federal income tax purposes were different from amounts reported for financial reporting purposes, as follows (amounts in thousands):
| | | | | | | | | | | | | | | | |
| | | Federal
Tax Cost | | | Unrealized
Appreciation | | | Unrealized
(Depreciation) | | | Net
Unrealized
Appreciation
(Depreciation) | |
Large Cap International Portfolio | | $ | 4,242,557 | | | $ | 2,159,880 | | | $ | (150,672 | ) | | $ | 2,009,208 | |
International Core Equity Portfolio | | | 26,675,979 | | | | 11,314,807 | | | | (2,252,592 | ) | | | 9,062,215 | |
Global Small Company Portfolio | | | 80,911 | | | | 18,156 | | | | — | | | | 18,156 | |
International Small Company Portfolio | | | 10,531,261 | | | | 2,939,914 | | | | — | | | | 2,939,914 | |
Japanese Small Company Portfolio | | | 308,348 | | | | 71,613 | | | | — | | | | 71,613 | |
Asia Pacific Small Company Portfolio | | | 335,341 | | | | 46,308 | | | | — | | | | 46,308 | |
United Kingdom Small Company Portfolio | | | 39,419 | | | | 8,087 | | | | (3,346 | ) | | | 4,741 | |
Continental Small Company Portfolio | | | 532,505 | | | | 230,638 | | | | — | | | | 230,638 | |
DFA International Real Estate Securities Portfolio | | | 6,194,326 | | | | 713,130 | | | | (699,671 | ) | | | 13,459 | |
DFA Global Real Estate Securities Portfolio | | | 8,328,063 | | | | 2,648,735 | | | | (231,337 | ) | | | 2,417,398 | |
DFA International Small Cap Value Portfolio | | | 10,858,361 | | | | 3,179,833 | | | | (1,052,322 | ) | | | 2,127,511 | |
International Vector Equity Portfolio | | | 2,874,292 | | | | 1,143,997 | | | | (200,605 | ) | | | 943,392 | |
International High Relative Profitability Portfolio | | | 1,781,068 | | | | 535,677 | | | | (46,497 | ) | | | 489,180 | |
World ex U.S. Value Portfolio | | | 262,198 | | | | 46,383 | | | | — | | | | 46,383 | |
World ex U.S. Core Equity Portfolio | | | 3,203,619 | | | | 1,289,404 | | | | (308,898 | ) | | | 980,506 | |
World Core Equity Portfolio | | | 704,721 | | | | 385,030 | | | | — | | | | 385,030 | |
Selectively Hedged Global Equity Portfolio | | | 195,268 | | | | 148,706 | | | | — | | | | 148,706 | |
Emerging Markets Portfolio | | | 3,739,638 | | | | 2,490,152 | | | | — | | | | 2,490,152 | |
Emerging Markets Small Cap Portfolio | | | 4,058,588 | | | | 1,058,119 | | | | — | | | | 1,058,119 | |
Emerging Markets Value Portfolio | | | 10,486,707 | | | | 2,707,721 | | | | — | | | | 2,707,721 | |
Emerging Markets Core Equity Portfolio | | | 20,475,039 | | | | 11,573,568 | | | | (2,498,617 | ) | | | 9,074,951 | |
Emerging Markets Targeted Value Portfolio | | | 192,272 | | | | 55,915 | | | | (11,757 | ) | | | 44,158 | |
The difference between GAAP-basis and tax-basis unrealized gains (losses) can occur as a result of wash sales and net mark to market gains (losses) on regulated futures contracts, net mark-to-market gain/loss on foreign currency contracts, and differences in the tax treatment of passive foreign investment company investments.
ASC 740 Accounting for Uncertainty in Income Taxes sets forth a minimum threshold for financial statement recognition of the benefit of a tax position taken or expected to be taken in a tax return. Management has analyzed the Portfolios’ tax positions and has concluded that no additional provision for income tax is required in the Portfolios’ financial statements. The Portfolios are not aware of any tax positions for which it is more likely than not that the total amounts of unrecognized tax benefits will significantly change in the next twelve months. The Portfolios’ federal tax returns for the prior three fiscal years remain subject to examination by the Internal Revenue Service.
143
G. Capital Share Transactions:
The capital share transactions by class were as follows (amounts in thousands):
| | | | | | | | | | | | | | | | |
| | | Year Ended | | | Year Ended | |
| | | October 31, 2021 | | | October 31, 2020 | |
| | | Amount | | | Shares | | | Amount | | | Shares | |
Emerging Markets Value Portfolio | | | | | | | | | | | | | | | | |
Class R2 Shares | | | | | | | | | | | | | | | | |
Shares Issued | | $ | 1,397 | | | | 45 | | | $ | 3,669 | | | | 151 | |
Shares Issued in Lieu of Cash Distributions | | | 349 | | | | 12 | | | | 570 | | | | 22 | |
Shares Redeemed | | | (4,468 | ) | | | (148 | ) | | | (16,724 | ) | | | (717 | ) |
| | | | | | | | | | | | | | | | |
Net Increase (Decrease) — Class R2 Shares | | $ | (2,722 | ) | | | (91 | ) | | $ | (12,485 | ) | | | (544 | ) |
| | | | | | | | | | | | | | | | |
Institutional Class Shares | | | | | | | | | | | | | | | | |
Shares Issued | | $ | 1,801,928 | | | | 58,072 | | | $ | 3,019,595 | | | | 131,537 | |
Shares Issued in Lieu of Cash Distributions | | | 368,063 | | | | 12,127 | | | | 425,160 | | | | 16,845 | |
Shares Redeemed | | | (5,470,382 | ) | | | (175,490 | ) | | | (5,831,173 | ) | | | (249,652 | ) |
| | | | | | | | | | | | | | | | |
Net Increase (Decrease) — Institutional Class Shares | | $ | (3,300,391 | ) | | | (105,291 | ) | | $ | (2,386,418 | ) | | | (101,270 | ) |
| | | | | | | | | | | | | | | | |
H. Financial Instruments:
In accordance with the Portfolios’ investment objectives and policies, the Portfolios may invest either directly or indirectly (through their investments in corresponding Master/Underlying Funds), in certain financial instruments that have off-balance sheet risk in excess of the amounts recognized in the financial statements and concentrations of credit and market risk. These instruments and their significant corresponding risks are described below:
1. Foreign Market Risks: Investments in foreign markets may involve certain considerations and risks not typically associated with investments in the United States of America, including the possibility of future political and economic developments and the level of foreign governmental supervision and regulation of foreign securities markets. These markets are generally smaller, less liquid and more volatile than the major securities markets in the United States of America. Consequently, acquisition and disposition of international securities held by the Portfolios may be inhibited.
Portfolios that have significant exposure to certain countries, such as the United Kingdom Small Company Portfolio’s Master Fund that concentrates investments in the United Kingdom, can be expected to be impacted by the political and economic conditions within such countries. For example, there is continuing uncertainty around the future of the euro and the European Union (EU) following the United Kingdom’s (UK) exit from the EU (referred to as “Brexit”). Brexit may cause greater market volatility and illiquidity, currency fluctuations, deterioration in economic activity, a decrease in business confidence, and increased likelihood of a recession in the UK. While it is not possible to determine the precise impact these events may have on the Portfolios, during this period and beyond, the impact on the UK, EU countries, other countries or parties that transact with the UK and EU, and the broader global economy could be significant and could adversely affect the value and liquidity of the Portfolios’ investments.
Derivative Financial Instruments:
Summarized below are the specific types of derivative instruments used by the Portfolios.
144
2. Forward Currency Contracts: The Portfolios listed below may acquire and sell forward currency contracts to hedge against adverse changes in the relationship of the U.S. dollar to foreign currencies (foreign exchange rate risk) or to transfer balances from one currency to another currency. The Selectively Hedged Global Equity Portfolio may hedge some or all of the currency exposure of its foreign securities by entering into forward currency contracts. The decision to hedge the Selectively Hedged Global Equity Portfolio’s currency exposure with respect to a foreign market will be based primarily on the Portfolio’s existing exposure to a given foreign currency. Each contract is valued daily and the change in value is recorded by the Portfolio as an unrealized gain or loss, which is presented in the Statements of Operations as the change in unrealized appreciation or depreciation of forward currency contracts. When the contract is closed or offset with the same counterparty, the Portfolio records a realized gain or loss equal to the change in the value of the contract when it was opened and the value at the time it was closed or offset. This is presented in the Statements of Operations as a net realized gain or loss on forward currency contracts. Risks may arise upon entering into these contracts from the potential inability of counterparties to meet the terms of their contracts and from unanticipated movements in the value of foreign currency relative to the U.S. dollar.
3. Futures Contracts: Each Portfolio listed below may purchase or sell futures contracts and options on futures contracts for equity securities and indices to increase or decrease market exposure based on actual or expected cash inflows to or outflows from the Portfolio. The Selectively Hedged Global Equity Portfolio may also use futures contracts to hedge some or all of the currency exposure of its foreign securities. Upon entering into a futures contract, the Portfolios deposit cash or pledge U.S. Government securities to a broker in an amount equal to the minimum “initial margin” requirements of the exchange on which the contract is traded. Subsequent payments are received from or paid to the broker each day, based on the daily fluctuation in the market value of the contract. These receipts or payments are known as “variation margin” and are recorded daily by the Portfolios as unrealized gains or losses until the contracts are closed. When the contracts are closed, the Portfolios record a realized gain or loss, which is presented in the Statements of Operations as a net realized gain or loss on futures, equal to the difference between the value of the contract at the time it was opened and the value at the time it was closed.
Risks may arise upon entrance into futures contracts from potential imperfect price correlations between the futures contracts and the underlying securities, from the possibility of an illiquid secondary market for these instruments and from the possibility that the Portfolio could lose more than the initial margin requirements. The Portfolios entering into stock index futures are subject to equity price risk from those futures contracts. Counterparty credit risk related to exchange-traded futures is minimal because the exchange’s clearinghouse, as counterparty to all exchange-traded futures, guarantees the futures against default.
Securities have been segregated as collateral for open futures contracts.
The average volume (based on the open positions at each fiscal month-end) of derivative activity for the year ended October 31, 2021 was as follows (amounts in thousands):
| | | | | | | | |
| | | Forward
Currency
Contracts* | | �� | Futures** | |
Large Cap International Portfolio | | $ | — | | | $ | 48,340 | |
International Core Equity Portfolio | | | — | | | | 266,565 | |
Global Small Company Portfolio | | | — | | | | 146 | |
International Small Company Portfolio | | | — | | | | 86,184 | |
DFA International Real Estate Securities Portfolio | | | — | | | | 39,583 | |
DFA International Small Cap Value Portfolio | | | — | | | | 115,129 | |
International Vector Equity Portfolio | | | — | | | | 1,640 | |
International High Relative Profitability Portfolio | | | — | | | | 4,911 | |
World ex U.S. Core Equity Portfolio | | | — | | | | 28,420 | |
Selectively Hedged Global Equity Portfolio | | | 107,658 | | | | 4,064 | |
Emerging Markets Core Equity Portfolio | | | — | | | | 226,591 | |
145
| | | | | | | | |
| | | Forward
Currency
Contracts* | | | Futures** | |
Emerging Markets Targeted Value Portfolio | | $ | — | | | $ | 1,700 | |
| * | Average amount of Currency Purchased/Sold in USD |
| ** | Average Notional Value of futures contracts |
The following is a summary of the Portfolios’ derivative instrument holdings categorized by primary risk exposure as of October 31, 2021 (amounts in thousands):
| | | | | | | | | | | | |
| | | Asset Derivatives Value | |
| | | Total Value
at
October 31, 2021 | | | Forward
Currency
Contracts (1) | | | Equity
Contracts*,(2) | |
Large Cap International Portfolio | | $ | 1,633 | | | | — | | | $ | 1,633 | |
International Core Equity Portfolio | | | 9,003 | | | | — | | | | 9,003 | |
International Small Company Portfolio | | | 2,141 | | | | — | | | | 2,141 | |
DFA International Real Estate Securities Portfolio | | | 1,410 | | | | — | | | | 1,410 | |
DFA International Small Cap Value Portfolio | | | 4,502 | | | | — | | | | 4,502 | |
International Vector Equity Portfolio | | | 826 | | | | — | | | | 826 | |
World ex U.S. Core Equity Portfolio | | | 1,034 | | | | — | | | | 1,034 | |
Selectively Hedged Global Equity Portfolio | | | 838 | | | $ | 736 | | | | 102 | |
Emerging Markets Core Equity Portfolio | | | 8,055 | | | | — | | | | 8,055 | |
Emerging Markets Targeted Value Portfolio | | | 54 | | | | — | | | | 54 | |
| | | | | | | | |
| | | Liability Derivatives Value | |
| | | Total Value | | | Forward | |
| | | at | | | Currency | |
| | | October 31, 2021 | | | Contracts (3) | |
Selectively Hedged Global Equity Portfolio | | $ | (389 | ) | | $ | (389 | ) |
| (1) | Presented on Statements of Assets and Liabilities as Unrealized Gain on Forward Currency Contracts. |
| (2) | Presented on Statements of Assets and Liabilities as Receivables or Payables: Futures Margin Variation. |
| (3) | Presented on Statements of Assets and Liabilities as Unrealized Loss on Forward Currency Contracts. |
| * | Includes cumulative appreciation (depreciation) of futures contracts. Only current day’s margin variation is reported within the Statements of Assets and Liabilities. |
The following is a summary of the realized and change in unrealized gains and losses from the Portfolios’ derivative instrument holdings categorized by primary risk exposure for the year ended October 31, 2021 (amounts in thousands):
| | | | | | | | | | | | |
| | | Realized Gain (Loss) on | |
| | | Derivatives | |
| | | | | | Forward | | | | |
| | | | | | Currency | | | Equity | |
| | | Total | | | Contracts (1) | | | Contracts (2) | |
Large Cap International Portfolio | | $ | 14,606 | | | | — | | | $ | 14,606 | |
International Core Equity Portfolio | | | 79,338 | | | | — | | | | 79,338 | |
146
| | | | | | | | | | | | |
| | | Realized Gain (Loss) on | |
| | | Derivatives | |
| | | Total | | | Forward
Currency
Contracts (1) | | | Equity
Contracts (2) | |
Global Small Company Portfolio | | $ | 35 | | | | — | | | $ | 35 | * |
International Small Company Portfolio | | | 26,350 | | | | — | | | | 26,350 | |
DFA International Real Estate Securities Portfolio | | | 13,260 | | | | — | | | | 13,260 | |
DFA Global Real Estate Securities Portfolio | | | 1,671 | | | | — | | | | 1,671 | * |
DFA International Small Cap Value Portfolio | | | 26,234 | | | | — | | | | 26,234 | |
International Vector Equity Portfolio | | | (437 | ) | | | — | | | | (437 | ) |
International High Relative Profitability Portfolio | | | 2,062 | | | | — | | | | 2,062 | |
World ex U.S. Core Equity Portfolio | | | 8,882 | | | | — | | | | 8,882 | |
World Core Equity Portfolio | | | (18 | ) | | | — | | | | (18 | )* |
Selectively Hedged Global Equity Portfolio | | | 1,941 | | | $ | 694 | | | | 1,247 | |
Emerging Markets Core Equity Portfolio | | | 67,395 | | | | — | | | | 67,395 | |
Emerging Markets Targeted Value Portfolio | | | 348 | | | | — | | | | 348 | |
| | | | | | | | | | | | |
| | | Change in Unrealized Appreciation
(Depreciation) on Derivatives | |
| | | Total | | | Forward
Currency
Contracts (3) | | | Equity
Contracts (4) | |
Large Cap International Portfolio | | $ | 2,380 | | | | — | | | $ | 2,380 | |
International Core Equity Portfolio | | | 10,863 | | | | — | | | | 10,863 | |
International Small Company Portfolio | | | 3,416 | | | | — | | | | 3,416 | |
DFA International Real Estate Securities Portfolio | | | 3,086 | | | | — | | | | 3,086 | |
DFA International Small Cap Value Portfolio | | | 9,695 | | | | — | | | | 9,695 | |
International Vector Equity Portfolio | | | 826 | | | | — | | | | 826 | |
International High Relative Profitability Portfolio | | | 145 | | | | — | | | | 145 | |
World ex U.S. Core Equity Portfolio | | | 1,632 | | | | — | | | | 1,632 | |
Selectively Hedged Global Equity Portfolio | | | 317 | | | $ | 121 | | | | 196 | |
Emerging Markets Core Equity Portfolio | | | 15,950 | | | | — | | | | 15,950 | |
Emerging Markets Targeted Value Portfolio | | | 67 | | | | — | | | | 67 | |
| (1) | Presented on Statements of Operations as Net Realized Gain (Loss) on: Forward Currency Contracts. |
| (2) | Presented on Statements of Operations as Net Realized Gain (Loss) on: Futures. |
| (3) | Presented on Statements of Operations as Change in Unrealized Appreciation (Depreciation) of: Forward Currency Contracts. |
| (4) | Presented on Statements of Operations as Change in Unrealized Appreciation (Depreciation) of: Futures. |
| * | As of October 31, 2021, there were no futures contracts outstanding. During the year ended October 31, 2021, the Portfolio had limited activity in futures contracts. |
Offsetting of Derivative Assets and Derivative Liabilities
In order to better define its contractual rights and to secure rights that will help a Portfolio mitigate its counterparty risk, the Fund on behalf of applicable Portfolios entered into an International Swaps and Derivatives Association, Inc. Master Agreement (ISDA Master Agreement) or a similar agreement with certain of its derivative contract counterparties. An ISDA Master Agreement is a bilateral agreement between the Fund, on behalf of a Portfolio, and a counterparty that governs over-the-counter (OTC) derivatives and forward currency contracts and
147
typically contains, among other things, provisions in the event of a default and/or termination event and may also include collateral posting items. Under an ISDA Master Agreement, a Portfolio may, under certain circumstances, offset with the counterparty certain derivative financial instruments’ payables and/or receivables with collateral held and/or posted, if any, and create one single net payment. The provisions of the ISDA Master Agreement typically permit a single net payment in the event of a default (close-out), including the bankruptcy or insolvency of the counterparty. However, bankruptcy or insolvency laws of a particular jurisdiction may impose restrictions on or prohibitions against the right of offset in bankruptcy, insolvency, or other events.
For financial reporting purposes, the Portfolios do not offset derivative assets and derivative liabilities that are subject to netting arrangements in the Statements of Assets and Liabilities.
The following table presents the Portfolios’ gross and net amount of assets and liabilities available for offset under netting arrangements as well as any related collateral received or pledged by the Portfolios as of October 31, 2021 (amounts in thousands):
| | | | | | | | | | | | | | | | | | | | | | | | | | | | | | | | | | | | | | | | |
| | | Gross
Amounts of
Recognized
Assets
(a) | | | Net
Amounts
of
Assets
Presented
in the
Statements
of Assets
and
Liabilities | | | Gross Amounts Not
Offset in the
Statements of Assets
and Liabilities | | | Net
Amount
(c) | | | Gross
Amounts of
Recognized
Liabilities
(a) | | | Net
Amounts
of
Liabilities
Presented
in the
Statements
of Assets
and
Liabilities | | | Gross Amounts Not
Offset in the
Statements of Assets
and Liabilities | | | Net
Amount
(e) | |
Description | | Financial
Instruments
(b) | | | Cash
Collateral
Received | | | Financial
Instruments
(d) | | | Cash
Collateral
Pledged | |
| | | Assets | | | Liabilities | |
Selectively Hedged Global Equity Portfolio | | | | | | | | | | | | | | | | | | | | | | | | | | | | | | | | | | | | | | | | |
UBSAG | | | — | | | | — | | | | — | | | | — | | | | — | | | $ | 11 | | | $ | 11 | | | | — | | | | — | | | $ | 11 | |
Citibank NA | | | — | | | | — | | | | — | | | | — | | | | — | | | | 29 | | | | 29 | | | | — | | | | — | | | | 29 | |
Bank of America Corp. | | $ | 535 | | | $ | 535 | | | | — | | | | — | | | $ | 535 | | | | — | | | | — | | | | — | | | | — | | | | — | |
State Street Bank and Trust | | | 167 | | | | 167 | | | $ | (1 | ) | | | — | | | | 166 | | | | 1 | | | | 1 | | | $ | (1 | ) | | | — | | | | — | |
HSBC Bank | | | — | | | | — | | | | — | | | | — | | | | — | | | | 267 | | | | 267 | | | | — | | | | — | | | | 267 | |
Goldman Sachs International | | | 15 | | | | 15 | | | | — | | | | — | | | | 15 | | | | — | | | | — | | | | — | | | | — | | | | — | |
Barclays Capital | | | — | | | | — | | | | — | | | | — | | | | — | | | | 23 | | | | 23 | | | | — | | | | — | | | | 23 | |
Australia & New Zealand Banking Group Ltd. | | | — | | | | — | | | | — | | | | — | | | | — | | | | 56 | | | | 56 | | | | — | | | | — | | | | 56 | |
JP Morgan | | | 17 | | | | 17 | | | | — | | | | — | | | | 17 | | | | — | | | | — | | | | — | | | | — | | | | — | |
Morgan Stanley and Co. International | | | 2 | | | | 2 | | | | (2 | ) | | | — | | | | — | | | | 2 | | | | 2 | | | | (2 | ) | | | — | | | | — | |
| | | | | | | | | | | | | | | | | | | | | | | | | | | | | | | | | | | | | | | | |
Total | | $ | 736 | | | $ | 736 | | | $ | (3 | ) | | | — | | | $ | 733 | | | $ | 389 | | | $ | 389 | | | $ | (3 | ) | | | — | | | $ | 386 | |
| | | | | | | | | | | | | | | | | | | | | | | | | | | | | | | | | | | | | | | | |
| (a) | No amounts have been netted against the gross amounts recognized in the Statements of Assets and Liabilities. |
| (b) | Represents the amount of assets that could be offset by liabilities with the same counterparty under master netting or similar agreements that management elects not to offset on the Statements of Assets and Liabilities. |
| (c) | Represents the net amount due from counterparties in the event of default. |
| (d) | Represents the amount of liabilities that could be offset by assets with the same counterparty under master netting or similar agreements that management elects not to offset on the Statements of Assets and Liabilities. |
| (e) | Represents the net amount due to counterparties in the event of default. |
I. Line of Credit and Interfund Lending Program:
The Fund, together with other Dimensional-advised portfolios, has entered into a $500 million uncommitted, unsecured discretionary line of credit effective April 7, 2021, with its domestic custodian bank. A line of credit with similar terms was in effect through April 7, 2021. Each portfolio is permitted to borrow, subject to its investment limitations, up to a maximum of $500 million, as long as total borrowings under the line of credit do not exceed $500 million in the aggregate. Borrowings under the line of credit are charged interest at rates agreed upon by the parties at the time of borrowing. Each portfolio is individually, and not jointly, liable for its particular advances under the line of credit. There is no commitment fee on the unused portion of the line of credit. The agreement for the discretionary line of credit may be terminated by either party at any time. The agreement for the line of credit expires on April 6, 2022.
148
The Fund, together with other Dimensional-advised portfolios, has also entered into an additional $700 million unsecured line of credit with its international custodian bank effective January 2, 2021. A line of credit with similar terms was in effect through January 2, 2021. Each portfolio is permitted to borrow, subject to its investment limitations, up to a maximum of $500 million, as long as total borrowings under the line of credit do not exceed $700 million in the aggregate. Each portfolio is individually, and not jointly, liable for its particular advances under the line of credit. Borrowings under the line of credit are charged interest at rates agreed upon by the parties at the time of borrowing. There is no commitment fee on the unused portion of the line of credit. The line of credit agreement expires on January 1, 2022.
For the year ended October 31, 2021, borrowings by the following Portfolios under the lines of credit were as follows (amounts in thousands, except percentages and days):
| | | | | | | | | | | | | | | | | | | | | | | | |
| | | Weighted
Average
Interest Rate | | | Weighted
Average
Loan Balance | | | Number of
Days
Outstanding* | | | Interest
Expense
Incurred | | | Maximum Amount
Borrowed During
the Period | | | Outstanding
Borrowings
as of 10/31/2021 | |
Large Cap International Portfolio | | | 0.83 | % | | $ | 2,206 | | | | 10 | | | $ | 1 | | | $ | 16,289 | | | | — | |
Global Small Company Portfolio | | | 0.83 | % | | | 258 | | | | 35 | | | | — | | | | 2,031 | | | | — | |
International Small Company Portfolio | | | 0.83 | % | | | 4,651 | | | | 5 | | | | 1 | | | | 15,443 | | | | — | |
DFA International Real Estate Securities Portfolio | | | 0.84 | % | | | 2,495 | | | | 14 | | | | 1 | | | | 14,265 | | | | — | |
DFA Global Real Estate Securities Portfolio | | | 0.83 | % | | | 4,695 | | | | 9 | | | | 1 | | | | 11,900 | | | | — | |
DFA International Small Cap Value Portfolio | | | 0.83 | % | | | 5,235 | | | | 9 | | | | 1 | | | | 11,048 | | | | — | |
International Vector Equity Portfolio | | | 0.83 | % | | | 1,137 | | | | 13 | | | | — | | | | 7,344 | | | | — | |
International High Relative Profitability Portfolio | | | 0.81 | % | | | 19,903 | | | | 1 | | | | — | | | | 19,903 | | | | — | |
World ex U.S. Value Portfolio | | | 0.83 | % | | | 638 | | | | 41 | | | | 1 | | | | 9,903 | | | | — | |
World ex U.S. Core Equity Portfolio | | | 0.83 | % | | | 2,422 | | | | 14 | | | | 1 | | | | 7,282 | | | | — | |
World Core Equity Portfolio | | | 0.83 | % | | | 897 | | | | 55 | | | | 1 | | | | 6,573 | | | $ | 142 | |
Selectively Hedged Global Equity Portfolio | | | 0.83 | % | | | 4,360 | | | | 2 | | | | — | | | | 4,401 | | | | — | |
Emerging Markets Core Equity Portfolio | | | 0.84 | % | | | 11,679 | | | | 2 | | | | 1 | | | | 22,991 | | | | — | |
Emerging Markets Targeted Value Portfolio | | | 0.84 | % | | | 4,266 | | | | 16 | | | | 2 | | | | 7,233 | | | | — | |
| * | Number of Days Outstanding represents the total of single or consecutive days during the year ended October 31, 2021, that each Portfolio’s available line of credit was used. |
149
Pursuant to an exemptive order issued by the SEC (the “Order”), the Portfolios may participate in an interfund lending program among certain portfolios managed by the Advisor (portfolios that operate as feeder funds do not participate in the program). The program allows the participating portfolios to borrow money from and loan money to each other for temporary or emergency purposes, subject to the conditions in the Order. A loan can only be made through the program if the interfund loan rate on that day is more favorable to both the borrowing and lending portfolios as compared to rates available through short-term bank loans or investments in overnight repurchase agreements and money market funds, respectively, as detailed in the Order. Further, a portfolio may participate in the program only if and to the extent that such participation is consistent with its investment objectives and limitations. Interfund loans have a maximum duration of seven days and may be called on one business day’s notice.
For the year ended October 31, 2021, activity by the Portfolios under the interfund lending program was as follows (amounts in thousands, except percentages and days):
| | | | | | | | | | | | | | | | | | | | | | | | | | |
| | | Borrower or Lender | | Weighted
Average
Interest Rate | | | Weighted
Average Loan
Balance | | | Number of
Days
Outstanding* | | | Interest
Expense/
Income | | | Maximum Amount
Borrowed/Loaned
During the Period | | | Outstanding
Borrowings
as of 10/31/2021 | |
Emerging Markets Core Equity Portfolio | | Borrower | | | 0.44 | % | | $ | 10 | | | | 1 | | | | — | | | $ | 10 | | | | — | |
| * | Number of Days Outstanding represents the total of single or consecutive days during the year ended October 31, 2021 that the Portfolio utilized the interfund lending program. |
J. Affiliated Trades:
Cross trades for the year ended October 31, 2021, if any, were executed by the Portfolios pursuant to procedures adopted by the Board of Directors of the Fund to ensure compliance with Rule 17a-7 under the Investment Company Act of 1940 (the “1940 Act”). Cross trading is the buying or selling of portfolio securities between series of investment companies, or between a series of an investment company and another entity, that are or could be considered affiliates by virtue of having a common investment advisor (or affiliated investment advisors), common Directors and/or common Officers. At its regularly scheduled meetings, the CCO certifies to the Board that the 17a-7 transactions entered into by the Portfolios complied with the Rule 17a-7 Procedures adopted by the Board of Directors of the Fund.
For the year ended October 31, 2021, cross trades by the Portfolios under Rule 17a-7 were as follows (amounts in thousands):
| | | | | | | | | | | | |
Portfolio | | Purchases | | | Sales | | | Realized Gain (Loss) | |
Large Cap International Portfolio | | $ | 180,663 | | | $ | 60,935 | | | $ | (8,996 | ) |
International Core Equity Portfolio | | | 167,844 | | | | 149,445 | | | | (11,095 | ) |
DFA Global Real Estate Securities Portfolio | | | 36,687 | | | | 137 | | | | 11 | |
DFA International Small Cap Value Portfolio | | | 81,551 | | | | 233,303 | | | | 55,507 | |
International Vector Equity Portfolio | | | 24,237 | | | | 45,657 | | | | 10,045 | |
International High Relative Profitability Portfolio | | | 80,493 | | | | 33,215 | | | | 873 | |
World ex U.S. Core Equity Portfolio | | | 9,977 | | | | 19,866 | | | | (2,408 | ) |
Emerging Markets Core Equity Portfolio | | | 5,509 | | | | 3,612 | | | | 299 | |
Emerging Markets Targeted Value Portfolio | | | 292 | | | | 1,418 | | | | 100 | |
150
K. Securities Lending:
As of October 31, 2021, some of the Portfolios had securities on loan to brokers/dealers, for which each such Portfolio received cash collateral. The Portfolios also received non-cash collateral consisting of short- and/or long-term U.S. Treasuries and U.S. government agency securities as follows (amounts in thousands):
| | | | |
| | | Non-Cash
Collateral
Market
Value | |
Large Cap International Portfolio | | $ | 55,186 | |
International Core Equity Portfolio | | | 314,556 | |
DFA International Real Estate Securities Portfolio | | | 16,995 | |
DFA International Small Cap Value Portfolio | | | 86,568 | |
International Vector Equity Portfolio | | | 49,380 | |
International High Relative Profitability Portfolio | | | 10,536 | |
World ex U.S. Core Equity Portfolio | | | 67,744 | |
Emerging Markets Core Equity Portfolio | | | 1,231,666 | |
Emerging Markets Targeted Value Portfolio | | | 7,426 | |
Each Portfolio invests the cash collateral, as described below, and records a liability for the return of the collateral, during the period the securities are on loan. Loans of securities are expected at all times to be secured by collateral in an amount (i) equal to at least 100% of the current market value of the loaned securities with respect to securities of the U.S. government or its agencies, (ii) generally equal to 102% of the current market value of the loaned securities with respect to U.S. securities, and (iii) generally equal to 105% of the current market value of the loaned securities with respect to foreign securities. However, daily market fluctuations could cause the Portfolio’s collateral to be lower or higher than the expected thresholds. If this were to occur, the collateral would be adjusted the next business day to ensure adequate collateralization. In the event of default or bankruptcy by the other party to the agreement, realization and/or retention of the collateral may be subject to legal proceedings. If the borrower fails to return loaned securities, cash collateral being maintained by the borrower is insufficient to cover the value of loaned securities, and such collateral insufficiency is not the result of investment losses, the lending agent has agreed to pay the amount of the shortfall to the Portfolio or, at the option of the lending agent, to replace the securities. In the event of the bankruptcy of the borrower, a Portfolio could experience delay in recovering the loaned securities or only recover cash or a security of equivalent value.
Subject to their stated investment policies, each Portfolio with securities on loan will generally invest the cash collateral received for the loaned securities in the Money Market Series, an affiliated registered money market fund advised by the Advisor for which the Advisor receives a management fee of 0.05% of the average daily net assets of the Money Market Series. Income received from the Money Market Series is netted with fees for securities lending and collateral investment expenses and with other payments to and from borrowers of securities. Each Portfolio also may invest the cash collateral received for the loaned securities in securities of the U.S. government or its agencies, repurchase agreements collateralized by securities of the U.S. government or its agencies, and affiliated or unaffiliated money market funds that are registered or unregistered. For purposes of this paragraph, agencies include both agency debentures and agency mortgage-backed securities. Additionally, each Portfolio will be able to terminate the loan at any time and will receive reasonable interest on the loan, as well as amounts equal to any dividends, interest or, other distributions on the loaned securities. However, dividend income received from loaned securities may not be eligible for taxation at qualified dividend income rates.
151
The following table reflects a breakdown of transactions accounted for as secured borrowings, the gross obligation by the type of collateral pledged, and the remaining contractual maturity of those transactions as of October 31, 2021 (amounts in thousands):
| | | | | | | | | | | | | | | | | | | | |
| | | Remaining Contractual Maturity of the Agreements
As of October 31, 2021 | |
| | | Overnight and
Continuous | | | <30 days | | | Between
30 & 90 days | | | >90 days | | | Total | |
Securities Lending Transactions Large Cap International Portfolio | | | | | | | | | | | | | | | | | | | | |
Common Stocks | | $ | 301,155 | | | | — | | | | — | | | | — | | | $ | 301,155 | |
International Core Equity Portfolio | | | | | | | | | | | | | | | | | | | | |
Common Stocks, Rights/Warrants | | | 1,595,091 | | | | — | | | | — | | | | — | | | | 1,595,091 | |
DFA International Real Estate Securities Portfolio | | | | | | | | | | | | | | | | | | | | |
Common Stocks | | | 310,621 | | | | — | | | | — | | | | — | | | | 310,621 | |
DFA Global Real Estate Securities Portfolio | | | | | | | | | | | | | | | | | | | | |
Common Stocks | | | 217,101 | | | | — | | | | — | | | | — | | | | 217,101 | |
DFA International Small Cap Value Portfolio | | | | | | | | | | | | | | | | | | | | |
Common Stocks | | | 383,569 | | | | — | | | | — | | | | — | | | | 383,569 | |
International Vector Equity Portfolio | | | | | | | | | | | | | | | | | | | | |
Common Stocks, Rights/Warrants | | | 142,982 | | | | — | | | | — | | | | — | | | | 142,982 | |
International High Relative Profitability Portfolio | | | | | | | | | | | | | | | | | | | | |
Common Stocks | | | 96,300 | | | | — | | | | — | | | | — | | | | 96,300 | |
World ex U.S. Core Equity Portfolio | | | | | | | | | | | | | | | | | | | | |
Common Stocks | | | 144,566 | | | | — | | | | — | | | | — | | | | 144,566 | |
Emerging Markets Core Equity Portfolio | | | | | | | | | | | | | | | | | | | | |
Common Stocks | | | 524,700 | | | | — | | | | — | | | | — | | | | 524,700 | |
Emerging Markets Targeted Value Portfolio | | | | | | | | | | | | | | | | | | | | |
Common Stocks | | | 3,070 | | | | — | | | | — | | | | — | | | | 3,070 | |
L. Shareholder Servicing Fees:
The Class R2 Shares pay a shareholder servicing fee in an amount up to 0.25% of their annual average net assets to compensate service agents that provide shareholder servicing, record keeping, account maintenance and other services to investors in Emerging Markets Value Portfolio Class R2 Shares.
M. Indemnitees; Contractual Obligations:
Under the Fund’s organizational documents, its Officers and Directors are indemnified against certain liabilities arising out of the performance of their duties to the Fund.
In the normal course of business, the Fund enters into contracts that contain a variety of representations and warranties that provide general indemnification. The Fund’s maximum exposure under these arrangements is unknown, as this would involve future claims that may be made against the Fund and/or its affiliates that have not yet occurred. However, based on experience, the Fund expects the risk of loss to be remote.
152
N. Recently Issued Accounting Standards and Regulations:
In March 2020, the Financial Accounting Standards Board (FASB) issued Accounting Standards Update (ASU) No. 2020-04, Reference Rate Reform (Topic 848) – Facilitation of the Effects of Reference Rate Reform on Financial Reporting. In January 2021, the FASB issued ASU No. 2021-01, with further amendments to Topic 848. The amendments in the ASUs provide optional temporary accounting recognition and financial reporting relief from the effect of certain types of contract modifications due to the planned discontinuation of the LIBOR and other interbank-offered based reference rates as of the end of 2021 and 2023. The ASUs are effective for certain reference rate-related contract modifications that occur during the period March 12, 2020 through December 31, 2022. Management has reviewed the requirements and believes the adoption of these ASUs will not have a material impact on the Portfolios’ financial statements.
In October 2020, the SEC adopted new regulations governing the use of derivatives by registered investment companies. Rule 18f-4 (the “Derivatives Rule”) imposes limits on the amount of derivatives contracts the Portfolios could enter, eliminate the asset segregation framework currently used by the Portfolios to comply with Section 18 of the 1940 Act, and require funds whose use of derivatives is more than a limited specified exposure to establish and maintain a derivatives risk management program and appoint a derivatives risk manager. The Derivatives Rule became effective February 19, 2021 and the Portfolios are required to comply on August 19, 2022. Management is currently evaluating the effect, if any, the Derivatives Rule will have on the Portfolios.
On December 3, 2020, the SEC adopted new Rule 2a-5 (the “Valuation Rule”) under the Investment Company Act of 1940, establishing an updated regulatory framework for fund valuation. The Valuation Rule, in part, provides a framework for good faith fair value determination and permits a Board to designate fair value determinations to a fund’s investment adviser. Further, the SEC is rescinding previously issued guidance on related issues. The Valuation Rule became effective on March 8, 2021, with a compliance date of September 8, 2022. Management is currently evaluating the Valuation Rule and its effect on the Portfolios.
O. Coronavirus (COVID-19) Pandemic:
The ongoing outbreak of the novel coronavirus, COVID-19, has resulted, at times, in market closures, market volatility, liquidity constraints and increased trading costs. Efforts to contain the spread of COVID-19 have resulted in global travel restrictions and disruptions of healthcare systems, business operations and supply chains, layoffs, reduced consumer demand, defaults and credit rating downgrades, and other significant economic impacts. The effects of COVID-19 have impacted global economic activity and may heighten pre-existing political, social and economic risks, domestically or globally. The full impact of the COVID-19 pandemic is unpredictable and may adversely affect a Portfolio’s performance.
P. Other:
As of October 31, 2021, the following number of shareholders held the following approximate percentages of the Portfolios’ outstanding shares. One or more of the shareholders may be omnibus accounts, which typically hold shares for the benefit of several other underlying investors.
| | | | | | | | |
| | | Number of
Shareholders | | | Approximate
Percentage
of Outstanding
Shares | |
Large Cap International Portfolio-Institutional Class | | | 4 | | | | 72 | % |
International Core Equity Portfolio-Institutional Class | | | 4 | | | | 72 | % |
Global Small Company Portfolio-Institutional Class | | | 4 | | | | 95 | % |
International Small Company Portfolio-Institutional Class | | | 4 | | | | 76 | % |
Japanese Small Company Portfolio-Institutional Class | | | 3 | | | | 87 | % |
Asia Pacific Small Company Portfolio-Institutional Class | | | 2 | | | | 92 | % |
United Kingdom Small Company Portfolio-Institutional Class | | | 4 | | | | 94 | % |
Continental Small Company Portfolio-Institutional Class | | | 2 | | | | 91 | % |
DFA International Real Estate Securities Portfolio-Institutional Class | | | 4 | | | | 93 | % |
DFA Global Real Estate Securities Portfolio-Institutional Class | | | 3 | | | | 68 | % |
DFA International Small Cap Value Portfolio-Institutional Class | | | 4 | | | | 75 | % |
International Vector Equity Portfolio-Institutional Class | | | 3 | | | | 84 | % |
153
| | | | | | | | |
| | | Number of
Shareholders | | | Approximate
Percentage
of Outstanding
Shares | |
International High Relative Profitability Portfolio-Institutional Class | | | 3 | | | | 90 | % |
World ex U.S. Value Portfolio-Institutional Class | | | 6 | | | | 90 | % |
World ex U.S. Core Equity Portfolio-Institutional Class | | | 3 | | | | 74 | % |
World Core Equity Portfolio-Institutional Class | | | 5 | | | | 85 | % |
Selectively Hedged Global Equity Portfolio-Institutional Class | | | 3 | | | | 91 | % |
Emerging Markets Portfolio-Institutional Class | | | 3 | | | | 63 | % |
Emerging Markets Small Cap Portfolio-Institutional Class | | | 4 | | | | 65 | % |
Emerging Markets Value Portfolio-Class R2 | | | 1 | | | | 96 | % |
Emerging Markets Value Portfolio-Institutional Class | | | 2 | | | | 40 | % |
Emerging Markets Core Equity Portfolio-Institutional Class | | | 3 | | | | 65 | % |
Emerging Markets Targeted Value Portfolio-Institutional Class | | | 3 | | | | 91 | % |
The Portfolios are subject to claims and suits that arise from time to time in the ordinary course of business (for example, ongoing claw back litigation against former shareholders of portfolio companies that filed for bankruptcy, such as The Tribune Company and Nine West). Although management currently believes that resolving claims against the Portfolios, individually or in aggregate, will not have a material adverse impact on the Portfolios’ financial position, results of operations, or cash flows, these matters are subject to inherent uncertainties and management’s view of these matters may change in the future.
On June 3, 2021, President Biden issued an Executive Order titled ”Addressing the Threat from Securities Investments that Finance Certain Companies of the People’s Republic of China” (the “Order”). Effective on August 2, 2021, the Order restricts investment in certain companies identified as “Chinese Military Industrial Complex Companies” (CMICs) by the Office of Foreign Asset Control, an agency of the Department of Treasury and the Department of Defense. As of July 27, 2021, the Portfolios have divested of all publicly traded securities identified as CMIC’s listed in the Order.
Q. Subsequent Event Evaluations:
Management has evaluated the impact of all subsequent events on the Portfolios through the date on which the financial statements were issued and has determined that there are no subsequent events requiring recognition or disclosure in the financial statements.
154
Report of Independent Registered Public Accounting Firm
To the Board of Directors of DFA Investment Dimensions Group Inc. and Shareholders of each of Large Cap International Portfolio, International Core Equity Portfolio, Global Small Company Portfolio, International Small Company Portfolio, Japanese Small Company Portfolio, Asia Pacific Small Company Portfolio, United Kingdom Small Company Portfolio, Continental Small Company Portfolio, DFA International Real Estate Securities Portfolio, DFA Global Real Estate Securities Portfolio, DFA International Small Cap Value Portfolio, International Vector Equity Portfolio, International High Relative Profitability Portfolio, World ex U.S. Value Portfolio, World ex U.S. Core Equity Portfolio, World Core Equity Portfolio, Selectively Hedged Global Equity Portfolio, Emerging Markets Portfolio, Emerging Markets Small Cap Portfolio, Emerging Markets Value Portfolio, Emerging Markets Core Equity Portfolio and Emerging Markets Targeted Value Portfolio
Opinions on the Financial Statements
We have audited the accompanying statements of assets and liabilities, including the summary schedules of portfolio holdings of Large Cap International Portfolio, International Core Equity Portfolio, DFA International Real Estate Securities Portfolio, DFA Global Real Estate Securities Portfolio, DFA International Small Cap Value Portfolio, International Vector Equity Portfolio, International High Relative Profitability Portfolio, World ex U.S. Core Equity Portfolio, Emerging Markets Core Equity Portfolio and Emerging Markets Targeted Value Portfolio and schedules of investments of Global Small Company Portfolio, International Small Company Portfolio, Japanese Small Company Portfolio, Asia Pacific Small Company Portfolio, United Kingdom Small Company Portfolio, Continental Small Company Portfolio, World ex U.S. Value Portfolio, World Core Equity Portfolio, Selectively Hedged Global Equity Portfolio, Emerging Markets Portfolio, Emerging Markets Small Cap Portfolio and Emerging Markets Value Portfolio (twenty-two of the portfolios constituting DFA Investment Dimensions Group Inc., hereafter collectively referred to as the “Portfolios”) as of October 31, 2021, the related statements of operations for the year ended October 31, 2021, the statements of changes in net assets for each of the two years in the period ended October 31, 2021, including the related notes, and the financial highlights for each of the periods indicated therein (collectively referred to as the “financial statements”). In our opinion, the financial statements present fairly, in all material respects, the financial position of each of the Portfolios as of October 31, 2021, the results of each of their operations for the year then ended, the changes in each of their net assets for each of the two years in the period ended October 31, 2021, and each of the financial highlights for each of the periods indicated therein in conformity with accounting principles generally accepted in the United States of America.
Basis for Opinions
These financial statements are the responsibility of the Portfolios’ management. Our responsibility is to express an opinion on the Portfolios’ financial statements based on our audits. We are a public accounting firm registered with the Public Company Accounting Oversight Board (United States) (PCAOB) and are required to be independent with respect to the Portfolios in accordance with the U.S. federal securities laws and the applicable rules and regulations of the Securities and Exchange Commission and the PCAOB.
We conducted our audits of these financial statements in accordance with the standards of the PCAOB. Those standards require that we plan and perform the audit to obtain reasonable assurance about whether the financial statements are free of material misstatement, whether due to error or fraud.
Our audits included performing procedures to assess the risks of material misstatement of the financial statements, whether due to error or fraud, and performing procedures that respond to those risks. Such procedures included examining, on a test basis, evidence regarding the amounts and disclosures in the financial statements. Our audits also included evaluating the accounting principles used and significant estimates made by management, as well as evaluating the overall presentation of the financial statements. Our procedures included confirmation of securities owned as of October 31, 2021 by correspondence with the custodians, brokers and transfer agents of the investee funds; when replies were not received from brokers, we performed other auditing procedures. We believe that our audits provide a reasonable basis for our opinions.
155
/s/ PricewaterhouseCoopers LLP
Philadelphia, Pennsylvania
December 22, 2021
We have served as the auditor of one or more investment companies in Dimensional Fund Advisors L.P. investment company group since 1981.
156
DIMENSIONAL INVESTMENT GROUP INC.
PERFORMANCE CHARTS
(Unaudited)
DFA International Value Portfolio — Class R2 vs.
MSCI World ex USA Index (net dividends)
October 31, 2011-October 31, 2021
| | |
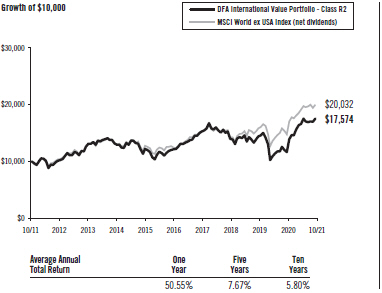 | | Past performance is not predictive of future performance. The returns shown do not reflect the deduction of taxes that a shareholder would pay on fund distributions or the redemption of fund shares. MSCI data © MSCI 2021, all rights reserved. |
DFA International Value Portfolio — Institutional Class vs.
MSCI World ex USA Index (net dividends)
October 31, 2011-October 31, 2021
| | |
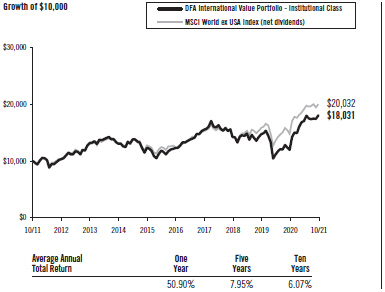 | | Past performance is not predictive of future performance. The returns shown do not reflect the deduction of taxes that a shareholder would pay on fund distributions or the redemption of fund shares. MSCI data © MSCI 2021, all rights reserved. |
157
MANAGEMENT’S DISCUSSION AND ANALYSIS
| | |
| International Equity Market Review | | 12 Months Ended October 31, 2021 |
Performance of non-U.S. developed markets was positive for the period. As measured by the MSCI World ex USA indices, small-cap stocks outperformed large-cap stocks, and mid-cap stocks, a subset of the large-cap universe, underperformed large-cap stocks and small-cap stocks. Value stocks outperformed growth stocks as measured by the MSCI World ex USA indices.
| | | | |
12 Months Ended October 31, 2021 | |
| |
| | | Return in U.S. Dollars | |
MSCI World ex USA Index | | | 35.59 | % |
MSCI World ex USA Mid Cap Index | | | 31.20 | % |
MSCI World ex USA Small Cap Index | | | 37.19 | % |
MSCI World ex USA Value Index | | | 40.88 | % |
MSCI World ex USA Growth Index | | | 30.25 | % |
For the 12 Months Ended October 31, 2021, the U.S. dollar appreciated against some non-U.S. developed markets currencies and depreciated against others. Overall, currency movements did not have a material overall impact on the U.S. dollar-denominated returns of developed markets.
| | | | | | | | |
12 Months Ended October 31, 2021 | |
| | |
Ten Largest Foreign Developed Markets by Market Cap | | Local Return | | | Return in U.S. Dollars | |
Japan | | | 30.75 | % | | | 19.88 | % |
United Kingdom | | | 35.57 | % | | | 43.72 | % |
Canada | | | 38.56 | % | | | 49.05 | % |
France | | | 48.30 | % | | | 47.33 | % |
Switzerland | | | 28.36 | % | | | 28.75 | % |
Germany | | | 33.47 | % | | | 32.60 | % |
Australia | | | 27.93 | % | | | 36.82 | % |
Netherlands | | | 60.71 | % | | | 59.67 | % |
Sweden | | | 40.26 | % | | | 45.36 | % |
Hong Kong | | | 18.26 | % | | | 17.91 | % |
Source: Returns are of MSCI standard indices net of foreign withholding taxes on dividends. Copyright MSCI 2021, all rights reserved.
Emerging markets had positive performance for the period but underperformed both U.S. and non-U.S. developed markets. As measured by the MSCI Emerging Markets indices, small-cap stocks outperformed large-cap stocks, and mid-cap stocks, a subset of the large-cap universe, outperformed large-cap stocks but underperformed small-cap stocks. Value stocks outperformed growth stocks as measured by the MSCI Emerging Markets indices.
158
| | | | |
12 Months Ended October 31, 2021 | |
| |
| | | Return in U.S. Dollars | |
MSCI Emerging Markets Index | | | 16.96 | % |
MSCI Emerging Markets Mid Cap Index | | | 31.20 | % |
MSCI Emerging Markets Small Cap Index | | | 44.29 | % |
MSCI Emerging Markets Value Index | | | 28.31 | % |
MSCI Emerging Markets Growth Index | | | 7.38 | % |
For the 12 Months Ended October 31, 2021, the U.S. dollar depreciated against some emerging markets currencies and appreciated against others. Overall, currency movements had a positive impact on the U.S. dollar denominated returns of emerging markets.
| | | | | | | | |
12 Months Ended October 31, 2021 | |
| | |
Ten Largest Emerging Markets by Market Cap | | Local Return | | | Return in U.S. | |
Dollars | |
China | | | -9.52 | % | | | -9.21 | % |
Taiwan | | | 38.36 | % | | | 42.32 | % |
Korea | | | 27.78 | % | | | 24.08 | % |
India | | | 51.78 | % | | | 50.21 | % |
Russia | | | 64.53 | % | | | 81.80 | % |
Brazil | | | 10.38 | % | | | 12.91 | % |
Saudi Arabia | | | 56.07 | % | | | 56.04 | % |
South Africa | | | 18.16 | % | | | 26.32 | % |
Mexico | | | 42.35 | % | | | 47.44 | % |
Thailand | | | 34.75 | % | | | 26.57 | % |
Source: Returns are of MSCI standard indices net of foreign withholding taxes on dividends. Copyright MSCI 2021, all rights reserved.
For Portfolios investing in non-U.S. equities traded outside of the U.S. market time zone, differences in the valuation timing and methodology between a Portfolio and its benchmark index may impact relative performance over the referenced period. The Portfolios price foreign exchange rates at the closing of the U.S. market, while their benchmark indices use rates at 4 p.m. London time. The Portfolios also may use fair value pricing to price certain portfolio securities at the closing of the U.S. market, while benchmark indices may use local market closing prices. For the one-year period ended October 31, 2021, these differences generally detracted from the Portfolios’ relative performance.
DFA International Value Portfolio
The DFA International Value Portfolio invests in developed ex U.S. large company value stocks by purchasing shares of the DFA International Value Series, a Master Fund managed by Dimensional that invests in such securities. The investment strategy is process driven, emphasizing broad diversification, with increased exposure to stocks with smaller total market capitalizations, lower relative price (value), and higher-profitability within the large-cap value segment of developed ex U.S. markets. As of October 31, 2021, the Master Fund held approximately 510 securities in 22 eligible developed markets. Average cash exposure throughout the year was less than 1% of the Master Fund’s assets.
159
For the 12 months ended October 31, 2021, total returns were 50.55% for the Portfolio’s Class R2 shares, 50.90% for the Portfolio’s Institutional Class shares, and 35.59% for the MSCI World ex USA Index (net dividends), the Portfolio’s benchmark. With low relative price (value) stocks outperforming high relative price (growth) stocks for the period, the Master Fund’s focus on value stocks contributed positively to performance relative to the style-neutral benchmark.
160
DIMENSIONAL INVESTMENT GROUP INC.
DISCLOSURE OF FUND EXPENSES
(Unaudited)
The following Expense Table is shown so that you can understand the impact of fees on your investment. All mutual funds have operating expenses. As a shareholder of the fund, you incur ongoing costs, which include costs for portfolio management, administrative services, and shareholder reports, among others. Operating expenses and legal and audit services, which are deducted from a fund’s gross income, directly reduce the investment return of the fund. A fund’s expenses are expressed as a percentage of its average net assets. This figure is known as the expense ratio. The following examples are intended to help you understand the ongoing costs, in dollars, of investing in the fund and to compare these costs with those of other mutual funds. The examples are based on an investment of $1,000 made at the beginning of the period shown and held for the entire period.
The Expense Table below illustrates your fund’s costs in two ways.
Actual Fund Return
This section helps you to estimate the actual expenses after fee waivers that you paid over the period. The “Ending Account Value” shown is derived from the fund’s actual return, and “Expenses Paid During Period” reflects the dollar amount that would have been paid by an investor who started with $1,000 in the fund. You may use the information here, together with the amount you invested, to estimate the expenses that you paid over the period.
To do so, simply divide your account value by $1,000 (for example, a $7,500 account value divided by $1,000 = 7.5), then multiply the result by the number given for your fund under the heading “Expenses Paid During Period.”
Hypothetical Example for Comparison Purposes
This section is intended to help you compare your fund’s costs with those of other mutual funds. The hypothetical “Ending Account Value” and “Expenses Paid During Period” are derived from the fund’s actual expense ratio and an assumed 5% annual return before expenses. In this case, because the return used is not the fund’s actual return, the results do not apply to your investment. The example is useful in making comparisons because the SEC requires all mutual funds to calculate expenses based on a 5% annual return. You can assess your fund’s costs by comparing this hypothetical example with the hypothetical examples that appear in shareholder reports of other funds.
Please note that the expenses shown in the table are meant to highlight and help you compare ongoing costs only and do not reflect any transactional costs, if applicable. The “Annualized Expense Ratio” represents the actual expenses for the six-month period indicated.
161
DISCLOSURE OF FUND EXPENSES
CONTINUED
Six Months Ended October 31, 2021
EXPENSE TABLE
| | | | | | | | | | | | | | | | |
| | | Beginning | | | Ending | | | | | | Expenses | |
| | | Account | | | Account | | | Annualized | | | Paid | |
| | | Value | | | Value | | | Expense | | | During | |
| | | 05/01/21 | | | 10/31/21 | | | Ratio (1) | | | Period (1) | |
DFA International Value Portfolio (2) | | | | | | | | | | | | | | | | |
Actual Fund Return | | | | | | | | | | | | | | | | |
Class R2 Shares | | $ | 1,000.00 | | | $ | 1,056.00 | | | | 0.60 | % | | $ | 3.11 | |
Institutional Class Shares | | $ | 1,000.00 | | | $ | 1,057.20 | | | | 0.36 | % | | $ | 1.87 | |
Hypothetical 5% Annual Return | | | | | | | | | | | | | | | | |
Class R2 Shares | | $ | 1,000.00 | | | $ | 1,022.18 | | | | 0.60 | % | | $ | 3.06 | |
Institutional Class Shares | | $ | 1,000.00 | | | $ | 1,023.39 | | | | 0.36 | % | | $ | 1.84 | |
| (1) | Expenses are equal to the fund’s annualized expense ratio for the six-month period, multiplied by the average account value over the period, multiplied by the number of days in the most recent six-month period (184), then divided by the number of days in the year (365) to reflect the six-month period. |
| (2) | The Portfolio is a Feeder Fund. The expenses shown reflect the direct expenses of the Feeder Fund and the allocation of the Feeder Fund’s portion of the expenses of its Master Fund (Affiliated Investment Company). |
162
DIMENSIONAL INVESTMENT GROUP INC.
DISCLOSURE OF PORTFOLIO HOLDINGS
(Unaudited)
The SEC requires that all funds file a complete Schedule of Investments with the SEC for their first and third fiscal quarters as an exhibit to their reports on Form N-PORT. For Dimensional Investment Group Inc., this would be for the fiscal quarters ending January 31 and July 31. Such Form N-PORT filing must be made within 60 days of the end of the quarter. Dimensional Investment Group Inc. filed its most recent Form N-PORT with the SEC on September 24, 2021. They are available upon request, without charge, by calling collect: (512) 306-7400; by mailing a request to Dimensional Fund Advisors LP, 6300 Bee Cave Road, Building One, Austin, TX 78746; or by visiting the SEC’s website at http://www.sec.gov.
PORTFOLIO HOLDINGS
The SEC requires that all funds present their categories of portfolio holdings in a table, chart, or graph format in their annual and semi-annual shareholder reports, whether or not a Schedule of Investments is used. The following table, which presents portfolio holdings as a percentage of total investments before short-term investments and collateral for loaned securities, is provided in compliance with this requirement.
The categories of industry classification for the Affiliated Investment Company are represented in its Disclosure of Portfolio Holdings, which is included elsewhere in the report. Refer to the Summary Schedule of Portfolio Holdings for the underlying Affiliated Investment Company’s holdings, which reflect the investments by category.
FEEDER FUND
| | | | |
| | | Affiliated Investment Company | |
DFA International Value Portfolio | | | 100.0 | % |
163
DFA INTERNATIONAL VALUE PORTFOLIO
SCHEDULE OF INVESTMENTS
October 31, 2021
| | | | |
| | | Value† | |
AFFILIATED INVESTMENT COMPANIES — (100.0%) | | | | |
Investment in The DFA International Value Series of The DFA Investment Trust Company | | $ | 8,316,979,479 | |
| | | | |
TOTAL INVESTMENTS IN AFFILIATED INVESTMENT COMPANIES | | $ | 8,316,979,479 | |
| | | | |
Summary of the Portfolio’s Master Fund’s investments as of October 31, 2021, based on their valuation inputs, is located in this report (See Security Valuation Note).
See accompanying Notes to Financial Statements.
164
DIMENSIONAL INVESTMENT GROUP INC.
STATEMENT OF ASSETS AND LIABILITIES
OCTOBER 31, 2021
(Amounts in thousands, except share and per share amounts)
| | | | |
| | | DFA | |
| | | International | |
| | | Value Portfolio | |
ASSETS: | | | | |
Investments in Affiliated Investment Company at Value | | $ | 8,316,979 | |
Receivables: | | | | |
Fund Shares Sold | | | 2,639 | |
Prepaid Expenses and Other Assets | | | 56 | |
| | | | |
Total Assets | | | 8,319,674 | |
| | | | |
LIABILITIES: | | | | |
Payables: | | | | |
Fund Shares Redeemed | | | 3,955 | |
Due to Advisor | | | 705 | |
Accrued Expenses and Other Liabilities | | | 781 | |
| | | | |
Total Liabilities | | | 5,441 | |
| | | | |
NET ASSETS | | $ | 8,314,233 | |
| | | | |
NET ASSET VALUE, OFFERING AND REDEMPTION PRICE PER SHARE: | | | | |
Class R2 Shares — based on net assets of $1,753 and shares outstanding of 88,780 | | $ | 19.74 | |
| | | | |
NUMBER OF SHARES AUTHORIZED | | | 100,000,000 | |
| | | | |
Institutional Class Shares — based on net assets of $8,312,480 and shares outstanding of 419,860,628 | | $ | 19.80 | |
| | | | |
NUMBER OF SHARES AUTHORIZED | | | 1,500,000,000 | |
| | | | |
NET ASSETS CONSIST OF: | | | | |
Paid-In Capital | | $ | 7,198,087 | |
Total Distributable Earnings (Loss) | | | 1,116,146 | |
| | | | |
NET ASSETS | | $ | 8,314,233 | |
| | | | |
See accompanying Notes to Financial Statements.
165
DIMENSIONAL INVESTMENT GROUP INC.
STATEMENT OF OPERATIONS
FOR THE YEAR ENDED OCTOBER 31, 2021
(Amounts in thousands)
| | | | |
| | | DFA | |
| | | International | |
| | | Value Portfolio* | |
Investment Income | | | | |
Net Investment Income Allocated from Affiliated Investment Companies: | | | | |
Dividends (Net of Foreign Taxes Withheld of $28,683) | | $ | 301,702 | |
Income from Securities Lending | | | 2,931 | |
Expenses Allocated from Affiliated Investment Companies | | | (17,844 | ) |
| | | | |
Total Net Investment Income Allocated and/or Distributions Received from Affiliated Investment Companies | | | 286,789 | |
| | | | |
Fund Expenses | | | | |
Investment Management Fees | | | 25,884 | |
Accounting & Transfer Agent Fees | | | 1,157 | |
Shareholder Servicing Fees Class R2 Shares | | | 3 | |
Filing Fees | | | 187 | |
Shareholders’ Reports | | | 172 | |
Directors’/Trustees’ Fees & Expenses | | | 89 | |
Professional Fees | | | 33 | |
Other | | | 45 | |
| | | | |
Total Fund Expenses | | | 27,570 | |
| | | | |
Fees Waived, Expenses Reimbursed by Advisor (Note C) | | | | |
Class R2 Shares | | | 3 | |
Institutional Class Shares | | | 16,403 | |
| | | | |
Net Expenses | | | 11,164 | |
| | | | |
Net Investment Income (Loss) | | | 275,625 | |
| | | | |
Realized and Unrealized Gain (Loss) | | | | |
Net Realized Gain (Loss) on: | | | | |
Transactions Allocated from Affiliated Investment Company** | | | 377,980 | |
Change in Unrealized Appreciation (Depreciation) of: | | | | |
Transactions Allocated from Affiliated Investment Company | | | 2,522,431 | |
| | | | |
Net Realized and Unrealized Gain (Loss) | | | 2,900,411 | |
| | | | |
Net Increase (Decrease) in Net Assets Resulting from Operations | | $ | 3,176,036 | |
| | | | |
| ** | Net of foreign capital gain taxes withheld of $0. |
| * | Investment Income and Realized and Unrealized Gain (Loss) were allocated from the Portfolio’s Master Fund (Affiliated Investment Company). |
See accompanying Notes to Financial Statements.
166
DIMENSIONAL INVESTMENT GROUP INC.
STATEMENTS OF CHANGES IN NET ASSETS
(Amounts in thousands)
| | | | | | | | |
| | | DFA International Value Portfolio*** | |
| | | Year | | | Year | |
| | | Ended | | | Ended | |
| | | Oct 31, | | | Oct 31, | |
| | | 2021 | | | 2020 | |
Increase (Decrease) in Net Assets | | | | | | | | |
Operations: | | | | | | | | |
Net Investment Income (Loss) | | $ | 275,625 | | | $ | 198,052 | |
Net Realized Gain (Loss) on: | | | | | | | | |
Transactions Allocated from Affiliated Investment Company*,** | | | 377,980 | | | | (316,959 | ) |
Change in Unrealized Appreciation (Depreciation) of: | | | | | | | | |
Transactions Allocated from Affiliated Investment Company | | | 2,522,431 | | | | (1,563,162 | ) |
| | | | | | | | |
Net Increase (Decrease) in Net Assets Resulting from Operations | | | 3,176,036 | | | | (1,682,069 | ) |
| | | | | | | | |
Distributions: | | | | | | | | |
Class R2 Shares | | | (43 | ) | | | (29 | ) |
Institutional Class Shares | | | (258,413 | ) | | | (226,414 | ) |
| | | | | | | | |
Total Distributions | | | (258,456 | ) | | | (226,443 | ) |
| | | | | | | | |
Capital Share Transactions (1): | | | | | | | | |
Shares Issued | | | 1,043,206 | | | | 2,636,246 | |
Shares Issued in Lieu of Cash Distributions | | | 254,720 | | | | 222,167 | |
Shares Redeemed | | | (2,459,596 | ) | | | (3,566,247 | ) |
| | | | | | | | |
Net Increase (Decrease) from Capital Share Transactions | | | (1,161,670 | ) | | | (707,834 | ) |
| | | | | | | | |
Total Increase (Decrease) in Net Assets | | | 1,755,910 | | | | (2,616,346 | ) |
Net Assets | | | | | | | | |
Beginning of Year | | | 6,558,323 | | | | 9,174,669 | |
| | | | | | | | |
End of Year | | $ | 8,314,233 | | | $ | 6,558,323 | |
| | | | | | | | |
(1) Shares Issued and Redeemed: | | | | | | | | |
Shares Issued | | | 56,340 | | | | 194,702 | |
Shares Issued in Lieu of Cash Distributions | | | 13,672 | | | | 14,542 | |
Shares Redeemed | | | (134,474 | ) | | | (258,909 | ) |
| | | | | | | | |
Net Increase (Decrease) from Shares Issued and Redeemed | | | (64,462 | ) | | | (49,665 | ) |
| | | | | | | | |
| * | Net of foreign capital gain taxes withheld for the fiscal year ended October 31, 2021 of $0. |
| ** | Net of foreign capital gain taxes withheld for the fiscal year ended October 31, 2020 of $0. |
| *** | Investment Income and Realized and Unrealized Gain (Loss) were allocated from the Portfolio’s Master Fund (Affiliated Investment Company). |
See accompanying Notes to Financial Statements.
167
DIMENSIONAL INVESTMENT GROUP INC.
FINANCIAL HIGHLIGHTS
(for a share outstanding throughout each period)
| | | | | | | | | | | | | | | | | | | | |
| | | DFA International Value Portfolio-Class R2 Shares | |
| | | Year | | | Year | | | Year | | | Year | | | Year | |
| | | Ended | | | Ended | | | Ended | | | Ended | | | Ended | |
| | | Oct 31, | | | Oct 31, | | | Oct 31, | | | Oct 31, | | | Oct 31, | |
| | | 2021 | | | 2020 | | | 2019 | | | 2018 | | | 2017 | |
Net Asset Value, Beginning of Year | | $ | 13.50 | | | $ | 17.13 | | | $ | 17.68 | | | $ | 19.89 | | | $ | 16.27 | |
Income from Investment Operations (A) | | | | | | | | | | | | | | | | | | | | |
Net Investment Income (Loss) | | | 0.62 | | | | 0.38 | | | | 0.58 | | | | 0.54 | | | | 0.55 | |
Net Gains (Losses) on Securities (Realized and Unrealized) | | | 6.17 | | | | (3.61 | ) | | | (0.10 | ) | | | (2.21 | ) | | | 3.61 | |
| | | | | | | | | | | | | | | | | | | | |
Total from Investment Operations | | | 6.79 | | | | (3.23 | ) | | | 0.48 | | | | (1.67 | ) | | | 4.16 | |
| | | | | | | | | | | | | | | | | | | | |
Less Distributions: | | | | | | | | | | | | | | | | | | | | |
Net Investment Income | | | (0.55 | ) | | | (0.40 | ) | | | (0.51 | ) | | | (0.54 | ) | | | (0.54 | ) |
Net Realized Gains | | | — | | | | — | | | | (0.52 | ) | | | — | | | | — | |
| | | | | | | | | | | | | | | | | | | | |
Total Distributions | | | (0.55 | ) | | | (0.40 | ) | | | (1.03 | ) | | | (0.54 | ) | | | (0.54 | ) |
| | | | | | | | | | | | | | | | | | | | |
Net Asset Value, End of Year | | $ | 19.74 | | | $ | 13.50 | | | $ | 17.13 | | | $ | 17.68 | | | $ | 19.89 | |
| | | | | | | | | | | | | | | | | | | | |
Total Return | | | 50.55 | % | | | (19.08 | %) | | | 3.13 | % | | | (8.59 | %) | | | 25.99 | % |
| | | | | | | | | | | | | | | | | | | | |
Net Assets, End of Year (thousands) | | $ | 1,753 | | | $ | 835 | | | $ | 1,191 | | | $ | 1,477 | | | $ | 3,508 | |
Ratio of Expenses to Average Net Assets (F) | | | 0.60 | % | | | 0.65 | % | | | 0.69 | % | | | 0.68 | % | | | 0.68 | % |
Ratio of Expenses to Average Net Assets (Excluding Fees Waived, Expenses Reimbursed by Advisor) (F) | | | 0.80 | % | | | 0.85 | % | | | 0.89 | % | | | 0.88 | % | | | 0.88 | % |
Ratio of Net Investment Income to Average Net Assets | | | 3.31 | % | | | 2.56 | % | | | 3.43 | % | | | 2.72 | % | | | 3.07 | % |
| | | | | | | | | | | | | | | | | | | | |
See page 1-2 for the Definitions of Abbreviations and Footnotes.
See accompanying Notes to Financial Statements.
168
DIMENSIONAL INVESTMENT GROUP INC.
FINANCIAL HIGHLIGHTS
(for a share outstanding throughout each period)
| | | | | | | | | | | | | | | | | | | | |
| | | DFA International Value Portfolio-Institutional Class Shares | |
| | | Year | | | Year | | | Year | | | Year | | | Year | |
| | | Ended | | | Ended | | | Ended | | | Ended | | | Ended | |
| | | Oct 31, | | | Oct 31, | | | Oct 31, | | | Oct 31, | | | Oct 31, | |
| | | 2021 | | | 2020 | | | 2019 | | | 2018 | | | 2017 | |
Net Asset Value, Beginning of Year | | $ | 13.54 | | | $ | 17.18 | | | $ | 17.74 | | | $ | 19.94 | | | $ | 16.30 | |
| | | | | | | | | | | | | | | | | | | | |
Income from Investment Operations (A) | | | | | | | | | | | | | | | | | | | | |
Net Investment Income (Loss) | | | 0.62 | | | | 0.38 | | | | 0.63 | | | | 0.60 | | | | 0.56 | |
Net Gains (Losses) on Securities (Realized and Unrealized) | | | 6.23 | | | | (3.58 | ) | | | (0.11 | ) | | | (2.21 | ) | | | 3.66 | |
| | | | | | | | | | | | | | | | | | | | |
Total from Investment Operations | | | 6.85 | | | | (3.20 | ) | | | 0.52 | | | | (1.61 | ) | | | 4.22 | |
| | | | | | | | | | | | | | | | | | | | |
Less Distributions: | | | | | | | | | | | | | | | | | | | | |
Net Investment Income | | | (0.59 | ) | | | (0.44 | ) | | | (0.56 | ) | | | (0.59 | ) | | | (0.58 | ) |
Net Realized Gains | | | — | | | | — | | | | (0.52 | ) | | | — | | | | — | |
| | | | | | | | | | | | | | | | | | | | |
Total Distributions | | | (0.59 | ) | | | (0.44 | ) | | | (1.08 | ) | | | (0.59 | ) | | | (0.58 | ) |
| | | | | | | | | | | | | | | | | | | | |
Net Asset Value, End of Year | | $ | 19.80 | | | $ | 13.54 | | | $ | 17.18 | | | $ | 17.74 | | | $ | 19.94 | |
| | | | | | | | | | | | | | | | | | | | |
Total Return | | | 50.90 | % | | | (18.87 | %) | | | 3.37 | % | | | (8.32 | %) | | | 26.36 | % |
| | | | | | | | | | | | | | | | | | | | |
Net Assets, End of Year (thousands) | | $ | 8,312,480 | | | $ | 6,557,488 | | | $ | 9,173,478 | | | $ | 9,421,965 | | | $ | 9,837,631 | |
Ratio of Expenses to Average Net Assets (F) | | | 0.36 | % | | | 0.40 | % | | | 0.44 | % | | | 0.43 | % | | | 0.43 | % |
Ratio of Expenses to Average Net Assets (Excluding Fees Waived, Expenses Reimbursed by Advisor) (F) | | | 0.56 | % | | | 0.60 | % | | | 0.64 | % | | | 0.63 | % | | | 0.63 | % |
Ratio of Net Investment Income to Average Net Assets | | | 3.36 | % | | | 2.57 | % | | | 3.70 | % | | | 3.01 | % | | | 3.12 | % |
| | | | | | | | | | | | | | | | | | | | |
See page 1-2 for the Definitions of Abbreviations and Footnotes.
See accompanying Notes to Financial Statements.
169
DIMENSIONAL INVESTMENT GROUP INC.
NOTES TO FINANCIAL STATEMENTS
A. Organization:
Dimensional Investment Group Inc. (the “Fund”) is an open-end management investment company registered under the Investment Company Act of 1940, whose shares are generally offered to institutional investors, retirement plans and clients of registered investment advisors. The Fund consists of eleven portfolios, one of which, the DFA International Value Portfolio (the “Portfolio”), is presented in this section of the report. The remaining operational portfolios are presented in separate reports. The Portfolio is an investment company, and accordingly, follows the accounting and reporting guidance under the Financial Accounting Standards Board (“FASB”) Accounting Standards Certification (“ASC”), Topic 946, “Financial Services-Investment Companies.”
The Portfolio invests substantially all of its assets in The DFA International Value Series (the “Series”), a corresponding series of The DFA Investment Trust Company. As of October 31, 2021, the Portfolio owned 68% of the Series. The financial statements of the Series are included elsewhere in this report and should be read in conjunction with the financial statements of the Portfolio.
B. Significant Accounting Policies:
The following significant accounting policies are in conformity with accounting principles generally accepted in the United States of America. Such policies are consistently followed by the Fund in preparation of its financial statements. The preparation of financial statements in accordance with accounting principles generally accepted in the United States of America requires management to make estimates and assumptions that affect the fair value of investments, the reported amounts of assets and liabilities, the disclosure of contingent assets and liabilities at the date of the financial statements, and the reported amounts of increases and decreases in net assets from operations during the reporting period. Actual results could differ from those estimates, and those differences could be material.
1. Security Valuation: The Portfolio uses a fair value hierarchy, which prioritizes the inputs-to-valuation techniques used to measure fair value into three broad levels described below:
| | • | | Level 1 – inputs are quoted prices in active markets for identical securities (including equity securities, open-end investment companies, and futures contracts) |
| | • | | Level 2 – other significant observable inputs (including quoted prices for similar securities, interest rates, prepayment speeds, credit risk, etc.) |
| | • | | Level 3 – significant unobservable inputs (including the Portfolio’s own assumptions in determining the fair value of investments) |
The Portfolio’s investment reflects its proportionate interests in the net assets of the Series. The valuation is classified as Level 1 in the hierarchy.
Securities for which no market quotations are readily available (including restricted securities), or for which market quotations have become unreliable, are valued in good faith at fair value in accordance with procedures adopted by the Board of Directors of the Fund. Fair value pricing may also be used if events that have a significant effect on the value of an investment (as determined in the discretion of Dimensional Fund Advisors LP) occur before the net asset value of the Portfolio is calculated. When fair value pricing is used, the prices of securities used by the Portfolio may differ from the quoted or published prices for the same securities on their primary markets or exchanges. These securities are generally categorized as Level 2 or Level 3 in the hierarchy.
A summary of the inputs used to value the Portfolio’s investments by each major security type, industry and/or country is disclosed previously in this note. A valuation hierarchy table has been included at the end of the Schedule of Investments. The methodology or inputs used for valuing securities are not necessarily an indication of the risk associated with investing in those securities.
170
2. Deferred Compensation Plan: Each eligible Director of the Fund may elect to participate in the Fee Deferral Plan for Independent Directors and Trustees (the “Plan”). Under the Plan, effective January 1, 2002, such Directors may defer payment of all or a portion of their total fees earned as a Director. These deferred amounts may be treated as though such amounts had been invested in shares of the following funds: the U.S. Large Cap Value Portfolio, U.S. Core Equity 1 Portfolio, U.S. Large Company Portfolio, U.S. Vector Equity Portfolio, U.S. Micro Cap Portfolio, DFA International Value Portfolio, International Core Equity Portfolio, Emerging Markets Portfolio, Emerging Markets Core Equity Portfolio, DFA Inflation-Protected Securities Portfolio, and/or DFA Two-Year Global Fixed Income Portfolio. Contributions made under the Plan and the change in unrealized appreciation (depreciation) and income are included in Directors’/ Trustees’ Fees & Expenses.
The Directors may receive their distributions of proceeds by one of the following methods: lump sum, annual installments over a period of agreed-upon years, or quarterly installments over a period of agreed-upon years. Each Director shall have the right in a notice of election (the “Notice”) to defer the receipt of the Director’s deferred compensation until a date specified by such Director in the Notice. The date may not be sooner than the earlier of: (i) the first business day of January following the year in which such Director ceases to be a member of the Board of Directors of the Fund; and (ii) five years following the effective date of the Director’s first deferral election. If a Director who elects to defer fees fails to designate in the Notice a time or date as of which payment of the Director’s deferred fee account shall commence, payment of such amount shall commence as of the first business day of January following the year in which the Director ceases to be a member of the Board (unless the Director files an amended Notice selecting a different distribution date).
3. Other: The Portfolio recognizes its pro-rata share, on a daily basis, of net investment income and realized and unrealized gains and losses of investment securities from the Series, which is treated as a partnership for federal income tax purposes. Dividend income and distributions to shareholders are recorded on the ex-dividend date. Distributions received on securities that represent a return of capital or capital gains are recorded as a reduction of cost of investments or as a realized gain, respectively. The Portfolio estimates the character of received distributions that may be considered return of capital distributions. Expenses directly attributable to the Portfolio are directly charged. Common expenses of the Fund or the Portfolio are allocated using methods approved by the Board of Directors, generally based on average net assets.
Class R2 Shares and Institutional Class Shares have equal rights to assets and earnings of the Portfolio. Income, gains and losses, and common expenses of the Portfolio are allocated to each class of shares based on its relative net assets. Each class will bear its own class-specific expenses, if any.
C. Investment Advisor:
The Advisor, Dimensional Fund Advisors LP, provides investment management services to the Portfolio. For the year ended October 31, 2021, the Portfolio’s investment management fees were accrued daily and paid monthly to the Advisor based on the following effective annual rates of average daily net assets:
| | | | |
DFA International Value Portfolio | | | 0.32 | %* |
| * | Effective as of February 28, 2021, the management fee payable by the Portfolio was reduced from 0.35% to 0.30%. |
Pursuant to an Amended and Restated Fee Waiver and/or Expense Assumption Agreement (the “Fee Waiver Agreement”), the Advisor has contractually agreed to waive certain fees, and in certain instances, assume certain expenses of the Portfolio, as described in the notes below. A portion of the Fee Waiver Agreement for the Portfolio will remain in effect through February 28, 2022, may only be terminated by the Fund’s Board of Directors prior to that date and shall continue in effect from year to year thereafter unless terminated by the Fund or the Advisor. The Fee Waiver Agreement with respect to the total management fees paid by the Portfolio, as described in the notes below, will remain in effect permanently, unless terminated by the Portfolio. During the year ended October 31, 2021, the Portfolio had expense limits based on a percentage of average net assets on an annualized basis, and the Advisor recovered previously waived fees and/or assumed expenses (amounts in thousands), as listed below. The net amount of waived fees/expenses assumed (recovered previously waived fees/expenses assumed) during the year ended October 31, 2021, and the previously waived fees/expenses assumed subject to future recovery by the
171
Advisor as of October 31, 2021, are also reflected below (amounts in thousands). At any time that the Annualized Expense Ratio (defined below) of the Class R2 shares of the Portfolio are less than the Expense Limitation Amount listed below, the Advisor retains the right to recover fees previously waived and/or expenses previously assumed to the extent that the expense ratio following such recovery would be less than the Expense Limitation Amount that was in place when such prior year fees were waived and/or expenses assumed, and less than the current Expense Limitation Amount for the Portfolio. The Advisor, however, will not be reimbursed by the Portfolio in connection with its Permanent Fee Waiver. The Fund, on behalf of the Portfolio, is also not obligated to reimburse the Advisor for fees previously waived or expenses previously assumed by the Advisor more than thirty-six months before the date of recovery.
| | | | | | | | | | | | | | | | | | | | |
| | | | | | | | | | | | | | | Previously | |
| | | | | | | | | Recovery | | | | | | Waived Fees/ | |
| | | Expense | | | Total | | | of Previously | | | Waived Fees/ | | | Expenses Assumed | |
| | | Limitation | | | Management | | | Waived Fees/ | | | Expenses | | | Subject to Future | |
Institutional Class Shares | | Amount | | | Fee Limit | | | Expenses Assumed | | | Assumed | | | Recovery | |
DFA International Value Portfolio (1) | | | — | | | | 0.30 | % | | | — | | | $ | 16,403 | | | | — | |
Class R2 Shares | | | | | | | | | | | | | | | | | | | | |
DFA International Value Portfolio (2) | | | 0.79 | % | | | 0.30 | % | | | — | | | | 3 | | | | — | |
| (1) | Effective February 28, 2021, the Advisor has contractually agreed to permanently waive all or a portion of the management fee of the Portfolio to the extent necessary to limit the total management fees paid to the Advisor by the Portfolio, including the proportionate share of the management fees the Portfolio pays indirectly through its investment in other funds managed by the Advisor, except for the fees paid indirectly through its investment of securities lending cash collateral in The DFA Short Term Investment Fund, to the rate listed above as a percentage of the average net assets of the Institutional Class of the Portfolio on an annualized basis (the “Permanent Fee Waiver”). From February 28, 2020 to February 27, 2021, the Permanent Fee Waiver Limit was 0.35%. From July 21, 2015 to February 27, 2020, the Permanent Fee Waiver Limit was 0.40%. |
| (2) | Effective February 28, 2021, the Advisor has contractually agreed to permanently waive all or a portion of the management fee of the DFA International Value Portfolio to the extent necessary to limit the total management fees paid to the Advisor by the Portfolio, including the proportionate share of the management fees the Portfolio pays indirectly through its investment in other funds managed by the Advisor, except for the fees paid indirectly through its investment of securities lending cash collateral in The DFA Short Term Investment Fund, to 0.30% of the average net assets of a class of the Portfolio on an annualized basis (the “Permanent Fee Waiver”). From February 28, 2020 to February 27, 2021, the Permanent Fee Waiver Limit was 0.35%. From July 21, 2015 to February 27, 2020, the Permanent Fee Waiver Limit was 0.40%. In addition to the Permanent Fee Waiver, the Advisor has contractually agreed (including for the time period prior to July 21, 2015) to assume the direct expenses of Class R2 shares of the Portfolio (excluding management fees and custodian fees), to the extent necessary to limit the annualized expenses of Class R2 shares of the Portfolio (excluding the expenses the Portfolio incurs indirectly through investment in other investment companies) to the rate listed above (the “Annualized Expense Ratio”). |
Fees Paid to Officers and Directors/Trustees:
Certain Officers and Directors of the Advisor are also Officers and Directors of the Fund; however, such Officers and Directors (with the exception of the Chief Compliance Officer (“CCO”)) receive no compensation from the Fund. For the year ended October 31, 2021, the total related amounts paid by the Fund to the CCO were $14 (in thousands). The total related amounts paid by the Portfolio are included in Other Expenses on the Statement of Operations.
D. Deferred Compensation:
As of October 31, 2021, the total liability for deferred compensation to Directors is included in Accrued Expenses and Other Liabilities on the Statement of Assets and Liabilities as follows (amount in thousands):
| | | | |
DFA International Value Portfolio | | $ | 282 | |
172
E. Federal Income Taxes:
The Portfolio has qualified and intends to continue to qualify as a regulated investment company under Subchapter M of the Internal Revenue Code for federal income tax purposes and to distribute substantially all of its taxable income and net capital gains to its shareholders. Accordingly, no provision has been made for federal income taxes.
Distributions from net investment income and net realized capital gains are determined in accordance with U.S. federal income tax regulations, which may differ from those amounts determined under accounting principles generally accepted in the United States of America. These book/tax differences are either temporary or permanent in nature. To the extent that these differences are permanent, they are charged or credited to paid-in capital or distributable earnings, undistributed net investment income, accumulated net realized gains or losses, or unrealized appreciation, as appropriate, in the period that the differences arise. Accordingly, the permanent differences as of October 31, 2021, can occur as a result of realized gains on securities considered to be “passive foreign investment companies”, net foreign currency gains/losses, and foreign capital gains tax reclass, and were reclassified to the accounts mentioned above. These reclassifications had no effect on net assets or net asset value per share.
The tax character of dividends and distributions declared and paid during the years ended October 31, 2020, and October 31, 2021, were as follows (amounts in thousands):
| | | | | | | | | | | | | | | | |
| | | Net Investment
Income and
Short-Term
Capital Gains | | | Long-Term
Capital Gains | | | Tax
Exempt
Income | | | Total | |
DFA International Value Portfolio | | | | | | | | | | | | | | | | |
2020 | | $ | 226,443 | | | | — | | | | — | | | $ | 226,443 | |
2021 | | | 258,456 | | | | — | | | | — | | | | 258,456 | |
As of October 31, 2021, the following net investment income and short-term capital gains and long-term capital gains distributions designated for federal income tax purposes are due to the use of accumulated earnings and profits distributed to shareholders upon redemption of shares (amounts in thousands):
| | | | | | | | | | | | |
| | | Net Investment | | | | | | | |
| | | Income and | | | | | | | |
| | | Short-Term | | | Long-Term | | | | |
| | | Capital Gains | | | Capital Gains | | | Total | |
DFA International Value Portfolio | | $ | (2,374 | ) | | | — | | | $ | (2,374 | ) |
As of October 31, 2021, the components of distributable earnings (accumulated losses) were as follows (amounts in thousands):
| | | | | | | | | | | | | | | | |
| | | Undistributed | | | | | | | | | Total Net | |
| | | Net Investment | | | | | | | | | Distributable | |
| | | Income and | | | Undistributed | | | Unrealized | | | Earnings | |
| | | Short-Term | | | Long-Term | | | Appreciation | | | (Accumulated | |
| | | Capital Gains | | | Capital Gains | | | (Depreciation) | | | Losses) | |
DFA International Value Portfolio | | $ | 109,693 | | | | — | | | $ | 1,006,924 | | | $ | 1,116,617 | |
For federal income tax purposes, the Fund measures its capital loss carryforwards annually at October 31, its fiscal year end. Capital loss carryforwards may be carried forward and applied against future capital gains. As of October 31, 2021, the Portfolio did not have capital loss carryforwards available to offset future realized capital gains.
During the year ended October 31, 2021, the Portfolio used the following capital loss carryforwards to offset realized capital gains for federal income tax purposes (amount in thousands):
| | | | |
DFA International Value Portfolio | | $ | 349,633 | |
173
As of October 31, 2021, the total cost and aggregate gross unrealized appreciation (depreciation) of securities for federal income tax purposes were different from amounts reported for financial reporting purposes, as follows (amounts in thousands):
| | | | | | | | | | | | | | | | |
| | | | | | | | | | | | Net | |
| | | | | | | | | | | | Unrealized | |
| | | Federal | | | Unrealized | | | Unrealized | | | Appreciation | |
| | | Tax Cost | | | Appreciation | | | (Depreciation) | | | (Depreciation) | |
DFA International Value Portfolio | | $ | 7,309,852 | | | $ | 1,128,895 | | | $ | (121,757 | ) | | $ | 1,007,138 | |
The difference between GAAP-basis and tax-basis unrealized gains (losses) can occur as a result of wash sales and net mark to market gains (losses) on regulated futures contracts, net mark-to-market gain/loss on foreign currency contracts, and differences in the tax treatment of passive foreign investment company investments.
ASC 740 Accounting for Uncertainty in Income Taxes sets forth a minimum threshold for financial statement recognition of the benefit of a tax position taken or expected to be taken in a tax return. Management has analyzed the Portfolio’s tax positions and has concluded that no additional provision for income tax is required in the Portfolio’s financial statements. The Portfolio is not aware of any tax positions for which it is more likely than not that the total amounts of unrecognized tax benefits will significantly change in the next twelve months. The Portfolio’s federal tax returns for the prior three fiscal years remain subject to examination by the Internal Revenue Service.
F. Capital Share Transactions:
The capital share transactions by class were as follows (amounts in thousands):
| | | | | | | | | | | | | | | | |
| | | Year Ended | | | Year Ended | |
| | | October 31, 2021 | | | October 31, 2020 | |
| | | Amount | | | Shares | | | Amount | | | Shares | |
DFA International Value Portfolio | | | | | | | | | | | | | | | | |
Class R2 Shares | | | | | | | | | | | | | | | | |
Shares Issued | | $ | 1,954 | | | | 104 | | | $ | 354 | | | | 23 | |
Shares Issued in Lieu of Cash Distributions | | | 43 | | | | 2 | | | | 29 | | | | 2 | |
Shares Redeemed | | | (1,495 | ) | | | (80 | ) | | | (473 | ) | | | (32 | ) |
| | | | | | | | | | | | | | | | |
Net Increase (Decrease) — Class R2 Shares | | $ | 502 | | | | 26 | | | $ | (90 | ) | | | (7 | ) |
| | | | | | | | | | | | | | | | |
Institutional Class Shares | | | | | | | | | | | | | | | | |
Shares Issued | | $ | 1,041,251 | | | | 56,236 | | | $ | 2,635,892 | | | | 194,679 | |
Shares Issued in Lieu of Cash Distributions | | | 254,677 | | | | 13,670 | | | | 222,138 | | | | 14,540 | |
Shares Redeemed | | | (2,458,101 | ) | | | (134,394 | ) | | | (3,565,774 | ) | | | (258,877 | ) |
| | | | | | | | | | | | | | | | |
Net Increase (Decrease) — Institutional Class Shares | | $ | (1,162,173 | ) | | | (64,488 | ) | | $ | (707,744 | ) | | | (49,658 | ) |
| | | | | | | | | | | | | | | | |
G. Shareholder Servicing Fees:
The Class R2 Shares pay a shareholder servicing fee in an amount up to 0.25% of their annual average net assets to compensate service agents that provide shareholder servicing, record keeping, account maintenance and other services to investors in the DFA International Value Portfolio’s Class R2 Shares.
H. Indemnitees; Contractual Obligations:
Under the Fund’s organizational documents, its Officers and Directors are indemnified against certain liabilities arising out of the performance of their duties to the Fund.
174
In the normal course of business, the Fund enters into contracts that contain a variety of representations and warranties that provide general indemnification. The Fund’s maximum exposure under these arrangements is unknown, as this would involve future claims that may be made against the Fund and/or its affiliates that have not yet occurred. However, based on experience, the Fund expects the risk of loss to be remote.
I. Recently Issued Accounting Standards and Regulations:
In March 2020, the Financial Accounting Standards Board (FASB) issued Accounting Standards Update (ASU) No. 2020-04, Reference Rate Reform (Topic 848) – Facilitation of the Effects of Reference Rate Reform on Financial Reporting. In January 2021, the FASB issued ASU No. 2021-01, with further amendments to Topic 848. The amendments in the ASUs provide optional temporary accounting recognition and financial reporting relief from the effect of certain types of contract modifications due to the planned discontinuation of the LIBOR and other interbank-offered based reference rates as of the end of 2021 and 2023. The ASUs are effective for certain reference rate-related contract modifications that occur during the period March 12, 2020 through December 31, 2022. Management has reviewed the requirements and believes the adoption of these ASUs will not have a material impact on the Portfolio’s financial statements.
In October 2020, the SEC adopted new regulations governing the use of derivatives by registered investment companies. Rule 18f-4 (the “Derivatives Rule”) imposes limits on the amount of derivatives contracts the Portfolio could enter, eliminate the asset segregation framework currently used by the Portfolio to comply with Section 18 of the 1940 Act, and require funds whose use of derivatives is more than a limited specified exposure to establish and maintain a derivatives risk management program and appoint a derivatives risk manager. The Derivatives Rule became effective February 19, 2021 and the Portfolio is required to comply on August 19, 2022. Management is currently evaluating the effect, if any, the Derivatives Rule will have on the Portfolio.
On December 3, 2020, the SEC adopted new Rule 2a-5 (the “Valuation Rule”) under the Investment Company Act of 1940, establishing an updated regulatory framework for fund valuation. The Valuation Rule, in part, provides a framework for good faith fair value determination and permits a Board to designate fair value determinations to a fund’s investment adviser. Further, the SEC is rescinding previously issued guidance on related issues. The Valuation Rule became effective on March 8, 2021, with a compliance date of September 8, 2022. Management is currently evaluating the Valuation Rule and its effect on the Portfolio.
J. Coronavirus (COVID-19) Pandemic:
The ongoing outbreak of the novel coronavirus, COVID-19, has resulted, at times, in market closures, market volatility, liquidity constraints and increased trading costs. Efforts to contain the spread of COVID-19 have resulted in global travel restrictions and disruptions of healthcare systems, business operations and supply chains, layoffs, reduced consumer demand, defaults and credit rating downgrades, and other significant economic impacts. The effects of COVID-19 have impacted global economic activity and may heighten pre-existing political, social and economic risks, domestically or globally. The full impact of the COVID-19 pandemic is unpredictable and may adversely affect the Portfolio’s performance.
K. Other:
As of October 31, 2021, the following number of shareholders held the following approximate percentages of the Portfolio’s outstanding shares. One or more of the shareholders may be omnibus accounts, which typically hold shares for the benefit of several other underlying investors.
| | | | | | | | |
| | | | | | Approximate | |
| | | | | | Percentage | |
| | | Number of | | | of Outstanding | |
| | | Shareholders | | | Shares | |
DFA International Value Portfolio-Class R2 | | | 5 | | | | 94 | % |
DFA International Value Portfolio-Institutional Class | | | 3 | | | | 65 | % |
175
The Portfolio is subject to claims and suits that arise from time to time in the ordinary course of business (for example, ongoing claw back litigation against former shareholders of portfolio companies that filed for bankruptcy, such as The Tribune Company and Nine West). Although management currently believes that resolving claims against the Portfolio, individually or in aggregate, will not have a material adverse impact on the Portfolio’s financial position, results of operations, or cash flows, these matters are subject to inherent uncertainties and management’s view of these matters may change in the future.
On June 3, 2021, President Biden issued an Executive Order titled ”Addressing the Threat from Securities Investments that Finance Certain Companies of the People’s Republic of China” (the “Order”). Effective on August 2, 2021, the Order restricts investment in certain companies identified as “Chinese Military Industrial Complex Companies” (CMICs) by the Office of Foreign Asset Control, an agency of the Department of Treasury and the Department of Defense. As of July 27, 2021, the Series have divested of all publicly traded securities identified as CMIC’s listed in the Order.
L. Subsequent Event Evaluations:
Management has evaluated the impact of all subsequent events on the Portfolio through the date on which the financial statements were issued and has determined that there are no subsequent events requiring recognition or disclosure in the financial statements.
176
Report of Independent Registered Public Accounting Firm
To the Board of Directors of Dimensional Investment Group Inc. and Shareholders of DFA International Value Portfolio
Opinion on the Financial Statements
We have audited the accompanying statement of assets and liabilities, including the schedule of investments, of DFA International Value Portfolio (one of the portfolios constituting Dimensional Investment Group Inc., hereafter referred to as the “Portfolio”) as of October 31, 2021, the related statement of operations for the year ended October 31, 2021, the statement of changes in net assets for each of the two years in the period ended October 31, 2020, including the related notes, and the financial highlights for each of the five years in the period ended October 31, 2021 (collectively referred to as the “financial statements”). In our opinion, the financial statements present fairly, in all material respects, the financial position of the Portfolio as of October 31, 2021, the results of its operations for the year then ended, the changes in its net assets for each of the two years in the period ended October 31, 2021 and the financial highlights for each of the five years in the period ended October 31, 2021 in conformity with accounting principles generally accepted in the United States of America.
Basis for Opinion
These financial statements are the responsibility of the Portfolio’s management. Our responsibility is to express an opinion on the Portfolio’s financial statements based on our audits. We are a public accounting firm registered with the Public Company Accounting Oversight Board (United States) (PCAOB) and are required to be independent with respect to the Portfolio in accordance with the U.S. federal securities laws and the applicable rules and regulations of the Securities and Exchange Commission and the PCAOB.
We conducted our audits of these financial statements in accordance with the standards of the PCAOB. Those standards require that we plan and perform the audit to obtain reasonable assurance about whether the financial statements are free of material misstatement, whether due to error or fraud.
Our audits included performing procedures to assess the risks of material misstatement of the financial statements, whether due to error or fraud, and performing procedures that respond to those risks. Such procedures included examining, on a test basis, evidence regarding the amounts and disclosures in the financial statements. Our audits also included evaluating the accounting principles used and significant estimates made by management, as well as evaluating the overall presentation of the financial statements. Our procedures included confirmation of the security owned as of October 31, 2021 by correspondence with the transfer agent of the investee fund. We believe that our audits provide a reasonable basis for our opinion.
/s/ PricewaterhouseCoopers LLP
Philadelphia, Pennsylvania
December 22, 2021
We have served as the auditor of one or more investment companies in Dimensional Fund Advisors L.P. investment company group since 1981.
177
THE DFA INVESTMENT TRUST COMPANY
PERFORMANCE CHARTS
(Unaudited)
The DFA International Value Series vs.
MSCI World ex USA Index (net dividends)
October 31, 2011-October 31, 2021
| | |
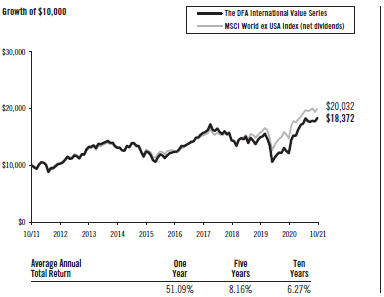 | | Past performance is not predictive of future performance. The returns shown do not reflect the deduction of taxes that a shareholder would pay on fund distributions or the redemption of fund shares. MSCI data © MSCI 2021, all rights reserved. |
The Japanese Small Company Series vs.
MSCI Japan Small Cap Index (net dividends)
October 31, 2011-October 31, 2021
| | |
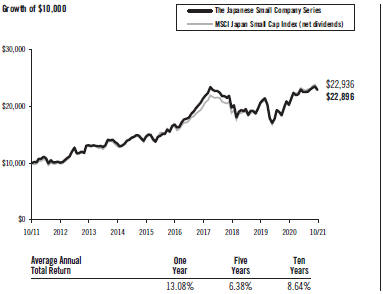 | | Past performance is not predictive of future performance. The returns shown do not reflect the deduction of taxes that a shareholder would pay on fund distributions or the redemption of fund shares. MSCI data © MSCI 2021, all rights reserved. |
178
THE DFA INVESTMENT TRUST COMPANY
PERFORMANCE CHARTS
(Unaudited)
The Asia Pacific Small Company Series vs.
MSCI Pacific ex Japan Small Cap Index (net dividends)
October 31, 2011-October 31, 2021
| | |
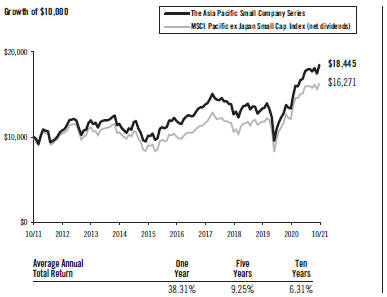 | | Past performance is not predictive of future performance. The returns shown do not reflect the deduction of taxes that a shareholder would pay on fund distributions or the redemption of fund shares. MSCI data © MSCI 2021, all rights reserved. |
The United Kingdom Small Company Series vs.
MSCI United Kingdom Small Cap Index (net dividends)
October 31, 2011-October 31, 2021
| | |
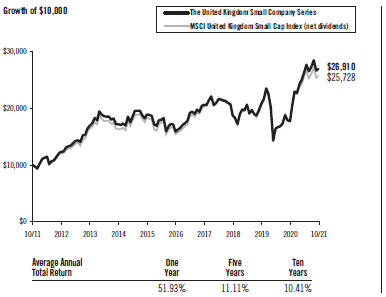 | | Past performance is not predictive of future performance. The returns shown do not reflect the deduction of taxes that a shareholder would pay on fund distributions or the redemption of fund shares. MSCI data © MSCI 2021, all rights reserved. |
179
THE DFA INVESTMENT TRUST COMPANY
PERFORMANCE CHARTS
(Unaudited)
The Continental Small Company Series vs.
MSCI Europe ex UK Small Cap Index (net dividends)
October 31, 2011-October 31, 2021
| | |
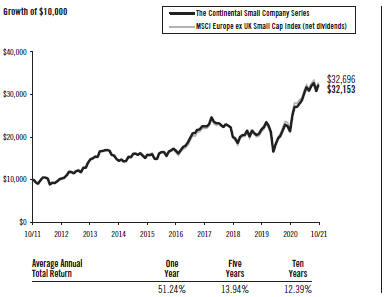 | | Past performance is not predictive of future performance. The returns shown do not reflect the deduction of taxes that a shareholder would pay on fund distributions or the redemption of fund shares. MSCI data © MSCI 2021, all rights reserved. |
The Canadian Small Company Series vs.
MSCI Canada Small Cap Index (net dividends)
October 31, 2011-October 31, 2021
| | |
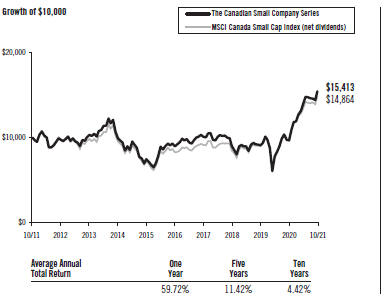 | | Past performance is not predictive of future performance. The returns shown do not reflect the deduction of taxes that a shareholder would pay on fund distributions or the redemption of fund shares. MSCI data © MSCI 2021, all rights reserved. |
180
THE DFA INVESTMENT TRUST COMPANY
PERFORMANCE CHARTS
(Unaudited)
The Emerging Markets Series vs.
MSCI Emerging Markets Index (net dividends)
October 31, 2011-October 31, 2021
| | |
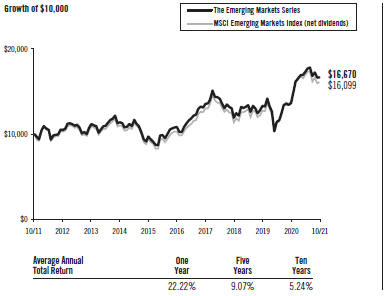 | | Past performance is not predictive of future performance. The returns shown do not reflect the deduction of taxes that a shareholder would pay on fund distributions or the redemption of fund shares. MSCI data © MSCI 2021, all rights reserved. |
The Emerging Markets Small Cap Series vs.
MSCI Emerging Markets Index (net dividends)
October 31, 2011-October 31, 2021
| | |
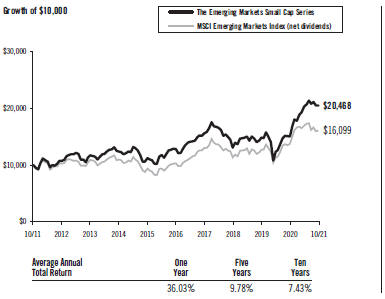 | | Past performance is not predictive of future performance. The returns shown do not reflect the deduction of taxes that a shareholder would pay on fund distributions or the redemption of fund shares. MSCI data © MSCI 2021, all rights reserved. |
181
MANAGEMENT’S DISCUSSION AND ANALYSIS
| | |
| International Equity Market Review | | 12 Months Ended October 31, 2021 |
Performance of non-U.S. developed markets was positive for the period. As measured by the MSCI World ex USA indices, small-cap stocks outperformed large-cap stocks, and mid-cap stocks, a subset of the large-cap universe, underperformed large-cap stocks and small-cap stocks. Value stocks outperformed growth stocks as measured by the MSCI World ex USA indices.
12 Months Ended October 31, 2021
| | | | |
| | | Return in U.S. Dollars | |
MSCI World ex USA Index | | | 35.59 | % |
MSCI World ex USA Mid Cap Index | | | 31.20 | % |
MSCI World ex USA Small Cap Index | | | 37.19 | % |
MSCI World ex USA Value Index | | | 40.88 | % |
MSCI World ex USA Growth Index | | | 30.25 | % |
For the 12 Months Ended October 31, 2021, the U.S. dollar appreciated against some non-U.S. developed markets currencies and depreciated against others. Overall, currency movements did not have a material overall impact on the U.S. dollar-denominated returns of developed markets.
12 Months Ended October 31, 2021
| | | | | | | | |
Ten Largest Foreign Developed Markets by Market Cap | | Local Return | | | Return in U.S. Dollars | |
Japan | | | 30.75 | % | | | 19.88 | % |
United Kingdom | | | 35.57 | % | | | 43.72 | % |
Canada | | | 38.56 | % | | | 49.05 | % |
France | | | 48.30 | % | | | 47.33 | % |
Switzerland | | | 28.36 | % | | | 28.75 | % |
Germany | | | 33.47 | % | | | 32.60 | % |
Australia | | | 27.93 | % | | | 36.82 | % |
Netherlands | | | 60.71 | % | | | 59.67 | % |
Sweden | | | 40.26 | % | | | 45.36 | % |
Hong Kong | | | 18.26 | % | | | 17.91 | % |
Source: Returns are of MSCI standard indices net of foreign withholding taxes on dividends. Copyright MSCI 2021, all rights reserved.
Emerging markets had positive performance for the period but underperformed both U.S. and non-U.S. developed markets. As measured by the MSCI Emerging Markets indices, small-cap stocks outperformed large-cap stocks, and mid-cap stocks, a subset of the large-cap universe, outperformed large-cap stocks but underperformed small-cap stocks. Value stocks outperformed growth stocks as measured by the MSCI Emerging Markets indices.
182
12 Months Ended October 31, 2021
| | | | |
| | | Return in U.S. Dollars | |
MSCI Emerging Markets Index | | | 16.96 | % |
MSCI Emerging Markets Mid Cap Index | | | 31.20 | % |
MSCI Emerging Markets Small Cap Index | | | 44.29 | % |
MSCI Emerging Markets Value Index | | | 28.31 | % |
MSCI Emerging Markets Growth Index | | | 7.38 | % |
For the 12 Months Ended October 31, 2021, the U.S. dollar depreciated against some emerging markets currencies and appreciated against others. Overall, currency movements had a positive impact on the U.S. dollar denominated returns of emerging markets.
12 Months Ended October 31, 2021
| | | | | | | | |
Ten Largest Emerging Markets by Market Cap Dollars | | Local Return | | | Return in U.S. | |
China | | | -9.52 | % | | | -9.21 | % |
Taiwan | | | 38.36 | % | | | 42.32 | % |
Korea | | | 27.78 | % | | | 24.08 | % |
India | | | 51.78 | % | | | 50.21 | % |
Russia | | | 64.53 | % | | | 81.80 | % |
Brazil | | | 10.38 | % | | | 12.91 | % |
Saudi Arabia | | | 56.07 | % | | | 56.04 | % |
South Africa | | | 18.16 | % | | | 26.32 | % |
Mexico | | | 42.35 | % | | | 47.44 | % |
Thailand | | | 34.75 | % | | | 26.57 | % |
Source: Returns are of MSCI standard indices net of foreign withholding taxes on dividends. Copyright MSCI 2021, all rights reserved.
For Portfolios investing in non-U.S. equities traded outside of the U.S. market time zone, differences in the valuation timing and methodology between a Portfolio and its benchmark index may impact relative performance over the referenced period. The Portfolios price foreign exchange rates at the closing of the U.S. market, while their benchmark indices use rates at 4 p.m. London time. The Portfolios also may use fair value pricing to price certain portfolio securities at the closing of the U.S. market, while benchmark indices may use local market closing prices. For the one-year period ended October 31, 2021, these differences generally detracted from the Portfolios’ relative performance.
The DFA International Value Series
The DFA International Value Series invests in developed ex U.S. large company value stocks. The investment strategy is process driven, emphasizing broad diversification, with increased exposure to stocks with smaller total market capitalizations, lower relative price (value), and higher-profitability within the large-cap value segment of developed ex U.S. markets. As of October 31, 2021, the Series held approximately 510 securities in 22 eligible developed markets. Average cash exposure throughout the year was less than 1% of the Series’ assets.
183
For the 12 months ended October 31, 2021, total returns were 51.09% for the Series and 35.59% for the MSCI World ex USA Index (net dividends), the Series’ benchmark. With low relative price (value) stocks outperforming high relative price (growth) stocks for the period, the Series’ focus on value stocks contributed positively to performance relative to the style-neutral benchmark.
The Japanese Small Company Series
The Japanese Small Company Series invests in Japanese small company stocks. The Series generally excludes stocks with the lowest profitability and highest relative price. Additionally, the Series generally excludes certain companies with high asset growth. The investment strategy is process driven, emphasizing broad diversification. As of October 31, 2021, the Series held approximately 1,820 securities. Average cash exposure throughout the year was less than 1% of the Series’ assets.
For the 12 months ended October 31, 2021, total returns were 13.08% for the Series and 13.18% for the MSCI Japan Small Cap Index (net dividends), the Series’ benchmark. The Series’ greater emphasis on stocks with smaller market capitalizations detracted from performance relative to the benchmark, as these stocks underperformed. The Series’ exclusion of real estate investment trusts (REITs) also detracted from relative performance, as REITs generally outperformed. Conversely, the Series’ exclusion of stocks with the lowest profitability and highest relative price contributed positively to performance relative to the benchmark, as did the Series’ exclusion of stocks with high asset growth, as those stocks underperformed.
The Asia Pacific Small Company Series
The Asia Pacific Small Company Series invests in small company stocks in Australia, Hong Kong, New Zealand, and Singapore. The Series generally excludes stocks with the lowest profitability and highest relative price. Additionally, the Series generally excludes certain companies with high asset growth. The investment strategy is process driven, emphasizing broad diversification. As of October 31, 2021, the Series held approximately 830 securities in 4 eligible countries. Average cash exposure throughout the year was less than 1% of the Series’ assets.
For the 12 months ended October 31, 2021, total returns were 38.31% for the Series and 34.27% for the MSCI Pacific ex Japan Small Cap Index (net dividends), the Series’ benchmark. The Series’ emphasis on stocks with smaller market capitalizations, particularly in Australia, contributed positively to relative performance, as larger stocks held by the index underperformed. The Series’ exclusion of real estate investment trusts (REITs) also contributed positively to relative performance, as REITs generally underperformed.
The United Kingdom Small Company Series
The United Kingdom Small Company Series invests in small company stocks in the U.K. The Series generally excludes stocks with the lowest profitability and highest relative price. Additionally, the Series generally excludes certain companies with high asset growth. The investment strategy is process driven, emphasizing broad diversification. As of October 31, 2021, the Series held approximately 330 securities. Average cash exposure throughout the year was less than 1% of the Series’ assets.
184
For the 12 months ended October 31, 2021, total returns were 51.93% for the Series and 45.72% for the MSCI United Kingdom Small Cap Index (net dividends), the Series’ benchmark. The Series’ greater emphasis on stocks with smaller market capitalizations contributed positively to performance relative to the benchmark, as these stocks outperformed. The Series’ exclusion of stocks with the lowest profitability and highest relative price also contributed positively to relative performance, as those securities underperformed for the period.
The Continental Small Company Series
The Continental Small Company Series invests in small company stocks in the developed markets of Europe (excluding the U.K.) and Israel. The Series generally excludes stocks with the lowest profitability and highest relative price. Additionally, the Series generally excludes certain companies with high asset growth. The investment strategy is process driven, emphasizing broad diversification. As of October 31, 2021, the Series held approximately 1,160 securities in 15 eligible countries. Average cash exposure throughout the year was less than 1% of the Series’ assets.
For the 12 months ended October 31, 2021, total returns were 51.24% for the Series and 49.80% for the MSCI Europe ex U.K. Small Cap Index (net dividends), the Series’ benchmark. The Series’ exclusion of stocks with the lowest profitability and highest relative price contributed positively to relative performance, as did the Series’ exclusion of stocks with high asset growth, as those securities underperformed for the year. Additionally, the Series’ exclusion of real estate investment trusts (REITs) contributed positively to relative performance, as REITs generally underperformed.
The Canadian Small Company Series
The Canadian Small Company Series invests in small company stocks in Canada. The Series generally excludes stocks with the lowest profitability and highest relative price. The Series also generally excludes certain companies with high asset growth. The investment strategy is process-driven, emphasizing broad diversification. As of October 31, 2021, the Series held approximately 330 securities. Average cash exposure throughout the year was less than 1% of the Series’ assets.
For the 12 months ended October 31, 2021, total returns were 59.72% for the Series and 53.21% for the MSCI Canada Small Cap Index (net dividends), the Series’ benchmark. The Series’ exclusion of stocks with the lowest profitability and highest relative price contributed positively to performance relative to the benchmark, as did the Series’ exclusion of stocks with high asset growth, as those securities underperformed for the period. The Series’ greater emphasis on stocks with smaller market capitalizations also contributed positively to performance relative to the benchmark, as these stocks outperformed.
The Emerging Markets Series
The Emerging Markets Series invests in large-cap stocks in emerging markets. The investment strategy is process driven, emphasizing broad diversification with increased exposure to stocks with smaller market capitalizations, lower relative price (value), and higher- profitability within the large-cap segment of emerging markets. As of October 31, 2021, the Series held approximately 1,720 securities in 24 eligible emerging markets. Average cash exposure throughout the year was less than 1% of the Series’ assets.
185
For the 12 months ended October 31, 2021, total returns were 22.22% for the Series and 16.96% for the MSCI Emerging Markets Index (net dividends), the Series’ benchmark. The Series’ greater emphasis on low relative price (value) stocks contributed positively to performance relative to the benchmark, as value stocks outperformed high relative price (growth) stocks in emerging markets for the period. The Series’ greater allocation to stocks with smaller market capitalizations within the large cap universe also contributed positively to relative performance, as these stocks outperformed their larger counterparts in emerging markets. The Portfolio’s emphasis on stocks with higher profitability also contributed positively to performance relative to the benchmark, as these stocks generally outperformed.
The Emerging Markets Small Cap Series
The Emerging Markets Small Cap Series invests in small company stocks in emerging markets. The Series generally excludes stocks with the lowest profitability and highest relative price. Additionally, the Series generally excludes certain companies with high asset growth. The investment strategy is process driven, emphasizing broad diversification. As of October 31, 2021, the Series held approximately 4,960 securities in 21 eligible emerging markets. Average cash exposure throughout the year was less than 1% of the Series’ assets.
For the 12 months ended October 31, 2021, total returns were 36.03% for the Series and 16.96% for the MSCI Emerging Markets Index (net dividends), the Series’ benchmark. With small-cap stocks outperforming large-cap stocks in emerging markets, the Series’ inclusion of stocks with smaller market capitalizations contributed positively to performance relative to the benchmark, which is composed primarily of large- and mid-cap stocks.
186
THE DFA INVESTMENT TRUST COMPANY
DISCLOSURE OF FUND EXPENSES
(Unaudited)
The following Expense Tables are shown so that you can understand the impact of fees on your investment. All mutual funds have operating expenses. As a shareholder of the fund, you incur ongoing costs, which include costs for portfolio management, administrative services, and shareholder reports, among others. Operating expenses and legal and audit services, which are deducted from a fund’s gross income, directly reduce the investment return of the fund. A fund’s expenses are expressed as a percentage of its average net assets. This figure is known as the expense ratio. The following examples are intended to help you understand the ongoing costs, in dollars, of investing in the fund and to compare these costs with those of other mutual funds. The examples are based on an investment of $1,000 made at the beginning of the period shown and held for the entire period.
The Expense Tables below illustrate your fund’s costs in two ways.
Actual Fund Return
This section helps you to estimate the actual expenses after fee waivers that you paid over the period. The “Ending Account Value” shown is derived from the fund’s actual return, and “Expenses Paid During Period” reflects the dollar amount that would have been paid by an investor who started with $1,000 in the fund. You may use the information here, together with the amount you invested, to estimate the expenses that you paid over the period.
To do so, simply divide your account value by $1,000 (for example, a $7,500 account value divided by $1,000 = 7.5), then multiply the result by the number given for your fund under the heading “Expenses Paid During Period.”
Hypothetical Example for Comparison Purposes
This section is intended to help you compare your fund’s costs with those of other mutual funds. The hypothetical “Ending Account Value” and “Expenses Paid During Period” are derived from the fund’s actual expense ratio and an assumed 5% annual return before expenses. In this case, because the return used is not the fund’s actual return, the results do not apply to your investment. The example is useful in making comparisons because the SEC requires all mutual funds to calculate expenses based on a 5% annual return. You can assess your fund’s costs by comparing this hypothetical example with the hypothetical examples that appear in shareholder reports of other funds.
Please note that the expenses shown in the tables are meant to highlight and help you compare ongoing costs only and do not reflect any transactional costs, if applicable. The “Annualized Expense Ratio” represents the actual expenses for the six-month period indicated.
Six Months Ended October 31, 2021
EXPENSE TABLES
| | | | | | | | | | | | | | | | |
| | | Beginning | | | Ending | | | | | | Expenses | |
| | | Account | | | Account | | | Annualized | | | Paid | |
| | | Value | | | Value | | | Expense | | | During | |
| | | 05/01/21 | | | 10/31/21 | | | Ratio (1) | | | Period (1) | |
The DFA International Value Series | | | | | | | | | | | | | | | | |
Actual Fund Return | | $ | 1,000.00 | | | $ | 1,058.40 | | | | 0.22 | % | | $ | 1.14 | |
Hypothetical 5% Annual Return | | $ | 1,000.00 | | | $ | 1,024.10 | | | | 0.22 | % | | $ | 1.12 | |
The Japanese Small Company Series | | | | | | | | | | | | | | | | |
Actual Fund Return | | $ | 1,000.00 | | | $ | 1,017.20 | | | | 0.12 | % | | $ | 0.61 | |
Hypothetical 5% Annual Return | | $ | 1,000.00 | | | $ | 1,024.60 | | | | 0.12 | % | | $ | 0.61 | |
187
DISCLOSURE OF FUND EXPENSES
CONTINUED
| | | | | | | | | | | | | | | | |
| | | Beginning | | | Ending | | | | | | Expenses | |
| | | Account | | | Account | | | Annualized | | | Paid | |
| | | Value | | | Value | | | Expense | | | During | |
| | | 05/01/21 | | | 10/31/21 | | | Ratio (1) | | | Period (1) | |
The Asia Pacific Small Company Series | | | | | | | | | | | | | | | | |
Actual Fund Return | | $ | 1,000.00 | | | $ | 1,042.30 | | | | 0.12 | % | | $ | 0.62 | |
Hypothetical 5% Annual Return | | $ | 1,000.00 | | | $ | 1,024.60 | | | | 0.12 | % | | $ | 0.61 | |
The United Kingdom Small Company Series | | | | | | | | | | | | | | | | |
Actual Fund Return | | $ | 1,000.00 | | | $ | 1,017.60 | | | | 0.12 | % | | $ | 0.61 | |
Hypothetical 5% Annual Return | | $ | 1,000.00 | | | $ | 1,024.60 | | | | 0.12 | % | | $ | 0.61 | |
The Continental Small Company Series | | | | | | | | | | | | | | | | |
Actual Fund Return | | $ | 1,000.00 | | | $ | 1,058.70 | | | | 0.12 | % | | $ | 0.62 | |
Hypothetical 5% Annual Return | | $ | 1,000.00 | | | $ | 1,024.60 | | | | 0.12 | % | | $ | 0.61 | |
The Canadian Small Company Series | | | | | | | | | | | | | | | | |
Actual Fund Return | | $ | 1,000.00 | | | $ | 1,098.50 | | | | 0.12 | % | | $ | 0.63 | |
Hypothetical 5% Annual Return | | $ | 1,000.00 | | | $ | 1,024.60 | | | | 0.12 | % | | $ | 0.61 | |
The Emerging Markets Series | | | | | | | | | | | | | | | | |
Actual Fund Return | | $ | 1,000.00 | | | $ | 964.10 | | | | 0.15 | % | | $ | 0.74 | |
Hypothetical 5% Annual Return | | $ | 1,000.00 | | | $ | 1,024.45 | | | | 0.15 | % | | $ | 0.77 | |
The Emerging Markets Small Cap Series | | | | | | | | | | | | | | | | |
Actual Fund Return | | $ | 1,000.00 | | | $ | 1,008.40 | | | | 0.27 | % | | $ | 1.37 | |
Hypothetical 5% Annual Return | | $ | 1,000.00 | | | $ | 1,023.84 | | | | 0.27 | % | | $ | 1.38 | |
| (1) | Expenses are equal to the fund’s annualized expense ratio for the six-month period, multiplied by the average account value over the period, multiplied by the number of days in the most recent six-month period (184), then divided by the number of days in the year (365) to reflect the six-month period. |
188
THE DFA INVESTMENT TRUST COMPANY
DISCLOSURE OF PORTFOLIO HOLDINGS
(Unaudited)
The SEC requires that all funds file a complete Schedule of Investments with the SEC for their first and third fiscal quarters as an exhibit to their reports on Form N-PORT. For The DFA Investment Trust Company, this would be for the fiscal quarters ending January 31 and July 31. Such Form N-PORT filing must be made within 60 days of the end of the quarter. The DFA Investment Trust Company filed its most recent Form N-PORT with the SEC on September 24, 2021 (September 27, 2021 with respect to The United Kingdom Small Company Series). They are available upon request, without charge, by calling collect: (512) 306-7400; by mailing a request to Dimensional Fund Advisors LP, 6300 Bee Cave Road, Building One, Austin, TX 78746; or by visiting the SEC’s website at http://www.sec.gov.
SEC regulations permit a fund to include in its reports to shareholders a “Summary Schedule of Portfolio Holdings” in lieu of a full Schedule of Investments. The Summary Schedule of Portfolio Holdings reports the fund’s 50 largest holdings in unaffiliated issuers and any investments that exceed one percent of the fund’s net assets at the end of the reporting period. The regulations also require that the Summary Schedule of Portfolio Holdings identify each category of investments that are held.
A fund is required to file a complete Schedule of Investments with the SEC on Form N-CSR within ten days after mailing the annual and semi-annual reports to shareholders. It will be available upon request, without charge, by calling collect: (512) 306-7400; by mailing a request to Dimensional Fund Advisors LP, 6300 Bee Cave Road, Building One, Austin, TX 78746; or by visiting the SEC’s website at http://www.sec.gov.
PORTFOLIO HOLDINGS
The SEC requires that all funds present their categories of portfolio holdings in a table, chart, or graph format in their annual and semi-annual shareholder reports, whether or not a Schedule of Investments is used. The following table, which presents portfolio holdings as a percentage of total investments before short-term investments and collateral for loaned securities, is provided in compliance with this requirement. The categories shown below represent broad industry sectors. Each industry sector consists of one or more specific industry classifications.
INTERNATIONAL EQUITY PORTFOLIOS
| | | | |
| The DFA International Value Series | |
Communication Services | | | 4.8 | % |
Consumer Discretionary | | | 14.7 | % |
Consumer Staples | | | 4.5 | % |
Energy | | | 12.6 | % |
Financials | | | 30.7 | % |
Health Care | | | 4.9 | % |
Industrials | | | 11.3 | % |
Information Technology | | | 0.9 | % |
Materials | | | 11.8 | % |
Real Estate | | | 2.3 | % |
Utilities | | | 1.5 | % |
| | | | |
| | | 100.0 | % |
| | | | |
| The Japanese Small Company Series | |
Communication Services | | | 3.1 | % |
Consumer Discretionary | | | 14.4 | % |
Consumer Staples | | | 7.3 | % |
Energy | | | 1.0 | % |
Financials | | | 8.4 | % |
Health Care | | | 4.5 | % |
Industrials | | | 30.5 | % |
Information Technology | | | 15.5 | % |
Materials | | | 12.1 | % |
Real Estate | | | 1.7 | % |
Utilities | | | 1.5 | % |
| | | | |
| | | 100.0 | % |
| | | | |
| The Asia Pacific Small Company Series | |
Communication Services | | | 6.4 | % |
Consumer Discretionary | | | 17.9 | % |
Consumer Staples | | | 8.0 | % |
Energy | | | 3.4 | % |
Financials | | | 12.4 | % |
Health Care | | | 6.0 | % |
Industrials | | | 12.0 | % |
Information Technology | | | 9.2 | % |
Materials | | | 14.3 | % |
Real Estate | | | 6.4 | % |
Utilities | | | 4.0 | % |
| | | | |
| | | 100.0 | % |
189
DISCLOSURE OF PORTFOLIO HOLDINGS
CONTINUED
| | | | |
| The United Kingdom Small Company Series | |
Communication Services | | | 3.8 | % |
Consumer Discretionary | | | 20.0 | % |
Consumer Staples | | | 6.8 | % |
Energy | | | 2.3 | % |
Financials | | | 16.7 | % |
Health Care | | | 3.2 | % |
Industrials | | | 25.8 | % |
Information Technology | | | 8.6 | % |
Materials | | | 6.6 | % |
Real Estate | | | 3.7 | % |
Utilities | | | 2.5 | % |
|
| | | | |
| | | 100.0 | % |
| | | | |
| The Continental Small Company Series | |
Communication Services | | | 4.3 | % |
Consumer Discretionary | | | 10.3 | % |
Consumer Staples | | | 4.0 | % |
Energy | | | 2.4 | % |
Financials | | | 13.9 | % |
Health Care | | | 6.8 | % |
Industrials | | | 27.9 | % |
Information Technology | | | 11.2 | % |
Materials | | | 8.4 | % |
Real Estate | | | 6.5 | % |
Utilities | | | 4.3 | % |
| | | | |
| | | 100.0 | % |
| | | | |
| The Canadian Small Company Series | |
Communication Services | | | 1.4 | % |
Consumer Discretionary | | | 6.3 | % |
Consumer Staples | | | 5.2 | % |
Energy | | | 20.3 | % |
Financials | | | 11.5 | % |
Health Care | | | 1.5 | % |
Industrials | | | 12.3 | % |
Information Technology | | | 3.2 | % |
Materials | | | 24.6 | % |
Real Estate | | | 4.2 | % |
Utilities | | | 9.5 | % |
| | | | |
| | | 100.0 | % |
| | | | |
| The Emerging Markets Series | |
Communication Services | | | 9.5 | % |
Consumer Discretionary | | | 12.1 | % |
Consumer Staples | | | 6.7 | % |
Energy | | | 4.7 | % |
Financials | | | 19.4 | % |
Health Care | | | 4.0 | % |
Industrials | | | 6.7 | % |
Information Technology | | | 20.7 | % |
Materials | | | 11.0 | % |
Real Estate | | | 2.6 | % |
Utilities | | | 2.6 | % |
| | | | |
| | | 100.0 | % |
| | | | |
| The Emerging Markets Small Cap Series | |
Communication Services | | | 4.4 | % |
Consumer Discretionary | | | 13.1 | % |
Consumer Staples | | | 6.7 | % |
Energy | | | 2.0 | % |
Financials | | | 8.6 | % |
Health Care | | | 7.5 | % |
Industrials | | | 15.5 | % |
Information Technology | | | 16.5 | % |
Materials | | | 13.8 | % |
Real Estate | | | 6.9 | % |
Utilities | | | 5.0 | % |
| | | | |
| | | 100.0 | % |
190
THE DFA INTERNATIONAL VALUE SERIES
SUMMARY SCHEDULE OF PORTFOLIO HOLDINGS
October 31, 2021
| | | | | | | | | | | | | | |
| | | | | | | | | | | Percentage | |
| | | | | Shares | | | Value» | | | of Net Assets‡ | |
COMMON STOCKS — (94.7%) | | | | | | | | | | | | |
AUSTRALIA — (6.0%) | | | | | | | | | | | | |
| | Australia & New Zealand Banking Group Ltd. | | | 6,888,410 | | | $ | 146,588,595 | | | | 1.2 | % |
| | National Australia Bank Ltd. | | | 4,975,285 | | | | 108,172,523 | | | | 0.9 | % |
| | Westpac Banking Corp. | | | 8,060,284 | | | | 156,813,850 | | | | 1.3 | % |
| | Other Securities | | | | | | | 342,062,377 | | | | 2.7 | % |
| | | | | | | | | | | | |
TOTAL AUSTRALIA | | | | | | | 753,637,345 | | | | 6.1 | % |
| | | | | | | | | | | | |
AUSTRIA — (0.0%) | | | | | | | | | | | | |
| | Other Securities | | | | | | | 1,511,840 | | | | 0.0 | % |
| | | | | | | | | | | | |
BELGIUM — (0.7%) | | | | | | | | | | | | |
| | Other Securities | | | | | | | 84,789,324 | | | | 0.7 | % |
| | | | | | | | | | | | |
CANADA — (9.4%) | | | | | | | | | | | | |
# | | Bank of Montreal | | | 180,174 | | | | 19,562,040 | | | | 0.2 | % |
| | Bank of Montreal | | | 1,448,818 | | | | 157,211,241 | | | | 1.3 | % |
| | Bank of Nova Scotia | | | 495,702 | | | | 32,499,402 | | | | 0.3 | % |
| | Bank of Nova Scotia | | | 1,698,160 | | | | 111,331,370 | | | | 0.9 | % |
# | | Canadian Imperial Bank of Commerce | | | 907,318 | | | | 110,093,685 | | | | 0.9 | % |
| | Canadian Imperial Bank of Commerce | | | 248,491 | | | | 30,132,019 | | | | 0.3 | % |
| | Canadian Natural Resources Ltd. | | | 489,228 | | | | 20,792,981 | | | | 0.2 | % |
| | Canadian Natural Resources Ltd. | | | 3,476,035 | | | | 147,766,248 | | | | 1.2 | % |
| | Other Securities | | | | | | | 557,468,956 | | | | 4.3 | % |
| | | | | | | | | | | | |
TOTAL CANADA | | | | | | | 1,186,857,942 | | | | 9.6 | % |
| | | | | | | | | | | | |
DENMARK — (2.2%) | | | | | | | | | | | | |
| | DSV AS | | | 309,306 | | | | 71,888,035 | | | | 0.6 | % |
# | | Vestas Wind Systems AS | | | 1,973,579 | | | | 85,317,056 | | | | 0.7 | % |
| | Other Securities | | | | | | | 116,222,387 | | | | 0.9 | % |
| | | | | | | | | | | | |
TOTAL DENMARK | | | | | | | 273,427,478 | | | | 2.2 | % |
| | | | | | | | | | | | |
FINLAND — (0.9%) | | | | | | | | | | | | |
| | Other Securities | | | | | | | 117,103,920 | | | | 1.0 | % |
| | | | | | | | | | | | |
FRANCE — (9.8%) | | | | | | | | | | | | |
| | AXA SA | | | 1,974,356 | | | | 57,439,907 | | | | 0.5 | % |
# | | BNP Paribas SA | | | 1,824,346 | | | | 122,116,632 | | | | 1.0 | % |
| | Cie de Saint-Gobain | | | 1,844,395 | | | | 127,286,369 | | | | 1.0 | % |
| | Cie Generale des Etablissements Michelin SCA | | | 622,212 | | | | 97,822,573 | | | | 0.8 | % |
| | Orange SA | | | 5,978,647 | | | | 65,196,841 | | | | 0.5 | % |
| | TotalEnergies SE | | | 6,840,726 | | | | 342,549,007 | | | | 2.8 | % |
| | Other Securities | | | | | | | 425,218,764 | | | | 3.5 | % |
| | | | | | | | | | | | |
TOTAL FRANCE | | | | | | | 1,237,630,093 | | | | 10.1 | % |
| | | | | | | | | | | | |
GERMANY — (6.5%) | | | | | | | | | | | | |
| | Allianz SE | | | 559,039 | | | | 129,814,638 | | | | 1.1 | % |
| | Bayerische Motoren Werke AG | | | 1,003,964 | | | | 101,436,507 | | | | 0.8 | % |
| | Daimler AG | | | 2,568,275 | | | | 254,933,183 | | | | 2.1 | % |
| | Volkswagen AG | | | 111,321 | | | | 36,190,216 | | | | 0.3 | % |
| | Other Securities | | | | | | | 297,572,604 | | | | 2.4 | % |
| | | | | | | | | | | | |
TOTAL GERMANY | | | | | | | 819,947,148 | | | | 6.7 | % |
| | | | | | | | | | | | |
191
THE DFA INTERNATIONAL VALUE SERIES
CONTINUED
| | | | | | | | | | | | | | |
| | | | | | | | | | | Percentage | |
| | | | | Shares | | | Value» | | | of Net Assets‡ | |
HONG KONG — (1.9%) | | | | | | | | | | | | |
| | Other Securities | | | | | | $ | 241,189,297 | | | | 2.0 | % |
| | | | | | | | | | | | |
IRELAND — (0.4%) | | | | | | | | | | | | |
| | Other Securities | | | | | | | 46,959,387 | | | | 0.4 | % |
| | | | | | | | | | | | |
ISRAEL — (0.4%) | | | | | | | | | | | | |
| | Other Securities | | | | | | | 50,389,622 | | | | 0.4 | % |
| | | | | | | | | | | | |
ITALY — (1.9%) | | | | | | | | | | | | |
| | Intesa Sanpaolo SpA | | | 21,991,838 | | | | 62,504,673 | | | | 0.5 | % |
| | Other Securities | | | | | | | 172,510,027 | | | | 1.4 | % |
| | | | | | | | | | | | |
TOTAL ITALY | | | | | | | 235,014,700 | | | | 1.9 | % |
| | | | | | | | | | | | |
JAPAN — (20.4%) | | | | | | | | | | | | |
| | Hitachi Ltd. | | | 997,700 | | | | 57,492,003 | | | | 0.5 | % |
| | Honda Motor Co. Ltd. | | | 3,522,000 | | | | 104,173,232 | | | | 0.8 | % |
| | Mitsubishi Corp. | | | 1,817,600 | | | | 57,795,971 | | | | 0.5 | % |
| | ORIX Corp. | | | 3,324,900 | | | | 66,086,674 | | | | 0.5 | % |
| | SoftBank Group Corp. | | | 1,571,580 | | | | 85,081,195 | | | | 0.7 | % |
| | Takeda Pharmaceutical Co. Ltd. | | | 2,595,871 | | | | 72,855,226 | | | | 0.6 | % |
| | Toyota Motor Corp. | | | 16,646,950 | | | | 293,721,364 | | | | 2.4 | % |
# | | Toyota Motor Corp., Sponsored ADR | | | 49,541 | | | | 8,747,454 | | | | 0.1 | % |
| | Other Securities | | | | | | | 1,825,296,083 | | | | 14.8 | % |
| | | | | | | | | | | | |
TOTAL JAPAN | | | | | | | 2,571,249,202 | | | | 20.9 | % |
| | | | | | | | | | | | |
NETHERLANDS — (5.0%) | | | | | | | | | | | | |
| | ING Groep NV | | | 4,722,058 | | | | 71,628,435 | | | | 0.6 | % |
| | Koninklijke Ahold Delhaize NV | | | 4,840,597 | | | | 157,476,505 | | | | 1.3 | % |
| | Koninklijke DSM NV | | | 340,858 | | | | 74,470,035 | | | | 0.6 | % |
| | Stellantis NV | | | 3,600,675 | | | | 71,894,458 | | | | 0.6 | % |
| | Other Securities | | | | | | | 248,451,361 | | | | 2.0 | % |
| | | | | | | | | | | | |
TOTAL NETHERLANDS | | | | | | | 623,920,794 | | | | 5.1 | % |
| | | | | | | | | | | | |
NEW ZEALAND — (0.2%) | | | | | | | | | | | | |
| | Other Securities | | | | | | | 30,228,390 | | | | 0.2 | % |
| | | | | | | | | | | | |
NORWAY — (1.1%) | | | | | | | | | | | | |
| | Other Securities | | | | | | | 132,380,863 | | | | 1.1 | % |
| | | | | | | | | | | | |
PORTUGAL — (0.1%) | | | | | | | | | | | | |
| | Other Securities | | | | | | | 9,221,253 | | | | 0.1 | % |
| | | | | | | | | | | | |
SINGAPORE — (0.7%) | | | | | | | | | | | | |
| | Other Securities | | | | | | | 88,513,432 | | | | 0.7 | % |
| | | | | | | | | | | | |
SPAIN — (2.2%) | | | | | | | | | | | | |
| | Banco Bilbao Vizcaya Argentaria SA | | | 9,200,845 | | | | 64,388,674 | | | | 0.5 | % |
# | | Banco Santander SA | | | 42,993,563 | | | | 163,078,151 | | | | 1.4 | % |
| | Other Securities | | | | | | | 50,876,176 | | | | 0.4 | % |
| | | | | | | | | | | | |
TOTAL SPAIN | | | | | | | 278,343,001 | | | | 2.3 | % |
| | | | | | | | | | | | |
SWEDEN — (2.7%) | | | | | | | | | | | | |
| | Other Securities | | | | | | | 337,295,776 | | | | 2.7 | % |
| | | | | | | | | | | | |
192
THE DFA INTERNATIONAL VALUE SERIES
CONTINUED
| | | | | | | | | | | | | | |
| | | | | | | | | | | Percentage | |
| | | | | Shares | | | Value» | | | of Net Assets‡ | |
SWITZERLAND — (8.3%) | | | | | | | | | | | | |
| | ABB Ltd. | | | 1,805,001 | | | $ | 59,715,251 | | | | 0.5 | % |
| | Cie Financiere Richemont SA | | | 797,506 | | | | 98,691,665 | | | | 0.8 | % |
| | Novartis AG | | | 1,706,093 | | | | 141,115,564 | | | | 1.2 | % |
| | Novartis AG, Sponsored ADR | | | 794,280 | | | | 65,734,613 | | | | 0.5 | % |
| | UBS Group AG | | | 6,030,163 | | | | 109,765,116 | | | | 0.9 | % |
# | | UBS Group AG | | | 1,233,581 | | | | 22,389,495 | | | | 0.2 | % |
| | Zurich Insurance Group AG | | | 344,357 | | | | 152,626,097 | | | | 1.2 | % |
| | Other Securities | | | | | | | 392,342,286 | | | | 3.2 | % |
| | | | | | | | | | | | |
TOTAL SWITZERLAND | | | | | | | 1,042,380,087 | | | | 8.5 | % |
| | | | | | | | | | | | |
UNITED KINGDOM — (13.9%) | | | | | | | | | | | | |
| | Aviva PLC | | | 13,916,649 | | | | 75,093,073 | | | | 0.6 | % |
# | | Barclays PLC, Sponsored ADR | | | 7,035,082 | | | | 78,722,568 | | | | 0.6 | % |
| | BP PLC | | | 7,690,578 | | | | 36,844,794 | | | | 0.3 | % |
| | BP PLC, Sponsored ADR | | | 5,912,515 | | | | 170,221,307 | | | | 1.4 | % |
| | British American Tobacco PLC | | | 3,024,009 | | | | 105,188,388 | | | | 0.9 | % |
# | | British American Tobacco PLC, Sponsored ADR | | | 838,885 | | | | 29,293,864 | | | | 0.2 | % |
| | Glencore PLC | | | 23,897,614 | | | | 119,501,940 | | | | 1.0 | % |
| | HSBC Holdings PLC | | | 13,535,003 | | | | 81,550,718 | | | | 0.7 | % |
# | | HSBC Holdings PLC, Sponsored ADR | | | 2,324,211 | | | | 69,889,024 | | | | 0.6 | % |
| | Lloyds Banking Group PLC | | | 164,752,825 | | | | 112,753,659 | | | | 0.9 | % |
| | Royal Dutch Shell PLC, Class B | | | 283,225 | | | | 6,499,652 | | | | 0.0 | % |
| | Royal Dutch Shell PLC, Sponsored ADR, Class B | | | 8,519,230 | | | | 390,521,503 | | | | 3.2 | % |
| | Vodafone Group PLC | | | 58,351,986 | | | | 86,002,139 | | | | 0.7 | % |
# | | Vodafone Group PLC, Sponsored ADR | | | 4,011,201 | | | | 59,967,459 | | | | 0.5 | % |
| | Other Securities | | | | | | | 326,711,444 | | | | 2.6 | % |
| | | | | | | | | | | | |
TOTAL UNITED KINGDOM | | | | | | | 1,748,761,532 | | | | 14.2 | % |
| | | | | | | | | | | | |
UNITED STATES — (0.0%) | | | | | | | | | | | | |
| | Other Security | | | | | | | 1,789,521 | | | | 0.0 | % |
| | | | | | | | | | | | |
TOTAL COMMON STOCKS | | | | | | | 11,912,541,947 | | | | 96.9 | % |
| | | | | | | | | | | | |
PREFERRED STOCKS — (1.4%) | | | | | | | | | | | | |
GERMANY — (1.4%) | | | | | | | | | | | | |
| | Volkswagen AG | | | 601,156 | | | | 134,918,290 | | | | 1.1 | % |
| | Other Securities | | | | | | | 44,965,817 | | | | 0.4 | % |
| | | | | | | | | | | | |
TOTAL GERMANY | | | | | | | 179,884,107 | | | | 1.5 | % |
| | | | | | | | | | | | |
RIGHTS/WARRANTS — (0.0%) | | | | | | | | | | | | |
CANADA — (0.0%) | | | | | | | | | | | | |
| | Other Security | | | | | | | 275,183 | | | | 0.0 | % |
| | | | | | | | | | | | |
TOTAL INVESTMENT SECURITIES
(Cost $10,175,872,330) | | | | | | | 12,092,701,237 | | | | | |
| | | | |
| | | | | | | | Value† | | | | |
SECURITIES LENDING COLLATERAL — (3.9%) | | | | | | | | | | | | |
@§ | | The DFA Short Term Investment Fund | | | 42,813,604 | | | | 495,353,403 | | | | 4.0 | % |
| | | | | | | | | | | | |
TOTAL INVESTMENTS—(100.0%)
(Cost $10,671,138,666) | | | | | | $ | 12,588,054,640 | | | | 102.4 | % |
| | | | | | | | | | | | | | |
193
THE DFA INTERNATIONAL VALUE SERIES
CONTINUED
As of October 31, 2021, The DFA International Value Series had entered into the following outstanding futures contracts:
| | | | | | | | | | | | | | | | | | | | |
| | | | | | | | | | | | | | | Unrealized | |
| | | Number of | | | Expiration | | | Notional | | | Market | | | Appreciation | |
Description | | Contracts | | | Date | | | Value | | | Value | | | (Depreciation) | |
Long Position Contracts: | | | | | | | | | | | | | | | | | | | | |
S&P 500® Emini Index | | | 384 | | | | 12/17/21 | | | $ | 85,247,563 | | | $ | 88,262,400 | | | $ | 3,014,837 | |
| | | | | | | | | | | | | | | | | | | | |
Total Futures Contracts | | | | | | | | | | $ | 85,247,563 | | | $ | 88,262,400 | | | $ | 3,014,837 | |
| | | | | | | | | | | | | | | | | | | | |
Summary of the Series’ investments as of October 31, 2021, based on their valuation inputs, is as follows (see Security Valuation Note):
| | | | | | | | | | | | | | | | |
| | | Investments in Securities (Market Value) | |
| | | Level 1 | | | Level 2 | | | Level 3 | | | Total | |
Common Stocks | | | | | | | | | | | | | | | | |
Australia | | | — | | | $ | 753,637,345 | | | | — | | | $ | 753,637,345 | |
Austria | | | — | | | | 1,511,840 | | | | — | | | | 1,511,840 | |
Belgium | | | — | | | | 84,789,324 | | | | — | | | | 84,789,324 | |
Canada | | $ | 1,186,857,942 | | | | — | | | | — | | | | 1,186,857,942 | |
Denmark | | | — | | | | 273,427,478 | | | | — | | | | 273,427,478 | |
Finland | | | — | | | | 117,103,920 | | | | — | | | | 117,103,920 | |
France | | | — | | | | 1,237,630,093 | | | | — | | | | 1,237,630,093 | |
Germany | | | 20,713,362 | | | | 799,233,786 | | | | — | | | | 819,947,148 | |
Hong Kong | | | — | | | | 241,189,297 | | | | — | | | | 241,189,297 | |
Ireland | | | 25,356,712 | | | | 21,602,675 | | | | — | | | | 46,959,387 | |
Israel | | | 6,959,330 | | | | 43,430,292 | | | | — | | | | 50,389,622 | |
Italy | | | 6,135,895 | | | | 228,878,805 | | | | — | | | | 235,014,700 | |
Japan | | | 26,448,456 | | | | 2,544,800,746 | | | | — | | | | 2,571,249,202 | |
Netherlands | | | 31,160,475 | | | | 592,760,319 | | | | — | | | | 623,920,794 | |
New Zealand | | | — | | | | 30,228,390 | | | | — | | | | 30,228,390 | |
Norway | | | — | | | | 132,380,863 | | | | — | | | | 132,380,863 | |
Portugal | | | — | | | | 9,221,253 | | | | — | | | | 9,221,253 | |
Singapore | | | 12,626,088 | | | | 75,887,344 | | | | — | | | | 88,513,432 | |
Spain | | | 8,226,977 | | | | 270,116,024 | | | | — | | | | 278,343,001 | |
Sweden | | | — | | | | 337,295,776 | | | | — | | | | 337,295,776 | |
Switzerland | | | 105,717,225 | | | | 936,662,862 | | | | — | | | | 1,042,380,087 | |
United Kingdom | | | 822,729,229 | | | | 926,032,303 | | | | — | | | | 1,748,761,532 | |
United States | | | 1,789,521 | | | | — | | | | — | | | | 1,789,521 | |
Preferred Stocks | | | | | | | | | | | | | | | | |
Germany | | | — | | | | 179,884,107 | | | | — | | | | 179,884,107 | |
Rights/Warrants | | | | | | | | | | | | | | | | |
Canada | | | — | | | | 275,183 | | | | — | | | | 275,183 | |
Securities Lending Collateral | | | — | | | | 495,353,403 | | | | — | | | | 495,353,403 | |
Futures Contracts** | | | 3,014,837 | | | | — | | | | — | | | | 3,014,837 | |
| | | | | | | | | | | | | | | | |
TOTAL | | $ | 2,257,736,049 | | | $ | 10,333,333,428 | | | | — | | | $ | 12,591,069,477 | |
| | | | | | | | | | | | | | | | |
| ** | Valued at the unrealized appreciation/(depreciation) on the investment. |
See accompanying Notes to Financial Statements.
194
THE JAPANESE SMALL COMPANY SERIES
SUMMARY SCHEDULE OF PORTFOLIO HOLDINGS
October 31, 2021
| | | | | | | | | | | | | | |
| | | | | | | | | | | Percentage | |
| | | | | Shares | | | Value» | | | of Net Assets‡ | |
COMMON STOCKS — (98.2%) | | | | | | | | | | | | |
COMMUNICATION SERVICES — (3.1%) | | | | | | | | | | | | |
| | Other Securities | | | | | | $ | 105,693,477 | | | | 3.1 | % |
| | | | | | | | | | | | |
CONSUMER DISCRETIONARY — (14.2%) | | | | | | | | | | | | |
| | Resorttrust, Inc. | | | 523,464 | | | | 9,276,381 | | | | 0.3 | % |
| | Takashimaya Co. Ltd. | | | 914,300 | | | | 8,465,774 | | | | 0.3 | % |
| | Other Securities | | | | | | | 471,009,353 | | | | 13.7 | % |
| | | | | | | | | | | | |
TOTAL CONSUMER DISCRETIONARY | | | | | | | 488,751,508 | | | | 14.3 | % |
| | | | | | | | | | | | |
CONSUMER STAPLES — (7.2%) | | | | | | | | | | | | |
| | Milbon Co. Ltd. | | | 159,852 | | | | 9,570,980 | | | | 0.3 | % |
| | Nippon Suisan Kaisha Ltd. | | | 1,912,300 | | | | 10,868,179 | | | | 0.3 | % |
| | Sapporo Holdings Ltd. | | | 392,620 | | | | 8,518,732 | | | | 0.3 | % |
| | Other Securities | | | | | | | 219,656,754 | | | | 6.4 | % |
| | | | | | | | | | | | |
TOTAL CONSUMER STAPLES | | | | | | | 248,614,645 | | | | 7.3 | % |
| | | | | | | | | | | | |
ENERGY — (0.9%) | | | | | | | | | | | | |
| | Other Securities | | | | | | | 32,702,071 | | | | 1.0 | % |
| | | | | | | | | | | | |
FINANCIALS — (8.2%) | | | | | | | | | | | | |
| | Credit Saison Co. Ltd. | | | 735,700 | | | | 9,019,474 | | | | 0.3 | % |
| | Hirogin Holdings, Inc. | | | 1,512,200 | | | | 8,331,078 | | | | 0.3 | % |
| | Jafco Group Co. Ltd. | | | 204,100 | | | | 12,931,197 | | | | 0.4 | % |
| | Other Securities | | | | | | | 253,393,996 | | | | 7.3 | % |
| | | | | | | | | | | | |
TOTAL FINANCIALS | | | | | | | 283,675,745 | | | | 8.3 | % |
| | | | | | | | | | | | |
HEALTH CARE — (4.4%) | | | | | | | | | | | | |
| | H.U. Group Holdings, Inc. | | | 362,400 | | | | 8,937,241 | | | | 0.3 | % |
| | Nipro Corp. | | | 809,400 | | | | 8,224,859 | | | | 0.2 | % |
| | Other Securities | | | | | | | 134,032,273 | | | | 3.9 | % |
| | | | | | | | | | | | |
TOTAL HEALTH CARE | | | | | | | 151,194,373 | | | | 4.4 | % |
| | | | | | | | | | | | |
INDUSTRIALS — (29.9%) | | | | | | | | | | | | |
| | Daiseki Co. Ltd. | | | 292,755 | | | | 13,664,852 | | | | 0.4 | % |
| | DMG Mori Co. Ltd. | | | 728,000 | | | | 12,536,750 | | | | 0.4 | % |
* | | Fujikura Ltd. | | | 1,714,800 | | | | 9,249,370 | | | | 0.3 | % |
| | Furukawa Electric Co. Ltd. | | | 424,300 | | | | 9,284,144 | | | | 0.3 | % |
| | GS Yuasa Corp. | | | 375,183 | | | | 8,167,598 | | | | 0.2 | % |
| | Hazama Ando Corp. | | | 1,294,000 | | | | 8,762,584 | | | | 0.3 | % |
| | Hitachi Zosen Corp. | | | 1,034,779 | | | | 8,113,625 | | | | 0.2 | % |
| | Inaba Denki Sangyo Co. Ltd. | | | 327,400 | | | | 7,853,534 | | | | 0.2 | % |
| | INFRONEER Holdings, Inc. | | | 1,192,388 | | | | 9,875,975 | | | | 0.3 | % |
| | Japan Steel Works Ltd. | | | 348,100 | | | | 10,226,224 | | | | 0.3 | % |
| | Meitec Corp. | | | 166,200 | | | | 9,996,518 | | | | 0.3 | % |
| | Mirait Holdings Corp. | | | 583,135 | | | | 11,215,268 | | | | 0.3 | % |
| | Nagase & Co. Ltd. | | | 578,600 | | | | 9,793,254 | | | | 0.3 | % |
| | Nichias Corp. | | | 391,000 | | | | 9,573,627 | | | | 0.3 | % |
| | Nishimatsu Construction Co. Ltd. | | | 345,000 | | | | 9,951,583 | | | | 0.3 | % |
# | | OSG Corp. | | | 511,900 | | | | 8,516,449 | | | | 0.3 | % |
| | Outsourcing, Inc. | | | 768,100 | | | | 14,734,721 | | | | 0.4 | % |
| | Penta-Ocean Construction Co. Ltd. | | | 1,616,400 | | | | 11,138,498 | | | | 0.3 | % |
195
THE JAPANESE SMALL COMPANY SERIES
CONTINUED
| | | | | | | | | | | | | | |
| | | | | | | | | | | Percentage | |
| | | | | Shares | | | Value» | | | of Net Assets‡ | |
INDUSTRIALS — (Continued) | | | | | | | | | | | | |
| | Ushio, Inc. | | | 651,100 | | | $ | 11,648,428 | | | | 0.4 | % |
| | Other Securities | | | | | | | 838,064,288 | | | | 24.4 | % |
| | | | | | | | | | | | |
TOTAL INDUSTRIALS | | | | | | | 1,032,367,290 | | | | 30.2 | % |
| | | | | | | | | | | | |
INFORMATION TECHNOLOGY — (15.2%) | | | | | | | | | | | | |
| | Alps Alpine Co. Ltd. | | | 1,039,300 | | | | 10,155,061 | | | | 0.3 | % |
# | | Anritsu Corp. | | | 636,100 | | | | 10,548,092 | | | | 0.3 | % |
| | Daiwabo Holdings Co. Ltd. | | | 582,700 | | | | 10,258,415 | | | | 0.3 | % |
| | Ferrotec Holdings Corp. | | | 232,000 | | | | 7,782,329 | | | | 0.2 | % |
| | Macnica Fuji Electronics Holdings, Inc. | | | 342,150 | | | | 8,043,827 | | | | 0.2 | % |
| | Nippon Electric Glass Co. Ltd. | | | 515,736 | | | | 13,168,257 | | | | 0.4 | % |
| | NSD Co. Ltd. | | | 508,160 | | | | 9,682,738 | | | | 0.3 | % |
| | Tokyo Seimitsu Co. Ltd. | | | 253,800 | | | | 10,333,728 | | | | 0.3 | % |
| | Topcon Corp. | | | 684,300 | | | | 12,200,386 | | | | 0.4 | % |
| | Ulvac, Inc. | | | 162,300 | | | | 9,105,840 | | | | 0.3 | % |
| | Other Securities | | | | | | | 423,947,927 | | | | 12.4 | % |
| | | | | | | | | | | | |
TOTAL INFORMATION TECHNOLOGY | | | | | | | 525,226,600 | | | | 15.4 | % |
| | | | | | | | | | | | |
MATERIALS — (11.9%) | | | | | | | | | | | | |
| | ADEKA Corp. | | | 602,400 | | | | 13,400,601 | | | | 0.4 | % |
# | | Asahi Holdings, Inc. | | | 464,800 | | | | 8,295,809 | | | | 0.3 | % |
| | Dowa Holdings Co. Ltd. | | | 208,205 | | | | 8,695,455 | | | | 0.3 | % |
| | Kobe Steel Ltd. | | | 1,495,100 | | | | 8,784,296 | | | | 0.3 | % |
| | Mitsui Mining & Smelting Co. Ltd. | | | 372,700 | | | | 10,694,693 | | | | 0.3 | % |
| | Sumitomo Bakelite Co. Ltd. | | | 192,800 | | | | 8,664,946 | | | | 0.3 | % |
| | Toagosei Co. Ltd. | | | 740,500 | | | | 8,275,887 | | | | 0.2 | % |
| | Ube Industries Ltd. | | | 430,100 | | | | 8,013,345 | | | | 0.2 | % |
| | Yamato Kogyo Co. Ltd. | | | 253,200 | | | | 8,489,870 | | | | 0.3 | % |
| | Other Securities | | | | | | | 326,086,787 | | | | 9.4 | % |
| | | | | | | | | | | | |
TOTAL MATERIALS | | | | | | | 409,401,689 | | | | 12.0 | % |
| | | | | | | | | | | | |
REAL ESTATE — (1.7%) | | | | | | | | | | | | |
| | Other Securities | | | | | | | 57,897,941 | | | | 1.7 | % |
| | | | | | | | | | | | |
UTILITIES — (1.5%) | | | | | | | | | | | | |
| | Nippon Gas Co. Ltd. | | | 684,000 | | | | 8,484,055 | | | | 0.3 | % |
| | West Holdings Corp. | | | 143,603 | | | | 8,026,221 | | | | 0.2 | % |
| | Other Securities | | | | | | | 35,924,861 | | | | 1.0 | % |
| | | | | | | | | | | | |
TOTAL UTILITIES | | | | | | | 52,435,137 | | | | 1.5 | % |
| | | | | | | | | | | | |
TOTAL COMMON STOCKS
(Cost $2,886,201,109) | | | | | | | 3,387,960,476 | | | | 99.2 | % |
| | | | | | | | | | | | |
| | | | |
| | | | | | | | Value† | | | | |
SECURITIES LENDING COLLATERAL — (1.8%) | | | | | | | | | | | | |
@§ | | The DFA Short Term Investment Fund | | | 5,314,587 | | | | 61,489,772 | | | | 1.8 | % |
| | | | | | | | | | | | |
TOTAL INVESTMENTS—(100.0%)
(Cost $2,947,678,139) | | | | | | $ | 3,449,450,248 | | | | 101.0 | % |
| | | | | | | | | | | | | | |
196
THE JAPANESE SMALL COMPANY SERIES
CONTINUED
Summary of the Series’ investments as of October 31, 2021, based on their valuation inputs, is as follows (see Security Valuation Note):
| | | | | | | | | | | | | | | | |
| | | Investments in Securities (Market Value) | |
| | | Level 1 | | | Level 2 | | | Level 3 | | | Total | |
Common Stocks | | | | | | | | | | | | | | | | |
Communication Services | | | — | | | $ | 105,693,477 | | | | — | | | $ | 105,693,477 | |
Consumer Discretionary | | | — | | | | 488,751,508 | | | | — | | | | 488,751,508 | |
Consumer Staples | | | — | | | | 248,614,645 | | | | — | | | | 248,614,645 | |
Energy | | | — | | | | 32,702,071 | | | | — | | | | 32,702,071 | |
Financials | | | — | | | | 283,675,745 | | | | — | | | | 283,675,745 | |
Health Care | | | — | | | | 151,194,373 | | | | — | | | | 151,194,373 | |
Industrials | | $ | 15,163,165 | | | | 1,017,204,125 | | | | — | | | | 1,032,367,290 | |
Information Technology | | | — | | | | 525,226,600 | | | | — | | | | 525,226,600 | |
Materials | | | — | | | | 409,401,689 | | | | — | | | | 409,401,689 | |
Real Estate | | | — | | | | 57,897,941 | | | | — | | | | 57,897,941 | |
Utilities | | | — | | | | 52,435,137 | | | | — | | | | 52,435,137 | |
Securities Lending Collateral | | | — | | | | 61,489,772 | | | | — | | | | 61,489,772 | |
| | | | | | | | | | | | | | | | |
TOTAL | | $ | 15,163,165 | | | $ | 3,434,287,083 | | | | — | | | $ | 3,449,450,248 | |
| | | | | | | | | | | | | | | | |
See accompanying Notes to Financial Statements.
197
THE ASIA PACIFIC SMALL COMPANY SERIES
SUMMARY SCHEDULE OF PORTFOLIO HOLDINGS
October 31, 2021
| | | | | | | | | | | | | | |
| | | | | | | | | | | Percentage | |
| | | | | Shares | | | Value» | | | of Net Assets‡ | |
COMMON STOCKS — (97.8%) | | | | | | | | | | | | |
AUSTRALIA — (59.7%) | | | | | | | | | | | | |
* | | AMP Ltd. | | | 12,893,152 | | | $ | 10,548,526 | | | | 0.6 | % |
| | ARB Corp. Ltd. | | | 521,174 | | | | 19,195,274 | | | | 1.1 | % |
| | Bapcor Ltd. | | | 2,189,248 | | | | 13,204,770 | | | | 0.7 | % |
# | | Breville Group Ltd. | | | 681,670 | | | | 15,172,506 | | | | 0.8 | % |
| | Brickworks Ltd. | | | 486,532 | | | | 8,731,553 | | | | 0.5 | % |
| | Carsales.com Ltd. | | | 553,743 | | | | 10,362,825 | | | | 0.6 | % |
| | Challenger Ltd. | | | 2,321,555 | | | | 12,194,726 | | | | 0.7 | % |
* | | Corporate Travel Management Ltd. | | | 650,080 | | | | 12,044,252 | | | | 0.7 | % |
| | Credit Corp. Group Ltd. | | | 442,571 | | | | 10,527,755 | | | | 0.6 | % |
| | CSR Ltd. | | | 3,109,441 | | | | 13,958,892 | | | | 0.8 | % |
| | Downer EDI Ltd. | | | 2,071,013 | | | | 9,901,826 | | | | 0.6 | % |
| | Eagers Automotive Ltd. | | | 775,292 | | | | 8,710,647 | | | | 0.5 | % |
| | Elders Ltd. | | | 1,009,369 | | | | 9,169,814 | | | | 0.5 | % |
| | Healius Ltd. | | | 3,973,423 | | | | 14,549,415 | | | | 0.8 | % |
| | Iluka Resources Ltd. | | | 1,999,707 | | | | 14,266,701 | | | | 0.8 | % |
| | IOOF Holdings Ltd. | | | 3,815,495 | | | | 11,809,268 | | | | 0.7 | % |
| | IRESS Ltd. | | | 1,225,060 | | | | 11,168,044 | | | | 0.6 | % |
* | | Lynas Rare Earths Ltd. | | | 1,615,350 | | | | 9,011,232 | | | | 0.5 | % |
# | | Metcash Ltd. | | | 6,296,220 | | | | 19,404,717 | | | | 1.1 | % |
| | nib holdings Ltd. | | | 2,951,426 | | | | 14,861,717 | | | | 0.8 | % |
* | | Orocobre Ltd. | | | 2,264,756 | | | | 15,294,789 | | | | 0.8 | % |
| | Orora Ltd. | | | 5,931,076 | | | | 14,837,472 | | | | 0.8 | % |
| | Pendal Group Ltd. | | | 2,058,779 | | | | 10,413,306 | | | | 0.6 | % |
| | Perpetual Ltd. | | | 376,124 | | | | 10,750,588 | | | | 0.6 | % |
* | | Perseus Mining Ltd. | | | 8,114,950 | | | | 9,622,883 | | | | 0.5 | % |
| | Premier Investments Ltd. | | | 458,786 | | | | 10,647,565 | | | | 0.6 | % |
| | Reliance Worldwide Corp. Ltd. | | | 3,629,454 | | | | 15,959,122 | | | | 0.9 | % |
| | Sandfire Resources Ltd. | | | 2,725,681 | | | | 11,481,645 | | | | 0.6 | % |
| | Sims Ltd. | | | 1,175,465 | | | | 12,796,166 | | | | 0.7 | % |
| | Spark Infrastructure Group | | | 10,978,157 | | | | 23,274,771 | | | | 1.3 | % |
* | | Star Entertainment Grp Ltd. | | | 3,941,041 | | | | 10,951,914 | | | | 0.6 | % |
| | Steadfast Group Ltd. | | | 3,596,653 | | | | 12,654,068 | | | | 0.7 | % |
| | Super Retail Group Ltd. | | | 1,085,264 | | | | 10,646,830 | | | | 0.6 | % |
| | Technology One Ltd. | | | 1,674,190 | | | | 15,547,005 | | | | 0.9 | % |
* | | Webjet Ltd. | | | 2,061,672 | | | | 9,866,315 | | | | 0.5 | % |
* | | Whitehaven Coal Ltd. | | | 5,382,983 | | | | 10,652,888 | | | | 0.6 | % |
#* | | Zip Co. Ltd. | | | 1,986,170 | | | | 9,816,301 | | | | 0.5 | % |
| | Other Securities | | | | | | | 645,675,521 | | | | 35.1 | % |
| | | | | | | | | | | | | | |
TOTAL AUSTRALIA | | | | | | | 1,109,683,609 | | | | 60.9 | % |
| | | | | | | | | | | | | | |
CHINA — (0.0%) | | | | | | | | | | | | |
| | Other Securities | | | | | | | 138,963 | | | | 0.0 | % |
| | | | | | | | | | | | | | |
HONG KONG — (21.0%) | | | | | | | | | | | | |
| | ASM Pacific Technology Ltd. | | | 1,406,800 | | | | 15,222,149 | | | | 0.8 | % |
# | | Kerry Logistics Network Ltd. | | | 4,063,500 | | | | 9,853,152 | | | | 0.5 | % |
| | Luk Fook Holdings International Ltd. | | | 3,577,000 | | | | 9,748,695 | | | | 0.5 | % |
| | Pacific Basin Shipping Ltd. | | | 32,170,000 | | | | 14,846,663 | | | | 0.8 | % |
| | VTech Holdings Ltd. | | | 1,345,100 | | | | 10,357,891 | | | | 0.6 | % |
| | Other Securities | | | | | | | 331,012,861 | | | | 18.2 | % |
| | | | | | | | | | | | | | |
TOTAL HONG KONG | | | | | | | 391,041,411 | | | | 21.4 | % |
| | | | | | | | | | | | | | |
198
THE ASIA PACIFIC SMALL COMPANY SERIES
CONTINUED
| | | | | | | | | | | | | | |
| | | | | | | | | | | Percentage | |
| | | | | Shares | | | Value» | | | of Net Assets‡ | |
NEW ZEALAND — (6.5%) | | | | | | | | | | | | |
| | Chorus Ltd. | | | 2,826,320 | | | $ | 12,906,707 | | | | 0.7 | % |
# | | Freightways Ltd. | | | 976,177 | | | | 9,063,774 | | | | 0.5 | % |
| | Infratil Ltd. | | | 3,435,660 | | | | 20,385,406 | | | | 1.1 | % |
| | Mainfreight Ltd. | | | 156,515 | | | | 10,085,924 | | | | 0.6 | % |
| | SKYCITY Entertainment Group Ltd. | | | 4,937,567 | | | | 11,322,406 | | | | 0.6 | % |
| | Summerset Group Holdings Ltd. | | | 985,298 | | | | 10,250,669 | | | | 0.6 | % |
| | Other Securities | | | | | | | 46,763,116 | | | | 2.5 | % |
| | | | | | | | | | | | | | |
TOTAL NEW ZEALAND | | | | | | | 120,778,002 | | | | 6.6 | % |
| | | | | | | | | | | | | | |
SINGAPORE — (10.5%) | | | | | | | | | | | | |
| | Sembcorp Industries Ltd. | | | 6,027,400 | | | | 8,995,759 | | | | 0.5 | % |
| | Singapore Press Holdings Ltd. | | | 7,439,300 | | | | 10,978,277 | | | | 0.6 | % |
| | Other Securities | | | | | | | 176,291,309 | | | | 9.7 | % |
| | | | | | | | | | | | | | |
TOTAL SINGAPORE | | | | | | | 196,265,345 | | | | 10.8 | % |
| | | | | | | | | | | | | | |
UNITED STATES — (0.1%) | | | | | | | | | | | | |
| | Other Securities | | | | | | | 1,189,681 | | | | 0.1 | % |
| | | | | | | | | | | | | | |
TOTAL COMMON STOCKS | | | | | | | 1,819,097,011 | | | | 99.8 | % |
| | | | | | | | | | | | | | |
PREFERRED STOCKS — (0.0%) | | | | | | | | | | | | |
AUSTRALIA — (0.0%) | | | | | | | | | | | | |
| | Other Security | | | | | | | 68,066 | | | | 0.0 | % |
| | | | | | | | | | | | | | |
RIGHTS/WARRANTS — (0.0%) | | | | | | | | | | | | |
AUSTRALIA — (0.0%) | | | | | | | | | | | | |
| | Other Securities | | | | | | | 138 | | | | 0.0 | % |
| | | | | | | | | | | | | | |
HONG KONG — (0.0%) | | | | | | | | | | | | |
| | Other Security | | | | | | | 7,842 | | | | 0.0 | % |
| | | | | | | | | | | | | | |
NEW ZEALAND — (0.0%) | | | | | | | | | | | | |
| | Other Security | | | | | | | 15,450 | | | | 0.0 | % |
| | | | | | | | | | | | | | |
SINGAPORE — (0.0%) | | | | | | | | | | | | |
| | Other Securities | | | | | | | 16,264 | | | | 0.0 | % |
| | | | | | | | | | | | | | |
TOTAL RIGHTS/WARRANTS | | | | | | | 39,694 | | | | 0.0 | % |
| | | | | | | | | | | | | | |
TOTAL INVESTMENT SECURITIES
(Cost $1,603,374,310) | | | | | | | 1,819,204,771 | | | | | |
| | | | | | | | | | | | | | |
| | | | |
| | | | | | | | Value† | | | | |
SECURITIES LENDING COLLATERAL — (2.2%) | | | | | | | | | | | | |
@§ | | The DFA Short Term Investment Fund | | | 3,509,676 | | | | 40,606,949 | | | | 2.2 | % |
| | | | | | | | | | | | | | |
TOTAL INVESTMENTS—(100.0%)
(Cost $1,643,976,673) | | | | | | $ | 1,859,811,720 | | | | 102.0 | % |
| | | | | | | | | | | | | | |
199
THE ASIA PACIFIC SMALL COMPANY SERIES
CONTINUED
Summary of the Series’ investments as of October 31, 2021, based on their valuation inputs, is as follows (see Security Valuation Note):
| | | | | | | | | | | | | | | | |
| | | Investments in Securities (Market Value) | |
| | | Level 1 | | | Level 2 | | | Level 3 | | | Total | |
Common Stocks | | | | | | | | | | | | | | | | |
Australia | | $ | 12,676 | | | $ | 1,109,648,166 | | | $ | 22,767 | | | $ | 1,109,683,609 | |
China | | | — | | | | 138,963 | | | | — | | | | 138,963 | |
Hong Kong | | | — | | | | 390,169,707 | | | | 871,704 | | | | 391,041,411 | |
New Zealand | | | — | | | | 120,778,002 | | | | — | | | | 120,778,002 | |
Singapore | | | — | | | | 195,145,698 | | | | 1,119,647 | | | | 196,265,345 | |
United States | | | — | | | | 1,189,681 | | | | — | | | | 1,189,681 | |
Preferred Stocks | | | | | | | | | | | | | | | | |
Australia | | | — | | | | 68,066 | | | | — | | | | 68,066 | |
Rights/Warrants | | | | | | | | | | | | | | | | |
Australia | | | — | | | | 138 | | | | — | | | | 138 | |
Hong Kong | | | — | | | | 7,842 | | | | — | | | | 7,842 | |
New Zealand | | | — | | | | 15,450 | | | | — | | | | 15,450 | |
Singapore | | | — | | | | 16,264 | | | | — | | | | 16,264 | |
Securities Lending Collateral | | | — | | | | 40,606,949 | | | | — | | | | 40,606,949 | |
| | | | | | | | | | | | | | | | |
TOTAL | | $ | 12,676 | | | $ | 1,857,784,926 | | | $ | 2,014,118 | ^ | | $ | 1,859,811,720 | |
| | | | | | | | | | | | | | | | |
| ^ | A reconciliation of Level 3 investments is presented when the Fund had a significant amount of Level 3 investments at the beginning and/or end of the reporting period in relation to net assets. |
See accompanying Notes to Financial Statements.
200
THE UNITED KINGDOM SMALL COMPANY SERIES
SUMMARY SCHEDULE OF PORTFOLIO HOLDINGS
October 31, 2021
| | | | | | | | | | | | | | |
| | | | | Shares | | | Value» | | | Percentage
of Net Assets‡ | |
COMMON STOCKS — (99.2%) | | | | | | | | | | | | |
COMMUNICATION SERVICES — (3.8%) | | | | | | | | | | | | |
| | Daily Mail & General Trust PLC, Class A | | | 1,003,074 | | | $ | 14,237,131 | | | | 0.7 | % |
| | Other Securities | | | | | | | 57,764,428 | | | | 3.1 | % |
| | | | | | | | | | | | |
TOTAL COMMUNICATION SERVICES | | | | | | | 72,001,559 | | | | 3.8 | % |
| | | | | | | | | | | | |
CONSUMER DISCRETIONARY — (19.8%) | | | | | | | | | | | | |
| | Bellway PLC | | | 417,887 | | | | 18,961,147 | | | | 1.0 | % |
* | | Countryside Properties PLC | | | 2,922,469 | | | | 18,812,341 | | | | 1.0 | % |
| | Domino’s Pizza Group PLC | | | 3,262,553 | | | | 17,283,266 | | | | 0.9 | % |
* | | Frasers Group PLC | | | 1,628,144 | | | | 14,351,413 | | | | 0.8 | % |
| | Games Workshop Group PLC | | | 157,764 | | | | 20,837,762 | | | | 1.1 | % |
| | Greggs PLC | | | 636,335 | | | | 26,596,851 | | | | 1.4 | % |
| | Inchcape PLC | | | 2,550,326 | | | | 28,784,465 | | | | 1.5 | % |
* | | Marks & Spencer Group PLC | | | 7,572,745 | | | | 19,035,955 | | | | 1.0 | % |
| | Pets at Home Group PLC | | | 3,262,961 | | | | 21,532,073 | | | | 1.1 | % |
* | | Playtech PLC | | | 1,947,421 | | | | 18,527,516 | | | | 1.0 | % |
| | Redrow PLC | | | 1,602,850 | | | | 14,112,668 | | | | 0.8 | % |
| | Vistry Group PLC | | | 898,922 | | | | 15,053,083 | | | | 0.8 | % |
| | Other Securities | | | | | | | 142,754,262 | | | | 7.5 | % |
| | | | | | | | | | | | | | |
TOTAL CONSUMER DISCRETIONARY | | | | | | | 376,642,802 | | | | 19.9 | % |
| | | | | | | | | | | | |
CONSUMER STAPLES — (6.7%) | | | | | | | | | | | | |
| | Britvic PLC | | | 1,748,990 | | | | 21,232,260 | | | | 1.1 | % |
| | Cranswick PLC | | | 374,680 | | | | 17,707,906 | | | | 0.9 | % |
| | Fevertree Drinks PLC | | | 655,368 | | | | 20,392,946 | | | | 1.1 | % |
| | Tate & Lyle PLC | | | 2,419,131 | | | | 21,435,384 | | | | 1.1 | % |
| | Other Securities | | | | | | | 46,754,593 | | | | 2.5 | % |
| | | | | | | | | | | | | | |
TOTAL CONSUMER STAPLES | | | | | | | 127,523,089 | | | | 6.7 | % |
| | | | | | | | | | | | |
ENERGY — (2.3%) | | | | | | | | | | | | |
| | Other Securities | | | | | | | 44,336,800 | | | | 2.3 | % |
| | | | | | | | | | | | |
FINANCIALS — (16.6%) | | | | | | | | | | | | |
* | | Beazley PLC | | | 3,279,338 | | | | 17,442,492 | | | | 0.9 | % |
| | Close Brothers Group PLC | | | 970,236 | | | | 19,112,250 | | | | 1.0 | % |
| | Hiscox Ltd. | | | 1,621,850 | | | | 18,452,426 | | | | 1.0 | % |
| | IG Group Holdings PLC | | | 2,149,742 | | | | 23,326,151 | | | | 1.2 | % |
| | Man Group PLC | | | 9,599,081 | | | | 30,488,754 | | | | 1.6 | % |
| | Paragon Banking Group PLC | | | 1,977,656 | | | | 14,825,635 | | | | 0.8 | % |
| | Quilter PLC | | | 10,641,392 | | | | 22,656,903 | | | | 1.2 | % |
* | | Virgin Money UK PLC | | | 5,337,722 | | | | 14,829,830 | | | | 0.8 | % |
| | Other Securities | | | | | | | 154,697,225 | | | | 8.1 | % |
| | | | | | | | | | | | |
TOTAL FINANCIALS | | | | | | | 315,831,666 | | | | 16.6 | % |
| | | | | | | | | | | | |
HEALTH CARE — (3.2%) | | | | | | | | | | | | |
* | | CVS Group PLC | | | 436,875 | | | | 14,888,932 | | | | 0.8 | % |
| | Other Securities | | | | | | | 46,277,391 | | | | 2.4 | % |
| | | | | | | | | | | | |
TOTAL HEALTH CARE | | | | | | | 61,166,323 | | | | 3.2 | % |
| | | | | | | | | | | | |
INDUSTRIALS — (25.6%) | | | | | | | | | | | | |
| | Bodycote PLC | | | 1,252,104 | | | | 13,714,783 | | | | 0.7 | % |
201
THE UNITED KINGDOM SMALL COMPANY SERIES
CONTINUED
| | | | | | | | | | | | | | |
| | | | | Shares | | | Value» | | | Percentage
of Net Assets‡ | |
INDUSTRIALS — (Continued) | | | | | | | | | | | | |
| | Diploma PLC | | | 628,300 | | | $ | 25,821,321 | | | | 1.4 | % |
| | Genuit Group PLC | | | 1,416,533 | | | | 12,853,080 | | | | 0.7 | % |
| | Grafton Group PLC | | | 1,582,491 | | | | 29,066,399 | | | | 1.5 | % |
| | Hays PLC | | | 8,705,616 | | | | 19,729,104 | | | | 1.0 | % |
| | IMI PLC | | | 1,193,944 | | | | 26,662,992 | | | | 1.4 | % |
* | | Meggitt PLC | | | 2,411,365 | | | | 24,757,023 | | | | 1.3 | % |
| | Pagegroup PLC | | | 2,014,945 | | | | 18,283,115 | | | | 1.0 | % |
| | Rotork PLC | | | 5,214,504 | | | | 25,207,456 | | | | 1.3 | % |
| | Travis Perkins PLC | | | 1,046,773 | | | | 22,129,674 | | | | 1.2 | % |
| | Ultra Electronics Holdings PLC | | | 566,936 | | | | 25,121,854 | | | | 1.3 | % |
| | Other Securities | | | | | | | 243,351,972 | | | | 12.9 | % |
| | | | | | | | | | | | |
TOTAL INDUSTRIALS | | | | | | | 486,698,773 | | | | 25.7 | % |
| | | | | | | | | | | | |
INFORMATION TECHNOLOGY — (8.5%) | | | | | | | | | | | | |
| | Computacenter PLC | | | 514,578 | | | | 18,918,353 | | | | 1.0 | % |
| | Softcat PLC | | | 738,845 | | | | 19,636,602 | | | | 1.0 | % |
| | Spectris PLC | | | 433,873 | | | | 22,323,692 | | | | 1.2 | % |
| | Spirent Communications PLC | | | 4,206,131 | | | | 16,515,848 | | | | 0.9 | % |
| | Other Securities | | | | | | | 84,212,380 | | | | 4.4 | % |
| | | | | | | | | | | | |
TOTAL INFORMATION TECHNOLOGY | | | | | | | 161,606,875 | | | | 8.5 | % |
| | | | | | | | | | | | |
MATERIALS — (6.5%) | | | | | | | | | | | | |
| | Hill & Smith Holdings PLC | | | 545,011 | | | | 13,677,859 | | | | 0.7 | % |
| | Marshalls PLC | | | 1,408,571 | | | | 13,643,131 | | | | 0.7 | % |
| | Synthomer PLC | | | 2,263,160 | | | | 15,684,931 | | | | 0.8 | % |
| | Victrex PLC | | | 576,646 | | | | 18,032,016 | | | | 1.0 | % |
| | Other Securities | | | | | | | 63,589,179 | | | | 3.4 | % |
| | | | | | | | | | | | |
TOTAL MATERIALS | | | | | | | 124,627,116 | | | | 6.6 | % |
| | | | | | | | | | | | |
REAL ESTATE — (3.7%) | | | | | | | | | | | | |
| | Grainger PLC | | | 4,411,972 | | | | 18,556,053 | | | | 1.0 | % |
* | | IWG PLC | | | 3,858,261 | | | | 16,364,344 | | | | 0.9 | % |
| | Savills PLC | | | 986,247 | | | | 19,181,608 | | | | 1.0 | % |
| | Other Securities | | | | | | | 16,005,096 | | | | 0.8 | % |
| | | | | | | | | | | | |
TOTAL REAL ESTATE | | | | | | | 70,107,101 | | | | 3.7 | % |
| | | | | | | | | | | | |
UTILITIES — (2.5%) | | | | | | | | | | | | |
* | | Centrica PLC | | | 19,338,945 | | | | 15,964,039 | | | | 0.8 | % |
| | Drax Group PLC | | | 2,521,289 | | | | 18,336,886 | | | | 1.0 | % |
| | Other Securities | | | | | | | 13,045,684 | | | | 0.7 | % |
| | | | | | | | | | | | |
TOTAL UTILITIES | | | | | | | 47,346,609 | | | | 2.5 | % |
| | | | | | | | | | | | |
TOTAL COMMON STOCKS
(Cost $1,462,298,964) | | | | | | | 1,887,888,713 | | | | 99.5 | % |
| | | | | | | | | | | | |
| | | | |
| | | | | | | | Value† | | | | |
SECURITIES LENDING COLLATERAL — (0.8%) | | | | | | | | | | | | |
@§ | | The DFA Short Term Investment Fund | | | 1,351,028 | | | | 15,631,396 | | | | 0.8 | % |
| | | | | | | | | | | | |
TOTAL INVESTMENTS—(100.0%)
(Cost $1,477,926,404) | | | | | | $ | 1,903,520,109 | | | | 100.3 | % |
| | | | | | | | | | | | | | |
202
THE UNITED KINGDOM SMALL COMPANY SERIES
CONTINUED
Summary of the Series’ investments as of October 31, 2021, based on their valuation inputs, is as follows (see Security Valuation Note):
| | | | | | | | | | | | | | | | |
| | | Investments in Securities (Market Value) | |
| | | Level 1 | | | Level 2 | | | Level 3 | | | Total | |
Common Stocks | | | | | | | | | | | | | | | | |
Communication Services | | $ | 55,069 | | | $ | 71,946,490 | | | | — | | | $ | 72,001,559 | |
Consumer Discretionary | | | — | | | | 376,642,802 | | | | — | | | | 376,642,802 | |
Consumer Staples | | | — | | | | 127,523,089 | | | | — | | | | 127,523,089 | |
Energy | | | — | | | | 44,336,800 | | | | — | | | | 44,336,800 | |
Financials | | | — | | | | 315,831,666 | | | | — | | | | 315,831,666 | |
Health Care | | | — | | | | 61,166,323 | | | | — | | | | 61,166,323 | |
Industrials | | | — | | | | 486,698,773 | | | | — | | | | 486,698,773 | |
Information Technology | | | — | | | | 161,606,875 | | | | — | | | | 161,606,875 | |
Materials | | | — | | | | 124,627,116 | | | | — | | | | 124,627,116 | |
Real Estate | | | — | | | | 70,107,101 | | | | — | | | | 70,107,101 | |
Utilities | | | — | | | | 47,346,609 | | | | — | | | | 47,346,609 | |
Securities Lending Collateral | | | — | | | | 15,631,396 | | | | — | | | | 15,631,396 | |
| | | | | | | | | | | | | | | | |
TOTAL | | $ | 55,069 | | | $ | 1,903,465,040 | | | | — | | | $ | 1,903,520,109 | |
| | | | | | | | | | | | | | | | |
| | | | | | | | | | | | | | | | |
See accompanying Notes to Financial Statements.
203
THE CONTINENTAL SMALL COMPANY SERIES
SUMMARY SCHEDULE OF PORTFOLIO HOLDINGS
October 31, 2021
| | | | | | | | | | | | | | |
| | | | | Shares | | | Value» | | | Percentage
of Net Assets‡ | |
COMMON STOCKS — (94.7%) | | | | | | | | | | | | |
AUSTRIA — (3.1%) | | | | | | | | | | | | |
| | ANDRITZ AG | | | 473,948 | | | $ | 26,919,532 | | | | 0.4 | % |
| | Other Securities | | | | | | | 187,051,424 | | | | 2.9 | % |
| | | | | | | | | | | | |
TOTALAUSTRIA | | | | | | | 213,970,956 | | | | 3.3 | % |
| | | | | | | | | | | | |
BELGIUM — (3.8%) | | | | | | | | | | | | |
| | Ackermans & van Haaren NV | | | 177,966 | | | | 30,604,090 | | | | 0.5 | % |
| | D’ieteren Group | | | 194,540 | | | | 33,543,417 | | | | 0.5 | % |
| | Other Securities | | | | | | | 197,897,761 | | | | 3.0 | % |
| | | | | | | | | | | | |
TOTAL BELGIUM | | | | | | | 262,045,268 | | | | 4.0 | % |
| | | | | | | | | | | | |
CANADA — (0.0%) | | | | | | | | | | | | |
| | Other Security | | | | | | | 709,749 | | | | 0.0 | % |
| | | | | | | | | | | | |
DENMARK — (5.3%) | | | | | | | | | | | | |
| | Ringkjoebing Landbobank AS | | | 195,777 | | | | 24,871,398 | | | | 0.4 | % |
| | Royal Unibrew AS | | | 331,556 | | | | 41,187,654 | | | | 0.6 | % |
# | | SimCorp AS | | | 271,754 | | | | 32,907,854 | | | | 0.5 | % |
| | Other Securities | | | | | | | 260,732,463 | | | | 4.0 | % |
| | | | | | | | | | | | |
TOTAL DENMARK | | | | | | | 359,699,369 | | | | 5.5 | % |
| | | | | | | | | | | | |
FINLAND — (5.8%) | | | | | | | | | | | | |
| | Huhtamaki Oyj | | | 673,038 | | | | 29,346,505 | | | | 0.4 | % |
# | | Nokian Renkaat Oyj | | | 768,570 | | | | 28,861,457 | | | | 0.4 | % |
# | | Orion Oyj, Class B | | | 636,552 | | | | 27,564,996 | | | | 0.4 | % |
| | Valmet Oyj | | | 924,559 | | | | 37,533,401 | | | | 0.6 | % |
| | Other Securities | | | | | | | 271,277,867 | | | | 4.2 | % |
| | | | | | | | | | | | |
TOTAL FINLAND | | | | | | | 394,584,226 | | | | 6.0 | % |
| | | | | | | | | | | | |
FRANCE — (10.4%) | | | | | | | | | | | | |
| | Faurecia SE | | | 649,627 | | | | 33,928,710 | | | | 0.5 | % |
| | Rexel SA | | | 2,125,412 | | | | 42,245,103 | | | | 0.7 | % |
* | | SOITEC | | | 135,169 | | | | 35,988,721 | | | | 0.6 | % |
| | Other Securities | | | | | | | 598,104,390 | | | | 9.1 | % |
| | | | | | | | | | | | |
TOTAL FRANCE | | | | | | | 710,266,924 | | | | 10.9 | % |
| | | | | | | | | | | | |
GERMANY — (15.1%) | | | | | | | | | | | | |
| | Aurubis AG | | | 287,587 | | | | 24,781,328 | | | | 0.4 | % |
| | Freenet AG | | | 1,000,321 | | | | 25,763,506 | | | | 0.4 | % |
| | GEA Group AG | | | 742,082 | | | | 36,548,405 | | | | 0.6 | % |
# | | Gerresheimer AG | | | 261,448 | | | | 23,988,547 | | | | 0.4 | % |
| | Hugo Boss AG | | | 459,212 | | | | 28,754,576 | | | | 0.4 | % |
* | | K+S AG | | | 1,479,794 | | | | 25,500,212 | | | | 0.4 | % |
| | Lanxess AG | | | 599,001 | | | | 40,362,102 | | | | 0.6 | % |
# | | ProSiebenSat.1 Media SE | | | 1,393,286 | | | | 23,338,566 | | | | 0.4 | % |
| | Rheinmetall AG | | | 309,902 | | | | 30,068,830 | | | | 0.5 | % |
| | TAG Immobilien AG | | | 1,033,296 | | | | 31,392,640 | | | | 0.5 | % |
| | Other Securities | | | | | | | 735,033,666 | | | | 11.1 | % |
| | | | | | | | | | | | |
TOTAL GERMANY | | | | | | | 1,025,532,378 | | | | 15.7 | % |
| | | | | | | | | | | | |
204
THE CONTINENTAL SMALL COMPANY SERIES
CONTINUED
| | | | | | | | | | | | | | |
| | | | | Shares | | | Value» | | | Percentage
of Net Assets‡ | |
IRELAND — (1.0%) | | | | | | | | | | | | |
* | | Bank of Ireland Group PLC | | | 6,006,044 | | | $ | 35,779,124 | | | | 0.6 | % |
| | Other Securities | | | | | | | 30,504,504 | | | | 0.4 | % |
| | | | | | | | | | | | |
TOTAL IRELAND | | | | | | | 66,283,628 | | | | 1.0 | % |
| | | | | | | | | | | | |
ISRAEL — (3.3%) | | | | | | | | | | | | |
| | Other Securities | | | | | | | 225,995,115 | | | | 3.4 | % |
| | | | | | | | | | | | |
ITALY — (8.3%) | | | | | | | | | | | | |
| | A2A SpA | | | 12,233,648 | | | | 25,743,846 | | | | 0.4 | % |
| | Azimut Holding SpA | | | 906,940 | | | | 26,118,330 | | | | 0.4 | % |
# | | Banco BPM SpA | | | 12,107,842 | | | | 37,652,859 | | | | 0.6 | % |
| | Hera SpA | | | 5,824,869 | | | | 23,830,941 | | | | 0.4 | % |
| | Italgas SpA | | | 3,792,959 | | | | 24,098,500 | | | | 0.4 | % |
| | Reply SpA | | | 148,015 | | | | 28,730,201 | | | | 0.4 | % |
| | Other Securities | | | | | | | 396,359,830 | | | | 6.0 | % |
| | | | | | | | | | | | |
TOTAL ITALY | | | | | | | 562,534,507 | | | | 8.6 | % |
| | | | | | | | | | | | |
NETHERLANDS — (6.7%) | | | | | | | | | | | | |
| | Aalberts NV | | | 720,618 | | | | 39,885,206 | | | | 0.6 | % |
| | Arcadis NV | | | 543,636 | | | | 26,497,175 | | | | 0.4 | % |
| | ASR Nederland NV | | | 931,393 | | | | 43,537,226 | | | | 0.7 | % |
| | BE Semiconductor Industries NV | | | 464,004 | | | | 42,394,069 | | | | 0.7 | % |
| | IMCD NV | | | 226,957 | | | | 50,394,583 | | | | 0.8 | % |
| W | | Signify NV | | | 673,043 | | | | 32,613,232 | | | | 0.5 | % |
| | Other Securities | | | | | | | 220,230,807 | | �� | | 3.3 | % |
| | | | | | | | | | | | |
TOTAL NETHERLANDS | | | | | | | 455,552,298 | | | | 7.0 | % |
| | | | | | | | | | | | |
NORWAY — (2.0%) | | | | | | | | | | | | |
| | Other Securities | | | | | | | 138,643,309 | | | | 2.1 | % |
| | | | | | | | | | | | |
PORTUGAL — (0.7%) | | | | | | | | | | | | |
| | Other Securities | | | | | | | 50,448,984 | | | | 0.8 | % |
| | | | | | | | | | | | |
SPAIN — (5.2%) | | | | | | | | | | | | |
* | | Banco de Sabadell SA | | | 36,662,284 | | | | 29,505,685 | | | | 0.5 | % |
| | Bankinter SA | | | 4,259,580 | | | | 23,453,290 | | | | 0.4 | % |
# | | Enagas SA | | | 1,045,470 | | | | 23,459,790 | | | | 0.4 | % |
| | Other Securities | | | | | | | 275,109,321 | | | | 4.1 | % |
| | | | | | | | | | | | |
TOTAL SPAIN | | | | | | | 351,528,086 | | | | 5.4 | % |
| | | | | | | | | | | | |
SWEDEN — (8.8%) | | | | | | | | | | | | |
| | Other Securities | | | | | | | 598,208,203 | | | | 9.1 | % |
| | | | | | | | | | | | |
SWITZERLAND — (15.1%) | | | | | | | | | | | | |
| | Allreal Holding AG | | | 118,457 | | | | 25,053,150 | | | | 0.4 | % |
* | | ams AG | | | 1,241,971 | | | | 24,588,933 | | | | 0.4 | % |
| | Belimo Holding AG | | | 62,238 | | | | 36,184,269 | | | | 0.6 | % |
| | Bucher Industries AG | | | 55,557 | | | | 28,039,159 | | | | 0.4 | % |
* | | Flughafen Zurich AG | | | 133,405 | | | | 24,091,216 | | | | 0.4 | % |
| | Georg Fischer AG | | | 32,352 | | | | 48,950,258 | | | | 0.8 | % |
| | Helvetia Holding AG | | | 249,056 | | | | 29,635,381 | | | | 0.5 | % |
| | Interroll Holding AG | | | 4,928 | | | | 23,908,178 | | | | 0.4 | % |
| | PSP Swiss Property AG | | | 341,202 | | | | 42,652,293 | | | | 0.7 | % |
205
THE CONTINENTAL SMALL COMPANY SERIES
CONTINUED
| | | | | | | | | | | | | | |
| | | | | Shares | | | Value» | | | Percentage
of Net Assets‡ | |
SWITZERLAND — (Continued) | | | | | | | | | | | | |
| | Siegfried Holding AG | | | 33,622 | | | $ | 32,339,058 | | | | 0.5 | % |
| W | | VAT Group AG | | | 148,293 | | | | 70,888,598 | | | | 1.1 | % |
| | Other Securities | | | | | | | 641,701,155 | | | | 9.5 | % |
| | | | | | | | | | | | | | |
TOTAL SWITZERLAND | | | | | | | 1,028,031,648 | | | | 15.7 | % |
| | | | | | | | | | | | | | |
UNITED KINGDOM — (0.1%) | | | | | | | | | | | | |
| | Other Securities | | | | | | | 4,660,893 | | | | 0.1 | % |
| | | | | | | | | | | | | | |
UNITED STATES — (0.0%) | | | | | | | | | | | | |
| | Other Security | | | | | | | 1,294,368 | | | | 0.0 | % |
| | | | | | | | | | | | | | |
TOTAL COMMON STOCKS | | | | | | | 6,449,989,909 | | | | 98.6 | % |
| | | | | | | | | | | | | | |
PREFERRED STOCKS — (0.9%) | | | | | | | | | | | | |
GERMANY — (0.9%) | | | | | | | | | | | | |
| | Other Securities | | | | | | | 61,732,488 | | | | 1.0 | % |
| | | | | | | | | | | | | | |
RIGHTS/WARRANTS — (0.0%) | | | | | | | | | | | | |
AUSTRIA — (0.0%) | | | | | | | | | | | | |
| | Other Securities | | | | | | | 12,299 | | | | 0.0 | % |
| | | | | | | | | | | | | | |
PORTUGAL — (0.0%) | | | | | | | | | | | | |
| | Other Security | | | | | | | 13,912 | | | | 0.0 | % |
| | | | | | | | | | | | | | |
SPAIN — (0.0%) | | | | | | | | | | | | |
| | Other Security | | | | | | | 715,382 | | | | 0.0 | % |
| | | | | | | | | | | | | | |
TOTAL RIGHTS/WARRANTS | | | | | | | 741,593 | | | | 0.0 | % |
| | | | | | | | | | | | | | |
TOTAL INVESTMENT SECURITIES
(Cost $4,543,679,052) | | | | | | | 6,512,463,990 | | | | | |
| | | | | | | | | | | | | | |
| | | | |
| | | | | | | | Value† | | | | |
SECURITIES LENDING COLLATERAL — (4.4%) | | | | | | | | | | | | |
@§ | | The DFA Short Term Investment Fund | | | 25,693,219 | | | | 297,270,547 | | | | 4.5 | % |
| | | | | | | | | | | | | | |
TOTAL INVESTMENTS—(100.0%)
(Cost $4,840,922,007) | | | | | | $ | 6,809,734,537 | | | | 104.1 | % |
| | | | | | | | | | | | | | |
Summary of the Series’ investments as of October 31, 2021, based on their valuation inputs, is as follows (see Security Valuation Note):
| | | | | | | | | | | | | | | | |
| | | Investments in Securities (Market Value) | |
| | | Level 1 | | | Level 2 | | | Level 3 | | | Total | |
Common Stocks | | | | | | | | | | | | | | | | |
Austria | | | — | | | $ | 213,970,956 | | | | — | | | $ | 213,970,956 | |
Belgium | | $ | 7,688,844 | | | | 254,356,424 | | | | — | | | | 262,045,268 | |
Canada | | | — | | | | 709,749 | | | | — | | | | 709,749 | |
Denmark | | | — | | | | 359,699,369 | | | | — | | | | 359,699,369 | |
Finland | | | — | | | | 394,584,226 | | | | — | | | | 394,584,226 | |
France | | | — | | | | 710,226,064 | | | $ | 40,860 | | | | 710,266,924 | |
Germany | | | 14,482,505 | | | | 1,011,049,873 | | | | — | | | | 1,025,532,378 | |
206
THE CONTINENTAL SMALL COMPANY SERIES
CONTINUED
| | | | | | | | | | | | | | | | |
| | | Investments in Securities (Market Value) | |
| | | Level 1 | | | Level 2 | | | Level 3 | | | Total | |
Ireland | | | — | | | $ | 66,283,628 | | | | — | | | $ | 66,283,628 | |
Israel | | $ | 1,561,556 | | | | 224,433,559 | | | | — | | | | 225,995,115 | |
Italy | | | — | | | | 562,534,507 | | | | — | | | | 562,534,507 | |
Netherlands | | | — | | | | 455,552,298 | | | | — | | | | 455,552,298 | |
Norway | | | — | | | | 138,643,309 | | | | — | | | | 138,643,309 | |
Portugal | | | — | | | | 50,448,984 | | | | — | | | | 50,448,984 | |
Spain | | | — | | | | 351,528,086 | | | | — | | | | 351,528,086 | |
Sweden | | | — | | | | 598,208,203 | | | | — | | | | 598,208,203 | |
Switzerland | | | 6,841,780 | | | | 1,021,189,868 | | | | — | | | | 1,028,031,648 | |
United Kingdom | | | — | | | | 4,660,893 | | | | — | | | | 4,660,893 | |
United States | | | — | | | | 1,294,368 | | | | — | | | | 1,294,368 | |
Preferred Stocks | | | | | | | | | | | | | | | | |
Germany | | | — | | | | 61,732,488 | | | | — | | | | 61,732,488 | |
Rights/Warrants | | | | | | | | | | | | | | | | |
Austria | | | — | | | | 12,299 | | | | — | | | | 12,299 | |
Portugal | | | — | | | | 13,912 | | | | — | | | | 13,912 | |
Spain | | | — | | | | 715,382 | | | | — | | | | 715,382 | |
Securities Lending Collateral | | | — | | | | 297,270,547 | | | | — | | | | 297,270,547 | |
| | | | | | | | | | | | | | | | |
TOTAL | | $ | 30,574,685 | | | $ | 6,779,118,992 | | | $ | 40,860 | ^ | | $ | 6,809,734,537 | |
| | | | | | | | | | | | | | | | |
| | | | | | | | | | | | | | | | |
| ^ | A reconciliation of Level 3 investments is presented when the Fund had a significant amount of Level 3 investments at the beginning and/or end of the reporting period in relation to net assets. |
See accompanying Notes to Financial Statements.
207
THE CANADIAN SMALL COMPANY SERIES
SUMMARY SCHEDULE OF PORTFOLIO HOLDINGS
October 31, 2021
| | | | | | | | | | | | | | |
| | | | | Shares | | | Value» | | | Percentage
of Net Assets‡ | |
COMMON STOCKS — (84.0%) | | | | | | | | | | | | |
COMMUNICATION SERVICES — (1.2%) | | | | | | | | | | | | |
| | Other Securities | | | | | | $ | 20,392,287 | | | | 1.4 | % |
| | | | | | | | | | | | | | |
CONSUMER DISCRETIONARY — (5.3%) | | | | | | | | | | | | |
* | | Aritzia, Inc. | | | 463,368 | | | | 18,248,672 | | | | 1.3 | % |
| | Linamar Corp. | | | 249,534 | | | | 13,724,773 | | | | 1.0 | % |
| | Other Securities | | | | | | | 59,378,275 | | | | 4.0 | % |
| | | | | | | | | | | | | | |
TOTAL CONSUMER DISCRETIONARY | | | | | | | 91,351,720 | | | | 6.3 | % |
| | | | | | | | | | | | | | |
CONSUMER STAPLES — (4.4%) | | | | | | | | | | | | |
# | | Maple Leaf Foods, Inc. | | | 417,087 | | | | 9,092,604 | | | | 0.6 | % |
# | | Premium Brands Holdings Corp., Class A | | | 197,300 | | | | 21,322,620 | | | | 1.5 | % |
| | Primo Water Corp. | | | 813,424 | | | | 12,948,006 | | | | 0.9 | % |
| | Other Securities | | | | | | | 32,050,901 | | | | 2.2 | % |
| | | | | | | | | | | | | | |
TOTAL CONSUMER STAPLES | | | | | | | 75,414,131 | | | | 5.2 | % |
| | | | | | | | | | | | | | |
ENERGY — (17.1%) | | | | | | | | | | | | |
| | ARC Resources Ltd. | | | 2,991,363 | | | | 28,690,593 | | | | 2.0 | % |
| | Crescent Point Energy Corp. | | | 2,888,800 | | | | 14,518,694 | | | | 1.0 | % |
# | | Crescent Point Energy Corp. | | | 192,400 | | | | 967,772 | | | | 0.1 | % |
# | | Enerplus Corp. | | | 1,287,055 | | | | 12,188,336 | | | | 0.8 | % |
# | | Gibson Energy, Inc. | | | 940,791 | | | | 18,958,733 | | | | 1.3 | % |
# | | Keyera Corp. | | | 445,938 | | | | 11,429,503 | | | | 0.8 | % |
* | | MEG Energy Corp. | | | 2,470,617 | | | | 22,138,932 | | | | 1.5 | % |
# | | Parex Resources, Inc. | | | 786,291 | | | | 15,267,108 | | | | 1.1 | % |
# | | Parkland Corp. | | | 763,190 | | | | 22,206,264 | | | | 1.5 | % |
# | | PrairieSky Royalty Ltd. | | | 1,064,207 | | | | 13,096,212 | | | | 0.9 | % |
# | | Whitecap Resources, Inc. | | | 3,150,760 | | | | 18,915,763 | | | | 1.3 | % |
| | Other Securities | | | | | | | 115,895,851 | | | | 8.0 | % |
| | | | | | | | | | | | | | |
TOTAL ENERGY | | | | | | | 294,273,761 | | | | 20.3 | % |
| | | | | | | | | | | | | | |
FINANCIALS — (9.6%) | | | | | | | | | | | | |
# | | Canadian Western Bank | | | 475,702 | | | | 15,217,390 | | | | 1.0 | % |
| | CI Financial Corp. | | | 967,840 | | | | 22,068,879 | | | | 1.5 | % |
# | | ECN Capital Corp. | | | 2,488,693 | | | | 21,637,311 | | | | 1.5 | % |
# | | Element Fleet Management Corp. | | | 1,811,383 | | | | 19,685,764 | | | | 1.4 | % |
#* | | Home Capital Group, Inc., Class B | | | 303,217 | | | | 9,839,362 | | | | 0.7 | % |
# | | Laurentian Bank of Canada | | | 412,090 | | | | 13,875,073 | | | | 1.0 | % |
| | Other Securities | | | | | | | 63,879,527 | | | | 4.3 | % |
| | | | | | | | | | | | | | |
TOTAL FINANCIALS | | | | | | | 166,203,306 | | | | 11.4 | % |
| | | | | | | | | | | | | | |
HEALTH CARE — (1.2%) | | | | | | | | | | | | |
| | Other Securities | | | | | | | 21,366,735 | | | | 1.5 | % |
| | | | | | | | | | | | | | |
INDUSTRIALS — (10.3%) | | | | | | | | | | | | |
#* | | ATS Automation Tooling Systems, Inc. | | | 441,354 | | | | 15,017,305 | | | | 1.0 | % |
#* | | Bombardier, Inc., Class B | | | 6,140,801 | | | | 9,874,106 | | | | 0.7 | % |
| | Finning International, Inc. | | | 890,113 | | | | 26,352,408 | | | | 1.8 | % |
| | LifeWorks, Inc. | | | 401,948 | | | | 10,389,719 | | | | 0.7 | % |
| | Richelieu Hardware Ltd. | | | 361,973 | | | | 12,778,442 | | | | 0.9 | % |
# | | SNC-Lavalin Group, Inc. | | | 655,742 | | | | 17,638,697 | | | | 1.2 | % |
208
THE CANADIAN SMALL COMPANY SERIES
CONTINUED
| | | | | | | | | | | | | | |
| | | | | Shares | | | Value» | | | Percentage
of Net Assets‡ | |
INDUSTRIALS — (Continued) | | | | | | | | | | | | |
| | Stantec, Inc. | | | 287,574 | | | $ | 15,893,715 | | | | 1.1 | % |
| | Other Securities | | | | | | | 69,576,440 | | | | 4.8 | % |
| | | | | | | | | | | | | | |
TOTAL INDUSTRIALS | | | | | | | 177,520,832 | | | | 12.2 | % |
| | | | | | | | | | | | | | |
INFORMATION TECHNOLOGY — (2.7%) | | | | | | | | | | | | |
| | Enghouse Systems Ltd. | | | 263,395 | | | | 11,422,438 | | | | 0.8 | % |
#* | | Kinaxis, Inc. | | | 99,954 | | | | 15,513,223 | | | | 1.1 | % |
| | Other Securities | | | | | | | 19,131,094 | | | | 1.3 | % |
| | | | | | | | | | | | | | |
TOTAL INFORMATION TECHNOLOGY | | | | | | | 46,066,755 | | | | 3.2 | % |
| | | | | | | | | | | | | | |
MATERIALS — (20.7%) | | | | | | | | | | | | |
| | Alamos Gold, Inc., Class A | | | 2,157,397 | | | | 16,002,666 | | | | 1.1 | % |
| | Alamos Gold, Inc., Class A | | | 2,642 | | | | 19,656 | | | | 0.0 | % |
# | | B2Gold Corp. | | | 2,045,993 | | | | 8,447,822 | | | | 0.6 | % |
| | B2Gold Corp. | | | 1,728,490 | | | | 7,155,949 | | | | 0.5 | % |
#* | | Capstone Mining Corp. | | | 2,456,528 | | | | 10,301,697 | | | | 0.7 | % |
# | | Centerra Gold, Inc. | | | 1,270,606 | | | | 9,527,493 | | | | 0.7 | % |
# | | Endeavour Mining PLC | | | 421,513 | | | | 10,708,128 | | | | 0.7 | % |
# | | Methanex Corp. | | | 208,917 | | | | 9,358,725 | | | | 0.6 | % |
| | Methanex Corp. | | | 127,282 | | | | 5,699,688 | | | | 0.4 | % |
| | SSR Mining, Inc. | | | 988,019 | | | | 15,583,490 | | | | 1.1 | % |
# | | SSR Mining, Inc. | | | 184,815 | | | | 2,916,381 | | | | 0.2 | % |
| | Stella-Jones, Inc. | | | 301,231 | | | | 10,814,232 | | | | 0.7 | % |
# | | Yamana Gold, Inc. | | | 4,784,888 | | | | 18,790,042 | | | | 1.3 | % |
| | Yamana Gold, Inc. | | | 588,814 | | | | 2,325,815 | | | | 0.2 | % |
| | Other Securities | | | | | | | 229,187,240 | | | | 15.8 | % |
| | | | | | | | | | | | | | |
TOTAL MATERIALS | | | | | | | 356,839,024 | | | | 24.6 | % |
| | | | | | | | | | | | | | |
REAL ESTATE — (3.5%) | | | | | | | | | | | | |
# | | Altus Group Ltd. | | | 261,893 | | | | 13,735,839 | | | | 1.0 | % |
| | Colliers International Group, Inc. | | | 134,012 | | | | 19,441,269 | | | | 1.3 | % |
| | Colliers International Group, Inc. | | | 4,163 | | | | 605,175 | | | | 0.0 | % |
# | | Tricon Residential, Inc. | | | 706,476 | | | | 10,280,893 | | | | 0.7 | % |
| | Other Securities | | | | | | | 16,340,781 | | | | 1.2 | % |
| | | | | | | | | | | | | | |
TOTAL REAL ESTATE | | | | | | | 60,403,957 | | | | 4.2 | % |
| | | | | | | | | | | | | | |
UTILITIES — (8.0%) | | | | | | | | | | | | |
# | | AltaGas Ltd. | | | 508,361 | | | | 10,523,763 | | | | 0.7 | % |
| | Atco Ltd., Class I | | | 392,922 | | | | 13,334,457 | | | | 0.9 | % |
# | | Boralex, Inc., Class A | | | 549,954 | | | | 17,019,423 | | | | 1.2 | % |
# | | Brookfield Infrastructure Corp., Class A | | | 337,306 | | | | 20,446,587 | | | | 1.4 | % |
# | | Capital Power Corp. | | | 771,649 | | | | 25,345,452 | | | | 1.8 | % |
# | | Innergex Renewable Energy, Inc. | | | 652,084 | | | | 10,854,015 | | | | 0.8 | % |
# | | Superior Plus Corp. | | | 829,579 | | | | 9,230,206 | | | | 0.6 | % |
| | TransAlta Corp. | | | 1,784,708 | | | | 20,015,956 | | | | 1.4 | % |
# | | TransAlta Renewables, Inc. | | | 614,934 | | | | 9,102,772 | | | | 0.6 | % |
| | Other Securities | | | | | | | 2,067,716 | | | | 0.1 | % |
| | | | | | | | | | | | | | |
TOTAL UTILITIES | | | | | | | 137,940,347 | | | | 9.5 | % |
| | | | | | | | | | | | | | |
TOTAL COMMON STOCKS | | | | | | | 1,447,772,855 | | | | 99.8 | % |
| | | | | | | | | | | | | | |
209
THE CANADIAN SMALL COMPANY SERIES
CONTINUED
| | | | | | | | | | | | | | |
| | | | | Shares | | | Value» | | | Percentage
of Net Assets‡ | |
RIGHTS/WARRANTS — (0.0%) | | | | | | | | | | | | |
ENERGY — (0.0%) | | | | | | | | | | | | |
| | Other Security | | | | | | $ | 308,498 | | | | 0.0 | % |
| | | | | | | | | | | | | | |
TOTAL RIGHTS/WARRANTS | | | | | | | 308,498 | | | | 0.0 | % |
| | | | | | | | | | | | | | |
TOTAL INVESTMENT SECURITIES
(Cost $1,069,056,866) | | | | | | | 1,448,081,353 | | | | | |
| | | | | | | | | | | | | | |
| | | | |
| | | | | | | | Value† | | | | |
SECURITIES LENDING COLLATERAL — (16.0%) | | | | | | | | | | | | |
@§ | | The DFA Short Term Investment Fund | | | 23,890,671 | | | | 276,415,069 | | | | 19.0 | % |
| | | | | | | | | | | | | | |
TOTAL INVESTMENTS—(100.0%)
(Cost $1,345,455,217) | | | | | | $ | 1,724,496,422 | | | | 118.8 | % |
| | | | | | | | | | | | | | |
Summary of the Series’ investments as of October 31, 2021, based on their valuation inputs, is as follows (see Security Valuation Note):
| | | | | | | | | | | | | | | | |
| | | Investments in Securities (Market Value) | |
| | | Level 1 | | | Level 2 | | | Level 3 | | | Total | |
Common Stocks | | | | | | | | | | | | | | | | |
Communication Services | | $ | 20,392,287 | | | | — | | | | — | | | $ | 20,392,287 | |
Consumer Discretionary | | | 91,314,123 | | | $ | 37,597 | | | | — | | | | 91,351,720 | |
Consumer Staples | | | 75,414,131 | | | | — | | | | — | | | | 75,414,131 | |
Energy | | | 294,213,404 | | | | 60,357 | | | | — | | | | 294,273,761 | |
Financials | | | 166,203,306 | | | | — | | | | — | | | | 166,203,306 | |
Health Care | | | 19,490,590 | | | | 1,876,145 | | | | — | | | | 21,366,735 | |
Industrials | | | 177,520,832 | | | | — | | | | — | | | | 177,520,832 | |
Information Technology | | | 46,066,755 | | | | — | | | | — | | | | 46,066,755 | |
Materials | | | 356,051,981 | | | | 787,043 | | | | — | | | | 356,839,024 | |
Real Estate | | | 60,403,957 | | | | — | | | | — | | | | 60,403,957 | |
Utilities | | | 137,940,347 | | | | — | | | | — | | | | 137,940,347 | |
Rights/Warrants | | | | | | | | | | | | | | | | |
Energy | | | — | | | | 308,498 | | | | — | | | | 308,498 | |
Securities Lending Collateral | | | — | | | | 276,415,069 | | | | — | | | | 276,415,069 | |
| | | | | | | | | | | | | | | | |
TOTAL | | $ | 1,445,011,713 | | | $ | 279,484,709 | | | | — | | | $ | 1,724,496,422 | |
| | | | | | | | | | | | | | | | |
See accompanying Notes to Financial Statements.
210
THE EMERGING MARKETS SERIES
SUMMARY SCHEDULE OF PORTFOLIO HOLDINGS
October 31, 2021
| | | | | | | | | | | | | | |
| | | | | Shares | | | Value» | | | Percentage
of Net Assets‡ | |
COMMON STOCKS — (97.6%) | | | | | | | | | | | | |
BRAZIL — (3.0%) | | | | | | | | | | | | |
| | Vale SA | | | 2,960,013 | | | $ | 37,557,408 | | | | 0.6 | % |
| | Other Securities | | | | | | | 153,559,145 | | | | 2.4 | % |
| | | | | | | | | | | | | | |
TOTAL BRAZIL | | | | | | | 191,116,553 | | | | 3.0 | % |
| | | | | | | | | | | | | | |
CHILE — (0.4%) | | | | | | | | | | | | |
| | Other Securities | | | | | | | 26,696,504 | | | | 0.4 | % |
| | | | | | | | | | | | | | |
CHINA — (31.5%) | | | | | | | | | | | | |
* | | Alibaba Group Holding Ltd. | | | 714,100 | | | | 14,683,794 | | | | 0.3 | % |
* | | Alibaba Group Holding Ltd., Sponsored ADR | | | 929,746 | | | | 153,352,305 | | | | 2.4 | % |
* | | Baidu, Inc., Class A | | | 766,950 | | | | 15,671,958 | | | | 0.3 | % |
* | | Baidu, Inc., Sponsored ADR | | | 137,226 | | | | 22,263,546 | | | | 0.4 | % |
| | BYD Co. Ltd., Class H | | | 514,386 | | | | 19,674,020 | | | | 0.3 | % |
| | China Construction Bank Corp., Class H | | | 79,728,590 | | | | 54,261,738 | | | | 0.9 | % |
| | China Gas Holdings Ltd. | | | 6,299,200 | | | | 15,722,928 | | | | 0.3 | % |
| | China Merchants Bank Co. Ltd., Class H | | | 3,434,554 | | | | 28,782,038 | | | | 0.5 | % |
| | China Overseas Land & Investment Ltd. | | | 7,665,500 | | | | 16,906,687 | | | | 0.3 | % |
# | | China Resources Land Ltd. | | | 5,690,666 | | | | 22,110,902 | | | | 0.4 | % |
| | CSPC Pharmaceutical Group Ltd. | | | 17,069,200 | | | | 17,811,704 | | | | 0.3 | % |
| | Geely Automobile Holdings Ltd. | | | 8,400,000 | | | | 29,153,372 | | | | 0.5 | % |
| | Industrial & Commercial Bank of China Ltd., Class H | | | 53,639,185 | | | | 29,402,967 | | | | 0.5 | % |
* | | JD.com, Inc., ADR | | | 248,488 | | | | 19,451,641 | | | | 0.3 | % |
| | Kweichow Moutai Co. Ltd., Class A | | | 65,693 | | | | 18,746,074 | | | | 0.3 | % |
| | Lenovo Group Ltd. | | | 18,933,278 | | | | 20,560,934 | | | | 0.3 | % |
| | Li Ning Co. Ltd. | | | 1,623,500 | | | | 17,915,414 | | | | 0.3 | % |
| *W | | Meituan, Class B | | | 1,192,700 | | | | 40,585,923 | | | | 0.7 | % |
| | NetEase, Inc., ADR | | | 271,103 | | | | 26,456,942 | | | | 0.4 | % |
| | Ping An Insurance Group Co. of China Ltd., Class H | | | 5,400,000 | | | | 38,678,739 | | | | 0.6 | % |
| | Tencent Holdings Ltd. | | | 3,951,600 | | | | 240,375,009 | | | | 3.8 | % |
| *W | | Wuxi Biologics Cayman, Inc. | | | 1,151,000 | | | | 17,434,142 | | | | 0.3 | % |
*W | | Xiaomi Corp., Class B | | | 7,645,200 | | | | 20,898,571 | | | | 0.4 | % |
| | Yum China Holdings, Inc. | | | 543,135 | | | | 31,002,146 | | | | 0.5 | % |
| | Other Securities | | | | | | | 1,080,031,787 | | | | 16.6 | % |
| | | | | | | | | | | | | | |
TOTAL CHINA | | | | | | | 2,011,935,281 | | | | 31.9 | % |
| | | | | | | | | | | | | | |
COLOMBIA — (0.2%) | | | | | | | | | | | | |
| | Other Securities | | | | | | | 12,316,697 | | | | 0.2 | % |
| | | | | | | | | | | | | | |
CZECH REPUBLIC — (0.1%) | | | | | | | | | | | | |
| | Other Securities | | | | | | | 9,027,755 | | | | 0.1 | % |
| | | | | | | | | | | | | | |
EGYPT — (0.1%) | | | | | | | | | | | | |
| | Other Securities | | | | | | | 3,891,591 | | | | 0.1 | % |
| | | | | | | | | | | | | | |
GREECE — (0.3%) | | | | | | | | | | | | |
| | Other Securities | | | | | | | 16,700,764 | | | | 0.3 | % |
| | | | | | | | | | | | | | |
HONG KONG — (0.1%) | | | | | | | | | | | | |
| | Other Securities | | | | | | | 5,532,184 | | | | 0.1 | % |
| | | | | | | | | | | | | | |
HUNGARY — (0.3%) | | | | | | | | | | | | |
| | Other Securities | | | | | | | 21,255,120 | | | | 0.3 | % |
| | | | | | | | | | | | | | |
211
THE EMERGING MARKETS SERIES
CONTINUED
| | | | | | | | | | | | | | |
| | | | | Shares | | | Value» | | | Percentage
of Net Assets‡ | |
INDIA — (13.3%) | | | | | | | | | | | | |
| | HDFC Bank Ltd. | | | 2,163,503 | | | $ | 45,977,515 | | | | 0.7 | % |
| | Hindustan Unilever Ltd. | | | 531,688 | | | | 16,988,292 | | | | 0.3 | % |
| | Housing Development Finance Corp. Ltd. | | | 698,168 | | | | 26,588,873 | | | | 0.4 | % |
| | Infosys Ltd. | | | 1,828,393 | | | | 40,997,003 | | | | 0.7 | % |
| | Infosys Ltd., Sponsored ADR | | | 859,642 | | | | 19,152,824 | | | | 0.3 | % |
| | Reliance Industries Ltd. | | | 1,571,323 | | | | 53,401,933 | | | | 0.9 | % |
| | Tata Consultancy Services Ltd. | | | 680,063 | | | | 30,968,780 | | | | 0.5 | % |
| | Tata Steel Ltd. | | | 955,424 | | | | 16,866,667 | | | | 0.3 | % |
| | Other Securities | | | | | | | 598,311,580 | | | | 9.4 | % |
| | | | | | | | | | | | | | |
TOTAL INDIA | | | | | | | 849,253,467 | | | | 13.5 | % |
| | | | | | | | | | | | | | |
INDONESIA — (1.7%) | | | | | | | | | | | | |
| | Bank Central Asia Tbk PT | | | 32,282,500 | | | | 17,070,253 | | | | 0.3 | % |
| | Other Securities | | | | | | | 94,597,970 | | | | 1.5 | % |
| | | | | | | | | | | | | | |
TOTAL INDONESIA | | | | | | | 111,668,223 | | | | 1.8 | % |
| | | | | | | | | | | | | | |
MALAYSIA — (1.5%) | | | | | | | | | | | | |
| | Other Securities | | | | | | | 98,689,277 | | | | 1.6 | % |
| | | | | | | | | | | | | | |
MEXICO — (2.1%) | | | | | | | | | | | | |
# | | America Movil SAB de CV | | | 23,862,904 | | | | 21,245,727 | | | | 0.4 | % |
| | Other Securities | | | | | | | 109,965,104 | | | | 1.7 | % |
| | | | | | | | | | | | | | |
TOTAL MEXICO | | | | | | | 131,210,831 | | | | 2.1 | % |
| | | | | | | | | | | | | | |
NETHERLANDS — (0.1%) | | | | | | | | | | | | |
| | Other Security | | | | | | | 3,847,242 | | | | 0.1 | % |
| | | | | | | | | | | | | | |
PERU — (0.1%) | | | | | | | | | | | | |
| | Other Securities | | | | | | | 6,418,615 | | | | 0.1 | % |
| | | | | | | | | | | | | | |
PHILIPPINES — (0.7%) | | | | | | | | | | | | |
| | Other Securities | | | | | | | 47,693,384 | | | | 0.8 | % |
| | | | | | | | | | | | | | |
POLAND — (0.9%) | | | | | | | | | | | | |
| | Other Securities | | | | | | | 54,588,905 | | | | 0.9 | % |
| | | | | | | | | | | | | | |
QATAR — (0.6%) | | | | | | | | | | | | |
| | Other Securities | | | | | | | 37,606,118 | | | | 0.6 | % |
| | | | | | | | | | | | | | |
RUSSIA — (1.3%) | | | | | | | | | | | | |
| | Sberbank of Russia PJSC, Sponsored ADR | | | 998,144 | | | | 20,017,792 | | | | 0.3 | % |
| | Other Securities | | | | | | | 65,279,760 | | | | 1.0 | % |
| | | | | | | | | | | | | | |
TOTAL RUSSIA | | | | | | | 85,297,552 | | | | 1.3 | % |
| | | | | | | | | | | | | | |
SAUDI ARABIA — (3.3%) | | | | | | | | | | | | |
| | Al Rajhi Bank | | | 758,186 | | | | 28,047,881 | | | | 0.5 | % |
| | Saudi Basic Industries Corp. | | | 442,004 | | | | 15,234,307 | | | | 0.2 | % |
| | Saudi National Bank | | | 1,236,879 | | | | 21,713,030 | | | | 0.4 | % |
| | Other Securities | | | | | | | 144,192,509 | | | | 2.2 | % |
| | | | | | | | | | | | | | |
TOTAL SAUDI ARABIA | | | | | | | 209,187,727 | | | | 3.3 | % |
| | | | | | | | | | | | | | |
212
THE EMERGING MARKETS SERIES
CONTINUED
| | | | | | | | | | | | | | |
| | | | | Shares | | | Value » | | | Percentage
of Net Assets‡ | |
SOUTH AFRICA — (3.6%) | | | | | | | | | | | | |
* | | MTN Group Ltd. | | | 2,885,932 | | | $ | 25,878,521 | | | | 0.4 | % |
| | Other Securities | | | | | | | 201,110,643 | | | | 3.2 | % |
| | | | | | | | | | | | |
TOTAL SOUTH AFRICA | | | | | | | 226,989,164 | | | | 3.6 | % |
| | | | | | | | | | | | |
SOUTH KOREA — (13.1%) | | | | | | | | | | | | |
| | KB Financial Group, Inc. | | | 376,407 | | | | 18,219,547 | | | | 0.3 | % |
| | LG Chem Ltd. | | | 28,624 | | | | 20,539,289 | | | | 0.3 | % |
| | LG Electronics, Inc. | | | 199,804 | | | | 20,670,498 | | | | 0.3 | % |
| | POSCO | | | 75,709 | | | | 19,202,198 | | | | 0.3 | % |
| | Samsung Electronics Co. Ltd. | | | 3,831,702 | | | | 229,415,933 | | | | 3.6 | % |
| | Samsung Electronics Co. Ltd., GDR | | | 105 | | | | 157,220 | | | | 0.0 | % |
| | SK Hynix, Inc. | | | 475,556 | | | | 41,920,530 | | | | 0.7 | % |
| | Other Securities | | | | | | | 489,256,441 | | | | 7.8 | % |
| | | | | | | | | | | | |
TOTAL SOUTH KOREA | | | | | | | 839,381,656 | | | | 13.3 | % |
| | | | | | | | | | | | |
TAIWAN — (16.5%) | | | | | | | | | | | | |
| | Evergreen Marine Corp. Taiwan Ltd. | | | 4,324,222 | | | | 15,561,495 | | | | 0.3 | % |
| | Hon Hai Precision Industry Co. Ltd. | | | 5,794,322 | | | | 22,368,040 | | | | 0.4 | % |
| | MediaTek, Inc. | | | 776,995 | | | | 25,572,990 | | | | 0.4 | % |
| | Taiwan Semiconductor Manufacturing Co. Ltd. | | | 15,380,808 | | | | 326,385,203 | | | | 5.2 | % |
| | United Microelectronics Corp. | | | 8,584,000 | | | | 17,820,160 | | | | 0.3 | % |
| | Other Securities | | | | | | | 649,615,769 | | | | 10.2 | % |
| | | | | | | | | | | | |
TOTAL TAIWAN | | | | | | | 1,057,323,657 | | | | 16.8 | % |
| | | | | | | | | | | | |
THAILAND — (1.8%) | | | | | | | | | | | | |
| | Other Securities | | | | | | | 115,888,768 | | | | 1.8 | % |
| | | | | | | | | | | | |
TURKEY — (0.4%) | | | | | | | | | | | | |
| | Other Securities | | | | | | | 28,003,484 | | | | 0.4 | % |
| | | | | | | | | | | | |
UNITED ARAB EMIRATES — (0.6%) | | | | | | | | | | | | |
| | Other Securities | | | | | | | 40,760,055 | | | | 0.6 | % |
| | | | | | | | | | | | |
UNITED STATES — (0.0%) | | | | | | | | | | | | |
| | Other Security | | | | | | | 1,379,532 | | | | 0.0 | % |
| | | | | | | | | | | | |
TOTAL COMMON STOCKS | | | | | | | 6,243,660,106 | | | | 99.0 | % |
| | | | | | | | | | | | |
PREFERRED STOCKS — (0.7%) | | | | | | | | | | | | |
BRAZIL — (0.7%) | | | | | | | | | | | | |
| | Other Securities | | | | | | | 42,291,948 | | | | 0.7 | % |
| | | | | | | | | | | | |
CHILE — (0.0%) | | | | | | | | | | | | |
| | Other Security | | | | | | | 975,429 | | | | 0.0 | % |
| | | | | | | | | | | | |
COLOMBIA — (0.0%) | | | | | | | | | | | | |
| | Other Securities | | | | | | | 2,163,748 | | | | 0.0 | % |
| | | | | | | | | | | | |
SOUTH KOREA — (0.0%) | | | | | | | | | | | | |
| | Other Securities | | | | | | | 220,593 | | | | 0.0 | % |
| | | | | | | | | | | | |
TOTAL PREFERRED STOCKS | | | | | | | 45,651,718 | | | | 0.7 | % |
| | | | | | | | | | | | |
213
THE EMERGING MARKETS SERIES
CONTINUED
| | | | | | | | | | | | | | |
| | | | | Shares | | | Value » | | | Percentage
of Net Assets‡ | |
RIGHTS/WARRANTS — (0.0%) | | | | | | | | | | | | |
THAILAND — (0.0%) | | | | | | | | | | | | |
| | Other Securities | | | | | | $ | 372,849 | | | | 0.0 | % |
| | | | | | | | | | | | | | |
TOTAL INVESTMENT SECURITIES
(Cost $3,711,438,631) | | | | | | | 6,289,684,673 | | | | | |
| | | | | | | | | | | | | | |
| | | | |
| | | | | | | | Value† | | | | |
SECURITIES LENDING COLLATERAL — (1.7%)
@§ The DFA Short Term Investment Fund | | | 9,324,531 | | | | 107,884,825 | | | | 1.7 | % |
| | | | | | | | | | | | | | |
TOTAL INVESTMENTS— (100.0%)
(Cost $3,819,309,985) | | | | | | $ | 6,397,569,498 | | | | 101.4 | % |
| | | | | | | | | | | | | | |
As of October 31, 2021, The Emerging Markets Series had entered into the following outstanding futures contracts:
| | | | | | | | | | | | | | | | | | | | |
Description | | Number of
Contracts | | | Expiration
Date | | | Notional
Value | | | Market
Value | | | Unrealized
Appreciation
(Depreciation) | |
Long Position Contracts: | | | | | | | | | | | | | | | | | | | | |
E-Mini MSCI Emerging Markets Index. | | | 650 | | | | 12/17/21 | | | $ | 42,358,988 | | | $ | 41,015,000 | | | $ | (1,343,988 | ) |
S&P 500® Emini Index. | | | 26 | | | | 12/17/21 | | | | 5,584,545 | | | | 5,976,100 | | | | 391,555 | |
| | | | | | | | | | | | | | | | | | | | |
Total Futures Contracts. | | | | | | | | | | $ | 47,943,533 | | | $ | 46,991,100 | | | $ | (952,433 | ) |
| | | | | | | | | | | | | | | | | | | | |
Summary of the Series’ investments as of October 31, 2021, based on their valuation inputs, is as follows (see Security Valuation Note):
| | | | | | | | | | | | | | | | |
| | | Investments in Securities (Market Value) | |
| | | Level 1 | | | Level 2 | | | Level 3 | | | Total | |
Common Stocks | | | | | | | | | | | | | | | | |
Brazil | | $ | 191,116,553 | | | | — | | | | — | | | $ | 191,116,553 | |
Chile | | | 13,782,759 | | | $ | 12,913,745 | | | | — | | | | 26,696,504 | |
China | | | 354,617,905 | | | | 1,652,811,475 | | | $ | 4,505,901 | | | | 2,011,935,281 | |
Colombia | | | 12,316,697 | | | | — | | | | — | | | | 12,316,697 | |
Czech Republic | | | — | | | | 9,027,755 | | | | — | | | | 9,027,755 | |
Egypt | | | 3,183 | | | | 3,888,408 | | | | — | | | | 3,891,591 | |
Greece | | | — | | | | 16,687,636 | | | | 13,128 | | | | 16,700,764 | |
Hong Kong | | | 930,840 | | | | 4,601,344 | | | | — | | | | 5,532,184 | |
Hungary | | | — | | | | 21,255,120 | | | | — | | | | 21,255,120 | |
India | | | 39,363,772 | | | | 809,889,695 | | | | — | | | | 849,253,467 | |
Indonesia | | | — | | | | 111,668,223 | | | | — | | | | 111,668,223 | |
Malaysia | | | — | | | | 98,689,277 | | | | — | | | | 98,689,277 | |
Mexico | | | 131,210,831 | | | | — | | | | — | | | | 131,210,831 | |
Netherlands | | | — | | | | 3,847,242 | | | | — | | | | 3,847,242 | |
Peru | | | 6,418,615 | | | | — | | | | — | | | | 6,418,615 | |
Philippines | | | 1,560,460 | | | | 46,132,924 | | | | — | | | | 47,693,384 | |
Poland | | | — | | | | 54,588,905 | | | | — | | | | 54,588,905 | |
Qatar | | | — | | | | 37,606,118 | | | | — | | | | 37,606,118 | |
Russia | | | 15,912,841 | | | | 69,384,711 | | | | — | | | | 85,297,552 | |
Saudi Arabia | | | — | | | | 209,187,727 | | | | — | | | | 209,187,727 | |
South Africa | | | 40,943,383 | | | | 186,045,781 | | | | — | | | | 226,989,164 | |
South Korea | | | 8,895,927 | | | | 830,485,729 | | | | — | | | | 839,381,656 | |
214
THE EMERGING MARKETS SERIES
CONTINUED
| | | | | | | | | | | | | | | | |
| | | Investments in Securities (Market Value) | |
| | | Level 1 | | | Level 2 | | | Level 3 | | | Total | |
Taiwan | | $ | 5,760,517 | | | $ | 1,051,555,679 | | | $ | 7,461 | | | $ | 1,057,323,657 | |
Thailand | | | 115,888,768 | | | | — | | | | — | | | | 115,888,768 | |
Turkey | | | — | | | | 28,003,484 | | | | — | | | | 28,003,484 | |
United Arab Emirates | | | — | | | | 40,760,055 | | | | — | | | | 40,760,055 | |
United States | | | 1,379,532 | | | | — | | | | — | | | | 1,379,532 | |
Preferred Stocks | | | | | | | | | | | | | | | | |
Brazil | | | 42,291,948 | | | | — | | | | — | | | | 42,291,948 | |
Chile | | | — | | | | 975,429 | | | | — | | | | 975,429 | |
Colombia | | | 2,163,748 | | | | — | | | | — | | | | 2,163,748 | |
South Korea | | | — | | | | 220,593 | | | | — | | | | 220,593 | |
Rights/Warrants | | | | | | | | | | | | | | | | |
Thailand | | | — | | | | 372,849 | | | | — | | | | 372,849 | |
Securities Lending Collateral | | | — | | | | 107,884,825 | | | | — | | | | 107,884,825 | |
Futures Contracts** | | | (952,433 | ) | | | — | | | | — | | | | (952,433 | ) |
| | | | | | | | | | | | | | | | |
TOTAL | | $ | 983,605,846 | | | $ | 5,408,484,729 | | | $ | 4,526,490 | ^ | | $ | 6,396,617,065 | |
| | | | | | | | | | | | | | | | |
| ** | Valued at the unrealized appreciation/(depreciation) on the investment. |
| ^ | A reconciliation of Level 3 investments is presented when the Fund had a significant amount of Level 3 investments at the beginning and/or end of the reporting period in relation to net assets. |
See accompanying Notes to Financial Statements.
215
THE EMERGING MARKETS SMALL CAP SERIES
SUMMARY SCHEDULE OF PORTFOLIO HOLDINGS
October 31, 2021
| | | | | | | | | | | | | | |
| | | | | Shares | | | Value» | | | Percentage
of Net Assets‡ | |
COMMON STOCKS — (96.7%) | | | | | | | | | | | | |
BRAZIL — (3.6%) | | | | | | | | | | | | |
* | | Petro Rio SA | | | 3,259,660 | | | $ | 13,555,445 | | | | 0.3 | % |
| | TOTVS SA | | | 1,646,258 | | | | 9,555,870 | | | | 0.2 | % |
| | Transmissora Alianca de Energia Eletrica SA | | | 1,415,423 | | | | 9,194,055 | | | | 0.2 | % |
| | Other Securities | | | | | | | 157,659,109 | | | | 3.0 | % |
| | | | | | | | | | | | | | |
TOTAL BRAZIL | | | | | | | 189,964,479 | | | | 3.7 | % |
| | | | | | | | | | | | | | |
CHILE — (0.5%) | | | | | | | | | | | | |
| | Other Securities | | | | | | | 28,698,405 | | | | 0.6 | % |
| | | | | | | | | | | | | | |
CHINA — (26.3%) | | | | | | | | | | | | |
* | | 51job, Inc., ADR | | | 134,562 | | | | 8,014,513 | | | | 0.2 | % |
| | AAC Technologies Holdings, Inc. | | | 2,265,000 | | | | 9,789,819 | | | | 0.2 | % |
# | | Bosideng International Holdings Ltd. | | | 13,134,000 | | | | 10,176,925 | | | | 0.2 | % |
| | China Conch Venture Holdings Ltd. | | | 2,567,000 | | | | 12,473,940 | | | | 0.3 | % |
| | China Everbright Environment Group Ltd. | | | 15,300,000 | | | | 10,510,411 | | | | 0.2 | % |
| | China Medical System Holdings Ltd. | | | 6,331,500 | | | | 10,720,614 | | | | 0.2 | % |
| | China Meidong Auto Holdings Ltd. | | | 2,280,000 | | | | 11,778,083 | | | | 0.2 | % |
# | | China Power International Development Ltd. | | | 17,284,333 | | | | 8,683,460 | | | | 0.2 | % |
# | | China Resources Cement Holdings Ltd. | | | 10,766,000 | | | | 9,053,174 | | | | 0.2 | % |
| | China Resources Power Holdings Co. Ltd. | | | 5,582,000 | | | | 14,447,459 | | | | 0.3 | % |
| | China Taiping Insurance Holdings Co. Ltd. | | | 6,435,200 | | | | 9,792,382 | | | | 0.2 | % |
| | Chinasoft International Ltd. | | | 9,800,000 | | | | 16,363,347 | | | | 0.3 | % |
| | Dongfeng Motor Group Co. Ltd., Class H | | | 8,526,000 | | | | 7,940,750 | | | | 0.2 | % |
# | | Dongyue Group Ltd. | | | 5,073,000 | | | | 11,802,904 | | | | 0.3 | % |
#*†† | | GCL-Poly Energy Holdings Ltd. | | | 71,015,000 | | | | 13,554,049 | | | | 0.3 | % |
| | Haitian International Holdings Ltd. | | | 2,659,000 | | | | 7,749,639 | | | | 0.2 | % |
| | Hengan International Group Co. Ltd. | | | 2,283,500 | | | | 11,933,416 | | | | 0.3 | % |
| | Hopson Development Holdings Ltd. | | | 2,891,350 | | | | 7,845,867 | | | | 0.2 | % |
| *W | | Hua Hong Semiconductor Ltd. | | | 2,037,000 | | | | 10,222,196 | | | | 0.2 | % |
#* | | JinkoSolar Holding Co. Ltd., ADR | | | 168,450 | | | | 10,076,679 | | | | 0.2 | % |
| | Kingboard Holdings Ltd. | | | 2,738,421 | | | | 11,933,504 | | | | 0.3 | % |
| | Kingsoft Corp. Ltd. | | | 3,235,800 | | | | 13,807,297 | | | | 0.3 | % |
| | Kunlun Energy Co. Ltd. | | | 13,120,000 | | | | 11,949,431 | | | | 0.3 | % |
| | Minth Group Ltd. | | | 3,117,000 | | | | 12,388,331 | | | | 0.3 | % |
| | Nine Dragons Paper Holdings Ltd. | | | 7,447,000 | | | | 9,364,604 | | | | 0.2 | % |
| # | | Shandong Weigao Group Medical Polymer Co. Ltd., | | | | | | | | | | | | |
| | Class H | | | 4,728,000 | | | | 8,053,345 | | | | 0.2 | % |
| | Sinopharm Group Co. Ltd., Class H | | | 3,858,800 | | | | 9,162,773 | | | | 0.2 | % |
| | Wharf Holdings Ltd. | | | 2,285,000 | | | | 7,944,418 | | | | 0.2 | % |
| W | | Yadea Group Holdings Ltd. | | | 4,848,000 | | | | 8,329,692 | | | | 0.2 | % |
# | | Yihai International Holding Ltd. | | | 1,546,000 | | | | 9,055,867 | | | | 0.2 | % |
* | | Zhuzhou CRRC Times Electric Co., Class H | | | 1,775,000 | | | | 8,481,861 | | | | 0.2 | % |
| | Other Securities | | | | | | | 1,062,128,452 | | | | 19.8 | % |
| �� | | | | | | | | | | | | | |
TOTAL CHINA | | | | | | | 1,385,529,202 | | | | 27.0 | % |
| | | | | | | | | | | | | | |
COLOMBIA — (0.2%) | | | | | | | | | | | | |
| | Other Securities | | | | | | | 8,479,068 | | | | 0.2 | % |
| | | | | | | | | | | | | | |
GREECE — (0.3%) | | | | | | | | | | | | |
| | Other Securities | | | | | | | 16,354,784 | | | | 0.3 | % |
| | | | | | | | | | | | | | |
216
THE EMERGING MARKETS SMALL CAP SERIES
CONTINUED
| | | | | | | | | | | | | | |
| | | | | Shares | | | Value» | | | Percentage
of Net Assets‡ | |
HONG KONG — (0.2%) | | | | | | | | | | | | |
| | Other Securities | | | | | | $ | 10,277,210 | | | | 0.2 | % |
| | | | | | | | | | | | |
HUNGARY — (0.1%) | | | | | | | | | | | | |
| | Other Securities | | | | | | | 4,328,456 | | | | 0.1 | % |
| | | | | | | | | | | | |
INDIA — (14.8%) | | | | | | | | | | | | |
| | Adani Enterprises Ltd. | | | 453,788 | | | | 8,641,485 | | | | 0.2 | % |
| | Crompton Greaves Consumer Electricals Ltd. | | | 1,658,783 | | | | 10,335,675 | | | | 0.2 | % |
| | Mphasis Ltd. | | | 249,485 | | | | 10,818,021 | | | | 0.2 | % |
| | Persistent Systems Ltd. | | | 231,687 | | | | 12,169,563 | | | | 0.2 | % |
| | Tata Power Co. Ltd. | | | 4,179,112 | | | | 12,094,135 | | | | 0.2 | % |
| | Tube Investments of India Ltd. | | | 445,137 | | | | 8,319,447 | | | | 0.2 | % |
| | Zee Entertainment Enterprises Ltd. | | | 2,031,434 | | | | 8,203,858 | | | | 0.2 | % |
| | Other Securities | | | | | | | 711,338,472 | | | | 13.9 | % |
| | | | | | | | | | | | |
TOTAL INDIA | | | | | | | 781,920,656 | | | | 15.3 | % |
| | | | | | | | | | | | |
INDONESIA — (1.7%) | | | | | | | | | | | | |
| | Other Securities | | | | | | | 90,677,432 | | | | 1.8 | % |
| | | | | | | | | | | | |
MALAYSIA — (1.6%) | | | | | | | | | | | | |
| | Other Securities | | | | | | | 86,798,444 | | | | 1.7 | % |
| | | | | | | | | | | | |
MEXICO — (2.4%) | | | | | | | | | | | | |
#* | | Grupo Simec SAB de CV, Class B | | | 959,651 | | | | 7,924,532 | | | | 0.2 | % |
* | | Industrias CH SAB de CV, Class B | | | 1,830,376 | | | | 15,869,541 | | | | 0.3 | % |
| | Other Securities | | | | | | | 101,377,483 | | | | 1.9 | % |
| | | | | | | | | | | | |
TOTAL MEXICO | | | | | | | 125,171,556 | | | | 2.4 | % |
| | | | | | | | | | | | |
PHILIPPINES — (1.0%) | | | | | | | | | | | | |
| | Other Securities | | | | | | | 54,455,930 | | | | 1.1 | % |
| | | | | | | | | | | | |
POLAND — (1.2%) | | | | | | | | | | | | |
| | Grupa Kety SA | | | 58,412 | | | | 9,172,305 | | | | 0.2 | % |
| | Other Securities | | | | | | | 51,404,701 | | | | 1.0 | % |
| | | | | | | | | | | | |
TOTAL POLAND | | | | | | | 60,577,006 | | | | 1.2 | % |
| | | | | | | | | | | | |
QATAR — (0.5%) | | | | | | | | | | | | |
| | Other Securities | | | | | | | 27,109,917 | | | | 0.5 | % |
| | | | | | | | | | | | |
RUSSIA — (0.3%) | | | | | | | | | | | | |
| | Other Securities | | | | | | | 15,459,484 | | | | 0.3 | % |
| | | | | | | | | | | | |
SAUDI ARABIA — (2.7%) | | | | | | | | | | | | |
| | Other Securities | | | | | | | 139,726,858 | | | | 2.7 | % |
| | | | | | | | | | | | |
SOUTH AFRICA — (3.7%) | | | | | | | | | | | | |
| | Barloworld Ltd. | | | 1,009,065 | | | | 8,474,223 | | | | 0.2 | % |
* | | Foschini Group Ltd. | | | 934,267 | | | | 7,922,967 | | | | 0.2 | % |
| | SPAR Group Ltd. | | | 617,202 | | | | 7,880,596 | | | | 0.2 | % |
# | | Woolworths Holdings Ltd. | | | 3,014,039 | | | | 10,609,503 | | | | 0.2 | % |
| | Other Securities | | | | | | | 162,316,269 | | | | 3.0 | % |
| | | | | | | | | | | | |
TOTAL SOUTH AFRICA | | | | | | | 197,203,558 | | | | 3.8 | % |
| | | | | | | | | | | | |
217
THE EMERGING MARKETS SMALL CAP SERIES
CONTINUED
| | | | | | | | | | | | | | |
| | | | | Shares | | | Value» | | | Percentage
of Net Assets‡ | |
SOUTH KOREA — (15.5%) | | | | | | | | | | | | |
# | | Wemade Co. Ltd. | | | 85,510 | | | $ | 13,380,561 | | | | 0.3 | % |
| | Other Securities | | | | | | | 801,898,275 | | | | 15.6 | % |
| | | | | | | | | | | | |
TOTAL SOUTH KOREA | | | | | | | 815,278,836 | | | | 15.9 | % |
| | | | | | | | | | | | |
TAIWAN — (16.4%) | | | | | | | | | | | | |
# | | TA Chen Stainless Pipe | | | 6,855,946 | | | | 10,848,523 | | | | 0.2 | % |
| | Other Securities | | | | | | | 855,859,869 | | | | 16.7 | % |
| | | | | | | | | | | | |
TOTAL TAIWAN | | | | | | | 866,708,392 | | | | 16.9 | % |
| | | | | | | | | | | | |
THAILAND — (2.5%) | | | | | | | | | | | | |
| | Other Securities | | | | | | | 129,555,886 | | | | 2.5 | % |
| | | | | | | | | | | | |
TURKEY — (0.7%) | | | | | | | | | | | | |
| | Other Securities | | | | | | | 37,538,108 | | | | 0.7 | % |
| | | | | | | | | | | | |
UNITED ARAB EMIRATES — (0.5%) | | | | | | | | | | | | |
| | Other Securities | | | | | | | 24,862,263 | | | | 0.5 | % |
| | | | | | | | | | | | |
UNITED KINGDOM — (0.0%) | | | | | | | | | | | | |
| | Other Security | | | | | | | 881,800 | | | | 0.0 | % |
| | | | | | | | | | | | |
TOTAL COMMON STOCKS. | | | | | | | 5,097,557,730 | | | | 99.4 | % |
| | | | | | | | | | | | |
PREFERRED STOCKS — (0.6%) | | | | | | | | | | | | |
BRAZIL — (0.6%) | | | | | | | | | | | | |
| | Other Securities | | | | | | | 29,697,009 | | | | 0.6 | % |
| | | | | | | | | | | | |
CHILE — (0.0%) | | | | | | | | | | | | |
| | Other Security | | | | | | | 653,901 | | | | 0.0 | % |
| | | | | | | | | | | | |
PHILIPPINES — (0.0%) | | | | | | | | | | | | |
| | Other Security | | | | | | | 569,875 | | | | 0.0 | % |
| | | | | | | | | | | | |
THAILAND — (0.0%) | | | | | | | | | | | | |
| | Other Security | | | | | | | 1,701,800 | | | | 0.0 | % |
| | | | | | | | | | | | |
TOTAL PREFERRED STOCKS | | | | | | | 32,622,585 | | | | 0.6 | % |
| | | | | | | | | | | | |
RIGHTS/WARRANTS — (0.0%) | | | | | | | | | | | | |
CHILE — (0.0%) | | | | | | | | | | | | |
| | Other Securities | | | | | | | 287 | | | | 0.0 | % |
| | | | | | | | | | | | |
INDONESIA — (0.0%) | | | | | | | | | | | | |
| | Other Security | | | | | | | 6,211 | | | | 0.0 | % |
| | | | | | | | | | | | |
SOUTH KOREA — (0.0%) | | | | | | | | | | | | |
| | Other Securities | | | | | | | 25,734 | | | | 0.0 | % |
| | | | | | | | | | | | |
TAIWAN — (0.0%) | | | | | | | | | | | | |
| | Other Securities | | | | | | | 39,291 | | | | 0.0 | % |
| | | | | | | | | | | | |
218
THE EMERGING MARKETS SMALL CAP SERIES
CONTINUED
| | | | | | | | | | | | | | |
| | | | | Shares | | | Value» | | | Percentage
of Net Assets‡ | |
THAILAND — (0.0%) | | | | | | | | | | | | |
| | Other Securities. | | | | | | $ | 192,848 | | | | 0.0 | % |
| | | | | | | | | | | | |
TOTAL RIGHTS/WARRANTS | | | | | | | 264,371 | | | | 0.0 | % |
| | | | | | | | | | | | |
TOTAL INVESTMENT SECURITIES
(Cost $3,960,382,989). | | | | | | | 5,130,444,686 | | | | | |
| | | | | | | | | | | | |
| | | | |
| | | | | | | | Value† | | | | |
SECURITIES LENDING COLLATERAL — (2.7%) | | | | | | | | | | | | |
@§ | | The DFA Short Term Investment Fund | | | 12,375,122 | | | | 143,180,163 | | | | 2.8 | % |
| | | | | | | | | | | | |
TOTAL INVESTMENTS—(100.0%)
(Cost $4,103,547,624). | | | | | | $ | 5,273,624,849 | | | | 102.8 | % |
| | | | | | | | | | | | | | |
As of October 31, 2021, The Emerging Markets Small Cap Series had entered into the following outstanding futures contracts:
| | | | | | | | | | | | | | | | | | | | |
| | | | | | | | | | | | | | | Unrealized | |
| | | Number of | | | Expiration | | | Notional | | | Market | | | Appreciation | |
Description | | Contracts | | | Date | | | Value | | | Value | | | (Depreciation) | |
Long Position Contracts: | | | | | | | | | | | | | | | | | | | | |
E-Mini MSCI Emerging Markets Index. | | | 400 | | | | 12/17/21 | | | $ | 25,186,156 | | | $ | 25,240,000 | | | $ | 53,844 | |
| | | | | | | | | | | | | | | | | | | | |
Total Futures Contracts. | | | | | | | | | | $ | 25,186,156 | | | $ | 25,240,000 | | | $ | 53,844 | |
| | | | | | | | | | | | | | | | | | | | |
Summary of the Series’ investments as of October 31, 2021, based on their valuation inputs, is as follows (see Security Valuation Note):
| | | | | | | | | | | | | | | | |
| | | Investments in Securities (Market Value) | |
| | | Level 1 | | | Level 2 | | | Level 3 | | | Total | |
Common Stocks | | | | | | | | | | | | | | | | |
Brazil | | $ | 189,964,479 | | | | — | | | | — | | | $ | 189,964,479 | |
Chile | | | 53,743 | | | $ | 28,644,662 | | | | — | | | | 28,698,405 | |
China | | | 88,808,409 | | | | 1,273,676,800 | | | $ | 23,043,993 | | | | 1,385,529,202 | |
Colombia | | | 8,479,068 | | | | — | | | | — | | | | 8,479,068 | |
Greece | | | — | | | | 16,354,784 | | | | — | | | | 16,354,784 | |
Hong Kong | | | 1,120,518 | | | | 8,861,567 | | | | 295,125 | | | | 10,277,210 | |
Hungary | | | — | | | | 4,328,456 | | | | — | | | | 4,328,456 | |
India | | | 1,286,534 | | | | 780,623,279 | | | | 10,843 | | | | 781,920,656 | |
Indonesia | | | 232,661 | | | | 89,424,388 | | | | 1,020,383 | | | | 90,677,432 | |
Malaysia | | | — | | | | 86,797,023 | | | | 1,421 | | | | 86,798,444 | |
Mexico | | | 118,747,907 | | | | 6,406,078 | | | | 17,571 | | | | 125,171,556 | |
Philippines | | | — | | | | 54,449,567 | | | | 6,363 | | | | 54,455,930 | |
Poland | | | — | | | | 60,577,006 | | | | — | | | | 60,577,006 | |
Qatar | | | — | | | | 27,109,917 | | | | — | | | | 27,109,917 | |
Russia | | | 15,459,484 | | | | — | | | | — | | | | 15,459,484 | |
Saudi Arabia | | | 764,967 | | | | 138,961,891 | | | | — | | | | 139,726,858 | |
South Africa | | | 7,373,876 | | | | 189,829,682 | | | | — | | | | 197,203,558 | |
South Korea | | | 390,687 | | | | 813,492,034 | | | | 1,396,115 | | | | 815,278,836 | |
Taiwan | | | — | | | | 866,392,584 | | | | 315,808 | | | | 866,708,392 | |
Thailand | | | 129,543,804 | | | | — | | | | 12,082 | | | | 129,555,886 | |
Turkey | | | — | | | | 37,538,108 | | | | — | | | | 37,538,108 | |
United Arab Emirates | | | — | | | | 24,786,935 | | | | 75,328 | | | | 24,862,263 | |
United Kingdom | | | — | | | | 881,800 | | | | — | | | | 881,800 | |
219
THE EMERGING MARKETS SMALL CAP SERIES
CONTINUED
| | | | | | | | | | | | | | | | |
| | | Investments in Securities (Market Value) | |
| | | Level 1 | | | Level 2 | | | Level 3 | | | Total | |
Preferred Stocks | | | | | | | | | | | | | | | | |
Brazil | | $ | 29,618,432 | | | $ | 78,577 | | | | — | | | $ | 29,697,009 | |
Chile | | | — | | | | 653,901 | | | | — | | | | 653,901 | |
Philippines | | | — | | | | 569,875 | | | | — | | | | 569,875 | |
Thailand | | | 1,701,800 | | | | — | | | | — | | | | 1,701,800 | |
Rights/Warrants | | | | | | | | | | | | | | | | |
Chile | | | — | | | | 287 | | | | — | | | | 287 | |
Indonesia | | | — | | | | 6,211 | | | | — | | | | 6,211 | |
South Korea | | | — | | | | 25,734 | | | | — | | | | 25,734 | |
Taiwan | | | — | | | | 39,291 | | | | — | | | | 39,291 | |
Thailand | | | — | | | | 192,848 | | | | — | | | | 192,848 | |
Securities Lending Collateral | | | — | | | | 143,180,163 | | | | — | | | | 143,180,163 | |
Futures Contracts** | | | 53,844 | | | | — | | | | — | | | | 53,844 | |
| | | | | | | | | | | | | | | | |
TOTAL | | $ | 593,600,213 | | | $ | 4,653,883,448 | | | $ | 26,195,032^ | | | $ | 5,273,678,693 | |
| | | | | | | | | | | | | | | | |
| ** | Valued at the unrealized appreciation/(depreciation) on the investment. |
| ^ | A reconciliation of Level 3 investments is presented when the Fund had a significant amount of Level 3 investments at the beginning and/or end of the reporting period in relation to net assets. |
See accompanying Notes to Financial Statements.
220
THE DFA INVESTMENT TRUST COMPANY
STATEMENTS OF ASSETS AND LIABILITIES
OCTOBER 31, 2021
(Amounts in thousands)
| | | | | | | | | | | | | | | | |
| | | The DFA
International
Value Series* | | | The Japanese
Small
Company
Series* | | | The Asia
Pacific Small
Company
Series* | | | The United
Kingdom Small
Company
Series* | |
ASSETS: | | | | | | | | | | | | | | | | |
Investment Securities at Value (including $499,686, $126,139, $139,195 and $13,650 of securities on loan, respectively) | | $ | 12,092,701 | | | $ | 3,387,960 | | | $ | 1,819,205 | | | $ | 1,887,889 | |
Collateral from Securities on Loan Invested in Affiliate at Value (including cost of $495,266, $61,477, $40,602 and $15,627, respectively) | | | 495,353 | | | | 61,490 | | | | 40,607 | | | | 15,631 | |
Segregated Cash for Futures Contracts | | | 4,416 | | | | — | | | | — | | | | — | |
Foreign Currencies at Value | | | 76,624 | | | | 1,399 | | | | 4,461 | | | | 5,028 | |
Cash | | | 111 | | | | 1,080 | | | | 71 | | | | 500 | |
Receivables: | | | | | | | | | | | | | | | | |
Investment Securities Sold | | | 60,993 | | | | 3,578 | | | | 5,517 | | | | 1,844 | |
Dividends, Interest and Tax Reclaims | | | 79,542 | | | | 24,682 | | | | 216 | | | | 5,823 | |
Securities Lending Income | | | 333 | | | | 124 | | | | 337 | | | | 7 | |
Futures Margin Variation | | | 183 | | | | — | | | | — | | | | — | |
Unrealized Gain on Foreign Currency Contracts | | | 48 | | | | 5 | | | | 1 | | | | — | |
Prepaid Expenses and Other Assets | | | 1 | | | | — | | | | — | | | | — | |
| | | | | | | | | | | | | | | | |
Total Assets | | | 12,810,305 | | | | 3,480,318 | | | | 1,870,415 | | | | 1,916,722 | |
| | | | | | | | | | | | | | | | |
LIABILITIES: | | | | | | | | | | | | | | | | |
Payables: | | | | | | | | | | | | | | | | |
Upon Return of Securities Loaned | | | 495,235 | | | | 61,522 | | | | 40,608 | | | | 15,631 | |
Investment Securities Purchased | | | 2,440 | | | | 1,796 | | | | 6,388 | | | | 3,386 | |
Due to Advisor | | | 2,085 | | | | 291 | | | | 152 | | | | 161 | |
Line of Credit | | | 11,495 | | | | — | | | | — | | | | — | |
Accrued Expenses and Other Liabilities | | | 1,557 | | | | 565 | | | | 300 | | | | 268 | |
| | | | | | | | | | | | | | | | |
Total Liabilities | | | 512,812 | | | | 64,174 | | | | 47,448 | | | | 19,446 | |
| | | | | | | | | | | | | | | | |
NET ASSETS | | $ | 12,297,493 | | | $ | 3,416,144 | | | $ | 1,822,967 | | | $ | 1,897,276 | |
| | | | | | | | | | | | | | | | |
Investment Securities at Cost | | $ | 10,175,872 | | | $ | 2,886,201 | | | $ | 1,603,374 | | | $ | 1,462,299 | |
| | | | | | | | | | | | | | | | |
Foreign Currencies at Cost | | $ | 75,248 | | | $ | 1,398 | | | $ | 4,419 | | | $ | 5,057 | |
| | | | | | | | | | | | | | | | |
| * | See Note J in the Notes to Financial Statements for additional information about securities lending collateral. |
See accompanying Notes to Financial Statements.
221
THE DFA INVESTMENT TRUST COMPANY
STATEMENTS OF ASSETS AND LIABILITIES
OCTOBER 31, 2021
(Amounts in thousands)
| | | | | | | | | | | | | | | | |
| | | The
Continental
Small
Company
Series* | | | The Canadian
Small
Company
Series* | | | The
Emerging
Markets
Series* | | | The
Emerging
Markets
Small Cap
Series* | |
ASSETS: | | | | | | | | | | | | | | | | |
Investment Securities at Value (including $279,785, $271,498, $255,568 and $646,636 of securities on loan, respectively) | | $ | 6,512,464 | | | $ | 1,448,081 | | | $ | 6,289,685 | | | $ | 5,130,445 | |
Collateral from Securities on Loan Invested in Affiliate at Value (including cost of $297,243, $276,398, $107,871 and $143,165, respectively) | | | 297,271 | | | | 276,415 | | | | 107,885 | | | | 143,180 | |
Segregated Cash for Futures Contracts | | | — | | | | — | | | | 2,671 | | | | 1,459 | |
Foreign Currencies at Value | | | 3,116 | | | | 1,148 | | | | 35,516 | | | | 13,480 | |
Cash | | | 5 | | | | 2 | | | | 21,819 | | | | — | |
Receivables: | | | | | | | | | | | | | | | | |
Investment Securities Sold | | | 1,462 | | | | 1,655 | | | | 8,411 | | | | 44,515 | |
Dividends, Interest and Tax Reclaims | | | 23,213 | | | | 643 | | | | 5,014 | | | | 5,242 | |
Securities Lending Income | | | 348 | | | | 189 | | | | 527 | | | | 1,977 | |
Unrealized Gain on Foreign Currency Contracts | | | — | | | | — | | | | — | | | | 3 | |
Prepaid Expenses and Other Assets | | | — | | | | — | | | | — | | | | 1 | |
| | | | | | | | | | | | | | | | |
Total Assets | | | 6,837,879 | | | | 1,728,133 | | | | 6,471,528 | | | | 5,340,302 | |
| | | | | | | | | | | | | | | | |
LIABILITIES: | | | | | | | | | | | | | | | | |
Payables: | | | | | | | | | | | | | | | | |
Due to Custodian | | | — | | | | — | | | | — | | | | 78 | |
Upon Return of Securities Loaned | | | 297,321 | | | | 276,415 | | | | 107,898 | | | | 143,144 | |
Investment Securities Purchased | | | — | | | | — | | | | 5,251 | | | | 279 | |
Due to Advisor | | | 544 | | | | 122 | | | | 543 | | | | 890 | |
Line of Credit | | | — | | | | — | | | | — | | | | 26,819 | |
Futures Margin Variation | | | — | | | | — | | | | 576 | | | | 1,406 | |
Unrealized Loss on Foreign Currency Contracts | | | — | | | | — | | | | 1 | | | | 16 | |
Deferred Taxes Payable | | | — | | | | — | | | | 46,353 | | | | 37,109 | |
Accrued Expenses and Other Liabilities | | | 909 | | | | 188 | | | | 1,576 | | | | 1,842 | |
| | | | | | | | | | | | | | | | |
Total Liabilities | | | 298,774 | | | | 276,725 | | | | 162,198 | | | | 211,583 | |
| | | | | | | | | | | | | | | | |
NET ASSETS | | $ | 6,539,105 | | | $ | 1,451,408 | | | $ | 6,309,330 | | | $ | 5,128,719 | |
| | | | | | | | | | | | | | | | |
Investment Securities at Cost | | $ | 4,543,679 | | | $ | 1,069,057 | | | $ | 3,711,439 | | | $ | 3,960,383 | |
| | | | | | | | | | | | | | | | |
Foreign Currencies at Cost | | $ | 3,111 | | | $ | 1,147 | | | $ | 32,760 | | | $ | 11,272 | |
| | | | | | | | | | | | | | | | |
| * | See Note J in the Notes to Financial Statements for additional information about securities lending collateral. |
See accompanying Notes to Financial Statements.
222
THE DFA INVESTMENT TRUST COMPANY
STATEMENTS OF OPERATIONS
FOR THE YEAR ENDED OCTOBER 31, 2021
(Amounts in thousands)
| | | | | | | | | | | | | | | | |
| | | The DFA
International
Value Series# | | | The Japanese
Small
Company
Series# | | | The Asia
Pacific
Small
Company
Series# | | | The United
Kingdom Small
Company
Series# | |
Investment Income | | | | | | | | | | | | | | | | |
Dividends (Net of Foreign Taxes Withheld of $42,113, $7,717, $667 and $525, respectively) | | $ | 442,829 | | | $ | 69,576 | | | $ | 61,273 | | | $ | 45,323 | |
Income from Securities Lending | | | 4,302 | | | | 1,944 | | | | 3,634 | | | | 478 | |
| | | | | | | | | | | | | | | | |
Total Investment Income | | | 447,131 | | | | 71,520 | | | | 64,907 | | | | 45,801 | |
| | | | | | | | | | | | | | | | |
Expenses | | | | | | | | | | | | | | | | |
Investment Management Fees | | | 24,048 | | | | 3,206 | | | | 1,834 | | | | 1,924 | |
Accounting & Transfer Agent Fees | | | 541 | | | | 144 | | | | 78 | | | | 81 | |
Custodian Fees | | | 879 | | | | 385 | | | | 200 | | | | 81 | |
Shareholders’ Reports | | | 38 | | | | 26 | | | | 23 | | | | 23 | |
Directors’/Trustees’ Fees & Expenses | | | 131 | | | | 36 | | | | 22 | | | | 21 | |
Professional Fees | | | 191 | | | | 38 | | | | 22 | | | | 24 | |
Other | | | 410 | | | | 108 | | | | 68 | | | | 60 | |
| | | | | | | | | | | | | | | | |
Total Expenses | | | 26,238 | | | | 3,943 | | | | 2,247 | | | | 2,214 | |
| | | | | | | | | | | | | | | | |
Fees Paid Indirectly (Note C) | | | 70 | | | | 3 | | | | 1 | | | | 1 | |
| | | | | | | | | | | | | | | | |
Net Expenses | | | 26,168 | | | | 3,940 | | | | 2,246 | | | | 2,213 | |
| | | | | | | | | | | | | | | | |
Net Investment Income (Loss) | | | 420,963 | | | | 67,580 | | | | 62,661 | | | | 43,588 | |
| | | | | | | | | | | | | | | | |
Realized and Unrealized Gain (Loss) | | | | | | | | | | | | | | | | |
Net Realized Gain (Loss) on: | | | | | | | | | | | | | | | | |
Investment Securities Sold** | | | 468,390 | | | | 106,212 | | | | 188,465 | | | | 99,258 | |
Affiliated Investment Companies Shares Sold | | | (27 | ) | | | 4 | | | | (3 | ) | | | 1 | |
Futures | | | 29,155 | | | | — | | | | — | | | | (120 | ) |
Foreign Currency Transactions | | | 4,495 | | | | (32 | ) | | | (238 | ) | | | 291 | |
Change in Unrealized Appreciation (Depreciation) of: | | | | | | | | | | | | | | | | |
Investment Securities and Foreign Currency | | | 3,710,810 | | | | 204,124 | | | | 322,334 | | | | 602,698 | |
Affiliated Investment Companies Shares | | | (30 | ) | | | (6 | ) | | | (1 | ) | | | (3 | ) |
Futures | | | 5,251 | | | | — | | | | — | | | | — | |
Translation of Foreign Currency-Denominated Amounts | | | (1,694 | ) | | | (657 | ) | | | 8 | | | | 25 | |
| | | | | | | | | | | | | | | | |
Net Realized and Unrealized Gain (Loss) | | | 4,216,350 | | | | 309,645 | | | | 510,565 | | | | 702,150 | |
| | | | | | | | | | | | | | | | |
Net Increase (Decrease) in Net Assets Resulting from Operations | | $ | 4,637,313 | | | $ | 377,225 | | | $ | 573,226 | | | $ | 745,738 | |
| | | | | | | | | | | | | | | | |
| ** | Net of foreign capital gain taxes withheld of $0, $0, $0 and $0, respectively. |
| # | Portion of income is from investment in affiliated fund. |
See accompanying Notes to Financial Statements.
223
THE DFA INVESTMENT TRUST COMPANY
STATEMENTS OF OPERATIONS
FOR THE YEAR ENDED OCTOBER 31, 2021
(Amounts in thousands)
| | | | | | | | | | | | | | | | |
| | | The
Continental
Small
Company
Series# | | | The Canadian
Small
Company
Series# | | | The
Emerging
Markets
Series# | | | The
Emerging
Markets
Small Cap
Series# | |
Investment Income | | | | | | | | | | | | | | | | |
Dividends (Net of Foreign Taxes Withheld of $21,096, $3,954, $20,102 and $14,942, respectively) | | $ | 126,316 | | | $ | 24,196 | | | $ | 162,117 | | | $ | 129,818 | |
Income from Securities Lending | | | 7,004 | | | | 2,268 | | | | 4,732 | | | | 18,805 | |
| | | | | | | | | | | | | | | | |
Total Investment Income | | | 133,320 | | | | 26,464 | | | | 166,849 | | | | 148,623 | |
| | | | | | | | | | | | | | | | |
Expenses | | | | | | | | | | | | | | | | |
Investment Management Fees | | | 5,961 | | | | 1,308 | | | | 6,486 | | | | 10,881 | |
Accounting & Transfer Agent Fees | | | 270 | | | | 52 | | | | 296 | | | | 252 | |
Custodian Fees. | | | 698 | | | | 75 | | | | 2,262 | | | | 2,743 | |
Shareholders’ Reports. | | | 28 | | | | 15 | | | | 30 | | | | 30 | |
Directors’/Trustees’ Fees & Expenses | | | 64 | | | | 15 | | | | 74 | | | | 61 | |
Professional Fees | | | 87 | | | | 47 | | | | 296 | | | | 269 | |
Other | | | 229 | | | | 40 | | | | 234 | | | | 245 | |
| | | | | | | | | | | | | | | | |
Total Expenses | | | 7,337 | | | | 1,552 | | | | 9,678 | | | | 14,481 | |
| | | | | | | | | | | | | | | | |
Fees Paid Indirectly (Note C) | | | 8 | | | | 2 | | | | 49 | | | | 26 | |
| | | | | | | | | | | | | | | | |
Net Expenses. | | | 7,329 | | | | 1,550 | | | | 9,629 | | | | 14,455 | |
| | | | | | | | | | | | | | | | |
Net Investment Income (Loss) | | | 125,991 | | | | 24,914 | | | | 157,220 | | | | 134,168 | |
| | | | | | | | | | | | | | | | |
Realized and Unrealized Gain (Loss) | | | | | | | | | | | | | | | | |
Net Realized Gain (Loss) on: | | | | | | | | | | | | | | | | |
Investment Securities Sold** | | | 392,015 | | | | 167,819 | | | | 399,802 | | | | 591,471 | |
Affiliated Investment Companies Shares Sold | | | 2 | | | | (11 | ) | | | — | | | | (4 | ) |
Futures. | | | — | | | | 42 | | | | 13,167 | | | | 5,812 | |
Foreign Currency Transactions | | | (1,344 | ) | | | 445 | | | | (3,699 | ) | | | (3,794 | ) |
Change in Unrealized Appreciation (Depreciation) of: | | | | | | | | | | | | | | | | |
Investment Securities and Foreign Currency | | | 1,753,296 | | | | 390,372 | | | | 694,801 | | | | 925,173 | |
Affiliated Investment Companies Shares | | | (21 | ) | | | (6 | ) | | | (10 | ) | | | (6 | ) |
Futures. | | | — | | | | — | | | | (990 | ) | | | (191 | ) |
Translation of Foreign Currency-Denominated Amounts | | | (445 | ) | | | 3 | | | | (9 | ) | | | (6 | ) |
| | | | | | | | | | | | | | | | |
Net Realized and Unrealized Gain (Loss) | | | 2,143,503 | | | | 558,664 | | | | 1,103,062 | | | | 1,518,455 | |
| | | | | | | | �� | | | | | | | | |
Net Increase (Decrease) in Net Assets Resulting from Operations. | | $ | 2,269,494 | | | $ | 583,578 | | | $ | 1,260,282 | | | $ | 1,652,623 | |
| | | | | | | | | | | | | | | | |
| ** | Net of foreign capital gain taxes withheld of $0, $0, $50 and $2,309, respectively. |
| # | Portion of income is from investment in affiliated fund. |
See accompanying Notes to Financial Statements.
224
THE DFA INVESTMENT TRUST COMPANY
STATEMENTS OF CHANGES IN NET ASSETS
(Amounts in thousands)
| | | | | | | | | | | | | | | | | | | | | | | | |
| | | The DFA International Value
Series | | | The Japanese Small
Company Series | | | The Asia Pacific Small
Company Series | |
| | | Year
Ended
Oct 31,
2021 | | | Year
Ended
Oct 31,
2020 | | | Year
Ended
Oct 31,
2021 | | | Year
Ended
Oct 31,
2020 | | | Year
Ended
Oct 31,
2021 | | | Year
Ended
Oct 31,
2020 | |
Increase (Decrease) in Net Assets | | | | | | | | | | | | | | | | | | | | | | | | |
Operations: | | | | | | | | | | | | | | | | | | | | | | | | |
Net Investment Income (Loss) | | $ | 420,963 | | | $ | 297,585 | | | $ | 67,580 | | | $ | 69,080 | | | $ | 62,661 | | | $ | 62,699 | |
Net Realized Gain (Loss) on: | | | | | | | | | | | | | | | | | | | | | | | | |
Investment Securities Sold*,** | | | 468,390 | | | | (566,996 | ) | | | 106,212 | | | | (64,936 | ) | | | 188,465 | | | | (77,003 | ) |
Affiliated Investment Companies Shares Sold | | | (27 | ) | | | 72 | | | | 4 | | | | (9 | ) | | | (3 | ) | | | (11 | ) |
Futures | | | 29,155 | | | | 40,717 | | | | — | | | | — | | | | — | | | | 608 | |
Foreign Currency Transactions | | | 4,495 | | | | 3,123 | | | | (32 | ) | | | 228 | | | | (238 | ) | | | (267 | ) |
Change in Unrealized Appreciation | | | | | | | | | | | | | | | | | | | | | | | | |
(Depreciation) of: | | | | | | | | | | | | | | | | | | | | | | | | |
Investment Securities and Foreign Currency | | | 3,710,810 | | | | (2,004,930 | ) | | | 204,124 | | | | (116,647 | ) | | | 322,334 | | | | (1,299 | ) |
Affiliated Investment Companies Shares | | | (30 | ) | | | 85 | | | | (6 | ) | | | 9 | | | | (1 | ) | | | 1 | |
Futures | | | 5,251 | | | | (3,281 | ) | | | — | | | | — | | | | — | | | | — | |
Translation of Foreign | | | | | | | | | | | | | | | | | | | | | | | | |
Currency-Denominated Amounts | | | (1,694 | ) | | | 1,379 | | | | (657 | ) | | | 182 | | | | 8 | | | | 1 | |
| | | | | | | | | | | | | | | | | | | | | | | | |
Net Increase (Decrease) in Net Assets Resulting from Operations | | | 4,637,313 | | | | (2,232,246 | ) | | | 377,225 | | | | (112,093 | ) | | | 573,226 | | | | (15,271 | ) |
| | | | | | | | | | | | | | | | | | | | | | | | |
Transactions in Interest: | | | | | | | | | | | | | | | | | | | | | | | | |
Contributions | | | 152,792 | | | | 1,038,679 | | | | 441,236 | | | | 71,736 | | | | 105,831 | | | | 82,954 | |
Withdrawals | | | (1,974,162 | ) | | | (1,745,733 | ) | | | (345,470 | ) | | | (764,667 | ) | | | (383,104 | ) | | | (182,512 | ) |
| | | | | | | | | | | | | | | | | | | | | | | | |
Net Increase (Decrease) from Transactions in Interest | | | (1,821,370 | ) | | | (707,054 | ) | | | 95,766 | | | | (692,931 | ) | | | (277,273 | ) | | | (99,558 | ) |
| | | | | | | | | | | | | | | | | | | | | | | | |
Total Increase (Decrease) in Net Assets | | | 2,815,943 | | | | (2,939,300 | ) | | | 472,991 | | | | (805,024 | ) | | | 295,953 | | | | (114,829 | ) |
Net Assets | | | | | | | | | | | | | | | | | | | | | | | | |
Beginning of Year | | | 9,481,550 | | | | 12,420,850 | | | | 2,943,153 | | | | 3,748,177 | | | | 1,527,014 | | | | 1,641,843 | |
| | | | | | | | | | | | | | | | | | | | | | | | |
End of Year | | $ | 12,297,493 | | | $ | 9,481,550 | | | $ | 3,416,144 | | | $ | 2,943,153 | | | $ | 1,822,967 | | | $ | 1,527,014 | |
| | | | | | | | | | | | | | | | | | | | | | | | |
| * | Net of foreign capital gain taxes withheld for the fiscal year ended October 31, 2021 of $0, $0 and $0, respectively. |
| ** | Net of foreign capital gain taxes withheld for the fiscal year ended October 31, 2020 of $0, $0 and $0, respectively. |
See accompanying Notes to Financial Statements.
225
THE DFA INVESTMENT TRUST COMPANY
STATEMENTS OF CHANGES IN NET ASSETS
(Amounts in thousands)
| | | | | | | | | | | | | | | | | | | | | | | | |
| | | The United Kingdom Small
Company Series | | | The Continental Small
Company Series | | | The Canadian Small
Company Series | |
| | | Year | | | Year | | | Year | | | Year | | | Year | | | Year | |
| | | Ended | | | Ended | | | Ended | | | Ended | | | Ended | | | Ended | |
| | | Oct 31, | | | Oct 31, | | | Oct 31, | | | Oct 31, | | | Oct 31, | | | Oct 31, | |
| | | 2021 | | | 2020 | | | 2021 | | | 2020 | | | 2021 | | | 2020 | |
Increase (Decrease) in Net Assets | | | | | | | | | | | | | | | | | | | | | | | | |
Operations: | | | | | | | | | | | | | | | | | | | | | | | | |
Net Investment Income (Loss) | | $ | 43,588 | | | $ | 42,407 | | | $ | 125,991 | | | $ | 109,276 | | | $ | 24,914 | | | $ | 20,882 | |
Net Realized Gain (Loss) on: | | | | | | | | | | | | | | | | | | | | | | | | |
Investment Securities Sold*,** | | | 99,258 | | | | (34,350 | ) | | | 392,015 | | | | 92,887 | | | | 167,819 | | | | (221,703 | ) |
Affiliated Investment Companies Shares Sold | | | 1 | | | | (1 | ) | | | 2 | | | | (26 | ) | | | (11 | ) | | | (8 | ) |
Futures | | | (120 | ) | | | (394 | ) | | | — | | | | (260 | ) | | | 42 | | | | — | |
Foreign Currency Transactions | | | 291 | | | | (444 | ) | | | (1,344 | ) | | | 1,299 | | | | 445 | | | | (151 | ) |
Change in Unrealized Appreciation | | | | | | | | | | | | | | | | | | | | | | | | |
(Depreciation) of: | | | | | | | | | | | | | | | | | | | | | | | | |
Investment Securities and Foreign Currency | | | 602,698 | | | | (329,338 | ) | | | 1,753,296 | | | | (384,869 | ) | | | 390,372 | | | | 206,814 | |
Affiliated Investment Companies Shares | | | (3 | ) | | | 4 | | | | (21 | ) | | | (9 | ) | | | (6 | ) | | | 3 | |
Translation of Foreign Currency-Denominated Amounts | | | 25 | | | | (381 | ) | | | (445 | ) | | | 825 | | | | 3 | | | | (2 | ) |
| | | | | | | | | | | | | | | | | | | | | | | | |
Net Increase (Decrease) in Net Assets Resulting from Operations | | | 745,738 | | | | (322,497 | ) | | | 2,269,494 | | | | (180,877 | ) | | | 583,578 | | | | 5,835 | |
| | | | | | | | | | | | | | | | | | | | | | | | |
Transactions in Interest: | | | | | | | | | | | | | | | | | | | | | | | | |
Contributions | | | 46,399 | | | | 5,810 | | | | 513,046 | | | | 135,156 | | | | 164,451 | | | | 6,817 | |
Withdrawals | | | (370,643 | ) | | | (484,982 | ) | | | (845,380 | ) | | | (959,829 | ) | | | (267,504 | ) | | | (190,384 | ) |
| | | | | | | | | | | | | | | | | | | | | | | | |
Net Increase (Decrease) from Transactions in Interest | | | (324,244 | ) | | | (479,172 | ) | | | (332,334 | ) | | | (824,673 | ) | | | (103,053 | ) | | | (183,567 | ) |
| | | | | | | | | | | | | | | | | | | | | | | | |
Total Increase (Decrease) in Net Assets | | | 421,494 | | | | (801,669 | ) | | | 1,937,160 | | | | (1,005,550 | ) | | | 480,525 | | | | (177,732 | ) |
Net Assets | | | | | | | | | | | | | | | | | | | | | | | | |
Beginning of Year | | | 1,475,782 | | | | 2,277,451 | | | | 4,601,945 | | | | 5,607,495 | | | | 970,883 | | | | 1,148,615 | |
| | | | | | | | | | | | | | | | | | | | | | | | |
End of Year | | $ | 1,897,276 | | | $ | 1,475,782 | | | $ | 6,539,105 | | | $ | 4,601,945 | | | $ | 1,451,408 | | | $ | 970,883 | |
| | | | | | | | | | | | | | | | | | | | | | | | |
| * | Net of foreign capital gain taxes withheld for the fiscal year ended October 31, 2021 of $0, $0 and $0, respectively. |
| ** | Net of foreign capital gain taxes withheld for the fiscal year ended October 31, 2020 of $0, $0 and $0, respectively. |
See accompanying Notes to Financial Statements.
226
THE DFA INVESTMENT TRUST COMPANY
STATEMENTS OF CHANGES IN NET ASSETS
(Amounts in thousands)
| | | | | | | | | | | | | | | | |
| | | The Emerging Markets
Series | | | The Emerging Markets
Small Cap Series | |
| | | Year | | | Year | | | Year | | | Year | |
| | | Ended | | | Ended | | | Ended | | | Ended | |
| | | Oct 31, | | | Oct 31, | | | Oct 31, | | | Oct 31, | |
| | | 2021 | | | 2020 | | | 2021 | | | 2020 | |
Increase (Decrease) in Net Assets | | | | | | | | | | | | | | | | |
Operations: | | | | | | | | | | | | | | | | |
Net Investment Income (Loss) | | $ | 157,220 | | | $ | 137,835 | | | $ | 134,168 | | | $ | 145,155 | |
Net Realized Gain (Loss) on: | | | | | | | | | | | | | | | | |
Investment Securities Sold*,** | | | 399,802 | | | | 52,822 | | | | 591,471 | | | | (389,082 | ) |
Affiliated Investment Companies Shares Sold | | | — | | | | (9 | ) | | | (4 | ) | | | (5 | ) |
Futures | | | 13,167 | | | | 20,410 | | | | 5,812 | | | | 16,698 | |
Foreign Currency Transactions | | | (3,699 | ) | | | (3,976 | ) | | | (3,794 | ) | | | (4,808 | ) |
Change in Unrealized Appreciation (Depreciation) of: | | | | | | | | | | | | | | | | |
Investment Securities and Foreign Currency | | | 694,801 | | | | 21,823 | | | | 925,173 | | | | 127,570 | |
Affiliated Investment Companies Shares | | | (10 | ) | | | 3 | | | | (6 | ) | | | (2 | ) |
Futures | | | (990 | ) | | | (366 | ) | | | (191 | ) | | | (512 | ) |
Translation of Foreign Currency-Denominated Amounts | | | (9 | ) | | | (16 | ) | | | (6 | ) | | | (103 | ) |
| | | | | | | | | | | | | | | | |
Net Increase (Decrease) in Net Assets Resulting from Operations | | | 1,260,282 | | | | 228,526 | | | | 1,652,623 | | | | (105,089 | ) |
| | | | | | | | | | | | | | | | |
Transactions in Interest: | | | | | | | | | | | | | | | | |
Contributions | | | 553,796 | | | | 607,207 | | | | 95,865 | | | | 184,927 | |
Withdrawals | | | (1,229,073 | ) | | | (1,145,570 | ) | | | (1,526,723 | ) | | | (1,603,251 | ) |
Net Increase (Decrease) from Transactions in Interest | | | (675,277 | ) | | | (538,363 | ) | | | (1,430,858 | ) | | | (1,418,324 | ) |
| | | | | | | | | | | | | | | | |
Total Increase (Decrease) in Net Assets | | | 585,005 | | | | (309,837 | ) | | | 221,765 | | | | (1,523,413 | ) |
Net Assets | | | | | | | | | | | | | | | | |
Beginning of Year | | | 5,724,325 | | | | 6,034,162 | | | | 4,906,954 | | | | 6,430,367 | |
| | | | | | | | | | | | | | | | |
End of Year | | $ | 6,309,330 | | | $ | 5,724,325 | | | $ | 5,128,719 | | | $ | 4,906,954 | |
| | | | | | | | | | | | | | | �� | |
| * | Net of foreign capital gain taxes withheld for the fiscal year ended October 31, 2021 of $50 and $2,309, respectively. |
| ** | Net of foreign capital gain taxes withheld for the fiscal year ended October 31, 2020 of $163 and $163, respectively. |
See accompanying Notes to Financial Statements.
227
THE DFA INVESTMENT TRUST COMPANY
FINANCIAL HIGHLIGHTS
| | | | | | | | | | | | | | | | | | | | | | | | | | | | | | | | | | | | | | | | |
| | | The DFA International Value Series | | | The Japanese Small Company Series | |
| | | Year
Ended
Oct 31,
2021 | | | Year
Ended
Oct 31,
2020 | | | Year
Ended
Oct 31,
2019 | | | Year
Ended
Oct 31,
2018 | | | Year
Ended
Oct 31,
2017 | | | Year
Ended
Oct 31,
2021 | | | Year
Ended
Oct 31,
2020 | | | Year
Ended
Oct 31,
2019 | | | Year
Ended
Oct 31,
2018 | | | Year
Ended
Oct 31,
2017 | |
Total Return | | | 51.09 | % | | | (18.68 | %) | | | 3.60 | % | | | (8.10 | %) | | | 26.53 | % | | | 13.08 | % | | | (1.93 | %) | | | 4.47 | % | | | (7.46 | %) | | | 27.10 | % |
| | | | | | | | | | | | | | | | | | | | | | | | | | | | | | | | | | | | | | | | |
Net Assets, End of Year (thousands) | | $ | 12,297,493 | | | $ | 9,481,550 | | | $ | 12,420,850 | | | $ | 12,153,340 | | | $ | 12,732,150 | | | $ | 3,416,144 | | | $ | 2,943,153 | | | $ | 3,748,177 | | | $ | 3,834,097 | | | $ | 3,989,049 | |
Ratio of Expenses to Average Net Assets | | | 0.22 | % | | | 0.21 | % | | | 0.21 | % | | | 0.22 | % | | | 0.22 | % | | | 0.12 | % | | | 0.13 | % | | | 0.12 | % | | | 0.12 | % | | | 0.13 | % |
Ratio of Expenses to Average Net Assets (Excluding Fees Paid Indirectly) | | | 0.22 | % | | | 0.22 | % | | | 0.22 | % | | | 0.22 | % | | | 0.22 | % | | | 0.12 | % | | | 0.13 | % | | | 0.12 | % | | | 0.12 | % | | | 0.13 | % |
Ratio of Net Investment Income to Average Net Assets | | | 3.50 | % | | | 2.77 | % | | | 3.92 | % | | | 3.21 | % | | | 3.33 | % | | | 2.11 | % | | | 2.13 | % | | | 2.32 | % | | | 1.90 | % | | | 1.90 | % |
Portfolio Turnover Rate | | | 9 | % | | | 12 | % | | | 16 | % | | | 20 | % | | | 17 | % | | | 11 | % | | | 5 | % | | | 12 | % | | | 17 | % | | | 13 | % |
See page 1-2 for the Definitions of Abbreviations and Footnotes.
See accompanying Notes to Financial Statements.
228
THE DFA INVESTMENT TRUST COMPANY
FINANCIAL HIGHLIGHTS
| | | | | | | | | | | | | | | | | | | | | | | | | | | | | | | | | | | | | | | | |
| | | The Asia Pacific Small Company Series | | | The United Kingdom Small Company Series | |
| | | Year | | | Year | | | Year | | | Year | | | Year | | | Year | | | Year | | | Year | | | Year | | | Year | |
| | | Ended | | | Ended | | | Ended | | | Ended | | | Ended | | | Ended | | | Ended | | | Ended | | | Ended | | | Ended | |
| | | Oct 31, | | | Oct 31, | | | Oct 31, | | | Oct 31, | | | Oct 31, | | | Oct 31, | | | Oct 31, | | | Oct 31, | | | Oct 31, | | | Oct 31, | |
| | | 2021 | | | 2020 | | | 2019 | | | 2018 | | | 2017 | | | 2021 | | | 2020 | | | 2019 | | | 2018 | | | 2017 | |
Total Return | | | 38.31 | % | | | 0.14 | % | | | 5.27 | % | | | (8.14 | %) | | | 16.21 | % | | | 51.93 | % | | | (14.87 | %) | | | 10.67 | % | | | (8.90 | %) | | | 29.87 | % |
| | | | | | | | | | | | | | | | | | | | | | | | | | | | | | | | | | | | | | | | |
Net Assets, End of Year (thousands) | | $ | 1,822,967 | | | $ | 1,527,014 | | | $ | 1,641,843 | | | $ | 1,730,371 | | | $ | 1,815,705 | | | $ | 1,897,276 | | | $ | 1,475,782 | | | $ | 2,277,451 | | | $ | 2,188,825 | | | $ | 2,329,912 | |
Ratio of Expenses to Average Net Assets | | | 0.12 | % | | | 0.13 | % | | | 0.13 | % | | | 0.13 | % | | | 0.13 | % | | | 0.12 | % | | | 0.12 | % | | | 0.11 | % | | | 0.11 | % | | | 0.12 | % |
Ratio of Expenses to Average Net Assets (Excluding Fees Paid Indirectly) | | | 0.12 | % | | | 0.13 | % | | | 0.13 | % | | | 0.13 | % | | | 0.13 | % | | | 0.12 | % | | | 0.12 | % | | | 0.12 | % | | | 0.11 | % | | | 0.12 | % |
Ratio of Net Investment Income to Average Net Assets | | | 3.42 | % | | | 4.21 | % | | | 4.11 | % | | | 3.96 | % | | | 3.82 | % | | | 2.27 | % | | | 2.38 | % | | | 3.43 | % | | | 3.23 | % | | | 3.40 | % |
Portfolio Turnover Rate | | | 19 | % | | | 18 | % | | | 18 | % | | | 18 | % | | | 14 | % | | | 12 | % | | | 9 | % | | | 18 | % | | | 14 | % | | | 9 | % |
See page 1-2 for the Definitions of Abbreviations and Footnotes.
See accompanying Notes to Financial Statements.
229
THE DFA INVESTMENT TRUST COMPANY
FINANCIAL HIGHLIGHTS
| | | | | | | | | | | | | | | | | | | | | | | | | | | | | | | | | | | | | | | | |
| | | The Continental Small Company Series | | | The Canadian Small Company Series | | | | |
| | | Year | | | Year | | | Year | | | Year | | | Year | | | Year | | | Year | | | Year | | | Year | | | Year | |
| | | Ended | | | Ended | | | Ended | | | Ended | | | Ended | | | Ended | | | Ended | | | Ended | | | Ended | | | Ended | |
| | | Oct 31, | | | Oct 31, | | | Oct 31, | | | Oct 31, | | | Oct 31, | | | Oct 31, | | | Oct 31, | | | Oct 31, | | | Oct 31, | | | Oct 31, | |
| | | 2021 | | | 2020 | | | 2019 | | | 2018 | | | 2017 | | | 2021 | | | 2020 | | | 2019 | | | 2018 | | | 2017 | |
Total Return | | | 51.24 | % | | | (2.23 | %) | | | 8.43 | % | | | (10.78 | %) | | | 34.27 | % | | | 59.72 | % | | | 6.02 | % | | | 1.00 | % | | | (10.44 | %) | | | 12.10 | % |
| | | | | | | | | | | | | | | | | | | | | | | | | | | | | | | | | | | | | | | | |
Net Assets, End of Year (thousands) | | $ | 6,539,105 | | | $ | 4,601,945 | | | $ | 5,607,495 | | | $ | 5,422,260 | | | $ | 5,751,059 | | | $ | 1,451,408 | | | $ | 970,883 | | | $ | 1,148,615 | | | $ | 1,146,811 | | | $ | 1,190,222 | |
Ratio of Expenses to Average Net Assets | | | 0.12 | % | | | 0.12 | % | | | 0.12 | % | | | 0.12 | % | | | 0.13 | % | | | 0.12 | % | | | 0.12 | % | | | 0.12 | % | | | 0.12 | % | | | 0.12 | % |
Ratio of Expenses to Average Net Assets (Excluding Fees Paid Indirectly) | | | 0.12 | % | | | 0.12 | % | | | 0.13 | % | | | 0.12 | % | | | 0.13 | % | | | 0.12 | % | | | 0.12 | % | | | 0.12 | % | | | 0.12 | % | | | 0.12 | % |
Ratio of Net Investment Income to Average Net Assets | | | 2.11 | % | | | 2.15 | % | | | 2.74 | % | | | 2.51 | % | | | 2.33 | % | | | 1.90 | % | | | 2.08 | % | | | 2.37 | % | | | 2.11 | % | | | 2.14 | % |
Portfolio Turnover Rate | | | 17 | % | | | 8 | % | | | 17 | % | | | 15 | % | | | 13 | % | | | 27 | % | | | 18 | % | | | 12 | % | | | 14 | % | | | 22 | % |
See page 1-2 for the Definitions of Abbreviations and Footnotes.
See accompanying Notes to Financial Statements.
230
THE DFA INVESTMENT TRUST COMPANY
FINANCIAL HIGHLIGHTS
| | | | | | | | | | | | | | | | | | | | | | | | | | | | | | | | | | | | | | | | |
| | | The Emerging Markets Series | | | The Emerging Markets Small Cap Series | |
| | | Year | | | Year | | | Year | | | Year | | | Year | | | Year | | | Year | | | Year | | | Year | | | Year | |
| | | Ended | | | Ended | | | Ended | | | Ended | | | Ended | | | Ended | | | Ended | | | Ended | | | Ended | | | Ended | |
| | | Oct 31, | | | Oct 31, | | | Oct 31, | | | Oct 31, | | | Oct 31, | | | Oct 31, | | | Oct 31, | | | Oct 31, | | | Oct 31, | | | Oct 31, | |
| | | 2021 | | | 2020 | | | 2019 | | | 2018 | | | 2017 | | | 2021 | | | 2020 | | | 2019 | | | 2018 | | | 2017 | |
Total Return | | | 22.22 | % | | | 2.67 | % | | | 11.40 | % | | | (11.83 | %) | | | 25.26 | % | | | 36.03 | % | | | 1.25 | % | | | 13.47 | % | | | (16.06 | %) | | | 21.55 | % |
| | | | | | | | | | | | | | | | | | | | | | | | | | | | | | | | | | | | | | | | |
Net Assets, End of Year (thousands) | | $ | 6,309,330 | | | $ | 5,724,325 | | | $ | 6,034,162 | | | $ | 5,469,649 | | | $ | 6,723,207 | | | $ | 5,128,719 | | | $ | 4,906,954 | | | $ | 6,430,367 | | | $ | 6,306,302 | | | $ | 7,253,457 | |
Ratio of Expenses to Average Net Assets | | | 0.15 | % | | | 0.13 | % | | | 0.14 | % | | | 0.14 | % | | | 0.15 | % | | | 0.27 | % | | | 0.25 | % | | | 0.24 | % | | | 0.24 | % | | | 0.27 | % |
Ratio of Expenses to Average Net Assets (Excluding Fees Paid Indirectly) | | | 0.15 | % | | | 0.14 | % | | | 0.15 | % | | | 0.14 | % | | | 0.15 | % | | | 0.27 | % | | | 0.26 | % | | | 0.25 | % | | | 0.24 | % | | | 0.27 | % |
Ratio of Net Investment Income to Average Net Assets | | | 2.42 | % | | | 2.38 | % | | | 3.04 | % | | | 2.40 | % | | | 2.23 | % | | | 2.47 | % | | | 2.64 | % | | | 2.90 | % | | | 2.77 | % | | | 2.78 | % |
Portfolio Turnover Rate | | | 19 | % | | | 22 | % | | | 9 | % | | | 12 | % | | | 8 | % | | | 16 | % | | | 18 | % | | | 12 | % | | | 12 | % | | | 15 | % |
See page 1-2 for the Definitions of Abbreviations and Footnotes.
See accompanying Notes to Financial Statements.
231
THE DFA INVESTMENT TRUST COMPANY
NOTES TO FINANCIAL STATEMENTS
A. Organization:
The DFA Investment Trust Company (the “Trust”) is an open-end management investment company registered under the Investment Company Act of 1940, The Trust consists of ten operational portfolios, eight of which, The DFA International Value Series, The Japanese Small Company Series, The Asia Pacific Small Company Series, The United Kingdom Small Company Series, The Continental Small Company Series, The Canadian Small Company Series, The Emerging Markets Series and The Emerging Markets Small Cap Series are included in this section of the report (collectively, the “Series”). The remaining operational portfolios are presented in separate reports. The Series are investment companies, and accordingly, follow the accounting and reporting guidance under the Financial Accounting Standards Board (“FASB”) Accounting Standards Certification (“ASC”), Topic 946, “Financial Services-Investment Companies.”
B. Significant Accounting Policies:
The following significant accounting policies are in conformity with accounting principles generally accepted in the United States of America. Such policies are consistently followed by the Trust in preparation of its financial statements. The preparation of financial statements in accordance with accounting principles generally accepted in the United States of America requires management to make estimates and assumptions that affect the fair value of investments, the reported amounts of assets and liabilities, the disclosure of contingent assets and liabilities at the date of the financial statements, and the reported amounts of increases and decreases in net assets from operations during the reporting period. Actual results could differ from those estimates, and those differences could be material.
1. Security Valuation: The Series use a fair value hierarchy, which prioritizes the inputs-to-valuation techniques used to measure fair value into three broad levels described below:
| | • | | Level 1 – inputs are quoted prices in active markets for identical securities (including equity securities, open-end investment companies, and futures contracts) |
| | • | | Level 2 – other significant observable inputs (including quoted prices for similar securities, interest rates, prepayment speeds, credit risk, etc.) |
| | • | | Level 3 – significant unobservable inputs (including the Series’ own assumptions in determining the fair value of investments) |
Securities held by the Series, including over-the-counter securities, are valued at the last quoted sale price of the day. International equity securities are subject to a fair value factor, as described later in this note. Securities held by the Series that are listed on Nasdaq are valued at the Nasdaq Official Closing Price (“NOCP”). If there is no last reported sale price or NOCP for the day, the Series value the securities within the range of the most recent quoted bid and ask prices. Price information on listed securities is taken from the exchange where the security is primarily traded. Generally, securities issued by open-end management investment companies are valued using their respective net asset values or public offering prices, as appropriate, for purchase orders placed at the close of the New York Stock Exchange (NYSE). These securities are generally categorized as Level 1 in the hierarchy.
Securities for which no market quotations are readily available (including restricted securities), or for which market quotations have become unreliable, are valued in good faith at fair value in accordance with procedures adopted by the Board of Trustees of the Trust. Fair value pricing may also be used if events that have a significant effect on the value of an investment (as determined in the discretion of Dimensional Fund Advisors LP) occur before the net asset value of the Series is calculated. When fair value pricing is used, the prices of securities used by the Series may differ from the quoted or published prices for the same securities on their primary markets or exchanges. These securities are generally categorized as Level 2 or Level 3 in the hierarchy.
232
The Series will also apply a fair value price in the circumstances described below. Generally, trading in foreign securities markets is completed each day at various times prior to the close of the NYSE. For example, trading in the Japanese securities markets is completed each day at the close of the Tokyo Stock Exchange (normally, 2:00 a.m. ET), which is fourteen hours before the close of the NYSE (normally, 4:00 p.m. ET) and the time that the net asset values of the Series are computed. Due to the time differences between the closings of the relevant foreign securities exchanges and the time the Series price their shares at the close of the NYSE, the Series will fair-value their foreign investments when it is determined that the market quotations for the foreign investments are either unreliable or not readily available. The fair value prices will attempt to reflect the impact of the U.S. financial markets’ perceptions and trading activities on the Series’ foreign investments since the last closing prices of the foreign investments were calculated on their primary foreign securities markets or exchanges. For these purposes, the Board of Trustees of the Series has determined that movements in relevant indices or other appropriate market indicators, after the close of the Tokyo Stock Exchange or the London Stock Exchange, demonstrate that market quotations may be unreliable. Fair valuation of portfolio securities may occur on a daily basis. The fair value pricing by the Series uses data furnished by an independent pricing service (and that data draws upon, among other information, the market values of foreign investments). When a Series uses fair value pricing, the values assigned to the Series’ foreign investments may not be the quoted or published prices of the investments on their primary markets or exchanges. These securities are generally categorized as Level 2 in the hierarchy.
Futures contracts held by the Series are valued using the settlement price established each day on the exchange on which they are traded. These valuations are generally categorized as Level 1 in the hierarchy.
Over-the-counter derivative contracts, which include forward currency contracts, do not require material subjectivity as pricing inputs are observed from quoted markets and are categorized as Level 2 in the hierarchy.
A summary of the inputs used to value the Series’ investments by each major security type, industry and/or country is disclosed previously in this note. Valuation hierarchy tables have been included at the end of the Summary Schedules of Portfolio Holdings. The methodology or inputs used for valuing securities are not necessarily an indication of the risk associated with investing in those securities.
2. Foreign Currency Translation: Securities and other assets and liabilities of the Series, whose values are initially expressed in foreign currencies are translated to U.S. dollars using the mean between the most recent bid and ask prices for the U.S. dollar as quoted by generally recognized reliable sources. To facilitate the translation, the Series enter into foreign currency contracts. A foreign currency contract is a spot agreement between two parties to buy and sell currencies at current market exchange rates, for settlement generally within two business days. Dividend and interest income and certain expenses are translated to U.S. dollars at the rate of exchange on their respective accrual dates. Receivables and payables denominated in foreign currencies are marked-to-market daily based on daily exchange rates and exchange gains or losses are realized upon ultimate receipt or disbursement.
The Series do not isolate the effect of foreign currency rate fluctuations when determining the realized gain or loss upon the sale or maturity of foreign currency-denominated debt obligations pursuant to U.S. Federal income tax regulations; such amounts are categorized as foreign exchange gain or loss for income tax reporting purposes.
Realized gains or losses on foreign currency transactions represent net foreign exchange gains or losses from the disposition of foreign currencies, currency gains or losses realized between the trade and settlement dates of securities transactions, and the difference between amounts of interest, dividends and any foreign withholding taxes recorded on the books of the Series and the U.S. dollar equivalent amounts actually received or paid.
3. Deferred Compensation Plan: Each eligible Trustee of the Trust may elect to participate in the Fee Deferral Plan for Independent Directors and Trustees (the “Plan”). Under the Plan, effective January 1, 2002, such Trustees may defer payment of all or a portion of their total fees earned as a Trustee. These deferred amounts may be treated as though such amounts had been invested in shares of the following funds: the U.S. Large Cap Value Portfolio, U.S. Core Equity 1 Portfolio, U.S. Large Company Portfolio, U.S. Vector Equity Portfolio, U.S. Micro Cap Portfolio, DFA International Value Portfolio, International Core Equity Portfolio, Emerging Markets Portfolio, Emerging Markets Core Equity Portfolio, DFA Inflation-Protected Securities Portfolio, and/or DFA Two-Year Global Fixed Income Portfolio. Contributions made under the Plan and the change in unrealized appreciation (depreciation) and income are included in Directors’/ Trustees’ Fees & Expenses.
233
The Trustees may receive their distributions of proceeds by one of the following methods: lump sum, annual installments over a period of agreed-upon years, or quarterly installments over a period of agreed-upon years. Each Trustee shall have the right in a notice of election (the “Notice”) to defer the receipt of the Trustee’s deferred compensation until a date specified by such Trustee in the Notice. The date may not be sooner than the earlier of: (i) the first business day of January following the year in which such Trustee ceases to be a member of the Board of Trustees of the Trust; and (ii) five years following the effective date of the Trustee’s first deferral election. If a Trustee who elects to defer fees fails to designate in the Notice a time or date as of which payment of the Trustee’s deferred fee account shall commence, payment of such amount shall commence as of the first business day of January following the year in which the Trustee ceases to be a member of the Board (unless the Trustee files an amended Notice selecting a different distribution date).
4. Other: Security transactions are accounted for as of the trade date. Costs used in determining realized gains and losses on the sale of investment securities and foreign currency are accounted for on the basis of identified cost. Dividend income and distributions to shareholders are recorded on the ex-dividend date. Distributions received on securities and that represent a return of capital or capital gains are recorded as a reduction of cost of investments or as a realized gain, respectively. The Series estimate the character of received distributions that may be considered return of capital distributions. Interest income is recorded on an accrual basis. Discount and premium on securities purchased are amortized over the lives of the respective securities, using the effective interest method. Expenses directly attributable to a Series are directly charged. Common expenses of the Trust or Series are allocated using methods approved by the Board of Trustees, generally based on average net assets.
The Series may be subject to taxes imposed by countries in which they invest with respect to their investments in issuers existing or operating in such countries. Such taxes are generally based on income earned or repatriated and capital gains realized on the sale of such investments. The Series accrue such taxes when the related income or capital gains are earned or throughout the holding period. Some countries require governmental approval for the repatriation of investment income, capital or the proceeds of sales earned by foreign investors. Additionally, if there is a deterioration in a country’s balance of payments or for other reasons, a country may impose temporary restrictions on foreign capital remittances abroad.
The Emerging Markets Series and The Emerging Markets Small Cap Series are subject to tax on short-term and long-term capital gains for investments in India. Such taxes are accrued on a daily basis and due upon sale of individual securities.
C. Investment Advisor:
The Advisor, Dimensional Fund Advisors LP, provides investment management services to the Series. For the year ended October 31, 2021, investment management fees were accrued daily and paid monthly to the Advisor based on the following effective annual rates of average daily net assets:
| | | | |
The DFA International Value Series | | | 0.20 | % |
The Japanese Small Company Series | | | 0.10 | % |
The Asia Pacific Small Company Series | | | 0.10 | % |
The United Kingdom Small Company Series | | | 0.10 | % |
The Continental Small Company Series | | | 0.10 | % |
The Canadian Small Company Series | | | 0.10 | % |
The Emerging Markets Series | | | 0.10 | % |
The Emerging Markets Small Cap Series | | | 0.20 | % |
234
Earned Income Credit:
Additionally, the Series have entered into arrangements with their custodian whereby net interest earned on uninvested cash balances was used to reduce a portion of the Series’ custody expenses. Custody expense in the accompanying financial statements is presented before reduction for credits. The impact of such credits is generally less than one basis point of each Series’ net assets. During the year ended October 31, 2021, expenses reduced were as follows (amounts in thousands):
| | | | |
| | | Fees Paid | |
| | | Indirectly | |
The DFA International Value Series | | $ | 70 | |
The Japanese Small Company Series | | | 3 | |
The Asia Pacific Small Company Series | | | 1 | |
The United Kingdom Small Company Series | | | 1 | |
The Continental Small Company Series | | | 8 | |
The Canadian Small Company Series | | | 2 | |
The Emerging Markets Series | | | 49 | |
The Emerging Markets Small Cap Series | | | 26 | |
Fees Paid to Officers and Directors/Trustees:
Certain Officers and Trustees of the Advisor are also Officers and Trustees of the Trust; however, such Officers and Trustees (with the exception of the Chief Compliance Officer (“CCO”)) receive no compensation from the Trust. For the year ended October 31, 2021, the total related amounts paid by the Trust to the CCO were $26 (in thousands). The total related amounts paid by each of the Series are included in Other Expenses on the Statements of Operations.
D. Deferred Compensation:
As of October 31, 2021, the total liability for deferred compensation to Trustees is included in Accrued Expenses and Other Liabilities on the Statements of Assets and Liabilities as follows (amounts in thousands):
| | | | |
The DFA International Value Series | | $ | 389 | |
The Japanese Small Company Series | | | 101 | |
The Asia Pacific Small Company Series | | | 52 | |
The United Kingdom Small Company Series | | | 62 | |
The Continental Small Company Series | | | 141 | |
The Canadian Small Company Series | | | 32 | |
The Emerging Markets Series | | | 176 | |
The Emerging Markets Small Cap Series | | | 150 | |
E. Purchases and Sales of Securities:
For the year ended October 31, 2021, the Series’ transactions related to investment securities, other than short-term securities, in-kind redemptions and U.S. Government securities (amounts in thousands), were as follows:
| | | | | | | | |
| | | Purchases | | | Sales | |
The DFA International Value Series | | $ | 1,057,912 | | | $ | 2,455,633 | |
The Japanese Small Company Series | | $ | 508,748 | | | $ | 350,428 | |
The Asia Pacific Small Company Series | | $ | 343,076 | | | $ | 514,881 | |
The United Kingdom Small Company Series | | $ | 217,918 | | | $ | 364,730 | |
The Continental Small Company Series | | $ | 966,589 | | | $ | 1,164,474 | |
The Canadian Small Company Series | | $ | 347,529 | | | $ | 402,802 | |
The Emerging Markets Series | | $ | 1,231,500 | | | $ | 1,751,073 | |
The Emerging Markets Small Cap Series | | $ | 846,765 | | | $ | 2,091,552 | |
235
There were no purchases or sales of long-term U.S. government securities.
For the year ended October 31, 2021, transactions related to Affiliated Investment Companies, excluding in-kind redemptions, are presented below.
The amounts presented below may differ from the respective amounts presented in the corresponding Summary Schedule of Portfolio Holdings, Statement of Assets and Liabilities or Statement of Operations due to rounding. The amounts are as follows (amounts in thousands):
| | | | | | | | | | | | | | | | | | | | | | | | | | | | | | | | | | | | |
| | | | | | | | | | | | | | | Change in | | | | | | | | | | | | | |
| | | | | | | | | | | | Net Realized | | | Unrealized | | | | | | | | | | | | | |
| | | Balance at | | | Purchases | | | Proceeds | | | Gain/(Loss) | | | Appreciation/ | | | Balance at | | | Shares as of | | | Dividend | | | Capital Gain | |
| | | October 31, 2020 | | | at Cost | | | from Sales | | | on Sales | | | Depreciation | | | October 31, 2021 | | | October 31, 2021 | | | Income | | | Distributions | |
The DFA International Value Series | | | | | | | | | | | | | | | | | | | | | | | | | | | | | | | | | | | | |
The DFA Short Term Investment Fund | | $ | 264,011 | | | $ | 5,234,731 | | | $ | 5,003,332 | | | $ | (27 | ) | | $ | (30 | ) | | $ | 495,353 | | | | 42,814 | | | $ | 372 | | | | — | |
| | | | | | | | | | | | | | | | | | | | | | | | | | | | | | | | | | | | |
Total | | $ | 264,011 | | | $ | 5,234,731 | | | $ | 5,003,332 | | | $ | (27 | ) | | $ | (30 | ) | | $ | 495,353 | | | | 42,814 | | | $ | 372 | | | | — | |
| | | | | | | | | | | | | | | | | | | | | | | | | | | | | | | | | | | | |
The Japanese Small Company Series | | | | | | | | | | | | | | | | | | | | | | | | | | | | | | | | | | | | |
The DFA Short Term Investment Fund | | $ | 57,849 | | | $ | 466,337 | | | $ | 462,694 | | | $ | 4 | | | $ | (6 | ) | | $ | 61,490 | | | | 5,315 | | | $ | 39 | | | | — | |
| | | | | | | | | | | | | | | | | | | | | | | | | | | | | | | | | | | | |
Total | | $ | 57,849 | | | $ | 466,337 | | | $ | 462,694 | | | $ | 4 | | | $ | (6 | ) | | $ | 61,490 | | | | 5,315 | | | $ | 39 | | | | — | |
| | | | | | | | | | | | | | | | | | | | | | | | | | | | | | | | | | | | |
The Asia Pacific Small Company Series | | | | | | | | | | | | | | | | | | | | | | | | | | | | | | | | | | | | |
The DFA Short Term Investment Fund | | $ | 42,048 | | | $ | 240,238 | | | $ | 241,675 | | | $ | (3 | ) | | $ | (1 | ) | | $ | 40,607 | | | | 3,510 | | | $ | 26 | | | | — | |
| | | | | | | | | | | | | | | | | | | | | | | | | | | | | | | | | | | | |
Total | | $ | 42,048 | | | $ | 240,238 | | | $ | 241,675 | | | $ | (3 | ) | | $ | (1 | ) | | $ | 40,607 | | | | 3,510 | | | $ | 26 | | | | — | |
| | | | | | | | | | | | | | | | | | | | | | | | | | | | | | | | | | | | |
The United Kingdom Small Company Series | | | | | | | | | | | | | | | | | | | | | | | | | | | | | | | | | | | | |
The DFA Short Term Investment Fund | | $ | 31,246 | | | $ | 119,684 | | | $ | 135,297 | | | $ | 1 | | | $ | (3 | ) | | $ | 15,631 | | | | 1,351 | | | $ | 17 | | | | — | |
| | | | | | | | | | | | | | | | | | | | | | | | | | | | | | | | | | | | |
Total | | $ | 31,246 | | | $ | 119,684 | | | $ | 135,297 | | | $ | 1 | | | $ | (3 | ) | | $ | 15,631 | | | | 1,351 | | | $ | 17 | | | | — | |
| | | | | | | | | | | | | | | | | | | | | | | | | | | | | | | | | | | | |
The Continental Small | | | | | | | | | | | | | | | | | | | | | | | | | | | | | | | | | | | | |
Company Series | | | | | | | | | | | | | | | | | | | | | | | | | | | | | | | | | | | | |
The DFA Short Term Investment Fund | | $ | 324,418 | | | $ | 1,169,762 | | | $ | 1,196,890 | | | $ | 2 | | | $ | (21 | ) | | $ | 297,271 | | | | 25,693 | | | $ | 188 | | | | — | |
| | | | | | | | | | | | | | | | | | | | | | | | | | | | | | | | | | | | |
Total | | $ | 324,418 | | | $ | 1,169,762 | | | $ | 1,196,890 | | | $ | 2 | | | $ | (21 | ) | | $ | 297,271 | | | | 25,693 | | | $ | 188 | | | | — | |
| | | | | | | | | | | | | | | | | | | | | | | | | | | | | | | | | | | | |
The Canadian Small Company Series | | | | | | | | | | | | | | | | | | | | | | | | | | | | | | | | | | | | |
The DFA Short Term Investment Fund | | $ | 146,332 | | | $ | 1,107,263 | | | $ | 977,163 | | | $ | (11 | ) | | $ | (6 | ) | | $ | 276,415 | | | | 23,891 | | | $ | 126 | | | | — | |
| | | | | | | | | | | | | | | | | | | | | | | | | | | | | | | | | | | | |
Total | | $ | 146,332 | | | $ | 1,107,263 | | | $ | 977,163 | | | $ | (11 | ) | | $ | (6 | ) | | $ | 276,415 | | | | 23,891 | | | $ | 126 | | | | — | |
| | | | | | | | | | | | | | | | | | | | | | | | | | | | | | | | | | | | |
236
| | | | | | | | | | | | | | | | | | | | | | | | | | | | | | | | | | | | |
| | | | | | | | | | | | | | | Change in | | | | | | | | | | | | | |
| | | | | | | | | | | | Net Realized | | | Unrealized | | | | | | | | | | | | | |
| | | Balance at | | | Purchases | | | Proceeds | | | Gain/(Loss) | | | Appreciation/ | | | Balance at | | | Shares as of | | | Dividend | | | Capital Gain | |
| | | October 31, 2020 | | | at Cost | | | from Sales | | | on Sales | | | Depreciation | | | October 31, 2021 | | | October 31, 2021 | | | Income | | | Distributions | |
The Emerging Markets Series | | | | | | | | | | | | | | | | | | | | | | | | | | | | | | | | | | | | |
The DFA Short Term Investment Fund | | $ | 86,837 | | | $ | 576,356 | | | $ | 555,298 | | | | — | | | $ | (10 | ) | | $ | 107,885 | | | | 9,325 | | | $ | 57 | | | | — | |
| | | | | | | | | | | | | | | | | | | | | | | | | | | | | | | | | | | | |
Total | | $ | 86,837 | | | $ | 576,356 | | | $ | 555,298 | | | | — | | | $ | (10 | ) | | $ | 107,885 | | | | 9,325 | | | $ | 57 | | | | — | |
| | | | | | | | | | | | | | | | | | | | | | | | | | | | | | | | | | | | |
The Emerging Markets Small Cap Series | | | | | | | | | | | | | | | | | | | | | | | | | | | | | | | | | | | | |
The DFA Short Term Investment Fund | | $ | 122,611 | | | $ | 544,541 | | | $ | 523,962 | | | $ | (4 | ) | | $ | (6 | ) | | $ | 143,180 | | | | 12,375 | | | $ | 90 | | | | — | |
| | | | | | | | | | | | | | | | | | | | | | | | | | | | | | | | | | | | |
Total | | $ | 122,611 | | | $ | 544,541 | | | $ | 523,962 | | | $ | (4 | ) | | $ | (6 | ) | | $ | 143,180 | | | | 12,375 | | | $ | 90 | | | | — | |
| | | | | | | | | | | | | | | | | | | | | | | | | | | | | | | | | | | | |
F. Federal Income Taxes:
No provision for federal income taxes is required since the Series are treated as partnerships for federal income tax purposes. Any net investment income and realized and unrealized gains and losses have been deemed to have been “passed down” to their respective partners.
As of October 31, 2021, the total cost and aggregate gross unrealized appreciation (depreciation) of securities for federal income tax purposes were different from amounts reported for financial reporting purposes, as follows (amounts in thousands):
| | | | | | | | | | | | | | | | |
| | | | | | | | | | | | Net | |
| | | | | | | | | | | | Unrealized | |
| | | Federal | | | Unrealized | | | Unrealized | | | Appreciation | |
| | | Tax Cost | | | Appreciation | | | (Depreciation) | | | (Depreciation) | |
The DFA International Value Series | | $ | 10,742,970 | | | $ | 2,741,089 | | | $ | (895,956 | ) | | $ | 1,845,133 | |
The Japanese Small Company Series | | | 3,036,953 | | | | 763,330 | | | | (350,827 | ) | | | 412,503 | |
The Asia Pacific Small Company Series | | | 1,685,638 | | | | 452,057 | | | | (277,883 | ) | | | 174,174 | |
The United Kingdom Small Company Series | | | 1,501,097 | | | | 609,599 | | | | (207,176 | ) | | | 402,423 | |
The Continental Small Company Series | | | 4,892,350 | | | | 2,378,869 | | | | (461,485 | ) | | | 1,917,384 | |
The Canadian Small Company Series | | | 1,375,270 | | | | 436,055 | | | | (86,829 | ) | | | 349,226 | |
The Emerging Markets Series | | | 3,848,753 | | | | 2,821,339 | | | | (269,763 | ) | | | 2,551,576 | |
The Emerging Markets Small Cap Series | | | 4,224,484 | | | | 1,705,745 | | | | (656,617 | ) | | | 1,049,128 | |
The difference between GAAP-basis and tax-basis unrealized gains (losses) is can occur as a result of wash sales and net mark to market gains (losses) on regulated futures contracts, net mark-to-market gain/loss on foreign currency contracts, and differences in the tax treatment of passive foreign investment company investments.
ASC 740 Accounting for Uncertainty in Income Taxes sets forth a minimum threshold for financial statement recognition of the benefit of a tax position taken or expected to be taken in a tax return. Management has analyzed the Series’ tax positions and has concluded that no additional provision for income tax is required in any Series’ financial statements. The Series are not aware of any tax positions for which it is more likely than not that the total amounts of unrecognized tax benefits will significantly change in the next twelve months. The Series’ federal tax returns for the prior three fiscal years remain subject to examination by the Internal Revenue Service.
237
G. Financial Instruments:
In accordance with the Series’ investment objectives and policies, the Series may invest in certain financial instruments that have off-balance sheet risk in excess of the amounts recognized in the financial statements and concentrations of credit and market risk. These instruments and their significant corresponding risks are described below:
1. Foreign Market Risks: Investments in foreign markets may involve certain considerations and risks not typically associated with investments in the United States of America, including the possibility of future political and economic developments and the level of foreign governmental supervision and regulation of foreign securities markets. These markets are generally smaller, less liquid and more volatile than the major securities markets in the United States of America. Consequently, acquisition and disposition of international securities held by the Series may be inhibited.
Series that have significant exposure to certain countries, such as The United Kingdom Small Company Series that concentrates investments in the United Kingdom, can be expected to be impacted by the political and economic conditions within such countries. For example, there is continuing uncertainty around the future of the euro and the European Union (EU) following the United Kingdom’s (UK) exit from the EU (referred to as “Brexit”). Brexit may cause greater market volatility and illiquidity, currency fluctuations, deterioration in economic activity, a decrease in business confidence, and increased likelihood of a recession in the UK. While it is not possible to determine the precise impact these events may have on the Series, during this period and beyond, the impact on the UK, EU countries, other countries or parties that transact with the UK and EU, and the broader global economy could be significant and could adversely affect the value and liquidity of the Series’ investments.
Derivative Financial Instruments:
Summarized below are the specific types of derivative instruments used by the Series.
2. Futures Contracts: The Series listed below may purchase or sell futures contracts and options on futures contracts for equity securities and indices to increase or decrease market exposure based on actual or expected cash inflows to or outflows from the Series. Upon entering into a futures contract, a Series deposits cash or pledges U.S. Government securities to a broker in an amount equal to the minimum “initial margin” requirements of the exchange on which the contract is traded. Subsequent payments are received from or paid to the broker each day, based on the daily fluctuation in the market value of the contract. These receipts or payments are known as “variation margin” and are recorded daily by the Series as unrealized gains or losses until the contracts are closed. When the contracts are closed, the Series records a realized gain or loss, which is presented in the Statements of Operations as a net realized gain or loss on futures, equal to the difference between the value of the contract at the time it was opened and the value at the time it was closed.
Risks may arise upon entrance into futures contracts from potential imperfect price correlations between the futures contracts and the underlying securities, from the possibility of an illiquid secondary market for these instruments and from the possibility that the Series could lose more than the initial margin requirements. Entering into stock index futures subjects the Series to equity price risk from those futures contracts. Counterparty credit risk related to exchange-traded futures is minimal because the exchange’s clearinghouse, as counterparty to all exchange-traded futures, guarantees the futures against default.
Securities have been segregated as collateral for open futures contracts.
The average volume (based on the open positions at each fiscal month-end) of derivative activity for the year ended October 31, 2021 was as follows (amounts in thousands):
| | | | |
| | | Futures* | |
The DFA International Value Series | | $ | 94,192 | |
The Canadian Small Company Series | | | 143 | |
The Emerging Markets Series | | | 66,202 | |
The Emerging Markets Small Cap Series | | $ | 36,430 | |
| * | Average Notional Value of futures contracts |
238
The following is a summary of the Series’ derivative instrument holdings categorized by primary risk exposure as of October 31, 2021 (amounts in thousands):
| | | | | | | | |
| | | Asset Derivatives Value | |
| | | Total Value | | | | |
| | | at | | | Equity | |
| | | October 31, 2021 | | | Contracts*,(1) | |
The DFA International Value Series | | $ | 3,015 | | | $ | 3,015 | |
The Emerging Markets Series | | | 392 | | | | 392 | |
The Emerging Markets Small Cap Series | | | 54 | | | | 54 | |
| | | | | | | | |
| | | Liability Derivatives Value | |
| | | Total Value | | | | |
| | | at | | | Equity | |
| | | October 31, 2021 | | | Contracts (2) | |
The Emerging Markets Series | | $ | (1,344 | ) | | $ | (1,344 | ) |
| (1) | Presented on Statements of Assets and Liabilities as Receivables or Payables: Futures Margin Variation. |
| (2) | Presented on Statements of Assets and Liabilities as Receivables or Payables: Futures Margin Variation. |
| * | Includes cumulative appreciation (depreciation) of futures contracts. Only current day’s margin variation is reported within the Statements of Assets and Liabilities. |
The following is a summary of the realized and change in unrealized gains and losses from the Series’ derivative instrument holdings categorized by primary risk exposure for the year ended October 31, 2021 (amounts in thousands):
| | | | | | | | |
| | | Realized Gain (Loss) on | |
| | | Derivatives | |
| | | | | | Equity | |
| | | Total | | | Contracts (1) | |
The DFA International Value Series | | $ | 29,155 | | | $ | 29,155 | |
The United Kingdom Small Company Series | | | (120 | ) | | | (120 | )* |
The Canadian Small Company Series | | | 42 | | | | 42 | * |
The Emerging Markets Series | | | 13,167 | | | | 13,167 | |
The Emerging Markets Small Cap Series | | | 5,812 | | | | 5,812 | |
| | | | | | | | |
| | | Change in Unrealized Appreciation | |
| | | (Depreciation) on Derivatives | |
| | | | | | Equity | |
| | | Total | | | Contracts (2) | |
The DFA International Value Series | | $ | 5,251 | | | $ | 5,251 | |
The Emerging Markets Series | | | (990 | ) | | | (990 | ) |
The Emerging Markets Small Cap Series | | | (191 | ) | | | (191 | ) |
| (1) | Presented on Statements of Operations as Net Realized Gain (Loss) on: Futures. |
| (2) | Presented on Statements of Operations as Change in Unrealized Appreciation (Depreciation) of: Futures. |
| * | As of October 31, 2021, there were no futures contracts outstanding. During the year ended October 31, 2021, the Series had limited activity in futures contracts. |
239
H. Line of Credit and Interfund Lending Program:
The Trust, together with other Dimensional-advised portfolios, has entered into a $500 million uncommitted, unsecured discretionary line of credit effective April 7, 2021, with its domestic custodian bank. A line of credit with similar terms was in effect through April 7, 2021. Each portfolio is permitted to borrow, subject to its investment limitations, up to a maximum of $500 million, as long as total borrowings under the line of credit do not exceed $500 million in the aggregate. Borrowings under the line of credit are charged interest at rates agreed upon by the parties at the time of borrowing. Each portfolio is individually, and not jointly, liable for its particular advances under the line of credit. There is no commitment fee on the unused portion of the line of credit. The agreement for the discretionary line of credit may be terminated by either party at any time. The agreement for the line of credit expires on April 6, 2022.
The Trust, together with other Dimensional-advised portfolios, has also entered into an additional $700 million unsecured line of credit with its international custodian bank effective January 2, 2021. A line of credit with similar terms was in effect through January 2, 2021. Each portfolio is permitted to borrow, subject to its investment limitations, up to a maximum of $500 million, as long as total borrowings under the line of credit do not exceed $700 million in the aggregate. Each portfolio is individually, and not jointly, liable for its particular advances under the line of credit. Borrowings under the line of credit are charged interest at rates agreed upon by the parties at the time of borrowing. There is no commitment fee on the unused portion of the line of credit. The agreement for the discretionary line of credit may be terminated by either party at any time. The line of credit agreement expires on January 1, 2022.
For the year ended October 31, 2021, borrowings by the following Series under the lines of credit were as follows (amounts in thousands, except percentages and days):
| | | | | | | | | | | | | | | | | | | | | | | | |
| | | Weighted | | | Weighted | | | Number of | | | Interest | | | Maximum Amount | | | Outstanding | |
| | | Average | | | Average | | | Days | | | Expense | | | Borrowed During | | | Borrowings | |
| | | Interest Rate | | | Loan Balance | | | Outstanding* | | | Incurred | | | the Period | | | as of 10/31/2021 | |
The DFA International Value Series | | | 0.84 | % | | $ | 9,260 | | | | 30 | | | $ | 7 | | | $ | 24,333 | | | $ | 11,495 | |
The Japanese Small Company Series | | | 0.84 | % | | | 6,222 | | | | 15 | | | | 2 | | | | 13,135 | | | | — | |
The Asia Pacific Small Company Series | | | 0.83 | % | | | 2,110 | | | | 53 | | | | 3 | | | | 30,520 | | | | — | |
The United Kingdom Small Company Series | | | 0.84 | % | | | 168 | | | | 8 | | | | — | | | | 578 | | | | — | |
The Continental Small Company Series | | | 0.83 | % | | | 44 | | | | 1 | | | | — | | | | 44 | | | | — | |
The Canadian Small Company Series | | | 0.83 | % | | | 1,329 | | | | 4 | | | | — | | | | 4,792 | | | | — | |
The Emerging Markets Series | | | 0.84 | % | | | 7,027 | | | | 13 | | | | 2 | | | | 16,724 | | | | — | |
The Emerging Markets Small Cap Series | | | 0.83 | % | | | 11,697 | | | | 24 | | | | 6 | | | | 38,728 | | | | 26,817 | |
| * | Number of Days Outstanding represents the total single or consecutive days during the year ended October 31, 2021, that each Series’ available line of credit was used. |
240
Pursuant to an exemptive order issued by the SEC (the “Order”), the Series may participate in an interfund lending program among certain portfolios managed by the Advisor (portfolios that operate as feeder funds do not participate in the program). The program allows the participating portfolios to borrow money from and loan money to each other for temporary or emergency purposes, subject to the conditions in the Order. A loan can only be made through the program if the interfund loan rate on that day is more favorable to both the borrowing and lending portfolios as compared to rates available through short-term bank loans or investments in overnight repurchase agreements and money market funds, respectively, as detailed in the Order. Further, a portfolio may participate in the program only if and to the extent that such participation is consistent with its investment objectives and limitations. Interfund loans have a maximum duration of seven days and may be called on one business day’s notice.
For the year ended October 31, 2021, activity by the Series under the interfund lending program was as follows (amounts in thousands, except percentages and days):
| | | | | | | | | | | | | | | | | | | | | | | | | | | | |
| | | | | | Weighted | | | Weighted | | | Number of | | | Interest | | | Maximum Amount | | | Outstanding | |
| | | Borrower or | | | Average | | | Average Loan | | | Days | | | Expense/ | | | Borrowed/Loaned | | | Borrowings | |
| | | Lender | | | Interest Rate | | | Balance | | | Outstanding* | | | Income | | | During the Period | | | as of 10/31/2021 | |
The DFA International Value Series | | | Borrower | | | | 0.44 | % | | $ | 58,886 | | | | 1 | | | $ | 1 | | | $ | 58,886 | | | | — | |
The Asia Pacific Small Company Series | | | Borrower | | | | 0.41 | % | | | 49,458 | | | | 2 | | | | 1 | | | | 53,238 | | | | — | |
| * | Number of Days Outstanding represents the total of single or consecutive days during the year ended October 31, 2021 that the Series’ utilized the interfund lending program. |
I. Affiliated Trades:
Cross trades for the year ended October 31, 2021, if any, were executed by the Series pursuant to procedures adopted by the Board of Trustees of the Trust to ensure compliance with Rule 17a-7 under the Investment Company Act of 1940 (the “1940 Act”). Cross trading is the buying or selling of portfolio securities between series of investment companies, or between a series of an investment company and another entity, that are or could be considered affiliates by virtue of a common investment advisor (or affiliated investment advisors), common Trustees and/or common Officers. At its regularly scheduled meetings, the CCO certifies to the Board that the 17a-7 transactions entered into by the Series complied with the Rule 17a-7 Procedures adopted by the Board of Trustees of the Trust.
For the year ended October 31, 2021, cross trades by the Series under Rule 17a-7 were as follows (amounts in thousands):
| | | | | | | | | | | | |
Series | | Purchases | | | Sales | | | Realized Gain (Loss) | |
The DFA International Value Series | | $ | 139,462 | | | $ | 107,328 | | | $ | 1,830 | |
The Japanese Small Company Series | | | 34,237 | | | | 17,480 | | | | 3,830 | |
The Asia Pacific Small Company Series | | | 6,846 | | | | 57,762 | | | | 28,154 | |
The United Kingdom Small Company Series | | | 30,321 | | | | 22,619 | | | | 5,186 | |
The Continental Small Company Series | | | 32,712 | | | | 81,693 | | | | 28,056 | |
The Canadian Small Company Series | | | 24,127 | | | | 76,420 | | | | 23,603 | |
The Emerging Markets Series | | | 15,292 | | | | 3,269 | | | | 413 | |
The Emerging Markets Small Cap Series | | | 1,244 | | | | 21,122 | | | | 7,251 | |
241
J. Securities Lending:
As of October 31, 2021, each Series had securities on loan to brokers/dealers, for which each such Series received cash collateral. The Series also received non-cash collateral consisting of short- and/or long-term U.S. Treasuries and U.S. government agency securities as follows (amounts in thousands):
| | | | |
| | | Non-Cash | |
| | | Collateral | |
| | | Market | |
| | | Value | |
The DFA International Value Series | | $ | 30,754 | |
The Japanese Small Company Series | | | 74,105 | |
The Asia Pacific Small Company Series | | | 113,646 | |
The Continental Small Company Series | | | 14,824 | |
The Canadian Small Company Series | | | 8,455 | |
The Emerging Markets Series | | | 176,351 | |
The Emerging Markets Small Cap Series | | | 554,856 | |
Each Series invests the cash collateral, as described below, and records a liability for the return of the collateral, during the period the securities are on loan. Loans of securities are expected at all times to be secured by collateral in an amount (i) equal to at least 100% of the current market value of the loaned securities with respect to securities of the U.S. government or its agencies, (ii) generally equal to 102% of the current market value of the loaned securities with respect to U.S. securities, and (iii) generally equal to 105% of the current market value of the loaned securities with respect to foreign securities. However, daily market fluctuations could cause the Series’ collateral to be lower or higher than the expected thresholds. If this were to occur, the collateral would be adjusted the next business day to ensure adequate collateralization. In the event of default or bankruptcy by the other party to the agreement, realization and/or retention of the collateral may be subject to legal proceedings. If the borrower fails to return loaned securities, cash collateral being maintained by the borrower is insufficient to cover the value of loaned securities, and such collateral insufficiency is not the result of investment losses, the lending agent has agreed to pay the amount of the shortfall to the Series or, at the option of the lending agent, to replace the securities. In the event of the bankruptcy of the borrower, the Series could experience delay in recovering the loaned securities or only recover cash or a security of equivalent value.
Subject to their stated investment policies, each Series will generally invest the cash collateral received for the loaned securities in The DFA Short Term Investment Fund (the “Money Market Series”), an affiliated registered money market fund advised by the Advisor for which the Advisor receives a management fee of 0.05% of the average daily net assets of the Money Market Series. Income received from the Money Market Series is netted with fees for securities lending and collateral investment expenses and with other payments to and from borrowers of securities. The Series also may invest the cash collateral received for the loaned securities in securities of the U.S. government or its agencies, repurchase agreements collateralized by securities of the U.S. government or its agencies, and affiliated or unaffiliated money market funds that are registered or unregistered. For purposes of this paragraph, agencies include both agency debentures and agency mortgage-backed securities. Additionally, each Series will be able to terminate the loan at any time and will receive reasonable interest on the loan, as well as amounts equal to any dividends, interest or, other distributions on the loaned securities. However, dividend income received from loaned securities may not be eligible for taxation at qualified dividend income rates.
242
The following table reflects a breakdown of transactions accounted for as secured borrowings, the gross obligation by the type of collateral pledged, and the remaining contractual maturity of those transactions as of October 31, 2021 (amounts in thousands):
| | | | | | | | | | | | | | | | | | | | |
| | | Remaining Contractual Maturity of the Agreements
As of October 31, 2021 | |
| | | Overnight and | | | | | | Between | | | | | | | |
| | | Continuous | | | <30 days | | | 30 & 90 days | | | >90 days | | | Total | |
Securities Lending Transactions | | | | | | | | | | | | | | | | | | | | |
The DFA International Value Series | | | | | | | | | | | | | | | | | | | | |
Common Stocks | | $ | 495,235 | | | | — | | | | — | | | | — | | | $ | 495,235 | |
The Japanese Small Company Series | | | | | | | | | | | | | | | | | | | | |
Common Stocks | | | 61,522 | | | | — | | | | — | | | | — | | | | 61,522 | |
The Asia Pacific Small Company Series | | | | | | | | | | | | | | | | | | | | |
Common Stocks | | | 40,608 | | | | — | | | | — | | | | — | | | | 40,608 | |
The United Kingdom Small Company Series | | | | | | | | | | | | | | | | | | | | |
Common Stocks | | | 15,631 | | | | — | | | | — | | | | — | | | | 15,631 | |
The Continental Small Company Series | | | | | | | | | | | | | | | | | | | | |
Common Stocks, Rights/Warrants | | | 297,321 | | | | — | | | | — | | | | — | | | | 297,321 | |
The Canadian Small Company Series | | | | | | | | | | | | | | | | | | | | |
Common Stocks, Rights/Warrants | | | 276,415 | | | | — | | | | — | | | | — | | | | 276,415 | |
The Emerging Markets Series | | | | | | | | | | | | | | | | | | | | |
Common Stocks | | | 107,898 | | | | — | | | | — | | | | — | | | | 107,898 | |
The Emerging Markets Small Cap Series | | | | | | | | | | | | | | | | | | | | |
Common Stocks | | | 143,144 | | | | — | | | | — | | | | — | | | | 143,144 | |
K. Indemnitees; Contractual Obligations:
Under the Trust’s organizational documents, its Officers and Trustees are indemnified against certain liabilities arising out of the performance of their duties to the Trust.
In the normal course of business, the Trust enters into contracts that contain a variety of representations and warranties that provide general indemnification. The Trust’s maximum exposure under these arrangements is unknown, as this would involve future claims that may be made against the Trust and/or its affiliates that have not yet occurred. However, based on experience, the Trust expects the risk of loss to be remote.
L. Recently Issued Accounting Standards and Regulations:
In March 2020, the Financial Accounting Standards Board (FASB) issued Accounting Standards Update (ASU) No. 2020-04, Reference Rate Reform (Topic 848) – Facilitation of the Effects of Reference Rate Reform on Financial Reporting. In January 2021, the FASB issued ASU No. 2021-01, with further amendments to Topic 848. The amendments in the ASUs provide optional temporary accounting recognition and financial reporting relief from the effect of certain types of contract modifications due to the planned discontinuation of the LIBOR and other interbank-offered based reference rates as of the end of 2021 and 2023. The ASUs are effective for certain reference rate-related contract modifications that occur during the period March 12, 2020 through December 31, 2022. Management has reviewed the requirements and believes the adoption of these ASUs will not have a material impact on the Series’ financial statements.
In October 2020, the SEC adopted new regulations governing the use of derivatives by registered investment companies. Rule 18f-4 (the “Derivatives Rule”) imposes limits on the amount of derivatives contracts the Series could enter, eliminate the asset segregation framework currently used by the Series to comply with Section 18 of the 1940 Act, and require funds whose use of derivatives is more than a limited specified exposure to establish and maintain a derivatives risk management program and appoint a derivatives risk manager. The Derivatives Rule became effective February 19, 2021 and the Series are required to comply on August 19, 2022. Management is currently evaluating the effect, if any, the Derivatives Rule will have on the Series.
243
On December 3, 2020, the SEC adopted new Rule 2a-5 (the “Valuation Rule”) under the Investment Company Act of 1940, establishing an updated regulatory framework for fund valuation. The Valuation Rule, in part, provides a framework for good faith fair value determination and permits a Board to designate fair value determinations to a fund’s investment adviser. Further, the SEC is rescinding previously issued guidance on related issues. The Valuation Rule became effective on March 8, 2021, with a compliance date of September 8, 2022. Management is currently evaluating the Valuation Rule and its effect on the Series.
M. Coronavirus (COVID-19) Pandemic:
The ongoing outbreak of the novel coronavirus, COVID-19, has resulted, at times, in market closures, market volatility, liquidity constraints and increased trading costs. Efforts to contain the spread of COVID-19 have resulted in global travel restrictions and disruptions of healthcare systems, business operations and supply chains, layoffs, reduced consumer demand, defaults and credit rating downgrades, and other significant economic impacts. The effects of COVID-19 have impacted global economic activity and may heighten pre-existing political, social and economic risks, domestically or globally. The full impact of the COVID-19 pandemic is unpredictable and may adversely affect a Series’ performance.
N. Other:
The Series and the Trust are subject to claims and suits that arise from time to time in the ordinary course of business (for example, ongoing claw back litigation against former shareholders of portfolio companies that filed for bankruptcy, such as The Tribune Company and Nine West). Although management currently believes that resolving claims against the Series and the Trust, individually or in aggregate, will not have a material adverse impact on the Series’ and the Trust’s financial position, results of operations, or cash flows, these matters are subject to inherent uncertainties and management’s view of these matters may change in the future.
On June 3, 2021, President Biden issued an Executive Order titled ”Addressing the Threat from Securities Investments that Finance Certain Companies of the People’s Republic of China” (the “Order”). Effective on August 2, 2021, the Order restricts investment in certain companies identified as “Chinese Military Industrial Complex Companies” (CMICs) by the Office of Foreign Asset Control, an agency of the Department of Treasury and the Department of Defense. As of July 27, 2021, the Series have divested of all publicly traded securities identified as CMIC’s listed in the Order.
O. Subsequent Event Evaluations:
Management has evaluated the impact of all subsequent events on the Series through the date on which the financial statements were issued and has determined that there are no subsequent events requiring recognition or disclosure in the financial statements.
244
Report of Independent Registered Public Accounting Firm
To the Board of Trustees of The DFA Investment Trust Company and Shareholders of The DFA International Value Series, The Japanese Small Company Series, The Asia Pacific Small Company Series, The United Kingdom Small Company Series, The Continental Small Company Series, The Canadian Small Company Series, The Emerging Markets Series and The Emerging Markets Small Cap Series
Opinions on the Financial Statements
We have audited the accompanying statements of assets and liabilities, including the summary schedules of portfolio holdings, of The DFA International Value Series, The Japanese Small Company Series, The Asia Pacific Small Company Series, The United Kingdom Small Company Series, The Continental Small Company Series, The Canadian Small Company Series, The Emerging Markets Series and The Emerging Markets Small Cap Series (eight of the series constituting The DFA Investment Trust Company, hereafter collectively referred to as the “Series”) as of October 31, 2021, the related statements of operations for the year ended October 31, 2021, the statements of changes in net assets for each of the two years in the period ended October 31, 2021, including the related notes, and the financial highlights for each of the five years in the period ended October 31, 2021 (collectively referred to as the “financial statements”). In our opinion, the financial statements present fairly, in all material respects, the financial position of each of the Series as of October 31, 2021, the results of each of their operations for the year then ended, the changes in each of their net assets for each of the two years in the period ended October 31, 2021, and each of the financial highlights for each of the five years in the period ended October 31, 2021 in conformity with accounting principles generally accepted in the United States of America.
Basis for Opinions
These financial statements are the responsibility of the Series’ management. Our responsibility is to express an opinion on the Series’ financial statements based on our audits. We are a public accounting firm registered with the Public Company Accounting Oversight Board (United States) (PCAOB) and are required to be independent with respect to the Series in accordance with the U.S. federal securities laws and the applicable rules and regulations of the Securities and Exchange Commission and the PCAOB.
We conducted our audits of these financial statements in accordance with the standards of the PCAOB. Those standards require that we plan and perform the audit to obtain reasonable assurance about whether the financial statements are free of material misstatement, whether due to error or fraud.
Our audits included performing procedures to assess the risks of material misstatement of the financial statements, whether due to error or fraud, and performing procedures that respond to those risks. Such procedures included examining, on a test basis, evidence regarding the amounts and disclosures in the financial statements. Our audits also included evaluating the accounting principles used and significant estimates made by management, as well as evaluating the overall presentation of the financial statements. Our procedures included confirmation of securities owned as of October 31, 2021 by correspondence with the custodian, brokers and transfer agent of the investee fund; when replies were not received from brokers, we performed other auditing procedures. We believe that our audits provide a reasonable basis for our opinions.
|
| /s/ PricewaterhouseCoopers LLP |
|
| Philadelphia, Pennsylvania |
| December 22, 2021 |
We have served as the auditor of one or more investment companies in Dimensional Fund Advisors L.P.
investment company group since 1981.
245
DIMENSIONAL EMERGING MARKETS VALUE FUND
PERFORMANCE CHARTS
(Unaudited)
| | |
| Dimensional Emerging Markets Value Fund vs. | | |
| MSCI Emerging Markets Index (net dividends) | | |
| October 31, 2011-October 31, 2021 | | |
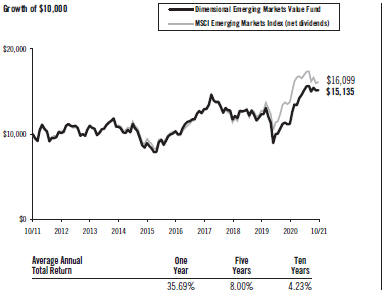
| | Past performance is not predictive of future performance. The returns shown do not reflect the deduction of taxes that a shareholder would pay on fund distributions or the redemption of fund shares. MSCI data © MSCI 2021, all rights reserved. |
246
MANAGEMENT’S DISCUSSION AND ANALYSIS
| | |
International Equity Market Review | | 12 Months Ended October 31, 2021 |
Performance of non-U.S. developed markets was positive for the period. As measured by the MSCI World ex USA indices, small-cap stocks outperformed large-cap stocks, and mid-cap stocks, a subset of the large-cap universe, underperformed large-cap stocks and small-cap stocks. Value stocks outperformed growth stocks as measured by the MSCI World ex USA indices.
12 Months Ended October 31, 2021
| | | | |
| | | Return in U.S. Dollars | |
MSCI World ex USA Index | | | 35.59 | % |
MSCI World ex USA Mid Cap Index | | | 31.20 | % |
MSCI World ex USA Small Cap Index | | | 37.19 | % |
MSCI World ex USA Value Index | | | 40.88 | % |
MSCI World ex USA Growth Index | | | 30.25 | % |
For the 12 Months Ended October 31, 2021, the U.S. dollar appreciated against some non-U.S. developed markets currencies and depreciated against others. Overall, currency movements did not have a material overall impact on the U.S. dollar-denominated returns of developed markets.
12 Months Ended October 31, 2021
| | | | | | | | |
Ten Largest Foreign Developed Markets by Market Cap | | Local Return | | | Return in U.S. Dollars | |
Japan | | | 30.75 | % | | | 19.88 | % |
United Kingdom | | | 35.57 | % | | | 43.72 | % |
Canada | | | 38.56 | % | | | 49.05 | % |
France | | | 48.30 | % | | | 47.33 | % |
Switzerland | | | 28.36 | % | | | 28.75 | % |
Germany | | | 33.47 | % | | | 32.60 | % |
Australia | | | 27.93 | % | | | 36.82 | % |
Netherlands | | | 60.71 | % | | | 59.67 | % |
Sweden | | | 40.26 | % | | | 45.36 | % |
Hong Kong | | | 18.26 | % | | | 17.91 | % |
Source: Returns are of MSCI standard indices net of foreign withholding taxes on dividends. Copyright MSCI 2021, all rights reserved.
Emerging markets had positive performance for the period but underperformed both U.S. and non-U.S. developed markets. As measured by the MSCI Emerging Markets indices, small-cap stocks outperformed large-cap stocks, and mid-cap stocks, a subset of the large-cap universe, outperformed large-cap stocks but underperformed small-cap stocks. Value stocks outperformed growth stocks as measured by the MSCI Emerging Markets indices.
247
12 Months Ended October 31, 2021
| | | | |
| | | Return in U.S. Dollars | |
MSCI Emerging Markets Index | | | 16.96 | % |
MSCI Emerging Markets Mid Cap Index | | | 31.20 | % |
MSCI Emerging Markets Small Cap Index | | | 44.29 | % |
MSCI Emerging Markets Value Index | | | 28.31 | % |
MSCI Emerging Markets Growth Index | | | 7.38 | % |
For the 12 Months Ended October 31, 2021, the U.S. dollar depreciated against some emerging markets currencies and appreciated against others. Overall, currency movements had a positive impact on the U.S. dollar denominated returns of emerging markets.
12 Months Ended October 31, 2021
| | | | | | | | |
Ten Largest Emerging Markets by Market Cap | | Local Return | | | Return in U.S. Dollars | |
China | | | -9.52 | % | | | -9.21 | % |
Taiwan | | | 38.36 | % | | | 42.32 | % |
Korea | | | 27.78 | % | | | 24.08 | % |
India | | | 51.78 | % | | | 50.21 | % |
Russia | | | 64.53 | % | | | 81.80 | % |
Brazil | | | 10.38 | % | | | 12.91 | % |
Saudi Arabia | | | 56.07 | % | | | 56.04 | % |
South Africa | | | 18.16 | % | | | 26.32 | % |
Mexico | | | 42.35 | % | | | 47.44 | % |
Thailand | | | 34.75 | % | | | 26.57 | % |
Source: Returns are of MSCI standard indices net of foreign withholding taxes on dividends. Copyright MSCI 2021, all rights reserved.
For Portfolios investing in non-U.S. equities traded outside of the U.S. market time zone, differences in the valuation timing and methodology between a Portfolio and its benchmark index may impact relative performance over the referenced period. The Portfolios price foreign exchange rates at the closing of the U.S. market, while their benchmark indices use rates at 4 p.m. London time. The Portfolios also may use fair value pricing to price certain portfolio securities at the closing of the U.S. market, while benchmark indices may use local market closing prices. For the one-year period ended October 31, 2021, these differences generally detracted from the Portfolios’ relative performance.
Dimensional Emerging Markets Value Fund
The Dimensional Emerging Markets Value Fund invests in value stocks of large and small companies in emerging markets. The investment strategy is process driven, emphasizing broad diversification with increased exposure to stocks with smaller market capitalizations, lower relative price (value), and higher-profitability within the value segment of emerging markets. As of October 31, 2021, the Fund held approximately 3,260 securities in 22 eligible emerging markets. Average cash exposure throughout the year was less than 1% of the Fund’s assets.
248
For the 12 months ended October 31, 2021, total returns were 35.69% for the Fund and 16.96% for the MSCI Emerging Markets Index (net dividends), the Fund’s benchmark. The Fund’s focus on low relative price (value) stocks contributed positively to performance relative to the style-neutral benchmark, as value stocks outperformed high relative price (growth) stocks in emerging markets for the period. With small-cap stocks outperforming large-cap stocks, the Fund’s inclusion of small-caps also contributed positively to performance relative to the benchmark, which is composed primarily of large-and mid-cap stocks.
249
DIMENSIONAL EMERGING MARKETS VALUE FUND
DISCLOSURE OF FUND EXPENSES
(Unaudited)
The following Expense Table is shown so that you can understand the impact of fees on your investment. All mutual funds have operating expenses. As a shareholder of the fund, you incur ongoing costs, which include costs for portfolio management, administrative services, and shareholder reports, among others. Operating expenses and legal and audit services, which are deducted from a fund’s gross income, directly reduce the investment return of the fund. A fund’s expenses are expressed as a percentage of its average net assets. This figure is known as the expense ratio. The following examples are intended to help you understand the ongoing costs, in dollars, of investing in the fund and to compare these costs with those of other mutual funds. The examples are based on an investment of $1,000 made at the beginning of the period shown and held for the entire period.
The Expense Table below illustrates your fund’s costs in two ways.
Actual Fund Return
This section helps you to estimate the actual expenses after fee waivers that you paid over the period. The “Ending Account Value” shown is derived from the fund’s actual return, and “Expenses Paid During Period” reflects the dollar amount that would have been paid by an investor who started with $1,000 in the fund. You may use the information here, together with the amount you invested, to estimate the expenses that you paid over the period.
To do so, simply divide your account value by $1,000 (for example, a $7,500 account value divided by $1,000 =7.5), then multiply the result by the number given for your fund under the heading “Expenses Paid During Period.”
Hypothetical Example for Comparison Purposes
This section is intended to help you compare your fund’s costs with those of other mutual funds. The hypothetical “Ending Account Value” and “Expenses Paid During Period” are derived from the fund’s actual expense ratio and an assumed 5% annual return before expenses. In this case, because the return used is not the fund’s actual return, the results do not apply to your investment. The example is useful in making comparisons because the SEC requires all mutual funds to calculate expenses based on a 5% annual return. You can assess your fund’s costs by comparing this hypothetical example with the hypothetical examples that appear in shareholder reports of other funds.
Please note that the expenses shown in the table are meant to highlight and help you compare ongoing costs only and do not reflect any transactional costs, if applicable. The “Annualized Expense Ratio” represents the actual expenses for the six-month period indicated.
250
DISCLOSURE OF FUND EXPENSES
CONTINUED
Six Months Ended October 31, 2021
EXPENSE TABLE
| | | | | | | | | | | | | | | | |
| | | Beginning | | | Ending | | | | | | Expenses | |
| | | Account | | | Account | | | Annualized | | | Paid | |
| | | Value | | | Value | | | Expense | | | During | |
| | | 05/01/21 | | | 10/31/21 | | | Ratio (1) | | | Period (1) | |
Dimensional Emerging Markets Value Fund | | | | | | | | | | | | | | | | |
Actual Fund Return | | | | | | | | | | | | | | | | |
Institutional Class Shares | | $ | 1,000.00 | | | $ | 1,001.30 | | | | 0.14 | % | | $ | 0.71 | |
Hypothetical 5% Annual Return | | | | | | | | | | | | | | | | |
Institutional Class Shares | | $ | 1,000.00 | | | $ | 1,024.50 | | | | 0.14 | % | | $ | 0.71 | |
| (1) | Expenses are equal to the fund’s annualized expense ratio for the six-month period, multiplied by the average account value over the period, multiplied by the number of days in the most recent six-month period (184), then divided by the number of days in the year (365) to reflect the six-month period. |
251
DIMENSIONAL EMERGING MARKETS VALUE FUND
DISCLOSURE OF PORTFOLIO HOLDINGS
(Unaudited)
The SEC requires that all funds file a complete Schedule of Investments with the SEC for their first and third fiscal quarters as an exhibit to their reports on Form N-PORT. For the Dimensional Emerging Markets Value Fund, this would be for the fiscal quarters ending January 31 and July 31. Such Form N-PORT filing must be made within 60 days of the end of the quarter. Dimensional Emerging Markets Value Fund filed its most recent Form N-PORT with the SEC on September 24, 2021. They are available upon request, without charge, by calling collect: (512) 306-7400; by mailing a request to Dimensional Fund Advisors LP, 6300 Bee Cave Road, Building One, Austin, TX 78746; by visiting the SEC’s website at http://www.sec.gov; or by visiting the SEC’s Public Reference Room in Washington, D.C. (call 1-800-732-0330 for information on the operation of the Public Reference Room).
SEC regulations permit a fund to include in its reports to shareholders a “Summary Schedule of Portfolio Holdings” in lieu of a full Schedule of Investments. The Summary Schedule of Portfolio Holdings reports the fund’s 50 largest holdings in unaffiliated issuers and any investments that exceed one percent of the fund’s net assets at the end of the reporting period. The regulations also require that the Summary Schedule of Portfolio Holdings identify each category of investments that are held.
A fund is required to file a complete Schedule of Investments with the SEC on Form N-CSR within ten days after mailing the annual and semi-annual reports to shareholders. It will be available upon request, without charge, by calling collect: (512) 306-7400; by mailing a request to Dimensional Fund Advisors LP, 6300 Bee Cave Road, Building One, Austin, TX 78746; or by visiting the SEC’s website at http://www.sec.gov.
PORTFOLIO HOLDINGS
The SEC requires that all funds present their categories of portfolio holdings in a table, chart, or graph format in their annual and semi-annual shareholder reports, whether or not a Schedule of Investments is used. The following table, which presents portfolio holdings as a percentage of total investments before short-term investments and collateral for loaned securities, is provided in compliance with this requirement. The categories shown below represent broad industry sectors. Each industry sector consists of one or more specific industry classifications.
| | | | |
| Dimensional Emerging Markets Value Fund | |
Communication Services | | | 3.2 | % |
Consumer Discretionary | | | 9.5 | % |
Consumer Staples | | | 3.0 | % |
Energy | | | 10.9 | % |
Financials | | | 27.4 | % |
Health Care | | | 2.5 | % |
Industrials | | | 8.9 | % |
Information Technology | | | 12.8 | % |
Materials | | | 14.8 | % |
Real Estate | | | 5.2 | % |
Utilities | | | 1.8 | % |
| | | | |
| | | 100.0 | % |
252
DIMENSIONAL EMERGING MARKETS VALUE FUND
SUMMARY SCHEDULE OF PORTFOLIO HOLDINGS
October 31, 2021
| | | | | | | | | | | | | | |
| | | | | Shares | | | Value» | | | Percentage
of Net Assets‡ | |
COMMON STOCKS — (97.8%) | | | | | | | | | | | | |
BRAZIL — (3.4%) | | | | | | | | | | | | |
| | Petroleo Brasileiro SA | | | 9,916,353 | | | $ | 48,617,153 | | | | 0.4 | % |
| | Petroleo Brasileiro SA, Sponsored ADR | | | 10,919,479 | | | | 104,936,193 | | | | 0.8 | % |
| | Petroleo Brasileiro SA, Sponsored ADR | | | 5,515,017 | | | | 54,157,467 | | | | 0.4 | % |
| | Vale SA | | | 10,579,377 | | | | 134,233,887 | | | | 1.0 | % |
| | Other Securities | | | | | | | 120,799,198 | | | | 0.8 | % |
| | | | | | | | | | | | | | |
TOTAL BRAZIL | | | | | | | 462,743,898 | | | | 3.4 | % |
| | | | | | | | | | | | | | |
CHILE — (0.5%) | | | | | | | | | | | | |
| | Other Securities | | | | | | | 70,623,150 | | | | 0.5 | % |
| | | | | | | | | | | | | | |
CHINA — (30.6%) | | | | | | | | | | | | |
* | | Alibaba Group Holding Ltd. | | | 7,316,900 | | | | 150,454,912 | | | | 1.1 | % |
* | | Baidu, Inc., Sponsored ADR | | | 883,875 | | | | 143,399,880 | | | | 1.1 | % |
| | Bank of China Ltd., Class H | | | 301,203,817 | | | | 106,596,497 | | | | 0.8 | % |
| | China Construction Bank Corp., Class H | | | 434,536,101 | | | | 295,736,876 | | | | 2.2 | % |
| | China Merchants Bank Co. Ltd., Class H | | | 14,808,500 | | | | 124,097,280 | | | | 0.9 | % |
| | China Overseas Land & Investment Ltd. | | | 22,666,000 | | | | 49,991,125 | | | | 0.4 | % |
| | China Resources Land Ltd. | | | 20,648,000 | | | | 80,227,147 | | | | 0.6 | % |
| | Geely Automobile Holdings Ltd. | | | 26,250,000 | | | | 91,104,288 | | | | 0.7 | % |
| | Industrial & Commercial Bank of China Ltd., Class H | | | 297,483,996 | | | | 163,069,444 | | | | 1.2 | % |
| | PetroChina Co. Ltd., Class H | | | 130,158,000 | | | | 62,755,344 | | | | 0.5 | % |
| | Ping An Insurance Group Co. of China Ltd., Class H | | | 20,578,500 | | | | 147,398,227 | | | | 1.1 | % |
* | | Trip.com Group Ltd., ADR | | | 1,765,245 | | | | 50,415,397 | | | | 0.4 | % |
| | Other Securities | | | | | | | 2,708,705,626 | | | | 20.0 | % |
| | | | | | | | | | | | | | |
TOTAL CHINA | | | | | | | 4,173,952,043 | | | | 31.0 | % |
| | | | | | | | | | | | | | |
COLOMBIA — (0.1%) | | | | | | | | | | | | |
| | Other Securities | | | | | | | 11,699,835 | | | | 0.1 | % |
| | | | | | | | | | | | | | |
CZECH REPUBLIC — (0.2%) | | | | | | | | | | | | |
| | Other Securities | | | | | | | 20,436,623 | | | | 0.1 | % |
| | | | | | | | | | | | | | |
GREECE — (0.2%) | | | | | | | | | | | | |
| | Other Securities | | | | | | | 33,803,657 | | | | 0.2 | % |
| | | | | | | | | | | | | | |
HONG KONG — (0.2%) | | | | | | | | | | | | |
| | Other Securities | | | | | | | 22,760,338 | | | | 0.2 | % |
| | | | | | | | | | | | | | |
HUNGARY — (0.3%) | | | | | | | | | | | | |
| | Other Securities | | | | | | | 33,993,976 | | | | 0.2 | % |
| | | | | | | | | | | | | | |
INDIA — (13.7%) | | | | | | | | | | | | |
* | | Axis Bank Ltd. | | | 6,005,724 | | | | 60,004,333 | | | | 0.5 | % |
| | Hindalco Industries Ltd. | | | 9,969,863 | | | | 61,983,738 | | | | 0.5 | % |
| | ICICI Bank Ltd., Sponsored ADR | | | 4,454,789 | | | | 94,218,784 | | | | 0.7 | % |
| | Larsen & Toubro Ltd. | | | 2,297,590 | | | | 54,714,019 | | | | 0.4 | % |
| | Mahindra & Mahindra Ltd. | | | 3,949,734 | | | | 46,836,219 | | | | 0.4 | % |
| | Reliance Industries Ltd. | | | 12,484,013 | | | | 424,273,319 | | | | 3.2 | % |
* | | Tata Motors Ltd. | | | 10,754,335 | | | | 69,290,039 | | | | 0.5 | % |
| | Wipro Ltd. | | | 6,193,725 | | | | 53,697,022 | | | | 0.4 | % |
253
DIMENSIONAL EMERGING MARKETS VALUE FUND
CONTINUED
| | | | | | | | | | | | | | |
| | | | | Shares | | | Value» | | | Percentage
of Net Assets‡ | |
INDIA — (Continued) | | | | | | | | | | | | |
| | Other Securities | | | | | | $ | 1,007,058,880 | | | | 7.3 | % |
| | | | | | | | | | | | | | |
TOTAL INDIA | | | | | | | 1,872,076,353 | | | | 13.9 | % |
| | | | | | | | | | | | | | |
INDONESIA — (1.5%) | | | | | | | | | | | | |
| | Other Securities | | | | | | | 209,741,386 | | | | 1.6 | % |
| | | | | | | | | | | | | | |
MALAYSIA — (1.8%) | | | | | | | | | | | | |
| | Other Securities | | | | | | | 250,499,529 | | | | 1.9 | % |
| | | | | | | | | | | | | | |
MEXICO — (2.2%) | | | | | | | | | | | | |
| | Grupo Financiero Banorte SAB de CV, Class O | | | 7,711,601 | | | | 48,746,251 | | | | 0.4 | % |
# | | Grupo Mexico SAB de CV, Class B | | | 10,518,496 | | | | 46,093,778 | | | | 0.3 | % |
| | Other Securities | | | | | | | 211,683,812 | | | | 1.6 | % |
| | | | | | | | | | | | | | |
TOTAL MEXICO | | | | | | | 306,523,841 | | | | 2.3 | % |
| | | | | | | | | | | | | | |
PHILIPPINES — (0.9%) | | | | | | | | | | | | |
| | Other Securities | | | | | | | 127,693,242 | | | | 0.9 | % |
| | | | | | | | | | | | | | |
POLAND — (0.8%) | | | | | | | | | | | | |
| | Other Securities | | | | | | | 115,707,174 | | | | 0.9 | % |
| | | | | | | | | | | | | | |
QATAR — (0.3%) | | | | | | | | | | | | |
| | Other Securities | | | | | | | 40,558,271 | | | | 0.3 | % |
| | | | | | | | | | | | | | |
RUSSIA — (1.8%) | | | | | | | | | | | | |
| | Gazprom PJSC, Sponsored ADR | | | 10,367,186 | | | | 101,731,786 | | | | 0.8 | % |
| | Lukoil PJSC, Sponsored ADR | | | 1,075,422 | | | | 109,618,672 | | | | 0.8 | % |
| | Other Securities | | | | | | | 29,314,846 | | | | 0.2 | % |
| | | | | | | | | | | | | | |
TOTAL RUSSIA | | | | | | | 240,665,304 | | | | 1.8 | % |
| | | | | | | | | | | | | | |
SAUDI ARABIA — (2.9%) | | | | | | | | | | | | |
| | Saudi Basic Industries Corp. | | | 2,016,628 | | | | 69,505,998 | | | | 0.5 | % |
| | Other Securities | | | | | | | 322,547,739 | | | | 2.4 | % |
| | | | | | | | | | | | | | |
TOTAL SAUDI ARABIA | | | | | | | 392,053,737 | | | | 2.9 | % |
| | | | | | | | | | | | | | |
SOUTH AFRICA — (3.9%) | | | | | | | | | | | | |
# | | Impala Platinum Holdings Ltd. | | | 3,660,330 | | | | 47,373,273 | | | | 0.4 | % |
* | | MTN Group Ltd. | | | 10,241,812 | | | | 91,839,637 | | | | 0.7 | % |
| | Standard Bank Group Ltd. | | | 5,188,666 | | | | 45,978,959 | | | | 0.4 | % |
| | Other Securities | | | | | | | 351,087,730 | | | | 2.5 | % |
| | | | | | | | | | | | | | |
TOTAL SOUTH AFRICA | | | | | | | 536,279,599 | | | | 4.0 | % |
| | | | | | | | | | | | | | |
SOUTH KOREA — (13.3%) | | | | | | | | | | | | |
| | Hana Financial Group, Inc. | | | 1,405,990 | | | | 54,214,720 | | | | 0.4 | % |
| | Hyundai Mobis Co. Ltd. | | | 210,611 | | | | 45,527,571 | | | | 0.4 | % |
| | Hyundai Motor Co. | | | 370,785 | | | | 66,316,913 | | | | 0.5 | % |
# | | KB Financial Group, Inc., ADR | | | 2,468,636 | | | | 118,667,332 | | | | 0.9 | % |
| | Kia Corp. | | | 939,529 | | | | 68,559,621 | | | | 0.5 | % |
| | LG Electronics, Inc. | | | 571,652 | | | | 59,139,613 | | | | 0.5 | % |
| | POSCO, Sponsored ADR | | | 903,713 | | | | 57,168,884 | | | | 0.4 | % |
| | Samsung Electronics Co. Ltd. | | | 1,978,003 | | | | 118,429,200 | | | | 0.9 | % |
| | SK Hynix, Inc. | | | 1,675,156 | | | | 147,665,948 | | | | 1.1 | % |
254
DIMENSIONAL EMERGING MARKETS VALUE FUND
CONTINUED
| | | | | | | | | | | | | | |
| | | | | Shares | | | Value» | | | Percentage
of Net Assets‡ | |
SOUTH KOREA — (Continued) | | | | | | | | | | | | |
| | Other Securities | | | | | | $ | 1,076,561,111 | | | | 7.9 | % |
| | | | | | | | | | | | | | |
TOTAL SOUTH KOREA | | | | | | | 1,812,250,913 | | | | 13.5 | % |
| | | | | | | | | | | | | | |
TAIWAN — (16.4%) | | | | | | | | | | | | |
# | | Asustek Computer, Inc. | | | 3,854,000 | | | | 48,999,039 | | | | 0.4 | % |
| | Cathay Financial Holding Co. Ltd. | | | 40,739,459 | | | | 84,921,085 | | | | 0.6 | % |
| | China Steel Corp. | | | 56,678,320 | | | | 68,334,569 | | | | 0.5 | % |
| | CTBC Financial Holding Co. Ltd. | | | 97,262,073 | | | | 81,219,569 | | | | 0.6 | % |
# | | Fubon Financial Holding Co. Ltd. | | | 33,386,173 | | | | 88,253,766 | | | | 0.7 | % |
| | Hon Hai Precision Industry Co. Ltd. | | | 41,463,192 | | | | 160,061,938 | | | | 1.2 | % |
# | | United Microelectronics Corp. | | | 51,490,681 | | | | 106,893,309 | | | | 0.8 | % |
| | Yuanta Financial Holding Co. Ltd. | | | 52,178,994 | | | | 46,381,015 | | | | 0.4 | % |
| | Other Securities | | | | | | | 1,550,689,307 | | | | 11.4 | % |
| | | | | | | | | | | | | | |
TOTAL TAIWAN | | | | | | | 2,235,753,597 | | | | 16.6 | % |
| | | | | | | | | | | | | | |
THAILAND — (1.9%) | | | | | | | | | | | | |
| | PTT PCL | | | 54,395,500 | | | | 63,112,386 | | | | 0.5 | % |
| | Other Securities | | | | | | | 189,042,273 | | | | 1.4 | % |
| | | | | | | | | | | | | | |
TOTAL THAILAND | | | | | | | 252,154,659 | | | | 1.9 | % |
| | | | | | | | | | | | | | |
TURKEY — (0.5%) | | | | | | | | | | | | |
| | Other Securities | | | | | | | 68,937,335 | | | | 0.5 | % |
| | | | | | | | | | | | | | |
UNITED ARAB EMIRATES — (0.4%) | | | | | | | | | | | | |
| | Other Securities | | | | | | | 51,284,572 | | | | 0.4 | % |
| | | | | | | | | | | | | | |
UNITED KINGDOM — (0.0%) | | | | | | | | | | | | |
| | Other Security | | | | | | | 365,499 | | | | 0.0 | % |
| | | | | | | | | | | | | | |
TOTAL COMMON STOCKS | | | | | | | 13,342,558,531 | | | | 99.1 | % |
| | | | | | | | | | | | | | |
PREFERRED STOCKS — (0.5%) | | | | | | | | | | | | |
BRAZIL — (0.5%) | | | | | | | | | | | | |
| | Petroleo Brasileiro SA | | | 3,992,173 | | | | 19,275,437 | | | | 0.2 | % |
| | Other Securities | | | | | | | 41,769,061 | | | | 0.3 | % |
| | | | | | | | | | | | | | |
TOTAL BRAZIL | | | | | | | 61,044,498 | | | | 0.5 | % |
| | | | | | | | | | | | | | |
COLOMBIA — (0.0%) | | | | | | | | | | | | |
| | Other Securities | | | | | | | 5,176,859 | | | | 0.0 | % |
| | | | | | | | | | | | | | |
PHILIPPINES — (0.0%) | | | | | | | | | | | | |
| | Other Security | | | | | | | 763,348 | | | | 0.0 | % |
| | | | | | | | | | | | | | |
SOUTH KOREA — (0.0%) | | | | | | | | | | | | |
| | Other Security | | | | | | | 622,023 | | | | 0.0 | % |
| | | | | | | | | | | | | | |
TOTAL PREFERRED STOCKS | | | | | | | 67,606,728 | | | | 0.5 | % |
| | | | | | | | | | | | | | |
RIGHTS/WARRANTS — (0.0%) | | | | | | | | | | | | |
TAIWAN — (0.0%) | | | | | | | | | | | | |
| | Other Securities | | | | | | | 13,477 | | | | 0.0 | % |
| | | | | | | | | | | | | | |
255
DIMENSIONAL EMERGING MARKETS VALUE FUND
CONTINUED
| | | | | | | | | | | | | | |
| | | | | Shares | | | Value» | | | Percentage
of Net Assets‡ | |
THAILAND — (0.0%) | | | | | | | | | | | | |
| | Other Securities | | | | | | $ | 1,659,369 | | | | 0.0 | % |
| | | | | | | | | | | | | | |
TOTAL RIGHTS/WARRANTS | | | | | | | 1,672,846 | | | | 0.0 | % |
| | | | | | | | | | | | | | |
TOTAL INVESTMENT SECURITIES
(Cost $10,418,045,683) | | | | | | | 13,411,838,105 | | | | | |
| | | | | | | | | | | | | | |
| | | | |
| | | | | | | | Value† | | | | |
SECURITIES LENDING COLLATERAL — (1.7%) | | | | | | | | | | | | |
@§ | | The DFA Short Term Investment Fund | | | 19,568,415 | | | | 226,406,566 | | | | 1.7 | % |
| | | | | | | | | | | | | | |
TOTAL INVESTMENTS—(100.0%)
(Cost $10,644,400,920) | | | | | | $ | 13,638,244,671 | | | | 101.3 | % |
| | | | | | | | | | | | | | |
As of October 31, 2021, Dimensional Emerging Markets Value Fund had entered into the following outstanding futures contracts:
| | | | | | | | | | | | | | | | | | | | |
Description | | Number of
Contracts | | | Expiration
Date | | | Notional
Value | | | Market
Value | | | Unrealized
Appreciation
(Depreciation) | |
Long Position Contracts: | | | | | | | | | | | | | | | | | | | | |
E-Mini MSCI Emerging Markets Index | | | 650 | | | | 12/17/21 | | | $ | 41,972,669 | | | $ | 41,015,000 | | | $ | (957,669 | ) |
S&P 500® Emini Index | | | 441 | | | | 12/17/21 | | | | 99,955,617 | | | | 101,363,850 | | | | 1,408,233 | |
| | | | | | | | | | | | | | | | | | | | |
Total Futures Contracts | | | | | | | | | | $ | 141,928,286 | | | $ | 142,378,850 | | | $ | 450,564 | |
| | | | | | | | | | | | | | | | | | | | |
Summary of the Fund’s investments as of October 31, 2021, based on their valuation inputs, is as follows (see Security Valuation Note):
| | | | | | | | | | | | | | | | |
| | | Investments in Securities (Market Value) | |
| | | Level 1 | | | Level 2 | | | Level 3 | | | Total | |
Common Stocks | | | | | | | | | | | | | | | | |
Brazil | | $ | 462,743,898 | | | | — | | | | — | | | $ | 462,743,898 | |
Chile | | | 6,785,587 | | | $ | 63,837,563 | | | | — | | | | 70,623,150 | |
China | | | 342,832,593 | | | | 3,793,625,614 | | | $ | 37,493,836 | | | | 4,173,952,043 | |
Colombia | | | 11,699,835 | | | | — | | | | — | | | | 11,699,835 | |
Czech Republic | | | — | | | | 20,436,623 | | | | — | | | | 20,436,623 | |
Greece | | | — | | | | 33,803,657 | | | | — | | | | 33,803,657 | |
Hong Kong | | | 5,675,428 | | | | 17,004,977 | | | | 79,933 | | | | 22,760,338 | |
Hungary | | | — | | | | 33,993,976 | | | | — | | | | 33,993,976 | |
India | | | 106,915,810 | | | | 1,765,125,436 | | | | 35,107 | | | | 1,872,076,353 | |
Indonesia | | | — | | | | 208,895,122 | | | | 846,264 | | | | 209,741,386 | |
Malaysia | | | — | | | | 250,498,909 | | | | 620 | | | | 250,499,529 | |
Mexico | | | 298,694,923 | | | | 7,828,918 | | | | — | | | | 306,523,841 | |
Philippines | | | — | | | | 127,678,949 | | | | 14,293 | | | | 127,693,242 | |
Poland | | | — | | | | 115,707,174 | | | | — | | | | 115,707,174 | |
Qatar | | | — | | | | 40,558,271 | | | | — | | | | 40,558,271 | |
Russia | | | 23,870,525 | | | | 216,794,779 | | | | — | | | | 240,665,304 | |
Saudi Arabia | | | — | | | | 392,053,737 | | | | — | | | | 392,053,737 | |
South Africa | | | 57,637,480 | | | | 478,642,119 | | | | — | | | | 536,279,599 | |
South Korea | | | 241,252,129 | | | | 1,570,035,853 | | | | 962,931 | | | | 1,812,250,913 | |
Taiwan | | | 27,564,991 | | | | 2,207,844,782 | | | | 343,824 | | | | 2,235,753,597 | |
Thailand | | | 252,154,659 | | | | — | | | | — | | | | 252,154,659 | |
Turkey | | | — | | | | 68,937,335 | | | | — | | | | 68,937,335 | |
256
DIMENSIONAL EMERGING MARKETS VALUE FUND
CONTINUED
| | | | | | | | | | | | | | | | |
| | | Investments in Securities (Market Value) | |
| | | Level 1 | | | Level 2 | | | Level 3 | | | Total | |
United Arab Emirates | | | — | | | $ | 51,284,572 | | | | — | | | $ | 51,284,572 | |
United Kingdom | | | — | | | | 365,499 | | | | — | | | | 365,499 | |
Preferred Stocks | | | | | | | | | | | | | | | | |
Brazil | | $ | 61,025,151 | | | | 19,347 | | | | — | | | | 61,044,498 | |
Colombia | | | 5,176,859 | | | | — | | | | — | | | | 5,176,859 | |
Philippines | | | — | | | | 763,348 | | | | — | | | | 763,348 | |
South Korea | | | — | | | | 622,023 | | | | — | | | | 622,023 | |
Rights/Warrants | | | | | | | | | | | | | | | | |
Taiwan | | | — | | | | 13,477 | | | | — | | | | 13,477 | |
Thailand | | | — | | | | 1,659,369 | | | | — | | | | 1,659,369 | |
Securities Lending Collateral | | | — | | | | 226,406,566 | | | | — | | | | 226,406,566 | |
Futures Contracts** | | | 450,564 | | | | — | | | | — | | | | 450,564 | |
| | | | | | | | | | | | | | | | |
TOTAL | | $ | 1,904,480,432 | | | $ | 11,694,437,995 | | | $ | 39,776,808 | ^ | | $ | 13,638,695,235 | |
| | | | | | | | | | | | | | | | |
| ** | Valued at the unrealized appreciation/(depreciation) on the investment. |
| ^ | A reconciliation of Level 3 investments is presented when the Fund had a significant amount of Level 3 investments at the beginning and/or end of the reporting period in relation to net assets. |
See accompanying Notes to Financial Statements.
257
DIMENSIONAL EMERGING MARKETS VALUE FUND
STATEMENT OF ASSETS AND LIABILITIES
OCTOBER 31, 2021
(Amounts in thousands)
| | | | |
| | | Dimensional
Emerging
Markets
Value Fund | |
ASSETS: | | | | |
Investment Securities at Value (including $662,761 of securities on loan)* | | $ | 13,411,838 | |
Collateral from Securities on Loan Invested in Affiliate at Value (including cost of $226,355) | | | 226,407 | |
Segregated Cash for Futures Contracts | | | 7,443 | |
Foreign Currencies at Value | | | 46,301 | |
Cash | | | 75,386 | |
Receivables: | | | | |
Investment Securities Sold | | | 27,645 | |
Dividends, Interest and Tax Reclaims | | | 10,195 | |
Securities Lending Income | | | 1,505 | |
Unrealized Gain on Foreign Currency Contracts | | | 3 | |
| | | | |
Total Assets | | | 13,806,723 | |
| | | | |
LIABILITIES: | | | | |
Payables: | | | | |
Upon Return of Securities Loaned | | | 226,403 | |
Investment Securities Purchased | | | 10,710 | |
Due to Advisor | | | 1,166 | |
Futures Margin Variation | | | 2,819 | |
Deferred Taxes Payable | | | 76,748 | |
Accrued Expenses and Other Liabilities | | | 19,172 | |
| | | | |
Total Liabilities | | | 337,018 | |
| | | | |
NET ASSETS | | $ | 13,469,705 | |
| | | | |
Investment Securities at Cost | | $ | 10,418,046 | |
| | | | |
Foreign Currencies at Cost | | $ | 45,724 | |
| | | | |
| * | See Note I in the Notes to Financial Statements for additional information about securities lending collateral. |
See accompanying Notes to Financial Statements.
258
DIMENSIONAL EMERGING MARKETS VALUE FUND
STATEMENT OF OPERATIONS
FOR THE YEAR ENDED OCTOBER 31, 2021
(Amounts in thousands)
| | | | |
| | | Dimensional
Emerging
Markets
Value Fund# | |
Investment Income | | | | |
Dividends (Net of Foreign Taxes Withheld of $61,245) | | $ | 485,227 | |
Income from Securities Lending | | | 14,542 | |
| | | | |
Total Investment Income | | | 499,769 | |
| | | | |
Expenses | | | | |
Investment Management Fees | | | 14,688 | |
Accounting & Transfer Agent Fees | | | 674 | |
Custodian Fees | | | 4,569 | |
Shareholders’ Reports | | | 37 | |
Directors’/Trustees’ Fees & Expenses | | | 165 | |
Professional Fees | | | 493 | |
Other | | | 752 | |
| | | | |
Total Expenses | | | 21,378 | |
| | | | |
Fees Paid Indirectly (Note C) | | | 65 | |
| | | | |
Net Expenses | | | 21,313 | |
| | | | |
Net Investment Income (Loss) | | | 478,456 | |
| | | | |
Realized and Unrealized Gain (Loss) | | | | |
Net Realized Gain (Loss) on: | | | | |
Investment Securities Sold** | | | 651,370 | |
Affiliated Investment Companies Shares Sold | | | (2 | ) |
Futures | | | 40,443 | |
Foreign Currency Transactions | | | (4,609 | ) |
Change in Unrealized Appreciation (Depreciation) of: | | | | |
Investment Securities and Foreign Currency | | | 3,305,387 | |
Affiliated Investment Companies Shares | | | (21 | ) |
Futures | | | 840 | |
Translation of Foreign Currency-Denominated Amounts | | | 12 | |
| | | | |
Net Realized and Unrealized Gain (Loss) | | | 3,993,420 | |
| | | | |
Net Increase (Decrease) in Net Assets Resulting from Operations | | $ | 4,471,876 | |
| | | | |
| ** | Net of foreign capital gain taxes withheld of $12,230. |
| # | Portion of income is from investment in affiliated fund. |
See accompanying Notes to Financial Statements.
259
DIMENSIONAL EMERGING MARKETS VALUE FUND
STATEMENTS OF CHANGES IN NET ASSETS
(Amounts in thousands)
| | | | | | | | |
| | | Dimensional Emerging
Markets Value Fund | |
| | | Year
Ended
Oct 31,
2021 | | | Year
Ended
Oct 31,
2020 | |
Increase (Decrease) in Net Assets | | | | | | | | |
Operations: | | | | | | | | |
Net Investment Income (Loss) | | $ | 478,456 | | | $ | 482,213 | |
Net Realized Gain (Loss) on: | | | | | | | | |
Investment Securities Sold*,** | | | 651,370 | | | | (1,060,455 | ) |
Affiliated Investment Companies Shares Sold | | | (2 | ) | | | — | |
Futures | | | 40,443 | | | | 32,312 | |
Foreign Currency Transactions | | | (4,609 | ) | | | (13,373 | ) |
Change in Unrealized Appreciation (Depreciation) of: | | | | | | | | |
Investment Securities and Foreign Currency | | | 3,305,387 | | | | (1,145,339 | ) |
Affiliated Investment Companies Shares | | | (21 | ) | | | 14 | |
Futures | | | 840 | | | | (3,697 | ) |
Translation of Foreign Currency-Denominated Amounts | | | 12 | | | | (40 | ) |
| | | | | | | | |
Net Increase (Decrease) in Net Assets Resulting from Operations | | | 4,471,876 | | | | (1,708,365 | ) |
| | | | | | | | |
Transactions in Interest: | | | | | | | | |
Contributions | | | 568,216 | | | | 916,139 | |
Withdrawals | | | (4,440,642 | ) | | | (3,763,616 | ) |
| | | | | | | | |
Net Increase (Decrease) from Transactions in Interest | | | (3,872,426 | ) | | | (2,847,477 | ) |
| | | | | | | | |
Total Increase (Decrease) in Net Assets | | | 599,450 | | | | (4,555,842 | ) |
Net Assets | | | | | | | | |
Beginning of Year | | | 12,870,255 | | | | 17,426,097 | |
| | | | | | | | |
End of Year | | $ | 13,469,705 | | | $ | 12,870,255 | |
| | | | | | | | |
| * | Net of foreign capital gain taxes withheld for the fiscal year ended October 31, 2021 of $12,230. |
| ** | Net of foreign capital gain taxes withheld for the fiscal year ended October 31, 2020 of $370. |
See accompanying Notes to Financial Statements.
260
DIMENSIONAL EMERGING MARKETS VALUE FUND
FINANCIAL HIGHLIGHTS
| | | | | | | | | | | | | | | | | | | | |
| | | Dimensional Emerging Markets Value Fund | |
| | | Year
Ended
Oct 31,
2021 | | | Year
Ended
Oct 31,
2020 | | | Year
Ended
Oct 31,
2019 | | | Year
Ended
Oct 31,
2018 | | | Year
Ended
Oct 31,
2017 | |
Total Return | | | 35.69 | % | | | (9.41 | %) | | | 5.24 | % | | | (9.06 | %) | | | 24.89 | % |
| | | | | | | | | | | | | | | | | | | | |
Net Assets, End of Year (thousands) | | $ | 13,469,705 | | | $ | 12,870,255 | | | $ | 17,426,097 | | | $ | 16,684,907 | | | $ | 19,612,211 | |
Ratio of Expenses to Average Net Assets | | | 0.14 | % | | | 0.14 | % | | | 0.13 | % | | | 0.14 | % | | | 0.16 | % |
Ratio of Expenses to Average Net Assets (Excluding Fees Paid Indirectly) | | | 0.14 | % | | | 0.14 | % | | | 0.15 | % | | | 0.14 | % | | | 0.16 | % |
Ratio of Net Investment Income to Average Net Assets | | | 3.26 | % | | | 3.25 | % | | | 2.95 | % | | | 2.78 | % | | | 2.64 | % |
Portfolio Turnover Rate | | | 14 | % | | | 20 | % | | | 14 | % | | | 13 | % | | | 14 | % |
See page 1-2 for the Definitions of Abbreviations and Footnotes.
See accompanying Notes to Financial Statements.
261
DIMENSIONAL EMERGING MARKETS VALUE FUND
NOTES TO FINANCIAL STATEMENTS
A. Organization:
Dimensional Emerging Markets Value Fund (the “Fund”) is an open-end management investment company registered under the Investment Company Act of 1940. The Fund meets the definition as an investment company and follows the accounting and reporting guidance under Financial Accounting Standards Board (“FASB”) Accounting Standards Certification (“ASC”) Topic 946, “Financial Services-Investment Companies.” The Fund consists of one series.
B. Significant Accounting Policies:
The following significant accounting policies are in conformity with accounting principles generally accepted in the United States of America. Such policies are consistently followed by the Fund in preparation of its financial statements. The preparation of financial statements in accordance with accounting principles generally accepted in the United States of America requires management to make estimates and assumptions that affect the fair value of investments, the reported amounts of assets and liabilities, the disclosure of contingent assets and liabilities at the date of the financial statements, and the reported amounts of increases and decreases in net assets from operations during the reporting period. Actual results could differ from those estimates, and those differences could be material.
1. Security Valuation: The Fund uses a fair value hierarchy, which prioritizes the inputs-to-valuation techniques used to measure fair value into three broad levels described below:
| | • | | Level 1 – inputs are quoted prices in active markets for identical securities (including equity securities, open-end investment companies, and futures contracts) |
| | • | | Level 2 – other significant observable inputs (including quoted prices for similar securities, interest rates, prepayment speeds, credit risk, etc.) |
| | • | | Level 3 – significant unobservable inputs (including the Fund’s own assumptions in determining the fair value of investments) |
Securities held by the Fund, including over-the-counter securities, are valued at the last quoted sale price of the day. International equity securities are subject to a fair value factor, as described later in this note.
Securities held by the Fund that are listed on Nasdaq are valued at the Nasdaq Official Closing Price (“NOCP”). If there is no last reported sale price or NOCP for the day, the Fund values the securities within the range of the most recent quoted bid and ask prices. Price information on listed securities is taken from the exchange where the security is primarily traded. Generally, securities issued by open-end management investment companies are valued using their respective net asset values or public offering prices, as appropriate, for purchase orders placed at the close of the New York Stock Exchange (NYSE). These securities are generally categorized as Level 1 in the hierarchy.
Securities for which no market quotations are readily available (including restricted securities), or for which market quotations have become unreliable, are valued in good faith at fair value in accordance with procedures adopted by the Board of Trustees of the Fund. Fair value pricing may also be used if events that have a significant effect on the value of an investment (as determined in the discretion of Dimensional Fund Advisors LP) occur before the net asset value of the Fund is calculated. When fair value pricing is used, the prices of securities used by the Fund may differ from the quoted or published prices for the same securities on their primary markets or exchanges. These securities are generally categorized as Level 2 or Level 3 in the hierarchy.
The Fund will also apply a fair value price in the circumstances described below. Generally, trading in foreign securities markets is completed each day at various times prior to the close of the NYSE. For example, trading in the Japanese securities markets is completed each day at the close of the Tokyo Stock Exchange (normally, 2:00 a.m. ET), which is fourteen hours before the close of the NYSE (normally, 4:00 p.m. ET) and the time at which the net asset value of the Fund is computed. Due to the time differences between the closings of the relevant foreign securities exchanges and the pricing of the Fund’s shares (at the close of the NYSE), the Fund will fair-value its foreign
262
investments when it is determined that the market quotations for the foreign investments are either unreliable or not readily available. The fair value prices will attempt to reflect the impact of the U.S. financial markets’ perceptions and trading activities on the Fund’s foreign investments since the last calculated closing prices of the foreign investments on their primary foreign securities markets or exchanges. For these purposes, the Board of Trustees of the Fund has determined that movements in relevant indices or other appropriate market indicators, after the close of the Tokyo Stock Exchange or the London Stock Exchange, demonstrate that market quotations may be unreliable. Fair valuation of portfolio securities may occur on a daily basis. The fair value pricing by the Fund uses data furnished by an independent pricing service (and that data draws upon, among other information, the market values of foreign investments). When the Fund uses fair value pricing, the values assigned to the Fund’s foreign investments may not be the quoted or published prices of the investments on their primary markets or exchanges. These securities are generally categorized as Level 2 in the hierarchy.
Futures contracts held by the Fund are valued using the settlement price established each day on the exchange on which they are traded. These valuations are generally categorized as Level 1 in the hierarchy.
A summary of the inputs used to value the Fund’s investments by each major security type, industry and/or country is disclosed previously in this note. A valuation hierarchy table has been included at the end of the Summary Schedule of Portfolio Holdings. The methodology or inputs used for valuing securities are not necessarily an indication of the risk associated with investing in those securities.
2. Foreign Currency Translation: Securities and other assets and liabilities of the Fund whose values are initially expressed in foreign currencies are translated to U.S. dollars using the mean between the most recent bid and ask prices for the U.S. dollar as quoted by generally recognized reliable sources. To facilitate the translation, the Fund enters into foreign currency contracts. A foreign currency contract is a spot agreement between two parties to buy and sell currencies at current market exchange rates, for settlement generally within two business days. Dividend and interest income and certain expenses are translated to U.S. dollars at the rate of exchange on their respective accrual dates. Receivables and payables denominated in foreign currencies are marked-to-market daily based on daily exchange rates and exchange gains or losses are realized upon ultimate receipt or disbursement. The Fund does not isolate the effect of foreign exchange rate fluctuations from the effect of fluctuations in the market prices of securities, whether realized or unrealized.
Realized gains or losses on foreign currency transactions represent net foreign exchange gains or losses from the disposition of foreign currencies, currency gains or losses realized between the trade and settlement dates of securities transactions, and the difference between amounts of interest, dividends and any foreign withholding taxes recorded on the books of the Fund and the U.S. dollar equivalent amounts actually received or paid.
3. Deferred Compensation Plan: Each eligible Trustee of the Fund may elect to participate in the Fee Deferral Plan for Independent Directors and Trustees (the “Plan”). Under the Plan, effective January 1, 2002, such Trustees may defer payment of all or a portion of their total fees earned as a Trustee. These deferred amounts may be treated as though such amounts had been invested in shares of the following funds: the U.S. Large Cap Value Portfolio, U.S. Core Equity 1 Portfolio, U.S. Large Company Portfolio, U.S. Vector Equity Portfolio, U.S. Micro Cap Portfolio, DFA International Value Portfolio, International Core Equity Portfolio, Emerging Markets Portfolio, Emerging Markets Core Equity Portfolio, DFA Inflation-Protected Securities Portfolio, and/or DFA Two-Year Global Fixed Income Portfolio. Contributions made under the Plan and the change in unrealized appreciation (depreciation) and income are included in Directors’/ Trustees’ Fees & Expenses. As of October 31, 2021, the total liability for deferred compensation to Trustees is included in Accrued Expenses and Other Liabilities on the Statement of Assets and Liabilities in the amount of $591 (in thousands).
The Trustees may receive their distributions of proceeds by one of the following methods: lump sum, annual installments over a period of agreed-upon years, or quarterly installments over a period of agreed-upon years. Each Trustee shall have the right in a notice of election (the “Notice”) to defer the receipt of the Trustee’s deferred compensation until a date specified by such Trustee in the Notice. The date may not be sooner than the earlier of: (i) the first business day of January following the year in which such Trustee ceases to be a member of the Board of Trustees of the Fund; and (ii) five years following the effective date of the Trustee’s first deferral election. If a Trustee who elects to defer fees fails to designate in the Notice a time or date as of which payment of the Trustee’s deferred fee account shall commence, payment of such amount shall commence as of the first business day of January following the year in which the Trustee ceases to be a member of the Board (unless the Trustee files an amended Notice selecting a different distribution date).
263
4. Other: Security transactions are accounted for as of the trade date. Costs used in determining realized gains and losses on the sale of investment securities and foreign currency are accounted for on the basis of identified cost. Dividend income and distributions to shareholders are recorded on the ex-dividend date. Distributions received on securities that represent a return of capital or capital gains are recorded as a reduction of cost of investments or as a realized gain, respectively. The Fund estimates the character of received distributions that may be considered return of capital distributions. Interest income is recorded on an accrual basis. Expenses directly attributable to the Fund are directly charged. The Fund may be subject to taxes imposed by countries in which it invests, with respect to its investments in issuers existing or operating in such countries. Such taxes are generally based on income earned or repatriated and capital gains realized on the sale of such investments. The Fund accrues such taxes when the related income or capital gains are earned or throughout the holding period. Some countries require governmental approval for the repatriation of investment income, capital or the proceeds of sales earned by foreign investors. Additionally, if there is a deterioration in a country’s balance of payments or for other reasons, a country may impose temporary restrictions on foreign capital remittances abroad.
The Fund’s investments in Chile are subject to governmental taxes on investment income. Such taxes are due when currencies are repatriated from the country. The Fund accrues for taxes on income as the income is earned. The Fund is subject to tax on short-term and long-term capital gains for investments in India. Such taxes are accrued on a daily basis and due upon sale of individual securities.
C. Investment Advisor:
The Advisor, Dimensional Fund Advisors LP, provides investment management services to the Fund.
For the year ended October 31, 2021, the Fund’s investment management fee was accrued daily and paid monthly to the Advisor based on the following effective annual rate of average daily net assets:
| | | | |
Dimensional Emerging Markets Value Fund | | | 0.10 | % |
Earned Income Credit:
Additionally, the Fund has entered into arrangements with its custodian whereby net interest earned on uninvested cash balances was used to reduce a portion of the Fund’s custody expense. Custody expense in the accompanying financial statements is presented before reduction for credits. The impact of such credits is generally less than one basis point of the Fund’s net assets. During the year ended October 31, 2021, expenses reduced were the following (amount in thousands):
| | | | |
| | | Fees Paid | |
| | | Indirectly | |
Dimensional Emerging Markets Value Fund | | $ | 65 | |
Fees Paid to Officers and Directors/Trustees:
Certain Officers and Trustees of the Advisor are also Officers and Trustees of the Fund; however, such Officers and Trustees (with the exception of the Chief Compliance Officer (“CCO”)) receive no compensation from the Fund. For the year ended October 31, 2021, the total related amounts paid by the Fund to the CCO were $5 (in thousands) and are included in Other Expenses on the Statement of Operations.
264
D. Purchases and Sales of Securities:
For the year ended October 31, 2021, the Fund’s transactions related to investment securities, other than short-term securities, in-kind redemptions and U.S. Government securities (amounts in thousands), were as follows:
| | | | | | | | |
| | | Purchases | | | Sales | |
Dimensional Emerging Markets Value Fund | | $ | 2,003,796 | | | $ | 5,334,734 | |
There were no purchases or sales of long-term U.S. government securities.
For the year ended October 31, 2021, transactions related to Affiliated Investment Companies, excluding in-kind redemptions, are presented below.
The amounts presented below may differ from the respective amounts presented in the corresponding Summary Schedule of Portfolio Holdings, Statement of Assets and Liabilities or Statement of Operations due to rounding. The amounts are as follows (amounts in thousands):
| | | | | | | | | | | | | | | | | | | | | | | | | | | | | | | | | | | | |
| | | | | | | | | | | | | | | Change in | | | | | | | | | | | | | |
| | | | | | | | | | | | Net Realized | | | Unrealized | | | | | | | | | | | | | |
| | | Balance at | | | Purchases | | | Proceeds | | | Gain/(Loss) | | | Appreciation/ | | | Balance at | | | Shares as of | | | Dividend | | | Capital Gain | |
| | | October 31, 2020 | | | at Cost | | | from Sales | | | on Sales | | | Depreciation | | | October 31, 2021 | | | October 31, 2021 | | | Income | | | Distributions | |
Dimensional Emerging Markets Value Fund | | | | | | | | | | | | | | | | | | | | | | | | | | | | | | | | | | | | |
The DFA Short Term Investment Fund | | $ | 229,226 | | | $ | 1,309,995 | | | $ | 1,312,791 | | | $ | (2 | ) | | $ | (21 | ) | | $ | 226,407 | | | | 19,568 | | | $ | 160 | | | | — | |
| | | | | | | | | | | | | | | | | | | | | | | | | | | | | | | | | | | | |
Total | | $ | 229,226 | | | $ | 1,309,995 | | | $ | 1,312,791 | | | $ | (2 | ) | | $ | (21 | ) | | $ | 226,407 | | | | 19,568 | | | $ | 160 | | | | — | |
| | | | | | | | | | | | | | | | | | | | | | | | | | | | | | | | | | | | |
E. Federal Income Taxes:
No provision for federal income taxes is required since the Fund is treated as a partnership for federal income tax purposes. Any net investment income and realized and unrealized gains and losses have been deemed to have been “passed down” to their respective partners.
As of October 31, 2021, the total cost and aggregate gross unrealized appreciation (depreciation) of securities for federal income tax purposes were different from amounts reported for financial reporting purposes, as follows (amounts in thousands):
| | | | | | | | | | | | | | | | |
| | | | | | | | | | | | Net | |
| | | | | | | | | | | | Unrealized | |
| | | Federal | | | Unrealized | | | Unrealized | | | Appreciation | |
| | | Tax Cost | | | Appreciation | | | (Depreciation) | | | (Depreciation) | |
Dimensional Emerging Markets Value Fund | | $ | 10,816,386 | | | $ | 4,113,515 | | | $ | (1,291,651 | ) | | $ | 2,821,864 | |
The difference between GAAP-basis and tax basis unrealized gains (losses) can occur as a result of wash sales and net mark-to-market gains (losses) on regulated futures contracts, net mark--to-market gains (losses) on foreign currency contracts, and differences in tax treatment of passive foreign investment company instruments.
ASC 740 Accounting for Uncertainty in Income Taxes sets forth a minimum threshold for financial statement recognition of the benefit of a tax position taken or expected to be taken in a tax return. Management has analyzed the Fund’s tax positions and has concluded that no additional provision for income tax is required in the Fund’s financial statements. The Fund is not aware of any tax positions for which it is more likely than not that the total amounts of unrecognized tax benefits will significantly change in the next twelve months. The Fund’s federal tax returns for the prior three fiscal years remain subject to examination by the Internal Revenue Service.
265
F. Financial Instruments:
In accordance with the Fund’s investment objective and policies, the Fund may invest in certain financial instruments that have off-balance sheet risk in excess of the amounts recognized in the financial statements and concentrations of credit and market risk. These instruments and their significant corresponding risks are described below:
1. Foreign Market Risks: Investments in foreign markets may involve certain considerations and risks not typically associated with investments in the United States of America, including the possibility of future political and economic developments and the level of foreign governmental supervision and regulation of foreign securities markets. These markets are generally smaller, less liquid and more volatile than the major securities markets in the United States of America. Consequently, acquisition and disposition of securities held by the Fund may be inhibited.
Derivative Financial Instruments:
Summarized below are the specific types of derivative instruments used by the Fund.
2. Futures Contracts: The Fund may purchase or sell futures contracts and options on futures contracts for foreign or U.S. equity securities and indices, to increase or decrease market exposure based on actual or expected cash inflows to or outflows from the Fund. Upon entering into a futures contract, the Fund deposits cash or pledges U.S. government securities to a broker in an amount equal to the minimum “initial margin” requirements of the exchange on which the contract is traded. Subsequent payments are received from or paid to the broker each day, based on the daily fluctuation in the market value of the contract. These receipts or payments are known as “variation margin” and are recorded daily by the Fund as unrealized gains or losses until the contracts are closed. When the contracts are closed, the Fund records a realized gain or loss, which is presented in the Statement of Operations as a net realized gain or loss on futures, equal to the difference between the value of the contract at the time it was opened and the value at the time it was closed.
Risks may arise upon entrance into futures contracts from potential imperfect price correlations between the futures contracts and the underlying securities or indices, from the possibility of an illiquid secondary market for these instruments and from the possibility that the Fund could lose more than the initial margin requirements. Entering into stock index futures subjects the Fund to equity price risk from those futures contracts. Counterparty credit risk related to exchange-traded futures is minimal because the exchange’s clearinghouse, as counterparty to all exchange-traded futures, guarantees the futures against default.
Securities have been segregated as collateral for open futures contracts.
The average volume (based on the open positions at each fiscal month-end) of derivative activity for the year ended October 31, 2021 was as follows (amount in thousands):
| | | | |
| | | Futures* | |
Dimensional Emerging Markets Value Fund | | $ | 92,928 | |
| * | Average Notional Value of futures contracts |
The following is a summary of the Fund’s derivative instrument holdings categorized by primary risk exposure as of October 31, 2021 (amounts in thousands):
| | | | | | | | |
| | | Asset Derivatives Value | |
| | | Total Value | | | | |
| | | at | | | Equity | |
| | | October 31, 2021 | | | Contracts*,(1) | |
Dimensional Emerging Markets Value Fund | | $ | 1,408 | | | $ | 1,408 | |
266
| | | | | | | | |
| | | Liability Derivatives Value | |
| | | Total Value | | | | |
| | | at | | | Equity | |
| | | October 31, 2021 | | | Contracts (2) | |
Dimensional Emerging Markets Value Fund | | $ | (958 | ) | | $ | (958 | ) |
| (1) | Presented on Statement of Assets and Liabilities as Receivables or Payables: Futures Margin Variation. |
| (2) | Presented on Statement of Assets and Liabilities as Receivables or Payables: Futures Margin Variation. |
| * | Includes cumulative appreciation (depreciation) of futures contracts. Only current day’s margin variation is reported within the Statement of Assets and Liabilities. |
The following is a summary of the realized and change in unrealized gains and losses from the Fund’s derivative instrument holdings categorized by primary risk exposure for the year ended October 31, 2021 (amounts in thousands):
| | | | | | | | |
| | | Realized Gain (Loss) on
Derivatives | |
| | | | | | Equity | |
| | | Total | | | Contracts (1) | |
Dimensional Emerging Markets Value Fund | | $ | 40,443 | | | $ | 40,443 | |
| | | | | | | | |
| | | Change in Unrealized Appreciation | |
| | | (Depreciation) on Derivatives | |
| | | | | | Equity | |
| | | Total | | | Contracts (2) | |
Dimensional Emerging Markets Value Fund | | $ | 840 | | | $ | 840 | |
| (1) | Presented on Statement of Operations as Net Realized Gain (Loss) on: Futures. |
| (2) | Presented on Statement of Operations as Change in Unrealized Appreciation (Depreciation) of: Futures. |
G. Line of Credit and Interfund Lending Program:
The Fund, together with other Dimensional-advised portfolios, has entered into a $500 million uncommitted, unsecured discretionary line of credit effective April 7, 2021, with its domestic custodian bank. A line of credit with similar terms was in effect through April 7, 2021. Each portfolio is permitted to borrow, subject to its investment limitations, up to a maximum of $500 million, as long as total borrowings under the line of credit do not exceed $500 million in the aggregate. Borrowings under the line of credit are charged interest at rates agreed upon by the parties at the time of borrowing. Each portfolio is individually, and not jointly, liable for its particular advances under the line of credit. There is no commitment fee on the unused portion of the line of credit. The agreement for the discretionary line of credit may be terminated by either party at any time. The agreement for the line of credit expires on April 6, 2022.
The Fund, together with other Dimensional-advised portfolios, has also entered into an additional $700 million unsecured line of credit with its international custodian bank effective January 2, 2021. A line of credit with similar terms was in effect through January 2, 2021. Each portfolio is permitted to borrow, subject to its investment limitations, up to a maximum of $500 million, as long as total borrowings under the line of credit do not exceed $700 million in the aggregate. Each portfolio is individually, and not jointly, liable for its particular advances under the line of credit. Borrowings under the line of credit are charged interest at rates agreed upon by the parties at the time of borrowing. There is no commitment fee on the unused portion of the line of credit. The agreement for the discretionary line of credit may be terminated by either party at any time. The line of credit agreement expires on January 1, 2022.
267
For the year ended October 31, 2021, borrowings by the Fund under the lines of credit were as follows (amounts in thousands, except percentages and days):
| | | | | | | | | | | | | | | | | | | | | | | | |
| | | Weighted
Average
Interest Rate | | | Weighted
Average
Loan Balance | | | Number of
Days
Outstanding* | | | Interest
Expense
Incurred | | | Maximum Amount
Borrowed During
the Period | | | Outstanding
Borrowings
as of 10/31/2021 | |
Dimensional Emerging Markets Value Fund | | | 0.83 | % | | $ | 13,109 | | | | 23 | | | $ | 10 | | | $ | 36,558 | | | | — | |
| * | Number of Days Outstanding represents the total of single or consecutive days during the year ended October 31, 2021, that the Fund’s available line of credit was used. |
Pursuant to an exemptive order issued by the SEC (the “Order”), the Fund may participate in an interfund lending program among certain portfolios managed by the Advisor (portfolios that operate as feeder funds do not participate in the program). The program allows the participating portfolios to borrow money from and loan money to each other for temporary or emergency purposes, subject to the conditions in the Order. A loan can only be made through the program if the interfund loan rate on that day is more favorable to both the borrowing and lending portfolios as compared to rates available through short-term bank loans or investments in overnight repurchase agreements and money market funds, respectively, as detailed in the Order. Further, a portfolio may participate in the program only if and to the extent that such participation is consistent with its investment objectives and limitations. Interfund loans have a maximum duration of seven days and may be called on one business day’s notice.
For the year ended October 31, 2021, activity by the Fund under the interfund lending program was as follows (amounts in thousands, except percentages and days):
| | | | | | | | | | | | | | | | | | | | | | | | | | | | |
| | | Borrower or
Lender | | | Weighted
Average
Interest Rate | | | Weighted
Average Loan
Balance | | | Number of
Days
Outstanding* | | | Interest
Expense/
Income | | | Maximum Amount
Borrowed/Loaned
During the Period | | | Outstanding
Borrowings
as of 10/31/2021 | |
Dimensional Emerging Markets Value Fund | | | Borrower | | | | 0.43 | % | | $ | 77,031 | | | | 4 | | | $ | 4 | | | $ | 93,288 | | | | — | |
| * | Number of Days Outstanding represents the total of single or consecutive days during the year ended October 31, 2021 that the Fund utilized the interfund lending program. |
H. Affiliated Trades:
Cross trades for the year ended October 31, 2021, if any, were executed by the Fund pursuant to procedures adopted by the Board of Trustees of the Fund to ensure compliance with Rule 17a-7 under the Investment Company Act of 1940 (the “1940 Act”). Cross trading is the buying or selling of portfolio securities between series of investment companies, or between a series of an investment company and another entity, that are or could be considered affiliates by virtue of a common investment advisor (or affiliated investment advisors), common Trustees and/or common Officers. At its regularly scheduled meetings, the CCO certifies to the Board that the 17a-7 transactions entered into by the Fund complied with the Rule 17a-7 Procedures adopted by the Board of Trustees of the Fund.
For the year ended October 31, 2021, cross trades by the Fund under Rule 17a-7 were as follows (amounts in thousands):
| | | | | | | | | | | | |
Portfolio | | Purchases | | | Sales | | | Realized Gain (Loss) | |
Dimensional Emerging Markets Value Fund | | $ | 2,162 | | | $ | 1,166 | | | $ | (355 | ) |
268
I. Securities Lending:
As of October 31, 2021, the Fund had securities on loan to brokers/dealers, for which the Fund received cash collateral. The Fund also received non-cash collateral consisting of short- and/or long-term U.S. Treasuries and U.S. government agency securities as follows (amount in thousands):
| | | | |
| | | Non-Cash
Collateral
Market
Value | |
Dimensional Emerging Markets Value Fund | | $ | 603,359 | |
The Fund invests the cash collateral, as described below, and records a liability for the return of the collateral, during the period the securities are on loan. Loans of securities are expected at all times to be secured by collateral in an amount (i) equal to at least 100% of the current market value of the loaned securities with respect to securities of the U.S. government or its agencies, (ii) generally equal to 102% of the current market value of the loaned securities with respect to U.S. securities, and (iii) generally equal to 105% of the current market value of the loaned securities with respect to foreign securities. However, daily market fluctuations could cause the Fund’s collateral to be lower or higher than the expected thresholds. If this were to occur, the collateral would be adjusted the next business day to ensure adequate collateralization. In the event of default or bankruptcy by the other party to the agreement, realization and/or retention of the collateral may be subject to legal proceedings. If the borrower fails to return loaned securities, cash collateral being maintained by the borrower is insufficient to cover the value of loaned securities, and such collateral insufficiency is not the result of investment losses, the lending agent has agreed to pay the amount of the shortfall to the Fund or, at the option of the lending agent, to replace the securities. In the event of the bankruptcy of the borrower, the Fund could experience delay in recovering the loaned securities or only recover cash or a security of equivalent value.
Subject to its stated investment policies, the Fund will generally invest the cash collateral received for the loaned securities in The DFA Short Term Investment Fund (the “Money Market Series”), an affiliated registered money market fund advised by the Advisor for which the Advisor receives a management fee of 0.05% of the average daily net assets of the Money Market Series. Income received from the Money Market Series is netted with fees for securities lending and collateral investment expenses and with other payments to and from borrowers of securities. The Fund also may invest the cash collateral received for the loaned securities in securities of the U.S. government or its agencies, repurchase agreements collateralized by securities of the U.S. government or its agencies, and affiliated or unaffiliated money market funds that are registered or unregistered. For purposes of this paragraph, agencies include both agency debentures and agency mortgage-backed securities. Additionally, the Fund will be able to terminate the loan at any time and will receive reasonable interest on the loan, as well as amounts equal to any dividends, interest or, other distributions on the loaned securities. However, dividend income received from loaned securities may not be eligible for taxation at qualified dividend income rates.
The following table reflects a breakdown of transactions accounted for as secured borrowings, the gross obligation by the type of collateral pledged, and the remaining contractual maturity of those transactions as of October 31, 2021 (amounts in thousands):
| | | | | | | | | | | | | | | | | | | | |
| | | Remaining Contractual Maturity of the Agreements
As of October 31, 2021 | |
| | | Overnight and
Continuous | | | <30 days | | | Between
30 & 90 days | | | >90 days | | | Total | |
Securities Lending Transactions | | | | | | | | | | | | | | | | | | | | |
Dimensional Emerging Markets Value Fund | | | | | | | | | | | | | | | | | | | | |
Common Stocks | | $ | 226,403 | | | | — | | | | — | | | | — | | | $ | 226,403 | |
269
J. Indemnitees; Contractual Obligations:
Under the Fund’s organizational documents, its Officers and Trustees are indemnified against certain liabilities arising out of the performance of their duties to the Fund.
In the normal course of business, the Fund enters into contracts that contain a variety of representations and warranties that provide general indemnification. The Fund’s maximum exposure under these arrangements is unknown, as this would involve future claims that may be made against the Fund and/or its affiliates that have not yet occurred. However, based on experience, the Fund expects the risk of loss to be remote.
K. Recently Issued Accounting Standards and Regulations:
In March 2020, the Financial Accounting Standards Board (FASB) issued Accounting Standards Update (ASU) No. 2020-04, Reference Rate Reform (Topic 848) – Facilitation of the Effects of Reference Rate Reform on Financial Reporting. In January 2021, the FASB issued ASU No. 2021-01, with further amendments to Topic 848. The amendments in the ASUs provide optional temporary accounting recognition and financial reporting relief from the effect of certain types of contract modifications due to the planned discontinuation of the LIBOR and other interbank-offered based reference rates as of the end of 2021 and 2023. The ASUs are effective for certain reference rate-related contract modifications that occur during the period March 12, 2020 through December 31, 2022. Management has reviewed the requirements and believes the adoption of these ASUs will not have a material impact on the Fund’s financial statements.
In October 2020, the SEC adopted new regulations governing the use of derivatives by registered investment companies. Rule 18f-4 (the “Derivatives Rule”) imposes limits on the amount of derivatives contracts the Fund could enter, eliminate the asset segregation framework currently used by the Fund to comply with Section 18 of the 1940 Act, and require funds whose use of derivatives is more than a limited specified exposure to establish and maintain a derivatives risk management program and appoint a derivatives risk manager. The Derivatives Rule became effective February 19, 2021 and the Fund is required to comply on August 19, 2022. Management is currently evaluating the effect, if any, the Derivatives Rule will have on the Fund.
On December 3, 2020, the SEC adopted new Rule 2a-5 (the “Valuation Rule”) under the Investment Company Act of 1940, establishing an updated regulatory framework for fund valuation. The Valuation Rule, in part, provides a framework for good faith fair value determination and permits a Board to designate fair value determinations to a fund’s investment adviser. Further, the SEC is rescinding previously issued guidance on related issues. The Valuation Rule became effective on March 8, 2021, with a compliance date of September 8, 2022. Management is currently evaluating the Valuation Rule and its effect on the Fund.
L. Coronavirus (COVID-19) Pandemic:
The ongoing outbreak of the novel coronavirus, COVID-19, has resulted, at times, in market closures, market volatility, liquidity constraints and increased trading costs. Efforts to contain the spread of COVID-19 have resulted in global travel restrictions and disruptions of healthcare systems, business operations and supply chains, layoffs, reduced consumer demand, defaults and credit rating downgrades, and other significant economic impacts. The effects of COVID-19 have impacted global economic activity and may heighten pre-existing political, social and economic risks, domestically or globally. The full impact of the COVID-19 pandemic is unpredictable and may adversely affect the Fund’s performance.
M. Other:
The Fund is subject to claims and suits that arise from time to time in the ordinary course of business (for example, ongoing claw back litigation against former shareholders of portfolio companies that filed for bankruptcy, such as The Tribune Company and Nine West). Although management currently believes that resolving claims against the Fund, individually or in aggregate, will not have a material adverse impact on the Fund’s financial position, results of operations, or cash flows, these matters are subject to inherent uncertainties and management’s view of these matters may change in the future.
270
On June 3, 2021, President Biden issued an Executive Order titled ”Addressing the Threat from Securities Investments that Finance Certain Companies of the People’s Republic of China” (the “Order”). Effective on August 2, 2021, the Order restricts investment in certain companies identified as “Chinese Military Industrial Complex Companies” (CMICs) by the Office of Foreign Asset Control, an agency of the Department of Treasury and the Department of Defense. As of July 27, 2021, the Fund have divested of all publicly traded securities identified as CMIC’s listed in the Order.
N. Subsequent Event Evaluations:
Management has evaluated the impact of all subsequent events on the Fund through the date on which the financial statements were issued and has determined that there are no subsequent events requiring recognition or disclosure in the financial statements.
271
Report of Independent Registered Public Accounting Firm
To the Board of Trustees and Shareholders of Dimensional Emerging Markets Value Fund
Opinion on the Financial Statements
We have audited the accompanying statement of assets and liabilities, including the summary schedule of portfolio holdings, of Dimensional Emerging Markets Value Fund (the “Fund”) as of October 31, 2021, the related statement of operations for the year ended October 31, 2021, the statement of changes in net assets for each of the two years in the period ended October 31, 2021, including the related notes, and the financial highlights for each of the five years in the period ended October 31, 2021 (collectively referred to as the “financial statements”). In our opinion, the financial statements present fairly, in all material respects, the financial position of the Fund as of October 31, 2021, the results of its operations for the year then ended, the changes in its net assets for each of the two years in the period ended October 31, 2021 and the financial highlights for each of the five years in the period ended October 31, 2021 in conformity with accounting principles generally accepted in the United States of America.
Basis for Opinion
These financial statements are the responsibility of the Fund’s management. Our responsibility is to express an opinion on the Fund’s financial statements based on our audits. We are a public accounting firm registered with the Public Company Accounting Oversight Board (United States) (PCAOB) and are required to be independent with respect to the Fund in accordance with the U.S. federal securities laws and the applicable rules and regulations of the Securities and Exchange Commission and the PCAOB.
We conducted our audits of these financial statements in accordance with the standards of the PCAOB. Those standards require that we plan and perform the audit to obtain reasonable assurance about whether the financial statements are free of material misstatement, whether due to error or fraud.
Our audits included performing procedures to assess the risks of material misstatement of the financial statements, whether due to error or fraud, and performing procedures that respond to those risks. Such procedures included examining, on a test basis, evidence regarding the amounts and disclosures in the financial statements. Our audits also included evaluating the accounting principles used and significant estimates made by management, as well as evaluating the overall presentation of the financial statements. Our procedures included confirmation of securities owned as of October 31, 2021 by correspondence with the custodian, brokers and transfer agent of the investee fund; when replies were not received from brokers, we performed other auditing procedures. We believe that our audits provide a reasonable basis for our opinion.
|
| /s/ PricewaterhouseCoopers LLP |
|
| Philadelphia, Pennsylvania |
| December 22, 2021 |
We have served as the auditor of one or more investment companies in Dimensional Fund Advisors L.P.
investment company group since 1981.
272
FUND MANAGEMENT
(Unaudited)
Trustees/Directors
Each Board of Trustees/Directors (each, the “Board” and collectively, the “Boards”) of The DFA Investment Trust Company (“DFAITC”), DFA Investment Dimensions Group Inc. (“DFAIDG”), Dimensional Investment Group Inc. (“DIG”), Dimensional ETF Trust (“ETF Trust”), and Dimensional Emerging Markets Value Fund (“DEM”) (each, the “Fund” and collectively, the “Funds”) is responsible for establishing the Funds’ policies and for overseeing the management of the Funds. The Trustees/ Directors of the Funds, including all of the disinterested Trustees/Directors, have adopted written procedures to monitor potential conflicts of interest that might develop between portfolios of the Funds (the “Feeder Portfolios”) that invest in certain series of DFAITC or DEM (the “Master Funds”).
Each Board has three standing committees, an Audit Committee, a Nominating Committee, and an Investment Strategy Committee (the “Strategy Committee”). The Audit Committee is composed of George M. Constantinides, Roger G. Ibbotson, Abbie J. Smith and Ingrid M. Werner. Each member of the Audit Committee is a disinterested Trustee/Director. The Audit Committee oversees the Fund’s accounting and financial reporting policies and practices, the Fund’s internal controls, the Fund’s financial statements and the independent audits thereof and performs other oversight functions as requested by the Board. The Audit Committee recommends the appointment of each Fund’s independent registered certified public accounting firm and acts as a liaison between the Fund’s independent registered certified public accounting firm and the full Board. There were two Audit Committee meetings held during the fiscal year ended October 31, 2021.
Each Board’s Nominating Committee is composed of George M. Constantinides, Roger G. Ibbotson, Myron S. Scholes, Abbie J. Smith, Douglas W. Diamond, Darrell Duffie and Ingrid M. Werner. Each member of the Nominating Committee is a disinterested Trustee/Director. The Nominating Committee for each Board makes recommendations for nominations of disinterested and interested members on the Board to the disinterested Board members and to the full Board. The Nominating Committee evaluates a candidate’s qualification for Board membership and the independence of such candidate from the Advisor and other principal service providers. There were four Nominating Committee meetings held during the fiscal year ended October 31, 2021.
Each Board’s Strategy Committee is composed of Gerard K. O’Reilly, Douglas W. Diamond, Myron S. Scholes and Darrell Duffie. The Strategy Committee assists the Board in carrying out its fiduciary duties with respect to the oversight of the Fund and its performance. At the request of the Board or the Advisor, the Strategy Committee (i) reviews the design of possible new series of the Fund, (ii) reviews performance of existing portfolios of the Funds and discusses and recommends possible enhancements to the portfolios’ investment strategies, (iii) reviews proposals by the Advisor to modify or enhance the investment strategies or policies of each portfolio, and (iv) considers issues relating to investment services for each portfolio of the Fund. There were three Strategy Committee meetings held during the fiscal year ended October 31, 2021.
Certain biographical information for each disinterested Trustee/Director and interested Trustee/Director of the Funds is set forth in the tables below, including a description of each Trustee/Director’s experience as a Trustee/Director of the Funds and as a Director or Trustee of other funds, as well as other recent professional experience.
The statements of additional information (together, “SAI”) of the Funds include additional information about each Trustee/Director. You may obtain copies of the SAI and prospectus of each Fund advised by Dimensional Fund Advisors LP by calling collect (512) 306-7400 or by mailing a request to Dimensional Fund Advisors LP, 6300 Bee Cave Road, Building One, Austin, TX 78746. Prospectuses are also available at http://us.dimensional.com.
273
Disinterested Directors/Trustees
| | | | | | | | | | |
Name, Address and Year of Birth | | Position | | Term of Office1 and Length of Service | | Principal Occupation During Past 5 Years | | Portfolios
within the
DFA Fund
Complex2
Overseen | | Other
Directorships of
Public
Companies Held
During Past
5 Years |
George M. Constantinides University of Chicago Booth School of Business 5807 S. Woodlawn Avenue Chicago, IL 60637 1947 | | Director/ Trustee | | DFAIDG – Since 1983; DIG & DEM – Since 1993; DFAITC – Since 1992; ETF Trust - Since 2020 | | Leo Melamed Professor of Finance, University of Chicago Booth School of Business (since 1978). | | 137 portfolios in 5 investment companies | | None |
| | | | | |
Douglas W. Diamond c/o Dimensional Fund Advisors LP 6300 Bee Cave Road, Building One Austin, TX 78746 1953 | | Director/ Trustee | | DFAIDG, DIG, DEM & DFAITC – Since 2017; ETF Trust - Since 2020 | | Merton H. Miller Distinguished Service Professor of Finance, University of Chicago Booth School of Business (since 1988). Formerly, Visiting Scholar, Federal Reserve Bank of Richmond (1990-2019). Formerly, Fischer Black Visiting Professor of Financial Economics, Alfred P. Sloan School of Management, Massachusetts Institute of Technology (2015-2016). | | 137 portfolios in 5 investment companies | | None |
| | | | | |
Darrell Duffie c/o Dimensional Fund Advisors LP 6300 Bee Cave Road, Building One Austin, TX 78746 1954 | | Director/ Trustee | | DFAIDG, DIG, DEM & DFAITC – Since 2019; ETF Trust - Since 2020 | | Dean Witter Distinguished Professor of Finance, Graduate School of Business, Stanford University (since 1984). Director, TNB Inc. (bank) (since 2020). | | 137 portfolios in 5 investment companies | | Formerly, Director, Moody’s Corporation (financial information and information technology) (2008- 2018). |
| | | | | |
Roger G. Ibbotson Yale School of Management 165 Whitney Avenue New Haven, CT 06511 1943 | | Director/ Trustee | | DFAIDG – Since 1981; DIG & DEM – Since 1993; DFAITC – Since 1992; ETF Trust - Since 2020 | | Professor in Practice Emeritus of Finance, Yale School of Management (since 1984). Chairman and Partner, Zebra Capital Management, LLC (hedge fund and asset manager) (since 2001). Formerly, Consultant to Morningstar, Inc. (2006-2016). | | 137 portfolios in 5 investment companies | | None |
Myron S. Scholes c/o Dimensional Fund Advisors LP 6300 Bee Cave Road, Building One Austin, TX 78746 1941 | | Director/ Trustee | | DFAIDG – Since 1981; DIG & DEM – Since 1993; DFAITC – Since 1992; ETF Trust - Since 2020 | | Chief Investment Strategist, Janus Henderson Investors (since 2014). Frank E. Buck Professor of Finance, Emeritus, Graduate School of Business, Stanford University (since 1981). | | 137 portfolios in 5 investment companies | | None |
| | | | | |
Abbie J. Smith University of Chicago Booth School of Business 5807 S. Woodlawn Avenue Chicago, IL 60637 1953 | | Director/ Trustee | | DFAIDG, DIG, DEM & DFAITC – Since 2000; ETF Trust - Since 2020 | | Boris and Irene Stern Distinguished Service Professor of Accounting and James S. Ely, III Faculty Fellow, University of Chicago Booth School of Business (since 1980). | | 137 portfolios in 5 investment companies | | Director, (since 2000) and formerly, Lead Director (2014- 2017), HNI Corporation (office furniture); Director, Ryder System Inc. (transportation, logistics and supply-chain management) (since 2003); and Trustee, UBS Funds (3 investment companies within the fund complex) (14 portfolios) (since 2009). |
274
| | | | | | | | | | |
Name, Address and Year of Birth | | Position | | Term of Office1 and Length of Service | | Principal Occupation During Past 5 Years | | Portfolios
within the
DFA Fund
Complex2
Overseen | | Other
Directorships of
Public
Companies Held
During Past 5 Years |
Ingrid M. Werner c/o Dimensional Fund Advisors LP 6300 Bee Cave Road, Building One Austin, TX 78746 1961 | | Director/ Trustee | | DFAIDG, DIG, DEM & DFAITC – Since 2019; ETF Trust - Since 2020 | | Martin and Andrew Murrer Professor of Finance, Fisher College of Business, The Ohio State University (since 1998). Adjunct Member, the Prize Committee for the Swedish Riksbank Prize in Economic Sciences in Memory of Alfred Nobel (annual award for significant scientific research contribution) (since 2018). Director, American Finance Association (global association of academic researchers and practitioners in finance) (since January 2019). Member, Scientific Board, Leibniz Institute for Financial Research (institute supporting academic research in finance) (since 2020). Chair, Economic Advisory Committee, FINRA (since 2017). Chairman, Scientific Advisory Board, Swedish House of Finance (institute supporting academic research in finance) (since 2014). Member, Scientific Board, Danish Finance Institute (institute supporting academic research in finance) (since 2017). Member, Academic Board, Mistra Financial Systems (organization funding academic research on environment, governance and climate/sustainability in finance) (since 2016). Fellow, Center for Analytical Finance (academic research) (since 2015). Associate Editor, Journal of Finance (since 2016). Formerly, President, Western Finance Association (global association of academic researchers and practitioners in finance) (2018- 2019). | | 137 portfolios in 5 investment companies | | Director, Fourth Swedish AP Fund (pension fund asset management) (since 2017). |
275
Interested Director/Trustee
The following interested Director/Trustee is described as such because he is deemed to be an “interested person,” as that term is defined under the 1940 Act, due to his position with the Advisor.
| | | | | | | | | | |
Name, Address and Year of Birth | | Position | | Term of Office1 and Length of Service | | Principal Occupation During Past 5 Years | | Portfolios
within the
DFA Fund
Complex2
Overseen | | Other Directorships
of Public Companies
Held During Past
5 Years |
David G. Booth 6300 Bee Cave Road, Building One Austin, TX 78746 1946 | | Chairman and Director/ Trustee | | DFAIDG – Since 1981; DIG & DFAITC – Since 1992; DEM – Since 1993; ETF Trust—Since 2020 | | Chairman, Director/Trustee, and formerly, President and Co-Chief Executive Officer (each until March 2017) of Dimensional Emerging Markets Value Fund (“DEM”), DFA Investment Dimensions Group Inc. (“DFAIDG”), Dimensional Investment Group Inc. (“DIG”), The DFA Investment Trust Company (“DFAITC”). Executive Chairman, and formerly, President and Co-Chief Executive Officer (each until February 2017) of Dimensional Holdings Inc., Dimensional Fund Advisors LP, Dimensional Investment LLC and DFA Securities LLC (collectively with DEM, DFAIDG, DIG and DFAITC, the “DFA Entities”). Chairman and Trustee of the ETF Trust (since June 2020). Formerly, Chairman and Director (2009-2018) and Co-Chief Executive Officer (2010 – June 2017) of Dimensional Fund Advisors Canada ULC. Trustee, University of Chicago (since 2002). Trustee, University of Kansas Endowment Association (since | | 137 portfolios in 5 investment companies | | None |
| | | | | | 2005). Member of the Hoover Institution Board (since September 2019). Formerly, Director of Dimensional Fund Advisors Ltd. (2002 – July 2017), DFA Australia Limited (1994 – July 2017), Dimensional Advisors Ltd. (2012 – July 2017), Dimensional Funds plc (2006 – July 2017) and Dimensional Funds II plc (2006 – July 2017). Formerly, Director and President of Dimensional Japan Ltd. (2012 – April 2017). Formerly, President, Dimensional SmartNest (US) LLC (2009-2014); and Limited Partner, VSC Investors, LLC (2007-2015). Formerly, Chairman, Director, President and Co- Chief Executive Officer of Dimensional Cayman Commodity Fund I Ltd. (2010-September 2017). | | | | |
| 1 | Each Director/Trustee holds office for an indefinite term until his or her successor is elected and qualified. |
| 2 | Each Director/Trustee is a director or trustee of each of the five registered investment companies within the DFA Fund Complex, which include: DFAIDG, DIG; DFAITC; DEM; and ETF Trust. Each disinterested Director/Trustee also serves on the Independent Review Committee of the Dimensional Funds, mutual funds registered in the provinces of Canada and managed by the Advisor’s affiliate, Dimensional Fund Advisors Canada ULC. |
276
Officers
Below is the name, year of birth, information regarding positions with the Funds and the principal occupation for each officer of the Funds. The address of each officer is 6300 Bee Cave Road, Building One, Austin, TX 78746. Each of the officers listed below holds the same office (except as otherwise noted) in the DFA Entities.
| | | | | | |
Name and Year of Birth | | Position | | Term of Office1 and Length of Service | | Principal Occupation During Past 5 Years |
| Valerie A. Brown | | Vice President and | | Since | | Vice President and Assistant Secretary of |
| 1967 | | Assistant Secretary | | 2001 | | • all the DFA Entities (since 2001) |
| | | | | | • DFA Australia Limited (since 2002) |
| | | | | | • Dimensional Fund Advisors Ltd. (since 2002) |
| | | | | | • Dimensional Cayman Commodity Fund I Ltd. (since 2010) |
| | | | | | • Dimensional Fund Advisors Pte. Ltd. (since 2012) |
| | | | | | • Dimensional Hong Kong Limited (since 2012) |
| | | | | | • ETF Trust (since 2020) |
| | | | | | Director, Vice President and Assistant Secretary (since 2003) of |
| | | | | | • Dimensional Fund Advisors Canada ULC |
| | | |
| Ryan P. Buechner | | Vice President and | | Since | | Vice President and Assistant Secretary of |
| 1982 | | Assistant Secretary | | September | | • DFAIDG, DIG, DFAITC and DEM (since 2019) |
| | | | 2019 | | • ETF Trust (since 2020) |
| | | | | | Vice President (since January 2018) of |
| | | | | | • Dimensional Holdings Inc. |
| | | | | | • Dimensional Fund Advisors LP |
| | | | | | • Dimensional Investment LLC |
| | | | | | • DFA Securities LLC |
| | | |
| David P. Butler | | Co-Chief | | Since | | Co-Chief Executive Officer of |
| 1964 | | Executive Officer | | 2017 | | • all the DFA Entities (since 2017) |
| | | | | | • ETF Trust (since 2020) |
| | | | | | Director (since 2017) of |
| | | | | | • Dimensional Holdings Inc. |
| | | | | | • Dimensional Fund Advisors Canada ULC |
| | | | | | • Dimensional Japan Ltd. |
| | | | | | • Dimensional Advisors Ltd. |
| | | | | | • Dimensional Fund Advisors Ltd. |
| | | | | | • DFA Australia Limited |
| | | | | | Director and Co-Chief Executive Officer (since 2017) of |
| | | | | | • Dimensional Cayman Commodity Fund I Ltd. |
| | | | | | Head of Global Financial Advisor Services (since 2007) for |
| | | | | | • Dimensional Fund Advisors LP |
| | | |
| | | | | | Formerly, Vice President (2007 – 2017) of |
| | | | | | • all the DFA Entities |
| | | |
| Stephen A. Clark | | Executive Vice | | Since | | Executive Vice President of |
| 1972 | | President | | 2017 | | • all the DFA Entities (since 2017) |
| | | | | | • ETF Trust (since 2020) |
| | | | | | Director and Vice President (since 2016) of |
| | | | | | • Dimensional Japan Ltd. |
| | | | | | President and Director (since 2016) of |
| | | | | | • Dimensional Fund Advisors Canada ULC |
| | | | | | Vice President (since 2008) and Director (since 2016) of |
| | | | | | • DFA Australia Limited |
| | | | | | Director (since 2016) of |
| | | | | | • Dimensional Advisors Ltd. |
| | | | | | • Dimensional Fund Advisors Pte. Ltd. |
| | | | | | • Dimensional Hong Kong Limited |
277
| | | | | | |
Name and Year of Birth | | Position | | Term of Office1 and Length of Service | | Principal Occupation During Past 5 Years |
| | | | | | Vice President (since 2019) of |
| | | | | | • Dimensional Fund Advisors Pte. Ltd. |
| | | |
| | | | | | Formerly, Vice President (2004 – 2017) of |
| | | | | | • all the DFA Entities |
| | | | | | Formerly, Vice President (2010 – 2016) of |
| | | | | | • Dimensional Fund Advisors Canada ULC |
| | | | | | Formerly, Vice President (2016-2019) of |
| | | | | | • Dimensional Fund Advisors Pte. Ltd. |
| | | | | | Formerly, Interim Chief Executive Officer (2019) of |
| | | | | | • Dimensional Fund Advisors Pte. Ltd. |
| | | | | | Formerly, Head of Institutional, North America (2012 – 2013) and Head of Global Institutional Services (2014-2018) for |
| | | | | | • Dimensional Fund Advisors LP |
| | | |
| Lisa M. Dallmer | | Chief Operating | | Since June | | Chief Operating Officer (since June 2021) of |
| 1972 | | Officer | | 2021 | | • the DFA Fund Complex |
| | | | | | • ETF Trust |
| | | | | | Executive Vice President (since January 2020) |
| | | | | | • Dimensional Holdings Inc. |
| | | | | | • Dimensional Fund Advisors LP |
| | | | | | • Dimensional Investment LLC |
| | | | | | • DFA Securities LLC |
| | | | | | Chief Operating Officer (since December 2019) |
| | | | | | • Dimensional Holdings Inc. |
| | | | | | • Dimensional Fund Advisors LP |
| | | | | | • Dimensional Investment LLC |
| | | | | | • DFA Securities LLC |
| | | |
| | | | | | Formerly, Vice President, Chief Financial Officer, and Treasurer (June 2020-June 2021) of |
| | | | | | • the DFA Fund Complex |
| | | | | | • ETF Trust |
| | | | | | Formerly, Senior Vice President, Business Operations (March 2019 – October 2019) at |
| | | | | | • Delphix Inc. |
| | | | | | Formerly, Chief Operating Officer Global Technology & Operations, Managing Director (2014 – 2018) of |
| | | | | | • BlackRock Inc. |
| | | |
| Bernard J. Grzelak | | Vice President | | Since June | | Vice President (since June 2021) of |
| 1971 | | | | 2021 | | • the DFA Fund Complex |
| | | | | | • ETF Trust |
| | | | | | Vice President, Chief Financial Officer and Treasurer (since September 2020) of |
| | | | | | • DFA Australia Limited |
| | | | | | • Dimensional Fund Advisors Canada ULC |
| | | | | | • DFA Securities LLC |
| | | | | | • Dimensional Advisors Ltd. |
| | | | | | • Dimensional Fund Advisors LP |
| | | | | | • Dimensional Fund Advisors Ltd. |
| | | | | | • Dimensional Fund Advisors Pte. Ltd. |
| | | | | | • Dimensional Holdings Inc. |
| | | | | | • Dimensional Hong Kong Limited |
| | | | | | • Dimensional Investment LLC |
278
| | | | | | |
Name and Year of Birth | | Position | | Term of Office1 and Length of Service | | Principal Occupation During Past 5 Years |
| | | | | | Vice President (since March 2021) of |
| | | | | | • Dimensional Ireland Limited |
| | | |
| | | | | | Formerly, Partner (2008 – 2020), Chief Operating Officer, Global Funds and Risk (2018 – 2020), Chief Operations Officer (2016 – 2018), and Director of Fund Administration (2003 – 2016) of Lord Abbett & Co. LLC Formerly, Chief Financial Officer (2017—2020), and Treaurer (2003 – 2017) of Lord Abbett Family of Funds |
| | | |
| Eric Hall | | Vice President and | | Since June | | Vice President and Assistant Treasurer (since June 2021) of |
| 1978 | | Assistant Treasurer | | 2021 | | • the DFA Fund Complex |
| | | | | | • ETF Trust |
| | | | | | Formerly, Data Integrity Team Lead (December 2019 – April 2021) of |
| | | | | | • Clearwater Analytics |
| | | | | | Formerly, Assistant Vice President and Assistant Treasurer (March 2015 – November 2019) at |
| | | | | | • INVESCO, U.S. (formerly, OppenheimerFunds, Inc.) |
| | | |
Jeff J. Jeon 1973 | | Vice President | | Since 2004 | | Vice President (since 2004) and Assistant Secretary (2017-2019) of • all the DFA Entities |
| | | | | | Vice President (since 2020) of |
| | | | | | • ETF Trust |
| | | | | | Vice President and Assistant Secretary (since 2010) of |
| | | | | | • Dimensional Cayman Commodity Fund I Ltd. |
| | | |
| Joy Lopez | | Vice President and | | Vice | | Vice President (since 2015) of |
| 1971 | | Assistant Treasurer | | President | | • all the DFA Entities |
| | | | since 2015 | | Assistant Treasurer (since 2017) of |
| | | | and | | • the DFA Fund Complex |
| | | | Assistant | | Vice President and Assistant Treasurer (since 2020) of |
| | | | Treasurer | | • ETF Trust |
| | | | since 2017 | | |
| | | | | | Formerly, Senior Tax Manager (2013 – 2015) for |
| | | | | | • Dimensional Fund Advisors LP |
| | | |
| Kenneth M. Manell | | Vice President | | Since | | Vice President of |
| 1972 | | | | 2010 | | • all the DFA Entities (since 2010) |
| | | | | | • Dimensional Cayman Commodity Fund I Ltd. (since 2010) |
| | | | | | • ETF Trust (since 2020) |
| | | |
| Jan Miller 1963 | | Vice President, Chief Financial Officer, and Treasurer | | Since June 2021 | | Vice President, Chief Financial Officer, and Treasurer (since June 2021) of • the DFA Fund Complex • ETF Trust |
| | | |
| | | | | | Formerly, Director (May 2019 – January 2021) at |
| | | | | | • INVESCO, U.S. (formerly, OppenheimerFunds, Inc.) |
| | | | | | Formerly, Vice President and Assistant Treasurer (September 2012 – May 2019) at |
| | | | | | • OppenheimerFunds, Inc. |
| | | |
| Catherine L. Newell | | President and | | President since 2017 and General Counsel sincec 2001 | | President of |
| 1964 | | General Counsel | | • the DFA Fund Complex (since 2017) |
| | | | • ETF Trust (since 2020) |
| | | | General Counsel (since 2001) of |
| | | | • all the DFA Entities |
| | | | Executive Vice President (since 2017) and Secretary (since 2000) of |
| | | | • Dimensional Fund Advisors LP |
| | | | • Dimensional Holdings Inc. |
| | | | | | • DFA Securities LLC |
| | | | | | • Dimensional Investment LLC |
279
| | | | | | |
Name and Year of Birth | | Position | | Term of Office1 and Length of Service | | Principal Occupation During Past 5 Years |
| | | | | | Director (since 2002), Vice President (since 1997) and Secretary (since 2002) of |
| | | | | | • DFA Australia Limited |
| | | | | | • Dimensional Fund Advisors Ltd. |
| | | | | | Vice President and Secretary of |
| | | | | | • Dimensional Fund Advisors Canada ULC (since 2003) |
| | | | | | • Dimensional Cayman Commodity Fund I Ltd. (since 2010) |
| | | | | | • Dimensional Japan Ltd. (since 2012) |
| | | | | | • Dimensional Advisors Ltd (since 2012) |
| | | | | | • Dimensional Fund Advisors Pte. Ltd. (since 2012) |
| | | | | | Director of |
| | | | | | • Dimensional Funds plc (since 2002) |
| | | | | | • Dimensional Funds II plc (since 2006) |
| | | | | | • Director of Dimensional Japan Ltd. (since 2012) |
| | | | | | • Dimensional Advisors Ltd. (since 2012) |
| | | | | | • Dimensional Fund Advisors Pte. Ltd. (since 2012) |
| | | | | | • Dimensional Hong Kong Limited (since 2012) |
| | | | | | • Dimensional Ireland Limited (since 2019) |
| | | |
| | | | | | Formerly, Vice President and Secretary (2010 – 2014) of |
| | | | | | • Dimensional SmartNest (US) LLC |
| | | | | | Formerly, Vice President (1997 – 2017) and Secretary (2000 – 2017) of |
| | | | | | • the DFA Fund Complex |
| | | | | | Formerly, Vice President of |
| | | | | | • Dimensional Fund Advisors LP (1997 – 2017) |
| | | | | | • Dimensional Holdings Inc. (2006 – 2017) |
| | | | | | • DFA Securities LLC (1997 – 2017) |
| | | | | | • Dimensional Investment LLC (2009 – 2017) |
| | | |
| Selwyn J. Notelovitz | | Vice President | | Since | | Vice President (since September 2021) of |
| 1961 | | | | September | | • the DFA Fund Complex |
| | | | 2021 | | • ETF Trust |
| | | | | | Vice President (since December 2012) and Chief Compliance Officer (since July 2020) of: |
| | | | | | • DFA Securities LLC |
| | | | | | • Dimensional Fund Advisors LP |
| | | | | | • Dimensional Holdings Inc. |
| | | | | | • Dimensional Investment LLC |
| | | | | | Chief Compliance Officer (since July 2020) of: |
| | | | | | • DFA Australia Limited |
| | | | | | • Dimensional Fund Advisors Ltd. |
| | | | | | • Dimensional Fund Advisors Canada ULC |
| | | | | | Formerly, Deputy Chief Compliance Officer (2013-2020) of: |
| | | | | | • DFA Fund Complex |
| | | | | | • DFA Securities LLC |
| | | | | | • Dimensional Fund Advisors LP |
| | | | | | • Dimensional Holdings Inc. |
| | | | | | • Dimensional Investment LLC |
| | | | | | Formerly, Vice President (2013-2020) of: |
| | | | | | • DFA Fund Complex |
| | | | | | Formerly, Director (2019-2021) of: |
| | | | | | • Dimensional Ireland Limited |
280
| | | | | | |
Name and Year of Birth | | Position | | Term of Office1 and Length of Service | | Principal Occupation During Past 5 Years |
| Carolyn L. O | | Vice President and | | Vice President since 2010 and Secretary since 2017 | | Vice President (since 2010) and Secretary (since 2017) of |
| 1974 | | Secretary | | • the DFA Fund Complex |
| | | | Vice President and Secretary (since 2020) of |
| | | | • ETF Trust |
| | | | Vice President (since 2010) and Assistant Secretary (since 2016) of |
| | | | • Dimensional Fund Advisors LP |
| | | | | | • Dimensional Holdings Inc. |
| | | | | | • Dimensional Investment LLC |
| | | | | | Vice President of |
| | | | | | • DFA Securities LLC (since 2010) |
| | | | | | • Dimensional Cayman Commodity Fund I Ltd. (since 2010) |
| | | | | | • Dimensional Fund Advisors Canada ULC (since 2016) |
| | | |
| Randy C. Olson | | Chief Compliance | | Since | | Chief Compliance Officer (since 2020) |
| 1980 | | Officer | | August | | • all the DFA Funds |
| | | | 2020 | | • ETF Trust |
| | | | | | Vice President (since 2016) of |
| | | | | | • DFA Securities LLC |
| | | | | | • Dimensional Fund Advisors LP |
| | | | | | • Dimensional Holdings Inc. |
| | | | | | • Dimensional Investment LLC |
| | | |
| | | | | | Formerly, Vice President – Senior Compliance Officer |
| | | | | | • Dimensional Investment Advisors LP (January 2020 – August 2020 and July 2014 – March 2017) |
| | | | | | Formerly, Vice President – Head of Compliance & Operations Asia Ex- Japan |
| | | | | | • Dimensional Investment Advisors LP (April 2017 – January 2020) |
| | | |
| Gerard K. O’Reilly | | Co-Chief | | Co-Chief | | Co-Chief Executive Officer and Chief Investment Officer of |
| 1976 | | Executive Officer and Chief Investment Officer | | Executive Officer and Chief Investment Officer since 2017 | | • all the DFA Entities (since 2017) • Dimensional Fund Advisors Canada ULC (since 2017) • ETF Trust (since 2020) |
| | | | Director, Chief Investment Officer and Vice President (since 2017) of |
| | | | • DFA Australia Limited |
| | | | | | Chief Investment Officer (since 2017) and Vice President (since 2016) of |
| | | | | | • Dimensional Japan Ltd. |
| | | | | | Director, Co-Chief Executive Officer and Chief Investment Officer (since 2017) of |
| | | | | | • Dimensional Cayman Commodity Fund I Ltd. |
| | | | | | Director of |
| | | | | | • Dimensional Funds plc (since 2014) |
| | | | | | • Dimensional Funds II plc (since 2014) |
| | | | | | • Dimensional Holdings Inc. (since 2017) |
| | | | | | • Dimensional Ireland Limited (since 2019) |
| | | |
| | | | | | Formerly, Co-Chief Investment Officer of |
| | | | | | • Dimensional Japan Ltd. (2016 – 2017) |
| | | | | | • DFA Australia Limited (2014 – 2017) |
| | | | | | Formerly, Executive Vice President (2017) and Co-Chief Investment Officer (2014 – 2017) of |
| | | | | | • all the DFA Entities |
| | | | | | Formerly, Vice President (2007 – 2017) of |
| | | | | | • all the DFA Entities |
| | | | | | Formerly, Vice President and Co-Chief Investment Officer (2014 – 2017) of |
| | | | | | • Dimensional Fund Advisors Canada ULC |
| | | | | | Formerly, Director (2017-2018) of |
| | | | | | • Dimensional Fund Advisors Pte. Ltd. |
281
| | | | | | |
Name and Year of Birth | | Position | | Term of Office1 and Length of Service | | Principal Occupation During Past 5 Years |
| | | |
| James J. Taylor | | Vice President and | | Since | | Vice President and Assistant Treasurer (since 2020) of |
| 1983 | | Assistant Treasurer | | March | | • the DFA Fund Complex |
| | | | 2020 | | • ETF Trust |
| | | | | | Vice President (since 2016) |
| | | | | | • Dimensional Holdings Inc. |
| | | | | | • Dimensional Fund Advisors LP |
| | | | | | • Dimensional Investment LLC |
| | | | | | • DFA Securities LLC |
| | | |
| | | | | | Formerly, Accounting Manager (2015 – 2016) |
| | | | | | • Dimensional Fund Advisors LP |
| 1 | Each officer holds office for an indefinite term at the pleasure of the Board of Directors/Trustees and until his or her successor is elected and qualified. |
282
VOTING PROXIES ON FUND PORTFOLIO SECURITIES
A description of the policies and procedures that the Fund uses in voting proxies relating to securities held in the portfolio is available (1) without charge, upon request, by calling collect: (512) 306-7400; (2) from the Advisor’s website at http://us.dimensional.com; and (3) on the SEC’s website at http://www.sec.gov. Information regarding how the Advisor votes these proxies is available from the EDGAR database on the SEC’s website at http://www.sec.gov and from the Advisor’s website at http://us.dimensional.com and reflects the twelve-month period beginning July 1st and ending June 30th.
283
TAX NOTICE TO SHAREHOLDERS
(Unaudited)
The following information is solely for informational purposes. Each Portfolio is designating the U.S. federal income tax character of the following items with respect to distributions paid or expected to be paid to shareholders related to the fiscal year ended October 31, 2021. All designations are based on financial information available as of the date of this annual report and, accordingly are subject to change. For each classification below and including “Section 163(j) interest dividends” as defined in Treasury Regulation §1.163(j)-1(b)(35) and “Section 199A dividends” as defined in Treasury Regulation §1.199A -3(d), it is the intent of the Portfolio to designate the maximum amount permitted under the Internal Revenue Code and the regulations thereunder.
For U.S. federal income tax purposes, shareholders generally must report distributions received from a Portfolio on a calendar-year basis, which therefore may include distributions with respect to portions of two fiscal years of the Portfolio. Annual statements needed by shareholders concerning the tax status of distributions received for the calendar year 2021 (e.g., IRS Form 1099-DIV) will be provided in early 2022. Shareholders should refer to these statements in preparing their calendar year 2021 tax returns. Please consult your tax advisor for the proper treatment of this information. Unless otherwise noted, the amounts in the table are expressed as a percentage of the distributions paid with respect to the fiscal year ended October 31, 2021.
| | | | | | | | | | | | | | | | | | | | | | | | | | | | | | | | | | | | | | | | | | | | | | | | | | | | |
DFA Investment Dimensions Group Inc. | | Net
Investment
Income
Distributions | | | Short-Term
Capital Gain
Distributions | | | Long-Term
Capital Gain
Distributions | | | Return of
Capital | | | Tax-Exempt
Interest | | | Total
Distributions | | | Qualified
Dividends
(for
Corporate
Dividends
Received
Deduction) (1) | | | Qualified
Dividend
Income (2) | | | U.S.
Government
Interest (3) | | | Foreign
Tax
Credit (4) | | | Foreign
Source
Income (5) | | | Qualified
Net
Interest
Income (6) | | | Qualified
Short-
Term
Capital
Gain (7) | |
Large Cap International Portfolio | | | 100 | % | | | — | | | | — | | | | — | | | | — | | | | 100 | % | | | — | | | | 87 | % | | | — | | | | 6 | % | | | 88 | % | | | — | | | | — | |
International Core Equity Portfolio | | | 100 | % | | | — | | | | — | | | | — | | | | — | | | | 100 | % | | | — | | | | 82 | % | | | — | | | | 7 | % | | | 85 | % | | | — | | | | — | |
Global Small Company Portfolio | | | 100 | % | | | — | | | | — | | | | — | | | | — | | | | 100 | % | | | — | | | | 70 | % | | | — | | | | 5 | % | | | 26 | % | | | — | | | | — | |
International Small Company Portfolio | | | 100 | % | | | — | | | | — | | | | — | | | | — | | | | 100 | % | | | — | | | | 53 | % | | | — | | | | 8 | % | | | 49 | % | | | — | | | | — | |
Japanese Small Company Portfolio | | | 100 | % | | | — | | | | — | | | | — | | | | — | | | | 100 | % | | | — | | | | 92 | % | | | — | | | | 9 | % | | | 88 | % | | | — | | | | — | |
Asia Pacific Small Company Portfolio | | | 100 | % | | | — | | | | — | | | | — | | | | — | | | | 100 | % | | | — | | | | 50 | % | | | — | | | | 1 | % | | | 75 | % | | | — | | | | — | |
United Kingdom Small Company Portfolio | | | 100 | % | | | — | | | | — | | | | — | | | | — | | | | 100 | % | | | — | | | | 55 | % | | | — | | | | 2 | % | | | 61 | % | | | — | | | | — | |
Continental Small Company Portfolio | | | 100 | % | | | — | | | | — | | | | — | | | | — | | | | 100 | % | | | — | | | | 71 | % | | | — | | | | 16 | % | | | 77 | % | | | — | | | | — | |
DFA International Real Estate Securities Portfolio | | | — | | | | — | | | | — | | | | — | | | | — | | | | — | | | | — | | | | 15 | % | | | — | | | | — | | | | 41 | % | | | — | | | | — | |
DFA Global Real Estate Securities Portfolio | | | 82 | % | | | — | | | | 18 | % | | | — | | | | — | | | | 100 | % | | | — | | | | 1 | % | | | — | | | | — | | | | — | | | | — | | | | — | |
DFA International Small Cap Value Portfolio | | | 100 | % | | | — | | | | — | | | | — | | | | — | | | | 100 | % | | | — | | | | 74 | % | | | — | | | | 10 | % | | | 69 | % | | | — | | | | — | |
International Vector Equity Portfolio | | | 100 | % | | | — | | | | — | | | | — | | | | — | | | | 100 | % | | | — | | | | 78 | % | | | — | | | | 9 | % | | | 83 | % | | | — | | | | — | |
International High Relative Profitability Portfolio | | | 100 | % | | | — | | | | — | | | | — | | | | — | | | | 100 | % | | | — | | | | 92 | % | | | — | | | | 7 | % | | | 86 | % | | | — | | | | — | |
World ex U.S. Value Portfolio | | | 100 | % | | | — | | | | — | | | | — | | | | — | | | | 100 | % | | | — | | | | 72 | % | | | — | | | | 7 | % | | | 81 | % | | | — | | | | — | |
World ex U.S. Core Equity Portfolio | | | 100 | % | | | — | | | | — | | | | — | | | | — | | | | 100 | % | | | — | | | | 74 | % | | | — | | | | 7 | % | | | 88 | % | | | — | | | | — | |
World Core Equity Portfolio | | | 100 | % | | | — | | | | — | | | | — | | | | — | | | | 100 | % | | | — | | | | 100 | % | | | — | | | | 5 | % | | | 51 | % | | | — | | | | — | |
Selectively Hedged Global Equity Portfolio | | | 50 | % | | | 3 | % | | | 47 | % | | | — | | | | — | | | | 100 | % | | | — | | | | 100 | % | | | — | | | | 7 | % | | | 40 | % | | | — | | | | 100 | % |
Emerging Markets Portfolio | | | 100 | % | | | — | | | | — | | | | — | | | | — | | | | 100 | % | | | — | | | | 71 | % | | | — | | | | 9 | % | | | 95 | % | | | — | | | | — | |
See accompanying Notes to Financial Statements.
284
| | | | | | | | | | | | | | | | | | | | | | | | | | | | | | | | | | | | | | | | | | | | | | | | | | | | |
DFA Investment Dimensions Group Inc. | | Net
Investment
Income
Distributions | | | Short-Term
Capital Gain
Distributions | | | Long-Term
Capital Gain
Distributions | | | Return of
Capital | | | Tax-Exempt
Interest | | | Total
Distributions | | | Qualified
Dividends
(for
Corporate
Dividends
Received
Deduction) (1) | | | Qualified
Dividend
Income (2) | | | U.S.
Government
Interest (3) | | | Foreign
Tax
Credit (4) | | | Foreign
Source
Income (5) | | | Qualified
Net
Interest
Income (6) | | | Qualified
Short-
Term
Capital
Gain (7) | |
Emerging Markets Small Cap | | | | | | | | | | | | | | | | | | | | | | | | | | | | | | | | | | | | | | | | | | | | | | | | | | | | |
Portfolio | | | 100 | % | | | — | | | | — | | | | — | | | | — | | | | 100 | % | | | — | | | | 22 | % | | | — | | | | 7 | % | | | 44 | % | | | — | | | | — | |
Emerging Markets Portfolio Value | | | 100 | % | | | — | | | | — | | | | — | | | | — | | | | 100 | % | | | — | | | | 59 | % | | | — | | | | 11 | % | | | 88 | % | | | — | | | | — | |
Emerging Markets Core Equity | | | | | | | | | | | | | | | | | | | | | | | | | | | | | | | | | | | | | | | | | | | | | | | | | | | | |
Portfolio | | | 100 | % | | | — | | | | — | | | | — | | | | — | | | | 100 | % | | | — | | | | 61 | % | | | — | | | | 9 | % | | | 90 | % | | | — | | | | — | |
Emerging Markets Targeted Value | | | | | | | | | | | | | | | | | | | | | | | | | | | | | | | | | | | | | | | | | | | | | | | | | | | | |
Portfolio | | | 90 | % | | | 10 | % | | | — | | | | — | | | | — | | | | 100 | % | | | — | | | | 21 | % | | | — | | | | 14 | % | | | 51 | % | | | — | | | | 100 | % |
Dimensional Investment Group Inc. | | | | | | | | | | | | | | | | | | | | | | | | | | | | | | | | | | | | | | | | | | | | | | | | | | | | |
DFA International Value Portfolio | | | 100 | % | | | — | | | | — | | | | — | | | | — | | | | 100 | % | | | — | | | | 84 | % | | | — | | | | 6 | % | | | 82 | % | | | — | | | | — | |
| (1) | Qualified Dividends represents the amount that qualifies for the corporate dividends-received deduction under Section 243 of the Internal Revenue Code and is reflected as a percentage of estimated ordinary income distributions (the total of short-term capital gain and net investment income distributions) for the calendar year 2021. |
| (2) | Qualified Dividend Income represents the amount that qualifies for the reduced capital gain tax rate under Section 1(h)(11) of the Internal Revenue Code and is reflected as a percentage of estimated ordinary income distributions (the total of short-term capital gain and net investment income distributions) for the calendar year 2021. |
| (3) | U.S. Government Interest represents the amount of interest that was derived from direct U.S. Government obligations and distributed during the fiscal year. This amount is reflected as a percentage of total estimated ordinary income distributions (the total of short-term capital gain and net investment income distributions) for the calendar year 2021. Generally, interest from direct U.S. Government obligations is exempt from state income tax. Please consult your tax advisor for the availability of a state tax exemption based on your individual circumstances. |
| (4) | Foreign Tax Credit represents the amount of dividends that qualify for the foreign tax credit pass through under Section 853 of the Internal Revenue Code and is reflected as a percentage of “investment company taxable income” (as defined in Section 852(b)(2) of the Internal Revenue Code). |
| (5) | Foreign Source Income represents the amount of dividends derived from foreign sources and is reflected as a percentage of “investment company taxable income” (as defined in Section 852(b)(2) of the Internal Revenue Code). |
| (6) | Qualified Net Interest Income represents the amount of interest income available as interest-related dividends generally exempt from withholding taxes for non-U.S. shareholders under Section 871(k)(1) of the Internal Revenue Code. The information is reflected as a percentage estimated ordinary income distributions (the total of short-term capital gain and net investment income distributions) for the calendar year 2021. |
| (7) | Qualified Short-Term Capital Gain represents the amount available as short-term capital gain dividends generally exempt from withholding taxes for non-U.S. shareholders under Section 871(k)(2) of the Internal Revenue Code. The information is reflected as a percentage of estimated ordinary income distributions (the total of short-term capital gain and net investment income distributions) for the calendar year 2021. |
See accompanying Notes to Financial Statements.
285
| | |
 | | DFA103121-001AI 00267814 |
The Registrant has adopted, as of the end of the period covered by this Form N-CSR (the “Report”), a code of ethics that applies to the Registrant’s Co-Principal Executive Officers and Principal Financial Officer (the “Code of Business Ethics”). The Registrant has not made any substantive amendments to the Code of Business Ethics during the period covered by this Report. The Registrant also has not granted any waiver from any provisions of the Code of Business Ethics during the period covered by this Report. A copy of the Code of Business Ethics is filed as an exhibit to this Report.
| ITEM 3. | AUDIT COMMITTEE FINANCIAL EXPERT. |
The Registrant’s Board of Trustees has determined that Abbie J. Smith possesses the technical attributes to qualify as an “audit committee financial expert” serving on the Registrant’s Audit Committee and has designated Ms. Smith as the “audit committee financial expert.” Ms. Smith
earned a Ph.D. in Accounting, and has taught Accounting at the graduate level since 1980. Ms. Smith’s education and career have provided her with an understanding of generally accepted accounting principles and financial statements; the ability to assess the general application of such principles in connection with the accounting for estimates, accruals and reserves; and experience preparing, analyzing and evaluating financial statements that present a breadth and level of complexity of issues that can reasonably be expected to be raised by the Registrant’s financial statements. In addition, Ms. Smith has served on the boards of directors and audit committees of entities other than the Registrant. Ms. Smith is independent under the standards set forth in Item 3 of Form N-CSR.
| ITEM 4. | PRINCIPAL ACCOUNTANT FEES AND SERVICES. |
|
Fiscal Year Ended October 31, 2021: $69,273 Fiscal Year Ended October 31, 2020: $21,254 |
| | |
Fees for Registrant | | Fiscal Year Ended October 31, 2021: $5,621 |
| |
| | Fiscal Year Ended October 31, 2020: $1,728 |
For fiscal years ended October 31, 2021 and October 31, 2020, Audit-Related Fees included fees for services related to limited procedures performed in connection with the production of the Registrant’s semi-annual financial statements.
Audit-Related Fees required to be approved pursuant to paragraph (c)(7)(ii) of Rule 2-01 of Regulation S-X
| | |
| | Fiscal Year Ended October 31, 2021: $220,000 |
| |
| | Fiscal Year Ended October 31, 2020: $215,000 |
For the fiscal years ended October 31, 2021 and October 31, 2020, Audit-Related Fees required to be approved pursuant to paragraph (c)(7)(ii) of Rule 2-01 of Regulation S-X included fees for services rendered in connection with the issuance of a Type II SSAE 16 over controls at the Registrant’s investment adviser.
| | |
Fees for Registrant | | Fiscal Year Ended October 31, 2021: $0 |
| |
| | Fiscal Year Ended October 31, 2020: $0 |
There were no Tax Fees required to be approved pursuant to paragraph (c)(7)(ii) of Rule 2-01 of Regulation S-X during the fiscal years indicated above.
| | |
Fees for Registrant | | Fiscal Year Ended October 31, 2021: $0 |
| |
| | Fiscal Year Ended October 31, 2020: $0 |
There were no “All Other Fees” required to be approved pursuant to paragraph (c)(7)(ii) of Rule 2-01 of Regulation S-X during the fiscal years indicated above.
(e)(1) Audit Committee’s Pre-Approval Policies and Procedures
Pre-Approval Policies and Procedures
as adopted by the
Audit Committees
of
DFA Investment Dimensions Group Inc.
Dimensional Emerging Markets Value Fund
Dimensional Investment Group Inc.
The DFA Investment Trust Company
(together, the “Funds”)
The Sarbanes-Oxley Act of 2002 (the “Act”) and the rules (the “Rules”) adopted by the U.S. Securities and Exchange Commission (the “SEC”) require that the Funds’ Audit Committees (together, the “Committee”) pre-approve all audit services and non-audit services provided to the Funds by their independent registered public accounting firm (the “Auditor”). The Act and the Rules also require that the Committee pre-approve all non-audit services provided by the Auditor to Dimensional Fund Advisors LP (“Dimensional”), the Funds’ investment advisor, and to affiliates of Dimensional that provide ongoing services to the Funds (with Dimensional, together the “Service Affiliates”) if the services directly impact the Funds’ operations and financial reporting.
The following policies and procedures govern the ways in which the Committee will pre-approve audit and various types of non-audit services that the Auditor provides to the Funds and to Service Affiliates. These policies and procedures do not apply in the case of audit services that the Auditor provides to Service Affiliates, nor do they apply to services that an audit firm other than the Auditor provides to such entities.
These policies and procedures comply with the requirements for pre-approval, but also provide mechanisms by which management of the Funds may request and secure pre-approval of audit and non-audit services in an orderly manner with minimal disruption to normal business operations. Pre-approval of non-audit services may be achieved through a combination of the procedures described in Sections C and D below.
| | 1. | The Committee must pre-approve all audit services and non-audit services that the Auditor provides to the Funds. |
| | 2. | The Committee must pre-approve any engagement of the Auditor to provide non-audit services to any Service Affiliate during the period of the Auditor’s engagement to provide audit services to the Funds, if the non-audit services to the Service Affiliate directly impact the Funds’ operations and financial reporting. |
| | B. | Pre-Approval of Audit Services to the Funds |
| | 1. | The Committee shall approve the engagement of an independent registered public accounting firm to certify the Funds’ financial statements for each fiscal year (the “Engagement”). The approval of the Engagement shall not be delegated to a Designated Member (as that term is defined in Section D below). In approving the Engagement, the Committee shall obtain, review and consider sufficient information concerning the proposed Auditor to enable the Committee to make a reasonable evaluation of the Auditor’s qualifications and independence. The Committee also shall consider the Auditor’s proposed fees for the Engagement, in light of the scope and nature of the audit services that the Funds will receive. |
| | 2. | The Committee shall report to the Boards of Directors/Trustees of the Funds (together, the “Board”) regarding its approval of the Engagement and of the proposed fees for the Engagement, and the basis for such approval. |
| | 3. | Unless otherwise in accordance with applicable law, the Engagement, in any event, shall require that the Auditor be selected by the vote, cast in person, of a majority of the members of the Board who are not “interested persons” of the Funds (as that term is defined in Section 2(a)(19) of the Investment Company Act of 1940) (the “Independent Directors”). |
| | C. | Pre-Approval of Non-Audit Services to the Funds and to Service Affiliates—by Types of Services |
| | 1. | The Committee may pre-approve types of non-audit services (including tax services) to the Funds and their Service Affiliates pursuant to this Section C. |
| | 2. | Annually, at such time as the Committee considers the Engagement of the Auditor, management of the Funds, in consultation with the Auditor, shall provide to the Committee, for its consideration and action, the following: (a) a list of those types of non-audit services, if any, that the Funds may request from the Auditor during the fiscal year; and (b) a list of those types of non-audit services directly impacting the Funds’ operations and financial reporting that Service Affiliates may request from the Auditor during the fiscal year. |
| | 3. | The lists submitted to the Committee shall describe the types of non-audit services in reasonable detail (which may include a range of tax services) and shall include an estimated budget (or budgeted range) of fees, where possible, and such other information as the Committee may request. If management and the Auditor desire the Committee to preapprove the furnishing of a range of tax services, the Auditor shall provide an estimated range of fees for such tax services for the consideration and approval by the Committee. |
| | 4. | The Committee’s pre-approval of the types of non-audit services submitted pursuant to this Section C shall constitute authorization for management of the Funds to utilize the Auditor for the types of non-audit services so pre-approved, if needed or desired during the fiscal year. |
| | 5. | A list of the types of non-audit services pre-approved by the Committee pursuant to this Section C will be distributed to management of the Service Affiliates and the appropriate partners of the Auditor. Periodically, the Auditor will discuss with the Committee those non-audit services that have been or are being provided pursuant to this Section C. |
| | D. | Pre-Approval of Non-Audit Services to the Funds and to Service Affiliates—Project-by-Project Basis |
| | 1. | The Committee also may pre-approve non-audit services on a project-by-project basis pursuant to this Section D. |
| | 2. | Management of the Funds, in consultation with the Auditor, may submit either to the Committee or to the Designated Member, as provided in this Section D, for their consideration and action, a pre-approval request identifying one or more non-audit service projects. The request so submitted shall describe the project(s) in reasonable detail and shall include an estimated budget (or budgeted range) of fees and such other information as the Committee or the Designated Member, as appropriate, shall request. |
| | 3. | The Committee, from time to time, shall designate one or more of its members who are Independent Directors (each a “Designated Member”) to consider, on the Committee’s behalf, any non-audit services, whether to the Funds or to any Service Affiliate, that have not been pre-approved by the Committee. The Designated Member also shall review, on the Committee’s behalf, any proposed material change in the nature or extent of any non-audit services previously approved. The Funds’ management, in consultation with the Auditor, shall explain why such non-audit services or material change in non-audit services are necessary and appropriate and the anticipated costs thereof. |
| | 4. | The Designated Member will review the requested non-audit services or proposed material change in such services and will either: |
| | (a) | pre-approve, pre-approve subject to conditions, or disapprove any such requested services, or any proposed material change in services, whether to the Funds or to a Service Affiliate; or |
| | (b) | refer such matter to the full Committee for its consideration and action. |
In considering any requested non-audit services or proposed material change in such services, the Designated Member’s authority shall be limited to approving non-audit services or proposed material changes that do not exceed $10,000 in value.
| | 5. | The Designated Member’s pre-approval (or pre-approval subject to conditions) of the requested non-audit services or proposed material change in services pursuant to this Section D shall constitute authorization for the management of the Funds or the Service Affiliate, as the case may be, to utilize the Auditor for the non-audit services so pre-approved. Any action by the Designated Member in approving a requested non-audit service shall be presented for ratification by the Committee not later than at its next scheduled meeting. If the Designated Member does not approve the Auditor providing the requested non-audit service, the matter may be presented to the full Committee for its consideration and action. |
| | E. | Amendment; Annual Review |
| | 1. | The Committee may amend these procedures from time to time. |
| | 2. | These procedures shall be reviewed annually by the Committee. |
| | 1. | The Funds shall maintain a written record of all decisions made by the Committee or by a Designated Member pursuant to these procedures, together with appropriate supporting materials. |
| | 2. | In connection with the approval of any non-audit service pursuant to the de minimis exception provided in the Rules, a record shall be made indicating that each of the conditions for this exception, as set forth in the Rules, has been satisfied. |
| | 3. | A copy of these Procedures (and of any amendments to these Procedures) shall be maintained and preserved permanently in an easily accessible place. The written records referred to in paragraphs 1 and 2 of this Section F shall be maintained and preserved for six years from the end of the fiscal year in which the actions recorded were taken, for at least the first two years in an easily accessible location. |
| | (e)(2) | The fees disclosed in Items 4(b), 4(c) or 4(d) were approved by the Registrant’s Audit Committee but not pursuant to paragraph (c)(7)(i)(C) of Rule 2-01 of Regulation S-X. |
| | (f) | The percentage of hours expended on the principal accountant’s engagement to audit the Registrant’s financial statements for the fiscal year ended October 31, 2021 that were attributed to work performed by persons other than the principal accountant’s full time, permanent employees was not greater than 50%. |
| | (g) | Aggregate Non-Audit Fees |
| | Fiscal | Year Ended October 31, 2021: $1,304,747 |
| | Fiscal | Year Ended October 31, 2020: $1,295,854 |
| | (h) | The Registrant’s Audit Committee has considered whether the provision of non-audit services that were rendered to the Registrant’s investment adviser, and any entity controlling, controlled by, or under common control with the investment adviser that provides ongoing services to the Registrant, that were not pre-approved pursuant to paragraph (c)(7)(ii) of Rule 2-01 of Regulation S-X is compatible with maintaining the principal accountant’s independence. |
| ITEM 5. | AUDIT COMMITTEE OF LISTED REGISTRANTS. |
This item is not applicable to the Registrant because it is not a listed issuer.
| (a) | The Registrant’s schedule of investments is provided below. |
DIMENSIONAL EMERGING MARKETS VALUE FUND
SCHEDULE OF INVESTMENTS
October 31, 2021
| | | | | | | | | | |
| | | | | Shares | | | Value» | |
COMMON STOCKS — (97.8%) | | | | | | | | |
BRAZIL — (3.4%) | | | | | | | | |
* | | Alliar Medicos A Frente SA | | | 200,100 | | | $ | 524,732 | |
* | | Anima Holding SA | | | 75,000 | | | | 87,707 | |
| | Banco Bradesco SA, ADR | | | 1,092,950 | | | | 3,825,325 | |
| | Banco Bradesco SA | | | 2,646,600 | | | | 7,971,969 | |
| | Banco do Brasil SA | | | 2,848,186 | | | | 14,382,739 | |
| | Banco Santander Brasil SA | | | 1,088,506 | | | | 6,634,644 | |
| | BrasilAgro - Co. Brasileira de Propriedades Agricolas | | | 328,463 | | | | 1,470,104 | |
* | | C&A Modas Ltda | | | 34,400 | | | | 36,937 | |
| | Camil Alimentos SA | | | 625,691 | | | | 1,073,158 | |
| | Cia Brasileira de Distribuicao | | | 684,958 | | | | 3,098,440 | |
# | | Cia Siderurgica Nacional SA, Sponsored ADR | | | 748,986 | | | | 3,055,863 | |
| | Cielo SA | | | 1,279,019 | | | | 496,306 | |
| | CSU Cardsystem SA | | | 69,819 | | | | 209,563 | |
| | Cyrela Brazil Realty SA Empreendimentos e Participacoes | | | 494,989 | | | | 1,235,762 | |
| | Direcional Engenharia SA | | | 628,557 | | | | 1,062,482 | |
* | | Embraer SA | | | 375,900 | | | | 1,460,627 | |
* | | Embraer SA, Sponsored ADR | | | 210,512 | | | | 3,269,251 | |
| | Enauta Participacoes SA | | | 681,873 | | | | 1,544,055 | |
| | Even Construtora e Incorporadora SA | | | 717,656 | | | | 790,925 | |
| | Fras-Le SA | | | 22,500 | | | | 56,651 | |
* | | Gafisa SA | | | 64,000 | | | | 22,793 | |
| | Gafisa SA, ADR | | | 164,984 | | | | 110,539 | |
# | | Gerdau SA, Sponsored ADR | | | 4,664,503 | | | | 22,063,099 | |
| | Gerdau SA | | | 254,766 | | | | 1,003,933 | |
* | | Getnet Adquirencia e Servicos para Meios de Pagamento SA | | | 272,127 | | | | 210,226 | |
| | Guararapes Confeccoes SA | | | 20,600 | | | | 39,968 | |
| | Helbor Empreendimentos SA | | | 130,440 | | | | 110,476 | |
| | Iguatemi Empresa de Shopping Centers SA | | | 117,331 | | | | 622,429 | |
| | Industrias Romi SA | | | 248,266 | | | | 718,343 | |
* | | International Meal Co. Alimentacao SA, Class A | | | 464,842 | | | | 231,441 | |
* | | Iochpe-Maxion SA | | | 835,706 | | | | 2,484,699 | |
| | JBS SA | | | 2,928,450 | | | | 20,262,230 | |
| | JHSF Participacoes SA | | | 1,753,405 | | | | 1,550,284 | |
| | M Dias Branco SA | | | 19,800 | | | | 108,581 | |
* | | Marisa Lojas SA | | | 721,250 | | | | 525,238 | |
| | Mills Estruturas e Servicos de Engenharia SA | | | 93,500 | | | | 83,331 | |
| | MRV Engenharia e Participacoes SA | | | 258,300 | | | | 464,535 | |
| | Petroleo Brasileiro SA, Sponsored ADR | | | 10,919,479 | | | | 104,936,193 | |
| | Petroleo Brasileiro SA, Sponsored ADR | | | 5,515,017 | | | | 54,157,467 | |
| | Petroleo Brasileiro SA | | | 9,916,353 | | | | 48,617,153 | |
| | Positivo Tecnologia SA | | | 156,700 | | | | 234,059 | |
| | Sao Carlos Empreendimentos e Participacoes SA | | | 60,300 | | | | 395,319 | |
| | Sendas Distribuidora SA | | | 1,015,790 | | | | 2,751,945 | |
W | | Ser Educacional SA | | | 23,900 | | | | 44,211 | |
| | SLC Agricola SA | | | 532,343 | | | | 4,110,618 | |
| | TIM SA | | | 2,003,840 | | | | 3,983,678 | |
| | Trisul SA | | | 290,805 | | | | 301,430 | |
| | Tupy SA | | | 490,902 | | | | 1,817,028 | |
| | Ultrapar Participacoes SA | | | 911,136 | | | | 2,106,794 | |
| | Usinas Siderurgicas de Minas Gerais SA Usiminas | | | 549,500 | | | | 1,254,042 | |
| | Vale SA | | | 10,579,377 | | | | 134,233,887 | |
* | | Valid Solucoes e Servicos de Seguranca em Meios de Pagamento e Identificacao SA | | | 192,737 | | | | 243,833 | |
| | Vibra Energia SA | | | 176,700 | | | | 656,856 | |
| | | | | | | | | | |
TOTAL BRAZIL | | | | | | | 462,743,898 | |
| | | | | | | | | | |
DIMENSIONAL EMERGING MARKETS VALUE FUND
CONTINUED
| | | | | | | | | | |
| | | | | Shares | | | Value» | |
CHILE — (0.5%) | | | | | | | | |
| | Besalco SA | | | 530,992 | | | $ | 140,337 | |
* | | Camanchaca SA | | | 1,334,309 | | | | 56,541 | |
| | CAP SA | | | 790,492 | | | | 7,828,360 | |
| | Cementos BIO BIO SA | | | 665,307 | | | | 596,264 | |
| | Cencosud SA | | | 7,523,739 | | | | 11,004,099 | |
| | Cia Sud Americana de Vapores SA | | | 48,651,513 | | | | 3,161,968 | |
| | Cristalerias de Chile SA | | | 264,624 | | | | 875,065 | |
| | Empresa Nacional de Telecomunicaciones SA | | | 712,006 | | | | 2,442,122 | |
| | Empresas CMPC SA | | | 5,272,541 | | | | 9,728,739 | |
| | Empresas COPEC SA | | | 1,840,697 | | | | 14,479,671 | |
* | | Empresas Hites SA | | | 1,783,807 | | | | 305,490 | |
* | | Empresas La Polar SA | | | 18,620,639 | | | | 235,799 | |
| | Enel Americas SA, ADR | | | 1,131,013 | | | | 6,401,534 | |
| | Enel Americas SA | | | 13,898,479 | | | | 1,581,581 | |
# | | Enel Chile SA, ADR | | | 176,983 | | | | 384,053 | |
| | Grupo Security SA | | | 3,945,934 | | | | 597,151 | |
| | Inversiones Aguas Metropolitanas SA | | | 2,266,399 | | | | 1,073,258 | |
* | | Itau CorpBanca Chile SA | | | 568,841,776 | | | | 1,263,147 | |
* | | Latam Airlines Group SA | | | 736,124 | | | | 1,076,444 | |
* | | Masisa SA | | | 9,310,884 | | | | 131,552 | |
| | PAZ Corp. SA | | | 1,562,812 | | | | 549,390 | |
* | | Ripley Corp. SA | | | 1,282,589 | | | | 216,790 | |
| | Salfacorp SA | | | 2,200,300 | | | | 743,881 | |
| | Sigdo Koppers SA | | | 187,924 | | | | 176,849 | |
| | SMU SA | | | 729,291 | | | | 72,657 | |
| | Sociedad Matriz SAAM SA | | | 47,547,899 | | | | 2,970,184 | |
| | Socovesa SA | | | 3,702,080 | | | | 484,843 | |
| | SONDA SA | | | 53,757 | | | | 18,176 | |
| | Vina Concha y Toro SA | | | 1,394,046 | | | | 2,027,205 | |
| | | | | | | | | | |
TOTAL CHILE | | | | | | | 70,623,150 | |
| | | | | | | | | | |
CHINA — (30.6%) | | | | | | | | |
* | | 360 DigiTech, Inc., ADR | | | 18,207 | | | | 371,605 | |
* | | 360 Security Technology, Inc., Class A | | | 661,700 | | | | 1,244,801 | |
* | | 361 Degrees International Ltd. | | | 5,729,000 | | | | 2,779,123 | |
# * W | | 3SBio, Inc. | | | 4,591,000 | | | | 4,197,250 | |
| | 5I5J Holding Group Co. Ltd., Class A | | | 1,102,800 | | | | 513,476 | |
| | AAC Technologies Holdings, Inc. | | | 3,268,000 | | | | 14,125,002 | |
W | | AAG Energy Holdings Ltd. | | | 308,000 | | | | 68,950 | |
| | Accelink Technologies Co. Ltd., Class A | | | 171,600 | | | | 581,345 | |
| | Advanced Technology & Materials Co. Ltd., Class A | | | 275,600 | | | | 366,731 | |
| | AECC Aero-Engine Control Co. Ltd., Class A | | | 244,300 | | | | 1,019,035 | |
| | AECC Aviation Power Co. Ltd., Class A | | | 345,407 | | | | 3,191,593 | |
* | | Aerospace Hi-Tech Holdings Grp Ltd., Class A | | | 419,623 | | | | 550,967 | |
| | Agile Group Holdings Ltd. | | | 10,528,999 | | | | 8,254,133 | |
| | Agricultural Bank of China Ltd., Class H | | | 95,473,000 | | | | 32,442,414 | |
* | | Air China Ltd., Class H | | | 7,800,000 | | | | 5,487,474 | |
| | Aisino Corp., Class A | | | 596,467 | | | | 1,067,724 | |
| | Ajisen China Holdings Ltd. | | | 3,383,000 | | | | 578,009 | |
* | | Alibaba Group Holding Ltd. | | | 7,316,900 | | | | 150,454,912 | |
* | | Alpha Group, Class A | | | 286,500 | | | | 225,724 | |
# * | | Aluminum Corp. of China Ltd., Class H | | | 20,860,000 | | | | 12,553,344 | |
| | Angang Steel Co. Ltd., Class H | | | 9,163,632 | | | | 4,925,713 | |
| | Anhui Conch Cement Co. Ltd., Class H | | | 7,897,000 | | | | 39,049,918 | |
| | Anhui Construction Engineering Group Co. Ltd., Class A | | | 454,600 | | | | 275,117 | |
| | Anhui Guangxin Agrochemical Co. Ltd., Class A | | | 89,500 | | | | 494,123 | |
| | Anhui Hengyuan Coal Industry & Electricity Power Co. Ltd., Class A | | | 499,340 | | | | 546,749 | |
| | Anhui Jiangnan Chemical Industry Co. Ltd., Class A | | | 414,960 | | | | 337,248 | |
| | Anhui Truchum Advanced Materials & Technology Co. Ltd., Class A | | | 378,200 | | | | 615,500 | |
DIMENSIONAL EMERGING MARKETS VALUE FUND
CONTINUED
| | | | | | | | | | |
| | | | | Shares | | | Value» | |
CHINA — (Continued) | | | | | | | | |
| | Anhui Xinhua Media Co. Ltd., Class A | | | 683,764 | | | $ | 503,107 | |
| | Anhui Zhongding Sealing Parts Co. Ltd., Class A | | | 748,604 | | | | 2,010,994 | |
# * | | Anton Oilfield Services Group | | | 16,568,000 | | | | 1,125,221 | |
| | Aoshikang Technology Co. Ltd., Class A | | | 49,300 | | | | 549,543 | |
| | APT Satellite Holdings Ltd. | | | 154,000 | | | | 45,584 | |
| | Asia Cement China Holdings Corp. | | | 3,553,500 | | | | 2,707,767 | |
W | | AsiaInfo Technologies Ltd. | | | 446,000 | | | | 734,824 | |
# * | | Asian Citrus Holdings Ltd. | | | 4,633,000 | | | | 112,419 | |
| | Ausnutria Dairy Corp. Ltd. | | | 1,564,000 | | | | 1,956,517 | |
| | AVIC Electromechanical Systems Co. Ltd., Class A | | | 27,400 | | | | 65,009 | |
| | AVIC Industry-Finance Holdings Co. Ltd., Class A | | | 2,732,900 | | | | 1,662,749 | |
| | AviChina Industry & Technology Co. Ltd., Class H | | | 12,969,000 | | | | 8,251,516 | |
W | | BAIC Motor Corp. Ltd., Class H | | | 12,987,500 | | | | 4,302,105 | |
* | | Baidu, Inc., Sponsored ADR | | | 883,875 | | | | 143,399,880 | |
W | | BAIOO Family Interactive Ltd. | | | 1,124,000 | | | | 90,442 | |
| | Bank of Beijing Co. Ltd., Class A | | | 5,995,822 | | | | 4,149,989 | |
| | Bank of Changsha Co. Ltd., Class A | | | 1,373,600 | | | | 1,726,579 | |
| | Bank of Chengdu Co. Ltd., Class A | | | 1,596,328 | | | | 3,183,899 | |
| | Bank of China Ltd., Class H | | | 301,203,817 | | | | 106,596,497 | |
| | Bank of Chongqing Co. Ltd., Class H | | | 3,051,500 | | | | 1,713,940 | |
| | Bank of Communications Co. Ltd., Class H | | | 41,482,574 | | | | 24,677,266 | |
| | Bank of Hangzhou Co. Ltd., Class A | | | 1,844,805 | | | | 4,114,839 | |
| | Bank of Jiangsu Co. Ltd., Class A | | | 4,149,605 | | | | 4,077,758 | |
| | Bank of Nanjing Co. Ltd., Class A | | | 3,991,531 | | | | 6,050,102 | |
| | Bank of Ningbo Co. Ltd., Class A | | | 1,742,529 | | | | 10,388,262 | |
| | Bank of Shanghai Co. Ltd., Class A | | | 3,689,247 | | | | 4,203,369 | |
* | | Bank of Tianjin Co. Ltd., Class H | | | 29,000 | | | | 11,929 | |
# * W | | Bank of Zhengzhou Co. Ltd., Class H | | | 402,599 | | | | 95,529 | |
| | Baoshan Iron & Steel Co. Ltd., Class A | | | 7,814,777 | | | | 8,698,090 | |
| | Baosheng Science & Technology Innovation Co. Ltd., Class A | | | 196,050 | | | | 148,584 | |
* | | Baoye Group Co. Ltd., Class H | | | 1,561,120 | | | | 763,480 | |
* | | Baozun, Inc., Class A | | | 2,500 | | | | 14,430 | |
| | BBMG Corp., Class H | | | 16,973,000 | | | | 2,851,852 | |
| | Befar Group Co. Ltd., Class A | | | 254,600 | | | | 334,075 | |
| | Beibuwan Port Co. Ltd., Class A | | | 258,100 | | | | 300,543 | |
| | Beijing Capital Development Co. Ltd., Class A | | | 425,200 | | | | 326,634 | |
| | Beijing Capital Eco-Environment Protection Group Co. Ltd., Class A | | | 3,783,279 | | | | 1,987,875 | |
# * | | Beijing Capital International Airport Co. Ltd., Class H | | | 12,208,000 | | | | 7,938,435 | |
* | | Beijing Energy International Holding Co. Ltd. | | | 4,182,000 | | | | 158,010 | |
| | Beijing Enlight Media Co. Ltd., Class A | | | 195,500 | | | | 286,052 | |
* | | Beijing Enterprises Clean Energy Group Ltd. | | | 4,880,000 | | | | 65,597 | |
| | Beijing Enterprises Holdings Ltd. | | | 3,226,000 | | | | 12,400,389 | |
* | | Beijing Enterprises Urban Resources Group Ltd. | | | 324,000 | | | | 32,824 | |
| | Beijing Enterprises Water Group Ltd. | | | 17,900,000 | | | | 6,841,992 | |
* | | Beijing Forever Technology Co. Ltd., Class A | | | 120,800 | | | | 217,029 | |
| | Beijing GeoEnviron Engineering & Technology, Inc., Class A | | | 255,190 | | | | 647,520 | |
# * | | Beijing Health Holdings Ltd. | | | 3,048,000 | | | | 38,411 | |
* | | Beijing Jetsen Technology Co. Ltd., Class A | | | 87,500 | | | | 56,056 | |
| | Beijing Konruns Pharmaceutical Co. Ltd., Class A | | | 34,500 | | | | 167,099 | |
| | Beijing New Building Materials PLC, Class A | | | 9,100 | | | | 40,101 | |
| | Beijing North Star Co. Ltd., Class H | | | 6,026,000 | | | | 966,888 | |
* | | Beijing Orient Landscape & Environment Co. Ltd., Class A | | | 719,200 | | | | 319,015 | |
* | | Beijing Orient National Communication Science & Technology Co. Ltd., Class A | | | 375,300 | | | | 517,024 | |
| | Beijing Originwater Technology Co. Ltd., Class A | | | 775,200 | | | | 843,745 | |
* | | Beijing Sanju Environmental Protection & New Material Co. Ltd., Class A | | | 81,200 | | | | 77,282 | |
| | Beijing Shiji Information Technology Co. Ltd., Class A | | | 134,398 | | | | 497,441 | |
* | | Beijing Shougang Co. Ltd., Class A | | | 756,666 | | | | 680,497 | |
| | Beijing Sinnet Technology Co. Ltd., Class A | | | 488,228 | | | | 1,007,768 | |
DIMENSIONAL EMERGING MARKETS VALUE FUND
CONTINUED
| | | | | | | | | | |
| | | | | Shares | | | Value» | |
CHINA — (Continued) | | | | | | | | |
| | Beijing SL Pharmaceutical Co. Ltd., Class A | | | 427,200 | | | $ | 619,143 | |
| | Beijing SPC Environment Protection Tech Co. Ltd., Class A | | | 367,135 | | | | 344,531 | |
| | Beijing Thunisoft Corp. Ltd., Class A | | | 169,434 | | | | 283,597 | |
| | Beijing Tong Ren Tang Chinese Medicine Co. Ltd. | | | 88,000 | | | | 112,137 | |
W | | Beijing Urban Construction Design & Development Group Co. Ltd., Class H | | | 476,000 | | | | 126,671 | |
| | Beijing Yanjing Brewery Co. Ltd., Class A | | | 1,317,929 | | | | 1,367,434 | |
| | Beijing Zhong Ke San Huan High-Tech Co. Ltd., Class A | | | 440,600 | | | | 770,778 | |
| | Best Pacific International Holdings Ltd. | | | 396,000 | | | | 120,989 | |
| | Bestsun Energy Co. Ltd., Class A | | | 173,200 | | | | 132,174 | |
| | Better Life Commercial Chain Share Co. Ltd., Class A | | | 523,230 | | | | 549,871 | |
| | Biem.L.Fdlkk Garment Co. Ltd., Class A | | | 73,725 | | | | 283,397 | |
| | Blue Sail Medical Co. Ltd., Class A | | | 492,700 | | | | 1,113,472 | |
| | Bluefocus Intelligent Communications Group Co. Ltd., Class A | | | 971,800 | | | | 760,006 | |
| | BOE Technology Group Co. Ltd., Class A | | | 13,370,757 | | | | 10,272,510 | |
* | | Bohai Leasing Co. Ltd., Class A | | | 2,291,900 | | | | 941,466 | |
| | Bosideng International Holdings Ltd. | | | 590,000 | | | | 457,164 | |
* | | Boyaa Interactive International Ltd. | | | 1,548,000 | | | | 103,184 | |
| | Bright Dairy & Food Co. Ltd., Class A | | | 630,905 | | | | 1,373,556 | |
| | Bright Real Estate Group Co. Ltd., Class A | | | 171,200 | | | | 58,300 | |
* †† | | Brilliance China Automotive Holdings Ltd. | | | 16,650,000 | | | | 5,511,151 | |
* | | BTG Hotels Group Co. Ltd., Class A | | | 200,100 | | | | 764,604 | |
| | C C Land Holdings Ltd. | | | 15,977,429 | | | | 3,580,706 | |
| | C&D International Investment Group Ltd. | | | 444,726 | | | | 827,772 | |
# * | | CA Cultural Technology Group Ltd. | | | 1,338,000 | | | | 104,901 | |
| | Cabbeen Fashion Ltd. | | | 1,514,000 | | | | 620,634 | |
| | Caitong Securities Co. Ltd., Class A | | | 518,700 | | | | 831,263 | |
| | Camel Group Co. Ltd., Class A | | | 216,320 | | | | 442,414 | |
| | Canny Elevator Co. Ltd., Class A | | | 211,052 | | | | 240,608 | |
* | | Capital Environment Holdings Ltd. | | | 12,116,000 | | | | 283,493 | |
| | Carrianna Group Holdings Co. Ltd. | | | 3,478,391 | | | | 308,123 | |
* †† | | CECEP COSTIN New Materials Group Ltd. | | | 132,000 | | | | 1,909 | |
| | CECEP Solar Energy Co. Ltd., Class A | | | 1,309,900 | | | | 2,283,363 | |
| | CECEP Wind-Power Corp., Class A | | | 941,500 | | | | 1,085,253 | |
| | Central China Management Co. Ltd. | | | 7,334,350 | | | | 1,131,452 | |
| | Central China Real Estate Ltd. | | | 6,699,350 | | | | 1,007,102 | |
| | Central China Securities Co. Ltd., Class H | | | 217,000 | | | | 39,813 | |
# | | CGN New Energy Holdings Co. Ltd. | | | 8,204,000 | | | | 7,678,736 | |
| | CGN Nuclear Technology Development Co. Ltd., Class A | | | 179,700 | | | | 250,331 | |
| | Changchun Faway Automobile Components Co. Ltd., Class A | | | 121,820 | | | | 199,699 | |
| | Changjiang Securities Co. Ltd., Class A | | | 1,260,190 | | | | 1,425,344 | |
| | Changying Xinzhi Technology Co. Ltd., Class A | | | 39,100 | | | | 102,531 | |
| | Chanjet Information Technology Co. Ltd., Class H | | | 21,000 | | | | 27,005 | |
| | Chaowei Power Holdings Ltd. | | | 3,811,000 | | | | 1,122,821 | |
* | | Cheetah Mobile, Inc., ADR | | | 218,633 | | | | 367,303 | |
| | Chengdu Fusen Noble-House Industrial Co. Ltd., Class A | | | 284,608 | | | | 557,099 | |
| | Chengdu Hongqi Chain Co. Ltd., Class A | | | 482,110 | | | | 382,448 | |
| | China Aerospace International Holdings Ltd. | | | 12,534,000 | | | | 933,750 | |
# | | China Aircraft Leasing Group Holdings Ltd. | | | 896,000 | | | | 619,807 | |
# | | China Aoyuan Group Ltd. | | | 7,667,000 | | | | 3,028,010 | |
| | China BlueChemical Ltd., Class H | | | 13,574,878 | | | | 4,539,175 | |
# * | | China Boton Group Co. Ltd. | | | 262,000 | | | | 93,507 | |
* | | China CAMC Engineering Co. Ltd., Class A | | | 347,300 | | | | 350,605 | |
| | China Cinda Asset Management Co. Ltd., Class H | | | 53,481,000 | | | | 8,928,437 | |
| | China CITIC Bank Corp. Ltd., Class H | | | 42,404,112 | | | | 18,600,546 | |
# | | China Coal Energy Co. Ltd., Class H | | | 13,890,000 | | | | 8,474,084 | |
†† | | China Common Rich Renewable Energy Investments Ltd. | | | 14,642,000 | | | | 1,764,266 | |
| | China Communications Services Corp. Ltd., Class H | | | 16,467,071 | | | | 9,103,318 | |
| | China Conch Venture Holdings Ltd. | | | 2,833,500 | | | | 13,768,956 | |
| | China Construction Bank Corp., Class H | | | 434,536,101 | | | | 295,736,876 | |
DIMENSIONAL EMERGING MARKETS VALUE FUND
CONTINUED
| | | | | | | | | | |
| | | | | Shares | | | Value» | |
CHINA — (Continued) | | | | | | | | |
| | China CSSC Holdings Ltd., Class A | | | 375,700 | | | $ | 1,320,142 | |
* | | China CYTS Tours Holding Co. Ltd., Class A | | | 418,760 | | | | 654,027 | |
# * | | China Dili Group | | | 4,137,899 | | | | 1,015,636 | |
| | China Dongxiang Group Co. Ltd. | | | 19,415,000 | | | | 2,039,597 | |
* | | China Eastern Airlines Corp. Ltd., ADR | | | 2,914 | | | | 56,328 | |
* | | China Eastern Airlines Corp. Ltd., Class H | | | 13,416,000 | | | | 5,263,817 | |
| | China Electronics Optics Valley Union Holding Co. Ltd. | | | 3,112,000 | | | | 173,268 | |
# | | China Energy Engineering Corp. Ltd., Class H | | | 2,124,000 | | | | 313,154 | |
| | China Everbright Bank Co. Ltd., Class H | | | 15,782,000 | | | | 5,549,913 | |
# W | | China Everbright Greentech Ltd. | | | 3,443,000 | | | | 1,210,725 | |
| | China Everbright Ltd. | | | 7,559,869 | | | | 8,500,706 | |
* | | China Film Co. Ltd., Class A | | | 305,100 | | | | 560,462 | |
* †† | | China Financial Services Holdings Ltd. | | | 94,200 | | | | 7,718 | |
| | China Foods Ltd. | | | 2,164,000 | | | | 826,813 | |
| | China Galaxy Securities Co. Ltd., Class H | | | 18,139,000 | | | | 10,099,363 | |
| | China Gas Holdings Ltd. | | | 11,940,000 | | | | 29,802,476 | |
# | | China Glass Holdings Ltd. | | | 4,496,000 | | | | 1,318,147 | |
* | | China Grand Automotive Services Group Co. Ltd., Class A | | | 217,500 | | | | 91,017 | |
# | | China Grand Pharmaceutical & Healthcare Holdings Ltd., Class A | | | 2,995,500 | | | | 2,398,544 | |
| | China Great Wall Securities Co. Ltd., Class A | | | 190,600 | | | | 340,494 | |
| | China Hanking Holdings Ltd. | | | 911,000 | | | | 165,944 | |
| | China Harmony Auto Holding Ltd. | | | 5,759,500 | | | | 2,945,651 | |
* †† | | China High Precision Automation Group Ltd. | | | 429,000 | | | | 12,613 | |
* | | China High Speed Railway Technology Co. Ltd., Class A | | | 716,600 | | | | 244,021 | |
# * | | China High Speed Transmission Equipment Group Co. Ltd. | | | 1,889,000 | | | | 1,464,462 | |
| | China Hongqiao Group Ltd. | | | 10,475,000 | | | | 11,638,260 | |
* †† W China Huarong Asset Management Co. Ltd., Class H | | | 62,368,000 | | | | 6,132,192 | |
†† | | China Huiyuan Juice Group Ltd. | | | 4,269,983 | | | | 192,411 | |
W | | China International Capital Corp. Ltd., Class H | | | 3,750,800 | | | | 9,286,112 | |
# | | China International Marine Containers Group Co. Ltd., Class H | | | 3,412,380 | | | | 6,760,878 | |
| | China Isotope & Radiation Corp. | | | 8,000 | | | | 22,768 | |
# | | China Jinmao Holdings Group Ltd. | | | 30,378,580 | | | | 8,875,055 | |
| | China Jushi Co. Ltd., Class A | | | 1,536,248 | | | | 4,589,441 | |
# | | China Kepei Education Group Ltd. | | | 1,630,000 | | | | 898,711 | |
| | China Lesso Group Holdings Ltd. | | | 8,141,000 | | | | 12,583,275 | |
| | China Life Insurance Co. Ltd., Class H | | | 13,508,000 | | | | 23,467,034 | |
# | | China Lilang Ltd. | | | 1,763,000 | | | | 1,004,264 | |
# * | | China Longevity Group Co. Ltd. | | | 1,152,649 | | | | 38,073 | |
# * †† | | China Lumena New Materials Corp. | | | 1,315,048 | | | | 0 | |
# * | | China Maple Leaf Educational Systems Ltd. | | | 7,422,000 | | | | 1,188,746 | |
| | China Medical System Holdings Ltd. | | | 3,750,000 | | | | 6,349,570 | |
| | China Meheco Co. Ltd., Class A | | | 303,800 | | | | 528,513 | |
| | China Merchants Bank Co. Ltd., Class H | | | 14,808,500 | | | | 124,097,280 | |
| | China Merchants Energy Shipping Co. Ltd., Class A | | | 1,571,640 | | | | 1,123,714 | |
| | China Merchants Land Ltd. | | | 11,986,000 | | | | 1,338,881 | |
| | China Merchants Port Holdings Co. Ltd. | | | 7,949,903 | | | | 13,253,916 | |
W | | China Merchants Securities Co. Ltd., Class H | | | 658,820 | | | | 1,040,885 | |
| | China Merchants Shekou Industrial Zone Holdings Co. Ltd., Class A | | | 1,361,110 | | | | 2,219,933 | |
†† | | China Metal Recycling Holdings Ltd. | | | 3,259,800 | | | | 0 | |
# | | China Minsheng Banking Corp. Ltd., Class H | | | 23,927,400 | | | | 9,487,130 | |
# | | China Modern Dairy Holdings Ltd. | | | 9,212,000 | | | | 1,737,791 | |
| | China Molybdenum Co. Ltd., Class H | | | 9,003,000 | | | | 5,565,679 | |
| | China National Accord Medicines Corp. Ltd., Class A | | | 233,806 | | | | 1,224,068 | |
| | China National Building Material Co. Ltd., Class H | | | 26,405,250 | | | | 33,093,514 | |
| | China National Medicines Corp. Ltd., Class A | | | 258,300 | | | | 1,230,453 | |
| | China National Nuclear Power Co. Ltd., Class A | | | 5,075,483 | | | | 5,439,532 | |
# W | | China New Higher Education Group Ltd. | | | 2,511,000 | | | | 1,258,608 | |
* | | China New Town Development Co. Ltd. | | | 11,705,522 | | | | 134,590 | |
* | | China Oil & Gas Group Ltd. | | | 18,900,000 | | | | 1,172,060 | |
DIMENSIONAL EMERGING MARKETS VALUE FUND
CONTINUED
| | | | | | | | | | |
| | | | | Shares | | | Value» | |
CHINA — (Continued) | | | | | | | | |
| | China Oilfield Services Ltd., Class H | | | 8,924,000 | | | $ | 8,534,612 | |
| | China Oriental Group Co. Ltd. | | | 8,518,000 | | | | 2,397,351 | |
| | China Overseas Grand Oceans Group Ltd. | | | 12,669,500 | | | | 6,074,374 | |
| | China Overseas Land & Investment Ltd. | | | 22,666,000 | | | | 49,991,125 | |
| | China Pacific Insurance Group Co. Ltd., Class H | | | 10,245,400 | | | | 31,329,126 | |
# | | China Petroleum & Chemical Corp., ADR | | | 774,776 | | | | 37,716,135 | |
| | China Petroleum & Chemical Corp., Class H | | | 77,479,575 | | | | 37,750,582 | |
| | China Pioneer Pharma Holdings Ltd. | | | 1,142,000 | | | | 169,953 | |
* †† | | China Properties Group Ltd. | | | 3,380,000 | | | | 135,213 | |
| | China Publishing & Media Co. Ltd., Class A | | | 477,385 | | | | 404,871 | |
| | China Railway Group Ltd., Class H | | | 22,192,000 | | | | 10,840,686 | |
W | | China Railway Signal & Communication Corp. Ltd., Class H | | | 5,576,000 | | | | 1,956,086 | |
| | China Railway Tielong Container Logistics Co. Ltd., Class A | | | 303,900 | | | | 224,356 | |
# * | | China Rare Earth Holdings Ltd. | | | 4,650,600 | | | | 489,964 | |
| | China Reinsurance Group Corp., Class H | | | 24,824,000 | | | | 2,581,511 | |
W | | China Renaissance Holdings Ltd. | | | 29,500 | | | | 71,289 | |
| | China Resources Cement Holdings Ltd. | | | 17,062,000 | | | | 14,347,507 | |
| | China Resources Double Crane Pharmaceutical Co. Ltd., Class A | | | 675,381 | | | | 1,204,710 | |
| | China Resources Gas Group Ltd. | | | 2,388,000 | | | | 12,817,206 | |
| | China Resources Land Ltd. | | | 20,648,000 | | | | 80,227,147 | |
| | China Resources Medical Holdings Co. Ltd. | | | 5,256,500 | | | | 3,687,682 | |
# W | | China Resources Pharmaceutical Group Ltd. | | | 9,373,500 | | | | 4,509,093 | |
| | China Resources Sanjiu Medical & Pharmaceutical Co. Ltd., Class A | | | 510,231 | | | | 1,923,562 | |
| | China Risun Group Ltd. | | | 709,000 | | | | 432,146 | |
# | | China Sanjiang Fine Chemicals Co. Ltd. | | | 5,245,000 | | | | 1,581,200 | |
| | China SCE Group Holdings Ltd. | | | 13,607,000 | | | | 4,243,693 | |
| | China Science Publishing & Media Ltd., Class A | | | 232,700 | | | | 299,135 | |
* W | | China Shengmu Organic Milk Ltd. | | | 729,000 | | | | 50,338 | |
| | China Shenhua Energy Co. Ltd., Class H | | | 19,655,500 | | | | 42,265,118 | |
| | China Shineway Pharmaceutical Group Ltd. | | | 2,159,000 | | | | 2,069,847 | |
| | China Shuifa Singyes Energy Holdings Ltd. | | | 520,000 | | | | 143,786 | |
* | | China Silver Group Ltd. | | | 8,388,000 | | | | 642,236 | |
# | | China South City Holdings Ltd. | | | 31,676,000 | | | | 2,360,826 | |
| | China South Publishing & Media Group Co. Ltd., Class A | | | 602,000 | | | | 770,392 | |
# * | | China Southern Airlines Co. Ltd., Class H | | | 9,962,000 | | | | 6,058,011 | |
| | China Starch Holdings Ltd. | | | 13,595,000 | | | | 296,294 | |
| | China State Construction Engineering Corp. Ltd., Class A | | | 16,812,606 | | | | 12,231,789 | |
* | | China Sunshine Paper Holdings Co. Ltd. | | | 1,885,000 | | | | 427,211 | |
| | China Taiping Insurance Holdings Co. Ltd. | | | 11,400,800 | | | | 17,348,488 | |
# * | | China Tianrui Group Cement Co. Ltd. | | | 45,000 | | | | 38,657 | |
* | | China Tianying, Inc., Class A | | | 948,700 | | | | 703,555 | |
W | | China Tower Corp. Ltd., Class H | | | 117,092,000 | | | | 15,174,976 | |
| | China Traditional Chinese Medicine Holdings Co. Ltd. | | | 18,684,000 | | | | 8,890,582 | |
| | China TransInfo Technology Co. Ltd., Class A | | | 240,300 | | | | 502,177 | |
# * | | China Travel International Investment Hong Kong Ltd. | | | 18,963,631 | | | | 2,750,859 | |
* | | China Tungsten & Hightech Materials Co. Ltd., Class A | | | 302,733 | | | | 627,643 | |
| | China Vanke Co. Ltd., Class H | | | 8,314,005 | | | | 19,425,081 | |
# W | | China Vast Industrial Urban Development Co. Ltd. | | | 1,490,000 | | | | 430,794 | |
| | China West Construction Group Co. Ltd., Class A | | | 358,900 | | | | 402,947 | |
* †† | | China Wood Optimization Holding Ltd. | | | 88,000 | | | | 7,634 | |
W | | China Xinhua Education Group Ltd. | | | 294,000 | | | | 62,641 | |
| | China XLX Fertiliser Ltd. | | | 1,879,000 | | | | 1,318,822 | |
| | China Yongda Automobiles Services Holdings Ltd. | | | 5,088,000 | | | | 8,095,387 | |
# * | | China ZhengTong Auto Services Holdings Ltd. | | | 8,694,500 | | | | 1,060,418 | |
| | China Zheshang Bank Co. Ltd., Class H | | | 24,000 | | | | 9,653 | |
| | China Zhonghua Geotechnical Engineering Group Co. Ltd., Class A | | | 270,700 | | | | 112,315 | |
# * | | China Zhongwang Holdings Ltd. | | | 13,622,954 | | | | 2,941,529 | |
| | Chinasoft International Ltd. | | | 3,412,000 | | | | 5,697,116 | |
| | Chinese Universe Publishing & Media Group Co. Ltd., Class A | | | 536,800 | | | | 875,061 | |
DIMENSIONAL EMERGING MARKETS VALUE FUND
CONTINUED
| | | | | | | | | | |
| | | | | Shares | | | Value» | |
CHINA — (Continued) | | | | | | | | |
| | Chongqing Changan Automobile Co. Ltd., Class A | | | 1,390,513 | | | $ | 4,252,746 | |
| | Chongqing Department Store Co. Ltd., Class A | | | 222,784 | | | | 801,439 | |
| | Chongqing Dima Industry Co. Ltd., Class A | | | 1,242,992 | | | | 448,835 | |
| | Chongqing Machinery & Electric Co. Ltd., Class H | | | 1,022,000 | | | | 93,020 | |
| | Chongqing Rural Commercial Bank Co. Ltd., Class H | | | 16,097,000 | | | | 5,790,383 | |
| | Chongqing Zongshen Power Machinery Co. Ltd., Class A | | | 662,300 | | | | 678,696 | |
| | Chu Kong Shipping Enterprises Group Co. Ltd. | | | 526,000 | | | | 64,154 | |
| | CIFI Holdings Group Co. Ltd. | | | 18,714,758 | | | | 10,388,154 | |
| | CIMC Enric Holdings Ltd. | | | 4,910,000 | | | | 6,313,798 | |
* | | Cinda Real Estate Co. Ltd., Class A | | | 783,100 | | | | 392,905 | |
| | Cisen Pharmaceutical Co. Ltd., Class A | | | 161,500 | | | | 303,165 | |
* | | CITIC Guoan Information Industry Co. Ltd., Class A | | | 546,700 | | | | 191,873 | |
| | CITIC Ltd. | | | 25,131,483 | | | | 25,176,604 | |
* | | CITIC Resources Holdings Ltd. | | | 15,150,000 | | | | 1,066,873 | |
# | | CITIC Securities Co. Ltd., Class H | | | 4,885,500 | | | | 12,404,075 | |
# * | | Citychamp Watch & Jewellery Group Ltd. | | | 476,000 | | | | 80,243 | |
| | CMST Development Co. Ltd., Class A | | | 304,400 | | | | 290,896 | |
| | CNHTC Jinan Truck Co. Ltd., Class A | | | 340,258 | | | | 704,267 | |
| | CNNC Hua Yuan Titanium Dioxide Co. Ltd., Class A | | | 492,800 | | | | 1,061,702 | |
| | COFCO Biotechnology Co. Ltd., Class A | | | 469,400 | | | | 781,461 | |
# * W | | Cogobuy Group | | | 1,339,000 | | | | 491,805 | |
# | | Colour Life Services Group Co. Ltd. | | | 2,857,548 | | | | 500,497 | |
# | | Comba Telecom Systems Holdings Ltd. | | | 1,318,000 | | | | 366,999 | |
| | Concord New Energy Group Ltd. | | | 39,820,000 | | | | 4,199,123 | |
| | Consun Pharmaceutical Group Ltd. | | | 2,355,000 | | | | 1,009,240 | |
* | | Coolpad Group Ltd. | | | 13,182,079 | | | | 692,089 | |
| | COSCO SHIPPING Development Co. Ltd., Class H | | | 13,494,000 | | | | 2,622,186 | |
# | | COSCO SHIPPING Energy Transportation Co. Ltd., Class H | | | 8,686,000 | | | | 3,838,529 | |
| | COSCO SHIPPING International Hong Kong Co. Ltd. | | | 3,614,000 | | | | 1,159,813 | |
| | COSCO SHIPPING Ports Ltd. | | | 13,271,761 | | | | 11,047,224 | |
* W | | Cosmo Lady China Holdings Co. Ltd. | | | 642,000 | | | | 46,238 | |
| | Country Garden Holdings Co. Ltd. | | | 36,552,799 | | | | 34,396,440 | |
| | CP Pokphand Co. Ltd. | | | 10,346,000 | | | | 1,464,136 | |
# | | CPMC Holdings Ltd. | | | 4,586,000 | | | | 2,240,844 | |
| | CQ Pharmaceutical Holding Co. Ltd., Class A | | | 507,600 | | | | 379,207 | |
# * | | Crazy Sports Group Ltd. | | | 7,256,000 | | | | 365,148 | |
| | CSG Holding Co. Ltd., Class A | | | 567,849 | | | | 802,581 | |
| | CSPC Pharmaceutical Group Ltd. | | | 2,798,000 | | | | 2,919,712 | |
| | CSSC Hong Kong Shipping Co. Ltd. | | | 134,000 | | | | 19,787 | |
| | CTS International Logistics Corp. Ltd., Class A | | | 337,870 | | | | 651,205 | |
| | D&O Home Collection Co. Ltd., Class A | | | 147,557 | | | | 292,957 | |
# | | DaFa Properties Group Ltd. | | | 402,000 | | | | 260,477 | |
W | | Dali Foods Group Co. Ltd. | | | 3,807,500 | | | | 2,119,946 | |
| | Dalian Huarui Heavy Industry Group Co. Ltd., Class A | | | 619,671 | | | | 373,625 | |
| | Daqin Railway Co. Ltd., Class A | | | 6,459,961 | | | | 6,409,783 | |
| | Dare Power Dekor Home Co. Ltd., Class A | | | 144,600 | | | | 264,100 | |
| | Dashang Co. Ltd., Class A | | | 205,208 | | | | 624,332 | |
| | Dawnrays Pharmaceutical Holdings Ltd. | | | 684,000 | | | | 149,577 | |
* | | Dazhong Transportation Group Co. Ltd., Class A | | | 359,539 | | | | 185,380 | |
| | Dazzle Fashion Co. Ltd., Class A | | | 185,600 | | | | 542,957 | |
| | DBG Technology Co. Ltd., Class A | | | 298,278 | | | | 648,375 | |
| | Deppon Logistics Co. Ltd., Class A | | | 195,700 | | | | 334,257 | |
# | | Dexin China Holdings Co. Ltd. | | | 736,000 | | | | 246,922 | |
| | DHC Software Co. Ltd., Class A | | | 701,900 | | | | 761,282 | |
| | Digital China Group Co. Ltd., Class A | | | 227,300 | | | | 530,565 | |
| | Digital China Holdings Ltd. | | | 3,504,000 | | | | 1,889,011 | |
| | Digital China Information Service Co. Ltd., Class A | | | 316,700 | | | | 551,885 | |
| | Dong-E-E-Jiao Co. Ltd., Class A | | | 247,813 | | | | 1,570,672 | |
| | Dongfang Electric Corp. Ltd., Class H | | | 2,029,200 | | | | 3,237,845 | |
DIMENSIONAL EMERGING MARKETS VALUE FUND
CONTINUED
| | | | | | | | | | |
| | | | | Shares | | | Value» | |
CHINA — (Continued) | | | | | | | | |
* | | Dongfang Electronics Co. Ltd., Class A | | | 289,100 | | | $ | 277,203 | |
| | Dongfeng Motor Group Co. Ltd., Class H | | | 13,572,000 | | | | 12,640,377 | |
| | Dongjiang Environmental Co. Ltd., Class H | | | 51,000 | | | | 23,267 | |
| | Dongxing Securities Co. Ltd., Class A | | | 763,900 | | | | 1,308,341 | |
# | | Dongyue Group Ltd. | | | 3,020,000 | | | | 7,026,369 | |
| | Dynagreen Environmental Protection Group Co. Ltd., Class H | | | 340,000 | | | | 173,504 | |
# * | | E-Commodities Holdings Ltd. | | | 5,880,000 | | | | 621,937 | |
| | Edvantage Group Holdings Ltd. | | | 104,000 | | | | 67,659 | |
| | Elion Energy Co. Ltd., Class A | | | 807,498 | | | | 626,122 | |
* | | Enjoyor Co. Ltd., Class A | | | 103,300 | | | | 111,634 | |
| | ENN Natural Gas Co. Ltd., Class A | | | 219,900 | | | | 633,083 | |
* W | | ESR Cayman Ltd. | | | 457,200 | | | | 1,479,437 | |
# | | Essex Bio-technology Ltd. | | | 207,000 | | | | 140,899 | |
| | EVA Precision Industrial Holdings Ltd. | | | 3,990,000 | | | | 696,808 | |
* | | Everbright Jiabao Co. Ltd., Class A | | | 607,266 | | | | 245,671 | |
# W | | Everbright Securities Co. Ltd., Class H | | | 1,371,200 | | | | 1,070,851 | |
* | | Fang Holdings Ltd., ADR | | | 3,666 | | | | 21,335 | |
| | Fangda Carbon New Material Co. Ltd., Class A | | | 915,594 | | | | 1,538,736 | |
| | Fangda Special Steel Technology Co. Ltd., Class A | | | 631,970 | | | | 731,795 | |
# | | Fantasia Holdings Group Co. Ltd. | | | 14,882,515 | | | | 1,071,166 | |
# | | Far East Horizon Ltd. | | | 7,898,000 | | | | 7,530,298 | |
| | FAW Jiefang Group Co. Ltd. | | | 724,752 | | | | 1,181,430 | |
| | Fiberhome Telecommunication Technologies Co. Ltd., Class A | | | 327,778 | | | | 882,019 | |
* | | FIH Mobile Ltd. | | | 939,000 | | | | 146,068 | |
| | Financial Street Holdings Co. Ltd., Class A | | | 569,730 | | | | 522,171 | |
# | | FinVolution Group, ADR | | | 60,163 | | | | 368,198 | |
# | | First Tractor Co. Ltd., Class H | | | 718,000 | | | | 361,962 | |
| | Focused Photonics Hangzhou, Inc., Class A | | | 26,500 | | | | 76,597 | |
| | Foshan Nationstar Optoelectronics Co. Ltd., Class A | | | 216,100 | | | | 345,633 | |
| | Fosun International Ltd. | | | 12,910,683 | | | | 15,126,381 | |
| | Founder Securities Co. Ltd., Class A | | | 1,689,907 | | | | 2,154,848 | |
| | FriendTimes, Inc. | | | 338,000 | | | | 49,741 | |
| | Fu Shou Yuan International Group Ltd. | | | 3,066,000 | | | | 2,632,205 | |
| | Fuan Pharmaceutical Group Co. Ltd., Class A | | | 571,196 | | | | 352,507 | |
| | Fufeng Group Ltd. | | | 11,203,000 | | | | 3,878,173 | |
| | Fujian Longking Co. Ltd., Class A | | | 325,100 | | | | 412,772 | |
| | Fujian Longma Environmental Sanitation Equipment Co. Ltd., Class A | | | 164,900 | | | | 322,573 | |
| | Fujian Star-net Communication Co. Ltd., Class A | | | 196,200 | | | | 671,341 | |
| | Fujian Sunner Development Co. Ltd., Class A | | | 579,198 | | | | 2,033,426 | |
| | Gansu Qilianshan Cement Group Co. Ltd., Class A | | | 256,400 | | | | 386,658 | |
| | Gansu Shangfeng Cement Co. Ltd., Class A | | | 278,900 | | | | 757,475 | |
* †† | | GCL-Poly Energy Holdings Ltd. | | | 121,131,000 | | | | 23,119,277 | |
* | | GDS Holdings Ltd., Class A | | | 200,000 | | | | 1,502,008 | |
| | Geely Automobile Holdings Ltd. | | | 26,250,000 | | | | 91,104,288 | |
| | GEM Co. Ltd., Class A | | | 1,160,200 | | | | 1,973,356 | |
| | Gemdale Corp., Class A | | | 1,689,954 | | | | 2,680,122 | |
| | Gemdale Properties & Investment Corp. Ltd. | | | 33,376,000 | | | | 3,248,417 | |
W | | Genertec Universal Medical Group Co. Ltd. | | | 5,727,000 | | | | 4,320,605 | |
* | | Genimous Technology Co. Ltd., Class A | | | 124,700 | | | | 117,914 | |
| | GF Securities Co. Ltd., Class H | | | 4,802,600 | | | | 8,145,765 | |
* | | Glorious Property Holdings Ltd. | | | 18,846,000 | | | | 586,148 | |
* | | Glory Sun Financial Group Ltd. | | | 2,780,000 | | | | 96,305 | |
| | Goldcard Smart Group Co. Ltd. | | | 156,680 | | | | 265,318 | |
| | Golden Eagle Retail Group Ltd. | | | 12,000 | | | | 10,440 | |
| | GoldenHome Living Co. Ltd., Class A | | | 68,570 | | | | 321,105 | |
| | Goldenmax International Technology Ltd., Class A | | | 301,200 | | | | 627,138 | |
| | Goldlion Holdings Ltd. | | | 1,887,000 | | | | 408,946 | |
| | Goldpac Group Ltd. | | | 1,296,000 | | | | 296,930 | |
* | | Gosuncn Technology Group Co. Ltd., Class A | | | 333,100 | | | | 231,743 | |
DIMENSIONAL EMERGING MARKETS VALUE FUND
CONTINUED
| | | | | | | | | | |
| | | | | Shares | | | Value» | |
CHINA — (Continued) | | | | | | | | |
* | | Grand Baoxin Auto Group Ltd. | | | 5,444,500 | | | $ | 611,216 | |
* | | Grandjoy Holdings Group Co. Ltd., Class A | | | 1,447,500 | | | | 744,252 | |
| | Greattown Holdings Ltd., Class A | | | 1,264,000 | | | | 699,476 | |
| | Greatview Aseptic Packaging Co. Ltd. | | | 1,449,000 | | | | 595,285 | |
| | Gree Electric Appliances, Inc. of Zhuhai, Class A | | | 1,066,200 | | | | 6,089,475 | |
| | Greenland Holdings Corp. Ltd., Class A | | | 3,512,040 | | | | 2,256,167 | |
# | | Greenland Hong Kong Holdings Ltd. | | | 8,146,575 | | | | 1,732,382 | |
# | | Greentown China Holdings Ltd. | | | 6,258,591 | | | | 8,622,757 | |
| | GRG Banking Equipment Co. Ltd., Class A | | | 676,700 | | | | 1,094,484 | |
* | | Guangdong Dongfang Precision Science & Technology Co. Ltd., Class A | | | 896,900 | | | | 759,065 | |
| | Guangdong Ellington Electronics Technology Co. Ltd., Class A | | | 357,356 | | | | 372,000 | |
* | | Guangdong HEC Technology Holding Co. Ltd., Class A | | | 1,058,600 | | | | 1,755,556 | |
| | Guangdong Huatie Tongda High-speed Railway Equipment Corp., Class A | | | 465,100 | | | | 327,654 | |
| | Guangdong Shirongzhaoye Co. Ltd., Class A | | | 163,300 | | | | 124,313 | |
| | Guangdong Tapai Group Co. Ltd., Class A | | | 353,173 | | | | 555,349 | |
| | Guangdong Zhongsheng Pharmaceutical Co. Ltd., Class A | | | 344,634 | | | | 453,413 | |
* | | Guanghui Energy Co. Ltd., Class A | | | 3,273,638 | | | | 3,378,539 | |
# * | | Guangshen Railway Co. Ltd., Sponsored ADR | | | 266,120 | | | | 2,342,937 | |
| | Guangxi Liugong Machinery Co. Ltd., Class A | | | 354,190 | | | | 411,547 | |
| | Guangxi Liuzhou Pharmaceutical Co. Ltd., Class A | | | 152,811 | | | | 363,532 | |
| | Guangxi Wuzhou Zhongheng Group Co. Ltd., Class A | | | 2,136,800 | | | | 1,018,015 | |
| | Guangzhou Automobile Group Co. Ltd., Class H | | | 10,882,000 | | | | 10,272,167 | |
| | Guangzhou Baiyun International Airport Co. Ltd., Class A | | | 716,300 | | | | 1,325,292 | |
| | Guangzhou Baiyunshan Pharmaceutical Holdings Co. Ltd., Class H | | | 700,000 | | | | 1,769,723 | |
| | Guangzhou Haige Communications Group, Inc. Co., Class A | | | 480,200 | | | | 708,361 | |
# | | Guangzhou R&F Properties Co. Ltd., Class H | | | 11,917,514 | | | | 7,455,046 | |
| | Guangzhou Yuexiu Financial Holdings Group Co. Ltd., Class A | | | 566,190 | | | | 683,548 | |
| | Guangzhou Zhujiang Brewery Co. Ltd., Class A | | | 202,300 | | | | 313,026 | |
* | | Guizhou Bailing Group Pharmaceutical Co. Ltd., Class A | | | 133,200 | | | | 123,227 | |
* | | Guizhou Broadcasting & TV Information Network Co. Ltd., Class A | | | 371,676 | | | | 254,167 | |
| | Guizhou Panjiang Refined Coal Co. Ltd., Class A | | | 1,125,732 | | | | 1,353,489 | |
* | | Guizhou Xinbang Pharmaceutical Co. Ltd., Class A | | | 43,700 | | | | 46,490 | |
| | Guomai Technologies, Inc., Class A | | | 418,400 | | | | 374,506 | |
# * | | Guorui Properties Ltd. | | | 5,759,000 | | | | 254,401 | |
| | Guosen Securities Co. Ltd., Class A | | | 1,174,527 | | | | 2,093,412 | |
* | | Guosheng Financial Holding, Inc., Class A | | | 257,924 | | | | 376,497 | |
* W | | Guotai Junan Securities Co. Ltd., Class H | | | 1,914,200 | | | | 2,613,311 | |
| | Guoyuan Securities Co. Ltd., Class A | | | 771,550 | | | | 893,875 | |
* W | | Haichang Ocean Park Holdings Ltd. | | | 558,000 | | | | 141,156 | |
| | Haier Smart Home Co. Ltd., Class A | | | 2,528,488 | | | | 10,744,047 | |
| | Haier Smart Home Co. Ltd., Class H | | | 1,827,400 | | | | 6,804,676 | |
| | Hailir Pesticides & Chemicals Group Co. Ltd., Class A | | | 78,260 | | | | 219,329 | |
* | | Hainan Meilan International Airport Co. Ltd., Class H | | | 417,000 | | | | 1,687,373 | |
| | Haitian International Holdings Ltd. | | | 979,000 | | | | 2,853,289 | |
| | Haitong Securities Co. Ltd., Class H | | | 12,313,600 | | | | 10,954,438 | |
# W | | Haitong UniTrust International Leasing Co. Ltd., Class H | | | 158,000 | | | | 21,732 | |
| | Hand Enterprise Solutions Co. Ltd., Class A | | | 310,700 | | | | 320,501 | |
* | | Hang Zhou Great Star Industrial Co. Ltd., Class A | | | 275,500 | | | | 1,379,553 | |
| | Hangcha Group Co. Ltd., Class A | | | 166,900 | | | | 432,078 | |
| | Hangxiao Steel Structure Co. Ltd., Class A | | | 585,322 | | | | 326,532 | |
| | Hangzhou Century Co. Ltd., Class A | | | 277,800 | | | | 267,112 | |
| | Hangzhou Oxygen Plant Group Co. Ltd., Class A | | | 274,300 | | | | 1,112,080 | |
| | Hangzhou Zhongheng Electric Co. Ltd., Class A | | | 70,200 | | | | 93,253 | |
* W | | Harbin Bank Co. Ltd., Class H | | | 1,611,000 | | | | 165,726 | |
| | Harbin Electric Co. Ltd., Class H | | | 4,957,474 | | | | 2,097,167 | |
* | | Harbin Gloria Pharmaceuticals Co. Ltd., Class A | | | 370,900 | | | | 138,562 | |
| | HBIS Resources Co. Ltd., Class A | | | 58,300 | | | | 131,056 | |
# * | | HC Group, Inc. | | | 1,280,000 | | | | 132,101 | |
| | Health & Happiness H&H International Holdings Ltd. | | | 506,500 | | | | 1,185,555 | |
DIMENSIONAL EMERGING MARKETS VALUE FUND
CONTINUED
| | | | | | | | | | |
| | | | | Shares | | | Value» | |
CHINA — (Continued) | | | | | | | | |
| | Hebei Construction Group Corp. Ltd., Class H | | | 322,500 | | | $ | 81,556 | |
| | Hello Group, Inc. | | | 639,246 | | | | 7,958,613 | |
| | Henan Lingrui Pharmaceutical Co., Class A | | | 400,000 | | | | 668,638 | |
| | Henan Pinggao Electric Co. Ltd., Class A | | | 382,800 | | | | 528,018 | |
* | | Henan Senyuan Electric Co. Ltd., Class A | | | 116,300 | | | | 47,206 | |
| | Henan Shenhuo Coal & Power Co. Ltd., Class A | | | 607,600 | | | | 901,710 | |
| | Henan Thinker Automatic Equipment Co. Ltd., Class A | | | 33,420 | | | | 106,728 | |
| | Henan Yuguang Gold & Lead Co. Ltd., Class A | | | 53,100 | | | | 44,542 | |
| | Henan Zhongyuan Expressway Co. Ltd., Class A | | | 608,400 | | | | 299,521 | |
# | | Hengan International Group Co. Ltd. | | | 2,529,000 | | | | 13,216,382 | |
* | | Hengdeli Holdings Ltd. | | | 14,156,000 | | | | 518,775 | |
| | Hengdian Group DMEGC Magnetics Co. Ltd., Class A | | | 211,700 | | | | 466,898 | |
| | Hengli Petrochemical Co. Ltd., Class A | | | 1,986,065 | | | | 6,848,646 | |
| | Hengtong Optic-electric Co. Ltd., Class A | | | 654,008 | | | | 1,555,280 | |
| | Hengyi Petrochemical Co. Ltd., Class A | | | 1,565,641 | | | | 2,679,468 | |
| | Hesteel Co. Ltd., Class A | | | 3,844,300 | | | | 1,477,219 | |
| | Hexing Electrical Co. Ltd., Class A | | | 202,190 | | | | 371,843 | |
* | | Hi Sun Technology China Ltd. | | | 9,768,000 | | | | 1,318,219 | |
| | Hisense Home Appliances Group Co. Ltd., Class H | | | 405,000 | | | | 435,003 | |
* | | Holitech Technology Co. Ltd., Class A | | | 1,226,800 | | | | 623,714 | |
| | Hongda Xingye Co. Ltd., Class A | | | 819,256 | | | | 694,690 | |
* | | Honghua Group Ltd. | | | 15,729,000 | | | | 543,238 | |
* †† W Honworld Group Ltd. | | | 1,002,500 | | | | 296,672 | |
W | | Hope Education Group Co. Ltd. | | | 5,706,000 | | | | 1,017,653 | |
| | Hopson Development Holdings Ltd. | | | 5,251,400 | | | | 14,250,017 | |
†† | | Hua Han Health Industry Holdings Ltd. | | | 17,852,160 | | | | 258,128 | |
* W | | Hua Hong Semiconductor Ltd. | | | 2,808,000 | | | | 14,091,274 | |
| | Huaan Securities Co. Ltd., Class A | | | 1,731,080 | | | | 1,382,996 | |
| | Huadong Medicine Co. Ltd., Class A | | | 656,038 | | | | 3,745,384 | |
| | Huafa Industrial Co. Ltd. Zhuhai, Class A | | | 1,079,100 | | | | 886,855 | |
| | Huafon Chemical Co. Ltd., Class A | | | 859,548 | | | | 1,599,130 | |
* | | Huafon Microfibre Shanghai Technology Co. Ltd. | | | 680,900 | | | | 480,964 | |
* | | Huafu Fashion Co. Ltd., Class A | | | 458,898 | | | | 317,501 | |
| | Huagong Tech Co. Ltd., Class A | | | 203,200 | | | | 915,616 | |
| | Huapont Life Sciences Co. Ltd., Class A | | | 469,100 | | | | 453,647 | |
W | | Huatai Securities Co. Ltd., Class H | | | 5,375,400 | | | | 7,993,816 | |
* | | Huawen Media Group, Class A | | | 347,100 | | | | 124,929 | |
| | Huaxi Securities Co. Ltd., Class A | | | 1,072,555 | | | | 1,515,844 | |
| | Huaxia Bank Co. Ltd., Class A | | | 4,457,700 | | | | 3,920,282 | |
| | Huaxin Cement Co. Ltd., Class A | | | 691,428 | | | | 1,803,302 | |
| | Huayu Automotive Systems Co. Ltd., Class A | | | 1,269,645 | | | | 5,321,046 | |
| | Huazhong In-Vehicle Holdings Co. Ltd. | | | 1,364,000 | | | | 665,665 | |
| | Hubei Biocause Pharmaceutical Co. Ltd., Class A | | | 1,614,997 | | | | 819,864 | |
| | Hubei Jumpcan Pharmaceutical Co. Ltd., Class A | | | 398,494 | | | | 1,003,391 | |
| | Hubei Xingfa Chemicals Group Co. Ltd., Class A | | | 268,600 | | | | 2,088,023 | |
* | | Huishang Bank Corp. Ltd., Class H | | | 1,603,900 | | | | 546,178 | |
| | Hunan Aihua Group Co. Ltd., Class A | | | 97,600 | | | | 543,929 | |
* | | Hunan Gold Corp. Ltd., Class A | | | 391,600 | | | | 662,881 | |
| | Hunan New Wellful Co. Ltd., Class A | | | 150,300 | | | | 163,022 | |
| | Hunan Valin Steel Co. Ltd., Class A | | | 1,767,160 | | | | 1,474,828 | |
| | Huolinhe Opencut Coal Industry Corp. Ltd. of Inner Mongolia, Class A | | | 804,437 | | | | 1,598,675 | |
| | Hytera Communications Corp. Ltd., Class A | | | 591,700 | | �� | | 521,695 | |
# * W | | iDreamSky Technology Holdings Ltd. | | | 286,000 | | | | 202,900 | |
| | IKD Co. Ltd., Class A | | | 301,500 | | | | 645,534 | |
W | | IMAX China Holding, Inc. | | | 33,100 | | | | 48,405 | |
| | Industrial & Commercial Bank of China Ltd., Class H | | | 297,483,996 | | | | 163,069,444 | |
| | Industrial Bank Co. Ltd., Class A | | | 7,873,753 | | | | 22,915,151 | |
| | Industrial Securities Co. Ltd., Class A | | | 1,722,840 | | | | 2,456,867 | |
| | Infore Environment Technology Group Co. Ltd., Class A | | | 301,756 | | | | 295,134 | |
DIMENSIONAL EMERGING MARKETS VALUE FUND
CONTINUED
| | | | | | | | | | |
| | | | | Shares | | | Value» | |
CHINA — (Continued) | | | | | | | | |
# * | | Inke Ltd. | | | 1,693,000 | | | $ | 343,495 | |
* | | Inner Mongolia BaoTou Steel Union Co. Ltd., Class A | | | 10,243,400 | | | | 4,502,513 | |
| | Inner Mongolia Eerduosi Resources Co. Ltd., Class A | | | 50,100 | | | | 232,259 | |
| | Inner Mongolia Junzheng Energy & Chemical Industry Group Co. Ltd., Class A | | | 3,342,751 | | | | 2,677,595 | |
| | Inner Mongolia Yitai Coal Co. Ltd., Class H | | | 207,300 | | | | 157,196 | |
* | | Inner Mongolia Yuan Xing Energy Co. Ltd., Class A | | | 755,550 | | | | 903,062 | |
* | | Inspur International Ltd. | | | 246,000 | | | | 106,121 | |
* | | Inspur Software Co. Ltd., Class A | | | 99,926 | | | | 188,856 | |
* | | JD.com, Inc., Class A | | | 601,400 | | | | 23,542,996 | |
| | JH Educational Technology, Inc. | | | 72,000 | | | | 16,528 | |
| | Jiajiayue Group Co. Ltd., Class A | | | 220,300 | | | | 506,884 | |
| | Jiangling Motors Corp. Ltd., Class A | | | 265,329 | | | | 644,965 | |
# * | | Jiangnan Group Ltd. | | | 14,145,000 | | | | 544,795 | |
| | Jiangsu Changshu Rural Commercial Bank Co. Ltd., Class A | | | 1,269,262 | | | | 1,439,465 | |
| | Jiangsu Eastern Shenghong Co. Ltd., Class A | | | 7,953 | | | | 33,815 | |
| | Jiangsu Guotai International Group Co. Ltd., Class A | | | 521,260 | | | | 1,075,040 | |
| | Jiangsu Jiangyin Rural Commercial Bank Co. Ltd., Class A | | | 743,220 | | | | 443,738 | |
* | | Jiangsu Kanion Pharmaceutical Co. Ltd., Class A | | | 316,520 | | | | 464,224 | |
| | Jiangsu Nhwa Pharmaceutical Co. Ltd., Class A | | | 190,400 | | | | 437,401 | |
| | Jiangsu Provincial Agricultural Reclamation & Development Corp. | | | 926,261 | | | | 1,611,385 | |
| | Jiangsu Yuyue Medical Equipment & Supply Co. Ltd., Class A | | | 311,400 | | | | 1,715,139 | |
| | Jiangsu Zhangjiagang Rural Commercial Bank Co. Ltd., Class A | | | 819,132 | | | | 792,782 | |
| | Jiangsu Zhongnan Construction Group Co. Ltd., Class A | | | 1,560,374 | | | | 933,564 | |
| | Jiangsu Zhongtian Technology Co. Ltd., Class A | | | 1,109,600 | | | | 1,753,572 | |
| | Jiangsu Zijin Rural Commercial Bank Co. Ltd., Class A | | | 1,284,700 | | | | 644,118 | |
| | Jiangxi Copper Co. Ltd., Class H | | | 5,607,000 | | | | 9,791,607 | |
| | Jiangxi Wannianqing Cement Co. Ltd., Class A | | | 226,480 | | | | 405,948 | |
| | Jiangxi Zhengbang Technology Co. Ltd., Class A | | | 564,963 | | | | 883,743 | |
| | Jiangzhong Pharmaceutical Co. Ltd., Class A | | | 302,480 | | | | 544,501 | |
| | Jiayou International Logistics Co. Ltd., Class A | | | 11,830 | | | | 30,275 | |
| | Jiayuan International Group Ltd. | | | 4,741,776 | | | | 1,833,394 | |
| | Jilin Aodong Pharmaceutical Group Co. Ltd., Class A | | | 543,856 | | | | 1,342,742 | |
| | Jilin Jiutai Rural Commercial Bank Corp. Ltd., Class H | | | 42,830 | | | | 13,816 | |
* | | Jilin Zixin Pharmaceutical Industrial Co. Ltd., Class A | | | 470,200 | | | | 197,654 | |
| | Jinduicheng Molybdenum Co. Ltd., Class A | | | 322,700 | | | | 366,091 | |
# | | Jingrui Holdings Ltd. | | | 3,426,000 | | | | 961,889 | |
# * | | JinkoSolar Holding Co. Ltd., ADR | | | 257,591 | | | | 15,409,094 | |
* | | Jinneng Holding Shanxi Coal Industry Co. Ltd., Class A | | | 670,614 | | | | 1,129,574 | |
| | Jinneng Science&Technology Co. Ltd., Class A | | | 577,233 | | | | 1,276,911 | |
| | Jinyuan EP Co. Ltd., Class A | | | 283,400 | | | | 479,743 | |
| | Jiuzhitang Co. Ltd., Class A | | | 421,200 | | | | 559,189 | |
| | Jizhong Energy Resources Co. Ltd., Class A | | | 1,185,500 | | | | 1,158,809 | |
| | JNBY Design Ltd. | | | 406,000 | | | | 679,211 | |
| | Joincare Pharmaceutical Group Industry Co. Ltd., Class A | | | 851,916 | | | | 1,533,976 | |
| | Jointown Pharmaceutical Group Co. Ltd., Class A | | | 1,002,522 | | | | 2,125,949 | |
| | Joy City Property Ltd. | | | 19,480,000 | | | | 1,014,695 | |
# | | JOYY, Inc., ADR | | | 315,298 | | | | 15,887,866 | |
| | JSTI Group, Class A | | | 308,575 | | | | 272,771 | |
| | Ju Teng International Holdings Ltd. | | | 5,890,249 | | | | 1,010,812 | |
| | Juneyao Airlines Co. Ltd., Class A | | | 150,100 | | | | 373,020 | |
| | Jutal Offshore Oil Services Ltd. | | | 590,000 | | | | 79,236 | |
* | | Kai Yuan Holdings Ltd. | | | 41,600,000 | | | | 205,992 | |
# | | Kaisa Group Holdings Ltd. | | | 21,268,578 | | | | 3,267,398 | |
| | Kaisa Prosperity Holdings Ltd. | | | 276,000 | | | | 584,779 | |
* W | | Kangda International Environmental Co. Ltd. | | | 3,759,000 | | | | 397,246 | |
# * | | Kasen International Holdings Ltd. | | | 2,592,000 | | | | 237,874 | |
| | Kehua Data Co. Ltd., Class A | | | 111,390 | | | | 679,838 | |
| | Kingboard Holdings Ltd. | | | 4,890,845 | | | | 21,313,348 | |
DIMENSIONAL EMERGING MARKETS VALUE FUND
CONTINUED
| | | | | | | | | | |
| | | | | Shares | | | Value» | |
CHINA — (Continued) | | | | | | | | |
| | Kingboard Laminates Holdings Ltd. | | | 6,252,500 | | | $ | 9,801,473 | |
| | KingClean Electric Co. Ltd., Class A | | | 31,232 | | | | 121,884 | |
| | Kingsoft Corp. Ltd. | | | 2,399,200 | | | | 10,237,489 | |
| | Konka Group Co. Ltd., Class A | | | 271,000 | | | | 238,008 | |
| | KPC Pharmaceuticals, Inc., Class A | | | 364,200 | | | | 472,996 | |
* | | Kuang-Chi Technologies Co. Ltd., Class A | | | 76,770 | | | | 246,270 | |
| | Kunlun Energy Co. Ltd. | | | 27,886,000 | | | | 25,398,005 | |
| | Kunlun Tech Co. Ltd., Class A | | | 378,900 | | | | 1,102,382 | |
* | | Kunshan Kersen Science & Technology Co. Ltd., Class A | | | 183,085 | | | | 292,121 | |
| | KWG Group Holdings Ltd. | | | 9,210,500 | | | | 8,028,917 | |
| | KWG Living Group Holdings Ltd. | | | 6,977,250 | | | | 4,700,142 | |
| | Lao Feng Xiang Co. Ltd., Class A | | | 123,154 | | | | 923,726 | |
| | LB Group Co. Ltd., Class A | | | 668,233 | | | | 2,970,591 | |
| | Lee & Man Paper Manufacturing Ltd. | | | 9,816,000 | | | | 7,377,751 | |
# | | Lee’s Pharmaceutical Holdings Ltd. | | | 1,039,500 | | | | 487,730 | |
W | | Legend Holdings Corp., Class H | | | 2,487,600 | | | | 4,372,385 | |
| | Lenovo Group Ltd. | | | 32,338,000 | | | | 35,118,033 | |
| | Lens Technology Co. Ltd., Class A | | | 257,400 | | | | 856,440 | |
| | Leo Group Co. Ltd., Class A | | | 2,336,500 | | | | 832,590 | |
* | | LexinFintech Holdings Ltd., ADR | | | 111,218 | | | | 593,904 | |
| | Leyard Optoelectronic Co. Ltd., Class A | | | 966,400 | | | | 1,420,621 | |
| | Liaoning Cheng Da Co. Ltd., Class A | | | 400,300 | | | | 1,274,031 | |
| | Lier Chemical Co. Ltd., Class A | | | 174,900 | | | | 618,113 | |
* | | LingNan Eco&Culture-Tourism Co. Ltd., Class A | | | 394,293 | | | | 164,662 | |
| | Livzon Pharmaceutical Group, Inc., Class H | | | 460,800 | | | | 1,517,863 | |
| | Lizhong Sitong Light Alloys Group Co. Ltd., Class A | | | 60,300 | | | | 145,884 | |
| | Logan Group Co. Ltd. | | | 1,795,000 | | | | 1,798,054 | |
| | Loncin Motor Co. Ltd., Class A | | | 1,187,800 | | | | 811,516 | |
| | Long Yuan Construction Group Co. Ltd., Class A | | | 565,700 | | | | 635,231 | |
W | | Longfor Group Holdings Ltd. | | | 8,115,500 | | | | 39,262,132 | |
| | Longshine Technology Group Co. Ltd., Class A | | | 137,802 | | | | 697,978 | |
| | Lonking Holdings Ltd. | | | 14,226,000 | | | | 4,151,736 | |
| | Luenmei Quantum Co. Ltd., Class A | | | 519,200 | | | | 670,391 | |
* | | Luoniushan Co. Ltd., Class A | | | 661,991 | | | | 707,394 | |
| | Luxi Chemical Group Co. Ltd., Class A | | | 608,000 | | | | 1,560,163 | |
# * W | | Luye Pharma Group Ltd. | | | 11,745,000 | | | | 5,597,183 | |
# * | | LVGEM China Real Estate Investment Co. Ltd. | | | 2,054,000 | | | | 466,201 | |
# | | Maanshan Iron & Steel Co. Ltd., Class H | | | 5,659,775 | | | | 2,406,733 | |
* | | Macrolink Culturaltainment Development Co. Ltd., Class A | | | 59,400 | | | | 16,712 | |
* W | | Maoyan Entertainment | | | 264,800 | | | | 319,826 | |
* | | Maoye International Holdings Ltd. | | | 5,595,000 | | | | 200,154 | |
* | | Markor International Home Furnishings Co. Ltd., Class A | | | 928,600 | | | | 491,874 | |
| | Mayinglong Pharmaceutical Group Co. Ltd., Class A | | | 111,700 | | | | 439,295 | |
| | Metallurgical Corp. of China Ltd., Class H | | | 13,359,000 | | | | 3,705,385 | |
# W | | Midea Real Estate Holding Ltd. | | | 16,000 | | | | 27,614 | |
| | Min Xin Holdings Ltd. | | | 708,418 | | | | 391,739 | |
| | Ming Yang Smart Energy Group Ltd., Class A | | | 376,000 | | | | 1,819,904 | |
* | | Mingfa Group International Co. Ltd. | | | 608,000 | | | | 35,056 | |
| | Minmetals Land Ltd. | | | 9,789,205 | | | | 1,004,068 | |
W | | Minsheng Education Group Co. Ltd. | | | 1,078,000 | | | | 155,893 | |
| | Minth Group Ltd. | | | 3,478,000 | | | | 13,823,104 | |
* | | Misho Ecology & Landscape Co. Ltd., Class A | | | 45,400 | | | | 18,075 | |
| | MLS Co. Ltd., Class A | | | 513,262 | | | | 1,117,003 | |
* | | MOBI Development Co. Ltd. | | | 424,000 | | | | 20,144 | |
| | Modern Land China Co. Ltd. | | | 3,187,200 | | | | 155,663 | |
* | | Myhome Real Estate Development Group Co. Ltd., Class A | | | 81,500 | | | | 20,189 | |
| | MYS Group Co. Ltd., Class A | | | 393,300 | | | | 200,559 | |
| | NanJi E-Commerce Co. Ltd., Class A | | | 399,700 | | | | 446,971 | |
| | Nanjing Iron & Steel Co. Ltd., Class A | | | 879,300 | | | | 484,968 | |
DIMENSIONAL EMERGING MARKETS VALUE FUND
CONTINUED
| | | | | | | | | | |
| | | | | Shares | | | Value» | |
CHINA — (Continued) | | | | | | | | |
| | Nanjing Xinjiekou Department Store Co. Ltd., Class A | | | 570,500 | | | $ | 871,314 | |
| | NARI Technology Co. Ltd., Class A | | | 1,515,720 | | | | 9,229,102 | |
* | | NavInfo Co. Ltd., Class A | | | 404,200 | | | | 739,361 | |
| | NetDragon Websoft Holdings Ltd. | | | 1,050,000 | | | | 2,299,724 | |
| | New China Life Insurance Co. Ltd., Class H | | | 3,525,300 | | | | 10,170,102 | |
* | | New Hope Liuhe Co. Ltd., Class A | | | 1,449,264 | | | | 3,260,207 | |
* | | New World Department Store China Ltd. | | | 2,778,000 | | | | 477,644 | |
| | Newland Digital Technology Co. Ltd., Class A | | | 352,060 | | | | 829,245 | |
| | Nexteer Automotive Group Ltd. | | | 6,068,000 | | | | 7,489,047 | |
| | Nine Dragons Paper Holdings Ltd. | | | 11,759,000 | | | | 14,786,944 | |
| | Ningbo Huaxiang Electronic Co. Ltd., Class A | | | 364,355 | | | | 1,346,977 | |
| | Ningbo Joyson Electronic Corp., Class A | | | 293,341 | | | | 814,407 | |
| | Ningbo Sanxing Medical Electric Co. Ltd., Class A | | | 300,400 | | | | 571,349 | |
| | Ningbo Yunsheng Co. Ltd., Class A | | | 221,200 | | | | 363,445 | |
| | Ningbo Zhoushan Port Co. Ltd., Class A | | | 1,959,600 | | | | 1,147,648 | |
| | Ningxia Jiaze New Energy Co. Ltd., Class A | | | 104,000 | | | | 88,531 | |
| | Norinco International Cooperation Ltd., Class A | | | 92,800 | | | | 108,868 | |
| | North Huajin Chemical Industries Co. Ltd., Class A | | | 431,619 | | | | 397,985 | |
| | Northeast Pharmaceutical Group Co. Ltd., Class A | | | 454,424 | | | | 371,662 | |
| | Northeast Securities Co. Ltd., Class A | | | 765,100 | | | | 1,030,064 | |
# * | | NVC International Holdings Ltd. | | | 5,629,000 | | | | 124,662 | |
| | Offshore Oil Engineering Co. Ltd., Class A | | | 1,189,601 | | | | 864,443 | |
| | OFILM Group Co. Ltd., Class A | | | 740,600 | | | | 865,160 | |
| | ORG Technology Co. Ltd., Class A | | | 579,600 | | | | 606,293 | |
* | | Orient Group, Inc., Class A | | | 647,440 | | | | 295,280 | |
W | | Orient Securities Co. Ltd., Class H | | | 2,986,800 | | | | 2,450,680 | |
| | Oriental Pearl Group Co. Ltd., Class A | | | 912,860 | | | | 1,102,205 | |
* | | Ourpalm Co. Ltd., Class A | | | 878,900 | | | | 534,049 | |
* | | Overseas Chinese Town Asia Holdings Ltd. | | | 1,014,000 | | | | 188,214 | |
* | | Pangang Group Vanadium Titanium & Resources Co. Ltd., Class A | | | 1,100,200 | | | | 686,771 | |
| | PAX Global Technology Ltd. | | | 5,504,000 | | | | 5,504,000 | |
| | PCI Technology Group Co. Ltd., Class A | | | 582,600 | | | | 690,546 | |
| | People’s Insurance Co. Group of China Ltd., Class H | | | 32,141,000 | | | | 10,025,522 | |
| | Perfect World Co. Ltd., Class A | | | 299,000 | | | | 810,771 | |
| | PetroChina Co. Ltd., Class H | | | 130,158,000 | | | | 62,755,344 | |
| | PhiChem Corp., Class A | | | 136,300 | | | | 377,537 | |
| | PICC Property & Casualty Co. Ltd., Class H | | | 34,389,000 | | | | 32,014,283 | |
| | Ping An Bank Co. Ltd., Class A | | | 5,732,573 | | | | 17,461,513 | |
| | Ping An Insurance Group Co. of China Ltd., Class H | | | 20,578,500 | | | | 147,398,227 | |
| | Pingdingshan Tianan Coal Mining Co. Ltd., Class A | | | 1,073,103 | | | | 1,429,726 | |
* | | Polaris Bay Group Co. Ltd., Class A | | | 568,670 | | | | 818,449 | |
* | | Poly Culture Group Co. Ltd., Class H | | | 402,000 | | | | 279,634 | |
| | Poly Property Group Co. Ltd. | | | 15,332,488 | | | | 3,782,299 | |
W | | Postal Savings Bank of China Co. Ltd., Class H | | | 30,055,000 | | | | 21,843,772 | |
* | | Pou Sheng International Holdings Ltd. | | | 8,805,000 | | | | 1,481,663 | |
| | Power Construction Corp. of China Ltd., Class A | | | 5,627,420 | | | | 7,241,012 | |
| | Powerlong Real Estate Holdings Ltd. | | | 10,843,000 | | | | 7,428,214 | |
# | | Prinx Chengshan Holding Ltd. | | | 214,000 | | | | 198,542 | |
| | Pujiang International Group Ltd. | | | 128,000 | | | | 58,186 | |
# | | PW Medtech Group Ltd. | | | 1,439,000 | | | | 221,513 | |
| | Q Technology Group Co. Ltd. | | | 1,983,000 | | | | 2,895,005 | |
| | Qingdao East Steel Tower Stock Co. Ltd., Class A | | | 188,500 | | | | 230,293 | |
| | Qingdao Eastsoft Communication Technology Co. Ltd., Class A | | | 171,436 | | | | 475,756 | |
| | Qingdao Hanhe Cable Co. Ltd., Class A | | | 1,114,800 | | | | 751,914 | |
W | | Qingdao Port International Co. Ltd., Class H | | | 802,000 | | | | 403,103 | |
| | Qingdao Topscomm Communication, Inc., Class A | | | 193,580 | | | | 208,335 | |
| | Qingling Motors Co. Ltd., Class H | | | 5,656,000 | | | | 1,273,546 | |
| | Qinhuangdao Port Co. Ltd., Class H | | | 845,000 | | | | 135,501 | |
* | | Qudian, Inc., Sponsored ADR | | | 362,937 | | | | 606,105 | |
DIMENSIONAL EMERGING MARKETS VALUE FUND
CONTINUED
| | | | | | | | | | |
| | | | | Shares | | | Value» | |
CHINA — (Continued) | | | | | | | | |
| | Rainbow Digital Commercial Co. Ltd., Class A | | | 588,176 | | | $ | 584,135 | |
| | Raisecom Technology Co. Ltd., Class A | | | 164,000 | | | | 155,124 | |
| | Rastar Group, Class A | | | 653,946 | | | | 314,434 | |
| | Realcan Pharmaceutical Group Co. Ltd., Class A | | | 467,929 | | | | 257,923 | |
* W | | Red Star Macalline Group Corp. Ltd., Class H | | | 1,834,297 | | | | 1,028,984 | |
# W | | Redco Properties Group Ltd. | | | 2,684,000 | | | | 824,420 | |
# | | Redsun Properties Group Ltd. | | | 2,854,000 | | | | 823,055 | |
| | Renhe Pharmacy Co. Ltd., Class A | | | 672,100 | | | | 995,423 | |
| | REXLot Holdings Ltd. | | | 67,831,618 | | | | 34,001 | |
| | Rianlon Corp., Class A | | | 25,716 | | | | 157,073 | |
| | RiseSun Real Estate Development Co. Ltd., Class A | | | 1,888,376 | | | | 1,266,416 | |
| | Rongan Property Co. Ltd., Class A | | | 1,399,700 | | | | 520,436 | |
# | | Ronshine China Holdings Ltd. | | | 2,969,500 | | | | 1,200,801 | |
| | Runjian Co. Ltd., Class A | | | 45,400 | | | | 218,275 | |
* | | RYB Education, Inc., ADR | | | 17,090 | | | | 44,776 | |
| | SAIC Motor Corp. Ltd., Class A | | | 1,570,273 | | | | 4,983,249 | |
| | Sailun Group Co. Ltd., Class A | | | 1,632,000 | | | | 3,405,498 | |
* | | SanFeng Intelligent Equipment Group Co. Ltd., Class A | | | 405,848 | | | | 229,282 | |
| | Sansteel Minguang Co. Ltd. Fujian, Class A | | | 986,480 | | | | 1,056,808 | |
| | Sany Heavy Equipment International Holdings Co. Ltd. | | | 5,544,000 | | | | 6,308,618 | |
* | | Saurer Intelligent Technology Co. Ltd., Class A | | | 357,100 | | | | 158,553 | |
| | Sealand Securities Co. Ltd., Class A | | | 1,779,595 | | | | 1,073,590 | |
| | Seazen Group Ltd. | | | 2,400,000 | | | | 1,898,587 | |
| | Seazen Holdings Co. Ltd., Class A | | | 1,012,915 | | | | 5,411,385 | |
| | SGIS Songshan Co. Ltd., Class A | | | 773,600 | | | | 535,390 | |
| | Shaanxi Coal Industry Co. Ltd., Class A | | | 3,735,445 | | | | 7,320,259 | |
| | Shan Xi Hua Yang Group New Energy Co. Ltd., Class A | | | 967,200 | | | | 1,605,726 | |
| | Shandong Buchang Pharmaceuticals Co. Ltd., Class A | | | 623,402 | | | | 1,704,839 | |
# | | Shandong Chenming Paper Holdings Ltd., Class H | | | 2,725,227 | | | | 1,310,799 | |
# W | | Shandong Gold Mining Co. Ltd., Class H | | | 2,296,250 | | | | 4,151,530 | |
| | Shandong Himile Mechanical Science & Technology Co. Ltd., Class A | | | 24,600 | | | | 96,060 | |
| | Shandong Hualu Hengsheng Chemical Co. Ltd., Class A | | | 851,969 | | | | 4,143,558 | |
| | Shandong Humon Smelting Co. Ltd., Class A | | | 275,500 | | | | 494,040 | |
| | Shandong Linglong Tyre Co. Ltd., Class A | | | 445,587 | | | | 2,463,266 | |
| | Shandong Longda Meat Foodstuff Co. Ltd., Class A | | | 389,046 | | | | 611,459 | |
| | Shandong Minhe Animal Husbandry Co. Ltd., Class A | | | 232,600 | | | | 579,956 | |
| | Shandong Nanshan Aluminum Co. Ltd., Class A | | | 2,898,350 | | | | 1,959,183 | |
| | Shandong New Beiyang Information Technology Co. Ltd., Class A | | | 280,600 | | | | 340,702 | |
| | Shandong Publishing & Media Co. Ltd., Class A | | | 290,233 | | | | 277,583 | |
| | Shandong Sun Paper Industry JSC Ltd., Class A | | | 1,227,281 | | | | 2,201,696 | |
| | Shandong Weigao Group Medical Polymer Co. Ltd., Class H | | | 8,420,000 | | | | 14,342,040 | |
| | Shandong Xiantan Co. Ltd., Class A | | | 61,800 | | | | 68,357 | |
| | Shandong Xinhua Pharmaceutical Co. Ltd., Class H | | | 646,000 | | | | 316,002 | |
| | Shandong Yisheng Livestock & Poultry Breeding Co. Ltd., Class A | | | 346,440 | | | | 575,389 | |
* | | Shanghai 2345 Network Holding Group Co. Ltd., Class A | | | 1,979,100 | | | | 622,221 | |
| | Shanghai AJ Group Co. Ltd., Class A | | | 869,352 | | | | 880,804 | |
| | Shanghai Daimay Automotive Interior Co. Ltd., Class A | | | 64,562 | | | | 187,832 | |
| | Shanghai Electric Group Co. Ltd., Class H | | | 10,734,000 | | | | 3,024,094 | |
| | Shanghai Environment Group Co. Ltd., Class A | | | 300,489 | | | | 545,350 | |
| | Shanghai Fengyuzhu Culture & Technology Co. Ltd., Class A | | | 174,870 | | | | 454,540 | |
| | Shanghai Fosun Pharmaceutical Group Co. Ltd., Class H | | | 970,500 | | | | 4,568,378 | |
| | Shanghai Industrial Development Co. Ltd., Class A | | | 986,190 | | | | 598,130 | |
| | Shanghai Industrial Holdings Ltd. | | | 3,585,918 | | | | 5,350,887 | |
| | Shanghai Industrial Urban Development Group Ltd. | | | 19,682,501 | | | | 1,694,393 | |
| | Shanghai International Port Group Co. Ltd., Class A | | | 2,613,716 | | | | 2,309,395 | |
| | Shanghai Jahwa United Co. Ltd., Class A | | | 150,768 | | | | 1,127,856 | |
| | Shanghai Jin Jiang Capital Co. Ltd., Class H | | | 15,170,000 | | | | 3,438,336 | |
| | Shanghai Jinjiang International Hotels Co. Ltd., Class A | | | 217,750 | | | | 1,832,369 | |
| | Shanghai Lingang Holdings Corp. Ltd., Class A | | | 314,160 | | | | 720,888 | |
DIMENSIONAL EMERGING MARKETS VALUE FUND
CONTINUED
| | | | | | | | | | |
| | | | | Shares | | | Value» | |
CHINA — (Continued) | | | | | | | | |
| | Shanghai Lujiazui Finance & Trade Zone Development Co. Ltd., Class A | | | 450,558 | | | $ | 762,083 | |
| | Shanghai Maling Aquarius Co. Ltd., Class A | | | 450,140 | | | | 550,018 | |
| | Shanghai Mechanical & Electrical Industry Co. Ltd., Class A | | | 175,890 | | | | 398,581 | |
| | Shanghai Pharmaceuticals Holding Co. Ltd., Class H | | | 5,566,300 | | | | 10,187,590 | |
| | Shanghai Pudong Construction Co. Ltd., Class A | | | 162,593 | | | | 146,209 | |
| | Shanghai Pudong Development Bank Co. Ltd., Class A | | | 7,828,778 | | | | 10,934,329 | |
| | Shanghai RAAS Blood Products Co. Ltd., Class A | | | 1,975,086 | | | | 2,035,582 | |
| | Shanghai Rongtai Health Technology Corp. Ltd., Class A | | | 44,000 | | | | 194,642 | |
| | Shanghai Shimao Co. Ltd., Class A | | | 624,696 | | | | 308,559 | |
| | Shanghai Shyndec Pharmaceutical Co. Ltd., Class A | | | 485,500 | | | | 708,195 | |
| | Shanghai Sinyang Semiconductor Materials Co. Ltd., Class A | | | 6,792 | | | | 42,020 | |
| | Shanghai Tongji Science & Technology Industrial Co. Ltd., Class A | | | 112,100 | | | | 135,013 | |
| | Shanghai Tunnel Engineering Co. Ltd., Class A | | | 370,334 | | | | 295,814 | |
| | Shanghai Waigaoqiao Free Trade Zone Group Co. Ltd., Class A | | | 119,800 | | | | 241,525 | |
| | Shanghai Yuyuan Tourist Mart Group Co. Ltd., Class A | | | 1,055,262 | | | | 1,620,198 | |
| | Shanghai Zhangjiang High-Tech Park Development Co. Ltd., Class A | | | 474,600 | | | | 1,235,901 | |
| | Shanghai Zijiang Enterprise Group Co. Ltd., Class A | | | 397,300 | | | | 603,698 | |
| | Shanxi Blue Flame Holding Co. Ltd., Class A | | | 315,028 | | | | 451,478 | |
| | Shanxi Coking Coal Energy Group Co. Ltd., Class A | | | 1,514,935 | | | | 2,199,523 | |
| | Shanxi Lu’an Environmental Energy Development Co. Ltd., Class A | | | 1,040,880 | | | | 2,112,438 | |
* | | Shanxi Meijin Energy Co. Ltd., Class A | | | 1,348,132 | | | | 2,380,856 | |
| | Shanxi Securities Co. Ltd., Class A | | | 1,173,460 | | | | 1,147,550 | |
| | Shanxi Taigang Stainless Steel Co. Ltd., Class A | | | 2,150,800 | | | | 2,593,091 | |
| | Shanying International Holding Co. Ltd., Class A | | | 1,210,500 | | | | 613,047 | |
| | Shenghe Resources Holding Co. Ltd., Class A | | | 36,360 | | | | 115,600 | |
* W | | Shengjing Bank Co. Ltd., Class H | | | 481,000 | | | | 432,356 | |
| | Shenguan Holdings Group Ltd. | | | 3,610,000 | | | | 187,696 | |
W | | Shenwan Hongyuan Group Co. Ltd., Class H | | | 4,616,800 | | | | 1,166,301 | |
| | Shenzhen Agricultural Products Group Co. Ltd., Class A | | | 908,126 | | | | 985,263 | |
* | | Shenzhen Airport Co. Ltd., Class A | | | 492,100 | | | | 581,935 | |
| | Shenzhen Aisidi Co. Ltd., Class A | | | 405,800 | | | | 679,709 | |
| | Shenzhen Bauing Construction Holding Group Co. Ltd., Class A | | | 430,400 | | | | 170,794 | |
| | Shenzhen Center Power Tech Co. Ltd., Class A | | | 80,000 | | | | 207,688 | |
| | Shenzhen Comix Group Co. Ltd., Class A | | | 105,400 | | | | 109,134 | |
| | Shenzhen Ellassay Fashion Co. Ltd., Class A | | | 29,500 | | | | 65,888 | |
| | Shenzhen Gas Corp. Ltd., Class A | | | 760,100 | | | | 1,077,438 | |
| | Shenzhen Gongjin Electronics Co. Ltd., Class A | | | 269,900 | | | | 335,153 | |
* | | Shenzhen Grandland Group Co. Ltd., Class A | | | 108,000 | | | | 38,124 | |
| | Shenzhen Hepalink Pharmaceutical Group Co. Ltd., Class A | | | 290,220 | | | | 696,466 | |
| | Shenzhen Heungkong Holding Co. Ltd., Class A | | | 640,300 | | | | 188,110 | |
| | Shenzhen International Holdings Ltd. | | | 6,449,190 | | | | 7,764,283 | |
# | | Shenzhen Investment Ltd. | | | 22,924,414 | | | | 5,622,912 | |
| | Shenzhen Jinjia Group Co. Ltd., Class A | | | 705,783 | | | | 1,193,545 | |
| | Shenzhen Kinwong Electronic Co. Ltd., Class A | | | 220,840 | | | | 891,909 | |
* | | Shenzhen MTC Co. Ltd., Class A | | | 1,364,600 | | | | 1,048,277 | |
* | | Shenzhen Neptunus Bioengineering Co. Ltd., Class A | | | 1,280,948 | | | | 620,526 | |
| | Shenzhen Overseas Chinese Town Co. Ltd., Class A | | | 3,406,961 | | | | 3,334,844 | |
* | | Shenzhen SDG Information Co. Ltd., Class A | | | 337,800 | | | | 316,571 | |
| | Shenzhen Suntak Circuit Technology Co. Ltd., Class A | | | 296,908 | | | | 639,797 | |
| | Shenzhen Tagen Group Co. Ltd., Class A | | | 553,400 | | | | 435,747 | |
| | Shenzhen Woer Heat-Shrinkable Material Co. Ltd., Class A | | | 384,100 | | | | 440,726 | |
| | Shenzhen World Union Group, Inc., Class A | | | 947,381 | | | | 555,306 | |
| | Shenzhen Yinghe Technology Co. Ltd., Class A | | | 190,058 | | | | 928,882 | |
| | Shenzhen Ysstech Info-tech Co. Ltd., Class A | | | 260,300 | | | | 398,980 | |
| | Shenzhen YUTO Packaging Technology Co. Ltd., Class A | | | 107,294 | | | | 549,218 | |
| | Shenzhen Zhenye Group Co. Ltd., Class A | | | 780,600 | | | | 509,370 | |
| | Shenzhen Zhongjin Lingnan Nonfemet Co. Ltd., Class A | | | 837,000 | | | | 647,619 | |
* | | Shijiazhuang Changshan BeiMing Technology Co. Ltd., Class A | | | 683,200 | | | | 692,609 | |
| | Shijiazhuang Yiling Pharmaceutical Co. Ltd., Class A | | | 839,424 | | | | 2,108,580 | |
DIMENSIONAL EMERGING MARKETS VALUE FUND
CONTINUED
| | | | | | | | | | |
| | | | | Shares | | | Value» | |
CHINA — (Continued) | | | | | | | | |
| | Shimao Group Holdings Ltd. | | | 9,280,035 | | | $ | 14,557,421 | |
| | Shinva Medical Instrument Co. Ltd., Class A | | | 159,000 | | | | 541,329 | |
# | | Shoucheng Holdings Ltd. | | | 10,423,683 | | | | 2,207,467 | |
| | Shougang Fushan Resources Group Ltd. | | | 13,988,277 | | | | 3,694,989 | |
* | | Shouhang High-Tech Energy Co. Ltd., Class A | | | 354,500 | | | | 180,955 | |
| | Shui On Land Ltd. | | | 27,217,803 | | | | 4,031,852 | |
* | | Sichuan Hebang Biotechnology Co. Ltd., Class A | | | 1,233,800 | | | | 686,150 | |
| | Sichuan Kelun Pharmaceutical Co. Ltd., Class A | | | 699,455 | | | | 1,934,654 | |
* | | Sichuan Languang Development Co. Ltd., Class A | | | 1,550,800 | | | | 419,251 | |
| | Sichuan Shuangma Cement Co. Ltd., Class A | | | 226,378 | | | | 708,042 | |
| | Sichuan Tianyi Comheart Telecom Co. Ltd., Class A | | | 72,998 | | | | 184,936 | |
| | Sieyuan Electric Co. Ltd., Class A | | | 182,700 | | | | 1,184,589 | |
# | | Sihuan Pharmaceutical Holdings Group Ltd. | | | 16,059,000 | | | | 3,370,099 | |
* | | Silver Grant International Holdings Group Ltd. | | | 6,302,804 | | | | 411,980 | |
| | Sino Biopharmaceutical Ltd. | | | 1,397,000 | | | | 1,030,126 | |
| | Sinochem International Corp., Class A | | | 575,231 | | | | 816,157 | |
| | Sinofert Holdings Ltd. | | | 13,934,000 | | | | 2,178,837 | |
| | Sinolink Securities Co. Ltd., Class A | | | 612,600 | | | | 1,026,553 | |
* | | Sinolink Worldwide Holdings Ltd. | | | 16,481,714 | | | | 530,344 | |
| | Sinoma International Engineering Co., Class A | | | 417,000 | | | | 677,469 | |
| | Sinoma Science & Technology Co. Ltd., Class A | | | 624,062 | | | | 3,687,152 | |
| | Sinomach Automobile Co. Ltd., Class A | | | 510,561 | | | | 505,076 | |
| | Sino-Ocean Group Holding Ltd. | | | 22,125,602 | | | | 4,808,654 | |
| | Sinopec Engineering Group Co. Ltd., Class H | | | 10,056,500 | | | | 5,300,512 | |
| | Sinopec Kantons Holdings Ltd. | | | 7,434,000 | | | | 2,830,467 | |
* | | Sinopec Oilfield Service Corp., Class H | | | 780,000 | | | | 74,977 | |
| | Sinopec Shanghai Petrochemical Co. Ltd., Sponsored ADR | | | 13,270 | | | | 309,987 | |
| | Sinopec Shanghai Petrochemical Co. Ltd., Class H | | | 16,670,000 | | | | 3,889,705 | |
| | Sinopharm Group Co. Ltd., Class H | | | 8,526,400 | | | | 20,246,052 | |
# | | Sinosoft Technology Group Ltd. | | | 2,140,000 | | | | 280,634 | |
| | Sinotrans Ltd., Class H | | | 15,798,000 | | | | 5,193,145 | |
| | Sinotruk Hong Kong Ltd. | | | 5,178,835 | | | | 7,148,221 | |
| | Skyfame Realty Holdings Ltd. | | | 1,546,000 | | | | 182,440 | |
| | Skyworth Digital Co. Ltd., Class A | | | 450,948 | | | | 510,362 | |
* | | Skyworth Group Ltd. | | | 9,558,116 | | | | 5,324,946 | |
* | | SOHO China Ltd. | | | 14,655,388 | | | | 3,722,348 | |
| | SooChow Securities Co. Ltd., Class A | | | 771,100 | | | | 1,021,230 | |
* | | Sou Yu Te Group Co. Ltd., Class A | | | 1,430,300 | | | | 328,425 | |
* | | South Manganese Investment Ltd. | | | 1,449,000 | | | | 228,937 | |
| | Southwest Securities Co. Ltd., Class A | | | 339,200 | | | | 255,031 | |
* | | Spring Airlines Co. Ltd., Class A | | | 203,441 | | | | 1,859,400 | |
* | | SPT Energy Group, Inc. | | | 4,862,000 | | | | 192,311 | |
| | SSY Group Ltd. | | | 4,256,000 | | | | 2,021,753 | |
* | | Starrise Media Holdings Ltd. | | | 270,000 | | | | 4,935 | |
| | Sun King Technology Group Ltd. | | | 568,000 | | | | 322,123 | |
| | Sunac China Holdings Ltd. | | | 13,496,000 | | | | 28,861,529 | |
* W | | Sunac Services Holdings Ltd. | | | 297 | | | | 599 | |
| | Sunflower Pharmaceutical Group Co. Ltd., Class A | | | 266,300 | | | | 594,874 | |
| | Sunfly Intelligent Technology Co. Ltd., Class A | | | 128,600 | | | | 243,590 | |
* | | Suning Universal Co. Ltd., Class A | | | 1,450,705 | | | | 1,087,115 | |
* | | Suning.com Co. Ltd., Class A | | | 1,980,900 | | | | 1,383,368 | |
* W | | Sunshine 100 China Holdings Ltd. | | | 249,000 | | | | 14,418 | |
| | Sunward Intelligent Equipment Co. Ltd., Class A | | | 318,700 | | | | 402,881 | |
* | | Sunwave Communications Co. Ltd., Class A | | | 271,570 | | | | 224,461 | |
| | Suzhou Anjie Technology Co. Ltd., Class A | | | 112,900 | | | | 243,376 | |
| | Suzhou Dongshan Precision Manufacturing Co. Ltd., Class A | | | 522,900 | | | | 1,663,278 | |
| | Suzhou Gold Mantis Construction Decoration Co. Ltd., Class A | | | 763,175 | | | | 711,909 | |
* | | Tahoe Group Co. Ltd., Class A | | | 803,106 | | | | 248,824 | |
| | Tangshan Jidong Cement Co. Ltd., Class A | | | 476,244 | | | | 864,972 | |
DIMENSIONAL EMERGING MARKETS VALUE FUND
CONTINUED
| | | | | | | | | | |
| | | | | Shares | | | Value» | |
CHINA — (Continued) | | | | | | | | |
| | TangShan Port Group Co. Ltd., Class A | | | 1,421,690 | | | $ | 593,097 | |
| | Tangshan Sanyou Chemical Industries Co. Ltd., Class A | | | 660,100 | | | | 952,417 | |
* | | Taung Gold International Ltd. | | | 5,980,000 | | | | 19,105 | |
| | TBEA Co. Ltd., Class A | | | 879,959 | | | | 3,725,239 | |
| | TCL Electronics Holdings Ltd. | | | 6,351,666 | | | | 3,443,828 | |
| | TCL Technology Group Corp., Class A | | | 3,045,935 | | | | 2,887,539 | |
| | Tech-Bank Food Co. Ltd., Class A | | | 647,250 | | | | 635,693 | |
| | Ten Pao Group Holdings Ltd. | | | 304,000 | | | | 75,273 | |
* | | Tencent Music Entertainment Group, ADR | | | 1,939,143 | | | | 15,241,664 | |
†† | | Tenwow International Holdings Ltd. | | | 2,984,000 | | | | 54,652 | |
| | Tian An China Investment Co. Ltd. | | | 4,049,000 | | | | 2,341,771 | |
| | Tian Di Science & Technology Co. Ltd., Class A | | | 992,900 | | | | 649,022 | |
* W | | Tian Ge Interactive Holdings Ltd. | | | 1,433,000 | | | | 164,253 | |
# | | Tiangong International Co. Ltd. | | | 4,350,000 | | | | 2,617,012 | |
| | Tianjin Capital Environmental Protection Group Co. Ltd., Class H | | | 24,000 | | | | 11,861 | |
| | Tianjin Chase Sun Pharmaceutical Co. Ltd., Class A | | | 1,996,711 | | | | 1,273,474 | |
| | Tianjin Guangyu Development Co. Ltd., Class A | | | 922,700 | | | | 2,413,868 | |
| | Tianjin Port Development Holdings Ltd. | | | 16,373,657 | | | | 1,367,243 | |
| | Tianjin ZhongXin Pharmaceutical Group Corp. Ltd., Class A | | | 196,749 | | | | 823,355 | |
| | Tianli Education International Holdings Ltd. | | | 462,000 | | | | 96,056 | |
| | Tianma Microelectronics Co. Ltd., Class A | | | 856,224 | | | | 1,648,296 | |
# | | Tianneng Power International Ltd. | | | 5,058,000 | | | | 5,775,694 | |
* | | Tianyun International Holdings Ltd. | | | 1,132,000 | | | | 208,094 | |
| | Tibet Tianlu Co. Ltd., Class A | | | 242,700 | | | | 240,889 | |
* | | Time Watch Investments Ltd. | | | 92,000 | | | | 9,797 | |
| | Times China Holdings Ltd. | | | 411,000 | | | | 279,667 | |
| | Tingyi Cayman Islands Holding Corp. | | | 6,648,000 | | | | 12,408,381 | |
| | Titan Wind Energy Suzhou Co. Ltd., Class A | | | 526,900 | | | | 1,753,558 | |
| | Tomson Group Ltd. | | | 3,354,526 | | | | 817,272 | |
| | Tong Ren Tang Technologies Co. Ltd., Class H | | | 2,382,000 | | | | 1,690,203 | |
* | | Tongcheng-Elong Holdings Ltd. | | | 2,164,000 | | | | 4,822,802 | |
* | | Tongda Group Holdings Ltd. | | | 37,575,000 | | | | 1,205,636 | |
| | Tongkun Group Co. Ltd., Class A | | | 547,222 | | | | 1,707,471 | |
| | Tongling Jingda Special Magnet Wire Co. Ltd., Class A | | | 584,400 | | | | 708,324 | |
| | Tongling Nonferrous Metals Group Co. Ltd., Class A | | | 2,493,900 | | | | 1,445,885 | |
# | | Top Spring International Holdings Ltd. | | | 146,000 | | | | 22,070 | |
| | Topsec Technologies Group, Inc., Class A | | | 250,515 | | | | 721,623 | |
| | Transfar Zhilian Co. Ltd., Class A | | | 1,128,500 | | | | 1,444,339 | |
| | TravelSky Technology Ltd., Class H | | | 1,011,000 | | | | 1,889,009 | |
* | | Trigiant Group Ltd. | | | 4,254,000 | | | | 354,999 | |
* | | Trip.com Group Ltd., ADR | | | 1,765,245 | | | | 50,415,397 | |
†† | | Trony Solar Holdings Co. Ltd. | | | 8,775,000 | | | | 0 | |
| | Truly International Holdings Ltd. | | | 166,000 | | | | 54,120 | |
* | | Tunghsu Optoelectronic Technology Co. Ltd., Class A | | | 1,525,000 | | | | 472,209 | |
* | | Tus Environmental Science & Technology Development Co. Ltd., Class A | | | 377,920 | | | | 228,786 | |
| | Unilumin Group Co. Ltd., Class A | | | 406,300 | | | | 520,141 | |
| | Uni-President China Holdings Ltd. | | | 3,090,000 | | | | 2,633,578 | |
| | Unisplendour Corp. Ltd., Class A | | | 924,760 | | | | 4,006,918 | |
| | United Energy Group Ltd. | | | 6,978,000 | | | | 617,246 | |
| | Universal Scientific Industrial Shanghai Co. Ltd., Class A | | | 457,637 | | | | 993,218 | |
| | Valiant Co. Ltd., Class A | | | 12,000 | | | | 38,606 | |
| | Vats Liquor Chain Store Management JSC Ltd., Class A | | | 96,400 | | | | 592,414 | |
| | Vatti Corp. Ltd., Class A | | | 363,850 | | | | 335,097 | |
# | | Vinda International Holdings Ltd. | | | 1,089,000 | | | | 3,002,517 | |
# * | | Viomi Technology Co. Ltd., ADR | | | 95,951 | | | | 423,144 | |
* | | Vipshop Holdings Ltd., ADR | | | 1,604,040 | | | | 17,901,086 | |
# W | | Virscend Education Co. Ltd. | | | 530,000 | | | | 35,558 | |
| | Wangneng Environment Co. Ltd., Class A | | | 116,940 | | | | 295,104 | |
| | Wangsu Science & Technology Co. Ltd., Class A | | | 837,700 | | | | 716,927 | |
DIMENSIONAL EMERGING MARKETS VALUE FUND
CONTINUED
| | | | | | | | | | |
| | | | | Shares | | | Value» | |
CHINA — (Continued) | | | | | | | | |
| | Want Want China Holdings Ltd. | | | 8,949,000 | | | $ | 6,940,355 | |
| | Wanxiang Qianchao Co. Ltd., Class A | | | 1,400,160 | | | | 1,309,709 | |
| | Wasion Holdings Ltd. | | | 3,404,000 | | | | 1,166,318 | |
| | Wasu Media Holding Co. Ltd., Class A | | | 341,086 | | | | 389,230 | |
| | Weichai Power Co. Ltd., Class H | | | 7,541,000 | | | | 13,498,137 | |
| | Weifu High-Technology Group Co. Ltd., Class A | | | 168,400 | | | | 510,851 | |
| | Weiqiao Textile Co., Class H | | | 3,037,000 | | | | 1,134,988 | |
| | Wellhope Foods Co. Ltd., Class A | | | 618,088 | | | | 884,565 | |
| | Wens Foodstuffs Group Co. Ltd., Class A | | | 2,850,445 | | | | 7,333,842 | |
| | West China Cement Ltd. | | | 17,048,000 | | | | 2,978,962 | |
| | Western Securities Co. Ltd., Class A | | | 927,448 | | | | 1,110,949 | |
| | Wharf Holdings Ltd. | | | 1,054,000 | | | | 3,664,515 | |
| | Wisdom Education International Holdings Co. Ltd. | | | 2,030,000 | | | | 347,725 | |
| | Wolong Electric Group Co. Ltd., Class A | | | 363,300 | | | | 840,029 | |
| | Wuchan Zhongda Group Co. Ltd., Class A | | | 1,479,800 | | | | 1,452,371 | |
* | | Wuhan DDMC Culture & Sports Co. Ltd., Class A | | | 366,500 | | | | 346,405 | |
| | Wuhan Department Store Group Co. Ltd., Class A | | | 430,300 | | | | 679,687 | |
* | | Wuhan P&S Information Technology Co. Ltd., Class A | | | 497,200 | | | | 470,714 | |
| | Wuhu Token Science Co. Ltd., Class A | | | 802,700 | | | | 1,288,229 | |
| | Wuxi Taiji Industry Co. Ltd., Class A | | | 733,524 | | | | 917,432 | |
| | XCMG Construction Machinery Co. Ltd., Class A | | | 3,532,500 | | | | 3,380,256 | |
| | XGD, Inc., Class A | | | 150,800 | | | | 223,454 | |
W | | Xiabuxiabu Catering Management China Holdings Co. Ltd. | | | 251,000 | | | | 182,891 | |
| | Xiamen C & D, Inc., Class A | | | 978,400 | | | | 1,223,812 | |
| | Xiamen Comfort Science & Technology Group Co. Ltd., Class A | | | 357,900 | | | | 608,112 | |
| | Xiamen International Airport Co. Ltd., Class A | | | 45,826 | | | | 114,273 | |
| | Xiamen International Port Co. Ltd., Class H | | | 6,710,000 | | | | 746,902 | |
| | Xiamen ITG Group Corp. Ltd., Class A | | | 525,902 | | | | 568,499 | |
| | Xiamen Tungsten Co. Ltd., Class A | | | 299,740 | | | | 1,062,917 | |
| | Xiamen Xiangyu Co. Ltd., Class A | | | 517,700 | | | | 626,606 | |
| | Xiandai Investment Co. Ltd., Class A | | | 184,100 | | | | 115,209 | |
| | Xilinmen Furniture Co. Ltd., Class A | | | 224,100 | | | | 922,628 | |
| | Xinfengming Group Co. Ltd., Class A | | | 144,260 | | | | 330,960 | |
| | Xingda International Holdings Ltd. | | | 8,916,001 | | | | 2,025,152 | |
| | Xingfa Aluminium Holdings Ltd. | | | 447,000 | | | | 545,039 | |
| | Xinhu Zhongbao Co. Ltd., Class A | | | 2,810,943 | | | | 1,264,983 | |
| | Xinhua Winshare Publishing & Media Co. Ltd., Class H | | | 1,828,000 | | | | 1,336,400 | |
| | Xinjiang Communications Construction Group Co. Ltd., Class A | | | 89,300 | | | | 147,822 | |
# | | Xinjiang Goldwind Science & Technology Co. Ltd., Class H | | | 2,324,400 | | | | 5,198,042 | |
| | Xinjiang Tianshan Cement Co. Ltd., Class A | | | 310,600 | | | | 662,246 | |
* | | Xinjiang Xinxin Mining Industry Co. Ltd., Class H | | | 1,208,000 | | | | 243,609 | |
| | Xinjiang Zhongtai Chemical Co. Ltd., Class A | | | 387,600 | | | | 640,298 | |
| | Xinxing Ductile Iron Pipes Co. Ltd., Class A | | | 1,389,600 | | | | 806,008 | |
| | Xinyangfeng Agricultural Technology Co. Ltd., Class A | | | 313,100 | | | | 889,774 | |
| | Xinyi Energy Holdings Ltd. | | | 218,000 | | | | 128,541 | |
| | Xinyu Iron & Steel Co. Ltd., Class A | | | 944,300 | | | | 872,295 | |
| | Xinyuan Real Estate Co. Ltd., ADR | | | 88,681 | | | | 101,983 | |
# | | Xtep International Holdings Ltd. | | | 3,518,498 | | | | 4,601,480 | |
| | Xuji Electric Co. Ltd., Class A | | | 233,200 | | | | 722,125 | |
* | | Yanchang Petroleum International Ltd. | | | 8,710,000 | | | | 88,317 | |
| | Yango Group Co. Ltd., Class A | | | 1,683,600 | | | | 846,398 | |
| | Yantai Changyu Pioneer Wine Co. Ltd., Class A | | | 199,900 | | | | 985,804 | |
| | Yantai Jereh Oilfield Services Group Co. Ltd., Class A | | | 296,888 | | | | 1,956,097 | |
# | | Yanzhou Coal Mining Co. Ltd., Class H | | | 10,432,000 | | | | 15,473,341 | |
* | | Yeahka Ltd. | | | 53,200 | | | | 160,680 | |
# * W | | YiChang HEC ChangJiang Pharmaceutical Co. Ltd., Class H | | | 1,646,200 | | | | 769,658 | |
| | Yifan Pharmaceutical Co. Ltd., Class A | | | 430,300 | | | | 1,102,156 | |
| | Yintai Gold Co. Ltd., Class A | | | 980,174 | | | | 1,346,066 | |
| | Yip’s Chemical Holdings Ltd. | | | 842,000 | | | | 498,158 | |
DIMENSIONAL EMERGING MARKETS VALUE FUND
CONTINUED
| | | | | | | | | | |
| | | | | Shares | | | Value» | |
CHINA — (Continued) | | | | | | | | |
* | | Yiren Digital Ltd., Sponsored ADR | | | 127,021 | | | $ | 398,846 | |
| | Yixintang Pharmaceutical Group Co. Ltd., Class A | | | 304,763 | | | | 1,512,671 | |
| | Yonghui Superstores Co. Ltd., Class A | | | 2,348,700 | | | | 1,444,183 | |
| | Yotrio Group Co. Ltd., Class A | | | 1,258,400 | | | | 681,555 | |
| | Youngor Group Co. Ltd., Class A | | | 1,650,413 | | | | 1,657,180 | |
* | | Youzu Interactive Co. Ltd., Class A | | | 318,800 | | | | 660,395 | |
| | Yuexiu Property Co. Ltd. | | | 12,249,357 | | | | 10,763,377 | |
| | Yum China Holdings, Inc. | | | 447,580 | | | | 25,547,866 | |
| | Yunda Holding Co. Ltd., Class A | | | 932,989 | | | | 2,721,895 | |
* | | Yunnan Aluminium Co. Ltd., Class A | | | 838,700 | | | | 1,561,321 | |
| | Yunnan Baiyao Group Co. Ltd., Class A | | | 263,127 | | | | 3,683,599 | |
| | Yunnan Copper Co. Ltd., Class A | | | 483,200 | | | | 1,003,150 | |
* | | Yunnan Tin Co. Ltd., Class A | | | 466,300 | | | | 1,193,991 | |
| | Yutong Bus Co. Ltd., Class A | | | 493,800 | | | | 874,791 | |
| | Yuzhou Group Holdings Co. Ltd. | | | 17,694,265 | | | | 1,929,094 | |
* | | Zall Smart Commerce Group Ltd. | | | 570,000 | | | | 35,902 | |
* | | Zepp Health Corp., ADR | | | 10,874 | | | | 89,276 | |
# | | Zhaojin Mining Industry Co. Ltd., Class H | | | 1,878,000 | | | | 1,337,055 | |
| | Zhefu Holding Group Co. Ltd., Class A | | | 706,800 | | | | 789,679 | |
* | | Zhejiang Century Huatong Group Co. Ltd., Class A | | | 2,293,054 | | | | 2,658,283 | |
| | Zhejiang China Commodities City Group Co. Ltd., Class A | | | 310,300 | | | | 236,737 | |
| | Zhejiang Chint Electrics Co. Ltd., Class A | | | 1,010,503 | | | | 9,534,592 | |
| | Zhejiang Communications Technology Co. Ltd. | | | 294,400 | | | | 238,929 | |
| | Zhejiang Dahua Technology Co. Ltd., Class A | | | 1,251,923 | | | | 4,264,696 | |
| | Zhejiang Garden Bio-Chemical High-tech Co. Ltd., Class A | | | 126,864 | | | | 264,625 | |
# †† | | Zhejiang Glass Co. Ltd. | | | 437,000 | | | | 0 | |
| | Zhejiang Hailiang Co. Ltd., Class A | | | 650,665 | | | | 1,070,755 | |
| | Zhejiang Hangmin Co. Ltd., Class A | | | 625,181 | | | | 530,850 | |
| | Zhejiang Hisoar Pharmaceutical Co. Ltd., Class A | | | 1,033,800 | | | | 1,256,233 | |
| | Zhejiang Huace Film & Television Co. Ltd., Class A | | | 333,832 | | | | 294,414 | |
| | Zhejiang Jiahua Energy Chemical Industry Co. Ltd., Class A | | | 470,400 | | | | 719,011 | |
| | Zhejiang Jianfeng Group Co. Ltd., Class A | | | 52,300 | | | | 93,198 | |
* | | Zhejiang Jingu Co. Ltd., Class A | | | 579,000 | | | | 638,913 | |
| | Zhejiang Jingxin Pharmaceutical Co. Ltd., Class A | | | 406,551 | | | | 512,087 | |
| | Zhejiang Juhua Co. Ltd., Class A | | | 505,207 | | | | 1,226,910 | |
| | Zhejiang Longsheng Group Co. Ltd., Class A | | | 1,312,233 | | | | 2,551,430 | |
| | Zhejiang Medicine Co. Ltd., Class A | | | 641,500 | | | | 1,599,268 | |
| | Zhejiang Narada Power Source Co. Ltd., Class A | | | 237,200 | | | | 418,672 | |
| | Zhejiang NHU Co. Ltd., Class A | | | 1,038,721 | | | | 4,402,467 | |
| | Zhejiang Orient Financial Holdings Group Co. Ltd., Class A | | | 1,775,900 | | | | 1,130,460 | |
| | Zhejiang Runtu Co. Ltd., Class A | | | 378,930 | | | | 523,544 | |
| | Zhejiang Satellite Petrochemical Co. Ltd., Class A | | | 441,840 | | | | 2,692,258 | |
| | Zhejiang Semir Garment Co. Ltd., Class A | | | 538,299 | | | | 632,094 | |
| | Zhejiang Wanfeng Auto Wheel Co. Ltd., Class A | | | 1,340,900 | | | | 1,102,529 | |
| | Zhejiang Wanliyang Co. Ltd., Class A | | | 366,141 | | | | 773,546 | |
| | Zhejiang Xianju Pharmaceutical Co. Ltd., Class A | | | 165,900 | | | | 286,044 | |
| | Zhejiang Xinan Chemical Industrial Group Co. Ltd., Class A | | | 138,400 | | | | 598,573 | |
| | Zhejiang Yankon Group Co. Ltd., Class A | | | 91,700 | | | | 52,302 | |
| | Zhejiang Yasha Decoration Co. Ltd., Class A | | | 749,426 | | | | 870,149 | |
| | Zhejiang Zhongcheng Packing Material Co. Ltd., Class A | | | 180,300 | | | | 190,089 | |
# | | Zhengzhou Coal Mining Machinery Group Co. Ltd., Class H | | | 1,429,600 | | | | 1,499,385 | |
# | | Zhenro Properties Group Ltd. | | | 2,822,000 | | | | 1,341,268 | |
* | | Zhong An Group Ltd. | | | 15,060,600 | | | | 600,709 | |
* | | Zhongfu Straits Pingtan Development Co. Ltd., Class A | | | 293,000 | | | | 125,508 | |
| | Zhongjin Gold Corp. Ltd., Class A | | | 1,506,102 | | | | 1,952,284 | |
| | Zhongshan Broad Ocean Motor Co. Ltd., Class A | | | 567,100 | | | | 602,699 | |
* | | Zhongtian Financial Group Co. Ltd., Class A | | | 2,289,900 | | | | 898,744 | |
| | Zhongyuan Environment-Protection Co. Ltd., Class A | | | 163,500 | | | | 155,313 | |
| | Zhuguang Holdings Group Co. Ltd. | | | 230,000 | | | | 50,511 | |
DIMENSIONAL EMERGING MARKETS VALUE FUND
CONTINUED
| | | | | | | | | | |
| | | | | Shares | | | Value» | |
CHINA — (Continued) | | | | | | | | |
* | | Zhuzhou CRRC Times Electric Co., Class H | | | 972,800 | | | $ | 4,648,538 | |
| | Zhuzhou Kibing Group Co. Ltd., Class A | | | 795,846 | | | | 1,975,110 | |
| | Zibo Qixiang Tengda Chemical Co. Ltd., Class A | | | 679,000 | | | | 1,192,406 | |
| | Zoomlion Heavy Industry Science & Technology Co. Ltd., Class H | | | 8,877,400 | | | | 6,394,235 | |
| | ZTE Corp., Class H | | | 2,876,200 | | | | 8,633,877 | |
| | ZTO Express Cayman, Inc., ADR | | | 327,385 | | | | 9,602,202 | |
| | ZTO Express Cayman, Inc. | | | 46,400 | | | | 1,376,318 | |
| | | | | | | | | | |
TOTAL CHINA | | | | | | | 4,173,952,043 | |
| | | | | | | | | | |
COLOMBIA — (0.1%) | | | | | | | | |
| | Bancolombia SA, Sponsored ADR | | | 3,602 | | | | 129,420 | |
| | Cementos Argos SA | | | 205,090 | | | | 345,835 | |
* | | Corp. Financiera Colombiana SA | | | 20,431 | | | | 160,975 | |
| | Grupo Argos SA | | | 1,529,091 | | | | 4,791,435 | |
| | Grupo de Inversiones Suramericana SA | | | 1,052,559 | | | | 6,135,235 | |
| | Mineros SA | | | 128,115 | | | | 136,935 | |
| | | | | | | | | | |
TOTAL COLOMBIA | | | | | | | 11,699,835 | |
| | | | | | | | | | |
CZECH REPUBLIC — (0.2%) | | | | | | | | |
| | CEZ AS | | | 523,898 | | | | 17,303,008 | |
* | | Komercni banka AS | | | 80,788 | | | | 3,133,615 | |
| | | | | | | | | | |
TOTAL CZECH REPUBLIC | | | | | | | 20,436,623 | |
| | | | | | | | | | |
GREECE — (0.2%) | | | | | | | | |
* | | Alpha Services & Holdings SA | | | 5,340,099 | | | | 6,807,883 | |
| | Autohellas Tourist & Trading SA | | | 38,797 | | | | 357,742 | |
| | Bank of Greece | | | 39,163 | | | | 765,418 | |
* | | Ellaktor SA | | | 594,352 | | | | 946,313 | |
* | | Eurobank Ergasias Services & Holdings SA, Class A | | | 5,879,649 | | | | 6,175,497 | |
* | | Fourlis Holdings SA | | | 61,713 | | | | 274,322 | |
* | | GEK Terna Holding Real Estate Construction SA | | | 1,073 | | | | 12,030 | |
| | Hellenic Petroleum SA | | | 149,657 | | | | 1,031,831 | |
* | | Intracom Holdings SA | | | 327,815 | | | | 758,817 | |
| | JUMBO SA | | | 25,081 | | | | 373,314 | |
* | | LAMDA Development SA | | | 77,929 | | | | 642,280 | |
* | | Motor Oil Hellas Corinth Refineries SA | | | 32,065 | | | | 544,272 | |
| | Mytilineos SA | | | 382,362 | | | | 6,987,484 | |
* | | National Bank of Greece SA | | | 2,200,866 | | | | 6,949,747 | |
* | | Piraeus Financial Holdings SA | | | 103,515 | | | | 176,902 | |
| | Titan Cement International SA | | | 57,498 | | | | 999,805 | |
| | | | | | | | | | |
TOTAL GREECE | | | | | | | 33,803,657 | |
| | | | | | | | | | |
HONG KONG — (0.2%) | | | | | | | | |
†† | | Anxin-China Holdings Ltd. | | | 6,152,000 | | | | 0 | |
# | | Atlas Corp. | | | 209,127 | | | | 2,927,778 | |
| | BYD Electronic International Co. Ltd. | | | 3,850,000 | | | | 11,429,146 | |
* | | China Energy Engineering Corp. | | | 7,387,830 | | | | 2,747,650 | |
†† | | Karce International Holdings | | | 640,000 | | | | 0 | |
* | | MMG Ltd. | | | 8,736,000 | | | | 4,035,176 | |
†† | | Realgold Resources Corp. | | | 3,137,500 | | | | 0 | |
| | Sun Art Retail Group Ltd. | | | 322,000 | | | | 188,776 | |
| | Texhong Textile Group Ltd. | | | 906,000 | | | | 1,351,879 | |
†† | | Untrade Youyuan Holdings | | | 4,485,251 | | | | 0 | |
†† | | Untrade. C Fiber Optic | | | 3,598,000 | | | | 0 | |
†† | | Untrade.CTEG | | | 9,748,000 | | | | 79,933 | |
| | | | | | | | | | |
TOTAL HONG KONG | | | | | | | 22,760,338 | |
| | | | | | | | | | |
DIMENSIONAL EMERGING MARKETS VALUE FUND
CONTINUED
| | | | | | | | | | |
| | | | | Shares | | | Value» | |
HUNGARY — (0.3%) | | | | | | | | |
| | MOL Hungarian Oil & Gas PLC | | | 3,506,064 | | | $ | 29,960,428 | |
* | | OTP Bank Nyrt | | | 67,128 | | | | 4,033,548 | |
| | | | | | | | | | |
TOTAL HUNGARY | | | | | | | 33,993,976 | |
| | | | | | | | | | |
INDIA — (13.7%) | | | | | | | | |
| | Aarti Drugs Ltd. | | | 35,366 | | | | 276,679 | |
| | ACC Ltd. | | | 338,836 | | | | 10,591,965 | |
| | Adani Enterprises Ltd. | | | 725,123 | | | | 13,808,518 | |
* | | Adani Green Energy Ltd. | | | 469,757 | | | | 7,235,796 | |
| | Adani Ports & Special Economic Zone Ltd. | | | 66,956 | | | | 622,871 | |
* | | Adani Power Ltd. | | | 1,868,617 | | | | 2,553,598 | |
| | Adani Total Gas Ltd. | | | 139,991 | | | | 2,719,707 | |
* | | Adani Transmission Ltd. | | | 571,651 | | | | 13,638,827 | |
* | | Aditya Birla Capital Ltd. | | | 2,879,031 | | | | 3,720,809 | |
| | Alembic Ltd. | | | 483,755 | | | | 673,271 | |
| | Allcargo Logistics Ltd. | | | 394,520 | | | | 1,421,635 | |
| | Amara Raja Batteries Ltd. | | | 4,029 | | | | 36,765 | |
| | Ambuja Cements Ltd. | | | 3,672,156 | | | | 19,861,025 | |
* †† | | Amtek Auto Ltd. | | | 941,223 | | | | 6,481 | |
| | Andhra Sugars Ltd. | | | 2,618 | | | | 22,373 | |
| | Apar Industries Ltd. | | | 8,379 | | | | 76,234 | |
| | Apollo Tyres Ltd. | | | 1,942,429 | | | | 5,564,461 | |
* | | Arvind Fashions Ltd. | | | 354,092 | | | | 1,420,610 | |
* | | Arvind Ltd. | | | 830,228 | | | | 1,462,557 | |
* W | | Aster DM Healthcare Ltd. | | | 28,695 | | | | 71,562 | |
| | Aurobindo Pharma Ltd. | | | 1,890,744 | | | | 17,510,362 | |
* | | Axis Bank Ltd. | | | 6,005,724 | | | | 60,004,333 | |
* | | Bajaj Hindusthan Sugar Ltd. | | | 69,831 | | | | 12,684 | |
| | Bajaj Holdings & Investment Ltd. | | | 278,067 | | | | 17,887,718 | |
| | Balmer Lawrie & Co. Ltd. | | | 470,215 | | | | 793,675 | |
| | Balrampur Chini Mills Ltd. | | | 990,244 | | | | 4,348,618 | |
| | Banco Products India Ltd. | | | 31,150 | | | | 76,530 | |
W | | Bandhan Bank Ltd. | | | 102,664 | | | | 400,853 | |
* | | Bank of Baroda | | | 4,146,066 | | | | 5,422,705 | |
* | | Bank of Maharashtra | | | 578,945 | | | | 161,386 | |
| | BEML Ltd. | | | 83,433 | | | | 1,793,530 | |
| | Bharat Bijlee Ltd. | | | 651 | | | | 13,014 | |
| | Bharat Dynamics Ltd. | | | 18,498 | | | | 100,126 | |
| | Bharat Electronics Ltd. | | | 4,584,348 | | | | 12,738,533 | |
* | | Bharat Heavy Electricals Ltd. | | | 5,700,069 | | | | 5,203,509 | |
| | Bharti Airtel Ltd. | | | 96,444 | | | | 365,909 | |
| | Birla Corp. Ltd. | | | 158,657 | | | | 3,231,028 | |
| | Birlasoft Ltd. | | | 927,461 | | | | 5,068,408 | |
| | Bliss Gvs Pharma Ltd. | | | 8,394 | | | | 12,456 | |
| | Bodal Chemicals Ltd. | | | 160,661 | | | | 264,018 | |
| | Bombay Burmah Trading Co. | | | 5,726 | | | | 82,582 | |
| | Brigade Enterprises Ltd. | | | 341,618 | | | | 2,146,762 | |
| | BSE Ltd. | | | 119,329 | | | | 2,112,143 | |
* | | Camlin Fine Sciences Ltd. | | | 11,938 | | | | 26,534 | |
| | Can Fin Homes Ltd. | | | 2,029 | | | | 17,024 | |
* | | Canara Bank | | | 1,449,186 | | | | 4,158,760 | |
* | | Capacit’e Infraprojects Ltd. | | | 41,710 | | | | 92,612 | |
| | Ceat Ltd. | | | 165,941 | | | | 2,786,994 | |
| | Century Enka Ltd. | | | 8,587 | | | | 50,965 | |
| | Century Textiles & Industries Ltd. | | | 37,750 | | | | 396,121 | |
* | | CG Power & Industrial Solutions Ltd. | | | 2,276,310 | | | | 4,524,912 | |
| | Chambal Fertilizers & Chemicals Ltd. | | | 891,271 | | | | 4,422,714 | |
†† | | Chennai Super Kings Cricket Ltd. | | | 5,080,767 | | | | 28,626 | |
| | Cholamandalam Financial Holdings Ltd. | | | 420,899 | | | | 3,942,309 | |
DIMENSIONAL EMERGING MARKETS VALUE FUND
CONTINUED
| | | | | | | | | | |
| | | | | Shares | | | Value» | |
INDIA — (Continued) | | | | | | | | |
| | Cipla Ltd. | | | 896,605 | | | $ | 10,913,166 | |
| | City Union Bank Ltd. | | | 1,110,844 | | | | 2,528,787 | |
| | Clariant Chemicals India Ltd. | | | 1,534 | | | | 11,286 | |
W | | Cochin Shipyard Ltd. | | | 39,788 | | | | 186,249 | |
| | Container Corp. Of India Ltd. | | | 357,502 | | | | 3,146,352 | |
* | | CSB Bank Ltd. | | | 20,356 | | | | 80,365 | |
| | Cyient Ltd. | | | 124,698 | | | | 1,778,492 | |
| | Dalmia Bharat Ltd. | | | 284,948 | | | | 7,675,859 | |
| | Dalmia Bharat Sugar & Industries Ltd. | | | 2,005 | | | | 10,571 | |
| | DB Corp. Ltd. | | | 113,948 | | | | 149,423 | |
* | | DCB Bank Ltd. | | | 1,192,136 | | | | 1,452,957 | |
| | DCM Shriram Ltd. | | | 292,320 | | | | 3,860,378 | |
* | | DCW Ltd. | | | 78,814 | | | | 50,086 | |
| | Deepak Fertilisers & Petrochemicals Corp. Ltd. | | | 278,985 | | | | 1,504,787 | |
| | Delta Corp. Ltd. | | | 51,743 | | | | 180,117 | |
* | | DEN Networks Ltd. | | | 47,436 | | | | 28,410 | |
| | Dhampur Sugar Mills Ltd. | | | 189,843 | | | | 749,357 | |
* | | Dhani Services Ltd. | | | 23,401 | | | | 56,306 | |
W | | Dilip Buildcon Ltd. | | | 108,385 | | | | 870,437 | |
* | | Dish TV India Ltd. | | | 2,132,040 | | | | 493,872 | |
* | | Dishman Carbogen Amcis Ltd. | | | 329,786 | | | | 908,820 | |
| | DLF Ltd. | | | 2,100,800 | | | | 11,245,263 | |
| | Dr Reddy’s Laboratories Ltd., ADR | | | 71,016 | | | | 4,363,223 | |
* | | DRC Systems India Ltd. | | | 4,728 | | | | 25,065 | |
| | Dwarikesh Sugar Industries Ltd. | | | 31,979 | | | | 30,402 | |
| | eClerx Services Ltd. | | | 13,413 | | | | 393,214 | |
| | Edelweiss Financial Services Ltd. | | | 1,371,920 | | | | 1,420,187 | |
* | | EID Parry India Ltd. | | | 563,199 | | | | 3,441,766 | |
* | | EIH Ltd. | | | 422,487 | | | | 783,946 | |
| | Electrosteel Castings Ltd. | | | 24,101 | | | | 10,872 | |
| | Engineers India Ltd. | | | 156,347 | | | | 152,189 | |
| | EPL Ltd. | | | 45,190 | | | | 130,038 | |
| | Escorts Ltd. | | | 190,424 | | | | 4,031,406 | |
| | Everest Kanto Cylinder Ltd. | | | 6,104 | | | | 9,168 | |
| | Excel Industries Ltd. | | | 2,342 | | | | 30,028 | |
| | Exide Industries Ltd. | | | 280,804 | | | | 649,465 | |
* | | FDC Ltd. | | | 69,318 | | | | 296,656 | |
| | Federal Bank Ltd. | | | 10,486,940 | | | | 13,723,062 | |
| | FIEM Industries Ltd. | | | 2,615 | | | | 43,832 | |
| | Filatex India Ltd. | | | 35,790 | | | | 47,917 | |
| | Finolex Cables Ltd. | | | 495,237 | | | | 3,107,605 | |
| | Finolex Industries Ltd. | | | 741,795 | | | | 2,183,048 | |
| | Firstsource Solutions Ltd. | | | 1,796,446 | | | | 4,774,638 | |
| | Force Motors Ltd. | | | 7,342 | | | | 138,445 | |
* | | Fortis Healthcare Ltd. | | | 1,383,126 | | | | 4,523,564 | |
| | Gabriel India Ltd. | | | 92,477 | | | | 190,331 | |
| | GAIL India Ltd. | | | 10,022,838 | | | | 19,896,528 | |
| | Garden Reach Shipbuilders & Engineers Ltd. | | | 14,771 | | | | 43,189 | |
| | Gateway Distriparks Ltd. | | | 325,127 | | | | 1,217,336 | |
* | | Gayatri Projects Ltd. | | | 93,367 | | | | 53,936 | |
| | GE Power India Ltd. | | | 2,881 | | | | 11,150 | |
* | | GE T&D India Ltd. | | | 13,808 | | | | 23,656 | |
* W | | General Insurance Corp. of India | | | 111,280 | | | | 198,271 | |
* | | GFL Ltd. | | | 199,658 | | | | 207,162 | |
| | GHCL Ltd. | | | 257,525 | | | | 1,453,394 | |
| | Glenmark Pharmaceuticals Ltd. | | | 1,040,612 | | | | 7,019,660 | |
| | Godawari Power & Ispat Ltd. | | | 7,208 | | | | 34,263 | |
| | Godawari Power & Ispat Ltd. | | | 7,208 | | | | 34,233 | |
| | Godfrey Phillips India Ltd. | | | 85,898 | | | | 1,492,300 | |
DIMENSIONAL EMERGING MARKETS VALUE FUND
CONTINUED
| | | | | | | | | | |
| | | | | Shares | | | Value» | |
INDIA — (Continued) | | | | | | | | |
| | Goodyear India Ltd. | | | 3,222 | | | $ | 43,742 | |
| | Granules India Ltd. | | | 883,816 | | | | 3,677,283 | |
| | Graphite India Ltd. | | | 20,799 | | | | 148,629 | |
| | Grasim Industries Ltd. | | | 1,273,099 | | | | 29,430,021 | |
| | Great Eastern Shipping Co. Ltd. | | | 503,782 | | | | 2,192,270 | |
| | Greaves Cotton Ltd. | | | 60,604 | | | | 108,533 | |
| | Gujarat Alkalies & Chemicals Ltd. | | | 176,303 | | | | 1,775,114 | |
| | Gujarat Ambuja Exports Ltd. | | | 280,132 | | | | 613,617 | |
* | | Gujarat Fluorochemicals Ltd. | | | 284,783 | | | | 6,962,637 | |
| | Gujarat Mineral Development Corp. Ltd. | | | 549,802 | | | | 545,459 | |
| | Gujarat Narmada Valley Fertilizers & Chemicals Ltd. | | | 332,353 | | | | 2,039,463 | |
| | Gujarat Pipavav Port Ltd. | | | 450,771 | | | | 674,974 | |
| | Gujarat State Fertilizers & Chemicals Ltd. | | | 828,894 | | | | 1,466,478 | |
| | Gujarat State Petronet Ltd. | | | 1,304,285 | | | | 5,312,019 | |
* | | Hathway Cable & Datacom Ltd. | | | 110,526 | | | | 32,267 | |
| | HBL Power Systems Ltd. | | | 23,319 | | | | 15,643 | |
| | HEG Ltd. | | | 12,117 | | | | 333,118 | |
| | HeidelbergCement India Ltd. | | | 345,204 | | | | 1,101,869 | |
| | HFCL Ltd. | | | 3,752,356 | | | | 3,617,106 | |
| | Hikal Ltd. | | | 308,027 | | | | 2,351,007 | |
| | HIL Ltd. | | | 18,294 | | | | 1,100,216 | |
| | Himadri Speciality Chemical Ltd. | | | 203,546 | | | | 143,046 | |
| | Himatsingka Seide Ltd. | | | 181,013 | | | | 610,981 | |
| | Hindalco Industries Ltd. | | | 9,969,863 | | | | 61,983,738 | |
| | Hinduja Global Solutions Ltd. | | | 59,737 | | | | 2,155,904 | |
| | Hindustan Aeronautics Ltd. | | | 44,133 | | | | 776,775 | |
| | Housing Development Finance Corp. Ltd. | | | 277,698 | | | | 10,575,788 | |
| | I G Petrochemicals Ltd. | | | 3,003 | | | | 33,610 | |
| | ICICI Bank Ltd., Sponsored ADR | | | 4,454,789 | | | | 94,218,784 | |
| | ICICI Bank Ltd. | | | 1,273,118 | | | | 13,783,851 | |
* | | IDFC First Bank Ltd. | | | 9,141,208 | | | | 6,078,635 | |
* | | IDFC Ltd. | | | 4,102,603 | | | | 3,052,120 | |
* | | IFCI Ltd. | | | 5,015,523 | | | | 820,261 | |
| | IIFL Finance Ltd. | | | 1,287,770 | | | | 5,611,220 | |
| | IIFL Securities Ltd. | | | 2,231,338 | | | | 2,894,014 | |
| | IIFL Wealth Management Ltd. | | | 248,986 | | | | 5,425,749 | |
| | India Cements Ltd. | | | 987,977 | | | | 2,725,540 | |
| | India Glycols Ltd. | | | 91,269 | | | | 1,028,491 | |
| | Indiabulls Housing Finance Ltd. | | | 1,767,950 | | | | 5,135,827 | |
* | | Indiabulls Real Estate Ltd. | | | 1,220,434 | | | | 2,491,134 | |
| | Indian Bank | | | 504,291 | | | | 1,158,382 | |
| | Indian Hume Pipe Co. Ltd. | | | 2,945 | | | | 7,515 | |
* | | Indian Overseas Bank | | | 82,696 | | | | 23,698 | |
| | Indo Count Industries Ltd. | | | 248,595 | | | | 812,442 | |
| | INEOS Styrolution India Ltd. | | | 19,028 | | | | 380,416 | |
| | Infibeam Avenues Ltd. | | | 2,883,341 | | | | 1,735,774 | |
* | | Inox Wind Energy Ltd. | | | 19,966 | | | | 234,682 | |
* | | Intellect Design Arena Ltd. | | | 295,765 | | | | 2,588,545 | |
| | IOL Chemicals & Pharmaceuticals Ltd. | | | 15,461 | | | | 114,966 | |
W | | IRCON International Ltd. | | | 48,054 | | | | 30,339 | |
| | ITD Cementation India Ltd. | | | 187,582 | | | | 204,684 | |
| | J Kumar Infraprojects Ltd. | | | 167,631 | | | | 339,346 | |
* | | Jagran Prakashan Ltd. | | | 489,592 | | | | 406,790 | |
| | Jai Corp. Ltd. | | | 312,837 | | | | 504,273 | |
* | | Jaiprakash Associates Ltd. | | | 409,710 | | | | 46,619 | |
* | | Jammu & Kashmir Bank Ltd. | | | 954,511 | | | | 512,954 | |
| | JB Chemicals & Pharmaceuticals Ltd. | | | 265,286 | | | | 5,920,857 | |
| | JBM Auto Ltd. | | | 2,437 | | | | 19,594 | |
| | Jindal Poly Films Ltd. | | | 107,814 | | | | 1,367,705 | |
DIMENSIONAL EMERGING MARKETS VALUE FUND
CONTINUED
| | | | | | | | | | |
| | | | | Shares | | | Value» | |
INDIA — (Continued) | | | | | | | | |
| | Jindal Saw Ltd. | | | 854,627 | | | $ | 1,308,024 | |
* | | Jindal Stainless Hisar Ltd. | | | 60,550 | | | | 271,658 | |
* | | Jindal Stainless Ltd. | | | 316,349 | | | | 816,573 | |
* | | Jindal Steel & Power Ltd. | | | 3,034,663 | | | | 16,952,971 | |
| | JK Cement Ltd. | | | 73,792 | | | | 3,289,516 | |
| | JK Lakshmi Cement Ltd. | | | 228,271 | | | | 1,885,719 | |
| | JK Paper Ltd. | | | 522,303 | | | | 1,576,169 | |
| | JK Tyre & Industries Ltd. | | | 607,973 | | | | 1,178,830 | |
| | JM Financial Ltd. | | | 2,157,432 | | | | 2,564,182 | |
| | JSW Energy Ltd. | | | 2,393,039 | | | | 10,987,877 | |
| | JSW Steel Ltd. | | | 4,827,498 | | | | 43,453,974 | |
| | Jubilant Ingrevia Ltd. | | | 762,037 | | | | 6,823,116 | |
| | Jubilant Pharmova Ltd. | | | 678,513 | | | | 5,399,795 | |
| | Jyothy Labs Ltd. | | | 26,964 | | | | 56,522 | |
| | Kalpataru Power Transmission Ltd. | | | 409,368 | | | | 2,291,526 | |
| | Kalyani Steels Ltd. | | | 78,911 | | | | 389,698 | |
| | Karnataka Bank Ltd. | | | 942,714 | | | | 858,209 | |
| | Karur Vysya Bank Ltd. | | | 2,259,617 | | | | 1,482,700 | |
| | Kaveri Seed Co. Ltd. | | | 83,828 | | | | 586,799 | |
| | KCP Ltd. | | | 12,706 | | | | 22,379 | |
| | KEC International Ltd. | | | 41,521 | | | | 266,989 | |
| | Kiri Industries Ltd. | | | 98,928 | | | | 642,154 | |
| | Kirloskar Ferrous Industries Ltd. | | | 11,598 | | | | 36,582 | |
| | Kirloskar Oil Engines Ltd. | | | 298,653 | | | | 812,633 | |
| | KNR Constructions Ltd. | | | 407,280 | | | | 1,527,638 | |
* | | Kolte-Patil Developers Ltd. | | | 90,777 | | | | 375,666 | |
| | KPIT Technologies Ltd. | | | 1,072,954 | | | | 4,430,656 | |
| | KPR Mill Ltd. | | | 204,410 | | | | 1,235,999 | |
| | KRBL Ltd. | | | 120,245 | | | | 454,661 | |
* | | L&T Finance Holdings Ltd. | | | 4,515,110 | | | | 4,984,138 | |
| | Larsen & Toubro Ltd. | | | 2,297,590 | | | | 54,714,019 | |
W | | Laurus Labs Ltd. | | | 93,302 | | | | 644,849 | |
| | LG Balakrishnan & Bros Ltd. | | | 25,778 | | | | 173,785 | |
| | LIC Housing Finance Ltd. | | | 2,167,790 | | | | 11,819,527 | |
| | Linde India Ltd. | | | 24,249 | | | | 746,454 | |
| | LT Foods Ltd. | | | 845,319 | | | | 788,313 | |
| | Lupin Ltd. | | | 1,204,587 | | | | 14,956,909 | |
| | Maharashtra Scooters Ltd. | | | 8,085 | | | | 479,149 | |
| | Maharashtra Seamless Ltd. | | | 147,161 | | | | 963,384 | |
| | Mahindra & Mahindra Financial Services Ltd. | | | 4,167,224 | | | | 10,074,587 | |
| | Mahindra & Mahindra Ltd. | | | 3,949,734 | | | | 46,836,219 | |
* | | Mahindra CIE Automotive Ltd. | | | 264,220 | | | | 951,664 | |
* | | Mahindra Lifespace Developers Ltd. | | | 376,407 | | | | 1,374,368 | |
| | Maithan Alloys Ltd. | | | 10,095 | | | | 143,017 | |
| | Manappuram Finance Ltd. | | | 1,364,008 | | | | 3,800,067 | |
| | Mangalam Cement Ltd. | | | 6,708 | | | | 37,780 | |
| | Marksans Pharma Ltd. | | | 1,329,294 | | | | 1,174,646 | |
| | Mastek Ltd. | | | 77,492 | | | | 2,885,246 | |
* | | Max Healthcare Institute Ltd. | | | 461,394 | | | | 2,044,274 | |
* | | Max India Ltd. | | | 42,980 | | | | 43,437 | |
* | | Meghmani Finechem Ltd. | | | 76,933 | | | | 907,196 | |
| | Meghmani Organics Ltd. | | | 818,438 | | | | 1,194,082 | |
| | Minda Corp. Ltd. | | | 28,727 | | | | 60,291 | |
| | MOIL Ltd. | | | 349,145 | | | | 728,740 | |
| | Monte Carlo Fashions Ltd. | | | 1,935 | | | | 10,056 | |
| | Motilal Oswal Financial Services Ltd. | | | 1,289 | | | | 15,767 | |
| | Mphasis Ltd. | | | 256,013 | | | | 11,101,085 | |
| | MRF Ltd. | | | 7,617 | | | | 7,885,337 | |
| | National Aluminium Co. Ltd. | | | 2,986,448 | | | | 3,879,929 | |
DIMENSIONAL EMERGING MARKETS VALUE FUND
CONTINUED
| | | | | | | | | | |
| | | | | Shares | | | Value» | |
INDIA — (Continued) | | | | | | | | |
| | Nava Bharat Ventures Ltd. | | | 479,073 | | | $ | 736,690 | |
| | Navneet Education Ltd. | | | 12,483 | | | | 17,615 | |
| | NCC Ltd. | | | 1,747,409 | | | | 1,670,013 | |
| | NCL Industries Ltd. | | | 4,762 | | | | 15,716 | |
| | Neuland Laboratories Ltd. | | | 1,140 | | | | 25,432 | |
| | NIIT Ltd. | | | 450,911 | | | | 1,803,846 | |
| | Nilkamal Ltd. | | | 35,216 | | | | 1,117,129 | |
| | NMDC Ltd. | | | 1,117,652 | | | | 2,141,980 | |
| | NOCIL Ltd. | | | 320,354 | | | | 1,146,183 | |
| | NRB Bearings Ltd. | | | 28,454 | | | | 49,017 | |
| | Nucleus Software Exports Ltd. | | | 18,815 | | | | 146,267 | |
* | | Oberoi Realty Ltd. | | | 457,696 | | | | 5,570,044 | |
* | | Omaxe Ltd. | | | 268,860 | | | | 266,208 | |
| | Orient Cement Ltd. | | | 556,320 | | | | 1,209,252 | |
| | Panama Petrochem Ltd. | | | 8,457 | | | | 30,226 | |
W | | Parag Milk Foods Ltd. | | | 137,951 | | | | 249,300 | |
* | | PC Jeweller Ltd. | | | 50,599 | | | | 18,647 | |
| | Persistent Systems Ltd. | | | 310,402 | | | | 16,304,137 | |
| | Petronet LNG Ltd. | | | 3,937,868 | | | | 12,112,455 | |
| | Phillips Carbon Black Ltd. | | | 518,512 | | | | 1,528,283 | |
| | Piramal Enterprises Ltd. | | | 380,449 | | | | 13,277,928 | |
* W | | PNB Housing Finance Ltd. | | | 186,149 | | | | 1,204,608 | |
| | PNC Infratech Ltd. | | | 321,227 | | | | 1,396,229 | |
| | Polyplex Corp. Ltd. | | | 101,191 | | | | 2,286,651 | |
* | | Poonawalla Fincorp Ltd. | | | 77,261 | | | | 172,075 | |
| | Power Finance Corp. Ltd. | | | 4,872,837 | | | | 8,678,236 | |
* | | Power Mech Projects Ltd. | | | 2,920 | | | | 38,509 | |
| | Praj Industries Ltd. | | | 63,549 | | | | 283,881 | |
* | | Prakash Industries Ltd. | | | 187,902 | | | | 164,286 | |
| | Prestige Estates Projects Ltd. | | | 647,281 | | | | 3,711,706 | |
* | | Pricol Ltd. | | | 29,519 | | | | 38,366 | |
| | Procter & Gamble Health Ltd. | | | 11,124 | | | | 812,439 | |
* | | PTC India Financial Services Ltd. | | | 1,484,251 | | | | 384,939 | |
| | PTC India Ltd. | | | 1,014,721 | | | | 1,725,749 | |
* | | Punjab National Bank | | | 5,997,812 | | | | 3,389,849 | |
W | | Quess Corp. Ltd. | | | 37,802 | | | | 437,644 | |
| | Rain Industries Ltd. | | | 736,786 | | | | 2,247,416 | |
| | Rajesh Exports Ltd. | | | 404,958 | | | | 3,454,239 | |
| | Rallis India Ltd. | | | 310,215 | | | | 1,099,258 | |
| | Ramco Industries Ltd. | | | 118,646 | | | | 449,111 | |
* | | Rane Holdings Ltd. | | | 1,527 | | | | 12,286 | |
| | Rashtriya Chemicals & Fertilizers Ltd. | | | 1,044,190 | | | | 1,074,453 | |
* | | Raymond Ltd. | | | 172,825 | | | | 1,053,709 | |
* W | | RBL Bank Ltd. | | | 322,994 | | | | 783,623 | |
| | REC Ltd. | | | 6,005,712 | | | | 12,025,518 | |
| | Redington India Ltd. | | | 4,228,564 | | | | 8,193,304 | |
| | Reliance Industries Ltd. | | | 12,484,013 | | | | 424,273,319 | |
* | | Reliance Power Ltd. | | | 1,644,945 | | | | 311,509 | |
| | Repco Home Finance Ltd. | | | 157,611 | | | | 567,785 | |
| | RITES Ltd. | | | 18,196 | | | | 68,698 | |
| | Sagar Cements Ltd. | | | 5,572 | | | | 21,035 | |
| | Sarda Energy & Minerals Ltd. | | | 2,117 | | | | 23,494 | |
| | Savita Oil Technologies Ltd. | | | 1,430 | | | | 26,467 | |
| | Sequent Scientific Ltd. | | | 35,715 | | | | 91,256 | |
| | Seshasayee Paper & Boards Ltd. | | | 59,795 | | | | 140,337 | |
W | | SH Kelkar & Co. Ltd. | | | 29,428 | | | | 62,382 | |
* | | Shankara Building Products Ltd. | | | 2,872 | | | | 21,054 | |
| | Sharda Cropchem Ltd. | | | 34,751 | | | | 143,247 | |
| | Shipping Corp. of India Ltd. | | | 822,610 | | | | 1,407,589 | |
DIMENSIONAL EMERGING MARKETS VALUE FUND
CONTINUED
| | | | | | | | | | |
| | | | | Shares | | | Value» | |
INDIA — (Continued) | | | | | | | | |
| | Shriram City Union Finance Ltd. | | | 29,413 | | | $ | 850,770 | |
| | Shriram Transport Finance Co. Ltd. | | | 735,109 | | | | 14,285,517 | |
| | Sobha Ltd. | | | 289,326 | | | | 2,979,298 | |
| | Somany Ceramics Ltd. | | | 10,977 | | | | 112,333 | |
| | Somany Home Innovation Ltd. | | | 60,531 | | | | 362,850 | |
* | | South Indian Bank Ltd. | | | 4,961,219 | | | | 624,825 | |
* | | Spandana Sphoorty Financial Ltd. | | | 2,296 | | | | 15,714 | |
| | Srikalahasthi Pipes Ltd. | | | 69,809 | | | | 180,148 | |
* | | Star Cement Ltd. | | | 24,193 | | | | 32,540 | |
| | State Bank of India | | | 6,087,495 | | | | 41,108,135 | |
| | Steel Authority of India Ltd. | | | 7,431,498 | | | | 11,497,384 | |
| | Strides Pharma Science Ltd. | | | 361,129 | | | | 2,584,870 | |
| | Sun Pharmaceutical Industries Ltd. | | | 2,709,187 | | | | 28,844,635 | |
| | Sun TV Network Ltd. | | | 192,573 | | | | 1,444,126 | |
| | Sundaram-Clayton Ltd. | | | 428 | | | | 21,981 | |
| | Sunteck Realty Ltd. | | | 290,750 | | | | 1,782,032 | |
| | Surya Roshni Ltd. | | | 65,033 | | | | 530,885 | |
* | | Suvidhaa Infoserve Ltd. | | | 255,844 | | | | 42,836 | |
* | | TAKE Solutions Ltd. | | | 75,949 | | | | 48,676 | |
* | | TARC Ltd. | | | 263,704 | | | | 154,309 | |
| | Tata Chemicals Ltd. | | | 761,327 | | | | 9,200,125 | |
| | Tata Coffee Ltd. | | | 31,485 | | | | 88,034 | |
| | Tata Consumer Products Ltd. | | | 1,775,741 | | | | 19,303,192 | |
| | Tata Metaliks Ltd. | | | 1,879 | | | | 24,044 | |
* | | Tata Motors Ltd. | | | 10,754,335 | | | | 69,290,039 | |
* | | Tata Steel BSL Ltd. | | | 161,085 | | | | 186,459 | |
| | Tata Steel Ltd. | | | 2,469,357 | | | | 43,593,024 | |
| | TD Power Systems Ltd. | | | 3,021 | | | | 13,579 | |
| | Tech Mahindra Ltd. | | | 512,811 | | | | 10,165,388 | |
| | Techno Electric & Engineering Co. Ltd. | | | 63,482 | | | | 222,693 | |
* †† | | Teledata Marine Solutions Ltd. | | | 267,258 | | | | 0 | |
| | Tide Water Oil Co. India Ltd. | | | 11,950 | | | | 262,760 | |
| | Time Technoplast Ltd. | | | 635,571 | | | | 591,911 | |
| | Tinplate Co. of India Ltd. | | | 203,125 | | | | 794,510 | |
* | | Titagarh Wagons Ltd. | | | 59,109 | | | | 74,658 | |
| | Transport Corp. of India Ltd. | | | 130,573 | | | | 1,099,264 | |
| | Trident Ltd. | | | 8,544,349 | | | | 4,351,177 | |
| | Triveni Engineering & Industries Ltd. | | | 572,383 | | | | 1,455,404 | |
| | Tube Investments of India Ltd. | | | 318,553 | | | | 5,953,639 | |
| | TV Today Network Ltd. | | | 29,230 | | | | 122,264 | |
* | | TV18 Broadcast Ltd. | | | 3,619,641 | | | | 2,018,983 | |
| | TVS Srichakra Ltd. | | | 3,639 | | | | 112,328 | |
* | | UCO Bank | | | 1,814,473 | | | | 351,575 | |
| | Uflex Ltd. | | | 219,094 | | | | 1,660,455 | |
| | Unichem Laboratories Ltd. | | | 200,132 | | | | 640,075 | |
* | | Union Bank of India | | | 1,643,856 | | | | 1,019,168 | |
| | UPL Ltd. | | | 204,333 | | | | 2,040,217 | |
* | | Usha Martin Ltd. | | | 388,305 | | | | 457,871 | |
* | | VA Tech Wabag Ltd. | | | 139,858 | | | | 596,391 | |
| | Vardhman Textiles Ltd. | | | 155,628 | | | | 4,057,423 | |
| | Vedanta Ltd. | | | 324,172 | | | | 1,318,782 | |
# | | Vedanta Ltd., ADR | | | 394,713 | | | | 6,232,525 | |
| | Vindhya Telelinks Ltd. | | | 23,536 | | | | 352,984 | |
| | Visaka Industries Ltd. | | | 1,209 | | | | 9,641 | |
* | | Vodafone Idea Ltd. | | | 10,109,989 | | | | 1,280,954 | |
| | Welspun Corp. Ltd. | | | 646,685 | | | | 1,161,259 | |
| | Welspun Enterprises Ltd. | | | 463,798 | | | | 609,539 | |
| | Welspun India Ltd. | | | 1,892,101 | | | | 3,509,710 | |
| | West Coast Paper Mills Ltd. | | | 184,344 | | | | 619,860 | |
DIMENSIONAL EMERGING MARKETS VALUE FUND
CONTINUED
| | | | | | | | | | |
| | | | | Shares | | | Value» | |
INDIA — (Continued) | | | | | | | | |
| | Wipro Ltd. | | | 6,193,725 | | | $ | 53,697,022 | |
* | | Wockhardt Ltd. | | | 235,925 | | | | 1,346,283 | |
* | | Yes Bank Ltd. | | | 19,922,354 | | | | 3,404,203 | |
| | Zensar Technologies Ltd. | | | 423,215 | | | | 2,625,727 | |
| | | | | | | | | | |
TOTAL INDIA | | | | | | | 1,872,076,353 | |
| | | | | | | | | | |
INDONESIA — (1.5%) | | | | | | | | |
| | Adaro Energy Tbk PT | | | 97,793,300 | | | | 11,584,010 | |
* | | Adhi Karya Persero Tbk PT | | | 4,040,200 | | | | 299,899 | |
| | AKR Corporindo Tbk PT | | | 563,800 | | | | 170,109 | |
* | | Alam Sutera Realty Tbk PT | | | 52,456,200 | | | | 674,809 | |
| | Aneka Tambang Tbk | | | 3,337,300 | | | | 552,293 | |
| | Astra Agro Lestari Tbk PT | | | 3,532,766 | | | | 2,678,746 | |
| | Astra International Tbk PT | | | 40,609,000 | | | | 17,295,882 | |
* †† | | Bakrie Telecom Tbk PT | | | 160,430,200 | | | | 106,161 | |
| | Bank Danamon Indonesia Tbk PT | | | 1,729,454 | | | | 328,752 | |
| | Bank Mandiri Persero Tbk PT | | | 49,143,662 | | | | 24,845,647 | |
| | Bank Negara Indonesia Persero Tbk PT | | | 26,872,841 | | | | 13,289,235 | |
* | | Bank Pan Indonesia Tbk PT | | | 58,330,801 | | | | 3,250,751 | |
| | Bank Pembangunan Daerah Jawa Barat Dan Banten Tbk PT | | | 18,459,300 | | | | 1,857,407 | |
| | Bank Pembangunan Daerah Jawa Timur Tbk PT | | | 21,617,600 | | | | 1,190,733 | |
* | | Bank Tabungan Negara Persero Tbk PT | | | 27,316,427 | | | | 3,435,857 | |
| | Barito Pacific Tbk PT | | | 5,139,300 | | | | 340,051 | |
* | | Bekasi Fajar Industrial Estate Tbk PT | | | 32,514,000 | | | | 298,279 | |
| | BISI International Tbk PT | | | 9,817,300 | | | | 706,326 | |
* | | Buana Lintas Lautan Tbk PT | | | 32,695,100 | | | | 591,422 | |
| | Bukit Asam Tbk PT | | | 22,735,900 | | | | 4,303,051 | |
* | | Bumi Serpong Damai Tbk PT | | | 20,401,300 | | | | 1,601,488 | |
| | Ciputra Development Tbk PT | | | 69,722,878 | | | | 5,295,557 | |
* | | City Retail Developments Tbk PT | | | 1,000,000 | | | | 11,093 | |
* | | Delta Dunia Makmur Tbk PT | | | 36,091,000 | | | | 754,321 | |
* | | Eagle High Plantations Tbk PT | | | 50,643,100 | | | | 325,258 | |
| | Elnusa Tbk PT | | | 21,143,600 | | | | 453,878 | |
| | Erajaya Swasembada Tbk PT | | | 59,034,000 | | | | 2,713,115 | |
* | | FKS Food Sejahtera Tbk PT | | | 23,353,822 | | | | 363,104 | |
| | Gajah Tunggal Tbk PT | | | 8,135,800 | | | | 419,583 | |
* †† | | Garuda Indonesia Persero Tbk PT | | | 7,731,781 | | | | 90,866 | |
| | Gudang Garam Tbk PT | | | 134,400 | | | | 318,392 | |
* †† | | Hanson International Tbk PT | | | 37,319,300 | | | | 24,695 | |
| | Hexindo Adiperkasa Tbk PT | | | 646,644 | | | | 184,800 | |
| | Indah Kiat Pulp & Paper Tbk PT | | | 16,466,400 | | | | 9,852,783 | |
* | | Indika Energy Tbk PT | | | 10,821,200 | | | | 1,360,491 | |
| | Indo Tambangraya Megah Tbk PT | | | 2,923,800 | | | | 4,457,289 | |
| | Indocement Tunggal Prakarsa Tbk PT | | | 380,200 | | | | 317,390 | |
| | Indofood Sukses Makmur Tbk PT | | | 30,127,000 | | | | 13,522,986 | |
| | Indomobil Sukses Internasional Tbk PT | | | 218,700 | | | | 15,478 | |
| | Integra Indocabinet Tbk PT | | | 2,170,600 | | | | 125,756 | |
* | | Intiland Development Tbk PT | | | 38,709,800 | | | | 473,651 | |
| | Japfa Comfeed Indonesia Tbk PT | | | 30,600,750 | | | | 3,737,862 | |
| | Jaya Real Property Tbk PT | | | 66,551,400 | | | | 2,333,251 | |
* | | Kawasan Industri Jababeka Tbk PT | | | 151,628,856 | | | | 1,692,833 | |
* | | KMI Wire & Cable Tbk PT | | | 10,201,300 | | | | 211,691 | |
* | | Krakatau Steel Persero Tbk PT | | | 407,200 | | | | 15,111 | |
| | Link Net Tbk PT | | | 164,900 | | | | 45,272 | |
| | Lippo Cikarang Tbk PT | | | 6,552,310 | | | | 465,796 | |
* | | Lippo Karawaci Tbk PT | | | 255,901,762 | | | | 2,676,723 | |
* | | Malindo Feedmill Tbk PT | | | 6,123,100 | | | | 326,588 | |
* | | Map Aktif Adiperkasa PT | | | 75,300 | | | | 17,296 | |
* | | Medco Energi Internasional Tbk PT | | | 59,390,032 | | | | 2,386,706 | |
DIMENSIONAL EMERGING MARKETS VALUE FUND
CONTINUED
| | | | | | | | | | |
| | | | | Shares | | | Value» | |
INDONESIA — (Continued) | | | | | | | | |
| | Media Nusantara Citra Tbk PT | | | 32,613,000 | | | $ | 2,074,394 | |
| | Metrodata Electronics Tbk PT | | | 5,572,550 | | | | 1,451,018 | |
* | | Mitra Adiperkasa Tbk PT | | | 1,655,900 | | | | 102,960 | |
| | Mitra Pinasthika Mustika Tbk PT | | | 1,774,100 | | | | 94,225 | |
* | | MNC Kapital Indonesia Tbk PT | | | 8,798,000 | | | | 63,966 | |
* | | MNC Vision Networks Tbk PT | | | 2,925,400 | | | | 49,988 | |
* | | Multipolar Tbk PT | | | 6,379,200 | | | | 181,897 | |
| | Pabrik Kertas Tjiwi Kimia Tbk PT | | | 3,619,300 | | | | 2,132,949 | |
* | | Pakuwon Jati Tbk PT | | | 1,999,500 | | | | 70,765 | |
* | | Pan Brothers Tbk PT | | | 24,455,850 | | | | 229,959 | |
* | | Panin Financial Tbk PT | | | 76,680,200 | | | | 987,931 | |
* | | Paninvest Tbk PT | | | 10,415,300 | | | | 506,627 | |
| | Perusahaan Perkebunan London Sumatra Indonesia Tbk PT | | | 23,469,084 | | | | 2,311,884 | |
* | | PP Persero Tbk PT | | | 11,059,600 | | | | 942,941 | |
| | Puradelta Lestari Tbk PT | | | 2,516,000 | | | | 39,847 | |
* | | Ramayana Lestari Sentosa Tbk PT | | | 10,775,500 | | | | 562,884 | |
| | Salim Ivomas Pratama Tbk PT | | | 22,834,800 | | | | 776,829 | |
* | | Sampoerna Agro Tbk PT | | | 8,192,041 | | | | 1,290,198 | |
| | Semen Indonesia Persero Tbk PT | | | 14,874,700 | | | | 9,558,201 | |
| | Siloam International Hospitals Tbk PT | | | 1,692,800 | | | | 1,027,572 | |
| | Sinar Mas Agro Resources & Technology Tbk PT | | | 6,811,900 | | | | 2,155,023 | |
* †† | | Sri Rejeki Isman Tbk PT | | | 63,289,500 | | | | 489,162 | |
* | | Surya Semesta Internusa Tbk PT | | | 31,276,700 | | | | 1,100,940 | |
†† | | Suryainti Permata Tbk PT | | | 17,378,000 | | | | 0 | |
| | Tempo Scan Pacific Tbk PT | | | 917,400 | | | | 95,206 | |
* | | Timah Tbk PT | | | 3,458,100 | | | | 388,788 | |
* †† | | Tiphone Mobile Indonesia Tbk PT | | | 6,628,800 | | | | 10,615 | |
* †† | | Trada Alam Minera Tbk PT | | | 188,544,700 | | | | 124,765 | |
| | Trias Sentosa Tbk PT | | | 336,500 | | | | 13,879 | |
| | Tunas Baru Lampung Tbk PT | | | 17,990,700 | | | | 1,098,100 | |
| | Tunas Ridean Tbk PT | | | 32,428,200 | | | | 2,864,645 | |
| | Ultrajaya Milk Industry & Trading Co. Tbk PT | | | 1,371,100 | | | | 157,855 | |
| | Unggul Indah Cahaya Tbk PT | | | 288,335 | | | | 181,165 | |
| | United Tractors Tbk PT | | | 11,662,600 | | | | 19,400,854 | |
| | Vale Indonesia Tbk PT | | | 10,962,400 | | | | 3,756,977 | |
* | | Waskita Beton Precast Tbk PT | | | 33,556,300 | | | | 367,376 | |
* | | Waskita Karya Persero Tbk PT | | | 17,591,000 | | | | 1,143,659 | |
| | Wijaya Karya Bangunan Gedung Tbk PT | | | 6,598,700 | | | | 90,841 | |
| | Wijaya Karya Beton Tbk PT | | | 18,377,300 | | | | 352,936 | |
* | | Wijaya Karya Persero Tbk PT | | | 20,772,300 | | | | 1,829,876 | |
| | XL Axiata Tbk PT | | | 24,207,100 | | | | 5,271,166 | |
| | | | | | | | | | |
TOTAL INDONESIA | | | | | | | 209,741,386 | |
| | | | | | | | | | |
MALAYSIA — (1.8%) | | | | | | | | |
# | | Aeon Co. M Bhd | | | 2,308,900 | | | | 824,615 | |
# | | AFFIN Bank Bhd | | | 7,976,554 | | | | 3,278,851 | |
| | Alliance Bank Malaysia Bhd | | | 7,337,700 | | | | 4,871,613 | |
| | Allianz Malaysia Bhd | | | 93,300 | | | | 296,999 | |
* | | AMMB Holdings Bhd | | | 10,368,662 | | | | 8,414,308 | |
| | Batu Kawan Bhd | | | 1,623,450 | | | | 8,743,957 | |
* | | Berjaya Assets Bhd | | | 604,700 | | | | 36,636 | |
* | | Berjaya Corp. Bhd | | | 14,975,529 | | | | 922,277 | |
# * | | Berjaya Land Bhd | | | 5,491,800 | | | | 324,914 | |
| | BIMB Holdings Bhd | | | 1,164,507 | | | | 899,697 | |
* | | Boustead Holdings Bhd | | | 2,832,091 | | | | 417,421 | |
# | | Boustead Plantations Bhd | | | 3,159,100 | | | | 546,073 | |
# * | | Bumi Armada Bhd | | | 16,365,600 | | | | 2,008,827 | |
# | | Cahya Mata Sarawak Bhd | | | 2,028,000 | | | | 701,722 | |
| | CB Industrial Product Holding Bhd | | | 1,285,500 | | | | 394,706 | |
DIMENSIONAL EMERGING MARKETS VALUE FUND
CONTINUED
| | | | | | | | | | |
| | | | | Shares | | | Value» | |
MALAYSIA — (Continued) | | | | | | | | |
# | | CIMB Group Holdings Bhd | | | 25,597,406 | | | $ | 32,297,102 | |
| | CSC Steel Holdings Bhd | | | 821,256 | | | | 263,581 | |
# * | | Cypark Resources Bhd | | | 918,750 | | | | 220,887 | |
# | | DRB-Hicom Bhd | | | 6,552,000 | | | | 2,610,626 | |
# | | Eco World Development Group Bhd | | | 4,869,900 | | | | 1,200,874 | |
# | | Ekovest BHD | | | 8,316,700 | | | | 832,961 | |
| | FAR East Holdings Bhd | | | 57,360 | | | | 41,561 | |
| | Gadang Holdings Bhd | | | 2,586,100 | | | | 259,462 | |
* | | Gamuda Bhd | | | 9,538,433 | | | | 7,468,036 | |
| | Genting Bhd | | | 7,451,300 | | | | 9,326,624 | |
| | Genting Malaysia Bhd | | | 8,748,100 | | | | 6,702,880 | |
| | Genting Plantations Bhd | | | 41,200 | | | | 72,651 | |
| | George Kent Malaysia Bhd | | | 1,855,600 | | | | 313,967 | |
| | HAP Seng Consolidated Bhd | | | 1,407,582 | | | | 2,666,758 | |
# | | Hengyuan Refining Co. Bhd | | | 791,000 | | | | 827,338 | |
| | HeveaBoard Bhd | | | 2,153,300 | | | | 246,813 | |
# | | Hiap Teck Venture Bhd | | | 8,346,100 | | | | 1,142,037 | |
| | Hibiscus Petroleum Bhd | | | 728,200 | | | | 157,974 | |
| | Hong Leong Financial Group Bhd | | | 1,923,134 | | | | 8,520,783 | |
| | Hong Leong Industries Bhd | | | 129,100 | | | | 284,627 | |
# * | | IGB Bhd | | | 1,994,205 | | | | 937,297 | |
| | IJM Corp. Bhd | | | 19,077,718 | | | | 8,541,962 | |
# | | Insas Bhd | | | 2,626,100 | | | | 648,017 | |
# | | IOI Properties Group Bhd | | | 7,235,425 | | | | 2,239,954 | |
# * | | Iskandar Waterfront City Bhd | | | 1,951,300 | | | | 186,300 | |
# * | | JAKS Resources Bhd | | | 6,809,780 | | | | 765,225 | |
# * | | Jaya Tiasa Holdings Bhd | | | 2,754,833 | | | | 472,172 | |
* | | Keck Seng Malaysia Bhd | | | 751,400 | | | | 704,533 | |
# * | | KNM Group Bhd | | | 13,856,690 | | | | 684,717 | |
# * | | KSL Holdings Bhd | | | 1,718,751 | | | | 271,921 | |
# | | Kumpulan Fima BHD | | | 575,200 | | | | 291,646 | |
| | Land & General Bhd | | | 11,345,220 | | | | 328,206 | |
| | LBS Bina Group Bhd | | | 3,959,834 | | | | 526,290 | |
# W | | Lotte Chemical Titan Holding Bhd | | | 1,069,093 | | | | 702,657 | |
| | Magnum Bhd | | | 5,704,845 | | | | 2,974,609 | |
# | | Mah Sing Group Bhd | | | 8,063,762 | | | | 1,577,931 | |
| | Malayan Banking Bhd | | | 15,697,757 | | | | 30,534,840 | |
| | Malayan Flour Mills Bhd | | | 3,750,075 | | | | 683,763 | |
# * | | Malaysia Airports Holdings Bhd | | | 476,154 | | | | 744,699 | |
# | | Malaysia Building Society Bhd | | | 13,955,643 | | | | 2,159,717 | |
# | | Malaysian Resources Corp. Bhd | | | 12,219,447 | | | | 1,211,310 | |
| | Matrix Concepts Holdings Bhd | | | 794,700 | | | | 412,471 | |
| | MBM Resources BHD | | | 812,703 | | | | 620,164 | |
| | Mega First Corp. Bhd | | | 341,200 | | | | 296,899 | |
| | MISC Bhd | | | 6,588,104 | | | | 11,269,420 | |
| | MKH Bhd | | | 1,847,578 | | | | 648,530 | |
# | | MMC Corp. Bhd | | | 3,524,180 | | | | 1,684,841 | |
| | MNRB Holdings Bhd | | | 1,983,779 | | | | 638,704 | |
* | | MPHB Capital Bhd | | | 178,400 | | | | 58,147 | |
# | | Muda Holdings Bhd | | | 529,900 | | | | 353,377 | |
| | Muhibbah Engineering M Bhd | | | 1,684,000 | | | | 389,194 | |
* | | Mulpha International Bhd | | | 852,260 | | | | 520,346 | |
* | | Notion VTEC Bhd | | | 220,300 | | | | 25,311 | |
* | | OCK Group Bhd | | | 131,800 | | | | 16,412 | |
| | Oriental Holdings BHD | | | 2,554,379 | | | | 3,293,785 | |
| | OSK Holdings Bhd | | | 6,761,306 | | | | 1,471,272 | |
| | Panasonic Manufacturing Malaysia Bhd | | | 22,880 | | | | 165,858 | |
| | Pantech Group Holdings Bhd | | | 2,614,594 | | | | 369,500 | |
| | Paramount Corp. Bhd | | | 1,807,455 | | | | 338,881 | |
DIMENSIONAL EMERGING MARKETS VALUE FUND
CONTINUED
| | | | | | | | | | |
| | | | | Shares | | | Value» | |
MALAYSIA — (Continued) | | | | | | | | |
# | | Petron Malaysia Refining & Marketing Bhd | | | 247,800 | | | $ | 269,597 | |
# * | | Pos Malaysia Bhd | | | 1,777,400 | | | | 315,293 | |
| | PPB Group Bhd | | | 2,239,339 | | | | 9,829,926 | |
| | RHB Bank Bhd | | | 11,553,209 | | | | 15,588,644 | |
* | | Rubberex Corp. M Bhd | | | 277,000 | | | | 36,205 | |
# * | | Sapura Energy Bhd | | | 39,709,700 | | | | 961,491 | |
# | | Sarawak Oil Palms Bhd | | | 694,467 | | | | 644,881 | |
| | Sime Darby Bhd | | | 17,922,700 | | | | 9,837,147 | |
| | Sime Darby Property Bhd | | | 7,330,900 | | | | 1,284,779 | |
# * | | SP Setia Bhd Group | | | 9,325,073 | | | | 3,510,119 | |
* †† | | Sumatec Resources Bhd | | | 2,855,100 | | | | 620 | |
| | Sunway Bhd | | | 9,004,786 | | | | 3,874,000 | |
| | Suria Capital Holdings Bhd | | | 793,880 | | | | 239,723 | |
| | Syarikat Takaful Malaysia Keluarga Bhd | | | 191,647 | | | | 183,819 | |
| | Ta Ann Holdings Bhd | | | 993,026 | | | | 776,721 | |
| | Tan Chong Motor Holdings Bhd | | | 658,600 | | | | 187,589 | |
* | | Tropicana Corp. Bhd | | | 5,049,461 | | | | 1,231,355 | |
* | | Tune Protect Group Bhd | | | 2,001,800 | | | | 239,649 | |
* | | UEM Edgenta Bhd | | | 1,204,400 | | | | 536,003 | |
# * | | UEM Sunrise Bhd | | | 8,933,745 | | | | 852,598 | |
| | United Malacca Bhd | | | 902,000 | | | | 1,122,626 | |
| | UOA Development Bhd | | | 7,576,600 | | | | 3,200,719 | |
# * | | Velesto Energy Bhd | | | 15,654,228 | | | | 604,001 | |
* | | Wah Seong Corp. Bhd | | | 676,080 | | | | 119,226 | |
# * | | WCT Holdings Bhd | | | 4,268,224 | | | | 640,403 | |
| | Yinson Holdings Bhd | | | 141,000 | | | | 199,353 | |
| | YNH Property Bhd | | | 3,337,050 | | | | 2,153,529 | |
| | YTL Corp. Bhd | | | 27,313,621 | | | | 4,158,477 | |
| | | | | | | | | | |
TOTAL MALAYSIA | | | | | | | 250,499,529 | |
| | | | | | | | | | |
MEXICO — (2.2%) | | | | | | | | |
* | | ALEATICA SAB de CV | | | 21,226 | | | | 18,867 | |
| | Alfa SAB de CV, Class A | | | 24,152,100 | | | | 17,444,226 | |
| | Alpek SAB de CV | | | 2,216,508 | | | | 2,444,963 | |
# | | Arca Continental SAB de CV | | | 1,394,616 | | | | 8,488,407 | |
# W | | Banco del Bajio SA | | | 1,475,288 | | | | 2,764,553 | |
* | | Cemex SAB de CV | | | 69,050 | | | | 44,540 | |
* | | Cemex SAB de CV, Sponsored ADR | | | 3,249,914 | | | | 20,896,943 | |
| | Coca-Cola Femsa SAB de CV, Sponsored ADR | | | 61,925 | | | | 3,328,469 | |
| | Coca-Cola Femsa SAB de CV | | | 1,044,400 | | | | 5,614,132 | |
| | Consorcio ARA SAB de CV | | | 3,207,049 | | | | 671,380 | |
| | Corp. Actinver SAB de CV, Class B | | | 89,268 | | | | 47,695 | |
* | | Corp. Interamericana de Entretenimiento SAB de CV, Class B | | | 1,220,611 | | | | 529,437 | |
# * | | Credito Real SAB de CV Sofom ER | | | 1,173,675 | | | | 598,581 | |
| | Cydsa SAB de CV | | | 5,874 | | | | 3,957 | |
* | | Dine SAB de CV | | | 1,022,314 | | | | 943,461 | |
# | | El Puerto de Liverpool SAB de CV, Class C1 | | | 532,562 | | | | 2,365,333 | |
| | Fomento Economico Mexicano SAB de CV, Sponsored ADR | | | 92,540 | | | | 7,605,862 | |
| | GCC SAB de CV | | | 910,806 | | | | 6,720,003 | |
# * | | Genomma Lab Internacional SAB de CV, Class B | | | 803,066 | | | | 771,939 | |
* | | Gentera SAB de CV | | | 1,801,797 | | | | 1,085,209 | |
# | | Grupo Carso SAB de CV | | | 3,079,499 | | | | 10,394,132 | |
| | Grupo Comercial Chedraui SA de CV | | | 2,074,720 | | | | 4,089,379 | |
| | Grupo Elektra SAB de CV | | | 104,717 | | | | 8,036,374 | |
| | Grupo Financiero Banorte SAB de CV, Class O | | | 7,711,601 | | | | 48,746,251 | |
* | | Grupo Financiero Inbursa SAB de CV, Class O | | | 7,138,340 | | | | 7,149,435 | |
* | | Grupo Gigante SAB de CV | | | 471,076 | | | | 593,764 | |
| | Grupo Herdez SAB de CV | | | 139,130 | | | | 255,581 | |
# | | Grupo Industrial Saltillo SAB de CV | | | 1,352,696 | | | | 1,964,524 | |
DIMENSIONAL EMERGING MARKETS VALUE FUND
CONTINUED
| | | | | | | | | | |
| | | | | Shares | | | Value» | |
MEXICO — (Continued) | | | | | | | | |
# * | | Grupo KUO SAB de CV, Class B | | | 1,907,144 | | | $ | 4,205,110 | |
# | | Grupo Mexico SAB de CV, Class B | | | 10,518,496 | | | | 46,093,778 | |
* | | Grupo Pochteca SAB de CV | | | 67,810 | | | | 26,843 | |
* | | Grupo Posadas SAB de CV | | | 312,086 | | | | 407,767 | |
| | Grupo Rotoplas SAB de CV | | | 201,455 | | | | 278,777 | |
* | | Grupo Sanborns SAB de CV | | | 1,360,018 | | | | 1,585,411 | |
* | | Grupo Simec SAB de CV, Class B | | | 690,073 | | | | 5,698,432 | |
| | Grupo Televisa SAB, Sponsored ADR | | | 713,059 | | | | 7,216,157 | |
| | Grupo Televisa SAB | | | 2,296,479 | | | | 4,646,946 | |
* | | Hoteles City Express SAB de CV | | | 259,134 | | | | 80,051 | |
| | Industrias Bachoco SAB de CV, Class B | | | 1,288,503 | | | | 4,538,049 | |
* | | Industrias CH SAB de CV, Class B | | | 1,878,046 | | | | 16,282,845 | |
# * | | Industrias Penoles SAB de CV | | | 513,804 | | | | 6,559,062 | |
# | | La Comer SAB de CV | | | 3,893,073 | | | | 6,983,252 | |
| | Medica Sur SAB de CV, Class B | | | 1,000 | | | | 2,132 | |
| | Megacable Holdings SAB de CV | | | 137,229 | | | | 404,995 | |
* | | Minera Frisco SAB de CV, Class A1 | | | 13,254,671 | | | | 2,446,461 | |
# * W | | Nemak SAB de CV | | | 9,781,685 | | | | 2,242,547 | |
| | Orbia Advance Corp. SAB de CV | | | 4,322,662 | | | | 11,295,862 | |
# | | Organizacion Cultiba SAB de CV | | | 157,421 | | | | 78,756 | |
# * | | Organizacion Soriana SAB de CV, Class B | | | 13,635,143 | | | | 16,557,149 | |
| | Promotora y Operadora de Infraestructura SAB de CV | | | 415,490 | | | | 3,060,475 | |
# * | | Unifin Financiera SAB de CV | | | 737,216 | | | | 1,138,696 | |
| | Vitro SAB de CV, Class A | | | 927,658 | | | | 1,076,891 | |
| | | | | | | | | | |
TOTAL MEXICO | | | | | | | 306,523,841 | |
| | | | | | | | | | |
PHILIPPINES — (0.9%) | | | | | | | | |
†† | | ACR Mining Corp. | | | 105,455 | | | | 7,021 | |
| | Alliance Global Group, Inc. | | | 22,644,306 | | | | 4,679,383 | |
| | Alsons Consolidated Resources, Inc. | | | 7,682,000 | | | | 173,367 | |
* | | Apex Mining Co., Inc. | | | 2,152,000 | | | | 61,783 | |
* | | Atlas Consolidated Mining & Development Corp. | | | 4,214,600 | | | | 526,900 | |
| | Ayala Corp. | | | 82,790 | | | | 1,418,674 | |
| | Bank of the Philippine Islands | | | 3,780,263 | | | | 6,522,190 | |
| | BDO Unibank, Inc. | | | 9,287,358 | | | | 22,858,117 | |
* | | Belle Corp. | | | 4,041,000 | | | | 112,280 | |
* | | Cebu Air, Inc. | | | 1,129,830 | | | | 992,976 | |
* W | | CEMEX Holdings Philippines, Inc. | | | 17,723,719 | | | | 435,804 | |
| | Century Properties Group, Inc. | | | 13,996,400 | | | | 127,580 | |
| | China Banking Corp. | | | 7,866,732 | | | | 3,770,111 | |
| | Cosco Capital, Inc. | | | 12,919,000 | | | | 1,339,182 | |
| | DMCI Holdings, Inc. | | | 8,009,300 | | | | 1,261,752 | |
* | | East West Banking Corp. | | | 2,667,000 | | | | 500,488 | |
* | | EEI Corp. | | | 1,850,500 | | | | 239,583 | |
†† | | Export & Industry Bank, Inc., Class A | | | 14,950 | | | | 0 | |
| | Filinvest Development Corp. | | | 384,400 | | | | 61,455 | |
| | Filinvest Land, Inc. | | | 73,198,031 | | | | 1,672,115 | |
| | First Philippine Holdings Corp. | | | 3,175,100 | | | | 4,688,076 | |
†† | | Fwbc Holdings, Inc. | | | 5,471,786 | | | | 0 | |
| | Global Ferronickel Holdings, Inc. | | | 9,631,116 | | | | 405,566 | |
| | GT Capital Holdings, Inc. | | | 271,527 | | | | 3,046,681 | |
* | | Integrated Micro-Electronics, Inc. | | | 2,057,200 | | | | 362,467 | |
| | JG Summit Holdings, Inc. | | | 12,249,017 | | | | 14,627,634 | |
| | LT Group, Inc. | | | 9,164,300 | | | | 1,829,501 | |
| | Megaworld Corp. | | | 60,961,300 | | | | 3,714,039 | |
| | Metropolitan Bank & Trust Co. | | | 9,034,092 | | | | 8,544,392 | |
| | Nickel Asia Corp. | | | 12,259,240 | | | | 1,334,581 | |
* | | Petron Corp. | | | 16,167,900 | | | | 1,239,054 | |
| | Philex Mining Corp. | | | 4,703,000 | | | | 486,110 | |
DIMENSIONAL EMERGING MARKETS VALUE FUND
CONTINUED
| | | | | | | | | | |
| | | | | Shares | | | Value» | |
PHILIPPINES — (Continued) | | | | | | | | |
* | | Philippine National Bank | | | 3,173,985 | | | $ | 1,265,129 | |
* †† | | Philippine National Construction Corp. | | | 398,900 | | | | 7,272 | |
| | Philippine Savings Bank | | | 1,950,769 | | | | 2,247,163 | |
†† | | Philippine Townships, Inc. | | | 226,200 | | | | 0 | |
†† | | Philtown Properties, Inc. | | | 6,701 | | | | 0 | |
* | | Phoenix Petroleum Philippines, Inc. | | | 1,259,500 | | | | 284,614 | |
* | | Pilipinas Shell Petroleum Corp. | | | 112,730 | | | | 48,311 | |
| | PNB Holdings Corp. | | | 497,957 | | | | 3,148 | |
| | Premium Leisure Corp. | | | 6,804,000 | | | | 58,800 | |
| | RFM Corp. | | | 762,400 | | | | 67,983 | |
| | Rizal Commercial Banking Corp. | | | 4,608,906 | | | | 1,764,296 | |
| | Robinsons Land Corp. | | | 22,395,608 | | | | 7,570,664 | |
| | Robinsons Retail Holdings, Inc. | | | 551,620 | | | | 680,898 | |
| | San Miguel Corp. | | | 5,113,496 | | | | 11,841,622 | |
| | Security Bank Corp. | | | 1,414,324 | | | | 3,393,435 | |
* | | Top Frontier Investment Holdings, Inc. | | | 526,832 | | | | 1,369,512 | |
| | Union Bank of the Philippines | | | 3,643,939 | | | | 6,534,766 | |
| | Vista Land & Lifescapes, Inc. | | | 46,966,968 | | | | 3,516,767 | |
| | | | | | | | | | |
TOTAL PHILIPPINES | | | | | | | 127,693,242 | |
| | | | | | | | | | |
POLAND — (0.8%) | | | | | | | | |
* | | Agora SA | | | 230,402 | | | | 472,603 | |
* | | Alior Bank SA | | | 424,541 | | | | 6,701,212 | |
| | Amica SA | | | 5,928 | | | | 182,786 | |
| | Asseco Poland SA | | | 2,753 | | | | 67,796 | |
| | Bank Handlowy w Warszawie SA | | | 5,962 | | | | 86,529 | |
* | | Bank Millennium SA | | | 2,475,509 | | | | 5,682,674 | |
| | Bank Polska Kasa Opieki SA | | | 8,454 | | | | 279,321 | |
* | | Boryszew SA | | | 283,585 | | | | 226,632 | |
| | Ciech SA | | | 151,622 | | | | 1,349,284 | |
| | Cyfrowy Polsat SA | | | 512,024 | | | | 4,579,121 | |
| | Develia SA | | | 1,336,579 | | | | 1,202,809 | |
* | | Enea SA | | | 1,484,378 | | | | 3,768,276 | |
* | | Famur SA | | | 68,091 | | | | 53,343 | |
| | Firma Oponiarska Debica SA | | | 13,080 | | | | 253,092 | |
* | | Grupa Azoty SA | | | 242,822 | | | | 1,813,906 | |
| | Grupa Kety SA | | | 25,837 | | | | 4,057,123 | |
* | | Grupa Lotos SA | | | 393,782 | | | | 6,121,353 | |
* | | Jastrzebska Spolka Weglowa SA | | | 175,136 | | | | 2,279,079 | |
| | Kernel Holding SA | | | 402,854 | | | | 6,084,614 | |
| | KGHM Polska Miedz SA | | | 187,839 | | | | 7,223,007 | |
# * | | Lubelski Wegiel Bogdanka SA | | | 52,381 | | | | 528,928 | |
# * | | mBank SA | | | 34,717 | | | | 4,913,390 | |
* | | PGE Polska Grupa Energetyczna SA | | | 4,539,080 | | | | 11,169,655 | |
# * | | PKP Cargo SA | | | 109,382 | | | | 504,216 | |
| | Polski Koncern Naftowy Orlen SA | | | 1,850,376 | | | | 39,906,813 | |
| | Santander Bank Polska SA | | | 2,475 | | | | 230,221 | |
| | Stalexport Autostrady SA | | | 189,773 | | | | 189,601 | |
* | | Tauron Polska Energia SA | | | 7,008,234 | | | | 5,779,790 | |
| | | | | | | | | | |
TOTAL POLAND | | | | | | | 115,707,174 | |
| | | | | | | | | | |
QATAR — (0.3%) | | | | | | | | |
| | Aamal Co. | | | 5,690,904 | | | | 1,705,810 | |
| | Al Khaleej Takaful Group QSC | | | 629,100 | | | | 779,735 | |
| | Al Khalij Commercial Bank PQSC | | | 633,121 | | | | 389,506 | |
| | Alijarah Holding Co. QPSC | | | 1,862,841 | | | | 530,169 | |
| | Baladna | | | 2,407,422 | | | | 1,062,379 | |
| | Barwa Real Estate Co. | | | 3,863,655 | | | | 3,349,839 | |
DIMENSIONAL EMERGING MARKETS VALUE FUND
CONTINUED
| | | | | | | | | | |
| | | | | Shares | | | Value» | |
QATAR — (Continued) | | | | | | | | |
| | Commercial Bank PSQC | | | 2,700,139 | | | $ | 4,540,035 | |
| | Doha Bank QPSC | | | 2,167,920 | | | | 1,715,817 | |
| | Doha Insurance Co. QSC | | | 34,356 | | | | 18,344 | |
* | | Gulf International Services QSC | | | 4,508,235 | | | | 2,280,656 | |
| | Gulf Warehousing Co. | | | 579,952 | | | | 780,310 | |
| | Industries Qatar QSC | | | 402,910 | | | | 1,755,582 | |
* | | Investment Holding Group | | | 2,117,901 | | | | 805,283 | |
| | Mannai Corp. QSC | | | 42,393 | | | | 56,157 | |
| | Mazaya Real Estate Development QPSC | | | 4,065,793 | | | | 1,164,486 | |
| | Mesaieed Petrochemical Holding Co. | | | 4,580,158 | | | | 3,026,010 | |
| | Ooredoo QPSC | | | 2,740,717 | | | | 5,218,329 | |
| | Qatar Fuel QSC | | | 352,837 | | | | 1,782,432 | |
* | | Qatar Insurance Co. SAQ | | | 1,583,791 | | | | 1,068,944 | |
| | Qatar National Cement Co. QSC | | | 354,384 | | | | 492,019 | |
| | Qatar Navigation QSC | | | 429,957 | | | | 897,357 | |
* | | Salam International Investment Ltd. QSC | | | 4,845,436 | | | | 1,268,012 | |
| | United Development Co. QSC | | | 7,639,216 | | | | 3,265,930 | |
| | Vodafone Qatar QSC | | | 5,496,029 | | | | 2,445,845 | |
| | Widam Food Co. | | | 142,061 | | | | 159,285 | |
| | | | | | | | | | |
TOTAL QATAR | | | | | | | 40,558,271 | |
| | | | | | | | | | |
RUSSIA — (1.8%) | | | | | | | | |
| | Etalon Group PLC, GDR | | | 88,415 | | | | 138,989 | |
| | Gazprom PJSC, Sponsored ADR | | | 10,367,186 | | | | 101,731,786 | |
| | Gazprom PJSC, Sponsored ADR | | | 18,140 | | | | 178,679 | |
| | Lukoil PJSC, Sponsored ADR | | | 1,075,422 | | | | 109,618,672 | |
| | Magnitogorsk Iron & Steel Works PJSC, GDR | | | 26,642 | | | | 324,910 | |
| | Rosneft Oil Co. PJSC, GDR | | | 1,733,767 | | | | 15,447,864 | |
| | RusHydro PJSC, ADR | | | 4,679,167 | | | | 5,119,411 | |
| | VTB Bank PJSC, GDR | | | 5,566,616 | | | | 8,104,993 | |
| | | | | | | | | | |
TOTAL RUSSIA | | | | | | | 240,665,304 | |
| | | | | | | | | | |
SAUDI ARABIA — (2.9%) | | | | | | | | |
| | Al Babtain Power & Telecommunication Co. | | | 154,490 | | | | 1,523,862 | |
* | | Al Etihad Cooperative Insurance Co. | | | 96,130 | | | | 565,108 | |
* | | Al Jouf Cement Co. | | | 608,319 | | | | 1,946,144 | |
| | Al Khaleej Training & Education Co. | | | 157,685 | | | | 1,169,662 | |
| | Alinma Bank | | | 4,600,379 | | | | 30,887,663 | |
* | | AlJazira Takaful Ta’awuni Co. | | | 110,855 | | | | 817,352 | |
| | Arab National Bank | | | 1,495,792 | | | | 9,190,127 | |
| | Arabian Cement Co. | | | 369,710 | | | | 3,846,733 | |
* | | Arabian Shield Cooperative Insurance Co. | | | 63,009 | | | | 409,261 | |
| | Arriyadh Development Co. | | | 201,350 | | | | 1,428,774 | |
* | | Aseer Trading Tourism & Manufacturing Co. | | | 54,499 | | | | 331,240 | |
| | Astra Industrial Group | | | 208,369 | | | | 2,398,474 | |
* | | AXA Cooperative Insurance Co. | | | 26,172 | | | | 253,309 | |
| | Bank Al-Jazira | | | 1,651,367 | | | | 8,465,295 | |
| | Banque Saudi Fransi | | | 1,170,655 | | | | 13,176,734 | |
* | | Basic Chemical Industries Ltd. | | | 78,332 | | | | 987,495 | |
* | | Buruj Cooperative Insurance Co. | | | 9,573 | | | | 66,510 | |
| | City Cement Co. | | | 460,609 | | | | 2,974,402 | |
* | | Dar Al Arkan Real Estate Development Co. | | | 1,990,695 | | | | 5,253,978 | |
* | | Dur Hospitality Co. | | | 316,162 | | | | 3,013,493 | |
| | Eastern Province Cement Co. | | | 281,927 | | | | 3,603,799 | |
* | | Emaar Economic City | | | 1,762,923 | | | | 5,963,072 | |
| | Etihad Etisalat Co. | | | 1,958,085 | | | | 15,786,518 | |
| | Hail Cement Co. | | | 363,748 | | | | 1,433,501 | |
* | | L’Azurde Co. for Jewelry | | | 17,564 | | | | 103,851 | |
DIMENSIONAL EMERGING MARKETS VALUE FUND
CONTINUED
| | | | | | | | | | |
| | | | | Shares | | | Value» | |
SAUDI ARABIA — (Continued) | | | | | | | | |
* | | Middle East Healthcare Co. | | | 176,626 | | | $ | 1,751,242 | |
* | | Middle East Paper Co. | | | 173,053 | | | | 2,135,250 | |
* | | Mobile Telecommunications Co. Saudi Arabia | | | 1,839,162 | | | | 6,657,089 | |
| | Najran Cement Co. | | | 608,408 | | | | 3,062,609 | |
* | | National Co. for Glass Manufacturing | | | 84,751 | | | | 835,855 | |
* | | National Industrialization Co. | | | 1,248,571 | | | | 8,310,561 | |
| | Northern Region Cement Co. | | | 762,631 | | | | 3,025,016 | |
| | Riyad Bank | | | 3,615,679 | | | | 28,465,458 | |
| | Sahara International Petrochemical Co. | | | 1,691,932 | | | | 19,868,528 | |
* | | Saudi Arabian Cooperative Insurance Co. | | | 12,606 | | | | 75,004 | |
* | | Saudi Arabian Mining Co. | | | 676,008 | | | | 14,738,626 | |
| | Saudi Basic Industries Corp. | | | 2,016,628 | | | | 69,505,998 | |
| | Saudi British Bank | | | 2,579,084 | | | | 22,792,059 | |
| | Saudi Ceramic Co. | | | 45,710 | | | | 663,490 | |
| | Saudi Chemical Co. Holding | | | 280,722 | | | | 2,838,268 | |
| | Saudi Industrial Investment Group | | | 663,836 | | | | 6,709,710 | |
| | Saudi Investment Bank | | | 537,224 | | | | 2,583,063 | |
* | | Saudi Kayan Petrochemical Co. | | | 3,601,259 | | | | 19,604,158 | |
| | Saudi National Bank | | | 2,441,717 | | | | 42,863,591 | |
* | | Saudi Re for Cooperative Reinsurance Co. | | | 209,860 | | | | 1,069,404 | |
| | Savola Group | | | 36,261 | | | | 353,725 | |
* | | Seera Group Holding | | | 850,351 | | | | 5,246,921 | |
* | | Tabuk Cement Co. | | | 339,247 | | | | 1,720,592 | |
| | Umm Al-Qura Cement Co. | | | 147,572 | | | | 1,044,351 | |
* | | Walaa Cooperative Insurance Co. | | | 152,249 | | | | 887,787 | |
* | | Yamama Cement Co. | | | 733,143 | | | | 5,414,140 | |
| | Yanbu Cement Co. | | | 250,091 | | | | 2,558,241 | |
* | | Zamil Industrial Investment Co. | | | 177,346 | | | | 1,676,644 | |
| | | | | | | | | | |
TOTAL SAUDI ARABIA | | | | | | | 392,053,737 | |
| | | | | | | | | | |
SOUTH AFRICA — (3.9%) | | | | | | | | |
| | Absa Group Ltd. | | | 2,897,453 | | | | 26,504,781 | |
| | Adcock Ingram Holdings Ltd. | | | 38,356 | | | | 122,688 | |
| | Advtech Ltd. | | | 99,684 | | | | 125,215 | |
| | AECI Ltd. | | | 1,064,965 | | | | 7,907,170 | |
| | African Rainbow Minerals Ltd. | | | 563,604 | | | | 7,525,275 | |
| | Alexander Forbes Group Holdings Ltd. | | | 5,708,639 | | | | 1,636,660 | |
| | Altron Ltd., Class A | | | 134,145 | | | | 96,334 | |
| | Alviva Holdings Ltd. | | | 641,511 | | | | 625,406 | |
# | | AngloGold Ashanti Ltd., Sponsored ADR | | | 1,374,436 | | | | 25,399,577 | |
| | Aspen Pharmacare Holdings Ltd. | | | 1,503,087 | | | | 23,879,046 | |
| | Astral Foods Ltd. | | | 139,390 | | | | 1,612,120 | |
| | Barloworld Ltd. | | | 1,558,940 | | | | 13,092,125 | |
| | Bidvest Group Ltd. | | | 26,151 | | | | 327,442 | |
* | | Blue Label Telecoms Ltd. | | | 2,854,170 | | | | 1,036,198 | |
# * | | Brait PLC | | | 5,322,564 | | | | 1,484,560 | |
| | Caxton & CTP Publishers & Printers Ltd. | | | 1,280,784 | | | | 744,896 | |
| | DataTec Ltd. | | | 3,395,574 | | | | 9,246,198 | |
# * | | Discovery Ltd. | | | 525,488 | | | | 4,820,968 | |
| | DRDGOLD Ltd. | | | 1,124,510 | | | | 998,563 | |
| | Exxaro Resources Ltd. | | | 1,038,924 | | | | 11,397,840 | |
* | | Foschini Group Ltd. | | | 74,521 | | | | 631,969 | |
| | Gold Fields Ltd., Sponsored ADR | | | 3,473,912 | | | | 32,237,903 | |
* | | Grindrod Ltd. | | | 1,937,400 | | | | 646,643 | |
# * | | Grindrod Shipping Holdings Ltd. | | | 67,963 | | | | 976,561 | |
| | Harmony Gold Mining Co. Ltd. | | | 1,224,659 | | | | 4,395,411 | |
| | Hudaco Industries Ltd. | | | 160,964 | | | | 1,447,705 | |
# | | Impala Platinum Holdings Ltd. | | | 3,660,330 | | | | 47,373,273 | |
| | Imperial Logistics Ltd. | | | 1,234,961 | | | | 5,043,653 | |
DIMENSIONAL EMERGING MARKETS VALUE FUND
CONTINUED
| | | | | | | | | | |
| | | | | Shares | | | Value» | |
SOUTH AFRICA — (Continued) | | | | | | | | |
| | Investec Ltd. | | | 1,205,052 | | | $ | 5,548,156 | |
| | KAP Industrial Holdings Ltd. | | | 8,126,436 | | | | 2,500,766 | |
| | Lewis Group Ltd. | | | 831,398 | | | | 2,355,530 | |
* | | Liberty Holdings Ltd. | | | 822,035 | | | | 4,853,665 | |
* | | Life Healthcare Group Holdings Ltd. | | | 3,082,381 | | | | 4,881,196 | |
* | | Long4Life Ltd. | | | 1,383,403 | | | | 542,813 | |
| | Merafe Resources Ltd. | | | 7,498,397 | | | | 564,620 | |
| | Metair Investments Ltd. | | | 1,142,050 | | | | 2,166,834 | |
| | Momentum Metropolitan Holdings | | | 6,169,743 | | | | 7,922,915 | |
| | Motus Holdings Ltd. | | | 300,269 | | | | 2,003,473 | |
* | | Mpact Ltd. | | | 1,853,981 | | | | 4,129,874 | |
* | | MTN Group Ltd. | | | 10,241,812 | | | | 91,839,637 | |
* | | Murray & Roberts Holdings Ltd. | | | 5,054,389 | | | | 4,631,761 | |
| | Nedbank Group Ltd. | | | 1,386,974 | | | | 15,804,622 | |
| | Ninety One Ltd. | | | 855,117 | | | | 2,952,851 | |
| | Oceana Group Ltd. | | | 127,899 | | | | 511,762 | |
# | | Old Mutual Ltd. | | | 17,256,455 | | | | 17,627,551 | |
# | | Omnia Holdings Ltd. | | | 1,243,158 | | | | 5,143,605 | |
# * W | | Pepkor Holdings Ltd. | | | 1,482,624 | | | | 2,337,718 | |
* | | PPC Ltd. | | | 10,395,993 | | | | 3,626,621 | |
| | PSG Group Ltd. | | | 13,550 | | | | 67,889 | |
| | Raubex Group Ltd. | | | 1,345,968 | | | | 2,877,497 | |
| | RCL Foods Ltd. | | | 159,113 | | | | 134,051 | |
| | Reunert Ltd. | | | 1,092,215 | | | | 3,608,299 | |
| | RFG Holdings Ltd. | | | 23,326 | | | | 18,992 | |
# | | Royal Bafokeng Platinum Ltd. | | | 591,722 | | | | 4,238,991 | |
| | Sanlam Ltd. | | | 116,111 | | | | 476,928 | |
# * | | Sappi Ltd. | | | 3,445,017 | | | | 10,582,386 | |
* | | Sasol Ltd. | | | 1,976,907 | | | | 33,204,068 | |
| | Sibanye Stillwater Ltd. | | | 1,447,583 | | | | 5,066,179 | |
| | Standard Bank Group Ltd. | | | 5,188,666 | | | | 45,978,959 | |
# * | | Steinhoff International Holdings NV | | | 4,384,451 | | | | 690,367 | |
| | Super Group Ltd. | | | 2,904,734 | | | | 6,077,153 | |
* | | Telkom SA SOC Ltd. | | | 1,676,467 | | | | 5,579,172 | |
| | Tiger Brands Ltd. | | | 14,459 | | | | 183,037 | |
* | | Tongaat Hulett Pvt Ltd. | | | 477,823 | | | | 225,891 | |
* | | Trencor Ltd. | | | 1,135,741 | | | | 321,894 | |
* | | Tsogo Sun Gaming Ltd. | | | 1,713,438 | | | | 1,382,642 | |
| | Wilson Bayly Holmes-Ovcon Ltd. | | | 328,383 | | | | 2,283,054 | |
| | | | | | | | | | |
TOTAL SOUTH AFRICA | | | | | | | 536,279,599 | |
| | | | | | | | | | |
SOUTH KOREA — (13.3%) | | | | | | | | |
| | ABco Electronics Co. Ltd. | | | 13,699 | | | | 133,321 | |
| | Aekyung Petrochemical Co. Ltd. | | | 73,470 | | | | 848,335 | |
| | Ahn-Gook Pharmaceutical Co. Ltd. | | | 14,137 | | | | 125,274 | |
| | AJ Networks Co. Ltd. | | | 69,115 | | | | 331,720 | |
* | | Ajin Industrial Co. Ltd. | | | 210,783 | | | | 639,586 | |
| | AK Holdings, Inc. | | | 29,750 | | | | 676,178 | |
| | AMOREPACIFIC Group | | | 20,330 | | | | 865,297 | |
* | | Aprogen pharmaceuticals, Inc. | | | 807,824 | | | | 707,221 | |
* | | Asia Business Daily Co. Ltd. | | | 11,337 | | | | 37,908 | |
# | | Asia Cement Co. Ltd. | | | 10,339 | | | | 1,210,452 | |
| | ASIA Holdings Co. Ltd. | | | 5,694 | | | | 608,194 | |
| | Asia Paper Manufacturing Co. Ltd. | | | 27,225 | | | | 1,069,912 | |
* | | AUK Corp. | | | 137,335 | | | | 382,041 | |
| | Aurora World Corp. | | | 19,282 | | | | 170,237 | |
| | Austem Co. Ltd. | | | 139,331 | | | | 339,437 | |
# | | Autech Corp. | | | 10,937 | | | | 102,353 | |
| | Avaco Co. Ltd. | | | 53,567 | | | | 474,094 | |
DIMENSIONAL EMERGING MARKETS VALUE FUND
CONTINUED
| | | | | | | | | | |
| | | | | Shares | | | Value» | |
SOUTH KOREA — (Continued) | | | | | | | | |
* | | Barunson Entertainment & Arts Corp. | | | 76,043 | | | $ | 113,192 | |
| | Bcworld Pharm Co. Ltd. | | | 4,341 | | | | 63,173 | |
| | BGF Co. Ltd. | | | 206,500 | | | | 982,534 | |
* | | BHI Co. Ltd. | | | 9,905 | | | | 42,579 | |
| | Binggrae Co. Ltd. | | | 15,005 | | | | 715,479 | |
* | | BioSmart Co. Ltd. | | | 54,215 | | | | 251,653 | |
| | Bixolon Co. Ltd. | | | 27,536 | | | | 131,619 | |
* | | Bluecom Co. Ltd. | | | 63,344 | | | | 512,307 | |
| | BNK Financial Group, Inc. | | | 1,040,137 | | | | 7,841,623 | |
| | Bookook Securities Co. Ltd. | | | 20,358 | | | | 429,255 | |
| | BYC Co. Ltd. | | | 752 | | | | 280,833 | |
# | | Byucksan Corp. | | | 266,300 | | | | 835,518 | |
* | | Capro Corp. | | | 203,349 | | | | 722,512 | |
* | | Charm Engineering Co. Ltd. | | | 75,503 | | | | 81,424 | |
| | Chinyang Holdings Corp. | | | 83,349 | | | | 230,262 | |
| | Chongkundang Holdings Corp. | | | 8,017 | | | | 562,459 | |
* | | CHOROKBAEM Co Co. Ltd. | | | 149,335 | | | | 196,708 | |
| | Chosun Refractories Co. Ltd. | | | 8,873 | | | | 668,754 | |
# | | CJ CheilJedang Corp. | | | 49,964 | | | | 16,238,483 | |
# | | CJ Corp. | | | 94,577 | | | | 7,775,689 | |
| | CJ ENM Co. Ltd. | | | 16,763 | | | | 2,535,430 | |
* | | CJ Logistics Corp. | | | 16,185 | | | | 1,967,949 | |
* | | Cloud Air Co. Ltd. | | | 53,283 | | | | 80,313 | |
* | | CODI-M Co. Ltd. | | | 970,980 | | | | 206,168 | |
| | Com2uSCorp | | | 5,068 | | | | 558,331 | |
* | | Comtec Systems Co. Ltd. | | | 330,288 | | | | 263,104 | |
| | Cosmax BTI, Inc. | | | 16,614 | | | | 248,220 | |
* | | Cosmecca Korea Co. Ltd. | | | 11,799 | | | | 150,814 | |
| | Coweaver Co. Ltd. | | | 16,593 | | | | 113,456 | |
| | Crown Confectionery Co. Ltd. | | | 11,579 | | | | 102,164 | |
| | CROWNHAITAI Holdings Co. Ltd. | | | 35,198 | | | | 267,226 | |
| | Cuckoo Holdings Co. Ltd. | | | 1,955 | | | | 37,746 | |
| | Cymechs, Inc. | | | 3,124 | | | | 43,864 | |
| | D.I Corp. | | | 59,363 | | | | 402,540 | |
| | Dae Han Flour Mills Co. Ltd. | | | 5,781 | | | | 812,193 | |
| | Dae Hyun Co. Ltd. | | | 170,764 | | | | 420,589 | |
| | Dae Won Kang Up Co. Ltd. | | | 215,821 | | | | 779,220 | |
* | | Dae Yu Co. Ltd. | | | 3,600 | | | | 19,141 | |
| | Daebongls Co. Ltd. | | | 4,061 | | | | 30,373 | |
# * | | Daechang Co. Ltd. | | | 318,178 | | | | 555,145 | |
| | Daechang Forging Co. Ltd. | | | 25,625 | | | | 166,870 | |
# | | Daedong Corp. | | | 106,769 | | | | 897,783 | |
| | Daeduck Co. Ltd. | | | 62,504 | | | | 392,511 | |
| | Daeduck Electronics Co. Ltd. | | | 179,378 | | | | 2,643,114 | |
| | Daehan Steel Co. Ltd. | | | 74,722 | | | | 1,190,293 | |
| | Daejung Chemicals & Metals Co. Ltd. | | | 2,193 | | | | 41,307 | |
| | Daekyo Co. Ltd. | | | 71,052 | | | | 263,816 | |
| | Daelim B&Co Co. Ltd. | | | 7,997 | | | | 47,987 | |
| | Daesang Corp. | | | 146,487 | | | | 2,996,812 | |
| | Daesang Holdings Co. Ltd. | | | 83,742 | | | | 718,395 | |
* | | Daesung Fine Tech Co. Ltd. | | | 21,216 | | | | 40,304 | |
| | Daesung Holdings Co. Ltd. | | | 8,931 | | | | 338,517 | |
| | Daewon San Up Co. Ltd. | | | 61,406 | | | | 349,184 | |
* | | Daewoo Engineering & Construction Co. Ltd. | | | 1,087,536 | | | | 5,822,577 | |
# * | | Daewoo Shipbuilding & Marine Engineering Co. Ltd. | | | 319,791 | | | | 7,102,873 | |
* | | Dahaam E-Tec Co. Ltd. | | | 3,535 | | | | 146,718 | |
| | Daihan Pharmaceutical Co. Ltd. | | | 12,480 | | | | 323,165 | |
| | Daishin Securities Co. Ltd. | | | 178,438 | | | | 3,187,036 | |
| | Daou Data Corp. | | | 88,252 | | | | 1,026,266 | |
DIMENSIONAL EMERGING MARKETS VALUE FUND
CONTINUED
| | | | | | | | | | |
| | | | | Shares | | | Value» | |
SOUTH KOREA — (Continued) | | | | | | | | |
| | Daou Technology, Inc. | | | 156,639 | | | $ | 3,133,785 | |
* | | Dayou Automotive Seat Technology Co. Ltd. | | | 54,169 | | | | 83,316 | |
| | DB Financial Investment Co. Ltd. | | | 192,414 | | | | 1,167,194 | |
| | DB Insurance Co. Ltd. | | | 293,336 | | | | 14,907,261 | |
* | | DB, Inc. | | | 197,479 | | | | 173,102 | |
| | DCM Corp. | | | 2,961 | | | | 56,817 | |
# | | Deutsch Motors, Inc. | | | 67,324 | | | | 438,731 | |
* | | Development Advance Solution Co. Ltd. | | | 63,090 | | | | 279,262 | |
| | DGB Financial Group, Inc. | | | 1,071,021 | | | | 9,490,129 | |
| | DHP Korea Co. Ltd. | | | 21,387 | | | | 128,019 | |
| | DI Dong Il Corp. | | | 5,500 | | | | 1,352,934 | |
| | Display Tech Co. Ltd. | | | 34,003 | | | | 265,792 | |
| | DL Construction Co. Ltd. | | | 6,643 | | | | 167,809 | |
* | | DL E&C Co. Ltd. | | | 119,161 | | | | 13,796,140 | |
| | DL Holdings Co. Ltd. | | | 95,046 | | | | 5,358,800 | |
| | DMS Co. Ltd. | | | 58,689 | | | | 323,266 | |
| | Dohwa Engineering Co. Ltd. | | | 4,051 | | | | 27,488 | |
| | Dong A Eltek Co. Ltd. | | | 36,986 | | | | 342,311 | |
| | Dong-A Socio Holdings Co. Ltd. | | | 5,046 | | | | 457,202 | |
| | Dong-A ST Co. Ltd. | | | 9,293 | | | | 580,010 | |
| | Dong-Ah Geological Engineering Co. Ltd. | | | 30,571 | | | | 483,714 | |
| | Dongbu Corp. | | | 36,803 | | | | 475,892 | |
# | | Dongil Industries Co. Ltd. | | | 5,430 | | | | 660,446 | |
| | Dongkuk Industries Co. Ltd. | | | 200,221 | | | | 666,680 | |
| | Dongkuk Steel Mill Co. Ltd. | | | 400,982 | | | | 5,852,557 | |
# | | Dongkuk Structures & Construction Co. Ltd. | | | 105,011 | | | | 527,737 | |
| | Dongsung Chemical Co. Ltd. | | | 159,407 | | | | 789,183 | |
| | Dongwon Development Co. Ltd. | | | 249,969 | | | | 1,150,953 | |
# | | Dongwon F&B Co. Ltd. | | | 2,928 | | | | 514,510 | |
# | | Dongwon Industries Co. Ltd. | | | 7,492 | | | | 1,462,069 | |
* | | Dongwoo Farm To Table Co. Ltd. | | | 14,971 | | | | 39,255 | |
# | | Dongyang E&P, Inc. | | | 28,974 | | | | 481,511 | |
* | | Doosan Bobcat, Inc. | | | 239,089 | | | | 7,814,071 | |
# | | Doosan Co. Ltd. | | | 41,937 | | | | 3,710,532 | |
# * | | Doosan Infracore Co. Ltd. | | | 461,007 | | | | 4,149,538 | |
| | DoubleUGames Co. Ltd. | | | 24,305 | | | | 1,335,957 | |
| | DRB Holding Co. Ltd. | | | 32,057 | | | | 152,656 | |
| | DTR Automotive Corp. | | | 25,146 | | | | 1,251,691 | |
* | | Duksan Hi-Metal Co. Ltd. | | | 12,725 | | | | 149,355 | |
| | DY Corp. | | | 99,543 | | | | 468,377 | |
| | DY POWER Corp. | | | 23,114 | | | | 252,452 | |
| | Eagon Industrial Ltd. | | | 37,684 | | | | 459,159 | |
# | | Easy Holdings Co. Ltd. | | | 310,378 | | | | 1,193,085 | |
* | | EcoBio Holdings Co. Ltd. | | | 3,536 | | | | 26,980 | |
| | e-LITECOM Co. Ltd. | | | 12,362 | | | | 86,748 | |
| | E-MART, Inc. | | | 75,843 | | | | 10,917,758 | |
| | ENF Technology Co. Ltd. | | | 6,907 | | | | 171,385 | |
| | Estechpharma Co. Ltd. | | | 22,481 | | | | 202,693 | |
# | | Eugene Corp. | | | 285,673 | | | | 1,238,991 | |
| | Eugene Investment & Securities Co. Ltd. | | | 397,054 | | | | 1,294,581 | |
| | Eusu Holdings Co. Ltd. | | | 64,565 | | | | 329,673 | |
* | | E-World | | | 82,123 | | | | 171,810 | |
| | Exicon Co. Ltd. | | | 4,859 | | | | 58,098 | |
| | Farmsco | | | 43,103 | | | | 224,556 | |
| | FarmStory Co. Ltd. | | | 149,369 | | | | 347,921 | |
| | Fursys, Inc. | | | 20,360 | | | | 680,088 | |
| | Gaon Cable Co. Ltd. | | | 15,461 | | | | 376,197 | |
* | | Gemvaxlink Co. Ltd. | | | 117,017 | | | | 161,020 | |
| | Geumhwa PSC Co. Ltd. | | | 976 | | | | 27,366 | |
DIMENSIONAL EMERGING MARKETS VALUE FUND
CONTINUED
| | | | | | | | | | |
| | | | | Shares | | | Value» | |
SOUTH KOREA — (Continued) | | | | | | | | |
* | | GMB Korea Corp. | | | 48,932 | | | $ | 271,047 | |
# * | | GNCO Co. Ltd. | | | 157,201 | | | | 112,249 | |
# | | Golfzon Newdin Holdings Co. Ltd. | | | 129,412 | | | | 961,609 | |
| | GS Engineering & Construction Corp. | | | 387,399 | | | | 13,746,425 | |
* | | GS Global Corp. | | | 296,677 | | | | 656,351 | |
| | GS Holdings Corp. | | | 288,772 | | | | 10,457,731 | |
| | GS Retail Co. Ltd. | | | 43,158 | | | | 1,191,538 | |
| | Gwangju Shinsegae Co. Ltd. | | | 3,803 | | | | 629,834 | |
| | Haitai Confectionery & Foods Co. Ltd. | | | 12,558 | | | | 89,637 | |
| | Halla Corp. | | | 142,882 | | | | 690,940 | |
| | Halla Holdings Corp. | | | 41,387 | | | | 1,807,748 | |
| | Han Kuk Carbon Co. Ltd. | | | 48,941 | | | | 527,500 | |
| | Hana Financial Group, Inc. | | | 1,405,990 | | | | 54,214,720 | |
| | Hana Pharm Co. Ltd. | | | 4,076 | | | | 71,767 | |
| | HanChang Paper Co. Ltd. | | | 21,637 | | | | 38,030 | |
| | Handok, Inc. | | | 14,535 | | | | 294,915 | |
| | Handsome Co. Ltd. | | | 90,119 | | | | 3,256,227 | |
| | Hanil Holdings Co. Ltd. | | | 76,457 | | | | 914,297 | |
| | Hanjin Transportation Co. Ltd. | | | 53,218 | | | | 1,583,856 | |
| | Hankook Tire & Technology Co. Ltd. | | | 447,631 | | | | 15,860,169 | |
| | HanmiGlobal Co. Ltd. | | | 3,947 | | | | 36,137 | |
| | Hanshin Construction | | | 50,121 | | | | 817,750 | |
| | Hanshin Machinery Co. | | | 16,044 | | | | 59,606 | |
| | Hansol Holdings Co. Ltd. | | | 188,105 | | | | 610,608 | |
* | | Hansol HomeDeco Co. Ltd. | | | 394,971 | | | | 679,466 | |
| | Hansol Paper Co. Ltd. | | | 111,442 | | | | 1,376,559 | |
* | | Hansol Technics Co. Ltd. | | | 170,134 | | | | 986,475 | |
| | Hanwha Aerospace Co. Ltd. | | | 185,488 | | | | 7,164,385 | |
| | Hanwha Corp. | | | 231,796 | | | | 6,672,680 | |
* | | Hanwha General Insurance Co. Ltd. | | | 368,354 | | | | 1,427,057 | |
* | | Hanwha Investment & Securities Co. Ltd. | | | 614,846 | | | | 2,921,391 | |
| | Hanwha Life Insurance Co. Ltd. | | | 1,750,642 | | | | 5,216,457 | |
* | | Hanwha Solutions Corp. | | | 487,471 | | | | 17,101,844 | |
| | Hanyang Eng Co. Ltd. | | | 61,244 | | | | 807,136 | |
| | Hanyang Securities Co. Ltd. | | | 52,372 | | | | 798,262 | |
* | | Harim Co. Ltd. | | | 120,041 | | | | 296,052 | |
# | | Harim Holdings Co. Ltd. | | | 234,789 | | | | 1,947,540 | |
| | HDC Hyundai Engineering Plastics Co. Ltd. | | | 71,923 | | | | 362,591 | |
* | | Heungkuk Fire & Marine Insurance Co. Ltd. | | | 81,716 | | | | 271,532 | |
| | High Tech Pharm Co. Ltd. | | | 8,554 | | | | 118,649 | |
| | HIMS Co. Ltd. | | | 2,255 | | | | 17,610 | |
| | Hitejinro Holdings Co. Ltd. | | | 41,974 | | | | 535,163 | |
# | | Huchems Fine Chemical Corp. | | | 76,301 | | | | 1,729,375 | |
* | | Humax Co. Ltd. | | | 96,847 | | | | 420,629 | |
* | | Huneed Technologies | | | 54,858 | | | | 333,527 | |
| | Huons Global Co. Ltd. | | | 14,883 | | | | 629,348 | |
# | | Huvis Corp. | | | 107,479 | | | | 899,326 | |
| | Huvitz Co. Ltd. | | | 10,898 | | | | 80,904 | |
| | Hwa Shin Co. Ltd. | | | 125,321 | | | | 1,032,354 | |
| | Hwacheon Machine Tool Co. Ltd. | | | 6,607 | | | | 207,165 | |
| | Hwangkum Steel & Technology Co. Ltd. | | | 50,980 | | | | 395,621 | |
| | Hwaseung Corp. Co. Ltd. | | | 154,342 | | | | 372,412 | |
* | | Hwaseung R&A Co. Ltd. | | | 19,783 | | | | 103,491 | |
| | HwaSung Industrial Co. Ltd. | | | 51,572 | | | | 591,499 | |
| | Hy-Lok Corp. | | | 47,174 | | | | 765,277 | |
| | Hyosung Corp. | | | 34,661 | | | | 3,068,783 | |
| | Hyundai BNG Steel Co. Ltd. | | | 64,726 | | | | 927,649 | |
* | | Hyundai Construction Equipment Co. Ltd. | | | 80,573 | | | | 2,788,832 | |
| | Hyundai Corp. | | | 45,004 | | | | 710,309 | |
DIMENSIONAL EMERGING MARKETS VALUE FUND
CONTINUED
| | | | | | | | | | |
| | | | | Shares | | | Value» | |
SOUTH KOREA — (Continued) | | | | | | | | |
| | Hyundai Corp. Holdings, Inc. | | | 31,933 | | | $ | 354,725 | |
| | Hyundai Department Store Co. Ltd. | | | 81,362 | | | | 5,777,039 | |
* | | Hyundai Electric & Energy System Co. Ltd. | | | 30,010 | | | | 570,085 | |
| | Hyundai Engineering & Construction Co. Ltd. | | | 269,031 | | | | 11,630,250 | |
| | Hyundai Futurenet Co. Ltd. | | | 253,369 | | | | 1,020,765 | |
| | Hyundai Glovis Co. Ltd. | | | 20,021 | | | | 2,883,227 | |
| | Hyundai Greenfood Co. Ltd. | | | 278,992 | | | | 2,319,673 | |
| | Hyundai Heavy Industries Holdings Co. Ltd. | | | 164,915 | | | | 8,940,805 | |
| | Hyundai Home Shopping Network Corp. | | | 37,455 | | | | 2,248,333 | |
| | Hyundai Livart Furniture Co. Ltd. | | | 66,327 | | | | 901,454 | |
| | Hyundai Marine & Fire Insurance Co. Ltd. | | | 362,292 | | | | 8,147,832 | |
* | | Hyundai Mipo Dockyard Co. Ltd. | | | 78,758 | | | | 5,122,012 | |
| | Hyundai Mobis Co. Ltd. | | | 210,611 | | | | 45,527,571 | |
| | Hyundai Motor Co. | | | 370,785 | | | | 66,316,913 | |
# | | Hyundai Motor Securities Co. Ltd. | | | 115,174 | | | | 1,251,138 | |
| | Hyundai Steel Co. | | | 330,237 | | | | 12,622,563 | |
| | Hyundai Wia Corp. | | | 58,341 | | | | 4,213,143 | |
| | ICD Co. Ltd. | | | 19,844 | | | | 212,855 | |
| | IDIS Holdings Co. Ltd. | | | 25,924 | | | | 284,567 | |
* | | Il Dong Pharmaceutical Co. Ltd. | | | 27,741 | | | | 334,575 | |
| | Iljin Electric Co. Ltd. | | | 91,487 | | | | 449,125 | |
| | Iljin Holdings Co. Ltd. | | | 91,947 | | | | 528,251 | |
# | | Ilshin Spinning Co. Ltd. | | | 8,448 | | | | 828,307 | |
# | | Ilsung Pharmaceuticals Co. Ltd. | | | 5,843 | | | | 387,818 | |
| | iMarketKorea, Inc. | | | 88,543 | | | | 833,522 | |
| | Industrial Bank of Korea | | | 1,245,640 | | | | 11,789,518 | |
| | INITECH Co. Ltd. | | | 31,597 | | | | 163,408 | |
* | | INNO Instrument, Inc. | | | 52,863 | | | | 97,524 | |
# | | Innocean Worldwide, Inc. | | | 16,272 | | | | 819,097 | |
| | INTOPS Co. Ltd. | | | 78,041 | | | | 1,556,615 | |
| | Inzi Controls Co. Ltd. | | | 4,320 | | | | 62,486 | |
| | INZI Display Co. Ltd. | | | 114,878 | | | | 332,803 | |
# | | IS Dongseo Co. Ltd. | | | 62,443 | | | | 2,421,200 | |
| | It’s Hanbul Co. Ltd. | | | 13,449 | | | | 248,402 | |
* | | Jahwa Electronics Co. Ltd. | | | 64,718 | | | | 1,036,878 | |
| | JB Financial Group Co. Ltd. | | | 687,824 | | | | 5,228,833 | |
| | JC Hyun System, Inc. | | | 42,385 | | | | 234,765 | |
# * | | JNTC Co. Ltd. | | | 45,564 | | | | 322,144 | |
| | JVM Co. Ltd. | | | 2,615 | | | | 35,929 | |
| | Kangnam Jevisco Co. Ltd. | | | 19,813 | | | | 424,349 | |
| | KAON Media Co. Ltd. | | | 61,724 | | | | 873,158 | |
# | | KB Financial Group, Inc., ADR | | | 2,468,636 | | | | 118,667,332 | |
| | KC Co. Ltd. | | | 40,765 | | | | 799,670 | |
| | KC Green Holdings Co. Ltd. | | | 76,623 | | | | 337,278 | |
| | KC Tech Co. Ltd. | | | 9,689 | | | | 186,778 | |
| | KCC Corp. | | | 16,696 | | | | 4,773,278 | |
| | KCC Engineering & Construction Co. Ltd. | | | 46,480 | | | | 398,091 | |
| | KCC Glass Corp. | | | 81,947 | | | | 4,231,277 | |
| | KCTC | | | 7,171 | | | | 39,853 | |
| | KG Chemical Corp. | | | 3,173 | | | | 92,393 | |
| | Kginicis Co. Ltd. | | | 37,918 | | | | 606,251 | |
| | KGMobilians Co. Ltd. | | | 28,155 | | | | 221,872 | |
* | | KH Electron Co. Ltd. | | | 179,620 | | | | 119,477 | |
| | Kia Corp. | | | 939,529 | | | | 68,559,621 | |
| | KISCO Corp. | | | 112,861 | | | | 869,021 | |
| | KISCO Holdings Co. Ltd. | | | 48,131 | | | | 754,469 | |
| | KISWIRE Ltd. | | | 65,649 | | | | 1,547,622 | |
# | | KIWOOM Securities Co. Ltd. | | | 89,433 | | | | 8,062,524 | |
| | KleanNara Co. Ltd. | | | 22,675 | | | | 87,342 | |
DIMENSIONAL EMERGING MARKETS VALUE FUND
CONTINUED
| | | | | | | | | | |
| | | | | Shares | | | Value» | |
SOUTH KOREA — (Continued) | | | | | | | | |
* | | KMH Hitech Co. Ltd. | | | 81,334 | | | $ | 114,802 | |
| | Kolmar Korea Holdings Co. Ltd. | | | 24,627 | | | | 486,850 | |
| | Kolon Corp. | | | 42,261 | | | | 1,283,041 | |
| | Kolon Global Corp. | | | 41,349 | | | | 923,147 | |
| | Kolon Industries, Inc. | | | 116,904 | | | | 8,944,961 | |
| | Komelon Corp. | | | 29,152 | | | | 303,008 | |
| | Kopla Co. Ltd. | | | 9,387 | | | | 69,983 | |
# | | Korea Alcohol Industrial Co. Ltd. | | | 90,447 | | | | 1,078,327 | |
| | Korea Arlico Pharm Co. Ltd. | | | 24,783 | | | | 163,431 | |
| | Korea Asset In Trust Co. Ltd. | | | 256,587 | | | | 970,879 | |
* | | Korea Circuit Co. Ltd. | | | 68,745 | | | | 929,757 | |
| | Korea Electric Terminal Co. Ltd. | | | 37,721 | | | | 2,441,013 | |
| | Korea Export Packaging Industrial Co. Ltd. | | | 1,813 | | | | 39,987 | |
| | Korea Flange Co. Ltd. | | | 159,881 | | | | 398,184 | |
| | Korea Industrial Co. Ltd. | | | 40,619 | | | | 116,555 | |
| | Korea Investment Holdings Co. Ltd. | | | 249,251 | | | | 18,641,815 | |
* | | Korea Line Corp. | | | 871,544 | | | | 2,111,580 | |
# | | Korea Petrochemical Ind Co. Ltd. | | | 21,875 | | | | 3,477,144 | |
| | Korea Petroleum Industries Co. | | | 5,904 | | | | 65,256 | |
| | Korea Real Estate Investment & Trust Co. Ltd. | | | 856,608 | | | | 1,718,121 | |
# * | | Korea Shipbuilding & Offshore Engineering Co. Ltd. | | | 133,872 | | | | 11,836,257 | |
| | Korea Zinc Co. Ltd. | | | 4,684 | | | | 2,156,606 | |
* | | Korean Air Lines Co. Ltd. | | | 139,815 | | | | 3,645,319 | |
| | Korean Drug Co. Ltd. | | | 15,186 | | | | 119,451 | |
| | Korean Reinsurance Co. | | | 503,654 | | | | 4,170,741 | |
| | Kortek Corp. | | | 54,034 | | | | 509,082 | |
| | KPX Chemical Co. Ltd. | | | 12,798 | | | | 632,907 | |
| | KSS LINE Ltd. | | | 92,398 | | | | 943,064 | |
| | KT Skylife Co. Ltd. | | | 150,103 | | | | 1,302,574 | |
| | KT&G Corp. | | | 276,885 | | | | 19,232,084 | |
# | | KTB Investment & Securities Co. Ltd. | | | 306,964 | | | | 1,733,826 | |
# | | KTCS Corp. | | | 168,949 | | | | 386,497 | |
| | Ktis Corp. | | | 166,666 | | | | 362,903 | |
| | Kukdo Chemical Co. Ltd. | | | 18,340 | | | | 1,050,651 | |
| | Kukdong Oil & Chemicals Co. Ltd. | | | 26,930 | | | | 99,845 | |
# | | Kumho Petrochemical Co. Ltd. | | | 20,845 | | | | 3,067,076 | |
* | | Kumho Tire Co., Inc. | | | 476,127 | | | | 2,176,964 | |
| | KUMHOE&C Co. Ltd. | | | 7,074 | | | | 73,120 | |
| | Kumkang Kind Co. Ltd. | | | 96,105 | | | | 648,512 | |
| | Kwang Dong Pharmaceutical Co. Ltd. | | | 62,984 | | | | 419,133 | |
# | | Kyeryong Construction Industrial Co. Ltd. | | | 46,338 | | | | 1,422,954 | |
| | Kyobo Securities Co. Ltd. | | | 112,582 | | | | 848,043 | |
# | | Kyungbang Co. Ltd. | | | 61,163 | | | | 697,282 | |
| | Kyung-In Synthetic Corp. | | | 6,399 | | | | 38,497 | |
# | | LEADCORP, Inc. | | | 104,366 | | | | 894,539 | |
| | Lee Ku Industrial Co. Ltd. | | | 13,826 | | | | 46,101 | |
| | LF Corp. | | | 130,753 | | | | 2,049,019 | |
| | LG Corp. | | | 316,955 | | | | 24,778,748 | |
# * | | LG Display Co. Ltd., ADR. | | | 3,173,356 | | | | 26,497,523 | |
| | LG Electronics, Inc. | | | 571,652 | | | | 59,139,613 | |
| | LG HelloVision Co. Ltd. | | | 143,379 | | | | 849,991 | |
| | LG Uplus Corp. | | | 1,364,297 | | | | 16,790,616 | |
| | LMS Co. Ltd. | | | 28,495 | | | | 272,894 | |
| | LOT Vacuum Co. Ltd. | | | 7,972 | | | | 99,647 | |
| | Lotte Chemical Corp. | | | 62,647 | | | | 12,049,617 | |
| | Lotte Chilsung Beverage Co. Ltd. | | | 21,352 | | | | 2,666,094 | |
| | Lotte Confectionery Co. Ltd. | | | 537 | | | | 59,273 | |
| | Lotte Corp. | | | 93,211 | | | | 2,610,828 | |
* | | Lotte Data Communication Co. | | | 8,187 | | | | 268,884 | |
DIMENSIONAL EMERGING MARKETS VALUE FUND
CONTINUED
| | | | | | | | | | |
| | | | | Shares | | | Value» | |
SOUTH KOREA — (Continued) | | | | | | | | |
# | | LOTTE Fine Chemical Co. Ltd. | | | 92,873 | | | $ | 6,780,460 | |
| | Lotte Food Co. Ltd. | | | 1,976 | | | | 645,777 | |
# | | LOTTE Himart Co. Ltd. | | | 65,598 | | | | 1,559,097 | |
# * | | Lotte Non-Life Insurance Co. Ltd. | | | 475,815 | | | | 750,069 | |
# | | Lotte Shopping Co. Ltd. | | | 44,648 | | | | 4,018,473 | |
| | LS Corp. | | | 91,063 | | | | 4,882,310 | |
| | LS Electric Co. Ltd. | | | 5,655 | | | | 286,204 | |
* | | Lumens Co. Ltd. | | | 231,495 | | | | 197,193 | |
* | | LVMC Holdings | | | 274,553 | | | | 788,238 | |
# | | LX Hausys Ltd. | | | 40,763 | | | | 2,430,585 | |
# * | | LX Holdings Corp. | | | 153,703 | | | | 1,165,207 | |
# | | LX International Corp. | | | 182,931 | | | | 4,264,052 | |
# | | Maeil Dairies Co. Ltd. | | | 6,841 | | | | 412,892 | |
| | Maeil Holdings Co. Ltd. | | | 11,288 | | | | 95,805 | |
| | MAKUS, Inc. | | | 19,446 | | | | 126,582 | |
# * | | Mando Corp. | | | 65,966 | | | | 3,540,796 | |
# | | MegaStudy Co. Ltd. | | | 43,791 | | | | 519,921 | |
| | Meritz Financial Group, Inc. | | | 238,609 | | | | 6,824,993 | |
| | Meritz Fire & Marine Insurance Co. Ltd. | | | 62,765 | | | | 1,491,907 | |
| | Meritz Securities Co. Ltd. | | | 1,882,325 | | | | 7,521,544 | |
| | Mi Chang Oil Industrial Co. Ltd. | | | 4,014 | | | | 272,640 | |
| | Mirae Asset Life Insurance Co. Ltd. | | | 396,195 | | | | 1,449,293 | |
| | Mirae Asset Securities Co. Ltd. | | | 1,759,061 | | | | 13,123,551 | |
# | | MK Electron Co. Ltd. | | | 88,121 | | | | 1,422,407 | |
* | | MNTech Co. Ltd. | | | 121,454 | | | | 435,283 | |
# * | | Mobase Co. Ltd. | | | 21,024 | | | | 62,852 | |
* | | Mobase Electronics Co. Ltd. | | | 16,407 | | | | 30,918 | |
| | Moonbae Steel Co. Ltd. | | | 8,945 | | | | 33,677 | |
| | Moorim P&P Co. Ltd. | | | 147,520 | | | | 565,909 | |
| | Moorim Paper Co. Ltd. | | | 140,508 | | | | 329,911 | |
# | | Motonic Corp. | | | 51,452 | | | | 490,704 | |
| | Muhak Co. Ltd. | | | 71,854 | | | | 598,818 | |
# | | Nam Hwa Construction Co. Ltd. | | | 23,163 | | | | 183,783 | |
| | Namhae Chemical Corp. | | | 8,933 | | | | 102,708 | |
| | Namyang Dairy Products Co. Ltd. | | | 2,206 | | | | 865,502 | |
* | | Neowiz | | | 46,369 | | | | 1,045,963 | |
# * | | Neowiz Holdings Corp. | | | 26,025 | | | | 1,118,468 | |
| | Nexen Corp. | | | 134,544 | | | | 578,904 | |
# | | Nexen Tire Corp. | | | 235,147 | | | | 1,524,506 | |
| | NH Investment & Securities Co. Ltd. | | | 653,039 | | | | 7,375,911 | |
* | | NHN Corp. | | | 55,553 | | | | 3,806,449 | |
| | NI Steel Co. Ltd. | | | 8,824 | | | | 30,675 | |
| | NICE Holdings Co. Ltd. | | | 15,181 | | | | 219,796 | |
| | Nice Information & Telecommunication, Inc. | | | 8,695 | | | | 250,902 | |
| | NICE Total Cash Management Co. Ltd. | | | 7,446 | | | | 35,431 | |
* | | NK Co. Ltd. | | | 25,998 | | | | 25,117 | |
| | Nong Shim Holdings Co. Ltd. | | | 11,334 | | | | 750,158 | |
| | Nong Woo Bio Co. Ltd. | | | 21,556 | | | | 219,225 | |
| | NongShim Co. Ltd. | | | 18,600 | | | | 4,510,002 | |
# | | NOROO Paint & Coatings Co. Ltd. | | | 66,016 | | | | 589,065 | |
| | NPC | | | 116,690 | | | | 636,542 | |
| | NS Shopping Co. Ltd. | | | 74,291 | | | | 884,863 | |
* | | OCI Co. Ltd. | | | 72,519 | | | | 8,034,626 | |
| | Okong Corp. | | | 4,362 | | | | 16,453 | |
| | Opto Device Technology Co. Ltd. | | | 44,813 | | | | 266,078 | |
| | Orion Holdings Corp. | | | 144,080 | | | | 1,975,332 | |
* | | Osung Advanced Materials Co. Ltd. | | | 167,534 | | | | 380,130 | |
| | Ottogi Corp. | | | 2,062 | | | | 849,393 | |
# | | Paik Kwang Industrial Co. Ltd. | | | 197,762 | | | | 954,788 | |
DIMENSIONAL EMERGING MARKETS VALUE FUND
CONTINUED
| | | | | | | | | | |
| | | | | Shares | | | Value» | |
SOUTH KOREA — (Continued) | | | | | | | | |
# | | Pan Ocean Co. Ltd. | | | 1,250,644 | | | $ | 6,471,323 | |
| | Pang Rim Co. Ltd. | | | 14,177 | | | | 32,932 | |
* | | Pan-Pacific Co. Ltd. | | | 113,324 | | | | 264,399 | |
# * | | Paradise Co. Ltd. | | | 10,185 | | | | 151,883 | |
| | Partron Co. Ltd. | | | 79,624 | | | | 639,408 | |
| | PJ Electronics Co. Ltd. | | | 10,236 | | | | 81,413 | |
# | | Poongsan Corp. | | | 117,956 | | | | 3,342,038 | |
# | | Poongsan Holdings Corp. | | | 28,395 | | | | 693,097 | |
| | POSCO, Sponsored ADR | | | 903,713 | | | | 57,168,884 | |
| | POSCO | | | 68,120 | | | | 17,277,387 | |
# | | Posco International Corp. | | | 306,356 | | | | 5,708,096 | |
* | | Power Logics Co. Ltd. | | | 92,739 | | | | 627,716 | |
| | Protec Co. Ltd. | | | 2,987 | | | | 68,976 | |
| | Pulmuone Co. Ltd. | | | 28,387 | | | | 414,779 | |
# | | Pyeong Hwa Automotive Co. Ltd. | | | 58,942 | | | | 560,059 | |
| | Rayence Co. Ltd. | | | 15,304 | | | | 172,433 | |
* | | RFTech Co. Ltd. | | | 21,344 | | | | 107,912 | |
| | Sajo Industries Co. Ltd. | | | 15,401 | | | | 629,604 | |
| | Sajodaerim Corp. | | | 8,739 | | | | 208,313 | |
* | | Sajodongaone Co. Ltd. | | | 161,899 | | | | 176,519 | |
| | Sam Young Electronics Co. Ltd. | | | 68,491 | | | | 708,066 | |
| | Sambo Corrugated Board Co. Ltd. | | | 31,268 | | | | 385,608 | |
* | | Sambo Motors Co. Ltd. | | | 66,691 | | | | 370,932 | |
# | | Samho Development Co. Ltd. | | | 108,856 | | | | 474,097 | |
| | SAMHWA Paints Industrial Co. Ltd. | | | 68,665 | | | | 590,750 | |
| | Samick Musical Instruments Co. Ltd. | | | 327,670 | | | | 510,701 | |
| | Samick THK Co. Ltd. | | | 4,386 | | | | 44,944 | |
| | Samji Electronics Co. Ltd. | | | 13,939 | | | | 146,052 | |
| | Samjin LND Co. Ltd. | | | 82,899 | | | | 296,922 | |
# | | Samjin Pharmaceutical Co. Ltd. | | | 14,635 | | | | 322,513 | |
* | | Sammok S-Form Co. Ltd. | | | 31,510 | | | | 436,009 | |
# | | SAMPYO Cement Co. Ltd. | | | 206,101 | | | | 881,023 | |
| | Samsung C&T Corp. | | | 270,688 | | | | 26,503,975 | |
| | Samsung Card Co. Ltd. | | | 120,114 | | | | 3,526,766 | |
| | Samsung Electronics Co. Ltd. | | | 1,978,003 | | | | 118,429,200 | |
| | Samsung Electronics Co. Ltd., GDR | | | 680 | | | | 1,015,240 | |
| | Samsung Fire & Marine Insurance Co. Ltd. | | | 120,085 | | | | 23,803,553 | |
# * | | Samsung Heavy Industries Co. Ltd. | | | 2,172,181 | | | | 11,870,552 | |
| | Samsung Life Insurance Co. Ltd. | | | 247,039 | | | | 14,290,270 | |
| | Samsung Securities Co. Ltd. | | | 310,841 | | | | 12,636,772 | |
| | SAMT Co. Ltd. | | | 20,625 | | | | 92,727 | |
# | | Samyang Corp. | | | 21,134 | | | | 1,236,605 | |
| | Samyang Holdings Corp. | | | 22,438 | | | | 1,977,978 | |
| | Samyang Packaging Corp. | | | 1,251 | | | | 28,280 | |
| | Samyang Tongsang Co. Ltd. | | | 7,531 | | | | 411,507 | |
* | | Sangsangin Co. Ltd. | | | 73,576 | | | | 563,904 | |
| | SAVEZONE I&C Corp. | | | 83,806 | | | | 228,955 | |
* | | SBS Media Holdings Co. Ltd. | | | 163,649 | | | | 289,830 | |
| | Seah Besteel Corp. | | | 100,507 | | | | 1,864,768 | |
| | SeAH Holdings Corp. | | | 4,354 | | | | 413,687 | |
| | SeAH Steel Corp. | | | 7,619 | | | | 674,663 | |
| | SeAH Steel Holdings Corp. | | | 8,469 | | | | 911,309 | |
| | Sebang Co. Ltd. | | | 60,229 | | | | 644,570 | |
# | | Sebang Global Battery Co. Ltd. | | | 35,688 | | | | 2,509,048 | |
| | Sejong Industrial Co. Ltd. | | | 103,664 | | | | 976,810 | |
* | | Sejong Telecom, Inc. | | | 313,971 | | | | 156,106 | |
* | | Sekonix Co. Ltd. | | | 67,746 | | | | 479,330 | |
| | Sempio Co. | | | 1,814 | | | | 68,345 | |
| | S-Energy Co. Ltd. | | | 71,432 | | | | 287,642 | |
DIMENSIONAL EMERGING MARKETS VALUE FUND
CONTINUED
| | | | | | | | | | |
| | | | | Shares | | | Value» | |
SOUTH KOREA — (Continued) | | | | | | | | |
| | Seohan Co. Ltd. | | | 493,982 | | | $ | 816,283 | |
# | | Seoul Semiconductor Co. Ltd. | | | 120,431 | | | | 1,542,199 | |
# * | | Seowon Co. Ltd. | | | 103,160 | | | | 189,463 | |
| | SEOWONINTECH Co. Ltd. | | | 6,241 | | | | 34,124 | |
| | Seoyon Co. Ltd. | | | 85,555 | | | | 1,151,999 | |
| | Seoyon E-Hwa Co. Ltd. | | | 96,241 | | | | 637,714 | |
* | | Sewon E&C Co. Ltd. | | | 386,748 | | | | 362,567 | |
†† | | Sewon Precision Industry Co. Ltd. | | | 1,457 | | | | 1,891 | |
| | SGC e Tec E&C Co. Ltd. | | | 7,549 | | | | 449,128 | |
# | | Shindaeyang Paper Co. Ltd. | | | 10,644 | | | | 799,012 | |
| | Shinhan Financial Group Co. Ltd. | | | 947,124 | | | | 30,920,674 | |
# | | Shinhan Financial Group Co. Ltd., ADR | | | 1,172,746 | | | | 37,903,150 | |
# | | Shinsegae Engineering & Construction Co. Ltd. | | | 15,870 | | | | 518,902 | |
| | Shinsegae Food Co. Ltd. | | | 2,444 | | | | 189,239 | |
| | Shinsegae Information & Communication Co. Ltd. | | | 664 | | | | 118,138 | |
# | | Shinsegae, Inc. | | | 34,791 | | | | 7,400,466 | |
| | Shinwha Intertek Corp. | | | 35,678 | | | | 106,982 | |
| | Shinyoung Securities Co. Ltd. | | | 25,871 | | | | 1,391,673 | |
* | | Signetics Corp. | | | 393,488 | | | | 590,954 | |
| | Silla Co. Ltd. | | | 36,116 | | | | 397,192 | |
# | | SIMPAC, Inc. | | | 127,360 | | | | 860,816 | |
* | | Sindoh Co. Ltd. | | | 26,365 | | | | 743,335 | |
| | Sinil Pharm Co. Ltd. | | | 23,668 | | | | 247,936 | |
# | | SK Discovery Co. Ltd. | | | 63,006 | | | | 2,571,788 | |
| | SK Gas Ltd. | | | 3,036 | | | | 358,924 | |
| | SK Hynix, Inc. | | | 1,675,156 | | | | 147,665,948 | |
* | | SK Innovation Co. Ltd. | | | 91,261 | | | | 19,032,481 | |
| | SK Networks Co. Ltd. | | | 844,582 | | | | 3,679,073 | |
* | | SK Rent A Car Co. Ltd. | | | 11,382 | | | | 118,255 | |
| | SK Securities Co. Ltd. | | | 2,112,180 | | | | 1,777,735 | |
| | SK, Inc. | | | 49,704 | | | | 10,372,589 | |
| | SL Corp. | | | 91,074 | | | | 2,566,102 | |
* | | S-MAC Co. Ltd. | | | 717,329 | | | | 714,250 | |
| | SNT Dynamics Co. Ltd. | | | 49,889 | | | | 396,200 | |
| | SNT Holdings Co. Ltd. | | | 36,374 | | | | 553,058 | |
| | SNT Motiv Co. Ltd. | | | 58,562 | | | | 2,528,559 | |
* | | SNU Precision Co. Ltd. | | | 34,211 | | | | 102,515 | |
* | | Solborn, Inc. | | | 27,073 | | | | 122,229 | |
| | Songwon Industrial Co. Ltd. | | | 41,113 | | | | 632,371 | |
# * | | Soulbrain Holdings Co. Ltd. | | | 14,138 | | | | 529,566 | |
| | SPG Co. Ltd. | | | 5,223 | | | | 44,302 | |
| | Spigen Korea Co. Ltd. | | | 6,891 | | | | 269,826 | |
# * †† | | Ssangyong Motor Co. | | | 336,500 | | | | 299,122 | |
| | Suheung Co. Ltd. | | | 10,944 | | | | 448,175 | |
# | | Sun Kwang Co. Ltd. | | | 27,041 | | | | 1,291,201 | |
* | | SundayToz Corp. | | | 8,746 | | | | 167,196 | |
# | | Sung Kwang Bend Co. Ltd. | | | 111,368 | | | | 876,929 | |
* | | Sungchang Enterprise Holdings Ltd. | | | 264,331 | | | | 575,203 | |
| | Sungdo Engineering & Construction Co. Ltd. | | | 52,687 | | | | 248,768 | |
# | | Sungshin Cement Co. Ltd. | | | 125,323 | | | | 1,196,695 | |
# | | Sungwoo Hitech Co. Ltd. | | | 351,238 | | | | 1,817,255 | |
| | Sunjin Co. Ltd. | | | 41,181 | | | | 456,468 | |
* | | Suprema HQ, Inc. | | | 8,097 | | | | 54,120 | |
* | | Suprema, Inc. | | | 11,129 | | | | 236,785 | |
| | SurplusGlobal, Inc. | | | 12,531 | | | | 46,407 | |
| | Systems Technology, Inc. | | | 6,395 | | | | 90,008 | |
| | Tae Kyung Industrial Co. Ltd. | | | 79,237 | | | | 437,579 | |
| | Taekwang Industrial Co. Ltd. | | | 1,637 | | | | 1,401,336 | |
| | Taekyung BK Co. Ltd. | | | 11,583 | | | | 56,705 | |
DIMENSIONAL EMERGING MARKETS VALUE FUND
CONTINUED
| | | | | | | | | | |
| | | | | Shares | | | Value» | |
SOUTH KOREA — (Continued) | | | | | | | | |
* †† | | Taewoong Co. Ltd. | | | 82,505 | | | $ | 661,918 | |
| | Taeyoung Engineering & Construction Co. Ltd. | | | 141,256 | | | | 1,343,801 | |
* | | Theragen Etex Co. Ltd. | | | 62,682 | | | | 348,131 | |
* | | Thinkware Systems Corp. | | | 35,459 | | | | 530,607 | |
| | TK Corp. | | | 94,555 | | | | 952,016 | |
| | Tongyang Life Insurance Co. Ltd. | | | 282,020 | | | | 1,650,107 | |
# | | Tongyang, Inc. | | | 315,577 | | | | 452,828 | |
* | | Top Engineering Co. Ltd. | | | 67,035 | | | | 428,074 | |
| | Toptec Co. Ltd. | | | 75,745 | | | | 567,529 | |
* | | Tovis Co. Ltd. | | | 73,482 | | | | 535,139 | |
# | | TS Corp. | | | 240,562 | | | | 680,311 | |
* | | TY Holdings Co. Ltd. | | | 153,478 | | | | 3,574,302 | |
* | | Ubivelox, Inc. | | | 4,443 | | | | 52,556 | |
* | | UIL Co. Ltd. | | | 40,064 | | | | 92,948 | |
| | Uju Electronics Co. Ltd. | | | 15,879 | | | | 374,661 | |
* | | Unick Corp. | | | 6,148 | | | | 38,520 | |
| | Unid Co. Ltd. | | | 34,541 | | | | 3,454,079 | |
| | Uniquest Corp. | | | 32,538 | | | | 288,072 | |
| | Unitrontech Co. Ltd. | | | 19,310 | | | | 94,657 | |
| | Viatron Technologies, Inc. | | | 18,763 | | | | 166,649 | |
| | Visang Education, Inc. | | | 48,747 | | | | 352,404 | |
* | | Vivien Corp. | | | 40,760 | | | | 106,467 | |
| | Whanin Pharmaceutical Co. Ltd. | | | 25,965 | | | | 398,895 | |
* | | WillBes & Co. | | | 332,697 | | | | 540,513 | |
| | Wins Co. Ltd. | | | 21,097 | | | | 286,108 | |
| | WiSoL Co. Ltd. | | | 71,622 | | | | 636,994 | |
# * | | Wonik Holdings Co. Ltd. | | | 245,189 | | | | 1,093,809 | |
# | | Wonik Materials Co. Ltd. | | | 12,961 | | | | 362,321 | |
| | Woojin, Inc. | | | 19,897 | | | | 164,221 | |
| | Woongjin Thinkbig Co. Ltd. | | | 66,784 | | | | 191,583 | |
| | Woori Financial Group, Inc. | | | 2,372,516 | | | | 26,971,117 | |
| | Woorison F&G Co. Ltd. | | | 126,099 | | | | 250,480 | |
| | WooSung Feed Co. Ltd. | | | 11,223 | | | | 288,752 | |
* | | Woowon Development Co. Ltd. | | | 8,436 | | | | 39,037 | |
| | Y G-1 Co. Ltd. | | | 95,992 | | | | 712,032 | |
| | YAS Co. Ltd. | | | 5,678 | | | | 62,612 | |
* | | Y-entec Co. Ltd. | | | 6,980 | | | | 73,052 | |
| | Yoosung Enterprise Co. Ltd. | | | 98,733 | | | | 285,602 | |
| | Young Poong Corp. | | | 2,294 | | | | 1,346,993 | |
| | Young Poong Precision Corp. | | | 53,659 | | | | 462,334 | |
| | Youngone Corp. | | | 123,827 | | | | 4,739,484 | |
| | Youngone Holdings Co. Ltd. | | | 26,091 | | | | 1,050,397 | |
| | Yuanta Securities Korea Co. Ltd. | | | 590,523 | | | | 2,280,629 | |
| | YuHwa Securities Co. Ltd. | | | 130,435 | | | | 309,488 | |
| | Yuyu Pharma, Inc. | | | 2,638 | | | | 16,779 | |
| | Zeus Co. Ltd. | | | 42,750 | | | | 762,121 | |
| | | | | | | | | | |
TOTAL SOUTH KOREA | | | | | | | 1,812,250,913 | |
| | | | | | | | | | |
TAIWAN — (16.4%) | | | | | | | | |
| | Abico Avy Co. Ltd. | | | 804,364 | | | | 747,353 | |
| | Ability Enterprise Co. Ltd. | | | 1,242,330 | | | | 874,013 | |
# | | AcBel Polytech, Inc. | | | 603,000 | | | | 751,533 | |
# | | Acer, Inc. | | | 14,714,109 | | | | 13,772,131 | |
# | | ACES Electronic Co. Ltd. | | | 558,000 | | | | 954,351 | |
* | | Acon Holding, Inc. | | | 1,155,000 | | | | 318,137 | |
| | Acter Group Corp. Ltd. | | | 12,000 | | | | 80,122 | |
| | Advanced International Multitech Co. Ltd. | | | 458,000 | | | | 1,304,076 | |
# * | | Advanced Optoelectronic Technology, Inc. | | | 500,000 | | | | 439,671 | |
| | AEON Motor Co. Ltd. | | | 52,000 | | | | 74,058 | |
DIMENSIONAL EMERGING MARKETS VALUE FUND
CONTINUED
| | | | | | | | | | |
| | | | | Shares | | | Value» | |
TAIWAN — (Continued) | | | | | | | | |
| | Aerospace Industrial Development Corp. | | | 296,000 | | | $ | 300,340 | |
# * | | AGV Products Corp. | | | 2,653,211 | | | | 970,185 | |
| | Airmate Cayman International Co. Ltd. | | | 50,557 | | | | 35,930 | |
# | | Allis Electric Co. Ltd. | | | 944,559 | | | | 806,344 | |
# | | Alpha Networks, Inc. | | | 1,958,086 | | | | 1,902,298 | |
# | | Altek Corp. | | | 1,407,365 | | | | 1,907,607 | |
* | | Ambassador Hotel | | | 1,492,000 | | | | 1,626,091 | |
# | | AMPOC Far-East Co. Ltd. | | | 594,000 | | | | 818,548 | |
| | AmTRAN Technology Co. Ltd. | | | 4,725,956 | | | | 3,008,052 | |
# | | Apacer Technology, Inc. | | | 578,210 | | | | 904,453 | |
# | | APCB, Inc. | | | 740,000 | | | | 573,520 | |
| | Apex Biotechnology Corp. | | | 37,000 | | | | 30,529 | |
# | | Apex International Co. Ltd. | | | 888,263 | | | | 2,497,696 | |
| | Apex Medical Corp. | | | 24,000 | | | | 22,947 | |
| | Apex Science & Engineering | | | 92,536 | | | | 35,661 | |
| | Arcadyan Technology Corp. | | | 30,000 | | | | 113,471 | |
| | Ardentec Corp. | | | 2,749,058 | | | | 5,890,570 | |
| | Argosy Research, Inc. | | | 9,000 | | | | 29,741 | |
# | | ASE Technology Holding Co. Ltd. | | | 6,934,000 | | | | 24,803,031 | |
# | | Asia Cement Corp. | | | 11,308,589 | | | | 18,011,968 | |
| | Asia Electronic Material Co. Ltd. | | | 92,000 | | | | 68,428 | |
* | | Asia Pacific Telecom Co. Ltd. | | | 5,141,204 | | | | 1,520,050 | |
# * | | Asia Plastic Recycling Holding Ltd. | | | 1,211,942 | | | | 319,320 | |
# | | Asia Polymer Corp. | | | 2,425,530 | | | | 3,416,125 | |
| | Asia Tech Image, Inc. | | | 62,000 | | | | 124,727 | |
| | Asia Vital Components Co. Ltd. | | | 1,733,984 | | | | 5,181,487 | |
# | | Asustek Computer, Inc. | | | 3,854,000 | | | | 48,999,039 | |
| | Aten International Co. Ltd. | | | 7,000 | | | | 21,256 | |
# | | AU Optronics Corp., Sponsored ADR | | | 3,887,815 | | | | 26,555,720 | |
# | | AU Optronics Corp. | | | 3,498,812 | | | | 2,404,464 | |
| | Audix Corp. | | | 399,332 | | | | 819,112 | |
| | Aver Information, Inc. | | | 14,000 | | | | 25,428 | |
# | | Avermedia Technologies | | | 109,600 | | | | 107,366 | |
| | Avita Corp. | | | 15,000 | | | | 30,973 | |
| | Bank of Kaohsiung Co. Ltd. | | | 3,027,383 | | | | 1,225,859 | |
| | Basso Industry Corp. | | | 173,000 | | | | 267,850 | |
# | | BES Engineering Corp. | | | 7,377,443 | | | | 2,333,751 | |
# | | Bin Chuan Enterprise Co. Ltd. | | | 239,000 | | | | 212,253 | |
# | | Biostar Microtech International Corp. | | | 951,055 | | | | 692,261 | |
| | Bizlink Holding, Inc. | | | 11,000 | | | | 101,680 | |
# | | Bright Led Electronics Corp. | | | 539,000 | | | | 455,177 | |
# | | Browave Corp. | | | 139,000 | | | | 199,296 | |
* | | Cameo Communications, Inc. | | | 1,053,712 | | | | 509,230 | |
# | | Capital Securities Corp. | | | 11,080,158 | | | | 6,047,506 | |
# | | Career Technology MFG. Co. Ltd. | | | 936,085 | | | | 844,314 | |
# | | Carnival Industrial Corp. | | | 806,007 | | | | 391,859 | |
| | Catcher Technology Co. Ltd. | | | 3,378,000 | | | | 19,587,024 | |
# | | Cathay Chemical Works | | | 331,000 | | | | 282,632 | |
| | Cathay Financial Holding Co. Ltd. | | | 40,739,459 | | | | 84,921,085 | |
# | | Cathay Real Estate Development Co. Ltd. | | | 3,381,694 | | | | 2,371,986 | |
| | Cayman Engley Industrial Co. Ltd. | | | 41,000 | | | | 95,949 | |
# | | Celxpert Energy Corp. | | | 419,000 | | | | 700,727 | |
# | | Central Reinsurance Co. Ltd. | | | 772,366 | | | | 779,453 | |
# * | | Chain Chon Industrial Co. Ltd. | | | 614,000 | | | | 468,346 | |
# | | ChainQui Construction Development Co. Ltd. | | | 571,393 | | | | 377,544 | |
# * | | Champion Building Materials Co. Ltd. | | | 1,323,828 | | | | 511,682 | |
| | Chang Hwa Commercial Bank Ltd. | | | 23,778,652 | | | | 14,041,734 | |
# | | Channel Well Technology Co. Ltd. | | | 457,000 | | | | 669,427 | |
| | Charoen Pokphand Enterprise | | | 96,000 | | | | 276,163 | |
DIMENSIONAL EMERGING MARKETS VALUE FUND
CONTINUED
| | | | | | | | | | |
| | | | | Shares | | | Value» | |
TAIWAN — (Continued) | | | | | | | | |
| | CHC Healthcare Group | | | 634,000 | | | $ | 838,257 | |
| | CHC Resources Corp. | | | 17,000 | | | | 27,536 | |
# | | Chen Full International Co. Ltd. | | | 281,000 | | | | 416,446 | |
| | Chenbro Micom Co. Ltd. | | | 17,000 | | | | 46,026 | |
# | | Cheng Loong Corp. | | | 4,514,659 | | | | 5,530,944 | |
# * | | Cheng Mei Materials Technology Corp. | | | 2,484,000 | | | | 1,063,779 | |
| | Cheng Shin Rubber Industry Co. Ltd. | | | 1,744,000 | | | | 2,140,481 | |
| | Cheng Uei Precision Industry Co. Ltd. | | | 2,408,635 | | | | 3,348,386 | |
# | | Chenming Electronic Technology Corp. | | | 455,000 | | | | 221,105 | |
| | Chia Chang Co. Ltd. | | | 668,000 | | | | 1,120,025 | |
# | | Chia Hsin Cement Corp. | | | 2,517,191 | | | | 1,829,227 | |
# | | Chian Hsing Forging Industrial Co. Ltd. | | | 41,000 | | | | 63,328 | |
# | | Chien Kuo Construction Co. Ltd. | | | 857,797 | | | | 404,581 | |
# | | Chien Shing Harbour Service Co. Ltd. | | | 23,000 | | | | 45,688 | |
| | Chilisin Electronics Corp. | | | 1,442,000 | | | | 4,473,641 | |
* | | China Airlines Ltd. | | | 16,031,353 | | | | 9,927,070 | |
| | China Bills Finance Corp. | | | 3,514,000 | | | | 2,106,001 | |
| | China Chemical & Pharmaceutical Co. Ltd. | | | 1,334,264 | | | | 1,060,738 | |
| | China Container Terminal Corp. | | | 23,000 | | | | 21,655 | |
| | China Development Financial Holding Corp. | | | 52,096,734 | | | | 26,628,126 | |
# | | China Electric Manufacturing Corp. | | | 1,100,432 | | | | 457,169 | |
# | | China General Plastics Corp. | | | 1,432,585 | | | | 1,915,019 | |
| | China Glaze Co. Ltd. | | | 602,799 | | | | 316,188 | |
| | China Life Insurance Co. Ltd. | | | 6,704,338 | | | | 7,007,866 | |
# | | China Man-Made Fiber Corp. | | | 7,673,014 | | | | 2,807,007 | |
| | China Metal Products | | | 1,712,969 | | | | 1,972,323 | |
| | China Motor Corp. | | | 1,289,099 | | | | 3,211,331 | |
# * | | China Petrochemical Development Corp. | | | 17,948,466 | | | | 7,820,718 | |
| | China Steel Corp. | | | 56,678,320 | | | | 68,334,569 | |
# | | China Wire & Cable Co. Ltd. | | | 463,600 | | | | 451,722 | |
# | | Chinese Maritime Transport Ltd. | | | 618,270 | | | | 1,251,780 | |
| | Ching Feng Home Fashions Co. Ltd. | | | 41,000 | | | | 29,548 | |
# | | Chin-Poon Industrial Co. Ltd. | | | 2,207,815 | | | | 2,377,646 | |
| | Chipbond Technology Corp. | | | 1,912,000 | | | | 4,438,108 | |
| | ChipMOS Technologies, Inc. | | | 3,037,085 | | | | 5,050,238 | |
# | | ChipMOS Technologies, Inc., ADR | | | 30,336 | | | | 1,009,271 | |
# | | Chong Hong Construction Co. Ltd. | | | 47,000 | | | | 124,745 | |
# | | Chun YU Works & Co. Ltd. | | | 833,000 | | | | 862,260 | |
# | | Chun Yuan Steel Industry Co. Ltd. | | | 2,324,287 | | | | 1,899,402 | |
# | | Chung Hsin Electric & Machinery Manufacturing Corp. | | | 2,519,250 | | | | 3,736,610 | |
| | Chung Hung Steel Corp. | | | 3,724,000 | | | | 4,698,751 | |
# * | | Chung Hwa Chemical Industrial Works Ltd. | | | 57,000 | | | | 90,558 | |
# * | | Chung Hwa Pulp Corp. | | | 2,158,353 | | | | 1,727,601 | |
†† | | Chung Shing Textile Co. Ltd. | | | 600 | | | | 0 | |
| | Chunghwa Chemical Synthesis & Biotech Co. Ltd. | | | 35,000 | | | | 82,289 | |
| | Chyang Sheng Dyeing & Finishing Co. Ltd. | | | 167,000 | | | | 83,518 | |
| | Clevo Co. | | | 1,257,000 | | | | 1,558,242 | |
# | | CMC Magnetics Corp. | | | 5,576,638 | | | | 1,771,101 | |
# | | CoAsia Electronics Corp. | | | 311,907 | | | | 145,450 | |
# | | Collins Co. Ltd. | | | 610,224 | | | | 335,434 | |
# | | Compal Electronics, Inc. | | | 24,839,332 | | | | 21,860,085 | |
# | | Compeq Manufacturing Co. Ltd. | | | 6,781,000 | | | | 9,868,066 | |
| | Compucase Enterprise | | | 57,000 | | | | 63,814 | |
# | | Concord Securities Co. Ltd. | | | 2,085,489 | | | | 888,362 | |
| | Concraft Holding Co. Ltd. | | | 37,000 | | | | 75,466 | |
# | | Continental Holdings Corp. | | | 2,333,540 | | | | 2,116,670 | |
# | | Contrel Technology Co. Ltd. | | | 784,000 | | | | 557,323 | |
| | Coretronic Corp. | | | 2,120,800 | | | | 4,389,780 | |
# * | | Coxon Precise Industrial Co. Ltd. | | | 598,000 | | | | 287,368 | |
DIMENSIONAL EMERGING MARKETS VALUE FUND
CONTINUED
| | | | | | | | | | |
| | | | | Shares | | | Value» | |
TAIWAN — (Continued) | | | | | | | | |
| | CTBC Financial Holding Co. Ltd. | | | 97,262,073 | | | $ | 81,219,569 | |
| | CTCI Corp. | | | 175,000 | | | | 229,310 | |
| | CviLux Corp. | | | 101,000 | | | | 174,343 | |
# | | CyberTAN Technology, Inc. | | | 799,000 | | | | 762,084 | |
# | | DA CIN Construction Co. Ltd. | | | 1,842,579 | | | | 2,011,806 | |
| | Darfon Electronics Corp. | | | 266,000 | | | | 399,993 | |
* | | Darwin Precisions Corp. | | | 2,351,635 | | | | 943,251 | |
| | De Licacy Industrial Co. Ltd. | | | 98,000 | | | | 54,099 | |
# * | | Delpha Construction Co. Ltd. | | | 505,576 | | | | 271,040 | |
# | | Depo Auto Parts Ind Co. Ltd. | | | 501,000 | | | | 1,013,463 | |
†† | | Der Pao Construction Co. Ltd. | | | 2,158,544 | | | | 0 | |
# | | D-Link Corp. | | | 3,293,552 | | | | 2,428,978 | |
| | Dr Wu Skincare Co. Ltd. | | | 13,000 | | | | 43,943 | |
| | Drewloong Precision, Inc. | | | 7,000 | | | | 24,682 | |
# | | Dyaco International, Inc. | | | 51,000 | | | | 119,245 | |
# | | Dynamic Electronics Co. Ltd. | | | 1,477,873 | | | | 1,118,223 | |
# | | Dynapack International Technology Corp. | | | 897,000 | | | | 3,101,822 | |
| | E.Sun Financial Holding Co. Ltd. | | | 43,627,946 | | | | 41,687,469 | |
# | | Edimax Technology Co. Ltd. | | | 1,026,902 | | | | 399,266 | |
# | | Edison Opto Corp. | | | 605,000 | | | | 455,979 | |
| | Edom Technology Co. Ltd. | | | 1,081,350 | | | | 1,324,625 | |
| | Elite Advanced Laser Corp. | | | 82,000 | | | | 164,773 | |
# | | Elite Semiconductor Microelectronics Technology, Inc. | | | 708,000 | | | | 3,640,493 | |
# | | Elitegroup Computer Systems Co. Ltd. | | | 1,974,395 | | | | 1,683,281 | |
†† | | ENG Electric Co. Ltd. | | | 239,997 | | | | 1,181 | |
# | | Ennoconn Corp. | | | 40,000 | | | | 265,200 | |
* | | Ennostar, Inc. | | | 2,061,209 | | | | 5,424,342 | |
| | EnTie Commercial Bank Co. Ltd. | | | 2,417,232 | | | | 1,450,984 | |
# | | Eson Precision Ind Co. Ltd. | | | 705,000 | | | | 1,696,725 | |
| | Eternal Materials Co. Ltd. | | | 1,775,513 | | | | 2,353,898 | |
* | | Eva Airways Corp. | | | 14,688,355 | | | | 9,969,130 | |
* | | Everest Textile Co. Ltd. | | | 2,357,813 | | | | 826,001 | |
| | Evergreen International Storage & Transport Corp. | | | 2,982,000 | | | | 2,912,066 | |
| | Evergreen Marine Corp. Taiwan Ltd. | | | 830,145 | | | | 2,987,427 | |
# | | Everlight Chemical Industrial Corp. | | | 680,950 | | | | 627,715 | |
| | Everlight Electronics Co. Ltd. | | | 2,531,000 | | | | 4,519,951 | |
| | Excel Cell Electronic Co. Ltd. | | | 17,000 | | | | 15,546 | |
| | Excellence Opto, Inc. | | | 96,000 | | | | 100,234 | |
# | | Excelsior Medical Co. Ltd. | | | 520,527 | | | | 1,035,583 | |
# | | EZconn Corp. | | | 194,250 | | | | 244,175 | |
| | Far Eastern Department Stores Ltd. | | | 6,801,445 | | | | 5,407,505 | |
| | Far Eastern International Bank | | | 17,145,991 | | | | 6,448,711 | |
| | Far Eastern New Century Corp. | | | 15,415,528 | | | | 16,145,387 | |
| | Farcent Enterprise Co. Ltd. | | | 11,000 | | | | 25,130 | |
# | | Farglory F T Z Investment Holding Co. Ltd. | | | 767,648 | | | | 1,394,809 | |
# | | Farglory Land Development Co. Ltd. | | | 1,545,264 | | | | 3,734,490 | |
# * | | Federal Corp. | | | 2,187,160 | | | | 2,115,667 | |
| | Feedback Technology Corp. | | | 20,000 | | | | 50,993 | |
| | First Financial Holding Co. Ltd. | | | 39,901,303 | | | | 32,851,360 | |
# | | First Hotel | | | 890,857 | | | | 463,197 | |
# | | First Insurance Co. Ltd. | | | 1,334,064 | | | | 638,070 | |
# | | First Steamship Co. Ltd. | | | 2,908,042 | | | | 1,341,503 | |
# | | FIT Holding Co. Ltd. | | | 185,150 | | | | 222,121 | |
| | FLEXium Interconnect, Inc. | | | 258,000 | | | | 893,876 | |
| | Forcecon Tech Co. Ltd. | | | 16,000 | | | | 41,452 | |
| | Forest Water Environment Engineering Co. Ltd. | | | 21,400 | | | | 26,237 | |
# | | Formosa Advanced Technologies Co. Ltd. | | | 1,017,000 | | | | 1,385,140 | |
| | Formosa Chemicals & Fibre Corp. | | | 3,008,000 | | | | 8,728,269 | |
# * | | Formosa Laboratories, Inc. | | | 483,478 | | | | 1,034,468 | |
DIMENSIONAL EMERGING MARKETS VALUE FUND
CONTINUED
| | | | | | | | | | |
| | | | | Shares | | | Value» | |
TAIWAN — (Continued) | | | | | | | | |
| | Formosa Plastics Corp. | | | 4,109,000 | | | $ | 15,916,046 | |
| | Formosa Taffeta Co. Ltd. | | | 3,218,511 | | | | 3,474,693 | |
| | Formosan Rubber Group, Inc. | | | 1,319,957 | | | | 1,071,192 | |
# | | Formosan Union Chemical | | | 2,094,843 | | | | 1,537,343 | |
| | Founding Construction & Development Co. Ltd. | | | 1,007,418 | | | | 685,257 | |
| | Foxconn Technology Co. Ltd. | | | 3,331,142 | | | | 8,270,929 | |
# * | | Franbo Lines Corp. | | | 120,057 | | | | 104,286 | |
| | Froch Enterprise Co. Ltd. | | | 1,269,734 | | | | 1,300,123 | |
# | | FSP Technology, Inc. | | | 757,292 | | | | 1,104,634 | |
| | Fu Chun Shin Machinery Manufacture Co. Ltd. | | | 53,265 | | | | 33,245 | |
# | | Fubon Financial Holding Co. Ltd. | | | 33,386,173 | | | | 88,253,766 | |
| | Fulgent Sun International Holding Co. Ltd. | | | 69,000 | | | | 255,875 | |
| | Fullerton Technology Co. Ltd. | | | 529,200 | | | | 328,223 | |
# * | | Fulltech Fiber Glass Corp. | | | 2,315,216 | | | | 1,462,657 | |
# | | Fwusow Industry Co. Ltd. | | | 1,174,043 | | | | 891,030 | |
# | | G Shank Enterprise Co. Ltd. | | | 965,902 | | | | 2,311,658 | |
# | | Gamania Digital Entertainment Co. Ltd. | | | 71,000 | | | | 147,624 | |
# | | Gemtek Technology Corp. | | | 2,013,962 | | | | 1,984,475 | |
| | General Interface Solution Holding Ltd. | | | 870,000 | | | | 3,044,787 | |
| | Getac Technology Corp. | | | 703,065 | | | | 1,324,261 | |
# * | | Giantplus Technology Co. Ltd. | | | 1,722,100 | | | | 729,139 | |
| | Gigabyte Technology Co. Ltd. | | | 332,287 | | | | 1,349,322 | |
# | | Ginko International Co. Ltd. | | | 72,000 | | | | 522,601 | |
| | Global Brands Manufacture Ltd. | | | 1,573,154 | | | | 2,007,221 | |
| | Global Lighting Technologies, Inc. | | | 13,000 | | | | 37,726 | |
# | | Global View Co. Ltd. | | | 53,000 | | | | 73,796 | |
| | Globe Union Industrial Corp. | | | 1,330,625 | | | | 735,955 | |
# | | Gloria Material Technology Corp. | | | 2,187,116 | | | | 1,670,444 | |
# | | Gold Circuit Electronics Ltd. | | | 4,617,965 | | | | 11,063,031 | |
# | | Goldsun Building Materials Co. Ltd. | | | 5,780,171 | | | | 5,352,109 | |
| | Good Will Instrument Co. Ltd. | | | 172,746 | | | | 165,665 | |
| | Gourmet Master Co. Ltd. | | | 4,000 | | | | 18,878 | |
| | Grand Fortune Securities Co. Ltd. | | | 733,767 | | | | 422,398 | |
# | | Grand Ocean Retail Group Ltd. | | | 437,000 | | | | 303,049 | |
| | Grand Pacific Petrochemical | | | 5,403,000 | | | | 5,258,090 | |
# | | Great China Metal Industry | | | 842,000 | | | | 781,965 | |
| | Great Wall Enterprise Co. Ltd. | | | 3,490,844 | | | | 6,739,015 | |
| | Greatek Electronics, Inc. | | | 49,000 | | | | 140,393 | |
* †† | | Green Energy Technology, Inc. | | | 1,424,880 | | | | 3,074 | |
# | | GTM Holdings Corp. | | | 679,900 | | | | 611,779 | |
# | | Hannstar Board Corp. | | | 3,200,488 | | | | 4,806,871 | |
# | | HannStar Display Corp. | | | 13,723,435 | | | | 6,977,768 | |
# | | HannsTouch Solution, Inc. | | | 3,452,001 | | | | 1,478,289 | |
# | | Hanpin Electron Co. Ltd. | | | 286,000 | | | | 291,281 | |
| | Harvatek Corp. | | | 974,553 | | | | 877,583 | |
| | Heran Co. Ltd. | | | 10,000 | | | | 42,141 | |
| | Hey Song Corp. | | | 1,961,500 | | | | 2,466,970 | |
| | Hi-Clearance, Inc. | | | 4,000 | | | | 19,797 | |
| | Highlight Tech Corp. | | | 30,000 | | | | 45,918 | |
# | | Highwealth Construction Corp. | | | 1,487,100 | | | | 2,401,260 | |
# | | Hiroca Holdings Ltd. | | | 368,000 | | | | 646,298 | |
# | | Hitron Technology, Inc. | | | 722,098 | | | | 545,713 | |
# | | Ho Tung Chemical Corp. | | | 5,169,475 | | | | 1,936,435 | |
# | | Hocheng Corp. | | | 1,351,300 | | | | 692,743 | |
| | Hold-Key Electric Wire & Cable Co. Ltd. | | | 49,699 | | | | 25,943 | |
| | Holiday Entertainment Co. Ltd. | | | 27,000 | | | | 60,404 | |
| | Hon Hai Precision Industry Co. Ltd. | | | 41,463,192 | | | | 160,061,938 | |
# | | Hong Pu Real Estate Development Co. Ltd. | | | 1,038,655 | | | | 813,073 | |
# | | Hong TAI Electric Industrial | | | 1,260,000 | | | | 1,201,459 | |
DIMENSIONAL EMERGING MARKETS VALUE FUND
CONTINUED
| | | | | | | | | | |
| | | | | Shares | | | Value» | |
TAIWAN — (Continued) | | | | | | | | |
| | Hong YI Fiber Industry Co. | | | 798,000 | | | $ | 681,546 | |
| | Horizon Securities Co. Ltd. | | | 63,000 | | | | 36,596 | |
# | | Hsing TA Cement Co. | | | 862,614 | | | | 653,785 | |
# * | | HTC Corp. | | | 4,182,000 | | | | 9,882,663 | |
| | Hu Lane Associate, Inc. | | | 19,000 | | | | 91,996 | |
# | | HUA ENG Wire & Cable Co. Ltd. | | | 1,728,035 | | | | 1,314,783 | |
| | Hua Nan Financial Holdings Co. Ltd. | | | 28,646,507 | | | | 20,976,012 | |
| | Huaku Development Co. Ltd. | | | 793,000 | | | | 2,594,030 | |
# | | Huang Hsiang Construction Corp. | | | 691,000 | | | | 907,998 | |
# | | Hung Ching Development & Construction Co. Ltd. | | | 857,468 | | | | 922,813 | |
| | Hung Sheng Construction Ltd. | | | 2,392,269 | | | | 2,076,460 | |
| | Huxen Corp. | | | 173,281 | | | | 319,201 | |
| | Hwa Fong Rubber Industrial Co. Ltd. | | | 62,000 | | | | 35,780 | |
# * | | Hwacom Systems, Inc. | | | 270,000 | | | | 205,380 | |
| | IBF Financial Holdings Co. Ltd. | | | 13,839,288 | | | | 7,916,425 | |
# | | Ichia Technologies, Inc. | | | 1,447,260 | | | | 845,550 | |
# * | | I-Chiun Precision Industry Co. Ltd. | | | 1,151,532 | | | | 2,442,822 | |
| | IEI Integration Corp. | | | 49,200 | | | | 78,418 | |
| | Infortrend Technology, Inc. | | | 1,013,000 | | | | 522,466 | |
# | | Innolux Corp. | | | 39,166,544 | | | | 23,559,885 | |
# | | Inpaq Technology Co. Ltd. | | | 280,250 | | | | 592,051 | |
| | Intai Technology Corp. | | | 12,000 | | | | 36,709 | |
# | | Integrated Service Technology, Inc. | | | 115,570 | | | | 214,911 | |
| | International CSRC Investment Holdings Co. | | | 4,051,166 | | | | 3,503,648 | |
| | Inventec Corp. | | | 13,025,277 | | | | 12,457,468 | |
| | Iron Force Industrial Co. Ltd. | | | 24,000 | | | | 60,668 | |
| | I-Sheng Electric Wire & Cable Co. Ltd. | | | 12,000 | | | | 18,354 | |
| | ITE Technology, Inc. | | | 798,479 | | | | 2,994,552 | |
# | | Jarllytec Co. Ltd. | | | 309,000 | | | | 588,391 | |
# | | Jean Co. Ltd. | | | 271,751 | | | | 113,536 | |
| | Jess-Link Products Co. Ltd. | | | 569,500 | | | | 721,008 | |
# * | | Jinli Group Holdings Ltd. | | | 847,532 | | | | 440,972 | |
| | Johnson Health Tech Co. Ltd. | | | 17,000 | | | | 35,699 | |
# | | K Laser Technology, Inc. | | | 820,601 | | | | 594,572 | |
# | | Kaimei Electronic Corp. | | | 138,000 | | | | 432,339 | |
| | Kaori Heat Treatment Co. Ltd. | | | 11,000 | | | | 19,912 | |
# | | Kaulin Manufacturing Co. Ltd. | | | 565,656 | | | | 298,517 | |
# | | KEE TAI Properties Co. Ltd. | | | 1,804,000 | | | | 851,832 | |
| | Kenda Rubber Industrial Co. Ltd. | | | 212,000 | | | | 233,486 | |
# | | Key Ware Electronics Co. Ltd. | | | 106,678 | | | | 56,970 | |
| | Kindom Development Co. Ltd. | | | 2,310,000 | | | | 3,188,881 | |
| | King Chou Marine Technology Co. Ltd. | | | 243,100 | | | | 305,005 | |
# | | King Yuan Electronics Co. Ltd. | | | 7,082,805 | | | | 10,163,042 | |
| | King’s Town Bank Co. Ltd. | | | 5,157,012 | | | | 7,700,351 | |
* | | King’s Town Construction Co. Ltd. | | | 426,380 | | | | 560,657 | |
| | Kinik Co. | | | 29,000 | | | | 78,860 | |
# * | | Kinko Optical Co. Ltd. | | | 659,756 | | | | 700,477 | |
# | | Kinpo Electronics | | | 7,666,375 | | | | 3,586,749 | |
# | | Kinsus Interconnect Technology Corp. | | | 1,680,000 | | | | 14,784,980 | |
| | Ko Ja Cayman Co. Ltd. | | | 14,000 | | | | 36,988 | |
# | | KS Terminals, Inc. | | | 53,000 | | | | 185,046 | |
# | | Kung Sing Engineering Corp. | | | 2,554,875 | | | | 788,114 | |
| | Kuo Toong International Co. Ltd. | | | 1,275,808 | | | | 984,103 | |
| | Kuo Yang Construction Co. Ltd. | | | 51,000 | | | | 44,040 | |
# | | Kwong Fong Industries Corp. | | | 481,649 | | | | 193,872 | |
| | Kwong Lung Enterprise Co. Ltd. | | | 167,000 | | | | 251,892 | |
# | | KYE Systems Corp. | | | 1,229,909 | | | | 470,257 | |
# | | L&K Engineering Co. Ltd. | | | 849,000 | | | | 892,765 | |
* | | LAN FA Textile | | | 985,713 | | | | 434,674 | |
DIMENSIONAL EMERGING MARKETS VALUE FUND
CONTINUED
| | | | | | | | | | |
| | | | | Shares | | | Value» | |
TAIWAN — (Continued) | | | | | | | | |
| | Lanner Electronics, Inc. | | | 37,000 | | | $ | 66,187 | |
| | Largan Precision Co. Ltd. | | | 75,000 | | | | 5,588,939 | |
| | Laster Tech Corp. Ltd. | | | 15,000 | | | | 23,779 | |
# | | Leader Electronics, Inc. | | | 347,056 | | | | 202,905 | |
# * | | Lealea Enterprise Co. Ltd. | | | 4,199,941 | | | | 1,746,712 | |
# | | LEE CHI Enterprises Co. Ltd. | | | 857,900 | | | | 774,143 | |
| | Lelon Electronics Corp. | | | 21,000 | | | | 48,386 | |
* | | Li Cheng Enterprise Co. Ltd. | | | 27,000 | | | | 18,899 | |
* | | Li Peng Enterprise Co. Ltd. | | | 2,733,381 | | | | 1,021,080 | |
| | Lian HWA Food Corp. | | | 57,200 | | | | 136,764 | |
# | | Lida Holdings Ltd. | | | 316,680 | | | | 358,858 | |
| | Lien Hwa Industrial Holdings Corp. | | | 1,387,815 | | | | 2,786,743 | |
# * | | Lingsen Precision Industries Ltd. | | | 2,389,480 | | | | 2,171,608 | |
| | Lite-On Technology Corp. | | | 12,950,738 | | | | 28,579,432 | |
# | | Liton Technology Corp. | | | 33,000 | | | | 52,311 | |
# * | | Long Bon International Co. Ltd. | | | 855,880 | | | | 551,124 | |
| | Long Da Construction & Development Corp. | | | 72,000 | | | | 52,370 | |
# | | Longchen Paper & Packaging Co. Ltd. | | | 4,598,304 | | | | 3,985,475 | |
| | Longwell Co. | | | 94,000 | | | | 190,529 | |
# | | Lotus Pharmaceutical Co. Ltd. | | | 93,000 | | | | 314,333 | |
| | Lu Hai Holding Corp. | | | 51,700 | | | | 74,467 | |
# | | Lucky Cement Corp. | | | 726,000 | | | | 311,299 | |
| | Lung Yen Life Service Corp. | | | 9,000 | | | | 14,562 | |
# | | Macauto Industrial Co. Ltd. | | | 65,000 | | | | 190,608 | |
# | | Macronix International Co. Ltd. | | | 10,684,605 | | | | 15,117,380 | |
| | Materials Analysis Technology, Inc. | | | 37,000 | | | | 191,148 | |
| | Mayer Steel Pipe Corp. | | | 943,456 | | | | 1,027,451 | |
# | | Maywufa Co. Ltd. | | | 182,070 | | | | 126,169 | |
| | Mega Financial Holding Co. Ltd. | | | 32,101,796 | | | | 38,577,993 | |
# | | Mercuries & Associates Holding Ltd. | | | 2,267,465 | | | | 1,889,749 | |
* | | Mercuries Life Insurance Co. Ltd. | | | 9,754,738 | | | | 3,217,151 | |
| | Merry Electronics Co. Ltd. | | | 147,074 | | | | 435,102 | |
# * | | MIN AIK Technology Co. Ltd. | | | 910,600 | | | | 725,615 | |
| | Mirle Automation Corp. | | | 80,000 | | | | 120,419 | |
# | | Mitac Holdings Corp. | | | 3,237,682 | | | | 3,350,803 | |
# | | MOSA Industrial Corp. | | | 190,000 | | | | 301,210 | |
# | | MPI Corp. | | | 378,000 | | | | 1,747,167 | |
| | Nak Sealing Technologies Corp. | | | 25,000 | | | | 78,687 | |
| | Namchow Holdings Co. Ltd. | | | 130,000 | | | | 226,069 | |
| | Nan Pao Resins Chemical Co. Ltd. | | | 9,000 | | | | 45,063 | |
# | | Nan Ren Lake Leisure Amusement Co. Ltd. | | | 608,000 | | | | 335,322 | |
| | Nan Ya Plastics Corp. | | | 4,849,000 | | | | 14,880,905 | |
| | Nang Kuang Pharmaceutical Co. Ltd. | | | 35,000 | | | | 43,565 | |
| | Nanya Technology Corp. | | | 6,919,000 | | | | 16,589,848 | |
# | | New Era Electronics Co. Ltd. | | | 168,000 | | | | 136,045 | |
* | | Newmax Technology Co. Ltd. | | | 25,000 | | | | 37,064 | |
| | Nichidenbo Corp. | | | 34,000 | | | | 61,705 | |
| | Nien Hsing Textile Co. Ltd. | | | 631,061 | | | | 473,593 | |
# | | Nishoku Technology, Inc. | | | 186,000 | | | | 565,780 | |
| | Nova Technology Corp. | | | 4,000 | | | | 21,096 | |
# | | O-Bank Co. Ltd. | | | 1,719,604 | | | | 482,364 | |
| | Ocean Plastics Co. Ltd. | | | 80,000 | | | | 95,210 | |
| | OptoTech Corp. | | | 2,215,828 | | | | 3,429,163 | |
# * | | Orient Semiconductor Electronics Ltd. | | | 1,705,670 | | | | 1,526,094 | |
# | | Pacific Construction Co. | | | 1,755,452 | | | | 621,577 | |
# | | Pacific Hospital Supply Co. Ltd. | | | 70,000 | | | | 175,408 | |
| | Paiho Shih Holdings Corp. | | | 59,000 | | | | 79,673 | |
| | Pan German Universal Motors Ltd. | | | 12,000 | | | | 92,605 | |
# | | Pan Jit International, Inc. | | | 1,211,100 | | | | 4,909,693 | |
DIMENSIONAL EMERGING MARKETS VALUE FUND
CONTINUED
| | | | | | | | | | |
| | | | | Shares | | | Value» | |
TAIWAN — (Continued) | | | | | | | | |
# | | Pan-International Industrial Corp. | | | 2,265,444 | | | $ | 3,311,115 | |
| | PCL Technologies, Inc. | | | 5,000 | | | | 15,171 | |
# | | Pegatron Corp. | | | 12,587,998 | | | | 30,815,912 | |
| | PharmaEngine, Inc. | | | 13,000 | | | | 27,599 | |
# * | | Phihong Technology Co. Ltd. | | | 300,882 | | | | 398,931 | |
| | Phison Electronics Corp. | | | 4,000 | | | | 56,401 | |
| | Plastron Precision Co. Ltd. | | | 38,156 | | | | 18,264 | |
# | | Plotech Co. Ltd. | | | 545,000 | | | | 486,433 | |
| | Posiflex Technology, Inc. | | | 14,000 | | | | 45,848 | |
| | Pou Chen Corp. | | | 8,475,550 | | | | 10,394,566 | |
| | President Securities Corp. | | | 4,938,263 | | | | 4,022,830 | |
# | | Primax Electronics Ltd. | | | 282,000 | | | | 523,377 | |
| | Prince Housing & Development Corp. | | | 6,016,018 | | | | 2,870,251 | |
†† | | Prodisc Technology, Inc. | | | 6,185,157 | | | | 0 | |
# | | Promate Electronic Co. Ltd. | | | 123,000 | | | | 171,755 | |
| | Prosperity Dielectrics Co. Ltd. | | | 16,000 | | | | 31,304 | |
| | Qisda Corp. | | | 9,505,171 | | | | 10,619,183 | |
| | QST International Corp. | | | 15,000 | | | | 31,783 | |
# | | Qualipoly Chemical Corp. | | | 290,593 | | | | 429,726 | |
| | Quanta Computer, Inc. | | | 2,608,000 | | | | 7,327,178 | |
| | Quanta Storage, Inc. | | | 45,000 | | | | 62,745 | |
# | | Quintain Steel Co. Ltd. | | | 1,444,473 | | | | 1,060,463 | |
| | Radiant Opto-Electronics Corp. | | | 999,000 | | | | 3,500,199 | |
| | Radium Life Tech Co. Ltd. | | | 3,777,226 | | | | 1,429,265 | |
| | Rechi Precision Co. Ltd. | | | 80,000 | | | | 53,726 | |
# | | Rich Development Co. Ltd. | | | 3,070,054 | | | | 1,011,225 | |
* | | Ritek Corp. | | | 3,952,449 | | | | 1,391,835 | |
* | | Roo Hsing Co. Ltd. | | | 478,000 | | | | 145,245 | |
* | | Rotam Global Agrosciences Ltd. | | | 90,157 | | | | 72,516 | |
| | Ruentex Development Co. Ltd. | | | 4,264,372 | | | | 10,883,285 | |
# | | Ruentex Industries Ltd. | | | 2,301,780 | | | | 8,982,185 | |
| | Sampo Corp. | | | 1,854,340 | | | | 1,975,016 | |
| | San Fang Chemical Industry Co. Ltd. | | | 23,000 | | | | 17,878 | |
# | | San Far Property Ltd. | | | 1,393,560 | | | | 762,960 | |
# | | Sanyang Motor Co. Ltd. | | | 2,660,624 | | | | 2,592,758 | |
| | Scan-D Corp. | | | 33,000 | | | | 61,391 | |
# | | SCI Pharmtech, Inc. | | | 69,600 | | | | 195,282 | |
| | Sea & Land Integrated Corp. | | | 20,600 | | | | 23,264 | |
| | Senao International Co. Ltd. | | | 33,000 | | | | 37,821 | |
| | Sercomm Corp. | | | 48,000 | | | | 110,032 | |
# | | Sesoda Corp. | | | 1,149,279 | | | | 1,270,665 | |
| | Shanghai Commercial & Savings Bank Ltd. | | | 628,000 | | | | 994,540 | |
# | | Shan-Loong Transportation Co. Ltd. | | | 436,000 | | | | 552,863 | |
# | | Sharehope Medicine Co. Ltd. | | | 179,905 | | | | 175,920 | |
# | | Sheng Yu Steel Co. Ltd. | | | 731,000 | | | | 877,648 | |
# | | ShenMao Technology, Inc. | | | 419,000 | | | | 1,070,844 | |
# | | Shih Her Technologies, Inc. | | | 260,000 | | | | 675,394 | |
* | | Shih Wei Navigation Co. Ltd. | | | 535,577 | | | | 789,854 | |
| | Shihlin Electric & Engineering Corp. | | | 3,030,000 | | | | 5,699,049 | |
| | Shin Kong Financial Holding Co. Ltd. | | | 41,055,909 | | | | 14,469,599 | |
| | Shin Zu Shing Co. Ltd. | | | 1,034,842 | | | | 3,712,504 | |
# * | | Shining Building Business Co. Ltd. | | | 1,373,368 | | | | 548,084 | |
# | | Shinkong Insurance Co. Ltd. | | | 1,273,412 | | | | 2,113,285 | |
# | | Shinkong Synthetic Fibers Corp. | | | 6,988,754 | | | | 4,741,403 | |
| | ShunSin Technology Holding Ltd. | | | 23,000 | | | | 74,835 | |
* | | Shuttle, Inc. | | | 1,819,015 | | | | 771,956 | |
| | Sigurd Microelectronics Corp. | | | 2,717,231 | | | | 5,743,419 | |
* | | Silitech Technology Corp. | | | 49,878 | | | | 61,801 | |
| | Sincere Navigation Corp. | | | 1,586,242 | | | | 1,584,256 | |
DIMENSIONAL EMERGING MARKETS VALUE FUND
CONTINUED
| | | | | | | | | | |
| | | | | Shares | | | Value» | |
TAIWAN — (Continued) | | | | | | | | |
| | Singatron Enterprise Co. Ltd. | | | 35,000 | | | $ | 32,379 | |
# | | Sinher Technology, Inc. | | | 273,000 | | | | 414,889 | |
| | Sinmag Equipment Corp. | | | 13,000 | | | | 50,075 | |
| | Sinon Corp. | | | 2,451,877 | | | | 2,148,188 | |
| | SinoPac Financial Holdings Co. Ltd. | | | 42,319,595 | | | | 21,552,820 | |
| | Sinyi Realty, Inc. | | | 46,000 | | | | 55,109 | |
| | Sirtec International Co. Ltd. | | | 458,200 | | | | 431,315 | |
# | | Siward Crystal Technology Co. Ltd. | | | 794,875 | | | | 961,625 | |
| | Soft-World International Corp. | | | 19,000 | | | | 61,385 | |
# | | Solar Applied Materials Technology Corp. | | | 1,936,798 | | | | 3,491,411 | |
| | Solomon Technology Corp. | | | 406,000 | | | | 253,487 | |
| | Solteam, Inc. | | | 39,390 | | | | 97,852 | |
# | | Southeast Cement Co. Ltd. | | | 944,700 | | | | 619,721 | |
# | | Spirox Corp. | | | 356,563 | | | | 368,080 | |
| | Standard Chemical & Pharmaceutical Co. Ltd. | | | 90,000 | | | | 124,976 | |
| | Sunonwealth Electric Machine Industry Co. Ltd. | | | 78,000 | | | | 108,160 | |
# | | Sunrex Technology Corp. | | | 517,108 | | | | 807,188 | |
# | | Sunspring Metal Corp. | | | 580,569 | | | | 587,620 | |
| | Supreme Electronics Co. Ltd. | | | 2,788,726 | | | | 4,508,178 | |
# | | Swancor Holding Co. Ltd. | | | 61,000 | | | | 216,519 | |
# | | Sweeten Real Estate Development Co. Ltd. | | | 862,114 | | | | 864,389 | |
| | Syncmold Enterprise Corp. | | | 50,000 | | | | 127,027 | |
# | | Synmosa Biopharma Corp. | | | 230,904 | | | | 191,142 | |
| | Synnex Technology International Corp. | | | 6,974,550 | | | | 13,513,517 | |
| | Systex Corp. | | | 12,000 | | | | 37,258 | |
# | | Ta Ya Electric Wire & Cable | | | 2,735,776 | | | | 2,437,126 | |
# | | Tah Hsin Industrial Corp. | | | 452,730 | | | | 1,019,753 | |
# | | TA-I Technology Co. Ltd. | | | 164,500 | | | | 376,524 | |
# * | | Tai Tung Communication Co. Ltd. | | | 508,535 | | | | 321,449 | |
| | Taichung Commercial Bank Co. Ltd. | | | 27,928,012 | | | | 12,006,866 | |
| | TaiDoc Technology Corp. | | | 13,000 | | | | 81,809 | |
| | Taiflex Scientific Co. Ltd. | | | 1,065,960 | | | | 1,830,095 | |
# | | Taimide Tech, Inc. | | | 116,000 | | | | 170,356 | |
| | Tainan Enterprises Co. Ltd. | | | 338,183 | | | | 221,322 | |
# | | Tainan Spinning Co. Ltd. | | | 6,278,485 | | | | 5,139,265 | |
| | Tai-Saw Technology Co. Ltd. | | | 158,000 | | | | 180,994 | |
| | Taishin Financial Holding Co. Ltd. | | | 46,516,044 | | | | 30,537,565 | |
# | | Taita Chemical Co. Ltd. | | | 1,669,566 | | | | 2,084,369 | |
| | TAI-TECH Advanced Electronics Co. Ltd. | | | 9,000 | | | | 41,481 | |
# | | Taiwan Business Bank | | | 21,804,811 | | | | 7,417,909 | |
| | Taiwan Cement Corp. | | | 23,712,948 | | | | 41,147,341 | |
# | | Taiwan Chinsan Electronic Industrial Co. Ltd. | | | 339,488 | | | | 571,866 | |
| | Taiwan Cogeneration Corp. | | | 78,000 | | | | 107,314 | |
| | Taiwan Cooperative Financial Holding Co. Ltd. | | | 37,615,745 | | | | 30,584,269 | |
| | Taiwan Fertilizer Co. Ltd. | | | 2,619,000 | | | | 6,404,653 | |
| | Taiwan Fire & Marine Insurance Co. Ltd. | | | 1,283,000 | | | | 921,171 | |
# | | Taiwan FU Hsing Industrial Co. Ltd. | | | 648,000 | | | | 943,318 | |
| | Taiwan Glass Industry Corp. | | | 5,779,982 | | | | 5,696,948 | |
| | Taiwan Hon Chuan Enterprise Co. Ltd. | | | 1,317,932 | | | | 3,087,875 | |
# | | Taiwan Hopax Chemicals Manufacturing Co. Ltd. | | | 931,000 | | | | 2,687,812 | |
†† | | Taiwan Kolin Co. Ltd. | | | 5,797,000 | | | | 0 | |
* | | Taiwan Land Development Corp. | | | 4,185,322 | | | | 511,264 | |
| | Taiwan Navigation Co. Ltd. | | | 1,024,000 | | | | 1,296,891 | |
| | Taiwan PCB Techvest Co. Ltd. | | | 1,607,946 | | | | 2,715,716 | |
| | Taiwan Semiconductor Co. Ltd. | | | 59,000 | | | | 173,335 | |
| | Taiwan Shin Kong Security Co. Ltd. | | | 109,390 | | | | 151,865 | |
| | Taiwan Steel Union Co. Ltd. | | | 8,000 | | | | 22,759 | |
# | | Taiwan Styrene Monomer | | | 264,000 | | | | 172,427 | |
# | | Taiwan Surface Mounting Technology Corp. | | | 1,414,991 | | | | 5,709,415 | |
DIMENSIONAL EMERGING MARKETS VALUE FUND
CONTINUED
| | | | | | | | | | |
| | | | | Shares | | | Value» | |
TAIWAN — (Continued) | | | | | | | | |
# * | | Taiwan TEA Corp. | | | 3,091,092 | | | $ | 2,320,647 | |
| | Taiwan Union Technology Corp. | | | 6,000 | | | | 20,689 | |
| | Taiyen Biotech Co. Ltd. | | | 601,217 | | | | 712,557 | |
# * | | Tatung Co. Ltd. | | | 4,614,000 | | | | 5,713,704 | |
| | TBI Motion Technology Co. Ltd. | | | 9,000 | | | | 15,608 | |
| | Te Chang Construction Co. Ltd. | | | 16,260 | | | | 16,965 | |
| | Teco Electric & Machinery Co. Ltd. | | | 6,927,725 | | | | 7,525,294 | |
| | Tera Autotech Corp. | | | 24,863 | | | | 18,433 | |
| | Test Research, Inc. | | | 77,000 | | | | 154,947 | |
| | Test Rite International Co. Ltd. | | | 1,140,266 | | | | 992,694 | |
| | Tex-Ray Industrial Co. Ltd. | | | 92,000 | | | | 45,997 | |
| | Thermaltake Technology Co. Ltd. | | | 14,000 | | | | 20,375 | |
| | Thye Ming Industrial Co. Ltd. | | | 37,000 | | | | 43,692 | |
# | | Ting Sin Co. Ltd. | | | 61,000 | | | | 50,153 | |
# | | Ton Yi Industrial Corp. | | | 3,768,600 | | | | 1,766,740 | |
| | Tong Yang Industry Co. Ltd. | | | 2,384,000 | | | | 2,898,585 | |
# * | | Tong-Tai Machine & Tool Co. Ltd. | | | 995,447 | | | | 573,649 | |
| | Top Bright Holding Co. Ltd. | | | 5,000 | | | | 20,804 | |
| | Topco Scientific Co. Ltd. | | | 11,000 | | | | 54,668 | |
| | Topco Technologies Corp. | | | 14,000 | | | | 39,616 | |
| | Topkey Corp. | | | 22,000 | | | | 102,526 | |
# | | Topoint Technology Co. Ltd. | | | 837,459 | | | | 1,254,619 | |
| | Toung Loong Textile Manufacturing | | | 102,000 | | | | 130,202 | |
| | TPK Holding Co. Ltd. | | | 2,287,000 | | | | 3,498,257 | |
| | Transcend Information, Inc. | | | 24,000 | | | | 58,329 | |
| | Tripod Technology Corp. | | | 2,531,000 | | | | 10,720,022 | |
* | | TrueLight Corp. | | | 32,000 | | | | 31,241 | |
# | | Tsann Kuen Enterprise Co. Ltd. | | | 215,000 | | | | 327,537 | |
# | | TSRC Corp. | | | 113,000 | | | | 130,351 | |
| | TST Group Holding Ltd. | | | 5,000 | | | | 24,972 | |
# | | Tung Ho Steel Enterprise Corp. | | | 4,907,274 | | | | 7,133,083 | |
| | TURVO International Co. Ltd. | | | 33,000 | | | | 123,079 | |
| | TXC Corp. | | | 1,644,000 | | | | 6,075,849 | |
# | | TYC Brother Industrial Co. Ltd. | | | 1,456,723 | | | | 1,046,556 | |
* | | Tycoons Group Enterprise | | | 2,762,337 | | | | 1,394,916 | |
# | | Tyntek Corp. | | | 1,640,097 | | | | 1,548,106 | |
# | | UDE Corp. | | | 353,000 | | | | 621,751 | |
| | U-Ming Marine Transport Corp. | | | 1,426,000 | | | | 2,704,368 | |
| | Unic Technology Corp. | | | 46,000 | | | | 35,927 | |
| | Unimicron Technology Corp. | | | 6,146,363 | | | | 42,132,335 | |
* | | Union Bank Of Taiwan | | | 13,013,051 | | | | 5,524,128 | |
# | | Unitech Computer Co. Ltd. | | | 477,739 | | | | 656,975 | |
# * | | Unitech Printed Circuit Board Corp. | | | 3,327,466 | | | | 2,170,334 | |
# | | United Microelectronics Corp. | | | 51,490,681 | | | | 106,893,309 | |
†† | | Unity Opto Technology Co. Ltd. | | | 2,993,000 | | | | 83,143 | |
| | Univacco Technology, Inc. | | | 46,000 | | | | 39,138 | |
| | Universal Cement Corp. | | | 2,280,583 | | | | 1,690,902 | |
| | Universal, Inc. | | | 64,000 | | | | 94,514 | |
| | Unizyx Holding Corp. | | | 1,586,000 | | | | 1,781,203 | |
# | | UPC Technology Corp. | | | 4,928,598 | | | | 4,100,617 | |
# | | USI Corp. | | | 4,858,827 | | | | 6,018,788 | |
* | | Usun Technology Co. Ltd. | | | 128,100 | | | | 160,249 | |
| | Ve Wong Corp. | | | 912,806 | | | | 1,071,339 | |
# * | | Victory New Materials Ltd. Co. | | | 626,687 | | | | 235,664 | |
# | | Wah Hong Industrial Corp. | | | 394,516 | | | | 399,203 | |
| | Wah Lee Industrial Corp. | | | 1,076,100 | | | | 3,296,537 | |
| | Walsin Lihwa Corp. | | | 8,686,412 | | | | 8,114,424 | |
# | | Walton Advanced Engineering, Inc. | | | 2,020,853 | | | | 1,245,342 | |
| | Wei Chuan Foods Corp. | | | 325,000 | | | | 267,318 | |
DIMENSIONAL EMERGING MARKETS VALUE FUND
CONTINUED
| | | | | | | | | | |
| | | | | Shares | | | Value» | |
TAIWAN — (Continued) | | | | | | | | |
†† | | Wei Mon Industry Co. Ltd. | | | 3,885,691 | | | $ | 0 | |
# | | Weikeng Industrial Co. Ltd. | | | 2,307,490 | | | | 2,317,106 | |
# | | Well Shin Technology Co. Ltd. | | | 482,080 | | | | 835,547 | |
| | Wha Yu Industrial Co. Ltd. | | | 238,000 | | | | 137,636 | |
# | | Winbond Electronics Corp. | | | 17,217,572 | | | | 16,324,719 | |
| | Winmate, Inc. | | | 28,000 | | | | 82,275 | |
# | | Winstek Semiconductor Co. Ltd. | | | 247,000 | | | | 269,822 | |
†† | | Wintek Corp. | | | 20,783,484 | | | | 256,426 | |
# | | Wisdom Marine Lines Co. Ltd. | | | 1,137,364 | | | | 2,677,107 | |
| | Wistron Corp. | | | 17,191,343 | | | | 18,067,243 | |
| | Wistron NeWeb Corp. | | | 114,000 | | | | 318,294 | |
# | | Wonderful Hi-Tech Co. Ltd. | | | 62,311 | | | | 51,526 | |
| | WPG Holdings Ltd. | | | 9,633,284 | | | | 17,996,131 | |
| | WT Microelectronics Co. Ltd. | | | 2,452,751 | | | | 5,541,795 | |
| | WUS Printed Circuit Co. Ltd. | | | 857,668 | | | | 875,798 | |
| | Xxentria Technology Materials Corp. | | | 28,000 | | | | 68,068 | |
| | Ya Horng Electronic Co. Ltd. | | | 22,000 | | | | 33,346 | |
# | | YC INOX Co. Ltd. | | | 1,963,446 | | | | 2,226,981 | |
| | YCC Parts Manufacturing Co. Ltd. | | | 10,000 | | | | 12,280 | |
# | | Yea Shin International Development Co. Ltd. | | | 843,825 | | | | 638,559 | |
# | | Yem Chio Co. Ltd. | | | 2,558,746 | | | | 1,399,449 | |
| | Yen Sun Technology Corp. | | | 84,000 | | | | 94,546 | |
# | | Yeong Guan Energy Technology Group Co. Ltd. | | | 474,820 | | | | 1,095,332 | |
| | YFC-Boneagle Electric Co. Ltd. | | | 34,000 | | | | 29,205 | |
# | | YFY, Inc. | | | 7,005,847 | | | | 8,076,605 | |
# | | Yi Jinn Industrial Co. Ltd. | | | 1,140,142 | | | | 709,026 | |
* | | Yieh Phui Enterprise Co. Ltd. | | | 3,438,265 | | | | 3,071,878 | |
# | | Young Fast Optoelectronics Co. Ltd. | | | 488,000 | | | | 530,674 | |
# | | Youngtek Electronics Corp. | | | 795,047 | | | | 2,420,555 | |
| | Yuanta Financial Holding Co. Ltd. | | | 52,178,994 | | | | 46,381,015 | |
# | | Yulon Motor Co. Ltd. | | | 3,594,650 | | | | 5,330,130 | |
| | Yung Chi Paint & Varnish Manufacturing Co. Ltd. | | | 214,687 | | | | 559,862 | |
| | YungShin Global Holding Corp. | | | 107,000 | | | | 167,485 | |
| | Yungtay Engineering Co. Ltd. | | | 23,000 | | | | 53,464 | |
# | | Zeng Hsing Industrial Co. Ltd. | | | 67,000 | | | | 367,594 | |
# | | Zenitron Corp. | | | 940,000 | | | | 974,269 | |
# | | Zero One Technology Co. Ltd. | | | 604,000 | | | | 1,002,776 | |
# | | Zhen Ding Technology Holding Ltd. | | | 3,635,000 | | | | 12,588,071 | |
| | Zhong Yang Technology Co. Ltd. | | | 9,000 | | | | 15,926 | |
# | | Zig Sheng Industrial Co. Ltd. | | | 2,151,352 | | | | 1,324,723 | |
# * | | Zinwell Corp. | | | 701,000 | | | | 497,193 | |
| | Zippy Technology Corp. | | | 48,000 | | | | 69,668 | |
# | | ZongTai Real Estate Development Co. Ltd. | | | 912,159 | | | | 1,273,031 | |
| | | | | | | | | | |
TOTAL TAIWAN | | | | | | | 2,235,753,597 | |
| | | | | | | | | | |
THAILAND — (1.9%) | | | | | | | | |
| | AAPICO Hitech PCL | | | 249,150 | | | | 159,180 | |
| | AAPICO Hitech PCL | | | 938,747 | | | | 599,757 | |
* | | Ananda Development PCL | | | 5,845,600 | | | | 278,341 | |
| | AP Thailand PCL | | | 16,307,230 | | | | 4,349,250 | |
| | Bangchak Corp. PCL | | | 6,810,700 | | | | 5,644,368 | |
* | | Bangkok Airways PCL | | | 4,493,000 | | | | 1,570,671 | |
| | Bangkok Bank PCL | | | 59,900 | | | | 221,133 | |
| | Bangkok Bank PCL | | | 1,450,853 | | | | 5,356,121 | |
| | Bangkok Insurance PCL | | | 215,128 | | | | 1,808,806 | |
| | Bangkok Land PCL | | | 71,881,596 | | | | 2,382,875 | |
| | Bangkok Life Assurance PCL | | | 1,110,200 | | | | 995,358 | |
* | | Bangkok Ranch PCL | | | 3,329,500 | | | | 307,037 | |
| | Banpu PCL | | | 28,014,733 | | | | 9,624,590 | |
DIMENSIONAL EMERGING MARKETS VALUE FUND
CONTINUED
| | | | | | | | | | |
| | | | | Shares | | | Value» | |
THAILAND — (Continued) | | | | | | | | |
| | Berli Jucker PCL | | | 1,518,800 | | | $ | 1,544,775 | |
* | | Better World Green PCL | | | 4,257,100 | | | | 105,201 | |
| | BG Container Glass PCL | | | 161,900 | | | | 55,134 | |
| | Cal-Comp Electronics Thailand PCL, Class F | | | 16,886,256 | | | | 1,333,293 | |
| | Charoen Pokphand Foods PCL | | | 19,777,700 | | | | 15,049,708 | |
* | | Country Group Development PCL | | | 3,308,900 | | | | 51,853 | |
* | | Country Group Holdings PCL | | | 1,206,900 | | | | 40,372 | |
* | | Demco PCL | | | 133,400 | | | | 19,538 | |
| | Eastern Water Resources Development & Management PCL, Class F | | | 254,300 | | | | 77,403 | |
| | GFPT PCL | | | 3,664,400 | | | | 1,281,008 | |
| | Global Green Chemicals PCL, Class F | | | 312,400 | | | | 118,624 | |
| | ICC International PCL | | | 2,067,400 | | | | 1,900,270 | |
| | Indorama Ventures PCL | | | 1,385,300 | | | | 1,753,412 | |
| | IRPC PCL | | | 43,754,900 | | | | 5,670,039 | |
* | | Italian-Thai Development PCL | | | 21,811,100 | | | | 1,538,099 | |
| | Kasikornbank PCL | | | 843,501 | | | | 3,584,228 | |
* | | Khon Kaen Sugar Industry PCL | | | 10,656,207 | | | | 1,239,598 | |
| | Kiatnakin Phatra Bank PCL | | | 1,257,500 | | | | 2,273,789 | |
| | Krung Thai Bank PCL | | | 12,326,000 | | | | 4,271,800 | |
| | Lalin Property PCL | | | 204,200 | | | | 57,231 | |
| | LH Financial Group PCL | | | 11,902,046 | | | | 527,266 | |
| | LPN Development PCL | | | 8,159,602 | | | | 1,224,586 | |
* | | MBK PCL | | | 800,610 | | | | 337,785 | |
| | Millcon Steel PCL | | | 5,499,000 | | | | 240,294 | |
* | | Nawarat Patanakarn PCL | | | 3,182,100 | | | | 100,692 | |
| | Origin Property PCL, Class F | | | 568,500 | | | | 193,598 | |
| | Polyplex Thailand PCL | | | 1,919,025 | | | | 1,411,112 | |
* | | Power Solution Technologies PCL, Class F | | | 1,808,740 | | | | 142,813 | |
| | Property Perfect PCL | | | 42,170,700 | | | | 584,601 | |
| | Pruksa Holding PCL | | | 5,079,600 | | | | 2,112,514 | |
| | PTT Exploration & Production PCL | | | 7,046,400 | | | | 24,951,465 | |
| | PTT Global Chemical PCL | | | 6,817,141 | | | | 12,891,602 | |
| | PTT PCL | | | 54,395,500 | | | | 63,112,386 | |
| | Quality Houses PCL | | | 27,914,547 | | | | 1,934,859 | |
| | Rojana Industrial Park PCL | | | 5,071,073 | | | | 1,054,484 | |
| | Saha Pathana Inter-Holding PCL | | | 2,248,100 | | | | 4,471,471 | |
| | Saha Pathanapibul PCL | | | 1,052,533 | | | | 1,911,101 | |
| | Sahakol Equipment PCL | | | 1,782,300 | | | | 131,057 | |
| | Saha-Union PCL | | | 1,568,500 | | | | 1,559,873 | |
* | | Samart Telcoms PCL | | | 113,900 | | | | 22,311 | |
| | Sansiri PCL | | | 54,046,766 | | | | 2,052,254 | |
| | SC Asset Corp. PCL | | | 10,005,753 | | | | 1,079,503 | |
| | Sena Development PCL | | | 1,331,366 | | | | 164,502 | |
| | Siam Cement PCL | | | 208,800 | | | | 2,485,527 | |
| | Siam City Cement PCL | | | 39,000 | | | | 199,216 | |
| | Siam Commercial Bank PCL | | | 2,883,100 | | | | 10,947,656 | |
| | Siamgas & Petrochemicals PCL | | | 66,200 | | | | 28,728 | |
* | | Singha Estate PCL | | | 547,000 | | | | 33,299 | |
| | Somboon Advance Technology PCL | | | 2,077,000 | | | | 1,283,161 | |
| | SPCG PCL | | | 506,700 | | | | 271,808 | |
| | Sri Trang Agro-Industry PCL | | | 1,744,899 | | | | 1,709,010 | |
* | | Srithai Superware PCL | | | 11,102,100 | | | | 468,408 | |
* | | STP & I PCL | | | 5,380,400 | | | | 706,955 | |
| | Supalai PCL | | | 7,863,700 | | | | 5,545,410 | |
| | Super Energy Corp. PCL | | | 114,997,600 | | | | 3,361,642 | |
| | Susco PCL | | | 126,100 | | | | 12,465 | |
| | Syntec Construction PCL | | | 5,229,800 | | | | 305,758 | |
| | Thai Oil PCL | | | 4,176,200 | | | | 7,016,444 | |
| | Thai Rayon PCL | | | 58,700 | | | | 90,661 | |
DIMENSIONAL EMERGING MARKETS VALUE FUND
CONTINUED
| | | | | | | | | | |
| | | | | Shares | | | Value» | |
THAILAND — (Continued) | | | | | | | | |
| | Thai Stanley Electric PCL | | | 37,000 | | | $ | 196,806 | |
| | Thai Stanley Electric PCL, Class F | | | 170,100 | | | | 904,774 | |
| | Thai Wacoal PCL | | | 81,200 | | | | 97,883 | |
| | Thaicom PCL | | | 4,075,500 | | | | 1,338,746 | |
| | Thanachart Capital PCL | | | 1,502,600 | | | | 1,596,222 | |
| | Thitikorn PCL | | | 1,125,800 | | | | 301,955 | |
| | TMBThanachart Bank PCL | | | 92,478,709 | | | | 3,232,888 | |
| | TPI Polene PCL | | | 38,994,640 | | | | 2,009,518 | |
| | TPI Polene Power PCL | | | 3,210,999 | | | | 410,296 | |
| | True Corp. PCL | | | 63,601,400 | | | | 7,781,863 | |
* | | Unique Engineering & Construction PCL | | | 777,000 | | | | 156,887 | |
| | Univentures PCL | | | 3,231,600 | | | | 397,346 | |
| | Vinythai PCL | | | 1,561,617 | | | | 1,788,336 | |
| | | | | | | | | | |
TOTAL THAILAND | | | | | | | 252,154,659 | |
| | | | | | | | | | |
TURKEY — (0.5%) | | | | | | | | |
# | | Akbank TAS | | | 12,733,695 | | | | 7,708,001 | |
* | | Albaraka Turk Katilim Bankasi AS | | | 6,400,736 | | | | 1,182,618 | |
| | Anadolu Anonim Turk Sigorta Sirketi | | | 2,740,994 | | | | 1,696,063 | |
| | Anadolu Efes Biracilik Ve Malt Sanayii AS | | | 438,406 | | | | 1,008,879 | |
# | | Arcelik AS | | | 240,237 | | | | 842,838 | |
* | | Borusan Mannesmann Boru Sanayi ve Ticaret AS | | | 186,252 | | | | 470,157 | |
* | | Cimsa Cimento Sanayi VE Ticaret AS | | | 408,339 | | | | 1,328,536 | |
# | | Dogan Sirketler Grubu Holding AS | | | 2,253,127 | | | | 628,406 | |
| | EIS Eczacibasi Ilac ve Sinai ve Finansal Yatirimlar Sanayi ve Ticaret AS | | | 635,312 | | | | 397,488 | |
| | Enka Insaat ve Sanayi AS | | | 4,716,199 | | | | 5,445,747 | |
* | | Gozde Girisim Sermayesi Yatirim Ortakligi AS | | | 1,178,710 | | | | 830,413 | |
* | | GSD Holding AS | | | 2,389,068 | | | | 648,843 | |
| | KOC Holding AS | | | 2,486,011 | | | | 6,061,276 | |
* | | Koza Anadolu Metal Madencilik Isletmeleri AS | | | 129,888 | | | | 226,592 | |
# * | | Sekerbank Turk AS | | | 3,153,463 | | | | 330,067 | |
# | | Selcuk Ecza Deposu Ticaret ve Sanayi AS | | | 451,739 | | | | 418,566 | |
* | | Turk Hava Yollari AO | | | 3,733,594 | | | | 5,690,184 | |
# | | Turkiye Garanti Bankasi AS | | | 13,334,670 | | | | 13,655,486 | |
# * | | Turkiye Halk Bankasi AS | | | 1,972,856 | | | | 909,077 | |
# | | Turkiye Is Bankasi AS, Class C | | | 9,142,747 | | | | 5,363,476 | |
# | | Turkiye Sinai Kalkinma Bankasi AS | | | 8,645,187 | | | | 1,169,007 | |
| | Turkiye Sise ve Cam Fabrikalari AS | | | 4,915,697 | | | | 4,421,796 | |
# * | | Turkiye Vakiflar Bankasi TAO, Class D | | | 5,849,551 | | | | 2,090,675 | |
| | Ulker Biskuvi Sanayi AS | | | 412,887 | | | | 867,463 | |
# | | Vestel Elektronik Sanayi ve Ticaret AS | | | 297,357 | | | | 790,790 | |
# | | Yapi ve Kredi Bankasi AS | | | 16,738,183 | | | | 4,754,891 | |
| | | | | | | | | | |
TOTAL TURKEY | | | | | | | 68,937,335 | |
| | | | | | | | | | |
UNITED ARAB EMIRATES — (0.4%) | | | | | | | | |
| | Abu Dhabi Commercial Bank PJSC | | | 6,998,773 | | | | 15,829,642 | |
| | Abu Dhabi National Insurance Co. PSC | | | 10,000 | | | | 15,214 | |
* | | Ajman Bank PJSC | | | 110,591 | | | | 21,008 | |
| | Aldar Properties PJSC | | | 9,554,812 | | | | 10,513,077 | |
* | | Amanat Holdings PJSC | | | 1,490,558 | | | | 458,290 | |
* | | DAMAC Properties Dubai Co. PJSC | | | 2,169,630 | | | | 739,867 | |
| | Dana Gas PJSC | | | 3,526,389 | | | | 992,949 | |
* | | Deyaar Development PJSC | | | 9,632,024 | | | | 780,561 | |
* | | Dubai Financial Market PJSC | | | 1,950,844 | | | | 541,839 | |
| | Dubai Investments PJSC | | | 2,833,956 | | | | 1,314,578 | |
* | | Emaar Development PJSC | | | 1,946,738 | | | | 2,076,867 | |
* | | Emaar Malls PJSC | | | 292,209 | | | | 159,498 | |
| | Emaar Properties PJSC | | | 11,964,633 | | | | 13,098,041 | |
DIMENSIONAL EMERGING MARKETS VALUE FUND
CONTINUED
| | | | | | | | | | |
| | | | | Shares | | | Value» | |
UNITED ARAB EMIRATES — (Continued) | | | | | | | | |
| | Emirates NBD Bank PJSC | �� | | 637,271 | | | $ | 2,424,894 | |
* | | Eshraq Investments PJSC | | | 4,699,658 | | | | 413,593 | |
| | Islamic Arab Insurance Co. | | | 229,899 | | | | 46,990 | |
* | | Manazel PJSC | | | 3,078,974 | | | | 461,458 | |
* | | RAK Properties PJSC | | | 4,853,881 | | | | 969,703 | |
| | Ras Al Khaimah Ceramics | | | 178,681 | | | | 133,674 | |
| | SHUAA Capital PSC | | | 61,321 | | | | 11,182 | |
* | | Union Properties PJSC | | | 3,928,839 | | | | 281,647 | |
| | | | | | | | | | |
TOTAL UNITED ARAB EMIRATES | | | | | | | 51,284,572 | |
| | | | | | | | | | |
UNITED KINGDOM — (0.0%) | | | | | | | | |
* | | Bytes Technology Group PLC | | | 50,304 | | | | 365,499 | |
| | | | | | | | | | |
TOTAL COMMON STOCKS | | | | | | | 13,342,558,531 | |
| | | | | | | | | | |
PREFERRED STOCKS — (0.5%) | | | | | | | | |
BRAZIL — (0.5%) | | | | | | | | |
| | Banco ABC Brasil SA | | | 560,876 | | | | 1,509,569 | |
W | | Banco BMG SA | | | 35,800 | | | | 19,347 | |
| | Banco Bradesco SA | | | 7,213,076 | | | | 25,433,256 | |
| | Banco do Estado do Rio Grande do Sul SA Class B | | | 1,331,245 | | | | 2,568,705 | |
| | Cia Ferro Ligas da Bahia - FERBASA | | | 330,538 | | | | 2,776,055 | |
| | Eucatex SA Industria e Comercio | | | 262,828 | | | | 370,692 | |
| | Gerdau SA | | | 368,620 | | | | 1,756,951 | |
| | Grazziotin SA | | | 6,400 | | | | 51,211 | |
| | Marcopolo SA | | | 2,532,543 | | | | 1,162,211 | |
| | Petroleo Brasileiro SA | | | 3,992,173 | | | | 19,275,437 | |
| | Schulz SA | | | 208,260 | | | | 304,431 | |
| | Unipar Carbocloro SA Class B | | | 207,349 | | | | 2,743,315 | |
| | Usinas Siderurgicas de Minas Gerais SA Usiminas Class A | | | 1,309,071 | | | | 3,073,318 | |
| | | | | | | | | | |
TOTAL BRAZIL | | | | | | | 61,044,498 | |
| | | | | | | | | | |
COLOMBIA — (0.0%) | | | | | | | | |
| | Grupo Argos SA | | | 374,078 | | | | 854,301 | |
| | Grupo de Inversiones Suramericana SA | | | 861,705 | | | | 4,322,558 | |
| | | | | | | | | | |
TOTAL COLOMBIA | | | | | | | 5,176,859 | |
| | | | | | | | | | |
PHILIPPINES — (0.0%) | | | | | | | | |
| | Cebu Air, Inc., 6.000% | | | 873,808 | | | | 763,348 | |
| | | | | | | | | | |
SOUTH KOREA — (0.0%) | | | | | | | | |
| | Hyundai Engineering & Construction Co. Ltd. | | | 4,576 | | | | 622,023 | |
| | | | | | | | | | |
TOTAL PREFERRED STOCKS | | | | | | | 67,606,728 | |
| | | | | | | | | | |
RIGHTS/WARRANTS — (0.0%) | | | | | | | | |
BRAZIL — (0.0%) | | | | | | | | |
* | | Ultrapar Participacoes SA Rights 11/03/21 | | | 65,305 | | | | 0 | |
| | | | | | | | | | |
CHILE — (0.0%) | | | | | | | | |
* | | Itau CorpBanca Chile SA Rights 11/02/21 | | | 1 | | | | 0 | |
| | | | | | | | | | |
TAIWAN — (0.0%) | | | | | | | | |
* | | Eva Airways Corp. Rights Exp 10/01/21 | | | 239,420 | | | | 0 | |
* | | Ta Ya Electric Wire & Cable Rights 11/10/21 | | | 99,944 | | | | 13,477 | |
| | | | | | | | | | |
TOTAL TAIWAN | | | | | | | 13,477 | |
| | | | | | | | | | |
DIMENSIONAL EMERGING MARKETS VALUE FUND
CONTINUED
| | | | | | | | | | |
| | | | | Shares | | | Value» | |
THAILAND — (0.0%) | | | | | | | | |
* | | Banpu PCL 10/01/22 | | | 6,911,516 | | | $ | 1,072,683 | |
* | | Banpu PCL 10/01/23 | | | 5,647,083 | | | | 575,217 | |
* | | MBK PCL Warrants 10/27/22 | | | 32,025 | | | | 10,616 | |
* | | Samart Telcoms PCL Rights 05/17/24 | | | 18,983 | | | | 853 | |
| | | | | | | | | | |
TOTAL THAILAND | | | | | | | 1,659,369 | |
| | | | | | | | | | |
TOTAL RIGHTS/WARRANTS | | | | | | | 1,672,846 | |
| | | | | | | | | | |
TOTAL INVESTMENT SECURITIES
(Cost $10,418,045,683) | | | | | | | 13,411,838,105 | |
| | | | | | | | | | |
| | | |
| | | | | | | | Value† | |
SECURITIES LENDING COLLATERAL — (1.7%) | | | | | | | | |
@ § | | The DFA Short Term Investment Fund | | | 19,568,415 | | | | 226,406,566 | |
| | | | | | | | | | |
TOTAL INVESTMENTS — (100.0%)
(Cost $10,644,400,920) | | | | | | $ | 13,638,244,671 | |
| | | | | | | | | | |
| | |
| ADR | | American Depositary Receipt |
| CP | | Certificate Participation |
| GDR | | Global Depositary Receipt |
| SA | | Special Assessment |
| ST | | Special Tax |
| » | | Securities that have been fair value factored. See Note B to Financial Statements. |
| * | | Non-Income Producing Securities. |
| # | | Total or Partial Securities on Loan. |
| W | | Rule 144A, Section 4(2), or other security that is restricted as to resale to institutional investors. This security has been deemed liquid based upon the Fund’s Liquidity Guidelines. The liquidity determination is unaudited. |
| †† | | Security valued using significant unobservable inputs (Level 3). |
| † | | See Note B to Financial Statements. |
| @ | | Security purchased with cash collateral received from Securities on Loan. |
| § | | Affiliated Fund. |
As of October 31, 2021, Dimensional Emerging Markets Value Fund had entered into the following outstanding futures contracts:
| | | | | | | | | | | | | | | | | | | | |
Description | | Number of
Contracts | | | Expiration
Date | | | Notional
Value | | | Market
Value | | | Unrealized
Appreciation
(Depreciation) | |
Long Position Contracts: | | | | | | | | | | | | | | | | | | | | |
E-Mini MSCI Emerging Markets Index | | | 650 | | | | 12/17/21 | | | $ | 41,972,669 | | | $ | 41,015,000 | | | $ | (957,669 | ) |
S&P 500® Emini Index | | | 441 | | | | 12/17/21 | | | | 99,955,617 | | | | 101,363,850 | | | | 1,408,233 | |
| | | | | | | | | | | | | | | | | | | | |
Total Futures Contracts | | | | | | | | | | $ | 141,928,286 | | | $ | 142,378,850 | | | $ | 450,564 | |
| | | | | | | | | | | | | | | | | | | | |
Summary of the Fund’s investments as of October 31, 2021, based on their valuation inputs, is as follows (see Security Valuation Note):
| | | | | | | | | | | | | | | | |
| | | Investments in Securities (Market Value) | |
| | | Level 1 | | | Level 2 | | | Level 3 | | | Total | |
Common Stocks | | | | | | | | | | | | | | | | |
Brazil | | $ | 462,743,898 | | | | — | | | | — | | | $ | 462,743,898 | |
Chile | | | 6,785,587 | | | $ | 63,837,563 | | | | — | | | | 70,623,150 | |
China | | | 342,832,593 | | | | 3,793,625,614 | | | $ | 37,493,836 | | | | 4,173,952,043 | |
Colombia | | | 11,699,835 | | | | — | | | | — | | | | 11,699,835 | |
Czech Republic | | | — | | | | 20,436,623 | | | | — | | | | 20,436,623 | |
Greece | | | — | | | | 33,803,657 | | | | — | | | | 33,803,657 | |
Hong Kong | | | 5,675,428 | | | | 17,004,977 | | | | 79,933 | | | | 22,760,338 | |
DIMENSIONAL EMERGING MARKETS VALUE FUND
CONTINUED
| | | | | | | | | | | | | | | | |
| | | Investments in Securities (Market Value) | |
| | | Level 1 | | | Level 2 | | | Level 3 | | | Total | |
Hungary | | | — | | | $ | 33,993,976 | | | | — | | | $ | 33,993,976 | |
India | | $ | 106,915,810 | | | | 1,765,125,436 | | | $ | 35,107 | | | | 1,872,076,353 | |
Indonesia | | | — | | | | 208,895,122 | | | | 846,264 | | | | 209,741,386 | |
Malaysia | | | — | | | | 250,498,909 | | | | 620 | | | | 250,499,529 | |
Mexico | | | 298,694,923 | | | | 7,828,918 | | | | — | | | | 306,523,841 | |
Philippines | | | — | | | | 127,678,949 | | | | 14,293 | | | | 127,693,242 | |
Poland | | | — | | | | 115,707,174 | | | | — | | | | 115,707,174 | |
Qatar | | | — | | | | 40,558,271 | | | | — | | | | 40,558,271 | |
Russia | | | 23,870,525 | | | | 216,794,779 | | | | — | | | | 240,665,304 | |
Saudi Arabia | | | — | | | | 392,053,737 | | | | — | | | | 392,053,737 | |
South Africa | | | 57,637,480 | | | | 478,642,119 | | | | — | | | | 536,279,599 | |
South Korea | | | 241,252,129 | | | | 1,570,035,853 | | | | 962,931 | | | | 1,812,250,913 | |
Taiwan | | | 27,564,991 | | | | 2,207,844,782 | | | | 343,824 | | | | 2,235,753,597 | |
Thailand | | | 252,154,659 | | | | — | | | | — | | | | 252,154,659 | |
Turkey | | | — | | | | 68,937,335 | | | | — | | | | 68,937,335 | |
United Arab Emirates | | | — | | | | 51,284,572 | | | | — | | | | 51,284,572 | |
United Kingdom | | | — | | | | 365,499 | | | | — | | | | 365,499 | |
Preferred Stocks | | | | | | | | | | | | | | | | |
Brazil | | | 61,025,151 | | | | 19,347 | | | | — | | | | 61,044,498 | |
Colombia | | | 5,176,859 | | | | — | | | | — | | | | 5,176,859 | |
Philippines | | | — | | | | 763,348 | | | | — | | | | 763,348 | |
South Korea | | | — | | | | 622,023 | | | | — | | | | 622,023 | |
Rights/Warrants | | | | | | | | | | | | | | | | |
Taiwan | | | — | | | | 13,477 | | | | — | | | | 13,477 | |
Thailand | | | — | | | | 1,659,369 | | | | — | | | | 1,659,369 | |
Securities Lending Collateral | | | — | | | | 226,406,566 | | | | — | | | | 226,406,566 | |
Futures Contracts** | | | 450,564 | | | | — | | | | — | | | | 450,564 | |
| | | | | | | | | | | | | | | | |
TOTAL | | $ | 1,904,480,432 | | | $ | 11,694,437,995 | | | $ | 39,776,808^ | | | $ | 13,638,695,235 | |
| | | | | | | | | | | | | | | | |
| ** | Valued at the unrealized appreciation/(depreciation) on the investment. |
| ^ | A reconciliation of Level 3 investments is presented when the Fund had a significant amount of Level 3 investments at the beginning and/or end of the reporting period in relation to net assets. |

Report of Independent Registered Public Accounting Firm
To the Board of Trustees and Shareholders of Dimensional Emerging Markets Value Fund
Opinion on the Financial Statements
We have audited the accompanying statement of assets and liabilities, including the summary schedule of portfolio holdings, of Dimensional Emerging Markets Value Fund (the “Fund”) as of October 31, 2021, the related statement of operations for the year ended October 31, 2021, the statement of changes in net assets for each of the two years in the period ended October 31, 2021, including the related notes, and the financial highlights for each of the five years in the period ended October 31, 2021 (included in Item 1 of this Form N-CSR) and the schedule of investments (included in Item 6 of this Form N-CSR) as of October 31, 2021 (collectively referred to as the “financial statements”). In our opinion, the financial statements present fairly, in all material respects, the financial position of the Fund as of October 31, 2021, the results of its operations for the year then ended, the changes in its net assets for each of the two years in the period ended October 31, 2021 and the financial highlights for each of the five years in the period ended October 31, 2021 in conformity with accounting principles generally accepted in the United States of America.
Basis for Opinion
These financial statements are the responsibility of the Fund’s management. Our responsibility is to express an opinion on the Fund’s financial statements based on our audits. We are a public accounting firm registered with the Public Company Accounting Oversight Board (United States) (PCAOB) and are required to be independent with respect to the Fund in accordance with the U.S. federal securities laws and the applicable rules and regulations of the Securities and Exchange Commission and the PCAOB.
We conducted our audits of these financial statements in accordance with the standards of the PCAOB. Those standards require that we plan and perform the audit to obtain reasonable assurance about whether the financial statements are free of material misstatement, whether due to error or fraud.
Our audits included performing procedures to assess the risks of material misstatement of the financial statements, whether due to error or fraud, and performing procedures that respond to those risks. Such procedures included examining, on a test basis, evidence regarding the amounts and disclosures in the financial statements. Our audits also included evaluating the accounting principles used and significant estimates made by management, as well as evaluating the overall presentation of the financial statements. Our procedures included confirmation of securities owned as of October 31, 2021 by correspondence with the custodian, brokers and transfer agent of the investee fund; when replies were not received from brokers, we performed other auditing procedures. We believe that our audits provide a reasonable basis for our opinion.
December 22, 2021
We have served as the auditor of one or more investment companies in Dimensional Fund Advisors L.P. investment company group since 1981.
|
| |
PricewaterhouseCoopers LLP, Two Commerce Square, Suite 1800, 2001 Market Street, Philadelphia, PA 19103-7042
T: (267) 330 3000, F: (267) 330 3300, www.pwc.com/us |
| ITEM 7. | DISCLOSURE OF PROXY VOTING POLICIES AND PROCEDURES FOR CLOSED-END MANAGEMENT INVESTMENT COMPANIES. |
This item is not applicable to the Registrant, which is an open-end management investment company.
| ITEM 8. | PORTFOLIO MANAGERS OF CLOSED-END MANAGEMENT INVESTMENT COMPANIES. |
This item is not applicable to the Registrant, which is an open-end management investment company.
| ITEM 9. | PURCHASES OF EQUITY SECURITIES BY CLOSED-END MANAGEMENT INVESTMENT COMPANY AND AFFILIATED PURCHASERS. |
This item is not applicable to the Registrant, which is an open-end management investment company.
| ITEM 10. | SUBMISSION OF MATTERS TO A VOTE OF SECURITY HOLDERS. |
None.
| ITEM 11. | CONTROLS AND PROCEDURES. |
| | (a) | Based on their evaluation of the Registrant’s disclosure controls and procedures as of a date within 90 days of the filing date of this Form N-CSR (the “Report”), the Registrant’s Co-Principal Executive Officers and Principal Financial Officer believe that the disclosure controls and procedures (as defined in Rule 30a-3(c) under the Investment Company Act of 1940, as amended) are effectively designed to ensure that information required to be disclosed by the Registrant in the Report is recorded, processed, summarized and reported by the filing date, including ensuring that information required to be disclosed in the Report is accumulated and communicated to the Registrant’s officers that are making certifications in the Report, as appropriate, to allow timely decisions regarding required disclosure. The Registrant’s management, including the Co-Principal Executive Officers and the Principal Financial Officer, recognizes that any set of controls and procedures, no matter how well designed and operated, can provide only reasonable assurance of achieving the desired control objectives. |
| | (b) | There were no changes in the Registrant’s internal control over financial reporting (as defined in Rule 30a-3(d) under the Investment Company Act of 1940, as amended) that occurred during the period covered by this Report that have materially affected, or are reasonably likely to materially affect, the Registrant’s internal control over financial reporting. |
| ITEM 12. | DISCLOSURE OF SECURITIES LENDING ACTIVITIES FOR CLOSED-END MANAGEMENT INVESTMENT COMPANIES. |
This item is not applicable to the Registrant, which is an open-end management investment company.
| | (a)(3) | This item is not applicable. |
SIGNATURES
Pursuant to the requirements of the Securities Exchange Act of 1934 and the Investment Company Act of 1940, the Registrant has duly caused this Report to be signed on its behalf by the undersigned, thereunto duly authorized.
Dimensional Emerging Markets Value Fund
| | |
| By: | | /s/ David P. Butler |
| | David P. Butler |
| | Co-Chief Executive Officer |
Date: January 5, 2022
| | |
| By: | | /s/ Gerard K. O’Reilly |
| | Gerard K. O’Reilly |
| | Co-Chief Executive Officer and |
| | Chief Investment Officer |
Date: January 5, 2022
Pursuant to the requirements of the Securities Exchange Act of 1934 and the Investment Company Act of 1940, this Report has been signed below by the following persons on behalf of the Registrant and in the capacities and on the dates indicated.
| | |
| By: | | /s/ David P. Butler |
| | David P. Butler |
| | Co-Principal Executive Officer |
| | Dimensional Emerging Markets Value Fund |
Date: January 5, 2022
| | |
| By: | | /s/ Gerard K. O’Reilly |
| | Gerard K. O’Reilly |
| | Co-Principal Executive Officer |
| | Dimensional Emerging Markets Value Fund |
Date: January 5, 2022
| | |
By: | | /s/ Jan Miller |
| | Jan Miller |
| | Principal Financial Officer |
| | Dimensional Emerging Markets Value Fund |
Date: January 5, 2022