
1
March 2009
www.amedisys.com
NASDAQ: AMED
1

2
Forward-Looking Statements
This presentation may include forward-looking statements as defined by the
Private Securities Litigation Reform Act of 1995. These forward-looking
statements are based upon current expectations and assumptions about
our business that are subject to a variety of risks and uncertainties that
could cause actual results to differ materially from those described in this
presentation. You should not rely on forward-looking statements a
prediction of future events. Additional information regarding factors that
could cause actual results to differ materially from those discussed in any
forward-looking statements are described in reports and registration
statements we file with the SEC, including our Annual Report on Form
10-K and subsequent Quarterly Reports on Form 10-Q and Current Reports
on Form 8-K, copies of which are available on the Amedisys internet
website http://www.amedisys.com or by contacting the Amedisys Investor
Relations department at (800) 467-2662. We disclaim any obligation to
update any forward-looking statements or any changes in events, conditions
or circumstances upon which any forward-looking statement may be based.
2

3
Important Website Information
We encourage everyone to visit the Investors Section of our
website at www.amedisys.com, where we have posted additional
important information such as press releases, profiles concerning
our business and clinical operations and control processes, and
SEC filings. We intend to use our website to expedite public access
to time-critical information regarding the Company in advance of or
in lieu of distributing a press release or a filing with the SEC
disclosing the same information.
3

4
Investment Highlights
Focus on home nursing and related services to Medicare
population
population
Large, growing and highly fragmented industry
Strong internal growth and cash flow with low recurring
routine cap ex
routine cap ex
Proven operating model supported by sophisticated
technology system
technology system
Demonstrated ability to identify and integrate
acquisitions
acquisitions
Liquidity availability to fund external growth
Extensive delivery platform ideally positioned for
Medicare care management initiatives
Medicare care management initiatives
Experienced management team
4

5
William F. Borne
Chairman and Chief Executive Officer
CEO since founding the Company in 1982
Chairman and Chief Executive Officer
CEO since founding the Company in 1982
Larry R. Graham
President and Chief Operating Officer, Director
Joined Amedisys in 1996; COO since 1999;
President since 2004
President and Chief Operating Officer, Director
Joined Amedisys in 1996; COO since 1999;
President since 2004
Dale E. Redman, CPA
Chief Financial Officer
Joined Amedisys in February 2007
Chief Financial Officer
Joined Amedisys in February 2007
Alice Ann Schwartz
Chief Information Officer
Joined Amedisys in 1998, CIO since 2004,
SVP Clinical Operations since 2003
Chief Information Officer
Joined Amedisys in 1998, CIO since 2004,
SVP Clinical Operations since 2003
Jeffrey Jeter
Chief Compliance Officer
Joined Amedisys in 2001
Chief Compliance Officer
Joined Amedisys in 2001
Management Team
5
6
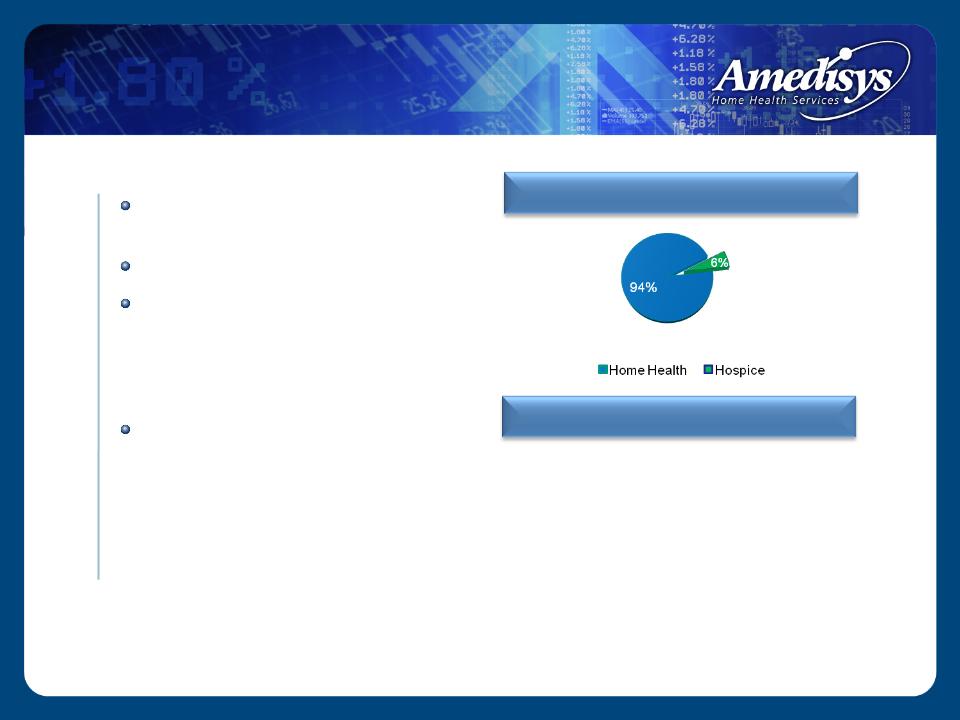
Corporate Overview1
Founded in 1982, publicly
listed 1994
listed 1994
528 locations in 37 states
Leading provider of home
health services
health services
‒ Services include skilled
nursing and therapy
nursing and therapy
94% of Home Health revenue
is episodic based (both
Medicare & non-Medicare)
is episodic based (both
Medicare & non-Medicare)
1For the year ended December 31, 2008
2Forecasted 2009 annual results as of 1/06/09, reaffirmed on 2/17/09 earnings call
Revenue Mix
Stats
› 14,800 employees
› Daily visits = 19,200
› 7,004,200 visits in 2008
› 2009 revenue guidance = $1.475 billion2
6
7
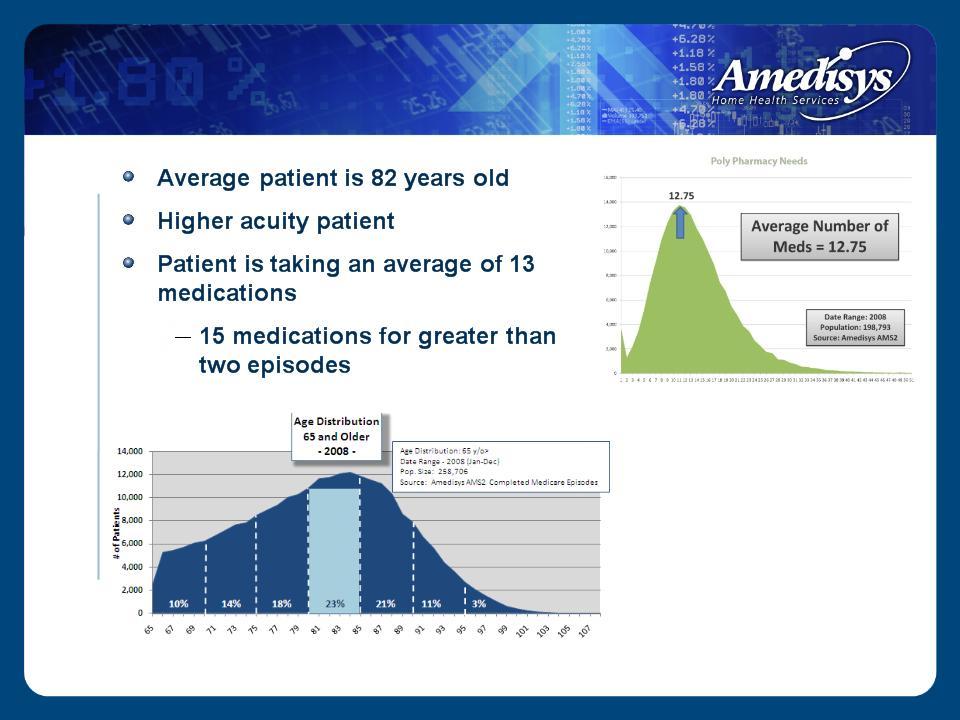
Patient Overview
7

8
• 85% receive care/
discharged within 2
episodes
discharged within 2
episodes
• 10% received care within
4 episodes
4 episodes
• 5% - - Chronic Subset
Patient Length of Stay
8
9
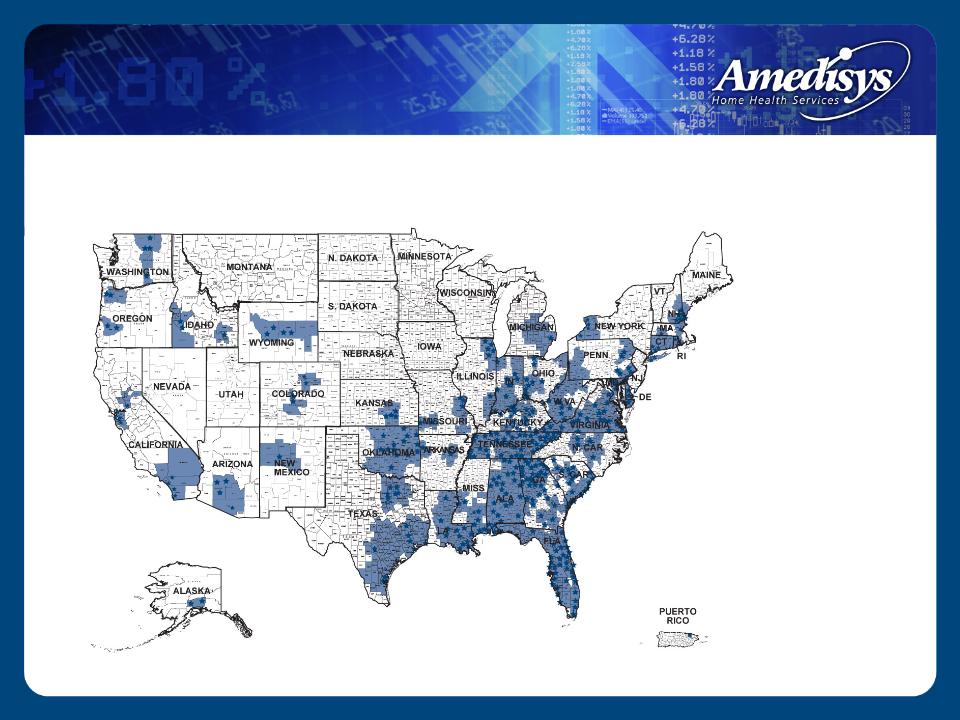
Our Locations
National home nursing provider located in 37 states, the District of Columbia and
Puerto Rico. Largest provider in the Southern and Southeastern United States.
Puerto Rico. Largest provider in the Southern and Southeastern United States.
‒ 480 home nursing
locations
locations
‒ 48 hospice locations
9

10
Our Strategy
Focus on Medicare-eligible patients
Emphasize internal growth
Select, acquire and integrate quality home care agencies
Focus on leveraging our cost-efficient operating structure
Develop and deploy specialized programs for chronic
diseases and conditions
diseases and conditions
Expand care coordination platform
Start-up activities
10
11
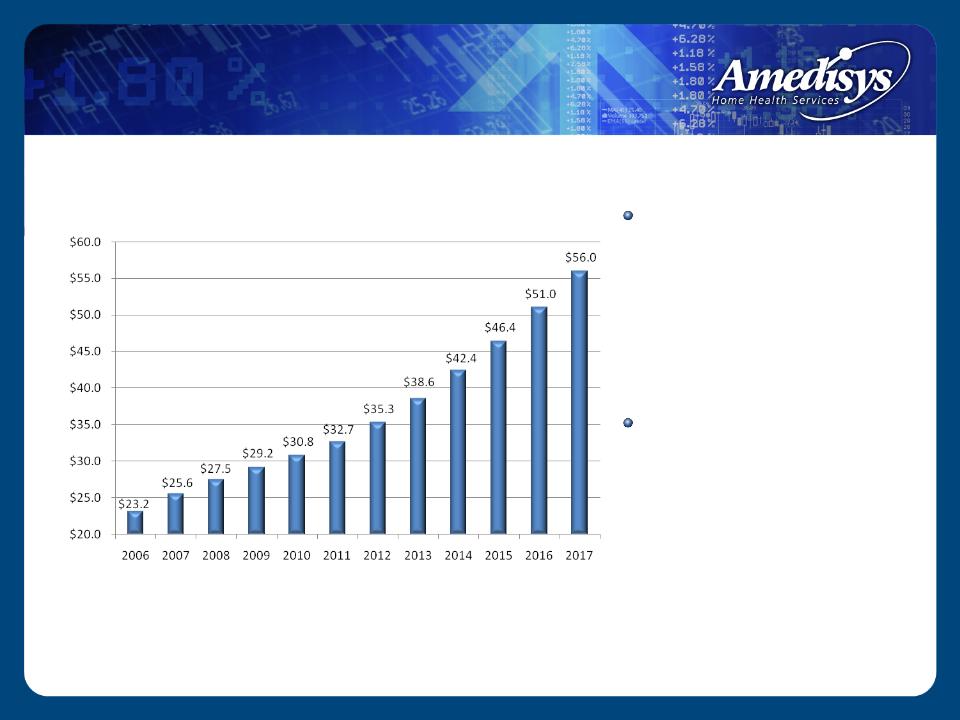
Medicare Revenue Market Size
2006: Medicare spending
for home health reached
$14 billion and hospice
was $9.2 billion, giving a
combined total of $23.2
billion
for home health reached
$14 billion and hospice
was $9.2 billion, giving a
combined total of $23.2
billion
2017: Home health will
contribute $36 billion and
hospice $20 billion of the
projected $56 billion
contribute $36 billion and
hospice $20 billion of the
projected $56 billion
Source: CBO's March 2008 Baseline: MEDICARE
MEDICARE Home Health and Hospice Revenue
$ in billions
11
12
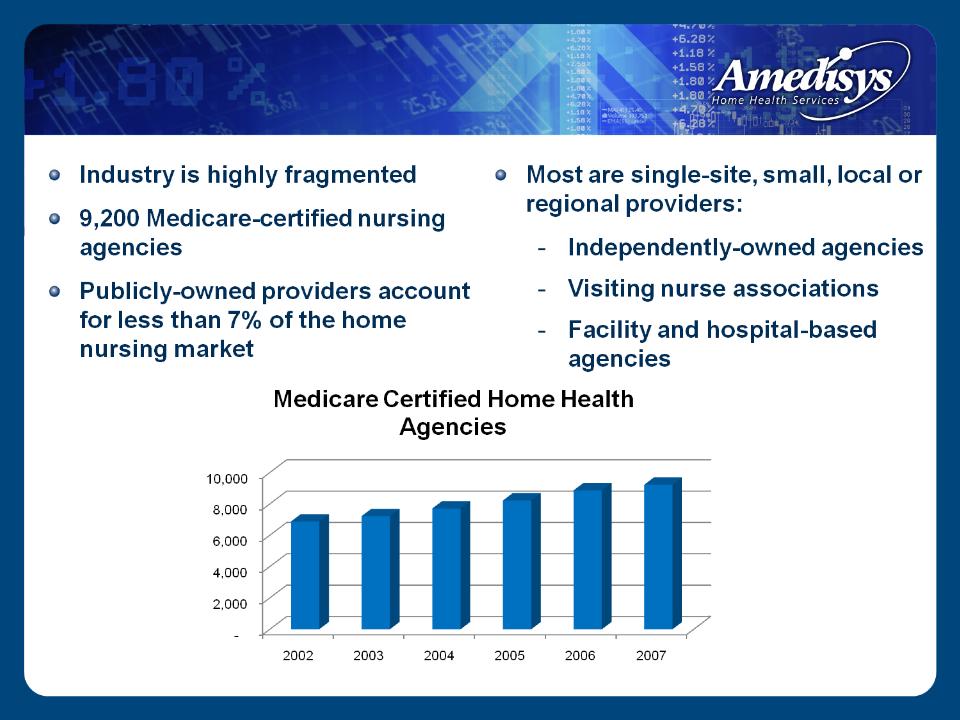
Home Nursing Market
Source: CMS Oscar data books and Medpac reports
12

13
Industry Growth Drivers
Trend from inpatient to home-based care:
‒ Patient preference
‒ Payor incentives
‒ Technology advancements
Demographics - - aging population
‒ 8,000 Americans will become Medicare eligible each
day beginning in 2011 and by 2030, 57.8 million
baby boomers will be eligible for Medicare benefits1
day beginning in 2011 and by 2030, 57.8 million
baby boomers will be eligible for Medicare benefits1
Increased prevalence of chronic and co-morbid
conditions
conditions
1Source: United States Census Bureau
13

14
Internal Growth
Internal revenue growth of 30% for Q4 2008 and 28% for the
full year of 2008
full year of 2008
Internal growth driven by:
‒ Overall industry growth
‒ Increase in episodic-based admissions
• Focus on start-ups
‒ Increase in episodic-based recertification's
• Higher acuity levels and co-morbidities, requiring
more intensive services
more intensive services
‒ Increase in episodic-based revenue per episode
• Development of therapy intensive specialty
programs
programs
• Focus of the new Medicare payment system
14
15
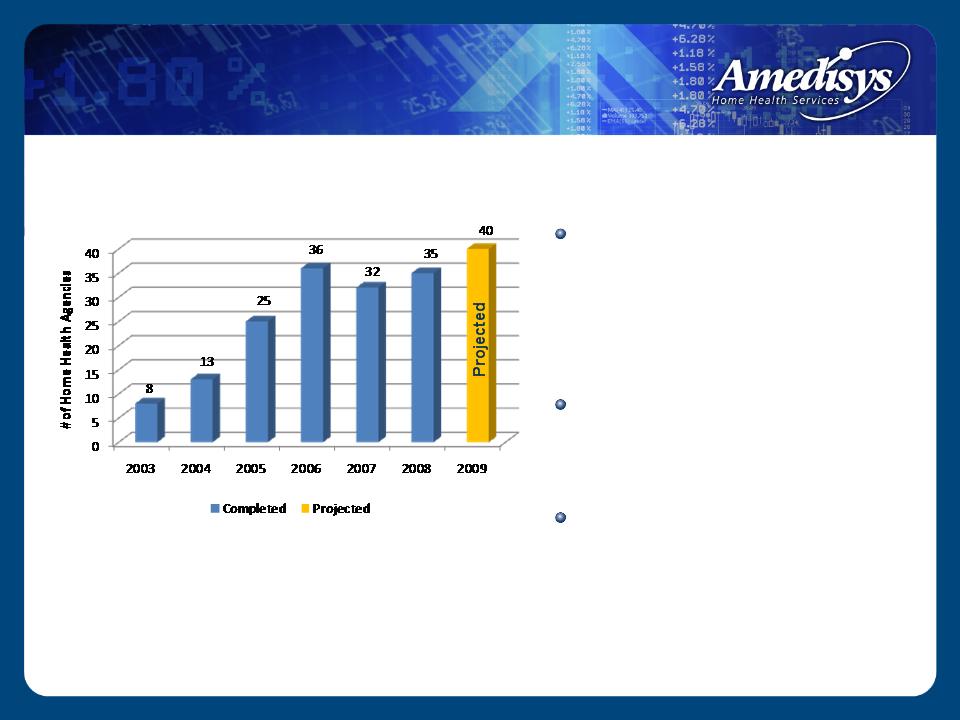
Start-Up Strategy
Home health start-ups
typically generate $1.5 - $2.0
million in run-rate revenue
by the end of their second
year of operations
typically generate $1.5 - $2.0
million in run-rate revenue
by the end of their second
year of operations
~ 18 months to recoup the
$250,000 - - $350,000
investment
$250,000 - - $350,000
investment
40 home health and 5
hospice start-ups projected
in 2009
hospice start-ups projected
in 2009
* Reported numbers are for home health start-ups
Yearly Start-Ups
15

16
Acquisition Strategy
92
17
49
145
16

17
High Quality Health Care
Source: OCS Corporate Comparative Report
Period: 1/1/08 - 9/30/08
17
18
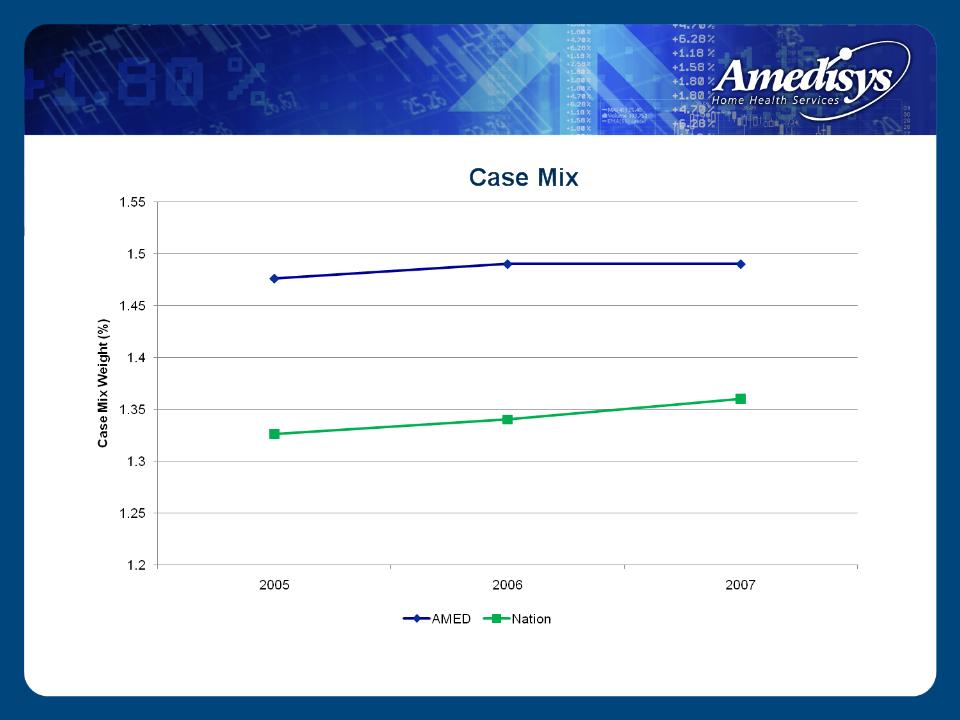
Higher Acuity Level Patients
Source: OCS BBI Reporter Corporate Comparative Report Date Range: 2005-2007 |
18
19
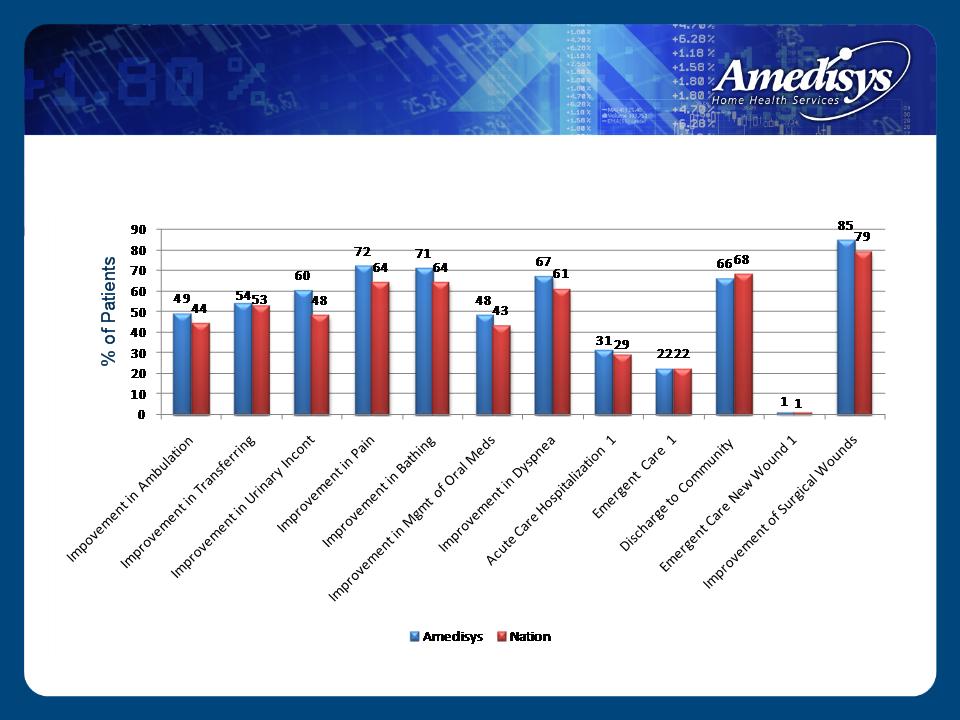
High Quality Outcomes
Outcomes - - June 2008
Amedisys vs. Nation
1 Lower % is better
Source: www.medicare.gov
19

20
High Quality Health Care
Care Management
‒ 13 disease management programs
‒ 70 clinical tracks
Specialty Division
‒ Balanced For Life first program in
division
division
‒ Serves higher acuity patients
‒ Rolled out to 178 locations through 2008
20
21
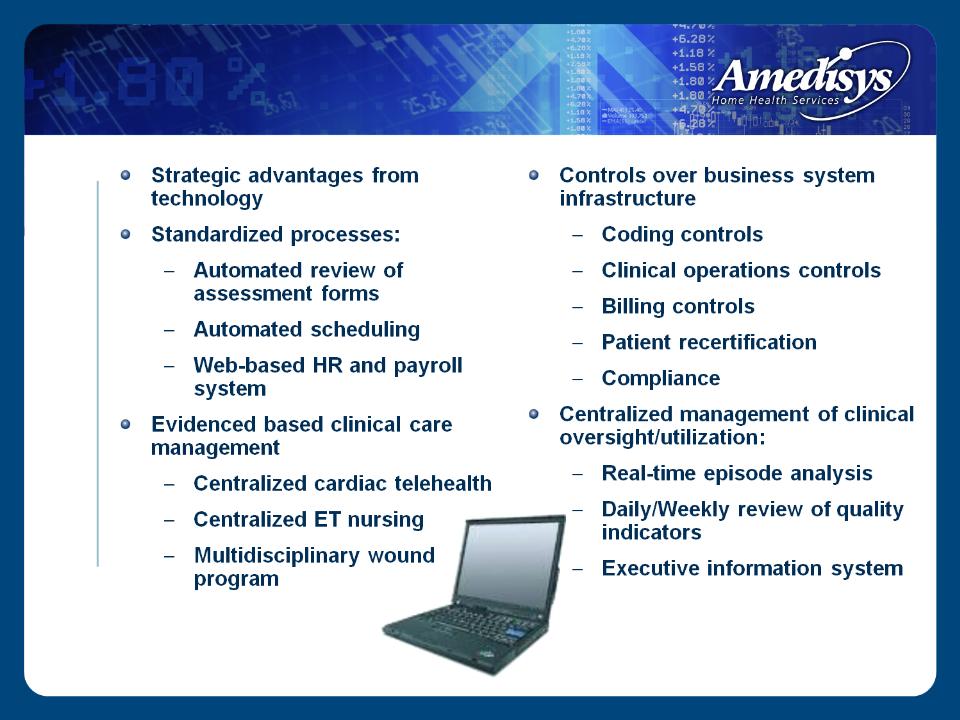
Investments in Technology
21

22
Comprehensive Compliance Program
Local Level
• Point of care system
enhances clinical
documentation accuracy
with real-time assessment
input
enhances clinical
documentation accuracy
with real-time assessment
input
• Clinical nurse review of
assessments
assessments
• Physician review/approval
• Standardized care plans
• Weekly case conferences
• Monthly audits
• End of episode case review
Regional Level
Corporate Level
• Unannounced
compliance & billing
audits
compliance & billing
audits
• Regional directors
monitor compliance
status and resolve errors
monitor compliance
status and resolve errors
• Real-time monitoring
capability of local level
activity via Point of Care
system
capability of local level
activity via Point of Care
system
• Compliance training for all
employees
employees
• Compliance concerns hotline
• Compliance review of metric
variances
variances
• Compliance manager site
visits
visits
• Semi-annual
clinical/compliance reviews
clinical/compliance reviews
• Annual Sarbanes-Oxley audit
• Annual billing competency
testing
testing
http://www.amedisys.com/pdf/Compliance3/Compliance_Controls.pdf
22

23
Medicare Reimbursement
Implemented in October 2000
‒ Base payment for 60-day episode of care
‒ Adjusted for patient acuity and market factors
2008 CMS issued reimbursement changes
‒ Better alignment of reimbursement with patient needs
‒ Expands HHRG’s from 80 to 153
‒ More integrated reimbursement for therapy
‒ Allocation of more dollars to later episodes
‒ Benefits agencies with a greater mix of higher-acuity patients
2009 Changes
‒ Market basket increase of approximately 3%
‒ Increase offset by 2.75% case mix creep adjustment
‒ No rural add-on payment
23

24
Strong revenue growth
EPS growth of greater than 20% for six consecutive years
Stable margins
Low leverage
High cash flow
Financial Highlights
24

25
Financial Highlights
25

26
Summary Financial Results
($ in millions, except per share data) | 2006 | 2007 | 2008 |
Net revenue | $541.1 | $697.9 | $1,187.4 |
Period-over-period growth | 41.8% | 29.0% | 70.1% |
Gross margin | 288.9 | 368.9 | 624.8 |
Margin | 53.4% | 52.9% | 52.6% |
CFFO | 43.1 | 93.1 | 150.7 |
Adjusted EBITDA1 | 75.7 | 109.8 | 181.4 |
Margin | 14.0% | 15.7% | 15.3% |
Adjusted fully-diluted EPS2 | $1.72 | $2.32 | $3.31 |
1 Adjusted EBITDA is defined as net income before provision for income taxes, net interest expense, and depreciation and amortization plus certain TLC integration costs and less the
Alliance gain. Adjusted EBITDA should not be considered as an alternative to, or more meaningful than, income before income taxes, cash flow from operating activities, or other
traditional indicators of operating performance. This calculation of Adjusted EBITDA may not be comparable to a similarly titled measure reported by other companies, since not all
companies calculate this non-GAAP financial measure in the same manner.
2Adjusted diluted earnings per share is defined as diluted earnings per share plus the earnings per share effect of certain TLC acquisition costs and less the earnings per share effect of
the Alliance gain. Adjusted diluted earnings per share should not be considered as an alternative to, or more meaningful than, income before income taxes, cash flow from operating
activities, or other traditional indicators of operating performance. This calculation of Adjusted diluted earnings per share may not be comparable to a similarly titled measure reported by
other companies, since not all companies calculate this non-GAAP financial measure in the same manner.
26

27
2006 | 2007 | 2008 | |
Agencies at period end | 275 | 354 | 528 |
Period-over-period growth | 24.4% | 28.7% | 49.2% |
Total visits | 3,437,881 | 4,302,830 | 7,004,200 |
Period-over-period growth | 45.4% | 25.2% | 62.8% |
Episodic-based admissions | 108,140 | 129,649 | 199,371 |
Period-over-period growth | 32.7% | 19.9% | 53.8% |
Episodic-based completed episodes | 172,930 | 219,855 | 353,076 |
Period-over-period growth | 42.9% | 27.1% | 60.6% |
Episodic-based revenue per episode | $2,634 | $2,660 | $2,854 |
Period-over-period growth | 2.6% | 1.0% | 7.3% |
Summary Performance Results
27

28
Dec. 31, 2007 | Mar. 31, 2008 | Dec. 31, 2008 | |
Assets | |||
Cash | $ 56.2 | $ 25.2 | $ 2.8 |
Accounts Receivable, Net | 96.3 | 144.1 | 175.7 |
Property and Equipment | 68.3 | 75.4 | 79.3 |
Goodwill | 332.5 | 734.2 | 733.9 |
Other | 33.8 | 58.8 | 78.5 |
Total Assets | $ 587.1 | $ 1,037.7 | $ 1,070.2 |
Liabilities and Stockholders’ Equity | |||
Debt | $ 24.0 | $ 417.4 | $ 328.6 |
All Other Liabilities | 116.1 | 151.9 | 180.3 |
Stockholders’ Equity | 447.0 | 468.4 | 561.3 |
Total Liabilities and Stockholders’ Equity | $ 587.1 | $ 1,037.7 | $ 1,070.2 |
Leverage Ratio | 0.2x | 2.4x | 1.6x |
Summary Balance Sheet
($ in millions)
28
29
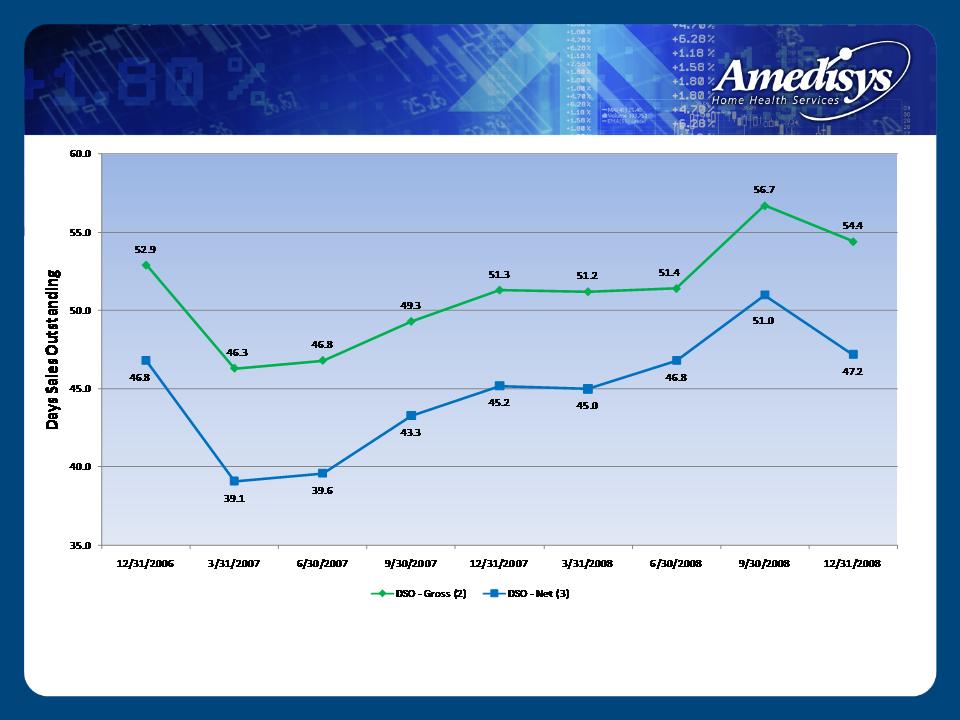
Days Revenue Outstanding
(DSO)
(DSO)
(1) For the three-month period ended March 31, 2008, our calculation of days revenue excludes the patient accounts receivable assumed in the TLC Health Care Services, Inc. (“TLC”) and Family Home
Health Care, Inc. and Comprehensive Home Healthcare Services, Inc. (“HMA”) acquisitions at March 31, 2008 by our average daily net patient revenue, excluding the results of TLC and HMA for the three-
month period ended March 31, 2008.
Health Care, Inc. and Comprehensive Home Healthcare Services, Inc. (“HMA”) acquisitions at March 31, 2008 by our average daily net patient revenue, excluding the results of TLC and HMA for the three-
month period ended March 31, 2008.
(2) Our calculation of days revenue outstanding (gross) is derived by dividing our period ending gross patient accounts receivable (defined as the summation of our Medicare patient accounts receivable, net of
estimated revenue adjustments and our other outstanding patients accounts receivable, before considering the allowance for doubtful accounts) at December 31, 2008, 2007 and 2006 by our average daily
net patient revenue for the three-month periods ended December 31, 2008, 2007 and 2006, respectively.
(3) ) Our calculation of days revenue outstanding (net) is derived by dividing our ending net patient accounts receivable (i.e. net of estimated revenue adjustments and allowance for doubtful accounts) at
December 31, 2008, 2007 and 2006 by our average daily net patient revenue for the three-month periods ended December 31, 2008, 2007 and 2006, respectively.
December 31, 2008, 2007 and 2006 by our average daily net patient revenue for the three-month periods ended December 31, 2008, 2007 and 2006, respectively.
(1)
29

30
Accounts Receivable
($ in thousands) | December 31, 2007 | December 31, 2008 | |
Medicare | $ 78,502 | $ 136,869 | |
Estimated revenue adjustments | (3,622) | (7,220) | |
Medicare patient accounts receivable, net | 74,880 | 129,649 | |
Non-Medicare | 34,397 | 73,101 | |
Allowance for doubtful accounts | (12,968) | (27,052) | |
Non-Medicare patient accounts receivable, net | 21,429 | 46,049 | |
Patient accounts receivable, net | $ 96,309 | $ 175,698 | |
Note: | |||
On average we collect over 99% of our Medicare revenue | |||
On average we collect approximately 87% of our non-Medicare revenue | |||
Combined we collect approximately 97.5% of all revenue | |||
($ in millions) | December 31, 2007 | December 31, 2008 | |
Medicare ERA + non Medicare ADA | $ 17.1 | $ 30.4 | |
% of Revenue | 2.5% | 2.6% | |
30

31
Liquidity
Available line of credit (LOC): 12/31/08 = $160m
2009 Estimated CFFO - - Cap Ex - Required Debt Pay = $140m
31

32
Summary
Strong revenue growth
EPS growth of greater than 20% for six consecutive
years
years
Stable margins
Low leverage
High cash flow
32

33
Guidance1
1Guidance excludes the effects of future acquisitions, if they are made.
2Provided as of the date of our Form 8-K filed with the Securities and Exchange Commission on January 6, 2009 and reaffirmed on February 17, 2009
earnings call.
earnings call.
Calendar Year 20092
Net revenue: $1.425 - $1.475 billion
EPS: $4.10 - $4.30
Diluted shares: 27.5 million
33

34
Contact Information
Kevin B. LeBlanc
Director of Investor Relations
Amedisys, Inc.
5959 S. Sherwood Forest Boulevard
Baton Rouge, LA 70816
Office - - 225.292.2031
Fax - 225.295.9653
kleblanc@amedisys.com
We encourage everyone to visit the Investors section on our website at www.amedisys.com, where we
have posted additional important information such as press releases, profiles concerning our business and
clinical operations and control processes, and SEC filings. We intend to use our website to expedite public
access to time-critical information regarding the Company in advance of or in lieu of distributing a press
release or a filing with the SEC disclosing the same information.
34