Exhibit 99.1

Amedisys, Inc.
NASDAQ: AMED
May 2005

Forward Looking Statements
Statements contained in this presentation which are not historical facts are forward-looking statements. These forward-looking statements and all other statements that may be contained in this presentation that are not historical facts are subject to a number of risks and uncertainties, and actual results may differ materially than those forecasted. Such forward-looking statements are estimates reflecting the best judgment of Amedisys, Inc. management based upon currently available information. Certain factors which could affect the accuracy of such forward-looking statements are identified in the public filings made by Amedisys, Inc. with the Securities and Exchange Commission, and forward-looking statements contained herein, or other public statements of Amedisys, Inc. or its management should be considered in light of those factors.
1
Investment Highlights
Large, growing, and fragmented industry
Focus on Medicare home nursing
Strong internal growth
Demonstrated ability to identify and integrate acquisitions
Proven operating model
Experienced management team
2
Management Team
William F. Borne, Chairman and Chief Executive Officer
CEO since founding the Company in 1982
Registered nurse, extensive hospital administrative and clinical experience
Larry R. Graham, President and Chief Operating Officer
Joined Amedisys in 1996; COO since 1999; President in 2004
General Health Systems; Arthur Andersen
Gregory H. Browne, Chief Financial Officer
Joined Amedisys as CFO in 2002
CEO for PeopleWorks, Ramsay Health Care, Ramsay-HMO
3
Corporate Overview
Leading provider of home nursing to Medicare beneficiaries
Medicare accounts for > 90.0% of revenue
127 locations in the southern United States
Services include:
Skilled nursing
Physical, occupational, and speech therapy
Specialized disease management programs
4
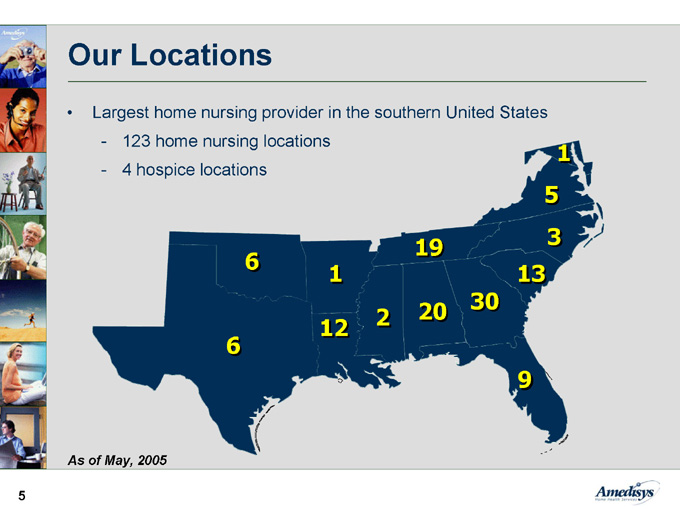
Our Locations
Largest home nursing provider in the southern United States
123 home nursing locations
4 hospice locations
1
5
3
19
6
13
1
30
2
20
12
6
9
As of May, 2005
5
Our Strategy
Focus on Medicare-eligible patients
Prioritize internal growth
Develop and deploy specialized nursing programs
Leverage cost-efficient operating structure
Grow through strategic acquisitions
6
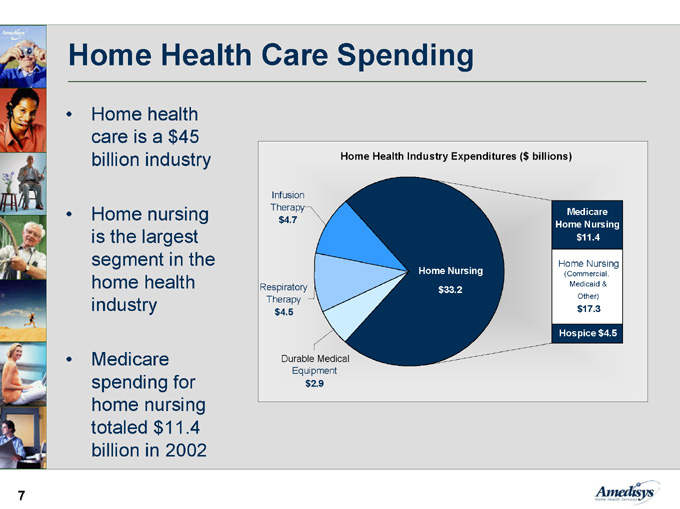
Home Health Care Spending
Home health care is a $45 billion industry
Home nursing is the largest segment in the home health industry
Medicare spending for home nursing totaled $11.4 billion in 2002
Home Health Industry Expenditures ($ billions)
Infusion
Therapy
Medicare
Home Nursing
$4.7
$11.4
Home Nursing
Home Nursing
(Commercial,
Respiratory
$33.2
Medicaid &
Therapy
Other)
$4.5
$17.3
Hospice $4.5
Durable Medical
Equipment
$2.9
7

Home Nursing Market
Industry is highly fragmented
7,000 Medicare-certified nursing agencies
Most are single site or small regional providers:
Independently-owned agencies
Visiting nurse associations
Facility- and hospital-based agencies
Publicly-owned providers account for less than 5.0% of the home nursing market
8
Industry Growth Drivers
Trend from inpatient to home-based care:
Patient preference
Payor incentives
Technology advancements
Demographics – aging population
Increased prevalence of chronic and co-morbid conditions
9
Internal Growth
Strong recent internal growth in Medicare admissions
- Approximately 21% for 1Q 2005
Internal growth being driven by:
Overall industry growth
Expanded and more effective sales force
Comprehensive range of clinical programs
Enhanced referral source education efforts
Increased focus on start-ups
10
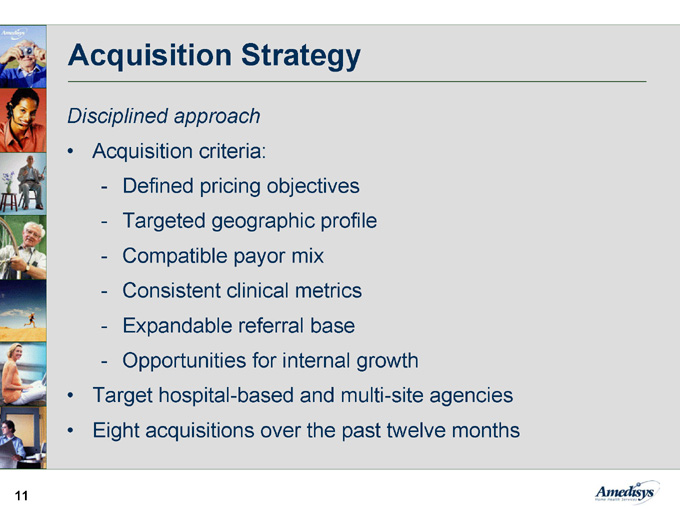
Acquisition Strategy
Disciplined approach
Acquisition criteria:
Defined pricing objectives
Targeted geographic profile
Compatible payor mix
Consistent clinical metrics
Expandable referral base
Opportunities for internal growth
Target hospital-based and multi-site agencies
Eight acquisitions over the past twelve months
11
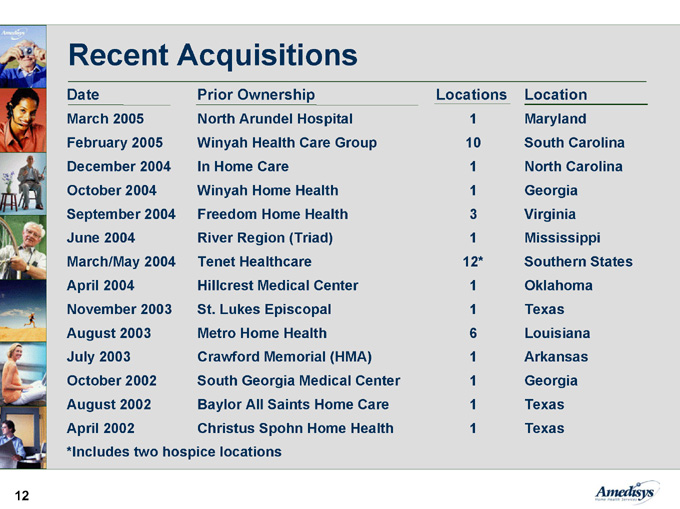
Recent Acquisitions
Date
Prior Ownership
Locations
Location
March 2005
North Arundel Hospital
1
Maryland
Winyah Health Care Group
10
South Carolina February 2005 In Home Care 1 North Carolina December 2004
October 2004
Winyah Home Health
1
Georgia
September 2004
Freedom Home Health 3 Virginia June 2004 River Region (Triad) 1 Mississippi
March/May 2004
Tenet Healthcare 12*
Southern States
April 2004
Hillcrest Medical Center 1 Oklahoma November 2003 St. Lukes Episcopal 1 Texas August 2003 Metro Home Health 6
Louisiana
July 2003 Crawford Memorial (HMA) 1 Arkansas October 2002 South Georgia Medical Center 1 Georgia August 2002
Baylor All Saints Home Care 1 Texas April 2002 Christus Spohn Home Health 1 Texas
*Includes two hospice locations
12
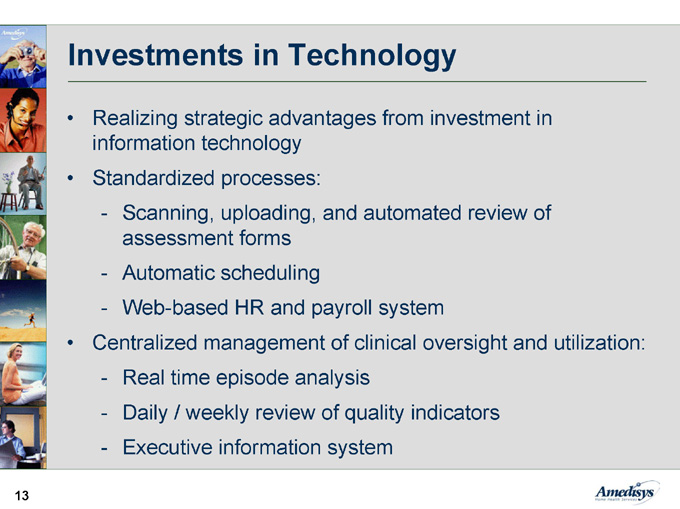
Investments in Technology
Realizing strategic advantages from investment in information technology
Standardized processes:
Scanning, uploading, and automated review of assessment forms
Automatic scheduling
Web-based HR and payroll system
Centralized management of clinical oversight and utilization:
Real time episode analysis
Daily / weekly review of quality indicators
Executive information system
13
Medicare Prospective Payment System
Implemented in October 2000
Base payment for 60-day episode of care
Adjusted for patient acuity and market factors
Reviewed and updated annually
Encourages efficient delivery of care
14
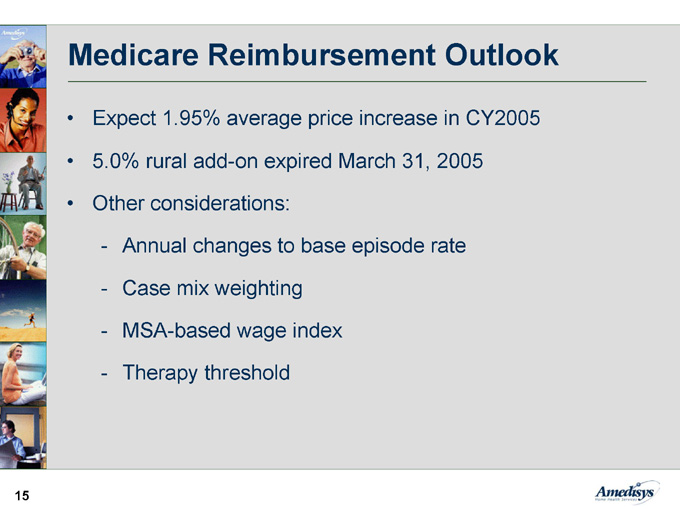
Medicare Reimbursement Outlook
Expect 1.95% average price increase in CY2005
5.0% rural add-on expired March 31, 2005
Other considerations:
Annual changes to base episode rate
Case mix weighting
MSA-based wage index
Therapy threshold
15
Financial Highlights
Increasing revenue
Expanded margins
EPS growth
Solid balance sheet
Strong cash flow
16
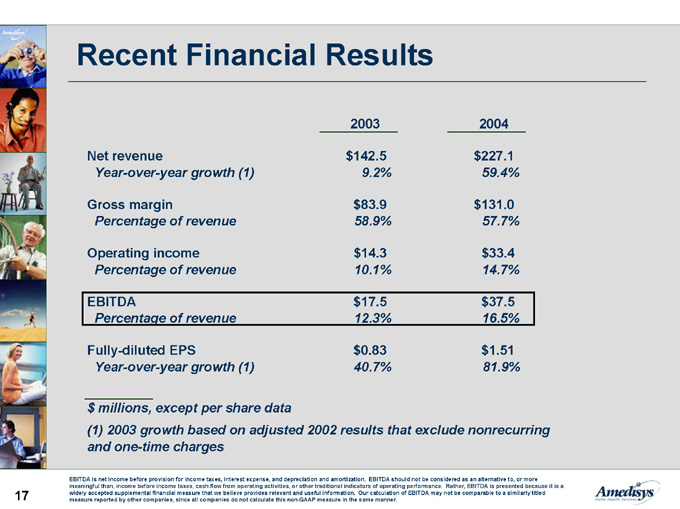
Recent Financial Results
2003 2004 $142.5 Net revenue
$227.1 9.2% Year-over-year growth (1) 59.4% $83.9 Gross margin $131.0 58.9% Percentage of revenue 57.7% $14.3
Operating income $33.4 10.1% Percentage of revenue 14.7%
$37.5
$17.5
EBITDA
12.3%
Percentage of revenue
16.5%
$0.83
Fully-diluted EPS
$1.51
40.7%
Year-over-year growth (1)
81.9%
$ millions, except per share data
(1) 2003 growth based on adjusted 2002 results that exclude nonrecurring
and one-time charges
EBITDA is net income before provision for income taxes, interest expense, and depreciation and amortization. EBITDA should not be considered as an alternative to, or more meaningful than, income before income taxes, cash flow from operating activities, or other traditional indicators of operating performance. Rather, EBITDA is presented because it is a widely accepted supplemental financial measure that we believe provides relevant and useful information. Our calculation of EBITDA may not be comparable to a similarly titled measure reported by other companies, since all companies do not calculate this non-GAAP measure in the same manner.
17
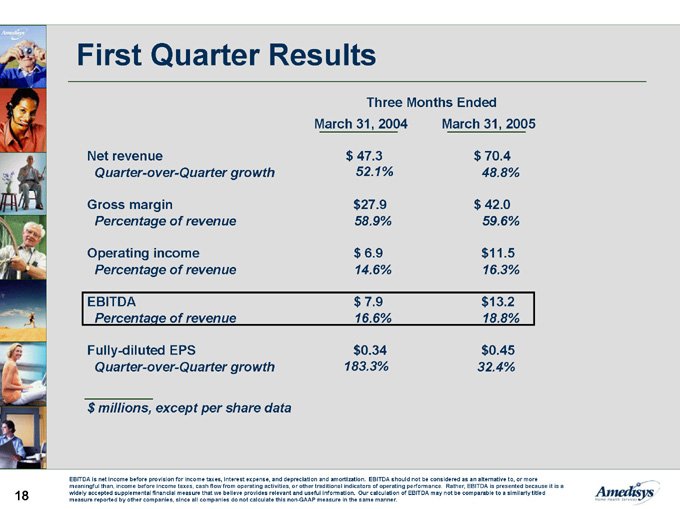
First Quarter Results
Three Months Ended
March 31, 2004
March 31, 2005
$ 47.3 Net revenue $ 70.4 48.8%
Quarter-over-Quarter growth
52.1% $27.9 Gross margin $ 42.0 58.9% Percentage of revenue 59.6% $ 6.9 Operating income
$11.5
14.6%
Percentage of revenue
16.3%
$13.2
$ 7.9
EBITDA
16.6%
Percentage of revenue
18.8%
$0.34
Fully-diluted EPS
$0.45
32.4%
Quarter-over-Quarter growth
183.3%
$ millions, except per share data
EBITDA is net income before provision for income taxes, interest expense, and depreciation and amortization. EBITDA should not be considered as an alternative to, or more meaningful than, income before income taxes, cash flow from operating activities, or other traditional indicators of operating performance. Rather, EBITDA is presented because it is a widely accepted supplemental financial measure that we believe provides relevant and useful information. Our calculation of EBITDA may not be comparable to a similarly titled measure reported by other companies, since all companies do not calculate this non-GAAP measure in the same manner.
18
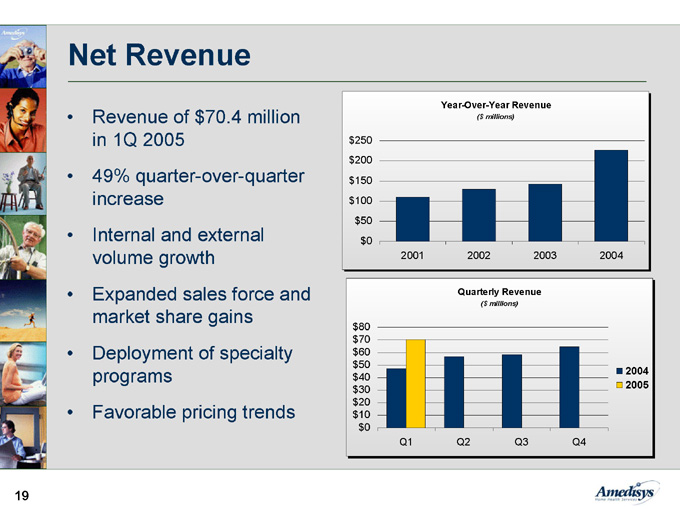
Net Revenue
Revenue of $70.4 million in 1Q 2005
49% quarter-over-quarter increase
Internal and external volume growth
Expanded sales force and market share gains
Deployment of specialty programs
Favorable pricing trends
Year-Over-Year Revenue
($ millions)
$250 $200 $150 $100 $50 $0 2003 2002 2001 2004
Quarterly Revenue
($ millions)
$80 $70 $60 $50 $40 2004
2005
$30
$20
$10
$0
Q3
Q4
Q1
Q2
19
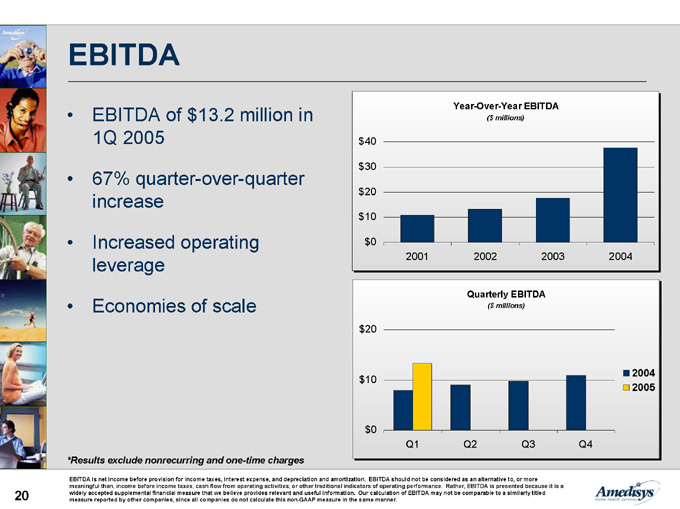
EBITDA
Year-Over-Year EBITDA
EBITDA of $13.2 million in 1Q 2005 67% quarter-over-quarter increase
Increased operating leverage
Economies of scale
($ millions)
$40 $30 $20 $10 $0 2004 2003 2002 2001
Quarterly EBITDA
($ millions)
$20 2004 $10 2005 $0 Q4 Q3 Q2 Q1
*Results exclude nonrecurring and one-time charges
EBITDA is net income before provision for income taxes, interest expense, and depreciation and amortization. EBITDA should not be considered as an alternative to, or more meaningful than, income before income taxes, cash flow from operating activities, or other traditional indicators of operating performance. Rather, EBITDA is presented because it is a widely accepted supplemental financial measure that we believe provides relevant and useful information. Our calculation of EBITDA may not be comparable to a similarly titled measure reported by other companies, since all companies do not calculate this non-GAAP measure in the same manner.
20
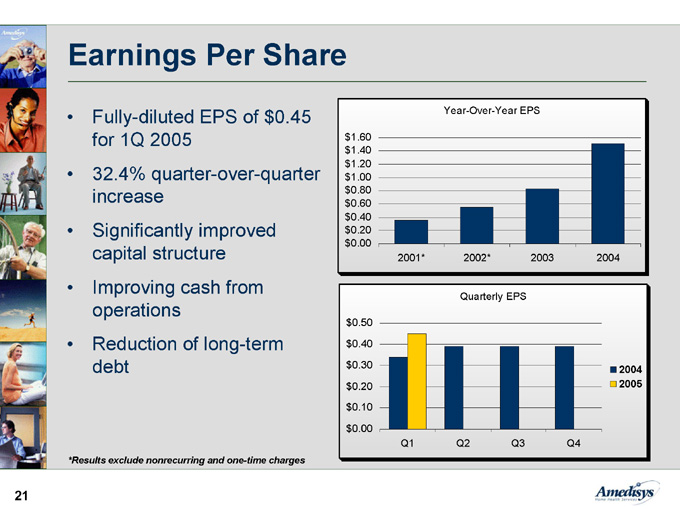
Earnings Per Share
Fully-diluted EPS of $0.45 for 1Q 2005
32.4% quarter-over-quarter increase
Significantly improved capital structure
Improving cash from operations
Reduction of long-term debt
Year-Over-Year EPS
$1.60 $1.40 $1.20 $1.00 $0.80 $0.60 $0.40 $0.20 $0.00 2003 2002* 2001* 2004
Quarterly EPS
$0.50 $0.40 $0.30 2004 $0.20 2005 $0.10 $0.00 Q3 Q2 Q1 Q4
*Results exclude nonrecurring and one-time charges
21
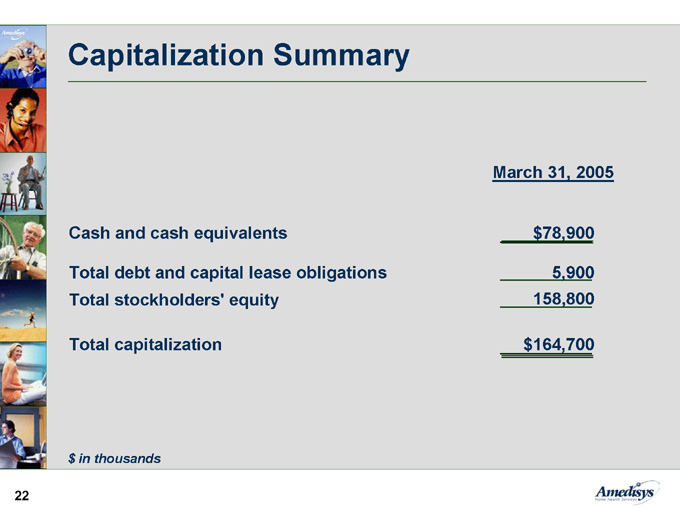
Capitalization Summary
March 31, 2005
Cash and cash equivalents
$78,900
Total debt and capital lease obligations
5,900
Total stockholders’ equity
158,800
Total capitalization
$164,700
$ in thousands
22
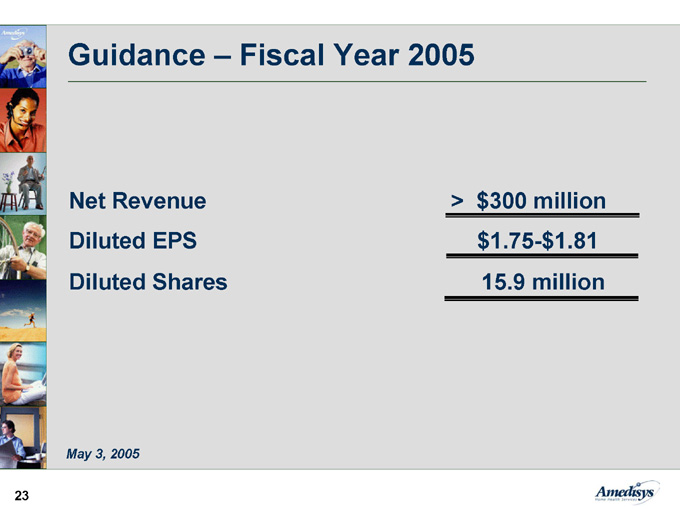
Guidance – Fiscal Year 2005
> $300 million
Net Revenue
$1.75-$1.81
Diluted EPS
15.9 million
Diluted Shares
May 3, 2005
23

Investment Highlights
Large, growing, and fragmented industry
Focus on Medicare home nursing
Strong internal growth
Demonstrated ability to identify and integrate acquisitions
Proven operating model
Experienced management team
24