 Amedisys, Inc. www.amedisys.com NASDAQ: AMED September 2007 Exhibit 99.1 |
 1 Statements contained in this presentation which are not historical facts are forward-looking statements. These forward-looking statements and all other statements that may be contained in this presentation that are not historical facts are subject to a number of risks and uncertainties, and actual results may differ materially from those forecasted. Such forward-looking statements are estimates reflecting the best judgment of Amedisys, Inc. management based upon currently available information. Certain factors which could affect the accuracy of such forward-looking statements are identified in the public filings made by Amedisys, Inc. with the Securities and Exchange Commission, and forward-looking statements contained herein, or other public statements of Amedisys, Inc. or its management should be considered in light of those factors. Forward Looking Statements |
 2 Investment Highlights • Large, growing and fragmented industry • Focus on home nursing and related services to Medicare population • Strong internal growth and cash flow with low recurring cap ex • Proven operating model supported by sophisticated technology system • Demonstrated ability to identify and integrate acquisitions • Substantial liquidity and balance sheet capacity to fund external growth • Extensive delivery platform ideally positioned for Medicare care management initiatives • Experienced management team |
 3 Management Team • William F. Borne - Chairman and Chief Executive Officer - CEO since founding the Company in 1982 - Registered nurse, extensive hospital administrative and clinical experience • Larry R. Graham - President and Chief Operating Officer - Joined Amedisys in 1996; COO since 1999; President since 2004 - General Health Systems - Arthur Andersen • Dale E. Redman, CPA –Chief Financial Officer - Joined Amedisys in February 2007 - CFO of United Companies - Ernst & Young |
 4 Corporate Overview • Leading provider of home nursing services • 313 1 locations primarily in United States • Services include skilled nursing and therapy • Medicare and other episodic based revenue accounts for approximately 94% 2 of net service revenue • Hospice care accounts for approximately 6% 2 of net service revenue 1) Both home health and hospice; as of June 30, 2007 2) For the six-month period ended June 30, 2007 |
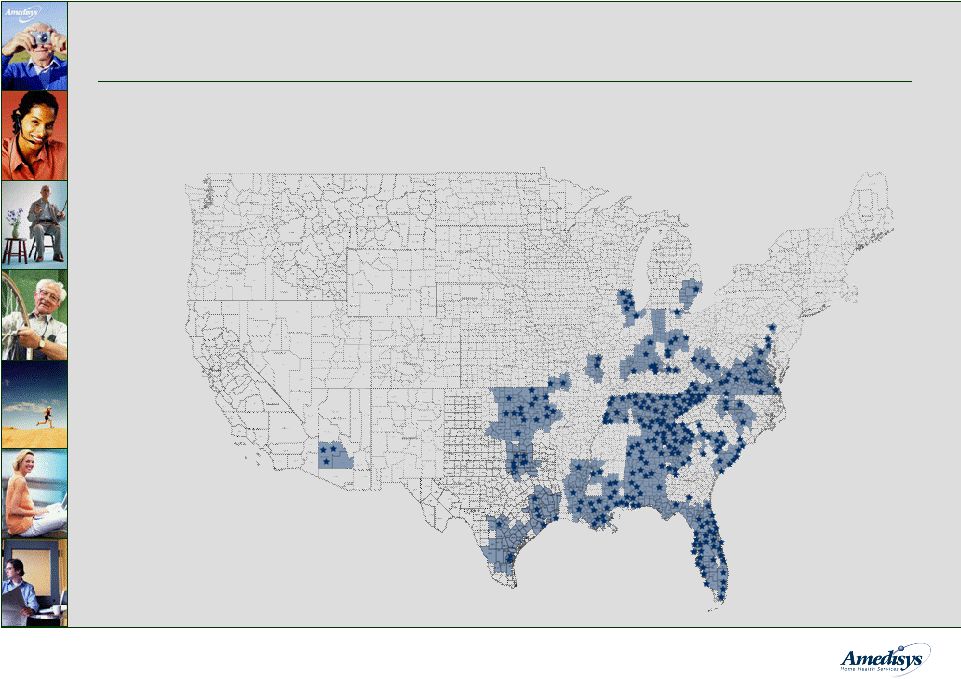 5 Our Locations 1 - 296 home nursing locations (shown) - 17 hospice locations 1) As of June 30, 2007 • Largest home nursing provider in the Southern and Southeastern United States |
 6 Our Strategy • Focus on Medicare-eligible patients • Develop and deploy specialized nursing programs • Expand care management capabilities • Prioritize internal growth • Select, acquire and integrate quality home care agencies • Leverage cost-efficient operating platform |
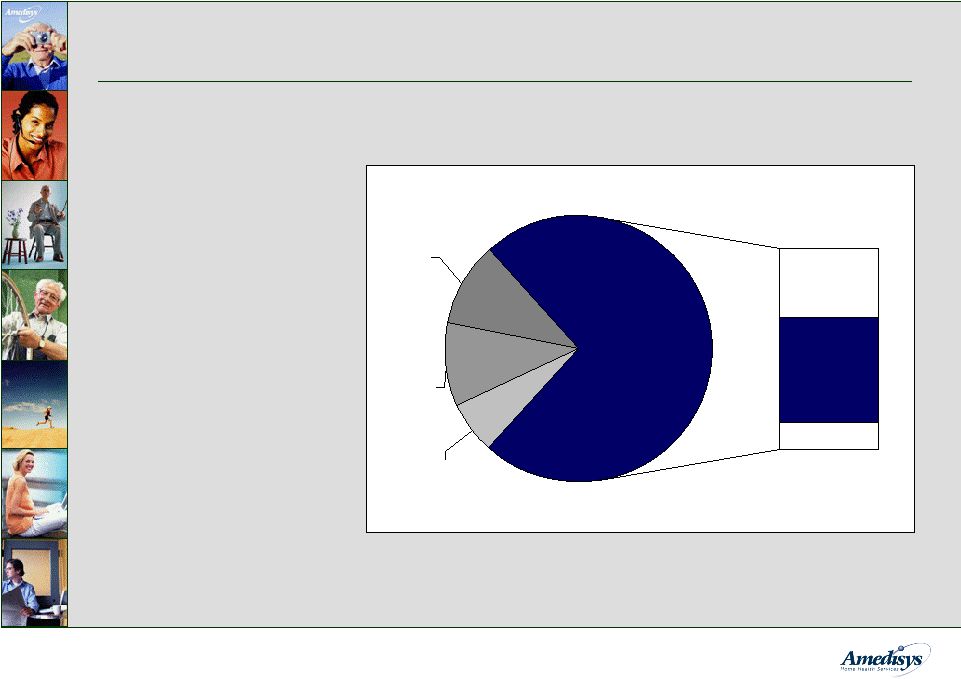 7 • Home health care is a $62.8 billion industry • Home nursing is the largest segment in the home health industry • Medicare spending for home nursing totaled $13.1 billion in 2005 Home Health Care Spending Home Health Industry Expenditures ($ billions) Medicare Home Nursing $13.1 Home Nursing (Commercial, Medicaid & Other) $23.3 Home Nursing $46.1 Infusion Therapy $5.5 Durable Medical Equipment $2.8 Respiratory Therapy $8.4 Hospice $9.7 Source: Company Reports, CMS and CIBC World Markets Corp. estimates for 2005 |
 8 Home Nursing Market • Industry is highly fragmented • 8,500 Medicare-certified nursing agencies • Most are single-site, small local or regional providers: - Independently-owned agencies - Visiting nurse associations - Facility and hospital-based agencies • Publicly-owned providers account for less than 7% of the home nursing market |
 9 Industry Growth Drivers • Trend from inpatient to home-based care: - Patient preference - Payor incentives - Technology advancements • Demographics – aging population • Increased prevalence of chronic and co-morbid conditions |
 10 Internal Growth - Overall industry growth - Expanded and more effective sales force - Comprehensive range of clinical programs - Enhanced referral source education efforts - Increased focus on start-ups • Strong internal growth in episodic-based admissions - Approximately 13% for Q2 2007 and 14% year-to-date • Internal growth driven by: |
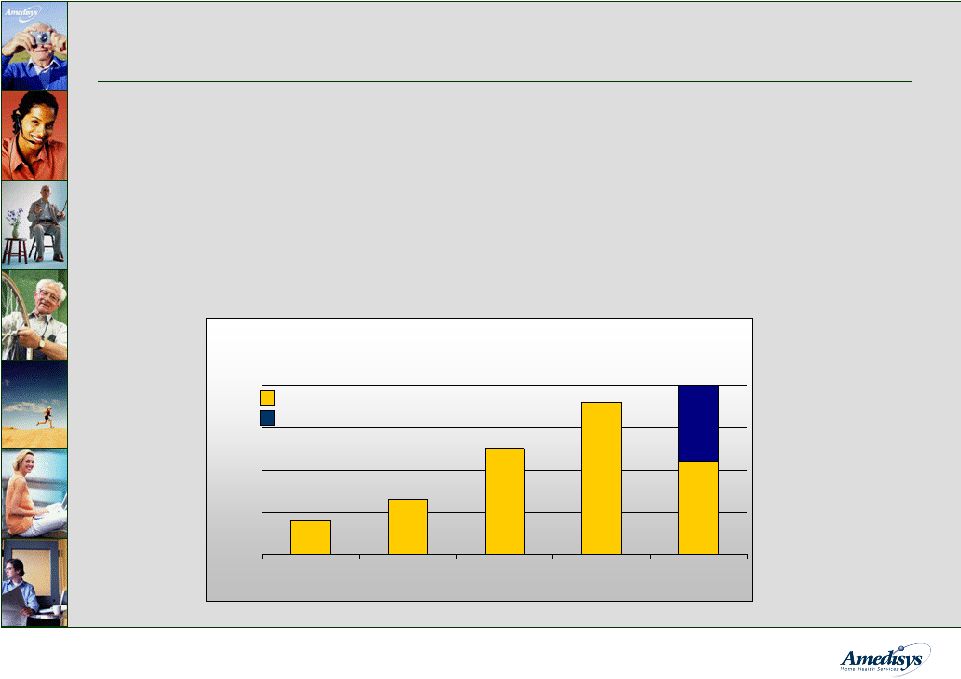 11 Start-Up Strategy • Start-ups typically generate $1.5 - $2.0 million in run-rate revenue by the end of their second year of operations • ~ 18 months to recoup the $250,000 - $350,000 investment • 22 home health start-ups completed through June 30, 2007 Yearly Start-Ups 40 25 13 8 36 0 10 20 30 40 2003 2004 2005 2006 2007 22 * Reported numbers are for home health start-ups Completed Projected |
 12 Acquisition Strategy Disciplined approach • Acquisition criteria: - Defined pricing objectives - Targeted geographic profile - Compatible payor mix - Consistent clinical metrics - Expandable referral base - Opportunities for internal growth • Target hospital-based and multi-site agencies • Eleven acquisitions over the last twelve months ended 6/30/2007; 23 agencies representing $49 million in revenues |
 13 Investments in Technology • Strategic advantages from technology • Standardized processes: - Automated review of assessment forms - Automatic scheduling - Web-based HR and payroll system • Centralized management of clinical oversight/utilization: - Real-time episode analysis - Daily/weekly review of quality indicators - Executive information system • Point of care roll-out currently underway: - Rolled out 235 sites as of June 30, 2007; planned to be fully deployed by year-end - Expect approximately $1.5 million in quarterly savings when fully deployed - Initial cap ex investment of $9 - $10 million |
 14 Comprehensive Compliance Program Local Level • Clinical nurse review of assessments • Standardized care plans • Physician review/approval • Weekly case conferences • Monthly audits • End of episode case review • Point-of-care system enhances clinical documentation accuracy with real-time assessment input Regional Level Corporate Level • Unannounced compliance & billing audits • Regional directors monitor compliance status and resolve errors • Real-time monitoring capability of local level activity via point-of- care system • Semi-annual clinical/compliance reviews • Compliance review of metric variances • Compliance manager site visits • Compliance training for all employees • Compliance concerns hotline • Annual Sarbanes-Oxley audit |
 15 Medicare Reimbursement • Implemented in October 2000 - Base payment for 60-day episode of care - Adjusted for patient acuity and market factors • CMS issued reimbursement changes on August 22, 2007 - Expands HHRG from 80 to 153 - Effective date of January 1, 2008 - More integrated reimbursement for therapy • We are analyzing the reimbursement changes and planning for its implementation - Multi component changes requiring complex modeling and testing - Will lead to operational adjustments and system programming changes |
 16 Financial Highlights • Increasing revenue • Cash flow/low cap ex requirements • Consistent EPS growth • Strong balance sheet to fund future growth |
 17 EBITDA is defined as net income before provision for income taxes, net interest expense, and depreciation and amortization. EBITDA should not be considered as an alternative to, or more meaningful than, income before income taxes, cash flow from operating activities, or other traditional indicators of operating performance. This calculation of EBITDA may not be comparable to a similarly titled measure reported by other companies, since not all companies calculate this non-GAAP measure in the same manner. ($ millions, except per share data) Summary Financial Results 2005 2006 2Q06 Net revenue $381.6 $541.1 $132.9 Period-over-period growth 68.0% 41.8% 66.0% Gross margin 218.5 305.7 76.2 Margin 57.3% 56.5% 57.4% Operating income 50.1 65.7 15.7 Margin 13.1% 12.1% 11.8% EBITDA 57.2 75.7 18.2 Margin 15.0% 14.0% 13.7% Fully-diluted EPS $1.41 $1.75 1 $0.42 Period-over-period growth 23.7% 24.1% 10.5% 2Q07 $169.5 27.5% 94.8 55.9% 24.0 14.2% 15.5% $0.57 35.7% 1) Adjusted to exclude $0.03 charge for write-off of deferred financing fees. 26.3 Net Income 38.3 30.1 9.1 14.9 |
 18 Summary Performance Results 2005 2006 2Q06 Agencies 1 221 275 247 Period-over-period growth 24.4% Completed Episodes 120,987 172,930 42,621 Period-over-period growth 42.9% Episodic-Based Admissions 81,464 108,140 26,364 Period-over-period growth 32.7% Revenue per Episode $2,567 $2,634 $2,652 Period-over-period growth 2.6% Total Visits 2,364,887 3,437,881 842,368 Period-over-period growth 45.4% 2Q07 313 26.7% 51,219 20.2% 31,376 19.0% 0.7% 1,049,008 24.5% $2,671 DSO 48.9 46.8 62.3 52.9 1) Inclusive of home health and hospice locations |
 19 Summary Balance Sheet ($ in millions) Dec. 31, 2006 June 30, 2007 Assets Cash (1) Accounts Receivable, Net Property, Plant and Equipment Goodwill Other Total Assets Liabilities and Stockholder Equity Debt All Other Liabilities Stockholders’ Equity Total Liabilities and Stockholders’ Equity $ 97.3 75.0 66.9 249.6 29.9 $ 518.7 $ 89.0 74.9 53.0 213.0 33.9 $ 463.8 1) Includes restricted cash of $4.8 million and $5.9 million as of December 31, 2006 and June 30, 2007, respectively. $5.3 94.5 364.0 $ 463.8 $15.3 104.0 399.4 $ 518.7 |
 20 Guidance Calendar Year 2007 1 Net revenue: $650 - $675 million EPS: $2.10 - $2.20 Diluted shares: 26.4 million 1) Provided as of the date of our form 8-K filed with the Securities and Exchange Commission on July 31, 2007 |
 21 Investment Highlights • Large, growing and fragmented industry • Focus on home nursing and related services to Medicare population • Strong internal growth and cash flow with low recurring cap ex • Proven operating model supported by sophisticated technology system • Demonstrated ability to identify and integrate acquisitions • Substantial liquidity and balance sheet capacity to fund external growth • Extensive delivery platform ideally positioned for Medicare disease management initiatives and payor diversification • Experienced management team |
 22 Contact Information • Thomas J. Dolan • SVP of Finance • Amedisys, Inc. • 5959 S. Sherwood Forest Boulevard • Baton Rouge, LA 70816 • Office – 225.292.2031 • Fax – 225.295.9653 • tdolan@amedisys.com • Dale Redman • Chief Financial Officer • Amedisys, Inc. • 5959 S. Sherwood Forest Boulevard • Baton Rouge, LA 70816 • Office – 225.292.2031 • Fax – 225.295.9653 • dredman@amedisys.com |
 |