 Amedisys, Inc. www.amedisys.com NASDAQ: AMED September 2008 Exhibit 99.1 |
 1 This presentation may include forward-looking statements as defined by the Private Securities Litigation Reform Act of 1995. These forward-looking statements are based upon current expectations and assumptions about our business that are subject to a variety of risks and uncertainties. Additional information regarding factors that could cause actual results to differ materially from those discussed in any forward-looking statements are described in reports and registration statements we file with the SEC, including our annual report on Form 10-K and Quarterly Reports on 10-Q, copies of which are available on the Amedisys internet website http://www.amedisys.com or by contacting the Amedisys Investor Relations department at (800) 467- 2662. We disclaim any obligation to update any forward-looking statements in this presentation. Forward Looking Statements |
 2 Investment Highlights • Large, growing and fragmented industry • Focus on home nursing and related services to Medicare population • Strong internal growth and cash flow with low recurring cap ex • Proven operating model supported by sophisticated technology system • Demonstrated ability to identify and integrate acquisitions • Substantial liquidity and balance sheet capacity to fund external growth • Extensive delivery platform ideally positioned for Medicare care management initiatives • Experienced management team |
 3 Management Team • William F. Borne - Chairman and Chief Executive Officer - CEO since founding the Company in 1982 - Registered nurse, extensive hospital administrative and clinical experience • Larry R. Graham - President and Chief Operating Officer - Joined Amedisys in 1996; COO since 1999; President since 2004 - General Health Systems - Arthur Andersen • Dale E. Redman, CPA - Chief Financial Officer - Joined Amedisys in February 2007 - CFO of United Companies - Ernst & Young |
 4 Corporate Overview 1 • Leading provider of home nursing services • 504 2 locations throughout the United States • Services include skilled nursing and therapy • Home Health =94% revenue, Hospice = 6% revenue • 94% of Home Health revenue is episodic based (both Medicare & non-Medicare) 1) For the six-month period ended June 30, 2008 2) Both home health and hospice, inclusive of joint venture agencies, as of June 30, 2008 |
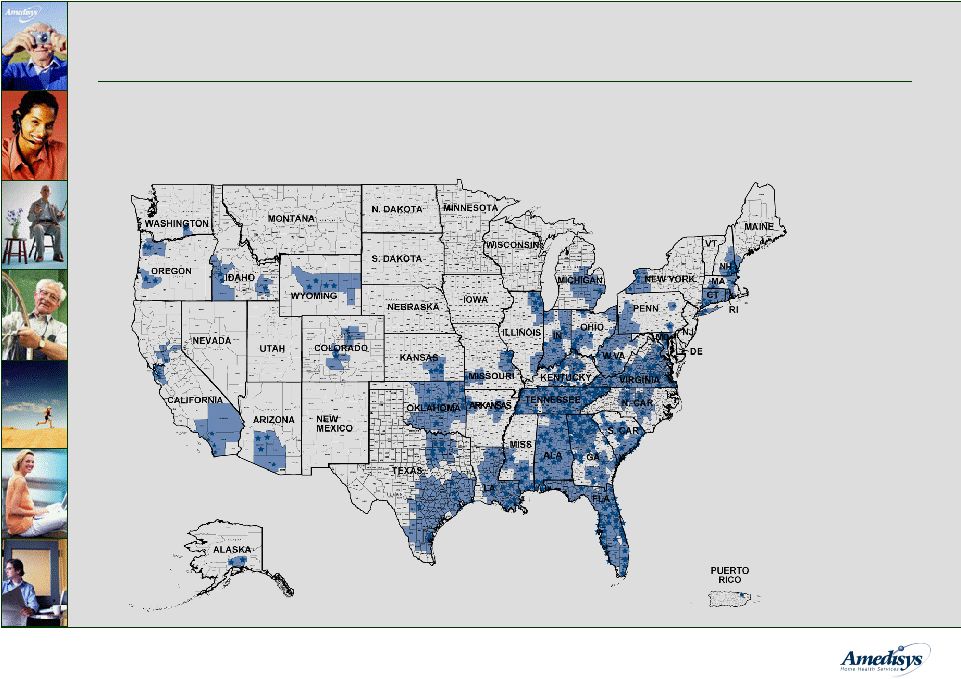 5 Our Locations 1 1) As of June 30, 2008 National home nursing provider located in 35 states. Largest provider in the Southern and Southeastern United States - 458 home nursing locations - 46 hospice locations |
 6 Our Strategy • Focus on Medicare-eligible patients • Prioritize internal growth • Select, acquire and integrate quality home care agencies • Leverage cost-efficient operating platform • Develop and deploy specialized nursing programs • Expand care coordination platform |
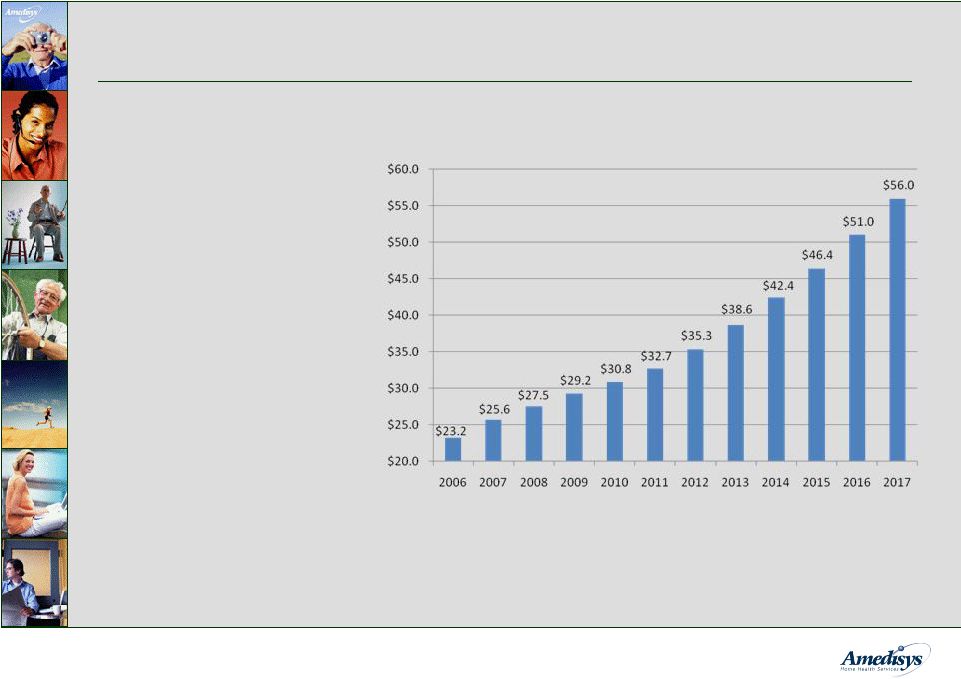 7 Medicare Revenue Market Size • 2006: Medicare spending for home health reached $14 billion was $9.2 billion, giving a combined total of $23.2 billion • 2017: Home Health will contribute $36 billion $20 billion projected $56 billion Source: CBO's March 2008 Baseline: MEDICARE MEDICARE Home Health and Hospice Revenue and hospice and hospice of the |
 8 Home Nursing Market • Industry is highly fragmented • 9,200 Medicare-certified nursing agencies • Most are single-site, small local or regional providers: - Independently-owned agencies - Visiting nurse associations - Facility and hospital-based agencies • Publicly-owned providers account for less than 7% of the home nursing market |
 9 Industry Growth Drivers • Trend from inpatient to home-based care: - Patient preference - Payor incentives - Technology advancements • Demographics – aging population - 8,000 Americans will become Medicare eligible each day beginning in 2011 and by 2030, 57.8 million baby boomers will be eligible for Medicare benefits 1 • Increased prevalence of chronic and co-morbid conditions 1 According to the United States Census Bureau |
 10 Internal Growth - Overall industry growth - Expanded and more effective sales force - Comprehensive range of clinical programs - Enhanced referral source education efforts - Focus on start-ups • Strong internal growth in episodic-based admissions - Approximately 13% for Q2 2008 and 10% for the first six months of 2008 • Internal revenue growth 28% for Q2 2008 and 27% for the first six months of 2008 • Internal growth driven by: |
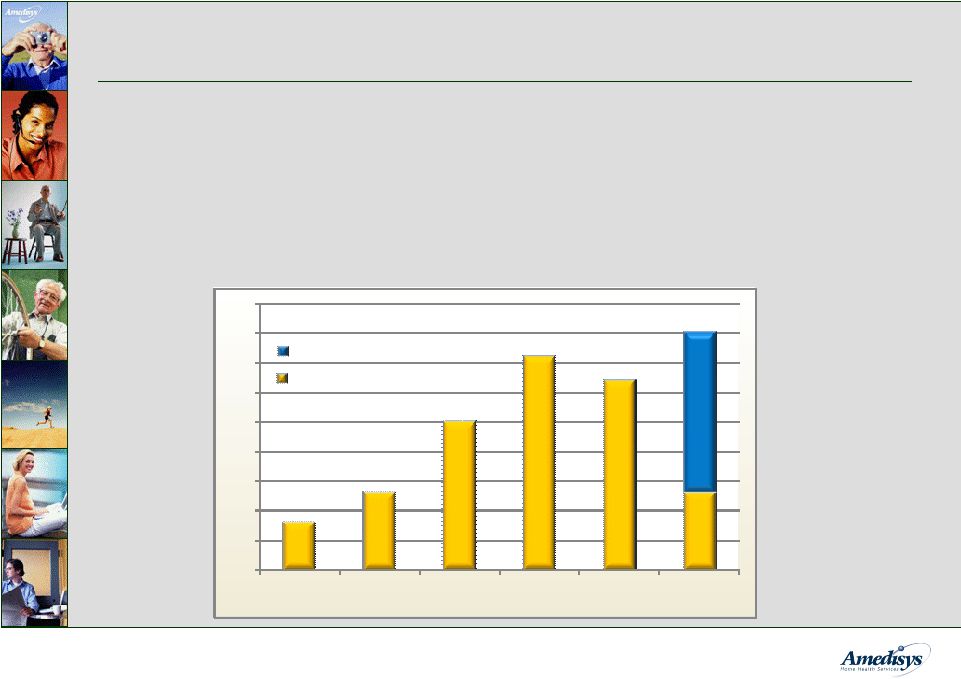 11 Start-Up Strategy • Start-ups typically generate $1.5 - $2.0 million in run-rate revenue by the end of their second year of operations • ~ 18 months to recoup the $250,000 - $350,000 investment • 13 home health start-ups completed through June 30, 2008 * Reported numbers are for home health start-ups Yearly Start-Ups 8 13 25 36 32 13 0 5 10 15 20 25 30 35 40 45 2003 2004 2005 2006 2007 2008 Projected Completed 27 40 |
 12 Acquisition Strategy • Acquisition rationale: - Industry leadership - Leverage our operating/business systems - Value accretion through synergies and agency profitability enhancement • Acquisition criteria: - Defined pricing objectives - Targeted geographic profile - Compatible payor mix - Consistent clinical metrics - Expandable referral base - Opportunities for future internal growth |
 13 TLC Integration • Detailed plan to wind-down TLC corporate - Converted all agencies as of September 15, 2008 - Converted ~ 17 agencies per month - Closing all regional billing centers by October 2008; closed 2 regional billing centers through August 2008 - Converted Human Resources, Accounts Payable and Payroll mid-April |
 14 Investments in Technology • Strategic advantages from technology • Standardized processes: - Automated review of assessment forms - Automatic scheduling - Web-based HR and payroll system • Centralized management of clinical oversight/utilization: - Real-time episode analysis - Daily/weekly review of quality indicators - Executive information system • Point of care roll-out completed |
 15 High Quality Health Care • Care Management - 12 disease management programs - 70 clinical tracks • Specialty Division - Balanced For Life first program in division - Targets higher acuity patients - Rolled out to 96 locations through June 2008; 150 total locations targeted for roll out by year end 2008 |
 16 Comprehensive Compliance Program • Clinical nurse review of assessments • Standardized care plans • Physician review/approval • Weekly case conferences • Monthly audits • End of episode case review • Point-of-care system enhances clinical documentation accuracy with real-time assessment input • Unannounced compliance & billing audits • Regional directors monitor compliance status and resolve errors • Real-time monitoring capability of local level activity via point-of- care system • Semi-annual clinical/compliance reviews • Compliance review of metric variances • Compliance manager site visits • Compliance training for all employees • Compliance concerns hotline • Annual Sarbanes-Oxley audit • Annual billing competency testing Corporate Level Regional Level Local Level |
 17 Medicare Reimbursement • Implemented in October 2000 - Base payment for 60-day episode of care - Adjusted for patient acuity and market factors • 2008 CMS issued reimbursement changes - Expands HHRG from 80 to 153 - More integrated reimbursement for therapy - Better alignment of reimbursement with patient needs - Allocation of more dollars to later episodes - Should benefit agencies with a greater business mix of higher- acuity patients |
 18 Financial Highlights • Increasing revenue • Cash flow/low cap ex requirements • Consistent EPS growth • Strong balance sheet to fund future growth - $250 million active shelf registration - $138 million unused revolving credit facility through June 2008 |
 19 EBITDA is defined as net income before provision for income taxes, net interest expense, and depreciation and amortization. EBITDA should not be considered as an alternative to, or more meaningful than, income before income taxes, cash flow from operating activities, or other traditional indicators of operating performance. This calculation of EBITDA may not be comparable to a similarly titled measure reported by other companies, since not all companies calculate this non-GAAP financial measure in the same manner. ($ millions, except per share data) Summary Financial Results 2006 2007 2Q07 Net revenue Period-over-period growth Gross margin Margin Operating income Margin EBITDA Margin Fully-diluted EPS Period-over-period growth 2Q08 Net Income $541.1 41.8% 305.7 56.5% 65.7 12.1% 75.7 14.0% 38.3 $1.72 22.0% $697.9 29.0% 368.9 52.9% 96.6 13.8% 109.8 15.7% 65.1 $2.48 44.2% $169.5 27.5% 89.7 52.9% 24.0 14.2% 26.3 15.5% 14.9 $0.57 35.7% $312.7 84.5% 163.9 52.4% 38.8 12.4% 44.3 14.2% 20.4 $0.76 33.3% 1) EBITDA would have been $47.0 million after adding back $2.7 million ($1.6 million, net of income taxes) in certain TLC Health Care Services, Inc. integration costs. 2) EPS would have been $0.82 after adding back $0.06 per diluted share for certain TLC Health Care Services, Inc integration costs in 2Q08. 1 2 |
 20 Summary Performance Results 2006 2007 2Q07 Agencies at period end 1 Period-over-period growth Completed Medicare Episodes Period-over-period growth Episodic-Based Admissions Period-over-period growth Revenue per Episode Period-over-period growth Total Visits Period-over-period growth 2Q08 DSO 1) Inclusive of home health and hospice locations 360 30.9% 4,302,830 25.2% 129,649 19.9% 208,547 20.6% $2,666 1.2% 51.3 275 3,437,881 108,140 172,930 $2,634 52.9 313 1,049,008 31,376 51,219 $2,671 46.8 504 61.0% 1,852,263 76.6% 53,561 70.7% 87,055 70.0% $2,852 6.8% 51.4 |
 21 Summary Balance Sheet ($ in millions) Dec. 31, 2007 June 30, 2008 Assets Cash Accounts Receivable, Net Property, Plant and Equipment Goodwill Other Total Assets Liabilities and Stockholders’ Equity Debt All Other Liabilities Stockholders’ Equity Total Liabilities and Stockholders’ Equity $ 1.7 161.9 78.5 697.5 82.9 $ 1,022.5 $379.2 147.3 496.0 $ 1,022.5 $ 56.2 96.3 68.3 332.5 33.8 $ 587.1 $24.0 116.1 447.0 $ 587.1 |
 22 Guidance 1) Provided as of the date of our form 8-K filed with the Securities and Exchange Commission on July 17, 2008 Calendar Year 2008 1 Net revenue: $1.100 - $1.150 billion EPS: $3.00 - $3.10 (after adding back certain expenses related to the integration of TLC Health Care Services, Inc.) Diluted shares: 26.9 million |
 23 Investment Highlights • Large, growing and fragmented industry • Focus on home nursing and related services to Medicare population • Strong internal growth and cash flow with low recurring cap ex • Proven operating model supported by sophisticated technology system • Demonstrated ability to identify and integrate acquisitions • Substantial liquidity and balance sheet capacity to fund external growth • Extensive delivery platform ideally positioned for Medicare disease management initiatives and payor diversification • Experienced management team |
 24 Contact Information Kevin B. LeBlanc Director of Investor Relations Amedisys, Inc. 5959 S. Sherwood Forest Boulevard Baton Rouge, LA 70816 Office – 225.292.2031 Fax – 225.295.9653 kleblanc@amedisys.com |
 |