 Investor Day 2009 www.amedisys.com NASDAQ: AMED Exhibit 99.1 |
 Forward-Looking Statements This presentation may include forward-looking statements as defined by the Private Securities Litigation Reform Act of 1995. These forward-looking statements are based upon current expectations and assumptions about our business that are subject to a variety of risks and uncertainties that could cause actual results to differ materially from those described in this presentation. You should not rely on forward-looking statements a prediction of future events. Additional information regarding factors that could cause actual results to differ materially from those discussed in any forward-looking statements are described in reports and registration statements we file with the SEC, including our Annual Report on Form 10-K and subsequent Quarterly Reports on Form 10-Q and Current Reports on Form 8-K, copies of which are available on the Amedisys internet website http://www.amedisys.com or by contacting the Amedisys Investor Relations department at (800) 467-2662. We disclaim any obligation to update any forward-looking statements or any changes in events, conditions or circumstances upon which any forward-looking statement may be based. |
 Important Website Information We encourage everyone to visit the Investors Section of our website at www.amedisys.com, where we have posted additional important information such as press releases, profiles concerning our business and clinical operations and control processes, and SEC filings. We intend to use our website to expedite public access to time-critical information regarding the Company in advance of or in lieu of distributing a press release or a filing with the SEC disclosing the same information. |
 Overview/Vision William Borne Founder/Chairman/ Chief Executive Officer |
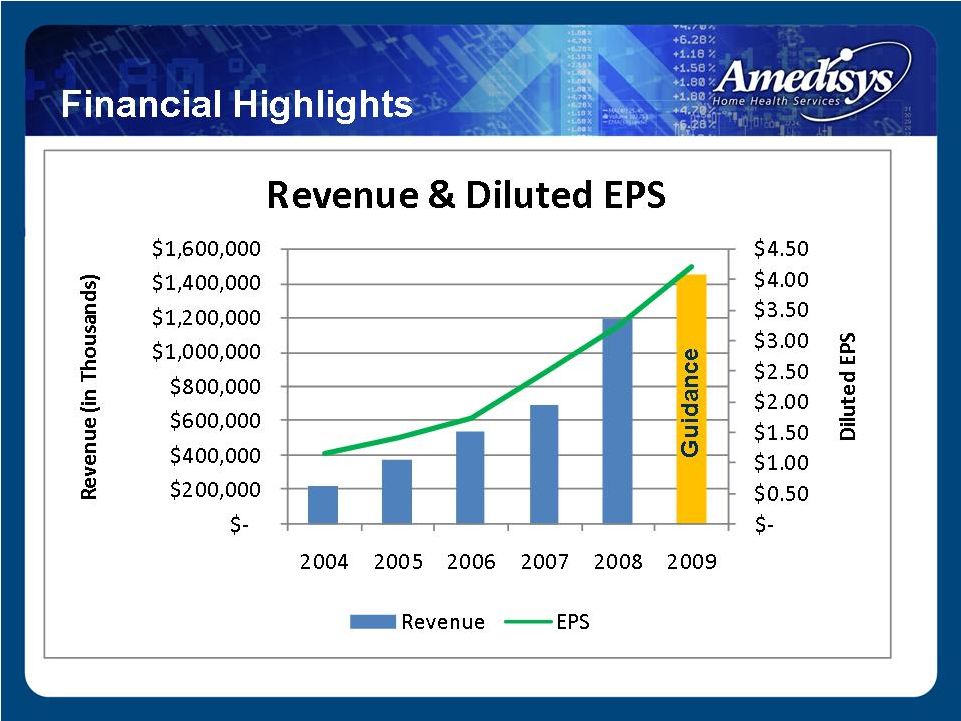
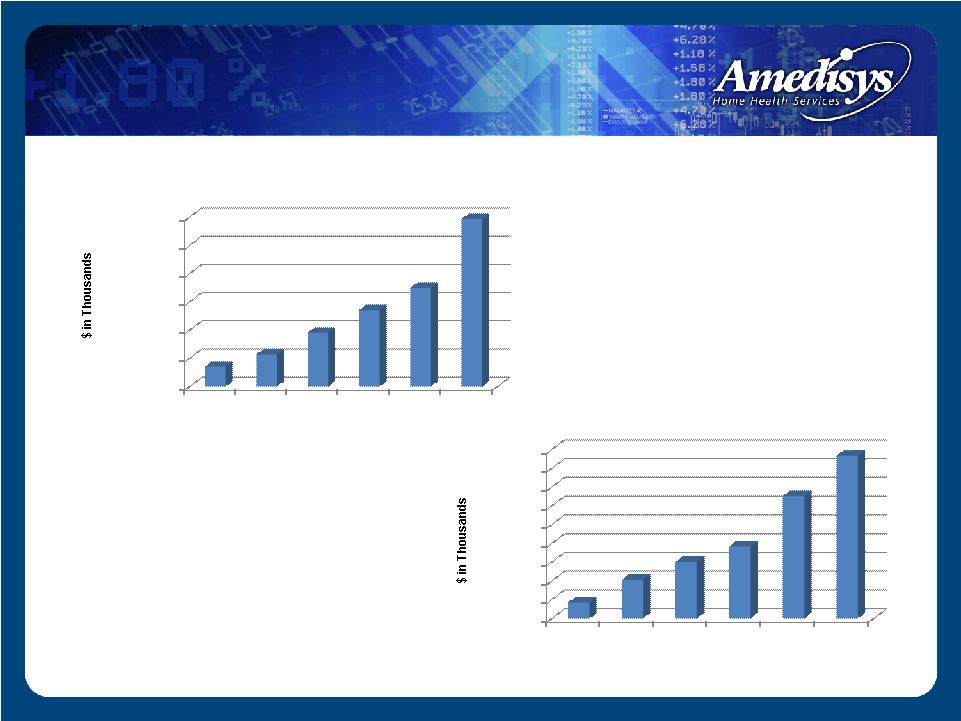 Financial Highlights $- $200,000 $400,000 $600,000 $800,000 $1,000,000 $1,200,000 2003 2004 2005 2006 2007 2008 $142,473 $227,089 $381,558 $541,148 $697,934 $1,187,415 Revenue $- $10,000 $20,000 $30,000 $40,000 $50,000 $60,000 $70,000 $80,000 $90,000 2003 2004 2005 2006 2007 2008 $8,407 $20,504 $30,102 $38,255 $65,113 $86,682 Net Income |
 Industry Growth Drivers Trend from inpatient to home-based care Patient preference Payor incentives Technology advancements Demographics – aging population 8,000 Americans will become Medicare eligible each day beginning in 2011 and by 2030, 57.8 million baby boomers will be eligible for Medicare benefits 1 Increased prevalence of chronic and co-morbid conditions 1 Source: United States Census Bureau |
 2008 Medicare Benefit Outlays by Service Source: Winter 2007 - KPMG’s Washington Healthcare Update |
 Projected Savings |
 25% of beneficiaries account for approximately 85% of Medicare spending 12% of beneficiaries account for approximately 69% of Medicare spending 5% of beneficiaries account for approximately 43% of Medicare spending These chronically ill beneficiaries see 14 physicians a year, fill an average of 50 different prescriptions, account for 76% of all hospital admissions, account for 88% of all prescriptions filled and 72% of physicians visits The least expensive 50% of Medicare beneficiaries account for only 4% of spending 1 Holtz-Eakin D. High-cost Medicare beneficiaries. Congressional Budget Office, pp. 1-12 (May 2005) http://www.cbo.gov/ftpdocs/63xx/doc6332/05-03- MediSpending.pdf; CBO Budget Options, Health Care, p. 77 (Dec. 2008) 2 Testimony of Gerard F. Anderson, Ph.D., Johns Hopkins Bloomberg School of Public Health, Health Policy and Management , before the Senate Special Committee on Aging, “The Future of Medicare: Recognizing the Need for Chronic Care Coordination, Serial No. 110-7, pp. 19-20 (May 9, 2007); CBO Budget Options, Health Care, p. 77 (Dec. 2008) 3 “ High Cost Medicare Beneficiaries,” Congressional Budget Office, p. 4 (May 2005) Medicare Beneficiary Recipients 1 1 2 3 |
 Public Referral sources Fiscal intermediaries Administrative CMS MedPac GAO Policy makers Influences |
 Seen as commodity based with downward pricing pressure Size Technology Performance Metrics Financial strength Move to a value-added company that improves the healthcare system Add value • New medical model • Policy changes Commodity Based To Value Added |
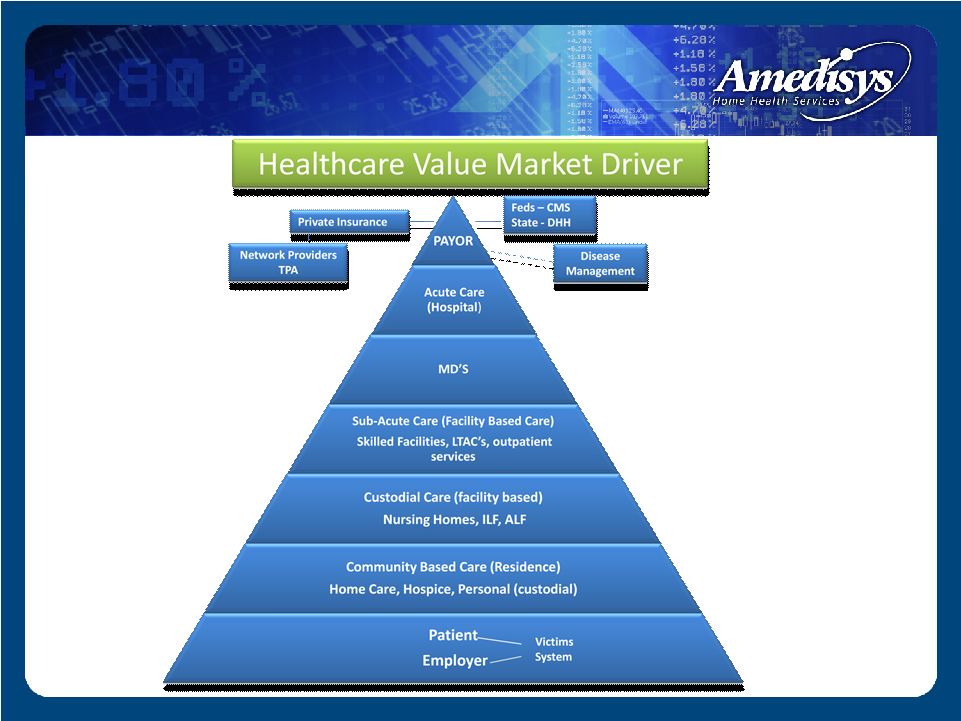 Old Medical Model |
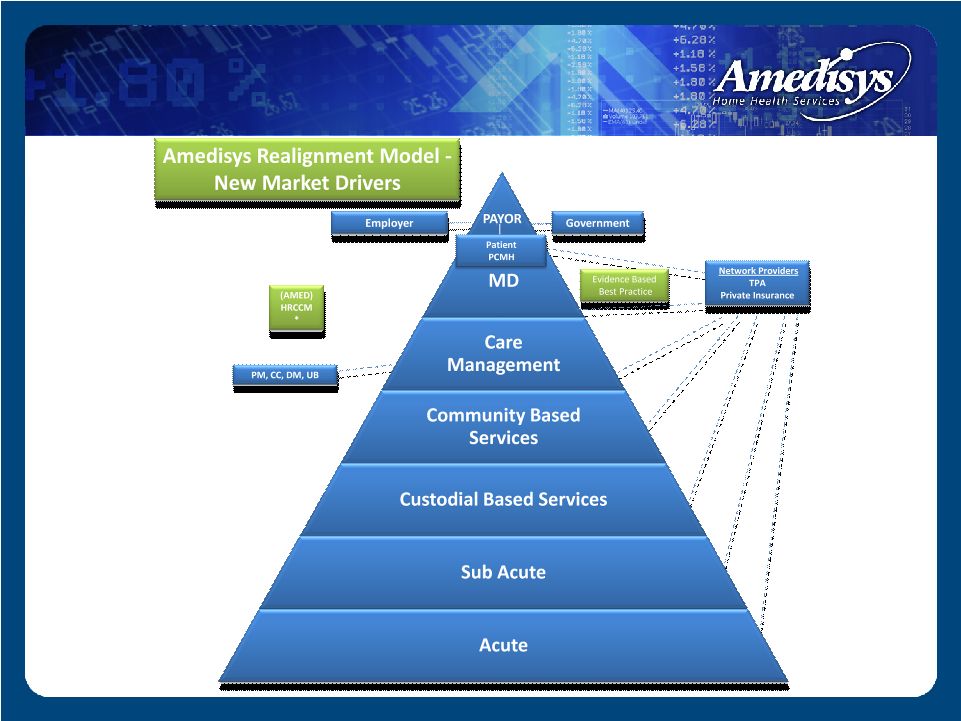 New Medical Model |
 Why needed? Potential solutions Home care infrastructure Amedisys information and communication technology capabilities New model of care Future of health care Comprehensive, Continuous Chronic Care Management in the Home |
 The Alliance is a national consortium of home health care organizations and providers that raises awareness about home health care and its proven ability to deliver quality, cost- effective, patient-centered care for patients. Members: Almost Family, Inc. Amedisys, Inc. Bayada Nurses Gentiva Health Services, Inc. HCR ManorCare Interim Healthcare LHC Group, Inc. Liberty Home Care NAHC (National Association for Home Care & Hospice) VNAA (Visiting Nurse Associations of America) Alliance For Home Health Quality and Innovation |
 Finalizing legislative messaging Awareness campaign Revitalizing Congressional Home Health Working Group Research Launched research project with Avalere (results expected early April 2009) to demonstrate home health value proposition in avoiding re-hospitalization Quality working groups Close partnership with CMS, AHQA and NQF on numerous quality demonstration initiatives Alliance Recent Developments |
 Collateral Legislation Home health legislation Independence at Home Medical Home |
 Operations Larry Graham President/ Chief Operating Officer |
 Business Strategy Three pronged business strategy Grow – Internally – Acquisitions – Start-ups Operationally efficient Quality outcomes |
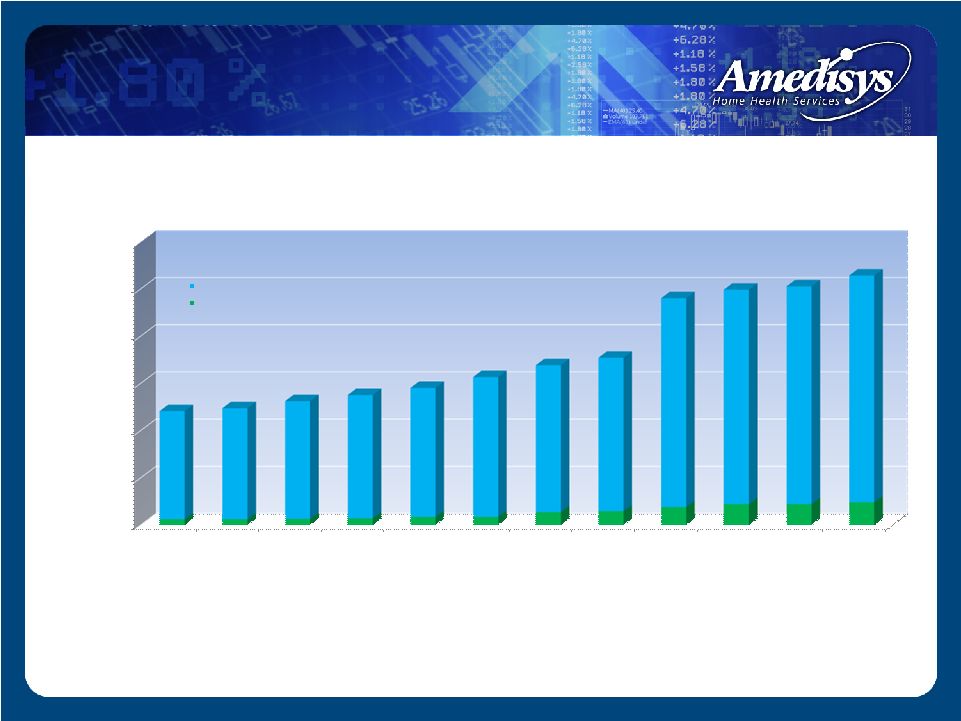 0 100 200 300 400 500 600 3/31/06 6/30/2006 9/30/2006 12/31/2006 3/31/2007 6/30/2007 9/30/2007 12/31/2007 3/31/2008 6/30/2008 9/30/2008 12/31/2008 12 12 13 14 17 17 27 29 38 44 44 48 229 235 249 261 273 296 311 325 442 454 461 480 241 247 262 275 290 313 338 354 480 498 505 528 Home health agencies Hospice agencies Home Health and Hospice Agencies Growth |
 Growth - Internal 2008 internal revenue growth of 28% Internal revenue growth targeting to be 15% through 2009 Internal revenue comprised volume (internal admissions & internal recertifications) and rate variance |
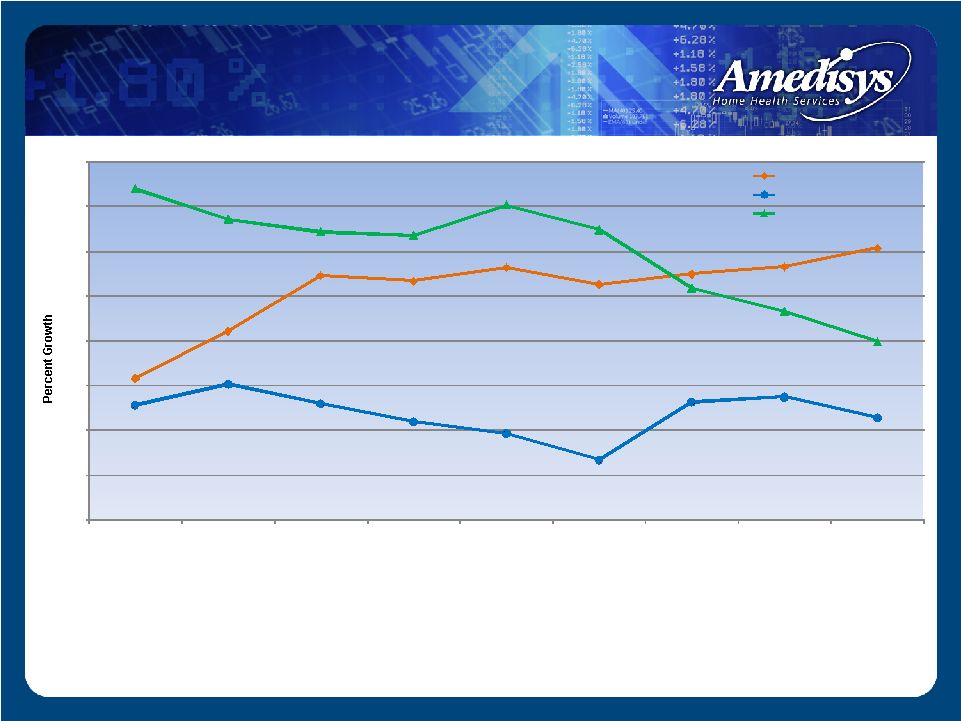 (1) Internal episodic-based revenue growth is the percent increase in our base/start-up episodic-based revenue for the period as a percent of the total episodic-based revenue of the prior period. (2) Internal episodic-based admission growth is the percent increase in our base/start-up episodic-based admissions for the period as a percent of the total episodic-based admissions of the prior period. (3) Internal episodic-based recertification growth is the percent increase in our base/start-up episodic-based recertifications for the period as a percent of the total episodic-based recertifications of the prior period. Growth – Internal Episodic Volume 16% 21% 27% 27% 28% 26% 28% 28% 30% 13% 15% 13% 11% 10% 7% 13% 14% 11% 37% 34% 32% 32% 35% 32% 26% 23% 20% 0% 5% 10% 15% 20% 25% 30% 35% 40% December 31, 2006 March 31, 2007 June 30, 2007 September30, 2007 December31, 2007 March 31, 2008 June 30, 2008 September30, 2008 December31, 2008 Revenue growth (1) Admission growth (2) Recertification growth (3) |
 28,019 31,599 31,376 32,672 34,002 38,859 53,561 53,203 53,748 22,726 24,300 27,032 29,441 31,839 34,464 46,236 48,367 49,773 46,716 48,974 53,958 55,983 60,940 65,295 94,203 94,986 98,592 - 20,000 40,000 60,000 80,000 100,000 120,000 December 31, 2006 March 31, 2007 June 30, 2007 September 30, 2007 December 31, 2007 March 31, 2008 June 30, 2008 September 30, 2008 December 31, 2008 Admissions (1) Recertifications (2) Completed episodes (3) Episodic-Based Growth - Volume (1) Episodic-based admissions are defined as the number of patients admitted to our agencies during the period for the first 60-day episode of care where payors reimburse us for services provided on an episodic-basis, which include Medicare and other insurance carriers, including Medicare Advantage programs. (2) Episodic-based recertifications are defined as the number of patients recertified to our agencies during the period for an additional 60-day episode of care where payors reimburse us for services provided on an episodic-basis, which include Medicare and other insurance carriers, including Medicare Advantage programs. (3) Episodic-based completed episodes are defined as the number of patients that have either reached the end of their 60-day eligibility period or terminated their service before the 60-day eligibility period has lapsed where payors reimburse us for services provided on an episodic-basis, which include Medicare and other insurance carriers, including Medicare Advantage programs. |
 Case mix weight Wage index adjustment – Acquisitions can cause adjustments Acuity impacts case mix Episodic-Based Growth – Rate Growth |
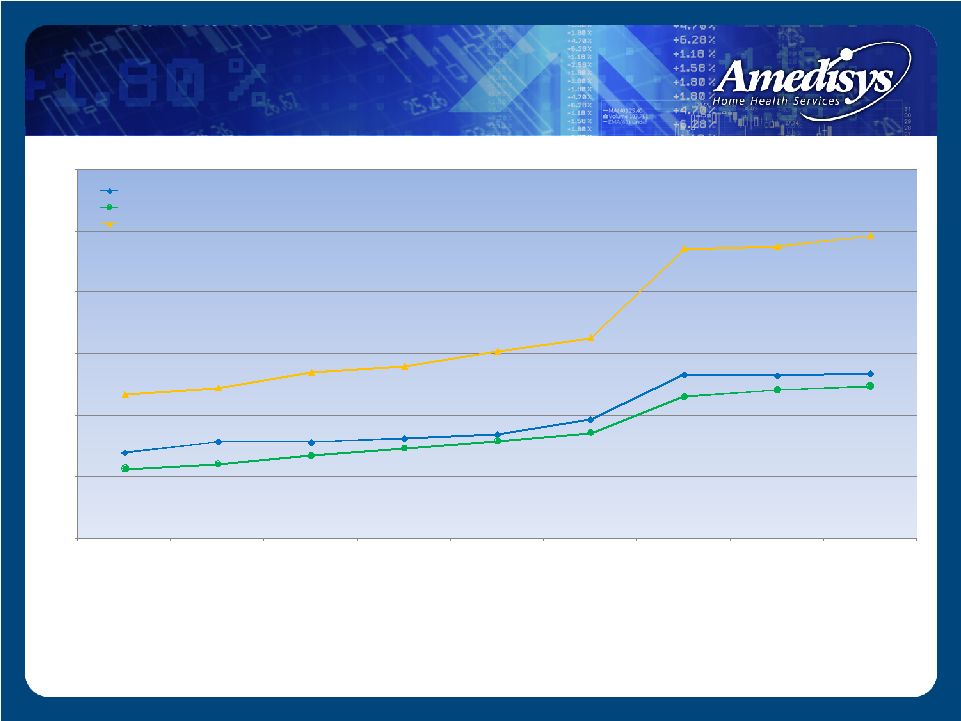
 $2,264 $2,339 $2,339 $2,339 $2,339 $2,270 $2,270 $2,270 $2,270 $2,612 $2,644 $2,671 $2,679 $2,666 $2,680 $2,852 $2,879 $2,981 $1,700 $1,900 $2,100 $2,300 $2,500 $2,700 $2,900 $3,100 12/31/2006 3/31/2007 6/30/2007 9/30/2007 12/31/2007 3/31/2008 6/30/2008 9/30/2008 12/31/2008 Revenue Per Episode CMS Base Rate(1) AMED Avg. Medicare-Based Revenue(2) Average Medicare Revenue per Completed Episode (1) Medicare program base episodic rates are set through Federal legislation. The actual base episode payment rate paid by Medicare, vary depending on the home health resource groups (“HHRGs”) to which Medicare patients are assigned.; the per episode payment is typically reduced or increased by such factors as our patient’s clinical, functional, and services utilization characteristics. (2) Amedisys average episodic-based revenue per completed episode is the average episodic-based revenue earned for each episodic-based completed episode of care. Growth – Rate Growth |
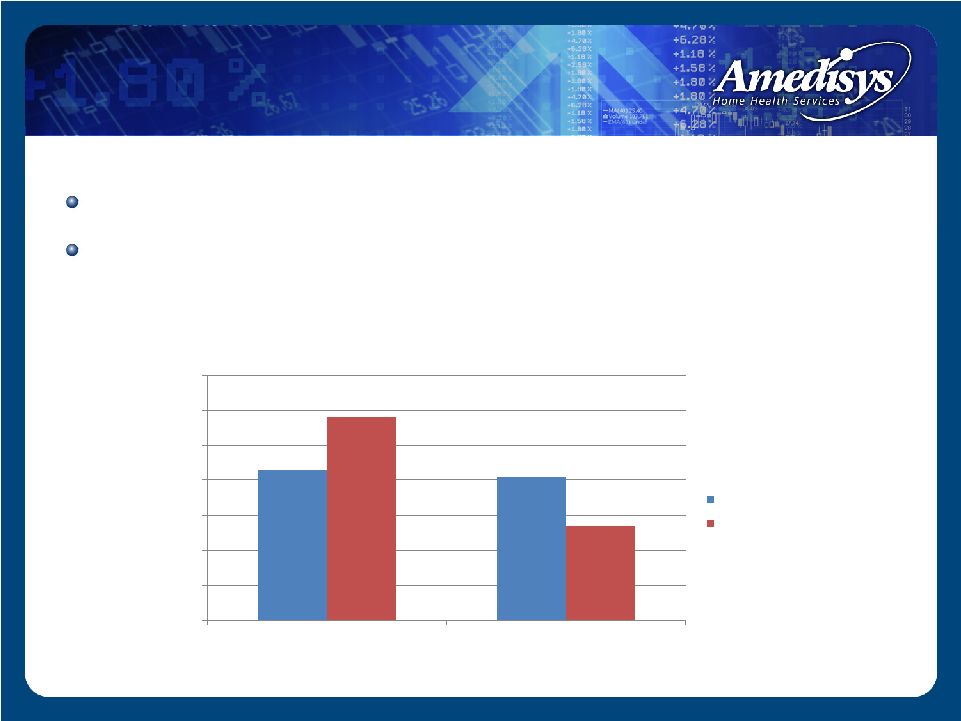 43% 41% 58% 27% 0% 10% 20% 30% 40% 50% 60% 70% Hospital Referral Physician Referral Referral Source Amedisys National Norm Source: OCS Corporate Comparative Report Period: 1/1/08 – 9/30/08 Professional Sales Force Over 800 sales force for home health Target both the doctor and discharge planners |
 More than 70 Clinical Tracks Care Management |
 Reported Purchase Price Number of Deals $148.6m 8 $17.8m 9 $120.5m 10 $478.1m 6 92 17 49 145 Growth - Acquisitions |
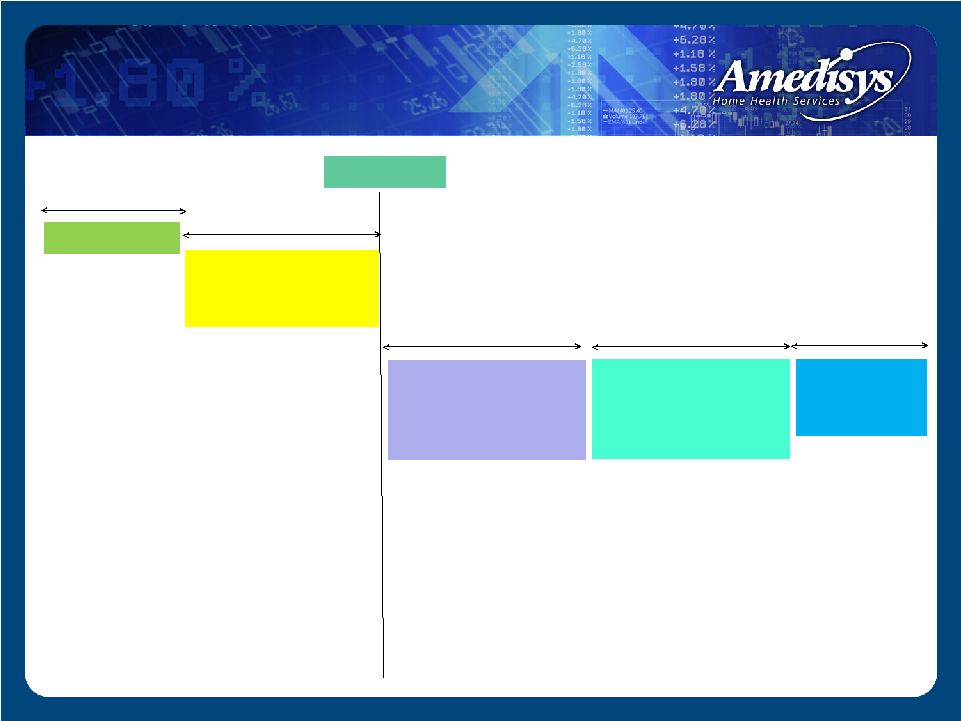 Prospect/LOI Due Diligence Integration Planning Documents Agency Conversion -IT Infrastructure -Point of Care -Processes Staffing Model Pay Per Visit Clinical Tracks Mercury Doc Care Management Programs 45-60 Days 30 – 180 Days 30 Days 180 + Days Closing Day Growth - Acquisitions |
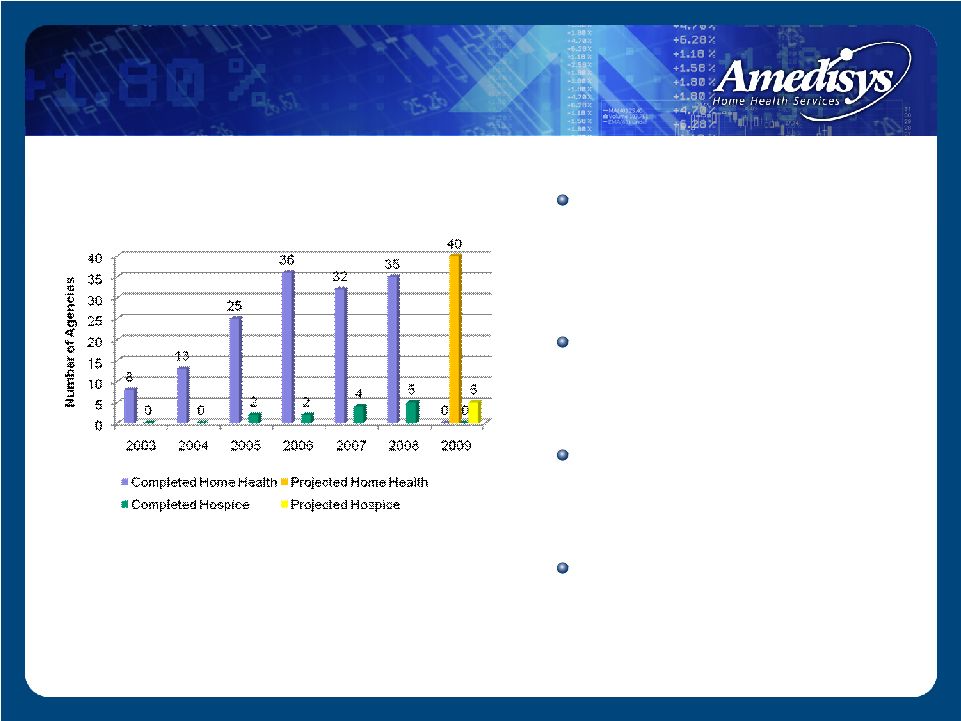 Home health start-ups typically generate $1.5 - $2.0 million in run-rate revenue in its second year of operation ~ 18 months to recoup the $250,000 - $350,000 investment 35 home health and 5 hospice start-ups completed in 2008 Project 40 home health and 5 hospice start-ups for 2009 Yearly Start-Ups Growth – Start-ups |
 Automated mileage Paperless Targeted discipline LPN vs. RN Therapist Assistant vs. Therapist Quality Care Coordinator - QCC Regional based Efficiencies |
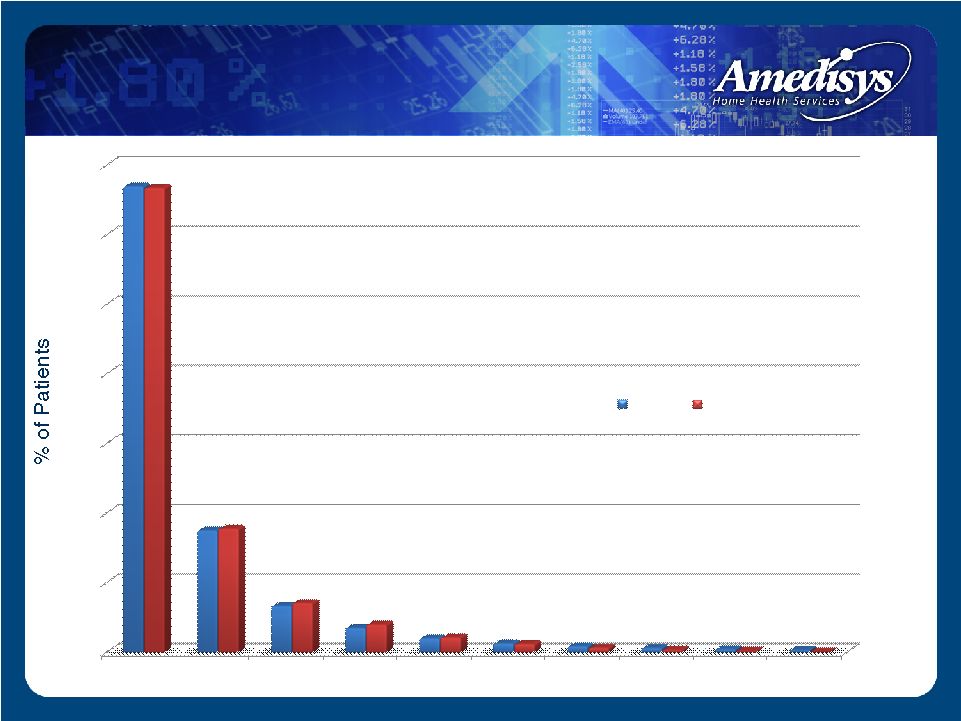
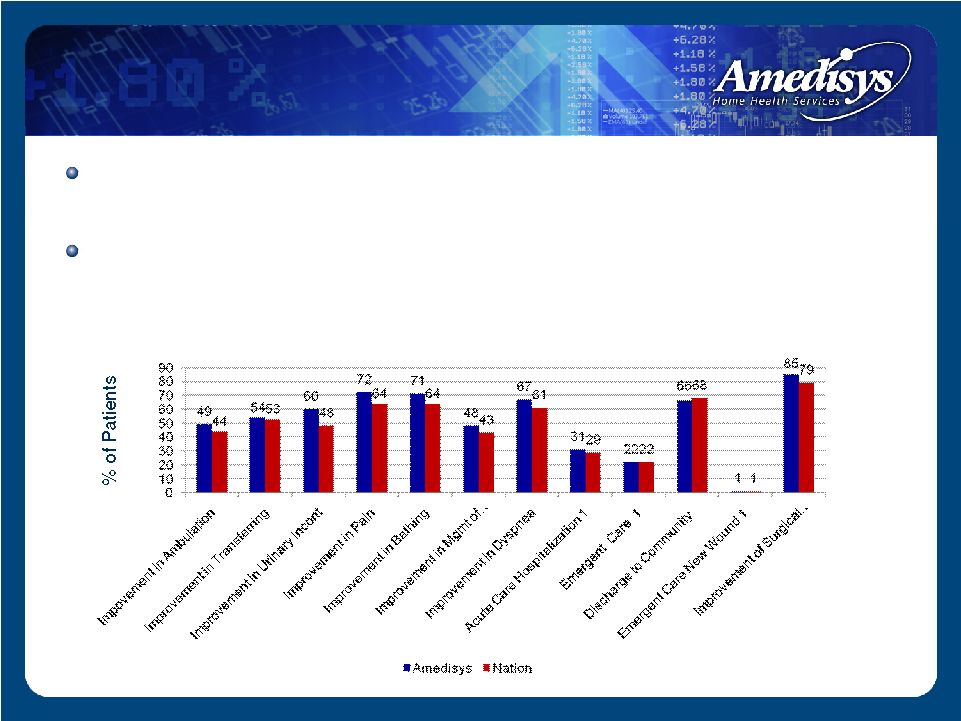 Exceeded or met 10 out of 12 outcomes versus national outcome average Recorded improved or consistent scores in 11 of 12 categories on a sequential basis Outcomes – June 2008 Amedisys vs. Nation 1 Lower % is better Source: www.medicare.gov High Quality Outcomes |
 Approximately $69 million in revenue in 2008 48 owned locations at December 31, 2008 Intend to open five new locations through startups in 2009 Occasional stand alone hospice acquisitions Hospice |
 Clinical Operations Alice Ann Schwartz Chief Information Officer/ Senior Vice President of Clinical Operations |
 Overview Overview of patients served/clinical trends How we deliver care (clinical platform) Clinical regulatory results Care management programs Competitive advantages Future clinical direction |
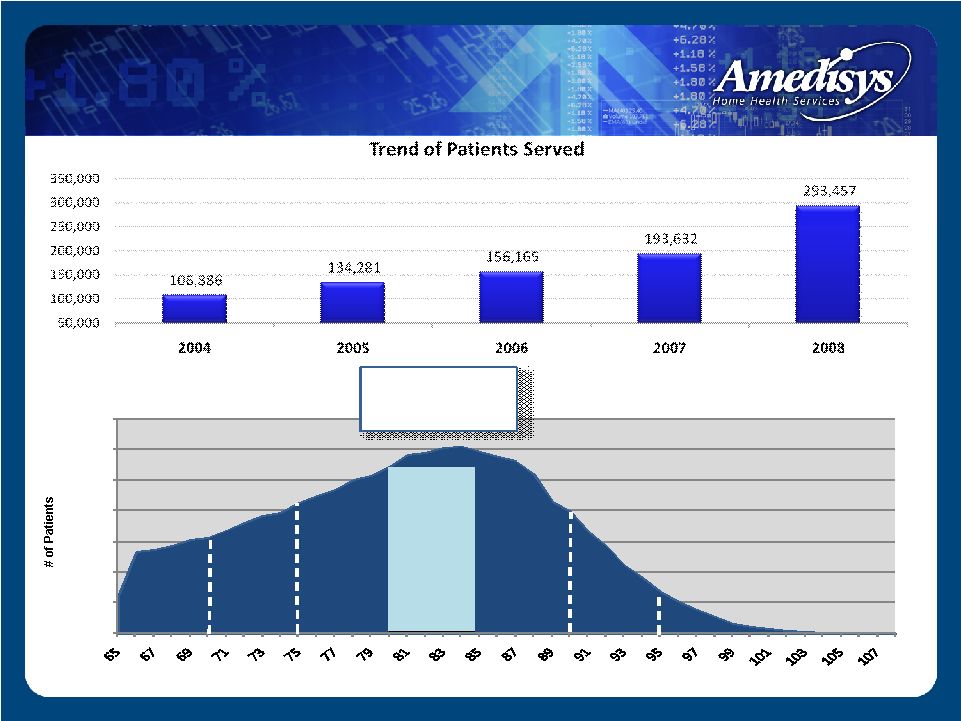 Patients Served/Clinical Trends Average Patient Age 0 2,000 4,000 6,000 8,000 10,000 12,000 14,000 # of Patients Age Distribution 65 and Older - 2008 - 10% 14% 18% 23% 21% 11% 3% |
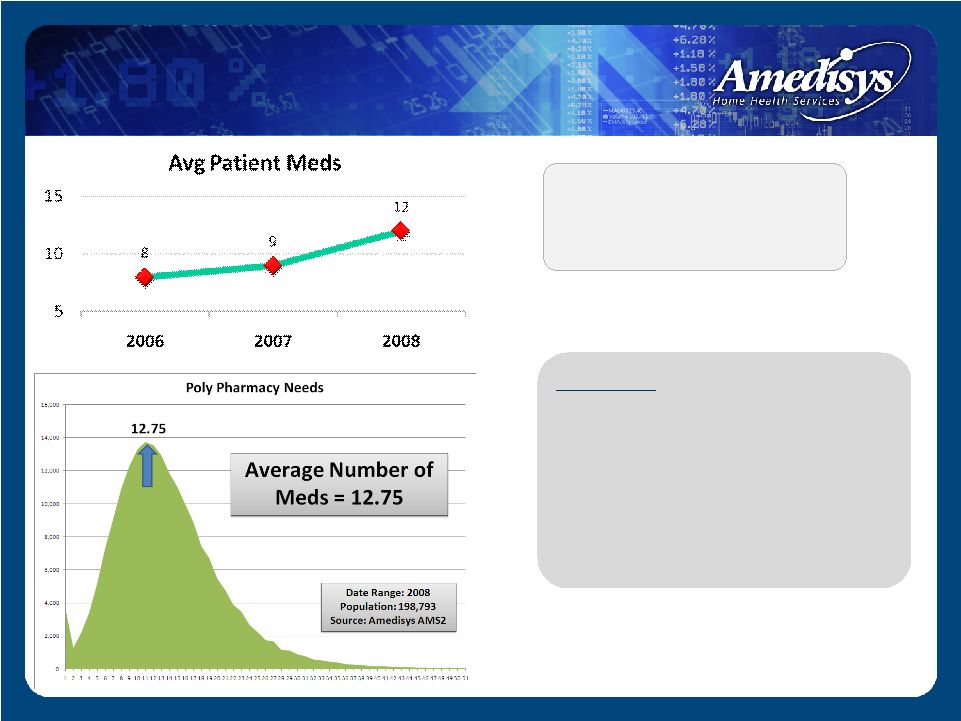 Guideline – As poly pharmacy needs increase, co-morbidities and complexities increase. As clinical complexities increase, service levels naturally increase. Our average patient medications have increased year over year Poly Pharmacy Trends |
 Predictive Stratification of High Hospitalization Risk Patients Amedisys National Diff Very High 10% 6% 4% High 41% 28% 13% Moderate 39% 43% (4%) Low 9% 20% (11%) Very Low 1% 3% (2%) Very High 10% High 41% Moderate 39% Low 9% Very Low 1% Amedisys |
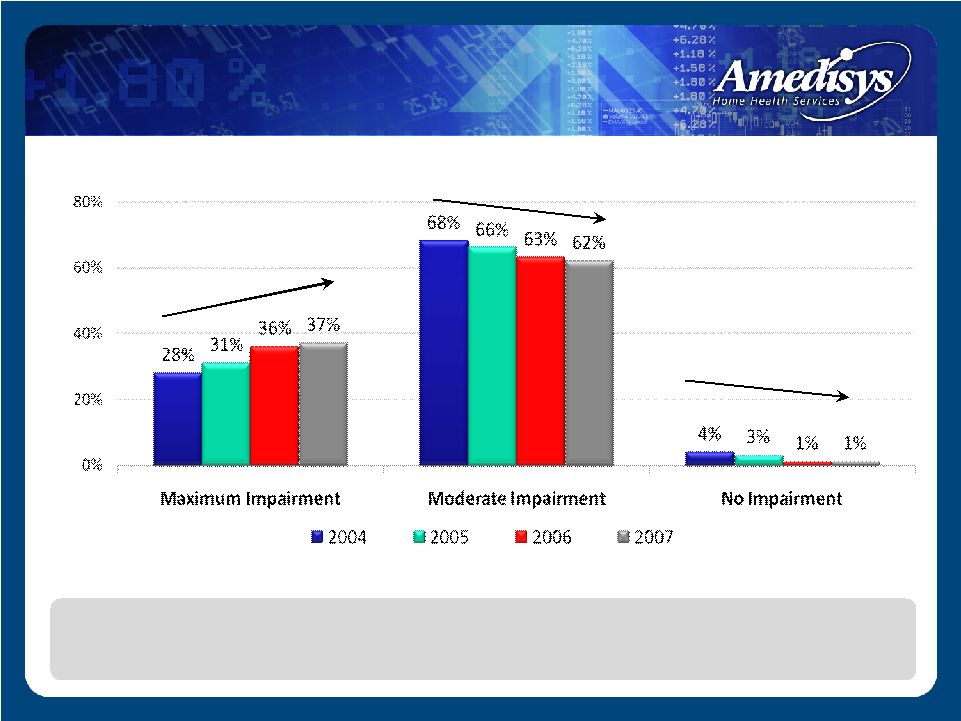 Functional Trends The organization’s profile is one of increasing poly pharmacy needs, increased hospitalization risk and increased functional debility. Functional Trends Graph |
 Diagnosis Trend |
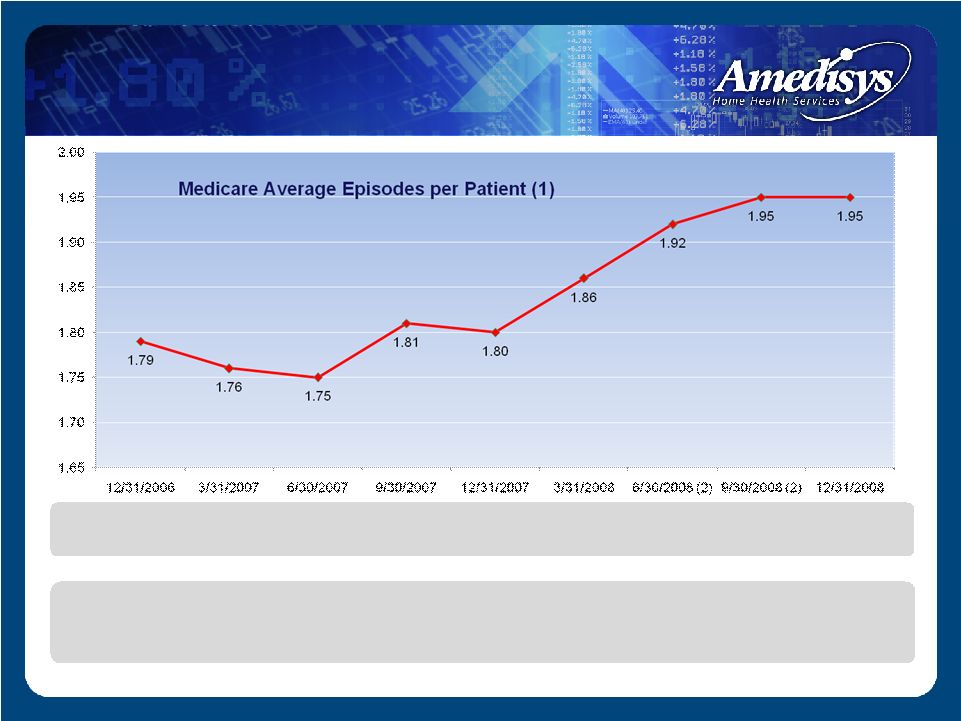 Medicare Average Episodes per Patient (1) (1) Medicare average episodes per patient is calculated by dividing the total number of completed Medicare episodes in the period by the total number of Medicare patients who completed episodes in the period. (2) Medicare average episode per patient for this period does not include TLC agencies that were not converted to Amedisys's operating platforms as of the reporting period. As comorbidities and complexities increase, service levels are impacted Average Episode/Patient |
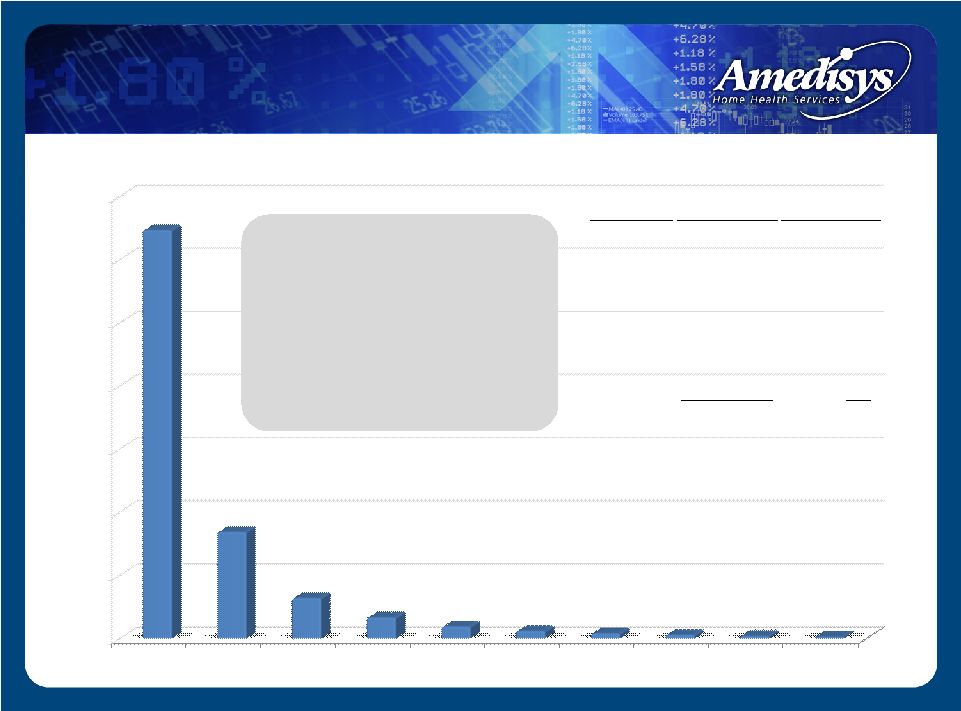 0 20,000 40,000 60,000 80,000 100,000 120,000 140,000 1-60 61-120 121-180 181-240 241-300 301-360 361-420 421-480 481-540 541-600 129,411 33,808 12,828 6,691 3,815 2,426 1,657 1,190 853 599 2008 Patients by Service Days • 85% receive care/ discharged within 2 episodes • 10% received care within 4 episodes • 5% - Chronic Subset Days Patients Percentage 1-60 129,411 66.96% 61-120 33,808 17.49% 121-180 12,828 6.64% 181-240 6,691 3.46% 241-300 3,815 1.97% 301-360 2,426 1.25% 361-420 1,657 0.86% 421-480 1,190 0.62% 481-540 853 0.44% 541-600 599 0.31% Total 193,278 100.00% Patient Length of Stay |
 0% 10% 20% 30% 40% 50% 60% 70% 1-60 61-120 121-180 181-240 241-300 301-360 361-420 421-480 481-540 541-600 2008 2007 Patient Length of Stay – 2008 vs. 2007 |
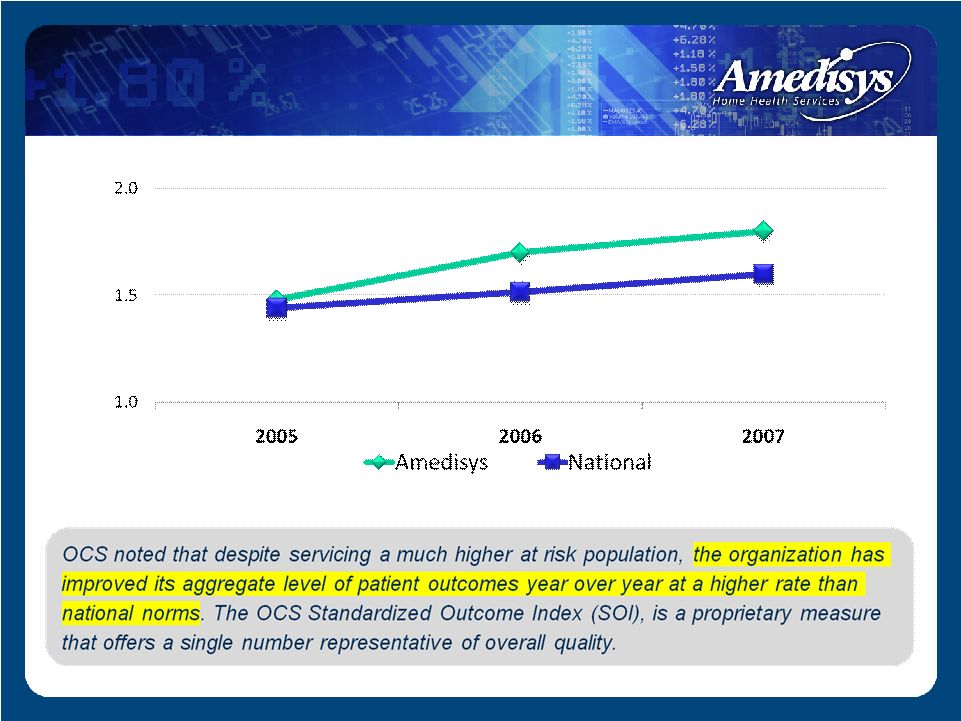 Standardized Outcome Index Standardized Outcome Index |
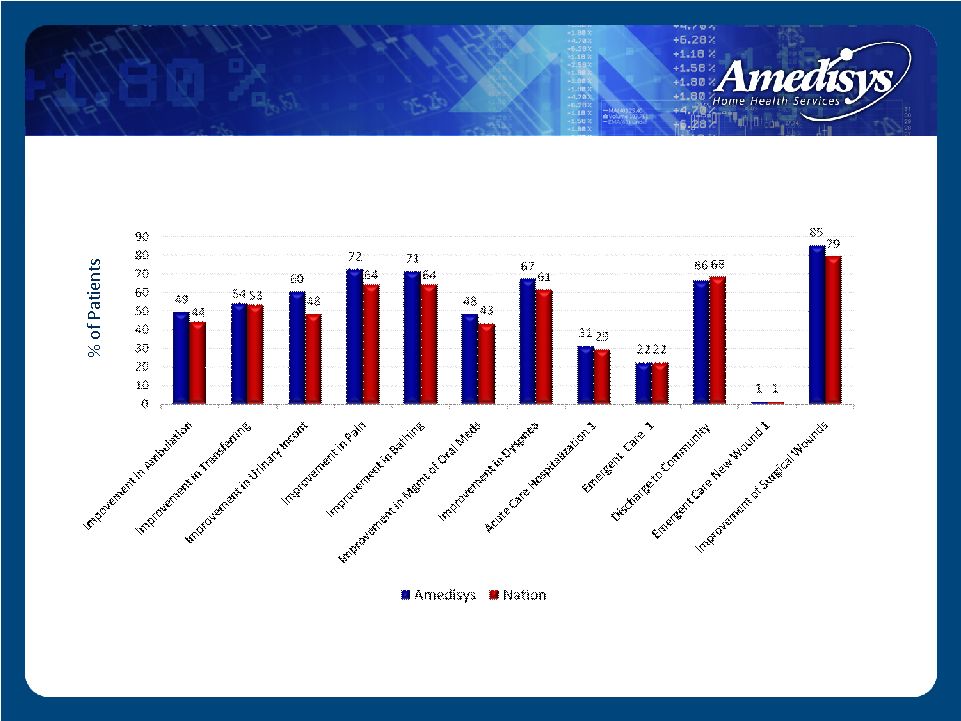 Outcomes – June 2008 Amedisys vs. Nation 1 Lower % is better Source: www.medicare.gov Outcomes |
 Advanced age Complex poly pharmacy needs Higher hospitalization risk Increasing functional trends Organizational change in diagnostic subsets serviced Trend of improving quality Clinical Summary |
 Point of Care Point of Care Encore Encore • Standardizing the assessment • Identifying acute exacerbations in the community • Outcome based care Linking at home clinical events to physician oversight Integrated DM outreach services Mercury Doc Care Delivery Model |
 Level Action Review State Local regulatory audits are conducted by state surveyors to ensure compliance with Medicare regulations If an agency has a condition level survey where issues are not resolved by the return survey, the site’s provider number could be terminated Intermediary (Payment Processor) Intermediaries conduct annual pre and post payment reviews to ensure compliance with Billing Regulations Providers placed on a payment edit will have episodes reviewed for a quarterly period. If the payment denial rate is <15% the provider is removed from the edit. If they demonstrate >15%, the edit will go into the next quarter. >4-5 quarters – potential for statistical sampling. Federal • Cost Report Reviews • RAC Audit Recoveries • Whistle Blower • Federal Investigations All Federal level inquiries could result in monies paid back to the government. Sanctions, reduced market capitalization caused by compliance concern. Three Levels of Review for a Medicare Provider |
 State Survey Level Three types of survey citations: Deficiency Free (perfect) Standard Level Condition Level Our clinical strategy: Mine all deficiencies Root cause analysis Embed advanced care protocols |
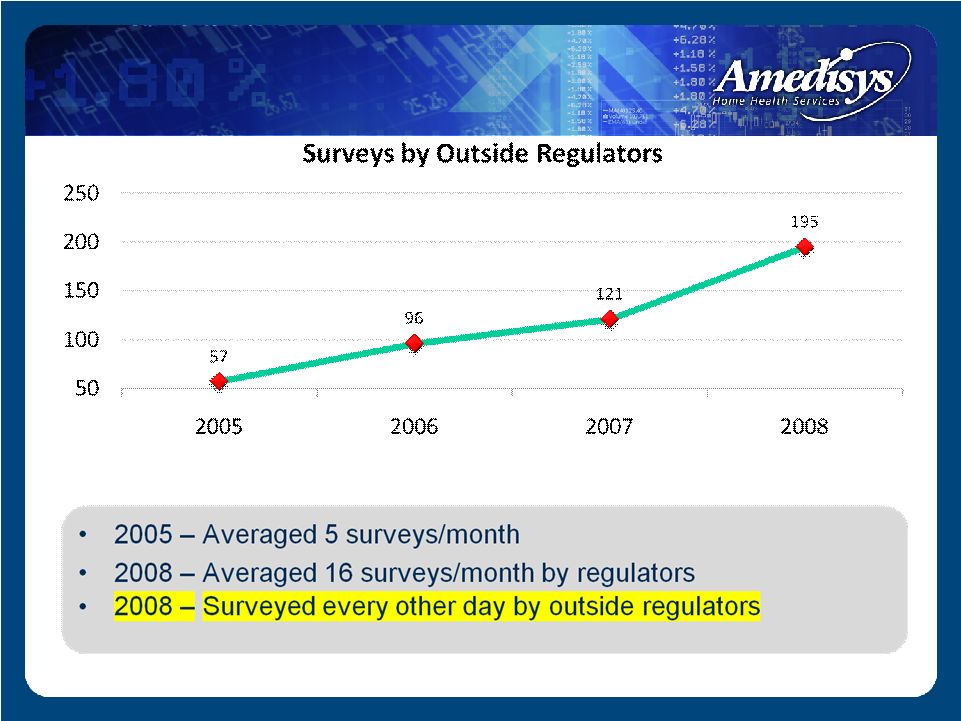
 57 50 100 150 200 250 2005 2006 2007 2008 Surveys by Outside Regulators • 2005 – Averaged 5 surveys/month State Survey Level |
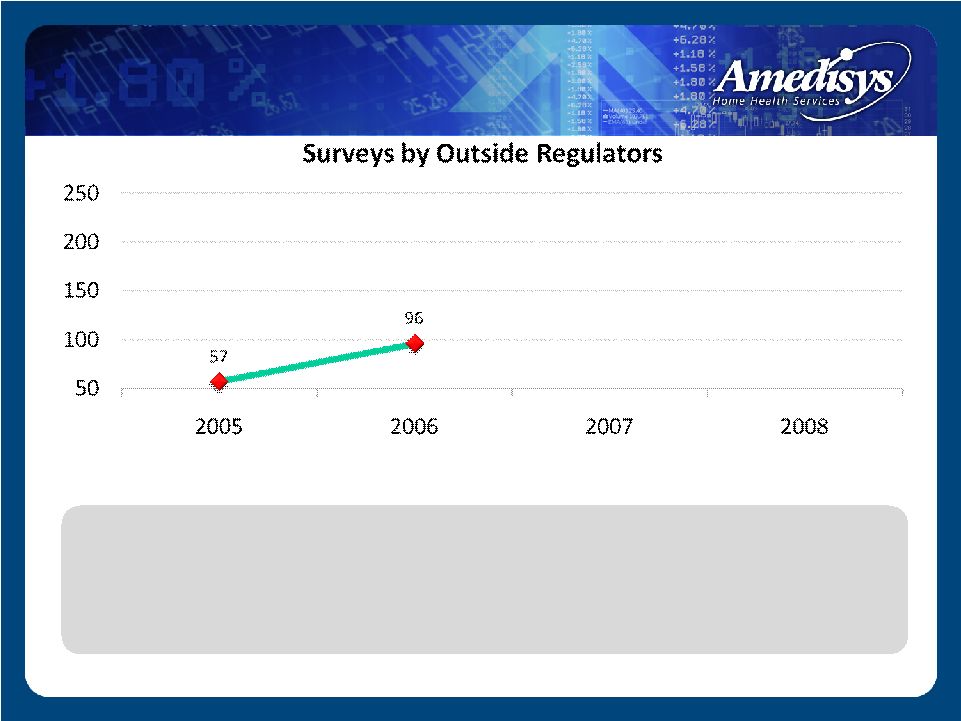 • 2005 – Averaged 5 surveys/month State Survey Level |
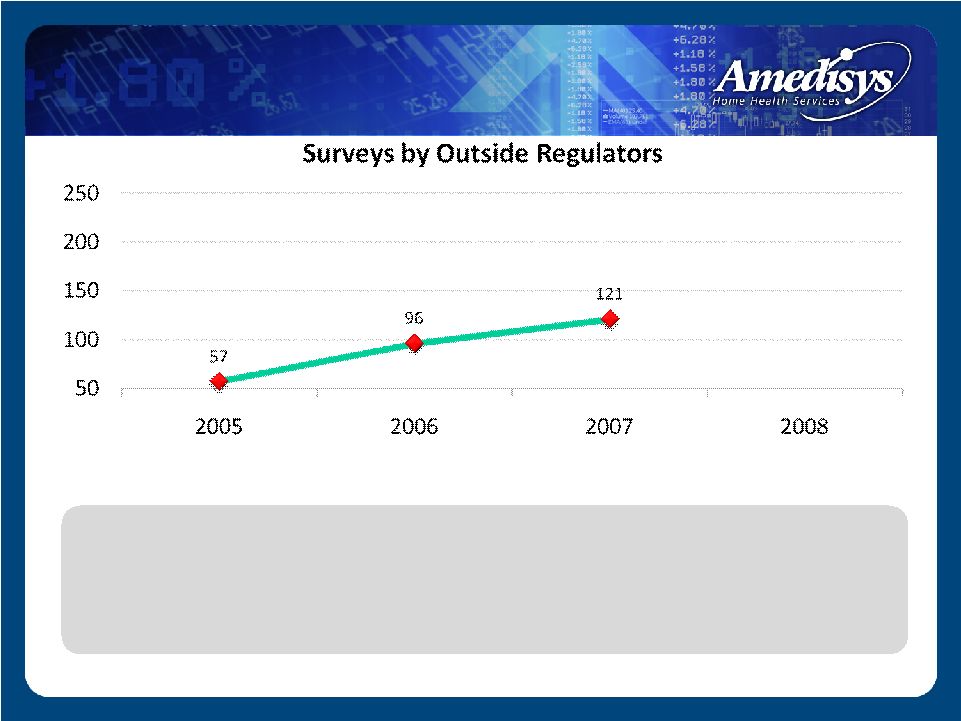 • 2005 – Averaged 5 surveys/month State Survey Level |
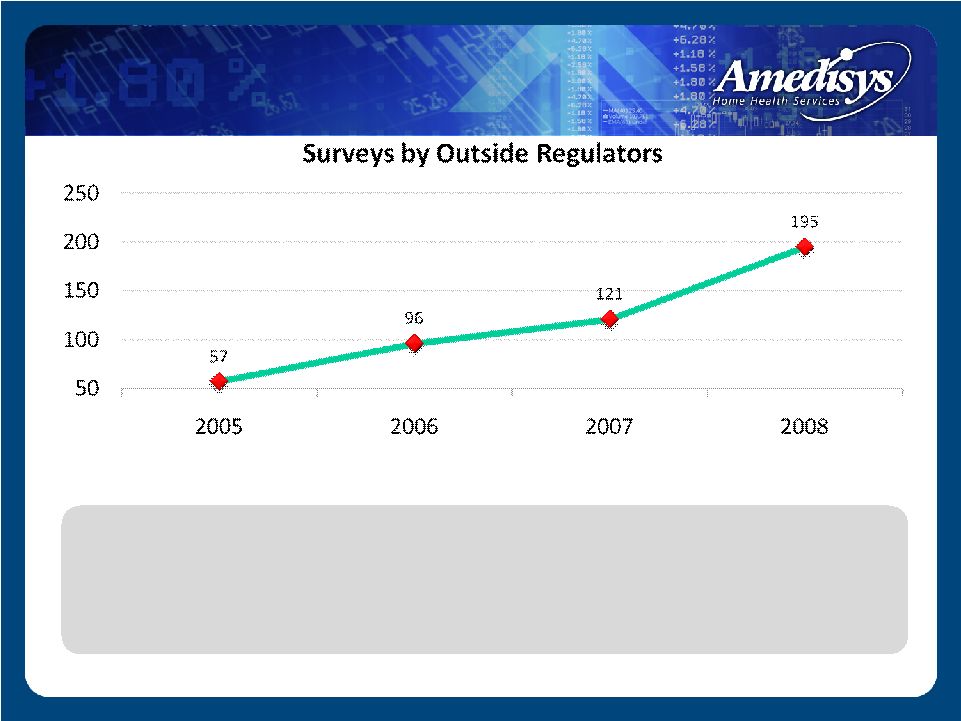 • 2005 – Averaged 5 surveys/month • 2008 – Averaged 16 surveys/month by regulators State Survey Level |
 State Survey Level |
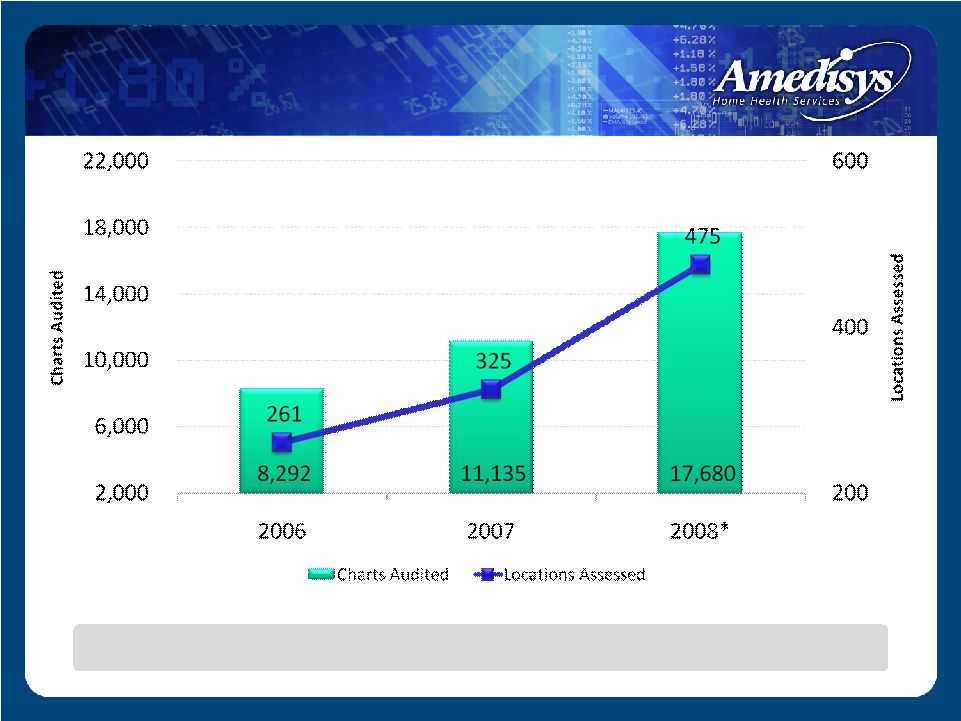 A commitment to ongoing improvement of Clinical Practice Internal Clinical Audits |
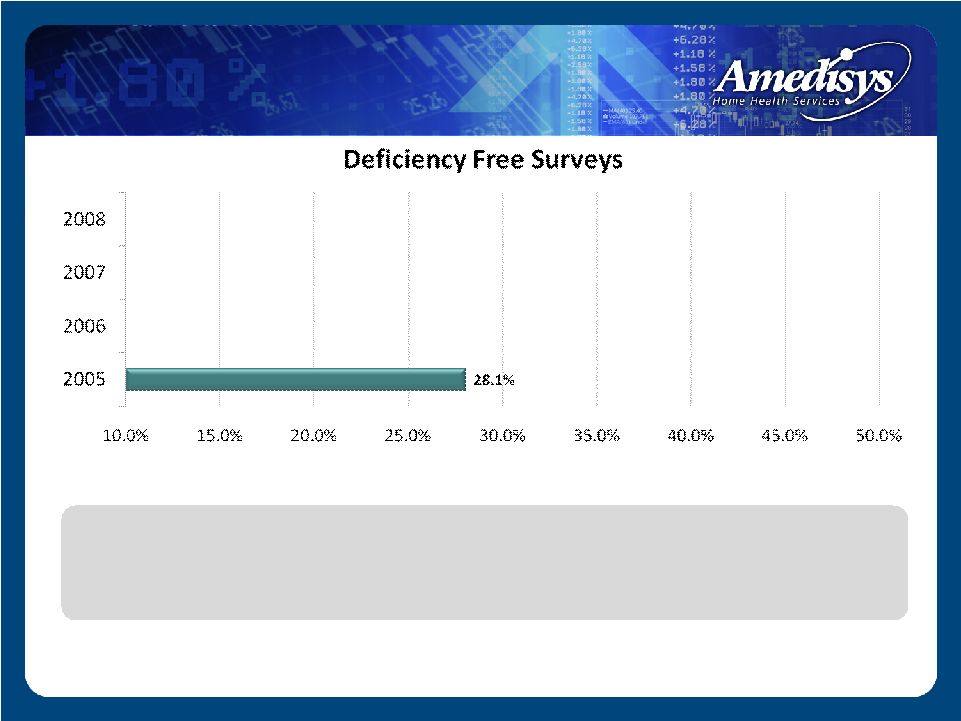 • 2005 – Perfect surveys averaged approx. 1 quarter of all monthly surveys State Survey Level – Perfect Surveys |
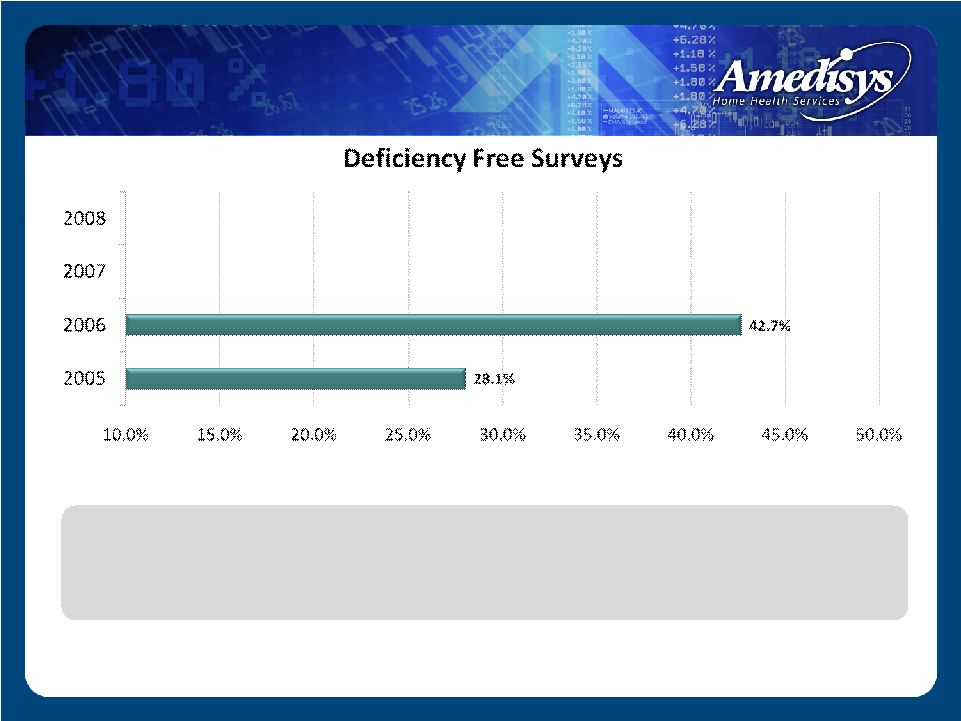 • 2005 – Perfect surveys averaged approx. 1 quarter of all monthly surveys State Survey Level – Perfect Surveys |
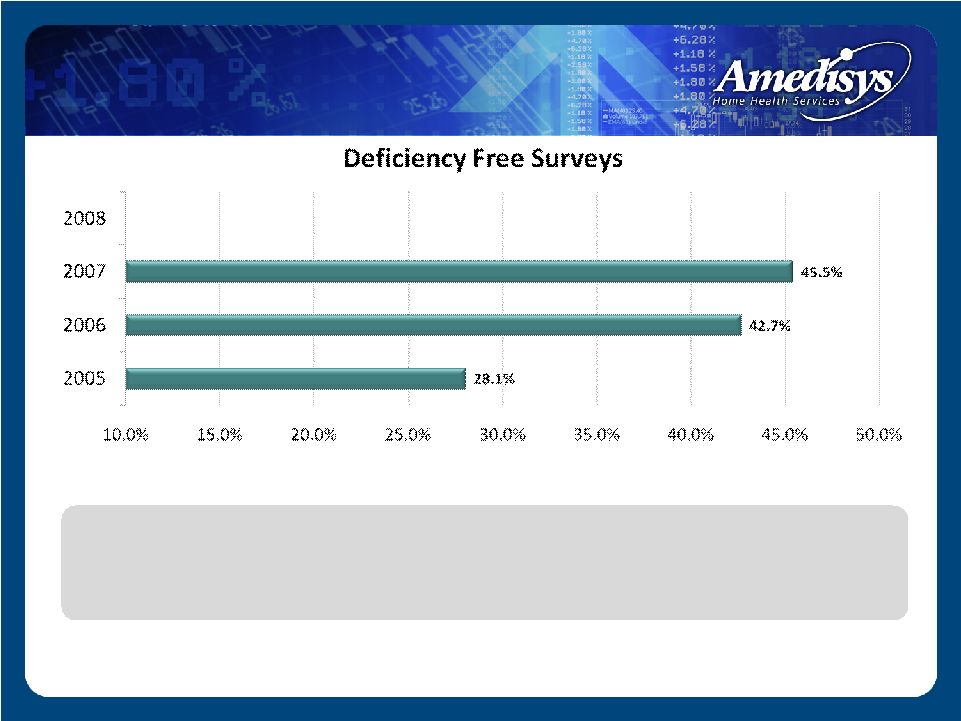 • 2005 – Perfect surveys averaged approx. 1 quarter of all monthly surveys State Survey Level – Perfect Surveys |
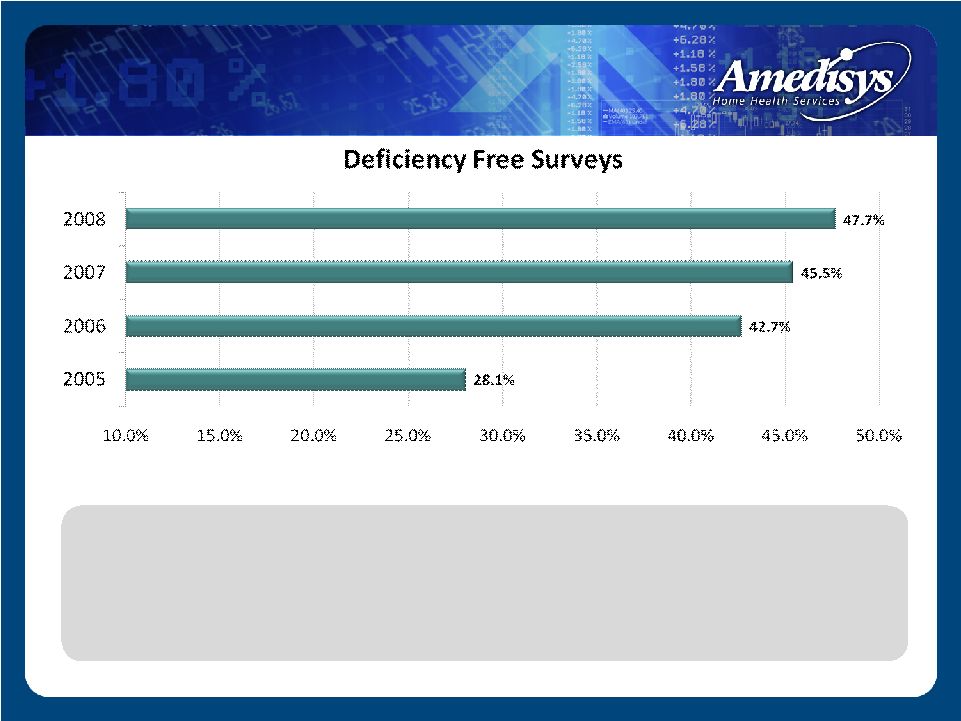 • 2005 – Perfect surveys averaged approx. 1 quarter of all monthly surveys • 2008 – Perfect surveys represent almost half of all monthly surveys conducted by outside regulators State Survey Level – Perfect Surveys |
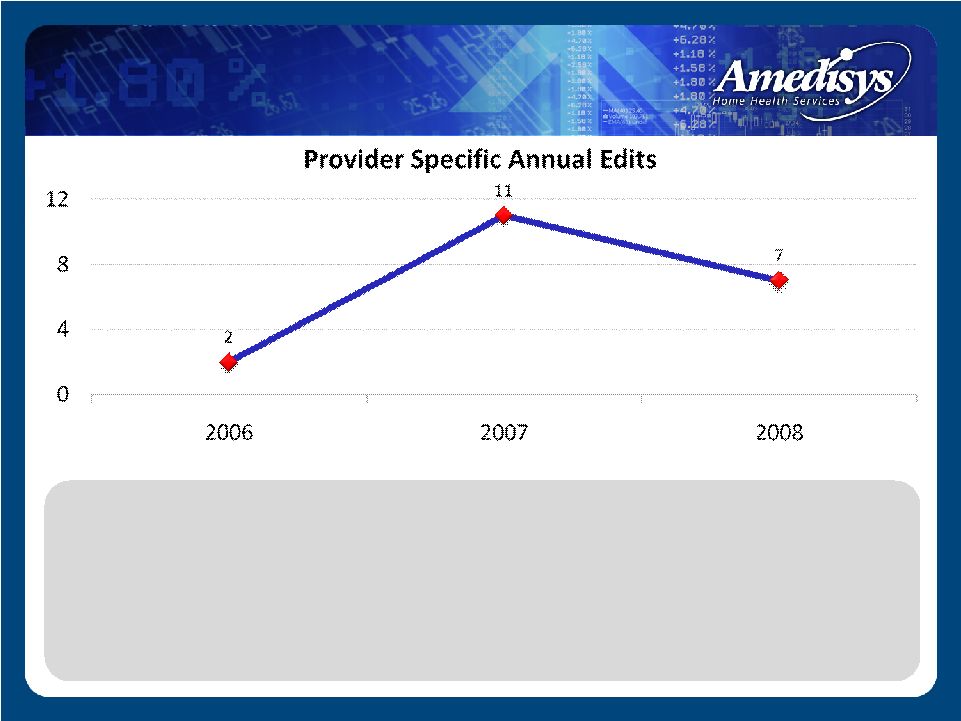 • As a system, average 2-11 provider edits annually • No trend of concerning pre or post payment denials • No provider number has ever extended into a 4th quarter edit • No provider in the history of Amedisys has ever had a statistical sampling applied to recoup monies Intermediary Level |
 No Known: Cost report impropriety inquires RAC audits Whistleblower allegations Active federal investigations Federal Level |
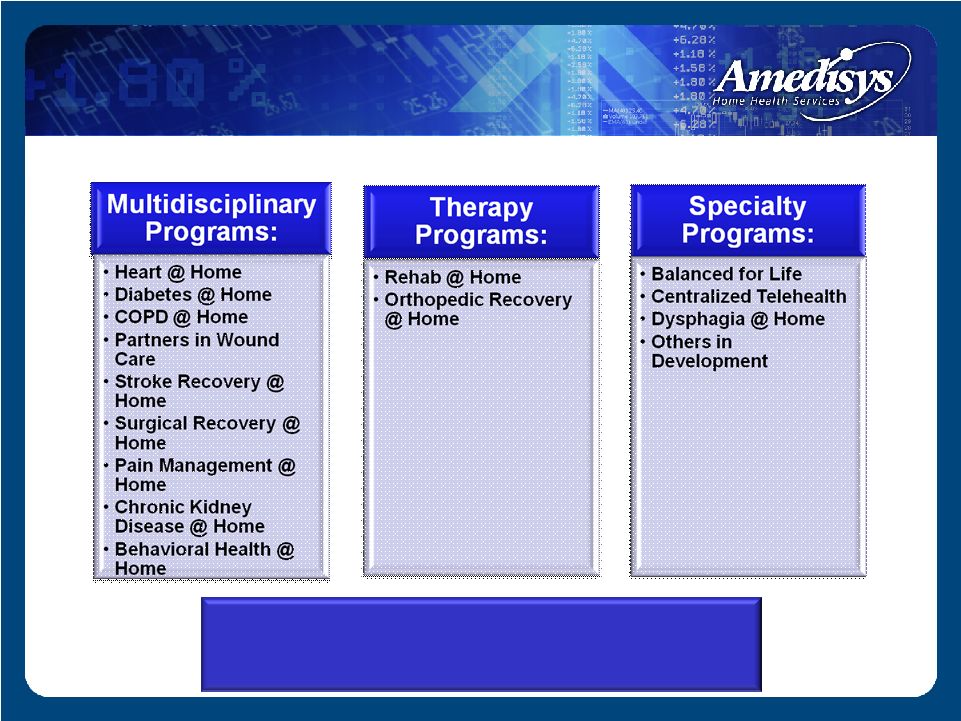
 Care Management Programs 14 care management programs Evidenced based standards of care Process of identification Clinical credentialing Growth/outcome tracking Center of Clinical Excellence recognition |
 Category Clinician Count Advanced Diabetes 4,639 Advanced Cardiac 4,973 Advanced Stroke 2,999 Advanced Wound 2,146 Total 14,757 Clinical Credentialing Achieved Category Units Awarded Diabetes 20,876 Cardiac 17,406 Stroke 8,997 Wound 10,730 Total 58,009 Continuing Education Units 2008 Summary • Credentialing Awarded – 14,757 • CEUs Awarded – 58,009 Clinician Credentialing – 2008 |
 Competitive Advantage Industry leader in clinical outcomes Year over year trend – improved quality and reduced survey risk A commitment to embedding research based practice into our care protocols Engrained clinical competencies/credentialing infrastructure Advanced care management platform Successful at servicing the high acuity patient with complex co-morbid needs |
 Next 24 – 36 Months Continued clinical outcome improvements Continued growth of deficiency-free surveys/reduced regulatory risk Continued reduction of the Hospitalization Rate Continued migration of our technical platform – CCM Predictive, stratified, patient-centered care Our Clinical Future |
 Future Clinical Delivery Models A nationwide standardized care delivery model that predicatively stratifies all patients and delivers a higher level of advanced treatments based upon patient centered need Our Clinical Future |
 Compliance Jeffrey D. Jeter Chief Compliance Officer |
 Data Consistency Edits RETROSPECTIVE CLAIMS REVIEWS PRE-BILLING COMPLIANCE COMMITTEE Bill Borne – Chief Executive Officer Beth Boulet—Sr. VP-Internal Audit Larry Graham –President/Chief Operating Officer Jeffrey Jeter—Chief Compliance Officer Cindy Philips—Sr. VP-Human Resources Dale Redman—Chief Financial Officer Paula Scarton—Vice President-Compliance Alice Ann Schwartz—Chief Information Officer Point Of Care Pre-Billing Audits Compliance Oversight Audits Special/ Workplan Audits ENFORCEMENT - Zero Tolerance Policy Complaint Audits COMPLIANCE REPORTING - Compliance Hotline - HIPAA Hotline - SOX Hotline - Employee Exit Interviews - Monthly Compliance Polling COMPLIANCE TRAINING - New Hire online Compliance Training - New Employee Orientation - Business Development Training (Anti-Kickback) - Billing Compliance Training - Annual Employee Compliance Training - HIPAA Compliance Training SCREENING - OIG Exclusion Database - Criminal Background Checks - DMV Record Check Quality Care Coord. HIPAA Records Mgt Physician Consultant Program BOARD OF DIRECTORS CHIEF COMPLIANCE OFFICER COMPLIANCE DEPT. STAFF Compliance Infrastructure |
 Tiered and Targeted Compliance Training All employees receive General Compliance Training upon hire and annually New employees participate in special compliance training as part of New Employee Orientation Employees involved in the billing process are required to complete additional compliance training annually Employees working in Business Development roles receive additional training specific to their function Compliance Training |
 Compliance Training |
 Point of Care All employees receive General Compliance Training upon hire and annually Improves accuracy and completeness of documentation Significant compliance controls – such as automated mileage calculation, electronic patient signatures, time/date stamping Enhances data consistency Enables centralized monitoring and data aggregation Compliance Technology |
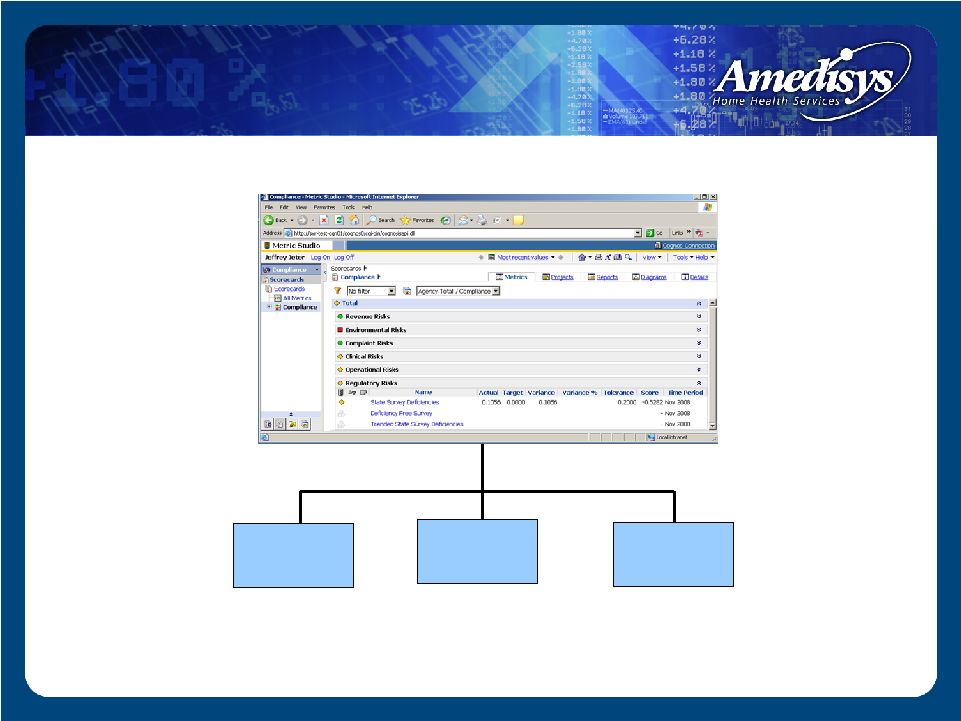
 Compliance Scorecard Risk-based auditing format—focusing on conditions that are suggestive of potential compliance problems Integrates specific risk measures from across various internal vantage points Utilizes peer aberrance analysis, which is a comparative methodology similar to that undertaken by the fiscal intermediary and the government Compliance Technology |
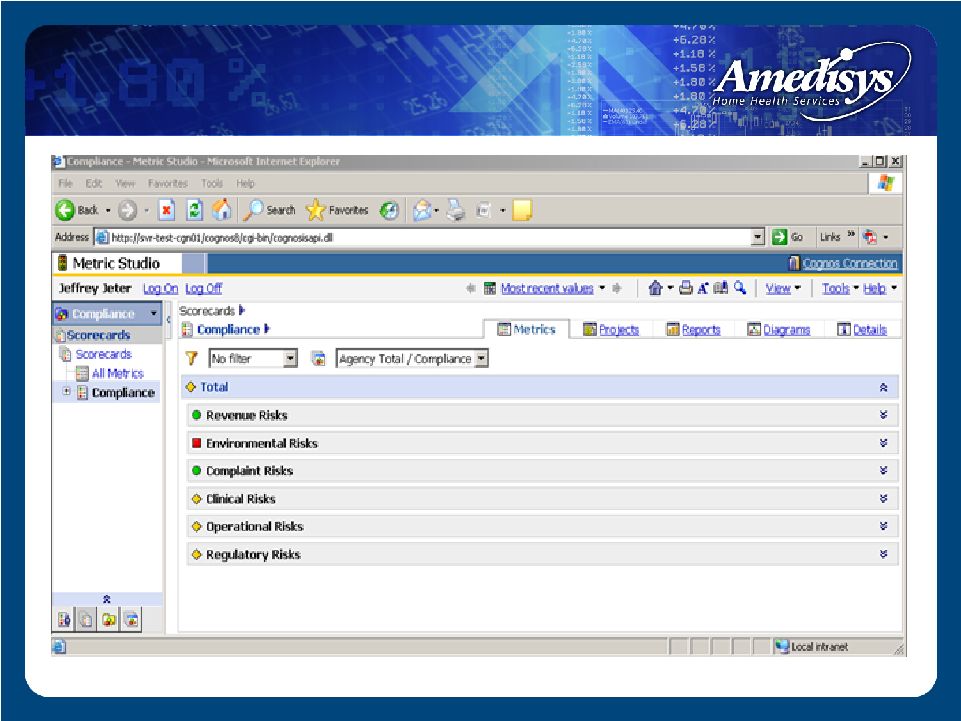 Compliance Technology / Compliance Scorecard Consolidated Compliance Scorecard—Company-wide |
 Compliance Technology Physician Consultant Payment Tracking Monitors payments to Medical Directors Tracks contract status and payments and will not allow payments to be issued that are not consistent with Anti- Kickback and Stark Safe Harbors Oversight of all physician contracts and payments is maintained by the Compliance Department |
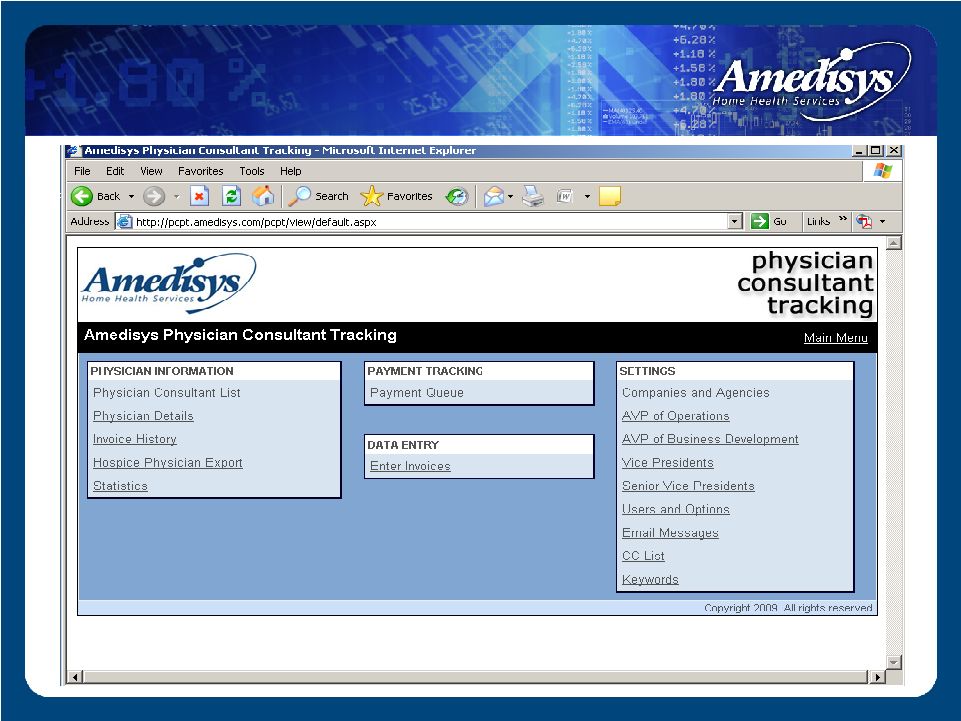 Compliance Technology / PCPT |
 Compliance Audit Process Types of Compliance Audits: 1. Compliance Oversight Audits • Scorecard Audits 2. Complaint Audits • Compliance Hotline • Exit Interviews • Internal Polling 3. Special Audits / Work Plan Audits • Florida Outlier Audit • Balanced for Life Audit • HIPAA Security Audits 4. Referral Audits • Quality Care Coordinator Requests • Operational Leadership Requests |
 Compliance Audit Protocols Audit Process: Agencies are selected by Compliance Department based on risk factors Sample size is determined by the agency’s average census Charts are reviewed by Clinical Audit Managers, who issue a report containing their clinical findings, as well as recommendations for remedial actions Agencies with unacceptable audit results are placed in queue for follow-up audit 6 months post-remediation |
 Compliance Oversight Audits Evolution Of Compliance Oversight Audit Process February of 2005—Compliance Oversight Audit Process commences Initially focused on high-impact revenue events: (1) High Therapy (2) Low LUPAs (3) High Case Mix - Emphasis on agencies performing better than Company norms 2008—Compliance Dashboard expands risk measures; automation and scorecards launched |
 Change in Leadership SOX Complaints HIPAA Hotline Acquisition Status Start-Up Status Clinical Oversight Risk Stratification Rookie DOO Compliance Hotline Employee Polling Exit Interviews Case Mix Marginal Visits Billing without Orders Standardized Frequencies FMR Status ADR Status High Risk Clinical Events Reverse Surveys Trended Surveys State Surveys Patient Satisf. Surveys Average Visits/ Episode Eee/Contractor Ratio Total Turnover High Internal Growth High Revenue Programs Clinical Oversight Audit Results Low LUPAs Trended High Therapy COP Audit Results Timely DC & Past Due Recerts SYS Holds Late OASIS Locks Unmet Weekly Frequency Outstanding Orders PI Audit Results High Therapy I (14-19 visits) High Therapy II (20+ visits) Missed Visits/ Homebound Status Questionable Recertifications Trended Low LUPAs High Gross Margin Comprehensive Compliance Risk Criteria: Compliance Oversight Audits |
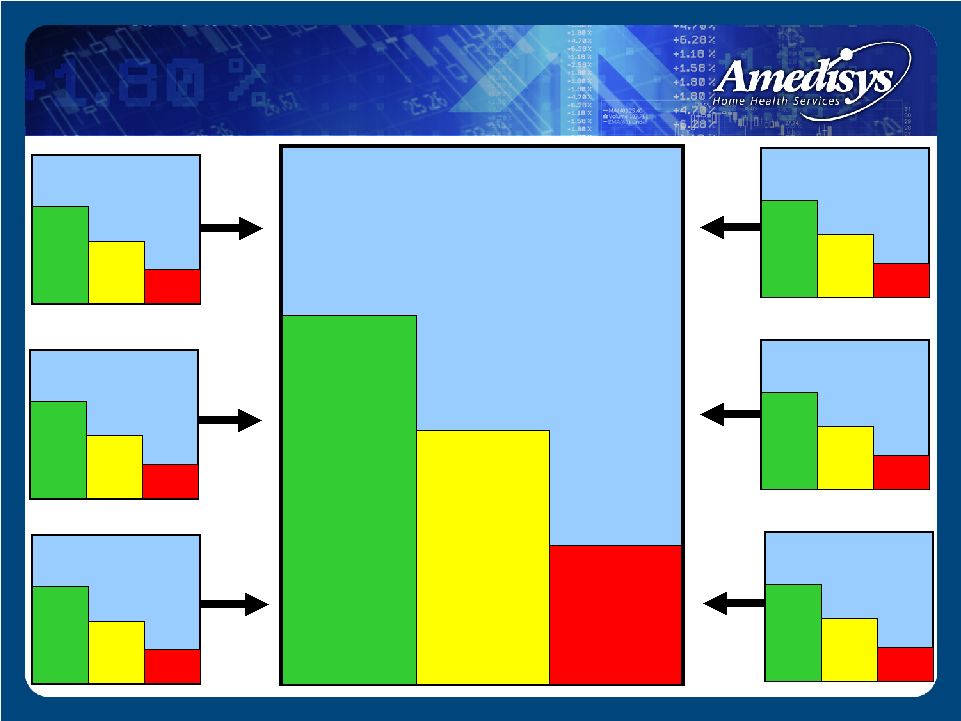 Consolidated Compliance Risk 100% Roll-Up # Company Average Up to 2 Standard Deviations $ 2 Standard Deviations Operational Risks # Company Average Up to 2 Standard Deviations $ 2 Standard Deviations Clinical Risks # Company Average Up to 2 Standard Deviations $ 2 Standard Deviations Revenue Risks # Company Average Up to 2 Standard Deviations $ 2 Standard Deviations Complaint Risks # Company Average Up to 2 Standard Deviations $ 2 Standard Deviations Regulatory Risks # Company Average Up to 2 Standard Deviations $ 2 Standard Deviations Environmental Risks # Company Average Up to 2 Standard Deviations $ 2 Standard Deviations Compliance Scorecard |
 Compliance Scorecard: Revenue Risks Subgroup Gross Margin Percentage Homebound Missed Visits Low LUPA High Case Mix Trended Low LUPAs Questionable Recerts High Revenue Programs (BFL) High Case Mix Billing without Orders High Therapy 1 (14-19 visits) High Therapy 2 (20+ visits) Trended High Therapy |
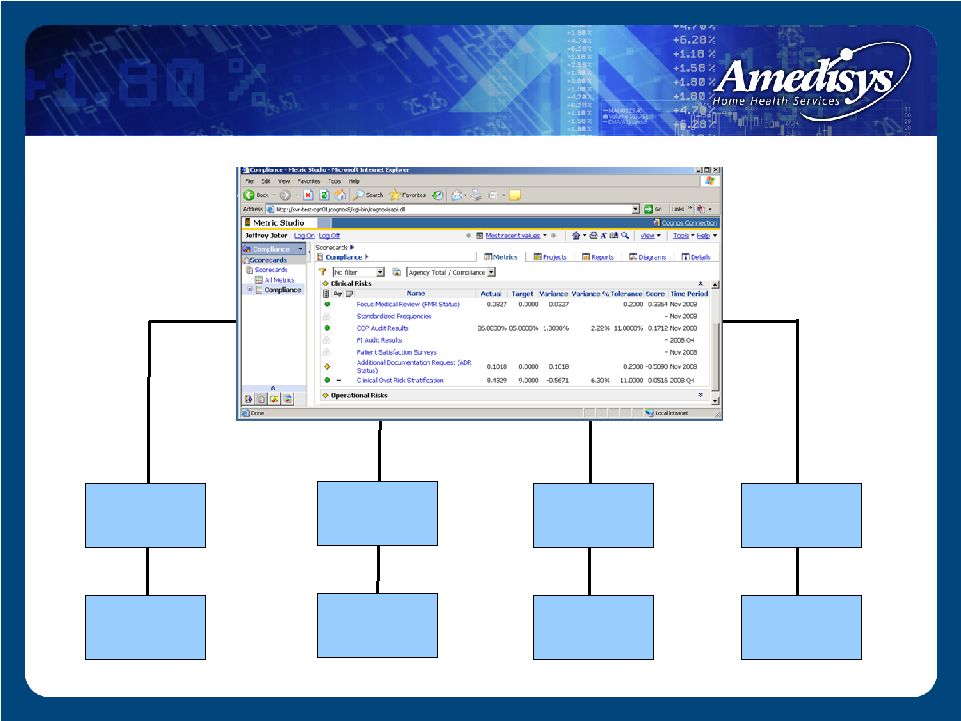 Compliance Scorecard: Compliance Scorecard: Clinical Risks Subgroup Clinical Risks Subgroup Standardized Frequencies PI Audit Results Clinical Oversight Risk Stratification High Risk Clinical Events ADR Status FMR Status COP Audit Results Patient Satisfaction Surveys |
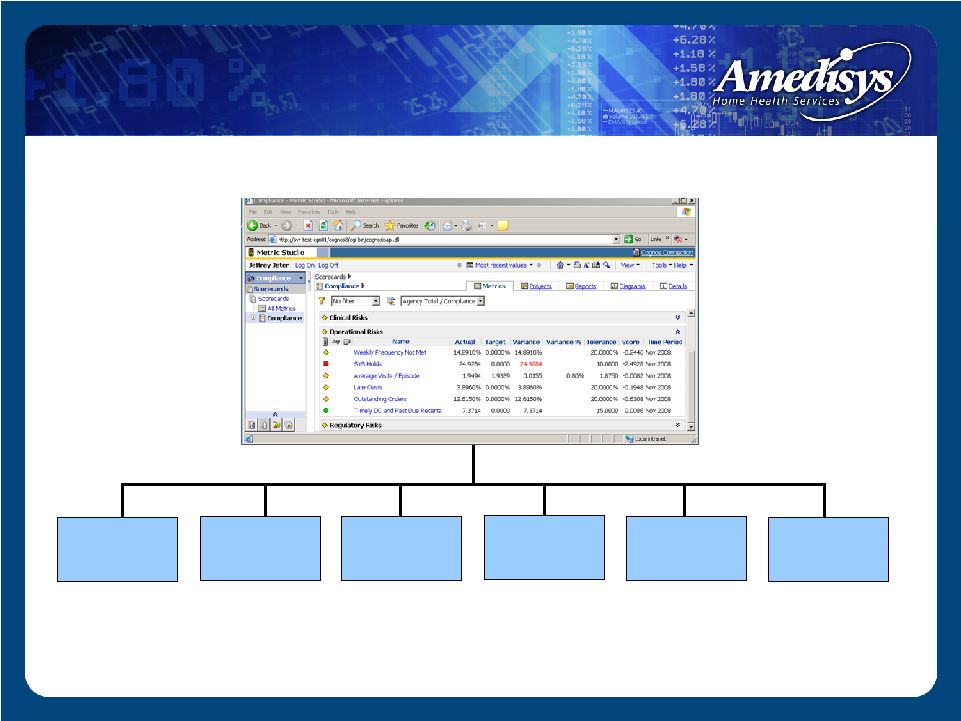 Compliance Scorecard: Compliance Scorecard: Operational Risks Subgroup Operational Risks Subgroup Timely DC & Past Due Recerts Late OASIS Locks Outstanding Orders SYS Holds Average Visits Per Episode Weekly Frequency Not Met |
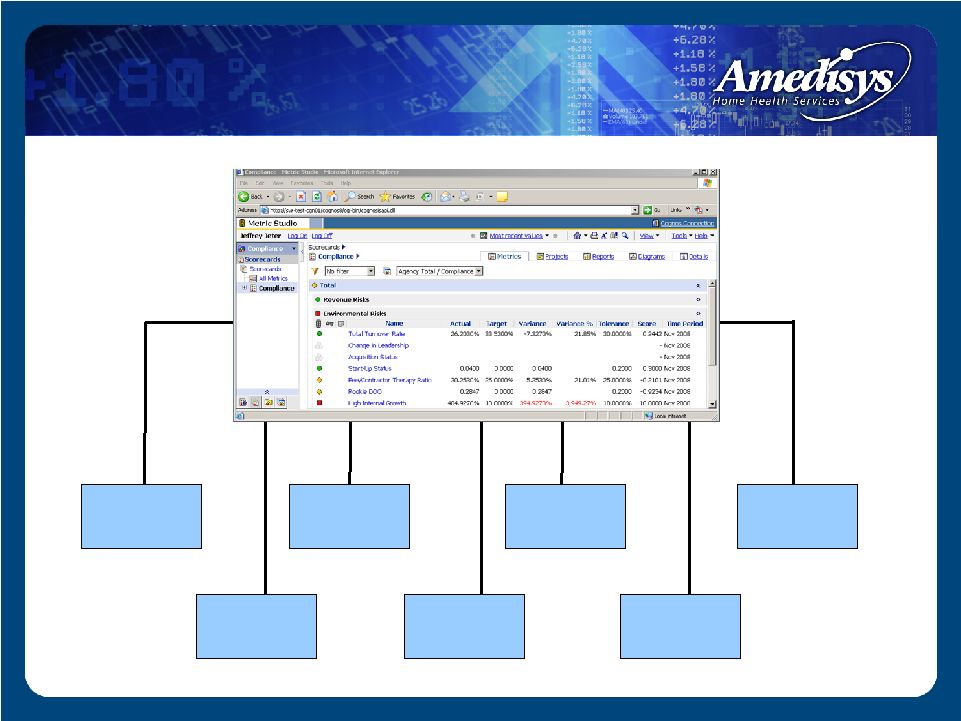 Compliance Scorecard: Compliance Scorecard: Environmental Risks Subgroup Environmental Risks Subgroup Start-Up Status High Internal Growth Employee-to- Contractor Ratio Acquisition Status Change in Leadership Total Turnover Rookie DOO |
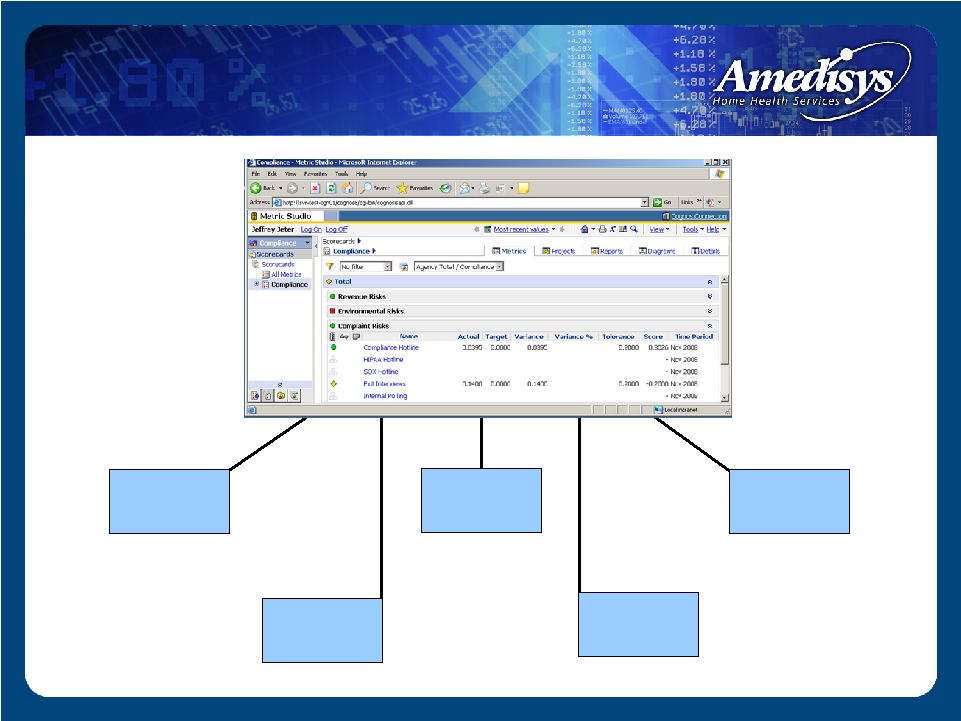 Compliance Scorecard: Compliance Scorecard: Complaint Risk Subgroup Complaint Risk Subgroup HIPAA Hotline SOX Complaints Employee Polling Exit Interviews Compliance Hotline |
 Compliance Scorecard: Compliance Scorecard: Regulatory Risk Subgroup Regulatory Risk Subgroup Trended Survey Deficiencies Deficiency-Free Survey ( - ) State Survey Deficiencies |
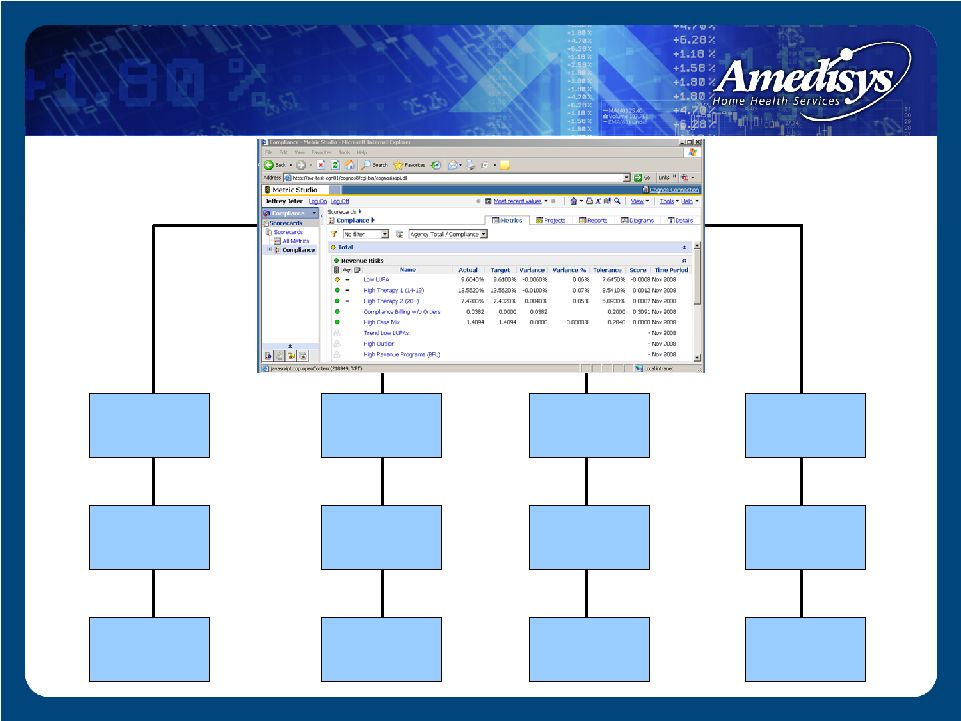
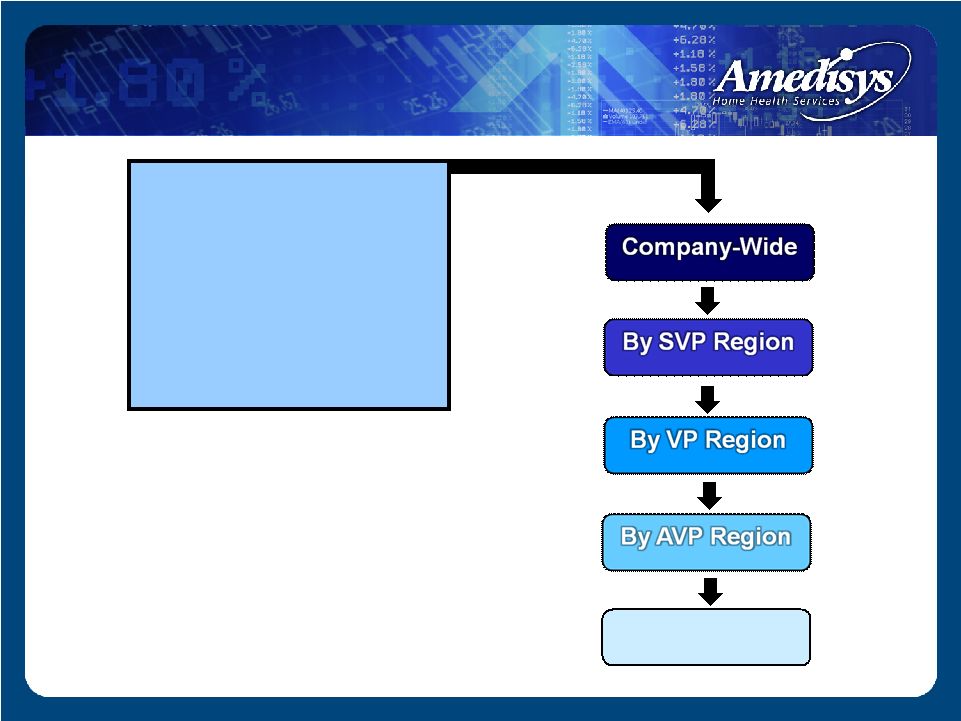 Compliance Scorecard: Drill-Down Capabilities Consolidated Compliance Risk Risk Subgroup Individual Metric or or By Agency By Agency |
 Corporate Compliance Audits Clinical Oversight Audits Quality Management Audits Internal Audit Quality Care Coordinator Reviews Sarbanes Oxley Audits External Auditor (KPMG) Audits State Surveys Fiscal Intermediary Review Comprehensive Audit Universe |
 Compliance Enforcement Amedisys Corporate Compliance Plan Based on OIG Model Compliance Plans for home health and hospice Basic “Zero Tolerance Policy” Because of the risks posed to the Company and its shareholders by fraudulent behavior, Amedisys will take a zero tolerance policy relative to fraud, abuse and waste involving federal health care programs Expanded “Zero Tolerance Policy” Certain conduct – such as an employee circumventing anti-fraud controls – while not per se fraud, is regarded as a violation of the Compliance Plan resulting in disciplinary action |
 Toll-Free Hotlines Compliance Hotline SOX Whistleblower Hotline HIPAA Privacy Hotline Toll Free, Available 24 hours/day, 7 days/week Confidential, anonymous, non-retaliation policy Exit Surveys Given to all employees leaving Amedisys Specific compliance-related questions Follow-up audits launched where necessary Monthly Compliance Polling 90 active employees contacted monthly Voluntary telephone questionnaire with CCO Home health and hospice-specific questions Follow-up audits launched where necessary Compliance Reporting |
 Summary Tiered and targeted training Compliance-centric technology Risk-based auditing Zero tolerance Varied reporting mechanisms |
 Financials Dale Redman Chief Financial Officer |
 Strong revenue growth EPS growth of greater than 20% for six consecutive years Stable margins Low leverage High cash flow Financial Highlights |
 Financial Highlights |
 ($ millions, except per share data) Summary Financial Results 2006 2007 2008 Net revenue $541.1 $697.9 $1,187.4 Period-over-period growth 41.8% 29.0% 70.1% Gross margin 288.9 368.9 624.8 Margin 53.4% 52.9% 52.6% CFFO 43.0 93.1 150.7 Adjusted EBITDA 1 75.7 109.8 181.4 Margin 14.0% 15.7% 15.3% Adjusted fully-diluted EPS 2 $1.72 $2.32 $3.31 1 Adjusted EBITDA is defined as net income before provision for income taxes, net interest expense, and depreciation and amortization plus certain TLC integration costs and less the Alliance gain. Adjusted EBITDA should not be considered as an alternative to, or more meaningful than, income before income taxes, cash flow from operating activities, or other traditional indicators of operating performance. This calculation of Adjusted EBITDA may not be comparable to a similarly titled measure reported by other companies, since not all companies calculate this non-GAAP financial measure in the same manner. 2 Adjusted diluted earnings per share is defined as diluted earnings per share plus the earnings per share effect of certain TLC acquisition costs and less the earnings per share effect of the Alliance gain. Adjusted diluted earnings per share should not be considered as an alternative to, or more meaningful than, income before income taxes, cash flow from operating activities, or other traditional indicators of operating performance. This calculation of Adjusted diluted earnings per share may not be comparable to a similarly titled measure reported by other companies, since not all companies calculate this non-GAAP financial measure in the same manner |
 2007 2008 2006 Agencies at period end Period-over-period growth Episodic-Based Completed Episodes Period-over-period growth Episodic-Based Admissions Period-over-period growth Episodic-Based Revenue per Episode Period-over-period growth Total Visits Period-over-period growth 354 30.9% 4,302,830 25.2% 129,649 19.9% 219,855 27.1% $2,660 1.0% 275 24.4% 3,437,881 45.4% 108,140 32.7% 172,930 42.9% $2,634 2.6% Summary Performance Results 528 48.3% 7,004,200 62.8% 199,371 53.8% 353,076 60.6% $2,854 7.3% |
 Summary Balance Sheet ($ in millions) Dec. 31, 2007 Assets Cash Accounts Receivable, Net Property and Equipment Goodwill Other Total Assets Liabilities and Stockholders’ Equity Debt All Other Liabilities Stockholders’ Equity Total Liabilities and Stockholders’ Equity Leverage Ratio $ 2.8 175.7 79.3 733.9 78.5 $ 1,070.2 $ 328.6 180.3 561.3 $ 1,070.2 1.6x $ 56.2 96.3 68.3 332.5 33.8 $ 587.1 $ 24.0 116.1 447.0 $ 587.1 0.2x Dec. 31, 2008 $ 25.2 144.1 75.4 734.2 58.8 $ 1,037.7 $ 417.4 151.9 468.4 $ 1,037.7 2.4x Mar. 31, 2008 |
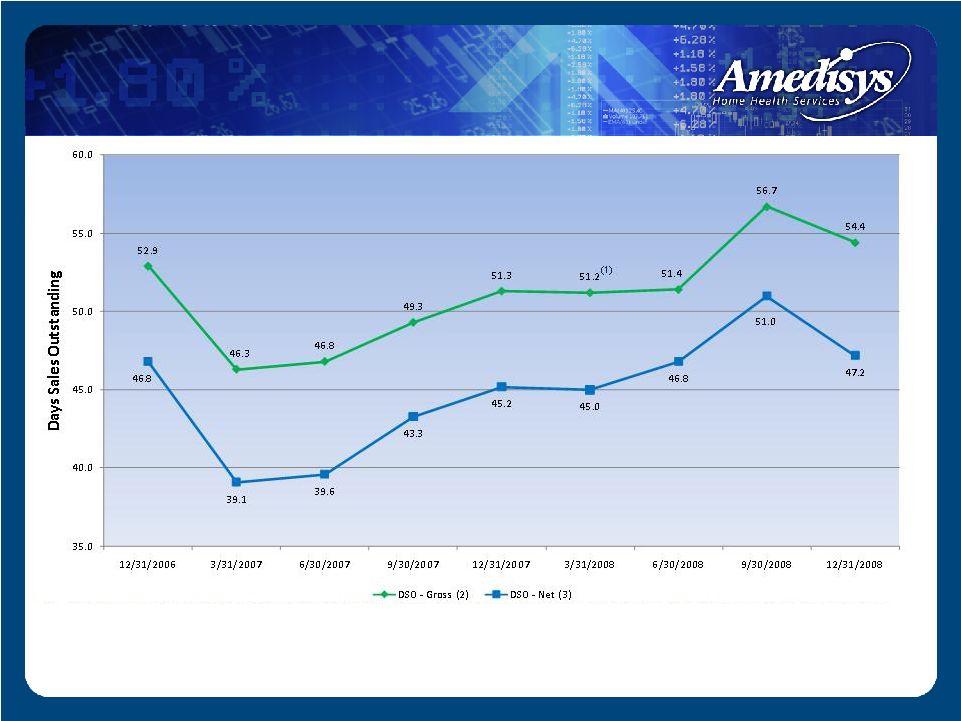 Days Revenue Outstanding (DSO) (1) For the three-month period ended March 31, 2008, our calculation of days revenue excludes the patient accounts receivable assumed in the TLC Health Care Services, Inc. (“TLC”) and Family Home Health Care, Inc. and Comprehensive Home Healthcare Services, Inc. (“HMA”) acquisitions at March 31, 2008 by our average daily net patient revenue, excluding the results of TLC and HMA for the three- month period ended March 31, 2008. (2) Our calculation of days revenue outstanding (gross) is derived by dividing our period ending gross patient accounts receivable (defined as the summation of our Medicare patient accounts receivable, net of estimated revenue adjustments and our other outstanding patients accounts receivable, before considering the allowance for doubtful accounts) at December 31, 2008, 2007 and 2006 by our average daily net patient revenue for the three-month periods ended December 31, 2008, 2007 and 2006, respectively. (3) ) Our calculation of days revenue outstanding (net) is derived by dividing our ending net patient accounts receivable (i.e. net of estimated revenue adjustments and allowance for doubtful accounts) at December 31, 2008, 2007 and 2006 by our average daily net patient revenue for the three-month periods ended December 31, 2008 and 2007, respectively. |
 December 31, 2007 December 31, 2008 Medicare 78,502 $ 136,869 $ Estimated revenue adjustments (3,622) (7,220) Medicare patient accounts receivable, net 74,880 129,649 Non-Medicare 34,397 73,101 Allowance for doubtful accounts (12,968) (27,052) Non-Medicare patient accounts receivable, net 21,429 46,049 Patient accounts receivable, net 96,309 $ 175,698 $ Accounts Receivable Note: On average we collect over 99% of our Medicare revenue. On average we collect approximately 87% of our non-Medicare revenue Combined we collect approximately 97.5% of all revenue December 31, 2007 December 31, 2008 Medicare ERA + Non Medicare ADA $17.1 $30.4 % of Revenue 2.5% 2.6% ($ in thousands) ($ in millions) |
 Liquidity Available line of credit (LOC): 12/31/08 = $160m 2009 Estimated CFFO - Cap Ex - Required Debt Pay = $140m |
 • Earnings before interest, taxes, depreciation and amortization ("EBITDA") and Adjusted EBITDA 2006 2007 2008 Net income 38,255 $ 65,113 $ 86,682 $ Add: Provision for income taxes 23,642 38,298 54,714 Interest expense (income), net 3,710 (3,150) 15,600 Depreciation and amortization 10,106 13,749 20,406 EBITDA (1) 75,713 114,010 $ 177,402 Add: Certain TLC acquisition costs (2) - - 3,991 Less: Alliance (3) - (4,212) - Adjusted EBITDA (4) 75,713 $ 109,798 $ 181,393 $ • Adjusted Net Income Reconciliation 2006 2007 2008 Net income 38,255 $ 65,113 $ 86,682 $ Add: Certain TLC acquisition costs (2) - - 2,446 Less: Alliance (3) - (4,212) - Adjusted net income (5) 38,255 $ 60,901 $ 89,128 $ • Adjusted Diluted Earnings Per Share Reconciliation 2006 2007 2008 Diluted earnings per share 1.72 $ 2.48 $ 3.22 $ Add: Certain TLC acquisition costs (2) - - 0.09 Less: Alliance (3) - (0.16) - Adjusted diluted earnings per share (6) 1.72 $ 2.32 $ 3.31 $ Reconciliation of Non-GAAP Financial Measures to GAAP Financial Statements (1) EBITDA is defined as net income before provision for income taxes, net interest expense, and depreciation and amortization. EBITDA should not be considered as an alternative to, or more meaningful than, income before income taxes, cash flow from operating activities, or other traditional indicators of operating performance. This calculation of EBITDA may not be comparable to a similarly titled measure reported by other companies, since not all companies calculate this non-GAAP financial measure in the same manner. (2) Certain TLC integration costs incurred primarily for the payment of severances for TLC employees and for the conversion of the acquired TLC agencies to our operating systems including our Point of Care network. (3) Alliance Home Health, Inc. (“Alliance”), a wholly owned subsidiary of ours, filed for Chapter 7 federal bankruptcy proceedings in September 2000. That case is now concluded. As a result, the remaining $4.2 million liabilities of Alliance were extinguished and we are not liable for any of these obligations. The discharge of the liabilities resulted in a non-taxable event. (4) Adjusted EBITDA is defined as net income before provision for income taxes, net interest expense, and depreciation and amortization plus certain TLC integration costs and less the Alliance gain. Adjusted EBITDA should not be considered as an alternative to, or more meaningful than, income before income taxes, cash flow from operating activities, or other traditional indicators of operating performance. This calculation of Adjusted EBITDA may not be comparable to a similarly titled measure reported by other companies, since not all companies calculate this non-GAAP financial measure in the same manner. (5) Adjusted net income is defined as net income plus certain TLC acquisition costs and less the Alliance gain. Adjusted net income should not be considered as an alternative to, or more meaningful than, income before income taxes, cash flow from operating activities, or other traditional indicators of operating performance. This calculation of Adjusted net income may not be comparable to a similarly titled measure reported by other companies, since not all companies calculate this non-GAAP financial measure in the same manner. (6) Adjusted diluted earnings per share is defined as diluted earnings per share plus the earnings per share effect of certain TLC acquisition costs and less the earnings per share effect of the Alliance gain. Adjusted diluted earnings per share should not be considered as an alternative to, or more meaningful than, income before income taxes, cash flow from operating activities, or other traditional indicators of operating performance. This calculation of Adjusted diluted earnings per share may not be comparable to a similarly titled measure reported by other companies, since not all companies calculate this non-GAAP financial measure in the same manner. |
 Summary Strong revenue growth EPS growth of greater than 20% for six consecutive years Stable margins Low leverage High cash flow |
 Guidance 1 1 Guidance excludes the effects of future acquisitions, if they are made. 2 Provided as of the date of our Form 8-K filed with the Securities and Exchange Commission on January 6, 2009 and reaffirmed on February 17, 2009 earnings call. Calendar Year 2009 2 Net revenue: $1.425 - $1.475 billion EPS: $4.10 - $4.30 Diluted shares: 27.5 million |
 Q & A |