 November 2010 Exhibit 99.1 Investor Presentation Leading Home Health Care & Hospice |
 Leading Home Health & Hospice Forward-looking statements This presentation may include forward-looking statements as defined by the Private Securities Litigation Reform Act of 1995. These forward-looking statements are based upon current expectations and assumptions about our business that are subject to a variety of risks and uncertainties that could cause actual results to differ materially from those described in this presentation. You should not rely on forward-looking statements as a prediction of future events. Additional information regarding factors that could cause actual results to differ materially from those discussed in any forward-looking statements are described in reports and registration statements we file with the SEC, including our Annual Report on Form 10-K and subsequent Quarterly Reports on Form 10-Q and Current Reports on Form 8-K, copies of which are available on the Amedisys internet website http://www.amedisys.com or by contacting the Amedisys Investor Relations department at (800) 467-2662. We disclaim any obligation to update any forward-looking statements or any changes in events, conditions or circumstances upon which any forward-looking statement may be based except as required by law. 2 www.amedisys.com NASDAQ: AMED We encourage everyone to visit the Investors Section of our website at www.amedisys.com, where we have posted additional important information such as press releases, profiles concerning our business and clinical operations and control processes, and SEC filings. We intend to use our website to expedite public access to time- critical information regarding the Company in advance of or in lieu of distributing a press release or a filing with the SEC disclosing the same information. |
 Leading Home Health & Hospice Management team William F. Borne, Chairman and CEO Founder and CEO since 1982 28 years leading the industry Michael D. Snow, Chief Operating Officer 30 years leading health care operations Wellmont, HealthSouth, HCA Tim Barfield, Chief Development Officer 15 years of corporate development experience Gov. Bobby Jindal , Vinson & Elkins, The Shaw Group Dale E. Redman, CPA, Chief Financial Officer 34 years of senior level financial experience Winward Capital, United Companies Financial 3 Jeffrey D. Jeter, Chief Compliance Officer 14 years of health care law and compliance expertise Former Medicaid prosecutor, LA AG for DOJ Michael O. Fleming, Chief Medical Officer 29 years as a family physician Former President of AAFP, first industry CMO G. Patrick Thompson, Chief Information Officer 23 years of corporate administration experience Arthur Andersen, Turner Industries, The Shaw Group David R. Bucey, General Counsel 24 years of experience in corporate law Coca-Cola Company, McKenna Long & Aldridge |
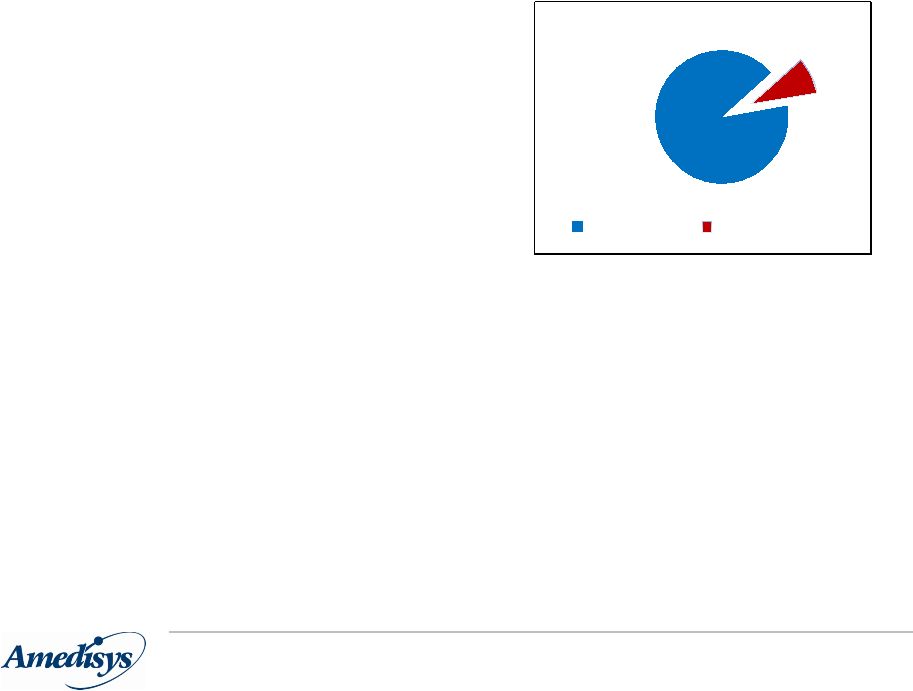 Leading Home Health & Hospice 91% 9% Home Health Hospice Company overview 1 4 • Founded in 1982, publicly listed 1994 • 609 locations in 45 states • Leading provider of home health services - Services include skilled nursing and therapy services • Growing hospice business • 95% of Home Health revenue is episodic based (both Medicare & non-Medicare) 17,200 employees Home Health: - Daily visits = 35,000 - 9.1 million visits run rate in 2010 Hospice: - Average daily census = 2,816 - Average length of stay = 87 days 2010 revenue guidance = $1.645 billion 1 For the quarter ended September 30, 2010 2 Provided as of the date of our Form 8-K filed with the Securities and Exchange Commission on October 26, 2010. Stats Revenue Mix 2 |
 Leading Home Health & Hospice Home Health Division 5 • Industry leader – Strong national footprint – 537 locations across 45 states as of September 30 – $369 million revenue in 3Q 2010 • Strong clinical quality • Experienced divisional leadership • World-class technology platform + enhancing operating platform • Well positioned to capitalize on organic and market opportunities Clinical Focus Industry Leading Technology Consolidator |
 Leading Home Health & Hospice Hospice Division 6 • Solid trajectory of internal growth – 28% YTD growth in 2010; 21% growth over 2009 – $36 million revenue in 3Q 2010 • Record patient census – Average daily census = 2,800+ • Operational efficiencies and quality care processes drive strong margins – Operating income margin = 20% • Partnered with the country’s largest and leading Home Health company – Offering comprehensive continuum of at-home care – Collective resources to drive operational and clinical excellence – Cross referral opportunities to drive growth Essential to the Care Continuum Experts in Pain & Symptom Management Significant Growth Opportunity |
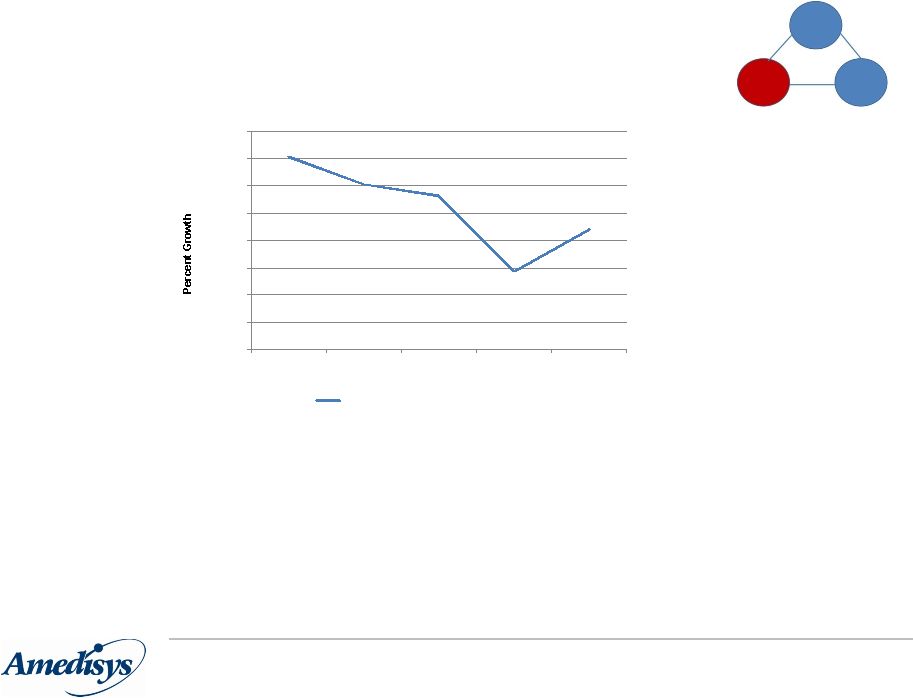
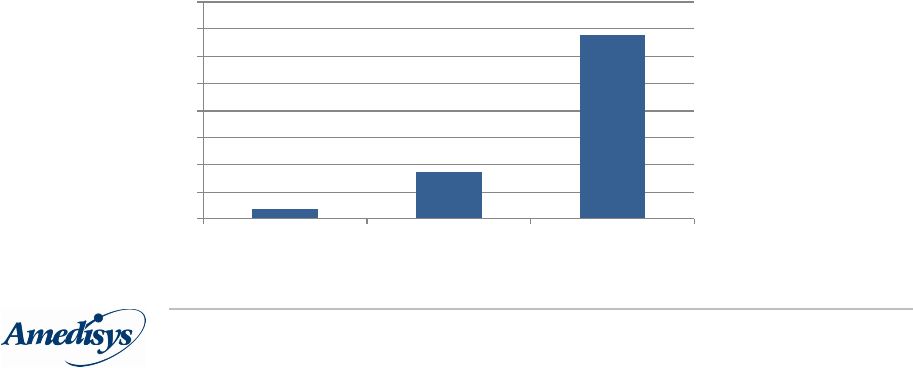 Leading Home Health & Hospice 2.0% 8.6% 33.9% 0.0% 5.0% 10.0% 15.0% 20.0% 25.0% 30.0% 35.0% 40.0% + 65 Population Medicare Home Health Spend AMED Revenue 2005 - 2010 Compounded Annual Growth Rate Strong Historical Industry Growth 7 1 Provided as of the date of our Form 8-K filed with the Securities and Exchange Commission on October 26, 2010. Even Stronger Amedisys Growth • Employee headcount grew from 6,200 in 2005 to 17,000 today • 221 Care Centers sites in 2005 to 609 today • $381M in revenues in 2005 to $1.645M projected for 2010 |
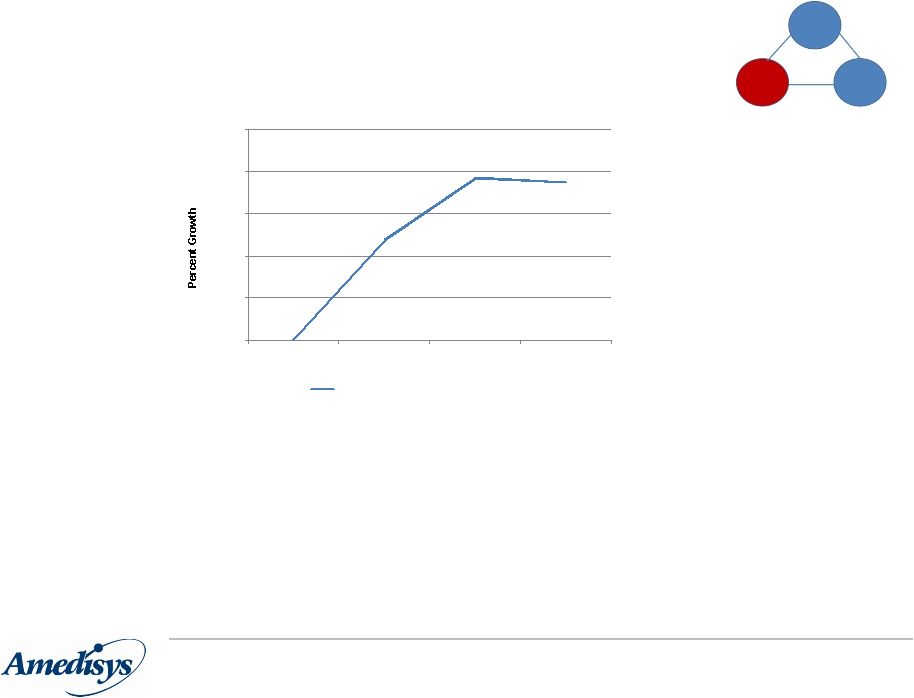
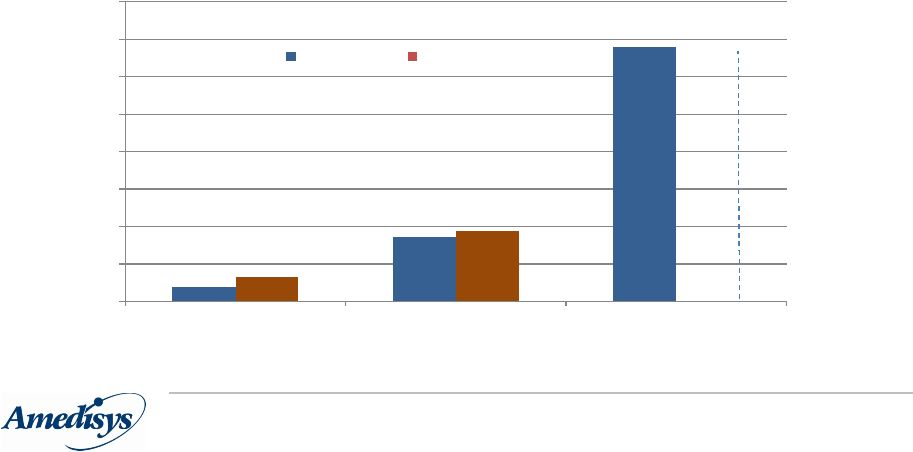 Leading Home Health & Hospice Stronger Future Growth Expected 8 Sources: Centers for Disease Control and Prevention and CBO August 2010 Baseline and Company historical information First Baby Boomer Turns 65 on 1/1/2011 • A new baby boomer will turn 65 every eight seconds for the next 19 years 2.0% 8.6% 33.9% 3.2% 9.4% ? 0.0% 5.0% 10.0% 15.0% 20.0% 25.0% 30.0% 35.0% 40.0% + 65 Population Medicare Home Health Spend AMED Revenue 2005-2010 2010-2020 Compounded Annual Growth Rate |
 Leading Home Health & Hospice $30 $32 $35 $38 $42 $45 $49 $54 $59 $64 $70 $507 $524 $566 $569 $617 $652 $684 $741 $771 $805 $878 $- $100 $200 $300 $400 $500 $600 $700 $800 $900 $1,000 2009 2010 2011 2012 2013 2014 2015 2016 2017 2018 2019 Home Health & Hospice Spend Medicare Spend Medicare market size 9 Total Medicare vs. Home Health and Hospice Spend Source: CBO's March 2009 Baseline: Medicare home health revenue, offset by cuts in Health Care Reform Bills. Kaiser Family Foundation fact sheet August 2010. National Health Expenditure Projections, September 2010. • Overall Medicare spend is expected to increase 68% during the next nine years • Medicare home health & hospice spend growing faster (119%), but only a fraction of total Medicare spend |
 Value Proposition Home Health is the Low Cost Alternative 10 $50 Home Health $5,765 Hospital $544 Skilled Nursing Facility * $5,293 Home Health $28,191 Hospital $14,688 Skilled Nursing Facility Average cost per length of stay: 4.9 days Hospital Average length of stay: Average per diem cost: 27 days Skilled Nursing Facility 106 days Home Health Leading Home Health & Hospice Source: National Association for Home Health & Hospice, Medpac June 2010 Data Book |
 Leading Home Health & Hospice 2010 Challenges/Actions • Challenges – Volume short fall • Driven by decline in recertification rate – Exacerbated by recent trend in cost structure • Higher percent of salaried clinicians than historical norm • Had just completed investment in field resources • Actions – Portfolio Management • Closing/Merging 39 care centers • Reducing start-up pipeline – Operational Changes • Expanding home health to 11 regions headed by single VP’s • Expanding to two hospice regions • Increase field level decision making • Enhancing on-boarding and training – Cost Structure • Pay per visit back to historical norms • Focus on staffing and administrative efficiencies – Admit Growth • Ultimately drives long term success • Expand clinical programs 11 $18-22 million EBITDA improvement |
 Leading Home Health & Hospice Our Long Term Strategy 12 Clinical Excellence Growth Efficiency |
 13 Quality Care Initiatives “Research & Development” Care Transition Encore Telehealth Care Team Conference Research & Development Leading Home Health & Hospice Improve Patient Outcome - Reduce ER & Hospitalization |
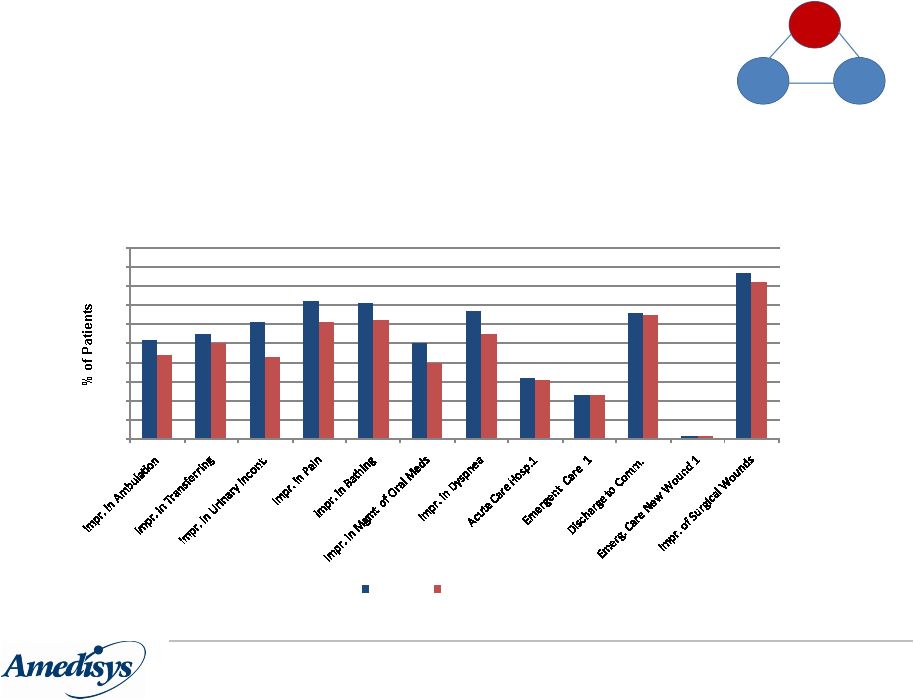 Leading Home Health & Hospice Focus on Clinical Outcomes 14 Amedisys vs. Footprint – Outcomes December 2009 • Exceeded or met 11 out of 12 outcomes vs. footprint • Awarded $3.6 million in pay for performance demonstration project from CMS 1 Lower % is better Source: Medicare 52 55 61 72 71 50 67 32 23 66 1 87 44 50 43 61 62 40 55 31 23 65 1 82 0 10 20 30 40 50 60 70 80 90 100 % of Patients Amedisys Footprint |
 Leading Home Health & Hospice 0.0% 2.0% 4.0% 6.0% 8.0% 10.0% 12.0% 14.0% 16.0% 2006 2007 2008 2009 3Q10 YTD Internal Episodic Admit Growth Home Health Growth - Internal 15 Historical • Specialty programs • Professional sales force / Mercury Doc • Blanket start-ups • Clinical outcomes Future • Specialty programs • Continued referral source communication enhancements • Targeted start-ups • Clinical differentiation • Health system & hospital partnerships Internal Admit Growth 1 1 Internal episodic-based admit growth is the percent increase in our base/start-up episodic-based admissions for the period as a percent of the total episodic-based admissions of the prior period. |
 Leading Home Health & Hospice 0.0% 5.0% 10.0% 15.0% 20.0% 25.0% 2007 2008 2009 3Q10 YTD Internal Episodic Admit Growth Hospice Growth - Internal 16 Hospice: Aggressive build (current share is ~1.2%) • $15 billion industry in the United States (NHPCO) • US hospice patient volumes projected to grow by 40% over next 5 years (NHPCO) • Building best hospice in the country based on clinical superiority • Duke School of Medicine’s Institute on Care at the End of Life Internal Episodic Admit Growth 1 1 Internal episodic-based admit growth is the percent increase in our base/start-up episodic-based admissions for the period as a percent of the total episodic-based admissions of the prior period. |
 Leading Home Health & Hospice Growth – External 17 • Acquisitions: Home Care – Continue to review opportunities – Focused on strategic expansion – CON markets, footprint expansion, market depth, hospital system joint ventures – Positioned well for increase in opportunities expected in 2011 • Acquisitions: Hospice – Continue to pursue opportunities – robust pipeline – Focused on geographic expansion into Amedisys home health markets and market depth • Other – Exploring revenue diversification strategies and care management expansion opportunities – Both internally developed or acquired |
 Leading Home Health & Hospice Consolidation Opportunities 18 • Home health and hospice industries are highly fragmented – 10,500 home health provider numbers – 3,400 hospice provider numbers • Small market share of publicly traded companies – Account for 15% of home health Medicare revenue market – Account for 12.5% of hospice Medicare revenue market • Most are single-site, small, local or regional providers – Independently-owned agencies – Visiting nurse associations – Facility and hospital-based |
 Leading Home Health & Hospice Efficiency 19 • Flexible Labor Structure – Increase pay per visit structure – Quicker adherence to staffing ratios • Infrastructure Investment – Upgrading accounting and HR system to Peoplesoft • More back office efficiency • Greater scalability – Field computer refresh • Enhancing field wireless communication – Continued investment in state-of-the-art operating system – Rolling out hospice point of care in 2011 |
 Leading Home Health & Hospice Valuation Headwinds • Regulatory focus on industry and Amedisys – Senate Finance Committee industry inquiry (information requested from all four publicly traded companies) – Securities Exchange Commission investigation of all four publicly traded companies – Department of Justice investigation • Industry reimbursement challenges – Decline in 2011 reimbursement of 5.2% – Decline in 2012 reimbursement of 2.9% proposed – Rebasing in 2014 • Amedisys operational challenges and opportunities 20 |
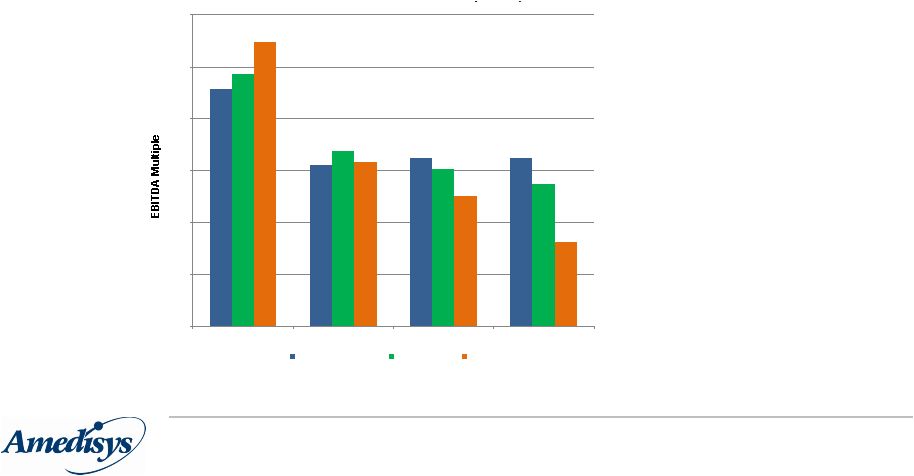 Leading Home Health & Hospice 0.0 2.0 4.0 6.0 8.0 10.0 12.0 2005 -2008 Average 2009 2010 Current Healthcare Providers /1 Home Health /2 Amedisys Historical Multiples 21 • Home health component trading off its historical norms versus the larger healthcare services sector • Amedisys at a substantial discount to rest of the home health companies Source: Bloomberg *Composed of healthcare providers reported in Oppenheimer’s weekly index Historical Healthcare Services Industry Multiples |
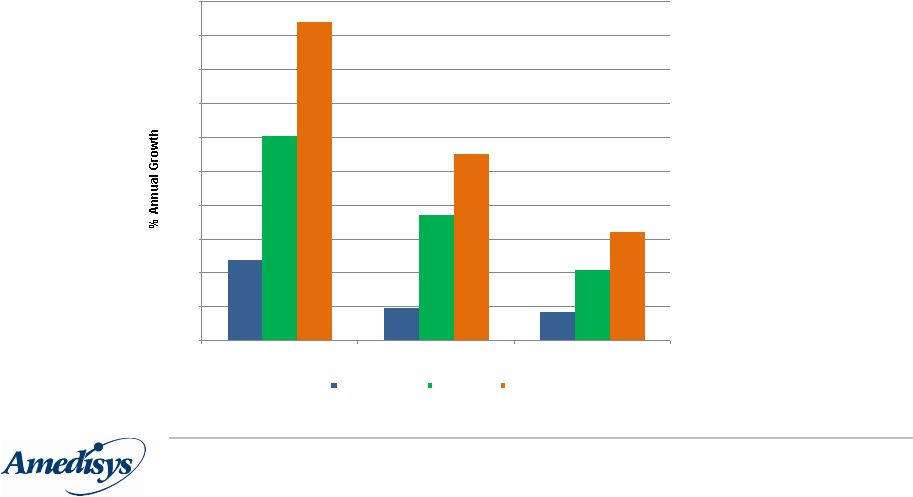 Leading Home Health & Hospice 0.0% 5.0% 10.0% 15.0% 20.0% 25.0% 30.0% 35.0% 40.0% 45.0% 50.0% 2006 -2008 Average 2009 2010 YTD /1 Healthcare Services /2 Home Health /3 Amedisys Historical Revenue Growth 22 • Historically, industry and Amedisys growth much greater than wider health care services sector Historical Healthcare Services Revenue Growth Source: Bloomberg /1 2010 YTD revenue for 6 months ended 6/30/10; growth is calculated comparing 2010 YTD revenue to 2009 revenue for same period /2 Composed of healthcare providers reported in Oppenheimer’s weekly index /3 Home Health peer group includes Gentiva, Almost Family and LHC Group ; revenues from Gentiva’s divested CareCentrix business are backed out of revenues for the measurement period |
 Leading Home Health & Hospice Review • High industry growth rate • Low cost sector in high cost healthcare industry • Substantial cost saving initiatives underway • Growth far in excess of historical industry norms • Scalable infrastructure • Reimbursement cuts to drive industry consolidation • Strong liquidity and capital position • Clinical quality and innovation 23 Tremendous Opportunities |
 Leading Home Health & Hospice Financial Review 24 |
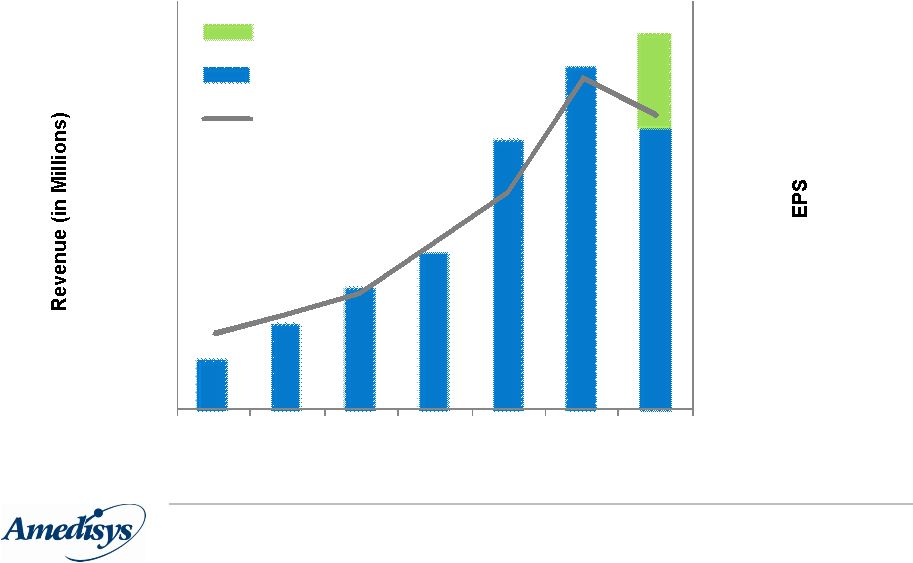 Leading Home Health & Hospice Financial highlights 25 $- $1.00 $2.00 $3.00 $4.00 $5.00 $6.00 $- $200 $400 $600 $800 $1,000 $1,200 $1,400 $1,600 $1,800 2004 2005 2006 2007 2008 2009 2010 Projected Revenue Actual Revenue EPS |
 Leading Home Health & Hospice 26 Summary financial results ($ in millions, except per share data) 2008 2009 3Q09 3Q10 Net revenue $1,187.4 $1,513.5 $388.3 $404.7 Period-over-period growth 70.1% 27.5% 20.7% 4.2% Gross margin 624.8 789.0 204.6 198.4 Percent of revenue 52.6% 52.1% 52.7% 49.0% CFFO 150.7 247.7 88.6 47.2 Adjusted EBITDA 1 181.4 261.8 69.1 51.9 Percent of revenue 15.3% 17.3% 17.8% 12.8% Adjusted Fully-diluted EPS 2 $3.31 $4.89 $1.29 $0.89 1 Adjusted EBITDA is defined as net income attributable to Amedisys, Inc. before provision for income taxes, net interest (income) expense, and depreciation and amortization plus certain adjustments (i.e. TLC integration costs incurred in 2008 and/or certain items incurred in 2010 which are detailed in our Form 8-K filed with the Securities and Exchange Commission on October 26, 2010). Adjusted EBITDA should not be considered as an alternative to, or more meaningful than, income before income taxes, cash flow from operating activities, or other traditional indicators of operating performance. This calculation of adjusted EBITDA may not be comparable to a similarly titled measure reported by other companies, since not all companies calculate this non-GAAP financial measure in the same manner. 2 Adjusted diluted earnings per share is defined as diluted earnings per share plus the earnings per share effect of certain adjustments (i.e. TLC integration costs incurred in 2008 and/or certain items incurred in 2010 which are detailed in our Form 8-K filed with the Securities and Exchange Commission on October 26, 2010). Adjusted diluted earnings per share should not be considered as an alternative to, or more meaningful than, income before income taxes, cash flow from operating activities, or other traditional indicators of operating performance. This calculation of adjusted diluted earnings per share may not be comparable to a similarly titled measure reported by other companies, since not all companies calculate this non-GAAP financial measure in the same manner. |
 Leading Home Health & Hospice 27 Summary performance results 2008 2009 3Q09 3Q10 Agencies at period end 528 586 569 609 Period-over-period growth 49.2% 11.0% 12.7% 7.0% Total visits 7,004,200 8,702,146 2,236,590 2,260,608 Period-over-period growth 62.8% 24.2% 19.0% 1.1% Episodic-based admissions 199,371 231,782 57,767 63,472 Period-over-period growth 53.8% 16.3% 8.6% 9.9% Episodic-based completed episodes 353,076 411,975 105,107 104,997 Period-over-period growth 60.6% 16.7% 10.7% -0.1% Episodic-based revenue per episode $2,854 $3,166 $3,189 $3,294 Period-over-period growth 7.3% 10.9% 11.2% 3.3% |
 Leading Home Health & Hospice 28 Summary balance sheet Dec. 31, 2009 Sep. 30, 2010 Assets Cash $ 34.5 $ 128.0 Accounts Receivable, Net 150.3 136.5 Property and Equipment 91.9 117.8 Goodwill 786.9 790.4 Other 108.8 91.2 Total Assets $ 1,172.4 $ 1,263.9 Liabilities and Equity Debt $ 215.2 $ 192.7 All Other Liabilities 220.9 223.0 Equity 736.3 848.2 Total Liabilities and Equity $ 1,172.4 $ 1,263.9 Leverage Ratio Leverage Ratio, Net of Cash 0.8x 0.7x 0.7x 0.3x |
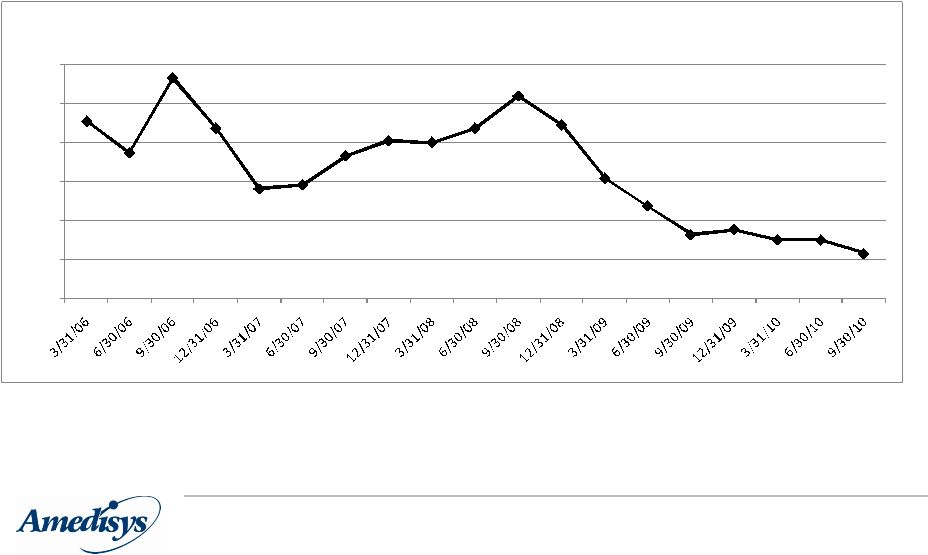 Leading Home Health & Hospice 47.7 43.7 53.3 46.8 39.1 39.6 43.3 45.2 45.0 46.8 51.0 47.2 40.4 36.9 33.2 33.9 32.6 32.5 30.8 25.0 30.0 35.0 40.0 45.0 50.0 55.0 DSO - Net (2) 29 Days revenue outstanding (DSO) (1) Our calculation of days revenue outstanding, net at March 31, 2008 is derived by dividing our ending net patient accounts receivable (i.e. net of estimated revenue adjustments, allowance for doubtful accounts and excluding the patient accounts receivable assumed in the TLC Health Care Services, Inc. (“TLC”) and Family Home Health Care, Inc. & Comprehensive Home Healthcare Services, Inc. (“HMA”) acquisitions) by our average daily net patient revenue, excluding the results of TLC and HMA for the three-month period ended March 31, 2008. (2) Our calculation of days revenue outstanding, net is derived by dividing our ending net patient accounts receivable (i.e. net of estimated revenue adjustments and allowance for doubtful accounts) by our average daily net patient revenue for the three-month period. (1) |
 Leading Home Health & Hospice 30 Liquidity • Cash balance at 9/30/10 = $128M • Available line of credit (LOC): 9/30/10 = $235M • 2010 Estimated CFFO - Cap Ex = $170M |
 Leading Home Health & Hospice 31 Guidance 1 Calendar Year 2010 Net revenue: $1.625 - $1.645 billion EPS: $4.20 - $4.35 Diluted shares : 28.5 million 2 3 1 Guidance excludes the effects of future acquisitions, if they are made. 2 Provided as of the date of our Form 8-K filed with the Securities and Exchange Commission on October 26, 2010. 3 Without adjustment for any shares that may be repurchased under our Share Repurchase Program. |
 Leading Home Health & Hospice Key references 32 Open Letter to Shareholders: http://www.amedisys.com/pdf/Letter_to_Shareholders.pdf Wyatt Matas Report: (upon request) kevin.leblanc@amedisys.com Avalere Study: http://www.amedisys.com/pdf/avalere_results_051109.pdf |
 Leading Home Health & Hospice Contact information Kevin B. LeBlanc Director of Investor Relations Amedisys, Inc. 5959 S. Sherwood Forest Boulevard Baton Rouge, LA 70816 Office: 225.292.2031 Fax: 225.295.9653 kevin.leblanc@amedisys.com 33 |