 Investor Presentation Leading Home Health & Hospice August 2013 clinical quality innovative care models better communities Exhibit 99.1 |
 Forward-looking Statements 2 www.amedisys.com NASDAQ: AMED We encourage everyone to visit the Investors Section of our website at www.amedisys.com, where we have posted additional important information such as press releases, profiles concerning our business and clinical operations and control processes, and SEC filings. We intend to use our website to expedite public access to time-critical information regarding the Company in advance of or in lieu of distributing a press release or a filing with the SEC disclosing the same information. This presentation may include forward-looking statements as defined by the Private Securities Litigation Reform Act of 1995. These forward-looking statements are based upon current expectations and assumptions about our business that are subject to a variety of risks and uncertainties that could cause actual results to differ materially from those described in this presentation. You should not rely on forward-looking statements as a prediction of future events. Additional information regarding factors that could cause actual results to differ materially from those discussed in any forward-looking statements are described in reports and registration statements we file with the SEC, including our Annual Report on Form 10-K and subsequent Quarterly Reports on Form 10-Q and Current Reports on Form 8-K, copies of which are available on the Amedisys internet website http://www.amedisys.com or by contacting the Amedisys Investor Relations department at (800) 467-2662. We disclaim any obligation to update any forward-looking statements or any changes in events, conditions or circumstances upon which any forward-looking statement may be based except as required by law. |
 Company Overview 3 • Founded in 1982, publicly listed 1994 • 503 care centers in 37 states • 14,700 employees • Projected revenue in 2013 of approximately $1.3 billion • Largest provider of skilled home health services • 4 largest hospice business 1 For the quarter ended June 30, 2013 1 th |
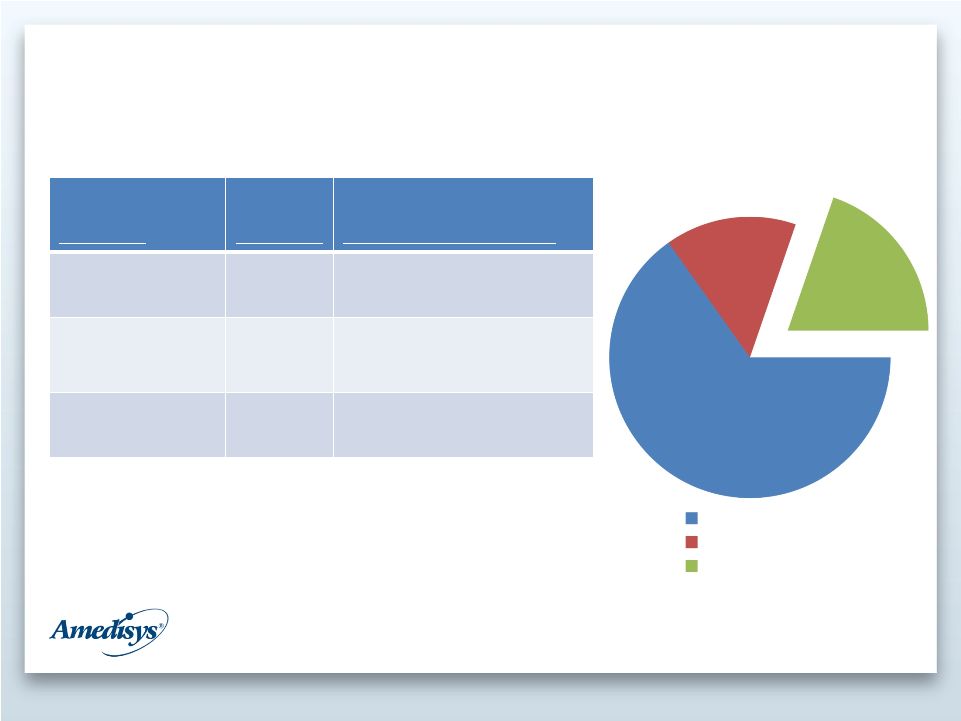 Business Segments 4 Business Segment % of Revenue Reimbursement Type HH - Medicare 65% Paid episodically (over a 60- day episode of care) HH – Non-Medicare 15% Majority paid per visit; remainder paid episodically Hospice 20% Mainly Medicare; paid at a daily rate 1 Revenue mix based on 2Q13 revenue 15% 20% 65% HH - Medicare HH - - Medicare Non Hospice Revenue Mix 1 |
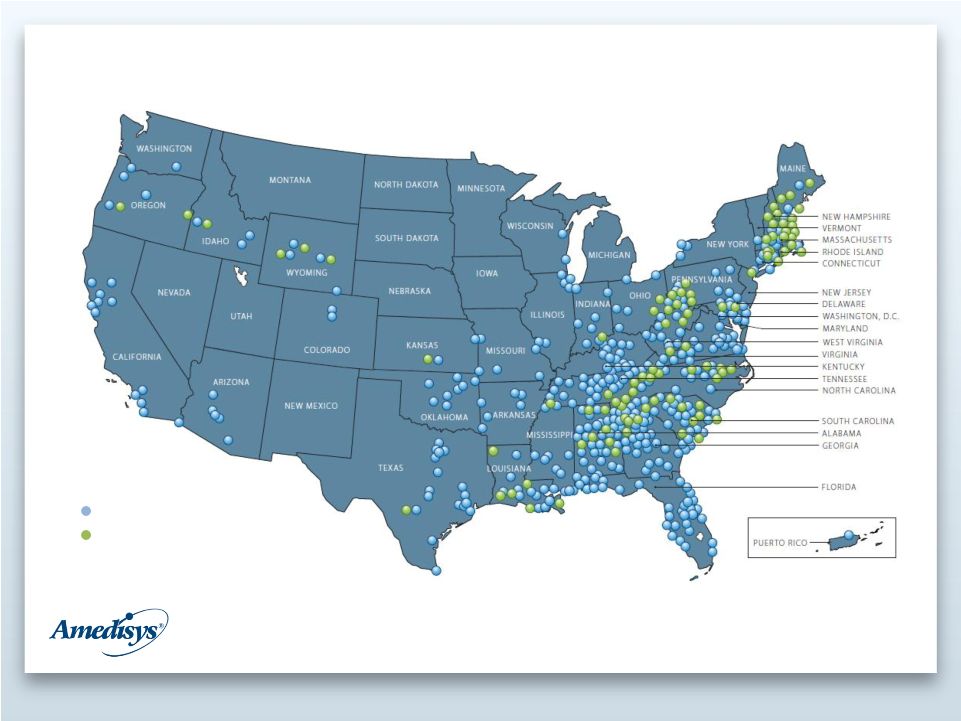 Care Center Locations 1 5 Home Health Care Centers (409) Hospice Care Centers (94) 1 As of June 30, 2013, includes care centers currently held for sale |
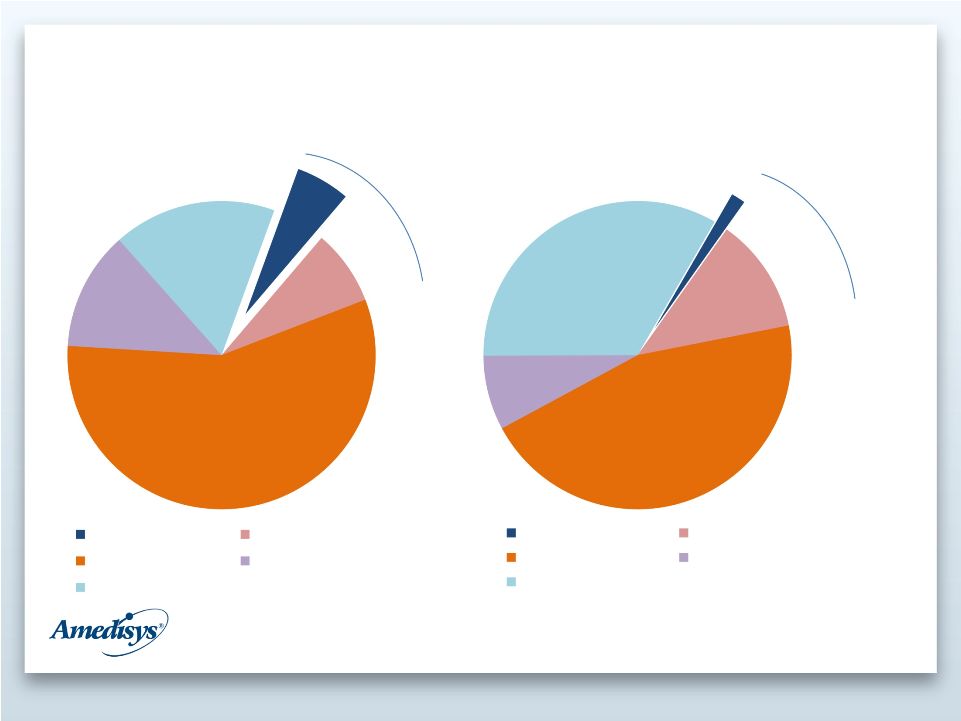 Estimated Market Share – Medicare Revenue 6 13.6% 13.6% Note: Estimated market share of total 2011 Medicare reimbursement Home Health Hospice 1.5% 12.1% 45.2% 7.8% 33.4% 7.9% 56.8% 12.5% 17.1% 5.7% Amedisys For Profit Non-Profit Public Peers Hospital-based Amedisys For Profit Non-Profit Public Peers Hospital-based |
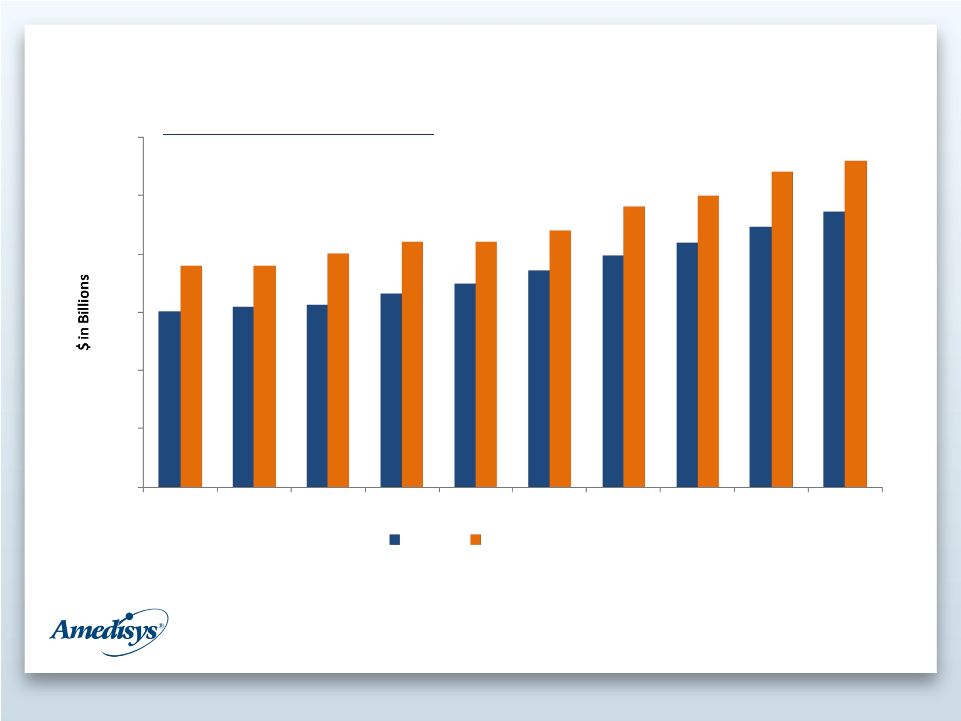 7 Home Health/Hospice Medicare Spend Home Health Source: CBO March 2013 Baseline report (10 year CAGR) Hospice Source: 2011 actual hospice spending with growth rate based on “Other Services” section of CBO March 2013 Baseline report (10 year CAGR) Population growth estimates provided by Tetrad; CAGR is for 2012-2017 (5 years) Compound Annual Growth Rates (CAGR) Home Health Expenditures = 4.4% Hospice Expenditures = 5.2% 65+ Population = 3.6% 75+ Population = 2.6% Hospice Home Health 2012 2013 2014 2015 2016 2017 2018 2019 2020 2021 $30 $25 $20 $15 $10 $5 $- 15 19 19 15 16 20 21 17 17 21 22 19 20 24 21 25 27 22 24 28 |
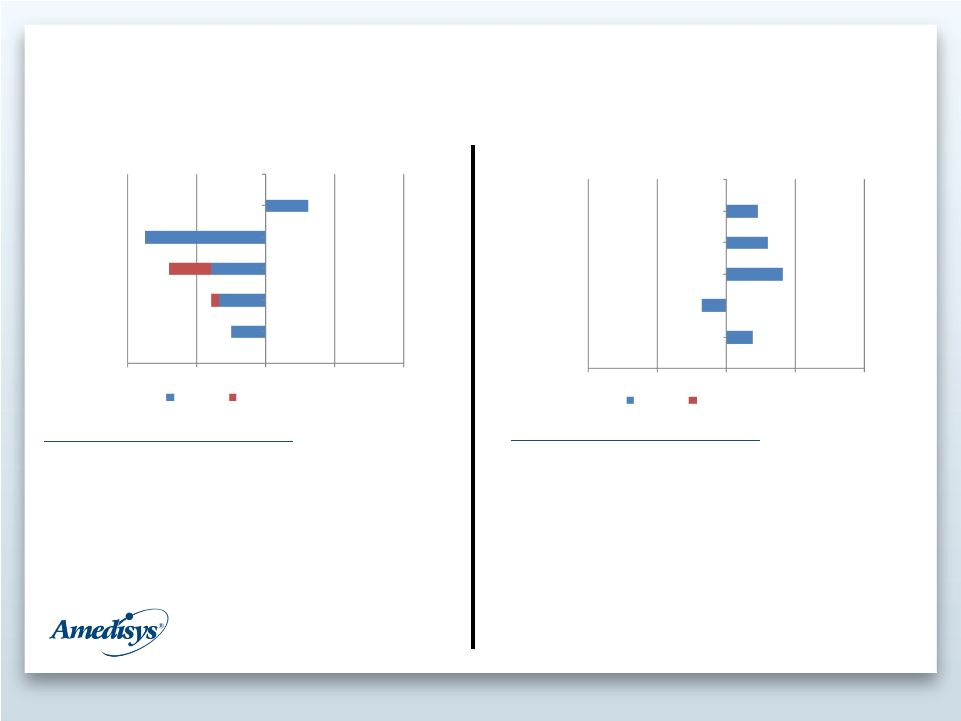 Medicare Reimbursement 8 -1.5% -2.0% -2.4% -5.2% 1.9% -6.0% -3.0% 0.0% 3.0% 6.0% 2014 - Proposed 2013 2012 2011 2010 -2.3% -4.2% Home Health Industry AMED Specific • 2014 final rule (rebasing) • Sustainable growth rate legislation (Doc Fix) • Co-payment proposals • Hospice rebasing (U-shaped reimbursement) • Nursing home reimbursement 1.1% -1.1%- 2.4% 1.8% 1.4% -6.0% -3.0% 0.0% 3.0% 6.0% 2014 - Final 2013 2012 2011 2010 Hospice Industry AMED Specific Reimbursement Considerations Reimbursement Considerations |
 Favorable Long Term Trends • Compelling demographics • Patient preference • Low cost of care delivery • Increased payor and hospital focus 9 Inpatient Hospital LTAC IRF SNF Hospice Home Health Average Cost of Stay $11,700 $38,664 $17,398 $11,728 $11,321 $5,257 Average Length of Stay 5 days 26 days 13 days 27 days 86 days 120 days Average Per Diem Cost $2,388 $1,470 $1,338 $431 $132 $44 Source: MedPAC March 2013 report; hospital information is for inpatient facilities only and is estimated based on patient discharges |
 Traditional Home Health and Hospice 10 Current Business Dynamics Issues • Fee for service based • High volume / low margins • “Retail” relationships • Patients with multiple conditions and physicians • Poor coordination / communication • Misaligned incentives • Minimal data interchange • Regulatory limitations on services • Limited physician coordination |
 Future Trends 11 Coordinated Care Management • Aligned incentives • Data exchange • Communications • Care Protocol • Outcome focused • Value driven Home Health Patient Home Hospice Post-Acute Facilities Payors Physicians Hospitals Informal Care Givers |
 Care Management Initiatives • Patient care management • Shared service care centers • Bundled payment initiatives • Next generation operating system • Other – ACO partnerships – Enterprise-level relationships – Palliative care and medical home 12 |
 Patient Care Management 13 • “Right Care. Right Time. Right Place.” • Centralized support – Local clinical decisions – Exception reporting • Recertification review – Attainment of patient goals – Physician orders or medication changes – Hospitalization during episode • Utilization focus – Reduce care plan variability – Patient outcome driven |
 Shared Service Model • All care centers organized into shared service centers – 40 shared service centers currently operating – Completed by the end of 2013 14 Quality Care Operational Efficiency Leadership • Clinical resource support • Consistency in care delivery/training • POD leadership supporting all care centers • Improved leadership turnover coverage CC 1 CC 2 CC 3 CC 4 CC 5 CC 6 CC7 POD • Centralized functions (on-call, intake, scheduling) • Specialty clinician productivity • Scheduling efficiency |
 Bundles • CMS Bundled Payment for Care Initiative (BPCI) program – Amedisys focused on Model 3 (post-acute) – CMS to set target price for relevant services during bundle – Awardees share savings and “at risk” for costs greater than target • Amedisys in awardee process in 5 regions – Currently in Phase I -- a no-risk reporting and ramp-up period – “At Risk” period starts Oct. 2013 or Jan. 2014 – Developing partnerships with hospitals/other partners to manage • Also focused on ACOs and Model 2 bundles 15 |
 AMS3 Operating System • 4Q13 Development complete / implementation begins • Migrating to .Net platform Existing platform sun setting • Benefits of proprietary system – Low incremental spend – Ongoing flexibility and customization • Enhancements over existing system – Greater clinician productivity – Superior clinical management engine – Care center efficiencies – Interoperability – Billing efficiencies – Expect $10-$15M in net annual savings after fully rolled out 16 |
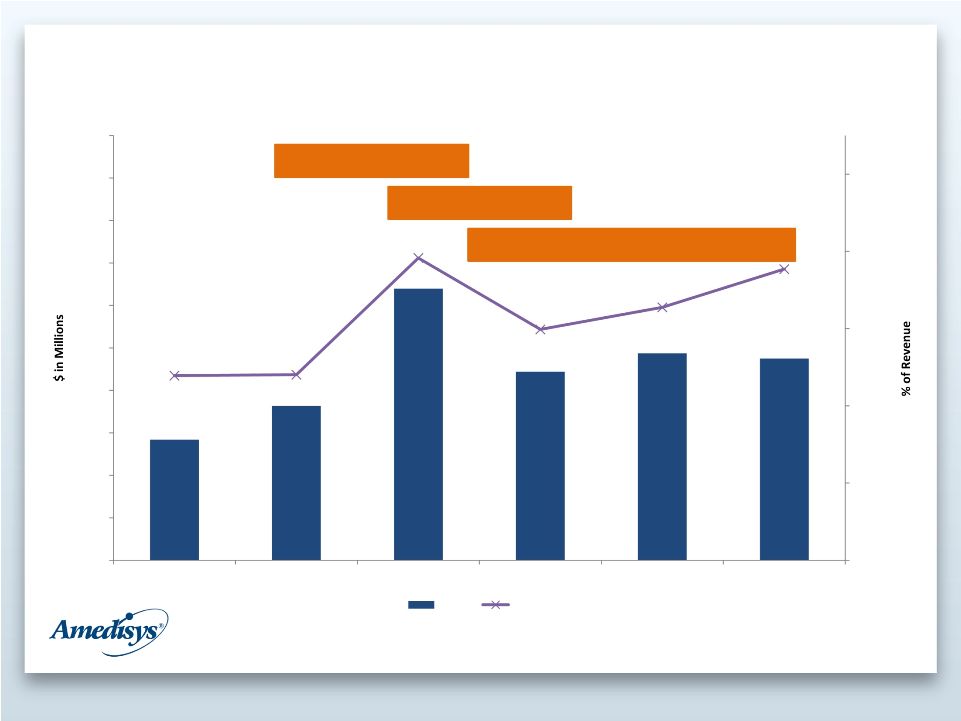 Capital Expenditures 17 100.0 90.0 80.0 70.0 60.0 50.0 40.0 30.0 20.0 10.0 0.0 2008 2009 2010 2011 2012 2013 0.0% 1.0% 2.0% 3.0% 4.0% 5.0% 3.8% 3.2% 3.0% 4.0% 2.4% 2.4% 28.4 36.4 64.0 44.4 48.3 47.5 Capex % of Rev PeopleSoft IT Security AMS3 Development |
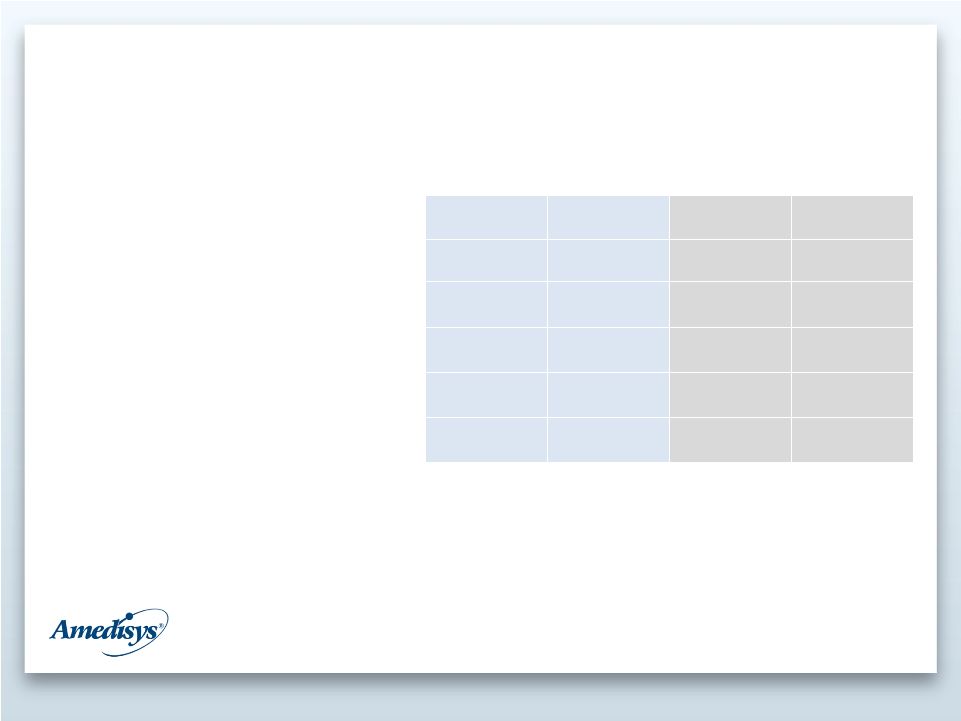
 Summary Financial Results 18 (Continuing operations only for quarterly numbers. $ in millions, except per share data) 2011 (1) 2012 (1) 2Q12 (2) 2Q13 (2) Adjusted Net Revenue $ 1,464 $ 1,488 $363 $313 Gross Margin % 46.7% 43.5% 44.2% 43.8% Adjusted EBITDA $ 157 $ 103 $27 $19 Adjusted EBITDA Margin 10.7% 6.9% 7.3% 6.1% Adjusted EPS $2.29 $1.08 $0.29 $0.17 1. The financial results for the years 2012 and 2011 are adjusted for certain items incurred in 2012 and 2011 and should be considered non-GAAP financial measures. A reconciliation of these non-GAAP financial measures is included as Exhibit 99.2 to our Form 8-K filed with the Securities and Exchange Commission on March 12, 2013. 2. The financial results for the three-month period ended June 30, 2013 and June 30, 2012 are adjusted for certain items totaling $5.1 million and $1.4 million, respectively, and should be considered a non-GAAP financial measure. A reconciliation of this non-GAAP financial measure is included as Exhibit 99.2 to our Form 8-K filed with the Securities and Exchange Commission on July 31, 2013 |
 Home Health Segment 19 ($ in millions, continuing operations for 2Q numbers) 2011 (1) 2012 (1) 2Q12 (2) 2Q13 (2) Medicare Revenue $ 1,038 $ 953 $229 $203 Non-Medicare Revenue $213 $245 $61 $46 Total Revenue $ 1,251 $ 1,198 $290 $249 Gross Margin % 46.9% 42.3% 43.1% 42.9% Contribution $220 $124 $36 $25 Contribution % 17.6% 10.4% 12.6% 10.2% 1. Results as reported in our Annual Report on Form 10-K for the year ended December 31, 2012 as filed with the Securities and Exchange Commission on March 12, 2013. 2. Results as reported in our Quarterly Report on Form 10-Q for the quarter ended June 30, 2013 as filed with the Securities and Exchange Commission on July 31, 2013 |
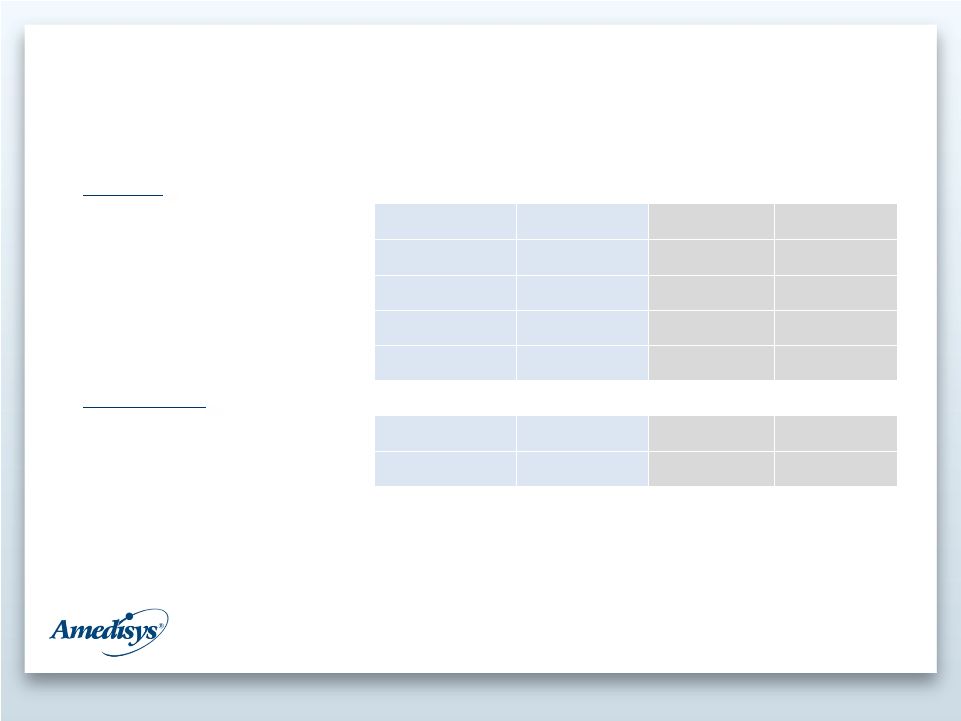 20 Home Health Operating Statistics 2011 (1) 2012 (1) 2Q12 (2) 2Q13 (2) Medicare Admissions 202,603 200,590 48,023 47,381 Same store admissions growth (5)% 0% 2% 0% Recertification rate 44.4% 42.2% 42.6% 36.5% Revenue per episode $3,027 $2,874 $2,879 $2,828 Visits per episode 18.7 18.7 19.1 17.6 Non-Medicare Admissions 73,880 93,016 23,047 18,161 Visits 1,754,255 2,074,446 523,111 378,928 1. Results as reported in our Annual Report on Form 10-K for the year ended December 31, 2012 as filed with the Securities and Exchange Commission on March 12, 2013. 2. Results as reported in our Quarterly Report on Form 10-Q for the quarter ended June 30, 2013 as filed with the Securities and Exchange Commission on July 31, 2013. |
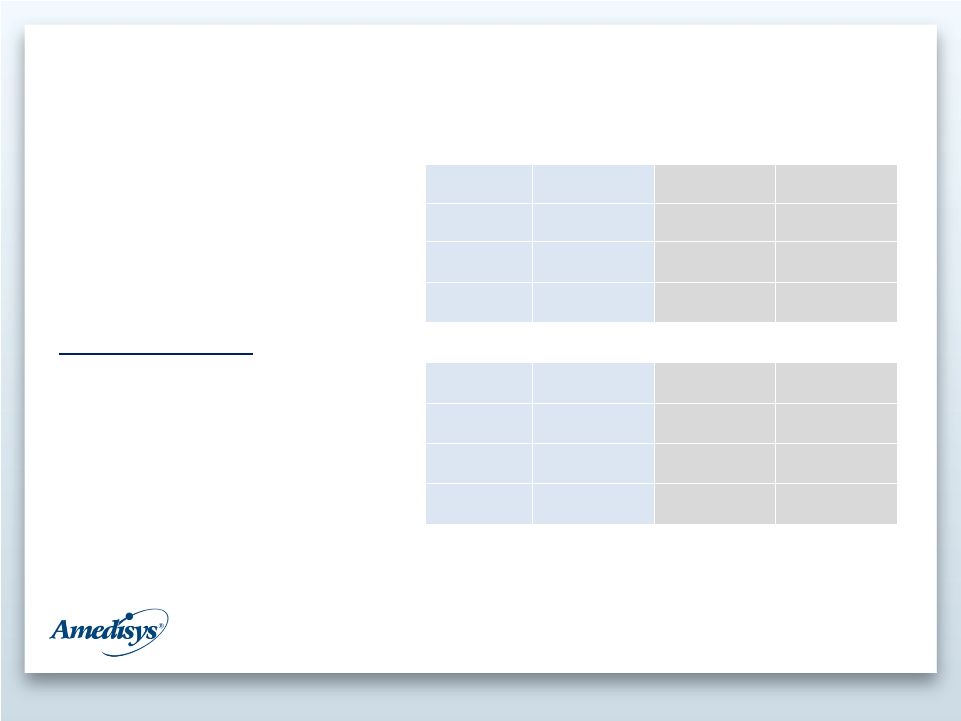 Hospice Segment 21 ($ in millions, continuing operations for 2Q numbers) 2011 (1) 2012 (1) 2Q12 (2) 2Q13 (2) Total Revenue $ 218 $ 290 $73 $65 Gross Margin % 46.5% 48.3% 48.5% 47.1% Contribution $49 $62 $17 $13 Contribution % 22.6% 21.4% 22.8% 19.7% Operating Statistics Total admissions 15,889 19,161 4,797 4,600 Same store revenue growth 19% 13% 22% (12%) Average daily census (ADC) 4,197 5,427 5,402 4,939 Average length of stay (ALOS) 88 99 95 99 1. Results as reported in our Annual Report on Form 10-K for the year ended December 31, 2012 as filed with the Securities and Exchange Commission on March 12, 2013 2. Results as reported in our Quarterly Report on Form 10-Q for the quarter ended June 30, 2013 as filed with the Securities and Exchange Commission on July 31, 2013. |
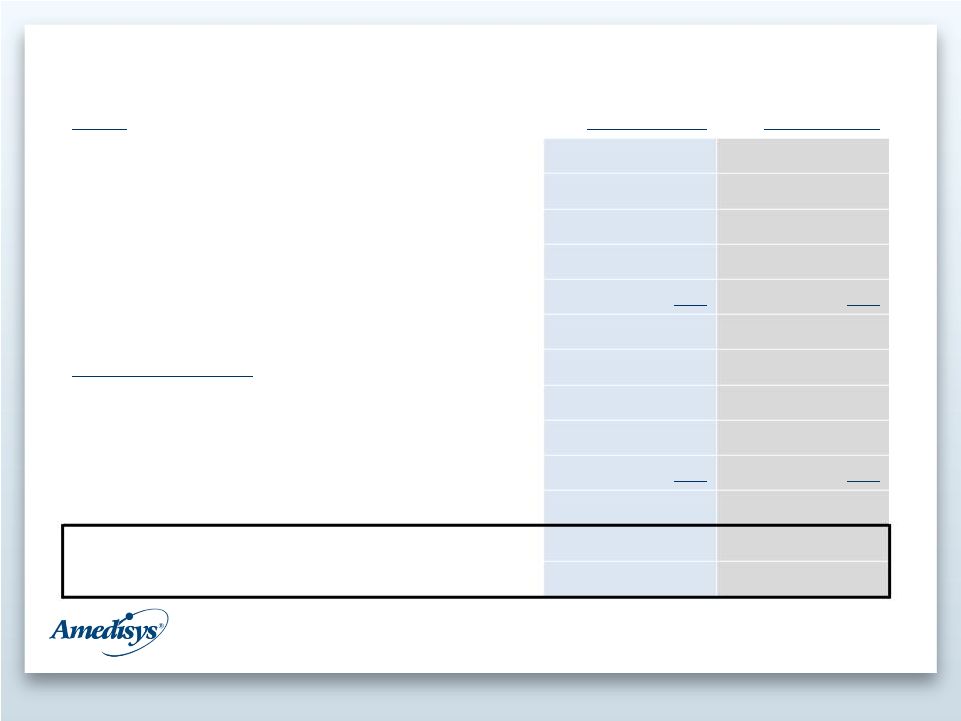 22 Summary Balance Sheet Assets Dec. 31, 2012 Jun. 30, 2013 Cash $ 15 $ 30 Accounts Receivable, Net 169 125 Property and Equipment 157 157 Goodwill 210 209 Other 180 179 Total Assets $ 731 $ 700 Liabilities and Equity Debt $ 103 $ 75 Other Liabilities 174 160 Equity 454 465 Total Liabilities and Equity $ 731 $ 700 Leverage Ratio 1.10x 1.01x Days Sales Outstanding 42 34 ($ in millions) |
 23 Liquidity 1 1. Availability under revolver of $94 million 2. 1H13 scheduled debt repayment includes $20M principal payment of senior notes due in March 2013, at end of quarter $20M in senior notes remain outstanding and are due in March 2014 3. Other cash flows for 2012 include refinancing costs associated with credit agreement signed on October 26, 2012, retirement of long-term debt and acquisitions. ($ in millions) 2012A 1H13A 2013F Cash Flow From Operations $ 69 $66 $ 100-110 Capital Expenditures 48 20 45-50 Scheduled debt repayments 2 29 28 36 Cash Flow, Net (8) 18 14-29 Beginning Cash 48 15 Other 3 (25) (3) End Cash $ 15 $30 |
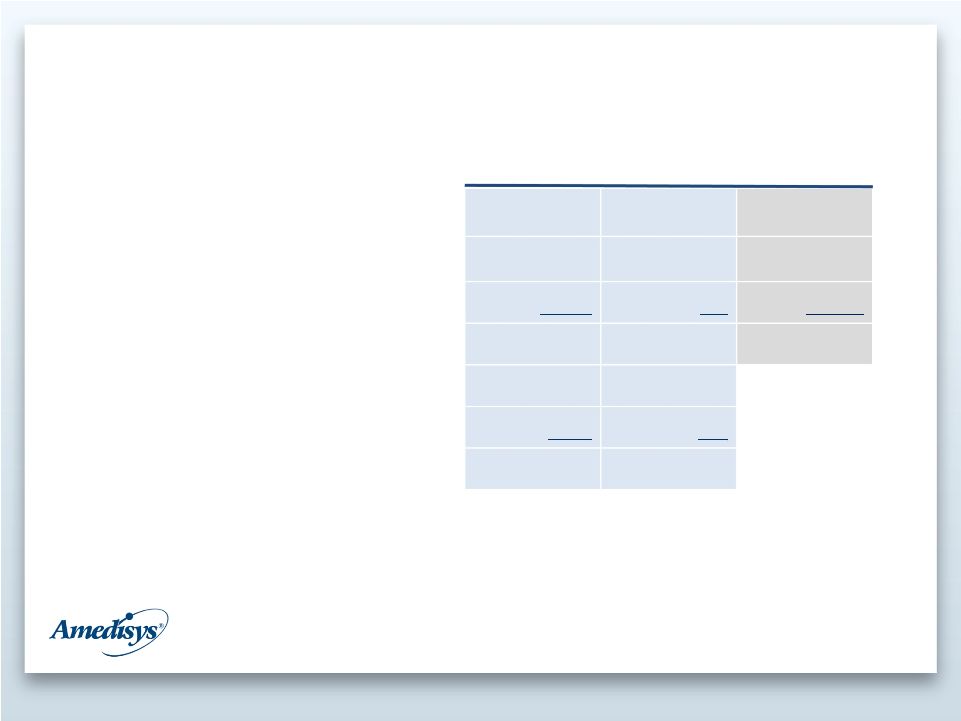
 24 Guidance 1. Guidance based on continuing operations excluding the effects of any one-time costs associated with our announced market exit activity or corporate expense initiatives. 2. Provided as of the date of our form 8-K filed with the Securities and Exchange Commission on July 31, 2013. 1 2 Calendar Year 2013 Net revenue: $1.24 - $1.28 billion EPS: $0.45 - $0.55 Diluted shares: 31.5 million |
 Investment Rationale • Favorable demographic trends • Positive attributes of home based care • IT infrastructure/scalability • Clinical quality and innovation • Strong liquidity and capital position • Market share capture opportunities 25 Efficient Core Business Care Mgmt Solutions |
 Contact Information Tom Dolan SVP Finance and Treasurer Amedisys, Inc. 5959 S. Sherwood Forest Boulevard Baton Rouge, LA 70816 Office: 225.299.3391 Fax: 225.298.6435 tom.dolan@amedisys.com 26 |