 Right care. Right care. Right time. Right time. Right place. Right place. Amedisys Investor Presentation September 2015 Exhibit 99.2 |
 2 Forward-looking Statements This presentation may include forward-looking statements as defined by the Private Securities Litigation Reform Act of 1995. These forward-looking statements are based upon current expectations and assumptions about our business that are subject to a variety of risks and uncertainties that could cause actual results to differ materially from those described in this presentation. You should not rely on forward-looking statements as a prediction of future events. Additional information regarding factors that could cause actual results to differ materially from those discussed in any forward-looking statements are described in reports and registration statements we file with the SEC, including our Annual Report on Form 10-K and subsequent Quarterly Reports on Form 10-Q and Current Reports on Form 8-K, copies of which are available on the Amedisys internet website http://www.amedisys.com or by contacting the Amedisys Investor Relations department at (225) 292-2031. We disclaim any obligation to update any forward-looking statements or any changes in events, conditions or circumstances upon which any forward-looking statement may be based except as required by law. www.amedisys.com NASDAQ: AMED We encourage everyone to visit the Investors Section of our website at www.amedisys.com, where we have posted additional important information such as press releases, profiles concerning our business and clinical operations and control processes, and SEC filings. We intend to use our website to expedite public access to time-critical information regarding the Company in advance of or in lieu of distributing a press release or a filing with the SEC disclosing the same information. |
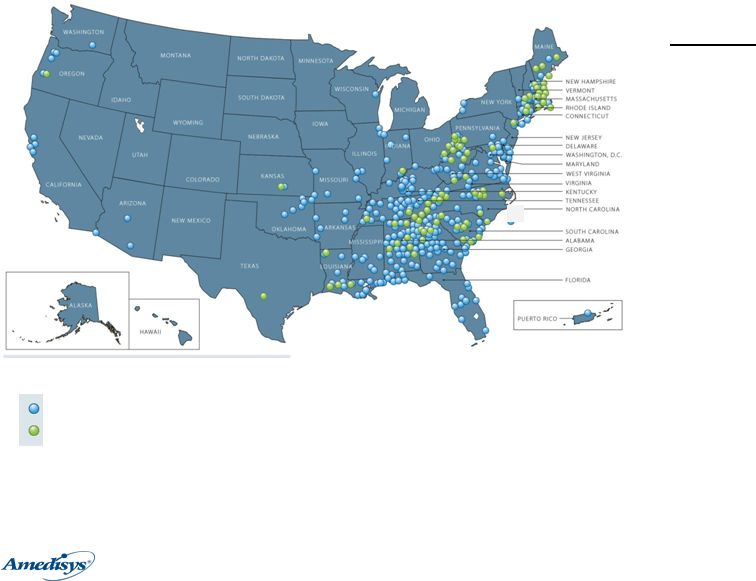 3 Amedisys Snapshot Overview • Founded in 1982, publicly listed 1994 • 395 care centers in 34 states • 13,000 employees • 57,000 patients currently on census • 2014 revenue of $1.2 billion • 360,000 patients seen annually • Over 7.5 million annual patient visits Amedisys Home Health Care Centers (316 locations) Amedisys Hospice Care Centers (79 locations) |
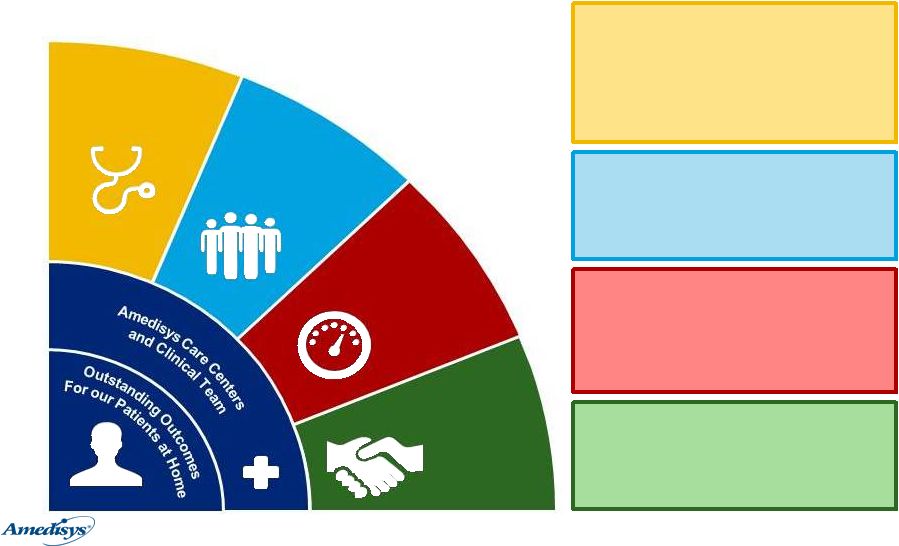 4 Clinical Distinction Become Employer of Choice Operational Excellence and Efficiency Driving Growth Delivered By Enabled By Our Goal Delivered By Enabled By Our Goal We are a clinical organization that will drive outstanding outcomes for our patients in their homes, as we provide our care centers and clinical team the right tools, and simplify operations to allow them to focus on patient care Amedisys Strategy: Winning “Same Game” Clinical Distinction • Clinical guidelines that support consistent, outstanding care • High quality as measured by STARS ratings and other key measures • Invest in professional development of clinicians • Develop innovative clinical programs that distinguish us in the market Become Employer of Choice • Improved ability to recruit, develop, and retain outstanding, talented people • Become “Employer of Choice” as we make working at Amedisys meaningful and more rewarding Operational Excellence and Efficiency • A new IT platform that makes it easier for clinicians to focus on care delivery • Supporting processes that drive standardization and simplification to improve operational efficiency • Effective, more efficient corporate operations Driving Growth • Improved information and tools to optimize business development effectiveness • Developing the capabilities to succeed as market moves to pay based on value • Investing capital to grow core businesses |
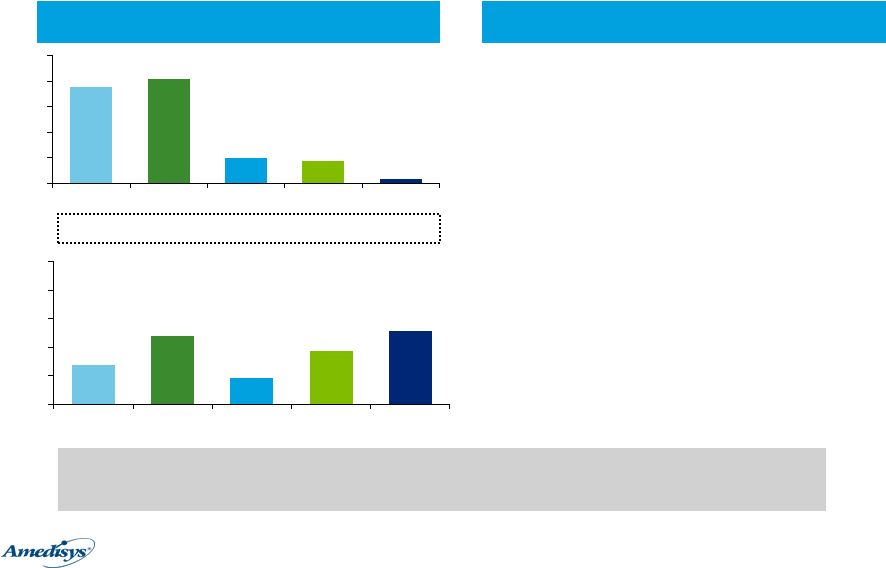 5 Although SNF receives a greater percentage of PAC referrals than HH, many SNF patients are eligible for HH, which is more cost effective and has lower readmission rates Performance Variation Across PAC Settings Opportunity exists to capture share from SNFs through education of discharge planners, clinician trainers and through management of readmissions 38% 41% 10% 9% 2% 0 10 20 30 40 50 HH SNF IRF ORF LTCH 14% 24% 9% 19% 26% 0 10 20 30 40 50 HH SNF IRF ORF LTCH Readmission Rates by PAC Type Distribution of Referrals to PAC Settings 44% total share of home health episodes if appropriate care setting is utilized (vs. 38% today) $2.5 B in annual amount saved by Medicare if patients utilize appropriate PAC setting 71% ORF episodes could receive care from HHA 15% SNF first setting episodes could receive care from HHAs 2.6% savings in total Medicare post-discharge episode spending Impact of Appropriate Care Setting $38,654 $17,399 $11,695 $6,300 $5,301 Medicare Exp per case |
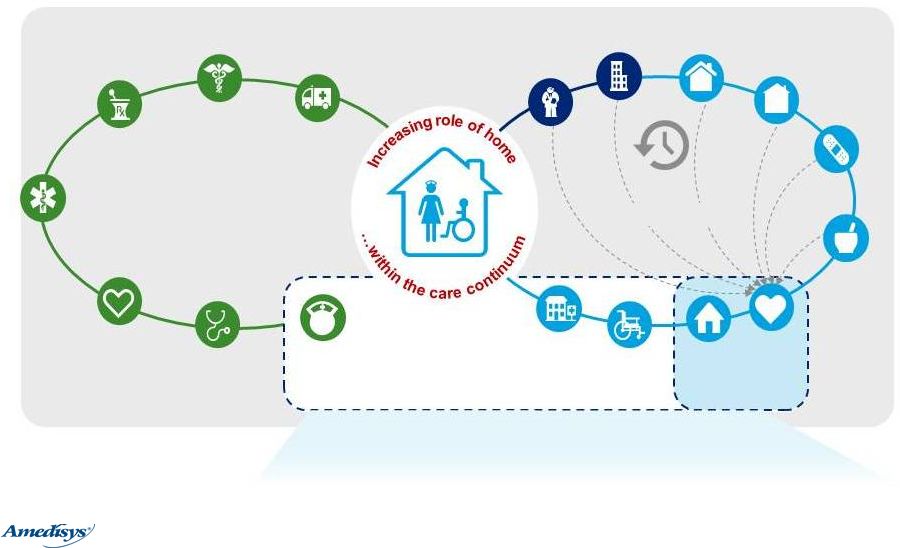 6 Our vision is to add the capabilities to serve a broader array of acuities, and in doing so take share from other providers becoming a value-added partner to at-risk entities Driving Growth by Expanding Care in the Home Retail Pharmacy Ambulatory Procedure Center Urgent Care Center Diagnostic/ Imaging Center Physician Clinics Wellness and Fitness Center Community-Based Care Acute Care The Unbroken Continuum of Care Personal Care Core Focus Area Potential Adjacencies Home Care DME Long Term Care Hospice Hospital at Home Potential to reinforce and extend our core through adjacencies IP Rehab Hospital Post-Acute Care OP Rehab SNF ER Share capture Over Time |
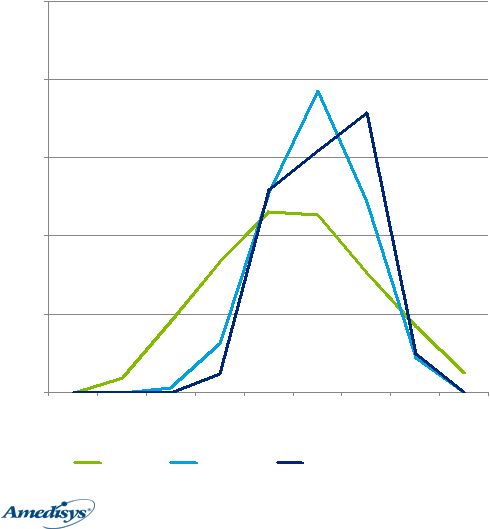 7 CMS released its inaugural ratings on the Home Health Compare website, Amedisys care centers performed well and we are developing targeted improvement plans Home Health Star Ratings and Value-Based Purchasing (VBP) 0% 10% 20% 30% 40% 50% 1.0 1.5 2.0 2.5 3.0 3.5 4.0 4.5 5.0 Star Rating Star Rating Distribution – Amedisys vs. Industry Industry Amedisys Amedisys VBP States • 93% of Amedisys care centers rated 3 stars or better • Compares favorably to 72% for rest of industry • 2016 CMS proposed rule introduced value- based purchasing pilot program • Reimbursement will be tied to quality and outcomes • Approximately 25% of home health revenue is in 9 proposed VBP states • Star ratings metrics similar to those that will determine reimbursement under VBP • Care center performance distribution is similar in proposed VBP states |
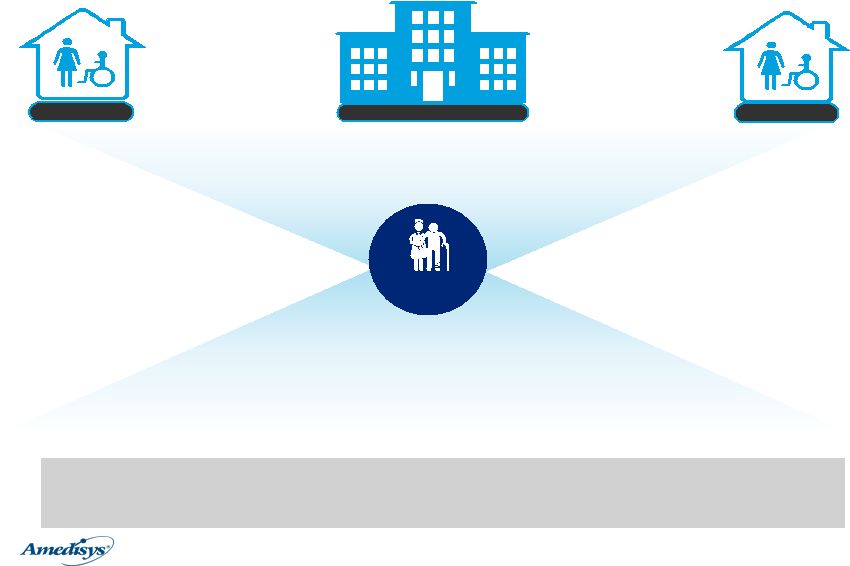 8 Amedisys Strategy: Tomorrow’s Focus – Owning the Home – “New Game” Expand the definition of homecare by employing new capabilities and technologies – engaging patients before an acute admission and again after discharge, preventing readmissions HOME HEALTH HOSPITAL HOME HEALTH Pre-Acute Post-Acute Targeted Capabilities to Take Share and Care for Higher and Lower Acuity Patients Amedisys MD/PA/NP Services By selectively adding additional capabilities, we will increase our ability to prevent patients from being admitted to the hospital (pre-acute) care for patients in the home, and capture share from higher cost facility based services Improve Analytics / Data Management Personal Care Services Assessments / Discharge Planning Enhanced Monitoring / Telemedicine Palliative Care DME / Infusion |
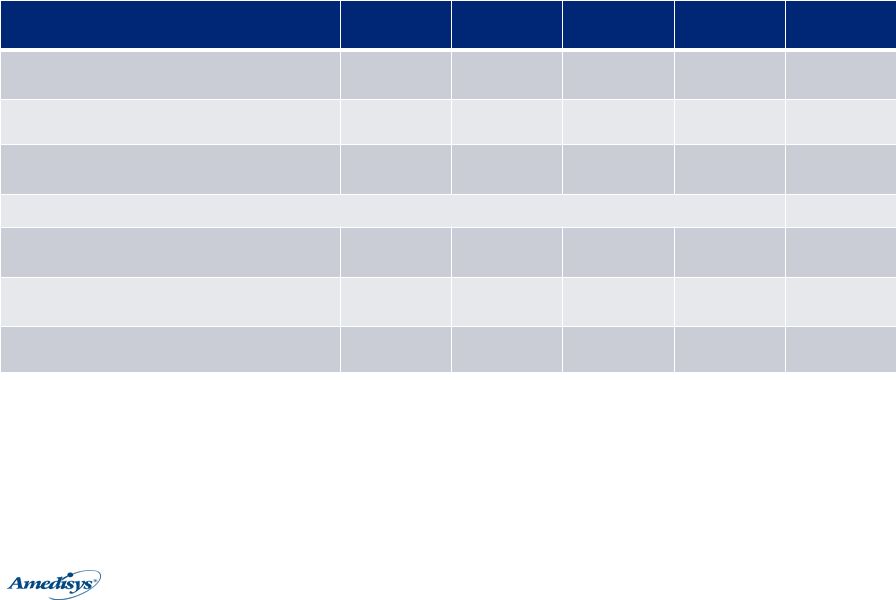 9 ($ in millions, except per share data) 2Q14 3Q14 4Q14 1Q15 2Q15 Net Revenue $305 $300 $301 $302 $314 Gross Margin % 43.4% 43.3% 43.0% 43.3% 44.1% Total G&A Expenses 118 114 113 111 112 EBITDA (reported) $22 $24 $23 $26 $32 EBITDA Margin 7.3% 7.9% 7.6% 8.7% 10.1% EPS $0.25 $0.28 $0.27 $0.30 $0.43 Summary Adjusted Financials – Quarterly 1 |
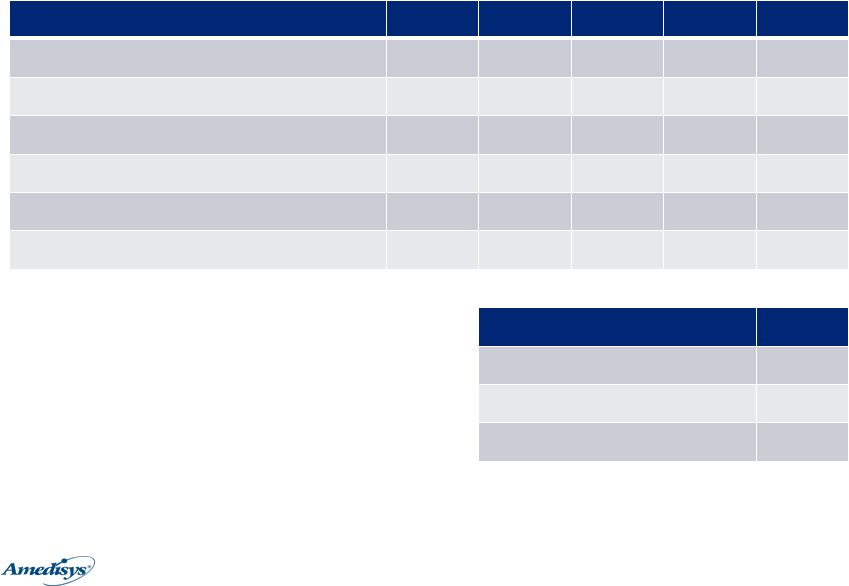 10 Adjusted Cash Flow 2 ($ in Millions) 2Q14 3Q14 4Q14 1Q15 2Q15 Operating cash flow 27 31 29 30 30 Changes in working capital (3) (6) 11 (16) 13 Operating cash flow, net 24 25 40 14 43 Capital Expenditures (4) (1) (2) (2) (15) Required Debt Repayments (3) (3) (3) (3) (3) Free Cash Flow 17 21 34 9 25 ($ in Millions) LTM LTM Free Cash Flow 89 Leverage ratio 3 0.9x Liquidity (avail. revolver + cash) 132 |
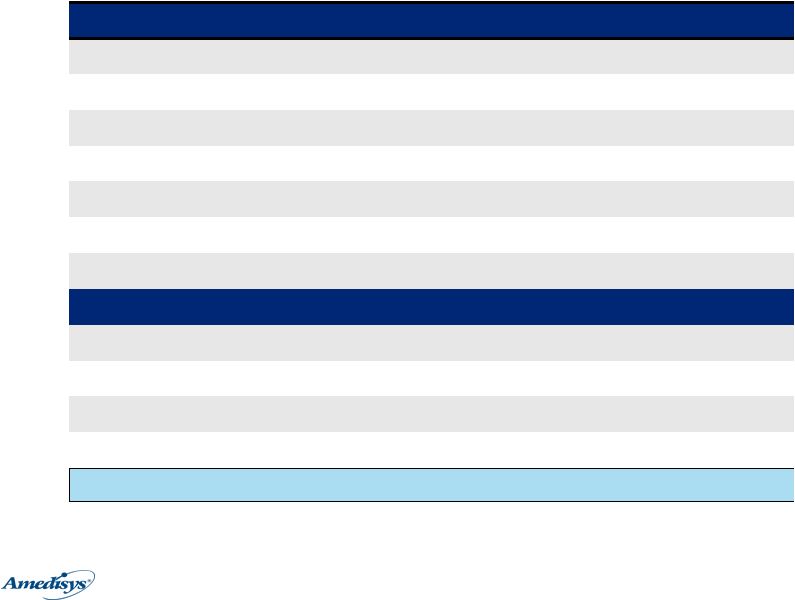 11 Balance Sheet Assets ($ in MM) 12/31/14 3/31/15 6/30/15 Cash $8 $3 $33 Accounts Receivable, net 99 111 110 Property and Equipment 137 57 67 Goodwill 206 206 206 Deferred Tax Asset 125 147 140 Other 95 99 89 Total Assets 670 623 645 Liabilities and Equity Other Liabilities $155 $156 $168 Long-Term Debt 118 100 97 Equity 397 367 380 Total Liabilities and Equity 670 623 645 Days Sales Outstanding 29 32 31 |
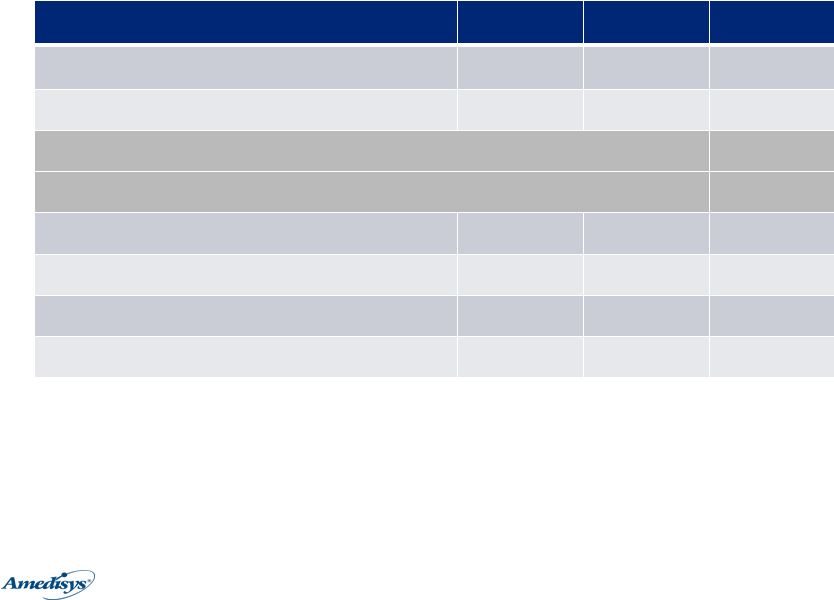 12 ($ in millions) 2Q14 1Q15 2Q15 Net Revenue $243 $241 $248 Gross Margin % 42.8% 42.6% 42.6% Key Operating Statistics Same store Medicare revenue growth 2% 6% (1%) Same store non-Medicare revenue growth 21% 20% 16% Medicare recert rate 37% 37% 36% Cost per visit $85.08 $86.33 $84.43 Home Health Segment 1 |
 13 ($ in millions) 2Q14 1Q15 2Q15 Net Revenue $62 $60 $66 Gross Margin % 46.1% 46.3% 49.6% Same store ADC growth (4%) 1% 8% Same store admission growth (3%) 7% 11% Revenue per day $145.44 $147.48 $147.53 Cost per day $78.24 $79.12 $74.07 Hospice Segment 1 |
14 Contact Information Ronnie LaBorde Vice Chairman and Chief Financial Officer ronnie.laborde@amedisys.com David Castille Managing Director, Finance david.castille@amedisys.com Amedisys, Inc. 5959 S. Sherwood Forest Blvd. Baton Rouge, LA 70816 Office: 225.292.2031 |
15 Endnotes 1. The financial results for the three month periods ended June 30, 2014, September 30, 2014, December 31, 2014, March 31, 2015 and June 30, 2015 are adjusted for certain items and should be considered a non-GAAP financial measure. A reconciliation of these non- GAAP financial measures is included in the corresponding 8-K detailing quarterly results for each respective reporting period. 2. Operating cash flow detailed in this schedule is adjusted for DOJ settlement payments made in 2Q14 ($115 million) and 4Q14 ($35 million). 3. Leverage ratio defined as total debt on balance sheet at 6/30/15 divided by the sum of adjusted EBITDA for the last four quarters. |