Amedisys 35th Annual J.P. Morgan Healthcare Conference January 11, 2017 Exhibit 99.1
Forward-looking Statements This presentation may include forward-looking statements as defined by the Private Securities Litigation Reform Act of 1995. These forward-looking statements are based upon current expectations and assumptions about our business that are subject to a variety of risks and uncertainties that could cause actual results to differ materially from those described in this presentation. You should not rely on forward-looking statements as a prediction of future events. Additional information regarding factors that could cause actual results to differ materially from those discussed in any forward-looking statements are described in reports and registration statements we file with the SEC, including our Annual Report on Form 10-K and subsequent Quarterly Reports on Form 10-Q and Current Reports on Form 8-K, copies of which are available on the Amedisys internet website http://www.amedisys.com or by contacting the Amedisys Investor Relations department at (225) 292-2031. We disclaim any obligation to update any forward-looking statements or any changes in events, conditions or circumstances upon which any forward-looking statement may be based except as required by law. www.amedisys.com NASDAQ: AMED We encourage everyone to visit the Investors Section of our website at www.amedisys.com, where we have posted additional important information such as press releases, profiles concerning our business and clinical operations and control processes, and SEC filings. We intend to use our website to expedite public access to time-critical information regarding the Company in advance of or in lieu of distributing a press release or a filing with the SEC disclosing the same information.
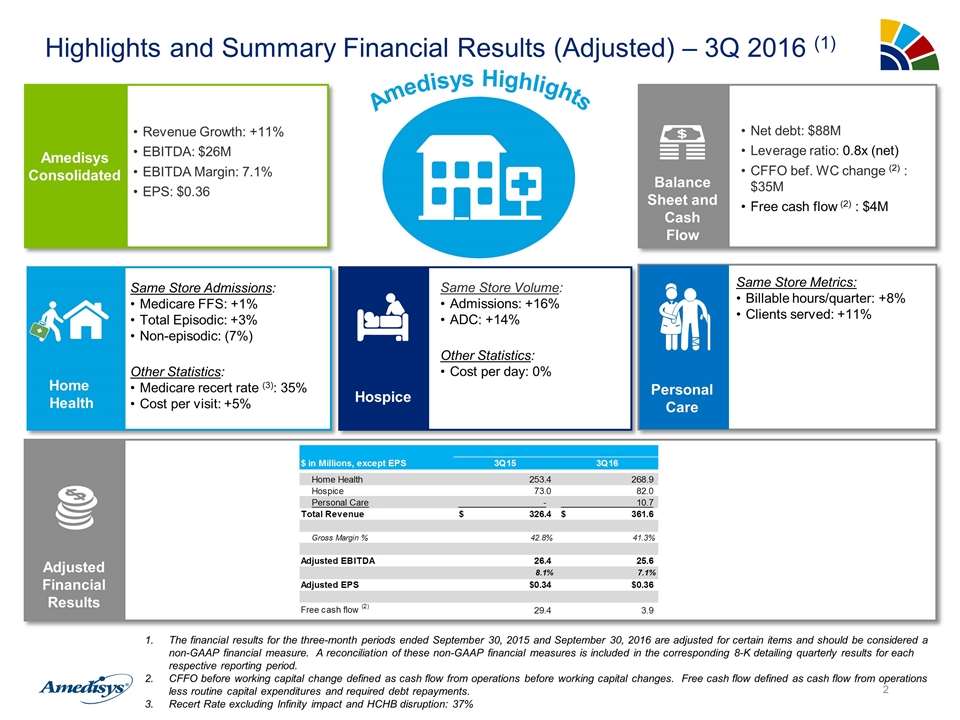
Highlights and Summary Financial Results (Adjusted) – 3Q 2016 (1) Amedisys Consolidated Revenue Growth: +11% EBITDA: $26M EBITDA Margin: 7.1% EPS: $0.36 Amedisys Highlights Same Store Admissions: Medicare FFS: +1% Total Episodic: +3% Non-episodic: (7%) Other Statistics: Medicare recert rate (3): 35% Cost per visit: +5% Home Health Same Store Metrics: Billable hours/quarter: +8% Clients served: +11% Personal Care Same Store Volume: Admissions: +16% ADC: +14% Other Statistics: Cost per day: 0% Hospice Net debt: $88M Leverage ratio: 0.8x (net) CFFO bef. WC change (2) : $35M Free cash flow (2) : $4M Balance Sheet and Cash Flow Adjusted Financial Results The financial results for the three-month periods ended September 30, 2015 and September 30, 2016 are adjusted for certain items and should be considered a non-GAAP financial measure. A reconciliation of these non-GAAP financial measures is included in the corresponding 8-K detailing quarterly results for each respective reporting period. CFFO before working capital change defined as cash flow from operations before working capital changes. Free cash flow defined as cash flow from operations less routine capital expenditures and required debt repayments. Recert Rate excluding Infinity impact and HCHB disruption: 37%
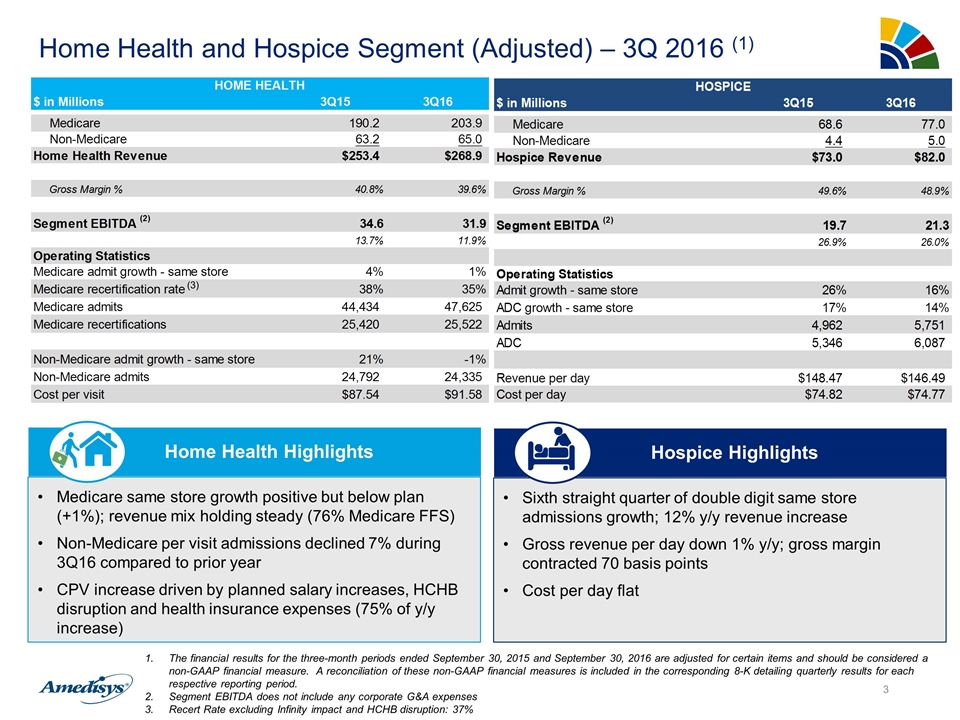
Home Health and Hospice Segment (Adjusted) – 3Q 2016 (1) Medicare same store growth positive but below plan (+1%); revenue mix holding steady (76% Medicare FFS) Non-Medicare per visit admissions declined 7% during 3Q16 compared to prior year CPV increase driven by planned salary increases, HCHB disruption and health insurance expenses (75% of y/y increase) Home Health Highlights Sixth straight quarter of double digit same store admissions growth; 12% y/y revenue increase Gross revenue per day down 1% y/y; gross margin contracted 70 basis points Cost per day flat Hospice Highlights The financial results for the three-month periods ended September 30, 2015 and September 30, 2016 are adjusted for certain items and should be considered a non-GAAP financial measure. A reconciliation of these non-GAAP financial measures is included in the corresponding 8-K detailing quarterly results for each respective reporting period. Segment EBITDA does not include any corporate G&A expenses Recert Rate excluding Infinity impact and HCHB disruption: 37% (3)
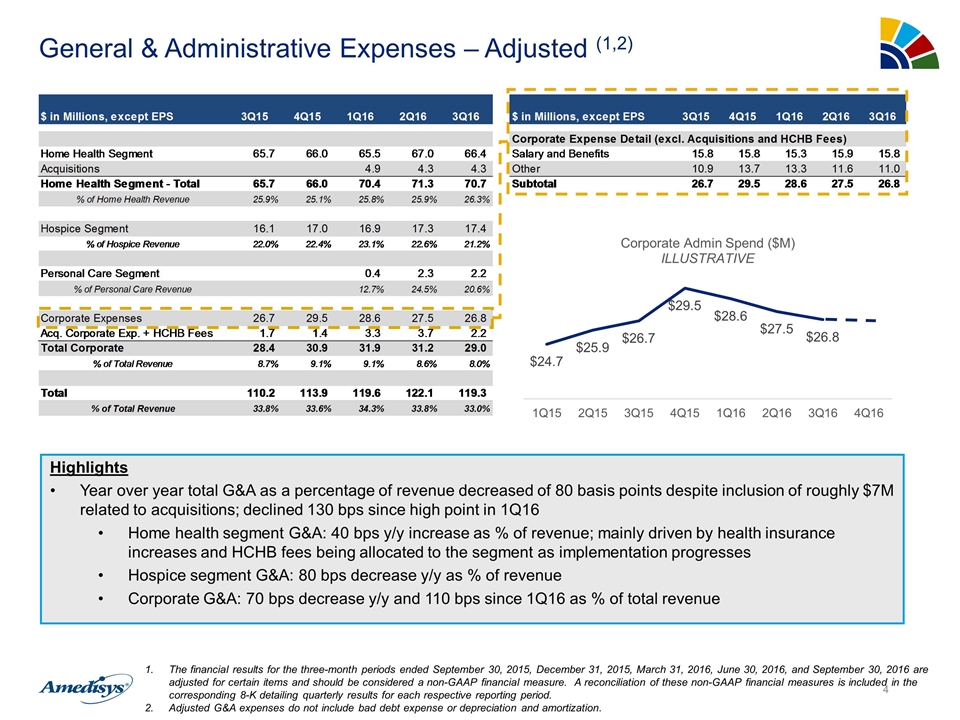
General & Administrative Expenses – Adjusted (1,2) Highlights Year over year total G&A as a percentage of revenue decreased of 80 basis points despite inclusion of roughly $7M related to acquisitions; declined 130 bps since high point in 1Q16 Home health segment G&A: 40 bps y/y increase as % of revenue; mainly driven by health insurance increases and HCHB fees being allocated to the segment as implementation progresses Hospice segment G&A: 80 bps decrease y/y as % of revenue Corporate G&A: 70 bps decrease y/y and 110 bps since 1Q16 as % of total revenue The financial results for the three-month periods ended September 30, 2015, December 31, 2015, March 31, 2016, June 30, 2016, and September 30, 2016 are adjusted for certain items and should be considered a non-GAAP financial measure. A reconciliation of these non-GAAP financial measures is included in the corresponding 8-K detailing quarterly results for each respective reporting period. Adjusted G&A expenses do not include bad debt expense or depreciation and amortization.
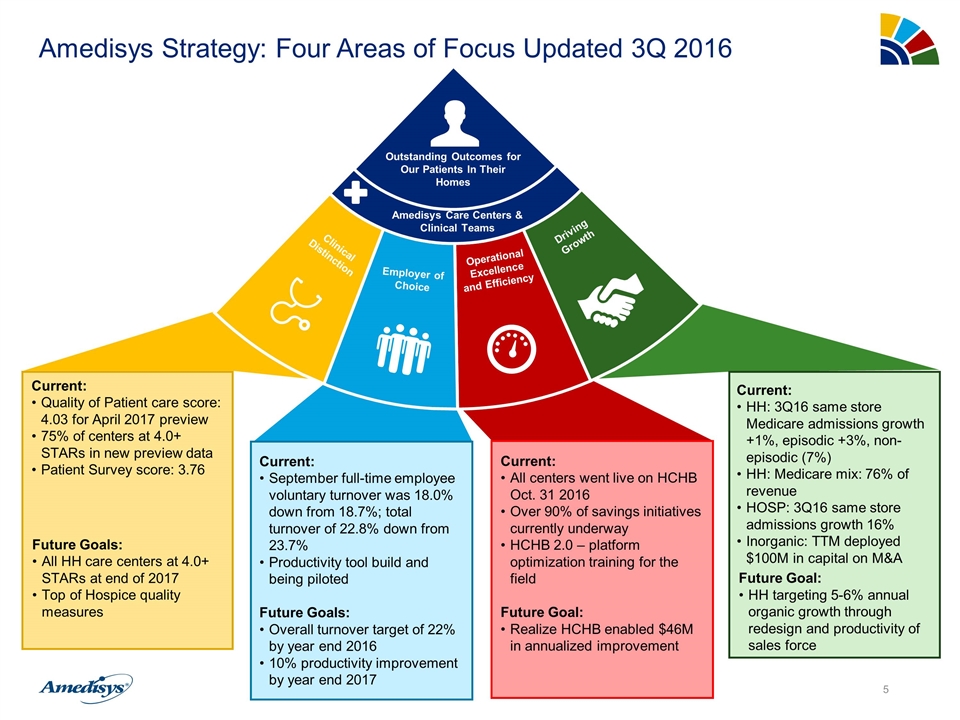
Amedisys Strategy: Four Areas of Focus Updated 3Q 2016 Clinicians Patient Health Clinicians Patient Health Outstanding Outcomes for Our Patients In Their Homes Amedisys Care Centers & Clinical Teams Current: All centers went live on HCHB Oct. 31 2016 Over 90% of savings initiatives currently underway HCHB 2.0 – platform optimization training for the field Future Goal: Realize HCHB enabled $46M in annualized improvement Current: Quality of Patient care score: 4.03 for April 2017 preview 75% of centers at 4.0+ STARs in new preview data Patient Survey score: 3.76 Future Goals: All HH care centers at 4.0+ STARs at end of 2017 Top of Hospice quality measures Current: HH: 3Q16 same store Medicare admissions growth +1%, episodic +3%, non-episodic (7%) HH: Medicare mix: 76% of revenue HOSP: 3Q16 same store admissions growth 16% Inorganic: TTM deployed $100M in capital on M&A Future Goal: HH targeting 5-6% annual organic growth through redesign and productivity of sales force Current: September full-time employee voluntary turnover was 18.0% down from 18.7%; total turnover of 22.8% down from 23.7% Productivity tool build and being piloted Future Goals: Overall turnover target of 22% by year end 2016 10% productivity improvement by year end 2017 Driving Growth Operational Excellence and Efficiency Employer of Choice Clinical Distinction Outstanding Outcomes for Our Patients In Their Homes Amedisys Care Centers & Clinical Teams
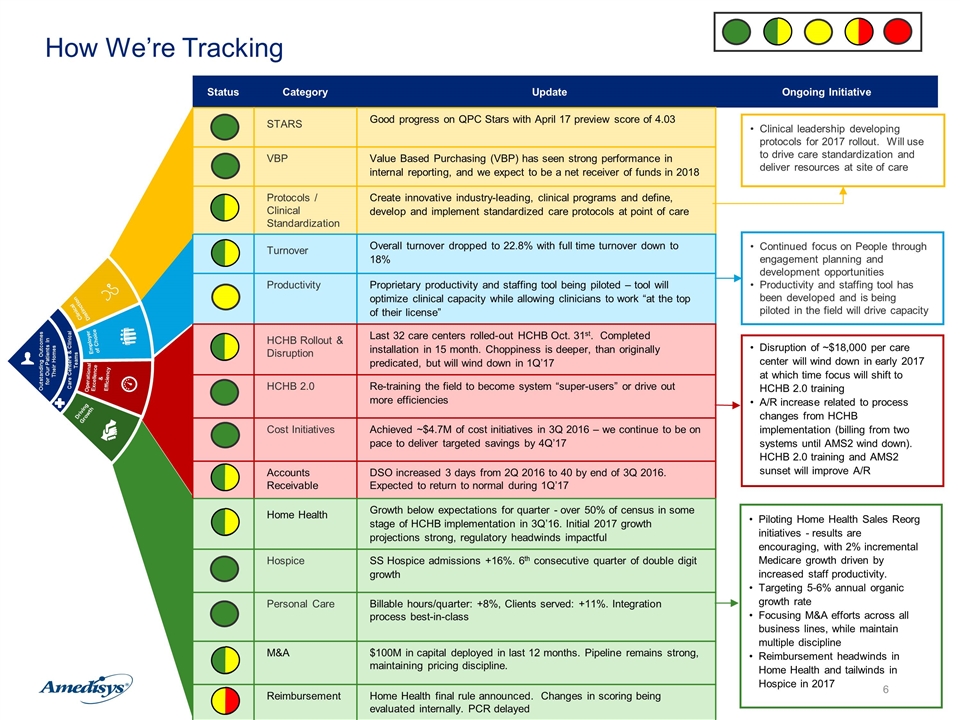
How We’re Tracking Clinical Distinction Employer of Choice Operational Excellence & Efficiency Driving Growth Outstanding Outcomes for Our Patients In Their Homes Care Centers & Clinical Teams Status Category Update Ongoing Initiative STARS Good progress on QPC Stars with April 17 preview score of 4.03 VBP Value Based Purchasing (VBP) has seen strong performance in internal reporting, and we expect to be a net receiver of funds in 2018 Protocols / Clinical Standardization Create innovative industry-leading, clinical programs and define, develop and implement standardized care protocols at point of care Turnover Overall turnover dropped to 22.8% with full time turnover down to 18% Productivity Proprietary productivity and staffing tool being piloted – tool will optimize clinical capacity while allowing clinicians to work “at the top of their license” HCHB Rollout & Disruption Last 32 care centers rolled-out HCHB Oct. 31st. Completed installation in 15 month. Choppiness is deeper, than originally predicated, but will wind down in 1Q’17 HCHB 2.0 Re-training the field to become system “super-users” or drive out more efficiencies Cost Initiatives Achieved ~$4.7M of cost initiatives in 3Q 2016 – we continue to be on pace to deliver targeted savings by 4Q’17 Accounts Receivable DSO increased 3 days from 2Q 2016 to 40 by end of 3Q 2016. Expected to return to normal during 1Q’17 Home Health Growth below expectations for quarter - over 50% of census in some stage of HCHB implementation in 3Q’16. Initial 2017 growth projections strong, regulatory headwinds impactful Hospice SS Hospice admissions +16%. 6th consecutive quarter of double digit growth Personal Care Billable hours/quarter: +8%, Clients served: +11%. Integration process best-in-class M&A $100M in capital deployed in last 12 months. Pipeline remains strong, maintaining pricing discipline. Reimbursement Home Health final rule announced. Changes in scoring being evaluated internally. PCR delayed Clinical leadership developing protocols for 2017 rollout. Will use to drive care standardization and deliver resources at site of care Continued focus on People through engagement planning and development opportunities Productivity and staffing tool has been developed and is being piloted in the field will drive capacity Piloting Home Health Sales Reorg initiatives - results are encouraging, with 2% incremental Medicare growth driven by increased staff productivity. Targeting 5-6% annual organic growth rate Focusing M&A efforts across all business lines, while maintain multiple discipline Reimbursement headwinds in Home Health and tailwinds in Hospice in 2017 Disruption of ~$18,000 per care center will wind down in early 2017 at which time focus will shift to HCHB 2.0 training A/R increase related to process changes from HCHB implementation (billing from two systems until AMS2 wind down). HCHB 2.0 training and AMS2 sunset will improve A/R
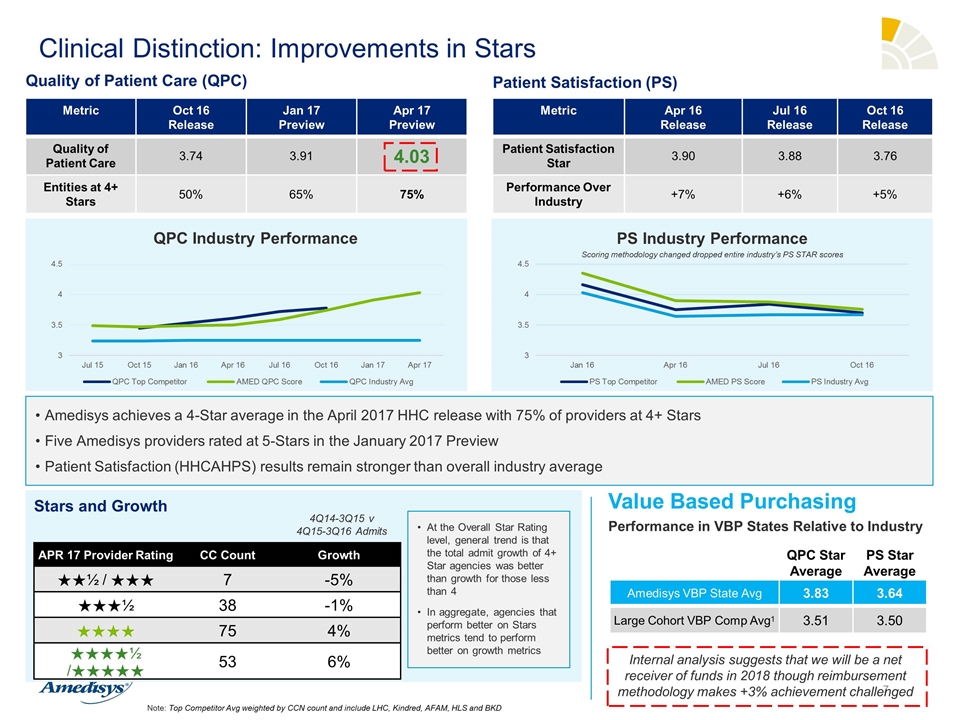
Clinical Distinction: Improvements in Stars Value Based Purchasing QPC Star Average PS Star Average Amedisys VBP State Avg 3.83 3.64 Large Cohort VBP Comp Avg1 3.51 3.50 Performance in VBP States Relative to Industry Internal analysis suggests that we will be a net receiver of funds in 2018 though reimbursement methodology makes +3% achievement challenged Metric Oct 16 Release Jan 17 Preview Apr 17 Preview Quality of Patient Care 3.74 3.91 4.03 Entities at 4+ Stars 50% 65% 75% Quality of Patient Care (QPC) Amedisys achieves a 4-Star average in the April 2017 HHC release with 75% of providers at 4+ Stars Five Amedisys providers rated at 5-Stars in the January 2017 Preview Patient Satisfaction (HHCAHPS) results remain stronger than overall industry average Metric Apr 16 Release Jul 16 Release Oct 16 Release Patient Satisfaction Star 3.90 3.88 3.76 Performance Over Industry +7% +6% +5% Patient Satisfaction (PS) QPC Industry Performance PS Industry Performance Note: Top Competitor Avg weighted by CCN count and include LHC, Kindred, AFAM, HLS and BKD Scoring methodology changed dropped entire industry’s PS STAR scores Stars and Growth APR 17 Provider Rating CC Count Growth ★★½ / ★★★ 7 -5% ★★★½ 38 -1% ★★★★ 75 4% ★★★★½ /★★★★★ 53 6% At the Overall Star Rating level, general trend is that the total admit growth of 4+ Star agencies was better than growth for those less than 4 In aggregate, agencies that perform better on Stars metrics tend to perform better on growth metrics 4Q14-3Q15 v 4Q15-3Q16 Admits
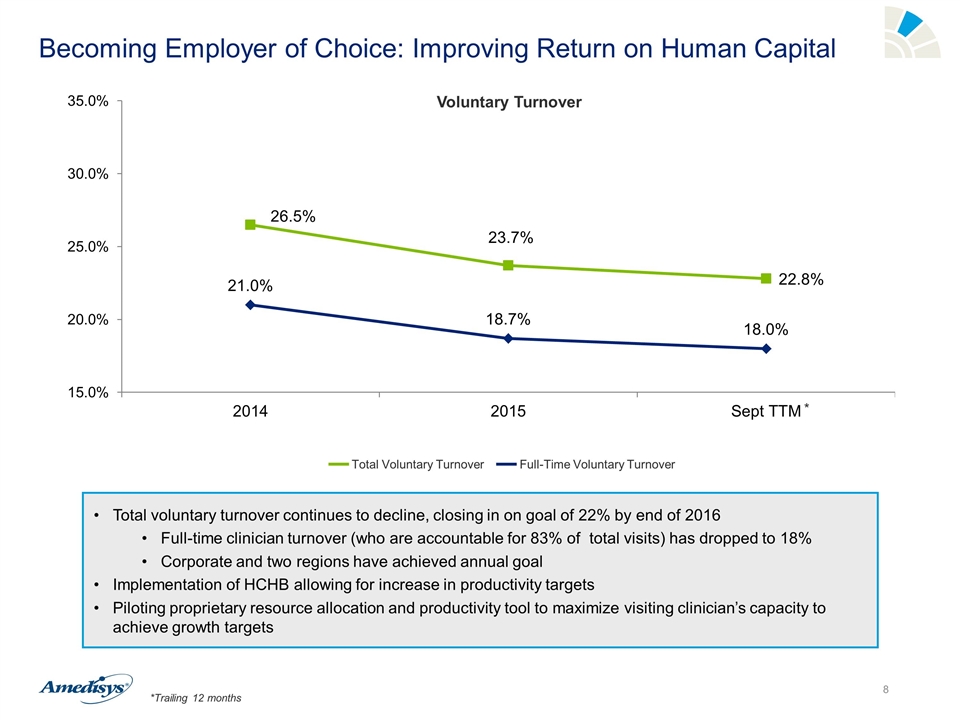
Becoming Employer of Choice: Improving Return on Human Capital Total voluntary turnover continues to decline, closing in on goal of 22% by end of 2016 Full-time clinician turnover (who are accountable for 83% of total visits) has dropped to 18% Corporate and two regions have achieved annual goal Implementation of HCHB allowing for increase in productivity targets Piloting proprietary resource allocation and productivity tool to maximize visiting clinician’s capacity to achieve growth targets Voluntary Turnover Total Voluntary Turnover Full-Time Voluntary Turnover *Trailing 12 months *
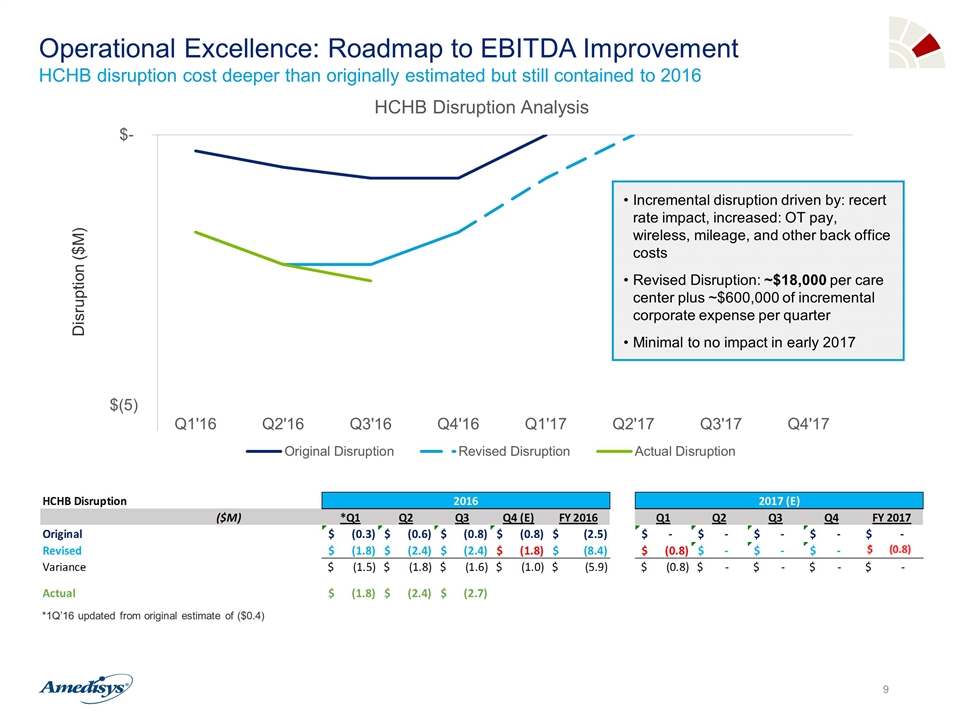
Operational Excellence: Roadmap to EBITDA Improvement HCHB disruption cost deeper than originally estimated but still contained to 2016 Disruption ($M) Incremental disruption driven by: recert rate impact, increased: OT pay, wireless, mileage, and other back office costs Revised Disruption: ~$18,000 per care center plus ~$600,000 of incremental corporate expense per quarter Minimal to no impact in early 2017 *1Q’16 updated from original estimate of ($0.4)
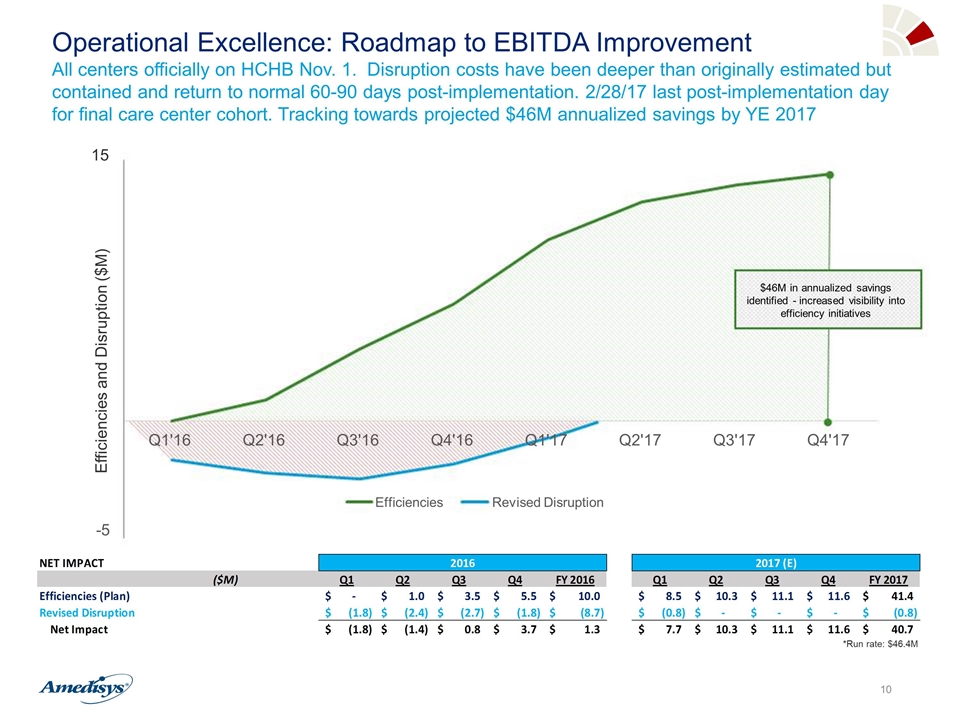
$46M in annualized savings identified - increased visibility into efficiency initiatives *Run rate: $46.4M Efficiencies and Disruption ($M) Operational Excellence: Roadmap to EBITDA Improvement All centers officially on HCHB Nov. 1. Disruption costs have been deeper than originally estimated but contained and return to normal 60-90 days post-implementation. 2/28/17 last post-implementation day for final care center cohort. Tracking towards projected $46M annualized savings by YE 2017 15 - 5 Q1'16 Q2'16 Q3'16 Q4'16 Q1'17 Q2'17 Q3'17 Q4'17 Efficiencies Revised Disruption
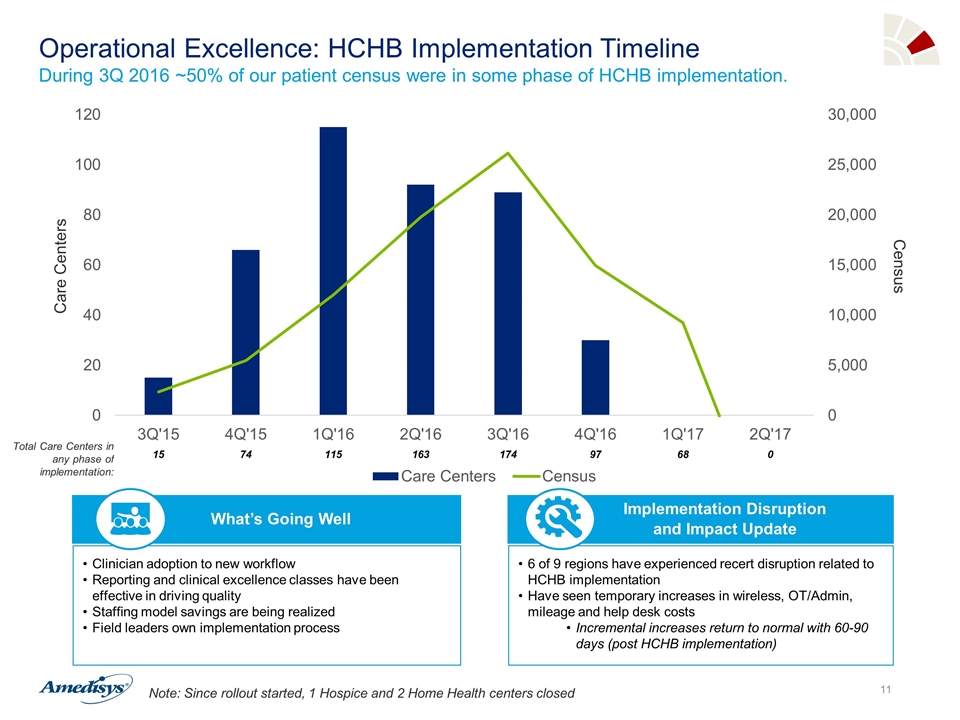
Operational Excellence: HCHB Implementation Timeline During 3Q 2016 ~50% of our patient census were in some phase of HCHB implementation. Note: Since rollout started, 1 Hospice and 2 Home Health centers closed Clinician adoption to new workflow Reporting and clinical excellence classes have been effective in driving quality Staffing model savings are being realized Field leaders own implementation process What’s Going Well 6 of 9 regions have experienced recert disruption related to HCHB implementation Have seen temporary increases in wireless, OT/Admin, mileage and help desk costs Incremental increases return to normal with 60-90 days (post HCHB implementation) Implementation Disruption and Impact Update Care Centers Census Total Care Centers in any phase of implementation: 15 74 115 163 174 97 68 0
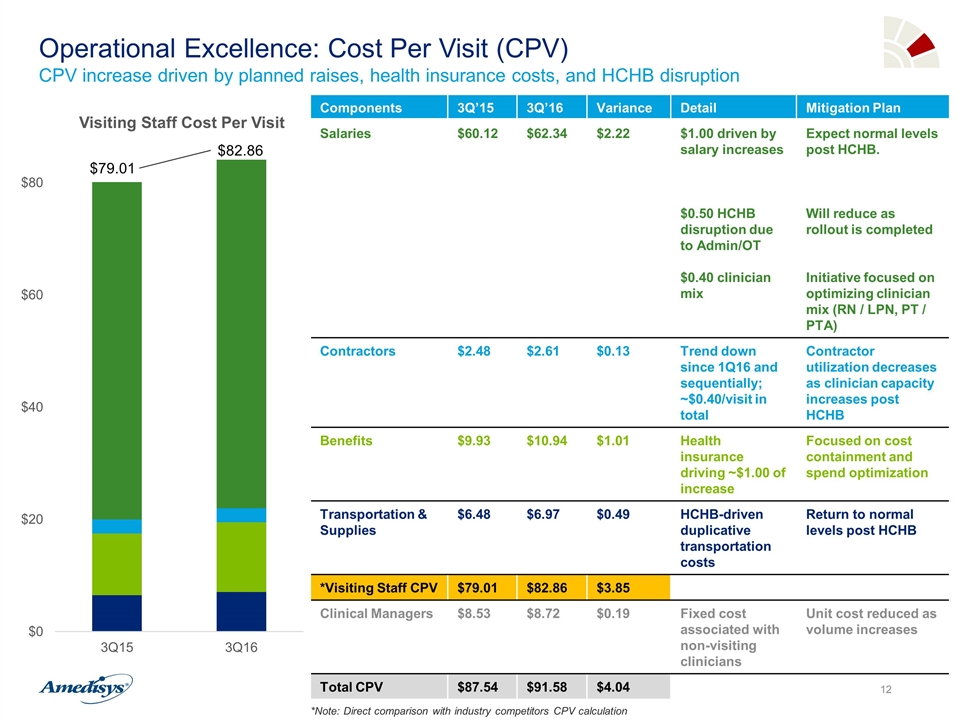
$82.86 $79.01 Components 3Q’15 3Q’16 Variance Detail Mitigation Plan Salaries $60.12 $62.34 $2.22 $1.00 driven by salary increases $0.50 HCHB disruption due to Admin/OT $0.40 clinician mix Expect normal levels post HCHB. Will reduce as rollout is completed Initiative focused on optimizing clinician mix (RN / LPN, PT / PTA) Contractors $2.48 $2.61 $0.13 Trend down since 1Q16 and sequentially; ~$0.40/visit in total Contractor utilization decreases as clinician capacity increases post HCHB Benefits $9.93 $10.94 $1.01 Health insurance driving ~$1.00 of increase Focused on cost containment and spend optimization Transportation & Supplies $6.48 $6.97 $0.49 HCHB-driven duplicative transportation costs Return to normal levels post HCHB *Visiting Staff CPV $79.01 $82.86 $3.85 Clinical Managers $8.53 $8.72 $0.19 Fixed cost associated with non-visiting clinicians Unit cost reduced as volume increases Total CPV $87.54 $91.58 $4.04 Operational Excellence: Cost Per Visit (CPV) CPV increase driven by planned raises, health insurance costs, and HCHB disruption *Note: Direct comparison with industry competitors CPV calculation
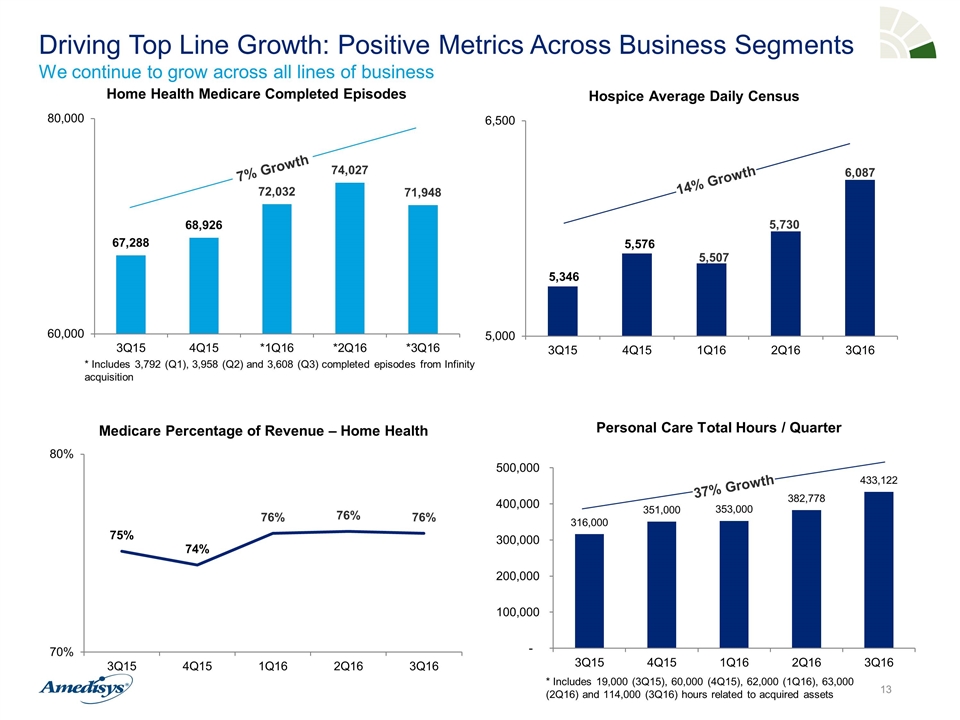
Driving Top Line Growth: Positive Metrics Across Business Segments We continue to grow across all lines of business 234 Opportunities Prospected 45 Opportunities Under Review 13 Active Processes * Includes 3,792 (Q1), 3,958 (Q2) and 3,608 (Q3) completed episodes from Infinity acquisition 7% Growth 14% Growth Personal Care Total Hours / Quarter 37% Growth * Includes 19,000 (3Q15), 60,000 (4Q15), 62,000 (1Q16), 63,000 (2Q16) and 114,000 (3Q16) hours related to acquired assets
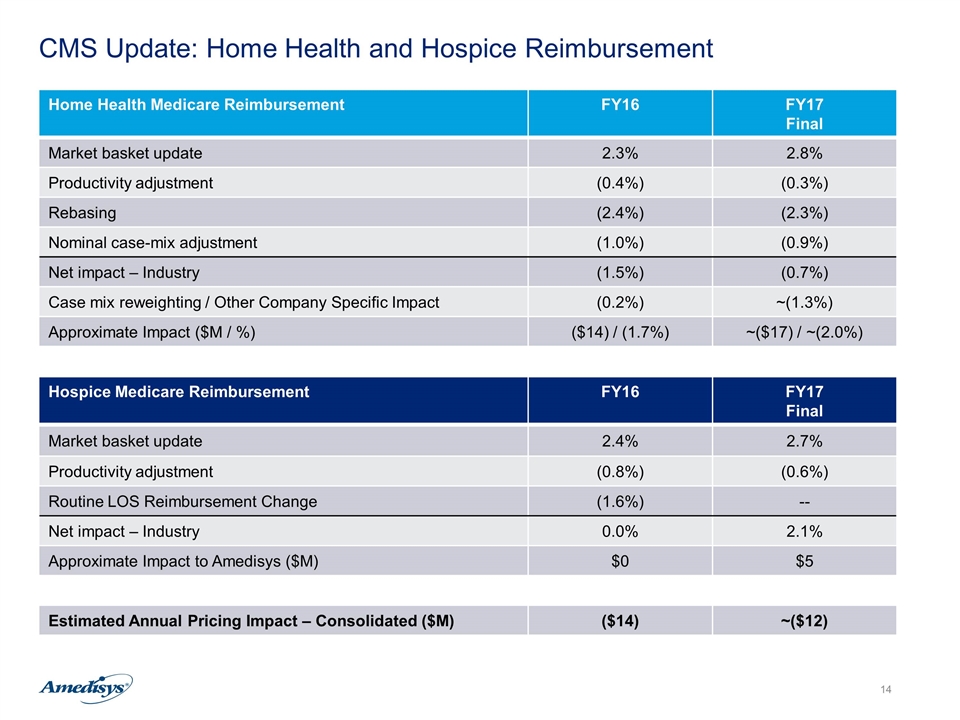
CMS Update: Home Health and Hospice Reimbursement Home Health Medicare Reimbursement FY16 FY17 Final Market basket update 2.3% 2.8% Productivity adjustment (0.4%) (0.3%) Rebasing (2.4%) (2.3%) Nominal case-mix adjustment (1.0%) (0.9%) Net impact – Industry (1.5%) (0.7%) Case mix reweighting / Other Company Specific Impact (0.2%) ~(1.3%) Approximate Impact ($M / %) ($14) / (1.7%) ~($17) / ~(2.0%) Hospice Medicare Reimbursement FY16 FY17 Final Market basket update 2.4% 2.7% Productivity adjustment (0.8%) (0.6%) Routine LOS Reimbursement Change (1.6%) -- Net impact – Industry 0.0% 2.1% Approximate Impact to Amedisys ($M) $0 $5 Estimated Annual Pricing Impact – Consolidated ($M) ($14) ~($12)
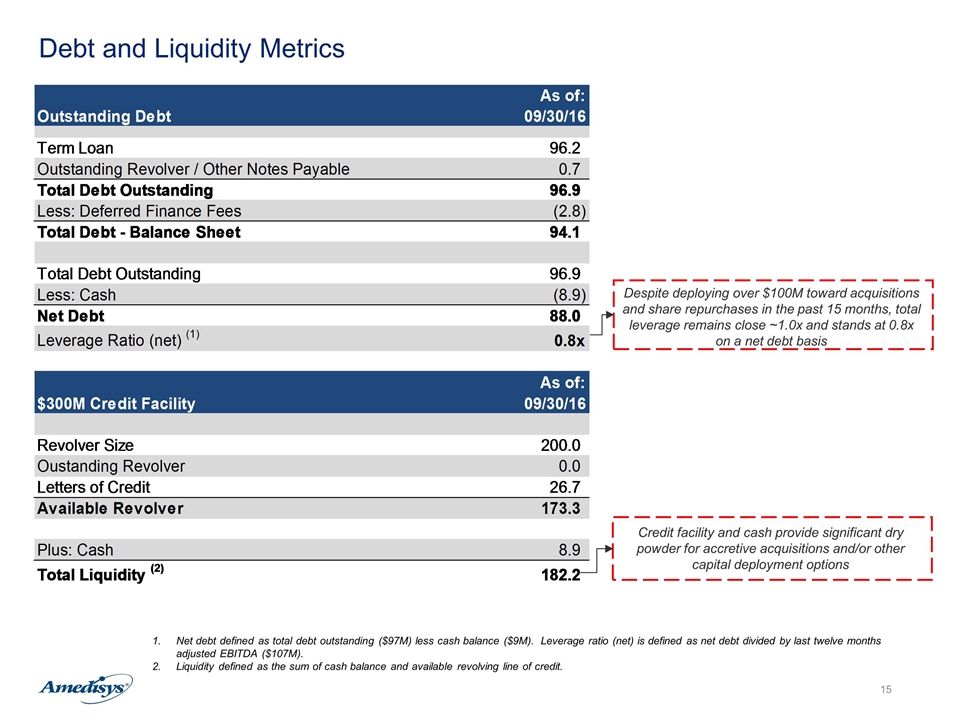
Debt and Liquidity Metrics Net debt defined as total debt outstanding ($97M) less cash balance ($9M). Leverage ratio (net) is defined as net debt divided by last twelve months adjusted EBITDA ($107M). Liquidity defined as the sum of cash balance and available revolving line of credit. Despite deploying over $100M toward acquisitions and share repurchases in the past 15 months, total leverage remains close ~1.0x and stands at 0.8x on a net debt basis Credit facility and cash provide significant dry powder for accretive acquisitions and/or other capital deployment options
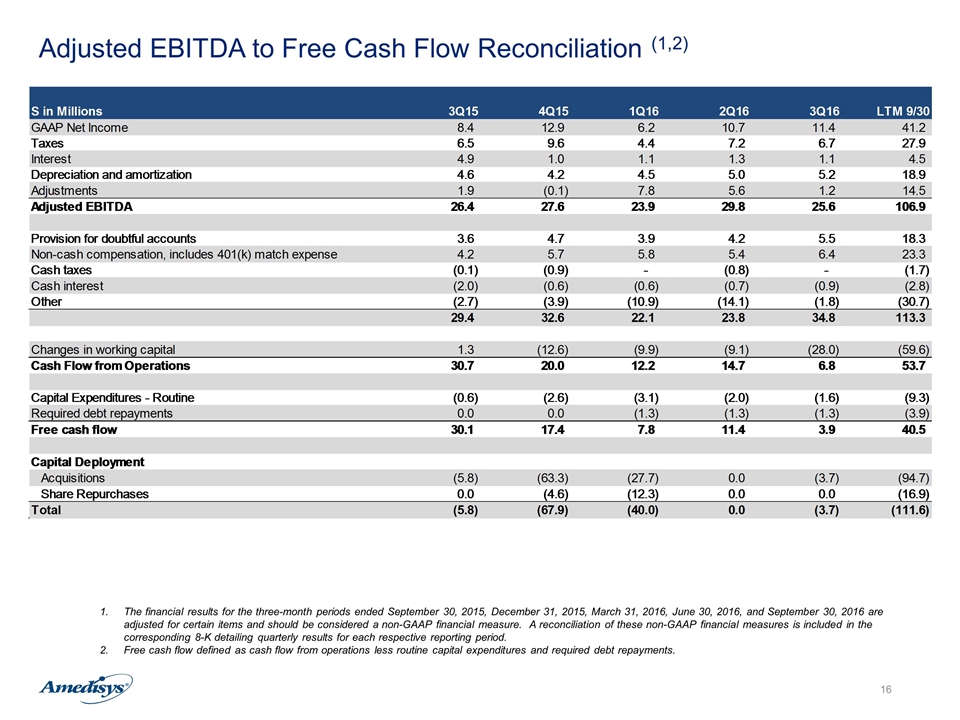
Adjusted EBITDA to Free Cash Flow Reconciliation (1,2) The financial results for the three-month periods ended September 30, 2015, December 31, 2015, March 31, 2016, June 30, 2016, and September 30, 2016 are adjusted for certain items and should be considered a non-GAAP financial measure. A reconciliation of these non-GAAP financial measures is included in the corresponding 8-K detailing quarterly results for each respective reporting period. Free cash flow defined as cash flow from operations less routine capital expenditures and required debt repayments.
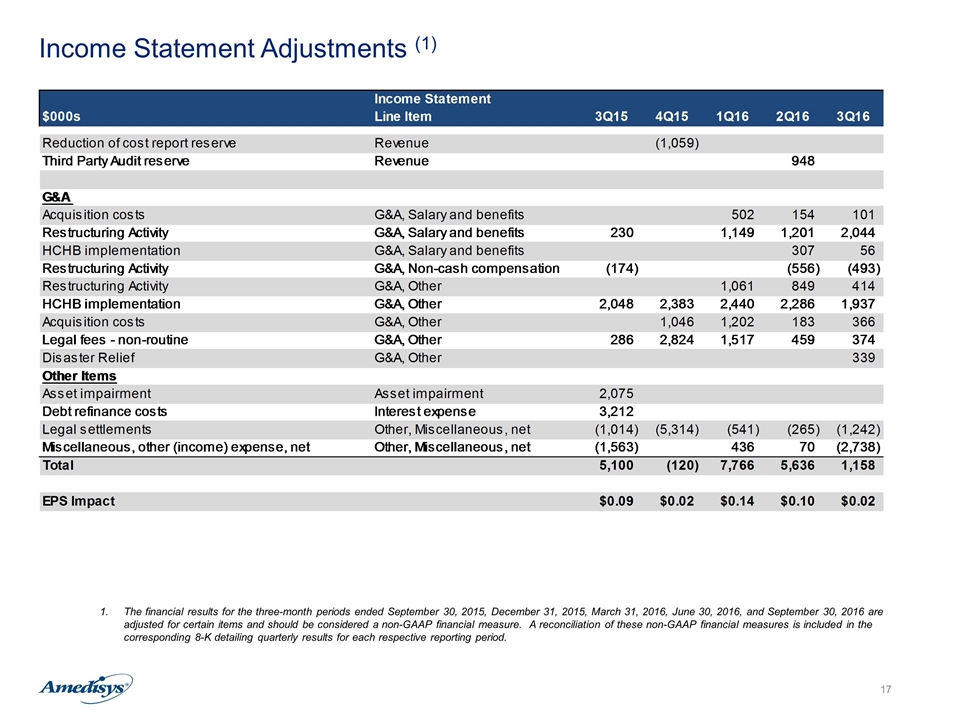
Income Statement Adjustments (1) The financial results for the three-month periods ended September 30, 2015, December 31, 2015, March 31, 2016, June 30, 2016, and September 30, 2016 are adjusted for certain items and should be considered a non-GAAP financial measure. A reconciliation of these non-GAAP financial measures is included in the corresponding 8-K detailing quarterly results for each respective reporting period. Income Statement $000s Line Item Q414 2Q15 3Q15 4Q15 1Q16 2Q16 3Q16 Reduction of cost report reserve Revenue -1059 Third Party Audit reserve Revenue 948 G&A Acquisition costs G&A, Salary and benefits 502 154 101 Restructuring Activity G&A, Salary and benefits 3323 230 1149 1201 2044 HCHB implementation G&A, Salary and benefits -644 307 56 Restructuring Activity G&A, Non-cash compensation -174 -556 -493 Restructuring Activity G&A, Other 1061 849 414 HCHB implementation G&A, Other 2048 2383 2440 2286 1937 Acquisition costs G&A, Other 1046 1202 183 366 Legal fees - non-routine G&A, Other 8000 286 2824 1517 459 374 Disaster Relief G&A, Other 339 Other Items Asset impairment Asset impairment 899 2075 Debt refinance costs Interest expense 3212 Legal settlements Other, Miscellaneous, net -1,113 -307 -1014 -5314 -541 -265 -1242 Miscellaneous, other (income) expense, net Other, Miscellaneous, net -3945 -1563 436 70 -2738 Total -,214 6,427 5,100 -,120 7,766 5,636 1,158 EPS Impact $-0.01 $0.12 $9.1387688013335661E-2 $0.02 $0.14000000000000001 $0.1 $0.02 Home Health Adjustments 3,615 Acquisition related costs 1,046 Exit and restructuring activity costs - HSP #N/A 0 45 0 Department of Justice - legal fees #N/A 0 0 286 459 Inventory and Data Security Reporting Wage and Hour litigation 8,000 Exit and restructuring activity costs #N/A 0 1,646 56 Asset impairment #N/A 899 0 0 DOJ 0 0 0 0 Debt Costs 0 0 0 0 Legal settlement #N/A -1,113 0 -1,014 -,596 Noncontrolling interests impairment charge 0 0 0 0 D&O Proceeds 0 0 0 0 Valley Writeoff 0 0 0 0 Tax Adjustment 0 0 0 0 Gain/loss on sale of care centers #N/A 0 0 -,184 Loss on sale of plane 0 0 0 0 Relator fees Other G&A 0 0 0 Loss on disposal of inpatient facility #N/A 0 0 0 Deferred financing fees #N/A 0 0 3,212 Unrealized gain on investment #N/A 0 -3,945 -1,379 Partial claim recovery Misc, net 0 -,307 0 -4,718 Building write down Asset Impairment 0 0 2,075 HCHB Implementation Other G&A 0 0 2,048 2,383 Life Insurance proceeds Misc, net 0 0 0 Total pre-tax impact -,214 5,439 5,100 2,189 EPS Impact $-0.01 $0.1262119310200544 $9.1387688013335661E-2


