
Amedisys Third Quarter 2017 Earnings Call Supplemental Slides November 8th, 2017 Exhibit 99.2
This presentation may include forward-looking statements as defined by the Private Securities Litigation Reform Act of 1995. These forward-looking statements are based upon current expectations and assumptions about our business that are subject to a variety of risks and uncertainties that could cause actual results to differ materially from those described in this presentation. You should not rely on forward-looking statements as a prediction of future events. Additional information regarding factors that could cause actual results to differ materially from those discussed in any forward-looking statements are described in reports and registration statements we file with the SEC, including our Annual Report on Form 10-K and subsequent Quarterly Reports on Form 10-Q and Current Reports on Form 8-K, copies of which are available on the Amedisys internet website http://www.amedisys.com or by contacting the Amedisys Investor Relations department at (225) 292-2031. We disclaim any obligation to update any forward-looking statements or any changes in events, conditions or circumstances upon which any forward-looking statement may be based except as required by law. www.amedisys.com NASDAQ: AMED We encourage everyone to visit the Investors Section of our website at www.amedisys.com, where we have posted additional important information such as press releases, profiles concerning our business and clinical operations and control processes, and SEC filings. Forward-looking statements
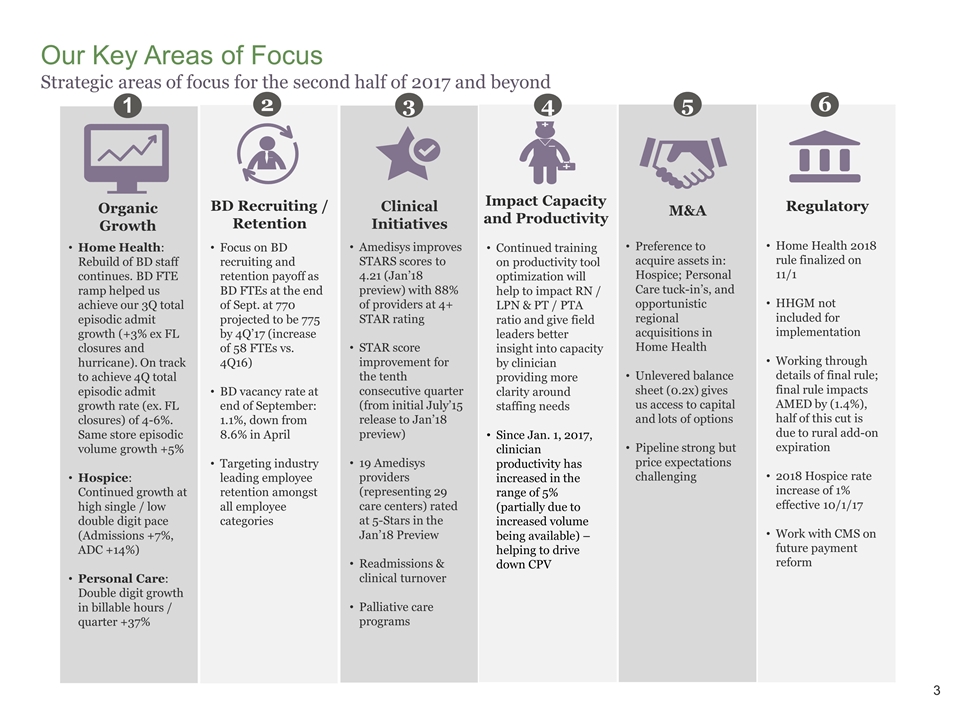
3 Our Key Areas of Focus Strategic areas of focus for the second half of 2017 and beyond Home Health: Rebuild of BD staff continues. BD FTE ramp helped us achieve our 3Q total episodic admit growth (+3% ex FL closures and hurricane). On track to achieve 4Q total episodic admit growth rate (ex. FL closures) of 4-6%. Same store episodic volume growth +5% Hospice: Continued growth at high single / low double digit pace (Admissions +7%, ADC +14%) Personal Care: Double digit growth in billable hours / quarter +37% 1 Organic Growth Amedisys improves STARS scores to 4.21 (Jan’18 preview) with 88% of providers at 4+ STAR rating STAR score improvement for the tenth consecutive quarter (from initial July’15 release to Jan’18 preview) 19 Amedisys providers (representing 29 care centers) rated at 5-Stars in the Jan’18 Preview Readmissions & clinical turnover Palliative care programs 3 Clinical Initiatives Continued training on productivity tool optimization will help to impact RN / LPN & PT / PTA ratio and give field leaders better insight into capacity by clinician providing more clarity around staffing needs Since Jan. 1, 2017, clinician productivity has increased in the range of 5% (partially due to increased volume being available) – helping to drive down CPV 4 Impact Capacity and Productivity Preference to acquire assets in: Hospice; Personal Care tuck-in’s, and opportunistic regional acquisitions in Home Health Unlevered balance sheet (0.2x) gives us access to capital and lots of options Pipeline strong but price expectations challenging 5 M&A 2 BD Recruiting / Retention Focus on BD recruiting and retention payoff as BD FTEs at the end of Sept. at 770 projected to be 775 by 4Q’17 (increase of 58 FTEs vs. 4Q16) BD vacancy rate at end of September: 1.1%, down from 8.6% in April Targeting industry leading employee retention amongst all employee categories 6 Regulatory Home Health 2018 rule finalized on 11/1 HHGM not included for implementation Working through details of final rule; final rule impacts AMED by (1.4%), half of this cut is due to rural add-on expiration 2018 Hospice rate increase of 1% effective 10/1/17 Work with CMS on future payment reform
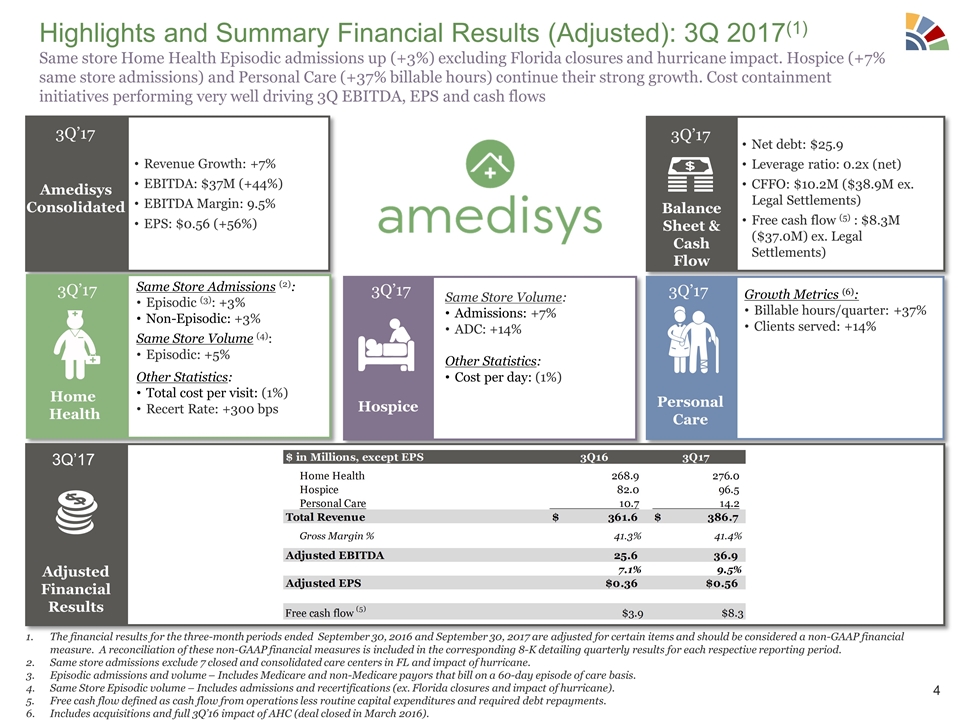
Highlights and Summary Financial Results (Adjusted): 3Q 2017(1) Same store Home Health Episodic admissions up (+3%) excluding Florida closures and hurricane impact. Hospice (+7% same store admissions) and Personal Care (+37% billable hours) continue their strong growth. Cost containment initiatives performing very well driving 3Q EBITDA, EPS and cash flows Amedisys Consolidated Revenue Growth: +7% EBITDA: $37M (+44%) EBITDA Margin: 9.5% EPS: $0.56 (+56%) 3Q’17 Net debt: $25.9 Leverage ratio: 0.2x (net) CFFO: $10.2M ($38.9M ex. Legal Settlements) Free cash flow (5) : $8.3M ($37.0M) ex. Legal Settlements) Balance Sheet & Cash Flow 3Q’17 Same Store Admissions (2): Episodic (3): +3% Non-Episodic: +3% Same Store Volume (4): Episodic: +5% Other Statistics: Total cost per visit: (1%) Recert Rate: +300 bps Home Health Growth Metrics (6): Billable hours/quarter: +37% Clients served: +14% Personal Care Same Store Volume: Admissions: +7% ADC: +14% Other Statistics: Cost per day: (1%) Hospice 3Q’17 3Q’17 3Q’17 Adjusted Financial Results 3Q’17 The financial results for the three-month periods ended September 30, 2016 and September 30, 2017 are adjusted for certain items and should be considered a non-GAAP financial measure. A reconciliation of these non-GAAP financial measures is included in the corresponding 8-K detailing quarterly results for each respective reporting period. Same store admissions exclude 7 closed and consolidated care centers in FL and impact of hurricane. Episodic admissions and volume – Includes Medicare and non-Medicare payors that bill on a 60-day episode of care basis. Same Store Episodic volume – Includes admissions and recertifications (ex. Florida closures and impact of hurricane). Free cash flow defined as cash flow from operations less routine capital expenditures and required debt repayments. Includes acquisitions and full 3Q’16 impact of AHC (deal closed in March 2016).
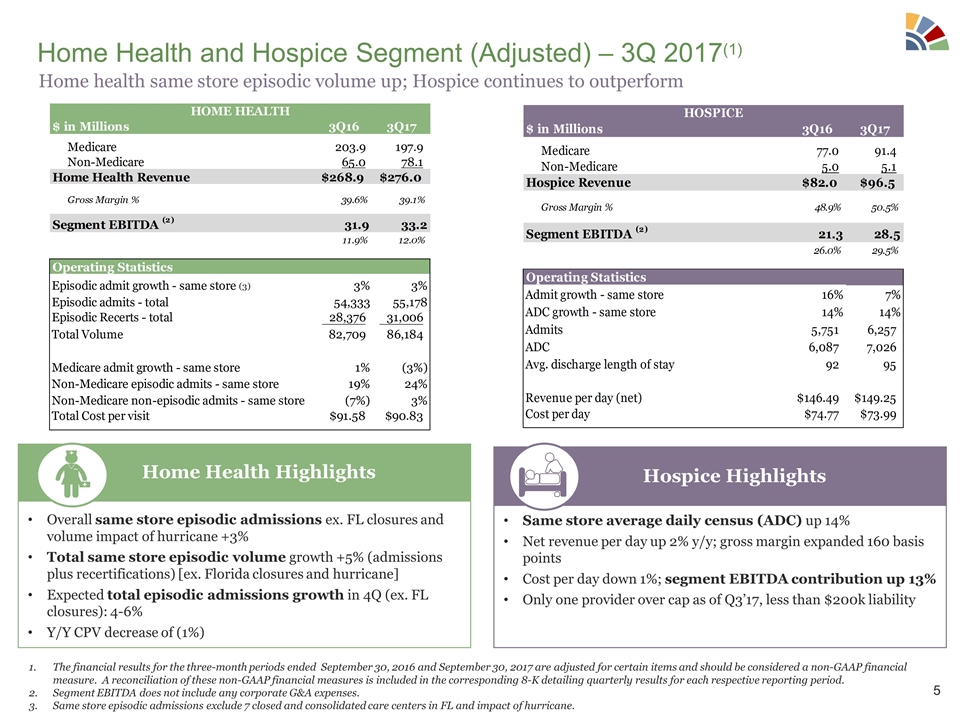
Home Health and Hospice Segment (Adjusted) – 3Q 2017(1) Overall same store episodic admissions ex. FL closures and volume impact of hurricane +3% Total same store episodic volume growth +5% (admissions plus recertifications) [ex. Florida closures and hurricane] Expected total episodic admissions growth in 4Q (ex. FL closures): 4-6% Y/Y CPV decrease of (1%) Home Health Highlights Same store average daily census (ADC) up 14% Net revenue per day up 2% y/y; gross margin expanded 160 basis points Cost per day down 1%; segment EBITDA contribution up 13% Only one provider over cap as of Q3’17, less than $200k liability Hospice Highlights The financial results for the three-month periods ended September 30, 2016 and September 30, 2017 are adjusted for certain items and should be considered a non-GAAP financial measure. A reconciliation of these non-GAAP financial measures is included in the corresponding 8-K detailing quarterly results for each respective reporting period. Segment EBITDA does not include any corporate G&A expenses. Same store episodic admissions exclude 7 closed and consolidated care centers in FL and impact of hurricane. Home health same store episodic volume up; Hospice continues to outperform
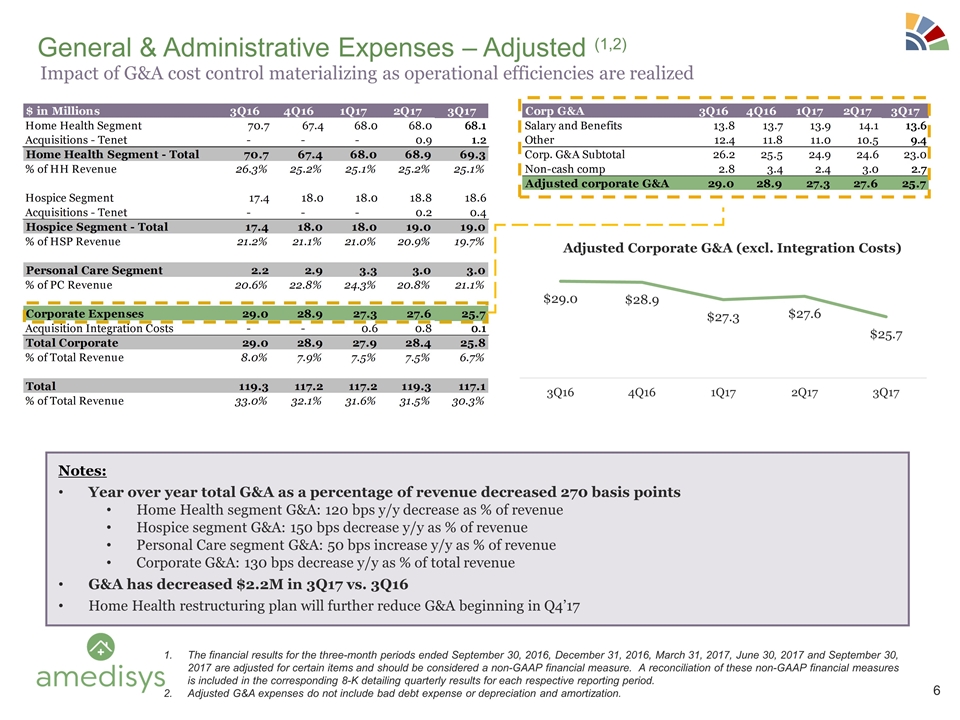
General & Administrative Expenses – Adjusted (1,2) Notes: Year over year total G&A as a percentage of revenue decreased 270 basis points Home Health segment G&A: 120 bps y/y decrease as % of revenue Hospice segment G&A: 150 bps decrease y/y as % of revenue Personal Care segment G&A: 50 bps increase y/y as % of revenue Corporate G&A: 130 bps decrease y/y as % of total revenue G&A has decreased $2.2M in 3Q17 vs. 3Q16 Home Health restructuring plan will further reduce G&A beginning in Q4’17 The financial results for the three-month periods ended September 30, 2016, December 31, 2016, March 31, 2017, June 30, 2017 and September 30, 2017 are adjusted for certain items and should be considered a non-GAAP financial measure. A reconciliation of these non-GAAP financial measures is included in the corresponding 8-K detailing quarterly results for each respective reporting period. Adjusted G&A expenses do not include bad debt expense or depreciation and amortization. Impact of G&A cost control materializing as operational efficiencies are realized
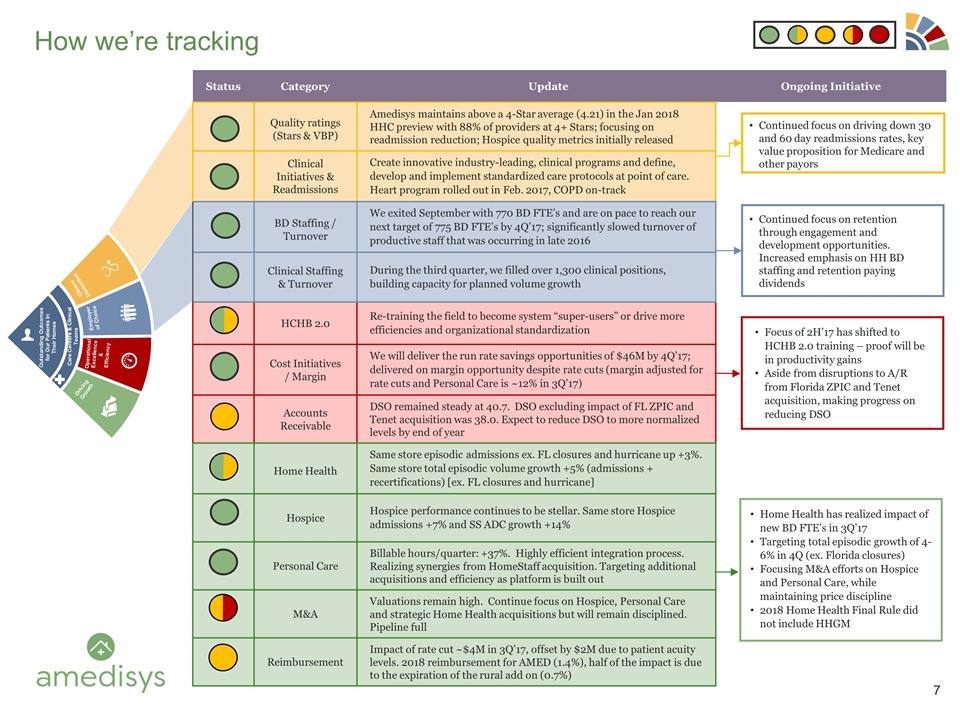
Status Category Update Ongoing Initiative Quality ratings (Stars & VBP) Amedisys maintains above a 4-Star average (4.21) in the Jan 2018 HHC preview with 88% of providers at 4+ Stars; focusing on readmission reduction; Hospice quality metrics initially released Clinical Initiatives & Readmissions Create innovative industry-leading, clinical programs and define, develop and implement standardized care protocols at point of care. Heart program rolled out in Feb. 2017, COPD on-track BD Staffing / Turnover We exited September with 770 BD FTE’s and are on pace to reach our next target of 775 BD FTE’s by 4Q’17; significantly slowed turnover of productive staff that was occurring in late 2016 Clinical Staffing & Turnover During the third quarter, we filled over 1,300 clinical positions, building capacity for planned volume growth HCHB 2.0 Re-training the field to become system “super-users” or drive more efficiencies and organizational standardization Cost Initiatives / Margin We will deliver the run rate savings opportunities of $46M by 4Q’17; delivered on margin opportunity despite rate cuts (margin adjusted for rate cuts and Personal Care is ~12% in 3Q’17) Accounts Receivable DSO remained steady at 40.7. DSO excluding impact of FL ZPIC and Tenet acquisition was 38.0. Expect to reduce DSO to more normalized levels by end of year Home Health Same store episodic admissions ex. FL closures and hurricane up +3%. Same store total episodic volume growth +5% (admissions + recertifications) [ex. FL closures and hurricane] Hospice Hospice performance continues to be stellar. Same store Hospice admissions +7% and SS ADC growth +14% Personal Care Billable hours/quarter: +37%. Highly efficient integration process. Realizing synergies from HomeStaff acquisition. Targeting additional acquisitions and efficiency as platform is built out M&A Valuations remain high. Continue focus on Hospice, Personal Care and strategic Home Health acquisitions but will remain disciplined. Pipeline full Reimbursement Impact of rate cut ~$4M in 3Q’17, offset by $2M due to patient acuity levels. 2018 reimbursement for AMED (1.4%), half of the impact is due to the expiration of the rural add on (0.7%) How we’re tracking Clinical Distinction Employer of Choice Operational Excellence & Efficiency Driving Growth Outstanding Outcomes for Our Patients In Their Homes Care Centers & Clinical Teams Continued focus on driving down 30 and 60 day readmissions rates, key value proposition for Medicare and other payors Continued focus on retention through engagement and development opportunities. Increased emphasis on HH BD staffing and retention paying dividends Home Health has realized impact of new BD FTE’s in 3Q’17 Targeting total episodic growth of 4-6% in 4Q (ex. Florida closures) Focusing M&A efforts on Hospice and Personal Care, while maintaining price discipline 2018 Home Health Final Rule did not include HHGM Focus of 2H’17 has shifted to HCHB 2.0 training – proof will be in productivity gains Aside from disruptions to A/R from Florida ZPIC and Tenet acquisition, making progress on reducing DSO
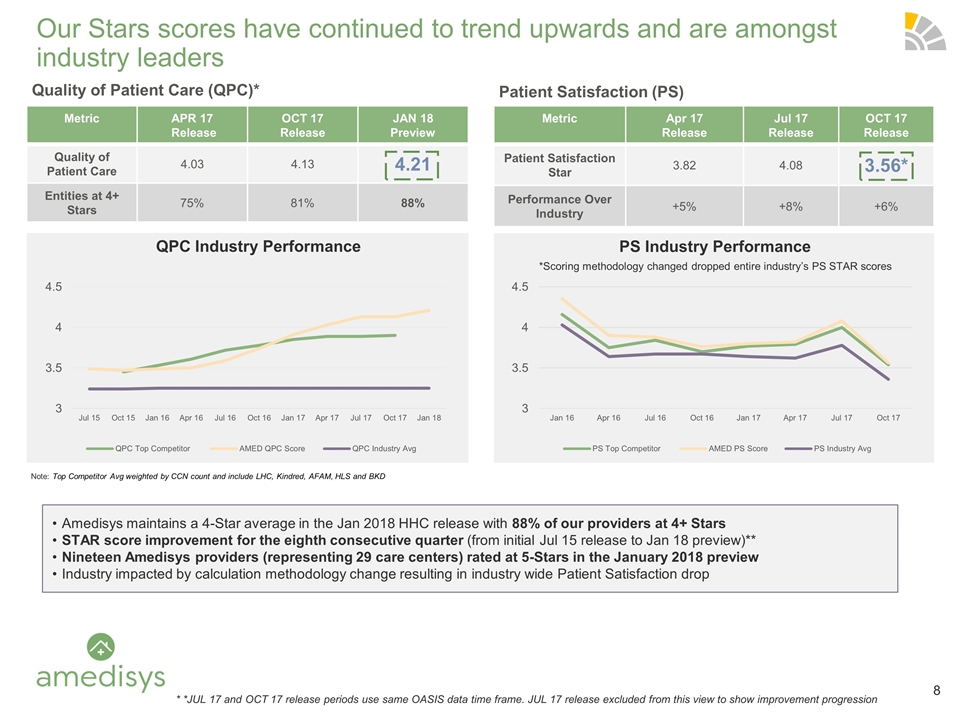
Our Stars scores have continued to trend upwards and are amongst industry leaders Note: Top Competitor Avg weighted by CCN count and include LHC, Kindred, AFAM, HLS and BKD Metric APR 17 Release OCT 17 Release JAN 18 Preview Quality of Patient Care 4.03 4.13 4.21 Entities at 4+ Stars 75% 81% 88% Metric Apr 17 Release Jul 17 Release OCT 17 Release Patient Satisfaction Star 3.82 4.08 3.56* Performance Over Industry +5% +8% +6% Quality of Patient Care (QPC)* Patient Satisfaction (PS) QPC Industry Performance PS Industry Performance *Scoring methodology changed dropped entire industry’s PS STAR scores Amedisys maintains a 4-Star average in the Jan 2018 HHC release with 88% of our providers at 4+ Stars STAR score improvement for the eighth consecutive quarter (from initial Jul 15 release to Jan 18 preview)** Nineteen Amedisys providers (representing 29 care centers) rated at 5-Stars in the January 2018 preview Industry impacted by calculation methodology change resulting in industry wide Patient Satisfaction drop * *JUL 17 and OCT 17 release periods use same OASIS data time frame. JUL 17 release excluded from this view to show improvement progression
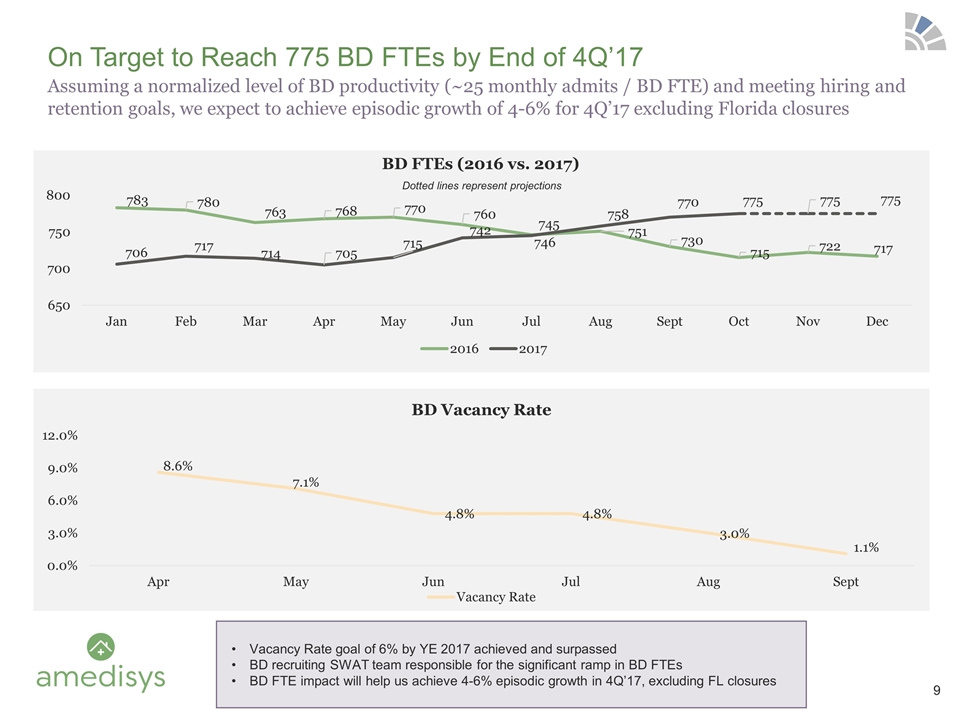
Dotted lines represent projections Assuming a normalized level of BD productivity (~25 monthly admits / BD FTE) and meeting hiring and retention goals, we expect to achieve episodic growth of 4-6% for 4Q’17 excluding Florida closures On Target to Reach 775 BD FTEs by End of 4Q’17 Vacancy Rate goal of 6% by YE 2017 achieved and surpassed BD recruiting SWAT team responsible for the significant ramp in BD FTEs BD FTE impact will help us achieve 4-6% episodic growth in 4Q’17, excluding FL closures
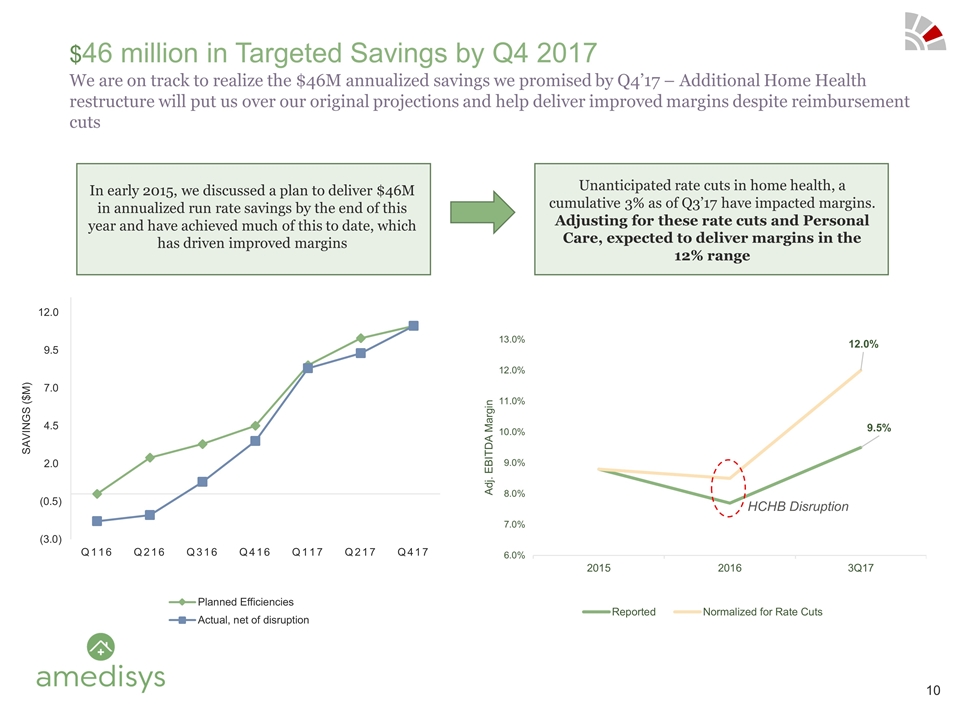
We are on track to realize the $46M annualized savings we promised by Q4’17 – Additional Home Health restructure will put us over our original projections and help deliver improved margins despite reimbursement cuts $46 million in Targeted Savings by Q4 2017 HCHB Disruption In early 2015, we discussed a plan to deliver $46M in annualized run rate savings by the end of this year and have achieved much of this to date, which has driven improved margins Unanticipated rate cuts in home health, a cumulative 3% as of Q3’17 have impacted margins. Adjusting for these rate cuts and Personal Care, expected to deliver margins in the 12% range
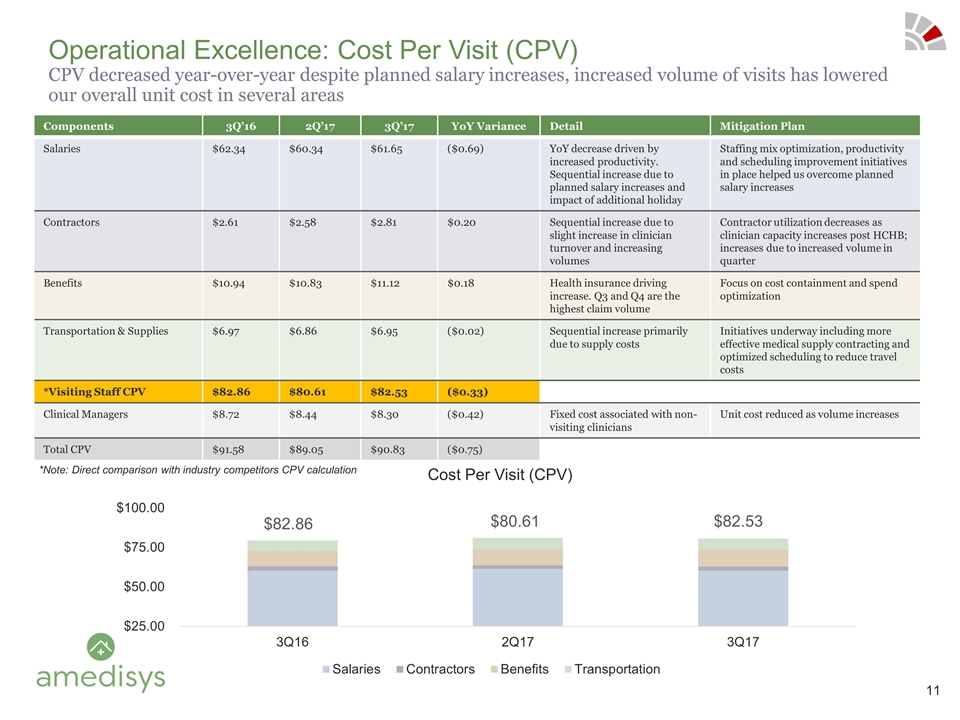
Components 3Q’16 2Q’17 3Q’17 YoY Variance Detail Mitigation Plan Salaries $62.34 $60.34 $61.65 ($0.69) YoY decrease driven by increased productivity. Sequential increase due to planned salary increases and impact of additional holiday Staffing mix optimization, productivity and scheduling improvement initiatives in place helped us overcome planned salary increases Contractors $2.61 $2.58 $2.81 $0.20 Sequential increase due to slight increase in clinician turnover and increasing volumes Contractor utilization decreases as clinician capacity increases post HCHB; increases due to increased volume in quarter Benefits $10.94 $10.83 $11.12 $0.18 Health insurance driving increase. Q3 and Q4 are the highest claim volume Focus on cost containment and spend optimization Transportation & Supplies $6.97 $6.86 $6.95 ($0.02) Sequential increase primarily due to supply costs Initiatives underway including more effective medical supply contracting and optimized scheduling to reduce travel costs *Visiting Staff CPV $82.86 $80.61 $82.53 ($0.33) Clinical Managers $8.72 $8.44 $8.30 ($0.42) Fixed cost associated with non-visiting clinicians Unit cost reduced as volume increases Total CPV $91.58 $89.05 $90.83 ($0.75) Operational Excellence: Cost Per Visit (CPV) CPV decreased year-over-year despite planned salary increases, increased volume of visits has lowered our overall unit cost in several areas *Note: Direct comparison with industry competitors CPV calculation $82.86 $80.61 $82.53
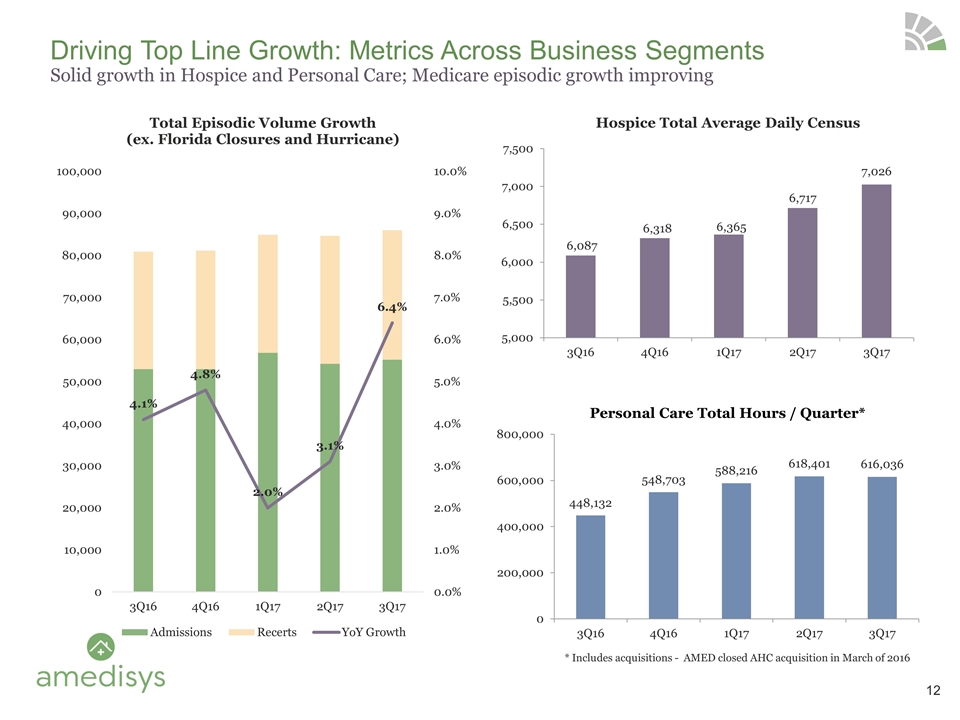
Driving Top Line Growth: Metrics Across Business Segments Solid growth in Hospice and Personal Care; Medicare episodic growth improving 234 Opportunities Prospected 45 Opportunities Under Review 13 Active Processes Personal Care Total Hours / Quarter* * Includes acquisitions - AMED closed AHC acquisition in March of 2016 12
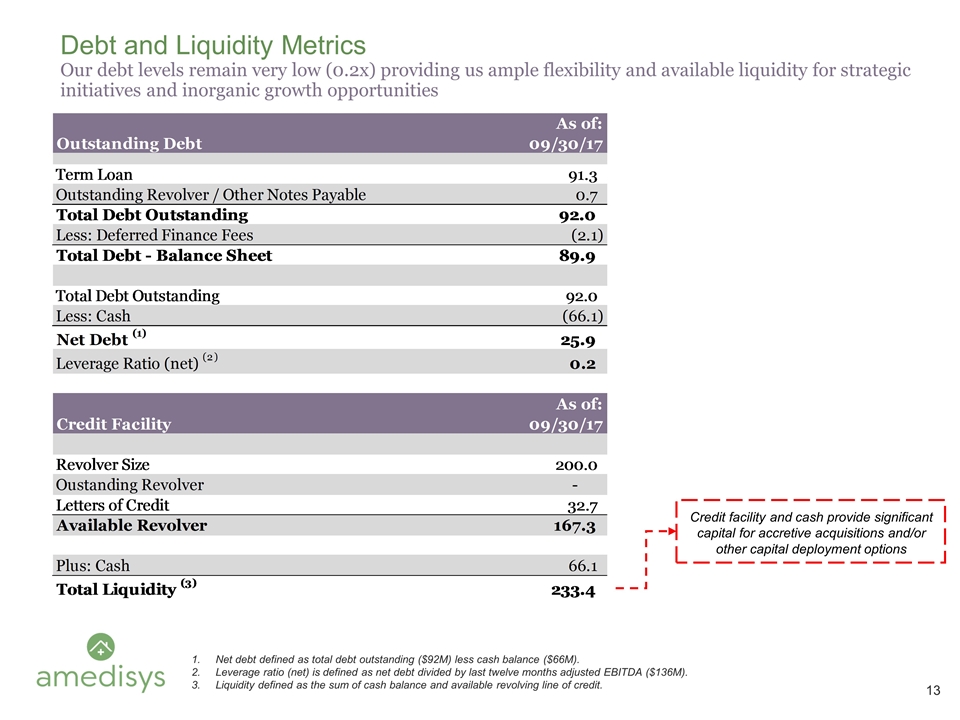
Debt and Liquidity Metrics Our debt levels remain very low (0.2x) providing us ample flexibility and available liquidity for strategic initiatives and inorganic growth opportunities Net debt defined as total debt outstanding ($92M) less cash balance ($66M). Leverage ratio (net) is defined as net debt divided by last twelve months adjusted EBITDA ($136M). Liquidity defined as the sum of cash balance and available revolving line of credit. Credit facility and cash provide significant capital for accretive acquisitions and/or other capital deployment options
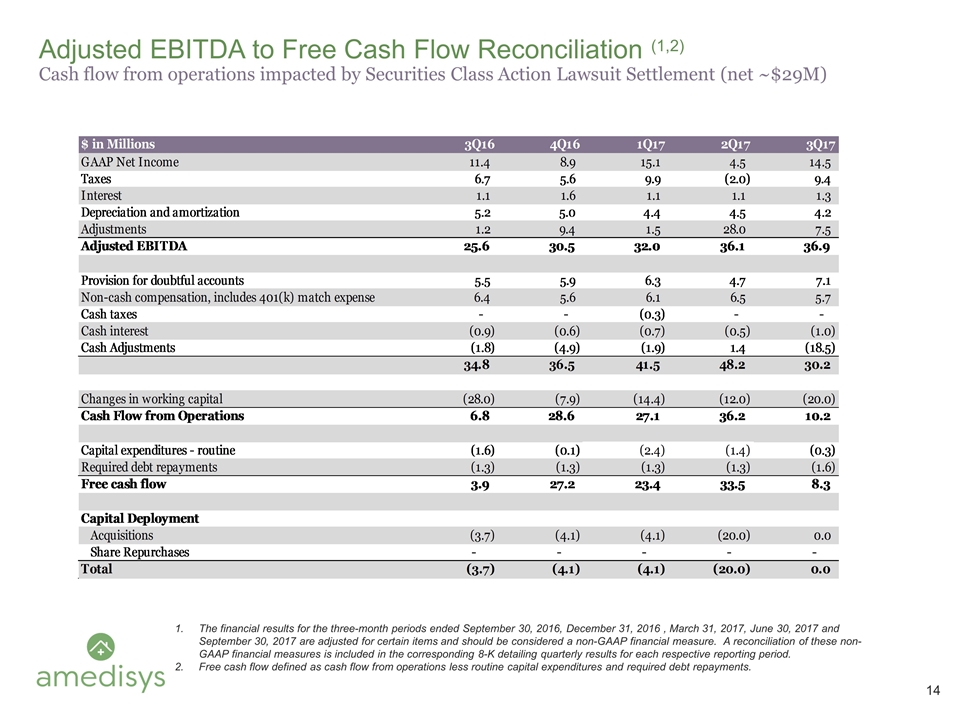
Adjusted EBITDA to Free Cash Flow Reconciliation (1,2) Cash flow from operations impacted by Securities Class Action Lawsuit Settlement (net ~$29M) The financial results for the three-month periods ended September 30, 2016, December 31, 2016 , March 31, 2017, June 30, 2017 and September 30, 2017 are adjusted for certain items and should be considered a non-GAAP financial measure. A reconciliation of these non-GAAP financial measures is included in the corresponding 8-K detailing quarterly results for each respective reporting period. Free cash flow defined as cash flow from operations less routine capital expenditures and required debt repayments.
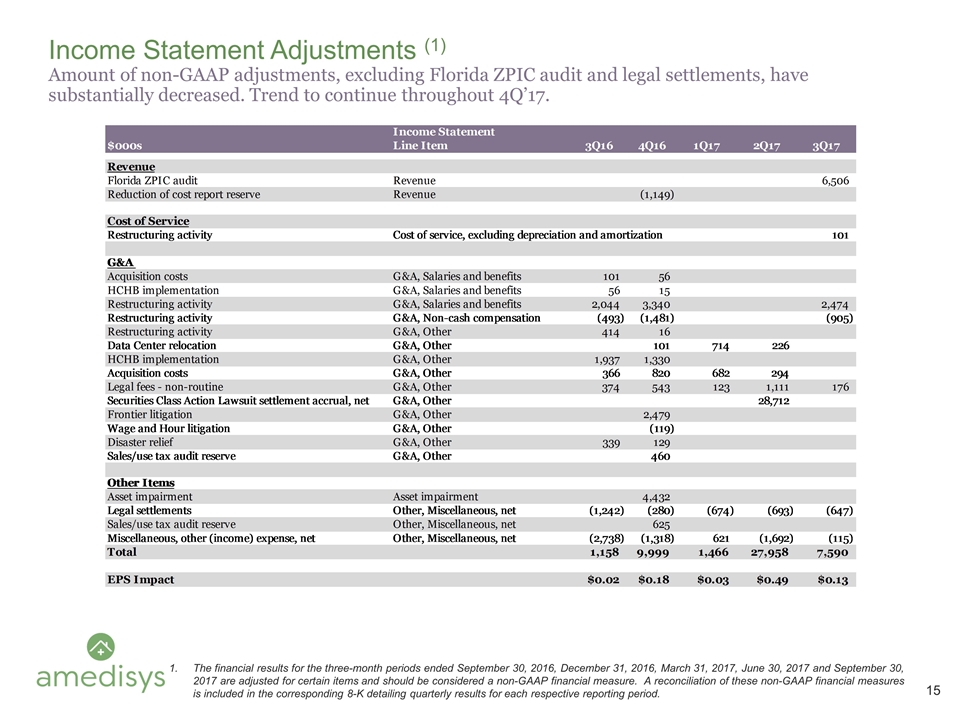
Income Statement Adjustments (1) Amount of non-GAAP adjustments, excluding Florida ZPIC audit and legal settlements, have substantially decreased. Trend to continue throughout 4Q’17. The financial results for the three-month periods ended September 30, 2016, December 31, 2016, March 31, 2017, June 30, 2017 and September 30, 2017 are adjusted for certain items and should be considered a non-GAAP financial measure. A reconciliation of these non-GAAP financial measures is included in the corresponding 8-K detailing quarterly results for each respective reporting period.


