
Amedisys Fourth Quarter and Year End 2019 Earnings Call Supplemental Slides February 19th, 2020 Exhibit 99.2

This presentation may include forward-looking statements as defined by the Private Securities Litigation Reform Act of 1995. These forward-looking statements are based upon current expectations and assumptions about our business that are subject to a variety of risks and uncertainties that could cause actual results to differ materially from those described in this presentation. You should not rely on forward-looking statements as a prediction of future events. Additional information regarding factors that could cause actual results to differ materially from those discussed in any forward-looking statements are described in reports and registration statements we file with the SEC, including our Annual Report on Form 10-K and subsequent Quarterly Reports on Form 10-Q and Current Reports on Form 8-K, copies of which are available on the Amedisys internet website http://www.amedisys.com or by contacting the Amedisys Investor Relations department at (225) 292-2031. We disclaim any obligation to update any forward-looking statements or any changes in events, conditions or circumstances upon which any forward-looking statement may be based except as required by law. www.amedisys.com NASDAQ: AMED We encourage everyone to visit the Investors Section of our website at www.amedisys.com, where we have posted additional important information such as press releases, profiles concerning our business and clinical operations and control processes, and SEC filings. Forward-looking statements
|
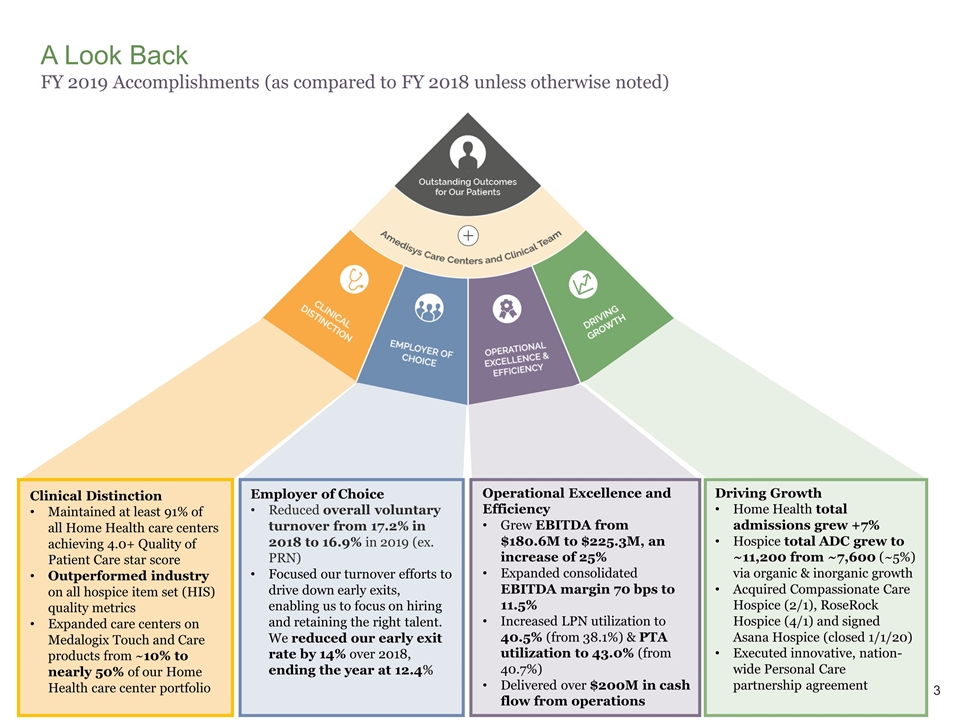 |
A Look Back FY 2019 Accomplishments (as compared to FY 2018 unless otherwise noted) Clinical Distinction Maintained at least 91% of all Home Health care centers achieving 4.0+ Quality of Patient Care star score Outperformed industry on all hospice item set (HIS) quality metrics Expanded care centers on Medalogix Touch and Care products from ~10% to nearly 50% of our Home Health care center portfolio Employer of Choice Reduced overall voluntary turnover from 17.2% in 2018 to 16.9% in 2019 (ex. PRN) Focused our turnover efforts to drive down early exits, enabling us to focus on hiring and retaining the right talent. We reduced our early exit rate by 14% over 2018, ending the year at 12.4% Operational Excellence and Efficiency Grew EBITDA from $180.6M to $225.3M, an increase of 25% Expanded consolidated EBITDA margin 70 bps to 11.5% Increased LPN utilization to 40.5% (from 38.1%) & PTA utilization to 43.0% (from 40.7%) Delivered over $200M in cash flow from operations Driving Growth Home Health total admissions grew +7% Hospice total ADC grew to ~11,200 from ~7,600 (~5%) via organic & inorganic growth Acquired Compassionate Care Hospice (2/1), RoseRock Hospice (4/1) and signed Asana Hospice (closed 1/1/20) Executed innovative, nation-wide Personal Care partnership agreement

Our Key Areas of Focus Strategic areas of focus and progress made during 4Q’19 Home Health*: Total same store admissions +4%. Total same store volume +4% Hospice: Admissions +1%, ADC +8% Personal Care: Billable hours / quarter -10% (including acquisitions) 1 Organic Growth Quality: Amedisys Apr’20 preview STARS score of 4.26 reflects CMS change in measurement (added Improvement in Mgmt. of Oral Meds) 48 Amedisys care centers rated at 5-Stars in the Apr’20 Preview (91% of care centers at 4+ Stars) Hospice quality – outperforming industry average in all hospice item set (HIS) categories 3 Clinical Initiatives Focusing on optimizing RN / LPN & PT / PTA staffing ratios. Current LPN Ratio: 42.3% (vs. 38.6% in 4Q’18) Current PTA Ratio: 44.4% (vs. 41.7% in 4Q’18) 4 Capacity and Productivity CCH integration remains on target ADC disruption felt during 3Q and 4Q Delivered total 2019 synergies of ~$6M. On track to achieve $10M in synergies in 2020 Tuck-in pipeline remains very active; however, valuations have been a challenge De novo update: 11 de novo’s started with 8 currently operating as of 4Q’19 5 M&A 2 Recruiting / Retention Targeting industry leading employee retention amongst all employee categories Current total voluntary turnover ~16.9% Focus on reduction of clinical turnover with heavy focus on clinicians and “early exits” *Note: Home Health same store volume is defined as admissions plus recertifications CMS finalized PDGM inclusive of a -4.36% Behavioral Assumption – Amedisys impact will be lower 2020 Hospice rate update for AMED (in effect 10/1) ~0.5% 6 Regulatory

Amedisys 2020 New Initiatives Our strategy remains the same (Clinical Excellence, Employer of Choice, Operational Excellence, Driving Growth); however, in 2020 we have several new initiatives that will be of focus Scale Personal Care Network CCH PDGM Clinical Excellence, Employer of Choice, Operational Excellence Growth Deliver $34M - $36M EBITDA Build infrastructure needed for care coordination Thrive under payment reform Consistent growth in all three lines of business Our foundational strategies

Highlights and Summary Financial Results (Adjusted): 4Q 2019(1) Home Health total same store volume +4%, total same store admissions +4%. Hospice same store admissions +1% Amedisys Consolidated Revenue Growth: +15% EBITDA: $52.2M (+19%) EBITDA Margin: 10.4% (+30 bps) EPS: $0.94 (+3%) 4Q’19 Net debt: $149.3M Net Leverage ratio: 0.7x CFFO: $75.2M Free cash flow (4): $72.4M DSO: 40.9 (vs. Q3’19 of 44.5) Balance Sheet & Cash Flow 4Q’19 Same Store (2)(3): Total Volume: +4% Total Admissions: +4% Other Statistics: Revenue per Episode: $2,916 (+0.9%) Total Cost per Visit: $94.26 (+2.1%) Medicare Recert Rate: 36.8% (-100 bps) Home Health Growth Metrics (5): Billable hours/quarter: -10% Clients served: -6% Personal Care Same Store Volume (3): Admissions: +1% ADC: +8% Other Statistics: Revenue per Day: $153.42 (+1.3%) Cost per day: $83.13 (+5.2%) Hospice 4Q’19 4Q’19 4Q’19 Adjusted Financial Results(1) 4Q’19 The financial results for the three-month periods and years ended December 31, 2018 and December 31, 2019 are adjusted for certain items and should be considered a non-GAAP financial measure. A reconciliation of these non-GAAP financial measures is included in the corresponding 8-K detailing quarterly results for each respective reporting period. Same Store volume – Includes admissions and recertifications. Effective July 1, 2019 same store is defined as care centers that we have operated for a least the last 12 months and startups that are an expansion of a same store care center. Free cash flow defined as cash flow from operations less routine capital expenditures and required debt repayments. Includes acquisitions.

Our revenue sources: 4Q’19 Medicare FFS: Paid episodically over a 60-day episode Private Episodic: MA and Commercial plans who pay us over a 60-day episode. Generally at rates ~90% – 100% of Medicare Per Visit: Managed care, Medicaid and private payors reimbursing us per visit performed Hospice Per Day Reimbursement: Routine Care: Patient at home with symptoms controlled – 99% of the Hospice care AMED provides, in line with overall hospice industry provision of care Continuous Care: Patient at home with uncontrolled symptoms Inpatient Care: Patient in facility with uncontrolled symptoms Respite Care: Patient at facility with symptoms controlled Home Health: 321 care centers; 34 states & DC Hospice: 138 care centers; 33 states Personal Care: 12 care centers; 3 states Total AMED: 471 care centers; 38 states and D.C.

Home Health and Hospice Segment (Adjusted) – 4Q 2019(1) Revenue per Episode up +0.9% Recert rate down 100 bps Y/Y CPV up +$1.90 (+2.1%, raises effective 8/1) EBITDA as a % percentage of revenue: +90 bps Visits per Episode down 0.7 to 17.0 Home Health Highlights Same store average daily census (ADC) up 8% Net revenue per day +1.3% ~$0.4M cap expense for 4Q (~2.1M YTD) CCH revenue contribution: $43.7M CCH segment EBITDA contribution $3.9M ($2.4M net of corporate) Hospice Highlights The financial results for the three-month periods and years ended December 31, 2018 and December 31, 2019 are adjusted for certain items and should be considered a non-GAAP financial measure. A reconciliation of these non-GAAP financial measures is included in the corresponding 8-K detailing quarterly results for each respective reporting period. Pre-Corporate EBITDA does not include any corporate G&A expenses. Same store information represents the percent change in volume or admissions for the period as a percent of the volume or admissions of the prior period Effective July 1, 2019, same store is defined as care centers that we have operated for a least the last 12 months and startups that are an expansion of a same store care center. Home health total volume growth (+4%); Hospice continues strong ADC growth (+8%)

General & Administrative Expenses – Adjusted (1,2) Notes: Year over year total G&A as a percentage of revenue increased 100 basis points Home Health segment G&A: 70 bps increase as % of revenue - 40 bps due to change in staffing model (reclass of Clinical Manager Assistant role from Cost of Revenue to G&A) and raises Hospice segment G&A: 190 bps increase as % of revenue – including $11.5M from acquisition of CCH Personal Care segment G&A: flat as % of revenue Corporate G&A: flat as a % of revenue – including $1.5M from acquisition of CCH Total G&A as a percentage of revenue increased 40 bps sequentially The financial results for the three-month periods ended December 31, 2018, March 31, 2019, June 30, 2019, September 30, 2019 and December 31, 2019 are adjusted for certain items and should be considered a non-GAAP financial measure. A reconciliation of these non-GAAP financial measures is included in the corresponding 8-K detailing quarterly results for each respective reporting period. Adjusted G&A expenses do not include depreciation and amortization. Added investments to Home Health and Hospice to support volume growth

Industry Leading Quality Scores Note: Top Competitor Avg weighted by CCN count and includes LHC, Kindred, AFAM, EHC and BKD Metric JUL 19 Release OCT 19 Release JAN 20 Release APR 20 PREVIEW Quality of Patient Care 4.27 4.28 4.27 4.26 Entities at 4+ Stars 85% 88% 86% 86% Metric APR 19 Release JUL 19 Release OCT 19 Release JAN 20 Release Patient Satisfaction Star 4.19 3.87 3.97 3.71 Performance Over Industry +8% +6% +6% +6% Quality of Patient Care (QPC) Patient Satisfaction (PS) Amedisys maintains a 4-Star average in the April 2020 HHC preview with 86% of our providers (representing 91% of care centers) at 4+ Stars and 52% of our providers (representing 60% of care centers) at 4.5+ Stars 29 Amedisys providers (representing 48 care centers) rated at 5-Stars in the April HHC 2020 preview In April 19 Preview for QPC, new measure introduced: Improvement in Management of Oral Meds

Hospice Quality: Amedisys Hospice Continues to Move Towards Best-in-Class Hospice Quality

Components 4Q’18 3Q’19 4Q’19 YoY Variance Detail Initiatives Salaries $62.79 $63.24 $64.18 $1.39 YoY increase due to planned wage increases partially offset by improvements in clinical utilization and optimization of discipline mix Staffing mix optimization, productivity and scheduling improvement initiatives in place to help overcome planned salary increases Contractors $3.38 $2.83 $2.72 ($0.66) YoY utilization improvement driving reduction in CPV Focused efforts on filling positions with full-time clinicians Benefits $11.60 $11.14 $12.45 $ 0.85 YoY increase in health and workers comp Focus on cost containment and spend optimization with specific focus on high cost claims Transportation & Supplies $6.50 $6.47 $6.47 ($0.03) *Visiting Clinician CPV $84.27 $83.68 $85.82 $1.55 Clinical Managers $8.09 $8.09 $8.44 $0.35 Fixed cost associated with non-visiting clinicians and planned wage increases Unit cost reduced as volume increases Total CPV $92.36 $91.77 $94.26 $1.90 Operational Excellence: Home Health Cost Per Visit (CPV) Total CPV impacted by planned wage increases *Note: Direct comparison with industry competitors CPV calculation $84.27 $83.68 $85.82

Driving Top Line Growth Continuing growth in all three lines of business Home Health Total Volume Hospice ADC Personal Care Total Hours / Quarter *Includes impact of East Tennessee (5/1/18) and Bring Care Home (10/1/18) acquisitions

Debt and Liquidity Metrics ~0.7x net leverage – revolver completely paid off during 2019 post Compassionate Care acquisition ex. Asana borrowing Net debt defined as total debt outstanding ($245.7M) less cash & restricted cash balance ($96.5M). Leverage ratio (net) is defined as net debt divided by last twelve months adjusted EBITDA ($225.3M). Liquidity defined as the sum of cash balance and available revolving line of credit.

Cash Flow Statement Highlights (1) Free cash flow defined as cash flow from operations less routine capital expenditures and required debt repayments.

Income Statement Adjustments (1) The financial results for the three-month periods ended December 31, 2018, March 31, 2019, June 30, 2019, September 30, 2019 and December 31, 2019 are adjusted for certain items and should be considered a non-GAAP financial measure. A reconciliation of these non-GAAP financial measures is included in the corresponding 8-K detailing quarterly results for each respective reporting period. Planned closures consist of in-patient units acquired from Compassionate Care Hospice whose operations ceased in April 2019.

2020 Guidance

Amedisys 2020 Preliminary Guidance 2019 Actual Performance 2020 Guidance Revenue Adjusted EBITDA $225.3M $1,962M Adjusted Earnings per Share $4.40 $250M - $260M $2,115M - $2,160M $4.90 - $5.13
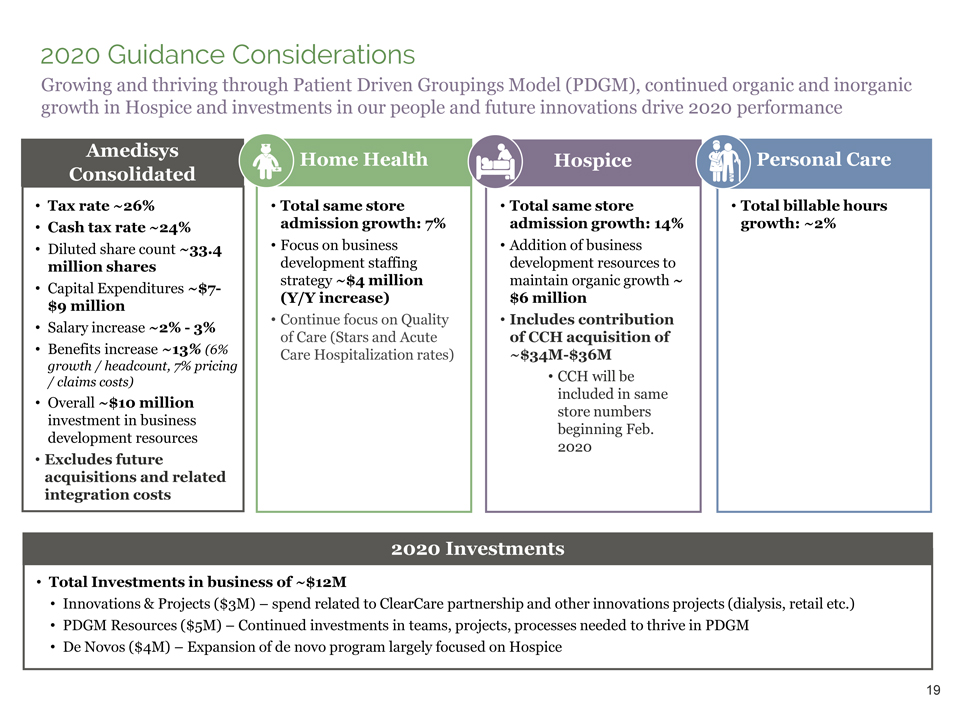
2020 Guidance Considerations Growing and thriving through Patient Driven Groupings Model (PDGM), continued organic and inorganic growth in Hospice and investments in our people and future innovations drive 2020 performance Amedisys Consolidated Home Health Hospice Personal Care Tax rate ~26% Cash tax rate ~24% Diluted share count ~33.4 million shares Capital Expenditures ~$7-$9 million Salary increase ~2% - 3% Benefits increase ~13% (6% growth / headcount, 7% pricing / claims costs) Overall ~$10 million investment in business development resources Excludes future acquisitions and related integration costs Total same store admission growth: 7% Focus on business development staffing strategy ~$4 million (Y/Y increase) Continue focus on Quality of Care (Stars and Acute Care Hospitalization rates) Total same store admission growth: 14% Addition of business development resources to maintain organic growth ~ $6 million Includes contribution of CCH acquisition of ~$34M-$36M CCH will be included in same store numbers beginning Feb. 2020 Total billable hours growth: ~2% 2020 Investments Total Investments in business of ~$12M Innovations & Projects ($3M) – spend related to ClearCare partnership and other innovations projects (dialysis, retail etc.) PDGM Resources ($5M) – Continued investments in teams, projects, processes needed to thrive in PDGM De Novos ($4M) – Expansion of de novo program largely focused on Hospice

Reimbursement Outlook Reimbursement Impact for Home Health and Hospice Home Health Hospice 2019 Final Rule (PDGM – Behavioral Assumpitons) (4.36%) Estimated AMED-Specific Impact (Claims from Jan – Sept 2019) (2.8%) 2020* Market Basket Update 3.0% Productivity / Other Adjustment (0.4) Estimated Industry Impact +2.6% Estimated AMED-Specific Impact +~0.5% Note: AMED impact differs from industry due to patient mix, referral mix and footprint *Hospice rate increase effective October 1, 2019 – majority of rate increase will be passed through to general inpatient & respite facilities resulting in a ~(0.5%) reduction in gross margin percentage

Impact of Health Insurance and Raises
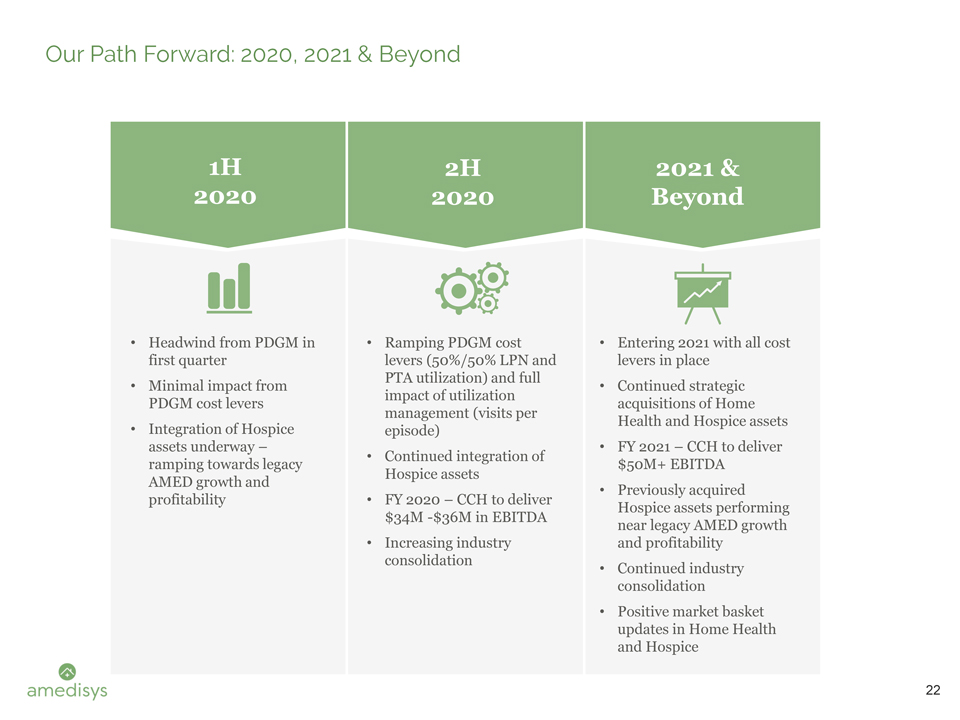
Our Path Forward: 2020, 2021 & Beyond Headwind from PDGM in first quarter Minimal impact from PDGM cost levers Integration of Hospice assets underway – ramping towards legacy AMED growth and profitability Ramping PDGM cost levers (50%/50% LPN and PTA utilization) and full impact of utilization management (visits per episode) Continued integration of Hospice assets FY 2020 – CCH to deliver $34M -$36M in EBITDA Increasing industry consolidation Entering 2021 with all cost levers in place Continued strategic acquisitions of Home Health and Hospice assets FY 2021 – CCH to deliver $50M+ EBITDA Previously acquired Hospice assets performing near legacy AMED growth and profitability Continued industry consolidation Positive market basket updates in Home Health and Hospice 22