 Project UNITY Discussion Materials Private and Confidential May 12, 2008 Exhibit 99.(c) |
 Section A – UNITY Financial Overview Section B – UNITY Valuation Data Table of Contents Private and Confidential |
 Section A – UNITY Financial Overview Private and Confidential |
 4 Private and Confidential Key Statistics Bloomberg, Factset, management financials as of 5/12/08. Data in millions, except volume and per share data. Current Capitalization Closing Price 5/12/08 $20.83 Market Capitalization $340.8 Enterprise Value $351.3 52-Week High $51.50 52-Week Low $18.18 Balance Sheet at 3/31/08 Basic Shares Outstanding 16.4 Fully Diluted shares Outstanding 16.5 Cash & Equivalents $17.6 Debt $28.0 Stockholders' Equity $49.7 Balance Sheet at Close (6/30/08) Basic Shares Outstanding 16.5 Fully Diluted shares Outstanding 16.9 Cash & Equivalents $25.2 Debt $25.0 Stockholders' Equity $61.7 Stock Price Analysis at 5/12/08 Absolute Price Average Daily Price VWAP Average Daily Trading Volume (thousands) 1-Day Prior $21.45 $21.14 $20.99 1,011.6 10-Days Prior $19.87 $19.95 $20.35 386.8 20-Days Prior $20.05 $19.79 $19.81 469.9 30-Days Prior $22.03 $20.24 $20.13 426.9 |
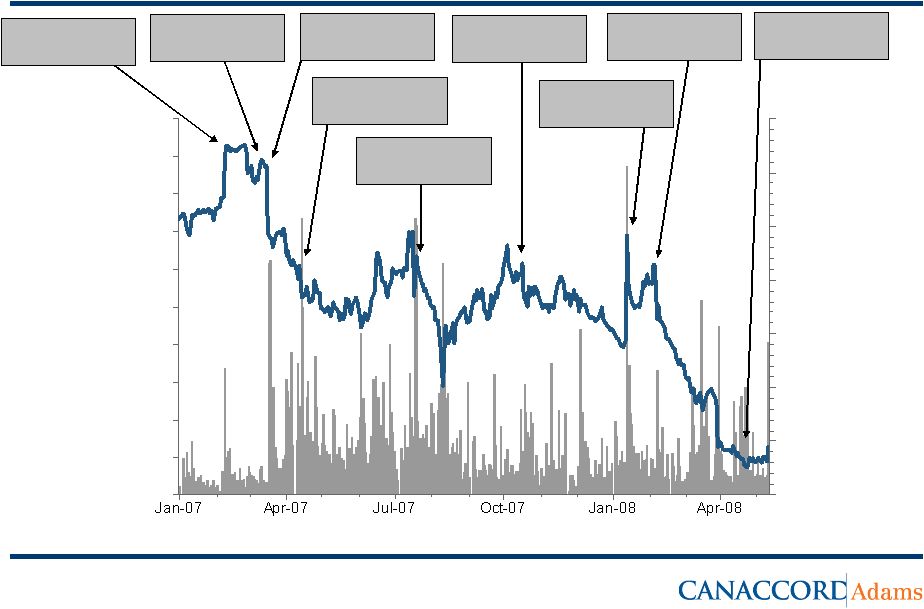 5 Private and Confidential $15.00 $20.00 $25.00 $30.00 $35.00 $40.00 $45.00 $50.00 $55.00 $60.00 $65.00 0 500 1,000 1,500 2,000 2,500 3,000 3,500 Price/Volume Chart: January 2007 – Present Source: Factset. Data as of 5/9/08. 3/15/07 – Barry Minkow publishes 500-page report alleging UNITY fraud 2/6/07 – UNITY announces record Q4:2006 results 3/17/07 – UNITY files defamation suit against Barry Minkow 4/17/07 – UNITY announces record Q1:2007 results 7/16/07 – UNITY announces record Q2:2007 results 10/16/07 – UNITY announces Q3:2007 results 2/5/08 – UNITY announces weak Q4:2007 and full year 2007 results 1/11/08 – SEC completes informal inquiry 4/21/08 – UNITY announces weak Q1:2008 results |
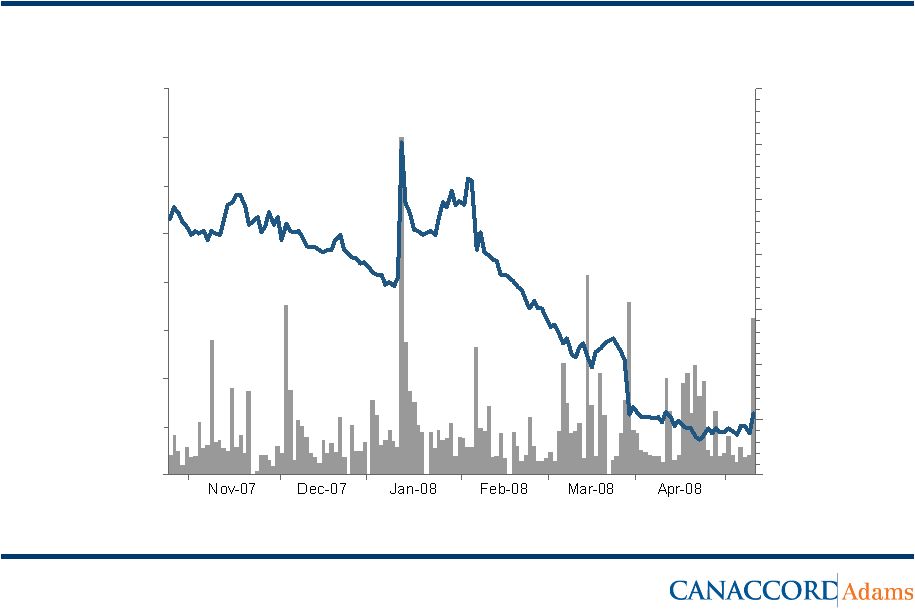 6 Private and Confidential Price/Volume Chart: 6 Month Source: Factset. Data as of 5/9/08. $15.00 $20.00 $25.00 $30.00 $35.00 $40.00 $45.00 $50.00 $55.00 0 500 1,000 1,500 2,000 2,500 3,000 3,500 |
 7 Private and Confidential Price/Volume Chart: 3-Year Source: Factset. Data as of 5/9/08. $15.00 $20.00 $25.00 $30.00 $35.00 $40.00 $45.00 $50.00 $55.00 $60.00 $65.00 0 500 1,000 1,500 2,000 2,500 3,000 3,500 |
 8 Private and Confidential LTM Short Interest/Price Chart Source: Factset, Nasdaq short interest data as of 5/9/08. 0 1 2 3 4 5 6 7 8 9 10 $0.00 $10.00 $20.00 $30.00 $40.00 $50.00 $60.00 Short Interest (MM) Stock Price |
 9 Private and Confidential May-07 Jun-07 Jul-07 Aug-07 Sep-07 Oct-07 Nov-07 Dec-07 Jan-08 Feb-08 Mar-08 Apr-08 40 50 60 70 80 90 100 110 120 130 UNITY NASDAQ Composite Index Direct Seller & Supplement Comp Group LTM Comparable Universe Indices vs UNITY (49.6%) (11.0%) (3.5%) Source: Factset. Data based on LTM as of 5/9/08. (1) The Direct Seller & Supplement Group is comprised of the companies listed on page 21 & 22. |
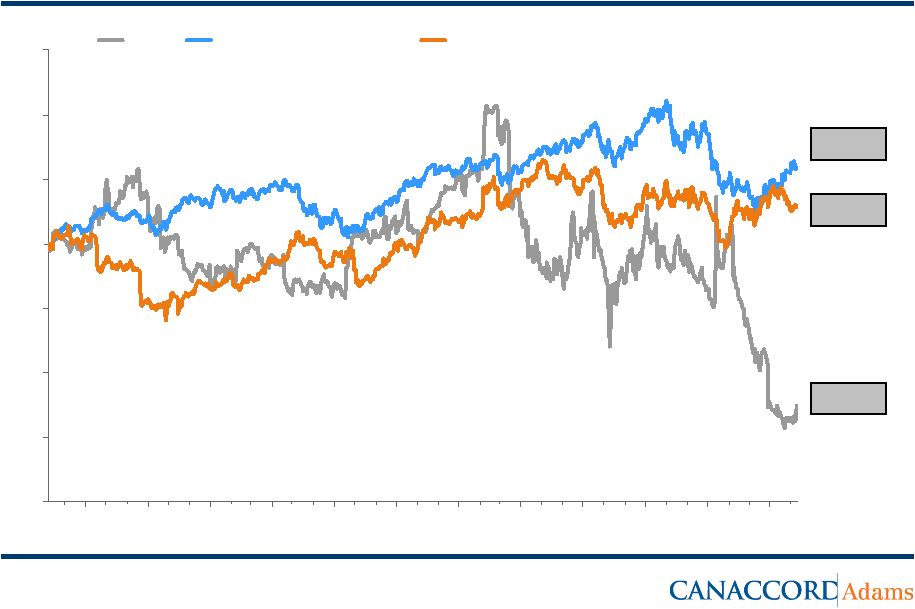 10 Private and Confidential Jul-05 Oct-05 Jan-06 Apr-06 Jul-06 Oct-06 Jan-07 Apr-07 Jul-07 Oct-07 Jan-08 Apr-08 20 40 60 80 100 120 140 160 UNITY NASDAQ Composite Index Direct Seller & Supplement Comp Group 3-Year Comparable Universe Indices (53.7%) 12.4% 26.2% Source: Factset. Data based on LTM as of 5/9/08. (1) The Direct Seller & Supplement Group is comprised of the companies listed on page 21 & 22. |
 11 Private and Confidential Summary of Analyst Estimates Source: Bloomberg consensus estimates. ($ in millions, except per share data) Analyst Recommendations Most Recent Price Target Date Previous Company Rating Price Target Period Changed Price Target FY08E FY09E FY08E FY09E FY08E FY09E Sidoti & Company Buy $39.00 12 Months 3/28/2008 $56.00 $428.3 $456.9 NA NA $1.99 $2.33 D.A. Davidson & Co. Buy $30.00 18 Months 3/28/2008 $49.00 $429.7 $459.7 $63.2 $70.8 $2.15 $2.50 Avondale Partners Market Perform $26.50 NA 3/28/2008 $50.00 $427.1 $482.5 $72.2 $81.7 $2.06 $2.33 Wedbush Morgan Buy $24.00 12 Months 4/22/2008 $30.00 $426.8 $454.2 $63.1 $69.7 $2.14 $2.40 Goldman Sachs Neutral $23.00 12 Months 3/28/2008 $42.00 NA NA NA NA NA NA Jefferies Hold $22.00 NA 3/28/2008 $52.00 $405.4 $409.7 $63.3 $68.1 $2.00 $2.20 Canaccord Adams Hold $21.00 NA 3/28/2008 $55.00 $429.8 $468.3 $61.9 $69.3 $2.07 $2.27 Consensus NA $26.50 NA NA NA $424.5 $455.2 $64.7 $71.9 $2.07 $2.34 Revenue EPS EBITDA |
 Section B – UNITY Valuation Data Private and Confidential |
 13 Private and Confidential Premiums Analysis – Comparable Transactions Source: Dealogic as of 4/25/08. Cash merger transactions with total transaction value between $200M - $800M and a stock price above $5 per share prior to offer Closing Price 5/12/08: $20.83 30 Day VWAP 5/12/08: $20.13 Premium Analysis ($ in millions except per share data) Closing Price 1-Day 1-Week 1-Month Premiums Paid Stripped Mean Percentages NA 12.2 % 14.8 % 17.7 % Premium at Offer Price Premium to Closing Price 24.8 % 21.2 % 33.0 % 20.9 % Premium to VWAP 24.5 % 23.8 % 26.4 % 29.2 % Tender Offer Price $26.00 |
 14 Private and Confidential Source: Dealogic as of 4/25/08. Ann. Transaction Purchase Price of Stock Premium to Prior Stock Price Date Target/Issuer Buyers/Investors Fin Sponsor Value Price Per Share 1 Day 1 Week 1 Month 1 Day 1 Week 1 Month 01/30/08 NuCo2 Inc Aurora Capital Group Aurora Capital Group $475.6 $30.00 $24.08 $24.98 $25.44 24.6% 20.1% 17.9% 01/15/08 Lifecore Biomedical Inc Warburg Pincus LLC Warburg Pincus $234.6 $17.00 $12.84 $13.37 $13.57 32.4% 27.2% 25.3% 08/02/07 Midwest Air Group Inc (Bid No 2) TPG Capital LP (Texas Pacific) TPG Capital LP (Texas Pacific) $402.6 $16.00 $13.93 $12.99 $15.25 14.9% 23.2% 4.9% 07/27/07 Deb Shops Inc Lee Equity Partners LLC Lee Equity Partners LLC $391.1 $27.25 $26.68 $29.03 $28.43 2.1% (6.1%) (4.2%) 06/18/07 Friendly Ice Cream Corp Freeze Operations Holding Corp Sun Capital Partners Group Inc $329.7 $15.50 $14.33 $13.68 $14.65 8.2% 13.3% 5.8% 06/11/07 James River Group Inc DE Shaw & Co LP Trident Capital; DE Shaw Private Equity $540.3 $34.50 $35.18 $33.82 $34.36 (1.9%) 2.0% 0.4% 06/04/07 Accredited Home Lenders Holdings Co Lone Star Fund V Lone Star Funds $296.8 $15.10 $13.76 $14.57 $11.84 9.7% 3.6% 27.5% 06/04/07 1-800 Contacts Inc Fenway Partners Inc Fenway Partners Inc $371.7 $24.25 $20.08 $19.21 $17.67 20.8% 26.2% 37.2% 04/26/07 Inter-Tel Inc Mitel Networks Corp Francisco Partners LP $697.0 $25.60 $23.96 $24.04 $23.90 6.8% 6.5% 7.1% 04/24/07 Symbion Inc Crestview Partners LLC Crestview Partners LLC $625.4 $22.35 $19.03 $19.71 $19.55 17.4% 13.4% 14.3% 04/05/07 World Air Holdings Inc Global Aero Logistics Inc MatlinPatterson Global Opportunities Partners LP $315.0 $12.50 $10.80 $10.78 $10.45 15.7% 16.0% 19.6% 03/20/07 Eschelon Telecom Inc Integra Telecom Inc Boston Ventures LP; Wind Point Partners; Nautic Partners LLC; Banc of America Equity Partners; $707.3 $30.00 $25.59 $25.16 $23.45 17.2% 19.2% 27.9% 03/06/07 Topps Co Inc (Bid No 1) Tornante Co LLC; Madison Dearborn Partners LLC Madison Dearborn Partners LLC $394.9 $9.75 $8.91 $9.03 $9.89 9.4% 8.0% (1.4%) 03/05/07 SafeNet Inc Vector Capital Vector Capital $689.7 $28.75 $28.30 $27.76 $25.31 1.6% 3.6% 13.6% 01/10/07 International Aluminum Corp GenStar Capital LLC Genstar Capital LP $226.8 $53.00 $49.99 $48.75 $46.86 6.0% 8.7% 13.1% 12/05/06 Direct General Corp Fremont Partners; Texas Pacific Group TPG Capital LP (Texas Pacific); Calera Capital $563.3 $21.25 $16.51 $15.87 $14.97 28.7% 33.9% 42.0% 11/14/06 Valley National Gases Inc Caxton-Iseman Capital Inc Caxton-Iseman Capital Inc $330.2 $27.00 $27.00 $26.85 $27.95 0.0% 0.6% (3.4%) Premiums Analysis – Comparable Transactions |
 15 Private and Confidential Source: Dealogic as of 4/25/08. Ann. Transaction Purchase Price of Stock Premium to Prior Stock Price Date Target/Issuer Buyers/Investors Fin Sponsor Value Price Per Share 1 Day 1 Week 1 Month 1 Day 1 Week 1 Month 09/25/06 Educate Inc Sterling Capital Partners LP; Citigroup Private Equity Apollo Advisors LP; Sterling Capital Partners LP; Citigroup Private Equity $504.3 $8.00 $7.06 $6.60 $6.67 13.3% 21.2% 19.9% 09/22/06 Talk America Holdings Inc Cavalier Telephone LLC Banc of America Equity Partners $247.8 $8.10 $6.57 $5.99 $5.80 23.3% 35.2% 39.7% 09/12/06 Metrologic Instruments Inc Francisco Partners LP; Elliott Associates LP Francisco Partners LP $427.0 $18.50 $16.36 $16.05 $13.80 13.1% 15.3% 34.1% 09/12/06 Peach Holdings, Inc DLJ Merchant Banking Partners; Orchard Acquisition Co Greenhill Capital Partners LLC; LLR Partners Inc; CSFB Private Equity $753.5 $7.20 $7.14 $7.01 $6.16 0.8% 2.7% 17.0% 08/18/06 Lone Star Steakhouse & Saloon Inc Lone Star Funds Lone Star Funds $655.7 $27.10 $23.55 $23.33 $24.01 15.1% 16.2% 12.9% 06/07/06 ACE Cash Express Inc JLL Partners Inc JLL Partners Inc $437.5 $30.00 $26.32 $26.61 $27.14 14.0% 12.7% 10.5% 04/27/06 NetIQ Corp AttachmateWRQ Thoma Cressey Bravo; Francisco Partners LP; Golden Gate Capital Corp $495.0 $12.20 $10.72 $11.28 $10.95 13.8% 8.2% 11.4% 04/21/06 Marsh Supermarkets Inc (Bid No 1) Sun Capital Partners Group Inc Sun Capital Partners Group Inc $325.0 $11.13 $11.16 $8.06 $8.00 (0.3%) 38.1% 39.1% 03/08/06 SourceCorp Inc Apollo Management LP Apollo Advisors LP $458.0 $25.00 $25.83 $25.84 $25.56 (3.2%) (3.3%) (2.2%) 02/24/06 Packaging Dynamics Corp Thilmany LLC Kohlberg & Co LLC $304.6 $14.00 $14.32 $13.43 $13.01 (2.2%) 4.2% 7.6% 02/06/06 Duratek Inc EnergySolutions Lindsay Goldberg $512.8 $22.00 $17.58 $17.71 $16.07 25.1% 24.2% 36.9% 01/09/06 Water Pik Technologies Inc Coast Acquisition Corp Carlyle Group Inc $380.0 $27.75 $21.62 $21.53 $21.25 28.4% 28.9% 30.6% 01/05/06 Datastream Systems Inc Infor Global Solutions Inc Golden Gate Capital Corp; Summit Partners LP; Parallax Capital Partners LLC $205.1 $10.26 $8.79 $8.25 $8.00 16.7% 24.4% 28.3% Mean: 12.4% 14.9% 17.8% Median: 13.6% 14.3% 15.7% Stripped Mean: 12.2% 14.8% 17.7% Premiums Analysis – Comparable Transactions |
 16 Private and Confidential Direct Seller & Supplement Peer Group Trading Statistics Source: Capital IQ, Factset, Bloomberg, SEC filings , Management projections as of 5/12/08. NA = Not applicable; NMF = Not Meaningful LTM as of 12/31/07 except where noted. AVP – LTM as of 3/31/08. BTH - LTM as of 1/31/08. HLF – LTM as of 3/31/08. NTY – LTM as of 3/31/08. NUS - LTM as of 3/31/08. NTRI - LTM as of 3/31/08. RELV - LTM as of 3/31/08. WNI – LTM as of 2/29/08. TUP - LTM as of 3/29/08. USNA - LTM as of 3/31/08. Blyth –Beat estimates, but underlying sales growth flat. Medifast – FQ3 below estimates; FQ4 met guidance but negative report. NBTY – Slightly missed FQ1; wide miss FQ2. Nutrisystem – Met estimates, but too early to call a turnaround. Mannatech – Lower y/y gross profit. Close 52 Week Range % Decrease from Market Ent. 05/09/08 High Low 52 Week High Cap. Value CY08E CY09E LTM CY08E CY09E LTM CY08E CY09E Direct Seller & Supplement Group $ $ $ % $M $M x x x x x x x x Avon Products Inc. $39.37 $42.51 $31.95 7.4% $16,802 $18,152 18.2x 15.4x 1.8x 1.7x 1.6x 12.6x 10.8x 9.6x Blyth, Inc. $17.87 $30.22 $15.45 40.9% $664 $629 12.6x 11.5x 0.5x 0.6x 0.5x 5.1x 4.9x 4.8x Ediets.com Inc. $3.70 $6.10 $2.85 39.3% $93 $93 NMF NMF 3.1x 1.2x 1.2x NMF NMF 37.0x Herbalife Ltd. $43.36 $51.09 $35.30 15.1% $2,790 $2,933 13.0x 11.1x 1.3x 1.2x 1.1x 7.8x 7.5x 6.7x Mannatech Inc. $6.42 $16.19 $4.75 60.3% $170 $123 NA NA 0.3x NA NA 5.1x NA NA Medifast Inc. $4.86 $9.37 $3.57 48.1% $67 $70 14.3x 11.4x 0.8x 0.8x 0.7x 7.6x 7.2x 6.0x Natural Alternatives International Inc. $7.76 $9.20 $5.64 15.7% $54 $53 NA NA 0.6x NA NA 11.9x NA NA NBTY Inc. $29.18 $53.42 $20.85 45.4% $1,950 $2,055 9.7x 9.1x 1.0x 1.0x 0.9x 6.1x 5.9x 5.7x Nu Skin Enterprises Inc. $16.84 $19.99 $13.85 15.8% $1,068 $1,181 14.0x 12.3x 1.0x 1.0x 0.9x 8.8x 7.4x 6.7x Nutraceutical International Corp. $12.80 $16.99 $10.67 24.7% $142 $166 NA NA 1.0x NA NA 5.9x NA NA NutriSystem Inc. $19.84 $74.09 $12.55 73.2% $627 $584 9.2x 8.7x 0.8x 0.8x 0.7x 4.4x 4.8x 4.3x Reliv International, Inc. $5.79 $11.60 $5.50 50.1% $92 $77 20.0x 18.7x 0.7x 0.7x 0.7x 11.2x 10.1x 10.0x Schiff Nutrition International Inc. $5.41 $7.69 $4.59 29.6% $63 $29 NA NA 0.2x NA NA 1.1x NA NA Tupperware Brands Corporation $38.84 $44.98 $23.60 13.7% $2,395 $2,953 14.7x 13.2x 1.4x 1.4x 1.3x 10.7x 9.7x 8.8x Mean: 34.2% $1,927 $2,078 14.0x 12.4x 1.0x 1.0x 1.0x 7.6x 7.6x 10.0x Median: 34.5% $398 $375 14.0x 11.5x 0.9x 1.0x 0.9x 7.6x 7.4x 6.7x Stripped Mean: 33.2% $843 $910 13.8x 12.0x 0.9x 1.0x 0.9x 7.7x 7.5x 7.3x Select Direct Seller & Supplement Group Mean: 44.7% $580 $577 9.2x 8.2x 0.6x 0.6x 0.6x 4.7x 4.6x 4.2x Median: 48.1% $627 $584 11.2x 10.3x 0.8x 0.8x 0.7x 5.1x 5.4x 5.3x Stripped Mean: 51.3% $487 $445 11.2x 10.3x 0.7x 0.8x 0.7x 5.4x 5.4x 5.3x UNITY (Current Price) $20.83 $51.50 $18.18 59.6% $341 $352 9.1x 7.6x 0.8x 0.8x 0.7x 5.0x 5.3x 4.4x UNITY (@ Tender Offer Price) $26.00 $51.50 $18.18 49.5% $412 $412 11.4x 9.4x 1.0x 0.9x 0.8x 6.1x 6.2x 5.2x P/E Multiple Ent. Val. / Revenue Ent. Val. / EBITDA |
 17 Private and Confidential Direct Seller & Supplement Peer Group Operating Statistics Source: Capital IQ, Factset, Bloomberg, SEC filings , Management projections as of 5/12/08. NA = Not applicable; NMF = Not Meaningful LTM as of 12/31/07 except where noted. AVP – LTM as of 3/31/08. BTH - LTM as of 1/31/08. HLF – LTM as of 3/31/08. NTY – LTM as of 3/31/08. NUS - LTM as of 3/31/08. NTRI - LTM as of 3/31/08. RELV - LTM as of 3/31/08. WNI – LTM as of 2/29/08. TUP - LTM as of 3/29/08. USNA - LTM as of 3/31/08. Blyth –Beat estimates, but underlying sales growth flat. Medifast – FQ3 below estimates; FQ4 met guidance but negative report. NBTY – Slightly missed FQ1; wide miss FQ2. Nutrisystem – Met estimates, but too early to call a turnaround. Mannatech – Lower y/y gross profit. Revenue EBITDA EPS Rev. Growth Rev. Growth LTM Gross LTM Gross EBITDA Gr EBITDA Debt to LTM CY08E CY09E LTM CY08E CY09E CY08E CY09E 06/07 08E/09E Profit Profit Margin 06/07 Margin Equity Direct Seller & Supplement Group $M $M $M $M $M $M $M $M % % $ % % % % Avon Products Inc. $10,255 $10,700 $11,417 $1,446 $1,678 $1,891 $2.16 $2.55 13.4% 6.7% $6,390 62.3% 12.1% 14.1% 315.2% Blyth, Inc. $1,165 $1,139 $1,155 $123 $127 $132 $1.42 $1.55 (4.6%) 1.4% $625 53.7% 19.7% 10.5% 53.1% Ediets.com Inc. $30 $80 $80 ($4) ($6) $3 ($0.36) ($0.02) (39.1%) 0.0% $23 75.7% NMF NMF 54.6% Herbalife Ltd. $2,242 $2,378 $2,578 $374 $390 $441 $3.33 $3.90 13.8% 8.4% $1,001 44.6% 15.7% 16.7% 183.1% Mannatech Inc. $413 NA NA $24 NA NA NA NA 0.6% NA $164 39.7% (50.6%) 5.9% 0.4% Medifast Inc. $84 $90 $101 $9 $10 $12 $0.34 $0.43 13.1% 12.3% $62 74.4% (4.3%) 10.9% 19.8% Natural Alternatives International Inc. $94 NA NA $4 NA NA NA NA (12.3%) NA $20 20.9% (47.3%) 4.7% 12.2% NBTY Inc. $2,043 $2,082 $2,173 $337 $350 $359 $3.01 $3.20 4.6% 4.3% $1,061 51.9% 24.3% 16.5% 19.4% Nu Skin Enterprises Inc. $1,182 $1,215 $1,284 $134 $160 $177 $1.20 $1.36 3.8% 5.6% $969 82.0% 6.8% 11.3% 77.3% Nutraceutical International Corp. $164 NA NA $28 NA NA NA NA 8.2% NA $89 54.3% (1.4%) 17.2% 25.4% NutriSystem Inc. $755 $719 $817 $133 $121 $135 $2.16 $2.28 37.3% 13.6% $396 52.4% 24.5% 17.6% 0.0% Reliv International, Inc. $104 $109 $113 $7 $8 $8 $0.29 $0.31 (5.5%) 3.7% $86 82.9% (37.0%) 6.6% 0.0% Schiff Nutrition International Inc. $170 NA NA $25 NA NA NA NA (6.1%) NA $72 42.7% 9.6% 14.7% 0.2% Tupperware Brands Corporation $2,068 $2,120 $2,280 $277 $304 $335 $2.65 $2.95 13.6% 7.5% $1,339 64.7% 22.2% 13.4% 123.3% Mean: $1,483 $2,063 $2,200 $208 $314 $349 $1.62 $1.85 2.9% 6.4% $878 57.3% (0.4%) 12.3% 63.1% Median: $584 $1,177 $1,219 $75 $144 $156 $1.79 $1.91 4.2% 6.1% $280 54.0% 9.6% 13.4% 22.6% Stripped Mean: $874 $1,232 $1,312 $123 $184 $200 $1.65 $1.83 3.6% 6.2% $491 58.2% 1.9% 12.5% 47.4% Mean: $892 $1,008 $1,061 $125 $152 $159 $1.73 $1.86 10.2% 7.9% $462 54.4% 2.7% 12.3% 18.6% Median: $755 $929 $986 $123 $124 $133 $1.79 $1.91 4.6% 8.3% $396 52.4% 19.7% 10.9% 19.4% Stripped Mean: $778 $929 $986 $93 $124 $133 $1.79 $1.91 6.1% 8.3% $395 52.7% 13.2% 12.7% 13.2% UNITY $424 $442 $496 $70 $66 $80 $2.29 $2.76 15.9% 12.2% $335 79.1% 9.8% 16.6% 56.3% Select Direct Seller & Supplement Group |