OMB APPROVAL
OMB Number: 3235-0570
Expires: January 31, 2014
Estimated average burden
hours per response: 20.6
UNITED STATES
SECURITIES AND EXCHANGE COMMISSION
Washington, D.C. 20549
FORM N-CSR
CERTIFIED SHAREHOLDER REPORT OF REGISTERED MANAGEMENT
INVESTMENT COMPANIES
Investment Company Act file number 811-07452
AIM Variable Insurance Funds (Invesco Variable Insurance Funds)
(Exact name of registrant as specified in charter)
11 Greenway Plaza, Suite 2500 Houston, Texas 77046
(Address of principal executive offices) (Zip code)
Philip A. Taylor 11 Greenway Plaza, Suite 2500 Houston, Texas 77046
(Name and address of agent for service)
Registrant’s telephone number, including area code: (713) 626-1919
Date of fiscal year end: 12/31
Date of reporting period: 12/31/11
Item 1. Reports to Stockholders.
Invesco V.I. Balanced-Risk Allocation FundAnnual Report to Shareholders § December 31, 2011The Fund provides a complete list of its holdings four times in each fiscal year, at the quarter-ends. For the second and fourth quarters, the lists appear in the Fund’s semiannual and annual reports to shareholders. For the first and third quarters, the Fund files the lists with the Securities and Exchange Commission (SEC) on Form N-Q. The Fund’s Form N-Q filings are available on the SEC website, sec.gov. Copies of the Fund’s Forms N-Q may be reviewed and copied at the SEC Public Reference Room in Washington, D.C. You can obtain information on the operation of the Public Reference Room, including information about duplicating fee charges, by calling 202 551 8090 or 800 732 0330, or by electronic request at the following email address: publicinfo@sec.gov. The SEC file numbers for the Fund are 811-07452 and 033-57340. The Fund’s most recent portfolio holdings, as filed on Form N-Q, have also been made available to insurance companies issuing variable annuity contracts and variable life insurance policies (“variable products”) that invest in the Fund.
A description of the policies and procedures that the Fund uses to determine how to vote proxies relating to portfolio securities is available without charge, upon request, from our Client Services department at 800 959 4246 or at invesco.com/proxyguidelines. The information is also available on the SEC website, sec.gov.
Information regarding how the Fund voted proxies related to its portfolio securities during the 12 months ended June 30, 2011, is available at invesco.com/proxysearch. The information is also available on the SEC website, sec.gov.
Invesco Advisers, Inc. is an investment adviser; it provides investment advisory services to individual and institutional clients and does not sell securities. Invesco Distributors, Inc. is the U.S. distributor for Invesco Ltd.’s retail mutual funds, exchange-traded funds and institutional money market funds. Both are wholly owned, indirect subsidiaries of Invesco Ltd.
This report must be accompanied or preceded by a currently effective Fund prospectus and variable product prospectus, which contain more complete information, including sales charges and expenses. Investors should read each carefully before investing.
Invesco Distributors, Inc.
VIIBRA-AR-1
| | | | | |
| |
| NOT FDIC INSURED | | MAY LOSE VALUE | | NO BANK GUARANTEE |
Management’s Discussion of Fund Performance
Performance summary
For the year ended December 31, 2011, Invesco V.I. Balanced-Risk Allocation Fund significantly outperformed the Custom V.I. Balanced-Risk Allocation Index, the Fund’s custom style-specific benchmark. Strong fixed income markets, as measured by the Barclays Capital U.S. Aggregate Index, contributed most to this outperformance over the reporting period. Global equity and commodity markets, as measured by the MSCI World Index and S&P GSCI Index, respectively, detracted from performance. Most of the Fund’s outperformance occurred in the second and third quarters of 2011, when stocks and commodities generally declined.
Your Fund’s long-term performance appears later in this report.
Fund vs. Indexes
Total returns, 12/31/10 to 12/31/11, excluding variable product issuer charges.
If variable product issuer charges were included, returns would be lower.
| | | | | |
|
| Series I Shares | | | 10.92 | % |
| |
| Series II Shares | | | 10.61 | |
| |
MSCI World Index▼(Broad Market Index) | | | -5.54 | |
| |
Custom V.I. Balanced-Risk Allocation Index§ (Style-Specific Index) | | | 0.83 | |
| |
Source(s): ▼Lipper Inc.; § Invesco, Lipper Inc.
How we invest
The Fund’s investment process, under normal conditions, is implemented with derivatives and other financially linked instruments whose performance is expected to correspond to U.S. and international fixed income, equity and commodity markets. The Fund’s investments in certain derivatives may create significant leveraged exposure to certain equity, fixed income and commodity markets. Leverage occurs when the investments in derivatives create greater economic exposure than the amount invested. The Fund may invest in derivatives and other financially linked instruments such as futures and swap agreements (including total return swaps). The Fund also may invest in U.S. and foreign government debt securities and other securities such as exchange-traded funds and commodity-linked notes. The Fund will seek to gain exposure to the commodity markets primarily through investments in Invesco Cayman Commodity Fund IV Ltd. (the “Subsidiary”), a wholly-owned subsidiary of the Fund organized under the laws of the Cayman Islands.
Our philosophy is based on the idea that understanding, managing and allocating risk is fundamental to a properly
Risk Allocation
By asset class
| | | | | | | | | |
| | | | | | | % of Net | |
| | | Risk | | | Assets as of | |
| Asset Class | | Allocation | | | 12/31/11* | |
| |
| Equity | | | 33.77 | % | | | 32.91 | % |
| |
| Fixed Income | | | 33.77 | | | | 112.82 | |
| |
| Commodities | | | 32.46 | | | | 28.28 | |
| |
| * | | Due to the use of leverage, the percentages may not equal 100%. |
constructed portfolio. The Fund uses a risk premium capture strategy that seeks to generate returns by investing in equity, bond and commodity markets using a risk-balanced investment process. Our primary goal is to build a portfolio that may perform well in diverse economic environments – recessionary, non-inflationary growth and inflationary growth – while balancing the amount of risk contributed by its exposure to equity, fixed income and commodity markets. We use a disciplined, three-step investment process that seeks to build a portfolio that may perform well in any economic environment while attempting to limit the impact that poor performance from any single asset has on overall Fund performance.
We begin the process by selecting representative assets for each asset class (equities, fixed income and commodities) from a universe of more than 50 assets. We consider three criteria when selecting assets:
| n | | Low correlation among the assets – We estimate long-term correlation among assets to build a Fund that is fully diversified. |
| |
| n | | Theoretical basis for excess return – We analyze each asset’s expected excess return over cash (its risk premium). |
| |
| n | | Liquidity, transparency and flexibility – The strategy is implemented using exchange-traded futures and other derivative or financially linked instruments. This ensures ample capacity and allows for daily liquidity while providing pure asset-class exposure. |
Next, we seek to construct the portfolio so that an approximately equal amount of risk comes from the equity, fixed income and commodity allocations. This balanced-risk allocation drives the weight of each asset class. We believe this approach may help mitigate large losses in capital and improve the portfolio’s risk/reward profile, which is commonly referred to as the Sharpe ratio. We re-estimate the risk contributed by each asset and re-optimize the portfolio monthly, or when new assets are added to the portfolio. Typically, the majority of the leverage in the Fund stems from the fixed income exposure, since it is the asset class that requires upsizing due to its generally lower risk profile.
Finally, on a monthly basis, we actively adjust portfolio positions to reflect the near-term environment while remaining consistent with the optimized portfolio structure. The positions are weighted to reflect the volatility of each asset (e.g., bonds tend to have larger active positions than equities). This step is crucial because various asset classes respond differently to different economic environments. Active positioning better aligns the portfolio with the prevailing economic climate.
Market conditions and your Fund
Entering 2011, the equity gains from late 2010 continued, due in part to accommodative monetary policies by major central banks. Government bond yields, which plunged substantially in March, resumed their upward trend in April. The broad-based upward trend in commodities also remained intact. With the exception of Australia, all of the government fixed income investments in the Fund had a negative contribution during this time. The Fund’s equity exposures were generally positive, with particularly strong results by U.S. large- and small-cap positions. Within the Fund, commodities posted mixed results, with crude oil and precious metals faring well, while copper and agricultural commodities declined. Tactical shifts in the first part of 2011 had minimal effect on Fund performance.
Volatility returned to global equity and commodities markets during the summer months of 2011. The causes of this volatility included performance of the peripheral European economies and the end of another round of quantitative easing. Bonds benefited during this time as yields declined in response to global economic uncertainty. The Fund’s diversified,
Invesco V.I. Balanced-Risk Allocation Fund
strategic exposure to government bonds was the largest contributor to returns. Tactical overweight exposure in government bond markets and gold, along with underweight exposure to soymeal, also proved beneficial.
Volatility of risky assets continued into the third quarter of 2011 as global equities and most commodities experienced meaningful weakness during this time. Bonds and gold had strong returns in the third quarter as investors sought shelter from the volatility. The Fund’s strategic allocation to bonds was instrumental in defending the portfolio against the weakness experienced in equities and commodities during this challenging period. In addition, a tactical overweight position in bonds and underweight position in equities drove results.
During the final months of the reporting period, all three asset classes contributed positively to Fund performance. With the exception of Japan, global equities were up sharply in the fourth quarter. Global government bonds also performed well as yields fell. The higher yielding markets of Australia and Great Britain led results for this group. Commodities, while mixed, were the largest contributor to results at the end of the reporting period. Crude oil enjoyed very strong results, trailed by copper, which also posted a good showing. Gold was off as strong gains from earlier in the year were consolidated, and soymeal was slightly negative. Active positioning was a net detractor at the end of the period as negative results from equities and commodities outweighed the positive contribution from fixed income.
Please note that our strategy is principally implemented using derivative instruments, including futures and total return swaps. Derivatives can be a more liquid and cost effective way to gain exposure to asset classes. Additionally, the leverage used in our strategy is inherent in these instruments.
Thank you for your continued commitment to Invesco V.I. Balanced-Risk Allocation Fund.
The views and opinions expressed in management’s discussion of Fund performance are those of Invesco Advisers, Inc. These views and opinions are subject to change at any time based on factors such as market and economic conditions. These views and opinions may not be relied upon as investment advice or recommendations, or as an offer for a particular security. The information is not a complete analysis of every aspect of any market, country, industry, security or the Fund. Statements of fact are from sources considered reliable, but Invesco Advisers, Inc. makes no representation or warranty as to their completeness or accuracy. Although historical performance is no guarantee of future results, these insights may help you understand our investment management philosophy.
See important Fund and, if applicable, index disclosures later in this report.
Mark Ahnrud
Chartered Financial Analyst, portfolio manager, is manager of Invesco V.I. Balanced-Risk Allocation Fund. Mr. Ahnrud joined Invesco in 2000. He began his investment career in 1985. Mr. Ahnrud earned a B.S. in finance and investments from Babson College and an M.B.A. from the Fuqua School of Business at Duke University.
Chris Devine
Chartered Financial Analyst, portfolio manager, is manager of Invesco V.I. Balanced-Risk Allocation Fund. Mr. Devine joined Invesco in 1998. He began his investment career in 1996. Mr. Devine earned a B.A. in economics from Wake Forest University and an M.B.A. from the University of Georgia.
Scott Hixon
Chartered Financial Analyst, portfolio manager, is manager of Invesco V.I. Balanced-Risk Allocation Fund. Mr. Hixon joined Invesco in 1994. He began his investment career in 1992. Mr. Hixon earned a B.B.A. in finance from Georgia Southern University and an M.B.A. in finance from Georgia State University.
Christian Ulrich
Chartered Financial Analyst, portfolio manager, is manager of Invesco V.I. Balanced-Risk Allocation Fund. Mr. Ulrich joined Invesco in 2000. He began his investment career in 1987. Mr. Ulrich graduated from the KV Zurich Business School in Zurich, Switzerland.
Scott Wolle
Chartered Financial Analyst, portfolio manager, is manager of Invesco V.I. Balanced-Risk Allocation Fund. Mr. Wolle joined Invesco in 1999. He began his investment career in 1991. Mr. Wolle earned a B.S. in finance from Virginia Polytechnic Institute and State University and an M.B.A. from the Fuqua School of Business at Duke University.
Assisted by the Global Asset Allocation Team
Invesco V.I. Balanced-Risk Allocation Fund
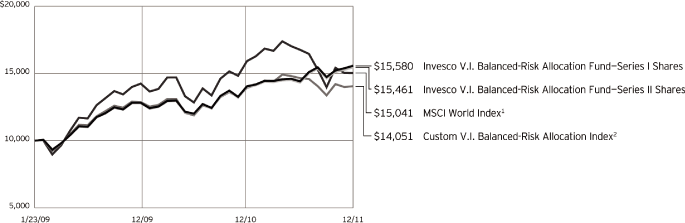
Your Fund’s Long-Term Performance
Results of a $10,000 Investment
Fund data from 1/23/09; index data from 1/31/09
| | |
| 1 | | Source: Lipper Inc. |
| |
| 2 | | Sources: Invesco, Lipper Inc. |
Past performance cannot guarantee comparable future results.
Average Annual Total Returns
As of 12/31/11
| | | | | | | | | |
|
| Series I Shares | | | | |
| |
| Inception (1/23/09) | | | 16.30 | % |
| |
| 1 Year | | | 10.92 | |
| |
| Series II Shares | | | | |
| |
| Inception | | (1/23/09) | | | 15.99 | % |
| |
| 1 Year | | | 10.61 | |
The returns shown above include the returns of Invesco Van Kampen V.I. Global Tactical Asset Allocation Fund (the first predecessor fund) for the period June 1, 2010, to May 2, 2011, the date the first predecessor fund was reorganized into the Fund, and the returns of Van Kampen Life Investment Trust Global Tactical Asset Allocation Portfolio (the second predecessor fund) for the period prior to June 1, 2010, the date the second predecessor fund was reorganized into the first predecessor fund. The second predecessor fund was advised by Van Kampen Asset Management. Returns shown above for Series I and Series II shares are blended returns of the predecessor funds and Invesco V.I. Balanced-Risk Allocation Fund. Share class returns will differ from the predecessor funds because of different expenses.
The performance data quoted represent past performance and cannot guarantee comparable future results;
current performance may be lower or higher. Please contact your variable product issuer or financial adviser for the most recent month-end variable product performance. Performance figures reflect Fund expenses, reinvested distributions and changes in net asset value. Investment return and principal value will fluctuate so that you may have a gain or loss when you sell shares.
The net annual Fund operating expense ratio set forth in the most recent Fund prospectus as of the date of this report for Series I and Series II shares was 0.74% and 0.99%, respectively.1,2 The total annual Fund operating expense ratio set forth in the most recent Fund prospectus as of the date of this report for Series I and Series II shares was 1.38% and 1.63%, respectively.2 The expense ratios presented above may vary from the expense ratios presented in other sections of this report that are based on expenses incurred during the period covered by this report.
Invesco V.I. Balanced-Risk Allocation Fund, a series portfolio of AIM Variable Insurance Funds (Invesco Variable Insurance Funds), is currently offered through insurance companies issuing variable products. You cannot purchase shares of the Fund directly. Performance figures given represent the Fund and are not intended to reflect
actual variable product values. They do not reflect sales charges, expenses and fees assessed in connection with a variable product. Sales charges, expenses and fees, which are determined by the variable product issuers, will vary and will lower the total return.
The most recent month-end performance data at the Fund level, excluding variable product charges, is available at 800 451 4246. As mentioned above, for the most recent month-end performance including variable product charges, please contact your variable product issuer or financial adviser.
Had the adviser not waived fees and/or reimbursed expenses, performance would have been lower.
| 1 | | Total annual Fund operating expenses after any contractual fee waivers and/or expense reimbursements by the adviser in effect through at least June 30, 2013. See current prospectus for more information. |
| |
| 2 | | The expense ratio includes acquired fund fees and expenses of the underlying funds in which the Fund invests of 0.04% for Invesco V.I. Balanced-Risk Allocation Fund. |
Invesco V.I. Balanced-Risk Allocation Fund
Invesco V.I. Balanced-Risk Allocation Fund’s investment objective is total return with a low to moderate correlation to traditional financial market indexes.
| n | | Unless otherwise stated, information presented in this report is as of December 31, 2011, and is based on total net assets. |
| |
| n | | Unless otherwise noted, all data provided by Invesco. |
| |
| n | | To access your Fund’s reports/prospectus, visit invesco.com/fundreports. |
Principal risks of investing in the Fund
Commodity-linked notes risk. The Fund’s investments in commodity-linked notes may involve substantial risks, including risk of loss of a significant portion of their principal value. In addition to risks associated with the underlying commodities, they may be subject to additional special risks, such as the lack of a secondary trading market and temporary price distortions due to speculators and/or the continuous rolling over of futures contracts underlying the notes. Commodity-linked notes are also subject to counterparty risk, which is the risk that the other party to the contract will not fulfill its contractual obligation to complete the transaction with the Fund.
Commodity risk. The Fund’s and the Subsidiary’s investment exposure to the commodities markets and/or a particular sector of the commodities markets, may subject the Fund and the Subsidiary to greater volatility than investments in traditional securities, such as stocks and bonds. The commodities markets may fluctuate widely based on a variety of factors, including changes in overall market movements, domestic and foreign political and economic events and policies, war, acts of terrorism, changes in domestic or foreign interest rates and/or investor expectations concerning interest rates, domestic and foreign inflation rates and investment and trading activities of mutual funds, hedge funds and commodities funds. Prices of various commodities may also be affected by factors such as drought, floods, weather, livestock disease, embargoes, tariffs and other regulatory developments. The prices of commodities can also fluctuate widely due to supply and demand disruptions in major producing or consuming regions. Because the Fund’s and the Subsidiary’s performance is linked to the performance of potentially volatile commodities, investors should be willing to assume the risks of potentially significant fluctuations in the value of the Fund’s shares.
Counterparty risk. Individually negotiated or over-the-counter derivatives are also subject to counterparty risk, which is the risk that the other party to the contract (such as a futures contract or swap agreement) will not fulfill its contractual
obligations, which may cause losses or additional costs to the Fund.
Credit risk. The issuer of instruments in which the Fund invests may be unable to meet interest and/or principal payments, thereby causing its instruments to decrease in value and lowering the issuer’s credit rating.
Currency/exchange rate risk. The dollar value of the Fund’s foreign investments will be affected by changes in the exchange rates between the dollar and the currencies in which those investments are traded.
Derivatives risk. Derivatives may be more difficult to purchase, sell or value than other investments and may be subject to market, interest rate, credit, leverage, counterparty and management risks. A fund investing in a derivative could lose more than the cash amount invested or incur higher taxes. Over-the-counter derivatives are also subject to counterparty risk, which is the risk that the other party to the contract will not fulfill its contractual obligation to complete the transaction with the Fund.
Developing markets securities risk. Securities issued by foreign companies and governments located in developing countries may be affected more negatively by inflation, devaluation of their currencies, higher transaction costs, delays in settlement, adverse political developments, the introduction of capital controls, withholding taxes, nationalization of private assets, expropriation, social unrest, war or lack of timely information than those in developed countries.
Exchange-traded funds risk. An investment by the Fund in ETFs generally presents the same primary risks as an investment in a mutual fund. In addition, an ETF may be subject to the following: (1) a discount of the ETF’s shares to its net asset value; (2) failure to develop an active trading market for the ETF’s shares; (3) the listing exchange halting trading of the ETF’s shares; (4) failure of the ETF’s shares to track the referenced index; and (5) holding troubled securities in the referenced index. ETFs may involve duplication of management fees and certain other expenses, as the Fund indirectly bears its proportionate share of any expenses paid by the ETFs in which it invests. Further, certain of the ETFs in which the Fund may
invest are leveraged. The more the Fund invests in such leveraged ETFs, the more this leverage will magnify any losses on those investments.
Exchange-traded notes (ETNs) risk. ETNs are subject to credit risk, including the credit risk of the issuer, and the value of the ETN may drop due to a downgrade in the issuer’s credit rating, despite the underlying market benchmark or strategy remaining unchanged. The value of an ETN may also be influenced by time to maturity, level of supply and demand for the ETN, volatility and lack of liquidity in underlying assets, changes in the applicable interest rates, changes in the issuer’s credit rating, and economic, legal, political, or geographic events that affect the referenced underlying asset.
Foreign securities risk. The Fund’s foreign investments may be affected by changes in a foreign country’s exchange rates; political and social instability; changes in economic or taxation policies; difficulties when enforcing obligations; decreased liquidity; and increased volatility. Foreign companies may be subject to less regulation resulting in less publicly available information about the companies.
Interest rate risk. Interest rate risk refers to the risk that bond prices generally fall as interest rates rise; conversely, bond prices generally rise as interest rates fall. Specific bonds differ in their sensitivity to changes in interest rates depending on their individual characteristics, including duration.
Leverage risk. Leverage exists when the Fund purchases or sells an instrument or enters into a transaction without investing cash in an amount equal to the full economic exposure of the instrument or transaction and the Fund could lose more than it invested. Leverage created from borrowing or certain types of transactions or instruments, including derivatives, may impair the Fund’s liquidity, cause it to liquidate positions at an unfavorable time, increase volatility or otherwise not achieve its intended objective.
Liquidity risk. The Fund may hold illiquid securities that it is unable to sell at the preferred time or price and could lose its entire investment in such securities.
Management risk. The investment techniques and risk analysis used by the
Invesco V.I. Balanced-Risk Allocation Fund
Fund’s portfolio managers may not produce the desired results.
Market risk. The prices of and the income generated by the Fund’s securities may decline in response to, among other things, investor sentiment; general economic and market conditions; regional or global instability; and currency and interest rate fluctuations.
Non-diversification risk. The Fund is non-diversified and can invest a greater portion of its assets in a single issuer. A change in the value of the issuer could affect the value of the Fund more than if it was a diversified fund.
Subsidiary risk. By investing in the Subsidiary, the Fund is indirectly exposed to risks associated with the Subsidiary’s investments, including derivatives and commodities. Because the Subsidiary is not registered under the Investment Company Act of 1940, the Fund, as the sole investor in the Subsidiary, will not have the protections offered to investors in U.S. registered investment companies. Changes in the laws of the United States and/or the Cayman Islands, under which the Fund and the Subsidiary, respectively, are organized, could result in the inability of the Fund and/or the Subsidiary to operate as described in this prospectus and could negatively affect the Fund and its shareholders.
Tax risk. As a regulated investment company, the Fund must derive at least 90% of its gross income for each taxable year from sources treated as qualifying income under the Internal Revenue Code of 1986, as amended. The Fund intends to treat the income it derives from commodity-linked notes and the Subsidiary as qualifying income based on the reasoning contained in private letter rulings provided to other Invesco Funds (which the Fund may not cite as precedent). If, however, the Internal Revenue Service were to change its position with respect to the conclusions reached in these private letter rulings, the income and gains from the Fund’s investment in the commodity-linked notes and/or the Subsidiary might be non-qualifying income, and there is a possibility such change in position might be applied to the Fund retroactively, in which case the Fund might not qualify as a regulated investment company for one or more years. In this event, the Fund’s Board may authorize a significant change in investment strategy or Fund liquidation. For more information, please see the “Dividends, Distributions and Tax Matters” section in the Fund’s SAI.
U.S. government obligations risk. The Fund may invest in obligations issued by U.S. Government agencies and instrumentalities that may receive varying levels of support from the government, which could affect the Fund’s ability to recover should they default.
About indexes used in this report
The MSCI World IndexSM is an unmanaged index considered representative of stocks of developed countries.
The Barclays Capital U.S. Aggregate Index is an unmanaged index considered representative of the U.S. investment-grade, fixed-rate bond market.
The Custom V.I. Balanced-Risk Allocation Index, created by Invesco to serve as a benchmark for Invesco V.I. Balanced-Risk Allocation Fund, is composed of the following indexes: (60%) MSCI World Index, (40%) Barclays Capital U.S. Aggregate Index.
The S&P GSCI Index is an unmanaged world production-weighted index composed of the principal physical commodities that are the subject of active, liquid futures markets.
The Fund is not managed to track the performance of any particular index, including the indexes defined here, and consequently, the performance of the Fund may deviate significantly from the performance of the indexes.
A direct investment cannot be made in an index. Unless otherwise indicated, index results include reinvested dividends, and they do not reflect sales charges. Performance of the peer group, if applicable, reflects fund expenses; performance of a market index does not.
Other information
The Chartered Financial Analyst® (CFA®) designation is globally recognized and attests to a charterholder’s success in a rigorous and comprehensive study program in the field of investment management and research analysis.
The returns shown in management’s discussion of Fund performance are based on net asset values calculated for shareholder transactions. Generally accepted accounting principles require adjustments to be made to the net assets of the Fund at period end for financial reporting purposes, and as such, the net asset values for shareholder transactions and the returns based on those net asset values may differ from the net asset values and returns reported in the Financial Highlights. Additionally, the returns and net asset values shown throughout this report are at the Fund level only and do not include variable product issuer charges. If such charges were included, the total returns would be lower.
Invesco V.I. Balanced-Risk Allocation Fund
Consolidated Schedule of Investments
December 31, 2011
| | | | | | | | | |
| | | Principal
| | |
| | | Amount | | Value |
| |
U.S. Treasury Bills–5.34%
|
0.12%, 01/26/12(a) | | $ | 11,000,000 | | | $ | 10,999,965 | |
| |
0.00%, 02/09/12(a) | | | 3,000,000 | | | | 2,999,969 | |
| |
| Total U.S. Treasury Securities (Cost $13,999,071) | | | | | | | 13,999,934 | |
| |
| | | | | | | | | |
| | | Shares | | |
Exchange Traded Fund–4.21%
|
Investment Companies–Exchange Traded Funds–4.21%
| | | | |
PowerShares DB Gold Fund (Cost $11,487,233)(b) | | | 203,100 | | | | 11,058,795 | |
| |
| | | | | | | | | |
| | | Shares | | Value |
| |
Money Market Funds–79.86%(c)
|
| Invesco V.I. Money Market Fund | | | 177,645,824 | | | $ | 177,645,824 | |
| |
| Liquid Assets Portfolio–Institutional Class | | | 5,940,412 | | | | 5,940,412 | |
| |
| Premier Portfolio–Institutional Class | | | 5,940,412 | | | | 5,940,412 | |
| |
| STIC (Global Series) PLC–U.S. Dollar Liquidity Portfolio–Institutional Class | | | 20,009,982 | | | | 20,009,982 | |
| |
| Total Money Market Funds (Cost $209,536,630) | | | | | | | 209,536,630 | |
| |
| TOTAL INVESTMENTS–89.41% (Cost $235,022,934) | | | | | | | 234,595,359 | |
| |
| OTHER ASSETS LESS LIABILITIES–10.59% | | | | | | | 27,774,109 | |
| |
| NET ASSETS–100.00% | | | | | | $ | 262,369,468 | |
| |
Notes to Schedule of Investments:
| | |
| (a) | | Security traded on a discount basis. The interest rate shown represents the discount rate at the time of purchase by the Fund. |
| (b) | | Not an affiliate of the Fund or its investment adviser. |
| (c) | | The money market fund and the Fund are affiliated by having the same investment adviser. |
| | | | | | | | | | | | | | | | | | | |
| Open Futures Contracts and Swap Agreements at Period-End(a) |
| | | | | | | | | | | Unrealized
|
| | | | | Number of
| | Expiration
| | Notional
| | Appreciation
|
| Long Futures Contracts | | | | Contracts | | Month | | Value | | (Depreciation) |
| |
| 100 Ounce Gold | | | | | 131 | | | | February-2012 | | | $ | 20,525,080 | | | $ | (1,836,273 | ) |
| |
| Australian 10 Year Bonds | | | | | 398 | | | | March-2012 | | | | 48,399,091 | | | | 502,477 | |
| |
| Canada 10 Year Bonds | | | | | 321 | | | | March-2012 | | | | 42,169,847 | | | | 438,601 | |
| |
| Dow Jones Eurostoxx 50 | | | | | 493 | | | | March-2012 | | | | 14,727,115 | | | | 452,725 | |
| |
E-Mini S&P 500 Index | | | | | 296 | | | | March-2012 | | | | 18,538,480 | | | | 94,391 | |
| |
| Euro Bond Future | | | | | 179 | | | | March-2012 | | | | 32,212,745 | | | | 1,063,264 | |
| |
| FTSE 100 Index | | | | | 183 | | | | March-2012 | | | | 15,737,309 | | | | 364,225 | |
| |
| Hang Seng Index | | | | | 80 | | | | January-2012 | | | | 9,505,318 | | | | 78,410 | |
| |
| Japan 10 Year Bonds | | | | | 23 | | | | March-2012 | | | | 42,571,224 | | | | 225,518 | |
| |
| LME Copper | | | | | 91 | | | | March-2012 | | | | 17,292,275 | | | | 613,050 | |
| |
| Long Gilt | | | | | 231 | | | | March-2012 | | | | 41,965,800 | | | | 751,822 | |
| |
| Russell 2000 Index Mini | | | | | 188 | | | | March-2012 | | | | 13,889,440 | | | | (22,727 | ) |
| |
| Topix Tokyo Price Index | | | | | 152 | | | | March-2012 | | | | 14,382,116 | | | | (260,878 | ) |
| |
| U.S. Treasury 20 Year Bonds | | | | | 246 | | | | March-2012 | | | | 35,623,875 | | | | 436,298 | |
| |
| WTI Crude | | | | | 201 | | | | June-2012 | | | | 19,995,480 | | | | 45,441 | |
| |
| Total Futures Contracts | | | | | | | | | | | | $ | 387,535,195 | | | $ | 2,946,344 | |
| |
| | | | | | | | | | | | | | | | | | | |
| | | | | | | | | | | | | | | | | | | |
| Long Swap Agreements | | Counterparty | | | | | | | | |
| |
| Canada 10 Year Bonds | | Goldman Sachs | | | 216 | | | | March-2012 | | | $ | 27,717,788 | | | $ | 292,589 | |
| |
| Japan 10 Year Bonds | | Merrill Lynch | | | 6 | | | | March-2012 | | | | 10,935,541 | | | | 46,057 | |
| |
| Long Gilt Swap | | Goldman Sachs | | | 86 | | | | March-2012 | | | | 15,466,398 | | | | 255,254 | |
| |
Soybean Meal(b) | | Barclays Capital | | | 19,600 | | | | May-2012 | | | | 9,236,825 | | | | 864,640 | |
| |
| Total Swap Agreements | | | | | | | | | | | | $ | 63,356,552 | | | $ | 1,458,540 | |
| |
| Total | | | | | | | | | | | | | | | | $ | 4,404,884 | |
| |
| |
| (a) | Futures collateralized by $25,045,000 cash held with Goldman Sachs, the futures commission merchant. |
| (b) | Receive a return equal to Barclays Capital Soybean Meal S2 Nearby Excess Return Index and pay the product of (i) 0.30% of the Notional Amount multiplied by (ii) days in the period divided by 365. |
See accompanying Notes to Consolidated Financial Statements which are an integral part of the financial statements.
Invesco V.I. Balanced-Risk Allocation Fund
Consolidated Statement of Assets and Liabilities
December 31, 2011
| | | | | |
Assets:
|
| Investments, at value (Cost $25,486,304) | | $ | 25,058,729 | |
| |
| Investments in affiliated money market funds, at value and cost | | | 209,536,630 | |
| |
| Total investments, at value (Cost $235,022,934) | | | 234,595,359 | |
| |
| Foreign currencies, at value (Cost $110,021) | | | 111,907 | |
| |
| Receivable for: | | | | |
| Deposits with brokers for open futures contracts | | | 25,045,000 | |
| |
| Variation margin | | | 1,531,584 | |
| |
| Fund shares sold | | | 74,328 | |
| |
| Dividends | | | 10,868 | |
| |
| Unrealized appreciation on swap agreements | | | 1,458,540 | |
| |
| Premiums paid on swap agreements | | | 87 | |
| |
| Investment for trustee deferred compensation and retirement plans | | | 11,695 | |
| |
| Total assets | | | 262,839,368 | |
| |
Liabilities:
|
| Payable for: | | | | |
| Fund shares reacquired | | | 43,906 | |
| |
| Dividends | | | 2,851 | |
| |
| Accrued fees to affiliates | | | 369,559 | |
| |
| Accrued other operating expenses | | | 37,173 | |
| |
| Trustee deferred compensation and retirement plans | | | 16,411 | |
| |
| Total liabilities | | | 469,900 | |
| |
| Net assets applicable to shares outstanding | | $ | 262,369,468 | |
| |
Net assets consist of:
|
| Shares of beneficial interest | | $ | 245,936,818 | |
| |
| Undistributed net investment income | | | 8,294,288 | |
| |
| Undistributed net realized gain | | | 4,159,380 | |
| |
| Unrealized appreciation | | | 3,978,982 | |
| |
| | | $ | 262,369,468 | |
| |
Net Assets:
|
| Series I | | $ | 4,471,664 | |
| |
| Series II | | $ | 257,897,804 | |
| |
Shares outstanding, $0.001 par value per share, with an unlimited number of shares authorized:
|
| Series I | | | 387,876 | |
| |
| Series II | | | 22,453,752 | |
| |
| Series I: | | | | |
| Net asset value per share | | $ | 11.53 | |
| |
| Series II: | | | | |
| Net asset value per share | | $ | 11.49 | |
| |
Consolidated Statement of Operations
For the year ended December 31, 2011
| | | | | |
Investment income:
|
| Dividends (net of foreign withholding taxes of $39,767) | | $ | 453,985 | |
| |
| Dividends from affiliated money market funds | | | 57,976 | |
| |
| Interest | | | 21,399 | |
| |
| Total investment income | | | 533,360 | |
| |
Expenses:
|
| Advisory fees | | | 1,261,677 | |
| |
| Administrative services fees | | | 394,133 | |
| |
| Custodian fees | | | 2,002 | |
| |
| Distribution fees — Series II | | | 339,937 | |
| |
| Trustees’ and officers’ fees and benefits | | | 20,707 | |
| |
| Other | | | (2,173 | ) |
| |
| Total expenses | | | 2,016,283 | |
| |
| Less: Fees waived | | | (703,730 | ) |
| |
| Net expenses | | | 1,312,553 | |
| |
| Net investment income (loss) | | | (779,193 | ) |
| |
Realized and unrealized gain (loss) from:
|
| Net realized gain (loss) from: | | | | |
| Investment securities | | | 9,113,262 | |
| |
| Foreign currencies | | | (246,343 | ) |
| |
| Futures contracts | | | 5,616,363 | |
| |
| Swap agreements | | | 2,521,712 | |
| |
| | | | 17,004,994 | |
| |
| Change in net unrealized appreciation (depreciation) of: | | | | |
| Investment securities | | | (7,266,015 | ) |
| |
| Foreign currency contracts | | | 31,734 | |
| |
| Futures contracts | | | 2,812,103 | |
| |
| Swap agreements | | | 1,311,978 | |
| |
| | | | (3,110,200 | ) |
| |
| Net realized and unrealized gain | | | 13,894,794 | |
| |
| Net increase in net assets resulting from operations | | $ | 13,115,601 | |
| |
See accompanying Notes to Consolidated Financial Statements which are an integral part of the financial statements.
Invesco V.I. Balanced-Risk Allocation Fund
Consolidated Statement of Changes in Net Assets
For the years ended December 31, 2011 and 2010
| | | | | | | | | |
| | | 2011 | | 2010 |
| |
Operations:
|
| Net investment income (loss) | | $ | (779,193 | ) | | $ | 468,578 | |
| |
| Net realized gain | | | 17,004,994 | | | | 5,198,426 | |
| |
| Change in net unrealized appreciation (depreciation) | | | (3,110,200 | ) | | | 127,094 | |
| |
| Net increase in net assets resulting from operations | | | 13,115,601 | | | | 5,794,098 | |
| |
Distributions to shareholders from net investment income:
|
| Series I | | | (136 | ) | | | (196 | ) |
| |
| Series II | | | (301,687 | ) | | | (185,515 | ) |
| |
| Total distributions from net investment income | | | (301,823 | ) | | | (185,711 | ) |
| |
Distributions to shareholders from net realized gains:
|
| Series I | | | (3,582 | ) | | | (1,436 | ) |
| |
| Series II | | | (14,743,368 | ) | | | (1,359,183 | ) |
| |
| Total distributions from net realized gains | | | (14,746,950 | ) | | | (1,360,619 | ) |
| |
Share transactions–net:
|
| Series I | | | 4,242,158 | | | | (107,942 | ) |
| |
| Series II | | | 185,367,819 | | | | (39,141,623 | ) |
| |
| Net increase (decrease) in net assets resulting from share transactions | | | 189,609,977 | | | | (39,249,565 | ) |
| |
| Net increase (decrease) in net assets | | | 187,676,805 | | | | (35,001,797 | ) |
| |
Net assets:
|
| Beginning of year | | | 74,692,663 | | | | 109,694,460 | |
| |
| End of year (includes undistributed net investment income (loss) of $8,294,288 and $(66,801), respectively) | | $ | 262,369,468 | | | $ | 74,692,663 | |
| |
Notes to Consolidated Financial Statements
December 31, 2011
NOTE 1—Significant Accounting Policies
Invesco V.I. Balanced-Risk Allocation Fund (the “Fund”) is a series portfolio of AIM Variable Insurance Funds (Invesco Variable Insurance Funds) (the “Trust”). The Trust is a Delaware statutory trust registered under the Investment Company Act of 1940, as amended (the “1940 Act”), as an open-end series management investment company consisting of twenty-eight separate portfolios, (each constituting a “Fund”). The assets, liabilities and operations of each portfolio are accounted for separately. Information presented in these consolidated financial statements pertains only to the Fund. Matters affecting each Fund or class will be voted on exclusively by the shareholders of such Fund or class. Current Securities and Exchange Commission (“SEC”) guidance, however, requires participating insurance companies offering separate accounts to vote shares proportionally in accordance with the instructions of the contract owners whose investments are funded by shares of each Fund or class.
The Fund will seek to gain exposure to the commodity markets primarily through investments in the Invesco Cayman Commodity Fund IV Ltd. (the “Subsidiary”), a wholly-owned subsidiary of the Fund organized under the laws of the Cayman Islands. The Subsidiary was organized by the Fund to invest in commodity-linked derivatives. The Fund may invest up to 25% of its total assets in the Subsidiary.
Prior to May 2, 2011, the Fund operated as Invesco Van Kampen V.I. Global Tactical Asset Allocation Fund (the“Acquired Fund”), an investment portfolio of the Trust. The Acquired Fund was reorganized May 2, 2011 (the “Reorganization Date”) through the transfer of all of its assets and liabilities to the Fund (the “Reorganization”). Upon closing of the Reorganization, holders of the Acquired Fund’s Series I and Series II shares received Series I and Series II shares, respectively of the Fund. Information for the Acquired Fund’s Series I and Series II shares prior to the Reorganization are included with Series I and Series II shares, respectively, of the Fund throughout this report.
The Fund’s investment objective is to provide total return with a low to moderate correlation to traditional financial market indices.
The Fund currently offers two classes of shares, Series I and Series II, both of which are offered to insurance company separate accounts funding variable annuity contracts and variable life insurance policies (“variable products”).
Invesco V.I. Balanced-Risk Allocation Fund
The following is a summary of the significant accounting policies followed by the Fund in the preparation of its consolidated financial statements.
| | |
| A. | | Security Valuations — Securities, including restricted securities, are valued according to the following policy. |
| | Debt obligations (including convertible bonds) and unlisted equities are fair valued using an evaluated quote provided by an independent pricing service. Evaluated quotes provided by the pricing service may be determined without exclusive reliance on quoted prices, and may reflect appropriate factors such as institution-size trading in similar groups of securities, developments related to specific securities, dividend rate, yield, quality, type of issue, coupon rate, maturity, individual trading characteristics and other market data. Debt securities are subject to interest rate and credit risks. In addition, all debt securities involve some risk of default with respect to interest and/or principal payments. |
| | A security listed or traded on an exchange (except convertible bonds) is valued at its last sales price or official closing price as of the close of the customary trading session on the exchange where the security is principally traded, or lacking any sales or official closing price on a particular day, the security may be valued at the closing bid price on that day. Securities traded in the over-the-counter market are valued based on prices furnished by independent pricing services or market makers. When such securities are valued by an independent pricing service they may be considered fair valued. Futures contracts are valued at the final settlement price set by an exchange on which they are principally traded. Listed options are valued at the mean between the last bid and ask prices from the exchange on which they are principally traded. Options not listed on an exchange are valued by an independent source at the mean between the last bid and ask prices. For purposes of determining net asset value per share, futures and option contracts generally are valued 15 minutes after the close of the customary trading session of the New York Stock Exchange (“NYSE”). |
| | Investments in open-end and closed-end registered investment companies that do not trade on an exchange are valued at the end of day net asset value per share. Investments in open-end and closed-end registered investment companies that trade on an exchange are valued at the last sales price or official closing price as of the close of the customary trading session on the exchange where the security is principally traded. |
| | Swap agreements are fair valued using an evaluated quote provided by an independent pricing service. Evaluated quotes provided by the pricing service are valued based on a model which may include end of day net present values, spreads, ratings, industry, and company performance. |
| | Foreign securities (including foreign exchange contracts) are converted into U.S. dollar amounts using the applicable exchange rates as of the close of the NYSE. If market quotations are available and reliable for foreign exchange traded equity securities, the securities will be valued at the market quotations. Because trading hours for certain foreign securities end before the close of the NYSE, closing market quotations may become unreliable. If between the time trading ends on a particular security and the close of the customary trading session on the NYSE, events occur that are significant and make the closing price unreliable, the Fund may fair value the security. If the event is likely to have affected the closing price of the security, the security will be valued at fair value in good faith using procedures approved by the Board of Trustees. Adjustments to closing prices to reflect fair value may also be based on a screening process of an independent pricing service to indicate the degree of certainty, based on historical data, that the closing price in the principal market where a foreign security trade is not the current value as of the close of the NYSE. Foreign securities meeting the approved degree of certainty that the price is not reflective of current value will be priced at the indication of fair value from the independent pricing service. Multiple factors may be considered by the independent pricing service in determining adjustments to reflect fair value and may include information relating to sector indices, American Depositary Receipts and domestic and foreign index futures. Foreign securities may have additional risks including exchange rate changes, potential for sharply devalued currencies and high inflation, political and economic upheaval, the relative lack of issuer information, relatively low market liquidity and the potential lack of strict financial and accounting controls and standards. |
| | Securities for which market prices are not provided by any of the above methods may be valued based upon quotes furnished by independent sources. The last bid price may be used to value equity securities. The mean between the last bid and asked prices is used to value debt obligations, including Corporate Loans. |
| | Securities for which market quotations are not readily available or are unreliable are valued at fair value as determined in good faith by or under the supervision of the Trust’s officers following procedures approved by the Board of Trustees. Issuer specific events, market trends, bid/ask quotes of brokers and information providers and other market data may be reviewed in the course of making a good faith determination of a security’s fair value. |
| | Valuations change in response to many factors including the historical and prospective earnings of the issuer, the value of the issuer’s assets, general economic conditions, interest rates, investor perceptions and market liquidity. Because of the inherent uncertainties of valuation, the values reflected in the consolidated financial statements may materially differ from the value received upon actual sale of those investments. |
| B. | | Securities Transactions and Investment Income — Securities transactions are accounted for on a trade date basis. Realized gains or losses on sales are computed on the basis of specific identification of the securities sold. Interest income is recorded on the accrual basis from settlement date. Dividend income (net of withholding tax, if any) is recorded on the ex-dividend date. Bond premiums and discounts are amortized and/or accreted for financial reporting purposes. |
| | The Fund may periodically participate in litigation related to Fund investments. As such, the Fund may receive proceeds from litigation settlements. Any proceeds received are included in the Consolidated Statement of Operations as realized gain (loss) for investments no longer held and as unrealized gain (loss) for investments still held. |
| | Brokerage commissions and mark ups are considered transaction costs and are recorded as an increase to the cost basis of securities purchased and/or a reduction of proceeds on a sale of securities. Such transaction costs are included in the determination of net realized and unrealized gain (loss) from investment securities reported in the Consolidated Statement of Operations and the Consolidated Statement of Changes in Net Assets and the net realized and unrealized gains (losses) on securities per share in the Consolidated Financial Highlights. Transaction costs are included in the calculation of the Fund’s net asset value and, accordingly, they reduce the Fund’s total returns. These transaction costs are not considered operating expenses and are not reflected in net investment income reported in the Consolidated Statement of Operations and Consolidated Statement of Changes in Net Assets, or the net investment income per share and ratios of expenses and net investment income reported in the Consolidated Financial Highlights, nor are they limited by any expense limitation arrangements between the Fund and the investment adviser. |
| | The Fund allocates income and realized and unrealized capital gains and losses to a class based on the relative net assets of each class. |
Invesco V.I. Balanced-Risk Allocation Fund
| | |
| C. | | Country Determination — For the purposes of making investment selection decisions and presentation in the Consolidated Schedule of Investments, the investment adviser may determine the country in which an issuer is located and/or credit risk exposure based on various factors. These factors include the laws of the country under which the issuer is organized, where the issuer maintains a principal office, the country in which the issuer derives 50% or more of its total revenues and the country that has the primary market for the issuer’s securities, as well as other criteria. Among the other criteria that may be evaluated for making this determination are the country in which the issuer maintains 50% or more of its assets, the type of security, financial guarantees and enhancements, the nature of the collateral and the sponsor organization. Country of issuer and/or credit risk exposure has been determined to be the United States of America, unless otherwise noted. |
| D. | | Distributions — Distributions from income and net realized capital gain, if any, are generally paid to separate accounts of participating insurance companies annually and recorded on ex-dividend date. |
| E. | | Federal Income Taxes — The Fund intends to comply with the requirements of Subchapter M of the Internal Revenue Code necessary to qualify as a regulated investment company and to distribute substantially all of the Fund’s taxable earnings to shareholders. As such, the Fund will not be subject to federal income taxes on otherwise taxable income (including net realized capital gain) that is distributed to shareholders. Therefore, no provision for federal income taxes is recorded in the consolidated financial statements. |
| | The Subsidiary is classified as a controlled foreign corporation under Subchapter N of the Internal Revenue Code. Therefore, the Fund is required to increase its taxable income by its share of the Subsidiary’s income. Net investment losses of the Subsidiary cannot be deducted by the Fund in the current period nor carried forward to offset taxable income in future periods. |
| | The Fund files tax returns in the U.S. Federal jurisdiction and certain other jurisdictions. Generally the Fund is subject to examinations by such taxing authorities for up to three years after the filing of the return for the tax period. |
| F. | | Expenses — Fees provided for under the Rule 12b-1 plan of a particular class of the Fund and which are directly attributable to that class are charged to the operations of such class. All other expenses are allocated among the classes based on relative net assets. |
| G. | | Accounting Estimates — The financial statements are prepared on a consolidated basis in conformity with accounting principles generally accepted in the United States of America (“GAAP”), which requires management to make estimates and assumptions that affect the reported amounts of assets and liabilities at the date of the financial statements and the reported amounts of revenues and expenses during the reporting period including estimates and assumptions related to taxation. Actual results could differ from those estimates by a significant amount. The accompanying financial statements reflect the financial position of the Fund and its Subsidiary and the results of operations on a consolidated basis. All inter-company accounts and transactions have been eliminated in consolidation. |
| | In addition, the Fund monitors for material events or transactions that may occur or become known after the period-end date and before the date the consolidated financial statements are released to print. |
| H. | | Indemnifications — Under the Trust’s organizational documents, each Trustee, officer, employee or other agent of the Trust, and under the Subsidiary’s organizational documents, the directors and officers of the Subsidiary, are indemnified against certain liabilities that may arise out of performance of their duties to the Fund and/or the Subsidiary, respectively. Additionally, in the normal course of business, the Fund enters into contracts, including the Fund’s servicing agreements, that contain a variety of indemnification clauses. The Fund’s maximum exposure under these arrangements is unknown as this would involve future claims that may be made against the Fund that have not yet occurred. The risk of material loss as a result of such indemnification claims is considered remote. |
| I. | | Futures Contracts — The Fund or the Subsidiary may enter into futures contracts to manage exposure to interest rate, equity and market price movements and/or currency risks. A futures contract is an agreement between two parties to purchase or sell a specified underlying security, currency or commodity (or delivery of a cash settlement price, in the case of an index future) for a fixed price at a future date. The Fund currently invests only in exchange-traded futures and they are standardized as to maturity date and underlying financial instrument. Initial margin deposits required upon entering into futures contracts are satisfied by the segregation of specific securities or cash as collateral at the futures commission merchant (broker). During the period the futures contracts are open, changes in the value of the contracts are recognized as unrealized gains or losses by recalculating the value of the contracts on a daily basis. Subsequent or variation margin payments are received or made depending upon whether unrealized gains or losses are incurred. These amounts are reflected as receivables or payables on the Consolidated Statement of Assets and Liabilities. When the contracts are closed or expire, the Fund recognizes a realized gain or loss equal to the difference between the proceeds from, or cost of, the closing transaction and the Fund’s basis in the contract. The net realized gain (loss) and the change in unrealized gain (loss) on futures contracts held during the period is included on the Consolidated Statement of Operations. The primary risks associated with futures contracts are market risk and the absence of a liquid secondary market. If the Fund were unable to liquidate a futures contract and/or enter into an offsetting closing transaction, the Fund would continue to be subject to market risk with respect to the value of the contracts and continue to be required to maintain the margin deposits on the futures contracts. Futures contracts have minimal counterparty risk since the exchange’s clearinghouse, as counterparty to all exchange-traded futures, guarantees the futures against default. Risks may exceed amounts recognized in the Consolidated Statement of Assets and Liabilities. |
| J. | | Swap Agreements — The Fund or the Subsidiary may enter into various swap transactions, including interest rate, total return, index, currency exchange rate and credit default swap contracts (“CDS”) for investment purposes or to manage interest rate, currency or credit risk. |
| | Interest rate, total return, index, and currency exchange rate swap agreements are two-party contracts entered into primarily to exchange the returns (or differentials in rates of returns) earned or realized on particular predetermined investments or instruments. The gross returns to be exchanged or “swapped” between the parties are calculated with respect to a notional amount, i.e., the return on or increase in value of a particular dollar amount invested at a particular interest rate or return of an underlying asset, in a particular foreign currency, or in a “basket” of securities representing a particular index. |
Invesco V.I. Balanced-Risk Allocation Fund
| | |
| | A CDS is an agreement between two parties (“Counterparties”) to exchange the credit risk of an issuer. A buyer of a CDS is said to buy protection by paying a fixed payment over the life of the agreement and in some situations an upfront payment to the seller of the CDS. If a defined credit event occurs (such as payment default or bankruptcy), the Fund as a protection buyer would cease paying its fixed payment, the Fund would deliver eligible bonds issued by the reference entity to the seller, and the seller would pay the full notional value, or the “par value”, of the referenced obligation to the Fund. A seller of a CDS is said to sell protection and thus would receive a fixed payment over the life of the agreement and an upfront payment, if applicable. If a credit event occurs, the Fund as a protection seller would cease to receive the fixed payment stream, the Fund would pay the buyer “par value” or the full notional value of the referenced obligation, and the Fund would receive the eligible bonds issued by the reference entity. In turn, these bonds may be sold in order to realize a recovery value. Alternatively, the seller of the CDS and its counterparty may agree to net the notional amount and the market value of the bonds and make a cash payment equal to the difference to the buyer of protection. If no credit event occurs, the Fund receives the fixed payment over the life of the agreement. As the seller, the Fund would effectively add leverage to its portfolio because, in addition to its total net assets, the Fund would be subject to investment exposure on the notional amount of the CDS. In connection with these agreements, cash and securities may be identified as collateral in accordance with the terms of the respective swap agreements to provide assets of value and recourse in the event of default under the swap agreement or bankruptcy/insolvency of a party to the swap agreement. If a counterparty becomes bankrupt or otherwise fails to perform its obligations due to financial difficulties, the Fund may experience significant delays in obtaining any recovery in a bankruptcy or other reorganization proceeding. The Fund may obtain only limited recovery or may obtain no recovery in such circumstances. |
| | Implied credit spreads represent the current level at which protection could be bought or sold given the terms of the existing CDS contract and serve as an indicator of the current status of the payment/performance risk of the CDS. An implied spread that has widened or increased since entry into the initial contract may indicate a deteriorating credit profile and increased risk of default for the reference entity. A declining or narrowing spread may indicate an improving credit profile or decreased risk of default for the reference entity. Alternatively, credit spreads may increase or decrease reflecting the general tolerance for risk in the credit markets. |
| | Changes in the value of swap agreements are recognized as unrealized gains (losses) in the Consolidated Statement of Operations by “marking to market” on a daily basis to reflect the value of the swap agreement at the end of each trading day. Payments received or paid at the beginning of the agreement are reflected as such on the Consolidated Statement of Assets and Liabilities and may be referred to as upfront payments. The Fund accrues for the fixed payment stream and amortizes upfront payments, if any, on swap agreements on a daily basis with the net amount, recorded as a component of realized gain (loss) on the Consolidated Statement of Operations. A liquidation payment received or made at the termination of a swap agreement is recorded as realized gain (loss) on the Consolidated Statement of Operations. The Fund segregates liquid securities having a value at least equal to the amount of the potential obligation of a Fund under any swap transaction. The Fund’s maximum risk of loss from counterparty risk, either as the protection seller or as the protection buyer, is the value of the contract. The risk may be mitigated by having a master netting arrangement between the Fund and the counterparty and by the posting of collateral by the counterparty to cover the Fund’s exposure to the counterparty. Entering into these agreements involves, to varying degrees, lack of liquidity and elements of credit, market, and counterparty risk in excess of amounts recognized on the Consolidated Statement of Assets and Liabilities. Such risks involve the possibility that a swap is difficult to sell or liquidate; the counterparty does not honor its obligations under the agreement and unfavorable interest rates and market fluctuations. |
| K. | | Other Risks — The Fund will seek to gain exposure to commodity markets primarily through an investment in the Subsidiary and through investments in exchange traded funds. The Subsidiary, unlike the Fund, may invest without limitation in commodities, commodity-linked derivatives and other securities, such as exchange traded notes, that may provide leverage and non-leveraged exposure to commodity markets. The Fund is indirectly exposed to the risks associated with the Subsidiary’s investments. |
| | The Fund is non-diversified and may invest in securities of fewer issuers than if it were diversified. Thus, the value of the Fund’s shares may vary more widely and the Fund may be subject to greater market and credit risk than if the Fund invested more broadly. |
| L. | | Collateral — To the extent the Fund or the Subsidiary has pledged or segregated a security as collateral and that security is subsequently sold, it is the Fund’s practice to replace such collateral no later than the next business day. |
NOTE 2—Advisory Fees and Other Fees Paid to Affiliates
Effective May 2, 2011, the Trust has entered into a master investment advisory agreement with Invesco Advisers, Inc. (the “Adviser” or “Invesco”). Under the terms of the investment advisory agreement, the Fund pays an advisory fee to the Adviser based on the annual rate of the Fund’s average daily net assets as follows:
| | | | | |
| Average Net Assets | | Rate |
| |
| First $250 million | | | 0 | .950% |
| |
| Next $250 million | | | 0 | .925% |
| |
| Next $500 million | | | 0 | .90% |
| |
| Next $1.5 billion | | | 0 | .875% |
| |
| Next $2.5 billion | | | 0 | .85% |
| |
| Next $2.5 billion | | | 0 | .825% |
| |
| Next $2.5 billion | | | 0 | .80% |
| |
| Over $10 billion | | | 0 | .775% |
| |
Under the terms of a master sub-advisory agreement between the Adviser and each of Invesco Asset Management Deutschland GmbH, Invesco Asset Management Limited, Invesco Asset Management (Japan) Limited, Invesco Australia Limited, Invesco Hong Kong Limited, Invesco Senior Secured Management,
Invesco V.I. Balanced-Risk Allocation Fund
Inc. and Invesco Canada Ltd. (collectively, the “Affiliated Sub-Advisers”) the Adviser, not the Fund, may pay 40% of the fees paid to the Adviser to any such Affiliated Sub-Adviser(s) that provide discretionary investment management services to the Fund based on the percentage of assets allocated to such Sub-Adviser(s).
The Subsidiary has entered into a separate contract with the Adviser whereby the Adviser provides investment advisory and other services to the Subsidiary. In consideration of these services, the Subsidiary pays an advisory fee to the Adviser based on the annual rate of the Subsidiary’s average daily net assets as set forth in the table above.
Effective May 2, 2011, the Adviser has contractually agreed, through at least June 30, 2013, to waive advisory fees and/or reimburse expenses of all shares to the extent necessary to limit total annual fund operating expenses after fee waiver and/or expense reimbursement (excluding certain items discussed below) of Series I shares to 0.70% and Series II shares to 0.95% of average daily net assets. Prior to May 2, 2011, the Adviser had contractually agreed to waive advisory fees and/or reimburse expenses of all shares to the extent necessary to limit total annual fund operating expenses to 0.90% and 1.15% for Series I and Series II shares, respectively. Effective January 1, 2012, the Adviser has contractually agreed to waive advisory fees and/or reimburse expenses of all shares to the extent necessary to limit total annual fund operating expenses to 0.62% and 0.87% for Series I and Series II shares, respectively. In determining the Adviser’s obligation to waive advisory fees and/or reimburse expenses, the following expenses are not taken into account, and could cause the total annual fund operating expenses after fee waiver and/or expense reimbursement to exceed the numbers reflected above: (1) interest; (2) taxes; (3) dividend expense on short sales; (4) extraordinary or non-routine items; (5) expenses of the underlying funds that are paid indirectly as a result of share ownership of the underlying funds; and (6) expenses that the Fund has incurred but did not actually pay because of an expense offset arrangement. Unless the Board of the Trustees and Invesco mutually agree to amend or continue the fee waiver agreement, it will terminate on June 30, 2013.
Further, the Adviser has contractually agreed, through at least June 30, 2012, to waive the advisory fee payable by the Fund in an amount equal to 100% of the net advisory fees the Adviser receives from the affiliated money market funds on investments by the Fund of uninvested cash in such affiliated money market funds.
For the year ended December 31, 2011, the Adviser waived advisory fees of $703,730.
The Trust has entered into a master administrative services agreement with Invesco pursuant to which the Fund has agreed to pay Invesco a fee for costs incurred in providing accounting services and fund administrative services to the Fund and to reimburse Invesco for administrative services fees paid to insurance companies that have agreed to provide services to the participants of separate accounts. These administrative services provided by the insurance companies may include, among other things: the printing of prospectuses, financial reports and proxy statements and the delivery of the same to existing participants; the maintenance of master accounts; the facilitation of purchases and redemptions requested by the participants; and the servicing of participants’ accounts. Pursuant to such agreement, for the year ended December 31, 2011, Invesco was paid $50,000 for accounting and fund administrative services and reimbursed $344,133 for services provided by insurance companies.
The Trust has entered into a transfer agency and service agreement with Invesco Investment Services, Inc. (“IIS”) pursuant to which the Fund has agreed to pay IIS a fee for providing transfer agency and shareholder services to the Fund and reimburse IIS for certain expenses incurred by IIS in the course of providing such services. For the year ended December 31, 2011, expenses incurred under the agreement are shown in the Consolidated Statement of Operations as transfer agent fees.
The Trust has entered into a master distribution agreement with Invesco Distributors, Inc. (“IDI”) to serve as the distributor for the Fund. The Trust has adopted a plan pursuant to Rule 12b-1 under the 1940 Act with respect to the Fund’s Series II shares (the “Plan”). The Fund, pursuant to the Plan, pays IDI compensation at the annual rate of 0.25% of the Fund’s average daily net assets of Series II shares. Of the Plan payments, up to 0.25% of the average daily net assets of the Series II shares may be paid to insurance companies who furnish continuing personal shareholder services to customers who purchase and own Series II shares of the Fund. For the year ended December 31, 2011, expenses incurred under the Plan are detailed in the Consolidated Statement of Operations as distribution fees.
Certain officers and trustees of the Trust are officers and directors of the Adviser, IIS and/or IDI.
NOTE 3—Additional Valuation Information
GAAP defines fair value as the price that would be received to sell an asset or paid to transfer a liability in an orderly transaction between market participants at the measurement date, under current market conditions. GAAP establishes a hierarchy that prioritizes the inputs to valuation methods giving the highest priority to readily available unadjusted quoted prices in an active market for identical assets (Level 1) and the lowest priority to significant unobservable inputs (Level 3) generally when market prices are not readily available or are unreliable. Based on the valuation inputs, the securities or other investments are tiered into one of three levels. Changes in valuation methods may result in transfers in or out of an investment’s assigned level:
| | |
| | Level 1 — | Prices are determined using quoted prices in an active market for identical assets. |
| | Level 2 — | Prices are determined using other significant observable inputs. Observable inputs are inputs that other market participants may use in pricing a security. These may include quoted prices for similar securities, interest rates, prepayment speeds, credit risk, yield curves, loss severities, default rates, discount rates, volatilities and others. |
| | Level 3 — | Prices are determined using significant unobservable inputs. In situations where quoted prices or observable inputs are unavailable (for example, when there is little or no market activity for an investment at the end of the period), unobservable inputs may be used. Unobservable inputs reflect the Fund’s own assumptions about the factors market participants would use in determining fair value of the securities or instruments and would be based on the best available information. |
The following is a summary of the tiered valuation input levels, as of December 31, 2011. The level assigned to the securities valuations may not be an indication of the risk or liquidity associated with investing in those securities. Because of the inherent uncertainties of valuation, the values reflected in the consolidated financial statements may materially differ from the value received upon actual sale of those investments.
Invesco V.I. Balanced-Risk Allocation Fund
During the year ended December 31, 2011, there were no significant transfers between investment levels.
| | | | | | | | | | | | | | | | | |
| | | Level 1 | | Level 2 | | Level 3 | | Total |
| |
| Exchange-Traded Funds | | $ | 11,058,795 | | | $ | — | | | $ | — | | | $ | 11,058,795 | |
| |
| U.S. Treasury Securities | | | — | | | | 13,999,934 | | | | — | | | | 13,999,934 | |
| |
| Money Market Funds | | | 209,536,630 | | | | — | | | | — | | | | 209,536,630 | |
| |
| | | $ | 220,595,425 | | | $ | 13,999,934 | | | $ | — | | | $ | 234,595,359 | |
| |
| Futures* | | | 2,946,344 | | | | — | | | | — | | | | 2,946,344 | |
| |
| Swap Agreements* | | | — | | | | 1,458,540 | | | | — | | | | 1,458,540 | |
| |
| Total Investments | | $ | 223,541,769 | | | $ | 15,458,474 | | | $ | — | | | $ | 239,000,243 | |
| |
| |
| * | Unrealized appreciation. |
NOTE 4—Derivative Investments
The following disclosure is intended to improve financial reporting about derivative instruments and hedging activities by requiring enhanced disclosures to enable investors to better understand their effects on an entity’s financial position and financial performance. The enhanced disclosure has no impact on the results of operations reported in the consolidated financial statements.
Value of Derivative Instruments at Period-End
The table below summarizes the value of the Fund’s derivative instruments, detailed by primary risk exposure, held as of December 31, 2011:
| | | | | | | | | |
| | | Value |
| Risk Exposure/Derivative Type | | Assets | | Liabilities |
| |
| Commodity risk | | | | | | | | |
Futures contracts(a) | | $ | 658,491 | | | $ | (1,836,273 | ) |
| |
Swap agreements(b) | | | 864,640 | | | | — | |
| |
| Interest rate risk | | | | | | | | |
Futures contracts(a) | | | 3,417,980 | | | | — | |
| |
Swap agreements(b) | | | 593,900 | | | | — | |
| |
| Market risk | | | | | | | | |
Futures contracts(a) | | | 989,751 | | | | (283,605 | ) |
| |
| | | $ | 6,524,762 | | | $ | (2,119,878 | ) |
| |
| | |
| (a) | | Includes cumulative appreciation (depreciation) of futures contracts. Only current day’s variation margin receivable is reported within the Consolidated Statement of Assets & Liabilities. |
| (b) | | Values are disclosed on the Consolidated Statement of Assets and Liabilities under the Unrealized appreciation on swap agreements. |
Effect of Derivative Instruments for the year ended December 31, 2011
The table below summarizes the gains (losses) on derivative instruments, detailed by primary risk exposure, recognized in earnings during the period:
| | | | | | | | | |
| | | Location of Gain (Loss) on
|
| | | Statement of Operations |
| | | | | Swap
|
| | | Futures* | | Agreements* |
| |
| Realized Gain (Loss) | | | | | | | | |
| Commodity risk | | $ | (1,447,729 | ) | | $ | (3,194,608 | ) |
| |
| Interest rate risk | | | 10,921,466 | | | | 5,716,320 | |
| |
| Market risk | | | (3,857,374 | ) | | | — | |
| |
| Change in Unrealized Appreciation (Depreciation) | | | | | | | | |
| Commodity risk | | $ | (1,177,782 | ) | | $ | 864,640 | |
| |
| Interest rate risk | | | 3,433,286 | | | | 593,900 | |
| |
| Market risk | | | 556,599 | | | | (146,562 | ) |
| |
| Total | | $ | 8,428,466 | | | $ | 3,833,690 | |
| |
| |
| * | The average notional value of futures and swap agreements outstanding during the period was $204,609,974 and $48,482,719, respectively. |
Invesco V.I. Balanced-Risk Allocation Fund
NOTE 5—Trustees’ and Officers’ Fees and Benefits
“Trustees’ and Officers’ Fees and Benefits” include amounts accrued by the Fund to pay remuneration to certain Trustees and Officers of the Fund. Trustees have the option to defer compensation payable by the Fund, and “Trustees’ and Officers’ Fees and Benefits” also include amounts accrued by the Fund to fund such deferred compensation amounts. Those Trustees who defer compensation have the option to select various Invesco Funds in which their deferral accounts shall be deemed to be invested. Finally, certain current Trustees are eligible to participate in a retirement plan that provides for benefits to be paid upon retirement to Trustees over a period of time based on the number of years of service. The Fund may have certain former Trustees who also participate in a retirement plan and receive benefits under such plan. “Trustees’ and Officers’ Fees and Benefits” include amounts accrued by the Fund to fund such retirement benefits. Obligations under the deferred compensation and retirement plans represent unsecured claims against the general assets of the Fund.
During the year ended December 31, 2011, the Fund paid legal fees of $1,225 for services rendered by Kramer, Levin, Naftalis & Frankel LLP as counsel to the Independent Trustees. A partner of that firm is a Trustee of the Trust.
NOTE 6—Cash Balances
The Fund is permitted to temporarily carry a negative or overdrawn balance in its account with State Street Bank and Trust Company, the custodian bank. To compensate the custodian bank for such overdrafts, the overdrawn Fund may either (1) leave funds as a compensating balance in the account so the custodian bank can be compensated by earning the additional interest; or (2) compensate by paying the custodian bank at a rate agreed upon by the custodian bank and Invesco, not to exceed the contractually agreed upon rate.
NOTE 7—Distributions to Shareholders and Tax Components of Net Assets
Tax Character of Distributions to Shareholders Paid During the Years Ended December 31, 2011 and 2010:
| | | | | | | | | |
| | | 2011 | | 2010 |
| |
| Ordinary income | | $ | 10,127,848 | | | $ | 1,156,905 | |
| |
| Long-term capital gain | | | 4,920,925 | | | | 389,425 | |
| |
| Total distributions | | $ | 15,048,773 | | | $ | 1,546,330 | |
| |
Tax Components of Net Assets at Period-End:
| | | | | |
| | | 2011 |
| |
| Undistributed ordinary income | | $ | 9,353,715 | |
| |
| Undistributed long-term gain | | | 4,013,671 | |
| |
| Net unrealized appreciation (depreciation) — investments | | | (627,440 | ) |
| |
| Net unrealized appreciation — other investments | | | 3,708,741 | |
| |
| Temporary book/tax differences | | | (16,037 | ) |
| |
| Shares of beneficial interest | | | 245,936,818 | |
| |
| Total net assets | | $ | 262,369,468 | |
| |
The difference between book-basis and tax-basis unrealized appreciation (depreciation) is due to differences in the timing of recognition of gains and losses on investments for tax and book purposes. The Fund’s net unrealized appreciation (depreciation) difference is attributable primarily to wash sales.
The temporary book/tax differences are a result of timing differences between book and tax recognition of income and/or expenses. The Fund’s temporary book/tax differences are the result of the trustee deferral of compensation and retirement plan benefits.
Capital loss carryforward is calculated and reported as of a specific date. Results of transactions and other activity after that date may affect the amount of capital loss carryforward actually available for the Trust to utilize. The Regulated Investment Company Modernization Act of 2010 (the “Act”) eliminated the eight-year carryover period for capital losses that arise in taxable years beginning after its enactment date of December 22, 2010. Consequently, these capital losses can be carried forward for an unlimited period. However, capital losses with an expiration period may not be used to offset capital gains until all net capital losses without an expiration date have been utilized. Additionally, post-enactment capital loss carryovers will retain their character as either short-term or long-term capital losses instead of as short-term capital losses as under prior law. The ability to utilize capital loss carryforward in the future may be limited under the Internal Revenue Code and related regulations based on the results of future transactions.
The Fund does not have a capital loss carryforward at period-end.
Invesco V.I. Balanced-Risk Allocation Fund
NOTE 8—Investment Securities
The aggregate amount of investment securities (other than short-term securities, U.S. Treasury obligations and money market funds, if any) purchased and sold by the Fund during the year ended December 31, 2011 was $27,425,156 and $69,294,484, respectively. Cost of investments on a tax basis includes the adjustments for financial reporting purposes as of the most recently completed Federal income tax reporting period-end.
| | | | | |
| Unrealized Appreciation (Depreciation) of Investment Securities on a Tax Basis |
| |
| Aggregate unrealized appreciation of investment securities | | $ | 5,913,101 | |
| |
| Aggregate unrealized (depreciation) of investment securities | | | (6,540,541 | ) |
| |
| Net unrealized appreciation (depreciation) of investment securities | | $ | (627,440 | ) |
| |
| Cost of investments for tax purposes is $235,222,799. |
NOTE 9—Reclassification of Permanent Differences
Primarily as a result of differing book/tax treatment of foreign futures, swap income and net operating losses, on December 31, 2011, undistributed net investment income was increased by $9,442,105, undistributed net realized gain was decreased by $3,456,088 and shares of beneficial interest decreased by $5,986,017.
NOTE 10—Share Information
| | | | | | | | | | | | | | | | | |
| | | Summary of Share Activity |
| |
| | | Year ended December 31, |
| | | 2011(a) | | 2010 |
| | | Shares | | Amount | | Shares | | Amount |
| |
| Sold: | | | | | | | | | | | | | | | | |
| Series I | | | 258,487 | | | $ | 2,871,722 | | | | — | | | $ | 58 | |
| |
| Series II | | | 12,355,475 | | | | 139,883,748 | | | | 2,727,339 | | | | 33,427,450 | |
| |
| Issued as reinvestment of dividends: | | | | | | | | | | | | | | | | |
| Series I | | | — | | | | — | | | | — | | | | — | |
| |
| Series II | | | 1,398,239 | | | | 15,045,054 | | | | 101,831 | | | | 1,546,330 | |
| |
Issued in connection with acquisitions:(b) | | | | | | | | | | | | | | | | |
| Series I | | | 174,025 | | | | 1,876,288 | | | | — | | | | — | |
| |
| Series II | | | 6,178,799 | | | | 66,483,294 | | | | — | | | | — | |
| |
| Reacquired: | | | | | | | | | | | | | | | | |
| Series I | | | (45,961 | ) | | | (505,852 | ) | | | (8,675 | ) | | | (108,000 | ) |
| |
| Series II | | | (3,202,503 | ) | | | (36,044,277 | ) | | | (6,161,080 | ) | | | (74,115,403 | ) |
| |
| Net increase (decrease) in share activity | | | 17,116,561 | | | $ | 189,609,977 | | | | (3,340,585 | ) | | $ | (39,249,565 | ) |
| |
| | |
| (a) | | There are entities that are record owners of more than 5% of the outstanding shares of the Fund and in the aggregate own 91% of the outstanding shares of the Fund. The Fund and the Fund’s principal underwriter or adviser, are parties to participation agreements with these entities whereby these entities sell units of interest in separate accounts funding variable products that are invested in the Fund. The Fund, Invesco and/or Invesco affiliates may make payments to these entities, which are considered to be related to the Fund, for providing services to the Fund, Invesco and/or Invesco affiliates including but not limited to services such as, securities brokerage, third party record keeping and account servicing and administrative services. The Trust has no knowledge as to whether all or any portion of the shares owned of record by these entities are also owned beneficially. |
| (b) | | As of the opening of business on May 2, 2011, the Fund acquired all the net assets of Invesco V.I. Global Multi-Asset Fund (the “Target Fund”) pursuant to a plan of reorganization approved by the Trustees of the Fund on November 10, 2010 and by the shareholders the Target Fund on April 1, 2011. The acquisition was accomplished by a taxable exchange of 6,352,824 shares of the Fund for 5,245,904 shares outstanding of the Target Fund as of the close of business on April 29, 2011. Each class of the Target Fund was exchanged for the like class of shares of the Fund based on the relative net asset value of the Target Fund to the net asset value of the Fund on the close of business, April 29, 2011. The Target Fund’s net assets at that date of $68,359,582 was combined with those of the Fund. The net assets of the Fund immediately before the acquisition were $73,364,971 and $141,724,553 immediately after the acquisition. |
| | The pro forma results of operations for the year ended December 31, 2011 assuming the reorganization had been completed on January 1, 2011, the beginning of the annual reporting period, are as follows: |
| | | | | |
| Net investment income | | $ | (432,423 | ) |
| Net realized/unrealized gains | | | 14,147,497 | |
| | | | | |
| Change in net assets resulting from operations | | $ | 13,715,074 | |
| | |
| | The combined investment portfolios have been managed as a single integrated portfolio since the acquisition was completed, it is not practicable to separate the amounts of revenue and earnings of the Target Fund that have been included in the Fund’s Statement of Operations since May 2, 2011. |
Invesco V.I. Balanced-Risk Allocation Fund
NOTE 11—Consolidated Financial Highlights
The following schedule presents financial highlights for a share of the Fund outstanding throughout the periods indicated.
| | | | | | | | | | | | | | | | | | | | | | | | | | | | | | | | | | | | | | | | | | | | | | | | | | | | | | | | | |
| | | | | | | | | | | | | | | | | | | | | | | Ratio of
| | Ratio of
| | | | |
| | | | | | | | | | | | | | | | | | | | | | | expenses
| | expenses
| | | | |
| | | | | | | Net gains
| | | | | | | | | | | | | | | | to average
| | to average net
| | Ratio of net
| | |
| | | Net asset
| | Net
| | on securities
| | | | Dividends
| | Distributions
| | | | | | | | | | net assets
| | assets without
| | investment
| | |
| | | value,
| | investment
| | (both
| | Total from
| | from net
| | from net
| | | | Net asset
| | | | Net assets,
| | with fee waivers
| | fee waivers
| | income (loss)
| | |
| | | beginning
| | income
| | realized and
| | investment
| | investment
| | realized
| | Total
| | value, end
| | Total
| | end of period
| | and/or expenses
| | and/or expenses
| | to average
| | Portfolio
|
| | | of period | | (loss)(a) | | unrealized) | | operations | | income | | gains | | distributions | | of period | | return(b) | | (000s omitted) | | absorbed | | absorbed | | net assets | | turnover(c) |
| |
| Series I* |
| Year ended 12/31/11 | | $ | 13.09 | | | $ | (0.04 | ) | | $ | 1.28 | | | $ | 1.24 | | | $ | (0.10 | ) | | $ | (2.70 | ) | | $ | (2.80 | ) | | $ | 11.53 | | | | 11.00 | % | | $ | 4,472 | | | | 0.71 | %(d)(e) | | | 1.22 | %(e) | | | (0.32 | )%(e) | | | 142 | % |
| Year ended 12/31/10(f) | | | 12.00 | | | | 0.10 | | | | 1.15 | | | | 1.25 | | | | (0.02 | ) | | | (0.14 | ) | | | (0.16 | ) | | | 13.09 | | | | 10.57 | | | | 17 | | | | 0.89 | | | | 1.29 | | | | 0.88 | (g) | | | 444 | |
| Eleven months ended 12/31/09(h) | | | 10.00 | | | | 0.04 | | | | 2.67 | | | | 2.71 | | | | (0.25 | ) | | | (0.46 | ) | | | (0.71 | ) | | | 12.00 | | | | 28.21 | | | | 120 | | | | 0.90 | (i)(j) | | | 1.46 | (i)(j) | | | 0.41 | (g)(i)(j) | | | 87 | |
| |
| Series II* |
| Year ended 12/31/11 | | | 13.05 | | | | (0.07 | ) | | | 1.27 | | | | 1.20 | | | | (0.06 | ) | | | (2.70 | ) | | | (2.76 | ) | | | 11.49 | | | | 10.61 | | | | 257,898 | | | | 0.96 | (d)(e) | | | 1.47 | (e) | | | (0.57 | )(e) | | | 142 | |
| Year ended 12/31/10(f) | | | 12.10 | | | | 0.07 | | | | 1.04 | | | | 1.11 | | | | (0.02 | ) | | | (0.14 | ) | | | (0.16 | ) | | | 13.05 | | | | 9.32 | | | | 75 | | | | 1.14 | | | | 1.54 | | | | 0.59 | (g) | | | 444 | |
| Eleven months ended 12/31/09(h) | | | 10.00 | | | | 0.05 | | | | 2.74 | | | | 2.79 | | | | (0.23 | ) | | | (0.46 | ) | | | (0.69 | ) | | | 12.10 | | | | 27.86 | (k) | | | 110 | | | | 1.15 | (i)(j) | | | 1.71 | (i)(j) | | | 0.44 | (g)(i)(j) | | | 87 | |
| |
| | |
| * | | Prior to May 2, 2011, the Fund operated as Invesco Van Kampen V.I. Global Tactical Asset Allocation Fund (the “Predecessor Fund”). On such date, holders of the Acquired Fund’s Series I and Series II shares received Series I and Series II shares, respectively of the Fund. |
| (a) | | Calculated using average shares outstanding. |
| (b) | | Includes adjustments in accordance with accounting principles generally accepted in the United States of America and as such, the net asset value for financial reporting purposes and the returns based upon those net asset values may differ from the net asset value and returns for shareholder transactions. Total returns are not annualized for periods less than one year, if applicable and do not reflect charges assessed in connection with a variable product, which if included would reduce total returns. |
| (c) | | Portfolio turnover is calculated at the fund level and is not annualized for periods less than one year, if applicable. |
| (d) | | In addition to the fees and expenses which the Fund bears directly; the Fund indirectly bears a pro rata share of the fees and expenses of the underlying funds in which the Fund invests. Because the underlying funds have varied expenses and fee levels and the Fund may own different proportions at different times, the amount of fees and expenses incurred indirectly by the Fund will vary. Estimated underlying fund expenses are not expenses that are incurred directly by your Fund. They are expenses that are incurred directly by the underlying funds and are deducted from the value of the funds your Fund invests in. The effect of the estimated underlying fund expenses that you bear indirectly is included in your Fund’s total return. Estimated acquired fund fees from underlying funds was 0.04%. |
| (e) | | Ratios are annualized and based on average daily net assets (000’s omitted) of $1,952 and $135,975 for Series I and Series II shares, respectively. |
| (f) | | On June 1, 2010, the Class I and Class II shares of the Predecessor Fund were reorganized into Series I and Series II shares, respectively of the Fund. |
| (g) | | Ratio of net investment income to average net assets without fee waivers and/or expenses absorbed for the year ended December 31, 2010 and the period ending December 31, 2009 was 0.48% and (0.15)% for Series I shares and 0.19% and (0.12)% for Series II shares, respectively. |
| (h) | | Commencement date of January 23, 2009. |
| (i) | | Does not include expenses of the Underlying Funds in which the Fund invests. The annualized weighted average ratio of expense to average net assets for the Underlying Funds was 0.08% at December 31, 2009. |
| (j) | | Annualized. |
| (k) | | These returns include combined 12b-1 fees and service fees of up to 0.25%. |
Invesco V.I. Balanced-Risk Allocation Fund
Report of Independent Registered Public Accounting Firm
To the Board of Trustees of AIM Variable Insurance Funds (Invesco Variable Insurance Funds)
and Shareholders of Invesco V.I. Balanced-Risk Allocation Fund:
In our opinion, the accompanying consolidated statement of assets and liabilities, including the consolidated schedule of investments, and the related consolidated statements of operations and of changes in net assets and the financial highlights present fairly, in all material respects, the consolidated financial position of Invesco V.I. Balanced-Risk Allocation Fund (formerly known as Invesco Van Kampen V.I. Global Tactical Asset Allocation Fund; one of the funds constituting AIM Variable Insurance Funds (Invesco Variable Insurance Funds), hereafter referred to as the “Fund”) at December 31, 2011, the results of its operations for the year then ended, and the changes in its net assets and the financial highlights for each of the two years in the period then ended, in conformity with accounting principles generally accepted in the United States of America. These consolidated financial statements and financial highlights (hereafter referred to as “financial statements”) are the responsibility of the Fund’s management; our responsibility is to express an opinion on these financial statements based on our audits. We conducted our audits of these financial statements in accordance with the standards of the Public Company Accounting Oversight Board (United States). Those standards require that we plan and perform the audits to obtain reasonable assurance about whether the financial statements are free of material misstatement. An audit includes examining, on a test basis, evidence supporting the amounts and disclosures in the financial statements, assessing the accounting principles used and significant estimates made by management, and evaluating the overall financial statement presentation. We believe that our audits, which included confirmation of securities at December 31, 2011 by correspondence with the custodian and brokers, provide a reasonable basis for our opinion. The financial highlights of the Fund for the periods ended December 31, 2009 and prior were audited by other independent auditors whose report dated February 19, 2010 expressed an unqualified opinion on those financial statements.
PRICEWATERHOUSECOOPERS LLP
February 17, 2012
Houston, Texas
Invesco V.I. Balanced-Risk Allocation Fund
Calculating your ongoing Fund expenses
Example
As a shareholder of the Fund, you incur ongoing costs, including management fees; distribution and/or service fees (12b-1); and other Fund expenses. This example is intended to help you understand your ongoing costs (in dollars) of investing in the Fund and to compare these costs with ongoing costs of investing in other mutual funds. The example is based on an investment of $1,000 invested at the beginning of the period and held for the entire period July 1, 2011 through December 31, 2011.
The actual and hypothetical expenses in the examples below do not represent the effect of any fees or other expenses assessed in connection with a variable product; if they did, the expenses shown would be higher while the ending account values shown would be lower.
Actual expenses
The table below provides information about actual account values and actual expenses. You may use the information in this table, together with the amount you invested, to estimate the expenses that you paid over the period. Simply divide your account value by $1,000 (for example, an $8,600 account value divided by $1,000 = 8.6), then multiply the result by the number in the table under the heading entitled “Actual Expenses Paid During Period” to estimate the expenses you paid on your account during this period.
Hypothetical example for comparison purposes
The table below also provides information about hypothetical account values and hypothetical expenses based on the Fund’s actual expense ratio and an assumed rate of return of 5% per year before expenses, which is not the Fund’s actual return.
The hypothetical account values and expenses may not be used to estimate the actual ending account balance or expenses you paid for the period. You may use this information to compare the ongoing costs of investing in the Fund and other funds. To do so, compare this 5% hypothetical example with the 5% hypothetical examples that appear in the shareholder reports of the other funds.
Please note that the expenses shown in the table are meant to highlight your ongoing costs. Therefore, the hypothetical information is useful in comparing ongoing costs, and will not help you determine the relative total costs of owning different funds.
| | | | | | | | | | | | | | | | | | | | | | | | | | | | | | | |
| | | | | | | | | | HYPOTHETICAL
| | | |
| | | | | | | | | | (5% annual return before
| | | |
| | | | | | | ACTUAL | | | expenses) | | | |
| | | | Beginning
| | | Ending
| | | Expenses
| | | Ending
| | | Expenses
| | | Annualized
|
| | | | Account Value
| | | Account Value
| | | Paid During
| | | Account Value
| | | Paid During
| | | Expense
|
| Class | | | (07/01/11) | | | (12/31/11)1 | | | Period2,3 | | | (12/31/11) | | | Period2,4 | | | Ratio |
| Series I | | | $ | 1,000.00 | | | | $ | 1,080.60 | | | | $ | 3.72 | | | | $ | 1,021.63 | | | | $ | 3.62 | | | | | 0.71 | % |
| | | | | | | | | | | | | | | | | | | | | | | | | | | | | | | |
| Series II | | | | 1,000.00 | | | | | 1,079.90 | | | | | 5.03 | | | | | 1,020.37 | | | | | 4.89 | | | | | 0.96 | |
| | | | | | | | | | | | | | | | | | | | | | | | | | | | | | | |
| |
| 1 | The actual ending account value is based on the actual total return of the Fund for the period July 1, 2011 through December 31, 2011, after actual expenses and will differ from the hypothetical ending account value which is based on the Fund’s expense ratio and a hypothetical annual return of 5% before expenses. |
| 2 | Expenses are equal to the Fund’s annualized expense ratio as indicated above multiplied by the average account value over the period, multiplied by 184/365 to reflect the most recent fiscal half year. Effective on January 1, 2012, the Adviser has contractually agreed to waive advisory fees and/or reimburse expenses of all shares to the extent necessary to limit total annual fund operating expenses to 0.62% and 0.87% for Series I and Series II shares, respectively. The waiver agreement is in effect through at least June 30, 2013. The annualized expense ratios restated as if this agreement had been in effect throughout the entire most recent fiscal half year are 0.57% and 0.82% for Series I and Series II shares, respectively. |
| 3 | The actual expenses paid restated as if the changes discussed above had been in effect throughout the entire most recent fiscal half year are $2.99 and $4.30 for Series I and Series II shares, respectively. |
| 4 | The hypothetical expenses paid restated as if changes discussed above had been in effect throughout the entire most recent fiscal half year are $2.91 and $4.18 for Series I and Series II shares, respectively. |
Invesco V.I. Balanced-Risk Allocation Fund
Form 1099-DIV, Form 1042-S and other year-end tax information provide shareholders with actual calendar year amounts that should be included in their tax returns. Shareholders should consult their tax advisors.
The following distribution information is being provided as required by the Internal Revenue Code or to meet a specific state’s requirement.
The Fund designates the following amounts or, if subsequently determined to be different, the maximum amount allowable for its fiscal year ended December 31, 2011:
| | | | | |
Federal and State Income Tax | | |
| |
| Long-Term Capital Gain Dividends | | $ | 4,920,925 | |
| Corporate Dividends Received Deduction* | | | 4.95% | |
| U.S. Treasury Obligations* | | | 0.05% | |
| | |
| | * | The above percentages are based on ordinary income dividends paid to shareholders during the Fund’s fiscal year. |
Invesco V.I. Balanced-Risk Allocation Fund
Trustees and Officers
The address of each trustee and officer is AIM Variable Insurance Funds (Invesco Variable Insurance Funds) (the “Trust”), 11 Greenway Plaza, Suite 2500, Houston, Texas 77046-1173. The trustees serve for the life of the Trust, subject to their earlier death, incapacitation, resignation, retirement or removal as more specifically provided in the Trust’s organizational documents. Each officer serves for a one year term or until their successors are elected and qualified. Column two below includes length of time served with predecessor entities, if any.
| | | | | | | | | |
| | | | | | | Number of Funds
| | |
Name, Year of Birth and
| | Trustee and/
| | Principal Occupation(s)
| | in Fund Complex
| | Other Directorship(s)
|
| Position(s) Held with the Trust | | or Officer Since | | During Past 5 Years | | Overseen by Trustee | | Held by Trustee |
| | | | | | | | | |
| | | | | | | | | |
| | | | | | | | | |
| Interested Persons | | | | | | | | |
| | | | | | | | | |
| | | | | | | | | |
| | | | | | | | | |
Martin L. Flanagan1 — 1960
Trustee | | 2007 | | Executive Director, Chief Executive Officer and President, Invesco Ltd. (ultimate parent of Invesco and a global investment management firm); Advisor to the Board, Invesco Advisers, Inc. (formerly known as Invesco Institutional (N.A.), Inc.); Trustee, The Invesco Funds; Vice Chair, Investment Company Institute; and Member of Executive Board, SMU Cox School of Business
Formerly: Chairman, Invesco Advisers, Inc. (registered investment adviser); Director, Chairman, Chief Executive Officer and President, IVZ Inc. (holding company), INVESCO Group Services, Inc. (service provider) and Invesco North American Holdings, Inc. (holding company); Director, Chief Executive Officer and President, Invesco Holding Company Limited (parent of Invesco and a global investment management firm); Director, Invesco Ltd.; Chairman, Investment Company Institute and President, Co-Chief Executive Officer, Co-President, Chief Operating Officer and Chief Financial Officer, Franklin Resources, Inc. (global investment management organization) | | 140 | | None |
| | | | | | | | | |
| | | | | | | | | |
| | | | | | | | | |
Philip A. Taylor2 — 1954
Trustee, President and Principal Executive Officer | | 2006 | | Head of North American Retail and Senior Managing Director, Invesco Ltd.; Director, Co-Chairman, Co-President and Co-Chief Executive Officer, Invesco Advisers, Inc. (formerly known as Invesco Institutional (N.A.), Inc.) (registered investment adviser); Director, Chairman, Chief Executive Officer and President, Invesco Management Group, Inc. (formerly Invesco Aim Management Group, Inc.) (financial services holding company); Director and President, INVESCO Funds Group, Inc. (registered investment adviser and registered transfer agent); Director and Chairman, Invesco Investment Services, Inc. (formerly known as Invesco Aim Investment Services, Inc.) (registered transfer agent) and IVZ Distributors, Inc. (formerly known as INVESCO Distributors, Inc.) (registered broker dealer); Director, President and Chairman, Invesco Inc. (holding company) and Invesco Canada Holdings Inc. (holding company); Chief Executive Officer, Invesco Corporate Class Inc. (corporate mutual fund company) and Invesco Canada Fund Inc. (corporate mutual fund company); Director, Chairman and Chief Executive Officer, Invesco Canada Ltd. (formerly known as Invesco Trimark Ltd./Invesco Trimark Ltèe) (registered investment adviser and registered transfer agent); Trustee, President and Principal Executive Officer, The Invesco Funds (other than AIM Treasurer’s Series Trust (Invesco Treasurer’s Series Trust) and Short-Term Investments Trust); Trustee and Executive Vice President, The Invesco Funds (AIM Treasurer’s Series Trust (Invesco Treasurer’s Series Trust) and Short-Term Investments Trust only); Director, Invesco Investment Advisers LLC (formerly known as Van Kampen Asset Management); Director, Chief Executive Officer and President, Van Kampen Exchange Corp. | | 140 | | None |
| | | | | | | | | |
| | | | | | | | | |
| | | | | Formerly: Director and Chairman, Van Kampen Investor Services Inc.: Director, Chief Executive Officer and President, 1371 Preferred Inc. (holding company); and Van Kampen Investments Inc.; Director and President, AIM GP Canada Inc. (general partner for limited partnerships); and Van Kampen Advisors, Inc.; Director and Chief Executive Officer, Invesco Trimark Dealer Inc. (registered broker dealer); Director, Invesco Distributors, Inc. (formerly known as Invesco Aim Distributors, Inc.) (registered broker dealer); Manager, Invesco PowerShares Capital Management LLC; Director, Chief Executive Officer and President, Invesco Advisers, Inc.; Director, Chairman, Chief Executive Officer and President, Invesco Aim Capital Management, Inc.; President, Invesco Trimark Dealer Inc. and Invesco Trimark Ltd./Invesco Trimark Ltèe; Director and President, AIM Trimark Corporate Class Inc. and AIM Trimark Canada Fund Inc.; Senior Managing Director, Invesco Holding Company Limited; Trustee and Executive Vice President, Tax-Free Investments Trust; Director and Chairman, Fund Management Company (former registered broker dealer); President and Principal Executive Officer, The Invesco Funds (AIM Treasurer’s Series Trust (Invesco Treasurer’s Series Trust), Short-Term Investments Trust and Tax-Free Investments Trust only); President, AIM Trimark Global Fund Inc. and AIM Trimark Canada Fund Inc. | | | | |
| | | | | | | | | |
| | | | | | | | | |
| | | | | | | | | |
Wayne W. Whalen3 — 1939
Trustee | | 2010 | | Of Counsel, and prior to 2010, partner in the law firm of Skadden, Arps, Slate, Meagher & Flom LLP, legal counsel to funds in the Fund Complex | | 158 | | Director of the Abraham Lincoln Presidential Library Foundation |
| | | | | | | | | |
| | | | | | | | | |
| | | | | | | | | |
| Independent Trustees | | | | | | | | |
| | | | | | | | | |
| | | | | | | | | |
| | | | | | | | | |
Bruce L. Crockett — 1944
Trustee and Chair | | 1993 | | Chairman, Crockett Technology Associates (technology consulting company) | | 140 | | ACE Limited (insurance company); and Investment Company Institute |
| | | | | Formerly: Director, Captaris (unified messaging provider); Director, President and Chief Executive Officer COMSAT Corporation; and Chairman, Board of Governors of INTELSAT (international communications company) | | | | |
| | | | | | | | | |
| |
| 1 | Mr. Flanagan is considered an interested person of the Trust because he is an officer of the adviser to the Trust, and an officer and a director of Invesco Ltd., ultimate parent of the adviser to the Trust. |
| 2 | Mr. Taylor is considered an interested person of the Trust because he is an officer and a director of the adviser to, and a director of the principal underwriter of, the Trust. |
| 3 | Mr. Whalen is considered an “interested person” (within the meaning of Section 2(a)(19) of the 1940 Act) of certain Funds in the Fund Complex by reason of he and his firm currently providing legal services as legal counsel to such Funds in the Fund Complex. |
Invesco V.I. Balanced-Risk Allocation Fund
Trustees and Officers—(continued)
The address of each trustee and officer is AIM Variable Insurance Funds (Invesco Variable Insurance Funds) (the “Trust”), 11 Greenway Plaza, Suite 2500, Houston, Texas 77046-1173. The trustees serve for the life of the Trust, subject to their earlier death, incapacitation, resignation, retirement or removal as more specifically provided in the Trust’s organizational documents. Each officer serves for a one year term or until their successors are elected and qualified. Column two below includes length of time served with predecessor entities, if any.
| | | | | | | | | |
| | | | | | | Number of Funds
| | |
Name, Year of Birth and
| | Trustee and/
| | Principal Occupation(s)
| | in Fund Complex
| | Other Directorship(s)
|
| Position(s) Held with the Trust | | or Officer Since | | During Past 5 Years | | Overseen by Trustee | | Held by Trustee |
Independent Trustees—(continued) | | | | | | |
| | | | | | | | | |
| | | | | | | | | |
| | | | | | | | | |
David C. Arch — 1945
Trustee | | 2010 | | Chairman and Chief Executive Officer of Blistex Inc., a consumer health care products manufacturer. | | 158 | | Member of the Heartland Alliance Advisory Board, a nonprofit organization serving human needs based in Chicago. Board member of the Illinois Manufacturers’ Association. Member of the Board of Visitors, Institute for the Humanities, University of Michigan |
| | | | | | | | | |
| | | | | | | | | |
| | | | | | | | | |
Frank S. Bayley — 1939
Trustee | | 2001 | | Retired
Formerly: Director, Badgley Funds, Inc. (registered investment company) (2 portfolios) and Partner, law firm of Baker & McKenzie
Formerly: Director, Badgley Funds, Inc. (registered investment company) (2 portfolios) and Partner, law firm of Baker & McKenzie | | 140 | | Director and Chairman, C.D. Stimson Company (a real estate investment company) |
| | | | | | | | | |
| | | | | | | | | |
| | | | | | | | | |
James T. Bunch — 1942
Trustee | | 2004 | | Managing Member, Grumman Hill Group LLC (family office private equity management)
Formerly: Founder, Green, Manning & Bunch Ltd. (investment banking firm)(1988-2010); Executive Committee, United States Golf Association; and Director, Policy Studies, Inc. and Van Gilder Insurance Corporation | | 140 | | Vice Chairman, Board of Governors, Western Golf Association/Evans Scholars Foundation and Director, Denver Film Society |
| | | | | | | | | |
| | | | | | | | | |
| | | | | | | | | |
Rodney F. Dammeyer — 1940
Trustee | | 2010 | | President of CAC, LLC, a private company offering capital investment and management advisory services.
Formerly: Prior to January 2004, Director of TeleTech Holdings Inc.; Prior to 2002, Director of Arris Group, Inc.; Prior to 2001, Managing Partner at Equity Group Corporate Investments. Prior to 1995, Vice Chairman of Anixter International. Prior to 1985, experience includes Senior Vice President and Chief Financial Officer of Household International, Inc., Executive Vice President and Chief Financial Officer of Northwest Industries, Inc. and Partner of Arthur Andersen & Co. | | 158 | | Director of Quidel Corporation and Stericycle, Inc. Prior to May 2008, Trustee of The Scripps Research Institute. Prior to February 2008, Director of Ventana Medical Systems, Inc. Prior to April 2007, Director of GATX Corporation. Prior to April 2004, Director of TheraSense, Inc. |
| | | | | | | | | |
| | | | | | | | | |
| | | | | | | | | |
Albert R. Dowden — 1941
Trustee | | 2000 | | Director of a number of public and private business corporations, including the Boss Group, Ltd. (private investment and management); Reich & Tang Funds (5 portfolios) (registered investment company); and Homeowners of America Holding Corporation/ Homeowners of America Insurance Company (property casualty company)
Formerly: Director, Continental Energy Services, LLC (oil and gas pipeline service); Director, CompuDyne Corporation (provider of product and services to the public security market) and Director, Annuity and Life Re (Holdings), Ltd. (reinsurance company); Director, President and Chief Executive Officer, Volvo Group North America, Inc.; Senior Vice President, AB Volvo; Director of various public and private corporations; Chairman, DHJ Media, Inc.; Director Magellan Insurance Company; and Director, The Hertz Corporation, Genmar Corporation (boat manufacturer), National Media Corporation; Advisory Board of Rotary Power International (designer, manufacturer, and seller of rotary power engines); and Chairman, Cortland Trust, Inc. (registered investment company) | | 140 | | Board of Nature’s Sunshine Products, Inc. |
| | | | | | | | | |
| | | | | | | | | |
| | | | | | | | | |
Jack M. Fields — 1952
Trustee | | 1997 | | Chief Executive Officer, Twenty First Century Group, Inc. (government affairs company); and Owner and Chief Executive Officer, Dos Angelos Ranch, L.P. (cattle, hunting, corporate entertainment), Discovery Global Education Fund (non-profit) and Cross Timbers Quail Research Ranch (non-profit)
Formerly: Chief Executive Officer, Texana Timber LP (sustainable forestry company) and member of the U.S. House of Representatives | | 140 | | Administaff |
| | | | | | | | | |
| | | | | | | | | |
| | | | | | | | | |
Carl Frischling — 1937
Trustee | | 1993 | | Partner, law firm of Kramer Levin Naftalis and Frankel LLP | | 140 | | Director, Reich & Tang Funds (16 portfolios) |
| | | | | | | | | |
| | | | | | | | | |
Invesco V.I. Balanced-Risk Allocation Fund
Trustees and Officers—(continued)
The address of each trustee and officer is AIM Variable Insurance Funds (Invesco Variable Insurance Funds) (the “Trust”), 11 Greenway Plaza, Suite 2500, Houston, Texas 77046-1173. The trustees serve for the life of the Trust, subject to their earlier death, incapacitation, resignation, retirement or removal as more specifically provided in the Trust’s organizational documents. Each officer serves for a one year term or until their successors are elected and qualified. Column two below includes length of time served with predecessor entities, if any.
| | | | | | | | | |
| | | | | | | Number of Funds
| | |
Name, Year of Birth and
| | Trustee and/
| | Principal Occupation(s)
| | in Fund Complex
| | Other Directorship(s)
|
| Position(s) Held with the Trust | | or Officer Since | | During Past 5 Years | | Overseen by Trustee | | Held by Trustee |
Independent Trustees—(continued) | | | | | | |
| | | | | | | | | |
| | | | | | | | | |
| | | | | | | | | |
Prema Mathai-Davis — 1950
Trustee | | 1998 | | Retired
Formerly: Chief Executive Officer, YWCA of the U.S.A. | | 140 | | None |
| | | | | | | | | |
| | | | | | | | | |
| | | | | | | | | |
Larry Soll — 1942
Trustee | | 2004 | | Retired
Formerly, Chairman, Chief Executive Officer and President, Synergen Corp. (a biotechnology company) | | 140 | | None |
| | | | | | | | | |
| | | | | | | | | |
| | | | | | | | | |
Hugo F. Sonnenschein — 1940
Trustee | | 2010 | | President Emeritus and Honorary Trustee of the University of Chicago and the Adam Smith Distinguished Service Professor in the Department of Economics at the University of Chicago. Prior to July 2000, President of the University of Chicago. | | 158 | | Trustee of the University of Rochester and a member of its investment committee. Member of the National Academy of Sciences, the American Philosophical Society and a fellow of the American Academy of Arts and Sciences |
| | | | | | | | | |
| | | | | | | | | |
| | | | | | | | | |
| Raymond Stickel, Jr. — 1944 Trustee | | 2005 | | Retired
Formerly: Director, Mainstay VP Series Funds, Inc. (25 portfolios) and Partner, Deloitte & Touche | | 140 | | None |
| | | | | | | | | |
| | | | | | | | | |
| | | | | | | | | |
| Other Officers | | | | | | | | |
| | | | | | | | | |
| | | | | | | | | |
| | | | | | | | | |
Russell C. Burk — 1958
Senior Vice President and Senior Officer | | 2005 | | Senior Vice President and Senior Officer, The Invesco Funds | | N/A | | N/A |
| | | | | | | | | |
| | | | | | | | | |
| | | | | | | | | |
John M. Zerr — 1962
Senior Vice President, Chief Legal Officer and Secretary | | 2006 | | Director, Senior Vice President, Secretary and General Counsel, Invesco Management Group, Inc. (formerly known as Invesco Aim Management Group, Inc.) and Van Kampen Exchange Corp.; Senior Vice President, Invesco Advisers, Inc. (formerly known as Invesco Institutional (N.A.), Inc.) (registered investment adviser); Senior Vice President and Secretary, Invesco Distributors, Inc. (formerly known as Invesco Aim Distributors, Inc.); Director, Vice President and Secretary, Invesco Investment Services, Inc. (formerly known as Invesco Aim Investment Services, Inc.) and IVZ Distributors, Inc. (formerly known as INVESCO Distributors, Inc.); Director and Vice President, INVESCO Funds Group, Inc.; Senior Vice President, Chief Legal Officer and Secretary, The Invesco Funds; Manager, Invesco PowerShares Capital Management LLC; Director, Secretary and General Counsel, Invesco Investment Advisers LLC (formerly known as Van Kampen Asset Management); Secretary and General Counsel, Van Kampen Funds Inc. and Chief Legal Officer, PowerShares Exchange-Traded Fund Trust, PowerShares Exchange-Traded Fund Trust II, PowerShares India Exchange-Traded Fund Trust and PowerShares Actively Managed Exchange-Traded Fund Trust
Formerly: Director and Secretary, Van Kampen Advisors Inc.; Director Vice President, Secretary and General Counsel Van Kampen Investor Services Inc.; Director, Invesco Distributors, Inc. (formerly known as Invesco Aim Distributors, Inc.); Director, Senior Vice President, General Counsel and Secretary, Invesco Advisers, Inc.; and Van Kampen Investments Inc.; Director, Vice President and Secretary, Fund Management Company; Director, Senior Vice President, Secretary, General Counsel and Vice President, Invesco Aim Capital Management, Inc.; Chief Operating Officer and General Counsel, Liberty Ridge Capital, Inc. (an investment adviser); Vice President and Secretary, PBHG Funds (an investment company) and PBHG Insurance Series Fund (an investment company); Chief Operating Officer, General Counsel and Secretary, Old Mutual Investment Partners (a broker-dealer); General Counsel and Secretary, Old Mutual Fund Services (an administrator) and Old Mutual Shareholder Services (a shareholder servicing center); Executive Vice President, General Counsel and Secretary, Old Mutual Capital, Inc. (an investment adviser); and Vice President and Secretary, Old Mutual Advisors Funds (an investment company) | | N/A | | N/A |
| | | | | | | | | |
| | | | | | | | | |
| | | | | | | | | |
Lisa O. Brinkley — 1959
Vice President | | 2004 | | Global Compliance Director, Invesco Ltd.; Chief Compliance Officer, Invesco Investment Services, Inc.(formerly known as Invesco Aim Investment Services, Inc.); and Vice President, The Invesco Funds
Formerly: Chief Compliance Officer, Invesco Distributors, Inc. (formerly known as Invesco Aim Distributors, Inc.) and Van Kampen Investor Services Inc.; Senior Vice President, Invesco Management Group, Inc.; Senior Vice President and Chief Compliance Officer, Invesco Advisers, Inc. and The Invesco Funds; Vice President and Chief Compliance Officer, Invesco Aim Capital Management, Inc. and Invesco Distributors, Inc.; Vice President, Invesco Investment Services, Inc. and Fund Management Company | | N/A | | N/A |
| | | | | | | | | |
Invesco V.I. Balanced-Risk Allocation Fund
Trustees and Officers—(continued)
The address of each trustee and officer is AIM Variable Insurance Funds (Invesco Variable Insurance Funds) (the “Trust”), 11 Greenway Plaza, Suite 2500, Houston, Texas 77046-1173. The trustees serve for the life of the Trust, subject to their earlier death, incapacitation, resignation, retirement or removal as more specifically provided in the Trust’s organizational documents. Each officer serves for a one year term or until their successors are elected and qualified. Column two below includes length of time served with predecessor entities, if any.
| | | | | | | | | |
| | | | | | | Number of Funds
| | |
Name, Year of Birth and
| | Trustee and/
| | Principal Occupation(s)
| | in Fund Complex
| | Other Directorship(s)
|
| Position(s) Held with the Trust | | or Officer Since | | During Past 5 Years | | Overseen by Trustee | | Held by Trustee |
Other Officers—(continued) | | | | | | |
| | | | | | | | | |
| | | | | | | | | |
| | | | | | | | | |
Sheri Morris — 1964
Vice President, Treasurer and Principal Financial Officer | | 1999 | | Vice President, Treasurer and Principal Financial Officer, The Invesco Funds; Vice President, Invesco Advisers, Inc. (formerly known as Invesco Institutional (N.A.), Inc.) (registered investment adviser).
Formerly: Treasurer, PowerShares Exchange-Traded Fund Trust, PowerShares Exchange-Traded Fund Trust II, PowerShares India Exchange-Traded Fund Trust and PowerShares Actively Managed Exchange-Traded Fund Trust, Vice President, Invesco Advisers, Inc., Invesco Aim Capital Management, Inc. and Invesco Aim Private Asset Management, Inc.; Assistant Vice President and Assistant Treasurer, The Invesco Funds and Assistant Vice President, Invesco Advisers, Inc., Invesco Aim Capital Management, Inc. and Invesco Aim Private Asset Management, Inc. | | N/A | | N/A |
| | | | | | | | | |
| | | | | | | | | |
| | | | | | | | | |
Karen Dunn Kelley — 1960
Vice President | | 1993 | | Head of Invesco’s World Wide Fixed Income and Cash Management Group; Senior Vice President, Invesco Management Group, Inc. (formerly known as Invesco Aim Management Group, Inc.) and Invesco Advisers, Inc. (formerly known as Invesco Institutional (N.A.), Inc.) (registered investment adviser); Executive Vice President, Invesco Distributors, Inc. (formerly known as Invesco Aim Distributors, Inc.); Director, Invesco Mortgage Capital Inc.; Vice President, The Invesco Funds (other than AIM Treasurer’s Series Trust (Invesco Treasurer’s Series Trust) and Short-Term Investments Trust); and President and Principal Executive Officer, The Invesco Funds (AIM Treasurer’s Series Trust (Invesco Treasurer’s Series Trust) and Short-Term Investments Trust only).
Formerly: Senior Vice President, Van Kampen Investments Inc.; Vice President, Invesco Advisers, Inc. (formerly known as Invesco Institutional (N.A.), Inc.); Director of Cash Management and Senior Vice President, Invesco Advisers, Inc. and Invesco Aim Capital Management, Inc.; President and Principal Executive Officer, Tax-Free Investments Trust; Director and President, Fund Management Company; Chief Cash Management Officer, Director of Cash Management, Senior Vice President, and Managing Director, Invesco Aim Capital Management, Inc.; Director of Cash Management, Senior Vice President, and Vice President, Invesco Advisers, Inc. and The Invesco Funds (AIM Treasurer’s Series Trust (Invesco Treasurer’s Series Trust), Short-Term Investments Trust and Tax-Free Investments Trust only) | | N/A | | N/A |
| | | | | | | | | |
| | | | | | | | | |
| | | | | | | | | |
Yinka Akinsola — 1977
Anti-Money Laundering Compliance Officer | | 2011 | | Anti-Money Laundering Compliance Officer, Invesco Advisers, Inc. (formerly known as Invesco Institutional (N.A.), Inc.) (registered investment adviser); Invesco Distributors, Inc. (formerly known as Invesco Aim Distributors, Inc.), Invesco Investment Services, Inc. (formerly known as Invesco Aim Investment Services, Inc.), Invesco Management Group, Inc., The Invesco Funds, Invesco Van Kampen Closed-End Funds, Van Kampen Exchange Corp. and Van Kampen Funds Inc. | | N/A | | N/A |
| | | | | | | | | |
| | | | | | | | | |
| | | | | | | | | |
Todd L. Spillane — 1958
Chief Compliance Officer | | 2006 | | Senior Vice President, Invesco Management Group, Inc. (formerly known as Invesco Aim Management Group, Inc.) and Van Kampen Exchange Corp.; Senior Vice President and Chief Compliance Officer, Invesco Advisers, Inc. (registered investment adviser) (formerly known as Invesco Institutional (N.A.), Inc.); Chief Compliance Officer, The Invesco Funds, INVESCO Private Capital Investments, Inc. (holding company) and Invesco Private Capital, Inc. (registered investment adviser); Vice President, Invesco Distributors, Inc. (formerly known as Invesco Aim Distributors, Inc.) and Invesco Investment Services, Inc. (formerly known as Invesco Aim Investment Services, Inc.).
Formerly: Chief Compliance Officer, Invesco Van Kampen Closed-End Funds PowerShares Exchange-Traded Fund Trust, PowerShares Exchange-Traded Fund Trust II, PowerShares India Exchange-Traded Fund Trust, and PowerShares Actively Managed Exchange-Traded Fund Trust; Senior Vice President, Van Kampen Investments Inc.; Senior Vice President and Chief Compliance Officer, Invesco Advisers, Inc. and Invesco Aim Capital Management, Inc.; Chief Compliance Officer, Invesco Global Asset Management (N.A.), Inc., Invesco Senior Secured Management, Inc. (registered investment adviser) and Van Kampen Investor Services Inc.; Vice President, Invesco Aim Capital Management, Inc. and Fund Management Company | | N/A | | N/A |
| | | | | | | | | |
The Statement of Additional Information of the Trust includes additional information about the Fund’s Trustees and is available upon request, without charge, by calling 1.800.959.4246. Please refer to the Fund’s prospectus for information on the Fund’s sub-advisers.
| | | | | | | |
Office of the Fund
11 Greenway Plaza, Suite 2500
Houston, TX 77046-1173 | | Investment Adviser
Invesco Advisers, Inc.
1555 Peachtree Street, N.E.
Atlanta, GA 30309 | | Distributor
Invesco Distributors, Inc.
11 Greenway Plaza, Suite 2500
Houston, TX 77046-1173 | | Auditors
PricewaterhouseCoopers LLP
1201 Louisiana Street, Suite 2900
Houston, TX 77002-5678 |
| | | | | | | |
| | | | | | | |
Counsel to the Fund
Stradley Ronon Stevens & Young, LLP
2600 One Commerce Square
Philadelphia, PA 19103 | | Counsel to the Independent Trustees
Kramer, Levin, Naftalis & Frankel LLP
1177 Avenue of the Americas
New York, NY 10036-2714 | | Transfer Agent
Invesco Investment Services, Inc.
11 Greenway Plaza, Suite 2500
Houston, TX77046-1173 | | Custodian
State Street Bank and Trust Company
225 Franklin
Boston, MA 02110-2801 |
Invesco V.I. Balanced-Risk Allocation Fund
Invesco V.I. Basic Value Fund
Annual Report to Shareholders § December 31, 2011
The Fund provides a complete list of its holdings four times in each fiscal year, at the quarter-ends. For the second and fourth quarters, the lists appear in the Fund’s semiannual and annual reports to shareholders. For the first and third quarters, the Fund files the lists with the Securities and Exchange Commission (SEC) on Form N-Q. The Fund’s Form N-Q filings are available on the SEC website, sec.gov. Copies of the Fund’s Forms N-Q may be reviewed and copied at the SEC Public Reference Room in Washington, D.C. You can obtain information on the operation of the Public Reference Room, including information about duplicating fee charges, by calling 202 551 8090 or 800 732 0330, or by electronic request at the following email address: publicinfo@sec.gov. The SEC file numbers for the Fund are 811-07452 and 033-57340. The Fund’s most recent portfolio holdings, as filed on Form N-Q, have also been made available to insurance companies issuing variable annuity contracts and variable life insurance policies (“variable products”) that invest in the Fund.
A description of the policies and procedures that the Fund uses to determine how to vote proxies relating to portfolio securities is available without charge, upon request, from our Client Services department at 800 959 4246 or at invesco.com/proxyguidelines. The information is also available on the SEC website, sec.gov.
Information regarding how the Fund voted proxies related to its portfolio securities during the 12 months ended June 30, 2011, is available at invesco.com/proxysearch. The information is also available on the SEC website, sec.gov.
Invesco Advisers, Inc. is an investment adviser; it provides investment advisory services to individual and institutional clients and does not sell securities. Invesco Distributors, Inc. is the U.S. distributor for Invesco Ltd.’s retail mutual funds, exchange-traded funds and institutional money market funds. Both are wholly owned, indirect subsidiaries of Invesco Ltd.
This report must be accompanied or preceded by a currently effective Fund prospectus and variable product prospectus, which contain more complete information, including sales charges and expenses. Investors should read each carefully before investing.
Invesco Distributors, Inc.
VIBVA-AR-1
| | | | | |
| |
| NOT FDIC INSURED | | MAY LOSE VALUE | | NO BANK GUARANTEE |
Management’s Discussion of Fund Performance
Performance summary
For the year ended December 31, 2011, Invesco V.I. Basic Value Fund, excluding variable product issuer charges, posted a small loss and underperformed its style-specific benchmark, the Russell 1000 Value Index. The Fund’s underperformance was largely due to a lack of exposure to the utilities sector and an overweight position in the financials sector. Alternatively, an overweight position in the consumer discretionary sector and good stock selection in the energy sector contributed to the Fund’s performance versus its style-specific benchmark. The Fund’s health care holdings were the largest contributors to absolute performance during the year, while its financials holdings were the largest detractors.
Your Fund’s long-term performance appears later in this report.
Fund vs. Indexes
Total returns, 12/31/10 to 12/31/11, excluding variable product issuer charges.
If variable product issuer charges were included, returns would be lower.
| | | | | |
|
| Series I Shares | | | -3.05 | % |
| |
| Series II Shares | | | -3.39 | |
| |
S&P 500 Index▼ (Broad Market Index) | | | 2.09 | |
| |
Russell 1000 Value Index▼ (Style-Specific Index) | | | 0.39 | |
| |
Lipper VUF Large-Cap Value Funds Index▼ (Peer Group Index) | | | -1.70 | |
| |
Source(s): ▼Lipper Inc.
How we invest
We seek to exploit market inefficiencies by investing in companies that appear undervalued relative to the market in general. Ultimately, we believe that the market will recognize the value in these companies and will sell them as their stock price begins to reflect their intrinsic value. Although we are benchmark agnostic, we feel that stock picking, as compared to making sector bets, may provide a more consistent path to success. In addition, investors can take advantage of pricing anomalies by purchasing undervalued stocks before a recognizable catalyst arises. We believe that there are four keys to investing: valuation, fundamentals, accounting and psychology.
The Fund’s primary investable universe includes all U.S. denominated equities. In order to distill the investment universe, we filter for companies with sufficient liquidity. We filter the remaining securities
on valuation metrics depending on the growth or cyclical nature of their business. The result of this filtering process is a pool of liquid securities that we believe is statistically inexpensive relative to the broader market. Companies identified in the filtering process are thoroughly analyzed to assess intrinsic value and their ability to achieve fair value.
We will only initiate a purchase of a security if we believe the potential for stock price appreciation outweighs the potential downside risk. To be eligible for inclusion in the Fund, a stock must meet the following criteria:
| n | | If we determine the security is statistically cheap on the basis of its primary valuation criteria, which depends on the cyclical or growth nature of its business. |
| |
| n | | If our rigorous fundamental analysis determines that the company is undervalued and possesses potential financial strength and improved quality of management for future growth. |
We maintain an intense focus on the quality of a company’s accounting and on financial statement analysis. Portfolio construction is bottom up and stock specific, concentrating on individual company fundamental analysis and valuations. Therefore, while we monitor and are aware of our positions relative to the benchmark, it does not play a major role in the construction of the Fund. We also pay attention to investor psychology, as we believe it is one reason why securities become undervalued and overvalued.
We look to manage risk through portfolio construction – chiefly through diversification across most major sectors and through the assistance of an independent quantitative risk control group. Risk management is continual. The Fund is regularly reviewed to ensure it is optimally constructed on a risk/reward basis. Portfolio managers have the final say on construction of the Fund and a collegial relationship exists between the risk management team and the Fund teams.
Our sell discipline is just as important as our buy decision and is based on the same principles: relative value and fundamentals. While no sale is automatic, a security is typically sold if it meets one or more of the following criteria:
| n | | If we believe the target price has been realized, and if we no longer consider the company undervalued. |
| |
| n | | If we determine that a better value opportunity can be found elsewhere. |
| |
| n | | If our research shows that a company is experiencing deteriorating fundamentals beyond what we feel to be a tolerable level and the trend is likely to be a long term issue. |
Market conditions and your Fund
Equity markets were volatile during 2011, and the broad market, as measured by the S&P 500 Index, posted only a small gain. In the first quarter, most major indexes performed very well,
Portfolio Composition
By sector
| | | | | |
|
| Financials | | | 32.8 | % |
| |
| Consumer Discretionary | | | 21.1 | |
| |
| Energy | | | 14.1 | |
| |
| Consumer Staples | | | 9.6 | |
| |
| Information Technology | | | 7.6 | |
| |
| Health Care | | | 6.7 | |
| |
| Industrials | | | 3.5 | |
| |
| Telecommunication Services | | | 2.2 | |
| |
| Materials | | | 1.2 | |
| |
Money Market Funds Plus Other Assets Less Liabilities | | | 1.2 | |
Top 10 Equity Holdings*
| | | | | | | | | |
|
| | 1. | | | Chubb Corp. (The) | | | 6.3 | % |
| |
| | 2. | | | Omnicom Group Inc. | | | 5.7 | |
| |
| | 3. | | | Royal Dutch Shell PLC-ADR | | | 4.8 | |
| |
| | 4. | | | Chevron Corp. | | | 4.3 | |
| |
| | 5. | | | Time Warner Cable Inc. | | | 4.1 | |
| |
| | 6. | | | JPMorgan Chase & Co. | | | 3.8 | |
| |
| | 7. | | | Macy’s, Inc. | | | 3.7 | |
| |
| | 8. | | | Molson Coors Brewing Co.-Class B | | | 3.7 | |
| |
| | 9. | | | Procter & Gamble Co. (The) | | | 3.0 | |
| |
| | 10. | | | Wells Fargo & Co. | | | 3.0 | |
Top Five Industries
| | | | | | | | | |
|
| | 1. | | | Property & Casualty Insurance | | | 15.0 | % |
| |
| | 2. | | | Integrated Oil & Gas | | | 13.1 | |
| |
| | 3. | | | Other Diversified Financial Services | | | 6.5 | |
| |
| | 4. | | | Cable & Satellite | | | 6.3 | |
| |
| | 5. | | | Diversified Banks | | | 5.9 | |
| | | | |
|
| Total Net Assets | | $239.2 million | |
| | | | | |
| Total Number of Holdings* | | | 41 | |
The Fund’s holdings are subject to change, and there is no assurance that the Fund will continue to hold any particular security.
| | |
| * | | Excluding money market fund holdings. |
Invesco V.I. Basic Value Fund
fueled by the second round of “quantitative easing” from the U.S. Federal Reserve. However, with the spring came increased volatility and significant macroeconomic distortions due to civil unrest in Egypt and Libya, flooding in Australia and a devastating earthquake and tsunami in Japan. Corporate earnings remained strong with largely positive surprises, but were often overshadowed by investor concerns about continued high unemployment and soft housing data.
Although markets stabilized and were generally in positive territory through the summer, major equity indexes sold off precipitously in August as the U.S. government struggled to raise the nation’s debt ceiling. Despite an eventual agreement between the White House and Congress, credit rating agency Standard & Poor’s announced the first-ever downgrade of long-term U.S. government debt. Uncertainty created by the downgrade, combined with worries over the sovereign debt crisis in the eurozone, caused fears of a global recession. Despite signs of sustained but muted growth, these macroeconomic factors continued to weigh on markets through the end of the reporting period. Sector performance within the S&P 500 Index was mixed during the year, with the utilities sector leading and the financials sector lagging.
In this environment, the Fund underperformed the Russell 1000 Value Index. The Fund’s lack of exposure to utilities detracted the most from its relative performance given that this was the best performing sector within the index during the year. We did not find attractive investment opportunities in utilities stocks based on those stocks’ elevated valuations. Indeed, only once in the last 40 years have electric utilities been as expensive as they were, as of the close of the reporting period, relative to the S&P 500 Index.1
The Fund’s overweight exposure to the financials sector, the worst performing market sector for the year, also detracted from Fund performance versus the Russell 1000 Value Index. More specifically, fears of an economic slowdown and European sovereign debt uncertainties weighed heavily on Fund holdings Bank of America, JP Morgan Chase and Morgan Stanley.
Unlike many other financials, several of the Fund’s property and casualty insurance holdings posted gains. Indeed, Chubb was one of the largest contributors to the Fund’s performance. Chubb’s attractive franchises, good capital management and favorable valuation – combined with possible early signs of
insurance pricing improvement off of trough levels – led to positive performance.
An overweight position in consumer discretionary stocks and good stock selection in the energy sector contributed to the Fund’s performance versus its style-specific benchmark. Consumer discretionary holding Macy’s helped drive performance as the company improved its operations through localization and enhanced employee training, combined with a high level of free cash flow and an inexpensive valuation. Chevron performed well as the energy company generated some of the industry’s highest returns on capital, combined with an attractive valuation and favorable oil prices.
Pfizer benefited from good results from a new anti-stroke medicine, Eliquis, and from its announcement that it is considering selling some of its more valuable businesses, such as animal health and consumer. UnitedHealth Group benefited from lower medical utilization as consumers with increasingly higher deductibles become more thoughtful about their health care spending.
We believe that market volatility over the reporting period created opportunities to invest in companies with attractive valuations. Our contrarian philosophy and deep value approach of buying companies that we consider extremely undervalued capitalizes on market volatility and periods of down markets as value is created for new investment opportunities.
Markets experienced increased volatility during the reporting period. We would like to caution investors against making investment decisions based on short-term performance.
Thank you for your investment in Invesco V.I. Basic Value Fund and for sharing our long-term investment horizon.
| | |
| 1 | | Source: Empirical Research Partners |
The views and opinions expressed in management’s discussion of Fund performance are those of Invesco Advisers, Inc. These views and opinions are subject to change at any time based on factors such as market and economic conditions. These views and opinions may not be relied upon as investment advice or recommendations, or as an offer for a particular security. The information is not a complete analysis of every aspect of any market, country, industry, security or the Fund. Statements of fact are from sources considered reliable, but Invesco Advisers, Inc. makes no representation or warranty as to their completeness or accuracy. Although historical performance is no guarantee of future results, these insights may help you understand our investment management philosophy.
See important Fund and, if applicable, index disclosures later in this report.
Jason Leder
Chartered Financial Analyst, portfolio manager, is lead manager of Invesco V.I. Basic Value Fund. He joined Invesco in 2010. Mr. Leder earned a B.A. from The University of Texas and an M.B.A. from Columbia University.
Devin Armstrong
Chartered Financial Analyst, portfolio manager, is manager of Invesco V.I. Basic Value Fund. He joined Invesco in 2010. Mr. Armstrong earned a B.S. in psychology and finance from the University of Illinois and an M.B.A. in finance from Columbia University.
Kevin Holt
Chartered Financial Analyst, portfolio manager, is manager of Invesco V.I. Basic Value Fund. He joined Invesco in 2010. Mr. Holt earned a B.A. from the University of Iowa and an M.B.A. from the University of Chicago.
Yogi Kak
Chartered Financial Analyst, portfolio manager, is manager of Invesco V.I. Basic Value Fund. He joined Invesco in 2011. Mr. Kak earned a bachelor of technology degree in electrical engineering from the Institute of Technology, Banares Hindu University. He also earned an M.B.A. from Tulane University.
Matthew Seinsheimer
Chartered Financial Analyst, portfolio manager, is manager of Invesco V.I. Basic Value Fund. He joined Invesco in 1992. Mr. Seinsheimer earned a B.B.A. from Southern Methodist University and an M.B.A. from The University of Texas at Austin.
James Warwick
Portfolio manager, is manager of Invesco V.I. Basic Value Fund. He joined Invesco in 2010. Mr. Warwick earned a B.B.A. from Stephen F. Austin State University and an M.B.A. from the University of Houston.
Invesco V.I. Basic Value Fund
Your Fund’s Long-Term Performance
Results of a $10,000 Investment
Fund and index data from 12/31/01*
| | |
| 1 | | Source: Lipper Inc. |
| |
| * | | During the reporting period, Invesco changed its policy regarding growth of $10,000 charts. For funds older than 10 years, we previously showed performance since inception. Going forward, we will show performance for the most recent 10 years, since this more accurately reflects the experience of the typical shareholder. As a result, charts now may include benchmarks that did not appear previously, because the funds’ inception pre-dated the benchmarks’ inception. Also, all charts will now be presented using a linear format. |
Past performance cannot guarantee comparable future results.
Average Annual Total Returns
As of 12/31/11
| | | | | | | | | |
|
| Series I Shares |
| |
| Inception (9/10/01) | | | 0.67 | % |
| |
| | 10 | | | Years | | | 0.43 | |
| |
| | 5 | | | Years | | | -5.48 | |
| |
| | 1 | | | Year | | | -3.05 | |
| | | | | | | | | |
| Series II Shares |
| |
| Inception (9/10/01) | | | 0.41 | % |
| |
| | 10 | | | Years | | | 0.17 | |
| |
| | 5 | | | Years | | | -5.74 | |
| |
| | 1 | | | Year | | | -3.39 | |
The performance of the Fund’s Series I and Series II share classes will differ primarily due to different class expenses.
The performance data quoted represent past performance and cannot guarantee comparable future results; current performance may be lower or higher. Please contact your variable product issuer or financial adviser for
the most recent month-end variable product performance. Performance figures reflect Fund expenses, reinvested distributions and changes in net asset value. Investment return and principal value will fluctuate so that you may have a gain or loss when you sell shares.
The total annual Fund operating expense ratio set forth in the most recent Fund prospectus as of the date of this report for Series I and Series II shares was 1.00% and 1.25%, respectively. The expense ratios presented above may vary from the expense ratios presented in other sections of this report that are based on expenses incurred during the period covered by this report.
Invesco V.I. Basic Value Fund, a series portfolio of AIM Variable Insurance Funds (Invesco Variable Insurance Funds), is currently offered through insurance companies issuing
variable products. You cannot purchase shares of the Fund directly. Performance figures given represent the Fund and are not intended to reflect actual variable product values. They do not reflect sales charges, expenses and fees assessed in connection with a variable product. Sales charges, expenses and fees, which are determined by the variable product issuers, will vary and will lower the total return.
The most recent month-end performance data at the Fund level, excluding variable product charges, is available at 800 451 4246. As mentioned above, for the most recent month-end performance including variable product charges, please contact your variable product issuer or financial adviser.
Invesco V.I. Basic Value Fund
Invesco V.I. Basic Value Fund’s investment objective is long-term growth of capital.
| n | | Unless otherwise stated, information presented in this report is as of December 31, 2011, and is based on total net assets. |
| |
| n | | Unless otherwise noted, all data provided by Invesco. |
| |
| n | | To access your Fund’s reports/prospectus, visit invesco.com/fundreports. |
Principal risks of investing in the Fund
Developing markets securities risk. Securities issued by foreign companies and governments located in developing countries may be affected more negatively by inflation, devaluation of their currencies, higher transaction costs, delays in settlement, adverse political developments, the introduction of capital controls, withholding taxes, nationalization of private assets, expropriation, social unrest, war or lack of timely information than those in developed countries.
Foreign securities risk. The Fund’s foreign investments may be affected by changes in a foreign country’s exchange rates; political and social instability; changes in economic or taxation policies; difficulties when enforcing obligations; decreased liquidity; and increased volatility. Foreign companies may be subject to less regulation resulting in less publicly available information about the companies.
Management risk. The investment techniques and risk analysis used by the Fund’s portfolio managers may not produce the desired results.
Market risk. The prices of and the income generated by the Fund’s securities may decline in response to, among other things, investor sentiment; general economic and market conditions; regional or global instability; and currency and interest rate fluctuations.
Value investing style risk. The Fund emphasizes a value style of investing, which focuses on undervalued companies with characteristics for improved valuations. This style of investing is subject to the risk that the valuations never improve or that the returns on value equity securities are less than returns on other styles of investing or the overall stock market. Value stocks also may decline in price, even though in theory they are already underpriced.
About indexes used in this report
The S&P 500® Index is an unmanaged index considered representative of the U.S. stock market.
The Russell 1000® Value Index is an unmanaged index considered representative of large-cap value stocks. The Russell 1000 Value Index is a trademark/service market of the Frank Russell Co. Russell® is a trademark of the Frank Russell Co.
The Lipper VUF Large-Cap Value Funds Index is an unmanaged index considered representative of large-cap value variable insurance underlying funds tracked by Lipper.
The Fund is not managed to track the performance of any particular index, including the index(es) defined here, and consequently, the performance of the Fund may deviate significantly from the performance of the index(es).
A direct investment cannot be made in an index. Unless otherwise indicated, index results include reinvested dividends, and they do not reflect sales charges. Performance of the peer group, if applicable, reflects fund expenses; performance of a market index does not.
Other information
The Chartered Financial Analyst® (CFA®) designation is globally recognized and attests to a charterholder’s success in a rigorous and comprehensive study program in the field of investment management and research analysis.
Industry classifications used in this report are generally according to the Global Industry Classification Standard, which was developed by and is the exclusive property and a service mark of MSCI Inc. and Standard & Poor’s.
The returns shown in management’s discussion of Fund performance are based on net asset values calculated for shareholder transactions. Generally accepted accounting principles require adjustments to be made to the net assets of the Fund at period end for financial reporting purposes, and as such, the net asset values for shareholder transactions and the returns based on those net asset values may differ from the net asset values and returns reported in the Financial Highlights. Additionally, the returns and net asset values shown throughout this report are at the Fund level only and do not include variable product issuer charges. If such charges were included, the total returns would be lower.
Invesco V.I. Basic Value Fund
Schedule of Investments
December 31, 2011
| | | | | | | | | |
| | | Shares | | Value |
| |
Common Stocks & Other Equity Interests–98.82%(a)
| | | | |
Advertising–5.67%
| | | | |
| Omnicom Group Inc. | | | 304,212 | | | $ | 13,561,771 | |
| |
Aerospace & Defense–1.78%
| | | | |
| Honeywell International Inc. | | | 78,459 | | | | 4,264,247 | |
| |
Asset Management & Custody Banks–1.62%
| | | | |
| Bank of New York Mellon Corp. (The) | | | 194,348 | | | | 3,869,469 | |
| |
Automobile Manufacturers–1.63%
| | | | |
| Renault S.A. (France) | | | 113,229 | | | | 3,902,952 | |
| |
Brewers–3.71%
| | | | |
| Molson Coors Brewing Co.–Class B | | | 203,856 | | | | 8,875,890 | |
| |
Cable & Satellite–6.25%
| | | | |
| Comcast Corp.–Class A | | | 213,948 | | | | 5,072,707 | |
| |
| Time Warner Cable Inc. | | | 155,321 | | | | 9,873,756 | |
| |
| | | | | | | | 14,946,463 | |
| |
Computer Hardware–5.92%
| | | | |
Apple Inc.(b) | | | 13,615 | | | | 5,514,075 | |
| |
Dell Inc.(b) | | | 204,112 | | | | 2,986,159 | |
| |
| Hewlett-Packard Co. | | | 219,277 | | | | 5,648,575 | |
| |
| | | | | | | | 14,148,809 | |
| |
Data Processing & Outsourced Services–1.68%
| | | | |
| Western Union Co. | | | 219,508 | | | | 4,008,216 | |
| |
Department Stores–3.74%
| | | | |
| Macy’s, Inc. | | | 278,340 | | | | 8,956,981 | |
| |
Diversified Banks–5.92%
| | | | |
| Comerica Inc. | | | 95,460 | | | | 2,462,868 | |
| |
| U.S. Bancorp | | | 171,122 | | | | 4,628,850 | |
| |
Wells Fargo & Co.(b) | | | 256,461 | | | | 7,068,065 | |
| |
| | | | | | | | 14,159,783 | |
| |
General Merchandise Stores–2.08%
| | | | |
| Target Corp. | | | 97,337 | | | | 4,985,601 | |
| |
Homebuilding–1.76%
| | | | |
| Ryland Group, Inc. (The) | | | 267,108 | | | | 4,209,622 | |
| |
Household Products–3.03%
| | | | |
| Procter & Gamble Co. (The) | | | 108,642 | | | | 7,247,508 | |
| |
Hypermarkets & Super Centers–2.81%
| | | | |
| Wal-Mart Stores, Inc. | | | 112,449 | | | | 6,719,952 | |
| |
Industrial Conglomerates–1.71%
| | | | |
| General Electric Co. | | | 228,400 | | | | 4,090,644 | |
| |
Integrated Oil & Gas–13.10%
| | | | |
| Chevron Corp. | | | 97,255 | | | | 10,347,931 | |
| |
| Exxon Mobil Corp. | | | 62,980 | | | | 5,338,185 | |
| |
| Petroleo Brasileiro S.A.–ADR (Brazil) | | | 169,757 | | | | 4,218,462 | |
| |
| Royal Dutch Shell PLC–ADR (United Kingdom) | | | 156,470 | | | | 11,436,392 | |
| |
| | | | | | | | 31,340,970 | |
| |
Investment Banking & Brokerage–2.24%
| | | | |
| Goldman Sachs Group, Inc. (The) | | | 25,519 | | | | 2,307,683 | |
| |
| Morgan Stanley | | | 201,990 | | | | 3,056,109 | |
| |
| | | | | | | | 5,363,792 | |
| |
Life & Health Insurance–1.47%
| | | | |
| MetLife, Inc. | | | 112,685 | | | | 3,513,518 | |
| |
Managed Health Care–2.16%
| | | | |
| UnitedHealth Group Inc. | | | 101,986 | | | | 5,168,651 | |
| |
Oil & Gas Drilling–1.02%
| | | | |
Noble Corp.(b) | | | 80,647 | | | | 2,437,152 | |
| |
Other Diversified Financial Services–6.53%
| | | | |
| Bank of America Corp. | | | 438,012 | | | | 2,435,347 | |
| |
| Citigroup Inc. | | | 153,209 | | | | 4,030,929 | |
| |
| JPMorgan Chase & Co. | | | 275,108 | | | | 9,147,341 | |
| |
| | | | | | | | 15,613,617 | |
| |
Pharmaceuticals–4.54%
| | | | |
| Bristol-Myers Squibb Co. | | | 108,909 | | | | 3,837,953 | |
| |
| Pfizer Inc. | | | 323,941 | �� | | | 7,010,083 | |
| |
| | | | | | | | 10,848,036 | |
| |
Property & Casualty Insurance–15.01%
| | | | |
Allied World Assurance Co. Holdings AG (Switzerland)(b) | | | 72,171 | | | | 4,541,721 | |
| |
| Allstate Corp. (The) | | | 193,315 | | | | 5,298,764 | |
| |
| Aspen Insurance Holdings Ltd. | | | 248,571 | | | | 6,587,132 | |
| |
| Chubb Corp. (The) | | | 216,718 | | | | 15,001,220 | |
| |
| Travelers Cos., Inc. (The) | | | 75,388 | | | | 4,460,708 | |
| |
| | | | | | | | 35,889,545 | |
| |
Steel–1.22%
| | | | |
| POSCO–ADR (South Korea) | | | 35,542 | | | | 2,917,998 | |
| |
Wireless Telecommunication Services–2.22%
| | | | |
| Vodafone Group PLC–ADR (United Kingdom) | | | 189,629 | | | | 5,315,301 | |
| |
| Total Common Stocks & Other Equity Interests (Cost $210,982,736) | | | | | | | 236,356,488 | |
| |
| | | | | | | | | |
| | | | | | | | | |
See accompanying Notes to Financial Statements which are an integral part of the financial statements.
Invesco V.I. Basic Value Fund
| | | | | | | | | |
| | | Shares | | Value |
| |
Money Market Funds–1.20%
| | | | |
Liquid Assets Portfolio–Institutional Class(c) | | | 1,431,733 | | | $ | 1,431,733 | |
| |
Premier Portfolio–Institutional Class(c) | | | 1,431,733 | | | | 1,431,733 | |
| |
| Total Money Market Funds (Cost $2,863,466) | | | | | | | 2,863,466 | |
| |
| TOTAL INVESTMENTS–100.02% (Cost $213,846,202) | | | | | | | 239,219,954 | |
| |
| OTHER ASSETS LESS LIABILITIES–(0.02)% | | | | | | | (37,855 | ) |
| |
| NET ASSETS–100.00% | | | | | | $ | 239,182,099 | |
| |
Investment Abbreviations:
| | | |
| ADR | | – American Depositary Receipt |
Notes to Schedule of Investments:
| | |
| (a) | | Industry and/or sector classifications used in this report are generally according to the Global Industry Classification Standard, which was developed by and is the exclusive property and a service mark of MSCI Inc. and Standard & Poor’s. |
| (b) | | Non-income producing security. |
| (c) | | The money market fund and the Fund are affiliated by having the same investment adviser. |
See accompanying Notes to Financial Statements which are an integral part of the financial statements.
Invesco V.I. Basic Value Fund
Statement of Assets and Liabilities
December 31, 2011
| | | | | |
Assets:
|
| Investments, at value (Cost $210,982,736) | | $ | 236,356,488 | |
| |
| Investments in affiliated money market funds, at value and cost | | | 2,863,466 | |
| |
| Total investments, at value (Cost $213,846,202) | | | 239,219,954 | |
| |
| Receivable for: | | | | |
| Fund shares sold | | | 65,383 | |
| |
| Dividends | | | 648,247 | |
| |
| Investment for trustee deferred compensation and retirement plans | | | 28,008 | |
| |
| Total assets | | | 239,961,592 | |
| |
Liabilities:
|
| Payable for: | | | | |
| Fund shares reacquired | | | 444,643 | |
| |
| Accrued fees to affiliates | | | 210,809 | |
| |
| Accrued other operating expenses | | | 32,304 | |
| |
| Trustee deferred compensation and retirement plans | | | 91,737 | |
| |
| Total liabilities | | | 779,493 | |
| |
| Net assets applicable to shares outstanding | | $ | 239,182,099 | |
| |
Net assets consist of:
|
| Shares of beneficial interest | | $ | 281,117,108 | |
| |
| Undistributed net investment income | | | 3,119,843 | |
| |
| Undistributed net realized gain (loss) | | | (70,428,604 | ) |
| |
| Unrealized appreciation | | | 25,373,752 | |
| |
| | | $ | 239,182,099 | |
| |
Net Assets:
|
| Series I | | $ | 135,644,325 | |
| |
| Series II | | $ | 103,537,774 | |
| |
Shares outstanding, $0.001 par value per share, with an unlimited number of shares authorized:
|
| Series I | | | 22,177,087 | |
| |
| Series II | | | 17,016,633 | |
| |
| Series I: | | | | |
| Net asset value per share | | $ | 6.12 | |
| |
| Series II: | | | | |
| Net asset value per share | | $ | 6.08 | |
| |
Statement of Operations
For the year ended December 31, 2011
| | | | | |
Investment income:
|
| Dividends (net of foreign withholding taxes of $134,866) | | $ | 6,241,973 | |
| |
| Dividends from affiliated money market funds | | | 7,686 | |
| |
| Total investment income | | | 6,249,659 | |
| |
Expenses:
|
| Advisory fees | | | 1,902,600 | |
| |
| Administrative services fees | | | 727,733 | |
| |
| Custodian fees | | | 6,741 | |
| |
| Distribution fees — Series II | | | 290,544 | |
| |
| Transfer agent fees | | | 30,300 | |
| |
| Trustees’ and officers’ fees and benefits | | | 28,836 | |
| |
| Other | | | 47,953 | |
| |
| Total expenses | | | 3,034,707 | |
| |
| Less: Fees waived | | | (10,843 | ) |
| |
| Net expenses | | | 3,023,864 | |
| |
| Net investment income | | | 3,225,795 | |
| |
Realized and unrealized gain (loss) from:
|
| Net realized gain (loss) from: | | | | |
| Investment securities (includes net gains from securities sold to affiliates of $520,464) | | | 13,181,581 | |
| |
| Foreign currencies | | | (1,509 | ) |
| |
| | | | 13,180,072 | |
| |
| Change in net unrealized appreciation (depreciation) of investment securities | | | (23,850,063 | ) |
| |
| Net realized and unrealized gain (loss) | | | (10,669,991 | ) |
| |
| Net increase (decrease) in net assets resulting from operations | | $ | (7,444,196 | ) |
| |
See accompanying Notes to Financial Statements which are an integral part of the financial statements.
Invesco V.I. Basic Value Fund
Statement of Changes in Net Assets
For the years ended December 31, 2011 and 2010
| | | | | | | | | |
| | | 2011 | | 2010 |
| |
Operations:
| | | | |
| Net investment income | | $ | 3,225,795 | | | $ | 1,797,336 | |
| |
| Net realized gain | | | 13,180,072 | | | | 1,972,585 | |
| |
| Change in net unrealized appreciation (depreciation) | | | (23,850,063 | ) | | | 17,975,887 | |
| |
| Net increase (decrease) in net assets resulting from operations | | | (7,444,196 | ) | | | 21,745,808 | |
| |
Distributions to shareholders from net investment income:
| | | | |
| Series I | | | (1,326,452 | ) | | | (1,104,262 | ) |
| |
| Series II | | | (702,510 | ) | | | (467,104 | ) |
| |
| Total distributions from net investment income | | | (2,028,962 | ) | | | (1,571,366 | ) |
| |
Share transactions–net:
| | | | |
| Series I | | | (40,031,379 | ) | | | (56,488,740 | ) |
| |
| Series II | | | (25,126,460 | ) | | | (10,025,853 | ) |
| |
| Net increase (decrease) in net assets resulting from share transactions | | | (65,157,839 | ) | | | (66,514,593 | ) |
| |
| Net increase (decrease) in net assets | | | (74,630,997 | ) | | | (46,340,151 | ) |
| |
Net assets:
| | | | |
| Beginning of year | | | 313,813,096 | | | | 360,153,247 | |
| |
| End of year (includes undistributed net investment income of $3,119,843 and $1,919,672, respectively) | | $ | 239,182,099 | | | $ | 313,813,096 | |
| |
Notes to Financial Statements
December 31, 2011
NOTE 1—Significant Accounting Policies
Invesco V.I. Basic Value Fund (the “Fund”) is a series portfolio of AIM Variable Insurance Funds (Invesco Variable Insurance Funds) (the “Trust”). The Trust is a Delaware statutory trust registered under the Investment Company Act of 1940, as amended (the “1940 Act”), as an open-end series management investment company consisting of twenty-eight separate portfolios, (each constituting a “Fund”). The assets, liabilities and operations of each portfolio are accounted for separately. Information presented in these financial statements pertains only to the Fund. Matters affecting each Fund or class will be voted on exclusively by the shareholders of such Fund or class. Current Securities and Exchange Commission (“SEC”) guidance, however, requires participating insurance companies offering separate accounts to vote shares proportionally in accordance with the instructions of the contract owners whose investments are funded by shares of each Fund or class.
The Fund’s investment objective is long-term growth of capital.
The Fund currently offers two classes of shares, Series I and Series II, both of which are offered to insurance company separate accounts funding variable annuity contracts and variable life insurance policies (“variable products”).
The following is a summary of the significant accounting policies followed by the Fund in the preparation of its financial statements.
| | |
| A. | | Security Valuations — Securities, including restricted securities, are valued according to the following policy. |
| | A security listed or traded on an exchange (except convertible bonds) is valued at its last sales price or official closing price as of the close of the customary trading session on the exchange where the security is principally traded, or lacking any sales or official closing price on a particular day, the security may be valued at the closing bid price on that day. Securities traded in the over-the-counter market are valued based on prices furnished by independent pricing services or market makers. When such securities are valued by an independent pricing service they may be considered fair valued. Futures contracts are valued at the final settlement price set by an exchange on which they are principally traded. Listed options are valued at the mean between the last bid and ask prices from the exchange on which they are principally traded. Options not listed on an exchange are valued by an independent source at the mean between the last bid and ask prices. For purposes of determining net asset value per share, futures and option contracts generally are valued 15 minutes after the close of the customary trading session of the New York Stock Exchange (“NYSE”). |
| | Investments in open-end and closed-end registered investment companies that do not trade on an exchange are valued at the end of day net asset value per share. Investments in open-end and closed-end registered investment companies that trade on an exchange are valued at the last sales price or official closing price as of the close of the customary trading session on the exchange where the security is principally traded. |
| | Debt obligations (including convertible bonds) and unlisted equities are fair valued using an evaluated quote provided by an independent pricing service. Evaluated quotes provided by the pricing service may be determined without exclusive reliance on quoted prices, and may reflect appropriate factors such as |
Invesco V.I. Basic Value Fund
| | |
| | institution-size trading in similar groups of securities, developments related to specific securities, dividend rate, yield, quality, type of issue, coupon rate, maturity, individual trading characteristics and other market data. Debt securities are subject to interest rate and credit risks. In addition, all debt securities involve some risk of default with respect to interest and/or principal payments. |
| | Foreign securities (including foreign exchange contracts) are converted into U.S. dollar amounts using the applicable exchange rates as of the close of the NYSE. If market quotations are available and reliable for foreign exchange traded equity securities, the securities will be valued at the market quotations. Because trading hours for certain foreign securities end before the close of the NYSE, closing market quotations may become unreliable. If between the time trading ends on a particular security and the close of the customary trading session on the NYSE, events occur that are significant and make the closing price unreliable, the Fund may fair value the security. If the event is likely to have affected the closing price of the security, the security will be valued at fair value in good faith using procedures approved by the Board of Trustees. Adjustments to closing prices to reflect fair value may also be based on a screening process of an independent pricing service to indicate the degree of certainty, based on historical data, that the closing price in the principal market where a foreign security trade is not the current value as of the close of the NYSE. Foreign securities meeting the approved degree of certainty that the price is not reflective of current value will be priced at the indication of fair value from the independent pricing service. Multiple factors may be considered by the independent pricing service in determining adjustments to reflect fair value and may include information relating to sector indices, American Depositary Receipts and domestic and foreign index futures. Foreign securities may have additional risks including exchange rate changes, potential for sharply devalued currencies and high inflation, political and economic upheaval, the relative lack of issuer information, relatively low market liquidity and the potential lack of strict financial and accounting controls and standards. |
| | Securities for which market prices are not provided by any of the above methods may be valued based upon quotes furnished by independent sources. The last bid price may be used to value equity securities. The mean between the last bid and asked prices is used to value debt obligations, including Corporate Loans. |
| | Securities for which market quotations are not readily available or are unreliable are valued at fair value as determined in good faith by or under the supervision of the Trust’s officers following procedures approved by the Board of Trustees. Issuer specific events, market trends, bid/ask quotes of brokers and information providers and other market data may be reviewed in the course of making a good faith determination of a security’s fair value. |
| | Valuations change in response to many factors including the historical and prospective earnings of the issuer, the value of the issuer’s assets, general economic conditions, interest rates, investor perceptions and market liquidity. Because of the inherent uncertainties of valuation, the values reflected in the financial statements may materially differ from the value received upon actual sale of those investments. |
| B. | | Securities Transactions and Investment Income — Securities transactions are accounted for on a trade date basis. Realized gains or losses on sales are computed on the basis of specific identification of the securities sold. Interest income is recorded on the accrual basis from settlement date. Dividend income (net of withholding tax, if any) is recorded on the ex-dividend date. |
| | The Fund may periodically participate in litigation related to Fund investments. As such, the Fund may receive proceeds from litigation settlements. Any proceeds received are included in the Statement of Operations as realized gain (loss) for investments no longer held and as unrealized gain (loss) for investments still held. |
| | Brokerage commissions and mark ups are considered transaction costs and are recorded as an increase to the cost basis of securities purchased and/or a reduction of proceeds on a sale of securities. Such transaction costs are included in the determination of net realized and unrealized gain (loss) from investment securities reported in the Statement of Operations and the Statement of Changes in Net Assets and the net realized and unrealized gains (losses) on securities per share in the Financial Highlights. Transaction costs are included in the calculation of the Fund’s net asset value and, accordingly, they reduce the Fund’s total returns. These transaction costs are not considered operating expenses and are not reflected in net investment income reported in the Statement of Operations and Statement of Changes in Net Assets, or the net investment income per share and ratios of expenses and net investment income reported in the Financial Highlights, nor are they limited by any expense limitation arrangements between the Fund and the investment adviser. |
| | The Fund allocates income and realized and unrealized capital gains and losses to a class based on the relative net assets of each class. |
| C. | | Country Determination — For the purposes of making investment selection decisions and presentation in the Schedule of Investments, the investment adviser may determine the country in which an issuer is located and/or credit risk exposure based on various factors. These factors include the laws of the country under which the issuer is organized, where the issuer maintains a principal office, the country in which the issuer derives 50% or more of its total revenues and the country that has the primary market for the issuer’s securities, as well as other criteria. Among the other criteria that may be evaluated for making this determination are the country in which the issuer maintains 50% or more of its assets, the type of security, financial guarantees and enhancements, the nature of the collateral and the sponsor organization. Country of issuer and/or credit risk exposure has been determined to be the United States of America, unless otherwise noted. |
| D. | | Distributions — Distributions from income and net realized capital gain, if any, are generally paid to separate accounts of participating insurance companies annually and recorded on ex-dividend date. |
| E. | | Federal Income Taxes — The Fund intends to comply with the requirements of Subchapter M of the Internal Revenue Code necessary to qualify as a regulated investment company and to distribute substantially all of the Fund’s taxable earnings to shareholders. As such, the Fund will not be subject to federal income taxes on otherwise taxable income (including net realized capital gain) that is distributed to shareholders. Therefore, no provision for federal income taxes is recorded in the financial statements. |
| | The Fund files tax returns in the U.S. Federal jurisdiction and certain other jurisdictions. Generally, the Fund is subject to examinations by such taxing authorities for up to three years after the filing of the return for the tax period. |
| F. | | Expenses — Fees provided for under the Rule 12b-1 plan of a particular class of the Fund and which are directly attributable to that class are charged to the operations of such class. All other expenses are allocated among the classes based on relative net assets. |
| G. | | Accounting Estimates — The preparation of financial statements in conformity with accounting principles generally accepted in the United States of America (“GAAP”) requires management to make estimates and assumptions that affect the reported amounts of assets and liabilities at the date of the financial statements and the reported amounts of revenues and expenses during the reporting period including estimates and assumptions related to |
Invesco V.I. Basic Value Fund
| | |
| | taxation. Actual results could differ from those estimates by a significant amount. In addition, the Fund monitors for material events or transactions that may occur or become known after the period-end date and before the date the financial statements are released to print. |
| H. | | Indemnifications — Under the Trust’s organizational documents, each Trustee, officer, employee or other agent of the Trust is indemnified against certain liabilities that may arise out of performance of their duties to the Fund. Additionally, in the normal course of business, the Fund enters into contracts, including the Fund’s servicing agreements that contain a variety of indemnification clauses. The Fund’s maximum exposure under these arrangements is unknown as this would involve future claims that may be made against the Fund that have not yet occurred. The risk of material loss as a result of such indemnification claims is considered remote. |
| I. | | Foreign Currency Translations — Foreign currency is valued at the close of the NYSE based on quotations posted by banks and major currency dealers. Portfolio securities and other assets and liabilities denominated in foreign currencies are translated into U.S. dollar amounts at date of valuation. Purchases and sales of portfolio securities (net of foreign taxes withheld on disposition) and income items denominated in foreign currencies are translated into U.S. dollar amounts on the respective dates of such transactions. The Fund does not separately account for the portion of the results of operations resulting from changes in foreign exchange rates on investments and the fluctuations arising from changes in market prices of securities held. The combined results of changes in foreign exchange rates and the fluctuation of market prices on investments (net of estimated foreign tax withholding) are included with the net realized and unrealized gain or loss from investments in the Statement of Operations. Reported net realized foreign currency gains or losses arise from (1) sales of foreign currencies, (2) currency gains or losses realized between the trade and settlement dates on securities transactions, and (3) the difference between the amounts of dividends, interest, and foreign withholding taxes recorded on the Fund’s books and the U.S. dollar equivalent of the amounts actually received or paid. Net unrealized foreign currency gains and losses arise from changes in the fair values of assets and liabilities, other than investments in securities at fiscal period end, resulting from changes in exchange rates. |
| | The Fund may invest in foreign securities which may be subject to foreign taxes on income, gains on investments or currency repatriation, a portion of which may be recoverable. |
| J. | | Foreign Currency Contracts — The Fund may enter into foreign currency contracts to manage or minimize currency or exchange rate risk. The Fund may also enter into foreign currency contracts for the purchase or sale of a security denominated in a foreign currency in order to “lock in” the U.S. dollar price of that security. A foreign currency contract is an obligation to purchase or sell a specific currency for an agreed-upon price at a future date. The use of foreign currency contracts does not eliminate fluctuations in the price of the underlying securities the Fund owns or intends to acquire but establishes a rate of exchange in advance. Fluctuations in the value of these contracts are measured by the difference in the contract date and reporting date exchange rates and are recorded as unrealized appreciation (depreciation) until the contracts are closed. When the contracts are closed, realized gains (losses) are recorded. Realized and unrealized gains (losses) on the contracts are included in the Statement of Operations. The primary risks associated with foreign currency contracts include failure of the counterparty to meet the terms of the contract and the value of the foreign currency changing unfavorably. These risks may be in excess of the amounts reflected in the Statement of Assets and Liabilities. |
NOTE 2—Advisory Fees and Other Fees Paid to Affiliates
The Trust has entered into a master investment advisory agreement with Invesco Advisers, Inc. (the “Adviser” or “Invesco”). Under the terms of the investment advisory agreement, the Fund pays an advisory fee to the Adviser based on the annual rate of the Fund’s average daily net assets as follows:
| | | | | |
| Average Daily Net Assets | | Rate |
| |
| First $250 million | | | 0 | .695% |
| |
| Next $250 million | | | 0 | .67% |
| |
| Next $500 million | | | 0 | .645% |
| |
| Next $1.5 billion | | | 0 | .62% |
| |
| Next $2.5 billion | | | 0 | .595% |
| |
| Next $2.5 billion | | | 0 | .57% |
| |
| Next $2.5 billion | | | 0 | .545% |
| |
| Over $10 billion | | | 0 | .52% |
| |
Under the terms of a master sub-advisory agreement between the Adviser and each of Invesco Asset Management Deutschland GmbH, Invesco Asset Management Limited, Invesco Asset Management (Japan) Limited, Invesco Australia Limited, Invesco Hong Kong Limited, Invesco Senior Secured Management, Inc. and Invesco Canada Ltd. (collectively, the “Affiliated Sub-Advisers”) the Adviser, not the Fund, may pay 40% of the fees paid to the Adviser to any such Affiliated Sub-Adviser(s) that provide discretionary investment management services to the Fund based on the percentage of assets allocated to such Sub-Adviser(s).
The Adviser has contractually agreed, through at least April 30, 2013, to waive advisory fees and/or reimburse expenses of all shares to the extent necessary to limit total annual fund operating expenses after fee waiver and/or expense reimbursement (excluding certain items discussed below) of Series I shares to 1.30% and Series II shares to 1.45% of average daily net assets. In determining the Adviser’s obligation to waive advisory fees and/or reimburse expenses, the following expenses are not taken into account, and could cause the total annual fund operating expenses after fee waiver and/or expense reimbursement to exceed the numbers reflected above: (1) interest; (2) taxes; (3) dividend expense on short sales; (4) extraordinary or non-routine items, including litigation expenses; and (5) expenses that the Fund has incurred but did not actually pay because of an expense offset arrangement. Unless the Board of the Trustees and Invesco mutually agree to amend or continue the fee waiver agreement, it will terminate on April 30, 2013. The Adviser did not waive fees and/or reimburse expenses during the period under this expense limitation.
Invesco V.I. Basic Value Fund
Further, the Adviser has contractually agreed, through at least June 30, 2012, to waive the advisory fee payable by the Fund in an amount equal to 100% of the net advisory fees the Adviser receives from the affiliated money market funds on investments by the Fund of uninvested cash in such affiliated money market funds.
For the year ended December 31, 2011, the Adviser waived advisory fees of $10,843.
The Trust has entered into a master administrative services agreement with Invesco pursuant to which the Fund has agreed to pay Invesco a fee for costs incurred in providing accounting services and fund administrative services to the Fund and to reimburse Invesco for administrative services fees paid to insurance companies that have agreed to provide services to the participants of separate accounts. These administrative services provided by the insurance companies may include, among other things: the printing of prospectuses, financial reports and proxy statements and the delivery of the same to existing participants; the maintenance of master accounts; the facilitation of purchases and redemptions requested by the participants; and the servicing of participants’ accounts. Pursuant to such agreement, for the year ended December 31, 2011, Invesco was paid $73,168 for accounting and fund administrative services and reimbursed $654,565 for services provided by insurance companies.
The Trust has entered into a transfer agency and service agreement with Invesco Investment Services, Inc. (“IIS”) pursuant to which the Fund has agreed to pay IIS a fee for providing transfer agency and shareholder services to the Fund and reimburse IIS for certain expenses incurred by IIS in the course of providing such services. For the year ended December 31, 2011, expenses incurred under the agreement are shown in the Statement of Operations as transfer agent fees.
The Trust has entered into a master distribution agreement with Invesco Distributors, Inc. (“IDI”) to serve as the distributor for the Fund. The Trust has adopted a plan pursuant to Rule 12b-1 under the 1940 Act with respect to the Fund’s Series II shares (the “Plan”). The Fund, pursuant to the Plan, pays IDI compensation at the annual rate of 0.25% of the Fund’s average daily net assets of Series II shares. Of the Plan payments, up to 0.25% of the average daily net assets of the Series II shares may be paid to insurance companies who furnish continuing personal shareholder services to customers who purchase and own Series II shares of the Fund. For the year ended December 31, 2011, expenses incurred under the Plan are detailed in the Statement of Operations as distribution fees.
Certain officers and trustees of the Trust are officers and directors of the Adviser, Invesco Ltd., IIS and/or IDI.
NOTE 3—Additional Valuation Information
GAAP defines fair value as the price that would be received to sell an asset or paid to transfer a liability in an orderly transaction between market participants at the measurement date, under current market conditions. GAAP establishes a hierarchy that prioritizes the inputs to valuation methods giving the highest priority to readily available unadjusted quoted prices in an active market for identical assets (Level 1) and the lowest priority to significant unobservable inputs (Level 3) generally when market prices are not readily available or are unreliable. Based on the valuation inputs, the securities or other investments are tiered into one of three levels. Changes in valuation methods may result in transfers in or out of an investment’s assigned level:
| | |
| | Level 1 — | Prices are determined using quoted prices in an active market for identical assets. |
| | Level 2 — | Prices are determined using other significant observable inputs. Observable inputs are inputs that other market participants may use in pricing a security. These may include quoted prices for similar securities, interest rates, prepayment speeds, credit risk, yield curves, loss severities, default rates, discount rates, volatilities and others. |
| | Level 3 — | Prices are determined using significant unobservable inputs. In situations where quoted prices or observable inputs are unavailable (for example, when there is little or no market activity for an investment at the end of the period), unobservable inputs may be used. Unobservable inputs reflect the Fund’s own assumptions about the factors market participants would use in determining fair value of the securities or instruments and would be based on the best available information. |
The following is a summary of the tiered valuation input levels, as of December 31, 2011. The level assigned to the securities valuations may not be an indication of the risk or liquidity associated with investing in those securities. Because of the inherent uncertainties of valuation, the values reflected in the financial statements may materially differ from the value received upon actual sale of those investments.
During the year ended December 31, 2011, there were no significant transfers between investment levels.
| | | | | | | | | | | | | | | | | |
| | | Level 1 | | Level 2 | | Level 3 | | Total |
| |
| Equity Securities | | $ | 235,317,002 | | | $ | 3,902,952 | | | $ | — | | | $ | 239,219,954 | |
| |
NOTE 4—Security Transactions with Affiliated Funds
The Fund is permitted to purchase or sell securities from or to certain other Invesco Funds under specified conditions outlined in procedures adopted by the Board of Trustees of the Trust. The procedures have been designed to ensure that any purchase or sale of securities by the Fund from or to another fund or portfolio that is or could be considered an affiliate by virtue of having a common investment adviser (or affiliated investment advisers), common Trustees and/or common officers complies with Rule 17a-7 of the 1940 Act. Further, as defined under the procedures, each transaction is effected at the current market price. Pursuant to these procedures, for the year ended December 31, 2011, the Fund engaged in securities sales of $1,845,703, which resulted in net realized gain of $520,464.
NOTE 5—Trustees’ and Officers’ Fees and Benefits
“Trustees’ and Officers’ Fees and Benefits” include amounts accrued by the Fund to pay remuneration to certain Trustees and Officers of the Fund. Trustees have the option to defer compensation payable by the Fund, and “Trustees’ and Officers’ Fees and Benefits” also include amounts accrued by the Fund to fund such deferred compensation amounts. Those Trustees who defer compensation have the option to select various Invesco Funds in which their deferral accounts shall be deemed to be invested. Finally, certain current Trustees are eligible to participate in a retirement plan that provides for benefits to be paid upon retirement to
Invesco V.I. Basic Value Fund
Trustees over a period of time based on the number of years of service. The Fund may have certain former Trustees who also participate in a retirement plan and receive benefits under such plan. “Trustees’ and Officers’ Fees and Benefits” include amounts accrued by the Fund to fund such retirement benefits. Obligations under the deferred compensation and retirement plans represent unsecured claims against the general assets of the Fund.
During the year ended December 31, 2011, the Fund paid legal fees of $1,495 for services rendered by Kramer, Levin, Naftalis & Frankel LLP as counsel to the Independent Trustees. A partner of that firm is a Trustee of the Trust.
NOTE 6—Cash Balances
The Fund is permitted to temporarily carry a negative or overdrawn balance in its account with State Street Bank and Trust Company, the custodian bank. To compensate the custodian bank for such overdrafts, the overdrawn Fund may either (1) leave funds as a compensating balance in the account so the custodian bank can be compensated by earning the additional interest; or (2) compensate by paying the custodian bank at a rate agreed upon by the custodian bank and Invesco, not to exceed the contractually agreed upon rate.
NOTE 7—Distributions to Shareholders and Tax Components of Net Assets
Tax Character of Distributions to Shareholders Paid During the Years Ended December 31, 2011 and 2010:
| | | | | | | | | |
| | | 2011 | | 2010 |
| |
| Ordinary income | | $ | 2,028,962 | | | $ | 1,571,366 | |
| |
Tax Components of Net Assets at Period-End:
| | | | | |
| | | 2011 |
| |
| Undistributed ordinary income | | $ | 3,210,688 | |
| |
| Net unrealized appreciation — investments | | | 23,734,411 | |
| |
| Temporary book/tax differences | | | (90,845 | ) |
| |
| Capital loss carryforward | | | (68,789,263 | ) |
| |
| Shares of beneficial interest | | | 281,117,108 | |
| |
| Total net assets | | $ | 239,182,099 | |
| |
The difference between book-basis and tax-basis unrealized appreciation is due to differences in the timing of recognition of gains and losses on investments for tax and book purposes. The Fund’s net unrealized appreciation difference is attributable primarily to wash sales.
The temporary book/tax differences are a result of timing differences between book and tax recognition of income and/or expenses. The Fund’s temporary book/tax differences are the result of the trustee deferral of compensation and retirement plan benefits.
Capital loss carryforward is calculated and reported as of a specific date. Results of transactions and other activity after that date may affect the amount of capital loss carryforward actually available for the Fund to utilize. The Regulated Investment Company Modernization Act of 2010 (the “Act”) eliminated the eight-year carryover period for capital losses that arise in taxable years beginning after its enactment date of December 22, 2010. Consequently, these capital losses can be carried forward for an unlimited period. However, capital losses with an expiration period may not be used to offset capital gains until all net capital losses without an expiration date have been utilized. Additionally, post-enactment capital loss carryovers will retain their character as either short-term or long-term capital losses instead of as short-term capital losses as under prior law. The ability to utilize capital loss carryforward in the future may be limited under the Internal Revenue Code and related regulations based on the results of future transactions.
The Fund utilized $12,040,127 of capital loss carryforward in the current period to offset net realized capital gain for federal income tax purposes. The Fund has a capital loss carryforward as of December 31, 2011, which expires as follows:
| | | | | | | | | | | | | |
| Capital Loss Carryforward* |
| Expiration | | Short-Term | | Long-Term | | Total |
| |
| December 31, 2016 | | $ | 28,504,080 | | | $ | — | | | $ | 28,504,080 | |
| |
| December 31, 2017 | | | 32,409,899 | | | | | | | | 32,409,899 | |
| |
| December 31, 2018 | | | 7,875,284 | | | | | | | | 7,875,284 | |
| |
| | | $ | 68,789,263 | | | $ | — | | | $ | 68,789,263 | |
| |
| |
| * | Capital loss carryforward as of the date listed above is reduced for limitations, if any, to the extent required by the Internal Revenue Code. |
Invesco V.I. Basic Value Fund
NOTE 8—Investment Securities
The aggregate amount of investment securities (other than short-term securities, U.S. Treasury obligations and money market funds, if any) purchased and sold by the Fund during the year ended December 31, 2011 was $41,358,302 and $98,335,592, respectively. Cost of investments on a tax basis includes the adjustments for financial reporting purposes as of the most recently completed Federal income tax reporting period-end.
| | | | | |
| Unrealized Appreciation (Depreciation) of Investment Securities on a Tax Basis |
| |
| Aggregate unrealized appreciation of investment securities | | $ | 44,100,350 | |
| |
| Aggregate unrealized (depreciation) of investment securities | | | (20,365,939 | ) |
| |
| Net unrealized appreciation of investment securities | | $ | 23,734,411 | |
| |
| Cost of investments for tax purposes is $215,485,543. |
NOTE 9—Reclassification of Permanent Differences
Primarily as a result of differing book/tax treatment of foreign currency transactions, on December 31, 2011, undistributed net investment income was increased by $3,338 and undistributed net realized gain (loss) was decreased by $3,338. This reclassification had no effect on the net assets of the Fund.
NOTE 10—Share Information
| | | | | | | | | | | | | | | | | |
| | | Summary of Share Activity |
| |
| | | Year ended December 31, |
| | | 2011(a) | | 2010 |
| | | Shares | | Amount | | Shares | | Amount |
| |
| Sold: | | | | | | | | | | | | | | | | |
| Series I | | | 969,060 | | | $ | 6,229,063 | | | | 1,839,415 | | | $ | 11,111,452 | |
| |
| Series II | | | 2,174,535 | | | | 13,057,835 | | | | 4,402,680 | | | | 25,876,503 | |
| |
| Issued as reinvestment of dividends: | | | | | | | | | | | | | | | | |
| Series I | | | 248,399 | | | | 1,326,452 | | | | 188,763 | | | | 1,104,262 | |
| |
| Series II | | | 132,299 | | | | 702,510 | | | | 80,258 | | | | 467,104 | |
| |
| Reacquired: | | | | | | | | | | | | | | | | |
| Series I | | | (7,489,282 | ) | | | (47,586,894 | ) | | | (11,391,121 | ) | | | (68,704,454 | ) |
| |
| Series II | | | (6,151,667 | ) | | | (38,886,805 | ) | | | (6,127,464 | ) | | | (36,369,460 | ) |
| |
| Net increase (decrease) in share activity | | | (10,116,656 | ) | | $ | (65,157,839 | ) | | | (11,007,469 | ) | | $ | (66,514,593 | ) |
| |
| | |
| (a) | | There are entities that are record owners of more than 5% of the outstanding shares of the Fund and in the aggregate own 59% of the outstanding shares of the Fund. The Fund and the Fund’s principal underwriter or adviser, are parties to participation agreements with these entities whereby these entities sell units of interest in separate accounts funding variable products that are invested in the Fund. The Fund, Invesco and/or Invesco affiliates may make payments to these entities, which are considered to be related to the Fund, for providing services to the Fund, Invesco and/or Invesco affiliates including but not limited to services such as, securities brokerage, third party record keeping and account servicing and administrative services. The Fund has no knowledge as to whether all or any portion of the shares owned of record by these entities are also owned beneficially. |
Invesco V.I. Basic Value Fund
NOTE 11—Financial Highlights
The following schedule presents financial highlights for a share of the Fund outstanding throughout the periods indicated.
| | | | | | | | | | | | | | | | | | | | | | | | | | | | | | | | | | | | | | | | | | | | | | | | | | | | | | | | | |
| | | | | | | | | | | | | | | | | | | | | | | Ratio of
| | Ratio of
| | | | |
| | | | | | | Net gains
| | | | | | | | | | | | | | | | expenses
| | expenses
| | | | |
| | | | | | | (losses) on
| | | | | | | | | | | | | | | | to average
| | to average net
| | Ratio of net
| | |
| | | Net asset
| | | | securities
| | | | Dividends
| | Distributions
| | | | | | | | | | net assets
| | assets without
| | investment
| | |
| | | value,
| | Net
| | (both
| | Total from
| | from net
| | from net
| | | | Net asset
| | | | Net assets,
| | with fee waivers
| | fee waivers
| | income
| | |
| | | beginning
| | investment
| | realized and
| | investment
| | investment
| | realized
| | Total
| | value, end
| | Total
| | end of period
| | and/or expenses
| | and/or expenses
| | to average
| | Portfolio
|
| | | of period | | income(a) | | unrealized) | | operations | | income | | gains | | distributions | | of period | | return(b) | | (000s omitted) | | absorbed | | absorbed | | net assets | | turnover(c) |
| |
| Series I |
| Year ended 12/31/11 | | $ | 6.38 | | | $ | 0.08 | | | $ | (0.28 | ) | | $ | (0.20 | ) | | $ | (0.06 | ) | | $ | — | | | $ | (0.06 | ) | | $ | 6.12 | | | | (3.05 | )% | | $ | 135,644 | | | | 1.00 | %(d) | | | 1.00 | %(d) | | | 1.28 | %(d) | | | 15 | % |
| Year ended 12/31/10 | | | 5.98 | | | | 0.04 | | | | 0.40 | | | | 0.44 | | | | (0.04 | ) | | | — | | | | (0.04 | ) | | | 6.38 | | | | 7.35 | | | | 181,515 | | | | 1.00 | | | | 1.00 | | | | 0.65 | | | | 86 | |
| Year ended 12/31/09 | | | 4.10 | | | | 0.03 | | | | 1.94 | | | | 1.97 | | | | (0.09 | ) | | | — | | | | (0.09 | ) | | | 5.98 | | | | 48.00 | | | | 226,282 | | | | 0.98 | | | | 0.99 | | | | 0.59 | | | | 23 | |
| Year ended 12/31/08 | | | 12.73 | | | | 0.10 | | | | (6.68 | ) | | | (6.58 | ) | | | (0.09 | ) | | | (1.96 | ) | | | (2.05 | ) | | | 4.10 | | | | (51.77 | ) | | | 157,693 | | | | 1.03 | | | | 1.03 | | | | 0.99 | | | | 58 | |
| Year ended 12/31/07 | | | 13.35 | | | | 0.07 | | | | 0.17 | | | | 0.24 | | | | (0.08 | ) | | | (0.78 | ) | | | (0.86 | ) | | | 12.73 | | | | 1.62 | | | | 399,974 | | | | 0.96 | | | | 0.99 | | | | 0.52 | | | | 25 | |
| |
| Series II |
| Year ended 12/31/11 | | | 6.34 | | | | 0.06 | | | | (0.28 | ) | | | (0.22 | ) | | | (0.04 | ) | | | — | | | | (0.04 | ) | | | 6.08 | | | | (3.39 | ) | | | 103,538 | | | | 1.25 | (d) | | | 1.25 | (d) | | | 1.03 | (d) | | | 15 | |
| Year ended 12/31/10 | | | 5.95 | | | | 0.02 | | | | 0.39 | | | | 0.41 | | | | (0.02 | ) | | | — | | | | (0.02 | ) | | | 6.34 | | | | 6.94 | | | | 132,298 | | | | 1.25 | | | | 1.25 | | | | 0.40 | | | | 86 | |
| Year ended 12/31/09 | | | 4.07 | | | | 0.02 | | | | 1.92 | | | | 1.94 | | | | (0.06 | ) | | | — | | | | (0.06 | ) | | | 5.95 | | | | 47.74 | | | | 133,872 | | | | 1.23 | | | | 1.24 | | | | 0.34 | | | | 23 | |
| Year ended 12/31/08 | | | 12.62 | | | | 0.07 | | | | (6.61 | ) | | | (6.54 | ) | | | (0.05 | ) | | | (1.96 | ) | | | (2.01 | ) | | | 4.07 | | | | (51.90 | ) | | | 126,874 | | | | 1.28 | | | | 1.28 | | | | 0.74 | | | | 58 | |
| Year ended 12/31/07 | | | 13.24 | | | | 0.04 | | | | 0.16 | | | | 0.20 | | | | (0.04 | ) | | | (0.78 | ) | | | (0.82 | ) | | | 12.62 | | | | 1.36 | | | | 303,628 | | | | 1.21 | | | | 1.24 | | | | 0.27 | | | | 25 | |
| |
| | |
| (a) | | Calculated using average shares outstanding. |
| (b) | | Includes adjustments in accordance with accounting principles generally accepted in the United States of America and as such, the net asset value for financial reporting purposes and the returns based upon those net asset values may differ from the net asset value and returns for shareholder transactions. Total returns are not annualized for periods less than one year, if applicable, and do not reflect charges assessed in connection with a variable product, which if included would reduce total returns. |
| (c) | | Portfolio turnover is calculated at the fund level and is not annualized for periods less than one year, if applicable. |
| (d) | | Ratios are based on average daily net assets (000’s) of $158,424 and $116,218 for Series I and Series II shares, respectively. |
Invesco V.I. Basic Value Fund
Report of Independent Registered Public Accounting Firm
To the Board of Trustees of AIM Variable Insurance Funds (Invesco Variable Insurance Funds)
and Shareholders of Invesco V.I. Basic Value Fund:
In our opinion, the accompanying statement of assets and liabilities, including the schedule of investments, and the related statements of operations and of changes in net assets and the financial highlights present fairly, in all material respects, the financial position of Invesco V.I. Basic Value Fund (one of the funds constituting AIM Variable Insurance Funds (Invesco Variable Insurance Funds), hereafter referred to as the “Fund”) at December 31, 2011, the results of its operations for the year then ended, the changes in its net assets for each of the two years in the period then ended and the financial highlights for each of the five years in the period then ended, in conformity with accounting principles generally accepted in the United States of America. These financial statements and financial highlights (hereafter referred to as “financial statements”) are the responsibility of the Fund’s management; our responsibility is to express an opinion on these financial statements based on our audits. We conducted our audits of these financial statements in accordance with the standards of the Public Company Accounting Oversight Board (United States). Those standards require that we plan and perform the audits to obtain reasonable assurance about whether the financial statements are free of material misstatement. An audit includes examining, on a test basis, evidence supporting the amounts and disclosures in the financial statements, assessing the accounting principles used and significant estimates made by management, and evaluating the overall financial statement presentation. We believe that our audits, which included confirmation of securities at December 31, 2011 by correspondence with the custodian, provide a reasonable basis for our opinion.
PRICEWATERHOUSECOOPERS LLP
February 14, 2012
Houston, Texas
Invesco V.I. Basic Value Fund
Calculating your ongoing Fund expenses
Example
As a shareholder of the Fund, you incur ongoing costs, including management fees; distribution and/or service fees (12b-1); and other Fund expenses. This example is intended to help you understand your ongoing costs (in dollars) of investing in the Fund and to compare these costs with ongoing costs of investing in other mutual funds. The example is based on an investment of $1,000 invested at the beginning of the period and held for the entire period July 1, 2011 through December 31, 2011.
The actual and hypothetical expenses in the examples below do not represent the effect of any fees or other expenses assessed in connection with a variable product; if they did, the expenses shown would be higher while the ending account values shown would be lower.
Actual expenses
The table below provides information about actual account values and actual expenses. You may use the information in this table, together with the amount you invested, to estimate the expenses that you paid over the period. Simply divide your account value by $1,000 (for example, an $8,600 account value divided by $1,000 = 8.6), then multiply the result by the number in the table under the heading entitled “Actual Expenses Paid During Period” to estimate the expenses you paid on your account during this period.
Hypothetical example for comparison purposes
The table below also provides information about hypothetical account values and hypothetical expenses based on the Fund’s actual expense ratio and an assumed rate of return of 5% per year before expenses, which is not the Fund’s actual return.
The hypothetical account values and expenses may not be used to estimate the actual ending account balance or expenses you paid for the period. You may use this information to compare the ongoing costs of investing in the Fund and other funds. To do so, compare this 5% hypothetical example with the 5% hypothetical examples that appear in the shareholder reports of the other funds.
Please note that the expenses shown in the table are meant to highlight your ongoing costs. Therefore, the hypothetical information is useful in comparing ongoing costs, and will not help you determine the relative total costs of owning different funds.
| | | | | | | | | | | | | | | | | | | | | | | | | | | | | | | |
| | | | | | | | | | | | | HYPOTHETICAL
| | | |
| | | | | | | ACTUAL | | | (5% annual return before expenses) | | | |
| | | | Beginning
| | | Ending
| | | Expenses
| | | Ending
| | | Expenses
| | | Annualized
|
| | | | Account Value
| | | Account Value
| | | Paid During
| | | Account Value
| | | Paid During
| | | Expense
|
| Class | | | (07/01/11) | | | (12/31/11)1 | | | Period2 | | | (12/31/11) | | | Period2 | | | Ratio |
| Series I | | | $ | 1,000.00 | | | | $ | 938.60 | | | | $ | 4.98 | | | | $ | 1,020.06 | | | | $ | 5.19 | | | | | 1.02 | % |
| | | | | | | | | | | | | | | | | | | | | | | | | | | | | | | |
| Series II | | | | 1,000.00 | | | | | 936.50 | | | | | 6.20 | | | | | 1,018.80 | | | | | 6.46 | | | | | 1.27 | |
| | | | | | | | | | | | | | | | | | | | | | | | | | | | | | | |
| |
| 1 | The actual ending account value is based on the actual total return of the Fund for the period July 1, 2011 through December 31, 2011, after actual expenses and will differ from the hypothetical ending account value which is based on the Fund’s expense ratio and a hypothetical annual return of 5% before expenses. |
| 2 | Expenses are equal to the Fund’s annualized expense ratio as indicated above multiplied by the average account value over the period, multiplied by 184/365 to reflect the most recent fiscal half year. |
Invesco V.I. Basic Value Fund
Tax Information
Form 1099-DIV, Form 1042-S and other year-end tax information provide shareholders with actual calendar year amounts that should be included in their tax returns. Shareholders should consult their tax advisors.
The following distribution information is being provided as required by the Internal Revenue Code or to meet a specific state’s requirement.
The Fund designates the following amounts or, if subsequently determined to be different, the maximum amount allowable for its fiscal year ended December 31, 2011:
| | | | | |
Federal and State Income Tax | | |
| |
| Corporate Dividends Received Deduction* | | | 100% | |
| | |
| | * | The above percentage is based on ordinary income dividends paid to shareholders during the Fund’s fiscal year. |
Invesco V.I. Basic Value Fund
Trustees and Officers
The address of each trustee and officer is AIM Variable Insurance Funds (Invesco Variable Insurance Funds) (the “Trust”), 11 Greenway Plaza, Suite 2500, Houston, Texas 77046-1173. The trustees serve for the life of the Trust, subject to their earlier death, incapacitation, resignation, retirement or removal as more specifically provided in the Trust’s organizational documents. Each officer serves for a one year term or until their successors are elected and qualified. Column two below includes length of time served with predecessor entities, if any.
| | | | | | | | | |
| | | | | | | Number of Funds
| | |
Name, Year of Birth and
| | Trustee and/
| | Principal Occupation(s)
| | in Fund Complex
| | Other Directorship(s)
|
| Position(s) Held with the Trust | | or Officer Since | | During Past 5 Years | | Overseen by Trustee | | Held by Trustee |
| | | | | | | | | |
| | | | | | | | | |
| | | | | | | | | |
Interested Persons | | | | | | | | |
| | | | | | | | | |
| | | | | | | | | |
| | | | | | | | | |
Martin L. Flanagan1 — 1960
Trustee | | 2007 | | Executive Director, Chief Executive Officer and President, Invesco Ltd. (ultimate parent of Invesco and a global investment management firm); Advisor to the Board, Invesco Advisers, Inc. (formerly known as Invesco Institutional (N.A.), Inc.); Trustee, The Invesco Funds; Vice Chair, Investment Company Institute; and Member of Executive Board, SMU Cox School of Business
Formerly: Chairman, Invesco Advisers, Inc. (registered investment adviser); Director, Chairman, Chief Executive Officer and President, IVZ Inc. (holding company), INVESCO Group Services, Inc. (service provider) and Invesco North American Holdings, Inc. (holding company); Director, Chief Executive Officer and President, Invesco Holding Company Limited (parent of Invesco and a global investment management firm); Director, Invesco Ltd.; Chairman, Investment Company Institute and President, Co-Chief Executive Officer, Co-President, Chief Operating Officer and Chief Financial Officer, Franklin Resources, Inc. (global investment management organization) | | 140 | | None |
| | | | | | | | | |
| | | | | | | | | |
| | | | | | | | | |
Philip A. Taylor2 — 1954
Trustee, President and Principal Executive Officer | | 2006 | | Head of North American Retail and Senior Managing Director, Invesco Ltd.; Director, Co-Chairman, Co-President and Co-Chief Executive Officer, Invesco Advisers, Inc. (formerly known as Invesco Institutional (N.A.), Inc.) (registered investment adviser); Director, Chairman, Chief Executive Officer and President, Invesco Management Group, Inc. (formerly Invesco Aim Management Group, Inc.) (financial services holding company); Director and President, INVESCO Funds Group, Inc. (registered investment adviser and registered transfer agent); Director and Chairman, Invesco Investment Services, Inc. (formerly known as Invesco Aim Investment Services, Inc.) (registered transfer agent) and IVZ Distributors, Inc. (formerly known as INVESCO Distributors, Inc.) (registered broker dealer); Director, President and Chairman, Invesco Inc. (holding company) and Invesco Canada Holdings Inc. (holding company); Chief Executive Officer, Invesco Corporate Class Inc. (corporate mutual fund company) and Invesco Canada Fund Inc. (corporate mutual fund company); Director, Chairman and Chief Executive Officer, Invesco Canada Ltd. (formerly known as Invesco Trimark Ltd./Invesco Trimark Ltèe) (registered investment adviser and registered transfer agent); Trustee, President and Principal Executive Officer, The Invesco Funds (other than AIM Treasurer’s Series Trust (Invesco Treasurer’s Series Trust) and Short-Term Investments Trust); Trustee and Executive Vice President, The Invesco Funds (AIM Treasurer’s Series Trust (Invesco Treasurer’s Series Trust) and Short-Term Investments Trust only); Director, Invesco Investment Advisers LLC (formerly known as Van Kampen Asset Management); Director, Chief Executive Officer and President, Van Kampen Exchange Corp. | | 140 | | None |
| | | | | | | | | |
| | | | | | | | | |
| | | | | Formerly: Director and Chairman, Van Kampen Investor Services Inc.: Director, Chief Executive Officer and President, 1371 Preferred Inc. (holding company); and Van Kampen Investments Inc.; Director and President, AIM GP Canada Inc. (general partner for limited partnerships); and Van Kampen Advisors, Inc.; Director and Chief Executive Officer, Invesco Trimark Dealer Inc. (registered broker dealer); Director, Invesco Distributors, Inc. (formerly known as Invesco Aim Distributors, Inc.) (registered broker dealer); Manager, Invesco PowerShares Capital Management LLC; Director, Chief Executive Officer and President, Invesco Advisers, Inc.; Director, Chairman, Chief Executive Officer and President, Invesco Aim Capital Management, Inc.; President, Invesco Trimark Dealer Inc. and Invesco Trimark Ltd./Invesco Trimark Ltèe; Director and President, AIM Trimark Corporate Class Inc. and AIM Trimark Canada Fund Inc.; Senior Managing Director, Invesco Holding Company Limited; Trustee and Executive Vice President, Tax-Free Investments Trust; Director and Chairman, Fund Management Company (former registered broker dealer); President and Principal Executive Officer, The Invesco Funds (AIM Treasurer’s Series Trust (Invesco Treasurer’s Series Trust), Short-Term Investments Trust and Tax-Free Investments Trust only); President, AIM Trimark Global Fund Inc. and AIM Trimark Canada Fund Inc. | | | | |
| | | | | | | | | |
| | | | | | | | | |
| | | | | | | | | |
Wayne W. Whalen3 — 1939
Trustee | | 2010 | | Of Counsel, and prior to 2010, partner in the law firm of Skadden, Arps, Slate, Meagher & Flom LLP, legal counsel to funds in the Fund Complex | | 158 | | Director of the Abraham Lincoln Presidential Library Foundation |
| | | | | | | | | |
| | | | | | | | | |
| | | | | | | | | |
Independent Trustees | | | | | | | | |
| | | | | | | | | |
| | | | | | | | | |
| | | | | | | | | |
Bruce L. Crockett — 1944
Trustee and Chair | | 1993 | | Chairman, Crockett Technology Associates (technology consulting company) | | 140 | | ACE Limited (insurance company); and Investment Company Institute |
| | | | | Formerly: Director, Captaris (unified messaging provider); Director, President and Chief Executive Officer COMSAT Corporation; and Chairman, Board of Governors of INTELSAT (international communications company) | | | | |
| | | | | | | | | |
| |
| 1 | Mr. Flanagan is considered an interested person of the Trust because he is an officer of the adviser to the Trust, and an officer and a director of Invesco Ltd., ultimate parent of the adviser to the Trust. |
| 2 | Mr. Taylor is considered an interested person of the Trust because he is an officer and a director of the adviser to, and a director of the principal underwriter of, the Trust. |
| 3 | Mr. Whalen is considered an “interested person” (within the meaning of Section 2(a)(19) of the 1940 Act) of certain Funds in the Fund Complex by reason of he and his firm currently providing legal services as legal counsel to such Funds in the Fund Complex. |
Invesco V.I. Basic Value Fund
Trustees and Officers—(continued)
The address of each trustee and officer is AIM Variable Insurance Funds (Invesco Variable Insurance Funds) (the “Trust”), 11 Greenway Plaza, Suite 2500, Houston, Texas 77046-1173. The trustees serve for the life of the Trust, subject to their earlier death, incapacitation, resignation, retirement or removal as more specifically provided in the Trust’s organizational documents. Each officer serves for a one year term or until their successors are elected and qualified. Column two below includes length of time served with predecessor entities, if any.
| | | | | | | | | |
| | | | | | | Number of Funds
| | |
Name, Year of Birth and
| | Trustee and/
| | Principal Occupation(s)
| | in Fund Complex
| | Other Directorship(s)
|
| Position(s) Held with the Trust | | or Officer Since | | During Past 5 Years | | Overseen by Trustee | | Held by Trustee |
| | | | | | | | | |
| | | | | | | | | |
| | | | | | | |
Independent Trustees—(continued) | | | | | | |
| | | | | | | | | |
| | | | | | | | | |
| | | | | | | | | |
David C. Arch — 1945
Trustee | | 2010 | | Chairman and Chief Executive Officer of Blistex Inc., a consumer health care products manufacturer. | | 158 | | Member of the Heartland Alliance Advisory Board, a nonprofit organization serving human needs based in Chicago. Board member of the Illinois Manufacturers’ Association. Member of the Board of Visitors, Institute for the Humanities, University of Michigan |
| | | | | | | | | |
| | | | | | | | | |
| | | | | | | | | |
Frank S. Bayley — 1939
Trustee | | 2001 | | Retired
Formerly: Director, Badgley Funds, Inc. (registered investment company) (2 portfolios) and Partner, law firm of Baker & McKenzie
Formerly: Director, Badgley Funds, Inc. (registered investment company) (2 portfolios) and Partner, law firm of Baker & McKenzie | | 140 | | Director and Chairman, C.D. Stimson Company (a real estate investment company) |
| | | | | | | | | |
| | | | | | | | | �� |
| | | | | | | | | |
James T. Bunch — 1942
Trustee | | 2004 | | Managing Member, Grumman Hill Group LLC (family office private equity management)
Formerly: Founder, Green, Manning & Bunch Ltd. (investment banking firm)(1988-2010); Executive Committee, United States Golf Association; and Director, Policy Studies, Inc. and Van Gilder Insurance Corporation | | 140 | | Vice Chairman, Board of Governors, Western Golf Association/Evans Scholars Foundation and Director, Denver Film Society |
| | | | | | | | | |
| | | | | | | | | |
| | | | | | | | | |
Rodney F. Dammeyer — 1940
Trustee | | 2010 | | President of CAC, LLC, a private company offering capital investment and management advisory services.
Formerly: Prior to January 2004, Director of TeleTech Holdings Inc.; Prior to 2002, Director of Arris Group, Inc.; Prior to 2001, Managing Partner at Equity Group Corporate Investments. Prior to 1995, Vice Chairman of Anixter International. Prior to 1985, experience includes Senior Vice President and Chief Financial Officer of Household International, Inc., Executive Vice President and Chief Financial Officer of Northwest Industries, Inc. and Partner of Arthur Andersen & Co. | | 158 | | Director of Quidel Corporation and Stericycle, Inc. Prior to May 2008, Trustee of The Scripps Research Institute. Prior to February 2008, Director of Ventana Medical Systems, Inc. Prior to April 2007, Director of GATX Corporation. Prior to April 2004, Director of TheraSense, Inc. |
| | | | | | | | | |
| | | | | | | | | |
| | | | | | | | | |
Albert R. Dowden — 1941
Trustee | | 2000 | | Director of a number of public and private business corporations, including the Boss Group, Ltd. (private investment and management); Reich & Tang Funds (5 portfolios) (registered investment company); and Homeowners of America Holding Corporation/ Homeowners of America Insurance Company (property casualty company)
Formerly: Director, Continental Energy Services, LLC (oil and gas pipeline service); Director, CompuDyne Corporation (provider of product and services to the public security market) and Director, Annuity and Life Re (Holdings), Ltd. (reinsurance company); Director, President and Chief Executive Officer, Volvo Group North America, Inc.; Senior Vice President, AB Volvo; Director of various public and private corporations; Chairman, DHJ Media, Inc.; Director Magellan Insurance Company; and Director, The Hertz Corporation, Genmar Corporation (boat manufacturer), National Media Corporation; Advisory Board of Rotary Power International (designer, manufacturer, and seller of rotary power engines); and Chairman, Cortland Trust, Inc. (registered investment company) | | 140 | | Board of Nature’s Sunshine Products, Inc. |
| | | | | | | | | |
| | | | | | | | | |
| | | | | | | | | |
Jack M. Fields — 1952
Trustee | | 1997 | | Chief Executive Officer, Twenty First Century Group, Inc. (government affairs company); and Owner and Chief Executive Officer, Dos Angelos Ranch, L.P. (cattle, hunting, corporate entertainment), Discovery Global Education Fund (non-profit) and Cross Timbers Quail Research Ranch (non-profit)
Formerly: Chief Executive Officer, Texana Timber LP (sustainable forestry company) and member of the U.S. House of Representatives | | 140 | | Administaff |
| | | | | | | | | |
| | | | | | | | | |
| | | | | | | | | |
Carl Frischling — 1937
Trustee | | 1993 | | Partner, law firm of Kramer Levin Naftalis and Frankel LLP | | 140 | | Director, Reich & Tang Funds (16 portfolios) |
| | | | | | | | | |
| | | | | | | | | |
Invesco V.I. Basic Value Fund
Trustees and Officers—(continued)
The address of each trustee and officer is AIM Variable Insurance Funds (Invesco Variable Insurance Funds) (the “Trust”), 11 Greenway Plaza, Suite 2500, Houston, Texas 77046-1173. The trustees serve for the life of the Trust, subject to their earlier death, incapacitation, resignation, retirement or removal as more specifically provided in the Trust’s organizational documents. Each officer serves for a one year term or until their successors are elected and qualified. Column two below includes length of time served with predecessor entities, if any.
| | | | | | | | | |
| | | | | | | Number of Funds
| | |
Name, Year of Birth and
| | Trustee and/
| | Principal Occupation(s)
| | in Fund Complex
| | Other Directorship(s)
|
| Position(s) Held with the Trust | | or Officer Since | | During Past 5 Years | | Overseen by Trustee | | Held by Trustee |
| | | Independent Trustees—(continued) | | | | |
| | | | | | | | | |
| | | | | | | | | |
| | | | | | | | | |
Prema Mathai-Davis — 1950
Trustee | | 1998 | | Retired
Formerly: Chief Executive Officer, YWCA of the U.S.A. | | 140 | | None |
| | | | | | | | | |
| | | | | | | | | |
| | | | | | | | | |
Larry Soll — 1942
Trustee | | 2004 | | Retired
Formerly, Chairman, Chief Executive Officer and President, Synergen Corp. (a biotechnology company) | | 140 | | None |
| | | | | | | | | |
| | | | | | | | | |
| | | | | | | | | |
Hugo F. Sonnenschein — 1940
Trustee | | 2010 | | President Emeritus and Honorary Trustee of the University of Chicago and the Adam Smith Distinguished Service Professor in the Department of Economics at the University of Chicago. Prior to July 2000, President of the University of Chicago. | | 158 | | Trustee of the University of Rochester and a member of its investment committee. Member of the National Academy of Sciences, the American Philosophical Society and a fellow of the American Academy of Arts and Sciences |
| | | | | | | | | |
| | | | | | | | | |
| | | | | | | | | |
| Raymond Stickel, Jr. — 1944 Trustee | | 2005 | | Retired
Formerly: Director, Mainstay VP Series Funds, Inc. (25 portfolios) and Partner, Deloitte & Touche | | 140 | | None |
| | | | | | | | | |
| | | | | | | | | |
| | | | | | | | | |
Other Officers | | | | | | | | |
| | | | | | | | | |
| | | | | | | | | |
| | | | | | | | | |
Russell C. Burk — 1958
Senior Vice President and Senior Officer | | 2005 | | Senior Vice President and Senior Officer, The Invesco Funds | | N/A | | N/A |
| | | | | | | | | |
| | | | | | | | | |
| | | | | | | | | |
John M. Zerr — 1962
Senior Vice President, Chief Legal Officer and Secretary | | 2006 | | Director, Senior Vice President, Secretary and General Counsel, Invesco Management Group, Inc. (formerly known as Invesco Aim Management Group, Inc.) and Van Kampen Exchange Corp.; Senior Vice President, Invesco Advisers, Inc. (formerly known as Invesco Institutional (N.A.), Inc.) (registered investment adviser); Senior Vice President and Secretary, Invesco Distributors, Inc. (formerly known as Invesco Aim Distributors, Inc.); Director, Vice President and Secretary, Invesco Investment Services, Inc. (formerly known as Invesco Aim Investment Services, Inc.) and IVZ Distributors, Inc. (formerly known as INVESCO Distributors, Inc.); Director and Vice President, INVESCO Funds Group, Inc.; Senior Vice President, Chief Legal Officer and Secretary, The Invesco Funds; Manager, Invesco PowerShares Capital Management LLC; Director, Secretary and General Counsel, Invesco Investment Advisers LLC (formerly known as Van Kampen Asset Management); Secretary and General Counsel, Van Kampen Funds Inc. and Chief Legal Officer, PowerShares Exchange-Traded Fund Trust, PowerShares Exchange-Traded Fund Trust II, PowerShares India Exchange-Traded Fund Trust and PowerShares Actively Managed Exchange-Traded Fund Trust
Formerly: Director and Secretary, Van Kampen Advisors Inc.; Director Vice President, Secretary and General Counsel Van Kampen Investor Services Inc.; Director, Invesco Distributors, Inc. (formerly known as Invesco Aim Distributors, Inc.); Director, Senior Vice President, General Counsel and Secretary, Invesco Advisers, Inc.; and Van Kampen Investments Inc.; Director, Vice President and Secretary, Fund Management Company; Director, Senior Vice President, Secretary, General Counsel and Vice President, Invesco Aim Capital Management, Inc.; Chief Operating Officer and General Counsel, Liberty Ridge Capital, Inc. (an investment adviser); Vice President and Secretary, PBHG Funds (an investment company) and PBHG Insurance Series Fund (an investment company); Chief Operating Officer, General Counsel and Secretary, Old Mutual Investment Partners (a broker-dealer); General Counsel and Secretary, Old Mutual Fund Services (an administrator) and Old Mutual Shareholder Services (a shareholder servicing center); Executive Vice President, General Counsel and Secretary, Old Mutual Capital, Inc. (an investment adviser); and Vice President and Secretary, Old Mutual Advisors Funds (an investment company) | | N/A | | N/A |
| | | | | | | | | |
| | | | | | | | | |
| | | | | | | | | |
Lisa O. Brinkley — 1959
Vice President | | 2004 | | Global Compliance Director, Invesco Ltd.; Chief Compliance Officer, Invesco Investment Services, Inc.(formerly known as Invesco Aim Investment Services, Inc.); and Vice President, The Invesco Funds
Formerly: Chief Compliance Officer, Invesco Distributors, Inc. (formerly known as Invesco Aim Distributors, Inc.) and Van Kampen Investor Services Inc.; Senior Vice President, Invesco Management Group, Inc.; Senior Vice President and Chief Compliance Officer, Invesco Advisers, Inc. and The Invesco Funds; Vice President and Chief Compliance Officer, Invesco Aim Capital Management, Inc. and Invesco Distributors, Inc.; Vice President, Invesco Investment Services, Inc. and Fund Management Company | | N/A | | N/A |
| | | | | | | | | |
Invesco V.I. Basic Value Fund
Trustees and Officers—(continued)
The address of each trustee and officer is AIM Variable Insurance Funds (Invesco Variable Insurance Funds) (the “Trust”), 11 Greenway Plaza, Suite 2500, Houston, Texas 77046-1173. The trustees serve for the life of the Trust, subject to their earlier death, incapacitation, resignation, retirement or removal as more specifically provided in the Trust’s organizational documents. Each officer serves for a one year term or until their successors are elected and qualified. Column two below includes length of time served with predecessor entities, if any.
| | | | | | | | | |
| | | | | | | Number of Funds
| | |
Name, Year of Birth and
| | Trustee and/
| | Principal Occupation(s)
| | in Fund Complex
| | Other Directorship(s)
|
| Position(s) Held with the Trust | | or Officer Since | | During Past 5 Years | | Overseen by Trustee | | Held by Trustee |
| | | Other Officers—(continued) | | | | |
| | | | | | | | | |
| | | | | | | | | |
| | | | | | | | | |
Sheri Morris — 1964
Vice President, Treasurer and Principal Financial Officer | | 1999 | | Vice President, Treasurer and Principal Financial Officer, The Invesco Funds; Vice President, Invesco Advisers, Inc. (formerly known as Invesco Institutional (N.A.), Inc.) (registered investment adviser).
Formerly: Treasurer, PowerShares Exchange-Traded Fund Trust, PowerShares Exchange-Traded Fund Trust II, PowerShares India Exchange-Traded Fund Trust and PowerShares Actively Managed Exchange-Traded Fund Trust, Vice President, Invesco Advisers, Inc., Invesco Aim Capital Management, Inc. and Invesco Aim Private Asset Management, Inc.; Assistant Vice President and Assistant Treasurer, The Invesco Funds and Assistant Vice President, Invesco Advisers, Inc., Invesco Aim Capital Management, Inc. and Invesco Aim Private Asset Management, Inc. | | N/A | | N/A |
| | | | | | | | | |
| | | | | | | | | |
| | | | | | | | | |
Karen Dunn Kelley — 1960
Vice President | | 1993 | | Head of Invesco’s World Wide Fixed Income and Cash Management Group; Senior Vice President, Invesco Management Group, Inc. (formerly known as Invesco Aim Management Group, Inc.) and Invesco Advisers, Inc. (formerly known as Invesco Institutional (N.A.), Inc.) (registered investment adviser); Executive Vice President, Invesco Distributors, Inc. (formerly known as Invesco Aim Distributors, Inc.); Director, Invesco Mortgage Capital Inc.; Vice President, The Invesco Funds (other than AIM Treasurer’s Series Trust (Invesco Treasurer’s Series Trust) and Short-Term Investments Trust); and President and Principal Executive Officer, The Invesco Funds (AIM Treasurer’s Series Trust (Invesco Treasurer’s Series Trust) and Short-Term Investments Trust only).
Formerly: Senior Vice President, Van Kampen Investments Inc.; Vice President, Invesco Advisers, Inc. (formerly known as Invesco Institutional (N.A.), Inc.); Director of Cash Management and Senior Vice President, Invesco Advisers, Inc. and Invesco Aim Capital Management, Inc.; President and Principal Executive Officer, Tax-Free Investments Trust; Director and President, Fund Management Company; Chief Cash Management Officer, Director of Cash Management, Senior Vice President, and Managing Director, Invesco Aim Capital Management, Inc.; Director of Cash Management, Senior Vice President, and Vice President, Invesco Advisers, Inc. and The Invesco Funds (AIM Treasurer’s Series Trust (Invesco Treasurer’s Series Trust), Short-Term Investments Trust and Tax-Free Investments Trust only) | | N/A | | N/A |
| | | | | | | | | |
| | | | | | | | | |
| | | | | | | | | |
Yinka Akinsola — 1977
Anti-Money Laundering Compliance Officer | | 2011 | | Anti-Money Laundering Compliance Officer, Invesco Advisers, Inc. (formerly known as Invesco Institutional (N.A.), Inc.) (registered investment adviser); Invesco Distributors, Inc. (formerly known as Invesco Aim Distributors, Inc.), Invesco Investment Services, Inc. (formerly known as Invesco Aim Investment Services, Inc.), Invesco Management Group, Inc., The Invesco Funds, Invesco Van Kampen Closed-End Funds, Van Kampen Exchange Corp. and Van Kampen Funds Inc. | | N/A | | N/A |
| | | | | | | | | |
| | | | | | | | | |
| | | | | | | | | |
Todd L. Spillane — 1958
Chief Compliance Officer | | 2006 | | Senior Vice President, Invesco Management Group, Inc. (formerly known as Invesco Aim Management Group, Inc.) and Van Kampen Exchange Corp.; Senior Vice President and Chief Compliance Officer, Invesco Advisers, Inc. (registered investment adviser) (formerly known as Invesco Institutional (N.A.), Inc.); Chief Compliance Officer, The Invesco Funds, INVESCO Private Capital Investments, Inc. (holding company) and Invesco Private Capital, Inc. (registered investment adviser); Vice President, Invesco Distributors, Inc. (formerly known as Invesco Aim Distributors, Inc.) and Invesco Investment Services, Inc. (formerly known as Invesco Aim Investment Services, Inc.).
Formerly: Chief Compliance Officer, Invesco Van Kampen Closed-End Funds PowerShares Exchange-Traded Fund Trust, PowerShares Exchange-Traded Fund Trust II, PowerShares India Exchange-Traded Fund Trust, and PowerShares Actively Managed Exchange-Traded Fund Trust; Senior Vice President, Van Kampen Investments Inc.; Senior Vice President and Chief Compliance Officer, Invesco Advisers, Inc. and Invesco Aim Capital Management, Inc.; Chief Compliance Officer, Invesco Global Asset Management (N.A.), Inc., Invesco Senior Secured Management, Inc. (registered investment adviser) and Van Kampen Investor Services Inc.; Vice President, Invesco Aim Capital Management, Inc. and Fund Management Company | | N/A | | N/A |
| | | | | | | | | |
The Statement of Additional Information of the Trust includes additional information about the Fund’s Trustees and is available upon request, without charge, by calling 1.800.959.4246. Please refer to the Fund’s prospectus for information on the Fund’s sub-advisers.
| | | | | | | |
Office of the Fund
11 Greenway Plaza, Suite 2500
Houston, TX 77046-1173 | | Investment Adviser
Invesco Advisers, Inc.
1555 Peachtree Street, N.E.
Atlanta, GA 30309 | | Distributor
Invesco Distributors, Inc.
11 Greenway Plaza, Suite 2500
Houston, TX 77046-1173 | | Auditors
PricewaterhouseCoopers LLP
1201 Louisiana Street, Suite 2900
Houston, TX 77002-5678 |
| | | | | | | |
| | | | | | | |
Counsel to the Fund
Stradley Ronon Stevens & Young, LLP
2600 One Commerce Square
Philadelphia, PA 19103 | | Counsel to the Independent Trustees
Kramer, Levin, Naftalis & Frankel LLP
1177 Avenue of the Americas
New York, NY 10036-2714 | | Transfer Agent
Invesco Investment Services, Inc.
11 Greenway Plaza, Suite 2500
Houston, TX77046-1173 | | Custodian
State Street Bank and Trust Company
225 Franklin
Boston, MA 02110-2801 |
Invesco V.I. Basic Value Fund
Invesco V.I. Capital Appreciation FundAnnual Report to Shareholders § December 31, 2011The Fund provides a complete list of its holdings four times in each fiscal year, at the quarter-ends. For the second and fourth quarters, the lists appear in the Fund’s semiannual and annual reports to shareholders. For the first and third quarters, the Fund files the lists with the Securities and Exchange Commission (SEC) on Form N-Q. The Fund’s Form N-Q filings are available on the SEC website, sec.gov. Copies of the Fund’s Forms N-Q may be reviewed and copied at the SEC Public Reference Room in Washington, D.C. You can obtain information on the operation of the Public Reference Room, including information about duplicating fee charges, by calling 202 551 8090 or 800 732 0330, or by electronic request at the following email address: publicinfo@sec.gov. The SEC file numbers for the Fund are 811-07452 and 033-57340. The Fund’s most recent portfolio holdings, as filed on Form N-Q, have also been made available to insurance companies issuing variable annuity contracts and variable life insurance policies (“variable products”) that invest in the Fund.
A description of the policies and procedures that the Fund uses to determine how to vote proxies relating to portfolio securities is available without charge, upon request, from our Client Services department at 800 959 4246 or at invesco.com/proxyguidelines. The information is also available on the SEC website, sec.gov.
Information regarding how the Fund voted proxies related to its portfolio securities during the 12 months ended June 30, 2011, is available at invesco.com/proxysearch. The information is also available on the SEC website, sec.gov.
Invesco Advisers, Inc. is an investment adviser; it provides investment advisory services to individual and institutional clients and does not sell securities. Invesco Distributors, Inc. is the U.S. distributor for Invesco Ltd.’s retail mutual funds, exchange-traded funds and institutional money market funds. Both are wholly owned, indirect subsidiaries of Invesco Ltd.
This report must be accompanied or preceded by a currently effective Fund prospectus and variable product prospectus, which contain more complete information, including sales charges and expenses. Investors should read each carefully before investing.
Invesco Distributors, Inc.
VICAP-AR-1
| | | | | | | | | |
|
| | | | | | | |
NOT FDIC INSURED | | | | MAY LOSE VALUE | | | | NO BANK GUARANTEE |
Management’s Discussion of Fund Performance
Performance summary
For the fiscal year ended December 31, 2011, Invesco V.I. Capital Appreciation Fund had negative returns and underperformed versus its style-specific index, the Russell 1000 Growth Index. Much of the Fund’s underperformance was due to stock selection in several sectors.
Your Fund’s long-term performance appears later in this report.
Fund vs. Indexes
Total returns, 12/31/10 to 12/31/11, excluding variable product issuer charges.
If variable product issuer charges were included, returns would be lower.
| | | | | |
|
| Series I Shares | | | -7.91 | % |
| |
| Series II Shares | | | -8.12 | |
| |
S&P 500 Index▼ (Broad Market Index) | | | 2.09 | |
| |
Russell 1000 Growth Index▼ (Style-Specific Index) | | | 2.64 | |
| |
Lipper VUF Multi-Cap Growth Funds Category Average▼ (Peer Group) | | | -3.59 | |
| |
Source: ▼ Lipper Inc.
How we invest
We believe a growth investment strategy is an essential component of a diversified portfolio.
Our investment process emphasizes rigorous bottom-up analysis of individual companies. We seek to invest in companies with strong or improving fundamentals, attractive valuations relative to growth prospects and earnings expectations that appear fair to conservative.
To narrow our investment universe, we utilize a holistic approach that emphasizes fundamental research and, to a lesser extent, includes quantitative analysis. The result of this distillation process is a set of stocks we analyze in greater depth.
Our fundamental analysis focuses on identifying companies with strong drivers of growth. To accomplish this goal, we conduct rigorous bottom-up analysis to develop higher conviction in each company’s prospects for growth. Through our analysis, we develop a mosaic of each company through detailed discussions with company management teams, competitors, distributors, suppliers, Wall Street
analysts and customers. We also employ a variety of valuation techniques based on the company in question, the industry in which the company operates, the stage of the business cycle and other factors that best reflect a company’s value.
Risk management plays an important role in portfolio construction. Our target portfolio attempts to maximize the relationship between risk and return. We seek to accomplish this goal by investing in companies with attractive fundamental prospects for growth and dividing the portfolio between stable growth stocks and catalyst-driven stocks.
We consider selling a stock for any of the following reasons:
| n | | The price target set at purchase has been reached. |
| |
| n | | There is deterioration in fundamentals. |
| |
| n | | The catalysts for growth are no longer present or are reflected in the stock price. |
| |
| n | | We identify a more attractive investment opportunity. |
Market conditions and your Fund
The fiscal year began with equity markets fueled on the second round of “quantitative easing” by the U.S. Federal Reserve, and markets rose through the first quarter of 2011. However, with the spring came increased volatility and significant macroeconomic distortions due to civil unrest in Egypt and Libya, flooding in Australia and a devastating earthquake and tsunami in Japan. Corporate earnings remained strong with largely positive surprises, but were often overshadowed by investor concerns about continuing high unemployment and soft housing data. Although markets stabilized and were generally in positive territory through the summer, major equity indexes sold off precipitously in August as the U.S. government struggled to raise the nation’s debt ceiling. Despite an eventual agreement between the White House and Congress, credit rating agency Standard & Poor’s announced the first-ever downgrade to long-term U.S. government debt. Uncertainty created by the downgrade, combined with the continuing saga surrounding the debt crisis in the eurozone, reignited fears of a global recession. Despite evidence of sustained, but muted, growth, these macroeconomic factors continued to weigh on markets through the end of the reporting period.
In this environment, the Fund produced negative absolute returns and underperformed the Russell 1000 Growth Index for the reporting period. The Fund underperformed the style-specific index by the widest margins in the information technology (IT), industrials, consumer discretionary, energy, health care and financials sectors. Underperformance overall was driven predominately by stock selection.
Portfolio Composition
By sector
| | | | | |
|
| Information Technology | | | 30.5 | % |
| |
| Consumer Discretionary | | | 16.5 | |
| |
| Industrials | | | 11.9 | |
| |
| Energy | | | 11.2 | |
| |
| Health Care | | | 10.2 | |
| |
| Consumer Staples | | | 8.3 | |
| |
| Materials | | | 3.9 | |
| |
| Financials | | | 3.6 | |
| |
| Telecommunication Services | | | 2.3 | |
| |
Money Market Funds Plus | | | | |
Other Assets Less Liabilities | | | 1.6 | |
Top 10 Equity Holdings*
| | | | | | | | | |
|
| | 1. | | | Apple Inc. | | | 6.9 | % |
| |
| | 2. | | | Google Inc.-Class A | | | 3.8 | |
| |
| | 3. | | | DIRECTV-Class A | | | 3.3 | |
| |
| | 4. | | | QUALCOMM Inc. | | | 2.9 | |
| |
| | 5. | | | Amazon.com, Inc. | | | 2.8 | |
| |
| | 6. | | | Halliburton Co. | | | 2.8 | |
| |
| | 7. | | | MasterCard, Inc.-Class A | | | 2.6 | |
| |
| | 8. | | | CVS Caremark Corp. | | | 2.5 | |
| |
| | 9. | | | UnitedHealth Group, Inc. | | | 2.4 | |
| |
| | 10. | | | JPMorgan Chase & Co. | | | 2.2 | |
| | | | | |
|
| Total Net Assets | | $531.7 million | |
| | | | | |
| Total Number of Holdings* | | | 78 | |
The Fund’s holdings are subject to change, and there is no assurance that the Fund will continue to hold any particular security.
*Excluding money market fund holdings.
Invesco V.I. Capital Appreciation Fund
For the fiscal year, the Fund underperformed its style-specific index by the widest margin in the IT sector due primarily to stock selection. In this sector, Rovi was the largest detractor from Fund performance. Weakening consumer spending in August, along with fourth quarter guidance that some legacy product revenue was decelerating while newer growth products would be postponed, hurt company performance. Despite these obstacles, we believe long-term growth potential still exists for Rovi, as the company generally benefits from secular tail-winds – such as the transition from analog to digital cable and the growing adoption of connected televisions. Broadcom also detracted from Fund performance during the reporting period. Weak sales of smart-phones and tablets using their semiconductors led management to reduce future earnings expectations. Positions in both Rovi and Broadcom offset the positive performance from two of the largest contributors to Fund performance, Apple and MasterCard.
In the industrials sector, the Fund’s underperformance was driven by stock selection. One of the largest single detractors to the Fund’s performance was construction and engineering services firm Foster Wheeler. The company missed out on an anticipated contract and, later in the reporting period, was disproportionately affected as energy prices declined. Examples of other holdings that were key detractors from Fund performance included industrial electric equipment producer ABB and commercial truck and engine maker Navistar International. Both companies were affected by wavering sentiment on the prospects for global growth.
The Fund also underperformed its style-specific index in the consumer discretionary sector, driven again by stock selection. Our position in Amazon detracted from Fund performance due to weak revenue growth late in the reporting period after initial high expectations for the stock. Amazon’s spending was also higher than expected, although directed to building out rapid distribution centers and new products, which may drive future growth.
In the energy sector, the Fund also underperformed its style-specific index due to stock selection and an emphasis on service providers and exploration companies with higher growth rates, which were down more than the defensive integrated oil companies and broader energy group. These firms included Halliburton, National Oilwell Varco and Weatherford International. We sold our position in National Oilwell Varco before the end of the reporting period.
Some of the Fund’s underperformance was offset by outperformance from holdings in other sectors. The Fund outperformed by the widest margin in the consumer staples sector, driven by stock selection. Specialty coffeemaker and producer Green Mountain Coffee Roasters benefited from strong revenue and earnings growth, and increasing distribution agreements to use its Keurig single cup brewing system. The stock was sold from the portfolio during the reporting period. Costco Wholesale and beverage company Hansen Natural also contributed to performance.
As we’ve discussed, the stock market experienced heavy volatility during the fiscal year. We would like to caution investors against making investment decisions based on short-term performance. We thank you for your commitment to Invesco V.I. Capital Appreciation Fund.
The views and opinions expressed in management’s discussion of Fund performance are those of Invesco Advisers, Inc. These views and opinions are subject to change at any time based on factors such as market and economic conditions. These views and opinions may not be relied upon as investment advice or recommendations, or as an offer for a particular security. The information is not a complete analysis of every aspect of any market, country, industry, security or the Fund. Statements of fact are from sources considered reliable, but Invesco Advisers, Inc. makes no representation or warranty as to their completeness or accuracy. Although historical performance is no guarantee of future results, these insights may help you understand our investment management philosophy.
See important Fund and, if applicable, index disclosures later in this report.
Erik Voss
Chartered Financial Analyst, portfolio manager, is lead manager of Invesco V.I. Capital Appreciation Fund. He joined Invesco in 2010. Mr. Voss earned a B.S. in mathematics and an M.S. in finance from the University of Wisconsin.
Ido Cohen
Portfolio manager, is manager of Invesco V.I. Capital Appreciation Fund. He joined Invesco in 2010. Mr. Cohen is a cum laude graduate of The Wharton School of the University of Pennsylvania with a B.S. in economics.
Invesco V.I. Capital Appreciation Fund
Your Fund’s Long-Term Performance
Results of a $10,000 Investment – Oldest Share Class(es)
Fund and index data from 12/31/01*
| |
| * | During the reporting period, Invesco changed its policy regarding growth of $10,000 charts. For funds older than 10 years, we previously showed performance since inception. Going forward, we will show performance for the most recent 10 years, since this more accurately reflects the experience of the typical shareholder. As a result, charts now may include benchmarks that did not appear previously, because the funds’ inception pre-dated the benchmarks’ inception. Also, all charts will now be presented using a linear format. |
Past performance cannot guarantee comparable future results.
Average Annual Total Returns
As of 12/31/11
| | | | | | | | | |
|
| Series I Shares | | | | |
| |
| Inception (5/5/93) | | | 5.30 | % |
| |
| | 10 | | | Years | | | 0.03 | |
| |
| | 5 | | | Years | | | -3.67 | |
| |
| | 1 | | | Year | | | -7.91 | |
| |
| | | | | | | | | |
| Series II Shares | | | | |
| |
| Inception (8/21/01) | | | -0.03 | % |
| |
| | 10 | | | Years | | | -0.22 | |
| |
| | 5 | | | Years | | | -3.91 | |
| |
| | 1 | | | Year | | | -8.12 | |
The performance of the Fund’s Series I and Series II share classes will differ primarily due to different class expenses.
The performance data quoted represent past performance and cannot guarantee comparable future results; current performance may be lower or higher. Please contact your variable product issuer or financial adviser for the most recent month-end variable
product performance. Performance figures reflect Fund expenses, reinvested distributions and changes in net asset value. Investment return and principal value will fluctuate so that you may have a gain or loss when you sell shares.
The total annual Fund operating expense ratio set forth in the most recent Fund prospectus as of the date of this report for Series I and Series II shares was 0.91% and 1.16%, respectively. The expense ratios presented above may vary from the expense ratios presented in other sections of this report that are based on expenses incurred during the period covered by this report.
Invesco V.I. Capital Appreciation Fund, a series portfolio of AIM Variable Insurance Funds (Invesco Variable Insurance Funds), is currently offered through insurance companies issuing variable products. You cannot purchase shares of the Fund directly.
Performance figures given represent the Fund and are not intended to reflect actual variable product values. They do not reflect sales charges, expenses and fees assessed in connection with a variable product. Sales charges, expenses and fees, which are determined by the variable product issuers, will vary and will lower the total return.
The most recent month-end performance data at the Fund level, excluding variable product charges, is available at 800 451 4246. As mentioned above, for the most recent month-end performance including variable product charges, please contact your variable product issuer or financial adviser.
Invesco V.I. Capital Appreciation Fund
Invesco V.I. Capital Appreciation Fund’s investment objective is long-term growth of capital.
| n | | Unless otherwise stated, information presented in this report is as of December 31, 2011, and is based on total net assets. |
| |
| n | | Unless otherwise noted, all data provided by Invesco. |
| |
| n | | To access your Fund’s reports/prospectus, visit invesco.com/fundreports. |
Principal risks of investing
in the Fund
Active trading risk. The Fund engages in frequent trading of portfolio securities. Active trading results in added expenses and may result in a lower return.
Foreign securities risk. The Fund’s foreign investments may be affected by changes in a foreign country’s exchange rates; political and social instability; changes in economic or taxation policies; difficulties when enforcing obligations; decreased liquidity; and increased volatility. Foreign companies may be subject to less regulation resulting in less publicly available information about the companies.
Management risk. The investment techniques and risk analysis used by the Fund’s portfolio managers may not produce the desired results.
Market risk. The prices of and the income generated by the Fund’s securities may decline in response to, among other things, investor sentiment; general economic and market conditions; regional or global instability; and currency and interest rate fluctuations.
About indexes used in this report
The S&P 500® Index is an unmanaged index considered representative of the U.S. stock market.
The Russell 1000® Growth Index is an unmanaged index considered representative of large-cap growth stocks. The Russell 1000 Growth Index is a trademark/service market of the Frank Russell Co. Russell® is a trademark of the Frank Russell Co.
The Lipper VUF Multi-Cap Growth Funds Category Average represents an average of all of the variable insurance underlying funds in the Lipper Multi-Cap Growth Funds category.
The Fund is not managed to track the performance of any particular index, including the indexes defined here, and consequently, the performance of the Fund may deviate significantly from the performance of the indexes.
A direct investment cannot be made in an index. Unless otherwise indicated, index results include reinvested dividends, and they do not reflect sales charges. Performance of the peer group, if applicable, reflects fund expenses; performance of a market index does not.
Other information
The Chartered Financial Analyst® (CFA®) designation is globally recognized and attests to a charterholder’s success in a rigorous and comprehensive study program in the field of investment management and research analysis.
Industry classifications used in this report are generally according to the Global Industry Classification Standard, which was developed by and is the exclusive property and a service mark of MSCI Inc. and Standard & Poor’s.
The returns shown in management’s discussion of Fund performance are based on net asset values calculated for shareholder transactions. Generally accepted accounting principles require adjustments to be made to the net assets of the Fund at period end for financial reporting purposes, and as such, the net asset values for shareholder transactions and the returns based on those net asset values may differ from the net asset values and returns reported in the Financial Highlights. Additionally, the returns and net asset values shown throughout this report are at the Fund level only and do not include variable product issuer charges. If such charges were included, the total returns would be lower.
Invesco V.I. Capital Appreciation Fund
Schedule of Investments(a)
December 31, 2011
| | | | | | | | | |
| | | Shares | | Value |
| |
Common Stocks & Other Equity Interests–98.36%
| | | | |
Aerospace & Defense–2.62%
| | | | |
| Boeing Co. (The) | | | 53,034 | | | $ | 3,890,044 | |
| |
| Precision Castparts Corp. | | | 60,983 | | | | 10,049,388 | |
| |
| | | | | | | | 13,939,432 | |
| |
Apparel Retail–0.12%
| | | | |
| Limited Brands, Inc. | | | 16,469 | | | | 664,524 | |
| |
Apparel, Accessories & Luxury Goods–0.99%
| | | | |
| Coach, Inc. | | | 27,115 | | | | 1,655,100 | |
| |
Prada S.p.A. (Italy)(b)(c) | | | 347,300 | | | | 1,562,230 | |
| |
Prada S.p.A. (Italy)(c) | | | 455,500 | | | | 2,048,936 | |
| |
| | | | | | | | 5,266,266 | |
| |
Application Software–1.19%
| | | | |
Citrix Systems, Inc.(c) | | | 103,927 | | | | 6,310,447 | |
| |
Asset Management & Custody Banks–1.40%
| | | | |
| BlackRock, Inc. | | | 41,690 | | | | 7,430,826 | |
| |
Auto Parts & Equipment–0.30%
| | | | |
BorgWarner, Inc.(c) | | | 24,815 | | | | 1,581,708 | |
| |
Automotive Retail–0.57%
| | | | |
AutoZone, Inc.(c) | | | 9,322 | | | | 3,029,370 | |
| |
Biotechnology–1.90%
| | | | |
Celgene Corp.(c) | | | 60,331 | | | | 4,078,376 | |
| |
Gilead Sciences, Inc.(c) | | | 147,744 | | | | 6,047,162 | |
| |
| | | | | | | | 10,125,538 | |
| |
Cable & Satellite–4.45%
| | | | |
| Comcast Corp.–Class A | | | 265,532 | | | | 6,295,764 | |
| |
DIRECTV–Class A(c) | | | 406,260 | | | | 17,371,677 | |
| |
| | | | | | | | 23,667,441 | |
| |
Casinos & Gaming–0.79%
| | | | |
Las Vegas Sands Corp.(c) | | | 98,801 | | | | 4,221,767 | |
| |
Communications Equipment–3.61%
| | | | |
F5 Networks, Inc.(c) | | | 21,252 | | | | 2,255,262 | |
| |
Juniper Networks, Inc.(c) | | | 68,044 | | | | 1,388,778 | |
| |
| QUALCOMM Inc. | | | 284,420 | | | | 15,557,774 | |
| |
| | | | | | | | 19,201,814 | |
| |
Computer Hardware–6.94%
| | | | |
Apple Inc.(c) | | | 91,142 | | | | 36,912,510 | |
| |
Computer Storage & Peripherals–3.37%
| | | | |
EMC Corp.(c) | | | 535,947 | | | | 11,544,298 | |
| |
NetApp, Inc.(c) | | | 119,966 | | | | 4,351,167 | |
| |
SanDisk Corp.(c) | | | 40,721 | | | | 2,003,881 | |
| |
| | | | | | | | 17,899,346 | |
| |
Construction & Engineering–1.09%
| | | | |
Foster Wheeler AG (Switzerland)(c) | | | 301,569 | | | | 5,772,031 | |
| |
Construction & Farm Machinery & Heavy Trucks–1.47%
| | | | |
| Cummins Inc. | | | 68,759 | | | | 6,052,167 | |
| |
Navistar International Corp.(c) | | | 46,304 | | | | 1,753,996 | |
| |
| | | | | | | | 7,806,163 | |
| |
Data Processing & Outsourced Services–2.61%
| | | | |
| MasterCard, Inc.–Class A | | | 37,275 | | | | 13,896,866 | |
| |
Department Stores–1.83%
| | | | |
| Macy’s, Inc. | | | 301,947 | | | | 9,716,654 | |
| |
Drug Retail–2.48%
| | | | |
| CVS Caremark Corp. | | | 323,205 | | | | 13,180,300 | |
| |
Fertilizers & Agricultural Chemicals–1.56%
| | | | |
| Monsanto Co. | | | 69,173 | | | | 4,846,952 | |
| |
| Mosaic Co. (The) | | | 68,288 | | | | 3,443,764 | |
| |
| | | | | | | | 8,290,716 | |
| |
Food Retail–0.50%
| | | | |
| Kroger Co. (The) | | | 109,697 | | | | 2,656,861 | |
| |
Footwear–1.02%
| | | | |
| NIKE, Inc.–Class B | | | 56,437 | | | | 5,438,834 | |
| |
General Merchandise Stores–0.34%
| | | | |
Dollar Tree, Inc.(c) | | | 21,701 | | | | 1,803,570 | |
| |
Gold–2.32%
| | | | |
| Barrick Gold Corp. (Canada) | | | 69,568 | | | | 3,147,952 | |
| |
| Goldcorp, Inc. (Canada) | | | 208,072 | | | | 9,207,186 | |
| |
| | | | | | | | 12,355,138 | |
| |
Health Care Distributors–0.16%
| | | | |
| Cardinal Health, Inc. | | | 21,347 | | | | 866,902 | |
| |
Health Care Equipment–0.40%
| | | | |
| Baxter International Inc. | | | 43,362 | | | | 2,145,552 | |
| |
Health Care Services–1.40%
| | | | |
Express Scripts, Inc.(c) | | | 166,165 | | | | 7,425,914 | |
| |
| | | | | | | | | |
| | | | | | | | | |
See accompanying Notes to Financial Statements which are an integral part of the financial statements.
Invesco V.I. Capital Appreciation Fund
| | | | | | | | | |
| | | Shares | | Value |
| |
Health Care Technology–0.82%
| | | | |
Allscripts Healthcare Solutions, Inc.(c) | | | 230,011 | | | $ | 4,356,408 | |
| |
Heavy Electrical Equipment–1.88%
| | | | |
ABB Ltd. (Switzerland)(c) | | | 141,930 | | | | 2,671,766 | |
| |
ABB Ltd.–ADR (Switzerland)(c) | | | 388,390 | | | | 7,313,383 | |
| |
| | | | | | | | 9,985,149 | |
| |
Home Improvement Retail–0.67%
| | | | |
| Home Depot, Inc. (The) | | | 84,607 | | | | 3,556,878 | |
| |
Hotels, Resorts & Cruise Lines–0.63%
| | | | |
| Starwood Hotels & Resorts Worldwide, Inc. | | | 70,020 | | | | 3,358,859 | |
| |
Household Products–2.05%
| | | | |
| Procter & Gamble Co. (The) | | | 163,702 | | | | 10,920,560 | |
| |
Hypermarkets & Super Centers–0.78%
| | | | |
| Costco Wholesale Corp. | | | 49,535 | | | | 4,127,256 | |
| |
Industrial Conglomerates–1.60%
| | | | |
| Danaher Corp. | | | 181,021 | | | | 8,515,228 | |
| |
Industrial Machinery–0.72%
| | | | |
| Ingersoll-Rand PLC (Ireland) | | | 126,153 | | | | 3,843,882 | |
| |
Integrated Oil & Gas–2.16%
| | | | |
| Exxon Mobil Corp. | | | 47,767 | | | | 4,048,731 | |
| |
| Occidental Petroleum Corp. | | | 79,429 | | | | 7,442,497 | |
| |
| | | | | | | | 11,491,228 | |
| |
Internet Retail–2.79%
| | | | |
Amazon.com, Inc.(c) | | | 85,692 | | | | 14,833,285 | |
| |
Internet Software & Services–5.47%
| | | | |
Baidu, Inc.–ADR (China)(c) | | | 34,395 | | | | 4,005,986 | |
| |
eBay Inc.(c) | | | 160,982 | | | | 4,882,584 | |
| |
Google Inc.–Class A(c) | | | 31,290 | | | | 20,210,211 | |
| |
| | | | | | | | 29,098,781 | |
| |
IT Consulting & Other Services–3.43%
| | | | |
| Accenture PLC–Class A (Ireland) | | | 148,065 | | | | 7,881,500 | |
| |
Cognizant Technology Solutions Corp.–Class A(c) | | | 160,826 | | | | 10,342,720 | |
| |
| | | | | | | | 18,224,220 | |
| |
Life Sciences Tools & Services–1.47%
| | | | |
Agilent Technologies, Inc.(c) | | | 223,216 | | | | 7,796,935 | |
| |
Managed Health Care–2.36%
| | | | |
| UnitedHealth Group Inc. | | | 247,582 | | | | 12,547,456 | |
| |
Oil & Gas Drilling–1.44%
| | | | |
| Ensco PLC–ADR (United Kingdom) | | | 162,865 | | | | 7,641,626 | |
| |
Oil & Gas Equipment & Services–4.87%
| | | | |
Cameron International Corp.(c) | | | 109,469 | | | | 5,384,780 | |
| |
| Halliburton Co. | | | 433,690 | | | | 14,966,642 | |
| |
Weatherford International Ltd.(c) | | | 379,619 | | | | 5,557,622 | |
| |
| | | | | | | | 25,909,044 | |
| |
Oil & Gas Exploration & Production–2.78%
| | | | |
| Anadarko Petroleum Corp. | | | 144,973 | | | | 11,065,789 | |
| |
| Noble Energy, Inc. | | | 39,160 | | | | 3,696,312 | |
| |
| | | | | | | | 14,762,101 | |
| |
Other Diversified Financial Services–2.24%
| | | | |
| JPMorgan Chase & Co. | | | 358,444 | | | | 11,918,263 | |
| |
Packaged Foods & Meats–0.30%
| | | | |
| Mead Johnson Nutrition Co. | | | 23,253 | | | | 1,598,179 | |
| |
Pharmaceuticals–1.64%
| | | | |
| Allergan, Inc. | | | 99,424 | | | | 8,723,462 | |
| |
Railroads–1.57%
| | | | |
| Union Pacific Corp. | | | 78,849 | | | | 8,353,263 | |
| |
Restaurants–1.94%
| | | | |
Krispy Kreme Doughnuts Inc.–Wts., expiring 03/02/12(d) | | | 1,194 | | | | 72 | |
| |
| Starbucks Corp. | | | 224,609 | | | | 10,334,260 | |
| |
| | | | | | | | 10,334,332 | |
| |
Semiconductors–1.53%
| | | | |
Broadcom Corp.–Class A(c) | | | 225,046 | | | | 6,607,350 | |
| |
| Xilinx, Inc. | | | 47,830 | | | | 1,533,430 | |
| |
| | | | | | | | 8,140,780 | |
| |
Soft Drinks–2.22%
| | | | |
Coca-Cola Co. (The) | | | 128,488 | | | | 8,990,305 | |
| |
Hansen Natural Corp.(c) | | | 30,434 | | | | 2,804,189 | |
| |
| | | | | | | | 11,794,494 | |
| |
Systems Software–2.33%
| | | | |
Check Point Software Technologies Ltd. (Israel)(c) | | | 87,385 | | | | 4,591,208 | |
| |
| Oracle Corp. | | | 41,902 | | | | 1,074,786 | |
| |
Rovi Corp.(c) | | | 272,654 | | | | 6,701,836 | |
| |
| | | | | | | | 12,367,830 | |
| |
Trucking–0.92%
| | | | |
| J.B. Hunt Transport Services, Inc. | | | 107,993 | | | | 4,867,245 | |
| |
| | | | | | | | | |
| | | | | | | | | |
See accompanying Notes to Financial Statements which are an integral part of the financial statements.
Invesco V.I. Capital Appreciation Fund
| | | | | | | | | |
| | | Shares | | Value |
| |
Wireless Telecommunication Services–2.32%
| | | | |
| America Movil SAB de C.V.–Series L–ADR (Mexico) | | | 134,919 | | | $ | 3,049,170 | |
| |
| American Tower Corp.–Class A | | | 154,428 | | | | 9,267,224 | |
| |
| | | | | | | | 12,316,394 | |
| |
| Total Common Stocks & Other Equity Interests (Cost $466,669,459) | | | | | | | 522,989,628 | |
| |
Money Market Funds–1.64%
| | | | |
Liquid Assets Portfolio–Institutional Class(e) | | | 4,368,252 | | | | 4,368,252 | |
| |
Premier Portfolio–Institutional Class(e) | | | 4,368,253 | | | | 4,368,253 | |
| |
| Total Money Market Funds (Cost $8,736,505) | | | | | | | 8,736,505 | |
| |
| TOTAL INVESTMENTS–100.00% (Cost $475,405,964) | | | | | | | 531,726,133 | |
| |
| OTHER ASSETS LESS LIABILITIES–0.00% | | | | | | | 15,945 | |
| |
| NET ASSETS–100.00% | | | | | | $ | 531,742,078 | |
| |
Investment Abbreviations:
| | | |
| ADR | | – American Depositary Receipt |
| Wts. | | – Warrants |
Notes to Schedule of Investments:
| | |
| (a) | | Industry and/or sector classifications used in this report are generally according to the Global Industry Classification Standard, which was developed by and is the exclusive property and a service mark of MSCI Inc. and Standard & Poor’s. |
| (b) | | Security purchased or received in a transaction exempt from registration under the Securities Act of 1933, as amended. The security may be resold pursuant to an exemption from registration under the 1933 Act, typically to qualified institutional buyers. The value of this security at December 31, 2011 represented 0.29% of the Fund’s Net Assets. |
| (c) | | Non-income producing security. |
| (d) | | Non-income producing security acquired through a corporate action. |
| (e) | | The money market fund and the Fund are affiliated by having the same investment adviser. |
See accompanying Notes to Financial Statements which are an integral part of the financial statements.
Invesco V.I. Capital Appreciation Fund
Statement of Assets and Liabilities
December 31, 2011
| | | | | |
Assets:
|
| Investments, at value (Cost $466,669,459) | | $ | 522,989,628 | |
| |
| Investments in affiliated money market funds, at value and cost | | | 8,736,505 | |
| |
| Total investments, at value (Cost $475,405,964) | | | 531,726,133 | |
| |
| Receivable for: | | | | |
| Investments sold | | | 2,363,469 | |
| |
| Fund shares sold | | | 100,509 | |
| |
| Dividends | | | 203,784 | |
| |
| Investment for trustee deferred compensation and retirement plans | | | 134,932 | |
| |
| Other assets | | | 388 | |
| |
| Total assets | | | 534,529,215 | |
| |
| | | | | |
| | | | | |
Liabilities:
|
| Payable for: | | | | |
| Investments purchased | | | 1,739,199 | |
| |
| Fund shares reacquired | | | 298,716 | |
| |
| Accrued fees to affiliates | | | 415,382 | |
| |
| Accrued other operating expenses | | | 39,637 | |
| |
| Trustee deferred compensation and retirement plans | | | 294,203 | |
| |
| Total liabilities | | | 2,787,137 | |
| |
| Net assets applicable to shares outstanding | | $ | 531,742,078 | |
| |
| | | | | |
| | | | | |
Net assets consist of:
|
| Shares of beneficial interest | | $ | 706,507,315 | |
| |
| Undistributed net investment income (loss) | | | (289,869 | ) |
| |
| Undistributed net realized gain (loss) | | | (230,795,537 | ) |
| |
| Unrealized appreciation | | | 56,320,169 | |
| |
| | | $ | 531,742,078 | |
| |
| | | | | |
| | | | | |
Net Assets:
|
| Series I | | $ | 383,916,540 | |
| |
| Series II | | $ | 147,825,538 | |
| |
| | | | | |
| | | | | |
Shares outstanding, $0.001 par value per share, with an unlimited number of shares authorized:
|
| Series I | | | 17,925,665 | |
| |
| Series II | | | 7,020,795 | |
| |
| Series I: | | | | |
| Net asset value per share | | $ | 21.42 | |
| |
| Series II: | | | | |
| Net asset value per share | | $ | 21.06 | |
| |
Statement of Operations
For the year ended December 31, 2011
| | | | | |
Investment income:
|
| Dividends (net of foreign withholding taxes of $37,724) | | $ | 5,922,067 | |
| |
| Dividends from affiliated money market funds (includes securities lending income of $4,376) | | | 19,737 | |
| |
| Total investment income | | | 5,941,804 | |
| |
| | | | | |
| | | | | |
Expenses:
|
| Advisory fees | | | 3,863,883 | |
| |
| Administrative services fees | | | 1,602,073 | |
| |
| Custodian fees | | | 22,757 | |
| |
| Distribution fees — Series II | | | 428,792 | |
| |
| Transfer agent fees | | | 62,019 | |
| |
| Trustees’ and officers’ fees and benefits | | | 45,137 | |
| |
| Other | | | 65,226 | |
| |
| Total expenses | | | 6,089,887 | |
| |
| Less: Fees waived | | | (22,772 | ) |
| |
| Net expenses | | | 6,067,115 | |
| |
| Net investment income (loss) | | | (125,311 | ) |
| |
| | | | | |
| | | | | |
Realized and unrealized gain (loss) from:
|
| Net realized gain from: | | | | |
| Investment securities (includes net gains from securities sold to affiliates of $149,410) | | | 57,777,721 | |
| |
| Foreign currencies | | | 57,222 | |
| |
| | | | 57,834,943 | |
| |
| Change in net unrealized appreciation (depreciation) of investment securities | | | (103,856,532 | ) |
| |
| Net realized and unrealized gain (loss) | | | (46,021,589 | ) |
| |
| Net increase (decrease) in net assets resulting from operations | | $ | (46,146,900 | ) |
| |
See accompanying Notes to Financial Statements which are an integral part of the financial statements.
Invesco V.I. Capital Appreciation Fund
Statement of Changes in Net Assets
For the years ended December 31, 2011 and 2010
| | | | | | | | | |
| | | 2011 | | 2010 |
| |
Operations:
| | | | |
| Net investment income (loss) | | $ | (125,311 | ) | | $ | 735,384 | |
| |
| Net realized gain | | | 57,834,943 | | | | 45,392,890 | |
| |
| Change in net unrealized appreciation (depreciation) | | | (103,856,532 | ) | | | 47,561,475 | |
| |
| Net increase (decrease) in net assets resulting from operations | | | (46,146,900 | ) | | | 93,689,749 | |
| |
Distributions to shareholders from net investment income:
| | | | |
| Series I | | | (666,196 | ) | | | (3,537,619 | ) |
| |
| Series II | | | — | | | | (915,129 | ) |
| |
| Total distributions from net investment income | | | (666,196 | ) | | | (4,452,748 | ) |
| |
Share transactions–net:
| | | | |
| Series I | | | (80,956,764 | ) | | | (78,894,363 | ) |
| |
| Series II | | | (24,185,092 | ) | | | (32,232,888 | ) |
| |
| Net increase (decrease) in net assets resulting from share transactions | | | (105,141,856 | ) | | | (111,127,251 | ) |
| |
| Net increase (decrease) in net assets | | | (151,954,952 | ) | | | (21,890,250 | ) |
| |
Net assets:
| | | | |
| Beginning of year | | | 683,697,030 | | | | 705,587,280 | |
| |
| End of year (includes undistributed net investment income (loss) of $(289,869) and $379,618, respectively) | | $ | 531,742,078 | | | $ | 683,697,030 | |
| |
Notes to Financial Statements
December 31, 2011
NOTE 1—Significant Accounting Policies
Invesco V.I. Capital Appreciation Fund (the “Fund”) is a series portfolio of AIM Variable Insurance Funds (Invesco Variable Insurance Funds) (the “Trust”). The Trust is a Delaware statutory trust registered under the Investment Company Act of 1940, as amended (the “1940 Act”), as an open-end series management investment company consisting of twenty-eight separate portfolios, (each constituting a “Fund”). The assets, liabilities and operations of each portfolio are accounted for separately. Information presented in these financial statements pertains only to the Fund. Matters affecting each Fund or class will be voted on exclusively by the shareholders of such Fund or class. Current Securities and Exchange Commission (“SEC”) guidance, however, requires participating insurance companies offering separate accounts to vote shares proportionally in accordance with the instructions of the contract owners whose investments are funded by shares of each Fund or class.
The Fund’s investment objective is long-term growth of capital.
The Fund currently offers two classes of shares, Series I and Series II, both of which are offered to insurance company separate accounts funding variable annuity contracts and variable life insurance policies (“variable products”).
The following is a summary of the significant accounting policies followed by the Fund in the preparation of its financial statements.
| | |
| A. | | Security Valuations — Securities, including restricted securities, are valued according to the following policy. |
| | A security listed or traded on an exchange (except convertible bonds) is valued at its last sales price or official closing price as of the close of the customary trading session on the exchange where the security is principally traded, or lacking any sales or official closing price on a particular day, the security may be valued at the closing bid price on that day. Securities traded in the over-the-counter market are valued based on prices furnished by independent pricing services or market makers. When such securities are valued by an independent pricing service they may be considered fair valued. Futures contracts are valued at the final settlement price set by an exchange on which they are principally traded. Listed options are valued at the mean between the last bid and ask prices from the exchange on which they are principally traded. Options not listed on an exchange are valued by an independent source at the mean between the last bid and ask prices. For purposes of determining net asset value per share, futures and option contracts generally are valued 15 minutes after the close of the customary trading session of the New York Stock Exchange (“NYSE”). |
| | Investments in open-end and closed-end registered investment companies that do not trade on an exchange are valued at the end of day net asset value per share. Investments in open-end and closed-end registered investment companies that trade on an exchange are valued at the last sales price or official closing price as of the close of the customary trading session on the exchange where the security is principally traded. |
| | Debt obligations (including convertible bonds) and unlisted equities are fair valued using an evaluated quote provided by an independent pricing service. Evaluated quotes provided by the pricing service may be determined without exclusive reliance on quoted prices, and may reflect appropriate factors such as |
Invesco V.I. Capital Appreciation Fund
| | |
| | institution-size trading in similar groups of securities, developments related to specific securities, dividend rate, yield, quality, type of issue, coupon rate, maturity, individual trading characteristics and other market data. Debt securities are subject to interest rate and credit risks. In addition, all debt securities involve some risk of default with respect to interest and/or principal payments. |
| | Foreign securities (including foreign exchange contracts) are converted into U.S. dollar amounts using the applicable exchange rates as of the close of the NYSE. If market quotations are available and reliable for foreign exchange traded equity securities, the securities will be valued at the market quotations. Because trading hours for certain foreign securities end before the close of the NYSE, closing market quotations may become unreliable. If between the time trading ends on a particular security and the close of the customary trading session on the NYSE, events occur that are significant and make the closing price unreliable, the Fund may fair value the security. If the event is likely to have affected the closing price of the security, the security will be valued at fair value in good faith using procedures approved by the Board of Trustees. Adjustments to closing prices to reflect fair value may also be based on a screening process of an independent pricing service to indicate the degree of certainty, based on historical data, that the closing price in the principal market where a foreign security trade is not the current value as of the close of the NYSE. Foreign securities meeting the approved degree of certainty that the price is not reflective of current value will be priced at the indication of fair value from the independent pricing service. Multiple factors may be considered by the independent pricing service in determining adjustments to reflect fair value and may include information relating to sector indices, American Depositary Receipts and domestic and foreign index futures. Foreign securities may have additional risks including exchange rate changes, potential for sharply devalued currencies and high inflation, political and economic upheaval, the relative lack of issuer information, relatively low market liquidity and the potential lack of strict financial and accounting controls and standards. |
| | Securities for which market prices are not provided by any of the above methods may be valued based upon quotes furnished by independent sources. The last bid price may be used to value equity securities. The mean between the last bid and asked prices is used to value debt obligations, including Corporate Loans. |
| | Securities for which market quotations are not readily available or are unreliable are valued at fair value as determined in good faith by or under the supervision of the Trust’s officers following procedures approved by the Board of Trustees. Issuer specific events, market trends, bid/ask quotes of brokers and information providers and other market data may be reviewed in the course of making a good faith determination of a security’s fair value. |
| | Valuations change in response to many factors including the historical and prospective earnings of the issuer, the value of the issuer’s assets, general economic conditions, interest rates, investor perceptions and market liquidity. Because of the inherent uncertainties of valuation, the values reflected in the financial statements may materially differ from the value received upon actual sale of those investments. |
| B. | | Securities Transactions and Investment Income — Securities transactions are accounted for on a trade date basis. Realized gains or losses on sales are computed on the basis of specific identification of the securities sold. Interest income is recorded on the accrual basis from settlement date. Dividend income (net of withholding tax, if any) is recorded on the ex-dividend date. |
| | The Fund may periodically participate in litigation related to Fund investments. As such, the Fund may receive proceeds from litigation settlements. Any proceeds received are included in the Statement of Operations as realized gain (loss) for investments no longer held and as unrealized gain (loss) for investments still held. |
| | Brokerage commissions and mark ups are considered transaction costs and are recorded as an increase to the cost basis of securities purchased and/or a reduction of proceeds on a sale of securities. Such transaction costs are included in the determination of net realized and unrealized gain (loss) from investment securities reported in the Statement of Operations and the Statement of Changes in Net Assets and the net realized and unrealized gains (losses) on securities per share in the Financial Highlights. Transaction costs are included in the calculation of the Fund’s net asset value and, accordingly, they reduce the Fund’s total returns. These transaction costs are not considered operating expenses and are not reflected in net investment income reported in the Statement of Operations and Statement of Changes in Net Assets, or the net investment income per share and ratios of expenses and net investment income reported in the Financial Highlights, nor are they limited by any expense limitation arrangements between the Fund and the investment adviser. |
| | The Fund allocates income and realized and unrealized capital gains and losses to a class based on the relative net assets of each class. |
| C. | | Country Determination — For the purposes of making investment selection decisions and presentation in the Schedule of Investments, the investment adviser may determine the country in which an issuer is located and/or credit risk exposure based on various factors. These factors include the laws of the country under which the issuer is organized, where the issuer maintains a principal office, the country in which the issuer derives 50% or more of its total revenues and the country that has the primary market for the issuer’s securities, as well as other criteria. Among the other criteria that may be evaluated for making this determination are the country in which the issuer maintains 50% or more of its assets, the type of security, financial guarantees and enhancements, the nature of the collateral and the sponsor organization. Country of issuer and/or credit risk exposure has been determined to be the United States of America, unless otherwise noted. |
| D. | | Distributions — Distributions from income and net realized capital gain, if any, are generally paid to separate accounts of participating insurance companies annually and recorded on ex-dividend date. |
| E. | | Federal Income Taxes — The Fund intends to comply with the requirements of Subchapter M of the Internal Revenue Code necessary to qualify as a regulated investment company and to distribute substantially all of the Fund’s taxable earnings to shareholders. As such, the Fund will not be subject to federal income taxes on otherwise taxable income (including net realized capital gain) that is distributed to shareholders. Therefore, no provision for federal income taxes is recorded in the financial statements. |
| | The Fund files tax returns in the U.S. Federal jurisdiction and certain other jurisdictions. Generally, the Fund is subject to examinations by such taxing authorities for up to three years after the filing of the return for the tax period. |
| F. | | Expenses — Fees provided for under the Rule 12b-1 plan of a particular class of the Fund and which are directly attributable to that class are charged to the operations of such class. All other expenses are allocated among the classes based on relative net assets. |
| G. | | Accounting Estimates — The preparation of financial statements in conformity with accounting principles generally accepted in the United States of America (“GAAP”) requires management to make estimates and assumptions that affect the reported amounts of assets and liabilities at the date of the financial statements and the reported amounts of revenues and expenses during the reporting period including estimates and assumptions related to |
Invesco V.I. Capital Appreciation Fund
| | |
| | taxation. Actual results could differ from those estimates by a significant amount. In addition, the Fund monitors for material events or transactions that may occur or become known after the period-end date and before the date the financial statements are released to print. |
| H. | | Indemnifications — Under the Trust’s organizational documents, each Trustee, officer, employee or other agent of the Trust is indemnified against certain liabilities that may arise out of performance of their duties to the Fund. Additionally, in the normal course of business, the Fund enters into contracts, including the Fund’s servicing agreements that contain a variety of indemnification clauses. The Fund’s maximum exposure under these arrangements is unknown as this would involve future claims that may be made against the Fund that have not yet occurred. The risk of material loss as a result of such indemnification claims is considered remote. |
| I. | | Securities Lending — The Fund may lend portfolio securities having a market value up to one-third of the Fund’s total assets. Such loans are secured by collateral equal to no less than the market value of the loaned securities determined daily by the securities lending provider. Such collateral will be cash or debt securities issued or guaranteed by the U.S. Government or any of its sponsored agencies. Cash collateral received in connection with these loans is invested in short-term money market instruments or affiliated money market funds and is shown as such on the Schedule of Investments. It is the Fund’s policy to obtain additional collateral from or return excess collateral to the borrower by the end of the next business day, following the valuation date of the securities loaned. Therefore, the value of the collateral held may be temporarily less than the value of the securities on loan. Lending securities entails a risk of loss to the Fund if and to the extent that the market value of the securities loaned were to increase and the borrower did not increase the collateral accordingly, and the borrower fails to return the securities. Upon the failure of the borrower to return the securities, collateral may be liquidated and the securities may be purchased on the open market to replace the loaned securities. The Fund could experience delays and costs in gaining access to the collateral. The Fund bears the risk of any deficiency in the amount of the collateral available for return to the borrower due to any loss on the collateral invested. Dividends received on cash collateral investments for securities lending transactions, which are net of compensation to counterparties, is included in Dividends from affiliates on the Statement of Operations. The aggregate value of securities out on loan is shown as a footnote on the Statement of Assets and Liabilities, if any. |
| J. | | Foreign Currency Translations — Foreign currency is valued at the close of the NYSE based on quotations posted by banks and major currency dealers. Portfolio securities and other assets and liabilities denominated in foreign currencies are translated into U.S. dollar amounts at date of valuation. Purchases and sales of portfolio securities (net of foreign taxes withheld on disposition) and income items denominated in foreign currencies are translated into U.S. dollar amounts on the respective dates of such transactions. The Fund does not separately account for the portion of the results of operations resulting from changes in foreign exchange rates on investments and the fluctuations arising from changes in market prices of securities held. The combined results of changes in foreign exchange rates and the fluctuation of market prices on investments (net of estimated foreign tax withholding) are included with the net realized and unrealized gain or loss from investments in the Statement of Operations. Reported net realized foreign currency gains or losses arise from (1) sales of foreign currencies, (2) currency gains or losses realized between the trade and settlement dates on securities transactions, and (3) the difference between the amounts of dividends, interest, and foreign withholding taxes recorded on the Fund’s books and the U.S. dollar equivalent of the amounts actually received or paid. Net unrealized foreign currency gains and losses arise from changes in the fair values of assets and liabilities, other than investments in securities at fiscal period end, resulting from changes in exchange rates. |
| | The Fund may invest in foreign securities which may be subject to foreign taxes on income, gains on investments or currency repatriation, a portion of which may be recoverable. |
| K. | | Foreign Currency Contracts — The Fund may enter into foreign currency contracts to manage or minimize currency or exchange rate risk. The Fund may also enter into foreign currency contracts for the purchase or sale of a security denominated in a foreign currency in order to “lock in” the U.S. dollar price of that security. A foreign currency contract is an obligation to purchase or sell a specific currency for an agreed-upon price at a future date. The use of foreign currency contracts does not eliminate fluctuations in the price of the underlying securities the Fund owns or intends to acquire but establishes a rate of exchange in advance. Fluctuations in the value of these contracts are measured by the difference in the contract date and reporting date exchange rates and are recorded as unrealized appreciation (depreciation) until the contracts are closed. When the contracts are closed, realized gains (losses) are recorded. Realized and unrealized gains (losses) on the contracts are included in the Statement of Operations. The primary risks associated with foreign currency contracts include failure of the counterparty to meet the terms of the contract and the value of the foreign currency changing unfavorably. These risks may be in excess of the amounts reflected in the Statement of Assets and Liabilities. |
NOTE 2—Advisory Fees and Other Fees Paid to Affiliates
The Trust has entered into a master investment advisory agreement with Invesco Advisers, Inc. (the “Adviser” or “Invesco”). Under the terms of the investment advisory agreement, the Fund pays an advisory fee to the Adviser based on the annual rate of the Fund’s average daily net assets as follows:
| | | | | |
| Average Daily Net Assets | | Rate |
| |
| First $250 million | | | 0 | .65% |
| |
| Over $250 million | | | 0 | .60% |
| |
Under the terms of a master sub-advisory agreement between the Adviser and each of Invesco Asset Management Deutschland GmbH, Invesco Asset Management Limited, Invesco Asset Management (Japan) Limited, Invesco Australia Limited, Invesco Hong Kong Limited, Invesco Senior Secured Management, Inc. and Invesco Canada Ltd. (collectively, the “Affiliated Sub-Advisers”) the Adviser, not the Fund, may pay 40% of the fees paid to the Adviser to any such Affiliated Sub-Adviser(s) that provide discretionary investment management services to the Fund based on the percentage of assets allocated to such Sub-Adviser(s).
The Adviser has contractually agreed, through at least April 30, 2013, to waive advisory fees and/or reimburse expenses of all shares to the extent necessary to limit total annual fund operating expenses after fee waiver and/or expense reimbursement (excluding certain items discussed below) of Series I shares to 1.30% and Series II shares to 1.45% of average daily net assets. In determining the Adviser’s obligation to waive advisory fees and/or reimburse expenses, the following
Invesco V.I. Capital Appreciation Fund
expenses are not taken into account, and could cause the total annual fund operating expenses after fee waiver and/or expense reimbursement to exceed the numbers reflected above: (1) interest; (2) taxes; (3) dividend expense on short sales; (4) extraordinary or non-routine items, including litigation expenses; and (5) expenses that the Fund has incurred but did not actually pay because of an expense offset arrangement. Unless the Board of the Trustees and Invesco mutually agree to amend or continue the fee waiver agreement, it will terminate on April 30, 2013. The Adviser did not waive fees and/or reimburse expenses during the period under this expense limitation.
Further, the Adviser has contractually agreed, through at least June 30, 2012, to waive the advisory fee payable by the Fund in an amount equal to 100% of the net advisory fees the Adviser receives from the affiliated money market funds on investments by the Fund of uninvested cash (excluding investments of cash collateral from securities lending) in such affiliated money market funds.
For the year ended December 31, 2011, the Adviser waived advisory fees of $22,772.
The Trust has entered into a master administrative services agreement with Invesco pursuant to which the Fund has agreed to pay Invesco a fee for costs incurred in providing accounting services and fund administrative services to the Fund and to reimburse Invesco for administrative services fees paid to insurance companies that have agreed to provide services to the participants of separate accounts. These administrative services provided by the insurance companies may include, among other things: the printing of prospectuses, financial reports and proxy statements and the delivery of the same to existing participants; the maintenance of master accounts; the facilitation of purchases and redemptions requested by the participants; and the servicing of participants’ accounts. Pursuant to such agreement, for the year ended December 31, 2011, Invesco was paid $153,324 for accounting and fund administrative services and reimbursed $1,448,749 for services provided by insurance companies.
The Trust has entered into a transfer agency and service agreement with Invesco Investment Services, Inc. (“IIS”) pursuant to which the Fund has agreed to pay IIS a fee for providing transfer agency and shareholder services to the Fund and reimburse IIS for certain expenses incurred by IIS in the course of providing such services. For the year ended December 31, 2011, expenses incurred under the agreement are shown in the Statement of Operations as transfer agent fees.
The Trust has entered into a master distribution agreement with Invesco Distributors, Inc. (“IDI”) to serve as the distributor for the Fund. The Trust has adopted a plan pursuant to Rule 12b-1 under the 1940 Act with respect to the Fund’s Series II shares (the “Plan”). The Fund, pursuant to the Plan, pays IDI compensation at the annual rate of 0.25% of the Fund’s average daily net assets of Series II shares. Of the Plan payments, up to 0.25% of the average daily net assets of the Series II shares may be paid to insurance companies who furnish continuing personal shareholder services to customers who purchase and own Series II shares of the Fund. For the year ended December 31, 2011, expenses incurred under the Plan are detailed in the Statement of Operations as distribution fees.
Certain officers and trustees of the Trust are officers and directors of the Adviser, IIS and/or IDI.
NOTE 3—Additional Valuation Information
GAAP defines fair value as the price that would be received to sell an asset or paid to transfer a liability in an orderly transaction between market participants at the measurement date, under current market conditions. GAAP establishes a hierarchy that prioritizes the inputs to valuation methods giving the highest priority to readily available unadjusted quoted prices in an active market for identical assets (Level 1) and the lowest priority to significant unobservable inputs (Level 3) generally when market prices are not readily available or are unreliable. Based on the valuation inputs, the securities or other investments are tiered into one of three levels. Changes in valuation methods may result in transfers in or out of an investment’s assigned level:
| | |
| | Level 1 — | Prices are determined using quoted prices in an active market for identical assets. |
| | Level 2 — | Prices are determined using other significant observable inputs. Observable inputs are inputs that other market participants may use in pricing a security. These may include quoted prices for similar securities, interest rates, prepayment speeds, credit risk, yield curves, loss severities, default rates, discount rates, volatilities and others. |
| | Level 3 — | Prices are determined using significant unobservable inputs. In situations where quoted prices or observable inputs are unavailable (for example, when there is little or no market activity for an investment at the end of the period), unobservable inputs may be used. Unobservable inputs reflect the Fund’s own assumptions about the factors market participants would use in determining fair value of the securities or instruments and would be based on the best available information. |
The following is a summary of the tiered valuation input levels, as of December 31, 2011. The level assigned to the securities valuations may not be an indication of the risk or liquidity associated with investing in those securities. Because of the inherent uncertainties of valuation, the values reflected in the financial statements may materially differ from the value received upon actual sale of those investments.
During the year ended December 31, 2011, there were no significant transfers between investment levels.
| | | | | | | | | | | | | | | | | |
| | | Level 1 | | Level 2 | | Level 3 | | Total |
| |
| Equity Securities | | $ | 528,114,967 | | | $ | 3,611,166 | | | $ | — | | | $ | 531,726,133 | |
| |
NOTE 4—Security Transactions with Affiliated Funds
The Fund is permitted to purchase or sell securities from or to certain other Invesco Funds under specified conditions outlined in procedures adopted by the Board of Trustees of the Trust. The procedures have been designed to ensure that any purchase or sale of securities by the Fund from or to another fund or portfolio that is or could be considered an affiliate by virtue of having a common investment adviser (or affiliated investment advisers), common Trustees and/or common officers complies with Rule 17a-7 of the 1940 Act. Further, as defined under the procedures, each transaction is effected at the current market price. Pursuant to these procedures, for the year ended December 31, 2011, the Fund engaged in securities purchases of $12,754,416 and securities sales of $8,049,534, which resulted in net realized gains of $149,410.
Invesco V.I. Capital Appreciation Fund
NOTE 5—Trustees’ and Officers’ Fees and Benefits
“Trustees’ and Officers’ Fees and Benefits” include amounts accrued by the Fund to pay remuneration to certain Trustees and Officers of the Fund. Trustees have the option to defer compensation payable by the Fund, and “Trustees’ and Officers’ Fees and Benefits” also include amounts accrued by the Fund to fund such deferred compensation amounts. Those Trustees who defer compensation have the option to select various Invesco Funds in which their deferral accounts shall be deemed to be invested. Finally, certain current Trustees are eligible to participate in a retirement plan that provides for benefits to be paid upon retirement to Trustees over a period of time based on the number of years of service. The Fund may have certain former Trustees who also participate in a retirement plan and receive benefits under such plan. “Trustees’ and Officers’ Fees and Benefits” include amounts accrued by the Fund to fund such retirement benefits. Obligations under the deferred compensation and retirement plans represent unsecured claims against the general assets of the Fund.
During the year ended December 31, 2011, the Fund paid legal fees of $1,943 for services rendered by Kramer, Levin, Naftalis & Frankel LLP as counsel to the Independent Trustees. A partner of that firm is a Trustee of the Trust.
NOTE 6—Cash Balances
The Fund is permitted to temporarily carry a negative or overdrawn balance in its account with State Street Bank and Trust Company, the custodian bank. To compensate the custodian bank for such overdrafts, the overdrawn Fund may either (1) leave funds as a compensating balance in the account so the custodian bank can be compensated by earning the additional interest; or (2) compensate by paying the custodian bank at a rate agreed upon by the custodian bank and Invesco, not to exceed the contractually agreed upon rate.
NOTE 7—Distributions to Shareholders and Tax Components of Net Assets
Tax Character of Distributions to Shareholders Paid During the Years Ended December 31, 2011 and 2010:
| | | | | | | | | |
| | | 2011 | | 2010 |
| |
| Ordinary income | | $ | 666,196 | | | $ | 4,452,748 | |
| |
Tax Components of Net Assets at Period-End:
| | | | | |
| | | 2011 |
| |
| Net unrealized appreciation — investments | | $ | 53,902,447 | |
| |
| Temporary book/tax differences | | | (289,869 | ) |
| |
| Capital loss carryforward | | | (228,377,815 | ) |
| |
| Shares of beneficial interest | | | 706,507,315 | |
| |
| Total net assets | | $ | 531,742,078 | |
| |
The difference between book-basis and tax-basis unrealized appreciation (depreciation) is due to differences in the timing of recognition of gains and losses on investments for tax and book purposes. The Fund’s net unrealized appreciation difference is attributable primarily to wash sales.
The temporary book/tax differences are a result of timing differences between book and tax recognition of income and/or expenses. The Fund’s temporary book/tax differences are the result of the trustee deferral of compensation and retirement plan benefits.
Capital loss carryforward is calculated and reported as of a specific date. Results of transactions and other activity after that date may affect the amount of capital loss carryforward actually available for the Fund to utilize. The Regulated Investment Company Modernization Act of 2010 (the “Act”) eliminated the eight-year carryover period for capital losses that arise in taxable years beginning after its enactment date of December 22, 2010. Consequently, these capital losses can be carried forward for an unlimited period. However, capital losses with an expiration period may not be used to offset capital gains until all net capital losses without an expiration date have been utilized. Additionally, post-enactment capital loss carryovers will retain their character as either short-term or long-term capital losses instead of as short-term capital losses as under prior law. The ability to utilize capital loss carryforward in the future may be limited under the Internal Revenue Code and related regulations based on the results of future transactions.
The Fund utilized $56,271,633 of capital loss carryforward in the current period to offset net realized capital gain for federal income tax purposes. The Fund has a capital loss carryforward as of December 31, 2011, which expires as follows:
| | | | | | | | | | | | | |
| Capital Loss Carryforward* |
| Expiration | | Short-Term | | Long-Term | | Total |
| |
| December 31, 2017 | | $ | 228,377,815 | | | $ | — | | | $ | 228,377,815 | |
| |
| |
| * | Capital loss carryforward as of the date listed above is reduced for limitations, if any, to the extent required by the Internal Revenue Code. |
Invesco V.I. Capital Appreciation Fund
NOTE 8—Investment Securities
The aggregate amount of investment securities (other than short-term securities, U.S. Treasury obligations and money market funds, if any) purchased and sold by the Fund during the year ended December 31, 2011 was $787,064,070 and $882,059,722, respectively. Cost of investments on a tax basis includes the adjustments for financial reporting purposes as of the most recently completed Federal income tax reporting period-end.
| | | | | |
| Unrealized Appreciation (Depreciation) of Investment Securities on a Tax Basis |
| |
| Aggregate unrealized appreciation of investment securities | | $ | 85,530,142 | |
| |
| Aggregate unrealized (depreciation) of investment securities | | | (31,627,695 | ) |
| |
| Net unrealized appreciation of investment securities | | $ | 53,902,447 | |
| |
| Cost of investments for tax purposes is $477,823,686. | | | | |
NOTE 9—Reclassification of Permanent Differences
Primarily as a result of differing book/tax treatment of foreign currency transactions and net operating losses, on December 31, 2011, undistributed net investment income (loss) was increased by $122,020, undistributed net realized gain (loss) was decreased by $15,904 and shares of beneficial interest decreased by $106,116. This reclassification had no effect on the net assets of the Fund.
NOTE 10—Share Information
| | | | | | | | | | | | | | | | | |
| | | Summary of Share Activity |
| |
| | | Year ended December 31, |
| | | 2011(a) | | 2010 |
| | | Shares | | Amount | | Shares | | Amount |
| |
| Sold: | | | | | | | | | | | | | | | | |
| Series I | | | 490,125 | | | $ | 11,275,302 | | | | 587,627 | | | $ | 12,238,362 | |
| |
| Series II | | | 421,024 | | | | 9,533,391 | | | | 512,761 | | | | 10,258,765 | |
| |
| Issued as reinvestment of dividends: | | | | | | | | | | | | | | | | |
| Series I | | | 32,168 | | | | 666,196 | | | | 170,899 | | | | 3,537,619 | |
| |
| Series II | | | — | | | | — | | | | 44,903 | | | | 915,129 | |
| |
| Reacquired: | | | | | | | | | | | | | | | | |
| Series I | | | (3,993,846 | ) | | | (92,898,262 | ) | | | (4,572,413 | ) | | | (94,670,344 | ) |
| |
| Series II | | | (1,480,197 | ) | | | (33,718,483 | ) | | | (2,127,908 | ) | | | (43,406,782 | ) |
| |
| Net increase (decrease) in share activity | | | (4,530,726 | ) | | $ | (105,141,856 | ) | | | (5,384,131 | ) | | $ | (111,127,251 | ) |
| |
| | |
| (a) | | There are entities that are record owners of more than 5% of the outstanding shares of the Fund and in the aggregate own 41% of the outstanding shares of the Fund. The Fund and the Fund’s principal underwriter or adviser, are parties to participation agreements with these entities whereby these entities sell units of interest in separate accounts funding variable products that are invested in the Fund. The Fund, Invesco and/or Invesco affiliates may make payments to these entities, which are considered to be related to the Fund, for providing services to the Fund, Invesco and/or Invesco affiliates including but not limited to services such as, securities brokerage, third party record keeping and account servicing and administrative services. The Fund has no knowledge as to whether all or any portion of the shares owned of record by these entities are also owned beneficially. |
Invesco V.I. Capital Appreciation Fund
NOTE 11—Financial Highlights
The following schedule presents financial highlights for a share of the Fund outstanding throughout the periods indicated.
| | | | | | | | | | | | | | | | | | | | | | | | | | | | | | | | | | | | | | | | | | | | | | | | | |
| | | | | | | | | | | | | | | | | | | Ratio of
| | Ratio of
| | | | |
| | | | | | | Net gains
| | | | | | | | | | | | expenses
| | expenses
| | | | |
| | | | | | | (losses) on
| | | | | | | | | | | | to average
| | to average net
| | Ratio of net
| | |
| | | Net asset
| | | | securities
| | | | Dividends
| | | | | | | | net assets
| | assets without
| | investment
| | |
| | | value,
| | Net
| | (both
| | Total from
| | from net
| | Net asset
| | | | Net assets,
| | with fee waivers
| | fee waivers
| | income (loss)
| | |
| | | beginning
| | investment
| | realized and
| | investment
| | investment
| | value, end
| | Total
| | end of period
| | and/or expenses
| | and/or expenses
| | to average
| | Portfolio
|
| | | of period | | income (loss) | | unrealized) | | operations | | income | | of period | | Return(a) | | (000s omitted) | | absorbed | | absorbed | | net assets | | turnover(b) |
| |
| Series I |
| Year ended 12/31/11 | | $ | 23.30 | | | $ | 0.01 | (c) | | $ | (1.85 | ) | | $ | (1.84 | ) | | $ | (0.04 | ) | | $ | 21.42 | | | | (7.91 | )% | | $ | 383,917 | | | | 0.91 | %(d) | | | 0.91 | %(d) | | | 0.06 | %(d) | | | 128 | % |
| Year ended 12/31/10 | | | 20.33 | | | | 0.04 | (c) | | | 3.09 | | | | 3.13 | | | | (0.16 | ) | | | 23.30 | | | | 15.49 | | | | 498,493 | | | | 0.90 | | | | 0.91 | | | | 0.19 | | | | 56 | |
| Year ended 12/31/09 | | | 16.89 | | | | 0.14 | (c) | | | 3.42 | | | | 3.56 | | | | (0.12 | ) | | | 20.33 | | | | 21.08 | | | | 512,540 | | | | 0.90 | | | | 0.91 | | | | 0.79 | | | | 85 | |
| Year ended 12/31/08 | | | 29.37 | | | | 0.09 | (c) | | | (12.57 | ) | | | (12.48 | ) | | | — | | | | 16.89 | | | | (42.49 | ) | | | 492,079 | | | | 0.91 | | | | 0.91 | | | | 0.37 | | | | 103 | |
| Year ended 12/31/07 | | | 26.22 | | | | 0.01 | | | | 3.14 | | | | 3.15 | | | | — | | | | 29.37 | | | | 12.01 | | | | 1,086,677 | | | | 0.88 | | | | 0.88 | | | | 0.03 | | | | 71 | |
| |
| Series II |
| Year ended 12/31/11 | | | 22.92 | | | | (0.04 | )(c) | | | (1.82 | ) | | | (1.86 | ) | | | — | | | | 21.06 | | | | (8.12 | ) | | | 147,826 | | | | 1.16 | (d) | | | 1.16 | (d) | | | (0.19 | )(d) | | | 128 | |
| Year ended 12/31/10 | | | 20.00 | | | | (0.01 | )(c) | | | 3.04 | | | | 3.03 | | | | (0.11 | ) | | | 22.92 | | | | 15.21 | | | | 185,204 | | | | 1.15 | | | | 1.16 | | | | (0.06 | ) | | | 56 | |
| Year ended 12/31/09 | | | 16.61 | | | | 0.09 | (c) | | | 3.35 | | | | 3.44 | | | | (0.05 | ) | | | 20.00 | | | | 20.72 | | | | 193,047 | | | | 1.15 | | | | 1.16 | | | | 0.54 | | | | 85 | |
| Year ended 12/31/08 | | | 28.95 | | | | 0.03 | (c) | | | (12.37 | ) | | | (12.34 | ) | | | — | | | | 16.61 | | | | (42.63 | ) | | | 176,794 | | | | 1.16 | | | | 1.16 | | | | 0.12 | | | | 103 | |
| Year ended 12/31/07 | | | 25.91 | | | | (0.07 | ) | | | 3.11 | | | | 3.04 | | | | — | | | | 28.95 | | | | 11.73 | | | | 349,294 | | | | 1.13 | | | | 1.13 | | | | (0.22 | ) | | | 71 | |
| |
| | |
| (a) | | Includes adjustments in accordance with accounting principles generally accepted in the United States of America and as such, the net asset value for financial reporting purposes and the returns based upon those net asset values may differ from the net asset value and returns for shareholder transactions. Total returns are not annualized for periods less than one year, if applicable and do not reflect charges assessed in connection with a variable product, which if included would reduce total returns. |
| (b) | | Portfolio turnover is calculated at the fund level and is not annualized for periods less than one year, if applicable. |
| (c) | | Calculated using average shares outstanding. |
| (d) | | Ratios are based on average daily net assets (000’s) of $451,630 and $171,517 for Series I and Series II shares, respectively. |
NOTE 12—Proposed Reorganization
The Board of Trustees of the Fund unanimously approved an Agreement and Plan of Reorganization (the “Agreement”) pursuant to which the Fund would transfer all of its assets and liabilities to Invesco Van Kampen V.I. Capital Growth Fund (the “Acquiring Fund”).
The Agreement requires approval of the Fund’s shareholders and will be submitted to the shareholders for their consideration at a meeting to be held in or around April 2012. Upon closing of the reorganization, shareholders of the Fund will receive a corresponding class of shares of the Acquiring Fund in exchange for their shares of the Fund and the Fund will liquidate and cease operations.
Invesco V.I. Capital Appreciation Fund
Report of Independent Registered Public Accounting Firm
To the Board of Trustees of AIM Variable Insurance Funds (Invesco Variable Insurance Funds)
and Shareholders of Invesco V.I. Capital Appreciation Fund:
In our opinion, the accompanying statement of assets and liabilities, including the schedule of investments, and the related statements of operations and of changes in net assets and the financial highlights present fairly, in all material respects, the financial position of Invesco V.I. Capital Appreciation Fund (one of the funds constituting AIM Variable Insurance Funds (Invesco Variable Insurance Funds), hereafter referred to as the “Fund”) at December 31, 2011, the results of its operations for the year then ended, and the changes in its net assets for each of the two years in the period then ended and the financial highlights for each of the five years in the period then ended, in conformity with accounting principles generally accepted in the United States of America. These financial statements and financial highlights (hereafter referred to as “financial statements”) are the responsibility of the Fund’s management; our responsibility is to express an opinion on these financial statements based on our audits. We conducted our audits of these financial statements in accordance with the standards of the Public Company Accounting Oversight Board (United States). Those standards require that we plan and perform the audits to obtain reasonable assurance about whether the financial statements are free of material misstatement. An audit includes examining, on a test basis, evidence supporting the amounts and disclosures in the financial statements, assessing the accounting principles used and significant estimates made by management, and evaluating the overall financial statement presentation. We believe that our audits, which included confirmation of securities at December 31, 2011 by correspondence with the custodian and brokers, provide a reasonable basis for our opinion.
PRICEWATERHOUSECOOPERS LLP
February 14, 2012
Houston, Texas
Invesco V.I. Capital Appreciation Fund
Calculating your ongoing Fund expenses
Example
As a shareholder of the Fund, you incur ongoing costs, including management fees; distribution and/or service fees (12b-1); and other Fund expenses. This example is intended to help you understand your ongoing costs (in dollars) of investing in the Fund and to compare these costs with ongoing costs of investing in other mutual funds. The example is based on an investment of $1,000 invested at the beginning of the period and held for the entire period July 1, 2011 through December 31, 2011.
The actual and hypothetical expenses in the examples below do not represent the effect of any fees or other expenses assessed in connection with a variable product; if they did, the expenses shown would be higher while the ending account values shown would be lower.
Actual expenses
The table below provides information about actual account values and actual expenses. You may use the information in this table, together with the amount you invested, to estimate the expenses that you paid over the period. Simply divide your account value by $1,000 (for example, an $8,600 account value divided by $1,000 = 8.6), then multiply the result by the number in the table under the heading entitled “Actual Expenses Paid During Period” to estimate the expenses you paid on your account during this period.
Hypothetical example for comparison purposes
The table below also provides information about hypothetical account values and hypothetical expenses based on the Fund’s actual expense ratio and an assumed rate of return of 5% per year before expenses, which is not the Fund’s actual return.
The hypothetical account values and expenses may not be used to estimate the actual ending account balance or expenses you paid for the period. You may use this information to compare the ongoing costs of investing in the Fund and other funds. To do so, compare this 5% hypothetical example with the 5% hypothetical examples that appear in the shareholder reports of the other funds.
Please note that the expenses shown in the table are meant to highlight your ongoing costs. Therefore, the hypothetical information is useful in comparing ongoing costs, and will not help you determine the relative total costs of owning different funds.
| | | | | | | | | | | | | | | | | | | | | | | | | | | | | | | |
| | | | | | | | | | HYPOTHETICAL
| | | |
| | | | | | | | | | (5% annual return before
| | | |
| | | | | | | ACTUAL | | | expenses) | | | |
| | | | Beginning
| | | Ending
| | | Expenses
| | | Ending
| | | Expenses
| | | Annualized
|
| | | | Account Value
| | | Account Value
| | | Paid During
| | | Account Value
| | | Paid During
| | | Expense
|
| Class | | | (07/01/11) | | | (12/31/11)1 | | | Period2 | | | (12/31/11) | | | Period2 | | | Ratio |
| Series I | | | $ | 1,000.00 | | | | $ | 879.00 | | | | $ | 4.36 | | | | $ | 1,020.57 | | | | $ | 4.69 | | | | | 0.92 | % |
| | | | | | | | | | | | | | | | | | | | | | | | | | | | | | | |
| Series II | | | | 1,000.00 | | | | | 878.20 | | | | | 5.54 | | | | | 1,019.31 | | | | | 5.96 | | | | | 1.17 | |
| | | | | | | | | | | | | | | | | | | | | | | | | | | | | | | |
| |
| 1 | The actual ending account value is based on the actual total return of the Fund for the period July 1, 2011 through December 31, 2011, after actual expenses and will differ from the hypothetical ending account value which is based on the Fund’s expense ratio and a hypothetical annual return of 5% before expenses. |
| 2 | Expenses are equal to the Fund’s annualized expense ratio as indicated above multiplied by the average account value over the period, multiplied by 184/365 to reflect the most recent fiscal half year. |
Invesco V.I. Capital Appreciation Fund
Form 1099-DIV, Form 1042-S and other year-end tax information provide shareholders with actual calendar year amounts that should be included in their tax returns. Shareholders should consult their tax advisors.
The following distribution information is being provided as required by the Internal Revenue Code or to meet a specific state’s requirement.
The Fund designates the following amounts or, if subsequently determined to be different, the maximum amount allowable for its fiscal year ended December 31, 2011:
| | | | | |
Federal and State Income Tax | | |
| |
| Corporate Dividends Received Deduction* | | | 98.53% | |
| | |
| | * | The above percentage is based on ordinary income dividends paid to shareholders during the Fund’s fiscal year. |
Invesco V.I. Capital Appreciation Fund
Trustees and Officers
The address of each trustee and officer is AIM Variable Insurance Funds (Invesco Variable Insurance Funds) (the “Trust”), 11 Greenway Plaza, Suite 2500, Houston, Texas 77046-1173. The trustees serve for the life of the Trust, subject to their earlier death, incapacitation, resignation, retirement or removal as more specifically provided in the Trust’s organizational documents. Each officer serves for a one year term or until their successors are elected and qualified. Column two below includes length of time served with predecessor entities, if any.
| | | | | | | | | |
| | | | | | | Number of Funds
| | |
Name, Year of Birth and
| | Trustee and/
| | Principal Occupation(s)
| | in Fund Complex
| | Other Directorship(s)
|
| Position(s) Held with the Trust | | or Officer Since | | During Past 5 Years | | Overseen by Trustee | | Held by Trustee |
| | | | | | | | | |
| | | | | | | | | |
| | | | | | | | | |
Interested Persons | | | | | | | | |
| | | | | | | | | |
| | | | | | | | | |
| | | | | | | | | |
Martin L. Flanagan1 — 1960
Trustee | | 2007 | | Executive Director, Chief Executive Officer and President, Invesco Ltd. (ultimate parent of Invesco and a global investment management firm); Advisor to the Board, Invesco Advisers, Inc. (formerly known as Invesco Institutional (N.A.), Inc.); Trustee, The Invesco Funds; Vice Chair, Investment Company Institute; and Member of Executive Board, SMU Cox School of Business
Formerly: Chairman, Invesco Advisers, Inc. (registered investment adviser); Director, Chairman, Chief Executive Officer and President, IVZ Inc. (holding company), INVESCO Group Services, Inc. (service provider) and Invesco North American Holdings, Inc. (holding company); Director, Chief Executive Officer and President, Invesco Holding Company Limited (parent of Invesco and a global investment management firm); Director, Invesco Ltd.; Chairman, Investment Company Institute and President, Co-Chief Executive Officer, Co-President, Chief Operating Officer and Chief Financial Officer, Franklin Resources, Inc. (global investment management organization) | | 140 | | None |
| | | | | | | | | |
| | | | | | | | | |
| | | | | | | | | |
Philip A. Taylor2 — 1954
Trustee, President and Principal Executive Officer | | 2006 | | Head of North American Retail and Senior Managing Director, Invesco Ltd.; Director, Co-Chairman, Co-President and Co-Chief Executive Officer, Invesco Advisers, Inc. (formerly known as Invesco Institutional (N.A.), Inc.) (registered investment adviser); Director, Chairman, Chief Executive Officer and President, Invesco Management Group, Inc. (formerly Invesco Aim Management Group, Inc.) (financial services holding company); Director and President, INVESCO Funds Group, Inc. (registered investment adviser and registered transfer agent); Director and Chairman, Invesco Investment Services, Inc. (formerly known as Invesco Aim Investment Services, Inc.) (registered transfer agent) and IVZ Distributors, Inc. (formerly known as INVESCO Distributors, Inc.) (registered broker dealer); Director, President and Chairman, Invesco Inc. (holding company) and Invesco Canada Holdings Inc. (holding company); Chief Executive Officer, Invesco Corporate Class Inc. (corporate mutual fund company) and Invesco Canada Fund Inc. (corporate mutual fund company); Director, Chairman and Chief Executive Officer, Invesco Canada Ltd. (formerly known as Invesco Trimark Ltd./Invesco Trimark Ltèe) (registered investment adviser and registered transfer agent); Trustee, President and Principal Executive Officer, The Invesco Funds (other than AIM Treasurer’s Series Trust (Invesco Treasurer’s Series Trust) and Short-Term Investments Trust); Trustee and Executive Vice President, The Invesco Funds (AIM Treasurer’s Series Trust (Invesco Treasurer’s Series Trust) and Short-Term Investments Trust only); Director, Invesco Investment Advisers LLC (formerly known as Van Kampen Asset Management); Director, Chief Executive Officer and President, Van Kampen Exchange Corp. | | 140 | | None |
| | | | | | | | | |
| | | | | | | | | |
| | | | | Formerly: Director and Chairman, Van Kampen Investor Services Inc.: Director, Chief Executive Officer and President, 1371 Preferred Inc. (holding company); and Van Kampen Investments Inc.; Director and President, AIM GP Canada Inc. (general partner for limited partnerships); and Van Kampen Advisors, Inc.; Director and Chief Executive Officer, Invesco Trimark Dealer Inc. (registered broker dealer); Director, Invesco Distributors, Inc. (formerly known as Invesco Aim Distributors, Inc.) (registered broker dealer); Manager, Invesco PowerShares Capital Management LLC; Director, Chief Executive Officer and President, Invesco Advisers, Inc.; Director, Chairman, Chief Executive Officer and President, Invesco Aim Capital Management, Inc.; President, Invesco Trimark Dealer Inc. and Invesco Trimark Ltd./Invesco Trimark Ltèe; Director and President, AIM Trimark Corporate Class Inc. and AIM Trimark Canada Fund Inc.; Senior Managing Director, Invesco Holding Company Limited; Trustee and Executive Vice President, Tax-Free Investments Trust; Director and Chairman, Fund Management Company (former registered broker dealer); President and Principal Executive Officer, The Invesco Funds (AIM Treasurer’s Series Trust (Invesco Treasurer’s Series Trust), Short-Term Investments Trust and Tax-Free Investments Trust only); President, AIM Trimark Global Fund Inc. and AIM Trimark Canada Fund Inc. | | | | |
| | | | | | | | | |
| | | | | | | | | |
| | | | | | | | | |
Wayne W. Whalen3 — 1939
Trustee | | 2010 | | Of Counsel, and prior to 2010, partner in the law firm of Skadden, Arps, Slate, Meagher & Flom LLP, legal counsel to funds in the Fund Complex | | 158 | | Director of the Abraham Lincoln Presidential Library Foundation |
| | | | | | | | | |
| | | | | | | | | |
| | | | | | | | | |
Independent Trustees | | | | | | | | |
| | | | | | | | | |
| | | | | | | | | |
| | | | | | | | | |
Bruce L. Crockett — 1944
Trustee and Chair | | 1993 | | Chairman, Crockett Technology Associates (technology consulting company) | | 140 | | ACE Limited (insurance company); and Investment Company Institute |
| | | | | Formerly: Director, Captaris (unified messaging provider); Director, President and Chief Executive Officer COMSAT Corporation; and Chairman, Board of Governors of INTELSAT (international communications company) | | | | |
| | | | | | | | | |
| |
| 1 | Mr. Flanagan is considered an interested person of the Trust because he is an officer of the adviser to the Trust, and an officer and a director of Invesco Ltd., ultimate parent of the adviser to the Trust. |
| 2 | Mr. Taylor is considered an interested person of the Trust because he is an officer and a director of the adviser to, and a director of the principal underwriter of, the Trust. |
| 3 | Mr. Whalen is considered an “interested person” (within the meaning of Section 2(a)(19) of the 1940 Act) of certain Funds in the Fund Complex by reason of he and his firm currently providing legal services as legal counsel to such Funds in the Fund Complex. |
Invesco V.I. Capital Appreciation Fund
Trustees and Officers—(continued)
The address of each trustee and officer is AIM Variable Insurance Funds (Invesco Variable Insurance Funds) (the “Trust”), 11 Greenway Plaza, Suite 2500, Houston, Texas 77046-1173. The trustees serve for the life of the Trust, subject to their earlier death, incapacitation, resignation, retirement or removal as more specifically provided in the Trust’s organizational documents. Each officer serves for a one year term or until their successors are elected and qualified. Column two below includes length of time served with predecessor entities, if any.
| | | | | | | | | |
| | | | | | | Number of Funds
| | |
Name, Year of Birth and
| | Trustee and/
| | Principal Occupation(s)
| | in Fund Complex
| | Other Directorship(s)
|
| Position(s) Held with the Trust | | or Officer Since | | During Past 5 Years | | Overseen by Trustee | | Held by Trustee |
| | | | | | | | | |
| | | | | | | | | |
| | | | | | | |
Independent Trustees—(continued) | | | | | | |
| | | | | | | | | |
| | | | | | | | | |
| | | | | | | | | |
David C. Arch — 1945
Trustee | | 2010 | | Chairman and Chief Executive Officer of Blistex Inc., a consumer health care products manufacturer. | | 158 | | Member of the Heartland Alliance Advisory Board, a nonprofit organization serving human needs based in Chicago. Board member of the Illinois Manufacturers’ Association. Member of the Board of Visitors, Institute for the Humanities, University of Michigan |
| | | | | | | | | |
| | | | | | | | | |
| | | | | | | | | |
Frank S. Bayley — 1939
Trustee | | 2001 | | Retired
Formerly: Director, Badgley Funds, Inc. (registered investment company) (2 portfolios) and Partner, law firm of Baker & McKenzie
Formerly: Director, Badgley Funds, Inc. (registered investment company) (2 portfolios) and Partner, law firm of Baker & McKenzie | | 140 | | Director and Chairman, C.D. Stimson Company (a real estate investment company) |
| | | | | | | | | |
| | | | | | | | | |
| | | | | | | | | |
James T. Bunch — 1942
Trustee | | 2004 | | Managing Member, Grumman Hill Group LLC (family office private equity management)
Formerly: Founder, Green, Manning & Bunch Ltd. (investment banking firm)(1988-2010); Executive Committee, United States Golf Association; and Director, Policy Studies, Inc. and Van Gilder Insurance Corporation | | 140 | | Vice Chairman, Board of Governors, Western Golf Association/Evans Scholars Foundation and Director, Denver Film Society |
| | | | | | | | | |
| | | | | | | | | |
| | | | | | | | | |
Rodney F. Dammeyer — 1940
Trustee | | 2010 | | President of CAC, LLC, a private company offering capital investment and management advisory services.
Formerly: Prior to January 2004, Director of TeleTech Holdings Inc.; Prior to 2002, Director of Arris Group, Inc.; Prior to 2001, Managing Partner at Equity Group Corporate Investments. Prior to 1995, Vice Chairman of Anixter International. Prior to 1985, experience includes Senior Vice President and Chief Financial Officer of Household International, Inc., Executive Vice President and Chief Financial Officer of Northwest Industries, Inc. and Partner of Arthur Andersen & Co. | | 158 | | Director of Quidel Corporation and Stericycle, Inc. Prior to May 2008, Trustee of The Scripps Research Institute. Prior to February 2008, Director of Ventana Medical Systems, Inc. Prior to April 2007, Director of GATX Corporation. Prior to April 2004, Director of TheraSense, Inc. |
| | | | | | | | | |
| | | | | | | | | |
| | | | | | | | | |
Albert R. Dowden — 1941
Trustee | | 2000 | | Director of a number of public and private business corporations, including the Boss Group, Ltd. (private investment and management); Reich & Tang Funds (5 portfolios) (registered investment company); and Homeowners of America Holding Corporation/ Homeowners of America Insurance Company (property casualty company)
Formerly: Director, Continental Energy Services, LLC (oil and gas pipeline service); Director, CompuDyne Corporation (provider of product and services to the public security market) and Director, Annuity and Life Re (Holdings), Ltd. (reinsurance company); Director, President and Chief Executive Officer, Volvo Group North America, Inc.; Senior Vice President, AB Volvo; Director of various public and private corporations; Chairman, DHJ Media, Inc.; Director Magellan Insurance Company; and Director, The Hertz Corporation, Genmar Corporation (boat manufacturer), National Media Corporation; Advisory Board of Rotary Power International (designer, manufacturer, and seller of rotary power engines); and Chairman, Cortland Trust, Inc. (registered investment company) | | 140 | | Board of Nature’s Sunshine Products, Inc. |
| | | | | | | | | |
| | | | | | | | | |
| | | | | | | | | |
Jack M. Fields — 1952
Trustee | | 1997 | | Chief Executive Officer, Twenty First Century Group, Inc. (government affairs company); and Owner and Chief Executive Officer, Dos Angelos Ranch, L.P. (cattle, hunting, corporate entertainment), Discovery Global Education Fund (non-profit) and Cross Timbers Quail Research Ranch (non-profit)
Formerly: Chief Executive Officer, Texana Timber LP (sustainable forestry company) and member of the U.S. House of Representatives | | 140 | | Administaff |
| | | | | | | | | |
| | | | | | | | | |
| | | | | | | | | |
Carl Frischling — 1937
Trustee | | 1993 | | Partner, law firm of Kramer Levin Naftalis and Frankel LLP | | 140 | | Director, Reich & Tang Funds (16 portfolios) |
| | | | | | | | | |
| | | | | | | | | |
Invesco V.I. Capital Appreciation Fund
Trustees and Officers—(continued)
The address of each trustee and officer is AIM Variable Insurance Funds (Invesco Variable Insurance Funds) (the “Trust”), 11 Greenway Plaza, Suite 2500, Houston, Texas 77046-1173. The trustees serve for the life of the Trust, subject to their earlier death, incapacitation, resignation, retirement or removal as more specifically provided in the Trust’s organizational documents. Each officer serves for a one year term or until their successors are elected and qualified. Column two below includes length of time served with predecessor entities, if any.
| | | | | | | | | |
| | | | | | | Number of Funds
| | |
Name, Year of Birth and
| | Trustee and/
| | Principal Occupation(s)
| | in Fund Complex
| | Other Directorship(s)
|
| Position(s) Held with the Trust | | or Officer Since | | During Past 5 Years | | Overseen by Trustee | | Held by Trustee |
| | | Independent Trustees—(continued) | | | | |
| | | | | | | | | |
| | | | | | | | | |
| | | | | | | | | |
Prema Mathai-Davis — 1950
Trustee | | 1998 | | Retired
Formerly: Chief Executive Officer, YWCA of the U.S.A. | | 140 | | None |
| | | | | | | | | |
| | | | | | | | | |
| | | | | | | | | |
Larry Soll — 1942
Trustee | | 2004 | | Retired
Formerly, Chairman, Chief Executive Officer and President, Synergen Corp. (a biotechnology company) | | 140 | | None |
| | | | | | | | | |
| | | | | | | | | |
| | | | | | | | | |
Hugo F. Sonnenschein — 1940
Trustee | | 2010 | | President Emeritus and Honorary Trustee of the University of Chicago and the Adam Smith Distinguished Service Professor in the Department of Economics at the University of Chicago. Prior to July 2000, President of the University of Chicago. | | 158 | | Trustee of the University of Rochester and a member of its investment committee. Member of the National Academy of Sciences, the American Philosophical Society and a fellow of the American Academy of Arts and Sciences |
| | | | | | | | | |
| | | | | | | | | |
| | | | | | | | | |
| Raymond Stickel, Jr. — 1944 Trustee | | 2005 | | Retired
Formerly: Director, Mainstay VP Series Funds, Inc. (25 portfolios) and Partner, Deloitte & Touche | | 140 | | None |
| | | | | | | | | |
| | | | | | | | | |
| | | | | | | | | |
Other Officers | | | | | | | | |
| | | | | | | | | |
| | | | | | | | | |
| | | | | | | | | |
Russell C. Burk — 1958
Senior Vice President and Senior Officer | | 2005 | | Senior Vice President and Senior Officer, The Invesco Funds | | N/A | | N/A |
| | | | | | | | | |
| | | | | | | | | |
| | | | | | | | | |
John M. Zerr — 1962
Senior Vice President, Chief Legal Officer and Secretary | | 2006 | | Director, Senior Vice President, Secretary and General Counsel, Invesco Management Group, Inc. (formerly known as Invesco Aim Management Group, Inc.) and Van Kampen Exchange Corp.; Senior Vice President, Invesco Advisers, Inc. (formerly known as Invesco Institutional (N.A.), Inc.) (registered investment adviser); Senior Vice President and Secretary, Invesco Distributors, Inc. (formerly known as Invesco Aim Distributors, Inc.); Director, Vice President and Secretary, Invesco Investment Services, Inc. (formerly known as Invesco Aim Investment Services, Inc.) and IVZ Distributors, Inc. (formerly known as INVESCO Distributors, Inc.); Director and Vice President, INVESCO Funds Group, Inc.; Senior Vice President, Chief Legal Officer and Secretary, The Invesco Funds; Manager, Invesco PowerShares Capital Management LLC; Director, Secretary and General Counsel, Invesco Investment Advisers LLC (formerly known as Van Kampen Asset Management); Secretary and General Counsel, Van Kampen Funds Inc. and Chief Legal Officer, PowerShares Exchange-Traded Fund Trust, PowerShares Exchange-Traded Fund Trust II, PowerShares India Exchange-Traded Fund Trust and PowerShares Actively Managed Exchange-Traded Fund Trust
Formerly: Director and Secretary, Van Kampen Advisors Inc.; Director Vice President, Secretary and General Counsel Van Kampen Investor Services Inc.; Director, Invesco Distributors, Inc. (formerly known as Invesco Aim Distributors, Inc.); Director, Senior Vice President, General Counsel and Secretary, Invesco Advisers, Inc.; and Van Kampen Investments Inc.; Director, Vice President and Secretary, Fund Management Company; Director, Senior Vice President, Secretary, General Counsel and Vice President, Invesco Aim Capital Management, Inc.; Chief Operating Officer and General Counsel, Liberty Ridge Capital, Inc. (an investment adviser); Vice President and Secretary, PBHG Funds (an investment company) and PBHG Insurance Series Fund (an investment company); Chief Operating Officer, General Counsel and Secretary, Old Mutual Investment Partners (a broker-dealer); General Counsel and Secretary, Old Mutual Fund Services (an administrator) and Old Mutual Shareholder Services (a shareholder servicing center); Executive Vice President, General Counsel and Secretary, Old Mutual Capital, Inc. (an investment adviser); and Vice President and Secretary, Old Mutual Advisors Funds (an investment company) | | N/A | | N/A |
| | | | | | | | | |
| | | | | | | | | |
| | | | | | | | | |
Lisa O. Brinkley — 1959
Vice President | | 2004 | | Global Compliance Director, Invesco Ltd.; Chief Compliance Officer, Invesco Investment Services, Inc.(formerly known as Invesco Aim Investment Services, Inc.); and Vice President, The Invesco Funds
Formerly: Chief Compliance Officer, Invesco Distributors, Inc. (formerly known as Invesco Aim Distributors, Inc.) and Van Kampen Investor Services Inc.; Senior Vice President, Invesco Management Group, Inc.; Senior Vice President and Chief Compliance Officer, Invesco Advisers, Inc. and The Invesco Funds; Vice President and Chief Compliance Officer, Invesco Aim Capital Management, Inc. and Invesco Distributors, Inc.; Vice President, Invesco Investment Services, Inc. and Fund Management Company | | N/A | | N/A |
| | | | | | | | | |
Invesco V.I. Capital Appreciation Fund
Trustees and Officers—(continued)
The address of each trustee and officer is AIM Variable Insurance Funds (Invesco Variable Insurance Funds) (the “Trust”), 11 Greenway Plaza, Suite 2500, Houston, Texas 77046-1173. The trustees serve for the life of the Trust, subject to their earlier death, incapacitation, resignation, retirement or removal as more specifically provided in the Trust’s organizational documents. Each officer serves for a one year term or until their successors are elected and qualified. Column two below includes length of time served with predecessor entities, if any.
| | | | | | | | | |
| | | | | | | Number of Funds
| | |
Name, Year of Birth and
| | Trustee and/
| | Principal Occupation(s)
| | in Fund Complex
| | Other Directorship(s)
|
| Position(s) Held with the Trust | | or Officer Since | | During Past 5 Years | | Overseen by Trustee | | Held by Trustee |
| | | Other Officers—(continued) | | | | |
| | | | | | | | | |
| | | | | | | | | |
| | | | | | | | | |
Sheri Morris — 1964
Vice President, Treasurer and Principal Financial Officer | | 1999 | | Vice President, Treasurer and Principal Financial Officer, The Invesco Funds; Vice President, Invesco Advisers, Inc. (formerly known as Invesco Institutional (N.A.), Inc.) (registered investment adviser).
Formerly: Treasurer, PowerShares Exchange-Traded Fund Trust, PowerShares Exchange-Traded Fund Trust II, PowerShares India Exchange-Traded Fund Trust and PowerShares Actively Managed Exchange-Traded Fund Trust, Vice President, Invesco Advisers, Inc., Invesco Aim Capital Management, Inc. and Invesco Aim Private Asset Management, Inc.; Assistant Vice President and Assistant Treasurer, The Invesco Funds and Assistant Vice President, Invesco Advisers, Inc., Invesco Aim Capital Management, Inc. and Invesco Aim Private Asset Management, Inc. | | N/A | | N/A |
| | | | | | | | | |
| | | | | | | | | |
| | | | | | | | | |
Karen Dunn Kelley — 1960
Vice President | | 1993 | | Head of Invesco’s World Wide Fixed Income and Cash Management Group; Senior Vice President, Invesco Management Group, Inc. (formerly known as Invesco Aim Management Group, Inc.) and Invesco Advisers, Inc. (formerly known as Invesco Institutional (N.A.), Inc.) (registered investment adviser); Executive Vice President, Invesco Distributors, Inc. (formerly known as Invesco Aim Distributors, Inc.); Director, Invesco Mortgage Capital Inc.; Vice President, The Invesco Funds (other than AIM Treasurer’s Series Trust (Invesco Treasurer’s Series Trust) and Short-Term Investments Trust); and President and Principal Executive Officer, The Invesco Funds (AIM Treasurer’s Series Trust (Invesco Treasurer’s Series Trust) and Short-Term Investments Trust only).
Formerly: Senior Vice President, Van Kampen Investments Inc.; Vice President, Invesco Advisers, Inc. (formerly known as Invesco Institutional (N.A.), Inc.); Director of Cash Management and Senior Vice President, Invesco Advisers, Inc. and Invesco Aim Capital Management, Inc.; President and Principal Executive Officer, Tax-Free Investments Trust; Director and President, Fund Management Company; Chief Cash Management Officer, Director of Cash Management, Senior Vice President, and Managing Director, Invesco Aim Capital Management, Inc.; Director of Cash Management, Senior Vice President, and Vice President, Invesco Advisers, Inc. and The Invesco Funds (AIM Treasurer’s Series Trust (Invesco Treasurer’s Series Trust), Short-Term Investments Trust and Tax-Free Investments Trust only) | | N/A | | N/A |
| | | | | | | | | |
| | | | | | | | | |
| | | | | | | | | |
Yinka Akinsola — 1977
Anti-Money Laundering Compliance Officer | | 2011 | | Anti-Money Laundering Compliance Officer, Invesco Advisers, Inc. (formerly known as Invesco Institutional (N.A.), Inc.) (registered investment adviser); Invesco Distributors, Inc. (formerly known as Invesco Aim Distributors, Inc.), Invesco Investment Services, Inc. (formerly known as Invesco Aim Investment Services, Inc.), Invesco Management Group, Inc., The Invesco Funds, Invesco Van Kampen Closed-End Funds, Van Kampen Exchange Corp. and Van Kampen Funds Inc. | | N/A | | N/A |
| | | | | | | | | |
| | | | | | | | | |
| | | | | | | | | |
Todd L. Spillane — 1958
Chief Compliance Officer | | 2006 | | Senior Vice President, Invesco Management Group, Inc. (formerly known as Invesco Aim Management Group, Inc.) and Van Kampen Exchange Corp.; Senior Vice President and Chief Compliance Officer, Invesco Advisers, Inc. (registered investment adviser) (formerly known as Invesco Institutional (N.A.), Inc.); Chief Compliance Officer, The Invesco Funds, INVESCO Private Capital Investments, Inc. (holding company) and Invesco Private Capital, Inc. (registered investment adviser); Vice President, Invesco Distributors, Inc. (formerly known as Invesco Aim Distributors, Inc.) and Invesco Investment Services, Inc. (formerly known as Invesco Aim Investment Services, Inc.).
Formerly: Chief Compliance Officer, Invesco Van Kampen Closed-End Funds PowerShares Exchange-Traded Fund Trust, PowerShares Exchange-Traded Fund Trust II, PowerShares India Exchange-Traded Fund Trust, and PowerShares Actively Managed Exchange-Traded Fund Trust; Senior Vice President, Van Kampen Investments Inc.; Senior Vice President and Chief Compliance Officer, Invesco Advisers, Inc. and Invesco Aim Capital Management, Inc.; Chief Compliance Officer, Invesco Global Asset Management (N.A.), Inc., Invesco Senior Secured Management, Inc. (registered investment adviser) and Van Kampen Investor Services Inc.; Vice President, Invesco Aim Capital Management, Inc. and Fund Management Company | | N/A | | N/A |
| | | | | | | | | |
The Statement of Additional Information of the Trust includes additional information about the Fund’s Trustees and is available upon request, without charge, by calling 1.800.959.4246. Please refer to the Fund’s prospectus for information on the Fund’s sub-advisers.
| | | | | | | |
Office of the Fund
11 Greenway Plaza, Suite 2500
Houston, TX 77046-1173 | | Investment Adviser
Invesco Advisers, Inc.
1555 Peachtree Street, N.E.
Atlanta, GA 30309 | | Distributor
Invesco Distributors, Inc.
11 Greenway Plaza, Suite 2500
Houston, TX 77046-1173 | | Auditors
PricewaterhouseCoopers LLP
1201 Louisiana Street, Suite 2900
Houston, TX 77002-5678 |
| | | | | | | |
| | | | | | | |
Counsel to the Fund
Stradley Ronon Stevens & Young, LLP
2600 One Commerce Square
Philadelphia, PA 19103 | | Counsel to the Independent Trustees
Kramer, Levin, Naftalis & Frankel LLP
1177 Avenue of the Americas
New York, NY 10036-2714 | | Transfer Agent
Invesco Investment Services, Inc.
11 Greenway Plaza, Suite 2500
Houston, TX77046-1173 | | Custodian
State Street Bank and Trust Company
225 Franklin
Boston, MA 02110-2801 |
Invesco V.I. Capital Appreciation Fund
Invesco V.I. Capital Development FundAnnual Report to Shareholders § December 31, 2011The Fund provides a complete list of its holdings four times in each fiscal year, at the quarter-ends. For the second and fourth quarters, the lists appear in the Fund’s semiannual and annual reports to shareholders. For the first and third quarters, the Fund files the lists with the Securities and Exchange Commission (SEC) on Form N-Q. The Fund’s Form N-Q filings are available on the SEC website, sec.gov. Copies of the Fund’s Forms N-Q may be reviewed and copied at the SEC Public Reference Room in Washington, D.C. You can obtain information on the operation of the Public Reference Room, including information about duplicating fee charges, by calling 202 551 8090 or 800 732 0330, or by electronic request at the following email address: publicinfo@sec.gov. The SEC file numbers for the Fund are 811-07452 and 033-57340. The Fund’s most recent portfolio holdings, as filed on Form N-Q, have also been made available to insurance companies issuing variable annuity contracts and variable life insurance policies (“variable products”) that invest in the Fund.
A description of the policies and procedures that the Fund uses to determine how to vote proxies relating to portfolio securities is available without charge, upon request, from our Client Services department at 800 959 4246 or at invesco.com/proxyguidelines. The information is also available on the SEC website, sec.gov.
Information regarding how the Fund voted proxies related to its portfolio securities during the 12 months ended June 30, 2011, is available at invesco.com/proxysearch. The information is also available on the SEC website, sec.gov.
Invesco Advisers, Inc. is an investment adviser; it provides investment advisory services to individual and institutional clients and does not sell securities. Invesco Distributors, Inc. is the U.S. distributor for Invesco Ltd.’s retail mutual funds, exchange-traded funds and institutional money market funds. Both are wholly owned, indirect subsidiaries of Invesco Ltd.
This report must be accompanied or preceded by a currently effective Fund prospectus and variable product prospectus, which contain more complete information, including sales charges and expenses. Investors should read each carefully before investing.
Invesco Distributors, Inc.
VICDV-AR-1
| | | | | | | | | |
|
| | | | | | | |
NOT FDIC INSURED | | | MAY LOSE VALUE | | | NO BANK GUARANTEE |
Management’s Discussion of Fund Performance
Performance summary
On March 22, 2011, James Leach joined the Fund’s management team as portfolio manager. On the same date, Paul Rasplicka left the Fund’s management team.
For the fiscal year ended December 31, 2011, Invesco V.I. Capital Development Fund had negative returns and underperformed the Fund’s style-specific benchmark, the Russell Midcap Growth Index. Underperformance was driven primarily by stock selection in several sectors.
The Fund underperformed the broad market, as represented by the S&P 500 Index, as mid-cap stocks generally underperformed large-cap stocks.
Your Fund’s long-term performance appears later in this report.
Fund vs. Indexes
Total returns, 12/31/10 to 12/31/11, excluding variable product issuer charges. If variable product issuer charges were included, returns would be lower.
| | | | | |
|
| |
| Series I Shares | | | -7.16 | % |
| |
| Series II Shares | | | -7.37 | |
| |
S&P 500 Index▼ (Broad Market Index) | | | 2.09 | |
| |
Russell Midcap Growth Index▼ (Style-Specific Index) | | | -1.65 | |
| |
Lipper VUF Mid-Cap Growth Funds Index▼ (Peer Group Index) | | | -4.69 | |
| |
Source(s):▼Lipper Inc.
How we invest
We believe a growth investment strategy is an essential component of a diversified portfolio.
Our investment process emphasizes rigorous bottom-up analysis of individual companies. We seek to invest in companies with strong or improving fundamentals, attractive valuations relative to growth prospects and earnings expectations that appear fair to conservative.
To narrow our investment universe, we utilize a holistic approach that emphasizes fundamental research and, to a lesser extent, includes quantitative analysis. The result of this distillation process is a set of stocks we analyze in greater depth.
Our fundamental analysis focuses on identifying companies with strong drivers of growth. To accomplish this goal, we
conduct rigorous bottom-up analysis to develop higher conviction in each company’s prospects for growth. Through our analysis, we develop a mosaic of each company through detailed discussions with company management teams, competitors, distributors, suppliers, Wall Street analysts and customers. We also employ a variety of valuation techniques based on the company in question, the industry in which the company operates, the stage of the business cycle and other factors that best reflect a company’s value.
Risk management plays an important role in portfolio construction. Our target portfolio attempts to maximize the relationship between risk and return. We seek to accomplish this goal by investing in companies with attractive fundamental prospects for growth and dividing the portfolio between stable growth stocks and catalyst-driven stocks.
We consider selling a stock for any of the following reasons:
| n | | The price target set at purchase has been reached. |
| |
| n | | There is deterioration in fundamentals. |
| |
| n | | The catalysts for growth are no longer present or are reflected in the stock price. |
| |
| n | | We identify a more attractive investment opportunity. |
Market conditions and your Fund
The fiscal year began with equity markets fueled on the second round of “quantitative easing” by the U.S. Federal Reserve, and markets rose through the first quarter of 2011. However, with the spring came increased volatility and significant macroeconomic distortions due to civil unrest in Egypt and Libya, flooding in Australia and a devastating earthquake and tsunami in Japan. Corporate earnings remained strong with largely positive surprises, but were often overshadowed by investor concerns about continuing high unemployment and soft housing data. Although markets stabilized and were generally in positive territory through the summer, major equity indexes sold off precipitously in August as the U.S. government struggled to raise the nation’s debt ceiling. Despite an eventual agreement between the White House and Congress, credit rating agency Standard & Poor’s announced the first-ever downgrade to long-term U.S. government debt. Uncertainty created by the downgrade, combined with the continuing saga surrounding the debt crisis in the eurozone, reignited fears of a global recession. Despite evidence of sustained, but muted, growth, these macroeconomic factors continued to weigh on markets through the end of the reporting period.
Portfolio Composition
By sector
| | | | | |
|
| Consumer Discretionary | | | 22.0 | % |
| |
| Information Technology | | | 18.5 | |
| |
| Industrials | | | 16.9 | |
| |
| Health Care | | | 16.6 | |
| |
| Energy | | | 9.1 | |
| |
| Materials | | | 5.9 | |
| |
| Consumer Staples | | | 3.3 | |
| |
| Telecommunication Services | | | 3.0 | |
| |
| Financials | | | 2.8 | |
| |
Money Market Funds Plus | | | | |
Other Assets Less Liabilities | | | 1.9 | |
Top 10 Equity Holdings*
| | | | | | | | | |
|
| | 1. | | | Cameron International Corp. | | | 2.4 | % |
| |
| | 2. | | | Kansas City Southern | | | 2.4 | |
| |
| | 3. | | | DaVita, Inc. | | | 2.3 | |
| |
| | 4. | | | Amphenol Corp.-Class A | | | 2.1 | |
| |
| | 5. | | | Airgas, Inc. | | | 2.0 | |
| |
| | 6. | | | Whiting Petroleum Corp. | | | 2.0 | |
| |
| | 7. | | | Aetna Inc. | | | 2.0 | |
| |
| | 8. | | | Church & Dwight Co., Inc. | | | 2.0 | |
| |
| | 9. | | | PetSmart, Inc. | | | 2.0 | |
| |
| | 10. | | | Discovery Communications, Inc. | | | | |
| | | | | -Class A | | | 2.0 | |
| | | | | |
|
| Total Net Assets | | $193.6 million | |
| | | | | |
| Total Number of Holdings* | | | 71 | |
The Fund’s holdings are subject to change, and there is no assurance that the Fund will continue to hold any particular security.
*Excluding money market fund holdings.
Invesco V.I. Capital Development Fund
In this environment, the Fund produced negative absolute returns and underperformed the Russell Midcap Growth Index for the fiscal year. The Fund underperformed by the widest margins in the consumer discretionary, industrials, consumer staples and telecommunication services sectors. Some of this underperformance was offset by outperformance in other sectors, including financials and information technology (IT).
The Fund underperformed most significantly in the consumer discretionary sector, primarily driven by stock selection. In this sector, clothing retailer Abercrombie & Fitch detracted from Fund performance. The company’s exposure to Europe, amid ongoing austerity and debt concerns, hurt stock performance. Internet-based publishing and production service Shutterfly also detracted from Fund performance as management guided down its earnings outlook late in the year. Both of these holdings were sold during the reporting period. Hotel operator Starwood Hotels was also a detractor for the fiscal year; its revenues tend to be correlated to economic growth, and sentiment turned mostly negative during the reporting period. The negative effect of these holdings offset the contribution to Fund performance from ULTA Salon, Cosmetics & Fragrance, which was the Fund’s top contributor.
The industrials sector was another area of weakness for the Fund due to stock selection and an overweight position in the underperforming sector. Holdings that detracted from Fund performance included construction equipment manufacturer Terex and commercial truck and engine maker Navistar International. Both companies were affected by wavering sentiment on the prospects for global growth. Construction and engineering services firm Foster Wheeler also detracted from Fund performance. The company did not win an anticipated contract and, later in the reporting period, was disproportionately affected as energy prices declined. Terex and Foster Wheeler were both sold during the reporting period.
Investors sought stability during the reporting period and rotated into the more defensive consumer staples sector. Returns for this sector were higher than most other sectors, and the Fund’s underweight position detracted from Fund performance.
Some of this underperformance was offset by outperformance in other sectors. The Fund outperformed the Russell Midcap Growth Index by the widest margin
in the financials sector, due to stock selection and an underweight position. One holding that made a positive contribution to performance was commercial real estate brokerage firm CB Richard Ellis, as investors reacted positively to news of increasing property sales and leasing in the U.S. and abroad. Discover Financial Services and Moody’s contributed to Fund performance, with Moody’s benefiting from the significant tailwind of new debt issuance during the year. Our holdings in CB Richard Ellis and Moody’s were both sold during the reporting period.
Outperformance in the IT sector was a result of strong stock selection. Data warehousing solution provider Teradata, middleware provider TIBCO Software and semiconductor capital equipment designer KLA-Tencor all contributed to Fund performance during the year. All three stocks were sold during the reporting period in favor of new opportunities.
As we’ve discussed, the stock market experienced significant volatility during the fiscal year. We would like to caution investors against making investment decisions based on short-term performance. We thank you for your commitment to Invesco V.I. Capital Development Fund.
The views and opinions expressed in management’s discussion of Fund performance are those of Invesco Advisers, Inc. These views and opinions are subject to change at any time based on factors such as market and economic conditions. These views and opinions may not be relied upon as investment advice or recommendations, or as an offer for a particular security. The information is not a complete analysis of every aspect of any market, country, industry, security or the Fund. Statements of fact are from sources considered reliable, but Invesco Advisers, Inc. makes no representation or warranty as to their completeness or accuracy. Although historical performance is no guarantee of future results, these insights may help you understand our investment management philosophy.
See important Fund and, if applicable, index disclosures later in this report.
James Leach
Chartered Financial Analyst, portfolio manager, is manager of Invesco V.I. Capital Development Fund. He joined Invesco in 2011. Mr. Leach earned a B.S. in mechanical engineering from the University of California and an M.B.A. from the Stern School of Business at New York University.
Invesco V.I. Capital Development Fund
Your Fund’s Long-Term Performance
Results of a $10,000 Investment – Oldest Share Class(es)
Fund and index data from 12/31/01*
| |
| * | During the reporting period, Invesco changed its policy regarding growth of $10,000 charts. For funds older than 10 years, we previously showed performance since inception. Going forward, we will show performance for the most recent 10 years, since this more accurately reflects the experience of the typical shareholder. As a result, charts now may include benchmarks that did not appear previously, because the funds’ inception pre-dated the benchmarks’ inception. Also, all charts will now be presented using a linear format. |
Past performance cannot guarantee comparable future results.
Average Annual Total Returns
As of 12/31/11
| | | | | | | | | |
|
| Series I Shares | | | | |
| |
| Inception (5/1/98) | | | 4.12 | % |
| |
| | 10 | | | Years | | | 3.77 | |
| |
| | 5 | | | Years | | | -1.61 | |
| |
| | 1 | | | Year | | | -7.16 | |
| |
| | | | | | | | | |
| Series II Shares | | | | |
| |
| Inception (8/21/01) | | | 3.43 | % |
| |
| | 10 | | | Years | | | 3.51 | |
| |
| | 5 | | | Years | | | -1.85 | |
| |
| | 1 | | | Year | | | -7.37 | |
The performance of the Fund’s Series I and Series II share classes will differ primarily due to different class expenses.
The performance data quoted represent past performance and cannot guarantee comparable future results; current performance may be lower or higher. Please contact your variable product issuer or financial adviser for the most recent month-end variable
product performance. Performance figures reflect Fund expenses, reinvested distributions and changes in net asset value. Investment return and principal value will fluctuate so that you may have a gain or loss when you sell shares.
The total annual Fund operating expense ratio set forth in the most recent Fund prospectus as of the date of this report for Series I and Series II shares was 1.09% and 1.34%, respectively. The expense ratios presented above may vary from the expense ratios presented in other sections of this report that are based on expenses incurred during the period covered by this report.
Invesco V.I. Capital Development Fund, a series portfolio of AIM Variable Insurance Funds (Invesco Variable Insurance Funds), is currently offered through insurance companies issuing variable products. You cannot purchase shares of the Fund directly.
Performance figures given represent the Fund and are not intended to reflect actual variable product values. They do not reflect sales charges, expenses and fees assessed in connection with a variable product. Sales charges, expenses and fees, which are determined by the variable product issuers, will vary and will lower the total return.
The most recent month-end performance data at the Fund level, excluding variable product charges, is available at 800 451 4246. As mentioned above, for the most recent month-end performance including variable product charges, please contact your variable product issuer or financial adviser.
Invesco V.I. Capital Development Fund
Invesco V.I. Capital Development Fund’s investment objective is long-term growth of capital.
| n | | Unless otherwise stated, information presented in this report is as of December 31, 2011, and is based on total net assets. |
| |
| n | | Unless otherwise noted, all data provided by Invesco. |
| |
| n | | To access your Fund’s reports/prospectus, visit invesco.com/fundreports. |
Principal risks of investing
in the Fund
Active trading risk. The Fund engages in frequent trading of portfolio securities. Active trading results in added expenses and may result in a lower return.
Foreign securities risk. The Fund’s foreign investments may be affected by changes in a foreign country’s exchange rates; political and social instability; changes in economic or taxation policies; difficulties when enforcing obligations; decreased liquidity; and increased volatility. Foreign companies may be subject to less regulation resulting in less publicly available information about the companies.
Growth investing risk. Growth stocks tend to be more expensive relative to their earnings or assets compared with other types of stock. As a result they tend to be more sensitive to changes in their earnings and can be more volatile.
Management risk. The investment techniques and risk analysis used by the Fund’s portfolio managers may not produce the desired results.
Market risk. The prices of and the income generated by the Fund’s securities may decline in response to, among other things, investor sentiment; general economic and market conditions; regional or global instability; and currency and interest rate fluctuations.
Small- and mid-capitalization risks. Stocks of small and mid-sized companies tend to be more vulnerable to adverse developments in the above factors and may have little or no operating history or track record of success, and limited product lines, markets, management and financial resources. The securities of small and mid-sized companies may be more volatile due to less market interest and less publicly available information about the issuer. They also may be illiquid or restricted as to resale, or may trade less frequently and in smaller volumes, all of which may cause difficulty when establishing or closing a position at a desirable price.
About indexes used in this report
The S&P 500® Index is an unmanaged index considered representative of the U.S. stock market.
The Russell Midcap® Growth Index is an unmanaged index considered representative of mid-cap growth stocks. The Russell Midcap Growth Index is a trademark/service mark of the Frank Russell Co. Russell® is a trademark of the Frank Russell Co.
The Lipper VUF Mid-Cap Growth Funds Index is an unmanaged index considered representative of mid-cap growth variable insurance underlying funds tracked by Lipper.
The Fund is not managed to track the performance of any particular index, including the indexes defined here, and consequently, the performance of the Fund may deviate significantly from the performance of the indexes.
A direct investment cannot be made in an index. Unless otherwise indicated, index results include reinvested dividends, and they do not reflect sales charges. Performance of the peer group, if applicable, reflects fund expenses; performance of a market index does not.
Other information
The Chartered Financial Analyst® (CFA®) designation is globally recognized and attests to a charterholder’s success in a rigorous and comprehensive study program in the field of investment management and research analysis.
Industry classifications used in this report are generally according to the Global Industry Classification Standard, which was developed by and is the exclusive property and a service mark of MSCI Inc. and Standard & Poor’s.
The returns shown in management’s discussion of Fund performance are based on net asset values calculated for shareholder transactions. Generally accepted accounting principles require adjustments to be made to the net assets of the Fund at period end for financial reporting purposes, and as such, the net asset values for shareholder transactions and the returns based on those net asset values may differ from the net asset values and returns reported in the Financial Highlights. Additionally, the returns and net asset values shown throughout this report are at the Fund level only and do not include variable product issuer charges. If such charges were included, the total returns would be lower.
Invesco V.I. Capital Development Fund
Schedule of Investments(a)
December 31, 2011
| | | | | | | | | |
| | | Shares | | Value |
| |
Common Stocks–98.06%
|
Aerospace & Defense–1.08%
| | | | |
| Triumph Group, Inc. | | | 35,825 | | | $ | 2,093,971 | |
| |
Air Freight & Logistics–1.57%
| | | | |
| C.H. Robinson Worldwide, Inc. | | | 43,643 | | | | 3,045,409 | |
| |
Apparel, Accessories & Luxury Goods–2.85%
| | | | |
| Coach, Inc. | | | 53,390 | | | | 3,258,926 | |
| |
Michael Kors Holdings Ltd.(b) | | | 82,646 | | | | 2,252,103 | |
| |
| | | | | | | | 5,511,029 | |
| |
Application Software–0.86%
| | | | |
Citrix Systems, Inc.(b) | | | 27,317 | | | | 1,658,688 | |
| |
Asset Management & Custody Banks–1.21%
| | | | |
Affiliated Managers Group, Inc.(b) | | | 24,382 | | | | 2,339,453 | |
| |
Auto Parts & Equipment–3.10%
| | | | |
BorgWarner, Inc.(b)(c) | | | 35,910 | | | | 2,288,903 | |
| |
| Gentex Corp. | | | 125,611 | | | | 3,716,830 | |
| |
| | | | | | | | 6,005,733 | |
| |
Automobile Manufacturers–1.11%
| | | | |
Tesla Motors, Inc.(b)(c) | | | 75,380 | | | | 2,152,853 | |
| |
Biotechnology–2.59%
| | | | |
BioMarin Pharmaceutical Inc.(b) | | | 81,832 | | | | 2,813,384 | |
| |
United Therapeutics Corp.(b) | | | 46,687 | | | | 2,205,961 | |
| |
| | | | | | | | 5,019,345 | |
| |
Broadcasting–1.98%
| | | | |
Discovery Communications, Inc.–Class A(b) | | | 93,483 | | | | 3,829,998 | |
| |
Communications Equipment–2.57%
| | | | |
F5 Networks, Inc.(b) | | | 18,542 | | | | 1,967,677 | |
| |
Juniper Networks, Inc.(b) | | | 88,722 | | | | 1,810,816 | |
| |
Sycamore Networks, Inc.(b) | | | 67,425 | | | | 1,206,908 | |
| |
| | | | | | | | 4,985,401 | |
| |
Computer Storage & Peripherals–1.58%
| | | | |
NetApp, Inc.(b) | | | 32,076 | | | | 1,163,396 | |
| |
Western Digital Corp.(b) | | | 61,289 | | | | 1,896,895 | |
| |
| | | | | | | | 3,060,291 | |
| |
Construction & Engineering–1.16%
| | | | |
MasTec Inc.(b) | | | 129,200 | | | | 2,244,204 | |
| |
Construction & Farm Machinery & Heavy Trucks–2.61%
| | | | |
AGCO Corp.(b) | | | 63,671 | | | | 2,735,943 | |
| |
Navistar International Corp.(b) | | | 60,990 | | | | 2,310,301 | |
| |
| | | | | | | | 5,046,244 | |
| |
Consumer Finance–1.61%
| | | | |
| Discover Financial Services | | | 129,591 | | | | 3,110,184 | |
| |
Electrical Components & Equipment–1.59%
| | | | |
| Cooper Industries PLC (Ireland) | | | 56,674 | | | | 3,068,897 | |
| |
Electronic Components–2.10%
| | | | |
| Amphenol Corp.–Class A | | | 89,718 | | | | 4,072,300 | |
| |
Fertilizers & Agricultural Chemicals–1.41%
| | | | |
Intrepid Potash, Inc.(b) | | | 120,463 | | | | 2,726,078 | |
| |
Footwear–1.05%
| | | | |
Deckers Outdoor Corp.(b) | | | 26,901 | | | | 2,032,909 | |
| |
General Merchandise Stores–1.64%
| | | | |
Dollar Tree, Inc.(b) | | | 38,098 | | | | 3,166,325 | |
| |
Health Care Equipment–1.36%
| | | | |
CareFusion Corp.(b) | | | 103,982 | | | | 2,642,183 | |
| |
Health Care Facilities–3.06%
| | | | |
Brookdale Senior Living Inc.(b) | | | 140,491 | | | | 2,443,138 | |
| |
| Universal Health Services, Inc.–Class B | | | 89,417 | | | | 3,474,745 | |
| |
| | | | | | | | 5,917,883 | |
| |
Health Care Services–4.98%
| | | | |
DaVita, Inc.(b) | | | 59,325 | | | | 4,497,428 | |
| |
Express Scripts, Inc.(b) | | | 66,828 | | | | 2,986,544 | |
| |
HMS Holdings Corp.(b) | | | 67,546 | | | | 2,160,121 | |
| |
| | | | | | | | 9,644,093 | |
| |
Health Care Technology–1.51%
| | | | |
Allscripts Healthcare Solutions, Inc.(b) | | | 154,345 | | | | 2,923,294 | |
| |
Hotels, Resorts & Cruise Lines–1.49%
| | | | |
| Starwood Hotels & Resorts Worldwide, Inc. | | | 60,200 | | | | 2,887,794 | |
| |
Household Products–1.99%
| | | | |
| Church & Dwight Co., Inc. | | | 84,032 | | | | 3,845,304 | |
| |
Human Resource & Employment Services–1.32%
| | | | |
| Robert Half International, Inc. | | | 89,647 | | | | 2,551,354 | |
| |
Industrial Gases–2.02%
| | | | |
| Airgas, Inc. | | | 50,095 | | | | 3,911,418 | |
| |
Industrial Machinery–3.48%
| | | | |
| Flowserve Corp. | | | 30,044 | | | | 2,983,970 | |
| |
| Gardner Denver Inc. | | | 48,778 | | | | 3,758,833 | |
| |
| | | | | | | | 6,742,803 | |
| |
Internet Software & Services–1.61%
| | | | |
Equinix, Inc.(b) | | | 30,832 | | | | 3,126,365 | |
| |
| | | | | | | | | |
See accompanying Notes to Financial Statements which are an integral part of the financial statements.
Invesco V.I. Capital Development Fund
| | | | | | | | | |
| | | Shares | | Value |
| |
IT Consulting & Other Services–1.60%
| | | | |
Cognizant Technology Solutions Corp.–Class A(b) | | | 38,070 | | | $ | 2,448,282 | |
| |
Gartner, Inc.(b) | | | 18,916 | | | | 657,709 | |
| |
| | | | | | | | 3,105,991 | |
| |
Managed Health Care–3.05%
| | | | |
| Aetna Inc. | | | 92,374 | | | | 3,897,259 | |
| |
Aveta, Inc.(b)(d) | | | 237,251 | | | | 2,016,634 | |
| |
| | | | | | | | 5,913,893 | |
| |
Movies & Entertainment–1.29%
| | | | |
| Cinemark Holdings, Inc. | | | 135,366 | | | | 2,502,917 | |
| |
Oil & Gas Drilling–0.59%
| | | | |
| Patterson-UTI Energy, Inc. | | | 57,269 | | | | 1,144,235 | |
| |
Oil & Gas Equipment & Services–4.36%
| | | | |
Cameron International Corp.(b) | | | 96,180 | | | | 4,731,094 | |
| |
Key Energy Services, Inc.(b) | | | 110,824 | | | | 1,714,447 | |
| |
Weatherford International Ltd.(b) | | | 136,459 | | | | 1,997,760 | |
| |
| | | | | | | | 8,443,301 | |
| |
Oil & Gas Exploration & Production–4.14%
| | | | |
| Cabot Oil & Gas Corp. | | | 45,312 | | | | 3,439,181 | |
| |
Sanchez Energy Corp.(b)(c) | | | 38,946 | | | | 672,208 | |
| |
Whiting Petroleum Corp.(b) | | | 83,494 | | | | 3,898,335 | |
| |
| | | | | | | | 8,009,724 | |
| |
Packaged Foods & Meats–1.34%
| | | | |
| H.J. Heinz Co. | | | 48,136 | | | | 2,601,269 | |
| |
Railroads–2.41%
| | | | |
Kansas City Southern(b) | | | 68,486 | | | | 4,657,733 | |
| |
Restaurants–1.70%
| | | | |
Panera Bread Co.–Class A(b) | | | 23,298 | | | | 3,295,502 | |
| |
Semiconductor Equipment–0.84%
| | | | |
Lam Research Corp.(b) | | | 43,920 | | | | 1,625,918 | |
| |
Semiconductors–5.18%
| | | | |
| Altera Corp. | | | 89,440 | | | | 3,318,224 | |
| |
| Avago Technologies Ltd. (Singapore) | | | 67,523 | | | | 1,948,714 | |
| |
| Linear Technology Corp. | | | 89,741 | | | | 2,694,922 | |
| |
LSI Corp.(b) | | | 347,251 | | | | 2,066,143 | |
| |
| | | | | | | | 10,028,003 | |
| |
Specialized Consumer Services–0.73%
| | | | |
Coinstar, Inc.(b)(c) | | | 31,133 | | | | 1,420,910 | |
| |
Specialty Chemicals–2.49%
| | | | |
| Albemarle Corp. | | | 53,541 | | | | 2,757,897 | |
| |
| LyondellBasell Industries N.V.–Class A (Netherlands) | | | 63,252 | | | | 2,055,057 | |
| |
| | | | | | | | 4,812,954 | |
| |
Specialty Stores–5.08%
| | | | |
| Dick’s Sporting Goods, Inc. | | | 78,882 | | | | 2,909,168 | |
| |
| PetSmart, Inc. | | | 74,954 | | | | 3,844,391 | |
| |
Ulta Salon, Cosmetics & Fragrance, Inc.(b) | | | 47,543 | | | | 3,086,491 | |
| |
| | | | | | | | 9,840,050 | |
| |
Systems Software–0.96%
| | | | |
Check Point Software Technologies Ltd. (Israel)(b) | | | 35,497 | | | | 1,865,012 | |
| |
Technology Distributors–1.15%
| | | | |
Avnet, Inc.(b) | | | 71,685 | | | | 2,228,687 | |
| |
Trucking–1.69%
| | | | |
| J.B. Hunt Transport Services, Inc. | | | 72,443 | | | | 3,265,006 | |
| |
Wireless Telecommunication Services–2.97%
| | | | |
NII Holdings Inc.(b) | | | 98,771 | | | | 2,103,822 | |
| |
SBA Communications Corp.–Class A(b) | | | 84,821 | | | | 3,643,910 | |
| |
| | | | | | | | 5,747,732 | |
| |
| Total Common Stocks (Cost $177,302,102) | | | | | | | 189,870,640 | |
| |
Money Market Funds–1.73%
|
Liquid Assets Portfolio–Institutional Class(e) | | | 1,676,664 | | | | 1,676,664 | |
| |
Premier Portfolio–Institutional Class(e) | | | 1,676,665 | | | | 1,676,665 | |
| |
| Total Money Market Funds (Cost $3,353,329) | | | | | | | 3,353,329 | |
| |
| TOTAL INVESTMENTS (excluding investments purchased with cash collateral from securities on loan)–99.79% (Cost $180,655,431) | | | | | | | 193,223,969 | |
| |
Investments Purchased with Cash Collateral from Securities on Loan
|
Money Market Funds–2.21%
|
Liquid Assets Portfolio–Institutional Class (Cost $4,284,449)(e)(f) | | | 4,284,449 | | | | 4,284,449 | |
| |
| TOTAL INVESTMENTS–102.00% (Cost $184,939,880) | | | | | | | 197,508,418 | |
| |
| OTHER ASSETS LESS LIABILITIES–(2.00)% | | | | | | | (3,880,291 | ) |
| |
| NET ASSETS–100.00% | | | | | | $ | 193,628,127 | |
| |
Notes to Schedule of Investments:
| | |
| (a) | | Industry and/or sector classifications used in this report are generally according to the Global Industry Classification Standard, which was developed by and is the exclusive property and a service mark of MSCI Inc. and Standard & Poor’s. |
| (b) | | Non-income producing security. |
| (c) | | All or a portion of this security was out on loan at December 31, 2011. |
| (d) | | Security purchased or received in a transaction exempt from registration under the Securities Act of 1933, as amended. The security may be resold pursuant to an exemption from registration under the 1933 Act, typically to qualified institutional buyers. The value of this security at December 31, 2011 represented 1.04% of the Fund’s Net Assets. |
| (e) | | The money market fund and the Fund are affiliated by having the same investment adviser. |
| (f) | | The security has been segregated to satisfy the commitment to return the cash collateral received in securities lending transactions upon the borrower’s return of the securities loaned. See Note 1I. |
See accompanying Notes to Financial Statements which are an integral part of the financial statements.
Invesco V.I. Capital Development Fund
Statement of Assets and Liabilities
December 31, 2011
| | | | | |
Assets:
|
| Investments, at value (Cost $177,302,102)* | | $ | 189,870,640 | |
| |
| Investments in affiliated money market funds, at value and cost | | | 7,637,778 | |
| |
| Total investments, at value (Cost $184,939,880) | | | 197,508,418 | |
| |
| Receivable for: | | | | |
| Investments sold | | | 696,028 | |
| |
| Fund shares sold | | | 44,131 | |
| |
| Dividends | | | 116,522 | |
| |
| Investment for trustee deferred compensation and retirement plans | | | 50,279 | |
| |
| Total assets | | | 198,415,378 | |
| |
| | | | | |
| | | | | |
Liabilities:
|
| Payable for: | | | | |
| Fund shares reacquired | | | 202,496 | |
| |
| Collateral upon return of securities loaned | | | 4,284,449 | |
| |
| Accrued fees to affiliates | | | 177,996 | |
| |
| Accrued other operating expenses | | | 33,393 | |
| |
| Trustee deferred compensation and retirement plans | | | 88,917 | |
| |
| Total liabilities | | | 4,787,251 | |
| |
| Net assets applicable to shares outstanding | | $ | 193,628,127 | |
| |
| | | | | |
| | | | | |
Net assets consist of:
|
| Shares of beneficial interest | | $ | 236,418,607 | |
| |
| Undistributed net investment income (loss) | | | (86,599 | ) |
| |
| Undistributed net realized gain (loss) | | | (55,272,392 | ) |
| |
| Unrealized appreciation | | | 12,568,511 | |
| |
| | | $ | 193,628,127 | |
| |
| | | | | |
| | | | | |
Net Assets:
|
| Series I | | $ | 112,296,883 | |
| |
| Series II | | $ | 81,331,244 | |
| |
| | | | | |
| | | | | |
Shares outstanding, $0.001 par value per share, with an unlimited number of shares authorized:
|
| Series I | | | 9,019,882 | |
| |
| Series II | | | 6,743,207 | |
| |
| Series I: | | | | |
| Net asset value per share | | $ | 12.45 | |
| |
| Series II: | | | | |
| Net asset value per share | | $ | 12.06 | |
| |
| |
| * | At December 31, 2011, securities with an aggregate value of $4,174,866 were on loan to brokers. |
Statement of Operations
For the year ended December 31, 2011
| | | | | |
Investment income:
|
| Dividends (net of foreign withholding taxes of $48,392) | | $ | 1,713,482 | |
| |
| Dividends from affiliated money market funds (includes securities lending income of $29,879) | | | 36,662 | |
| |
| Total investment income | | | 1,750,144 | |
| |
| | | | | |
| | | | | |
Expenses:
|
| Advisory fees | | | 1,626,496 | |
| |
| Administrative services fees | | | 601,926 | |
| |
| Custodian fees | | | 18,795 | |
| |
| Distribution fees — Series II | | | 238,337 | |
| |
| Transfer agent fees | | | 35,213 | |
| |
| Trustees’ and officers’ fees and benefits | | | 27,156 | |
| |
| Other | | | 71,860 | |
| |
| Total expenses | | | 2,619,783 | |
| |
| Less: Fees waived | | | (12,792 | ) |
| |
| Net expenses | | | 2,606,991 | |
| |
| Net investment income (loss) | | | (856,847 | ) |
| |
| | | | | |
| | | | | |
Realized and unrealized gain (loss) from:
|
| Net realized gain from: | | | | |
| Investment securities (includes net gains from securities sold to affiliates of $1,322,373) | | | 21,932,463 | |
| |
| Foreign currencies | | | 21 | |
| |
| | | | 21,932,484 | |
| |
| Change in net unrealized appreciation (depreciation) of: | | | | |
| Investment securities | | | (46,143,284 | ) |
| |
| Foreign currencies | | | (135 | ) |
| |
| | | | (46,143,419 | ) |
| |
| Net realized and unrealized gain (loss) | | | (24,210,935 | ) |
| |
| Net increase (decrease) in net assets resulting from operations | | $ | (25,067,782 | ) |
| |
See accompanying Notes to Financial Statements which are an integral part of the financial statements.
Invesco V.I. Capital Development Fund
Statement of Changes in Net Assets
For the years ended December 31, 2011 and 2010
| | | | | | | | | |
| | | 2011 | | 2010 |
| |
Operations:
|
| Net investment income (loss) | | $ | (856,847 | ) | | $ | (470,655 | ) |
| |
| Net realized gain | | | 21,932,484 | | | | 23,142,942 | |
| |
| Change in net unrealized appreciation (depreciation) | | | (46,143,419 | ) | | | 5,835,983 | |
| |
| Net increase (decrease) in net assets resulting from operations | | | (25,067,782 | ) | | | 28,508,270 | |
| |
Share transactions–net:
|
| Series I | | | 47,766,607 | | | | (12,617,550 | ) |
| |
| Series II | | | (4,817,752 | ) | | | (16,250,389 | ) |
| |
| Net increase (decrease) in net assets resulting from share transactions | | | 42,948,855 | | | | (28,867,939 | ) |
| |
| Net increase (decrease) in net assets | | | 17,881,073 | | | | (359,669 | ) |
| |
Net assets:
|
| Beginning of year | | | 175,747,054 | | | | 176,106,723 | |
| |
| End of year (includes undistributed net investment income (loss) of $(86,599) and $(51,861), respectively) | | $ | 193,628,127 | | | $ | 175,747,054 | |
| |
Notes to Financial Statements
December 31, 2011
NOTE 1—Significant Accounting Policies
Invesco V.I. Capital Development Fund (the “Fund”) is a series portfolio of AIM Variable Insurance Funds (Invesco Variable Insurance Funds) (the “Trust”). The Trust is a Delaware statutory trust registered under the Investment Company Act of 1940, as amended (the “1940 Act”), as an open-end series management investment company consisting of twenty-eight separate portfolios, (each constituting a “Fund”). The assets, liabilities and operations of each portfolio are accounted for separately. Information presented in these financial statements pertains only to the Fund. Matters affecting each Fund or class will be voted on exclusively by the shareholders of such Fund or class. Current Securities and Exchange Commission (“SEC”) guidance, however, requires participating insurance companies offering separate accounts to vote shares proportionally in accordance with the instructions of the contract owners whose investments are funded by shares of each Fund or class.
The Fund’s investment objective is long-term growth of capital.
The Fund currently offers two classes of shares, Series I and Series II, both of which are offered to insurance company separate accounts funding variable annuity contracts and variable life insurance policies (“variable products”).
The following is a summary of the significant accounting policies followed by the Fund in the preparation of its financial statements.
| | |
| A. | | Security Valuations — Securities, including restricted securities, are valued according to the following policy. |
| | A security listed or traded on an exchange (except convertible bonds) is valued at its last sales price or official closing price as of the close of the customary trading session on the exchange where the security is principally traded, or lacking any sales or official closing price on a particular day, the security may be valued at the closing bid price on that day. Securities traded in the over-the-counter market are valued based on prices furnished by independent pricing services or market makers. When such securities are valued by an independent pricing service they may be considered fair valued. Futures contracts are valued at the final settlement price set by an exchange on which they are principally traded. Listed options are valued at the mean between the last bid and ask prices from the exchange on which they are principally traded. Options not listed on an exchange are valued by an independent source at the mean between the last bid and ask prices. For purposes of determining net asset value per share, futures and option contracts generally are valued 15 minutes after the close of the customary trading session of the New York Stock Exchange (“NYSE”). |
| | Investments in open-end and closed-end registered investment companies that do not trade on an exchange are valued at the end of day net asset value per share. Investments in open-end and closed-end registered investment companies that trade on an exchange are valued at the last sales price or official closing price as of the close of the customary trading session on the exchange where the security is principally traded. |
| | ��Debt obligations (including convertible bonds) and unlisted equities are fair valued using an evaluated quote provided by an independent pricing service. Evaluated quotes provided by the pricing service may be determined without exclusive reliance on quoted prices, and may reflect appropriate factors such as institution-size trading in similar groups of securities, developments related to specific securities, dividend rate, yield, quality, type of issue, coupon rate, maturity, individual trading characteristics and other market data. Debt securities are subject to interest rate and credit risks. In addition, all debt securities involve some risk of default with respect to interest and/or principal payments. |
| | Foreign securities (including foreign exchange contracts) are converted into U.S. dollar amounts using the applicable exchange rates as of the close of the NYSE. If market quotations are available and reliable for foreign exchange traded equity securities, the securities will be valued at the market quotations. Because trading hours for certain foreign securities end before the close of the NYSE, closing market quotations may become unreliable. If between the time trading ends on a particular security and the close of the customary trading session on the NYSE, events occur that are significant and |
Invesco V.I. Capital Development Fund
| | |
| | make the closing price unreliable, the Fund may fair value the security. If the event is likely to have affected the closing price of the security, the security will be valued at fair value in good faith using procedures approved by the Board of Trustees. Adjustments to closing prices to reflect fair value may also be based on a screening process of an independent pricing service to indicate the degree of certainty, based on historical data, that the closing price in the principal market where a foreign security trade is not the current value as of the close of the NYSE. Foreign securities meeting the approved degree of certainty that the price is not reflective of current value will be priced at the indication of fair value from the independent pricing service. Multiple factors may be considered by the independent pricing service in determining adjustments to reflect fair value and may include information relating to sector indices, American Depositary Receipts and domestic and foreign index futures. Foreign securities may have additional risks including exchange rate changes, potential for sharply devalued currencies and high inflation, political and economic upheaval, the relative lack of issuer information, relatively low market liquidity and the potential lack of strict financial and accounting controls and standards. |
| | Securities for which market prices are not provided by any of the above methods may be valued based upon quotes furnished by independent sources. The last bid price may be used to value equity securities. The mean between the last bid and asked prices is used to value debt obligations, including Corporate Loans. |
| | Securities for which market quotations are not readily available or are unreliable are valued at fair value as determined in good faith by or under the supervision of the Trust’s officers following procedures approved by the Board of Trustees. Issuer specific events, market trends, bid/ask quotes of brokers and information providers and other market data may be reviewed in the course of making a good faith determination of a security’s fair value. |
| | Valuations change in response to many factors including the historical and prospective earnings of the issuer, the value of the issuer’s assets, general economic conditions, interest rates, investor perceptions and market liquidity. Because of the inherent uncertainties of valuation, the values reflected in the financial statements may materially differ from the value received upon actual sale of those investments. |
| B. | | Securities Transactions and Investment Income — Securities transactions are accounted for on a trade date basis. Realized gains or losses on sales are computed on the basis of specific identification of the securities sold. Interest income is recorded on the accrual basis from settlement date. Dividend income (net of withholding tax, if any) is recorded on the ex-dividend date. |
| | The Fund may periodically participate in litigation related to Fund investments. As such, the Fund may receive proceeds from litigation settlements. Any proceeds received are included in the Statement of Operations as realized gain (loss) for investments no longer held and as unrealized gain (loss) for investments still held. |
| | Brokerage commissions and mark ups are considered transaction costs and are recorded as an increase to the cost basis of securities purchased and/or a reduction of proceeds on a sale of securities. Such transaction costs are included in the determination of net realized and unrealized gain (loss) from investment securities reported in the Statement of Operations and the Statement of Changes in Net Assets and the net realized and unrealized gains (losses) on securities per share in the Financial Highlights. Transaction costs are included in the calculation of the Fund’s net asset value and, accordingly, they reduce the Fund’s total returns. These transaction costs are not considered operating expenses and are not reflected in net investment income reported in the Statement of Operations and Statement of Changes in Net Assets, or the net investment income per share and ratios of expenses and net investment income reported in the Financial Highlights, nor are they limited by any expense limitation arrangements between the Fund and the investment adviser. |
| | The Fund allocates income and realized and unrealized capital gains and losses to a class based on the relative net assets of each class. |
| C. | | Country Determination — For the purposes of making investment selection decisions and presentation in the Schedule of Investments, the investment adviser may determine the country in which an issuer is located and/or credit risk exposure based on various factors. These factors include the laws of the country under which the issuer is organized, where the issuer maintains a principal office, the country in which the issuer derives 50% or more of its total revenues and the country that has the primary market for the issuer’s securities, as well as other criteria. Among the other criteria that may be evaluated for making this determination are the country in which the issuer maintains 50% or more of its assets, the type of security, financial guarantees and enhancements, the nature of the collateral and the sponsor organization. Country of issuer and/or credit risk exposure has been determined to be the United States of America, unless otherwise noted. |
| D. | | Distributions — Distributions from income and net realized capital gain, if any, are generally paid to separate accounts of participating insurance companies annually and recorded on ex-dividend date. |
| E. | | Federal Income Taxes — The Fund intends to comply with the requirements of Subchapter M of the Internal Revenue Code necessary to qualify as a regulated investment company and to distribute substantially all of the Fund’s taxable earnings to shareholders. As such, the Fund will not be subject to federal income taxes on otherwise taxable income (including net realized capital gain) that is distributed to shareholders. Therefore, no provision for federal income taxes is recorded in the financial statements. |
| | The Fund files tax returns in the U.S. Federal jurisdiction and certain other jurisdictions. Generally, the Fund is subject to examinations by such taxing authorities for up to three years after the filing of the return for the tax period. |
| F. | | Expenses — Fees provided for under the Rule 12b-1 plan of a particular class of the Fund and which are directly attributable to that class are charged to the operations of such class. All other expenses are allocated among the classes based on relative net assets. |
| G. | | Accounting Estimates — The preparation of financial statements in conformity with accounting principles generally accepted in the United States of America (“GAAP”) requires management to make estimates and assumptions that affect the reported amounts of assets and liabilities at the date of the financial statements and the reported amounts of revenues and expenses during the reporting period including estimates and assumptions related to taxation. Actual results could differ from those estimates by a significant amount. In addition, the Fund monitors for material events or transactions that may occur or become known after the period-end date and before the date the financial statements are released to print. |
| H. | | Indemnifications — Under the Trust’s organizational documents, each Trustee, officer, employee or other agent of the Trust is indemnified against certain liabilities that may arise out of performance of their duties to the Fund. Additionally, in the normal course of business, the Fund enters into contracts, including the Fund’s servicing agreements that contain a variety of indemnification clauses. The Fund’s maximum exposure under these arrangements is unknown as this would involve future claims that may be made against the Fund that have not yet occurred. The risk of material loss as a result of such indemnification claims is considered remote. |
| I. | | Securities Lending — The Fund may lend portfolio securities having a market value up to one-third of the Fund’s total assets. Such loans are secured by collateral equal to no less than the market value of the loaned securities determined daily by the securities lending provider. Such collateral will be cash or |
Invesco V.I. Capital Development Fund
| | |
| | debt securities issued or guaranteed by the U.S. Government or any of its sponsored agencies. Cash collateral received in connection with these loans is invested in short-term money market instruments or affiliated money market funds and is shown as such on the Schedule of Investments. It is the Fund’s policy to obtain additional collateral from or return excess collateral to the borrower by the end of the next business day, following the valuation date of the securities loaned. Therefore, the value of the collateral held may be temporarily less than the value of the securities on loan. Lending securities entails a risk of loss to the Fund if and to the extent that the market value of the securities loaned were to increase and the borrower did not increase the collateral accordingly, and the borrower fails to return the securities. Upon the failure of the borrower to return the securities, collateral may be liquidated and the securities may be purchased on the open market to replace the loaned securities. The Fund could experience delays and costs in gaining access to the collateral. The Fund bears the risk of any deficiency in the amount of the collateral available for return to the borrower due to any loss on the collateral invested. Dividends received on cash collateral investments for securities lending transactions, which are net of compensation to counterparties, is included in Dividends from affiliated money market funds on the Statement of Operations. The aggregate value of securities out on loan is shown as a footnote on the Statement of Assets and Liabilities, if any. |
| J. | | Foreign Currency Translations — Foreign currency is valued at the close of the NYSE based on quotations posted by banks and major currency dealers. Portfolio securities and other assets and liabilities denominated in foreign currencies are translated into U.S. dollar amounts at date of valuation. Purchases and sales of portfolio securities (net of foreign taxes withheld on disposition) and income items denominated in foreign currencies are translated into U.S. dollar amounts on the respective dates of such transactions. The Fund does not separately account for the portion of the results of operations resulting from changes in foreign exchange rates on investments and the fluctuations arising from changes in market prices of securities held. The combined results of changes in foreign exchange rates and the fluctuation of market prices on investments (net of estimated foreign tax withholding) are included with the net realized and unrealized gain or loss from investments in the Statement of Operations. Reported net realized foreign currency gains or losses arise from (1) sales of foreign currencies, (2) currency gains or losses realized between the trade and settlement dates on securities transactions, and (3) the difference between the amounts of dividends, interest, and foreign withholding taxes recorded on the Fund’s books and the U.S. dollar equivalent of the amounts actually received or paid. Net unrealized foreign currency gains and losses arise from changes in the fair values of assets and liabilities, other than investments in securities at fiscal period end, resulting from changes in exchange rates. |
| | The Fund may invest in foreign securities which may be subject to foreign taxes on income, gains on investments or currency repatriation, a portion of which may be recoverable. |
| K. | | Foreign Currency Contracts — The Fund may enter into foreign currency contracts to manage or minimize currency or exchange rate risk. The Fund may also enter into foreign currency contracts for the purchase or sale of a security denominated in a foreign currency in order to “lock in” the U.S. dollar price of that security. A foreign currency contract is an obligation to purchase or sell a specific currency for an agreed-upon price at a future date. The use of foreign currency contracts does not eliminate fluctuations in the price of the underlying securities the Fund owns or intends to acquire but establishes a rate of exchange in advance. Fluctuations in the value of these contracts are measured by the difference in the contract date and reporting date exchange rates and are recorded as unrealized appreciation (depreciation) until the contracts are closed. When the contracts are closed, realized gains (losses) are recorded. Realized and unrealized gains (losses) on the contracts are included in the Statement of Operations. The primary risks associated with foreign currency contracts include failure of the counterparty to meet the terms of the contract and the value of the foreign currency changing unfavorably. These risks may be in excess of the amounts reflected in the Statement of Assets and Liabilities. |
NOTE 2—Advisory Fees and Other Fees Paid to Affiliates
The Trust has entered into a master investment advisory agreement with Invesco Advisers, Inc. (the “Adviser” or “Invesco”). Effective May 2, 2011, under the terms of the investment advisory agreement, the Fund pays an advisory fee to the Adviser based on the annual rate of the Fund’s average daily net assets as follows:
| | | | | |
| Average Daily Net Assets | | Rate |
| |
| First $250 million | | | 0 | .745% |
| |
| Next $100 million | | | 0 | .73% |
| |
| Over $350 million | | | 0 | .625% |
| |
Prior to May 2, 2011, the Fund paid an advisory fee to the Adviser based on the annual rate of the Fund’s average daily net assets as follows:
| | | | | |
| Average Daily Net Assets | | Rate |
| |
| First $350 million | | | 0 | .75% |
| |
| Over $350 million | | | 0 | .625% |
| |
Also prior to May 2, 2011, the Adviser had contractually agreed to waive advisory fees to the extent necessary so that the advisory fees payable by the Fund (based on the Fund’s average daily net assets) do not exceed the annual rate of:
| | | | | |
| Average Net Assets | | Rate |
| |
| First $250 million | | | 0 | .745% |
| |
| Next $250 million | | | 0 | .73% |
| |
| Next $500 million | | | 0 | .715% |
| |
| Next $1.5 billion | | | 0 | .70% |
| |
| Next $2.5 billion | | | 0 | .685% |
| |
| Next $2.5 billion | | | 0 | .67% |
| |
| Next $2.5 billion | | | 0 | .655% |
| |
| Over $10 billion | | | 0 | .64% |
| |
Invesco V.I. Capital Development Fund
Under the terms of a master sub-advisory agreement between the Adviser and each of Invesco Asset Management Deutschland GmbH, Invesco Asset Management Limited, Invesco Asset Management (Japan) Limited, Invesco Australia Limited, Invesco Hong Kong Limited, Invesco Senior Secured Management, Inc. and Invesco Canada Ltd. (collectively, the “Affiliated Sub-Advisers”) the Adviser, not the Fund, may pay 40% of the fees paid to the Adviser to any such Affiliated Sub-Adviser(s) that provide discretionary investment management services to the Fund based on the percentage of assets allocated to such Sub-Adviser(s).
The Adviser has contractually agreed, through at least June 30, 2012, to waive advisory fees and/or reimburse expenses of all shares to the extent necessary to limit total annual fund operating expenses after fee waiver and/or expense reimbursement (excluding certain items discussed below) of Series I shares to 1.30% and Series II shares to 1.45% of average daily net assets. In determining the Adviser’s obligation to waive advisory fees and/or reimburse expenses, the following expenses are not taken into account, and could cause the total annual fund operating expenses after fee waiver and/or expense reimbursement to exceed the numbers reflected above: (1) interest; (2) taxes; (3) dividend expense on short sales; (4) extraordinary items or non-routine items, including litigation expenses; and (5) expenses that the Fund has incurred but did not actually pay because of an expense offset arrangement. Unless the Board of the Trustees and Invesco mutually agree to amend or continue the fee waiver agreement, it will terminate on June 30, 2012. The Adviser did not waive fees and/or reimburse expenses during the period under this expense limitation.
Further, the Adviser has contractually agreed, through at least June 30, 2012, to waive the advisory fee payable by the Fund in an amount equal to 100% of the net advisory fees the Adviser receives from the affiliated money market funds on investments by the Fund of uninvested cash in such affiliated money market funds.
For the year ended December 31, 2011, the Adviser waived advisory fees of $12,792.
The Trust has entered into a master administrative services agreement with Invesco pursuant to which the Fund has agreed to pay Invesco a fee for costs incurred in providing accounting services and fund administrative services to the Fund and to reimburse Invesco for administrative services fees paid to insurance companies that have agreed to provide services to the participants of separate accounts. These administrative services provided by the insurance companies may include, among other things: the printing of prospectuses, financial reports and proxy statements and the delivery of the same to existing participants; the maintenance of master accounts; the facilitation of purchases and redemptions requested by the participants; and the servicing of participants’ accounts. Pursuant to such agreement, for the year ended December 31, 2011, Invesco was paid $60,108 for accounting and fund administrative services and reimbursed $541,818 for services provided by insurance companies.
The Trust has entered into a transfer agency and service agreement with Invesco Investment Services, Inc. (“IIS”) pursuant to which the Fund has agreed to pay IIS a fee for providing transfer agency and shareholder services to the Fund and reimburse IIS for certain expenses incurred by IIS in the course of providing such services. For the year ended December 31, 2011, expenses incurred under the agreement are shown in the Statement of Operations as transfer agent fees.
The Trust has entered into a master distribution agreement with Invesco Distributors, Inc. (“IDI”) to serve as the distributor for the Fund. The Trust has adopted a plan pursuant to Rule 12b-1 under the 1940 Act with respect to the Fund’s Series II shares (the “Plan”). The Fund, pursuant to the Plan, pays IDI compensation at the annual rate of 0.25% of the Fund’s average daily net assets of Series II shares. Of the Plan payments, up to 0.25% of the average daily net assets of the Series II shares may be paid to insurance companies who furnish continuing personal shareholder services to customers who purchase and own Series II shares of the Fund. For the year ended December 31, 2011, expenses incurred under the Plan are detailed in the Statement of Operations as distribution fees.
Certain officers and trustees of the Trust are officers and directors of the Adviser, IIS and/or IDI.
NOTE 3—Additional Valuation Information
GAAP defines fair value as the price that would be received to sell an asset or paid to transfer a liability in an orderly transaction between market participants at the measurement date, under current market conditions. GAAP establishes a hierarchy that prioritizes the inputs to valuation methods giving the highest priority to readily available unadjusted quoted prices in an active market for identical assets (Level 1) and the lowest priority to significant unobservable inputs (Level 3) generally when market prices are not readily available or are unreliable. Based on the valuation inputs, the securities or other investments are tiered into one of three levels. Changes in valuation methods may result in transfers in or out of an investment’s assigned level:
| | |
| | Level 1 — | Prices are determined using quoted prices in an active market for identical assets. |
| | Level 2 — | Prices are determined using other significant observable inputs. Observable inputs are inputs that other market participants may use in pricing a security. These may include quoted prices for similar securities, interest rates, prepayment speeds, credit risk, yield curves, loss severities, default rates, discount rates, volatilities and others. |
| | Level 3 — | Prices are determined using significant unobservable inputs. In situations where quoted prices or observable inputs are unavailable (for example, when there is little or no market activity for an investment at the end of the period), unobservable inputs may be used. Unobservable inputs reflect the Fund’s own assumptions about the factors market participants would use in determining fair value of the securities or instruments and would be based on the best available information. |
The following is a summary of the tiered valuation input levels, as of December 31, 2011. The level assigned to the securities valuations may not be an indication of the risk or liquidity associated with investing in those securities. Because of the inherent uncertainties of valuation, the values reflected in the financial statements may materially differ from the value received upon actual sale of those investments.
During the year ended December 31, 2011, there were no significant transfers between investment levels.
| | | | | | | | | | | | | | | | | |
| | | Level 1 | | Level 2 | | Level 3 | | Total |
| |
| Equity Securities | | $ | 195,491,784 | | | $ | 2,016,634 | | | $ | — | | | $ | 197,508,418 | |
| |
NOTE 4—Security Transactions with Affiliated Funds
The Fund is permitted to purchase or sell securities from or to certain other Invesco Funds under specified conditions outlined in procedures adopted by the Board of Trustees of the Trust. The procedures have been designed to ensure that any purchase or sale of securities by the Fund from or to another fund or portfolio that is or could be considered an affiliate by virtue of having a common investment adviser (or affiliated investment advisers), common Trustees and/or
Invesco V.I. Capital Development Fund
common officers complies with Rule 17a-7 of the 1940 Act. Further, as defined under the procedures, each transaction is effected at the current market price. Pursuant to these procedures, for the year ended December 31, 2011, the Fund engaged in securities purchases of $6,083,616 and securities sales of $7,174,591, which resulted in net realized gains of $1,322,373.
NOTE 5—Trustees’ and Officers’ Fees and Benefits
“Trustees’ and Officers’ Fees and Benefits” include amounts accrued by the Fund to pay remuneration to certain Trustees and Officers of the Fund. Trustees have the option to defer compensation payable by the Fund, and “Trustees’ and Officers’ Fees and Benefits” also include amounts accrued by the Fund to fund such deferred compensation amounts. Those Trustees who defer compensation have the option to select various Invesco Funds in which their deferral accounts shall be deemed to be invested. Finally, certain current Trustees are eligible to participate in a retirement plan that provides for benefits to be paid upon retirement to Trustees over a period of time based on the number of years of service. The Fund may have certain former Trustees who also participate in a retirement plan and receive benefits under such plan. “Trustees’ and Officers’ Fees and Benefits” include amounts accrued by the Fund to fund such retirement benefits. Obligations under the deferred compensation and retirement plans represent unsecured claims against the general assets of the Fund.
During the year ended December 31, 2011, the Fund paid legal fees of $1,371 for services rendered by Kramer, Levin, Naftalis & Frankel LLP as counsel to the Independent Trustees. A partner of that firm is a Trustee of the Trust.
NOTE 6—Cash Balances
The Fund is permitted to temporarily carry a negative or overdrawn balance in its account with State Street Bank and Trust Company, the custodian bank. To compensate the custodian bank for such overdrafts, the overdrawn Fund may either (1) leave funds as a compensating balance in the account so the custodian bank can be compensated by earning the additional interest; or (2) compensate by paying the custodian bank at a rate agreed upon by the custodian bank and Invesco, not to exceed the contractually agreed upon rate.
NOTE 7—Distributions to Shareholders and Tax Components of Net Assets
There were no ordinary income or long-term capital gain distributions paid during the years ended December 31, 2011 and 2010.
Tax Components of Net Assets at Period-End:
| | | | | |
| | | 2011 |
| |
| Net unrealized appreciation — investments | | $ | 12,239,409 | |
| |
| Net unrealized appreciation (depreciation) — other investments | | | (27 | ) |
| |
| Temporary book/tax differences | | | (86,599 | ) |
| |
| Capital loss carryforward | | | (54,943,263 | ) |
| |
| Shares of beneficial interest | | | 236,418,607 | |
| |
| Total net assets | | $ | 193,628,127 | |
| |
The difference between book-basis and tax-basis unrealized appreciation (depreciation) is due to differences in the timing of recognition of gains and losses on investments for tax and book purposes. The Fund’s net unrealized appreciation difference is attributable primarily to wash sales.
The temporary book/tax differences are a result of timing differences between book and tax recognition of income and/or expenses. The Fund’s temporary book/tax differences are the result of the trustee deferral of compensation and retirement plan benefits.
Capital loss carryforward is calculated and reported as of a specific date. Results of transactions and other activity after that date may affect the amount of capital loss carryforward actually available for the Fund to utilize. The Regulated Investment Company Modernization Act of 2010 (the “Act”) eliminated the eight-year carryover period for capital losses that arise in taxable years beginning after its enactment date of December 22, 2010. Consequently, these capital losses can be carried forward for an unlimited period. However, capital losses with an expiration period may not be used to offset capital gains until all net capital losses without an expiration date have been utilized. Additionally, post-enactment capital loss carryovers will retain their character as either short-term or long-term capital losses instead of as short-term capital losses as under prior law. The ability to utilize capital loss carryforward in the future may be limited under the Internal Revenue Code and related regulations based on the results of future transactions. Under these limitation rules, the Fund is limited to utilizing $ 42,247,554 of capital loss carryforward in the fiscal year ending December 31, 2012.
The Fund utilized $ 21,958,257 of capital loss carryforward in the current period to offset net realized capital gain for federal income tax purposes. The Fund has a capital loss carryforward as of December 31, 2011, which expires as follows:
| | | | | | | | | | | | | |
| Capital Loss Carryforward* |
| Expiration | | Short-Term | | Long-Term | | Total |
| |
| December 31, 2015 | | $ | 4,972,522 | | | $ | — | | | $ | 4,972,522 | |
| |
| December 31, 2016 | | | 23,511,984 | | | | — | | | | 23,511,984 | |
| |
| December 31, 2017 | | | 26,458,757 | | | | — | | | | 26,458,757 | |
| |
| Total capital loss carryforward | | $ | 54,943,263 | | | $ | — | | | $ | 54,943,263 | |
| |
| |
| * | Capital loss carryforward as of the date listed above is reduced for limitations, if any, to the extent required by the Internal Revenue Code. To the extent that unrealized gains as of May 2, 2011, the date of reorganization of Invesco V.I. Dynamics Fund into the Fund and realized on securities held in each fund at such date of reorganization, the capital loss carryforward may be further limited for up to five years from the date of the reorganization. |
Invesco V.I. Capital Development Fund
NOTE 8—Investment Securities
The aggregate amount of investment securities (other than short-term securities, U.S. Treasury obligations and money market funds, if any) purchased and sold by the Fund during the year ended December 31, 2011 was $333,704,625 and $315,253,426, respectively. Cost of investments on a tax basis includes the adjustments for financial reporting purposes as of the most recently completed Federal income tax reporting period-end.
| | | | | |
| Unrealized Appreciation (Depreciation) of Investment Securities on a Tax Basis |
| |
| Aggregate unrealized appreciation of investment securities | | $ | 23,382,697 | |
| |
| Aggregate unrealized (depreciation) of investment securities | | | (11,143,288 | ) |
| |
| Net unrealized appreciation of investment securities | | $ | 12,239,409 | |
| |
| Cost of investments for tax purposes is $185,269,009. |
NOTE 9—Reclassification of Permanent Differences
Primarily as a result of differing book/tax treatment of net operating losses, on December 31, 2011, undistributed net investment income (losses) was increased by $846,110, undistributed net realized gain (loss) was increased by $41 and shares of beneficial interest decreased by $846,151. Further, as a result of tax deferrals acquired in the reorganization of Invesco V.I. Dynamics Fund into the Fund, undistributed net investment income (loss) was decreased by $24,001, undistributed net realized gain (loss) was decreased by $23,771,407 and shares of beneficial interest increased by $23,795,408. These reclassifications had no effect on the net assets of the Fund.
NOTE 10—Share Information
| | | | | | | | | | | | | | | | | |
| | | Summary of Share Activity |
| |
| | | Year ended December 31, |
| | | 2011(a) | | 2010 |
| | | Shares | | Amount | | Shares | | Amount |
| |
| Sold: | | | | | | | | | | | | | | | | |
| Series I | | | 4,950,569 | | | $ | 69,861,938 | | | | 985,705 | | | $ | 11,570,756 | |
| |
| Series II | | | 2,003,550 | | | | 26,759,687 | | | | 838,860 | | | | 9,669,323 | |
| |
Issued in connection with acquisitions:(b) | | | | | | | | | | | | | | | | |
| Series I | | | 4,084,698 | | | | 61,763,293 | | | | — | | | | — | |
| |
| Series II | | | 675 | | | | 9,893 | | | | — | | | | — | |
| |
| Reacquired: | | | | | | | | | | | | | | | | |
| Series I | | | (6,179,608 | ) | | | (83,858,624 | ) | | | (2,070,684 | ) | | | (24,188,306 | ) |
| |
| Series II | | | (2,411,144 | ) | | | (31,587,332 | ) | | | (2,263,580 | ) | | | (25,919,712 | ) |
| |
| Net increase (decrease) in share activity | | | 2,448,740 | | | $ | 42,948,855 | | | | (2,509,699 | ) | | $ | (28,867,939 | ) |
| |
| | |
| (a) | | There are entities that are record owners of more than 5% of the outstanding shares of the Fund and in the aggregate own 62% of the outstanding shares of the Fund. The Fund and the Fund’s principal underwriter or adviser, are parties to participation agreements with these entities whereby these entities sell units of interest in separate accounts funding variable products that are invested in the Fund. The Fund, Invesco and/or Invesco affiliates may make payments to these entities, which are considered to be related to the Fund, for providing services to the Fund, Invesco and/or Invesco affiliates including but not limited to services such as, securities brokerage, third party record keeping and account servicing and administrative services. The Fund has no knowledge as to whether all or any portion of the shares owned of record by these entities are also owned beneficially. |
| (b) | | As of the opening of business on May 2, 2011, the Fund acquired all the net assets of Invesco V.I. Dynamics Fund (the “Target Fund”) pursuant to a plan of reorganization approved by the Trustees of the Fund on November 10, 2010 and by the shareholders of the Target Fund on April 1, 2011. The acquisition was accomplished by a tax-free exchange of 4,085,373 shares of the Fund for 3,130,800 shares outstanding of the Target Fund as of the close of business on April 29, 2011. Each class of the Target Fund was exchanged for the like class of shares of the Fund based on the relative net asset value of the Target Fund to the net asset value of the Fund at the close of business on April 29, 2011. The Target Fund’s net assets at that date of $61,773,186 including $13,383,842 of unrealized appreciation were combined with those of the Fund. The net assets of the Fund immediately before the acquisition were $228,323,159 and $290,096,345 immediately after the acquisition. |
The pro forma results of operations for the year ended December 31, 2011, assuming the reorganization had been completed on January 1, 2011, the beginning of the annual reporting period, are as follows:
| | | | | |
| Net investment income (loss) | | $ | (868,058 | ) |
| Net realized/unrealized gains (losses) | | | (17,700,362 | ) |
| | | | | |
| Change in net assets resulting from operations | | $ | (18,568,420 | ) |
The combined investment portfolios have been managed as a single integrated portfolio since the acquisition was completed, it is not practicable to separate the amounts of revenue and earnings of the Target Fund that have been included in the Fund’s Statement of Operations since May 2, 2011.
Invesco V.I. Capital Development Fund
NOTE 11—Financial Highlights
The following schedule presents financial highlights for a share of the Fund outstanding throughout the periods indicated.
| | | | | | | | | | | | | | | | | | | | | | | | | | | | | | | | | | | | | | | | | | | | | | | | | |
| | | | | | | | | | | | | | | | | | | Ratio of
| | Ratio of
| | | | |
| | | | | | | Net gains
| | | | | | | | | | | | expenses
| | expenses
| | | | |
| | | | | | | (losses) on
| | | | | | | | | | | | to average
| | to average net
| | Ratio of net
| | |
| | | Net asset
| | Net
| | securities
| | | | Distributions
| | | | | | | | net assets
| | assets without
| | investment
| | |
| | | value,
| | investment
| | (both
| | Total from
| | from net
| | Net asset
| | | | Net assets,
| | with fee waivers
| | fee waivers
| | income (loss)
| | |
| | | beginning
| | income
| | realized and
| | investment
| | realized
| | value, end
| | Total
| | end of period
| | and/or expenses
| | and/or expenses
| | to average
| | Portfolio
|
| | | of period | | (loss)(a) | | unrealized) | | operations | | gains | | of period | | return(b) | | (000s omitted) | | absorbed | | absorbed | | net assets | | turnover(c) |
| |
| Series I |
| Year ended 12/31/11 | | $ | 13.41 | | | $ | (0.04 | ) | | $ | (0.92 | ) | | $ | (0.96 | ) | | $ | — | | | $ | 12.45 | | | | (7.16 | )% | | $ | 112,297 | | | | 1.08 | %(d) | | | 1.09 | %(d) | | | (0.28 | )%(d) | | | 161 | % |
| Year ended 12/31/10 | | | 11.29 | | | | (0.02 | ) | | | 2.14 | | | | 2.12 | | | | — | | | | 13.41 | | | | 18.78 | | | | 82,665 | | | | 1.08 | | | | 1.09 | | | | (0.14 | ) | | | 79 | |
| Year ended 12/31/09 | | | 7.93 | | | | (0.04 | ) | | | 3.40 | | | | 3.36 | | | | — | | | | 11.29 | | | | 42.37 | | | | 81,866 | | | | 1.10 | | | | 1.11 | | | | (0.41 | ) | | | 102 | |
| Year ended 12/31/08 | | | 18.85 | | | | (0.05 | ) | | | (8.88 | ) | | | (8.93 | ) | | | (1.99 | ) | | | 7.93 | | | | (47.03 | ) | | | 61,986 | | | | 1.10 | | | | 1.11 | | | | (0.38 | ) | | | 99 | |
| Year ended 12/31/07 | | | 18.43 | | | | (0.10 | ) | | | 2.14 | | | | 2.04 | | | | (1.62 | ) | | | 18.85 | | | | 10.84 | | | | 149,776 | | | | 1.05 | | | | 1.06 | | | | (0.47 | ) | | | 109 | |
| |
| Series II |
| Year ended 12/31/11 | | | 13.02 | | | | (0.07 | ) | | | (0.89 | ) | | | (0.96 | ) | | | — | | | | 12.06 | | | | (7.37 | ) | | | 81,331 | | | | 1.33 | (d) | | | 1.34 | (d) | | | (0.53 | )(d) | | | 161 | |
| Year ended 12/31/10 | | | 10.99 | | | | (0.04 | ) | | | 2.07 | | | | 2.03 | | | | — | | | | 13.02 | | | | 18.47 | | | | 93,082 | | | | 1.33 | | | | 1.34 | | | | (0.39 | ) | | | 79 | |
| Year ended 12/31/09 | | | 7.74 | | | | (0.06 | ) | | | 3.31 | | | | 3.25 | | | | — | | | | 10.99 | | | | 41.99 | | | | 94,241 | | | | 1.35 | | | | 1.36 | | | | (0.66 | ) | | | 102 | |
| Year ended 12/31/08 | | | 18.53 | | | | (0.09 | ) | | | (8.71 | ) | | | (8.80 | ) | | | (1.99 | ) | | | 7.74 | | | | (47.13 | ) | | | 80,473 | | | | 1.35 | | | | 1.36 | | | | (0.63 | ) | | | 99 | |
| Year ended 12/31/07 | | | 18.19 | | | | (0.15 | ) | | | 2.11 | | | | 1.96 | | | | (1.62 | ) | | | 18.53 | | | | 10.55 | | | | 190,815 | | | | 1.30 | | | | 1.31 | | | | (0.72 | ) | | | 109 | |
| |
| | |
| (a) | | Calculated using average shares outstanding. |
| (b) | | Includes adjustments in accordance with accounting principles generally accepted in the United States of America and as such, the net asset value for financial reporting purposes and the returns based upon those net asset values may differ from the net asset value and returns for shareholder transactions. Total returns are not annualized for periods less than one year, if applicable, and do not reflect charges assessed in connection with a variable product, which if included would reduce total returns. |
| (c) | | Portfolio turnover is calculated at the fund level and is not annualized for periods less than one year, if applicable. For the period ending December 31, 2011, the portfolio turnover calculation excludes the value of securities purchased of $47,957,386 and sold of $37,916,746 in effect to realign the Fund’s portfolio holdings after the reorganization of Invesco V.I. Dynamics Fund into the Fund. |
| (d) | | Ratios are based on average daily net assets (000’s) of $122,525 and $95,335 for Series I and Series II shares, respectively. |
NOTE 12—Proposed Reorganization
The Board of Trustees of the Fund unanimously approved an Agreement and Plan of Reorganization (the “Agreement”) pursuant to which the Fund would transfer all of its assets and liabilities to Invesco Van Kampen V.I. Mid Cap Growth Fund (the “Acquiring Fund”).
The Agreement requires approval of the Fund’s shareholders and will be submitted to the shareholders for their consideration at a meeting to be held in or around April 2012. Upon closing of the reorganization, shareholders of the Fund will receive a corresponding class of shares of the Acquiring Fund in exchange for their shares of the Fund and the Fund will liquidate and cease operations.
Invesco V.I. Capital Development Fund
Report of Independent Registered Public Accounting Firm
To the Board of Trustees of AIM Variable Insurance Funds (Invesco Variable Insurance Funds)
and Shareholders of Invesco V.I. Capital Development Fund:
In our opinion, the accompanying statement of assets and liabilities, including the schedule of investments, and the related statements of operations and of changes in net assets and the financial highlights present fairly, in all material respects, the financial position of Invesco V.I. Capital Development Fund (one of the funds constituting AIM Variable Insurance Funds (Invesco Variable Insurance Funds), hereafter referred to as the “Fund”) at December 31, 2011, the results of its operations for the year then ended, the changes in its net assets for each of the two years in the period then ended and the financial highlights for each of the five years in the period then ended, in conformity with accounting principles generally accepted in the United States of America. These financial statements and financial highlights (hereafter referred to as “financial statements”) are the responsibility of the Fund’s management; our responsibility is to express an opinion on these financial statements based on our audits. We conducted our audits of these financial statements in accordance with the standards of the Public Company Accounting Oversight Board (United States). Those standards require that we plan and perform the audits to obtain reasonable assurance about whether the financial statements are free of material misstatement. An audit includes examining, on a test basis, evidence supporting the amounts and disclosures in the financial statements, assessing the accounting principles used and significant estimates made by management, and evaluating the overall financial statement presentation. We believe that our audits, which included confirmation of securities at December 31, 2011 by correspondence with the custodian and brokers, provide a reasonable basis for our opinion.
PRICEWATERHOUSECOOPERS LLP
February 14, 2012
Houston, Texas
Invesco V.I. Capital Development Fund
Calculating your ongoing Fund expenses
Example
As a shareholder of the Fund, you incur ongoing costs, including management fees; distribution and/or service fees (12b-1); and other Fund expenses. This example is intended to help you understand your ongoing costs (in dollars) of investing in the Fund and to compare these costs with ongoing costs of investing in other mutual funds. The example is based on an investment of $1,000 invested at the beginning of the period and held for the entire period July 1, 2011 through December 31, 2011.
The actual and hypothetical expenses in the examples below do not represent the effect of any fees or other expenses assessed in connection with a variable product; if they did, the expenses shown would be higher while the ending account values shown would be lower.
Actual expenses
The table below provides information about actual account values and actual expenses. You may use the information in this table, together with the amount you invested, to estimate the expenses that you paid over the period. Simply divide your account value by $1,000 (for example, an $8,600 account value divided by $1,000 = 8.6), then multiply the result by the number in the table under the heading entitled “Actual Expenses Paid During Period” to estimate the expenses you paid on your account during this period.
Hypothetical example for comparison purposes
The table below also provides information about hypothetical account values and hypothetical expenses based on the Fund’s actual expense ratio and an assumed rate of return of 5% per year before expenses, which is not the Fund’s actual return.
The hypothetical account values and expenses may not be used to estimate the actual ending account balance or expenses you paid for the period. You may use this information to compare the ongoing costs of investing in the Fund and other funds. To do so, compare this 5% hypothetical example with the 5% hypothetical examples that appear in the shareholder reports of the other funds.
Please note that the expenses shown in the table are meant to highlight your ongoing costs. Therefore, the hypothetical information is useful in comparing ongoing costs, and will not help you determine the relative total costs of owning different funds.
| | | | | | | | | | | | | | | | | | | | | | | | | | | | | | | |
| | | | | | | | | | HYPOTHETICAL
| | | |
| | | | | | | | | | (5% annual return before
| | | |
| | | | | | | ACTUAL | | | expenses) | | | |
| | | | Beginning
| | | Ending
| | | Expenses
| | | Ending
| | | Expenses
| | | Annualized
|
| | | | Account Value
| | | Account Value
| | | Paid During
| | | Account Value
| | | Paid During
| | | Expense
|
| Class | | | (07/01/11) | | | (12/31/11)1 | | | Period2 | | | (12/31/11) | | | Period2 | | | Ratio |
| Series I | | | $ | 1,000.00 | | | | $ | 856.30 | | | | $ | 5.15 | | | | $ | 1,019.66 | | | | $ | 5.60 | | | | | 1.10 | % |
| | | | | | | | | | | | | | | | | | | | | | | | | | | | | | | |
| Series II | | | | 1,000.00 | | | | | 855.30 | | | | | 6.31 | | | | | 1,018.40 | | | | | 6.87 | | | | | 1.35 | |
| | | | | | | | | | | | | | | | | | | | | | | | | | | | | | | |
| |
| 1 | The actual ending account value is based on the actual total return of the Fund for the period July 1, 2011 through December 31, 2011, after actual expenses and will differ from the hypothetical ending account value which is based on the Fund’s expense ratio and a hypothetical annual return of 5% before expenses. |
| 2 | Expenses are equal to the Fund’s annualized expense ratio as indicated above multiplied by the average account value over the period, multiplied by 184/365 to reflect the most recent fiscal half year. |
Invesco V.I. Capital Development Fund
The address of each trustee and officer is AIM Variable Insurance Funds (Invesco Variable Insurance Funds) (the “Trust”), 11 Greenway Plaza, Suite 2500, Houston, Texas 77046-1173. The trustees serve for the life of the Trust, subject to their earlier death, incapacitation, resignation, retirement or removal as more specifically provided in the Trust’s organizational documents. Each officer serves for a one year term or until their successors are elected and qualified. Column two below includes length of time served with predecessor entities, if any.
| | | | | | | | | |
| | | | | | | Number of Funds
| | |
Name, Year of Birth and
| | Trustee and/
| | Principal Occupation(s)
| | in Fund Complex
| | Other Directorship(s)
|
| Position(s) Held with the Trust | | or Officer Since | | During Past 5 Years | | Overseen by Trustee | | Held by Trustee |
| | | | | | | | | |
| | | | | | | | | |
| | | | | | | | | |
| Interested Persons | | | | | | | | |
| | | | | | | | | |
| | | | | | | | | |
| | | | | | | | | |
Martin L. Flanagan1 — 1960
Trustee | | 2007 | | Executive Director, Chief Executive Officer and President, Invesco Ltd. (ultimate parent of Invesco and a global investment management firm); Advisor to the Board, Invesco Advisers, Inc. (formerly known as Invesco Institutional (N.A.), Inc.); Trustee, The Invesco Funds; Vice Chair, Investment Company Institute; and Member of Executive Board, SMU Cox School of Business
Formerly: Chairman, Invesco Advisers, Inc. (registered investment adviser); Director, Chairman, Chief Executive Officer and President, IVZ Inc. (holding company), INVESCO Group Services, Inc. (service provider) and Invesco North American Holdings, Inc. (holding company); Director, Chief Executive Officer and President, Invesco Holding Company Limited (parent of Invesco and a global investment management firm); Director, Invesco Ltd.; Chairman, Investment Company Institute and President, Co-Chief Executive Officer, Co-President, Chief Operating Officer and Chief Financial Officer, Franklin Resources, Inc. (global investment management organization) | | 140 | | None |
| | | | | | | | | |
| | | | | | | | | |
| | | | | | | | | |
Philip A. Taylor2 — 1954
Trustee, President and Principal Executive Officer | | 2006 | | Head of North American Retail and Senior Managing Director, Invesco Ltd.; Director, Co-Chairman, Co-President and Co-Chief Executive Officer, Invesco Advisers, Inc. (formerly known as Invesco Institutional (N.A.), Inc.) (registered investment adviser); Director, Chairman, Chief Executive Officer and President, Invesco Management Group, Inc. (formerly Invesco Aim Management Group, Inc.) (financial services holding company); Director and President, INVESCO Funds Group, Inc. (registered investment adviser and registered transfer agent); Director and Chairman, Invesco Investment Services, Inc. (formerly known as Invesco Aim Investment Services, Inc.) (registered transfer agent) and IVZ Distributors, Inc. (formerly known as INVESCO Distributors, Inc.) (registered broker dealer); Director, President and Chairman, Invesco Inc. (holding company) and Invesco Canada Holdings Inc. (holding company); Chief Executive Officer, Invesco Corporate Class Inc. (corporate mutual fund company) and Invesco Canada Fund Inc. (corporate mutual fund company); Director, Chairman and Chief Executive Officer, Invesco Canada Ltd. (formerly known as Invesco Trimark Ltd./Invesco Trimark Ltèe) (registered investment adviser and registered transfer agent); Trustee, President and Principal Executive Officer, The Invesco Funds (other than AIM Treasurer’s Series Trust (Invesco Treasurer’s Series Trust) and Short-Term Investments Trust); Trustee and Executive Vice President, The Invesco Funds (AIM Treasurer’s Series Trust (Invesco Treasurer’s Series Trust) and Short-Term Investments Trust only); Director, Invesco Investment Advisers LLC (formerly known as Van Kampen Asset Management); Director, Chief Executive Officer and President, Van Kampen Exchange Corp. | | 140 | | None |
| | | | | | | | | |
| | | | | | | | | |
| | | | | Formerly: Director and Chairman, Van Kampen Investor Services Inc.: Director, Chief Executive Officer and President, 1371 Preferred Inc. (holding company); and Van Kampen Investments Inc.; Director and President, AIM GP Canada Inc. (general partner for limited partnerships); and Van Kampen Advisors, Inc.; Director and Chief Executive Officer, Invesco Trimark Dealer Inc. (registered broker dealer); Director, Invesco Distributors, Inc. (formerly known as Invesco Aim Distributors, Inc.) (registered broker dealer); Manager, Invesco PowerShares Capital Management LLC; Director, Chief Executive Officer and President, Invesco Advisers, Inc.; Director, Chairman, Chief Executive Officer and President, Invesco Aim Capital Management, Inc.; President, Invesco Trimark Dealer Inc. and Invesco Trimark Ltd./Invesco Trimark Ltèe; Director and President, AIM Trimark Corporate Class Inc. and AIM Trimark Canada Fund Inc.; Senior Managing Director, Invesco Holding Company Limited; Trustee and Executive Vice President, Tax-Free Investments Trust; Director and Chairman, Fund Management Company (former registered broker dealer); President and Principal Executive Officer, The Invesco Funds (AIM Treasurer’s Series Trust (Invesco Treasurer’s Series Trust), Short-Term Investments Trust and Tax-Free Investments Trust only); President, AIM Trimark Global Fund Inc. and AIM Trimark Canada Fund Inc. | | | | |
| | | | | | | | | |
| | | | | | | | | |
| | | | | | | | | |
Wayne W. Whalen3 — 1939
Trustee | | 2010 | | Of Counsel, and prior to 2010, partner in the law firm of Skadden, Arps, Slate, Meagher & Flom LLP, legal counsel to funds in the Fund Complex | | 158 | | Director of the Abraham Lincoln Presidential Library Foundation |
| | | | | | | | | |
| | | | | | | | | |
| | | | | | | | | |
| Independent Trustees | | | | | | | | |
| | | | | | | | | |
| | | | | | | | | |
| | | | | | | | | |
Bruce L. Crockett — 1944
Trustee and Chair | | 1993 | | Chairman, Crockett Technology Associates (technology consulting company) | | 140 | | ACE Limited (insurance company); and Investment Company Institute |
| | | | | Formerly: Director, Captaris (unified messaging provider); Director, President and Chief Executive Officer COMSAT Corporation; and Chairman, Board of Governors of INTELSAT (international communications company) | | | | |
| | | | | | | | | |
| |
| 1 | Mr. Flanagan is considered an interested person of the Trust because he is an officer of the adviser to the Trust, and an officer and a director of Invesco Ltd., ultimate parent of the adviser to the Trust. |
| 2 | Mr. Taylor is considered an interested person of the Trust because he is an officer and a director of the adviser to, and a director of the principal underwriter of, the Trust. |
| 3 | Mr. Whalen is considered an “interested person” (within the meaning of Section 2(a)(19) of the 1940 Act) of certain Funds in the Fund Complex by reason of he and his firm currently providing legal services as legal counsel to such Funds in the Fund Complex. |
Invesco V.I. Capital Development Fund
Trustees and Officers—(continued)
The address of each trustee and officer is AIM Variable Insurance Funds (Invesco Variable Insurance Funds) (the “Trust”), 11 Greenway Plaza, Suite 2500, Houston, Texas 77046-1173. The trustees serve for the life of the Trust, subject to their earlier death, incapacitation, resignation, retirement or removal as more specifically provided in the Trust’s organizational documents. Each officer serves for a one year term or until their successors are elected and qualified. Column two below includes length of time served with predecessor entities, if any.
| | | | | | | | | |
| | | | | | | Number of Funds
| | |
Name, Year of Birth and
| | Trustee and/
| | Principal Occupation(s)
| | in Fund Complex
| | Other Directorship(s)
|
| Position(s) Held with the Trust | | or Officer Since | | During Past 5 Years | | Overseen by Trustee | | Held by Trustee |
| | | | | | | | | |
| | | | | | | | | |
| | | | | | | |
Independent Trustees—(continued) | | | | | | |
| | | | | | | | | |
| | | | | | | | | |
| | | | | | | | | |
David C. Arch — 1945
Trustee | | 2010 | | Chairman and Chief Executive Officer of Blistex Inc., a consumer health care products manufacturer. | | 158 | | Member of the Heartland Alliance Advisory Board, a nonprofit organization serving human needs based in Chicago. Board member of the Illinois Manufacturers’ Association. Member of the Board of Visitors, Institute for the Humanities, University of Michigan |
| | | | | | | | | |
| | | | | | | | | |
| | | | | | | | | |
Frank S. Bayley — 1939
Trustee | | 2001 | | Retired
Formerly: Director, Badgley Funds, Inc. (registered investment company) (2 portfolios) and Partner, law firm of Baker & McKenzie
Formerly: Director, Badgley Funds, Inc. (registered investment company) (2 portfolios) and Partner, law firm of Baker & McKenzie | | 140 | | Director and Chairman, C.D. Stimson Company (a real estate investment company) |
| | | | | | | | | |
| | | | | | | | | |
| | | | | | | | | |
James T. Bunch — 1942
Trustee | | 2004 | | Managing Member, Grumman Hill Group LLC (family office private equity management)
Formerly: Founder, Green, Manning & Bunch Ltd. (investment banking firm)(1988-2010); Executive Committee, United States Golf Association; and Director, Policy Studies, Inc. and Van Gilder Insurance Corporation | | 140 | | Vice Chairman, Board of Governors, Western Golf Association/Evans Scholars Foundation and Director, Denver Film Society |
| | | | | | | | | |
| | | | | | | | | |
| | | | | | | | | |
Rodney F. Dammeyer — 1940
Trustee | | 2010 | | President of CAC, LLC, a private company offering capital investment and management advisory services.
Formerly: Prior to January 2004, Director of TeleTech Holdings Inc.; Prior to 2002, Director of Arris Group, Inc.; Prior to 2001, Managing Partner at Equity Group Corporate Investments. Prior to 1995, Vice Chairman of Anixter International. Prior to 1985, experience includes Senior Vice President and Chief Financial Officer of Household International, Inc., Executive Vice President and Chief Financial Officer of Northwest Industries, Inc. and Partner of Arthur Andersen & Co. | | 158 | | Director of Quidel Corporation and Stericycle, Inc. Prior to May 2008, Trustee of The Scripps Research Institute. Prior to February 2008, Director of Ventana Medical Systems, Inc. Prior to April 2007, Director of GATX Corporation. Prior to April 2004, Director of TheraSense, Inc. |
| | | | | | | | | |
| | | | | | | | | |
| | | | | | | | | |
Albert R. Dowden — 1941
Trustee | | 2000 | | Director of a number of public and private business corporations, including the Boss Group, Ltd. (private investment and management); Reich & Tang Funds (5 portfolios) (registered investment company); and Homeowners of America Holding Corporation/ Homeowners of America Insurance Company (property casualty company)
Formerly: Director, Continental Energy Services, LLC (oil and gas pipeline service); Director, CompuDyne Corporation (provider of product and services to the public security market) and Director, Annuity and Life Re (Holdings), Ltd. (reinsurance company); Director, President and Chief Executive Officer, Volvo Group North America, Inc.; Senior Vice President, AB Volvo; Director of various public and private corporations; Chairman, DHJ Media, Inc.; Director Magellan Insurance Company; and Director, The Hertz Corporation, Genmar Corporation (boat manufacturer), National Media Corporation; Advisory Board of Rotary Power International (designer, manufacturer, and seller of rotary power engines); and Chairman, Cortland Trust, Inc. (registered investment company) | | 140 | | Board of Nature’s Sunshine Products, Inc. |
| | | | | | | | | |
| | | | | | | | | |
| | | | | | | | | |
Jack M. Fields — 1952
Trustee | | 1997 | | Chief Executive Officer, Twenty First Century Group, Inc. (government affairs company); and Owner and Chief Executive Officer, Dos Angelos Ranch, L.P. (cattle, hunting, corporate entertainment), Discovery Global Education Fund (non-profit) and Cross Timbers Quail Research Ranch (non-profit)
Formerly: Chief Executive Officer, Texana Timber LP (sustainable forestry company) and member of the U.S. House of Representatives | | 140 | | Administaff |
| | | | | | | | | |
| | | | | | | | | |
| | | | | | | | | |
Carl Frischling — 1937
Trustee | | 1993 | | Partner, law firm of Kramer Levin Naftalis and Frankel LLP | | 140 | | Director, Reich & Tang Funds (16 portfolios) |
| | | | | | | | | |
| | | | | | | | | |
Invesco V.I. Capital Development Fund
Trustees and Officers—(continued)
The address of each trustee and officer is AIM Variable Insurance Funds (Invesco Variable Insurance Funds) (the “Trust”), 11 Greenway Plaza, Suite 2500, Houston, Texas 77046-1173. The trustees serve for the life of the Trust, subject to their earlier death, incapacitation, resignation, retirement or removal as more specifically provided in the Trust’s organizational documents. Each officer serves for a one year term or until their successors are elected and qualified. Column two below includes length of time served with predecessor entities, if any.
| | | | | | | | | |
| | | | | | | Number of Funds
| | |
Name, Year of Birth and
| | Trustee and/
| | Principal Occupation(s)
| | in Fund Complex
| | Other Directorship(s)
|
| Position(s) Held with the Trust | | or Officer Since | | During Past 5 Years | | Overseen by Trustee | | Held by Trustee |
Independent Trustees—(continued) | | | | | | |
| | | | | | | | | |
| | | | | | | | | |
| | | | | | | | | |
Prema Mathai-Davis — 1950
Trustee | | 1998 | | Retired
Formerly: Chief Executive Officer, YWCA of the U.S.A. | | 140 | | None |
| | | | | | | | | |
| | | | | | | | | |
| | | | | | | | | |
Larry Soll — 1942
Trustee | | 2004 | | Retired
Formerly, Chairman, Chief Executive Officer and President, Synergen Corp. (a biotechnology company) | | 140 | | None |
| | | | | | | | | |
| | | | | | | | | |
| | | | | | | | | |
Hugo F. Sonnenschein — 1940
Trustee | | 2010 | | President Emeritus and Honorary Trustee of the University of Chicago and the Adam Smith Distinguished Service Professor in the Department of Economics at the University of Chicago. Prior to July 2000, President of the University of Chicago. | | 158 | | Trustee of the University of Rochester and a member of its investment committee. Member of the National Academy of Sciences, the American Philosophical Society and a fellow of the American Academy of Arts and Sciences |
| | | | | | | | | |
| | | | | | | | | |
| | | | | | | | | |
| Raymond Stickel, Jr. — 1944 Trustee | | 2005 | | Retired
Formerly: Director, Mainstay VP Series Funds, Inc. (25 portfolios) and Partner, Deloitte & Touche | | 140 | | None |
| | | | | | | | | |
| | | | | | | | | |
| | | | | | | | | |
| Other Officers | | | | | | | | |
| | | | | | | | | |
| | | | | | | | | |
| | | | | | | | | |
Russell C. Burk — 1958
Senior Vice President and Senior Officer | | 2005 | | Senior Vice President and Senior Officer, The Invesco Funds | | N/A | | N/A |
| | | | | | | | | |
| | | | | | | | | |
| | | | | | | | | |
John M. Zerr — 1962
Senior Vice President, Chief Legal Officer and Secretary | | 2006 | | Director, Senior Vice President, Secretary and General Counsel, Invesco Management Group, Inc. (formerly known as Invesco Aim Management Group, Inc.) and Van Kampen Exchange Corp.; Senior Vice President, Invesco Advisers, Inc. (formerly known as Invesco Institutional (N.A.), Inc.) (registered investment adviser); Senior Vice President and Secretary, Invesco Distributors, Inc. (formerly known as Invesco Aim Distributors, Inc.); Director, Vice President and Secretary, Invesco Investment Services, Inc. (formerly known as Invesco Aim Investment Services, Inc.) and IVZ Distributors, Inc. (formerly known as INVESCO Distributors, Inc.); Director and Vice President, INVESCO Funds Group, Inc.; Senior Vice President, Chief Legal Officer and Secretary, The Invesco Funds; Manager, Invesco PowerShares Capital Management LLC; Director, Secretary and General Counsel, Invesco Investment Advisers LLC (formerly known as Van Kampen Asset Management); Secretary and General Counsel, Van Kampen Funds Inc. and Chief Legal Officer, PowerShares Exchange-Traded Fund Trust, PowerShares Exchange-Traded Fund Trust II, PowerShares India Exchange-Traded Fund Trust and PowerShares Actively Managed Exchange-Traded Fund Trust
Formerly: Director and Secretary, Van Kampen Advisors Inc.; Director Vice President, Secretary and General Counsel Van Kampen Investor Services Inc.; Director, Invesco Distributors, Inc. (formerly known as Invesco Aim Distributors, Inc.); Director, Senior Vice President, General Counsel and Secretary, Invesco Advisers, Inc.; and Van Kampen Investments Inc.; Director, Vice President and Secretary, Fund Management Company; Director, Senior Vice President, Secretary, General Counsel and Vice President, Invesco Aim Capital Management, Inc.; Chief Operating Officer and General Counsel, Liberty Ridge Capital, Inc. (an investment adviser); Vice President and Secretary, PBHG Funds (an investment company) and PBHG Insurance Series Fund (an investment company); Chief Operating Officer, General Counsel and Secretary, Old Mutual Investment Partners (a broker-dealer); General Counsel and Secretary, Old Mutual Fund Services (an administrator) and Old Mutual Shareholder Services (a shareholder servicing center); Executive Vice President, General Counsel and Secretary, Old Mutual Capital, Inc. (an investment adviser); and Vice President and Secretary, Old Mutual Advisors Funds (an investment company) | | N/A | | N/A |
| | | | | | | | | |
| | | | | | | | | |
| | | | | | | | | |
Lisa O. Brinkley — 1959
Vice President | | 2004 | | Global Compliance Director, Invesco Ltd.; Chief Compliance Officer, Invesco Investment Services, Inc.(formerly known as Invesco Aim Investment Services, Inc.); and Vice President, The Invesco Funds
Formerly: Chief Compliance Officer, Invesco Distributors, Inc. (formerly known as Invesco Aim Distributors, Inc.) and Van Kampen Investor Services Inc.; Senior Vice President, Invesco Management Group, Inc.; Senior Vice President and Chief Compliance Officer, Invesco Advisers, Inc. and The Invesco Funds; Vice President and Chief Compliance Officer, Invesco Aim Capital Management, Inc. and Invesco Distributors, Inc.; Vice President, Invesco Investment Services, Inc. and Fund Management Company | | N/A | | N/A |
| | | | | | | | | |
Invesco V.I. Capital Development Fund
Trustees and Officers—(continued)
The address of each trustee and officer is AIM Variable Insurance Funds (Invesco Variable Insurance Funds) (the “Trust”), 11 Greenway Plaza, Suite 2500, Houston, Texas 77046-1173. The trustees serve for the life of the Trust, subject to their earlier death, incapacitation, resignation, retirement or removal as more specifically provided in the Trust’s organizational documents. Each officer serves for a one year term or until their successors are elected and qualified. Column two below includes length of time served with predecessor entities, if any.
| | | | | | | | | |
| | | | | | | Number of Funds
| | |
Name, Year of Birth and
| | Trustee and/
| | Principal Occupation(s)
| | in Fund Complex
| | Other Directorship(s)
|
| Position(s) Held with the Trust | | or Officer Since | | During Past 5 Years | | Overseen by Trustee | | Held by Trustee |
Other Officers—(continued) | | | | | | |
| | | | | | | | | |
| | | | | | | | | |
| | | | | | | | | |
Sheri Morris — 1964
Vice President, Treasurer and Principal Financial Officer | | 1999 | | Vice President, Treasurer and Principal Financial Officer, The Invesco Funds; Vice President, Invesco Advisers, Inc. (formerly known as Invesco Institutional (N.A.), Inc.) (registered investment adviser).
Formerly: Treasurer, PowerShares Exchange-Traded Fund Trust, PowerShares Exchange-Traded Fund Trust II, PowerShares India Exchange-Traded Fund Trust and PowerShares Actively Managed Exchange-Traded Fund Trust, Vice President, Invesco Advisers, Inc., Invesco Aim Capital Management, Inc. and Invesco Aim Private Asset Management, Inc.; Assistant Vice President and Assistant Treasurer, The Invesco Funds and Assistant Vice President, Invesco Advisers, Inc., Invesco Aim Capital Management, Inc. and Invesco Aim Private Asset Management, Inc. | | N/A | | N/A |
| | | | | | | | | |
| | | | | | | | | |
| | | | | | | | | |
Karen Dunn Kelley — 1960
Vice President | | 1993 | | Head of Invesco’s World Wide Fixed Income and Cash Management Group; Senior Vice President, Invesco Management Group, Inc. (formerly known as Invesco Aim Management Group, Inc.) and Invesco Advisers, Inc. (formerly known as Invesco Institutional (N.A.), Inc.) (registered investment adviser); Executive Vice President, Invesco Distributors, Inc. (formerly known as Invesco Aim Distributors, Inc.); Director, Invesco Mortgage Capital Inc.; Vice President, The Invesco Funds (other than AIM Treasurer’s Series Trust (Invesco Treasurer’s Series Trust) and Short-Term Investments Trust); and President and Principal Executive Officer, The Invesco Funds (AIM Treasurer’s Series Trust (Invesco Treasurer’s Series Trust) and Short-Term Investments Trust only).
Formerly: Senior Vice President, Van Kampen Investments Inc.; Vice President, Invesco Advisers, Inc. (formerly known as Invesco Institutional (N.A.), Inc.); Director of Cash Management and Senior Vice President, Invesco Advisers, Inc. and Invesco Aim Capital Management, Inc.; President and Principal Executive Officer, Tax-Free Investments Trust; Director and President, Fund Management Company; Chief Cash Management Officer, Director of Cash Management, Senior Vice President, and Managing Director, Invesco Aim Capital Management, Inc.; Director of Cash Management, Senior Vice President, and Vice President, Invesco Advisers, Inc. and The Invesco Funds (AIM Treasurer’s Series Trust (Invesco Treasurer’s Series Trust), Short-Term Investments Trust and Tax-Free Investments Trust only) | | N/A | | N/A |
| | | | | | | | | |
| | | | | | | | | |
| | | | | | | | | |
Yinka Akinsola — 1977
Anti-Money Laundering Compliance Officer | | 2011 | | Anti-Money Laundering Compliance Officer, Invesco Advisers, Inc. (formerly known as Invesco Institutional (N.A.), Inc.) (registered investment adviser); Invesco Distributors, Inc. (formerly known as Invesco Aim Distributors, Inc.), Invesco Investment Services, Inc. (formerly known as Invesco Aim Investment Services, Inc.), Invesco Management Group, Inc., The Invesco Funds, Invesco Van Kampen Closed-End Funds, Van Kampen Exchange Corp. and Van Kampen Funds Inc. | | N/A | | N/A |
| | | | | | | | | |
| | | | | | | | | |
| | | | | | | | | |
Todd L. Spillane — 1958
Chief Compliance Officer | | 2006 | | Senior Vice President, Invesco Management Group, Inc. (formerly known as Invesco Aim Management Group, Inc.) and Van Kampen Exchange Corp.; Senior Vice President and Chief Compliance Officer, Invesco Advisers, Inc. (registered investment adviser) (formerly known as Invesco Institutional (N.A.), Inc.); Chief Compliance Officer, The Invesco Funds, INVESCO Private Capital Investments, Inc. (holding company) and Invesco Private Capital, Inc. (registered investment adviser); Vice President, Invesco Distributors, Inc. (formerly known as Invesco Aim Distributors, Inc.) and Invesco Investment Services, Inc. (formerly known as Invesco Aim Investment Services, Inc.).
Formerly: Chief Compliance Officer, Invesco Van Kampen Closed-End Funds PowerShares Exchange-Traded Fund Trust, PowerShares Exchange-Traded Fund Trust II, PowerShares India Exchange-Traded Fund Trust, and PowerShares Actively Managed Exchange-Traded Fund Trust; Senior Vice President, Van Kampen Investments Inc.; Senior Vice President and Chief Compliance Officer, Invesco Advisers, Inc. and Invesco Aim Capital Management, Inc.; Chief Compliance Officer, Invesco Global Asset Management (N.A.), Inc., Invesco Senior Secured Management, Inc. (registered investment adviser) and Van Kampen Investor Services Inc.; Vice President, Invesco Aim Capital Management, Inc. and Fund Management Company | | N/A | | N/A |
| | | | | | | | | |
The Statement of Additional Information of the Trust includes additional information about the Fund’s Trustees and is available upon request, without charge, by calling 1.800.959.4246. Please refer to the Fund’s prospectus for information on the Fund’s sub-advisers.
| | | | | | | |
Office of the Fund
11 Greenway Plaza, Suite 2500
Houston, TX 77046-1173 | | Investment Adviser
Invesco Advisers, Inc.
1555 Peachtree Street, N.E.
Atlanta, GA 30309 | | Distributor
Invesco Distributors, Inc.
11 Greenway Plaza, Suite 2500
Houston, TX 77046-1173 | | Auditors
PricewaterhouseCoopers LLP
1201 Louisiana Street, Suite 2900
Houston, TX 77002-5678 |
| | | | | | | |
| | | | | | | |
Counsel to the Fund
Stradley Ronon Stevens & Young, LLP
2600 One Commerce Square
Philadelphia, PA 19103 | | Counsel to the Independent Trustees
Kramer, Levin, Naftalis & Frankel LLP
1177 Avenue of the Americas
New York, NY 10036-2714 | | Transfer Agent
Invesco Investment Services, Inc.
11 Greenway Plaza, Suite 2500
Houston, TX77046-1173 | | Custodian
State Street Bank and Trust Company
225 Franklin
Boston, MA 02110-2801 |
Invesco V.I. Capital Development Fund
Invesco V.I. Core Equity FundAnnual Report to Shareholders § December 31, 2011The Fund provides a complete list of its holdings four times in each fiscal year, at the quarter-ends. For the second and fourth quarters, the lists appear in the Fund’s semiannual and annual reports to shareholders. For the first and third quarters, the Fund files the lists with the Securities and Exchange Commission (SEC) on Form N-Q. The Fund’s Form N-Q filings are available on the SEC website, sec.gov. Copies of the Fund’s Forms N-Q may be reviewed and copied at the SEC Public Reference Room in Washington, D.C. You can obtain information on the operation of the Public Reference Room, including information about duplicating fee charges, by calling 202 551 8090 or 800 732 0330, or by electronic request at the following email address: publicinfo@sec.gov. The SEC file numbers for the Fund are 811-07452 and 033-57340. The Fund’s most recent portfolio holdings, as filed on Form N-Q, have also been made available to insurance companies issuing variable annuity contracts and variable life insurance policies (“variable products”) that invest in the Fund.
A description of the policies and procedures that the Fund uses to determine how to vote proxies relating to portfolio securities is available without charge, upon request, from our Client Services department at 800 959 4246 or at invesco.com/proxyguidelines. The information is also available on the SEC website, sec.gov.
Information regarding how the Fund voted proxies related to its portfolio securities during the 12 months ended June 30, 2011, is available at invesco.com/proxysearch. The information is also available on the SEC website, sec.gov.
Invesco Advisers, Inc. is an investment adviser; it provides investment advisory services to individual and institutional clients and does not sell securities. Invesco Distributors, Inc. is the U.S. distributor for Invesco Ltd.’s retail mutual funds, exchange-traded funds and institutional money market funds. Both are wholly owned, indirect subsidiaries of Invesco Ltd.
This report must be accompanied or preceded by a currently effective Fund prospectus and variable product prospectus, which contain more complete information, including sales charges and expenses. Investors should read each carefully before investing.
Invesco Distributors, Inc.
VICEQ-AR-1
| | | | | |
| |
| NOT FDIC INSURED | | MAY LOSE VALUE | | NO BANK GUARANTEE |
Management’s Discussion of Fund Performance
Performance summary
Invesco V.I. Core Equity Fund delivered a slightly negative return for the fiscal year ended December 31, 2011, and trailed the broad market, as measured by the S&P 500 Index, as well as its style-specific benchmark, the Russell 1000 Index. Top contributors to the Fund’s returns were holdings in the consumer staples and information technology (IT) sectors, while energy was the largest detractor. Additionally, our comparative results versus the Russell 1000 Index were adversely affected by investments in the health care sector, while stock selection in the financials sector helped performance.
Your Fund’s long-term performance appears later in this report.
Fund vs. Indexes
Total returns, 12/31/10 to 12/31/11, excluding variable product issuer charges.
If variable product issuer charges were included, returns would be lower.
| | | | | |
|
| Series I Shares | | | -0.06 | % |
| |
| Series II Shares | | | -0.29 | |
| |
S&P 500 Index▼(Broad Market Index) | | | 2.09 | |
| |
Russell 1000 Index▼(Style-Specific Index) | | | 1.50 | |
| |
Lipper VUF Large-Cap Core Funds Index▼(Peer Group Index) | | | -2.10 | |
| |
Source(s): ▼ Lipper Inc.
How we invest
We manage your Fund with the objective of achieving long-run realized investor returns exceeding those of the passive benchmarks across a full market cycle, which we define as market trough to market trough, or peak-to-peak. As fund managers, we believe investors need a reason to stick with the Fund for long periods of time in order to realize these returns, and believe the best way we can encourage this behavior is by delivering a smoother (less volatile) investor experience – especially in turbulent, down-trending markets. The portfolio we construct is intended to provide attractive participation during positive-trending equity markets, but with a greater emphasis on downside protection during more turbulent, down-trending markets. We position the Fund to act as a “conservative cornerstone” – a stable foundational component within a well-diversified portfolio of assets.
The Fund’s portfolio is composed of what we call core stocks. A core stock
encompasses elements of growth (revenues, profits, economic value) and value (both absolute and comparative measures). Along this growth-value continuum, we seek to identify and invest in areas of temporary disconnection between market perception and the view our research uncovers.
To build a portfolio of core stocks, we conduct thorough fundamental research of businesses to gain a deeper understanding of companies’ prospects, growth potential and return on invested capital (ROIC) characteristics. The analytical process we use to identify potential investments comprises three phases: financial, business and valuation.
Financial analysis provides insights into ROIC (a key indicator of business quality) and historical capital allocation (a key indicator of management quality). Business analysis evaluates the competitive landscape and any structural or cyclical business opportunities or threats and allows us to identify key revenue, profit
and return drivers of the company. Both financial and business analyses serve as a basis to construct valuation models that help us assess a company’s intrinsic worth. Finally, our valuation analysis employs three primary techniques, including discounted cash flow, traditional valuation multiples and net asset value.
We consider selling a stock when it exceeds our target price, we have not seen a demonstrable improvement in fundamentals, or a more compelling investment opportunity exists.
Market conditions and your Fund
The fiscal year began with equity markets fueled on the second round of “quantitative easing” by the U.S. Federal Reserve, and markets rose through the first quarter of 2011. Thereafter, volatility drastically increased due to civil unrest in Egypt and Libya, and the devastating earthquake and tsunami in Japan. Corporate earnings were largely positive, but often overshadowed by investor concerns about continuing high unemployment, lack of consumer spending and soft housing data. At the same time, the sovereign debt crisis intensified in the eurozone region, and growth in developed economies decelerated, weighing on investor sentiment and prompting fears of a global recession. Despite occasional signs of sustained but muted growth, these macroeconomic factors continued to weigh on markets through the end of the reporting period.
In this environment, most major U.S. equity indexes delivered underwhelming results for the fiscal year. The Dow Jones Industrial Average and S&P 500 Index achieved single-digit gains, but the NASDAQ was negative for the period. These somewhat tepid results masked a great deal of volatility in 2011. We were active managers throughout the year, taking profits into the market’s strength
Portfolio Composition
By sector
| | | | | |
|
| Information Technology | | | 18.8 | % |
| |
| Financials | | | 14.4 | |
| |
| Health Care | | | 12.6 | |
| |
| Energy | | | 12.2 | |
| |
| Industrials | | | 11.3 | |
| |
| Consumer Discretionary | | | 6.0 | |
| |
| Consumer Staples | | | 4.8 | |
| |
| Materials | | | 3.4 | |
| |
| Utilities | | | 2.4 | |
| |
| Telecommunication Services | | | 1.8 | |
| |
Money Market Funds Plus | | | | |
Other Assets Less Liabilities | | | 12.3 | |
Top 10 Equity Holdings*
| | | | | | | | | |
|
| | 1. | | | Progressive Corp. (The) | | | 3.3 | % |
| |
| | 2. | | | Cisco Systems, Inc. | | | 3.1 | |
| |
| | 3. | | | Kroger Co. (The) | | | 2.9 | |
| |
| | 4. | | | Microsoft Corp. | | | 2.9 | |
| |
| | 5. | | | American Express Co. | | | 2.6 | |
| |
| | 6. | | | Symantec Corp. | | | 2.6 | |
| |
| | 7. | | | Berkshire Hathaway Inc.- Class A | | | 2.6 | |
| |
| | 8. | | | Macy’s, Inc. | | | 2.5 | |
| |
| | 9. | | | General Electric Co. | | | 2.3 | |
| |
| | 10. | | | QUALCOMM, Inc. | | | 2.2 | |
| | | | | |
|
| Total Net Assets | | $1.1 billion |
| | | | | |
| Total Number of Holdings* | | | | 74 |
The Fund’s holdings are subject to change, and there is no assurance that the Fund will continue to hold any particular security.
*Excluding money market fund holdings.
Invesco V.I. Core Equity Fund
in the first half and using weakness in the third quarter to invest in attractively valued core stocks.
A strong holding in which we eliminated our position during the reporting period was Motorola Mobility, the largest contributor to Fund performance for the year. The company is a spin-off of parent company Motorola Solutions (formerly Motorola), focused primarily on the handset, home DVR and cable equipment businesses. In August, Google (not a Fund holding) announced plans to acquire Motorola Mobility at a premium for $12.5 billion in cash or $40 per share.
Another strong contributor to Fund performance was Macy’s. The department store operator undertook numerous restructuring initiatives in recent years, including consolidating key back-office functions, such as buying, design and supply chain management, into a national structure. These efforts, along with better inventory management, have begun to improve the company’s business performance and margins. Macy’s earnings beat expectations in recent months as fundamentals continued to improve across the board, including strong sales growth, particularly from their online division, and a very strong 2011 holiday sales season. Based on its improving earnings outlook, the company doubled its quarterly dividend to 10 cents per share earlier in the year. These improvements are largely in line with our original expectations for the company.
Oil services firm Weatherford International was a new investment in 2011, and was the largest detractor from Fund performance. The company faced a number of headline issues early in the year that negatively affected the stock’s price, including a restatement of its financial results due to improper income tax reporting. We invested in March as the company’s valuation reflected an attractive level; however, the company, along with peer firms, faced additional pressures through the summer due to fears of a global economic downturn and its potential effect on energy demand. Our view is that Weatherford International’s valuation reached a point where investors are now being appropriately compensated for the aforementioned issues. Overall, we believe the company has room to improve its margins and that oil equipment and service firms will continue to benefit from increased oilfield capital spending and the increased need for more sophisticated extraction technologies.
Legg Mason also detracted from results during the reporting period. The asset management firm has been under pressure since the height of the financial crisis, as fear about its subprime-related exposures in its money market division caused a significant drop in the company’s shares. Since then, Legg Mason’s total assets under management have declined as a result of steady fixed income outflows, and shares have not recovered meaningfully. However, the company has embarked on a restructuring program aimed at reducing costs, and in our view, Legg Mason’s valuation has reached a point where its diversified asset mix, solid competitive positioning, and strong brands are underappreciated by the market.
Over the fiscal year, our cash weighting fluctuated as market choppiness allowed us to buy on weakness and sell into strength. Markets rallied in the first half of the reporting period, providing us an opportunity to take profits. However, as market volatility increased over the summer, we used the opportunity to purchase shares in quality companies leveraged to areas of economic growth globally. During the fiscal year we increased our exposure to the consumer discretionary, energy, IT and materials sectors, and reduced our exposure to the consumer staples, industrials and health care sectors. As a result of our buys and sells, our cash position increased slightly as compared to the prior fiscal year end, and it stood at approximately 12% at the end of the reporting period.
Maintaining a conservative approach is an enduring part of our investment strategy. Amid the market’s volatility, we sought judicious long-term investments for the portfolio. At the end of the fiscal year, the Fund was positioned with more or less of a “barbell” approach, balancing our more pro-cyclical holdings in the energy and IT sectors with our health care holdings, which are typically more defensive in nature.
Regardless of market conditions, our goal for Invesco V.I. Core Equity Fund remains the same: to serve as a conservative cornerstone for your investment portfolio. We seek to provide attractive upside participation with strong potential downside protection, so that over a full market cycle the Fund delivers solid investment results with the potential for reduced risk and a smoother investor experience. As always, we would like to thank you for your continued investment in Invesco V.I. Core Equity Fund.
Ronald Sloan
Chartered Financial Analyst, portfolio manager, is lead manager of Invesco V.I. Core Equity Fund. Mr. Sloan has worked in the investment industry since 1971 and joined Invesco in 1998. Mr. Sloan attended the University of Missouri, where he earned both a B.S. in business administration and an M.B.A.
Tyler Dann II
Chartered Financial Analyst, portfolio manager, is manager of Invesco V.I. Core Equity Fund. Mr. Dann joined Invesco in 2004. He serves on the board of directors of the National Association of Petroleum Investment Analysts and is a member of the CFA Society of San Francisco. He earned a B.A. from Princeton University.
Brian Nelson
Chartered Financial Analyst, portfolio manager, is manager of Invesco V.I. Core Equity Fund. He began his investment career in 1988 and joined Invesco in 2004. He earned a B.A. from the University of California Santa Barbara and is a member of the CFA Society of San Francisco.
The views and opinions expressed in management’s discussion of Fund performance are those of Invesco Advisers, Inc. These views and opinions are subject to change at any time based on factors such as market and economic conditions. These views and opinions may not be relied upon as investment advice or recommendations, or as an offer for a particular security. The information is not a complete analysis of every aspect of any market, country, industry, security or the Fund. Statements of fact are from sources considered reliable, but Invesco Advisers, Inc. makes no representation or warranty as to their completeness or accuracy. Although historical performance is no guarantee of future results, these insights may help you understand our investment management philosophy.
See important Fund and, if applicable, index disclosures later in this report.
Invesco V.I. Core Equity Fund
Your Fund’s Long-Term Performance
Results of a $10,000 Investment – Oldest Share Class(es)
Fund and index data from 12/31/01*
| | | |
| 1 | | Source: Lipper Inc. |
| |
| * | | During the reporting period, Invesco changed its policy regarding growth of $10,000 charts. For funds older than 10 years, we previously showed performance since inception. Going forward, we will show performance for the most recent 10 years, since this more accurately reflects the experience of the typical shareholder. As a result, charts now may include benchmarks that did not appear previously, because the funds’ inception pre-dated the benchmarks’ inception. Also, all charts will now be presented using a linear format. |
Past performance cannot guarantee comparable future results.
Average Annual Total Returns
As of 12/31/11
| | | | | |
|
Series I Shares | | | | |
| |
| Inception (5/2/94) | | | 7.18 | % |
| |
| 10 Years | | | 4.09 | |
| |
| 5 Years | | | 1.19 | |
| |
| 1 Year | | | -0.06 | |
| |
| | | | | |
Series II Shares | | | | |
| |
| Inception (10/24/01) | | | 4.40 | % |
| |
| 10 Years | | | 3.83 | |
| |
| 5 Years | | | 0.94 | |
| |
| 1 Year | | | -0.29 | |
The performance of the Fund’s Series I and Series II share classes will differ primarily due to different class expenses.
The performance data quoted represent past performance and cannot guarantee comparable future results; current performance may be lower or higher. Please contact your variable product issuer or financial adviser for
the most recent month-end variable product performance. Performance figures reflect Fund expenses, reinvested distributions and changes in net asset value. Investment return and principal value will fluctuate so that you may have a gain or loss when you sell shares.
The total annual Fund operating expense ratio set forth in the most recent Fund prospectus as of the date of this report for Series I and Series II shares was 0.89% and 1.14%, respectively. The expense ratios presented above may vary from the expense ratios presented in other sections of this report that are based on expenses incurred during the period covered by this report.
Invesco V.I. Core Equity Fund, a series portfolio of AIM Variable Insurance Funds (Invesco Variable Insurance Funds), is currently offered through insurance companies issuing
variable products. You cannot purchase shares of the Fund directly. Performance figures given represent the Fund and are not intended to reflect actual variable product values. They do not reflect sales charges, expenses and fees assessed in connection with a variable product. Sales charges, expenses and fees, which are determined by the variable product issuers, will vary and will lower the total return.
The most recent month-end performance data at the Fund level, excluding variable product charges, is available at 800 451 4246. As mentioned above, for the most recent month-end performance including variable product charges, please contact your variable product issuer or financial adviser.
Invesco V.I. Core Equity Fund
Invesco V.I. Core Equity Fund’s investment objective is long-term growth of capital.
| n | | Unless otherwise stated, information presented in this report is as of December 31, 2011, and is based on total net assets. |
| |
| n | | Unless otherwise noted, all data provided by Invesco. |
| |
| n | | To access your Fund’s reports/prospectus, visit invesco.com/fundreports. |
Principal risks of investing in the Fund
Cash/cash equivalents risk. Holding cash or cash equivalents may negatively affect performance.
Foreign securities risk. The Fund’s foreign investments may be affected by changes in a foreign country’s exchange rates; political and social instability; changes in economic or taxation policies; difficulties when enforcing obligations; decreased liquidity; and increased volatility. Foreign companies may be subject to less regulation resulting in less publicly available information about the companies.
Management risk. The investment techniques and risk analysis used by the Fund’s portfolio managers may not produce the desired results.
Market risk. The prices of and the income generated by the Fund’s securities may decline in response to, among other things, investor sentiment; general economic and market conditions; regional or global instability; and currency and interest rate fluctuations.
About indexes used in this report
The S&P 500® Index is an unmanaged index considered representative of the U.S. stock market.
The Russell 1000® Index is an unmanaged index considered representative of large-cap stocks. The Russell 1000 Index is a trademark/service mark of the Frank Russell Co. Russell® is a trademark of the Frank Russell Co.
The Lipper VUF Large-Cap Core Funds Index is an unmanaged index considered representative of large-cap core variable insurance underlying funds tracked by Lipper.
The Dow Jones Industrial Average is a price-weighted index of the 30 largest, most widely held stocks traded on the New York Stock Exchange.
The NASDAQ Composite Index (price-only) is a broad-based capitalization-weighted index of all NASDAQ National Market and Small Cap stocks.
The Fund is not managed to track the performance of any particular index, including the indexes defined here, and consequently, the performance of the Fund may deviate significantly from the performance of the indexes.
A direct investment cannot be made in an index. Unless otherwise indicated, index results include reinvested dividends, and they do not reflect sales charges. Performance of the peer group, if applicable, reflects fund expenses; performance of a market index does not.
Other information
The Chartered Financial Analyst® (CFA®) designation is globally recognized and attests to a charterholder’s success in a rigorous and comprehensive study program in the field of investment management and research analysis.
Industry classifications used in this report are generally according to the Global Industry Classification Standard, which was developed by and is the exclusive property and a service mark of MSCI Inc. and Standard & Poor’s.
The returns shown in management’s discussion of Fund performance are based on net asset values calculated for shareholder transactions. Generally accepted accounting principles require adjustments to be made to the net assets of the Fund at period end for financial reporting purposes, and as such, the net asset values for shareholder transactions and the returns based on those net asset values may differ from the net asset values and returns reported in the Financial Highlights. Additionally, the returns and net asset values shown throughout this report are at the Fund level only and do not include variable product issuer charges. If such charges were included, the total returns would be lower.
Invesco V.I. Core Equity Fund
Schedule of Investments(a)
December 31, 2011
| | | | | | | | | |
| | | Shares | | Value |
| |
Common Stocks & Other Equity Interests–87.67%
| | | | |
Aerospace & Defense–0.27%
| | | | |
| Xylem, Inc. | | | 121,304 | | | $ | 3,116,300 | |
| |
Air Freight & Logistics–0.91%
| | | | |
| United Parcel Service, Inc.–Class B | | | 142,078 | | | | 10,398,689 | |
| |
Application Software–1.73%
| | | | |
Adobe Systems Inc.(b) | | | 699,717 | | | | 19,781,000 | |
| |
Asset Management & Custody Banks–2.77%
| | | | |
| Legg Mason, Inc. | | | 557,649 | | | | 13,411,458 | |
| |
| Northern Trust Corp. | | | 460,721 | | | | 18,272,195 | |
| |
| | | | | | | | 31,683,653 | |
| |
Auto Parts & Equipment–0.26%
| | | | |
| Johnson Controls, Inc. | | | 93,776 | | | | 2,931,438 | |
| |
Automobile Manufacturers–0.21%
| | | | |
General Motors Co.(b) | | | 117,629 | | | | 2,384,340 | |
| |
Biotechnology–1.41%
| | | | |
Gilead Sciences, Inc.(b) | | | 394,153 | | | | 16,132,682 | |
| |
Communications Equipment–5.92%
| | | | |
| Cisco Systems, Inc. | | | 1,929,267 | | | | 34,881,147 | |
| |
| QUALCOMM, Inc. | | | 457,547 | | | | 25,027,821 | |
| |
| Telefonaktiebolaget LM Ericsson–ADR (Sweden) | | | 755,907 | | | | 7,657,338 | |
| |
| | | | | | | | 67,566,306 | |
| |
Computer & Electronics Retail–0.72%
| | | | |
| Best Buy Co., Inc. | | | 349,750 | | | | 8,173,657 | |
| |
Computer Hardware–0.34%
| | | | |
| Hewlett-Packard Co. | | | 152,497 | | | | 3,928,323 | |
| |
Construction Materials–0.93%
| | | | |
| CRH PLC (Ireland) | | | 535,485 | | | | 10,645,682 | |
| |
Consumer Finance–2.62%
| | | | |
| American Express Co. | | | 633,849 | | | | 29,898,657 | |
| |
Department Stores–2.46%
| | | | |
| Macy’s, Inc. | | | 874,591 | | | | 28,144,338 | |
| |
Diversified Banks–1.50%
| | | | |
| U.S. Bancorp | | | 631,543 | | | | 17,083,238 | |
| |
Drug Retail–0.88%
| | | | |
| CVS Caremark Corp. | | | 247,203 | | | | 10,080,938 | |
| |
Electric Utilities–2.38%
| | | | |
| Edison International | | | 207,747 | | | | 8,600,726 | |
| |
| Exelon Corp. | | | 428,779 | | | | 18,596,145 | |
| |
| | | | | | | | 27,196,871 | |
| |
Electrical Components & Equipment–0.75%
| | | | |
| Emerson Electric Co. | | | 182,689 | | | | 8,511,481 | |
| |
Electronic Manufacturing Services–1.42%
| | | | |
| TE Connectivity Ltd. | | | 527,911 | | | | 16,264,938 | |
| |
Environmental & Facilities Services–1.30%
| | | | |
| Waste Management, Inc. | | | 455,011 | | | | 14,883,410 | |
| |
Food Retail–2.93%
| | | | |
| Kroger Co. (The) | | | 1,382,634 | | | | 33,487,395 | |
| |
Gold–0.93%
| | | | |
| Agnico-Eagle Mines Ltd. (Canada) | | | 165,000 | | | | 5,992,800 | |
| |
| Newcrest Mining Ltd. (Australia) | | | 150,843 | | | | 4,566,754 | |
| |
| | | | | | | | 10,559,554 | |
| |
Health Care Equipment–2.05%
| | | | |
| Baxter International Inc. | | | 149,682 | | | | 7,406,265 | |
| |
| Covidien PLC (Ireland) | | | 219,399 | | | | 9,875,149 | |
| |
| Medtronic, Inc. | | | 161,023 | | | | 6,159,130 | |
| |
| | | | | | | | 23,440,544 | |
| |
Heavy Electrical Equipment–1.98%
| | | | |
ABB Ltd. (Switzerland)(b) | | | 768,361 | | | | 14,464,036 | |
| |
ABB Ltd.–ADR (Switzerland)(b) | | | 434,314 | | | | 8,178,132 | |
| |
| | | | | | | | 22,642,168 | |
| |
Home Improvement Retail–1.36%
| | | | |
| Lowe’s Cos., Inc. | | | 611,287 | | | | 15,514,464 | |
| |
Hypermarkets & Super Centers–0.99%
| | | | |
| Wal-Mart Stores, Inc. | | | 188,953 | | | | 11,291,831 | |
| |
Industrial Conglomerates–3.79%
| | | | |
| 3M Co. | | | 97,970 | | | | 8,007,088 | |
| |
| General Electric Co. | | | 1,435,649 | | | | 25,712,473 | |
| |
| Koninklijke Philips Electronics N.V. (Netherlands) | | | 455,669 | | | | 9,549,157 | |
| |
| | | | | | | | 43,268,718 | |
| |
Industrial Gases–1.54%
| | | | |
| Air Products & Chemicals, Inc. | | | 206,853 | | | | 17,621,807 | |
| |
| | | | | | | | | |
| | | | | | | | | |
See accompanying Notes to Financial Statements which are an integral part of the financial statements.
Invesco V.I. Core Equity Fund
| | | | | | | | | |
| | | Shares | | Value |
| |
Industrial Machinery–1.31%
| | | | |
| Illinois Tool Works Inc. | | | 178,076 | | | $ | 8,317,930 | |
| |
| Ingersoll-Rand PLC (Ireland) | | | 216,220 | | | | 6,588,223 | |
| |
| | | | | | | | 14,906,153 | |
| |
Insurance Brokers–1.37%
| | | | |
| Marsh & McLennan Cos., Inc. | | | 493,879 | | | | 15,616,454 | |
| |
Integrated Oil & Gas–0.55%
| | | | |
| Hess Corp. | | | 109,902 | | | | 6,242,434 | |
| |
Investment Banking & Brokerage–0.36%
| | | | |
| Charles Schwab Corp. (The) | | | 361,353 | | | | 4,068,835 | |
| |
Life Sciences Tools & Services–1.92%
| | | | |
Agilent Technologies, Inc.(b) | | | 460,412 | | | | 16,082,191 | |
| |
Thermo Fisher Scientific, Inc.(b) | | | 130,605 | | | | 5,873,307 | |
| |
| | | | | | | | 21,955,498 | |
| |
Managed Health Care–1.24%
| | | | |
| WellPoint, Inc. | | | 214,517 | | | | 14,211,751 | |
| |
Movies & Entertainment–0.48%
| | | | |
| Walt Disney Co. (The) | | | 147,155 | | | | 5,518,313 | |
| |
Oil & Gas Drilling–0.50%
| | | | |
| Transocean Ltd. | | | 148,222 | | | | 5,690,243 | |
| |
Oil & Gas Equipment & Services–6.30%
| | | | |
| Baker Hughes Inc. | | | 393,341 | | | | 19,132,106 | |
| |
Cameron International Corp.(b) | | | 130,784 | | | | 6,433,265 | |
| |
| National Oilwell Varco Inc. | | | 123,090 | | | | 8,368,889 | |
| |
| Schlumberger Ltd. | | | 125,856 | | | | 8,597,224 | |
| |
| Tenaris S.A.–ADR (Argentina) | | | 251,807 | | | | 9,362,184 | |
| |
Weatherford International Ltd.(b) | | | 1,369,498 | | | | 20,049,451 | |
| |
| | | | | | | | 71,943,119 | |
| |
Oil & Gas Exploration & Production–4.35%
| | | | |
| Apache Corp. | | | 205,648 | | | | 18,627,596 | |
| |
| Devon Energy Corp. | | | 247,242 | | | | 15,329,004 | |
| |
Southwestern Energy Co.(b) | | | 361,819 | | | | 11,556,499 | |
| |
| Talisman Energy Inc. (Canada) | | | 325,000 | | | | 4,140,655 | |
| |
| | | | | | | | 49,653,754 | |
| |
Oil & Gas Refining & Marketing–0.46%
| | | | |
| Valero Energy Corp. | | | 250,786 | | | | 5,279,045 | |
| |
Pharmaceuticals–6.01%
| | | | |
| Merck & Co., Inc. | | | 136,301 | | | | 5,138,548 | |
| |
| Pfizer Inc. | | | 339,777 | | | | 7,352,774 | |
| |
| Roche Holding AG (Switzerland) | | | 140,272 | | | | 23,724,988 | |
| |
| Sanofi–ADR (France) | | | 208,811 | | | | 7,629,954 | |
| |
| Teva Pharmaceutical Industries Ltd.–ADR (Israel) | | | 615,328 | | | | 24,834,638 | |
| |
| | | | | | | | 68,680,902 | |
| |
Property & Casualty Insurance–5.84%
| | | | |
Berkshire Hathaway Inc.–Class A(b) | | | 254 | | | | 29,147,770 | |
| |
| Progressive Corp. (The) | | | 1,924,873 | | | | 37,554,272 | |
| |
| | | | | | | | 66,702,042 | |
| |
Railroads–1.01%
| | | | |
| Union Pacific Corp. | | | 109,064 | | | | 11,554,240 | |
| |
Semiconductors–2.99%
| | | | |
| Analog Devices, Inc. | | | 350,588 | | | | 12,544,039 | |
| |
| Intel Corp. | | | 268,283 | | | | 6,505,863 | |
| |
| Taiwan Semiconductor Manufacturing Co. Ltd. (Taiwan) | | | 6,047,823 | | | | 15,140,030 | |
| |
| | | | | | | | 34,189,932 | |
| |
Specialty Stores–0.48%
| | | | |
| Staples, Inc. | | | 394,128 | | | | 5,474,438 | |
| |
Systems Software–6.36%
| | | | |
| CA, Inc. | | | 477,138 | | | | 9,645,345 | |
| |
| Microsoft Corp. | | | 1,283,715 | | | | 33,325,241 | |
| |
Symantec Corp.(b) | | | 1,898,290 | | | | 29,708,239 | |
| |
| | | | | | | | 72,678,825 | |
| |
Wireless Telecommunication Services–1.79%
| | | | |
| Vodafone Group PLC (United Kingdom) | | | 7,359,060 | | | | 20,451,068 | |
| |
Total Common Stocks & Other Equity Interests
(Cost $911,257,858) | | | | | | | 1,001,449,468 | |
| |
Money Market Funds–12.27%
| | | | |
Liquid Assets Portfolio–Institutional Class(c) | | | 70,092,432 | | | | 70,092,432 | |
| |
Premier Portfolio–Institutional Class(c) | | | 70,092,432 | | | | 70,092,432 | |
| |
| Total Money Market Funds (Cost $140,184,864) | | | 140,184,864 | |
| |
| TOTAL INVESTMENTS–99.94% (Cost $1,051,442,722) | | | 1,141,634,332 | |
| |
| OTHER ASSETS LESS LIABILITIES–0.06% | | | | | | | 668,986 | |
| |
| NET ASSETS–100.00% | | | | | | $ | 1,142,303,318 | |
| |
Investment Abbreviations:
| | | |
| ADR | | – American Depositary Receipt |
Notes to Schedule of Investments:
| | |
| (a) | | Industry and/or sector classifications used in this report are generally according to the Global Industry Classification Standard, which was developed by and is the exclusive property and a service mark of MSCI Inc. and Standard & Poor’s. |
| (b) | | Non-income producing security. |
| (c) | | The money market fund and the Fund are affiliated by having the same investment adviser. |
See accompanying Notes to Financial Statements which are an integral part of the financial statements.
Invesco V.I. Core Equity Fund
Statement of Assets and Liabilities
December 31, 2011
| | | | | |
Assets:
|
| Investments, at value (Cost $911,257,858) | | $ | 1,001,449,468 | |
| |
| Investments in affiliated money market funds, at value and cost | | | 140,184,864 | |
| |
| Total investments, at value (Cost $1,051,442,722) | | | 1,141,634,332 | |
| |
| Foreign currencies, at value (Cost $540,096) | | | 516,655 | |
| |
| Receivable for: | | | | |
| Investments sold | | | 279,301 | |
| |
| Fund shares sold | | | 182,392 | |
| |
| Dividends | | | 2,477,350 | |
| |
| Investment for trustee deferred compensation and retirement plans | | | 138,320 | |
| |
| Other assets | | | 191 | |
| |
| Total assets | | | 1,145,228,541 | |
| |
Liabilities:
|
| Payable for: | | | | |
| Investments purchased | | | 972,124 | |
| |
| Fund shares reacquired | | | 763,730 | |
| |
| Accrued fees to affiliates | | | 714,651 | |
| |
| Accrued other operating expenses | | | 36,213 | |
| |
| Trustee deferred compensation and retirement plans | | | 438,505 | |
| |
| Total liabilities | | | 2,925,223 | |
| |
| Net assets applicable to shares outstanding | | $ | 1,142,303,318 | |
| |
| | | | | |
| | | | | |
Net assets consist of:
|
| Shares of beneficial interest | | $ | 1,187,727,534 | |
| |
| Undistributed net investment income | | | 10,643,071 | |
| |
| Undistributed net realized gain (loss) | | | (146,216,446 | ) |
| |
| Unrealized appreciation | | | 90,149,159 | |
| |
| | | $ | 1,142,303,318 | |
| |
| | | | | |
| | | | | |
Net Assets:
|
| Series I | | $ | 1,091,171,281 | |
| |
| Series II | | $ | 51,132,037 | |
| |
Shares outstanding, $0.001 par value per share, with an unlimited number of shares authorized:
|
| Series I | | | 40,832,619 | |
| |
| Series II | | | 1,928,519 | |
| |
| Series I: | | | | |
| Net asset value per share | | $ | 26.72 | |
| |
| Series II: | | | | |
| Net asset value per share | | $ | 26.51 | |
| |
Statement of Operations
For the year ended December 31, 2011
| | | | | |
Investment income:
|
| Dividends (net of foreign withholding taxes of $479,718) | | $ | 21,743,674 | |
| |
| Dividends from affiliated money market funds (includes securities lending income of $46,281) | | | 191,167 | |
| |
| Interest | | | 193,282 | |
| |
| Total investment income | | | 22,128,123 | |
| |
Expenses:
|
| Advisory fees | | | 7,791,172 | |
| |
| Administrative services fees | | | 3,331,528 | |
| |
| Custodian fees | | | 49,177 | |
| |
| Distribution fees — Series II | | | 96,299 | |
| |
| Transfer agent fees | | | 43,976 | |
| |
| Trustees’ and officers’ fees and benefits | | | 74,783 | |
| |
| Other | | | 60,718 | |
| |
| Total expenses | | | 11,447,653 | |
| |
| Less: Fees waived | | | (208,222 | ) |
| |
| Net expenses | | | 11,239,431 | |
| |
| Net investment income | | | 10,888,692 | |
| |
Realized and unrealized gain (loss) from:
|
| Net realized gain from: | | | | |
| Investment securities (includes net gains (losses) from securities sold to affiliates of $(1,439,884)) | | | 67,134,566 | |
| |
| Foreign currencies | | | 174,698 | |
| |
| Foreign currency contracts | | | 4,321,151 | |
| |
| Option contracts written | | | 51,915 | |
| |
| | | | 71,682,330 | |
| |
| Change in net unrealized appreciation (depreciation) of: | | | | |
| Investment securities | | | (72,998,261 | ) |
| |
| Foreign currencies | | | (100,992 | ) |
| |
| Foreign currency contracts | | | 50,646 | |
| |
| | | | (73,048,607 | ) |
| |
| Net realized and unrealized gain (loss) | | | (1,366,277 | ) |
| |
| Net increase in net assets resulting from operations | | $ | 9,522,415 | |
| |
See accompanying Notes to Financial Statements which are an integral part of the financial statements.
Invesco V.I. Core Equity Fund
Statement of Changes in Net Assets
For the years ended December 31, 2011 and 2010
| | | | | | | | | |
| | | 2011 | | 2010 |
| |
Operations:
| | | | |
| Net investment income | | $ | 10,888,692 | | | $ | 12,009,590 | |
| |
| Net realized gain | | | 71,682,330 | | | | 45,174,795 | |
| |
| Change in net unrealized appreciation (depreciation) | | | (73,048,607 | ) | | | 65,458,831 | |
| |
| Net increase in net assets resulting from operations | | | 9,522,415 | | | | 122,643,216 | |
| |
Distributions to shareholders from net investment income:
| | | | |
| Series I | | | (11,312,225 | ) | | | (12,902,647 | ) |
| |
| Series II | | | (326,851 | ) | | | (280,002 | ) |
| |
| Total distributions from net investment income | | | (11,639,076 | ) | | | (13,182,649 | ) |
| |
Share transactions–net:
| | | | |
| Series I | | | (252,642,206 | ) | | | (217,887,519 | ) |
| |
| Series II | | | 16,379,401 | | | | (1,987,933 | ) |
| |
| Net increase (decrease) in net assets resulting from share transactions | | | (236,262,805 | ) | | | (219,875,452 | ) |
| |
| Net increase (decrease) in net assets | | | (238,379,466 | ) | | | (110,414,885 | ) |
| |
Net assets:
| | | | |
| Beginning of year | | | 1,380,682,784 | | | | 1,491,097,669 | |
| |
| End of year (includes undistributed net investment income of $10,643,071 and $11,218,757, respectively) | | $ | 1,142,303,318 | | | $ | 1,380,682,784 | |
| |
Notes to Financial Statements
December 31, 2011
NOTE 1—Significant Accounting Policies
Invesco V.I. Core Equity Fund (the “Fund”) is a series portfolio of AIM Variable Insurance Funds (Invesco Variable Insurance Funds) (the “Trust”). The Trust is a Delaware statutory trust registered under the Investment Company Act of 1940, as amended (the “1940 Act”), as an open-end series management investment company consisting of twenty-eight separate portfolios, (each constituting a “Fund”). The assets, liabilities and operations of each portfolio are accounted for separately. Information presented in these financial statements pertains only to the Fund. Matters affecting each Fund or class will be voted on exclusively by the shareholders of such Fund or class. Current Securities and Exchange Commission (“SEC”) guidance, however, requires participating insurance companies offering separate accounts to vote shares proportionally in accordance with the instructions of the contract owners whose investments are funded by shares of each Fund or class.
The Fund’s investment objective is long-term growth of capital.
The Fund currently offers two classes of shares, Series I and Series II, both of which are offered to insurance company separate accounts funding variable annuity contracts and variable life insurance policies (“variable products”).
The following is a summary of the significant accounting policies followed by the Fund in the preparation of its financial statements.
| | |
| A. | | Security Valuations — Securities, including restricted securities, are valued according to the following policy. |
| | A security listed or traded on an exchange (except convertible bonds) is valued at its last sales price or official closing price as of the close of the customary trading session on the exchange where the security is principally traded, or lacking any sales or official closing price on a particular day, the security may be valued at the closing bid price on that day. Securities traded in the over-the-counter market are valued based on prices furnished by independent pricing services or market makers. When such securities are valued by an independent pricing service they may be considered fair valued. Futures contracts are valued at the final settlement price set by an exchange on which they are principally traded. Listed options are valued at the mean between the last bid and ask prices from the exchange on which they are principally traded. Options not listed on an exchange are valued by an independent source at the mean between the last bid and ask prices. For purposes of determining net asset value per share, futures and option contracts generally are valued 15 minutes after the close of the customary trading session of the New York Stock Exchange (“NYSE”). |
| | Investments in open-end and closed-end registered investment companies that do not trade on an exchange are valued at the end of day net asset value per share. Investments in open-end and closed-end registered investment companies that trade on an exchange are valued at the last sales price or official closing price as of the close of the customary trading session on the exchange where the security is principally traded. |
| | Debt obligations (including convertible bonds) and unlisted equities are fair valued using an evaluated quote provided by an independent pricing service. Evaluated quotes provided by the pricing service may be determined without exclusive reliance on quoted prices, and may reflect appropriate factors such as |
Invesco V.I. Core Equity Fund
| | |
| | institution-size trading in similar groups of securities, developments related to specific securities, dividend rate, yield, quality, type of issue, coupon rate, maturity, individual trading characteristics and other market data. Debt securities are subject to interest rate and credit risks. In addition, all debt securities involve some risk of default with respect to interest and/or principal payments. |
| | Foreign securities (including foreign exchange contracts) are converted into U.S. dollar amounts using the applicable exchange rates as of the close of the NYSE. If market quotations are available and reliable for foreign exchange traded equity securities, the securities will be valued at the market quotations. Because trading hours for certain foreign securities end before the close of the NYSE, closing market quotations may become unreliable. If between the time trading ends on a particular security and the close of the customary trading session on the NYSE, events occur that are significant and make the closing price unreliable, the Fund may fair value the security. If the event is likely to have affected the closing price of the security, the security will be valued at fair value in good faith using procedures approved by the Board of Trustees. Adjustments to closing prices to reflect fair value may also be based on a screening process of an independent pricing service to indicate the degree of certainty, based on historical data, that the closing price in the principal market where a foreign security trade is not the current value as of the close of the NYSE. Foreign securities meeting the approved degree of certainty that the price is not reflective of current value will be priced at the indication of fair value from the independent pricing service. Multiple factors may be considered by the independent pricing service in determining adjustments to reflect fair value and may include information relating to sector indices, American Depositary Receipts and domestic and foreign index futures. Foreign securities may have additional risks including exchange rate changes, potential for sharply devalued currencies and high inflation, political and economic upheaval, the relative lack of issuer information, relatively low market liquidity and the potential lack of strict financial and accounting controls and standards. |
| | Securities for which market prices are not provided by any of the above methods may be valued based upon quotes furnished by independent sources. The last bid price may be used to value equity securities. The mean between the last bid and asked prices is used to value debt obligations, including Corporate Loans. |
| | Securities for which market quotations are not readily available or are unreliable are valued at fair value as determined in good faith by or under the supervision of the Trust’s officers following procedures approved by the Board of Trustees. Issuer specific events, market trends, bid/ask quotes of brokers and information providers and other market data may be reviewed in the course of making a good faith determination of a security’s fair value. |
| | Valuations change in response to many factors including the historical and prospective earnings of the issuer, the value of the issuer’s assets, general economic conditions, interest rates, investor perceptions and market liquidity. Because of the inherent uncertainties of valuation, the values reflected in the financial statements may materially differ from the value received upon actual sale of those investments. |
| B. | | Securities Transactions and Investment Income — Securities transactions are accounted for on a trade date basis. Realized gains or losses on sales are computed on the basis of specific identification of the securities sold. Interest income is recorded on the accrual basis from settlement date. Dividend income (net of withholding tax, if any) is recorded on the ex-dividend date. |
| | The Fund may periodically participate in litigation related to Fund investments. As such, the Fund may receive proceeds from litigation settlements. Any proceeds received are included in the Statement of Operations as realized gain (loss) for investments no longer held and as unrealized gain (loss) for investments still held. |
| | Brokerage commissions and mark ups are considered transaction costs and are recorded as an increase to the cost basis of securities purchased and/or a reduction of proceeds on a sale of securities. Such transaction costs are included in the determination of net realized and unrealized gain (loss) from investment securities reported in the Statement of Operations and the Statement of Changes in Net Assets and the net realized and unrealized gains (losses) on securities per share in the Financial Highlights. Transaction costs are included in the calculation of the Fund’s net asset value and, accordingly, they reduce the Fund’s total returns. These transaction costs are not considered operating expenses and are not reflected in net investment income reported in the Statement of Operations and Statement of Changes in Net Assets, or the net investment income per share and ratios of expenses and net investment income reported in the Financial Highlights, nor are they limited by any expense limitation arrangements between the Fund and the investment adviser. |
| | The Fund allocates income and realized and unrealized capital gains and losses to a class based on the relative net assets of each class. |
| C. | | Country Determination — For the purposes of making investment selection decisions and presentation in the Schedule of Investments, the investment adviser may determine the country in which an issuer is located and/or credit risk exposure based on various factors. These factors include the laws of the country under which the issuer is organized, where the issuer maintains a principal office, the country in which the issuer derives 50% or more of its total revenues and the country that has the primary market for the issuer’s securities, as well as other criteria. Among the other criteria that may be evaluated for making this determination are the country in which the issuer maintains 50% or more of its assets, the type of security, financial guarantees and enhancements, the nature of the collateral and the sponsor organization. Country of issuer and/or credit risk exposure has been determined to be the United States of America, unless otherwise noted. |
| D. | | Distributions — Distributions from income and net realized capital gain, if any, are generally paid to separate accounts of participating insurance companies annually and recorded on ex-dividend date. |
| E. | | Federal Income Taxes — The Fund intends to comply with the requirements of Subchapter M of the Internal Revenue Code necessary to qualify as a regulated investment company and to distribute substantially all of the Fund’s taxable earnings to shareholders. As such, the Fund will not be subject to federal income taxes on otherwise taxable income (including net realized capital gain) that is distributed to shareholders. Therefore, no provision for federal income taxes is recorded in the financial statements. |
| | The Fund files tax returns in the U.S. Federal jurisdiction and certain other jurisdictions. Generally, the Fund is subject to examinations by such taxing authorities for up to three years after the filing of the return for the tax period. |
| F. | | Expenses — Fees provided for under the Rule 12b-1 plan of a particular class of the Fund and which are directly attributable to that class are charged to the operations of such class. All other expenses are allocated among the classes based on relative net assets. |
| G. | | Accounting Estimates — The preparation of financial statements in conformity with accounting principles generally accepted in the United States of America (“GAAP”) requires management to make estimates and assumptions that affect the reported amounts of assets and liabilities at the date of the financial statements and the reported amounts of revenues and expenses during the reporting period including estimates and assumptions related to |
Invesco V.I. Core Equity Fund
| | |
| | taxation. Actual results could differ from those estimates by a significant amount. In addition, the Fund monitors for material events or transactions that may occur or become known after the period-end date and before the date the financial statements are released to print. |
| H. | | Indemnifications — Under the Trust’s organizational documents, each Trustee, officer, employee or other agent of the Trust is indemnified against certain liabilities that may arise out of performance of their duties to the Fund. Additionally, in the normal course of business, the Fund enters into contracts, including the Fund’s servicing agreements that contain a variety of indemnification clauses. The Fund’s maximum exposure under these arrangements is unknown as this would involve future claims that may be made against the Fund that have not yet occurred. The risk of material loss as a result of such indemnification claims is considered remote. |
| I. | | Securities Lending — The Fund may lend portfolio securities having a market value up to one-third of the Fund’s total assets. Such loans are secured by collateral equal to no less than the market value of the loaned securities determined daily by the securities lending provider. Such collateral will be cash or debt securities issued or guaranteed by the U.S. Government or any of its sponsored agencies. Cash collateral received in connection with these loans is invested in short-term money market instruments or affiliated money market funds and is shown as such on the Schedule of Investments. It is the Fund’s policy to obtain additional collateral from or return excess collateral to the borrower by the end of the next business day, following the valuation date of the securities loaned. Therefore, the value of the collateral held may be temporarily less than the value of the securities on loan. Lending securities entails a risk of loss to the Fund if and to the extent that the market value of the securities loaned were to increase and the borrower did not increase the collateral accordingly, and the borrower fails to return the securities. Upon the failure of the borrower to return the securities, collateral may be liquidated and the securities may be purchased on the open market to replace the loaned securities. The Fund could experience delays and costs in gaining access to the collateral. The Fund bears the risk of any deficiency in the amount of the collateral available for return to the borrower due to any loss on the collateral invested. Dividends received on cash collateral investments for securities lending transactions, which are net of compensation to counterparties, is included in Dividends from affiliated money market funds on the Statement of Operations. The aggregate value of securities out on loan is shown as a footnote on the Statement of Assets and Liabilities, if any. |
| J. | | Foreign Currency Translations — Foreign currency is valued at the close of the NYSE based on quotations posted by banks and major currency dealers. Portfolio securities and other assets and liabilities denominated in foreign currencies are translated into U.S. dollar amounts at date of valuation. Purchases and sales of portfolio securities (net of foreign taxes withheld on disposition) and income items denominated in foreign currencies are translated into U.S. dollar amounts on the respective dates of such transactions. The Fund does not separately account for the portion of the results of operations resulting from changes in foreign exchange rates on investments and the fluctuations arising from changes in market prices of securities held. The combined results of changes in foreign exchange rates and the fluctuation of market prices on investments (net of estimated foreign tax withholding) are included with the net realized and unrealized gain or loss from investments in the Statement of Operations. Reported net realized foreign currency gains or losses arise from (1) sales of foreign currencies, (2) currency gains or losses realized between the trade and settlement dates on securities transactions, and (3) the difference between the amounts of dividends, interest, and foreign withholding taxes recorded on the Fund’s books and the U.S. dollar equivalent of the amounts actually received or paid. Net unrealized foreign currency gains and losses arise from changes in the fair values of assets and liabilities, other than investments in securities at fiscal period end, resulting from changes in exchange rates. |
| | The Fund may invest in foreign securities which may be subject to foreign taxes on income, gains on investments or currency repatriation, a portion of which may be recoverable. |
| K. | | Foreign Currency Contracts — The Fund may enter into foreign currency contracts to manage or minimize currency or exchange rate risk. The Fund may also enter into foreign currency contracts for the purchase or sale of a security denominated in a foreign currency in order to “lock in” the U.S. dollar price of that security. A foreign currency contract is an obligation to purchase or sell a specific currency for an agreed-upon price at a future date. The use of foreign currency contracts does not eliminate fluctuations in the price of the underlying securities the Fund owns or intends to acquire but establishes a rate of exchange in advance. Fluctuations in the value of these contracts are measured by the difference in the contract date and reporting date exchange rates and are recorded as unrealized appreciation (depreciation) until the contracts are closed. When the contracts are closed, realized gains (losses) are recorded. Realized and unrealized gains (losses) on the contracts are included in the Statement of Operations. The primary risks associated with foreign currency contracts include failure of the counterparty to meet the terms of the contract and the value of the foreign currency changing unfavorably. These risks may be in excess of the amounts reflected in the Statement of Assets and Liabilities. |
| L. | | Call Options Written — The Fund may write call options. A call option gives the purchaser of such option the right to buy, and the writer (the Fund) the obligation to sell, the underlying security at the stated exercise price during the option period. Written call options are recorded as a liability in the Statement of Assets and Liabilities. The amount of the liability is subsequently valued to reflect the current market value of the option written. If a written call option expires on the stipulated expiration date, or if the Fund enters into a closing purchase transaction, the Fund realizes a gain (or a loss if the closing purchase transaction exceeds the premium received when the option was written) without regard to any unrealized gain or loss on the underlying security, and the liability related to such option is extinguished. If a written option is exercised, the Fund realizes a gain or a loss from the sale of the underlying security and the proceeds of the sale are increased by the premium originally received. Realized gains and losses on these contracts are included in the Statement of Operations. A risk in writing a covered call option is that the Fund gives up the opportunity for profit if the market price of the security increases and the option is exercised. |
| M. | | Put Options Purchased — The Fund may purchase put options including options on securities indexes and/or futures contracts. By purchasing a put option, the Fund obtains the right (but not the obligation) to sell the option’s underlying instrument at a fixed strike price. In return for this right, the Fund pays an option premium. The option’s underlying instrument may be a security, securities index, or a futures contract. Put options may be used by the Fund to hedge securities it owns by locking in a minimum price at which the Fund can sell. If security prices fall, the put option could be exercised to offset all or a portion of the Fund’s resulting losses. At the same time, because the maximum the Fund has at risk is the cost of the option, purchasing put options does not eliminate the potential for the Fund to profit from an increase in the value of the securities hedged. Realized and unrealized gains and losses on these contracts are included in the Statement of Operations. A risk in buying an option is that the Fund pays a premium whether or not the option is exercised. In addition, there can be no assurance that a liquid secondary market will exist for any option purchased. |
Invesco V.I. Core Equity Fund
NOTE 2—Advisory Fees and Other Fees Paid to Affiliates
The Trust has entered into a master investment advisory agreement with Invesco Advisers, Inc. (the “Adviser” or “Invesco”). Under the terms of the investment advisory agreement, the Fund pays an advisory fee to the Adviser based on the annual rate of the Fund’s average daily net assets as follows:
| | | | | |
| Average Daily Net Assets | | Rate |
| |
| First $250 million | | | 0 | .65% |
| |
| Over $250 million | | | 0 | .60% |
| |
Under the terms of a master sub-advisory agreement between the Adviser and each of Invesco Asset Management Deutschland GmbH, Invesco Asset Management Limited, Invesco Asset Management (Japan) Limited, Invesco Australia Limited, Invesco Hong Kong Limited, Invesco Senior Secured Management, Inc. and Invesco Canada Ltd. (collectively, the “Affiliated Sub-Advisers”) the Adviser, not the Fund, may pay 40% of the fees paid to the Adviser to any such Affiliated Sub-Adviser(s) that provide discretionary investment management services to the Fund based on the percentage of assets allocated to such Sub-Adviser(s).
The Adviser has contractually agreed, through at least April 30, 2013, to waive advisory fees and/or reimburse expenses of all shares to the extent necessary to limit total annual fund operating expenses after fee waiver and/or expense reimbursement (excluding certain items discussed below) of Series I shares to 1.30% and Series II shares to 1.45% of average daily net assets. In determining the Adviser’s obligation to waive advisory fees and/or reimburse expenses, the following expenses are not taken into account, and could cause the total annual fund operating expenses after fee waiver and/or expense reimbursement to exceed the numbers reflected above: (1) interest; (2) taxes; (3) dividend expense on short sales; (4) extraordinary items or non-routine items, including litigation expenses; and (5) expenses that the Fund has incurred but did not actually pay because of an expense offset arrangement. Unless the Board of the Trustees and Invesco mutually agree to amend or continue the fee waiver agreement, it will terminate on April 30, 2013. The Adviser did not waive fees and/or reimburse expenses during the period under this expense limitation.
Further, the Adviser has contractually agreed, through at least June 30, 2012, to waive the advisory fee payable by the Fund in an amount equal to 100% of the net advisory fees the Adviser receives from the affiliated money market funds on investments by the Fund of uninvested cash (excluding investments of cash collateral from securities lending) in such affiliated money market funds.
For the year ended December 31, 2011, the Adviser waived advisory fees of $208,222.
The Trust has entered into a master administrative services agreement with Invesco pursuant to which the Fund has agreed to pay Invesco a fee for costs incurred in providing accounting services and fund administrative services to the Fund and to reimburse Invesco for administrative services fees paid to insurance companies that have agreed to provide services to the participants of separate accounts. These administrative services provided by the insurance companies may include, among other things: the printing of prospectuses, financial reports and proxy statements and the delivery of the same to existing participants; the maintenance of master accounts; the facilitation of purchases and redemptions requested by the participants; and the servicing of participants’ accounts. Pursuant to such agreement, for the year ended December 31, 2011, Invesco was paid $303,870 for accounting and fund administrative services and reimbursed $3,027,658 for services provided by insurance companies.
The Trust has entered into a transfer agency and service agreement with Invesco Investment Services, Inc. (“IIS”) pursuant to which the Fund has agreed to pay IIS a fee for providing transfer agency and shareholder services to the Fund and reimburse IIS for certain expenses incurred by IIS in the course of providing such services. For the year ended December 31, 2011, expenses incurred under the agreement are shown in the Statement of Operations as transfer agent fees.
The Trust has entered into a master distribution agreement with Invesco Distributors, Inc. (“IDI”) to serve as the distributor for the Fund. The Trust has adopted a plan pursuant to Rule 12b-1 under the 1940 Act with respect to the Fund’s Series II shares (the “Plan”). The Fund, pursuant to the Plan, pays IDI compensation at the annual rate of 0.25% of the Fund’s average daily net assets of Series II shares. Of the Plan payments, up to 0.25% of the average daily net assets of the Series II shares may be paid to insurance companies who furnish continuing personal shareholder services to customers who purchase and own Series II shares of the Fund. For the year ended December 31, 2011, expenses incurred under the Plan are detailed in the Statement of Operations as distribution fees.
Certain officers and trustees of the Trust are officers and directors of the Adviser, Invesco Ltd., IIS and/or IDI.
NOTE 3—Additional Valuation Information
GAAP defines fair value as the price that would be received to sell an asset or paid to transfer a liability in an orderly transaction between market participants at the measurement date, under current market conditions. GAAP establishes a hierarchy that prioritizes the inputs to valuation methods giving the highest priority to readily available unadjusted quoted prices in an active market for identical assets (Level 1) and the lowest priority to significant unobservable inputs (Level 3) generally when market prices are not readily available or are unreliable. Based on the valuation inputs, the securities or other investments are tiered into one of three levels. Changes in valuation methods may result in transfers in or out of an investment’s assigned level:
| | |
| | Level 1 — | Prices are determined using quoted prices in an active market for identical assets. |
| | Level 2 — | Prices are determined using other significant observable inputs. Observable inputs are inputs that other market participants may use in pricing a security. These may include quoted prices for similar securities, interest rates, prepayment speeds, credit risk, yield curves, loss severities, default rates, discount rates, volatilities and others. |
Invesco V.I. Core Equity Fund
| | |
| | Level 3 — | Prices are determined using significant unobservable inputs. In situations where quoted prices or observable inputs are unavailable (for example, when there is little or no market activity for an investment at the end of the period), unobservable inputs may be used. Unobservable inputs reflect the Fund’s own assumptions about the factors market participants would use in determining fair value of the securities or instruments and would be based on the best available information. |
The following is a summary of the tiered valuation input levels, as of December 31, 2011. The level assigned to the securities valuations may not be an indication of the risk or liquidity associated with investing in those securities. Because of the inherent uncertainties of valuation, the values reflected in the financial statements may materially differ from the value received upon actual sale of those investments.
During the year ended December 31, 2011, there were no significant transfers between investment levels.
| | | | | | | | | | | | | | | | | |
| | | Level 1 | | Level 2 | | Level 3 | | Total |
| Equity Securities | | $ | 1,108,360,187 | | | $ | 33,274,145 | | | $ | — | | | $ | 1,141,634,332 | |
| |
NOTE 4—Derivative Investments
Effect of Derivative Instruments for the year ended December 31, 2011
The table below summarizes the gains on derivative instruments, detailed by primary risk exposure, recognized in earnings during the period:
| | | | | | | | | |
| | | Location of Gain on
|
| | | Statement of Operations |
| | | Foreign Currency
| | |
| | | Contracts* | | Options* |
| |
| Realized Gain | | | | | | | | |
| Currency risk | | $ | 4,321,151 | | | $ | — | |
| |
| Equity risk | | | — | | | | 51,915 | |
| |
| Change in Unrealized Appreciation | | | | | | | | |
| Currency risk | | | 50,646 | | | | — | |
| |
| Equity risk | | | — | | | | — | |
| |
| Total | | $ | 4,371,797 | | | $ | 51,915 | |
| |
| |
| * | The average notional value of foreign currency contracts and options outstanding during the period was $3,751,825 and $4,326, respectively. |
| | | | | | | | | |
| Transactions During the Period |
| | | Call Option Contracts |
| | | Number of
| | Premiums
|
| | | Contracts | | Received |
| |
| Beginning of period | | | — | | | $ | — | |
| |
| Written | | | 1,889 | | | | 51,915 | |
| |
| Expired | | | (1,889 | ) | | | (51,915 | ) |
| |
| End of period | | | 0 | | | $ | 0 | |
| |
NOTE 5—Security Transactions with Affiliated Funds
The Fund is permitted to purchase or sell securities from or to certain other Invesco Funds under specified conditions outlined in procedures adopted by the Board of Trustees of the Trust. The procedures have been designed to ensure that any purchase or sale of securities by the Fund from or to another fund or portfolio that is or could be considered an affiliate by virtue of having a common investment adviser (or affiliated investment advisers), common Trustees and/or common officers complies with Rule 17a-7 of the 1940 Act. Further, as defined under the procedures, each transaction is effected at the current market price. Pursuant to these procedures, for the year ended December 31, 2011, the Fund engaged in securities sales of $8,391,853, which resulted in net realized gains (losses) of $(1,439,884).
NOTE 6—Trustees’ and Officers’ Fees and Benefits
“Trustees’ and Officers’ Fees and Benefits” include amounts accrued by the Fund to pay remuneration to certain Trustees and Officers of the Fund. Trustees have the option to defer compensation payable by the Fund, and “Trustees’ and Officers’ Fees and Benefits” also include amounts accrued by the Fund to fund such deferred compensation amounts. Those Trustees who defer compensation have the option to select various Invesco Funds in which their deferral accounts shall be deemed to be invested. Finally, certain current Trustees are eligible to participate in a retirement plan that provides for benefits to be paid upon retirement to Trustees over a period of time based on the number of years of service. The Fund may have certain former Trustees who also participate in a retirement plan and receive benefits under such plan. “Trustees’ and Officers’ Fees and Benefits” include amounts accrued by the Fund to fund such retirement benefits. Obligations under the deferred compensation and retirement plans represent unsecured claims against the general assets of the Fund.
During the year ended December 31, 2011, the Fund paid legal fees of $2,806 for services rendered by Kramer, Levin, Naftalis & Frankel LLP as counsel to the Independent Trustees. A partner of that firm is a Trustee of the Trust.
Invesco V.I. Core Equity Fund
NOTE 7—Cash Balances
The Fund is permitted to temporarily carry a negative or overdrawn balance in its account with State Street Bank and Trust Company, the custodian bank. To compensate the custodian bank for such overdrafts, the overdrawn Fund may either (1) leave funds as a compensating balance in the account so the custodian bank can be compensated by earning the additional interest; or (2) compensate by paying the custodian bank at a rate agreed upon by the custodian bank and Invesco, not to exceed the contractually agreed upon rate.
NOTE 8—Distributions to Shareholders and Tax Components of Net Assets
Tax Character of Distributions to Shareholders Paid During the Years Ended December 31, 2011 and 2010:
| | | | | | | | | |
| | | 2011 | | 2010 |
| |
| Ordinary income | | $ | 11,639,076 | | | $ | 13,182,649 | |
| |
Tax Components of Net Assets at Period-End:
| | | | | |
| | | 2011 |
| |
| Undistributed ordinary income | | $ | 11,076,114 | |
| |
| Net unrealized appreciation — investments | | | 83,766,858 | |
| |
| Net unrealized appreciation (depreciation) — other investments | | | (42,451 | ) |
| |
| Temporary book/tax differences | | | (433,043 | ) |
| |
| Capital loss carryforward | | | (139,791,694 | ) |
| |
| Shares of beneficial interest | | | 1,187,727,534 | |
| |
| Total net assets | | $ | 1,142,303,318 | |
| |
The difference between book-basis and tax-basis unrealized appreciation (depreciation) is due to differences in the timing of recognition of gains and losses on investments for tax and book purposes. The Fund’s net unrealized appreciation difference is attributable primarily to wash sales.
The temporary book/tax differences are a result of timing differences between book and tax recognition of income and/or expenses. The Fund’s temporary book/tax differences are the result of the trustee deferral of compensation and retirement plan benefits.
Capital loss carryforward is calculated and reported as of a specific date. Results of transactions and other activity after that date may affect the amount of capital loss carryforward actually available for the Fund to utilize. The Regulated Investment Company Modernization Act of 2010 (the “Act”) eliminated the eight-year carryover period for capital losses that arise in taxable years beginning after its enactment date of December 22, 2010. Consequently, these capital losses can be carried forward for an unlimited period. However, capital losses with an expiration period may not be used to offset capital gains until all net capital losses without an expiration date have been utilized. Additionally, post-enactment capital loss carryovers will retain their character as either short-term or long-term capital losses instead of as short-term capital losses as under prior law. The ability to utilize capital loss carryforward in the future may be limited under the Internal Revenue Code and related regulations based on the results of future transactions.
The Fund utilized $70,495,881 of capital loss carryforward in the current period to offset net realized capital gain for federal income tax purposes. The Fund has a capital loss carryforward as of December 31, 2011, which expires as follows:
| | | | | | | | | | | | | |
| Capital Loss Carryforward* |
| Expiration | | Short-Term | | Long-Term | | Total |
| |
| December 31, 2017 | | $ | 139,791,694 | | | $ | — | | | $ | 139,791,694 | |
| |
| |
| * | Capital loss carryforward as of the date listed above is reduced for limitations, if any, to the extent required by the Internal Revenue Code. To the extent that unrealized gains as of May 1, 2006, the date of the reorganization of AIM V.I. Core Stock Fund and AIM V.I. Premier Equity Fund, into the Fund, are realized on securities held in each Fund at such date, the capital loss carryforward may be further limited for up to five years from the date of the reorganization. |
Invesco V.I. Core Equity Fund
NOTE 9—Investment Securities
The aggregate amount of investment securities (other than short-term securities, U.S. Treasury obligations and money market funds, if any) purchased and sold by the Fund during the year ended December 31, 2011 was $404,498,870 and $671,079,638, respectively. Cost of investments on a tax basis includes the adjustments for financial reporting purposes as of the most recently completed Federal income tax reporting period-end.
| | | | | |
| Unrealized Appreciation (Depreciation) of Investment Securities on a Tax Basis |
| |
| Aggregate unrealized appreciation of investment securities | | $ | 137,253,589 | |
| |
| Aggregate unrealized (depreciation) of investment securities | | | (53,486,731 | ) |
| |
| Net unrealized appreciation of investment securities | | $ | 83,766,858 | |
| |
| Cost of investments for tax purposes is $1,057,867,474. | | | | |
NOTE 10—Reclassification of Permanent Differences
Primarily as a result of differing book/tax treatment of foreign currency transactions on December 31, 2011, undistributed net investment income increased by $174,698 and undistributed net realized gain (loss) decreased by $174,698. This reclassification had no effect on the net assets of the Fund.
NOTE 11—Share Information
| | | | | | | | | | | | | | | | | |
| | | Summary of Share Activity |
| |
| | | Years ended December 31, |
| | | 2011(a) | | 2010 |
| | | Shares | | Amount | | Shares | | Amount |
| |
| Sold: | | | | | | | | | | | | | | | | |
| Series I | | | 1,178,162 | | | $ | 31,786,139 | | | | 1,698,343 | | | $ | 42,098,514 | |
| |
| Series II | | | 1,071,003 | | | | 28,747,134 | | | | 351,173 | | | | 8,756,793 | |
| |
| Issued as reinvestment of dividends: | | | | | | | | | | | | | | | | |
| Series I | | | 459,287 | | | | 11,312,225 | | | | 519,430 | | | | 12,902,647 | |
| |
| Series II | | | 13,368 | | | | 326,851 | | | | 11,350 | | | | 280,003 | |
| |
| Reacquired: | | | | | | | | | | | | | | | | |
| Series I | | | (10,589,116 | ) | | | (295,740,570 | ) | | | (10,899,313 | ) | | | (272,888,680 | ) |
| |
| Series II | | | (461,543 | ) | | | (12,694,584 | ) | | | (441,967 | ) | | | (11,024,729 | ) |
| |
| Net increase (decrease) in share activity | | | (8,328,839 | ) | | $ | (236,262,805 | ) | | | (8,760,984 | ) | | $ | (219,875,452 | ) |
| |
| | |
| (a) | | There are entities that are record owners of more than 5% of the outstanding shares of the Fund and in the aggregate own 55% of the outstanding shares of the Fund. The Fund and the Fund’s principal underwriter or adviser, are parties to participation agreements with these entities whereby these entities sell units of interest in separate accounts funding variable products that are invested in the Fund. The Fund, Invesco and/or Invesco affiliates may make payments to these entities, which are considered to be related to the Fund, for providing services to the Fund, Invesco and/or Invesco affiliates including, but not limited to, services such as, securities brokerage, third party record keeping and account servicing and administrative services. The Fund has no knowledge as to whether all or any portion of the shares owned of record by these entities are also owned beneficially. |
Invesco V.I. Core Equity Fund
NOTE 12—Financial Highlights
The following schedule presents financial highlights for a share of the Fund outstanding throughout the periods indicated.
| | | | | | | | | | | | | | | | | | | | | | | | | | | | | | | | | | | | | | | | | | | | | | | | | |
| | | | | | | | | | | | | | | | | | | Ratio of
| | Ratio of
| | | | |
| | | | | | | | | | | | | | | | | | | expenses
| | expenses
| | | | |
| | | | | | | Net gains (losses)
| | | | | | | | | | | | to average
| | to average net
| | Ratio of net
| | |
| | | Net asset
| | | | on securities
| | | | Dividends
| | | | | | | | net assets
| | assets without
| | investment
| | |
| | | value,
| | Net
| | (both
| | Total from
| | from net
| | Net asset
| | | | Net assets,
| | with fee waivers
| | fee waivers
| | income
| | |
| | | beginning
| | investment
| | realized and
| | investment
| | investment
| | value, end
| | Total
| | end of period
| | and/or expenses
| | and/or expenses
| | to average
| | Portfolio
|
| | | of period | | income(a) | | unrealized) | | operations | | income | | of period | | return(b) | | (000s omitted) | | absorbed | | absorbed | | net assets | | turnover(c) |
| |
| Series I |
| Year ended 12/31/11 | | $ | 27.03 | | | $ | 0.24 | | | $ | (0.28 | ) | | $ | (0.04 | ) | | $ | (0.27 | ) | | $ | 26.72 | | | | (0.06 | )% | | $ | 1,091,171 | | | | 0.87 | %(d) | | | 0.89 | %(d) | | | 0.86 | %(d) | | | 35 | % |
| Year ended 12/31/10 | | | 24.92 | | | | 0.22 | | | | 2.14 | | | | 2.36 | | | | (0.25 | ) | | | 27.03 | | | | 9.56 | | | | 1,345,658 | | | | 0.87 | | | | 0.89 | | | | 0.87 | | | | 47 | |
| Year ended 12/31/09 | | | 19.75 | | | | 0.19 | | | | 5.39 | | | | 5.58 | | | | (0.41 | ) | | | 24.92 | | | | 28.30 | | | | 1,456,822 | | | | 0.88 | | | | 0.90 | | | | 0.96 | | | | 21 | |
| Year ended 12/31/08 | | | 29.11 | | | | 0.33 | | | | (9.11 | ) | | | (8.78 | ) | | | (0.58 | ) | | | 19.75 | | | | (30.14 | ) | | | 1,330,161 | | | | 0.89 | | | | 0.90 | | | | 1.26 | | | | 36 | |
| Year ended 12/31/07 | | | 27.22 | | | | 0.42 | | | | 1.80 | | | | 2.22 | | | | (0.33 | ) | | | 29.11 | | | | 8.12 | | | | 2,298,007 | | | | 0.87 | | | | 0.88 | | | | 1.44 | | | | 45 | |
| |
| Series II |
| Year ended 12/31/11 | | | 26.82 | | | | 0.17 | | | | (0.27 | ) | | | (0.10 | ) | | | (0.21 | ) | | | 26.51 | | | | (0.29 | ) | | | 51,132 | | | | 1.12 | (d) | | | 1.14 | (d) | | | 0.61 | (d) | | | 35 | |
| Year ended 12/31/10 | | | 24.75 | | | | 0.15 | | | | 2.12 | | | | 2.27 | | | | (0.20 | ) | | | 26.82 | | | | 9.25 | | | | 35,025 | | | | 1.12 | | | | 1.14 | | | | 0.62 | | | | 47 | |
| Year ended 12/31/09 | | | 19.62 | | | | 0.14 | | | | 5.34 | | | | 5.48 | | | | (0.35 | ) | | | 24.75 | | | | 27.98 | | | | 34,275 | | | | 1.13 | | | | 1.15 | | | | 0.71 | | | | 21 | |
| Year ended 12/31/08 | | | 28.88 | | | | 0.26 | | | | (9.02 | ) | | | (8.76 | ) | | | (0.50 | ) | | | 19.62 | | | | (30.32 | ) | | | 23,885 | | | | 1.14 | | | | 1.15 | | | | 1.01 | | | | 36 | |
| Year ended 12/31/07 | | | 27.02 | | | | 0.34 | | | | 1.80 | | | | 2.14 | | | | (0.28 | ) | | | 28.88 | | | | 7.88 | | | | 34,772 | | | | 1.12 | | | | 1.13 | | | | 1.19 | | | | 45 | |
| |
| | |
| (a) | | Calculated using average shares outstanding. |
| (b) | | Includes adjustments in accordance with accounting principles generally accepted in the United States of America and as such, the net asset value for financial reporting purposes and the returns based upon those net asset values may differ from the net asset value and returns for shareholder transactions. Total returns are not annualized for periods less than one year, if applicable, and do not reflect charges assessed in connection with a variable product, which if included would reduce total returns. |
| (c) | | Portfolio turnover is calculated at the fund level and is not annualized for periods less than one year, if applicable. |
| (d) | | Ratios are based on average daily net assets (000’s) of $1,239,176 and $38,520 for Series I and Series II shares, respectively. |
Invesco V.I. Core Equity Fund
Report of Independent Registered Public Accounting Firm
To the Board of Trustees of AIM Variable Insurance Funds (Invesco Variable Insurance Funds)
and Shareholders of Invesco V.I. Core Equity Fund:
In our opinion, the accompanying statement of assets and liabilities, including the schedule of investments, and the related statements of operations and of changes in net assets and the financial highlights present fairly, in all material respects, the financial position of Invesco V.I. Core Equity Fund (one of the funds constituting AIM Variable Insurance Funds (Invesco Variable Insurance Funds), hereafter referred to as the “Fund”) at December 31, 2011, the results of its operations for the year then ended, the changes in its net assets for each of the two years in the period then ended and the financial highlights for each of the five years in the period then ended, in conformity with accounting principles generally accepted in the United States of America. These financial statements and financial highlights (hereafter referred to as “financial statements”) are the responsibility of the Fund’s management; our responsibility is to express an opinion on these financial statements based on our audits. We conducted our audits of these financial statements in accordance with the standards of the Public Company Accounting Oversight Board (United States). Those standards require that we plan and perform the audits to obtain reasonable assurance about whether the financial statements are free of material misstatement. An audit includes examining, on a test basis, evidence supporting the amounts and disclosures in the financial statements, assessing the accounting principles used and significant estimates made by management, and evaluating the overall financial statement presentation. We believe that our audits, which included confirmation of securities at December 31, 2011 by correspondence with the custodian and brokers, provide a reasonable basis for our opinion.
PRICEWATERHOUSECOOPERS LLP
February 14, 2012
Houston, Texas
Invesco V.I. Core Equity Fund
Calculating your ongoing Fund expenses
Example
As a shareholder of the Fund, you incur ongoing costs, including management fees; distribution and/or service fees (12b-1); and other Fund expenses. This example is intended to help you understand your ongoing costs (in dollars) of investing in the Fund and to compare these costs with ongoing costs of investing in other mutual funds. The example is based on an investment of $1,000 invested at the beginning of the period and held for the entire period July 1, 2011 through December 31, 2011.
The actual and hypothetical expenses in the examples below do not represent the effect of any fees or other expenses assessed in connection with a variable product; if they did, the expenses shown would be higher while the ending account values shown would be lower.
Actual expenses
The table below provides information about actual account values and actual expenses. You may use the information in this table, together with the amount you invested, to estimate the expenses that you paid over the period. Simply divide your account value by $1,000 (for example, an $8,600 account value divided by $1,000 = 8.6), then multiply the result by the number in the table under the heading entitled “Actual Expenses Paid During Period” to estimate the expenses you paid on your account during this period.
Hypothetical example for comparison purposes
The table below also provides information about hypothetical account values and hypothetical expenses based on the Fund’s actual expense ratio and an assumed rate of return of 5% per year before expenses, which is not the Fund’s actual return.
The hypothetical account values and expenses may not be used to estimate the actual ending account balance or expenses you paid for the period. You may use this information to compare the ongoing costs of investing in the Fund and other funds. To do so, compare this 5% hypothetical example with the 5% hypothetical examples that appear in the shareholder reports of the other funds.
Please note that the expenses shown in the table are meant to highlight your ongoing costs. Therefore, the hypothetical information is useful in comparing ongoing costs, and will not help you determine the relative total costs of owning different funds.
| | | | | | | | | | | | | | | | | | | | | | | | | | | | | | | |
| | | | | | | | | | HYPOTHETICAL
| | | |
| | | | | | | ACTUAL | | | (5% annual return before expenses) | | | |
| | | | Beginning
| | | Ending
| | | Expenses
| | | Ending
| | | Expenses
| | | Annualized
|
| | | | Account Value
| | | Account Value
| | | Paid During
| | | Account Value
| | | Paid During
| | | Expense
|
| Class | | | (07/01/11) | | | (12/31/11)1 | | | Period2 | | | (12/31/11) | | | Period2 | | | Ratio |
| Series I | | | $ | 1,000.00 | | | | $ | 930.20 | | | | $ | 4.28 | | | | $ | 1,020.77 | | | | $ | 4.48 | | | | | 0.88 | % |
| | | | | | | | | | | | | | | | | | | | | | | | | | | | | | | |
| Series II | | | | 1,000.00 | | | | | 928.80 | | | | | 5.49 | | | | | 1,019.51 | | | | | 5.75 | | | | | 1.13 | |
| | | | | | | | | | | | | | | | | | | | | | | | | | | | | | | |
| |
| 1 | The actual ending account value is based on the actual total return of the Fund for the period July 1, 2011 through December 31, 2011, after actual expenses and will differ from the hypothetical ending account value which is based on the Fund’s expense ratio and a hypothetical annual return of 5% before expenses. |
| 2 | Expenses are equal to the Fund’s annualized expense ratio as indicated above multiplied by the average account value over the period, multiplied by 184/365 to reflect the most recent fiscal half year. |
Invesco V.I. Core Equity Fund
Form 1099-DIV, Form 1042-S and other year-end tax information provide shareholders with actual calendar year amounts that should be included in their tax returns. Shareholders should consult their tax advisors.
The following distribution information is being provided as required by the Internal Revenue Code or to meet a specific state’s requirement.
The Fund designates the following amounts or, if subsequently determined to be different, the maximum amount allowable for its fiscal year ended December 31, 2011:
| | | | | |
Federal and State Income Tax | | |
| |
| Corporate Dividends Received Deduction* | | | 100% | |
| | |
| | * | The above percentages are based on ordinary income dividends paid to shareholders during the Fund’s fiscal year. |
Invesco V.I. Core Equity Fund
Trustees and Officers
The address of each trustee and officer is AIM Variable Insurance Funds (Invesco Variable Insurance Funds) (the “Trust”), 11 Greenway Plaza, Suite 2500, Houston, Texas 77046-1173. The trustees serve for the life of the Trust, subject to their earlier death, incapacitation, resignation, retirement or removal as more specifically provided in the Trust’s organizational documents. Each officer serves for a one year term or until their successors are elected and qualified. Column two below includes length of time served with predecessor entities, if any.
| | | | | | | | | |
| | | | | | | Number of Funds
| | |
Name, Year of Birth and
| | Trustee and/
| | Principal Occupation(s)
| | in Fund Complex
| | Other Directorship(s)
|
| Position(s) Held with the Trust | | or Officer Since | | During Past 5 Years | | Overseen by Trustee | | Held by Trustee |
| | | | | | | | | |
| | | | | | | | | |
| | | | | | | | | |
Interested Persons | | | | | | | | |
| | | | | | | | | |
| | | | | | | | | |
| | | | | | | | | |
Martin L. Flanagan1 — 1960
Trustee | | 2007 | | Executive Director, Chief Executive Officer and President, Invesco Ltd. (ultimate parent of Invesco and a global investment management firm); Advisor to the Board, Invesco Advisers, Inc. (formerly known as Invesco Institutional (N.A.), Inc.); Trustee, The Invesco Funds; Vice Chair, Investment Company Institute; and Member of Executive Board, SMU Cox School of Business
Formerly: Chairman, Invesco Advisers, Inc. (registered investment adviser); Director, Chairman, Chief Executive Officer and President, IVZ Inc. (holding company), INVESCO Group Services, Inc. (service provider) and Invesco North American Holdings, Inc. (holding company); Director, Chief Executive Officer and President, Invesco Holding Company Limited (parent of Invesco and a global investment management firm); Director, Invesco Ltd.; Chairman, Investment Company Institute and President, Co-Chief Executive Officer, Co-President, Chief Operating Officer and Chief Financial Officer, Franklin Resources, Inc. (global investment management organization) | | 140 | | None |
| | | | | | | | | |
| | | | | | | | | |
| | | | | | | | | |
Philip A. Taylor2 — 1954
Trustee, President and Principal Executive Officer | | 2006 | | Head of North American Retail and Senior Managing Director, Invesco Ltd.; Director, Co-Chairman, Co-President and Co-Chief Executive Officer, Invesco Advisers, Inc. (formerly known as Invesco Institutional (N.A.), Inc.) (registered investment adviser); Director, Chairman, Chief Executive Officer and President, Invesco Management Group, Inc. (formerly Invesco Aim Management Group, Inc.) (financial services holding company); Director and President, INVESCO Funds Group, Inc. (registered investment adviser and registered transfer agent); Director and Chairman, Invesco Investment Services, Inc. (formerly known as Invesco Aim Investment Services, Inc.) (registered transfer agent) and IVZ Distributors, Inc. (formerly known as INVESCO Distributors, Inc.) (registered broker dealer); Director, President and Chairman, Invesco Inc. (holding company) and Invesco Canada Holdings Inc. (holding company); Chief Executive Officer, Invesco Corporate Class Inc. (corporate mutual fund company) and Invesco Canada Fund Inc. (corporate mutual fund company); Director, Chairman and Chief Executive Officer, Invesco Canada Ltd. (formerly known as Invesco Trimark Ltd./Invesco Trimark Ltèe) (registered investment adviser and registered transfer agent); Trustee, President and Principal Executive Officer, The Invesco Funds (other than AIM Treasurer’s Series Trust (Invesco Treasurer’s Series Trust) and Short-Term Investments Trust); Trustee and Executive Vice President, The Invesco Funds (AIM Treasurer’s Series Trust (Invesco Treasurer’s Series Trust) and Short-Term Investments Trust only); Director, Invesco Investment Advisers LLC (formerly known as Van Kampen Asset Management); Director, Chief Executive Officer and President, Van Kampen Exchange Corp. | | 140 | | None |
| | | | | | | | | |
| | | | | | | | | |
| | | | | Formerly: Director and Chairman, Van Kampen Investor Services Inc.: Director, Chief Executive Officer and President, 1371 Preferred Inc. (holding company); and Van Kampen Investments Inc.; Director and President, AIM GP Canada Inc. (general partner for limited partnerships); and Van Kampen Advisors, Inc.; Director and Chief Executive Officer, Invesco Trimark Dealer Inc. (registered broker dealer); Director, Invesco Distributors, Inc. (formerly known as Invesco Aim Distributors, Inc.) (registered broker dealer); Manager, Invesco PowerShares Capital Management LLC; Director, Chief Executive Officer and President, Invesco Advisers, Inc.; Director, Chairman, Chief Executive Officer and President, Invesco Aim Capital Management, Inc.; President, Invesco Trimark Dealer Inc. and Invesco Trimark Ltd./Invesco Trimark Ltèe; Director and President, AIM Trimark Corporate Class Inc. and AIM Trimark Canada Fund Inc.; Senior Managing Director, Invesco Holding Company Limited; Trustee and Executive Vice President, Tax-Free Investments Trust; Director and Chairman, Fund Management Company (former registered broker dealer); President and Principal Executive Officer, The Invesco Funds (AIM Treasurer’s Series Trust (Invesco Treasurer’s Series Trust), Short-Term Investments Trust and Tax-Free Investments Trust only); President, AIM Trimark Global Fund Inc. and AIM Trimark Canada Fund Inc. | | | | |
| | | | | | | | | |
| | | | | | | | | |
| | | | | | | | | |
Wayne W. Whalen3 — 1939
Trustee | | 2010 | | Of Counsel, and prior to 2010, partner in the law firm of Skadden, Arps, Slate, Meagher & Flom LLP, legal counsel to funds in the Fund Complex | | 158 | | Director of the Abraham Lincoln Presidential Library Foundation |
| | | | | | | | | |
| | | | | | | | | |
| | | | | | | | | |
Independent Trustees | | | | | | | | |
| | | | | | | | | |
| | | | | | | | | |
| | | | | | | | | |
Bruce L. Crockett — 1944
Trustee and Chair | | 1993 | | Chairman, Crockett Technology Associates (technology consulting company) | | 140 | | ACE Limited (insurance company); and Investment Company Institute |
| | | | | Formerly: Director, Captaris (unified messaging provider); Director, President and Chief Executive Officer COMSAT Corporation; and Chairman, Board of Governors of INTELSAT (international communications company) | | | | |
| | | | | | | | | |
| |
| 1 | Mr. Flanagan is considered an interested person of the Trust because he is an officer of the adviser to the Trust, and an officer and a director of Invesco Ltd., ultimate parent of the adviser to the Trust. |
| 2 | Mr. Taylor is considered an interested person of the Trust because he is an officer and a director of the adviser to, and a director of the principal underwriter of, the Trust. |
| 3 | Mr. Whalen is considered an “interested person” (within the meaning of Section 2(a)(19) of the 1940 Act) of certain Funds in the Fund Complex by reason of he and his firm currently providing legal services as legal counsel to such Funds in the Fund Complex. |
Invesco V.I. Core Equity Fund
Trustees and Officers—(continued)
The address of each trustee and officer is AIM Variable Insurance Funds (Invesco Variable Insurance Funds) (the “Trust”), 11 Greenway Plaza, Suite 2500, Houston, Texas 77046-1173. The trustees serve for the life of the Trust, subject to their earlier death, incapacitation, resignation, retirement or removal as more specifically provided in the Trust’s organizational documents. Each officer serves for a one year term or until their successors are elected and qualified. Column two below includes length of time served with predecessor entities, if any.
| | | | | | | | | |
| | | | | | | Number of Funds
| | |
Name, Year of Birth and
| | Trustee and/
| | Principal Occupation(s)
| | in Fund Complex
| | Other Directorship(s)
|
| Position(s) Held with the Trust | | or Officer Since | | During Past 5 Years | | Overseen by Trustee | | Held by Trustee |
| | | | | | | | | |
| | | | | | | | | |
| | | | | | | |
Independent Trustees—(continued) | | | | | | |
| | | | | | | | | |
| | | | | | | | | |
| | | | | | | | | |
David C. Arch — 1945
Trustee | | 2010 | | Chairman and Chief Executive Officer of Blistex Inc., a consumer health care products manufacturer. | | 158 | | Member of the Heartland Alliance Advisory Board, a nonprofit organization serving human needs based in Chicago. Board member of the Illinois Manufacturers’ Association. Member of the Board of Visitors, Institute for the Humanities, University of Michigan |
| | | | | | | | | |
| | | | | | | | | |
| | | | | | | | | |
Frank S. Bayley — 1939
Trustee | | 2001 | | Retired
Formerly: Director, Badgley Funds, Inc. (registered investment company) (2 portfolios) and Partner, law firm of Baker & McKenzie | | 140 | | Director and Chairman, C.D. Stimson Company (a real estate investment company) |
| | | | | | | | | |
| | | | | | | | | |
| | | | | | | | | |
James T. Bunch — 1942
Trustee | | 2004 | | Managing Member, Grumman Hill Group LLC (family office private equity management)
Formerly: Founder, Green, Manning & Bunch Ltd. (investment banking firm)(1988-2010); Executive Committee, United States Golf Association; and Director, Policy Studies, Inc. and Van Gilder Insurance Corporation | | 140 | | Vice Chairman, Board of Governors, Western Golf Association/Evans Scholars Foundation and Director, Denver Film Society |
| | | | | | | | | |
| | | | | | | | | |
| | | | | | | | | |
Rodney F. Dammeyer — 1940
Trustee | | 2010 | | President of CAC, LLC, a private company offering capital investment and management advisory services.
Formerly: Prior to January 2004, Director of TeleTech Holdings Inc.; Prior to 2002, Director of Arris Group, Inc.; Prior to 2001, Managing Partner at Equity Group Corporate Investments. Prior to 1995, Vice Chairman of Anixter International. Prior to 1985, experience includes Senior Vice President and Chief Financial Officer of Household International, Inc., Executive Vice President and Chief Financial Officer of Northwest Industries, Inc. and Partner of Arthur Andersen & Co. | | 158 | | Director of Quidel Corporation and Stericycle, Inc. Prior to May 2008, Trustee of The Scripps Research Institute. Prior to February 2008, Director of Ventana Medical Systems, Inc. Prior to April 2007, Director of GATX Corporation. Prior to April 2004, Director of TheraSense, Inc. |
| | | | | | | | | |
| | | | | | | | | |
| | | | | | | | | |
Albert R. Dowden — 1941
Trustee | | 2000 | | Director of a number of public and private business corporations, including the Boss Group, Ltd. (private investment and management); Reich & Tang Funds (5 portfolios) (registered investment company); and Homeowners of America Holding Corporation/ Homeowners of America Insurance Company (property casualty company)
Formerly: Director, Continental Energy Services, LLC (oil and gas pipeline service); Director, CompuDyne Corporation (provider of product and services to the public security market) and Director, Annuity and Life Re (Holdings), Ltd. (reinsurance company); Director, President and Chief Executive Officer, Volvo Group North America, Inc.; Senior Vice President, AB Volvo; Director of various public and private corporations; Chairman, DHJ Media, Inc.; Director Magellan Insurance Company; and Director, The Hertz Corporation, Genmar Corporation (boat manufacturer), National Media Corporation; Advisory Board of Rotary Power International (designer, manufacturer, and seller of rotary power engines); and Chairman, Cortland Trust, Inc. (registered investment company) | | 140 | | Board of Nature’s Sunshine Products, Inc. |
| | | | | | | | | |
| | | | | | | | | |
| | | | | | | | | |
Jack M. Fields — 1952
Trustee | | 1997 | | Chief Executive Officer, Twenty First Century Group, Inc. (government affairs company); and Owner and Chief Executive Officer, Dos Angelos Ranch, L.P. (cattle, hunting, corporate entertainment), Discovery Global Education Fund (non-profit) and Cross Timbers Quail Research Ranch (non-profit)
Formerly: Chief Executive Officer, Texana Timber LP (sustainable forestry company) and member of the U.S. House of Representatives | | 140 | | Administaff |
| | | | | | | | | |
| | | | | | | | | |
| | | | | | | | | |
Carl Frischling — 1937
Trustee | | 1993 | | Partner, law firm of Kramer Levin Naftalis and Frankel LLP | | 140 | | Director, Reich & Tang Funds (16 portfolios) |
| | | | | | | | | |
| | | | | | | | | |
Invesco V.I. Core Equity Fund
Trustees and Officers—(continued)
The address of each trustee and officer is AIM Variable Insurance Funds (Invesco Variable Insurance Funds) (the “Trust”), 11 Greenway Plaza, Suite 2500, Houston, Texas 77046-1173. The trustees serve for the life of the Trust, subject to their earlier death, incapacitation, resignation, retirement or removal as more specifically provided in the Trust’s organizational documents. Each officer serves for a one year term or until their successors are elected and qualified. Column two below includes length of time served with predecessor entities, if any.
| | | | | | | | | |
| | | | | | | Number of Funds
| | |
Name, Year of Birth and
| | Trustee and/
| | Principal Occupation(s)
| | in Fund Complex
| | Other Directorship(s)
|
| Position(s) Held with the Trust | | or Officer Since | | During Past 5 Years | | Overseen by Trustee | | Held by Trustee |
| | | Independent Trustees—(continued) | | | | |
| | | | | | | | | |
| | | | | | | | | |
| | | | | | | | | |
Prema Mathai-Davis — 1950
Trustee | | 1998 | | Retired
Formerly: Chief Executive Officer, YWCA of the U.S.A. | | 140 | | None |
| | | | | | | | | |
| | | | | | | | | |
| | | | | | | | | |
Larry Soll — 1942
Trustee | | 2004 | | Retired
Formerly, Chairman, Chief Executive Officer and President, Synergen Corp. (a biotechnology company) | | 140 | | None |
| | | | | | | | | |
| | | | | | | | | |
| | | | | | | | | |
Hugo F. Sonnenschein — 1940
Trustee | | 2010 | | President Emeritus and Honorary Trustee of the University of Chicago and the Adam Smith Distinguished Service Professor in the Department of Economics at the University of Chicago. Prior to July 2000, President of the University of Chicago. | | 158 | | Trustee of the University of Rochester and a member of its investment committee. Member of the National Academy of Sciences, the American Philosophical Society and a fellow of the American Academy of Arts and Sciences |
| | | | | | | | | |
| | | | | | | | | |
| | | | | | | | | |
| Raymond Stickel, Jr. — 1944 Trustee | | 2005 | | Retired
Formerly: Director, Mainstay VP Series Funds, Inc. (25 portfolios) and Partner, Deloitte & Touche | | 140 | | None |
| | | | | | | | | |
| | | | | | | | | |
| | | | | | | | | |
Other Officers | | | | | | | | |
| | | | | | | | | |
| | | | | | | | | |
| | | | | | | | | |
Russell C. Burk — 1958
Senior Vice President and Senior Officer | | 2005 | | Senior Vice President and Senior Officer, The Invesco Funds | | N/A | | N/A |
| | | | | | | | | |
| | | | | | | | | |
| | | | | | | | | |
John M. Zerr — 1962
Senior Vice President, Chief Legal Officer and Secretary | | 2006 | | Director, Senior Vice President, Secretary and General Counsel, Invesco Management Group, Inc. (formerly known as Invesco Aim Management Group, Inc.) and Van Kampen Exchange Corp.; Senior Vice President, Invesco Advisers, Inc. (formerly known as Invesco Institutional (N.A.), Inc.) (registered investment adviser); Senior Vice President and Secretary, Invesco Distributors, Inc. (formerly known as Invesco Aim Distributors, Inc.); Director, Vice President and Secretary, Invesco Investment Services, Inc. (formerly known as Invesco Aim Investment Services, Inc.) and IVZ Distributors, Inc. (formerly known as INVESCO Distributors, Inc.); Director and Vice President, INVESCO Funds Group, Inc.; Senior Vice President, Chief Legal Officer and Secretary, The Invesco Funds; Manager, Invesco PowerShares Capital Management LLC; Director, Secretary and General Counsel, Invesco Investment Advisers LLC (formerly known as Van Kampen Asset Management); Secretary and General Counsel, Van Kampen Funds Inc. and Chief Legal Officer, PowerShares Exchange-Traded Fund Trust, PowerShares Exchange-Traded Fund Trust II, PowerShares India Exchange-Traded Fund Trust and PowerShares Actively Managed Exchange-Traded Fund Trust
Formerly: Director and Secretary, Van Kampen Advisors Inc.; Director Vice President, Secretary and General Counsel Van Kampen Investor Services Inc.; Director, Invesco Distributors, Inc. (formerly known as Invesco Aim Distributors, Inc.); Director, Senior Vice President, General Counsel and Secretary, Invesco Advisers, Inc.; and Van Kampen Investments Inc.; Director, Vice President and Secretary, Fund Management Company; Director, Senior Vice President, Secretary, General Counsel and Vice President, Invesco Aim Capital Management, Inc.; Chief Operating Officer and General Counsel, Liberty Ridge Capital, Inc. (an investment adviser); Vice President and Secretary, PBHG Funds (an investment company) and PBHG Insurance Series Fund (an investment company); Chief Operating Officer, General Counsel and Secretary, Old Mutual Investment Partners (a broker-dealer); General Counsel and Secretary, Old Mutual Fund Services (an administrator) and Old Mutual Shareholder Services (a shareholder servicing center); Executive Vice President, General Counsel and Secretary, Old Mutual Capital, Inc. (an investment adviser); and Vice President and Secretary, Old Mutual Advisors Funds (an investment company) | | N/A | | N/A |
| | | | | | | | | |
| | | | | | | | | |
| | | | | | | | | |
Lisa O. Brinkley — 1959
Vice President | | 2004 | | Global Compliance Director, Invesco Ltd.; Chief Compliance Officer, Invesco Investment Services, Inc.(formerly known as Invesco Aim Investment Services, Inc.); and Vice President, The Invesco Funds
Formerly: Chief Compliance Officer, Invesco Distributors, Inc. (formerly known as Invesco Aim Distributors, Inc.) and Van Kampen Investor Services Inc.; Senior Vice President, Invesco Management Group, Inc.; Senior Vice President and Chief Compliance Officer, Invesco Advisers, Inc. and The Invesco Funds; Vice President and Chief Compliance Officer, Invesco Aim Capital Management, Inc. and Invesco Distributors, Inc.; Vice President, Invesco Investment Services, Inc. and Fund Management Company | | N/A | | N/A |
| | | | | | | | | |
Invesco V.I. Core Equity Fund
Trustees and Officers—(continued)
The address of each trustee and officer is AIM Variable Insurance Funds (Invesco Variable Insurance Funds) (the “Trust”), 11 Greenway Plaza, Suite 2500, Houston, Texas 77046-1173. The trustees serve for the life of the Trust, subject to their earlier death, incapacitation, resignation, retirement or removal as more specifically provided in the Trust’s organizational documents. Each officer serves for a one year term or until their successors are elected and qualified. Column two below includes length of time served with predecessor entities, if any.
| | | | | | | | | |
| | | | | | | Number of Funds
| | |
Name, Year of Birth and
| | Trustee and/
| | Principal Occupation(s)
| | in Fund Complex
| | Other Directorship(s)
|
| Position(s) Held with the Trust | | or Officer Since | | During Past 5 Years | | Overseen by Trustee | | Held by Trustee |
| | | Other Officers—(continued) | | | | |
| | | | | | | | | |
| | | | | | | | | |
| | | | | | | | | |
Sheri Morris — 1964
Vice President, Treasurer and Principal Financial Officer | | 1999 | | Vice President, Treasurer and Principal Financial Officer, The Invesco Funds; Vice President, Invesco Advisers, Inc. (formerly known as Invesco Institutional (N.A.), Inc.) (registered investment adviser).
Formerly: Treasurer, PowerShares Exchange-Traded Fund Trust, PowerShares Exchange-Traded Fund Trust II, PowerShares India Exchange-Traded Fund Trust and PowerShares Actively Managed Exchange-Traded Fund Trust, Vice President, Invesco Advisers, Inc., Invesco Aim Capital Management, Inc. and Invesco Aim Private Asset Management, Inc.; Assistant Vice President and Assistant Treasurer, The Invesco Funds and Assistant Vice President, Invesco Advisers, Inc., Invesco Aim Capital Management, Inc. and Invesco Aim Private Asset Management, Inc. | | N/A | | N/A |
| | | | | | | | | |
| | | | | | | | | |
| | | | | | | | | |
Karen Dunn Kelley — 1960
Vice President | | 1993 | | Head of Invesco’s World Wide Fixed Income and Cash Management Group; Senior Vice President, Invesco Management Group, Inc. (formerly known as Invesco Aim Management Group, Inc.) and Invesco Advisers, Inc. (formerly known as Invesco Institutional (N.A.), Inc.) (registered investment adviser); Executive Vice President, Invesco Distributors, Inc. (formerly known as Invesco Aim Distributors, Inc.); Director, Invesco Mortgage Capital Inc.; Vice President, The Invesco Funds (other than AIM Treasurer’s Series Trust (Invesco Treasurer’s Series Trust) and Short-Term Investments Trust); and President and Principal Executive Officer, The Invesco Funds (AIM Treasurer’s Series Trust (Invesco Treasurer’s Series Trust) and Short-Term Investments Trust only).
Formerly: Senior Vice President, Van Kampen Investments Inc.; Vice President, Invesco Advisers, Inc. (formerly known as Invesco Institutional (N.A.), Inc.); Director of Cash Management and Senior Vice President, Invesco Advisers, Inc. and Invesco Aim Capital Management, Inc.; President and Principal Executive Officer, Tax-Free Investments Trust; Director and President, Fund Management Company; Chief Cash Management Officer, Director of Cash Management, Senior Vice President, and Managing Director, Invesco Aim Capital Management, Inc.; Director of Cash Management, Senior Vice President, and Vice President, Invesco Advisers, Inc. and The Invesco Funds (AIM Treasurer’s Series Trust (Invesco Treasurer’s Series Trust), Short-Term Investments Trust and Tax-Free Investments Trust only) | | N/A | | N/A |
| | | | | | | | | |
| | | | | | | | | |
| | | | | | | | | |
Yinka Akinsola — 1977
Anti-Money Laundering Compliance Officer | | 2011 | | Anti-Money Laundering Compliance Officer, Invesco Advisers, Inc. (formerly known as Invesco Institutional (N.A.), Inc.) (registered investment adviser); Invesco Distributors, Inc. (formerly known as Invesco Aim Distributors, Inc.), Invesco Investment Services, Inc. (formerly known as Invesco Aim Investment Services, Inc.), Invesco Management Group, Inc., The Invesco Funds, Invesco Van Kampen Closed-End Funds, Van Kampen Exchange Corp. and Van Kampen Funds Inc. | | N/A | | N/A |
| | | | | | | | | |
| | | | | | | | | |
| | | | | | | | | |
Todd L. Spillane — 1958
Chief Compliance Officer | | 2006 | | Senior Vice President, Invesco Management Group, Inc. (formerly known as Invesco Aim Management Group, Inc.) and Van Kampen Exchange Corp.; Senior Vice President and Chief Compliance Officer, Invesco Advisers, Inc. (registered investment adviser) (formerly known as Invesco Institutional (N.A.), Inc.); Chief Compliance Officer, The Invesco Funds, INVESCO Private Capital Investments, Inc. (holding company) and Invesco Private Capital, Inc. (registered investment adviser); Vice President, Invesco Distributors, Inc. (formerly known as Invesco Aim Distributors, Inc.) and Invesco Investment Services, Inc. (formerly known as Invesco Aim Investment Services, Inc.).
Formerly: Chief Compliance Officer, Invesco Van Kampen Closed-End Funds PowerShares Exchange-Traded Fund Trust, PowerShares Exchange-Traded Fund Trust II, PowerShares India Exchange-Traded Fund Trust, and PowerShares Actively Managed Exchange-Traded Fund Trust; Senior Vice President, Van Kampen Investments Inc.; Senior Vice President and Chief Compliance Officer, Invesco Advisers, Inc. and Invesco Aim Capital Management, Inc.; Chief Compliance Officer, Invesco Global Asset Management (N.A.), Inc., Invesco Senior Secured Management, Inc. (registered investment adviser) and Van Kampen Investor Services Inc.; Vice President, Invesco Aim Capital Management, Inc. and Fund Management Company | | N/A | | N/A |
| | | | | | | | | |
The Statement of Additional Information of the Trust includes additional information about the Fund’s Trustees and is available upon request, without charge, by calling 1.800.959.4246. Please refer to the Fund’s prospectus for information on the Fund’s sub-advisers.
| | | | | | | |
Office of the Fund
11 Greenway Plaza, Suite 2500
Houston, TX 77046-1173 | | Investment Adviser
Invesco Advisers, Inc.
1555 Peachtree Street, N.E.
Atlanta, GA 30309 | | Distributor
Invesco Distributors, Inc.
11 Greenway Plaza, Suite 2500
Houston, TX 77046-1173 | | Auditors
PricewaterhouseCoopers LLP
1201 Louisiana Street, Suite 2900
Houston, TX 77002-5678 |
| | | | | | | |
| | | | | | | |
Counsel to the Fund
Stradley Ronon Stevens & Young, LLP
2600 One Commerce Square
Philadelphia, PA 19103 | | Counsel to the Independent Trustees
Kramer, Levin, Naftalis & Frankel LLP
1177 Avenue of the Americas
New York, NY 10036-2714 | | Transfer Agent
Invesco Investment Services, Inc.
11 Greenway Plaza, Suite 2500
Houston, TX77046-1173 | | Custodian
State Street Bank and Trust Company
225 Franklin
Boston, MA 02110-2801 |
Invesco V.I. Core Equity Fund
Invesco V.I. Diversified Income Fund
Annual Report to Shareholders § December 31, 2011
The Fund provides a complete list of its holdings four times in each fiscal year, at the quarter-ends. For the second and fourth quarters, the lists appear in the Fund’s semiannual and annual reports to shareholders. For the first and third quarters, the Fund files the lists with the Securities and Exchange Commission (SEC) on Form N-Q. The Fund’s Form N-Q filings are available on the SEC website, sec.gov. Copies of the Fund’s Forms N-Q may be reviewed and copied at the SEC Public Reference Room in Washington, D.C. You can obtain information on the operation of the Public Reference Room, including information about duplicating fee charges, by calling 202 551 8090 or 800 732 0330, or by electronic request at the following email address: publicinfo@sec.gov. The SEC file numbers for the Fund are 811-07452 and 033-57340. The Fund’s most recent portfolio holdings, as filed on Form N-Q, have also been made available to insurance companies issuing variable annuity contracts and variable life insurance policies (“variable products”) that invest in the Fund.
A description of the policies and procedures that the Fund uses to determine how to vote proxies relating to portfolio securities is available without charge, upon request, from our Client Services department at 800 959 4246 or at invesco.com/proxyguidelines. The information is also available on the SEC website, sec.gov.
Information regarding how the Fund voted proxies related to its portfolio securities during the 12 months ended June 30, 2011, is available at invesco.com/proxysearch. The information is also available on the SEC website, sec.gov.
Invesco Advisers, Inc. is an investment adviser; it provides investment advisory services to individual and institutional clients and does not sell securities. Invesco Distributors, Inc. is the U.S. distributor for Invesco Ltd.’s retail mutual funds, exchange-traded funds and institutional money market funds. Both are wholly owned, indirect subsidiaries of Invesco Ltd.
This report must be accompanied or preceded by a currently effective Fund prospectus and variable product prospectus, which contain more complete information, including sales charges and expenses. Investors should read each carefully before investing.
Invesco Distributors, Inc.
VIDIN-AR-1
| | | | | |
|
| | | | | |
NOT FDIC INSURED | | MAY LOSE VALUE | | NO BANK GUARANTEE |
Management’s Discussion of Fund Performance
Performance summary
For the year ended December 31, 2011, Invesco V.I. Diversified Income Fund underperformed its style-specific index. Security selection in the financials sector was a significant reason for the Fund’s underperformance relative to its style-specific index.
Your Fund’s long-term performance appears later in this report.
Fund vs. Indexes
Total returns, 12/31/10 to 12/31/11, excluding variable product issuer charges.
If variable product issuer charges were included, returns would be lower.
| | | | | |
|
| Series I Shares | | | 7.02 | % |
| |
| Series II Shares | | | 6.72 | |
| |
Barclays Capital U.S. Aggregate Index▼ (Broad Market Index) | | | 7.84 | |
| |
Barclays Capital U.S. Credit Index▼ (Style-Specific Index) | | | 8.35 | |
| |
Lipper VUF Corporate Debt BBB-Rated Funds Index▼ (Peer Group Index) | | | 7.34 | |
Source(s): ▼Lipper Inc.
How we invest
We invest primarily in fixed-rate, U.S. dollar-denominated corporate bonds. We may invest up to 40% of total assets in foreign securities. Up to 35% of the Fund’s assets may be invested in lower quality, high yield debt securities. The Fund may invest in derivative instruments such as futures contracts and swap agreements, including, but not limited to credit default swaps. It also may engage in mortgage dollar roll transactions, a form of repurchase agreement activity in the to-be-announced (TBA) market for agency mortgage backed securities (MBS).
Our security selection is supported by a team of independent specialists. Team members conduct top-down macroeconomic as well as bottom-up analysis on individual securities. Their recommendations are communicated to portfolio managers through proprietary technology that allows all investment professionals to communicate in a timely manner.
Portfolio construction begins with a well-defined Fund design that establishes
the target investment vehicles for generating the desired “alpha” (the extra return above a specific benchmark) as well as the risk parameters for the Fund. Investment vehicles are evaluated for liquidity and relative value.
Our sell decisions are based on:
| n | | A conscious decision to alter the Fund’s macro risk exposure (such as duration, yield curve positioning, sector exposure). |
| |
| n | | The need to limit or reduce exposure to a particular sector or issuer. |
| |
| n | | Degradation of an issuer’s credit quality. |
| |
| n | | Realignment of a valuation target. |
| |
| n | | Presentation of a better relative value opportunity. |
| |
| n | | The Fund’s general liquidity needs. |
Market conditions and your Fund
Global financial markets were unsettled and volatile during 2011 as investors assessed and reacted to the economic implications of several global events, including the Japanese earthquake and tsunami, the U.S. debt ceiling debate and a reinvigorated eurozone sovereign debt
crisis. The year began with U.S. interest rates drifting without much direction as these global developments unfolded. The U.S. economy showed signs of faltering, and there was little consensus regarding the threat of U.S. inflation. However, starting in the second quarter, anxiety linked to the aforementioned events and related concerns about global financial instability began dominating headlines and investors’ psyche, leading to periods of extreme risk aversion, wider credit spreads and high demand for the perceived safe haven of U.S. government bonds. By the end of the year, U.S. interest rates were pushed to near-historic lows, in spite of Standard & Poor’s credit rating downgrade of long-term U.S. debt in the third quarter.
U.S. Treasury yields for maturities of between two and 30 years ended the year lower than at the start of the year, generating strong positive 12-month returns across government bond sectors. With inflation expectations held in check, long-term bonds outperformed short and intermediate maturities, as investors were willing to extend out on the yield curve for incrementally higher returns. The broad U.S. investment grade bond market, as measured by the Barclays Capital U.S. Aggregate Index, also generated a positive total return for the 12 months ended December 31, 2011. While U.S. credit spreads widened to reflect heightened systemic risks, the significant decline in rates across the yield curve created gains across most domestic bond market sectors for the year.
With this economic and market environment as a backdrop, the Fund generated positive returns for the reporting period but underperformed its style-specific benchmark.
Several sector choices had notable, but largely offsetting, influences on Fund
Portfolio Composition
By industry, based on total investments
| | | | | |
|
| Other Diversified Financial Services | | | 8.9 | % |
| |
| U.S. Treasury Notes | | | 7.0 | |
| |
| Diversified Banks | | | 6.2 | |
| |
| Investment Banking & Brokerage | | | 5.3 | |
| |
| U.S. Treasury Bonds | | | 5.2 | |
| |
| Other Industries, Each With | | | | |
| Less Than 3.0% of Total Investments | | | 67.4 | |
Top 10 Fixed Income Issuers*
| | | | | | | | | |
|
| | 1. | | | U.S. Treasury | | | 12.2 | % |
| |
| | 2. | | | Citigroup Inc. | | | 2.2 | |
| |
| | 3. | | | Bank of America Corp. | | | 1.9 | |
| |
| | 4. | | | Hutchison Whampoa International Ltd. | | | 1.8 | |
| |
| | 5. | | | COX Communications Inc. | | | 1.7 | |
| |
| | 6. | | | DIRECTV Holdings LLC/DIRECTV
Financing Co., Inc. | | | 1.6 | |
| |
| | 7. | | | Morgan Stanley | | | 1.6 | |
| |
| | 8. | | | Goldman Sachs Group, Inc. (The) | | | 1.4 | |
| |
| | 9. | | | JM Smucker Co. (The) | | | 1.2 | |
| |
| | 10. | | | Entertainment Properties Trust | | | 1.2 | |
| | | | | |
|
| Total Net Assets | | $22.6 million | |
| | | | | |
| Total Number of Holdings* | | | 425 | |
The Fund’s holdings are subject to change, and there is no assurance that the Fund will continue to hold any particular security.
*Excludes U.S. Treasury Bills
Invesco V.I. Diversified Income Fund
performance. Early in the year, robust outperformance was generated by the Fund’s general overweight exposure to the investment grade financials, high yield and emerging market sectors. However, as credit market volatility increased, our sustained overweight position in financials, along with our underweight positions in the better-performing consumer staples, utilities and energy sectors, offset the strong start to the year.
As the year progressed, we lowered the Fund’s overall credit risk by increasing our exposure to U.S. government securities, which proved to be a beneficial strategy as investor pessimism grew. Another strategy we employed to manage overall credit risk during the volatile summer entailed buying credit protection via credit default swap indexes (CDX). We implemented credit risk management using CDX in July 2011 for approximately 2% of the portfolio’s market value; this helped diminish the negative effect of widening credit spreads during July and August.
Security selection aided performance during the first three months of 2011, mainly through our focus on lower quality investment grade bonds. However, as the credit markets became more erratic, the poor relative performance of our lower quality holdings, some domestic and European financials and some basic industry/capital goods and transportation credits, became a significant drag on Fund performance.
The Fund also uses active duration and yield curve positioning for risk management and for generating alpha versus its style-specific benchmark. Duration measures a portfolio’s price sensitivity to interest rate changes, with a longer portfolio duration tending to be more sensitive to interest rate changes than the benchmark. Duration and yield curve positions had a modest negative effect on Fund performance for the year. In addition, U.S. Treasury futures were an important investment tool in the management of our targeted portfolio duration.
Thank you for your investment in Invesco V.I. Diversified Income Fund.
The views and opinions expressed in management’s discussion of Fund performance are those of Invesco Advisers, Inc. These views and opinions are subject to change at any time based on factors such as market and economic conditions. These views and opinions may not be relied upon as investment advice or recommendations, or as an offer for a particular security. The information is not a complete analysis of every aspect of any market, country, industry, security or the Fund. Statements of fact are from sources considered reliable, but Invesco Advisers, Inc. makes no representation or warranty as to their completeness or accuracy. Although historical performance is no guarantee of future results, these insights may help you understand our investment management philosophy.
See important Fund and, if applicable, index disclosures later in this report.
Chuck Burge
Portfolio manager, is manager of Invesco V.I. Diversified Income Fund. He joined Invesco in 2002. Mr. Burge earned a B.S. in economics from Texas A&M University and an M.B.A. in finance and accounting from Rice University.
John Craddock
Chartered Financial Analyst, portfolio manager, is manager of Invesco V.I. Diversified Income Fund. He joined Invesco in 1999. Mr. Craddock earned a B.S. in mechanical engineering from Clemson University and an M.B.A. with a concentration in finance from the Dupree School of Management at the Georgia Institute of Technology.
Peter Ehret
Chartered Financial Analyst, portfolio manager, is manager of Invesco V.I. Diversified Income Fund. He joined Invesco in 2001.
Mr. Ehret graduated cum laude with a B.S. in economics from the University of Minnesota. He also earned an M.S. in real estate appraisal and investment analysis from the University of Wisconsin-Madison.
Darren Hughes
Chartered Financial Analyst, portfolio manager, is manager of Invesco V.I. Diversified Income Fund. He joined Invesco in 1992.
Mr. Hughes earned a B.B.A. in finance and economics from Baylor University.
Invesco V.I. Diversified Income Fund
Your Fund’s Long-Term Performance
Results of a $10,000 Investment – Oldest Share Class(es)
Fund and index data from 12/31/01*
| * | During the reporting period, Invesco changed its policy regarding growth of $10,000 charts. For funds older than 10 years, we previously showed performance since inception. Going forward, we will show performance for the most recent 10 years, since this more accurately reflects the experience of the typical shareholder. As a result, charts now may include benchmarks that did not appear previously, because the funds’ inception pre-dated the benchmarks’ inception. Also, all charts will now be presented using a linear format. |
Past performance cannot guarantee comparable future results.
Average Annual Total Returns
As of 12/31/11
| | | | | | | | | |
|
| Series I Shares | | | | |
| Inception (5/5/93) | | | 4.23 | % |
| |
| | 10 | | | Years | | | 3.53 | |
| |
| | 5 | | | Years | | | 2.32 | |
| |
| | 1 | | | Year | | | 7.02 | |
| |
| |
| Series II Shares | | | | |
| |
| | 10 | | | Years | | | 3.27 | % |
| |
| | 5 | | | Years | | | 2.07 | |
| |
| | 1 | | | Year | | | 6.72 | |
| |
Series II shares incepted on March 14, 2002. Performance shown prior to that date is that of Series I shares, restated to reflect the higher 12b-1 fees applicable to Series II. Series I performance reflects any applicable fee waivers or expense reimbursements. The performance of the Fund’s Series I and Series II share classes will differ primarily due to different class expenses.
The performance data quoted represent past performance and cannot guarantee comparable future results; current performance may be lower or higher. Please contact your variable product issuer or financial adviser for the most recent month-end variable product performance. Performance
figures reflect Fund expenses, reinvested distributions and changes in net asset value. Investment return and principal value will fluctuate so that you may have a gain or loss when you sell shares.
The net annual Fund operating expense ratio set forth in the most recent Fund prospectus as of the date of this report for Series I and Series II shares was 0.75% and 1.00%, respectively.1 The total annual Fund operating expense ratio set forth in the most recent Fund prospectus as of the date of this report for Series I and Series II shares was 1.36% and 1.61%, respectively. The expense ratios presented above may vary from the expense ratios presented in other sections of this report that are based on expenses incurred during the period covered by this report.
Invesco V.I. Diversified Income Fund, a series portfolio of AIM Variable Insurance Funds (Invesco Variable Insurance Funds), is currently offered through insurance companies issuing variable products. You cannot purchase shares of the Fund directly. Performance figures given represent the Fund and are not intended to reflect
actual variable product values. They do not reflect sales charges, expenses and fees assessed in connection with a variable product. Sales charges, expenses and fees, which are determined by the variable product issuers, will vary and will lower the total return.
The most recent month-end performance data at the Fund level, excluding variable product charges, is available at 800 451 4246. As mentioned above, for the most recent month-end performance including variable product charges, please contact your variable product issuer or financial adviser.
Had the adviser not waived fees and/ or expenses, performance would have been lower.
| 1 | | Total annual Fund operating expenses after any contractual fee waivers and/or expense reimbursements by the adviser in effect through at least April 30, 2013. See current prospectus for more information. |
Invesco V.I. Diversified Income Fund
Invesco V.I. Diversified Income Fund’s investment objective is total return, comprised of current income and capital appreciation.
| n | | Unless otherwise stated, information presented in this report is as of December 31, 2011, and is based on total net assets. |
| |
| n | | Unless otherwise noted, all data provided by Invesco. |
| |
| n | | To access your Fund’s reports/prospectus, visit invesco.com/fundreports. |
Principal risks of investing
in the Fund
Credit risk. The issuer of instruments in which the Fund invests may be unable to meet interest and/or principal payments, thereby causing its instruments to decrease in value and lowering the issuer’s credit rating.
Derivatives risk. Derivatives may be more difficult to purchase, sell or value than other investments and may be subject to market, interest rate, credit, leverage, counterparty and management risks. A fund investing in a derivative could lose more than the cash amount invested or incur higher taxes. Over-the-counter derivatives are also subject to counterparty risk, which is the risk that the other party to the contract will not fulfill its contractual obligation to complete the transaction with the Fund.
Developing markets securities risk. Securities issued by foreign companies and governments located in developing countries may be affected more negatively by inflation, devaluation of their currencies, higher transaction costs, delays in settlement, adverse political developments, the introduction of capital controls, withholding taxes, nationalization of private assets, expropriation, social unrest, war or lack of timely information than those in developed countries.
Foreign securities risk. The Fund’s foreign investments may be affected by changes in a foreign country’s exchange rates; political and social instability; changes in economic or taxation policies; difficulties when enforcing obligations; decreased liquidity; and increased volatility. Foreign companies may be subject to less regulation resulting in less publicly available information about the companies.
High yield bond (junk bond) risk. Junk bonds involve a greater risk of default or price changes due to changes in the credit quality of the issuer. The values of junk bonds fluctuate more than those of high- quality bonds in response to company, political, regulatory or economic developments. Values of junk bonds can decline significantly over short periods of time.
Interest rate risk. Interest rate risk refers to the risk that bond prices generally fall as interest rates rise; conversely, bond prices generally rise as interest rates fall. Specific bonds differ in their sensitivity to changes in interest rates
depending on their individual characteristics, including duration.
Leverage risk. Leverage exists when the Fund purchases or sells an instrument or enters into a transaction without investing cash in an amount equal to the full economic exposure of the instrument or transaction and the Fund could lose more than it invested. Leverage created from borrowing or certain types of transactions or instruments, including derivatives, may impair the Fund’s liquidity, cause it to liquidate positions at an unfavorable time, increase volatility or otherwise not achieve its intended objective.
Management risk. The investment techniques and risk analysis used by the Fund’s portfolio managers may not produce the desired results.
Market risk. The prices of and the income generated by the Fund’s securities may decline in response to, among other things, investor sentiment; general economic and market conditions; regional or global instability; and currency and interest rate fluctuations.
Mortgage- and asset-backed securities risk. The Fund may invest in mortgage- and asset-backed securities that are subject to prepayment or call risk, which is the risk that the borrower’s payments may be received earlier or later than expected due to changes in prepayment rates on underlying loans. Faster prepayments often happen when interest rates are falling. As a result, the Fund may reinvest these early payments at lower interest rates, thereby reducing the Fund’s income. Conversely, when interest rates rise, prepayments may happen more slowly, causing the security to lengthen in duration. Longer duration securities tend to be more volatile. Securities may be prepaid at a price less than the original purchase value. An unexpectedly high rate of defaults on the mortgages held by a mortgage pool may adversely affect the value of mortgage-backed securities and could result in losses to the Fund. The risk of such defaults is generally higher in the case of mortgage pools that include subprime mortgages. Subprime mortgages refer to loans made to borrowers with weakened credit histories or with lower capacity to make timely payments on their mortgages.
About indexes used in this report
The Barclays Capital U.S. Aggregate Index is an unmanaged index considered representative of the U.S. investment-grade, fixed-rate bond market.
The Barclays Capital U.S. Credit Index is an unmanaged index considered representative of publicly issued, SEC-registered U.S. corporate and specified foreign debentures and secured notes.
The Lipper VUF Corporate Debt BBB-Rated Funds Index is an unmanaged index considered representative of corporate debt BBB-rated variable insurance underlying funds tracked by Lipper.
The Fund is not managed to track the performance of any particular index, including the index(es) defined here, and consequently, the performance of the Fund may deviate significantly from the performance of the index(es).
A direct investment cannot be made in an index. Unless otherwise indicated, index results include reinvested dividends, and they do not reflect sales charges. Performance of the peer group, if applicable, reflects fund expenses; performance of a market index does not.
Other information
The Chartered Financial Analyst® (CFA®) designation is globally recognized and attests to a charterholder’s success in a rigorous and comprehensive study program in the field of investment management and research analysis.
Industry classifications used in this report are generally according to the Global Industry Classification Standard, which was developed by and is the exclusive property and a service mark of MSCI Inc. and Standard & Poor’s.
The returns shown in management’s discussion of Fund performance are based on net asset values calculated for shareholder transactions. Generally accepted accounting principles require adjustments to be made to the net assets of the Fund at period end for financial reporting purposes, and as such, the net asset values for shareholder transactions and the returns based on those net asset values may differ from the net asset values and returns reported in the Financial Highlights. Additionally, the returns and net asset values shown throughout this report are at the Fund level only and do not include variable product issuer charges. If such charges were included, the total returns would be lower.
Invesco V.I. Diversified Income Fund
Schedule of Investments(a)
December 31, 2011
| | | | | | | | | |
| | | Principal
| | |
| | | Amount | | Value |
| |
U.S. Dollar Denominated Bonds and Notes–83.34%
|
Aerospace & Defense–0.20%
| | | | |
BE Aerospace, Inc., Sr. Unsec. Notes,
6.88%, 10/01/20 | | $ | 2,000 | | | $ | 2,195 | |
| |
Bombardier Inc. (Canada), Sr. Unsec. Notes, 7.75%, 03/15/20(b) | | | 15,000 | | | | 16,425 | |
| |
Huntington Ingalls Industries Inc., Sr. Unsec. Gtd. Notes,
6.88%, 03/15/18(b) | | | 5,000 | | | | 4,937 | |
| |
7.13%, 03/15/21(b) | | | 10,000 | | | | 9,875 | |
| |
| Spirit Aerosystems Inc., Sr. Unsec. Gtd. Global Notes, 6.75%, 12/15/20 | | | 10,000 | | | | 10,475 | |
| |
| Triumph Group, Inc., Sr. Unsec. Gtd. Sub. Global Notes, 8.00%, 11/15/17 | | | 2,000 | | | | 2,150 | |
| |
| | | | | | | | 46,057 | |
| |
Agricultural Products–0.16%
| | | | |
| Corn Products International, Inc., Sr. Unsec. Notes, 6.63%, 04/15/37 | | | 30,000 | | | | 35,791 | |
| |
Airlines–2.59%
| | | | |
American Airlines Inc., Sr. Sec. Gtd. Notes, 7.50%, 03/15/16(b)(c) | | | 12,000 | | | | 8,640 | |
| |
American Airlines Pass Through Trust,
Series 2009-1A, Sec. Pass Through Ctfs., 10.38%, 07/02/19 | | | 42,238 | | | | 45,036 | |
| |
Series 2011-1, Class B, Sec. Gtd. Pass Through Ctfs., 7.00%, 01/31/18(b) | | | 84,439 | | | | 75,151 | |
| |
Continental Airlines Pass Through Trust,
Series 2007-1, Class C, Sec. Sub. Global Pass Through Ctfs., 7.34%, 04/19/14 | | | 4,923 | | | | 4,874 | |
| |
Series 2009-1, Sec. Pass Through Ctfs., 9.00%, 07/08/16 | | | 191,533 | | | | 211,165 | |
| |
Series 2009-2, Class B, Sec. Global Pass Through Ctfs., 9.25%, 05/10/17 | | | 12,573 | | | | 12,978 | |
| |
Series 2010-1, Class B, Sec. Pass Through Ctfs., 6.00%, 01/12/19 | | | 15,000 | | | | 14,034 | |
| |
Delta Air Lines Pass Through Trust,
Series 2002-1, Class C, Sec. Pass Through Ctfs., 7.78%, 01/02/12 | | | 460 | | | | 460 | |
| |
Series 2009-1, Class A, Sr. Sec. Pass Through Ctfs., 7.75%, 12/17/19 | | | 39,476 | | | | 43,078 | |
| |
Series 2010-1, Class B, Sec. Pass Through Ctfs., 6.38%, 01/02/16(b) | | | 5,000 | | | | 4,650 | |
| |
Series 2010-2, Class A, Sec. Pass Through Ctfs., 4.95%, 05/23/19 | | | 57,193 | | | | 58,373 | |
| |
Series 2010-2, Class B, Sec. Pass Through Ctfs., 6.75%, 11/23/15(b) | | | 5,000 | | | | 4,650 | |
| |
Series 2011-1, Class A, Sec. Pass Through Ctfs., 5.30%, 04/15/19 | | | 15,000 | | | | 15,497 | |
| |
Delta Air Lines, Inc.,
Sec. Notes, 12.25%, 03/15/15(b) | | | 5,000 | | | | 5,300 | |
| |
Sr. Sec. Notes, 9.50%, 09/15/14(b) | | | 8,000 | | | | 8,260 | |
| |
UAL Pass Through Trust,
Series 2009-1, Sr. Sec. Gtd. Global Pass Through Ctfs., 10.40%, 11/01/16 | | | 38,393 | | | | 42,712 | |
| |
Series 2009-2A, Sec. Gtd. Global Pass Through Ctfs., 9.75%, 01/15/17 | | | 26,680 | | | | 29,548 | |
| |
| | | | | | | | 584,406 | |
| |
Alternative Carriers–0.17%
| | | | |
Cogent Communications Group, Inc., Sr. Sec. Gtd. Notes, 8.38%, 02/15/18(b) | | | 10,000 | | | | 10,325 | |
| |
| Level 3 Communications Inc., Sr. Unsec. Global Notes, 11.88%, 02/01/19 | | | 10,000 | | | | 10,675 | |
| |
Level 3 Financing Inc., Sr. Unsec. Gtd. Global Notes, 9.25%, 11/01/14 | | | 6,000 | | | | 6,135 | |
| |
| 9.38%, 04/01/19 | | | 10,000 | | | | 10,450 | |
| |
| | | | | | | | 37,585 | |
| |
Aluminum–0.04%
| | | | |
| Century Aluminum Co., Sr. Sec. Gtd. Notes, 8.00%, 05/15/14 | | | 10,000 | | | | 9,956 | |
| |
Apparel Retail–0.31%
| | | | |
| Express LLC/Express Finance Corp., Sr. Unsec. Gtd. Global Notes, 8.75%, 03/01/18 | | | 7,000 | | | | 7,648 | |
| |
| Gap, Inc. (The), Sr. Unsec. Notes, 5.95%, 04/12/21 | | | 42,000 | | | | 40,162 | |
| |
| J. Crew Group, Inc., Sr. Unsec. Gtd. Global Notes, 8.13%, 03/01/19 | | | 10,000 | | | | 9,575 | |
| |
| Limited Brands Inc., Sr. Unsec. Gtd. Global Notes, 8.50%, 06/15/19 | | | 10,000 | | | | 11,800 | |
| |
| | | | | | | | 69,185 | |
| |
Apparel, Accessories & Luxury Goods–0.11%
| | | | |
| Hanesbrands Inc., Sr. Unsec. Gtd. Global Notes, 6.38%, 12/15/20 | | | 10,000 | | | | 10,225 | |
| |
| Jones Group/Appreal Group Holdings/Apparel Group USA/Footwear Accessories Retail, Sr. Unsec. Notes, 6.88%, 03/15/19 | | | 15,000 | | | | 13,575 | |
| |
| | | | | | | | | |
| | | | | | | | 23,800 | |
| |
Asset Management & Custody Banks–0.07%
| | | | |
DJO Finance LLC/Corp.,
Sr. Unsec. Gtd. Global Notes, 7.75%, 04/15/18 | | | 2,000 | | | | 1,530 | |
| |
Sr. Unsec. Gtd. Sub. Global Notes, 9.75%, 10/15/17 | | | 10,000 | | | | 7,800 | |
| |
First Data Corp., Sr. Sec. Gtd. Notes, 7.38%, 06/15/19(b) | | | 7,000 | | | | 6,615 | |
| |
| | | | | | | | | |
| | | | | | | | 15,945 | |
| |
| | | | | | | | | |
| | | | | | | | | |
See accompanying Notes to Financial Statements which are an integral part of the financial statements.
Invesco V.I. Diversified Income Fund
| | | | | | | | | |
| | | Principal
| | |
| | | Amount | | Value |
| |
Auto Parts & Equipment–0.21%
| | | | |
Allison Transmission Inc., Sr. Unsec. Gtd Notes, 7.13%, 05/15/19(b) | | $ | 12,000 | | | $ | 11,820 | |
| |
| American Axle & Manufacturing, Inc., Sr. Unsec. Gtd. Notes, 7.75%, 11/15/19 | | | 10,000 | | | | 9,850 | |
| |
| Dana Holding Corp., Sr. Unsec. Notes, 6.75%, 02/15/21 | | | 9,000 | | | | 9,247 | |
| |
| Tenneco Inc., Sr. Unsec. Gtd. Global Notes, 6.88%, 12/15/20 | | | 15,000 | | | | 15,525 | |
| |
| | | | | | | | 46,442 | |
| |
Automobile Manufacturers–0.04%
| | | | |
| Ford Motor Co., Sr. Unsec. Global Notes, 7.45%, 07/16/31 | | | 7,000 | | | | 8,400 | |
| |
Automotive Retail–0.49%
| | | | |
| Advance Auto Parts, Inc., Sr. Unsec. Gtd. Notes, 5.75%, 05/01/20 | | | 100,000 | | | | 110,107 | |
| |
Biotechnology–0.81%
| | | | |
| Gilead Sciences, Inc., Sr. Unsec. Notes, 5.65%, 12/01/41 | | | 160,000 | | | | 177,658 | |
| |
STHI Holding Corp., Sec. Gtd. Notes, 8.00%, 03/15/18(b) | | | 5,000 | | | | 5,162 | |
| |
| | | | | | | | 182,820 | |
| |
Brewers–1.02%
| | | | |
Anheuser-Busch InBev Worldwide Inc., Sr. Unsec. Gtd. Global Notes,
2.88%, 02/15/16 | | | 125,000 | | | | 132,507 | |
| |
| 4.13%, 01/15/15 | | | 90,000 | | | | 97,260 | |
| |
| | | | | | | | 229,767 | |
| |
Broadcasting–1.88%
| | | | |
| Allbritton Communications Co., Sr. Unsec. Global Notes, 8.00%, 05/15/18 | | | 20,000 | | | | 20,000 | |
| |
| Clear Channel Communications, Inc., Sr. Sec. Gtd. Global Notes, 9.00%, 03/01/21 | | | 12,000 | | | | 10,140 | |
| |
COX Communications Inc.,
Sr. Unsec. Global Notes, 5.45%, 12/15/14 | | | 95,000 | | | | 105,707 | |
| |
| Sr. Unsec. Notes, | | | | | | | | |
8.38%, 03/01/39(b) | | | 75,000 | | | | 100,094 | |
| |
9.38%, 01/15/19(b) | | | 140,000 | | | | 188,867 | |
| |
| | | | | | | | 424,808 | |
| |
Building Products–0.50%
| | | | |
| Associated Materials LLC, Sr. Sec. Gtd. Global Notes, 9.13%, 11/01/17 | | | 15,000 | | | | 13,312 | |
| |
Building Materials Corp. of America, Sr. Sec. Gtd. Notes, 7.50%,��03/15/20(b) | | | 25,000 | | | | 27,000 | |
| |
| Gibraltar Industries Inc., Series B, Sr. Unsec. Gtd. Sub. Global Notes, 8.00%, 12/01/15 | | | 15,000 | | | | 15,075 | |
| |
Nortek Inc., Sr. Unsec. Gtd. Notes, 8.50%, 04/15/21(b) | | | 32,000 | | | | 27,240 | |
| |
Roofing Supply Group LLC/Roofing Supply Finance Inc., Sr. Sec. Notes, 8.63%, 12/01/17(b) | | | 14,000 | | | | 14,315 | |
| |
USG Corp., Sr. Unsec. Gtd. Notes, 9.75%, 08/01/14(b) | | | 15,000 | | | | 15,300 | |
| |
| | | | | | | | 112,242 | |
| |
Cable & Satellite–2.49%
| | | | |
| DIRECTV Holdings LLC/ DIRECTV Financing Co., Inc., Sr. Unsec. Gtd. Global Notes, 7.63%, 05/15/16 | | | 350,000 | | | | 371,219 | |
| |
EH Holding Corp., Sr. Unsec. Gtd. Notes, 7.63%, 06/15/21(b) | | | 5,000 | | | | 5,269 | |
| |
| NBC Universal Media LLC, Sr. Unsec. Global Notes, | | | | | | | | |
| 2.10%, 04/01/14 | | | 35,000 | | | | 35,479 | |
| |
| 5.95%, 04/01/41 | | | 35,000 | | | | 41,838 | |
| |
Time Warner Cable, Inc.,
Sr. Unsec. Gtd. Global Notes, 6.75%, 07/01/18 | | | 55,000 | | | | 65,400 | |
| |
Sr. Unsec. Gtd. Notes, 5.00%, 02/01/20 | | | 38,000 | | | | 41,748 | |
| |
| | | | | | | | 560,953 | |
| |
Casinos & Gaming–0.47%
| | | | |
| Ameristar Casinos Inc., Sr. Unsec. Gtd. Global Notes, 7.50%, 04/15/21 | | | 12,000 | | | | 12,420 | |
| |
| Caesars Entertainment Operating Co. Inc., Sec. Gtd. Global Notes, 12.75%, 04/15/18 | | | 10,000 | | | | 8,000 | |
| |
CityCenter Holdings LLC/CityCenter Finance Corp., Sr. Sec. Gtd. PIK Notes, 10.75%, 01/15/17(b) | | | 7,277 | | | | 7,532 | |
| |
| MGM Resorts International, Sr. Unsec. Gtd. Global Notes, 6.63%, 07/15/15 | | | 25,000 | | | | 23,969 | |
| |
| Pinnacle Entertainment Inc., Sr. Unsec. Gtd. Global Notes, 8.63%, 08/01/17 | | | 5,000 | | | | 5,312 | |
| |
Seneca Gaming Corp., Sr. Unsec. Gtd. Notes, 8.25%, 12/01/18(b) | | | 8,000 | | | | 7,820 | |
| |
Snoqualmie Entertainment Authority, Sr. Sec. Notes, 9.13%, 02/01/15(b) | | | 15,000 | | | | 14,400 | |
| |
| Wynn Las Vegas LLC/Wynn Las Vegas Capital Corp., Sr. Sec. Gtd. First Mortgage Global Notes, 7.88%, 11/01/17 | | | 25,000 | | | | 27,484 | |
| |
| | | | | | | | 106,937 | |
| |
Coal & Consumable Fuels–0.11%
| | | | |
| CONSOL Energy Inc., Sr. Unsec. Gtd. Global Notes, 8.25%, 04/01/20 | | | 15,000 | | | | 16,650 | |
| |
Peabody Energy Corp., Sr. Unsec. Gtd. Notes, 6.00%, 11/15/18(b) | | | 7,000 | | | | 7,175 | |
| |
| | | | | | | | 23,825 | |
| |
Communications Equipment–0.06%
| | | | |
Avaya Inc., Sr. Sec. Gtd. Notes, 7.00%, 04/01/19(b) | | | 15,000 | | | | 14,625 | |
| |
Computer & Electronics Retail–0.04%
| | | | |
Rent-A-Center Inc., Sr. Unsec. Gtd Global Notes, 6.63%, 11/15/20 | | | 10,000 | | | | 10,100 | |
| |
| | | | | | | | | |
| | | | | | | | | |
See accompanying Notes to Financial Statements which are an integral part of the financial statements.
Invesco V.I. Diversified Income Fund
| | | | | | | | | |
| | | Principal
| | |
| | | Amount | | Value |
| |
Computer Hardware–0.02%
| | | | |
| SunGard Data Systems Inc., Sr. Unsec. Gtd. Global Notes, 7.38%, 11/15/18 | | $ | 5,000 | | | $ | 5,138 | |
| |
Computer Storage & Peripherals–0.05%
| | | | |
Seagate HDD Cayman, Sr. Unsec. Gtd. Notes, 7.75%, 12/15/18(b) | | | 10,000 | | | | 10,700 | |
| |
Construction & Engineering–0.17%
| | | | |
| Dycom Investments Inc., Sr. Unsec. Gtd. Sub. Global Notes, 7.13%, 01/15/21 | | | 12,000 | | | | 12,180 | |
| |
| MasTec, Inc., Sr. Unsec. Gtd. Global Notes, 7.63%, 02/01/17 | | | 3,000 | | | | 3,131 | |
| |
| Tutor Perini Corp., Sr. Unsec. Gtd. Global Notes, 7.63%, 11/01/18 | | | 25,000 | | | | 23,625 | |
| |
| | | | | | | | 38,936 | |
| |
Construction & Farm Machinery & Heavy Trucks–0.20%
| | | | |
Commercial Vehicle Group, Inc., Sr. Sec. Gtd. Notes, 7.88%, 04/15/19(b) | | | 8,000 | | | | 7,750 | |
| |
| Manitowoc Co. Inc. (The), Sr. Unsec. Gtd. Notes, 8.50%, 11/01/20 | | | 5,000 | | | | 5,250 | |
| |
| Navistar International Corp., Sr. Unsec. Gtd. Notes, 8.25%, 11/01/21 | | | 5,000 | | | | 5,325 | |
| |
| Titan International Inc., Sr. Sec. Gtd. Global Notes, 7.88%, 10/01/17 | | | 25,000 | | | | 26,125 | |
| |
| | | | | | | | 44,450 | |
| |
Construction Materials–0.49%
| | | | |
| CRH America Inc., Sr. Unsec. Gtd. Notes, 4.13%, 01/15/16 | | | 80,000 | | | | 80,228 | |
| |
| Ply Gem Industries Inc., Sr. Sec. Gtd. Global Notes, 8.25%, 02/15/18 | | | 15,000 | | | | 13,144 | |
| |
| Texas Industries Inc., Sr. Unsec. Gtd. Global Notes, 9.25%, 08/15/20 | | | 20,000 | | | | 18,000 | |
| |
| | | | | | | | 111,372 | |
| |
Consumer Finance–0.87%
| | | | |
| Ally Financial Inc., Sr. Unsec. Gtd. Global Notes, 8.00%, 11/01/31 | | | 40,000 | | | | 38,700 | |
| |
| Ford Motor Credit Co. LLC, Sr. Unsec. Notes, 8.00%, 12/15/16 | | | 20,000 | | | | 22,950 | |
| |
| National Money Mart Co. (Canada), Sr. Unsec. Gtd. Global Notes, 10.38%, 12/15/16 | | | 25,000 | | | | 26,813 | |
| |
SLM Corp.,
Sr. Unsec. Medium-Term Global Notes, 6.25%, 01/25/16 | | | 75,000 | | | | 73,455 | |
| |
Series A, Sr. Unsec. Medium-Term Notes, 5.00%, 10/01/13 | | | 35,000 | | | | 35,172 | |
| |
| | | | | | | | 197,090 | |
| |
Data Processing & Outsourced Services–0.07%
| | | | |
CoreLogic, Inc., Sr. Unsec. Gtd. Notes, 7.25%, 06/01/21(b) | | | 15,000 | | | | 14,400 | |
| |
Department Stores–0.05%
| | | | |
| Sears Holdings Corp., Sr. Sec. Gtd. Global Notes, 6.63%, 10/15/18 | | | 15,000 | | | | 11,475 | |
| |
Distillers & Vintners–0.74%
| | | | |
| Constellation Brands Inc., Sr. Unsec. Gtd. Global Notes, 7.25%, 05/15/17 | | | 10,000 | | | | 10,975 | |
| |
Pernod-Ricard S.A. (France), Sr. Unsec. Notes, 4.45%, 01/15/22(b) | | | 150,000 | | | | 155,537 | |
| |
| | | | | | | | 166,512 | |
| |
Diversified Banks–5.70%
| | | | |
| Abbey National Treasury Services PLC (United Kingdom), Sr. Unsec. Gtd. Global Notes, 2.88%, 04/25/14 | | | 25,000 | | | | 23,314 | |
| |
ABN Amro Bank N.V. (Netherlands), Sr. Unsec. Notes, 3.00%, 01/31/14(b) | | | 200,000 | | | | 200,263 | |
| |
| Bank of Nova Scotia (Canada), Sr. Unsec. Global Notes, 2.38%, 12/17/13 | | | 70,000 | | | | 71,950 | |
| |
HSBC Bank PLC (United Kingdom), Sr. Unsec. Notes, 4.13%, 08/12/20(b) | | | 235,000 | | | | 234,893 | |
| |
ING Bank N.V. (Netherlands), Unsec. Sub. Notes, 5.13%, 05/01/15(b) | | | 100,000 | | | | 93,761 | |
| |
Lloyds TSB Bank PLC (United Kingdom),
Sr. Unsec. Gtd. Global Notes, 4.88%, 01/21/16 | | | 55,000 | | | | 53,246 | |
| |
Sr. Unsec. Gtd. Medium-Term Notes, 4.38%, 01/12/15(b) | | | 145,000 | | | | 139,302 | |
| |
Royal Bank of Scotland PLC (The) (United Kingdom),
Sr. Unsec. Gtd. Global Notes, 4.88%, 03/16/15 | | | 130,000 | | | | 124,201 | |
| |
| Series 2, | | | | | | | | |
Sr. Unsec. Gtd. Global Notes, 3.40%, 08/23/13 | | | 75,000 | | | | 72,792 | |
| |
Societe Generale S.A. (France), Sr. Unsec. Notes, 2.50%, 01/15/14(b) | | | 130,000 | | | | 120,170 | |
| |
Standard Chartered PLC (United Kingdom), Sr. Unsec. Notes, 5.50%, 11/18/14(b) | | | 55,000 | | | | 59,304 | |
| |
VTB Bank OJSC Via VTB Capital S.A. (Luxembourg), Sr. Unsec. Loan Participation Notes, 6.55%, 10/13/20(b) | | | 100,000 | | | | 93,586 | |
| |
| | | | | | | | 1,286,782 | |
| |
Diversified Capital Markets–0.94%
| | | | |
| Credit Suisse AG (Switzerland), Sub. Global Notes, 5.40%, 01/14/20 | | | 115,000 | | | | 108,059 | |
| |
| UBS AG (Switzerland), Sr. Unsec. Medium-Term Global Notes, 5.75%, 04/25/18 | | | 100,000 | | | | 103,817 | |
| |
| | | | | | | | 211,876 | |
| |
Diversified Chemicals–0.07%
| | | | |
Huntsman International LLC,
Sr. Unsec. Gtd. Global Notes, 5.50%, 06/30/16 | | | 4,000 | | | | 3,950 | |
| |
Sr. Unsec. Gtd. Sub. Global Notes, 8.63%, 03/15/21 | | | 11,000 | | | | 11,715 | |
| |
| | | | | | | | 15,665 | |
| |
| | | | | | | | | |
| | | | | | | | | |
See accompanying Notes to Financial Statements which are an integral part of the financial statements.
Invesco V.I. Diversified Income Fund
| | | | | | | | | |
| | | Principal
| | |
| | | Amount | | Value |
| |
Diversified Metals & Mining–0.17%
| | | | |
| Freeport-McMoRan Copper & Gold Inc., Sr. Unsec. Notes, 8.38%, 04/01/17 | | $ | 35,000 | | | $ | 37,056 | |
| |
Midwest Vanadium Pty. Ltd. (Australia), Sr. Sec. Gtd. Mortgage Notes, 11.50%, 02/15/18(b) | | | 3,000 | | | | 2,206 | |
| |
| | | | | | | | 39,262 | |
| |
Diversified REIT’s–0.81%
| | | | |
Dexus Diversified Trust/Dexus Office Trust (Australia), Sr. Unsec. Gtd. Notes, 5.60%, 03/15/21(b) | | | 180,000 | | | | 183,574 | |
| |
Drug Retail–0.78%
| | | | |
CVS Pass Through Trust, Sr. Sec. Gtd. Mortgage Pass Through Ctfs., 5.77%, 01/10/33(b) | | | 171,280 | | | | 175,600 | |
| |
Electric Utilities–2.82%
| | | | |
DCP Midstream LLC, Sr. Unsec. Notes, 9.70%, 12/01/13(b) | | | 100,000 | | | | 113,629 | |
| |
9.75%, 03/15/19(b) | | | 55,000 | | | | 72,812 | |
| |
Enel Finance International N.V. (Luxembourg), Sr. Unsec. Gtd. Notes, 3.88%, 10/07/14(b) | | | 100,000 | | | | 97,232 | |
| |
| LSP Energy L.P./LSP Batesville Funding Corp. Series D, Sr. Sec. Bonds, 8.16%, 07/15/25 | | | 25,000 | | | | 20,750 | |
| |
| Ohio Power Co. Series M, Sr. Unsec. Notes, 5.38%, 10/01/21 | | | 180,000 | | | | 206,327 | |
| |
| PPL Electric Utilities Corp., Sec. First Mortgage Bonds, 6.25%, 05/15/39 | | | 45,000 | | | | 60,868 | |
| |
| Virginia Electric & Power Co., Sr. Unsec. Notes, 5.00%, 06/30/19 | | | 55,000 | | | | 63,561 | |
| |
| | | | | | | | 635,179 | |
| |
Electrical Components & Equipment–0.14%
| | | | |
| Belden Inc., Sr. Gtd. Sub. Global Notes, 9.25%, 06/15/19 | | | 25,000 | | | | 26,812 | |
| |
| Polypore International Inc., Sr. Unsec. Gtd. Global Notes, 7.50%, 11/15/17 | | | 5,000 | | | | 5,188 | |
| |
| | | | | | | | 32,000 | |
| |
Environmental & Facilities Services–0.65%
| | | | |
Waste Management, Inc., Sr. Unsec. Gtd. Notes, 4.60%, 03/01/21 | | | 70,000 | | | | 76,393 | |
| |
| 5.00%, 03/15/14 | | | 65,000 | | | | 69,955 | |
| |
| | | | | | | | 146,348 | |
| |
Forest Products–0.03%
| | | | |
Millar Western Forest Products Ltd. (Canada), Sr. Unsec. Notes, 8.50%, 04/01/21(b) | | | 10,000 | | | | 7,725 | |
| |
Gas Utilities–0.13%
| | | | |
| Ferrellgas L.P./Ferrellgas Finance Corp., Sr. Unsec. Global Notes, 6.50%, 05/01/21 | | | 10,000 | | | | 8,850 | |
| |
| Suburban Propane Partners, L.P./Suburban Energy Finance Corp., Sr. Unsec. Notes, 7.38%, 03/15/20 | | | 20,000 | | | | 20,900 | |
| |
| | | | | | | | 29,750 | |
| |
Gold–1.77%
| | | | |
| Barrick Gold Corp. (Canada), Sr. Unsec. Global Notes, 2.90%, 05/30/16 | | | 65,000 | | | | 67,123 | |
| |
Gold Fields Orogen Holding BVI Ltd. (Mali), Sr. Unsec. Gtd. Notes, 4.88%, 10/07/20(b) | | | 200,000 | | | | 178,664 | |
| |
Kinross Gold Corp. (Canada), Sr. Unsec. Gtd. Notes,
5.13%, 09/01/21(b) | | | 75,000 | | | | 74,715 | |
| |
6.88%, 09/01/41(b) | | | 75,000 | | | | 77,839 | |
| |
| | | | | | | | 398,341 | |
| |
Health Care Distributors–0.55%
| | | | |
| AmerisourceBergen Corp., Sr. Unsec. Gtd. Notes, 3.50%, 11/15/21 | | | 120,000 | | | | 124,246 | |
| |
Health Care Equipment–0.14%
| | | | |
| Boston Scientific Corp., Sr. Unsec. Notes, 4.50%, 01/15/15 | | | 30,000 | | | | 31,566 | |
| |
Health Care Facilities–0.31%
| | | | |
| HCA, Inc., Sr. Sec. Gtd. Global Notes, 7.88%, 02/15/20 | | | 13,000 | | | | 14,105 | |
| |
HealthSouth Corp., Sr. Unsec. Gtd. Notes,
7.25%, 10/01/18 | | | 15,000 | | | | 14,925 | |
| |
| 7.75%, 09/15/22 | | | 15,000 | | | | 14,812 | |
| |
| Tenet Healthcare Corp., Sr. Unsec. Global Notes, 9.25%, 02/01/15 | | | 25,000 | | | | 26,625 | |
| |
| | | | | | | | 70,467 | |
| |
Health Care Services–1.70%
| | | | |
| Express Scripts, Inc., Sr. Unsec. Gtd. Global Notes, 6.25%, 06/15/14 | | | 125,000 | | | | 136,321 | |
| |
Highmark, Inc., Sr. Unsec. Notes,
4.75%, 05/15/21(b) | | | 40,000 | | | | 40,983 | |
| |
6.13%, 05/15/41(b) | | | 35,000 | | | | 38,452 | |
| |
| Medco Health Solutions Inc., Sr. Unsec. Notes, 2.75%, 09/15/15 | | | 35,000 | | | | 35,195 | |
| |
Orlando Lutheran Towers Inc., Bonds, 8.00%, 07/01/12(d)(e) | | | 125,000 | | | | 127,909 | |
| |
| Universal Hospital Services Inc., Sec. Gtd. PIK Global Notes, 8.50%, 06/01/15 | | | 5,000 | | | | 5,081 | |
| |
| | | | | | | | 383,941 | |
| |
Health Care Technology–0.07%
| | | | |
| MedAssets Inc., Sr. Unsec. Gtd. Global Notes, 8.00%, 11/15/18 | | | 15,000 | | | | 14,775 | |
| |
Homebuilding–0.20%
| | | | |
Beazer Homes USA Inc., Sr. Unsec. Gtd. Global Notes,
6.88%, 07/15/15 | | | 7,000 | | | | 5,267 | |
| |
| 8.13%, 06/15/16 | | | 15,000 | | | | 11,175 | |
| |
| K. Hovnanian Enterprises Inc., Sr. Sec. Gtd. Global Notes, 10.63%, 10/15/16 | | | 24,000 | | | | 19,200 | |
| |
See accompanying Notes to Financial Statements which are an integral part of the financial statements.
Invesco V.I. Diversified Income Fund
| | | | | | | | | |
| | | Principal
| | |
| | | Amount | | Value |
| |
Homebuilding–(continued)
| | | | |
| | | | | | | | | |
| Lennar Corp., Sr. Unsec. Gtd. Global Notes, 6.95%, 06/01/18 | | $ | 9,000 | | | $ | 8,775 | |
| |
| M/I Homes Inc., Sr. Unsec. Gtd. Global Notes, 8.63%, 11/15/18 | | | 2,000 | | | | 1,775 | |
| |
| | | | | | | | 46,192 | |
| |
Home Furnishings–0.04%
| | | | |
American Standard Americas, Sr. Sec. Notes, 10.75%, 01/15/16(b) | | | 15,000 | | | | 8,925 | |
| |
Hotels, Resorts & Cruise Lines–1.57%
| | | | |
Hyatt Hotels Corp., Sr. Unsec. Notes, 5.75%, 08/15/15(b) | | | 165,000 | | | | 177,656 | |
| |
| Royal Caribbean Cruises Ltd., Sr. Unsec. Global Notes, 7.50%, 10/15/27 | | | 10,000 | | | | 9,825 | |
| |
Wyndham Worldwide Corp., Sr. Unsec. Notes,
7.38%, 03/01/20 | | | 55,000 | | | | 62,734 | |
| |
| 5.63%, 03/01/21 | | | 100,000 | | | | 103,500 | |
| |
| | | | | | | | 353,715 | |
| |
Household Products–0.11%
| | | | |
| Central Garden & Pet Co., Sr. Gtd. Sub. Notes, 8.25%, 03/01/18 | | | 25,000 | | | | 24,688 | |
| |
Housewares & Specialties–0.02%
| | | | |
| American Greetings Corp., Sr. Unsec. Gtd. Notes, 7.38%, 12/01/21 | | | 5,000 | | | | 5,069 | |
| |
Independent Power Producers & Energy Traders–0.14%
| | | | |
| AES Corp. (The), Sr. Unsec. Global Notes, 8.00%, 10/15/17 | | | 25,000 | | | | 27,500 | |
| |
Calpine Corp., Sr. Sec. Notes, 7.25%, 10/15/17(b) | | | 5,000 | | | | 5,225 | |
| |
| | | | | | | | 32,725 | |
| |
Industrial Conglomerates–1.80%
| | | | |
Hutchison Whampoa International Ltd. (Hong Kong),
Sr. Unsec. Gtd. Notes, 7.63%, 04/09/19(b) | | | 130,000 | | | | 158,847 | |
| |
Unsec. Gtd. Notes, 5.75%, 09/11/19(b) | | | 100,000 | | | | 111,580 | |
| |
Hutchison Whampoa International Ltd. (Hong Kong), Unsec. Gtd. Sub. Notes, 6.00%(b)(f) | | | 135,000 | | | | 135,337 | |
| |
| | | | | | | | 405,764 | |
| |
Industrial Machinery–0.73%
| | | | |
Cleaver-Brooks Inc., Sr. Sec. Notes, 12.25%, 05/01/16(b) | | | 10,000 | | | | 10,100 | |
| |
| Pentair, Inc., Sr. Unsec. Gtd. Notes, 5.00%, 05/15/21 | | | 145,000 | | | | 154,157 | |
| |
| | | | | | | | 164,257 | |
| |
Industrial REIT’s–0.07%
| | | | |
| DuPont Fabros Technology L.P., Sr. Unsec. Gtd. Global Notes, 8.50%, 12/15/17 | | | 15,000 | | | | 16,163 | |
| |
Insurance Brokers–0.59%
| | | | |
| Marsh & McLennan Cos. Inc., Sr. Unsec. Notes, 9.25%, 04/15/19 | | | 100,000 | | | | 132,552 | |
| |
Integrated Oil & Gas–0.19%
| | | | |
| Petrobras International Finance Co. (Brazil), Sr. Unsec. Gtd. Global Notes, 5.38%, 01/27/21 | | | 40,000 | | | | 42,162 | |
| |
Integrated Telecommunication Services–1.78%
| | | | |
AT&T Inc., Sr. Unsec. Global Notes,
2.50%, 08/15/15 | | | 60,000 | | | | 62,227 | |
| |
| 2.95%, 05/15/16 | | | 35,000 | | | | 36,772 | |
| |
| 4.45%, 05/15/21 | | | 15,000 | | | | 16,556 | |
| |
Integra Telecom Holdings Inc., Sr. Sec. Notes, 10.75%, 04/15/16(b) | | | 5,000 | | | | 4,050 | |
| |
| Telefonica Emisiones S.A. Unipersonal (Spain), Sr. Unsec. Gtd. Global Notes, 5.46%, 02/16/21 | | | 90,000 | | | | 86,214 | |
| |
Telemar Norte Leste S.A. (Brazil), Sr. Unsec. Notes, 5.50%, 10/23/20(b) | | | 161,000 | | | | 159,954 | |
| |
| Verizon Communications, Inc., Sr. Unsec. Global Notes, 4.75%, 11/01/41 | | | 30,000 | | | | 32,566 | |
| |
Windstream Corp., Sr. Unsec. Gtd. Notes, 7.50%, 06/01/22(b) | | | 2,000 | | | | 2,010 | |
| |
| | | | | | | | 400,349 | |
| |
Internet Retail–0.20%
| | | | |
| Expedia Inc., Sr. Unsec. Gtd. Global Notes, 5.95%, 08/15/20 | | | 45,000 | | | | 45,516 | |
| |
Internet Software & Services–0.07%
| | | | |
| Equinix Inc., Sr. Unsec. Notes, 8.13%, 03/01/18 | | | 15,000 | | | | 16,575 | |
| |
Investment Banking & Brokerage–5.28%
| | | | |
Cantor Fitzgerald L.P., Bonds, 7.88%, 10/15/19(b) | | | 160,000 | | | | 160,559 | |
| |
Goldman Sachs Group, Inc. (The),
Sr. Unsec. Global Notes,
5.13%, 01/15/15 | | | 50,000 | | | | 51,101 | |
| |
| 3.70%, 08/01/15 | | | 45,000 | | | | 44,089 | |
| |
| 3.63%, 02/07/16 | | | 30,000 | | | | 28,995 | |
| |
| 5.25%, 07/27/21 | | | 55,000 | | | | 53,895 | |
| |
Unsec. Sub. Global Notes, 6.75%, 10/01/37 | | | 140,000 | | | | 131,650 | |
| |
| Jefferies Group Inc., Sr. Unsec. Notes, 6.45%, 06/08/27 | | | 80,000 | | | | 66,700 | |
| |
Macquarie Group Ltd. (Australia), Sr. Unsec. Notes,
7.30%, 08/01/14(b) | | | 110,000 | | | | 116,543 | |
| |
6.00%, 01/14/20(b) | | | 105,000 | | | | 99,118 | |
| |
Morgan Stanley,
Sr. Unsec. Global Notes, 6.00%, 05/13/14 | | | 230,000 | | | | 233,476 | |
| |
Series F, Sr. Unsec. Medium-Term Global Notes, 5.63%, 09/23/19 | | | 130,000 | | | | 120,122 | |
| |
See accompanying Notes to Financial Statements which are an integral part of the financial statements.
Invesco V.I. Diversified Income Fund
| | | | | | | | | |
| | | Principal
| | |
| | | Amount | | Value |
| |
Investment Banking & Brokerage–(continued)
| | | | |
| | | | | | | | | |
| Raymond James Financial, Inc., Sr. Unsec. Notes, 4.25%, 04/15/16 | | $ | 35,000 | | | $ | 35,857 | |
| |
| Schwab Capital Trust I, Jr. Unsec. Gtd. Sub. Notes, 7.50%, 11/15/37 | | | 50,000 | | | | 49,937 | |
| |
| | | | | | | | 1,192,042 | |
| |
Leisure Facilities–0.02%
| | | | |
| Speedway Motorsports Inc., Sr. Unsec. Gtd. Global Notes, 6.75%, 02/01/19 | | | 5,000 | | | | 5,075 | |
| |
Leisure Products–0.05%
| | | | |
Toys R US-Delaware Inc., Sr. Sec. Gtd. Notes, 7.38%, 09/01/16(b) | | | 12,000 | | | | 12,180 | |
| |
Life & Health Insurance–2.14%
| | | | |
| MetLife Inc., Sr. Unsec. Notes, 6.75%, 06/01/16 | | | 55,000 | | | | 63,558 | |
| |
Nationwide Financial Services, Inc., Sr. Unsec. Notes, 5.38%, 03/25/21(b) | | | 165,000 | | | | 163,841 | |
| |
Prudential Financial, Inc.,
Jr. Unsec. Sub. Global Notes, 8.88%, 06/15/38 | | | 130,000 | | | | 148,850 | |
| |
Series D,
Sr. Unsec. Medium-Term Notes, 7.38%, 06/15/19 | | | 90,000 | | | | 107,223 | |
| |
| | | | | | | | 483,472 | |
| |
Life Sciences Tools & Services–0.87%
| | | | |
| Life Technologies Corp., Sr. Notes, 6.00%, 03/01/20 | | | 120,000 | | | | 134,412 | |
| |
Patheon Inc. (Canada), Sr. Sec. Gtd. Notes, 8.63%, 04/15/17(b) | | | 25,000 | | | | 20,250 | |
| |
| PerkinElmer, Inc., Sr. Unsec. Notes, 5.00%, 11/15/21 | | | 40,000 | | | | 40,535 | |
| |
| | | | | | | | 195,197 | |
| |
Managed Health Care–1.81%
| | | | |
Cigna Corp., Sr. Unsec. Global Notes, 2.75%, 11/15/16 | | | 60,000 | | | | 59,981 | |
| |
Cigna Corp.,
Sr. Unsec. Global Notes, 5.38%, 02/15/42 | | | 85,000 | | | | 85,495 | |
| |
| Sr. Unsec. Notes, | | | | | | | | |
| 4.50%, 03/15/21 | | | 45,000 | | | | 46,275 | |
| |
| 5.88%, 03/15/41 | | | 35,000 | | | | 37,335 | |
| |
UnitedHealth Group Inc., Sr. Unsec. Notes,
3.88%, 10/15/20 | | | 60,000 | | | | 63,951 | |
| |
| 5.95%, 02/15/41 | | | 60,000 | | | | 74,116 | |
| |
| WellPoint, Inc., Sr. Unsec. Global Notes, 3.70%, 08/15/21 | | | 40,000 | | | | 40,881 | |
| |
| | | | | | | | 408,034 | |
| |
Mortgage Backed Securities–0.39%
| | | | |
| U.S. Bank N.A., Sr. Unsec. Medium-Term Notes, 5.92%, 05/25/12 | | | 85,881 | | | | 87,599 | |
| |
Movies & Entertainment–0.43%
| | | | |
| AMC Entertainment Inc., Sr. Unsec. Gtd. Global Notes, 8.75%, 06/01/19 | | | 25,000 | | | | 25,969 | |
| |
NAI Entertainment Holdings LLC, Sr. Sec. Notes, 8.25%, 12/15/17(b) | | | 15,000 | | | | 15,956 | |
| |
| Time Warner, Inc., Sr. Unsec. Gtd. Global Notes, 5.38%, 10/15/41 | | | 50,000 | | | | 54,197 | |
| |
| | | | | | | | 96,122 | |
| |
Multi-Line Insurance–2.01%
| | | | |
| American Financial Group, Inc., Sr. Unsec. Notes, 9.88%, 06/15/19 | | | 180,000 | | | | 211,499 | |
| |
| Hartford Financial Services Group Inc., Jr. Unsec. Sub. Deb., 8.13%, 06/15/38 | | | 10,000 | | | | 9,950 | |
| |
Health Care Service Corp., Sr. Unsec. Notes, 4.70%, 01/15/21(b) | | | 55,000 | | | | 59,726 | |
| |
Liberty Mutual Group Inc.,
Jr. Unsec. Gtd. Sub. Bonds, (Acquired 03/21/11; | | | | | | | | |
Cost $15,112) 7.80%, 03/15/37(b) | | | 15,000 | | | | 13,462 | |
| |
Sr. Unsec. Gtd. Notes, 5.00%, 06/01/21(b) | | | 50,000 | | | | 48,281 | |
| |
Sr. Unsec. Notes, 5.75%, 03/15/14(b) | | | 100,000 | | | | 104,675 | |
| |
Nationwide Mutual Insurance Co., Unsec. Sub. Notes, 9.38%, 08/15/39(b) | | | 5,000 | | | | 6,030 | |
| |
| | | | | | | | 453,623 | |
| |
Office Services & Supplies–0.11%
| | | | |
| IKON Office Solutions, Inc., Sr. Unsec. Notes, 6.75%, 12/01/25 | | | 25,000 | | | | 24,438 | |
| |
Oil & Gas Drilling–0.18%
| | | | |
| Transocean Inc., Sr. Unsec. Gtd. Global Notes, 4.95%, 11/15/15 | | | 40,000 | | | | 40,813 | |
| |
Oil & Gas Equipment & Services–0.13%
| | | | |
| Bristow Group, Inc., Sr. Unsec. Gtd. Global Notes, 7.50%, 09/15/17 | | | 14,000 | | | | 14,490 | |
| |
| Key Energy Services, Inc., Sr. Unsec. Gtd. Notes, 6.75%, 03/01/21 | | | 15,000 | | | | 15,075 | |
| |
| | | | | | | | 29,565 | |
| |
Oil & Gas Exploration & Production–2.25%
| | | | |
Anadarko Petroleum Corp.,
Sr. Unsec. Global Notes, 5.75%, 06/15/14 | | | 95,000 | | | | 102,601 | |
| |
Sr. Unsec. Notes, 7.63%, 03/15/14 | | | 15,000 | | | | 16,714 | |
| |
| Chaparral Energy Inc., Sr. Unsec. Gtd. Global Notes, 8.25%, 09/01/21 | | | 13,000 | | | | 13,227 | |
| |
Chesapeake Energy Corp., Sr. Unsec. Gtd. Notes,
6.13%, 02/15/21 | | | 5,000 | | | | 5,144 | |
| |
| 6.63%, 08/15/20 | | | 8,000 | | | | 8,570 | |
| |
| Cimarex Energy Co., Sr. Unsec. Gtd. Notes, 7.13%, 05/01/17 | | | 10,000 | | | | 10,487 | |
| |
| Continental Resources Inc., Sr. Unsec. Gtd. Global Notes, 8.25%, 10/01/19 | | | 15,000 | | | | 16,556 | |
| |
See accompanying Notes to Financial Statements which are an integral part of the financial statements.
Invesco V.I. Diversified Income Fund
| | | | | | | | | |
| | | Principal
| | |
| | | Amount | | Value |
| |
Oil & Gas Exploration & Production–(continued)
| | | | |
| | | | | | | | | |
| EOG Resources, Inc., Sr. Unsec. Notes, 4.10%, 02/01/21 | | $ | 45,000 | | | $ | 49,432 | |
| |
| EXCO Resources Inc., Sr. Unsec. Gtd. Notes, 7.50%, 09/15/18 | | | 5,000 | | | | 4,750 | |
| |
| Forest Oil Corp., Sr. Unsec. Gtd. Global Notes, 7.25%, 06/15/19 | | | 2,000 | | | | 2,020 | |
| |
| McMoRan Exploration Co., Sr. Unsec. Gtd. Notes, 11.88%, 11/15/14 | | | 12,000 | | | | 12,810 | |
| |
| Newfield Exploration Co., Sr. Unsec. Sub. Global Notes, 7.13%, 05/15/18 | | | 13,000 | | | | 13,747 | |
| |
| Pemex Project Funding Master Trust, Sr. Unsec. Gtd. Global Bonds, 6.63%, 06/15/35 | | | 65,000 | | | | 74,172 | |
| |
| Petrobras International Finance Co. (Brazil), Sr. Unsec. Gtd. Global Notes, 6.88%, 01/20/40 | | | 45,000 | | | | 51,672 | |
| |
| Petroleos Mexicanos (Mexico), Sr. Unsec. Gtd. Global Notes, 5.50%, 01/21/21 | | | 65,000 | | | | 70,609 | |
| |
| Plains Exploration & Production Co., Sr. Unsec. Gtd. Notes, 8.63%, 10/15/19 | | | 15,000 | | | | 16,537 | |
| |
| Range Resources Corp., Sr. Unsec. Gtd. Sub. Notes, 5.75%, 06/01/21 | | | 10,000 | | | | 10,775 | |
| |
SM Energy Co., Sr. Unsec. Notes, 6.63%, 02/15/19(b) | | | 10,000 | | | | 10,350 | |
| |
6.50%, 11/15/21(b) | | | 2,000 | | | | 2,070 | |
| |
| Whiting Petroleum Corp., Sr. Unsec. Gtd. Sub. Notes, 6.50%, 10/01/18 | | | 10,000 | | | | 10,463 | |
| |
WPX Energy Inc., Sr. Unsec. Notes, 6.00%, 01/15/22(b) | | | 5,000 | | | | 5,138 | |
| |
| | | | | | | | 507,844 | |
| |
Oil & Gas Refining & Marketing–0.56%
| | | | |
Petronas Capital Ltd. (Malaysia), Unsec. Gtd. Unsub. Notes, 5.25%, 08/12/19(b) | | | 100,000 | | | | 112,414 | |
| |
| United Refining Co., Sr. Sec. Gtd. Global Notes, 10.50%, 02/28/18 | | | 15,000 | | | | 14,100 | |
| |
| | | | | | | | 126,514 | |
| |
Oil & Gas Storage & Transportation–2.45%
| | | | |
Atlas Pipeline Partners L.P./Atlas Pipeline Finance Corp., Sr. Unsec. Gtd. Notes, 8.75%, 06/15/18(b) | | | 6,000 | | | | 6,345 | |
| |
Chesapeake Midstream Partners L.P./CHKM Finance Corp., Sr. Unsec. Gtd. Notes, 5.88%, 04/15/21(b) | | | 9,000 | | | | 9,090 | |
| |
| Copano Energy LLC/Copano Energy Finance Corp., Sr. Unsec. Gtd. Notes, 7.13%, 04/01/21 | | | 15,000 | | | | 15,225 | |
| |
| Energy Transfer Equity L.P., Sr. Sec. Gtd. Notes, 7.50%, 10/15/20 | | | 10,000 | | | | 10,863 | |
| |
| Energy Transfer Partners L.P., Sr. Unsec. Global Notes, 6.05%, 06/01/41 | | | 115,000 | | | | 113,711 | |
| |
| Enterprise Products Operating LLC, Sr. Unsec. Gtd. Notes, 6.45%, 09/01/40 | | | 70,000 | | | | 82,145 | |
| |
| Inergy L.P./Inergy Finance Corp., Sr. Unsec. Gtd. Global Notes, 6.88%, 08/01/21 | | | 7,000 | | | | 7,088 | |
| |
MarkWest Energy Partners L.P./MarkWest Energy Finance Corp., Sr. Unsec. Gtd. Notes,
6.25%, 06/15/22 | | | 5,000 | | | | 5,250 | |
| |
| 6.50%, 08/15/21 | | | 15,000 | | | | 15,712 | |
| |
| Overseas Shipholding Group, Inc., Sr. Unsec. Notes, 8.13%, 03/30/18 | | | 25,000 | | | | 15,312 | |
| |
| Regency Energy Partners L.P./Regency Energy Finance Corp., Sr. Unsec. Gtd. Notes, 6.88%, 12/01/18 | | | 5,000 | | | | 5,319 | |
| |
| Spectra Energy Capital LLC, Sr. Unsec. Gtd. Notes, 5.65%, 03/01/20 | | | 155,000 | | | | 172,050 | |
| |
Targa Resources Partners L.P./Targa Resouces Partners Finance Corp., Sr. Unsec. Gtd. Notes, 6.88%, 02/01/21(b) | | | 15,000 | | | | 15,262 | |
| |
| Williams Partners L.P., Sr. Unsec. Global Notes, 3.80%, 02/15/15 | | | 75,000 | | | | 78,809 | |
| |
| | | | | | | | 552,181 | |
| |
Other Diversified Financial Services–8.89%
| | | | |
Bank of America Corp.,
Sr. Unsec. Global Notes, | | | | | | | | |
| 3.70%, 09/01/15 | | | 25,000 | | | | 23,352 | |
| |
| 4.50%, 04/01/15 | | | 240,000 | | | | 232,185 | |
| |
| 6.50%, 08/01/16 | | | 130,000 | | | | 131,543 | |
| |
Sr. Unsec. Notes, 5.88%, 01/05/21 | | | 35,000 | | | | 33,237 | |
| |
Citigroup Inc.,
Sr. Unsec. Global Notes, | | | | | | | | |
| 4.50%, 01/14/22 | | | 70,000 | | | | 67,330 | |
| |
| 6.01%, 01/15/15 | | | 150,000 | | | | 157,335 | |
| |
Sr. Unsec. Notes, 6.38%, 08/12/14 | | | 255,000 | | | | 267,991 | |
| |
| Countrywide Financial Corp., Sr. Unsec. Gtd. Medium-Term Global Notes, 5.80%, 06/07/12 | | | 10,000 | | | | 10,033 | |
| |
ERAC USA Finance LLC, Unsec. Gtd. Notes, 5.80%, 10/15/12(b) | | | 105,000 | | | | 108,656 | |
| |
Football Trust V, Sec. Pass Through Ctfs., 5.35%, 10/05/20(b) | | | 100,000 | | | | 111,748 | |
| |
| General Electric Capital Corp. Series A, Sr. Unsec. Medium-Term Global Notes, 6.88%, 01/10/39 | | | 60,000 | | | | 71,840 | |
| |
International Lease Finance Corp.,
Sr. Sec. Notes, 6.50%, 09/01/14(b) | | | 115,000 | | | | 118,162 | |
| |
| Sr. Unsec. Global Notes, | | | | | | | | |
| 8.63%, 09/15/15 | | | 10,000 | | | | 10,240 | |
| |
| 8.75%, 03/15/17 | | | 27,000 | | | | 27,928 | |
| |
Sr. Unsec. Notes, 8.25%, 12/15/20 | | | 10,000 | | | | 10,131 | |
| |
| JPMorgan Chase & Co., Sr. Unsec. Global Notes, | | | | | | | | |
| 3.15%, 07/05/16 | | | 35,000 | | | | 35,236 | |
| |
| 3.45%, 03/01/16 | | | 25,000 | | | | 25,382 | |
| |
| 4.75%, 05/01/13 | | | 15,000 | | | | 15,691 | |
| |
| 5.40%, 01/06/42 | | | 80,000 | | | | 82,677 | |
| |
| 5.60%, 07/15/41 | | | 95,000 | | | | 102,536 | |
| |
See accompanying Notes to Financial Statements which are an integral part of the financial statements.
Invesco V.I. Diversified Income Fund
| | | | | | | | | |
| | | Principal
| | |
| | | Amount | | Value |
| |
Other Diversified Financial Services–(continued)
| | | | |
| | | | | | | | | |
| JPMorgan Chase Capital XXVII, Series AA, Jr. Unsec. Ltd. Gtd. Sub. Notes, 7.00%, 11/01/39 | | $ | 160,000 | | | $ | 161,373 | |
| |
| Merrill Lynch & Co. Inc., Series C, Sr. Unsec. Medium-Term Global Notes, 5.45%, 02/05/13 | | | 200,000 | | | | 201,612 | |
| |
Twin Reefs Pass-Through Trust, Sec. Pass Through Ctfs., 1.39%, (Acquired 12/07/04-04/03/06; Cost $130,332)(b)(c)(e)(f) | | | 130,000 | | | | — | |
| |
| | | | | | | | 2,006,218 | |
| |
Packaged Foods & Meats–1.83%
| | | | |
| Del Monte Foods Co., Sr. Unsec. Gtd. Global Notes, 7.63%, 02/15/19 | | | 5,000 | | | | 4,838 | |
| |
| JM Smucker Co. (The), Sr. Unsec. Gtd. Global Notes., 3.50%, 10/15/21 | | | 265,000 | | | | 272,067 | |
| |
| Kraft Foods Inc., Sr. Unsec. Global Notes, | | | | | | | | |
| 2.63%, 05/08/13 | | | 70,000 | | | | 71,429 | |
| |
| 6.50%, 02/09/40 | | | 50,000 | | | | 64,488 | |
| |
| | | | | | | | 412,822 | |
| |
Paper Packaging–0.04%
| | | | |
| Cascades Inc. (Canada), Sr. Unsec. Gtd. Global Notes, 7.88%, 01/15/20 | | | 10,000 | | | | 9,775 | |
| |
Paper Products–0.59%
| | | | |
| Boise Cascade LLC, Sr. Unsec. Gtd. Sub. Global Notes, 7.13%, 10/15/14 | | | 17,000 | | | | 16,915 | |
| |
| Clearwater Paper Corp., Sr. Unsec. Gtd. Global Notes, 7.13%, 11/01/18 | | | 5,000 | | | | 5,212 | |
| |
International Paper Co., Sr. Unsec. Global Notes,
4.75%, 02/15/22 | | | 35,000 | | | | 37,314 | |
| |
| 6.00%, 11/15/41 | | | 40,000 | | | | 43,613 | |
| |
| Mercer International Inc., Sr. Unsec. Gtd. Global Notes, 9.50%, 12/01/17 | | | 10,000 | | | | 10,275 | |
| |
NewPage Corp., Sr. Sec. Gtd. Global Notes, 11.38%, 12/31/14(c) | | | 7,000 | | | | 5,198 | |
| |
| P.H. Glatfelter Co., Sr. Unsec. Gtd. Global Notes, 7.13%, 05/01/16 | | | 15,000 | | | | 15,544 | |
| |
| | | | | | | | 134,071 | |
| |
Pharmaceuticals–0.12%
| | | | |
Mylan Inc., Sr. Unsec. Gtd. Notes, 6.00%, 11/15/18(b) | | | 5,000 | | | | 5,163 | |
| |
| NBTY Inc., Sr. Unsec. Gtd. Global Notes, 9.00%, 10/01/18 | | | 10,000 | | | | 11,000 | |
| |
Valeant Pharmaceuticals International (Canada), Sr. Unsec. Gtd. Notes, 6.75%, 10/01/17(b) | | | 10,000 | | | | 10,000 | |
| |
| | | | | | | | 26,163 | |
| |
Property & Casualty Insurance–1.00%
| | | | |
| CNA Financial Corp., Sr. Unsec. Notes, 7.35%, 11/15/19 | | | 160,000 | | | | 178,591 | |
| |
| W.R. Berkley Corp., Sr. Unsec. Notes, 7.38%, 09/15/19 | | | 40,000 | | | | 46,673 | |
| |
| | | | | | | | 225,264 | |
| |
Railroads–1.01%
| | | | |
| Canadian Pacific Railway Co. (Canada), Sr. Unsec. Notes, 4.45%, 03/15/23 | | | 20,000 | | | | 20,254 | |
| |
| CSX Corp., Sr. Unsec. Notes, 5.50%, 04/15/41 | | | 55,000 | | | | 62,234 | |
| |
| Union Pacific Corp., Sr. Unsec. Notes, 4.00%, 02/01/21 | | | 135,000 | | | | 145,663 | |
| |
| | | | | | | | 228,151 | |
| |
Real Estate Services–0.02%
| | | | |
| CB Richard Ellis Services Inc., Sr. Unsec. Gtd. Global Notes, 6.63%, 10/15/20 | | | 5,000 | | | | 5,163 | |
| |
Regional Banks–1.72%
| | | | |
| BB&T Capital Trust II, Jr. Unsec. Gtd. Sub. Global Capital Securities, 6.75%, 06/07/36 | | | 5,000 | | | | 4,995 | |
| |
CIT Group Inc., Sec. Gtd. Bonds, 7.00%, 05/02/17(b) | | | 20,000 | | | | 20,050 | |
| |
| PNC Funding Corp., Sr. Unsec. Gtd. Global Notes, 3.63%, 02/08/15 | | | 110,000 | | | | 116,028 | |
| |
PNC Preferred Funding Trust III, Jr. Sub. Notes, 8.70%(b)(f) | | | 200,000 | | | | 204,500 | |
| |
| Regions Financial Corp., Unsec. Sub. Notes, 7.38%, 12/10/37 | | | 30,000 | | | | 24,825 | |
| |
| Synovus Financial Corp., Unsec. Sub. Global Notes, 5.13%, 06/15/17 | | | 20,000 | | | | 17,050 | |
| |
| | | | | | | | 387,448 | |
| |
Research & Consulting Services–0.05%
| | | | |
| FTI Consulting Inc., Sr. Unsec. Gtd. Global Notes, 6.75%, 10/01/20 | | | 10,000 | | | | 10,475 | |
| |
Restaurants–1.00%
| | | | |
| Yum! Brands, Inc., Sr. Unsec. Notes, 5.30%, 09/15/19 | | | 200,000 | | | | 224,956 | |
| |
Semiconductor Equipment–0.20%
| | | | |
| Amkor Technology Inc., Sr. Unsec. Global Notes, 7.38%, 05/01/18 | | | 25,000 | | | | 25,625 | |
| |
Sensata Technologies B.V. (Netherlands), Sr. Unsec. Gtd. Notes, 6.50%, 05/15/19(b) | | | 20,000 | | | | 19,950 | |
| |
| | | | | | | | 45,575 | |
| |
Semiconductors–0.12%
| | | | |
Freescale Semiconductor Inc., Sr. Sec. Gtd. Notes, 9.25%, 04/15/18(b) | | | 25,000 | | | | 26,812 | |
| |
Sovereign Debt–0.77%
| | | | |
| Mexico Government International Bond (Mexico), Series A, Sr. Unsec. Medium-Term Global Notes, 6.05%, 01/11/40 | | | 60,000 | | | | 73,500 | |
| |
Russian Foreign Bond (Russia), Sr. Unsec. Euro Bonds, 3.63%, 04/29/15(b) | | | 100,000 | | | | 100,750 | |
| |
| | | | | | | | 174,250 | |
| |
| | | | | | | | | |
| | | | | | | | | |
See accompanying Notes to Financial Statements which are an integral part of the financial statements.
Invesco V.I. Diversified Income Fund
| | | | | | | | | |
| | | Principal
| | |
| | | Amount | | Value |
| |
Specialized Finance–1.11%
| | | | |
| Moody’s Corp., Sr. Unsec. Notes, 5.50%, 09/01/20 | | $ | 110,000 | | | $ | 115,543 | |
| |
National Rural Utilities Cooperative Finance Corp., Sr. Sec. Collateral Trust Bonds, 3.05%, 03/01/16 | | | 70,000 | | | | 73,883 | |
| |
Sr. Sec. Collateral Trust Notes, 2.63%, 09/16/12 | | | 60,000 | | | | 60,741 | |
| |
| | | | | | | | 250,167 | |
| |
Specialized REIT’s–2.05%
| | | | |
| Entertainment Properties Trust, Sr. Unsec. Gtd. Global Notes, 7.75%, 07/15/20 | | | 245,000 | | | | 261,049 | |
| |
| HCP, Inc., Sr. Unsec. Notes, 3.75%, 02/01/16 | | | 25,000 | | | | 25,507 | |
| |
| Host Hotels & Resorts L.P., Sr. Gtd. Global Notes, 6.00%, 11/01/20 | | | 10,000 | | | | 10,250 | |
| |
| Omega Healthcare Investors, Inc., Sr. Unsec. Gtd. Global Notes, 6.75%, 10/15/22 | | | 5,000 | | | | 5,019 | |
| |
| Senior Housing Properties Trust, Sr. Unsec. Notes, 4.30%, 01/15/16 | | | 75,000 | | | | 73,641 | |
| |
| Ventas Realty L.P./Ventas Capital Corp., Sr. Unsec. Gtd. Notes, 4.75%, 06/01/21 | | | 90,000 | | | | 87,321 | |
| |
| | | | | | | | 462,787 | |
| |
Specialty Chemicals–0.07%
| | | | |
| PolyOne Corp., Sr. Unsec. Notes, 7.38%, 09/15/20 | | | 15,000 | | | | 15,525 | |
| |
Specialty Stores–0.17%
| | | | |
| Michaels Stores Inc., Sr. Unsec. Gtd. Global Notes, 7.75%, 11/01/18 | | | 10,000 | | | | 10,200 | |
| |
| Staples Inc., Sr. Unsec. Gtd. Global Notes, 9.75%, 01/15/14 | | | 25,000 | | | | 28,500 | |
| |
| | | | | | | | 38,700 | |
| |
Steel–1.81%
| | | | |
ArcelorMittal S.A. (Luxembourg), Sr. Unsec. Global Notes,
5.50%, 03/01/21 | | | 10,000 | | | | 9,203 | |
| |
| 6.13%, 06/01/18 | | | 55,000 | | | | 55,990 | |
| |
| 6.75%, 03/01/41 | | | 10,000 | | | | 9,004 | |
| |
| 7.00%, 10/15/39 | | | 195,000 | | | | 181,024 | |
| |
FMG Resources Pty. Ltd. (Australia), Sr. Unsec. Gtd. Notes,
6.38%, 02/01/16(b) | | | 7,000 | | | | 6,808 | |
| |
7.00%, 11/01/15(b) | | | 7,000 | | | | 7,105 | |
| |
| United States Steel Corp., Sr. Unsec. Notes, 7.00%, 02/01/18 | | | 6,000 | | | | 5,970 | |
| |
Vale Overseas Ltd. (Brazil), Sr. Unsec. Gtd. Global Notes,
4.63%, 09/15/20 | | | 55,000 | | | | 57,061 | |
| |
| 6.88%, 11/10/39 | | | 65,000 | | | | 75,003 | |
| |
| | | | | | | | 407,168 | |
| |
Systems Software–0.08%
| | | | |
Allen Systems Group Inc., Sec. Gtd. Notes, 10.50%, 11/15/16(b) | | | 20,000 | | | | 17,500 | |
| |
Technology Distributors–0.31%
| | | | |
| Avnet Inc., Sr. Unsec. Notes, 5.88%, 06/15/20 | | | 65,000 | | | | 68,922 | |
| |
Textiles–0.07%
| | | | |
| Levi Strauss & Co., Sr. Unsec. Global Notes, 7.63%, 05/15/20 | | | 15,000 | | | | 15,413 | |
| |
Thrifts & Mortgage Finance–0.16%
| | | | |
| First Niagara Financial Group Inc., Unsec. Sub. Notes, 7.25%, 12/15/21 | | | 35,000 | | | | 35,837 | |
| |
Tires & Rubber–0.06%
| | | | |
| Goodyear Tire & Rubber Co. (The), Sr. Unsec. Gtd. Notes, 8.25%, 08/15/20 | | | 13,000 | | | | 14,235 | |
| |
Tobacco–0.46%
| | | | |
| Altria Group, Inc., Sr. Unsec. Gtd. Global Notes, 4.75%, 05/05/21 | | | 95,000 | | | | 104,861 | |
| |
Trading Companies & Distributors–0.17%
| | | | |
Aircastle Ltd., Sr. Note, 9.75%, 08/01/18(b) | | | 2,000 | | | | 2,110 | |
| |
| H&E Equipment Services Inc., Sr. Unsec. Gtd. Global Notes, 8.38%, 07/15/16 | | | 25,000 | | | | 25,594 | |
| |
| Interline Brands, Inc., Sr. Unsec. Gtd. Global Notes, 7.00%, 11/15/18 | | | 5,000 | | | | 5,187 | |
| |
| RSC Equipment Rental Inc./RSC Holdings III LLC, Sr. Unsec. Gtd. Global Notes, 8.25%, 02/01/21 | | | 5,000 | | | | 5,125 | |
| |
| | | | | | | | 38,016 | |
| |
Trucking–0.18%
| | | | |
Avis Budget Car Rental LLC/Avis Budget Finance Inc.,
Sr. Unsec. Gtd. Global Notes, | | | | | | | | |
| 8.25%, 01/15/19 | | | 15,000 | | | | 14,962 | |
| |
| 9.75%, 03/15/20 | | | 2,000 | | | | 2,070 | |
| |
Hertz Corp. (The), Sr. Unsec. Gtd. Global Notes,
6.75%, 04/15/19 | | | 12,000 | | | | 12,210 | |
| |
| 7.38%, 01/15/21 | | | 10,000 | | | | 10,275 | |
| |
| | | | | | | | 39,517 | |
| |
Wireless Telecommunication Services–1.88%
| | | | |
| Alltel Corp., Sr. Unsec. Global Notes, 7.00%, 07/01/12 | | | 50,000 | | | | 51,516 | |
| |
| American Tower Corp., Sr. Unsec. Global Notes, 4.63%, 04/01/15 | | | 90,000 | | | | 94,292 | |
| |
Clearwire Communications LLC/Clearwire Finance, Inc., Sr. Sec. Gtd. Notes, 12.00%, 12/01/15(b) | | | 15,000 | | | | 14,513 | |
| |
| Cricket Communications, Inc., Sr. Unsec. Gtd. Global Notes, 7.75%, 10/15/20 | | | 22,000 | | | | 19,360 | |
| |
Crown Castle Towers LLC, Sr. Sec. Gtd. Notes, 4.88%, 08/15/20(b) | | | 120,000 | | | | 122,400 | |
| |
Intelsat Jackson Holdings S.A. (Luxembourg),
Sr. Unsec. Gtd. Notes,
7.25%, 04/01/19(b) | | | 10,000 | | | | 10,250 | |
| |
7.50%, 04/01/21(b) | | | 15,000 | | | | 15,375 | |
| |
MetroPCS Wireless Inc., Sr. Unsec. Gtd. Notes,
6.63%, 11/15/20 | | | 10,000 | | | | 9,450 | |
| |
| 7.88%, 09/01/18 | | | 5,000 | | | | 5,078 | |
| |
| SBA Telecommunications Inc., Sr. Unsec. Gtd. Global Notes, 8.25%, 08/15/19 | | | 13,000 | | | | 14,219 | |
| |
See accompanying Notes to Financial Statements which are an integral part of the financial statements.
Invesco V.I. Diversified Income Fund
| | | | | | | | | |
| | | Principal
| | |
| | | Amount | | Value |
| |
Wireless Telecommunication Services–(continued)
| | | | |
| | | | | | | | | |
| Sprint Capital Corp., Sr. Unsec. Gtd. Global Notes, 6.90%, 05/01/19 | | $ | 10,000 | | | $ | 8,225 | |
| |
Sprint Nextel Corp., Sr. Unsec. Gtd. Notes,
9.00%, 11/15/18(b) | | | 7,000 | | | | 7,376 | |
| |
| Sr. Unsec. Notes, | | | | | | | | |
| 8.38%, 08/15/17 | | | 5,000 | | | | 4,519 | |
| |
11.50%, 11/15/21(b) | | | 2,000 | | | | 1,988 | |
| |
Wind Acquisition Finance S.A. (Luxembourg), Sr. Sec. Gtd. Notes, 11.75%, 07/15/17(b) | | | 50,000 | | | | 44,750 | |
| |
| | | | | | | | 423,311 | |
| |
| Total U.S. Dollar Denominated Bonds and Notes (Cost $18,176,752) | | | | | | | 18,799,374 | |
| |
U.S. Treasury Securities–12.45%
|
U.S. Treasury Bills–0.22%
| | | | |
| 0.10%, 11/15/12(g)(h) | | | 50,000 | | | | 49,963 | |
| |
U.S. Treasury Notes–7.05%
| | | | |
| 2.00%, 04/30/16 | | | 160,000 | | | | 168,950 | |
| |
| 1.75%, 05/31/16 | | | 230,000 | | | | 240,530 | |
| |
| 1.00%, 08/31/16 | | | 250,000 | | | | 252,734 | |
| |
| 3.63%, 02/15/21 | | | 800,000 | | | | 929,000 | |
| |
| | | | | | | | 1,591,214 | |
| |
U.S. Treasury Bonds–5.18%
| | | | |
| 4.25%, 05/15/39 | | | 100,000 | | | | 127,125 | |
| |
| 4.50%, 08/15/39 | | | 100,000 | | | | 132,141 | |
| |
| 4.75%, 02/15/41 | | | 660,000 | | | | 908,840 | |
| |
| | | | | | | | 1,168,106 | |
| |
| Total U.S. Treasury Securities (Cost $2,463,107) | | | | | | | 2,809,283 | |
| |
Asset-Backed Securities–2.12%
|
Countrywide Asset-Backed Ctfs., Series 2007-4, Class A1B, Pass Through Ctfs., 5.81%, 09/25/37 | | | 37,306 | | | | 36,641 | |
| |
Credit Suisse Mortgage Capital Ctfs. Series 2009-2R, Class 1A11, Floating Rate Pass Through Ctfs., 2.70%, 09/26/34(b)(e) | | | 89,659 | | | | 84,921 | |
| |
Santander Drive Auto Receivables Trust, Series 2011-1, Class D, Pass Through Ctfs., 4.01%, 02/15/17 | | | 80,000 | | | | 79,837 | |
| |
TIAA Seasoned Commercial Mortgage Trust, Series 2007-C4, Class A2, Variable Rate Pass Through Ctfs., 5.44%, 08/15/39(e) | | | 19,538 | | | | 19,833 | |
| |
Wachovia Bank Commercial Mortgage Trust, Series 2005-C21, Class AJ, Variable Rate Pass Through Ctfs., 5.38%, 10/15/44(e) | | | 110,000 | | | | 107,869 | |
| |
Wells Fargo Mortgage Backed Securities Trust, Series 2004-Z, Class 2A1, Floating Rate Pass Through Ctfs., 2.62%, 12/25/34(e) | | | 165,140 | | | | 149,871 | |
| |
| Total Asset-Backed Securities (Cost $464,822) | | | | | | | 478,972 | |
| |
U.S. Government Sponsored Mortgage-Backed Securities–1.13%
|
Federal Home Loan Mortgage Corp. (FHLMC)–0.36%
| | | | |
| Pass Through Ctfs., | | | | | | | | |
6.50%, 05/01/16 to 08/01/32 | | | 7,968 | | | | 8,994 | |
| |
6.00%, 05/01/17 to 12/01/31 | | | 41,313 | | | | 45,708 | |
| |
| 5.50%, 09/01/17 | | | 23,705 | | | | 25,710 | |
| |
| | | | | | | | 80,412 | |
| |
Federal National Mortgage Association (FNMA)–0.64%
| | | | |
| Pass Through Ctfs., | | | | | | | | |
7.00%, 02/01/16 to 09/01/32 | | | 21,318 | | | | 24,522 | |
| |
6.50%, 05/01/16 to 09/01/31 | | | 6,786 | | | | 7,574 | |
| |
| 5.00%, 11/01/18 | | | 24,536 | | | | 26,505 | |
| |
7.50%, 04/01/29 to 10/01/29 | | | 71,568 | | | | 79,794 | |
| |
| 8.00%, 04/01/32 | | | 5,866 | | | | 6,584 | |
| |
| | | | | | | | 144,979 | |
| |
Government National Mortgage Association (GNMA)–0.13%
| | | | |
| Pass Through Ctfs., 7.50%, 06/15/23 | | | 9,244 | | | | 10,703 | |
| |
| 8.50%, 11/15/24 | | | 5,813 | | | | 6,650 | |
| |
7.00%, 07/15/31 to 08/15/31 | | | 2,162 | | | | 2,540 | |
| |
6.50%, 11/15/31 to 03/15/32 | | | 4,972 | | | | 5,764 | |
| |
| 6.00%, 11/15/32 | | | 3,528 | | | | 4,016 | |
| |
| | | | | | | | 29,673 | |
| |
| Total U.S. Government Sponsored Mortgage-Backed Securities (Cost $232,755) | | | | | | | 255,064 | |
| |
Municipal Obligations–0.99%
| | | | |
| Alameda (County of), California Joint Powers Authority (Multiple Capital); Series 2010 A, Lease RB, 7.05%, 12/01/44 | | | 55,000 | | | | 68,359 | |
| |
| Florida Development Finance Corp. (Palm Bay Academy Inc.); Series 2006 B, Taxable RB, 7.50%, 05/15/17 | | | 65,000 | | | | 58,332 | |
| |
| Georgia (State of) Municipal Electric Authority (Plant Vogtle Units 3 & 4–Project J); Series 2010 A, Taxable RB, 6.64%, 04/01/57 | | | 90,000 | | | | 95,345 | |
| |
| Total Municipal Obligations (Cost $209,523) | | | | | | | 222,036 | |
| |
Non-U.S. Dollar Denominated Bonds & Notes–0.24%(i)
|
Canada–0.03%
| | | | |
Gateway Casinos & Entertainment Ltd. (Canada), Sec. Gtd. Notes, 8.88%, 11/15/17(b) | | CAD | 8,000 | | | | 8,009 | |
| |
United States–0.21%
| | | | |
CEDC Finance Corp. International Inc., Sr. Sec. Gtd. Notes, 8.88%, 12/01/16(b) | | EUR | 50,000 | | | | 46,595 | |
| |
| Total Non-U.S. Dollar Denominated Bonds & Notes (Cost $57,548) | | | | | | | 54,604 | |
| |
| | | | | | | | | |
| | | | | | | | | |
| | | | | | | | | |
See accompanying Notes to Financial Statements which are an integral part of the financial statements.
Invesco V.I. Diversified Income Fund
| | | | | | | | | |
| | | Shares | | Value |
| |
Preferred Stocks–0.18%
|
Consumer Finance–0.04%
| | | | |
| Ally Financial, Inc. Series A, 8.50% Pfd. | | | 250 | | | $ | 4,597 | |
| |
| GMAC Capital Trust I, Series 2, 8.13% Jr. Gtd. Sub. Pfd. | | | 270 | | | | 5,222 | |
| |
| | | | | | | | 9,819 | |
| |
Office REIT’s–0.01%
| | | | |
| DuPont Fabros Technology, Inc., Series B, 7.63% Pfd. | | | 95 | | | | 2,369 | |
| |
Regional Banks–0.11%
| | | | |
| Zions Bancorp., Series C, 9.50% Pfd. | | | 1,000 | | | | 25,250 | |
| |
Tires & Rubber–0.02%
| | | | |
| Goodyear Tire & Rubber Co. (The), $2.94 Conv. Pfd. | | | 75 | | | | 3,649 | |
| |
| Total Preferred Stocks (Cost $46,056) | | | | | | | 41,087 | |
| |
Common Stocks & Other Equity Interests–0.00%
|
Broadcasting–0.00%
| | | | |
Adelphia Recovery Trust Series ACC-1(j) | | | 87,412 | | | | 88 | |
| |
Cable & Satellite–0.00%
| | | | |
Adelphia Communications Corp.(j) | | | 900 | | | | 225 | |
| |
| Total Common Stocks & Other Equity Interests (Cost $22,181) | | | | | | | 313 | |
| |
| TOTAL INVESTMENTS–100.45% (Cost $21,672,744) | | | | | | | 22,660,733 | |
| |
| OTHER ASSETS LESS LIABILITIES–(0.45)% | | | | | | | (101,600 | ) |
| |
| NET ASSETS–100.00% | | | | | | $ | 22,559,133 | |
| |
Investment Abbreviations:
| | | |
| CAD | | – Canadian Dollar |
| Ctfs. | | – Certificates |
| Deb. | | – Debentures |
| EUR | | – Euro |
| FHLMC | | – Federal Home Loan Mortgage Corp. |
| FNMA | | – Federal National Mortgage Association |
| GNMA | | – Government National Mortgage Association |
| Gtd. | | – Guaranteed |
| Jr. | | – Junior |
| Ltd. | | – Limited |
| Pfd. | | – Preferred |
| PIK | | – Payment in Kind |
| RB | | – Revenue Bonds |
| Ref. | | – Refunding |
| REIT | | – Real Estate Investment Trust |
| Sec. | | – Secured |
| Sr. | | – Senior |
| Sub. | | – Subordinated |
| Unsec. | | – Unsecured |
| Unsub. | | – Unsubordinated |
Notes to Schedule of Investments:
| | |
| (a) | | Industry and/or sector classifications used in this report are generally according to the Global Industry Classification Standard, which was developed by and is the exclusive property and a service mark of MSCI Inc. and Standard & Poor’s. |
| (b) | | Security purchased or received in a transaction exempt from registration under the Securities Act of 1933, as amended. The security may be resold pursuant to an exemption from registration under the 1933 Act, typically to qualified institutional buyers. The aggregate value of these securities at December 31, 2011 was $5,665,009, which represented 25.11% of the Fund’s Net Assets. |
| (c) | | Defaulted security. Currently, the issuer is partially or fully in default with respect to interest payments. The value of these securities at December 31, 2011 was $13,838, which represented less than 1% of the Fund’s Net Assets. |
| (d) | | Security has an irrevocable call by the issuer or mandatory put by the holder. Maturity date reflects such call or put. |
| (e) | | Interest or dividend rate is redetermined periodically. Rate shown is the rate in effect on December 31, 2011. |
| (f) | | Perpetual bond with no specified maturity date. |
| (g) | | All or a portion of the value was pledged as collateral to cover margin requirements for open futures contracts. See Note 1M and Note 4 |
| (h) | | Security traded on a discount basis. The interest rate shown represents the discount rate at the time of purchase by the Fund. |
| (i) | | Foreign denominated security. Principal amount is denominated in currency indicated. |
| (j) | | Non-income producing security acquired as part of the Adelphia Communications bankruptcy reorganization. |
See accompanying Notes to Financial Statements which are an integral part of the financial statements.
Invesco V.I. Diversified Income Fund
Statement of Assets and Liabilities
December 31, 2011
| | | | | |
Assets:
|
| Investments, at value (Cost $21,672,744) | | $ | 22,660,733 | |
| |
| Foreign currencies, at value (Cost $7,765) | | | 7,554 | |
| |
| Receivable for: | | | | |
| Fund shares sold | | | 4,250 | |
| |
| Dividends and interest | | | 308,066 | |
| |
| Foreign currency contracts | | | 2,583 | |
| |
| Investment for trustee deferred compensation and retirement plans | | | 42,327 | |
| |
| Other assets | | | 368 | |
| |
| Total assets | | | 23,025,881 | |
| |
| | | | | |
| | | | | |
Liabilities:
|
| Payable for: | | | | |
| Fund shares reacquired | | | 17,963 | |
| |
| Amount due custodian | | | 325,882 | |
| |
| Variation margin | | | 438 | |
| |
| Accrued fees to affiliates | | | 9,836 | |
| |
| Accrued other operating expenses | | | 62,249 | |
| |
| Trustee deferred compensation and retirement plans | | | 50,380 | |
| |
| Total liabilities | | | 466,748 | |
| |
| Net assets applicable to shares outstanding | | $ | 22,559,133 | |
| |
| | | | | |
| | | | | |
Net Assets consist of:
|
| Shares of beneficial interest | | $ | 30,112,427 | |
| |
| Undistributed net investment income | | | 1,034,647 | |
| |
| Undistributed net realized gain (loss) | | | (9,552,639 | ) |
| |
| Unrealized appreciation | | | 964,698 | |
| |
| | | $ | 22,559,133 | |
| |
| | | | | |
| | | | | |
Net Assets:
|
| Series I | | $ | 22,332,518 | |
| |
| Series II | | $ | 226,615 | |
| |
| | | | | |
| | | | | |
Shares outstanding, $0.001 par value per share, with an unlimited number of shares authorized:
|
| Series I | | | 3,605,391 | |
| |
| Series II | | | 36,769 | |
| |
| Series I: | | | | |
| Net asset value per share | | $ | 6.19 | |
| |
| Series II: | | | | |
| Net asset value per share | | $ | 6.16 | |
| |
Statement of Operations
For the year ended December 31, 2011
| | | | | |
Investment income:
|
| Interest | | $ | 1,272,665 | |
| |
| Dividends from affiliated money market funds | | | 327 | |
| |
| Total investment income | | | 1,272,992 | |
| |
| | | | | |
| | | | | |
Expenses:
|
| Advisory fees | | | 139,937 | |
| |
| Administrative services fees | | | 90,402 | |
| |
| Custodian fees | | | 12,070 | |
| |
| Distribution fees — Series II | | | 530 | |
| |
| Transfer agent fees | | | 8,470 | |
| |
| Trustees’ and officers’ fees and benefits | | | 18,180 | |
| |
| Professional services fees | | | 42,270 | |
| |
| Other | | | 28,042 | |
| |
| Total expenses | | | 339,901 | |
| |
| Less: Fees waived and expenses reimbursed | | | (165,106 | ) |
| |
| Net expenses | | | 174,795 | |
| |
| Net investment income | | | 1,098,197 | |
| |
| | | | | |
| | | | | |
Realized and unrealized gain (loss) from:
|
| Net realized gain (loss) from: | | | | |
| Investment securities | | | 522,242 | |
| |
| Foreign currencies | | | (772 | ) |
| |
| Foreign currency contracts | | | 206 | |
| |
| Futures contracts | | | 49,881 | |
| |
| Swap agreements | | | (3,746 | ) |
| |
| | | | 567,811 | |
| |
| Change in net unrealized appreciation (depreciation) of: | | | | |
| Investment securities | | | (58,361 | ) |
| |
| Foreign currencies | | | (218 | ) |
| |
| Foreign currency contracts | | | 2,404 | |
| |
| Futures contracts | | | (31,667 | ) |
| |
| | | | (87,842 | ) |
| |
| Net realized and unrealized gain | | | 479,969 | |
| |
| Net increase in net assets resulting from operations | | $ | 1,578,166 | |
| |
See accompanying Notes to Financial Statements which are an integral part of the financial statements.
Invesco V.I. Diversified Income Fund
Statement of Changes in Net Assets
For the years ended December 31, 2011 and 2010
| | | | | | | | | |
| | | 2011 | | 2010 |
| |
Operations:
|
| Net investment income | | $ | 1,098,197 | | | $ | 1,225,023 | |
| |
| Net realized gain | | | 567,811 | | | | 814,813 | |
| |
| Change in net unrealized appreciation (depreciation) | | | (87,842 | ) | | | 296,160 | |
| |
| Net increase in net assets resulting from operations | | | 1,578,166 | | | | 2,335,996 | |
| |
Distributions to shareholders from net investment income:
|
| Series I | | | (1,215,874 | ) | | | (1,390,866 | ) |
| |
| Series II | | | (10,587 | ) | | | (12,740 | ) |
| |
| Total distributions from net investment income | | | (1,226,461 | ) | | | (1,403,606 | ) |
| |
Share transactions–net:
|
| Series I | | | (1,245,046 | ) | | | (1,990,553 | ) |
| |
| Series II | | | (8,207 | ) | | | (71,022 | ) |
| |
| Net increase (decrease) in net assets resulting from share transactions | | | (1,253,253 | ) | | | (2,061,575 | ) |
| |
| Net increase (decrease) in net assets | | | (901,548 | ) | | | (1,129,185 | ) |
| |
Net assets:
|
| Beginning of year | | | 23,460,681 | | | | 24,589,866 | |
| |
| End of year (includes undistributed net investment income of $1,034,647 and $1,168,966, respectively) | | $ | 22,559,133 | | | $ | 23,460,681 | |
| |
Notes to Financial Statements
December 31, 2011
NOTE 1—Significant Accounting Policies
Invesco V.I. Diversified Income Fund (the “Fund”) is a series portfolio of AIM Variable Insurance Funds (Invesco Variable Insurance Funds) (the “Trust”). The Trust is a Delaware statutory trust registered under the Investment Company Act of 1940, as amended (the “1940 Act”), as an open-end series management investment company consisting of twenty-eight separate portfolios, (each constituting a “Fund”). The assets, liabilities and operations of each portfolio are accounted for separately. Information presented in these financial statements pertains only to the Fund. Matters affecting each Fund or class will be voted on exclusively by the shareholders of such Fund or class. Current Securities and Exchange Commission (“SEC”) guidance, however, requires participating insurance companies offering separate accounts to vote shares proportionally in accordance with the instructions of the contract owners whose investments are funded by shares of each Fund or class.
The Fund’s investment objective is total return, comprised of current income and capital appreciation.
The Fund currently offers two classes of shares, Series I and Series II, both of which are offered to insurance company separate accounts funding variable annuity contracts and variable life insurance policies (“variable products”).
The following is a summary of the significant accounting policies followed by the Fund in the preparation of its financial statements.
| | |
| A. | | Security Valuations — Securities, including restricted securities, are valued according to the following policy. |
| | Debt obligations (including convertible bonds) and unlisted equities are fair valued using an evaluated quote provided by an independent pricing service. Evaluated quotes provided by the pricing service may be determined without exclusive reliance on quoted prices, and may reflect appropriate factors such as institution-size trading in similar groups of securities, developments related to specific securities, dividend rate, yield, quality, type of issue, coupon rate, maturity, individual trading characteristics and other market data. Debt securities are subject to interest rate and credit risks. In addition, all debt securities involve some risk of default with respect to interest and/or principal payments. |
| | A security listed or traded on an exchange (except convertible bonds) is valued at its last sales price or official closing price as of the close of the customary trading session on the exchange where the security is principally traded, or lacking any sales or official closing price on a particular day, the security may be valued at the closing bid price on that day. Securities traded in the over-the-counter market are valued based on prices furnished by independent pricing services or market makers. When such securities are valued by an independent pricing service they may be considered fair valued. Futures contracts are valued at the final settlement price set by an exchange on which they are principally traded. Listed options are valued at the mean between the last bid and ask prices from the exchange on which they are principally traded. Options not listed on an exchange are valued by an independent source at the mean between the last bid and ask prices. For purposes of determining net asset value per share, futures and option contracts generally are valued 15 minutes after the close of the customary trading session of the New York Stock Exchange (“NYSE”). |
Invesco V.I. Diversified Income Fund
| | |
| | Investments in open-end and closed-end registered investment companies that do not trade on an exchange are valued at the end of day net asset value per share. Investments in open-end and closed-end registered investment companies that trade on an exchange are valued at the last sales price or official closing price as of the close of the customary trading session on the exchange where the security is principally traded. |
| | Swap agreements are fair valued using an evaluated quote provided by an independent pricing service. Evaluated quotes provided by the pricing service are valued based on a model which may include end of day net present values, spreads, ratings, industry, and company performance. |
| | Foreign securities (including foreign exchange contracts) are converted into U.S. dollar amounts using the applicable exchange rates as of the close of the NYSE. If market quotations are available and reliable for foreign exchange traded equity securities, the securities will be valued at the market quotations. Because trading hours for certain foreign securities end before the close of the NYSE, closing market quotations may become unreliable. If between the time trading ends on a particular security and the close of the customary trading session on the NYSE, events occur that are significant and make the closing price unreliable, the Fund may fair value the security. If the event is likely to have affected the closing price of the security, the security will be valued at fair value in good faith using procedures approved by the Board of Trustees. Adjustments to closing prices to reflect fair value may also be based on a screening process of an independent pricing service to indicate the degree of certainty, based on historical data, that the closing price in the principal market where a foreign security trade is not the current value as of the close of the NYSE. Foreign securities meeting the approved degree of certainty that the price is not reflective of current value will be priced at the indication of fair value from the independent pricing service. Multiple factors may be considered by the independent pricing service in determining adjustments to reflect fair value and may include information relating to sector indices, American Depositary Receipts and domestic and foreign index futures. Foreign securities may have additional risks including exchange rate changes, potential for sharply devalued currencies and high inflation, political and economic upheaval, the relative lack of issuer information, relatively low market liquidity and the potential lack of strict financial and accounting controls and standards. |
| | Securities for which market prices are not provided by any of the above methods may be valued based upon quotes furnished by independent sources. The last bid price may be used to value equity securities. The mean between the last bid and asked prices is used to value debt obligations, including Corporate Loans. |
| | Securities for which market quotations are not readily available or are unreliable are valued at fair value as determined in good faith by or under the supervision of the Trust’s officers following procedures approved by the Board of Trustees. Issuer specific events, market trends, bid/ask quotes of brokers and information providers and other market data may be reviewed in the course of making a good faith determination of a security’s fair value. |
| | Valuations change in response to many factors including the historical and prospective earnings of the issuer, the value of the issuer’s assets, general economic conditions, interest rates, investor perceptions and market liquidity. Because of the inherent uncertainties of valuation, the values reflected in the financial statements may materially differ from the value received upon actual sale of those investments. |
| B. | | Securities Transactions and Investment Income — Securities transactions are accounted for on a trade date basis. Realized gains or losses on sales are computed on the basis of specific identification of the securities sold. Interest income is recorded on the accrual basis from settlement date. Paydown gains and losses on mortgage and asset-backed securities are recorded as adjustments to interest income. Dividend income (net of withholding tax, if any) is recorded on the ex-dividend date. Bond premiums and discounts are amortized and/or accreted for financial reporting purposes. |
| | The Fund may periodically participate in litigation related to Fund investments. As such, the Fund may receive proceeds from litigation settlements. Any proceeds received are included in the Statement of Operations as realized gain (loss) for investments no longer held and as unrealized gain (loss) for investments still held. |
| | Brokerage commissions and mark ups are considered transaction costs and are recorded as an increase to the cost basis of securities purchased and/or a reduction of proceeds on a sale of securities. Such transaction costs are included in the determination of net realized and unrealized gain (loss) from investment securities reported in the Statement of Operations and the Statement of Changes in Net Assets and the net realized and unrealized gains (losses) on securities per share in the Financial Highlights. Transaction costs are included in the calculation of the Fund’s net asset value and, accordingly, they reduce the Fund’s total returns. These transaction costs are not considered operating expenses and are not reflected in net investment income reported in the Statement of Operations and Statement of Changes in Net Assets, or the net investment income per share and ratios of expenses and net investment income reported in the Financial Highlights, nor are they limited by any expense limitation arrangements between the Fund and the investment adviser. |
| | The Fund allocates income and realized and unrealized capital gains and losses to a class based on the relative net assets of each class. |
| C. | | Country Determination — For the purposes of making investment selection decisions and presentation in the Schedule of Investments, the investment adviser may determine the country in which an issuer is located and/or credit risk exposure based on various factors. These factors include the laws of the country under which the issuer is organized, where the issuer maintains a principal office, the country in which the issuer derives 50% or more of its total revenues and the country that has the primary market for the issuer’s securities, as well as other criteria. Among the other criteria that may be evaluated for making this determination are the country in which the issuer maintains 50% or more of its assets, the type of security, financial guarantees and enhancements, the nature of the collateral and the sponsor organization. Country of issuer and/or credit risk exposure has been determined to be the United States of America, unless otherwise noted. |
| D. | | Distributions — Distributions from income and net realized capital gain, if any, are generally paid to separate accounts of participating insurance companies annually and recorded on ex-dividend date. |
| E. | | Federal Income Taxes — The Fund intends to comply with the requirements of Subchapter M of the Internal Revenue Code necessary to qualify as a regulated investment company and to distribute substantially all of the Fund’s taxable earnings to shareholders. As such, the Fund will not be subject to federal income taxes on otherwise taxable income (including net realized capital gain) that is distributed to shareholders. Therefore, no provision for federal income taxes is recorded in the financial statements. |
| | The Fund files tax returns in the U.S. Federal jurisdiction and certain other jurisdictions. Generally, the Fund is subject to examinations by such taxing authorities for up to three years after the filing of the return for the tax period. |
| F. | | Expenses — Fees provided for under the Rule 12b-1 plan of a particular class of the Fund and which are directly attributable to that class are charged to the operations of such class. All other expenses are allocated among the classes based on relative net assets. |
Invesco V.I. Diversified Income Fund
| | |
| G. | | Accounting Estimates — The preparation of financial statements in conformity with accounting principles generally accepted in the United States of America (“GAAP”) requires management to make estimates and assumptions that affect the reported amounts of assets and liabilities at the date of the financial statements and the reported amounts of revenues and expenses during the reporting period including estimates and assumptions related to taxation. Actual results could differ from those estimates by a significant amount. In addition, the Fund monitors for material events or transactions that may occur or become known after the period-end date and before the date the financial statements are released to print. |
| H. | | Indemnifications — Under the Trust’s organizational documents, each Trustee, officer, employee or other agent of the Trust is indemnified against certain liabilities that may arise out of performance of their duties to the Fund. Additionally, in the normal course of business, the Fund enters into contracts, including the Fund’s servicing agreements that contain a variety of indemnification clauses. The Fund’s maximum exposure under these arrangements is unknown as this would involve future claims that may be made against the Fund that have not yet occurred. The risk of material loss as a result of such indemnification claims is considered remote. |
| I. | | Lower-Rated Securities — The Fund may invest in lower-quality debt securities, i.e., “junk bonds”. Investments in lower-rated securities or unrated securities of comparable quality tend to be more sensitive to economic conditions than higher rated securities. Junk bonds involve a greater risk of default by the issuer because such securities are generally unsecured and are often subordinated to other creditors’ claims. |
| J. | | Foreign Currency Translations — Foreign currency is valued at the close of the NYSE based on quotations posted by banks and major currency dealers. Portfolio securities and other assets and liabilities denominated in foreign currencies are translated into U.S. dollar amounts at date of valuation. Purchases and sales of portfolio securities (net of foreign taxes withheld on disposition) and income items denominated in foreign currencies are translated into U.S. dollar amounts on the respective dates of such transactions. The Fund does not separately account for the portion of the results of operations resulting from changes in foreign exchange rates on investments and the fluctuations arising from changes in market prices of securities held. The combined results of changes in foreign exchange rates and the fluctuation of market prices on investments (net of estimated foreign tax withholding) are included with the net realized and unrealized gain or loss from investments in the Statement of Operations. Reported net realized foreign currency gains or losses arise from (1) sales of foreign currencies, (2) currency gains or losses realized between the trade and settlement dates on securities transactions, and (3) the difference between the amounts of dividends, interest, and foreign withholding taxes recorded on the Fund’s books and the U.S. dollar equivalent of the amounts actually received or paid. Net unrealized foreign currency gains and losses arise from changes in the fair values of assets and liabilities, other than investments in securities at fiscal period end, resulting from changes in exchange rates. |
| | The Fund may invest in foreign securities which may be subject to foreign taxes on income, gains on investments or currency repatriation, a portion of which may be recoverable. |
| K. | | Foreign Currency Contracts — The Fund may enter into foreign currency contracts to manage or minimize currency or exchange rate risk. The Fund may also enter into foreign currency contracts for the purchase or sale of a security denominated in a foreign currency in order to “lock in” the U.S. dollar price of that security. A foreign currency contract is an obligation to purchase or sell a specific currency for an agreed-upon price at a future date. The use of foreign currency contracts does not eliminate fluctuations in the price of the underlying securities the Fund owns or intends to acquire but establishes a rate of exchange in advance. Fluctuations in the value of these contracts are measured by the difference in the contract date and reporting date exchange rates and are recorded as unrealized appreciation (depreciation) until the contracts are closed. When the contracts are closed, realized gains (losses) are recorded. Realized and unrealized gains (losses) on the contracts are included in the Statement of Operations. The primary risks associated with foreign currency contracts include failure of the counterparty to meet the terms of the contract and the value of the foreign currency changing unfavorably. These risks may be in excess of the amounts reflected in the Statement of Assets and Liabilities. |
| L. | | Dollar Rolls and Forward Commitment Transactions — The Fund may enter into dollar roll transactions to enhance the Fund’s performance. The Fund executes its dollar roll transactions in the to be announced (“TBA”) market whereby the Fund makes a forward commitment to purchase a security and, instead of accepting delivery, the position is offset by the sale of the security with a simultaneous agreement to repurchase at a future date. |
| | The Fund accounts for dollar roll transactions as purchases and sales and realizes gains and losses on these transactions. These transactions increase the Fund’s portfolio turnover rate. The Fund will segregate liquid assets in an amount equal to its dollar roll commitments. Dollar roll transactions are considered borrowings under the 1940 Act. |
| | Dollar roll transactions involve the risk that a counter-party to the transaction may fail to complete the transaction. If this occurs, the Fund may lose the opportunity to purchase or sell the security at the agreed upon price. Dollar rolls transactions also involve the risk that the value of the securities retained by the Fund may decline below the price of the securities that the Fund has sold but is obligated to purchase under the agreement. |
| M. | | Futures Contracts — The Fund may enter into futures contracts to manage exposure to interest rate, equity and market price movements and/or currency risks. A futures contract is an agreement between two parties to purchase or sell a specified underlying security, currency or commodity (or delivery of a cash settlement price, in the case of an index future) for a fixed price at a future date. The Fund currently invests only in exchange-traded futures and they are standardized as to maturity date and underlying financial instrument. Initial margin deposits required upon entering into futures contracts are satisfied by the segregation of specific securities or cash as collateral at the futures commission merchant (broker). During the period the futures contracts are open, changes in the value of the contracts are recognized as unrealized gains or losses by recalculating the value of the contracts on a daily basis. Subsequent or variation margin payments are received or made depending upon whether unrealized gains or losses are incurred. These amounts are reflected as receivables or payables on the Statement of Assets and Liabilities. When the contracts are closed or expire, the Fund recognizes a realized gain or loss equal to the difference between the proceeds from, or cost of, the closing transaction and the Fund’s basis in the contract. The net realized gain (loss) and the change in unrealized gain (loss) on futures contracts held during the period is included on the Statement of Operations. The primary risks associated with futures contracts are market risk and the absence of a liquid secondary market. If the Fund were unable to liquidate a futures contract and/or enter into an offsetting closing transaction, the Fund would continue to be subject to market risk with respect to the value of the contracts and continue to be required to maintain the margin deposits on the futures contracts. Futures contracts have minimal counterparty risk since the |
Invesco V.I. Diversified Income Fund
| | |
| | exchange’s clearinghouse, as counterparty to all exchange-traded futures, guarantees the futures against default. Risks may exceed amounts recognized in the Statement of Assets and Liabilities. |
| N. | | Swap Agreements — The Fund may enter into various swap transactions, including interest rate, total return, index, currency exchange rate and credit default swap contracts (“CDS”) for investment purposes or to manage interest rate, currency or credit risk. |
| | Interest rate, total return, index, and currency exchange rate swap agreements are two-party contracts entered into primarily to exchange the returns (or differentials in rates of returns) earned or realized on particular predetermined investments or instruments. The gross returns to be exchanged or “swapped” between the parties are calculated with respect to a notional amount, i.e., the return on or increase in value of a particular dollar amount invested at a particular interest rate or return of an underlying asset, in a particular foreign currency, or in a “basket” of securities representing a particular index. |
| | A CDS is an agreement between two parties (“Counterparties”) to exchange the credit risk of an issuer. A buyer of a CDS is said to buy protection by paying a fixed payment over the life of the agreement and in some situations an upfront payment to the seller of the CDS. If a defined credit event occurs (such as payment default or bankruptcy), the Fund as a protection buyer would cease paying its fixed payment, the Fund would deliver eligible bonds issued by the reference entity to the seller, and the seller would pay the full notional value, or the “par value”, of the referenced obligation to the Fund. A seller of a CDS is said to sell protection and thus would receive a fixed payment over the life of the agreement and an upfront payment, if applicable. If a credit event occurs, the Fund as a protection seller would cease to receive the fixed payment stream, the Fund would pay the buyer “par value” or the full notional value of the referenced obligation, and the Fund would receive the eligible bonds issued by the reference entity. In turn, these bonds may be sold in order to realize a recovery value. Alternatively, the seller of the CDS and its counterparty may agree to net the notional amount and the market value of the bonds and make a cash payment equal to the difference to the buyer of protection. If no credit event occurs, the Fund receives the fixed payment over the life of the agreement. As the seller, the Fund would effectively add leverage to its portfolio because, in addition to its total net assets, the Fund would be subject to investment exposure on the notional amount of the CDS. In connection with these agreements, cash and securities may be identified as collateral in accordance with the terms of the respective swap agreements to provide assets of value and recourse in the event of default under the swap agreement or bankruptcy/insolvency of a party to the swap agreement. If a counterparty becomes bankrupt or otherwise fails to perform its obligations due to financial difficulties, the Fund may experience significant delays in obtaining any recovery in a bankruptcy or other reorganization proceeding. The Fund may obtain only limited recovery or may obtain no recovery in such circumstances. |
| | Implied credit spreads represent the current level at which protection could be bought or sold given the terms of the existing CDS contract and serve as an indicator of the current status of the payment/performance risk of the CDS. An implied spread that has widened or increased since entry into the initial contract may indicate a deteriorating credit profile and increased risk of default for the reference entity. A declining or narrowing spread may indicate an improving credit profile or decreased risk of default for the reference entity. Alternatively, credit spreads may increase or decrease reflecting the general tolerance for risk in the credit markets. |
| | Changes in the value of swap agreements are recognized as unrealized gains (losses) in the Statement of Operations by “marking to market” on a daily basis to reflect the value of the swap agreement at the end of each trading day. Payments received or paid at the beginning of the agreement are reflected as such on the Statement of Assets and Liabilities and may be referred to as upfront payments. The Fund accrues for the fixed payment stream and amortizes upfront payments, if any, on swap agreements on a daily basis with the net amount, recorded as a component of realized gain (loss) on the Statement of Operations. A liquidation payment received or made at the termination of a swap agreement is recorded as realized gain (loss) on the Statement of Operations. The Fund segregates liquid securities having a value at least equal to the amount of the potential obligation of a Fund under any swap transaction. The Fund’s maximum risk of loss from counterparty risk, either as the protection seller or as the protection buyer, is the value of the contract. The risk may be mitigated by having a master netting arrangement between the Fund and the counterparty and by the posting of collateral by the counterparty to cover the Fund’s exposure to the counterparty. Entering into these agreements involves, to varying degrees, lack of liquidity and elements of credit, market, and counterparty risk in excess of amounts recognized on the Statement of Assets and Liabilities. Such risks involve the possibility that a swap is difficult to sell or liquidate; the counterparty does not honor its obligations under the agreement and unfavorable interest rates and market fluctuations. |
| O. | | Collateral — To the extent the Fund has pledged or segregated a security as collateral and that security is subsequently sold, it is the Fund’s practice to replace such collateral no later than the next business day. |
NOTE 2—Advisory Fees and Other Fees Paid to Affiliates
The Trust has entered into a master investment advisory agreement with Invesco Advisers, Inc. (the “Adviser” or “Invesco”). Under the terms of the investment advisory agreement, the Fund pays an advisory fee to the Adviser based on the annual rate of the Fund’s average daily net assets as follows:
| | | | | |
| Average Daily Net Assets | | Rate |
| |
| First $250 million | | | 0 | .60% |
| |
| Over $250 million | | | 0 | .55% |
| |
Under the terms of a master sub-advisory agreement between the Adviser and each of Invesco Asset Management Deutschland GmbH, Invesco Asset Management Limited, Invesco Asset Management (Japan) Limited, Invesco Australia Limited, Invesco Hong Kong Limited, Invesco Senior Secured Management, Inc. and Invesco Canada Ltd. (collectively, the “Affiliated Sub-Advisers”) the Adviser, not the Fund, may pay 40% of the fees paid to the Adviser to any such Affiliated Sub-Adviser(s) that provide discretionary investment management services to the Fund based on the percentage of assets allocated to such Sub-Adviser(s).
The Adviser has contractually agreed, through at least April 30, 2013, to waive advisory fees and/or reimburse expenses of all shares to the extent necessary to limit total annual fund operating expenses after fee waiver and/or expense reimbursement (excluding certain items discussed below) of Series I shares to 0.75%
Invesco V.I. Diversified Income Fund
and Series II shares to 1.00% of average daily net assets. In determining the Adviser’s obligation to waive advisory fees and/or reimburse expenses, the following expenses are not taken into account, and could cause the total annual fund operating expenses after fee waiver and/or expense reimbursement to exceed the numbers reflected above: (1) interest; (2) taxes; (3) dividend expense on short sales; (4) extraordinary or non-routine items, including litigation expenses; and (5) expenses that the Fund has incurred but did not actually pay because of an expense offset arrangement. Unless the Board of the Trustees and Invesco mutually agree to amend or continue the fee waiver agreement, it will terminate on April 30, 2013.
Further, the Adviser has contractually agreed, through at least June 30, 2012, to waive the advisory fee payable by the Fund in an amount equal to 100% of the net advisory fees the Adviser receives from the affiliated money market funds on investments by the Fund of uninvested cash in such affiliated money market funds.
For the year ended December 31, 2011, the Adviser waived advisory fees of $139,938 and reimbursed Fund expenses of $25,168.
The Trust has entered into a master administrative services agreement with Invesco pursuant to which the Fund has agreed to pay Invesco a fee for costs incurred in providing accounting services and fund administrative services to the Fund and to reimburse Invesco for administrative services fees paid to insurance companies that have agreed to provide services to the participants of separate accounts. These administrative services provided by the insurance companies may include, among other things: the printing of prospectuses, financial reports and proxy statements and the delivery of the same to existing participants; the maintenance of master accounts; the facilitation of purchases and redemptions requested by the participants; and the servicing of participants’ accounts. Pursuant to such agreement, for the year ended December 31, 2011, Invesco was paid $50,000 for accounting and fund administrative services and reimbursed $40,402 for services provided by insurance companies.
The Trust has entered into a transfer agency and service agreement with Invesco Investment Services, Inc. (“IIS”) pursuant to which the Fund has agreed to pay IIS a fee for providing transfer agency and shareholder services to the Fund and reimburse IIS for certain expenses incurred by IIS in the course of providing such services. For the year ended December 31, 2011, expenses incurred under the agreement are shown in the Statement of Operations as transfer agent fees.
The Trust has entered into a master distribution agreement with Invesco Distributors, Inc. (“IDI”) to serve as the distributor for the Fund. The Trust has adopted a plan pursuant to Rule 12b-1 under the 1940 Act with respect to the Fund’s Series II shares (the “Plan”). The Fund, pursuant to the Plan, pays IDI compensation at the annual rate of 0.25% of the Fund’s average daily net assets of Series II shares. Of the Plan payments, up to 0.25% of the average daily net assets of the Series II shares may be paid to insurance companies who furnish continuing personal shareholder services to customers who purchase and own Series II shares of the Fund. For the year ended December 31, 2011, expenses incurred under the Plan are detailed in the Statement of Operations as distribution fees.
Certain officers and trustees of the Trust are officers and directors of the Adviser, IIS and/or IDI.
NOTE 3—Additional Valuation Information
GAAP defines fair value as the price that would be received to sell an asset or paid to transfer a liability in an orderly transaction between market participants at the measurement date, under current market conditions. GAAP establishes a hierarchy that prioritizes the inputs to valuation methods giving the highest priority to readily available unadjusted quoted prices in an active market for identical assets (Level 1) and the lowest priority to significant unobservable inputs (Level 3) generally when market prices are not readily available or are unreliable. Based on the valuation inputs, the securities or other investments are tiered into one of three levels. Changes in valuation methods may result in transfers in or out of an investment’s assigned level:
| | |
| | Level 1 — | Prices are determined using quoted prices in an active market for identical assets. |
| | Level 2 — | Prices are determined using other significant observable inputs. Observable inputs are inputs that other market participants may use in pricing a security. These may include quoted prices for similar securities, interest rates, prepayment speeds, credit risk, yield curves, loss severities, default rates, discount rates, volatilities and others. |
| | Level 3 — | Prices are determined using significant unobservable inputs. In situations where quoted prices or observable inputs are unavailable (for example, when there is little or no market activity for an investment at the end of the period), unobservable inputs may be used. Unobservable inputs reflect the Fund’s own assumptions about the factors market participants would use in determining fair value of the securities or instruments and would be based on the best available information. |
Invesco V.I. Diversified Income Fund
The following is a summary of the tiered valuation input levels, as of December 31, 2011. The level assigned to the securities valuations may not be an indication of the risk or liquidity associated with investing in those securities. Because of the inherent uncertainties of valuation, the values reflected in the financial statements may materially differ from the value received upon actual sale of those investments.
During the year ended December 31, 2011, there were no significant transfers between investment levels.
| | | | | | | | | | | | | | | | | |
| | | Level 1 | | Level 2 | | Level 3 | | Total |
| |
| Equity Securities | | $ | 41,175 | | | $ | 225 | | | $ | — | | | $ | 41,400 | |
| |
| U.S. Treasury Securities | | | — | | | | 2,809,283 | | | | — | | | | 2,809,283 | |
| |
| U.S. Government Sponsored Securities | | | — | | | | 255,064 | | | | — | | | | 255,064 | |
| |
| Domestic Corporate Debt Securities | | | — | | | | 18,625,124 | | | | 0 | | | | 18,625,124 | |
| |
| Foreign Corporate Debt Securities | | | — | | | | 54,604 | | | | — | | | | 54,604 | |
| |
| Foreign Sovereign Debt Securities | | | — | | | | 174,250 | | | | — | | | | 174,250 | |
| |
| Asset Backed Securities | | | — | | | | 478,972 | | | | — | | | | 478,972 | |
| |
| Municipal Obligations | | | — | | | | 222,036 | | | | — | | | | 222,036 | |
| |
| | | $ | 41,175 | | | $ | 22,619,558 | | | $ | 0 | | | $ | 22,660,733 | |
| |
| Foreign Currency Contracts* | | | — | | | | 2,404 | | | | — | | | | 2,404 | |
| |
| Futures* | | | (25,477 | ) | | | — | | | | — | | | | (25,477 | ) |
| |
| Total Investments | | $ | 15,698 | | | $ | 22,621,962 | | | $ | 0 | | | $ | 22,637,660 | |
| |
| |
| * | Unrealized appreciation (depreciation). |
NOTE 4—Derivative Investments
Value of Derivative Instruments at Period-End
The table below summarizes the value of the Fund’s derivative instruments, detailed by primary risk exposure, held as of December 31, 2011:
| | | | | | | | | |
| | | Value |
| Risk Exposure/Derivative Type | | Assets | | Liabilities |
| |
| Currency risk | | | | | | | | |
Foreign Currency Contracts(a) | | $ | 2,404 | | | $ | — | |
| |
| Interest rate risk | | | | | | | | |
Futures contracts(b) | | | 29,049 | | | | (54,526 | ) |
| |
| | |
| (a) | | Values are disclosed on the Statement of Assets and Liabilities under the Foreign currency contracts outstanding. |
| (b) | | Includes cumulative appreciation (depreciation) of futures contracts. Only current day’s variation margin receivable (payable) is reported within the Statement of Assets and Liabilities. |
Effect of Derivative Instruments for the year ended December 31, 2011
The table below summarizes the gains (losses) on derivative instruments, detailed by primary risk exposure, recognized in earnings during the period:
| | | | | | | | | | | | | |
| | | Location of Gain (Loss) on
|
| | | Statement of Operations |
| | | | | Swap
| | Foreign Currency
|
| | | Futures* | | Agreements* | | Contracts* |
| |
| Realized Gain (Loss) | | | | | | | | | | | | |
| Credit risk | | $ | — | | | $ | (3,746 | ) | | $ | — | |
| |
| Currency risk | | | — | | | | — | | | | 206 | |
| |
| Interest rate risk | | | 49,881 | | | | — | | | | — | |
| |
| Change in Unrealized Appreciation (Depreciation) | | | | | | | | | | | | |
| Credit risk | | $ | — | | | $ | — | | | $ | — | |
| |
| Currency risk | | | — | | | | — | | | | 2,404 | |
| |
| Interest rate risk | | | (31,667 | ) | | | — | | | | — | |
| |
| Total | | $ | 18,214 | | | $ | (3,746 | ) | | $ | 2,610 | |
| |
| |
| * | The average notional value of futures, swap agreements and foreign currency contracts outstanding during the period was $8,339,248, $291,667 and $10,954, respectively. |
Invesco V.I. Diversified Income Fund
| | | | | | | | | | | | | | | | | |
| Open Futures Contracts |
| | | | | | | | | Unrealized
|
| | | Number of
| | Expiration
| | Notional
| | Appreciation
|
| Long Contracts | | Contracts | | Month | | Value | | (Depreciation) |
| |
| U.S. Treasury Ultra Bonds | | | 4 | | | | March-2012 | | | $ | 640,750 | | | $ | 7,304 | |
| |
| U.S. Treasury 5 Year Notes | | | 32 | | | | March-2012 | | | | 3,944,250 | | | | 21,745 | |
| |
| Subtotal | | | | | | | | | | $ | 4,585,000 | | | $ | 29,049 | |
| |
Short Contracts | | | | | | | | | | | | | | | | |
| U.S. Treasury 10 Year Notes | | | 28 | | | | March-2012 | | | $ | (3,671,500 | ) | | $ | (49,934 | ) |
| |
| U.S. Treasury 30 Year Notes | | | 1 | | | | March-2012 | | | | (144,813 | ) | | | (4,592 | ) |
| |
| Subtotal | | | | | | | | | | $ | (3,816,313 | ) | | $ | (54,526 | ) |
| |
| Total | | | | | | | | | | $ | 768,687 | | | $ | (25,477 | ) |
| |
| | | | | | | | | | | | | | | | | | | | | | | |
| Open Foreign Currency Contracts |
Settlement
| | | | Contract to | | Notional
| | Unrealized
|
| Date | | Counterparty | | Deliver | | Receive | | Value | | Appreciation |
| |
| 02/09/12 | | RBC Capital Markets Corp. | | EUR | | | 34,000 | | | USD | | | 46,426 | | | $ | 44,022 | | | $ | 2,404 | |
| |
| | | | | | | | | | | | | | | | | | | | | | | |
| |
| Closed Foreign Currency Contracts |
Closed
| | | | Contract to | | Notional
| | Realized
|
| Date | | Counterparty | | Deliver | | Receive | | Value | | Gain |
| |
| 02/09/12 | | RBC Capital Markets Corp. | | EUR | | | 7,000 | | | USD | | | 9,637 | | | $ | 9,458 | | | $ | 179 | |
| |
| Total foreign currency contracts | | | | | | | | | | | | | | | | | | | | $ | 2,583 | |
| |
| | | |
| Currency Abbreviations: |
| EUR | | – Euro |
| USD | | – U.S. Dollar |
NOTE 5—Trustees’ and Officers’ Fees and Benefits
“Trustees’ and Officers’ Fees and Benefits” include amounts accrued by the Fund to pay remuneration to certain Trustees and Officers of the Fund. Trustees have the option to defer compensation payable by the Fund, and “Trustees’ and Officers’ Fees and Benefits” also include amounts accrued by the Fund to fund such deferred compensation amounts. Those Trustees who defer compensation have the option to select various Invesco Funds in which their deferral accounts shall be deemed to be invested. Finally, certain current Trustees are eligible to participate in a retirement plan that provides for benefits to be paid upon retirement to Trustees over a period of time based on the number of years of service. The Fund may have certain former Trustees who also participate in a retirement plan and receive benefits under such plan. “Trustees’ and Officers’ Fees and Benefits” include amounts accrued by the Fund to fund such retirement benefits. Obligations under the deferred compensation and retirement plans represent unsecured claims against the general assets of the Fund.
During the year ended December 31, 2011, the Fund paid legal fees of $1,148 for services rendered by Kramer, Levin, Naftalis & Frankel LLP as counsel to the Independent Trustees. A partner of that firm is a Trustee of the Trust.
NOTE 6—Cash Balances
The Fund may borrow for leveraging in an amount up to 5% of the Fund’s total assets (excluding the amount borrowed) at the time the borrowing is made. In doing so, the Fund is permitted to temporarily carry a negative or overdrawn balance in its account with State Street Bank and Trust Company, the custodian bank. To compensate the custodian bank for such overdrafts, the overdrawn Fund may either (1) leave funds as a compensating balance in the account so the custodian bank can be compensated by earning the additional interest; or (2) compensate by paying the custodian bank at a rate agreed upon by the custodian bank and Invesco, not to exceed the contractually agreed upon rate. A Fund may not purchase additional securities when any borrowings from banks exceeds 5% of the Fund’s total assets.
NOTE 7—Distributions to Shareholders and Tax Components of Net Assets
Tax Character of Distributions to Shareholders Paid During the Years Ended December 31, 2011 and 2010:
| | | | | | | | | |
| | | 2011 | | 2010 |
| |
| Ordinary income | | $ | 1,226,461 | | | $ | 1,403,606 | |
| |
Invesco V.I. Diversified Income Fund
Tax Components of Net Assets at Period-End:
| | | | | |
| | | 2011 |
| |
| Undistributed ordinary income | | $ | 1,083,674 | |
| |
| Net unrealized appreciation — investments | | | 949,971 | |
| |
| Net unrealized appreciation (depreciation) — other investments | | | (218 | ) |
| |
| Temporary book/tax differences | | | (49,027 | ) |
| |
| Capital loss carryforward | | | (9,537,694 | ) |
| |
| Shares of beneficial interest | | | 30,112,427 | |
| |
| Total net assets | | $ | 22,559,133 | |
| |
The difference between book-basis and tax-basis unrealized appreciation (depreciation) is due to differences in the timing of recognition of gains and losses on investments for tax and book purposes. The Fund’s net unrealized appreciation difference is attributable primarily to wash sales and straddle loss deferrals.
The temporary book/tax differences are a result of timing differences between book and tax recognition of income and/or expenses. The Fund’s temporary book/tax differences are the result of the trustee deferral of compensation and retirement plan benefits.
Capital loss carryforward is calculated and reported as of a specific date. Results of transactions and other activity after that date may affect the amount of capital loss carryforward actually available for the Fund to utilize. The Regulated Investment Company Modernization Act of 2010 (the “Act”) eliminated the eight-year carryover period for capital losses that arise in taxable years beginning after its enactment date of December 22, 2010. Consequently, these capital losses can be carried forward for an unlimited period. However, capital losses with an expiration period may not be used to offset capital gains until all net capital losses without an expiration date have been utilized. Additionally, post-enactment capital loss carryovers will retain their character as either short-term or long-term capital losses instead of as short-term capital losses as under prior law. The ability to utilize capital loss carryforward in the future may be limited under the Internal Revenue Code and related regulations based on the results of future transactions.
The Fund utilized $582,621 of capital loss carryforward in the current period to offset net realized capital gain for federal income tax purposes. The Fund has a capital loss carryforward as of December 31, 2011, which expires as follows:
| | | | | | | | | | | | | |
| Capital Loss Carryforward* |
| Expiration | | Short-Term | | Long-Term | | Total |
| |
| December 31, 2016 | | $ | 2,178,603 | | | $ | — | | | $ | 2,178,603 | |
| |
| December 31, 2017 | | | 7,359,091 | | | | — | | | | 7,359,091 | |
| |
| | | $ | 9,537,694 | | | $ | — | | | $ | 9,537,694 | |
| |
| |
| * | Capital loss carryforward as of the date listed above is reduced for limitations, if any, to the extent required by the Internal Revenue Code. |
NOTE 8—Investment Securities
The aggregate amount of investment securities (other than short-term securities, U.S. Treasury obligations and money market funds, if any) purchased and sold by the Fund during the year ended December 31, 2011 was $10,615,008 and $13,235,941, respectively. Cost of investments on a tax basis includes the adjustments for financial reporting purposes as of the most recently completed Federal income tax reporting period-end.
| | | | | |
| Unrealized Appreciation (Depreciation) of Investment Securities on a Tax Basis |
| Aggregate unrealized appreciation of investment securities | | $ | 1,370,144 | |
| |
| Aggregate unrealized (depreciation) of investment securities | | | (420,173 | ) |
| |
| Net unrealized appreciation of investment securities | | $ | 949,971 | |
| |
| Cost of investments for tax purposes is $21,710,762. | | | | |
NOTE 9—Reclassification of Permanent Differences
Primarily as a result of differing book/tax treatment of foreign currency transactions and paydown reclasses, on December 31, 2011, undistributed net investment income was decreased by $6,055 and undistributed net realized gain (loss) was increased by $6,055. This reclassification had no effect on the net assets of the Fund.
Invesco V.I. Diversified Income Fund
NOTE 10—Share Information
| | | | | | | | | | | | | | | | | |
| | | Summary of Share Activity |
| |
| | | Year ended December 31, |
| | | 2011(a) | | 2010 |
| | | Shares | | Amount | | Shares | | Amount |
| |
| Sold: | | | | | | | | | | | | | | | | |
| Series I | | | 348,442 | | | $ | 2,182,267 | | | | 297,335 | | | $ | 1,831,971 | |
| |
| Series II | | | 5,383 | | | | 33,498 | | | | 68 | | | | 406 | |
| |
| Issued as reinvestment of dividends: | | | | | | | | | | | | | | | | |
| Series I | | | 198,025 | | | | 1,215,874 | | | | 227,266 | | | | 1,390,866 | |
| |
| Series II | | | 1,730 | | | | 10,587 | | | | 2,092 | | | | 12,740 | |
| |
| Reacquired: | | | | | | | | | | | | | | | | |
| Series I | | | (746,622 | ) | | | (4,643,187 | ) | | | (848,553 | ) | | | (5,213,390 | ) |
| |
| Series II | | | (8,507 | ) | | | (52,292 | ) | | | (13,673 | ) | | | (84,168 | ) |
| |
| Net increase (decrease) in share activity | | | (201,549 | ) | | $ | (1,253,253 | ) | | | (335,465 | ) | | $ | (2,061,575 | ) |
| |
| | |
| (a) | | There are entities that are record owners of more than 5% of the outstanding shares of the Fund and in the aggregate own 77% of the outstanding shares of the Fund. The Fund and the Fund’s principal underwriter or adviser, are parties to participation agreements with these entities whereby these entities sell units of interest in separate accounts funding variable products that are invested in the Fund. The Fund, Invesco and/or Invesco affiliates may make payments to these entities, which are considered to be related to the Fund, for providing services to the Fund, Invesco and/or Invesco affiliates including but not limited to services such as, securities brokerage, third party record keeping and account servicing and administrative services. The Fund has no knowledge as to whether all or any portion of the shares owned of record by these entities are also owned beneficially. |
NOTE 11—Financial Highlights
The following schedule presents financial highlights for a share of the Fund outstanding throughout the periods indicated.
| | | | | | | | | | | | | | | | | | | | | | | | | | | | | | | | | | | | | | | | | | | | | | | | | |
| | | | | | | | | | | | | | | | | | | Ratio of
| | Ratio of
| | | | |
| | | | | | | Net gains
| | | | | | | | | | | | expenses
| | expenses
| | | | |
| | | | | | | (losses) on
| | | | | | | | | | | | to average
| | to average net
| | Ratio of net
| | |
| | | Net asset
| | | | securities
| | | | Dividends
| | | | | | | | net assets
| | assets without
| | investment
| | |
| | | value,
| | Net
| | (both
| | Total from
| | from net
| | Net asset
| | | | Net assets,
| | with fee waivers
| | fee waivers
| | income
| | |
| | | beginning
| | investment
| | realized and
| | investment
| | investment
| | value, end
| | Total
| | end of period
| | and/or expenses
| | and/or expenses
| | to average
| | Portfolio
|
| | | of period | | income(a) | | unrealized) | | operations | | income | | of period | | Return(b) | | (000s omitted) | | absorbed | | absorbed | | net assets | | turnover(c) |
| |
| Series I | | | | | | | | | | | | | | | | | | | | | | | | | | | | | | | | | | | | | | | | | | | | | | | | |
| Year ended 12/31/11 | | $ | 6.10 | | | $ | 0.29 | | | $ | 0.13 | | | $ | 0.42 | | | $ | (0.33 | ) | | $ | 6.19 | | | | 7.02 | % | | $ | 22,333 | | | | 0.75 | %(d) | | | 1.46 | %(d) | | | 4.71 | %(d) | | | 59 | % |
| Year ended 12/31/10 | | | 5.88 | | | | 0.31 | | | | 0.28 | | | | 0.59 | | | | (0.37 | ) | | | 6.10 | | | | 10.05 | | | | 23,229 | | | | 0.75 | | | | 1.36 | | | | 5.03 | | | | 87 | |
| Year ended 12/31/09 | | | 5.87 | | | | 0.35 | | | | 0.29 | | | | 0.64 | | | | (0.63 | ) | | | 5.88 | | | | 10.89 | | | | 24,299 | | | | 0.74 | | | | 1.48 | | | | 5.91 | | | | 200 | |
| Year ended 12/31/08 | | | 7.80 | | | | 0.50 | | | | (1.74 | ) | | | (1.24 | ) | | | (0.69 | ) | | | 5.87 | | | | (15.59 | ) | | | 24,070 | | | | 0.75 | | | | 1.31 | | | | 6.83 | | | | 35 | |
| Year ended 12/31/07 | | | 8.28 | | | | 0.51 | | | | (0.37 | ) | | | 0.14 | | | | (0.62 | ) | | | 7.80 | | | | 1.72 | | | | 38,336 | | | | 0.75 | | | | 1.17 | | | | 6.04 | | | | 67 | |
| |
| Series II | | | | | | | | | | | | | | | | | | | | | | | | | | | | | | | | | | | | | | | | | | | | | | | | |
| Year ended 12/31/11 | | | 6.07 | | | | 0.28 | | | | 0.13 | | | | 0.41 | | | | (0.32 | ) | | | 6.16 | | | | 6.72 | | | | 227 | | | | 1.00 | (d) | | | 1.71 | (d) | | | 4.46 | (d) | | | 59 | |
| Year ended 12/31/10 | | | 5.85 | | | | 0.29 | | | | 0.28 | | | | 0.57 | | | | (0.35 | ) | | | 6.07 | | | | 9.70 | | | | 232 | | | | 1.00 | | | | 1.61 | | | | 4.78 | | | | 87 | |
| Year ended 12/31/09 | | | 5.83 | | | | 0.34 | | | | 0.29 | | | | 0.63 | | | | (0.61 | ) | | | 5.85 | | | | 10.70 | | | | 291 | | | | 0.99 | | | | 1.73 | | | | 5.66 | | | | 200 | |
| Year ended 12/31/08 | | | 7.74 | | | | 0.48 | | | | (1.72 | ) | | | (1.24 | ) | | | (0.67 | ) | | | 5.83 | | | | (15.78 | ) | | | 409 | | | | 1.00 | | | | 1.56 | | | | 6.58 | | | | 35 | |
| Year ended 12/31/07 | | | 8.21 | | | | 0.48 | | | | (0.36 | ) | | | 0.12 | | | | (0.59 | ) | | | 7.74 | | | | 1.51 | | | | 606 | | | | 1.00 | | | | 1.42 | | | | 5.79 | | | | 67 | |
| |
| | |
| (a) | | Calculated using average shares outstanding. |
| (b) | | Includes adjustments in accordance with accounting principles generally accepted in the United States of America and as such, the net asset value for financial reporting purposes and the returns based upon those net asset values may differ from the net asset value and returns for shareholder transactions. Total returns are not annualized for periods less than one year if applicable and do not reflect charges assessed in connection with a variable product, which if included would reduce total returns. |
| (c) | | Portfolio turnover is calculated at the fund level and is not annualized for periods less than one year, if applicable. |
| (d) | | Ratios are based on average daily net assets (000’s) of $23,111 and $212 for Series I and Series II shares, respectively. |
Invesco V.I. Diversified Income Fund
Report of Independent Registered Public Accounting Firm
To the Board of Trustees of AIM Variable Insurance Funds (Invesco Variable Insurance Funds)
and Shareholders of Invesco V.I. Diversified Income Fund:
In our opinion, the accompanying statement of assets and liabilities, including the schedule of investments, and the related statements of operations and of changes in net assets and the financial highlights present fairly, in all material respects, the financial position of Invesco V.I. Diversified Income Fund (one of the funds constituting AIM Variable Insurance Funds (Invesco Variable Insurance Funds), hereafter referred to as the “Fund”) at December 31, 2011, the results of its operations for the year then ended, and the changes in its net assets for each of the two years in the period then ended and the financial highlights for each of the five years in the period then ended, in conformity with accounting principles generally accepted in the United States of America. These financial statements and financial highlights (hereafter referred to as “financial statements”) are the responsibility of the Fund’s management; our responsibility is to express an opinion on these financial statements based on our audits. We conducted our audits of these financial statements in accordance with the standards of the Public Company Accounting Oversight Board (United States). Those standards require that we plan and perform the audits to obtain reasonable assurance about whether the financial statements are free of material misstatement. An audit includes examining, on a test basis, evidence supporting the amounts and disclosures in the financial statements, assessing the accounting principles used and significant estimates made by management, and evaluating the overall financial statement presentation. We believe that our audits, which included confirmation of securities at December 31, 2011 by correspondence with the custodian and brokers, provide a reasonable basis for our opinion.
PRICEWATERHOUSECOOPERS LLP
February 17, 2012
Houston, Texas
Invesco V.I. Diversified Income Fund
Calculating your ongoing Fund expenses
Example
As a shareholder of the Fund, you incur ongoing costs, including management fees; distribution and/or service fees (12b-1); and other Fund expenses. This example is intended to help you understand your ongoing costs (in dollars) of investing in the Fund and to compare these costs with ongoing costs of investing in other mutual funds. The example is based on an investment of $1,000 invested at the beginning of the period and held for the entire period July 1, 2011 through December 31, 2011.
The actual and hypothetical expenses in the examples below do not represent the effect of any fees or other expenses assessed in connection with a variable product; if they did, the expenses shown would be higher while the ending account values shown would be lower.
Actual expenses
The table below provides information about actual account values and actual expenses. You may use the information in this table, together with the amount you invested, to estimate the expenses that you paid over the period. Simply divide your account value by $1,000 (for example, an $8,600 account value divided by $1,000 = 8.6), then multiply the result by the number in the table under the heading entitled “Actual Expenses Paid During Period” to estimate the expenses you paid on your account during this period.
Hypothetical example for comparison purposes
The table below also provides information about hypothetical account values and hypothetical expenses based on the Fund’s actual expense ratio and an assumed rate of return of 5% per year before expenses, which is not the Fund’s actual return.
The hypothetical account values and expenses may not be used to estimate the actual ending account balance or expenses you paid for the period. You may use this information to compare the ongoing costs of investing in the Fund and other funds. To do so, compare this 5% hypothetical example with the 5% hypothetical examples that appear in the shareholder reports of the other funds.
Please note that the expenses shown in the table are meant to highlight your ongoing costs. Therefore, the hypothetical information is useful in comparing ongoing costs, and will not help you determine the relative total costs of owning different funds.
| | | | | | | | | | | | | | | | | | | | | | | | | | | | | | | |
| | | | | | | | | | HYPOTHETICAL
| | | |
| | | | | | | ACTUAL | | | (5% annual return before expenses) | | | |
| | | | Beginning
| | | Ending
| | | Expenses
| | | Ending
| | | Expenses
| | | Annualized
|
| | | | Account Value
| | | Account Value
| | | Paid During
| | | Account Value
| | | Paid During
| | | Expense
|
| Class | | | (07/01/11) | | | (12/31/11)1 | | | Period2 | | | (12/31/11) | | | Period2 | | | Ratio |
| Series I | | | $ | 1,000.00 | | | | $ | 1,034.60 | | | | $ | 3.85 | | | | $ | 1,021.42 | | | | $ | 3.82 | | | | | 0.75 | % |
| | | | | | | | | | | | | | | | | | | | | | | | | | | | | | | |
| Series II | | | | 1,000.00 | | | | | 1,033.20 | | | | | 5.12 | | | | | 1,020.16 | | | | | 5.09 | | | | | 1.00 | |
| | | | | | | | | | | | | | | | | | | | | | | | | | | | | | | |
| |
| 1 | The actual ending account value is based on the actual total return of the Fund for the period July 1, 2011 through December 31, 2011, after actual expenses and will differ from the hypothetical ending account value which is based on the Fund’s expense ratio and a hypothetical annual return of 5% before expenses. |
| 2 | Expenses are equal to the Fund’s annualized expense ratio as indicated above multiplied by the average account value over the period, multiplied by 184/365 to reflect the most recent fiscal half year. |
Invesco V.I. Diversified Income Fund
Form 1099-DIV, Form 1042-S and other year-end tax information provide shareholders with actual calendar year amounts that should be included in their tax returns. Shareholders should consult their tax advisors.
The following distribution information is being provided as required by the Internal Revenue Code or to meet a specific state’s requirement.
The Fund designates the following amounts or, if subsequently determined to be different, the maximum amount allowable for its fiscal year ended December 31, 2011:
| | | | | |
Federal and State Income Tax | | |
| |
| Corporate Dividends Received Deduction* | | | 0.00% | |
| U.S. Treasury Obligations* | | | 4.35% | |
| | |
| | * | The above percentages are based on ordinary income dividends paid to shareholders during the Fund’s fiscal year. |
Invesco V.I. Diversified Income Fund
Trustees and Officers
The address of each trustee and officer is AIM Variable Insurance Funds (Invesco Variable Insurance Funds) (the “Trust”), 11 Greenway Plaza, Suite 2500, Houston, Texas 77046-1173. The trustees serve for the life of the Trust, subject to their earlier death, incapacitation, resignation, retirement or removal as more specifically provided in the Trust’s organizational documents. Each officer serves for a one year term or until their successors are elected and qualified. Column two below includes length of time served with predecessor entities, if any.
| | | | | | | | | |
| | | | | | | Number of Funds
| | |
Name, Year of Birth and
| | Trustee and/
| | Principal Occupation(s)
| | in Fund Complex
| | Other Directorship(s)
|
| Position(s) Held with the Trust | | or Officer Since | | During Past 5 Years | | Overseen by Trustee | | Held by Trustee |
| | | | | | | | | |
| | | | | | | | | |
| | | | | | | | | |
| Interested Persons | | | | | | | | |
| | | | | | | | | |
| | | | | | | | | |
| | | | | | | | | |
Martin L. Flanagan1 — 1960
Trustee | | 2007 | | Executive Director, Chief Executive Officer and President, Invesco Ltd. (ultimate parent of Invesco and a global investment management firm); Advisor to the Board, Invesco Advisers, Inc. (formerly known as Invesco Institutional (N.A.), Inc.); Trustee, The Invesco Funds; Vice Chair, Investment Company Institute; and Member of Executive Board, SMU Cox School of Business
Formerly: Chairman, Invesco Advisers, Inc. (registered investment adviser); Director, Chairman, Chief Executive Officer and President, IVZ Inc. (holding company), INVESCO Group Services, Inc. (service provider) and Invesco North American Holdings, Inc. (holding company); Director, Chief Executive Officer and President, Invesco Holding Company Limited (parent of Invesco and a global investment management firm); Director, Invesco Ltd.; Chairman, Investment Company Institute and President, Co-Chief Executive Officer, Co-President, Chief Operating Officer and Chief Financial Officer, Franklin Resources, Inc. (global investment management organization) | | 140 | | None |
| | | | | | | | | |
| | | | | | | | | |
| | | | | | | | | |
Philip A. Taylor2 — 1954
Trustee, President and Principal Executive Officer | | 2006 | | Head of North American Retail and Senior Managing Director, Invesco Ltd.; Director, Co-Chairman, Co-President and Co-Chief Executive Officer, Invesco Advisers, Inc. (formerly known as Invesco Institutional (N.A.), Inc.) (registered investment adviser); Director, Chairman, Chief Executive Officer and President, Invesco Management Group, Inc. (formerly Invesco Aim Management Group, Inc.) (financial services holding company); Director and President, INVESCO Funds Group, Inc. (registered investment adviser and registered transfer agent); Director and Chairman, Invesco Investment Services, Inc. (formerly known as Invesco Aim Investment Services, Inc.) (registered transfer agent) and IVZ Distributors, Inc. (formerly known as INVESCO Distributors, Inc.) (registered broker dealer); Director, President and Chairman, Invesco Inc. (holding company) and Invesco Canada Holdings Inc. (holding company); Chief Executive Officer, Invesco Corporate Class Inc. (corporate mutual fund company) and Invesco Canada Fund Inc. (corporate mutual fund company); Director, Chairman and Chief Executive Officer, Invesco Canada Ltd. (formerly known as Invesco Trimark Ltd./Invesco Trimark Ltèe) (registered investment adviser and registered transfer agent); Trustee, President and Principal Executive Officer, The Invesco Funds (other than AIM Treasurer’s Series Trust (Invesco Treasurer’s Series Trust) and Short-Term Investments Trust); Trustee and Executive Vice President, The Invesco Funds (AIM Treasurer’s Series Trust (Invesco Treasurer’s Series Trust) and Short-Term Investments Trust only); Director, Invesco Investment Advisers LLC (formerly known as Van Kampen Asset Management); Director, Chief Executive Officer and President, Van Kampen Exchange Corp. | | 140 | | None |
| | | | | | | | | |
| | | | | | | | | |
| | | | | Formerly: Director and Chairman, Van Kampen Investor Services Inc.: Director, Chief Executive Officer and President, 1371 Preferred Inc. (holding company); and Van Kampen Investments Inc.; Director and President, AIM GP Canada Inc. (general partner for limited partnerships); and Van Kampen Advisors, Inc.; Director and Chief Executive Officer, Invesco Trimark Dealer Inc. (registered broker dealer); Director, Invesco Distributors, Inc. (formerly known as Invesco Aim Distributors, Inc.) (registered broker dealer); Manager, Invesco PowerShares Capital Management LLC; Director, Chief Executive Officer and President, Invesco Advisers, Inc.; Director, Chairman, Chief Executive Officer and President, Invesco Aim Capital Management, Inc.; President, Invesco Trimark Dealer Inc. and Invesco Trimark Ltd./Invesco Trimark Ltèe; Director and President, AIM Trimark Corporate Class Inc. and AIM Trimark Canada Fund Inc.; Senior Managing Director, Invesco Holding Company Limited; Trustee and Executive Vice President, Tax-Free Investments Trust; Director and Chairman, Fund Management Company (former registered broker dealer); President and Principal Executive Officer, The Invesco Funds (AIM Treasurer’s Series Trust (Invesco Treasurer’s Series Trust), Short-Term Investments Trust and Tax-Free Investments Trust only); President, AIM Trimark Global Fund Inc. and AIM Trimark Canada Fund Inc. | | | | |
| | | | | | | | | |
| | | | | | | | | |
| | | | | | | | | |
Wayne W. Whalen3 — 1939
Trustee | | 2010 | | Of Counsel, and prior to 2010, partner in the law firm of Skadden, Arps, Slate, Meagher & Flom LLP, legal counsel to funds in the Fund Complex | | 158 | | Director of the Abraham Lincoln Presidential Library Foundation |
| | | | | | | | | |
| | | | | | | | | |
| | | | | | | | | |
| Independent Trustees | | | | | | | | |
| | | | | | | | | |
| | | | | | | | | |
| | | | | | | | | |
Bruce L. Crockett — 1944
Trustee and Chair | | 1993 | | Chairman, Crockett Technology Associates (technology consulting company) | | 140 | | ACE Limited (insurance company); and Investment Company Institute |
| | | | | Formerly: Director, Captaris (unified messaging provider); Director, President and Chief Executive Officer COMSAT Corporation; and Chairman, Board of Governors of INTELSAT (international communications company) | | | | |
| | | | | | | | | |
| |
| 1 | Mr. Flanagan is considered an interested person of the Trust because he is an officer of the adviser to the Trust, and an officer and a director of Invesco Ltd., ultimate parent of the adviser to the Trust. |
| 2 | Mr. Taylor is considered an interested person of the Trust because he is an officer and a director of the adviser to, and a director of the principal underwriter of, the Trust. |
| 3 | Mr. Whalen is considered an “interested person” (within the meaning of Section 2(a)(19) of the 1940 Act) of certain Funds in the Fund Complex by reason of he and his firm currently providing legal services as legal counsel to such Funds in the Fund Complex. |
Invesco V.I. Diversified Income Fund
Trustees and Officers—(continued)
The address of each trustee and officer is AIM Variable Insurance Funds (Invesco Variable Insurance Funds) (the “Trust”), 11 Greenway Plaza, Suite 2500, Houston, Texas 77046-1173. The trustees serve for the life of the Trust, subject to their earlier death, incapacitation, resignation, retirement or removal as more specifically provided in the Trust’s organizational documents. Each officer serves for a one year term or until their successors are elected and qualified. Column two below includes length of time served with predecessor entities, if any.
| | | | | | | | | |
| | | | | | | Number of Funds
| | |
Name, Year of Birth and
| | Trustee and/
| | Principal Occupation(s)
| | in Fund Complex
| | Other Directorship(s)
|
| Position(s) Held with the Trust | | or Officer Since | | During Past 5 Years | | Overseen by Trustee | | Held by Trustee |
| | | | | | | | | |
| | | | | | | | | |
| | | | | | | |
Independent Trustees—(continued) | | | | | | |
| | | | | | | | | |
| | | | | | | | | |
| | | | | | | | | |
David C. Arch — 1945
Trustee | | 2010 | | Chairman and Chief Executive Officer of Blistex Inc., a consumer health care products manufacturer. | | 158 | | Member of the Heartland Alliance Advisory Board, a nonprofit organization serving human needs based in Chicago. Board member of the Illinois Manufacturers’ Association. Member of the Board of Visitors, Institute for the Humanities, University of Michigan |
| | | | | | | | | |
| | | | | | | | | |
| | | | | | | | | |
Frank S. Bayley — 1939
Trustee | | 2001 | | Retired
Formerly: Director, Badgley Funds, Inc. (registered investment company) (2 portfolios) and Partner, law firm of Baker & McKenzie
Formerly: Director, Badgley Funds, Inc. (registered investment company) (2 portfolios) and Partner, law firm of Baker & McKenzie | | 140 | | Director and Chairman, C.D. Stimson Company (a real estate investment company) |
| | | | | | | | | |
| | | | | | | | | |
| | | | | | | | | |
James T. Bunch — 1942
Trustee | | 2004 | | Managing Member, Grumman Hill Group LLC (family office private equity management)
Formerly: Founder, Green, Manning & Bunch Ltd. (investment banking firm)(1988-2010); Executive Committee, United States Golf Association; and Director, Policy Studies, Inc. and Van Gilder Insurance Corporation | | 140 | | Vice Chairman, Board of Governors, Western Golf Association/Evans Scholars Foundation and Director, Denver Film Society |
| | | | | | | | | |
| | | | | | | | | |
| | | | | | | | | |
Rodney F. Dammeyer — 1940
Trustee | | 2010 | | President of CAC, LLC, a private company offering capital investment and management advisory services.
Formerly: Prior to January 2004, Director of TeleTech Holdings Inc.; Prior to 2002, Director of Arris Group, Inc.; Prior to 2001, Managing Partner at Equity Group Corporate Investments. Prior to 1995, Vice Chairman of Anixter International. Prior to 1985, experience includes Senior Vice President and Chief Financial Officer of Household International, Inc., Executive Vice President and Chief Financial Officer of Northwest Industries, Inc. and Partner of Arthur Andersen & Co. | | 158 | | Director of Quidel Corporation and Stericycle, Inc. Prior to May 2008, Trustee of The Scripps Research Institute. Prior to February 2008, Director of Ventana Medical Systems, Inc. Prior to April 2007, Director of GATX Corporation. Prior to April 2004, Director of TheraSense, Inc. |
| | | | | | | | | |
| | | | | | | | | |
| | | | | | | | | |
Albert R. Dowden — 1941
Trustee | | 2000 | | Director of a number of public and private business corporations, including the Boss Group, Ltd. (private investment and management); Reich & Tang Funds (5 portfolios) (registered investment company); and Homeowners of America Holding Corporation/ Homeowners of America Insurance Company (property casualty company)
Formerly: Director, Continental Energy Services, LLC (oil and gas pipeline service); Director, CompuDyne Corporation (provider of product and services to the public security market) and Director, Annuity and Life Re (Holdings), Ltd. (reinsurance company); Director, President and Chief Executive Officer, Volvo Group North America, Inc.; Senior Vice President, AB Volvo; Director of various public and private corporations; Chairman, DHJ Media, Inc.; Director Magellan Insurance Company; and Director, The Hertz Corporation, Genmar Corporation (boat manufacturer), National Media Corporation; Advisory Board of Rotary Power International (designer, manufacturer, and seller of rotary power engines); and Chairman, Cortland Trust, Inc. (registered investment company) | | 140 | | Board of Nature’s Sunshine Products, Inc. |
| | | | | | | | | |
| | | | | | | | | |
| | | | | | | | | |
Jack M. Fields — 1952
Trustee | | 1997 | | Chief Executive Officer, Twenty First Century Group, Inc. (government affairs company); and Owner and Chief Executive Officer, Dos Angelos Ranch, L.P. (cattle, hunting, corporate entertainment), Discovery Global Education Fund (non-profit) and Cross Timbers Quail Research Ranch (non-profit)
Formerly: Chief Executive Officer, Texana Timber LP (sustainable forestry company) and member of the U.S. House of Representatives | | 140 | | Administaff |
| | | | | | | | | |
| | | | | | | | | |
| | | | | | | | | |
Carl Frischling — 1937
Trustee | | 1993 | | Partner, law firm of Kramer Levin Naftalis and Frankel LLP | | 140 | | Director, Reich & Tang Funds (16 portfolios) |
| | | | | | | | | |
| | | | | | | | | |
Invesco V.I. Diversified Income Fund
Trustees and Officers—(continued)
The address of each trustee and officer is AIM Variable Insurance Funds (Invesco Variable Insurance Funds) (the “Trust”), 11 Greenway Plaza, Suite 2500, Houston, Texas 77046-1173. The trustees serve for the life of the Trust, subject to their earlier death, incapacitation, resignation, retirement or removal as more specifically provided in the Trust’s organizational documents. Each officer serves for a one year term or until their successors are elected and qualified. Column two below includes length of time served with predecessor entities, if any.
| | | | | | | | | |
| | | | | | | Number of Funds
| | |
Name, Year of Birth and
| | Trustee and/
| | Principal Occupation(s)
| | in Fund Complex
| | Other Directorship(s)
|
| Position(s) Held with the Trust | | or Officer Since | | During Past 5 Years | | Overseen by Trustee | | Held by Trustee |
| | | Independent Trustees—(continued) | | | | |
| | | | | | | | | |
| | | | | | | | | |
| | | | | | | | | |
Prema Mathai-Davis — 1950
Trustee | | 1998 | | Retired
Formerly: Chief Executive Officer, YWCA of the U.S.A. | | 140 | | None |
| | | | | | | | | |
| | | | | | | | | |
| | | | | | | | | |
Larry Soll — 1942
Trustee | | 2004 | | Retired
Formerly, Chairman, Chief Executive Officer and President, Synergen Corp. (a biotechnology company) | | 140 | | None |
| | | | | | | | | |
| | | | | | | | | |
| | | | | | | | | |
Hugo F. Sonnenschein — 1940
Trustee | | 2010 | | President Emeritus and Honorary Trustee of the University of Chicago and the Adam Smith Distinguished Service Professor in the Department of Economics at the University of Chicago. Prior to July 2000, President of the University of Chicago. | | 158 | | Trustee of the University of Rochester and a member of its investment committee. Member of the National Academy of Sciences, the American Philosophical Society and a fellow of the American Academy of Arts and Sciences |
| | | | | | | | | |
| | | | | | | | | |
| | | | | | | | | |
| Raymond Stickel, Jr. — 1944 Trustee | | 2005 | | Retired
Formerly: Director, Mainstay VP Series Funds, Inc. (25 portfolios) and Partner, Deloitte & Touche | | 140 | | None |
| | | | | | | | | |
| | | | | | | | | |
| | | | | | | | | |
| Other Officers | | | | | | | | |
| | | | | | | | | |
| | | | | | | | | |
| | | | | | | | | |
Russell C. Burk — 1958
Senior Vice President and Senior Officer | | 2005 | | Senior Vice President and Senior Officer, The Invesco Funds | | N/A | | N/A |
| | | | | | | | | |
| | | | | | | | | |
| | | | | | | | | |
John M. Zerr — 1962
Senior Vice President, Chief Legal Officer and Secretary | | 2006 | | Director, Senior Vice President, Secretary and General Counsel, Invesco Management Group, Inc. (formerly known as Invesco Aim Management Group, Inc.) and Van Kampen Exchange Corp.; Senior Vice President, Invesco Advisers, Inc. (formerly known as Invesco Institutional (N.A.), Inc.) (registered investment adviser); Senior Vice President and Secretary, Invesco Distributors, Inc. (formerly known as Invesco Aim Distributors, Inc.); Director, Vice President and Secretary, Invesco Investment Services, Inc. (formerly known as Invesco Aim Investment Services, Inc.) and IVZ Distributors, Inc. (formerly known as INVESCO Distributors, Inc.); Director and Vice President, INVESCO Funds Group, Inc.; Senior Vice President, Chief Legal Officer and Secretary, The Invesco Funds; Manager, Invesco PowerShares Capital Management LLC; Director, Secretary and General Counsel, Invesco Investment Advisers LLC (formerly known as Van Kampen Asset Management); Secretary and General Counsel, Van Kampen Funds Inc. and Chief Legal Officer, PowerShares Exchange-Traded Fund Trust, PowerShares Exchange-Traded Fund Trust II, PowerShares India Exchange-Traded Fund Trust and PowerShares Actively Managed Exchange-Traded Fund Trust
Formerly: Director and Secretary, Van Kampen Advisors Inc.; Director Vice President, Secretary and General Counsel Van Kampen Investor Services Inc.; Director, Invesco Distributors, Inc. (formerly known as Invesco Aim Distributors, Inc.); Director, Senior Vice President, General Counsel and Secretary, Invesco Advisers, Inc.; and Van Kampen Investments Inc.; Director, Vice President and Secretary, Fund Management Company; Director, Senior Vice President, Secretary, General Counsel and Vice President, Invesco Aim Capital Management, Inc.; Chief Operating Officer and General Counsel, Liberty Ridge Capital, Inc. (an investment adviser); Vice President and Secretary, PBHG Funds (an investment company) and PBHG Insurance Series Fund (an investment company); Chief Operating Officer, General Counsel and Secretary, Old Mutual Investment Partners (a broker-dealer); General Counsel and Secretary, Old Mutual Fund Services (an administrator) and Old Mutual Shareholder Services (a shareholder servicing center); Executive Vice President, General Counsel and Secretary, Old Mutual Capital, Inc. (an investment adviser); and Vice President and Secretary, Old Mutual Advisors Funds (an investment company) | | N/A | | N/A |
| | | | | | | | | |
| | | | | | | | | |
| | | | | | | | | |
Lisa O. Brinkley — 1959
Vice President | | 2004 | | Global Compliance Director, Invesco Ltd.; Chief Compliance Officer, Invesco Investment Services, Inc.(formerly known as Invesco Aim Investment Services, Inc.); and Vice President, The Invesco Funds
Formerly: Chief Compliance Officer, Invesco Distributors, Inc. (formerly known as Invesco Aim Distributors, Inc.) and Van Kampen Investor Services Inc.; Senior Vice President, Invesco Management Group, Inc.; Senior Vice President and Chief Compliance Officer, Invesco Advisers, Inc. and The Invesco Funds; Vice President and Chief Compliance Officer, Invesco Aim Capital Management, Inc. and Invesco Distributors, Inc.; Vice President, Invesco Investment Services, Inc. and Fund Management Company | | N/A | | N/A |
| | | | | | | | | |
Invesco V.I. Diversified Income Fund
Trustees and Officers—(continued)
The address of each trustee and officer is AIM Variable Insurance Funds (Invesco Variable Insurance Funds) (the “Trust”), 11 Greenway Plaza, Suite 2500, Houston, Texas 77046-1173. The trustees serve for the life of the Trust, subject to their earlier death, incapacitation, resignation, retirement or removal as more specifically provided in the Trust’s organizational documents. Each officer serves for a one year term or until their successors are elected and qualified. Column two below includes length of time served with predecessor entities, if any.
| | | | | | | | | |
| | | | | | | Number of Funds
| | |
Name, Year of Birth and
| | Trustee and/
| | Principal Occupation(s)
| | in Fund Complex
| | Other Directorship(s)
|
| Position(s) Held with the Trust | | or Officer Since | | During Past 5 Years | | Overseen by Trustee | | Held by Trustee |
| | | Other Officers—(continued) | | | | |
| | | | | | | | | |
| | | | | | | | | |
| | | | | | | | | |
Sheri Morris — 1964
Vice President, Treasurer and Principal Financial Officer | | 1999 | | Vice President, Treasurer and Principal Financial Officer, The Invesco Funds; Vice President, Invesco Advisers, Inc. (formerly known as Invesco Institutional (N.A.), Inc.) (registered investment adviser).
Formerly: Treasurer, PowerShares Exchange-Traded Fund Trust, PowerShares Exchange-Traded Fund Trust II, PowerShares India Exchange-Traded Fund Trust and PowerShares Actively Managed Exchange-Traded Fund Trust, Vice President, Invesco Advisers, Inc., Invesco Aim Capital Management, Inc. and Invesco Aim Private Asset Management, Inc.; Assistant Vice President and Assistant Treasurer, The Invesco Funds and Assistant Vice President, Invesco Advisers, Inc., Invesco Aim Capital Management, Inc. and Invesco Aim Private Asset Management, Inc. | | N/A | | N/A |
| | | | | | | | | |
| | | | | | | | | |
| | | | | | | | | |
Karen Dunn Kelley — 1960
Vice President | | 1993 | | Head of Invesco’s World Wide Fixed Income and Cash Management Group; Senior Vice President, Invesco Management Group, Inc. (formerly known as Invesco Aim Management Group, Inc.) and Invesco Advisers, Inc. (formerly known as Invesco Institutional (N.A.), Inc.) (registered investment adviser); Executive Vice President, Invesco Distributors, Inc. (formerly known as Invesco Aim Distributors, Inc.); Director, Invesco Mortgage Capital Inc.; Vice President, The Invesco Funds (other than AIM Treasurer’s Series Trust (Invesco Treasurer’s Series Trust) and Short-Term Investments Trust); and President and Principal Executive Officer, The Invesco Funds (AIM Treasurer’s Series Trust (Invesco Treasurer’s Series Trust) and Short-Term Investments Trust only).
Formerly: Senior Vice President, Van Kampen Investments Inc.; Vice President, Invesco Advisers, Inc. (formerly known as Invesco Institutional (N.A.), Inc.); Director of Cash Management and Senior Vice President, Invesco Advisers, Inc. and Invesco Aim Capital Management, Inc.; President and Principal Executive Officer, Tax-Free Investments Trust; Director and President, Fund Management Company; Chief Cash Management Officer, Director of Cash Management, Senior Vice President, and Managing Director, Invesco Aim Capital Management, Inc.; Director of Cash Management, Senior Vice President, and Vice President, Invesco Advisers, Inc. and The Invesco Funds (AIM Treasurer’s Series Trust (Invesco Treasurer’s Series Trust), Short-Term Investments Trust and Tax-Free Investments Trust only) | | N/A | | N/A |
| | | | | | | | | |
| | | | | | | | | |
| | | | | | | | | |
Yinka Akinsola — 1977
Anti-Money Laundering Compliance Officer | | 2011 | | Anti-Money Laundering Compliance Officer, Invesco Advisers, Inc. (formerly known as Invesco Institutional (N.A.), Inc.) (registered investment adviser); Invesco Distributors, Inc. (formerly known as Invesco Aim Distributors, Inc.), Invesco Investment Services, Inc. (formerly known as Invesco Aim Investment Services, Inc.), Invesco Management Group, Inc., The Invesco Funds, Invesco Van Kampen Closed-End Funds, Van Kampen Exchange Corp. and Van Kampen Funds Inc. | | N/A | | N/A |
| | | | | | | | | |
| | | | | | | | | |
| | | | | | | | | |
Todd L. Spillane — 1958
Chief Compliance Officer | | 2006 | | Senior Vice President, Invesco Management Group, Inc. (formerly known as Invesco Aim Management Group, Inc.) and Van Kampen Exchange Corp.; Senior Vice President and Chief Compliance Officer, Invesco Advisers, Inc. (registered investment adviser) (formerly known as Invesco Institutional (N.A.), Inc.); Chief Compliance Officer, The Invesco Funds, INVESCO Private Capital Investments, Inc. (holding company) and Invesco Private Capital, Inc. (registered investment adviser); Vice President, Invesco Distributors, Inc. (formerly known as Invesco Aim Distributors, Inc.) and Invesco Investment Services, Inc. (formerly known as Invesco Aim Investment Services, Inc.).
Formerly: Chief Compliance Officer, Invesco Van Kampen Closed-End Funds PowerShares Exchange-Traded Fund Trust, PowerShares Exchange-Traded Fund Trust II, PowerShares India Exchange-Traded Fund Trust, and PowerShares Actively Managed Exchange-Traded Fund Trust; Senior Vice President, Van Kampen Investments Inc.; Senior Vice President and Chief Compliance Officer, Invesco Advisers, Inc. and Invesco Aim Capital Management, Inc.; Chief Compliance Officer, Invesco Global Asset Management (N.A.), Inc., Invesco Senior Secured Management, Inc. (registered investment adviser) and Van Kampen Investor Services Inc.; Vice President, Invesco Aim Capital Management, Inc. and Fund Management Company | | N/A | | N/A |
| | | | | | | | | |
The Statement of Additional Information of the Trust includes additional information about the Fund’s Trustees and is available upon request, without charge, by calling 1.800.959.4246. Please refer to the Fund’s prospectus for information on the Fund’s sub-advisers.
| | | | | | | |
Office of the Fund
11 Greenway Plaza, Suite 2500
Houston, TX 77046-1173 | | Investment Adviser
Invesco Advisers, Inc.
1555 Peachtree Street, N.E.
Atlanta, GA 30309 | | Distributor
Invesco Distributors, Inc.
11 Greenway Plaza, Suite 2500
Houston, TX 77046-1173 | | Auditors
PricewaterhouseCoopers LLP
1201 Louisiana Street, Suite 2900
Houston, TX 77002-5678 |
| | | | | | | |
| | | | | | | |
Counsel to the Fund
Stradley Ronon Stevens & Young, LLP
2600 One Commerce Square
Philadelphia, PA 19103 | | Counsel to the Independent Trustees
Kramer, Levin, Naftalis & Frankel LLP
1177 Avenue of the Americas
New York, NY 10036-2714 | | Transfer Agent
Invesco Investment Services, Inc.
11 Greenway Plaza, Suite 2500
Houston, TX77046-1173 | | Custodian
State Street Bank and Trust Company
225 Franklin
Boston, MA 02110-2801 |
Invesco V.I. Diversified Income Fund
Invesco V.I. Dividend Growth FundAnnual Report to Shareholders
§ December 31, 2011
The Fund provides a complete list of its holdings four times in each fiscal year, at the quarter-ends. For the second and fourth quarters, the lists appear in the Fund’s semiannual and annual reports to shareholders. For the first and third quarters, the Fund files the lists with the Securities and Exchange Commission (SEC) on Form N-Q. The Fund’s Form N-Q filings are available on the SEC website, sec.gov. Copies of the Fund’s Forms N-Q may be reviewed and copied at the SEC Public Reference Room in Washington, D.C. You can obtain information on the operation of the Public Reference Room, including information about duplicating fee charges, by calling 202 551 8090 or 800 732 0330, or by electronic request at the following email address: publicinfo@sec.gov. The SEC file numbers for the Fund are 811-07452 and 033-57340. The Fund’s most recent portfolio holdings, as filed on Form N-Q, have also been made available to insurance companies issuing variable annuity contracts and variable life insurance policies (“variable products”) that invest in the Fund.
A description of the policies and procedures that the Fund uses to determine how to vote proxies relating to portfolio securities is available without charge, upon request, from our Client Services department at 800 959 4246 or at invesco.com/proxyguidelines. The information is also available on the SEC website, sec.gov.
Information regarding how the Fund voted proxies related to its portfolio securities during the 12 months ended June 30, 2011, is available at invesco.com/proxysearch. The information is also available on the SEC website, sec.gov.
Invesco Advisers, Inc. is an investment adviser; it provides investment advisory services to individual and institutional clients and does not sell securities. Invesco Distributors, Inc. is the U.S. distributor for Invesco Ltd.’s retail mutual funds, exchange-traded funds and institutional money market funds. Both are wholly owned, indirect subsidiaries of Invesco Ltd.
This report must be accompanied or preceded by a currently effective Fund prospectus and variable product prospectus, which contain more complete information, including sales charges and expenses. Investors should read each carefully before investing.
Invesco Distributors, Inc.
MS-VIDGR-AR-1
NOT FDIC INSURED | MAY LOSE VALUE | NO BANK GUARANTEE
Management’s Discussion of Fund Performance
Performance summary
In the year ended December 31, 2011, U.S. equity markets delivered muted returns but were volatile as investors worried about a potential slowdown in global economic growth. For the year, Invesco V.I. Dividend Growth Fund lagged its broad market and style-specific benchmarks, the S&P 500 Index and the Russell 1000 Index, respectively. The Fund’s returns were largely driven by investments in consumer staples, utilities and energy stocks. Holdings in the financials sector were the largest detractors from results during the fiscal year.
Your Fund’s long-term performance appears later in this report.
Fund vs. Indexes
Total returns, 12/31/10 to 12/31/11, excluding variable product issuer charges. If variable product issuer charges were included, returns would be lower.
| | | | | |
|
| Series I Shares | | | 0.20 | % |
| |
| Series II Shares | | | –0.06 | |
| |
S&P 500 Index▼ (Broad Market Index) | | | 2.09 | |
| |
Russell 1000 Index▼ (Style-Specific Index) | | | 1.50 | |
| |
Lipper VUF Large-Cap Core Funds Index▼ (Peer Group Index) | | | –2.10 | |
| |
Source(s): ▼Lipper Inc.
As noted in the Fund’s latest semiannual report, the Fund has adopted a three-tier benchmark structure to compare its performance to broad market, style-specific and peer group market measures.
How we invest
Our total return approach emphasizes long-term capital appreciation, current income and capital preservation. The Fund may serve as a conservative cornerstone within a well-diversified asset allocation strategy, complementing more aggressive and cyclical investments.
We seek companies that we believe have normalized earnings power greater than that implied by their current market valuation and that return capital to shareholders via dividends and share repurchases. All stocks in the portfolio pay dividends, and the Fund pays a quarterly dividend to shareholders. We manage risk by utilizing a valuation framework, careful stock selection and a rigorous buy-and-sell discipline.
We look for dividend-paying companies with strong profitability, solid balance sheets and capital allocation policies that
may support sustained or increasing dividends and share repurchases. We perform extensive fundamental research, incorporating both financial statement analysis and an assessment of the potential reward relative to the downside risk to determine a fair valuation over our two-year investment horizon for each stock. We believe our process may provide the best combination of dividend income, price appreciation and capital preservation.
We maintain a rigorous sell discipline and consider selling or trimming a stock when it no longer meets our investment criteria, including when:
| n | | A stock reaches its fair valuation (target price). |
| |
| n | | A company’s fundamental business prospects deteriorate. |
| |
| n | | We identify a more attractive investment opportunity. |
Market conditions and your Fund
Equity markets rose from the start of the year through the first quarter of 2011. Corporate fundamentals continued to improve as cost controls and stronger revenues helped produce better margins and earnings. However, in the spring of 2011, investor focus shifted from fundamentals to macroeconomic concerns. Market volatility dramatically increased due to civil unrest in the Middle East and the earthquake and tsunami in Japan. Then the eurozone sovereign debt crisis intensified, fear of contagion from Greece to other EU nations spread and growth in developed economies began to slow. As a result, fears of a global recession grew.
Despite significant volatility, major U.S. equity indexes produced positive returns for the year. Sector performance was mixed, with utilities, consumer staples and health care being the leading sectors and financials and materials lagging.
Consumer staples company Kimberly-Clark was the top contributor to Fund performance for the year. Kimberly-Clark has been a long-term investment for the Fund. Historically, the shareholder-friendly company has used its strong balance sheet to increase its dividend and to buy back stock each year. The company also has invested in innovative products and has been able to offset rising input costs by increasing prices and restructuring cost savings. Over the year, we opportunistically added to our Kimberly-Clark position when concerns about weak consumer spending and rising input costs weighed on the company’s stock price. We believed that Kimberly-Clark would be able to meet these challenges, as it has in the past. Indeed, the company’s third quarter 2011 results exceeded market expectations, and Kimberly-Clark gained market share with its new products.
Portfolio Composition
By sector
| | | | | |
|
| Consumer Staples | | | 23.4 | % |
| |
| Financials | | | 18.3 | |
| |
| Consumer Discretionary | | | 12.1 | |
| |
| Utilities | | | 11.1 | |
| |
| Industrials | | | 9.8 | |
| |
| Health Care | | | 8.0 | |
| |
| Information Technology | | | 5.3 | |
| |
| Materials | | | 4.3 | |
| |
| Energy | | | 1.3 | |
| |
| Telecommunication Services | | | 1.0 | |
| |
Money Market Funds Plus Other Assets Less Liabilities | | | 5.4 | |
Top 10 Equity Holdings*
| | | | | | | | | |
|
| | 1. | | | Kimberly-Clark Corp. | | | 3.3 | % |
| |
| | 2. | | | General Mills, Inc. | | | 3.2 | |
| |
| | 3. | | | Procter & Gamble Co. (The) | | | 2.3 | |
| |
| | 4. | | | Heineken N.V. | | | 2.3 | |
| |
| | 5. | | | SunTrust Banks, Inc. | | | 2.3 | |
| |
| | 6. | | | American Electric Power Co., Inc. | | | 2.3 | |
| |
| | 7. | | | General Dynamics Corp. | | | 2.2 | |
| |
| | 8. | | | Automatic Data Processing, Inc. | | | 2.2 | |
| |
| | 9. | | | Raytheon Co. | | | 2.1 | |
| |
| | 10. | | | Johnson & Johnson | | | 2.1 | |
Top Five Industries
| | | | | | | | | |
|
| | 1. | | | Packaged Foods & Meats | | | 7.9 | % |
| |
| | 2. | | | Regional Banks | | | 7.1 | |
| |
| | 3. | | | Electric Utilities | | | 6.3 | |
| |
| | 4. | | | Household Products | | | 5.6 | |
| |
| | 5. | | | Pharmaceuticals | | | 5.0 | |
| | | | |
|
| Total Net Assets | | $322.3 million |
| | | | | |
| Total Number of Holdings* | | | 75 | |
The Fund’s holdings are subject to change, and there is no assurance that the Fund will continue to hold any particular security.
* Excluding money market fund holdings.
Invesco V.I. Dividend Growth Fund
Another top contributor to Fund results was oil services firm Baker Hughes. The company reported strong earnings driven by continued growing revenues and improving margins in its North American business. The company received notable benefits from its 2010 acquisition of BJ Services, including the realization of cost synergies and stronger pricing power for its pressure pumping services used in shale drilling. We sold our position in Baker Hughes before the close of the year as the stock price reached our estimate of fair valuation.
Holdings in the financials sector were the primary detractors from Fund results during the fiscal year. Fears of an economic slowdown and European sovereign debt uncertainties weighed on the Fund’s U.S. regional bank holdings. Hudson City Bancorp, SunTrust Banks and Zions Bancorporation all lagged the overall market in sympathy with broader macroeconomic uncertainties, and they were among the largest detractors from results. We have further stress-tested our analysis of these investments, valuing companies on a variety of metrics and considering the impact of regulations on their normalized earnings power. We believe valuations offer an attractive risk/reward profile as the group, at year-end, was trading near 2008 levels (based on tangible book value), despite higher capital positions, lower credit costs, improving loan demand and strong deposit growth. Also, these companies are increasingly returning excess capital to shareholders via dividends and stock buy-backs. At year-end, the Fund’s exposure to financials was primarily in regional banks and property and casualty insurance companies, which we believed represented the best risk/reward opportunities within the sector.
The landscape is changing quickly as markets react to slowing economic growth and the impact of Europe’s sovereign debt issues. In 2011, we found more attractive opportunities in stable growing companies whose cash flows and business predictability was more consistent, rather than global cyclical stocks which we believed were near peak margins and had less attractive valuations. However, some cyclical sectors such as financials experienced dramatic compression in their valuation; as a result, we became active investors in the sector. At the end of the year, the Fund’s largest sector overweights, as compared to the Russell 1000 Index, were the consumer staples, financials and utilities sectors. Primary underweights were the information technology, energy and health care sectors.
Overall at the end of 2011, we believed companies were in sound financial shape and equity valuations were modestly attractive. Also, valuation dispersions were narrow within sectors and return correlations were at historic highs. While the breadth of investment opportunities has decreased over the last two years, we believe investors should remain focused on long-term business fundamentals and dividend-paying stocks.
We believe one of our competitive advantages is a disciplined approach to evaluating stocks over a full market cycle, applying our total return approach. We focus not only on an investment’s capital appreciation potential, but also on its current dividend income and capital preservation. This approach helps create a well-diversified Fund that may serve as a cornerstone allocation within an overall portfolio. As always, we thank you for your investment in Invesco V.I. Dividend Growth Fund.
The views and opinions expressed in management’s discussion of Fund performance are those of Invesco Advisers, Inc. These views and opinions are subject to change at any time based on factors such as market and economic conditions. These views and opinions may not be relied upon as investment advice or recommendations, or as an offer for a particular security. The information is not a complete analysis of every aspect of any market, country, industry, security or the Fund. Statements of fact are from sources considered reliable, but Invesco Advisers, Inc. makes no representation or warranty as to their completeness or accuracy. Although historical performance is no guarantee of future results, these insights may help you understand our investment management philosophy.
See important Fund and, if applicable, index disclosures later in this report.
Meggan Walsh
Chartered Financial Analyst, portfolio manager, is lead manager of Invesco V.I. Dividend Growth Fund. She joined Invesco in 1991. Ms. Walsh earned a B.S. in finance from the University of Maryland and an M.B.A. from Loyola University of Maryland.
Jonathan Harrington
Chartered Financial Analyst, portfolio manager, is manager of Invesco V.I. Dividend Growth Fund. He joined Invesco in 2001. Mr. Harrington earned a B.A. in history and philosophy from Dartmouth College and an M.B.A. from the Kellogg Graduate School of Management at Northwestern University.
Invesco V.I. Dividend Growth Fund
Your Fund’s Long-Term Performance
Results of a $10,000 Investment – Oldest Share Class(es)
Fund and index data from 12/31/01*
| | |
| 1 | | Source: Lipper Inc. |
| |
| * | | During the reporting period, Invesco changed its policy regarding growth of $10,000 charts. For funds older than 10 years, we previously showed performance since inception. Going forward, we will show performance for the most recent 10 years, since this more accurately reflects the experience of the typical shareholder. As a result, charts now may include benchmarks that did not appear previously, because the funds’ inception pre-dated the benchmarks’ inception. Also, all charts will now be presented using a linear format. |
Past performance cannot guarantee comparable future results.
As noted earlier in this report, the Fund
has adopted a three-tier benchmark structure to compare its performance to broad market, style-specific and peer
group market measures. These additional benchmarks will now be included in the chart above.
Average Annual Total Returns
As of 12/31/11
| | | | | | | | | |
|
| Series I Shares | | | | |
| |
| Inception (3/1/90) | | | 6.62 | % |
| |
| | 10 | | | Years | | | 1.99 | |
| |
| | 5 | | | Years | | | –1.81 | |
| |
| | 1 | | | Year | | | 0.20 | |
| |
| | | | | | | | | |
| Series II Shares | | | | |
| |
| Inception (6/5/00) | | | 1.65 | % |
| |
| | 10 | | | Years | | | 1.73 | |
| |
| | 5 | | | Years | | | –2.06 | |
| |
| | 1 | | | Year | | | –0.06 | |
Effective June 1, 2010, Class X and Class Y shares of the predecessor fund, Morgan Stanley Variable Investment Dividend Growth Portfolio, advised by Morgan Stanley Investment Advisors Inc. were reorganized into Series I and Series II shares, respectively, of Invesco V.I. Dividend Growth Fund. Returns shown above for Series I and Series II shares are blended returns of the predecessor fund and Invesco V.I. Dividend Growth Fund. Share class returns will differ from the predecessor fund because of different expenses.
The performance data quoted represent past performance and cannot guarantee comparable future results; current performance may be lower or higher. Please contact your variable product issuer or financial adviser for the most recent month-end variable product performance.
Performance figures reflect Fund expenses, reinvested distributions and changes in net asset value. Investment return and principal value will fluctuate so that you may have a gain or loss when you sell shares.
The net annual Fund operating expense ratio set forth in the most recent Fund prospectus as of the date of this report for Series I and Series II shares was 0.67% and 0.92%, respectively.1 The total annual Fund operating expense ratio set forth in the most recent Fund prospectus as of the date of this report for Series I and Series II shares was 0.82% and 1.07%, respectively. The expense ratios presented above may vary from the expense ratios presented in other sections of this report that are based on expenses incurred during the period covered by this report.
Invesco V.I. Dividend Growth Fund, a series portfolio of AIM Variable Insurance Funds (Invesco Variable Insurance Funds), is currently offered through insurance companies issuing variable products. You cannot purchase shares of the Fund directly. Performance figures given represent the Fund and are not intended to reflect actual variable product values. They do not reflect sales charges, expenses and fees assessed in connection with a variable product. Sales charges, expenses and fees, which are determined by the variable product issuers, will vary and will lower the total return.
The most recent month-end performance data at the Fund level, excluding variable product charges, is available at 800 451 4246. As mentioned above, for the most recent month-end performance including variable product charges, please contact your variable product issuer or financial adviser.
| | |
| 1 | | Total annual Fund operating expenses after any contractual fee waivers and/or expense reimbursements by the adviser in effect through at least June 30, 2012. See current prospectus for more information. |
Invesco V.I. Dividend Growth Fund
Invesco V.I. Dividend Growth Fund’s investment objective is to provide reasonable current income and long-term growth of income and capital.
| n | | Unless otherwise stated, information presented in this report is as of December 31, 2011, and is based on total net assets. |
| |
| n | | Unless otherwise noted, all data provided by Invesco. |
| |
| n | | To access your Fund’s reports/prospectus, visit invesco.com/fundreports. |
Principal risks of investing in the Fund
Common stock risk. In general, stock values fluctuate in response to activities specific to the company as well as general market, economic and political conditions. Stock prices can fluctuate widely in response to these factors.
Depositary receipts risk. Depositary receipts involve many of the same risks as those associated with direct investment in foreign securities. In addition, the underlying issuers of certain depositary receipts, particularly unsponsored or unregistered depositary receipts, are under no obligation to distribute shareholder communications to the holders of such receipts or to pass through to them any voting rights with respect to the deposited securities.
Foreign securities risk. The risks of investing in securities of foreign issuers can include fluctuations in foreign currencies, foreign currency exchange controls, political and economic instability, differences in securities regulation and trading, and foreign taxation issues.
Derivatives risk. A derivative instrument often has risks similar to its underlying instrument and may have additional risks, including imperfect correlation between the value of the derivative and the underlying instrument, risks of default by the other party to certain transactions, magnification of losses incurred due to changes in the market value of the securities, instruments, indices or interest rates to which they relate, and risks that the transactions may not be liquid. Certain derivative transactions may give rise to a form of leverage. Leverage magnifies the potential for gain and the risk of loss.
Futures risk. A decision as to whether, when and how to use futures involves the exercise of skill and judgment and even a well conceived futures transaction may be unsuccessful because of market behavior or unexpected events.
Options risk. A decision as to whether, when and how to use options involves the exercise of skill and judgment and even a well conceived option transaction may be unsuccessful because of market behavior or unexpected events. The prices of options can be highly volatile and the use of options can lower total returns.
Swaps risk. A swap contract is an agreement between two parties pursuant to which the parties exchange payments at specified dates on the basis of a specified notional amount, with the payments calculated by reference to specified securities, indexes, reference rates, currencies or other instruments. Swaps are subject to credit risk and counterparty risk.
About indexes used in this report
The S&P 500® Index is an unmanaged index considered representative of the U.S. stock market.
The Russell 1000® Index is an unmanaged index considered representative of large-cap stocks. The Russell 1000 Index is a trademark/ service mark of the Frank Russell Co. Russell® is a trademark of the Frank Russell Co.
The Lipper VUF Large-Cap Core Funds Index is an unmanaged index considered representative of large-cap core variable insurance underlying funds tracked by Lipper.
The Fund is not managed to track the performance of any particular index, including the index(es) defined here, and consequently, the performance of the Fund may deviate significantly from the performance of the index(es).
A direct investment cannot be made in an index. Unless otherwise indicated, index results include reinvested dividends, and they do not reflect sales charges. Performance of the peer group, if applicable, reflects fund expenses; performance of a market index does not.
Other information
The Chartered Financial Analyst® (CFA®) designation is globally recognized and attests to a charterholder’s success in a rigorous and comprehensive study program in the field of investment management and research analysis.
Industry classifications used in this report are generally according to the Global Industry Classification Standard, which was developed by and is the exclusive property and a service mark of MSCI Inc. and Standard & Poor’s.
The returns shown in management’s discussion of Fund performance are based on net asset values calculated for shareholder transactions. Generally accepted accounting principles require adjustments to be made to the net assets of the Fund at period end for financial reporting purposes, and as such, the net asset values for shareholder transactions and the returns based on those net asset values may differ from the net asset values and returns reported in the Financial Highlights. Additionally, the returns and net asset values shown throughout this report are at the Fund level only and do not include variable product issuer charges. If such charges were included, the total returns would be lower.
Invesco V.I. Dividend Growth Fund
Schedule of Investments(a)
December 31, 2011
| | | | | | | | | |
| | | Shares | | Value |
| |
Common Stocks–94.61%
|
Aerospace & Defense–4.34%
| | | | |
| General Dynamics Corp. | | | 107,843 | | | $ | 7,161,854 | |
| |
| Raytheon Co. | | | 141,043 | | | | 6,823,660 | |
| |
| | | | | | | | 13,985,514 | |
| |
Apparel Retail–0.58%
| | | | |
| TJX Cos., Inc. | | | 28,834 | | | | 1,861,235 | |
| |
Asset Management & Custody Banks–1.67%
| | | | |
| Federated Investors, Inc.–Class B | | | 256,252 | | | | 3,882,218 | |
| |
| State Street Corp. | | | 37,207 | | | | 1,499,814 | |
| |
| | | | | | | | 5,382,032 | |
| |
Auto Parts & Equipment–1.56%
| | | | |
| Johnson Controls, Inc. | | | 160,285 | | | | 5,010,509 | |
| |
Brewers–2.27%
| | | | |
| Heineken N.V. (Netherlands) | | | 158,760 | | | | 7,329,505 | |
| |
Building Products–2.00%
| | | | |
| Masco Corp. | | | 615,988 | | | | 6,455,554 | |
| |
Casinos & Gaming–1.50%
| | | | |
| International Game Technology | | | 281,125 | | | | 4,835,350 | |
| |
Consumer Finance–1.89%
| | | | |
| Capital One Financial Corp. | | | 143,916 | | | | 6,086,208 | |
| |
Data Processing & Outsourced Services–2.16%
| | | | |
| Automatic Data Processing, Inc. | | | 128,561 | | | | 6,943,580 | |
| |
Department Stores–0.03%
| | | | |
| Nordstrom, Inc. | | | 2,054 | | | | 102,104 | |
| |
Distillers & Vintners–0.27%
| | | | |
| Treasury Wine Estates (Australia) | | | 227,094 | | | | 854,760 | |
| |
Diversified Chemicals–0.33%
| | | | |
| E. I. du Pont de Nemours and Co. | | | 23,434 | | | | 1,072,808 | |
| |
Drug Retail–1.04%
| | | | |
| Walgreen Co. | | | 101,705 | | | | 3,362,367 | |
| |
Electric Utilities–6.29%
| | | | |
| American Electric Power Co., Inc. | | | 177,002 | | | | 7,311,953 | |
| |
| Entergy Corp. | | | 62,527 | | | | 4,567,597 | |
| |
| Exelon Corp. | | | 151,222 | | | | 6,558,498 | |
| |
| PPL Corp. | | | 62,494 | | | | 1,838,573 | |
| |
| | | | | | | | 20,276,621 | |
| |
Food Distributors–2.01%
| | | | |
| Sysco Corp. | | | 221,242 | | | | 6,489,028 | |
| |
Gas Utilities–1.32%
| | | | |
| AGL Resources Inc. | | | 100,276 | | | | 4,237,664 | |
| |
General Merchandise Stores–1.91%
| | | | |
| Target Corp. | | | 120,412 | | | | 6,167,503 | |
| |
Health Care Equipment–3.01%
| | | | |
| Medtronic, Inc. | | | 110,933 | | | | 4,243,187 | |
| |
| Stryker Corp. | | | 109,649 | | | | 5,450,652 | |
| |
| | | | | | | | 9,693,839 | |
| |
Hotels, Resorts & Cruise Lines–1.79%
| | | | |
| Accor S.A. (France) | | | 64,045 | | | | 1,614,090 | |
| |
| Marriott International Inc.–Class A | | | 141,937 | | | | 4,140,302 | |
| |
| | | | | | | | 5,754,392 | |
| |
Household Products–5.59%
| | | | |
| Kimberly-Clark Corp. | | | 143,485 | | | | 10,554,757 | |
| |
| Procter & Gamble Co. (The) | | | 111,962 | | | | 7,468,985 | |
| |
| | | | | | | | 18,023,742 | |
| |
Housewares & Specialties–0.90%
| | | | |
| Newell Rubbermaid Inc. | | | 179,181 | | | | 2,893,773 | |
| |
Industrial Machinery–3.11%
| | | | |
| Illinois Tool Works Inc. | | | 48,030 | | | | 2,243,481 | |
| |
| Pentair, Inc. | | | 184,493 | | | | 6,141,772 | |
| |
| Snap-On Inc. | | | 32,314 | | | | 1,635,735 | |
| |
| | | | | | | | 10,020,988 | |
| |
Integrated Oil & Gas–1.30%
| | | | |
| Exxon Mobil Corp. | | | 27,215 | | | | 2,306,743 | |
| |
| Total S.A. (France) | | | 36,876 | | | | 1,882,260 | |
| |
| | | | | | | | 4,189,003 | |
| |
Integrated Telecommunication Services–1.00%
| | | | |
| AT&T Inc. | | | 106,865 | | | | 3,231,598 | |
| |
Investment Banking & Brokerage–1.32%
| | | | |
| Charles Schwab Corp. (The) | | | 378,411 | | | | 4,260,908 | |
| |
Life & Health Insurance–2.91%
| | | | |
| Lincoln National Corp. | | | 123,635 | | | | 2,400,991 | |
| |
| Prudential Financial, Inc. | | | 48,856 | | | | 2,448,663 | |
| |
| StanCorp Financial Group, Inc. | | | 123,532 | | | | 4,539,801 | |
| |
| | | | | | | | 9,389,455 | |
| |
Motorcycle Manufacturers–0.91%
| | | | |
| Harley-Davidson, Inc. | | | 75,322 | | | | 2,927,766 | |
| |
| | | | | | | | | |
| | | | | | | | | |
See accompanying Notes to Financial Statements which are an integral part of the financial statements.
Invesco V.I. Dividend Growth Fund
| | | | | | | | | |
| | | Shares | | Value |
| |
Movies & Entertainment–1.93%
| | | | |
| Time Warner Inc. | | | 171,870 | | | $ | 6,211,382 | |
| |
Multi-Utilities–3.31%
| | | | |
| Dominion Resources, Inc. | | | 83,220 | | | | 4,417,317 | |
| |
| PG&E Corp. | | | 38,844 | | | | 1,601,150 | |
| |
| Sempra Energy | | | 84,645 | | | | 4,655,475 | |
| |
| | | | | | | | 10,673,942 | |
| |
Office Services & Supplies–0.36%
| | | | |
| Avery Dennison Corp. | | | 39,905 | | | | 1,144,475 | |
| |
Oil & Gas Storage & Transportation–0.20%
| | | | |
| Southern Union Co. | | | 15,183 | | | | 639,356 | |
| |
Packaged Foods & Meats–7.93%
| | | | |
| Campbell Soup Co. | | | 190,689 | | | | 6,338,502 | |
| |
| General Mills, Inc. | | | 254,475 | | | | 10,283,335 | |
| |
| Kraft Foods Inc.–Class A | | | 172,723 | | | | 6,452,931 | |
| |
| Mead Johnson Nutrition Co. | | | 36,156 | | | | 2,485,002 | |
| |
| | | | | | | | 25,559,770 | |
| |
Paper Products–1.80%
| | | | |
| International Paper Co. | | | 195,904 | | | | 5,798,758 | |
| |
Personal Products–0.70%
| | | | |
| L’Oreal S.A (France) | | | 21,713 | | | | 2,267,923 | |
| |
Pharmaceuticals–4.98%
| | | | |
| Bristol-Myers Squibb Co. | | | 69,474 | | | | 2,448,264 | |
| |
| Eli Lilly & Co. | | | 136,262 | | | | 5,663,048 | |
| |
| Johnson & Johnson | | | 102,210 | | | | 6,702,932 | |
| |
| Novartis AG (Switzerland) | | | 21,823 | | | | 1,247,759 | |
| |
| | | | | | | | 16,062,003 | |
| |
Property & Casualty Insurance–1.41%
| | | | |
| Travelers Cos., Inc. (The) | | | 76,971 | | | | 4,554,374 | |
| |
Regional Banks–7.14%
| | | | |
| Cullen/Frost Bankers, Inc. | | | 15,329 | | | | 811,057 | |
| |
| Fifth Third Bancorp | | | 432,494 | | | | 5,501,324 | |
| |
| M&T Bank Corp. | | | 48,977 | | | | 3,738,904 | |
| |
| SunTrust Banks, Inc. | | | 413,481 | | | | 7,318,614 | |
| |
| Zions Bancorp. | | | 345,750 | | | | 5,628,810 | |
| |
| | | | | | | | 22,998,709 | |
| |
Reinsurance–0.41%
| | | | |
| Transatlantic Holdings, Inc. | | | 24,014 | | | | 1,314,286 | |
| |
Restaurants–0.86%
| | | | |
| Brinker International, Inc. | | | 103,703 | | | | 2,775,092 | |
| |
Semiconductors–1.44%
| | | | |
| Linear Technology Corp. | | | 10,056 | | | | 301,982 | |
| |
| Texas Instruments Inc. | | | 148,700 | | | | 4,328,657 | |
| |
| | | | | | | | 4,630,639 | |
| |
Soft Drinks–1.26%
| | | | |
Coca-Cola Co. (The) | | | 57,909 | | | | 4,051,893 | |
| |
Specialized Consumer Services–0.09%
| | | | |
| H&R Block, Inc. | | | 17,966 | | | | 293,385 | |
| |
Specialized REIT’s–1.63%
| | | | |
| Weyerhaeuser Co. | | | 281,700 | | | | 5,259,339 | |
| |
Specialty Chemicals–0.53%
| | | | |
| Ecolab Inc. | | | 29,669 | | | | 1,715,165 | |
| |
Systems Software–1.74%
| | | | |
| Microsoft Corp. | | | 215,781 | | | | 5,601,675 | |
| |
Thrifts & Mortgage Finance–1.59%
| | | | |
| Capitol Federal Financial Inc. | | | 11,148 | | | | 128,648 | |
| |
| Hudson City Bancorp, Inc. | | | 800,043 | | | | 5,000,269 | |
| |
| | | | | | | | 5,128,917 | |
| |
Tobacco–2.29%
| | | | |
| Altria Group, Inc. | | | 156,566 | | | | 4,642,182 | |
| |
| Philip Morris International Inc. | | | 34,896 | | | | 2,738,638 | |
| |
| | | | | | | | 7,380,820 | |
| |
| Total Common Stocks (Cost $302,436,259) | | | | | | | 304,899,709 | |
| |
Money Market Funds–3.92%
|
Liquid Assets Portfolio–Institutional Class(b) | | | 6,316,590 | | | | 6,316,590 | |
| |
Premier Portfolio–Institutional Class(b) | | | 6,316,591 | | | | 6,316,591 | |
| |
| Total Money Market Funds (Cost $12,633,181) | | | | | | | 12,633,181 | |
| |
| TOTAL INVESTMENTS–98.53% (Cost $315,069,440) | | | | | | | 317,532,890 | |
| |
| OTHER ASSETS LESS LIABILITIES–1.47% | | | | | | | 4,741,836 | |
| |
| NET ASSETS–100.00% | | | | | | $ | 322,274,726 | |
| |
Notes to Schedule of Investments:
| | |
| (a) | | Industry and/or sector classifications used in this report are generally according to the Global Industry Classification Standard, which was developed by and is the exclusive property and a service mark of MSCI Inc. and Standard & Poor’s. |
| (b) | | The money market fund and the Fund are affiliated by having the same investment adviser. |
See accompanying Notes to Financial Statements which are an integral part of the financial statements.
Invesco V.I. Dividend Growth Fund
Statement of Assets and Liabilities
December 31, 2011
| | | | | |
Assets:
|
| Investments, at value (Cost $302,436,259) | | $ | 304,899,709 | |
| |
| Investments in affiliated money market funds, at value and cost | | | 12,633,181 | |
| |
| Total investments, at value (Cost $315,069,440) | | | 317,532,890 | |
| |
| Foreign currencies, at value (Cost $4,811,756) | | | 4,884,287 | |
| |
| Receivable for: | | | | |
| Investments sold | | | 1,592,347 | |
| |
| Fund shares sold | | | 51,989 | |
| |
| Dividends | | | 680,758 | |
| |
| Investment for trustee deferred compensation and retirement plans | | | 24,251 | |
| |
| Total assets | | | 324,766,522 | |
| |
Liabilities:
|
| Payable for: | | | | |
| Investments purchased | | | 983,901 | |
| |
| Fund shares reacquired | | | 294,787 | |
| |
| Accrued fees to affiliates | | | 943,219 | |
| |
| Accrued other operating expenses | | | 209,379 | |
| |
| Trustee deferred compensation and retirement plans | | | 60,510 | |
| |
| Total liabilities | | | 2,491,796 | |
| |
| Net assets applicable to shares outstanding | | $ | 322,274,726 | |
| |
Net assets consist of:
|
| Shares of beneficial interest | | $ | 416,621,316 | |
| |
| Undistributed net investment income | | | 6,604,125 | |
| |
| Undistributed net realized gain (loss) | | | (103,486,621 | ) |
| |
| Unrealized appreciation | | | 2,535,906 | |
| |
| | | $ | 322,274,726 | |
| |
Net Assets:
|
| Series I | | $ | 253,850,228 | |
| |
| Series II | | $ | 68,424,498 | |
| |
Shares outstanding, $0.001 par value per share, with an unlimited number of shares authorized:
|
| Series I | | | 18,075,818 | |
| |
| Series II | | | 4,886,234 | |
| |
| Series I: | | | | |
| Net asset value per share | | $ | 14.04 | |
| |
| Series II: | | | | |
| Net asset value per share | | $ | 14.00 | |
| |
Statement of Operations
For the year ended December 31, 2011
| | | | | |
Investment income:
|
| Dividends (net of foreign withholding taxes of $138,805) | | $ | 8,678,492 | |
| |
| Dividends from affiliated money market funds | | | 13,351 | |
| |
| Interest | | | 41,888 | |
| |
| Total investment income | | | 8,733,731 | |
| |
Expenses:
|
| Advisory fees | | | 1,579,045 | |
| |
| Administrative services fees | | | 298,206 | |
| |
| Custodian fees | | | 38,270 | |
| |
| Distribution fees — Series II | | | 161,910 | |
| |
| Transfer agent fees | | | 27,186 | |
| |
| Trustees’ and officers’ fees and benefits | | | 33,748 | |
| |
| Other | | | 47,327 | |
| |
| Total expenses | | | 2,185,692 | |
| |
| Less: Fees waived | | | (18,200 | ) |
| |
| Net expenses | | | 2,167,492 | |
| |
| Net investment income | | | 6,566,239 | |
| |
Realized and unrealized gain (loss) from:
|
| Net realized gain from: | | | | |
| Investment securities (includes net gains (losses) from securities sold to affiliates of $(185,852)) | | | 23,602,811 | |
| |
| Foreign currencies | | | 84,894 | |
| |
| | | | 23,687,705 | |
| |
| Change in net unrealized appreciation (depreciation) of: | | | | |
| Investment securities | | | (41,221,706 | ) |
| |
| Foreign currencies | | | 73,352 | |
| |
| Foreign currency contracts | | | 235 | |
| |
| | | | (41,148,119 | ) |
| |
| Net realized and unrealized gain (loss) | | | (17,460,414 | ) |
| |
| Net increase (decrease) in net assets resulting from operations | | $ | (10,894,175 | ) |
| |
See accompanying Notes to Financial Statements which are an integral part of the financial statements.
Invesco V.I. Dividend Growth Fund
Statement of Changes in Net Assets
For the years ended December 31, 2011 and 2010
| | | | | | | | | |
| | | 2011 | | 2010 |
| |
Operations:
|
| Net investment income | | $ | 6,566,239 | | | $ | 3,571,412 | |
| |
| Net realized gain | | | 23,687,705 | | | | 3,469,462 | |
| |
| Change in net unrealized appreciation (depreciation) | | | (41,148,119 | ) | | | 15,628,383 | |
| |
| Net increase (decrease) in net assets resulting from operations | | | (10,894,175 | ) | | | 22,669,257 | |
| |
Distributions to shareholders from net investment income:
|
| Series I | | | (2,886,405 | ) | | | (3,255,974 | ) |
| |
| Series II | | | (680,347 | ) | | | (803,719 | ) |
| |
| Total distributions from net investment income | | | (3,566,752 | ) | | | (4,059,693 | ) |
| |
Share transactions–net:
|
| Series I | | | 85,833,062 | | | | (27,025,327 | ) |
| |
| Series II | | | 19,990,978 | | | | (17,414,065 | ) |
| |
| Net increase (decrease) in net assets resulting from share transactions | | | 105,824,040 | | | | (44,439,392 | ) |
| |
| Net increase (decrease) in net assets | | | 91,363,113 | | | | (25,829,828 | ) |
| |
Net assets:
|
| Beginning of year | | | 230,911,613 | | | | 256,741,441 | |
| |
| End of year (includes undistributed net investment income of $6,604,125 and $3,539,933, respectively) | | $ | 322,274,726 | | | $ | 230,911,613 | |
| |
Notes to Financial Statements
December 31, 2011
NOTE 1—Significant Accounting Policies
Invesco V.I. Dividend Growth Fund (the “Fund”) is a series portfolio of AIM Variable Insurance Funds (Invesco Variable Insurance Funds) (the “Trust”). The Trust is a Delaware statutory trust registered under the Investment Company Act of 1940, as amended (the “1940 Act”), as an open-end series management investment company consisting of twenty-eight separate portfolios, (each constituting a “Fund”). The assets, liabilities and operations of each portfolio are accounted for separately. Information presented in these financial statements pertains only to the Fund. Matters affecting each Fund or class will be voted on exclusively by the shareholders of such Fund or class. Current Securities and Exchange Commission (“SEC”) guidance, however, requires participating insurance companies offering separate accounts to vote shares proportionally in accordance with the instructions of the contract owners whose investments are funded by shares of each Fund or class.
The Fund’s investment objective is to provide reasonable current income and long-term growth of income and capital.
The Fund currently offers two classes of shares, Series I and Series II, both of which are offered to insurance company separate accounts funding variable annuity contracts and variable life insurance policies (“variable products”).
The following is a summary of the significant accounting policies followed by the Fund in the preparation of its financial statements.
| | |
| A. | | Security Valuations — Securities, including restricted securities, are valued according to the following policy. |
| | A security listed or traded on an exchange (except convertible bonds) is valued at its last sales price or official closing price as of the close of the customary trading session on the exchange where the security is principally traded, or lacking any sales or official closing price on a particular day, the security may be valued at the closing bid price on that day. Securities traded in the over-the-counter market are valued based on prices furnished by independent pricing services or market makers. When such securities are valued by an independent pricing service they may be considered fair valued. Futures contracts are valued at the final settlement price set by an exchange on which they are principally traded. Listed options are valued at the mean between the last bid and ask prices from the exchange on which they are principally traded. Options not listed on an exchange are valued by an independent source at the mean between the last bid and ask prices. For purposes of determining net asset value per share, futures and option contracts generally are valued 15 minutes after the close of the customary trading session of the New York Stock Exchange (“NYSE”). |
| | Investments in open-end and closed-end registered investment companies that do not trade on an exchange are valued at the end of day net asset value per share. Investments in open-end and closed-end registered investment companies that trade on an exchange are valued at the last sales price or official closing price as of the close of the customary trading session on the exchange where the security is principally traded. |
Invesco V.I. Dividend Growth Fund
| | |
| | Debt obligations (including convertible bonds) and unlisted equities are fair valued using an evaluated quote provided by an independent pricing service. Evaluated quotes provided by the pricing service may be determined without exclusive reliance on quoted prices, and may reflect appropriate factors such as institution-size trading in similar groups of securities, developments related to specific securities, dividend rate, yield, quality, type of issue, coupon rate, maturity, individual trading characteristics and other market data. Debt securities are subject to interest rate and credit risks. In addition, all debt securities involve some risk of default with respect to interest and/or principal payments. |
| | Foreign securities (including foreign exchange contracts) are converted into U.S. dollar amounts using the applicable exchange rates as of the close of the NYSE. If market quotations are available and reliable for foreign exchange traded equity securities, the securities will be valued at the market quotations. Because trading hours for certain foreign securities end before the close of the NYSE, closing market quotations may become unreliable. If between the time trading ends on a particular security and the close of the customary trading session on the NYSE, events occur that are significant and make the closing price unreliable, the Fund may fair value the security. If the event is likely to have affected the closing price of the security, the security will be valued at fair value in good faith using procedures approved by the Board of Trustees. Adjustments to closing prices to reflect fair value may also be based on a screening process of an independent pricing service to indicate the degree of certainty, based on historical data, that the closing price in the principal market where a foreign security trade is not the current value as of the close of the NYSE. Foreign securities meeting the approved degree of certainty that the price is not reflective of current value will be priced at the indication of fair value from the independent pricing service. Multiple factors may be considered by the independent pricing service in determining adjustments to reflect fair value and may include information relating to sector indices, American Depositary Receipts and domestic and foreign index futures. Foreign securities may have additional risks including exchange rate changes, potential for sharply devalued currencies and high inflation, political and economic upheaval, the relative lack of issuer information, relatively low market liquidity and the potential lack of strict financial and accounting controls and standards. |
| | Securities for which market prices are not provided by any of the above methods may be valued based upon quotes furnished by independent sources. The last bid price may be used to value equity securities. The mean between the last bid and asked prices is used to value debt obligations, including Corporate Loans. |
| | Securities for which market quotations are not readily available or are unreliable are valued at fair value as determined in good faith by or under the supervision of the Trust’s officers following procedures approved by the Board of Trustees. Issuer specific events, market trends, bid/ask quotes of brokers and information providers and other market data may be reviewed in the course of making a good faith determination of a security’s fair value. |
| | Valuations change in response to many factors including the historical and prospective earnings of the issuer, the value of the issuer’s assets, general economic conditions, interest rates, investor perceptions and market liquidity. Because of the inherent uncertainties of valuation, the values reflected in the financial statements may materially differ from the value received upon actual sale of those investments. |
| B. | | Securities Transactions and Investment Income — Securities transactions are accounted for on a trade date basis. Realized gains or losses on sales are computed on the basis of specific identification of the securities sold. Interest income is recorded on the accrual basis from settlement date. Dividend income (net of withholding tax, if any) is recorded on the ex-dividend date. |
| | The Fund may periodically participate in litigation related to Fund investments. As such, the Fund may receive proceeds from litigation settlements. Any proceeds received are included in the Statement of Operations as realized gain (loss) for investments no longer held and as unrealized gain (loss) for investments still held. |
| | Brokerage commissions and mark ups are considered transaction costs and are recorded as an increase to the cost basis of securities purchased and/or a reduction of proceeds on a sale of securities. Such transaction costs are included in the determination of net realized and unrealized gain (loss) from investment securities reported in the Statement of Operations and the Statement of Changes in Net Assets and the net realized and unrealized gains (losses) on securities per share in the Financial Highlights. Transaction costs are included in the calculation of the Fund’s net asset value and, accordingly, they reduce the Fund’s total returns. These transaction costs are not considered operating expenses and are not reflected in net investment income reported in the Statement of Operations and Statement of Changes in Net Assets, or the net investment income per share and ratios of expenses and net investment income reported in the Financial Highlights, nor are they limited by any expense limitation arrangements between the Fund and the investment adviser. |
| | The Fund allocates income and realized and unrealized capital gains and losses to a class based on the relative net assets of each class. |
| C. | | Country Determination — For the purposes of making investment selection decisions and presentation in the Schedule of Investments, the investment adviser may determine the country in which an issuer is located and/or credit risk exposure based on various factors. These factors include the laws of the country under which the issuer is organized, where the issuer maintains a principal office, the country in which the issuer derives 50% or more of its total revenues and the country that has the primary market for the issuer’s securities, as well as other criteria. Among the other criteria that may be evaluated for making this determination are the country in which the issuer maintains 50% or more of its assets, the type of security, financial guarantees and enhancements, the nature of the collateral and the sponsor organization. Country of issuer and/or credit risk exposure has been determined to be the United States of America, unless otherwise noted. |
| D. | | Distributions — Distributions from income and net realized capital gain, if any, are generally paid to separate accounts of participating insurance companies annually and recorded on ex-dividend date. |
| E. | | Federal Income Taxes — The Fund intends to comply with the requirements of Subchapter M of the Internal Revenue Code necessary to qualify as a regulated investment company and to distribute substantially all of the Fund’s taxable earnings to shareholders. As such, the Fund will not be subject to federal income taxes on otherwise taxable income (including net realized capital gain) that is distributed to shareholders. Therefore, no provision for federal income taxes is recorded in the financial statements. |
| | The Fund files tax returns in the U.S. Federal jurisdiction and certain other jurisdictions. Generally, the Fund is subject to examinations by such taxing authorities for up to three years after the filing of the return for the tax period. |
Invesco V.I. Dividend Growth Fund
| | |
| F. | | Expenses — Fees provided for under the Rule 12b-1 plan of a particular class of the Fund and which are directly attributable to that class are charged to the operations of such class. All other expenses are allocated among the classes based on relative net assets. |
| G. | | Accounting Estimates — The preparation of financial statements in conformity with accounting principles generally accepted in the United States of America (“GAAP”) requires management to make estimates and assumptions that affect the reported amounts of assets and liabilities at the date of the financial statements and the reported amounts of revenues and expenses during the reporting period including estimates and assumptions related to taxation. Actual results could differ from those estimates by a significant amount. In addition, the Fund monitors for material events or transactions that may occur or become known after the period-end date and before the date the financial statements are released to print. |
| H. | | Indemnifications — Under the Trust’s organizational documents, each Trustee, officer, employee or other agent of the Trust is indemnified against certain liabilities that may arise out of performance of their duties to the Fund. Additionally, in the normal course of business, the Fund enters into contracts, including the Fund’s servicing agreements that contain a variety of indemnification clauses. The Fund’s maximum exposure under these arrangements is unknown as this would involve future claims that may be made against the Fund that have not yet occurred. The risk of material loss as a result of such indemnification claims is considered remote. |
| I. | | Foreign Currency Translations — Foreign currency is valued at the close of the NYSE based on quotations posted by banks and major currency dealers. Portfolio securities and other assets and liabilities denominated in foreign currencies are translated into U.S. dollar amounts at date of valuation. Purchases and sales of portfolio securities (net of foreign taxes withheld on disposition) and income items denominated in foreign currencies are translated into U.S. dollar amounts on the respective dates of such transactions. The Fund does not separately account for the portion of the results of operations resulting from changes in foreign exchange rates on investments and the fluctuations arising from changes in market prices of securities held. The combined results of changes in foreign exchange rates and the fluctuation of market prices on investments (net of estimated foreign tax withholding) are included with the net realized and unrealized gain or loss from investments in the Statement of Operations. Reported net realized foreign currency gains or losses arise from (1) sales of foreign currencies, (2) currency gains or losses realized between the trade and settlement dates on securities transactions, and (3) the difference between the amounts of dividends, interest, and foreign withholding taxes recorded on the Fund’s books and the U.S. dollar equivalent of the amounts actually received or paid. Net unrealized foreign currency gains and losses arise from changes in the fair values of assets and liabilities, other than investments in securities at fiscal period end, resulting from changes in exchange rates. |
| | The Fund may invest in foreign securities which may be subject to foreign taxes on income, gains on investments or currency repatriation, a portion of which may be recoverable. |
| J. | | Foreign Currency Contracts — The Fund may enter into foreign currency contracts to manage or minimize currency or exchange rate risk. The Fund may also enter into foreign currency contracts for the purchase or sale of a security denominated in a foreign currency in order to “lock in” the U.S. dollar price of that security. A foreign currency contract is an obligation to purchase or sell a specific currency for an agreed-upon price at a future date. The use of foreign currency contracts does not eliminate fluctuations in the price of the underlying securities the Fund owns or intends to acquire but establishes a rate of exchange in advance. Fluctuations in the value of these contracts are measured by the difference in the contract date and reporting date exchange rates and are recorded as unrealized appreciation (depreciation) until the contracts are closed. When the contracts are closed, realized gains (losses) are recorded. Realized and unrealized gains (losses) on the contracts are included in the Statement of Operations. The primary risks associated with foreign currency contracts include failure of the counterparty to meet the terms of the contract and the value of the foreign currency changing unfavorably. These risks may be in excess of the amounts reflected in the Statement of Assets and Liabilities. |
NOTE 2—Advisory Fees and Other Fees Paid to Affiliates
The Trust has entered into a master investment advisory agreement with Invesco Advisers, Inc. (the “Adviser” or “Invesco”). Under the terms of the investment advisory agreement, the Fund pays an advisory fee to the Adviser based on the annual rate of the Fund’s average daily net assets as follows:
| | | | | |
| Average Daily Net Assets | | Rate |
| |
| First $250 million | | | 0 | .545% |
| |
| Next $750 million | | | 0 | .42% |
| |
| Next $1 billion | | | 0 | .395% |
| |
| Over $2 billion | | | 0 | .37% |
| |
Under the terms of a master sub-advisory agreement between the Adviser and each of Invesco Asset Management Deutschland GmbH, Invesco Asset Management Limited, Invesco Asset Management (Japan) Limited, Invesco Australia Limited, Invesco Hong Kong Limited, Invesco Senior Secured Management, Inc. and Invesco Canada Ltd. (collectively, the “Affiliated Sub-Advisers”) the Adviser, not the Fund, may pay 40% of the fees paid to the Adviser to any such Affiliated Sub-Adviser(s) that provide discretionary investment management services to the Fund based on the percentage of assets allocated to such Sub-Adviser(s).
The Adviser has contractually agreed, through at least June 30, 2012, to waive advisory fees and/or reimburse expenses of all shares to the extent necessary to limit total annual fund operating expenses after fee waiver and/or expense reimbursement (excluding certain items discussed below) of Series I shares to 0.67% and Series II shares to 0.92% of average daily net assets. In determining the Adviser’s obligation to waive advisory fees and/or reimburse expenses, the following expenses are not taken into account, and could cause the total annual fund operating expenses after fee waiver and/or expense reimbursement to exceed the numbers reflected above: (1) interest; (2) taxes; (3) dividend expense on short sales; (4) extraordinary or non-routine items, including litigation expenses; and (5) expenses that the Fund has incurred but did not actually pay because of an expense offset arrangement. Unless the Board of the Trustees and Invesco
Invesco V.I. Dividend Growth Fund
mutually agree to amend or continue the fee waiver agreement, it will terminate on June 30, 2012. The Advisor did not waive fees and/or reimburse expenses during the period under this expense limitation.
Further, the Adviser has contractually agreed, through at least June 30, 2012, to waive the advisory fee payable by the Fund in an amount equal to 100% of the net advisory fees the Adviser receives from the affiliated money market funds on investments by the Fund of uninvested cash in such affiliated money market funds.
For the year ended December 31, 2011, the Adviser waived advisory fees of $18,200.
The Trust has entered into a master administrative services agreement with Invesco pursuant to which the Fund has agreed to pay Invesco a fee for costs incurred in providing accounting services and fund administrative services to the Fund and to reimburse Invesco for administrative services fees paid to insurance companies that have agreed to provide services to the participants of separate accounts. These administrative services provided by the insurance companies may include, among other things: the printing of prospectuses, financial reports and proxy statements and the delivery of the same to existing participants; the maintenance of master accounts; the facilitation of purchases and redemptions requested by the participants; and the servicing of participants’ accounts. Pursuant to such agreement, for the year ended December 31, 2011, Invesco was paid $79,358 for accounting and fund administrative services and reimbursed $218,848 for services provided by insurance companies.
The Trust has entered into a transfer agency and service agreement with Invesco Investment Services, Inc. (“IIS”) pursuant to which the Fund has agreed to pay IIS a fee for providing transfer agency and shareholder services to the Fund and reimburse IIS for certain expenses incurred by IIS in the course of providing such services. For the year ended December 31, 2011, expenses incurred under the agreement are shown in the Statement of Operations as transfer agent fees.
The Trust has entered into a master distribution agreement with Invesco Distributors, Inc. (“IDI”) to serve as the distributor for the Fund. The Trust has adopted a plan pursuant to Rule 12b-1 under the 1940 Act with respect to the Fund’s Series II shares (the “Plan”). The Fund, pursuant to the Plan, pays IDI compensation at the annual rate of 0.25% of the Fund’s average daily net assets of Series II shares. Of the Plan payments, up to 0.25% of the average daily net assets of the Series II shares may be paid to insurance companies who furnish continuing personal shareholder services to customers who purchase and own Series II shares of the Fund. For the year ended December 31, 2011, expenses incurred under the Plan are detailed in the Statement of Operations as distribution fees.
Certain officers and trustees of the Trust are officers and directors of the Adviser, Invesco Ltd., IIS and/or IDI.
NOTE 3—Additional Valuation Information
GAAP defines fair value as the price that would be received to sell an asset or paid to transfer a liability in an orderly transaction between market participants at the measurement date, under current market conditions. GAAP establishes a hierarchy that prioritizes the inputs to valuation methods giving the highest priority to readily available unadjusted quoted prices in an active market for identical assets (Level 1) and the lowest priority to significant unobservable inputs (Level 3) generally when market prices are not readily available or are unreliable. Based on the valuation inputs, the securities or other investments are tiered into one of three levels. Changes in valuation methods may result in transfers in or out of an investment’s assigned level:
| | |
| | Level 1 — | Prices are determined using quoted prices in an active market for identical assets. |
| | Level 2 — | Prices are determined using other significant observable inputs. Observable inputs are inputs that other market participants may use in pricing a security. These may include quoted prices for similar securities, interest rates, prepayment speeds, credit risk, yield curves, loss severities, default rates, discount rates, volatilities and others. |
| | Level 3 — | Prices are determined using significant unobservable inputs. In situations where quoted prices or observable inputs are unavailable (for example, when there is little or no market activity for an investment at the end of the period), unobservable inputs may be used. Unobservable inputs reflect the Fund’s own assumptions about the factors market participants would use in determining fair value of the securities or instruments and would be based on the best available information. |
The following is a summary of the tiered valuation input levels, as of December 31, 2011. The level assigned to the securities valuations may not be an indication of the risk or liquidity associated with investing in those securities. Because of the inherent uncertainties of valuation, the values reflected in the financial statements may materially differ from the value received upon actual sale of those investments.
During the year ended December 31, 2011, there were no significant transfers between investment levels.
| | | | | | | | | | | | | | | | | |
| | | Level 1 | | Level 2 | | Level 3 | | Total |
| |
| Equity Securities | | $ | 306,707,036 | | | $ | 10,825,854 | | | $ | — | | | $ | 317,532,890 | |
| |
NOTE 4—Derivative Investments
Effect of Derivative Instruments for the year ended December 31, 2011
The table below summarizes the gains on derivative instruments, detailed by primary risk exposure, recognized in earnings during the period:
| | | | | |
| | | Location of Gain (Loss) on
|
| | | Statement of Operations |
| | | Foreign Currency Contracts |
| |
| Change in Unrealized Appreciation (Depreciation) | | | | |
| |
| Currency risk | | $ | 235 | |
| |
Invesco V.I. Dividend Growth Fund
NOTE 5—Security Transactions with Affiliated Funds
The Fund is permitted to purchase or sell securities from or to certain other Invesco Funds under specified conditions outlined in procedures adopted by the Board of Trustees of the Trust. The procedures have been designed to ensure that any purchase or sale of securities by the Fund from or to another fund or portfolio that is or could be considered an affiliate by virtue of having a common investment adviser (or affiliated investment advisers), common Trustees and/or common officers complies with Rule 17a-7 of the 1940 Act. Further, as defined under the procedures, each transaction is effected at the current market price. Pursuant to these procedures, for the year ended December 31, 2011, the Fund engaged in securities sales of $563,803, which resulted in net realized gains (losses) of $(185,852).
NOTE 6—Trustees’ and Officers’ Fees and Benefits
“Trustees’ and Officers’ Fees and Benefits” include amounts accrued by the Fund to pay remuneration to certain Trustees and Officers of the Fund. Trustees have the option to defer compensation payable by the Fund, and “Trustees’ and Officers’ Fees and Benefits” also include amounts accrued by the Fund to fund such deferred compensation amounts. Those Trustees who defer compensation have the option to select various Invesco Funds in which their deferral accounts shall be deemed to be invested. Finally, certain current Trustees are eligible to participate in a retirement plan that provides for benefits to be paid upon retirement to Trustees over a period of time based on the number of years of service. The Fund may have certain former Trustees who also participate in a retirement plan and receive benefits under such plan. “Trustees’ and Officers’ Fees and Benefits” include amounts accrued by the Fund to fund such retirement benefits. Obligations under the deferred compensation and retirement plans represent unsecured claims against the general assets of the Fund.
During the year ended December 31, 2011, the Fund paid legal fees of $1,439 for services rendered by Kramer, Levin, Naftalis & Frankel LLP as counsel to the Independent Trustees. A partner of that firm is a Trustee of the Trust.
NOTE 7—Cash Balances
The Fund is permitted to temporarily carry a negative or overdrawn balance in its account with State Street Bank and Trust Company, the custodian bank. To compensate the custodian bank for such overdrafts, the overdrawn Fund may either (1) leave funds as a compensating balance in the account so the custodian bank can be compensated by earning the additional interest; or (2) compensate by paying the custodian bank at a rate agreed upon by the custodian bank and Invesco, not to exceed the contractually agreed upon rate.
NOTE 8—Distributions to Shareholders and Tax Components of Net Assets
Tax Character of Distributions to Shareholders Paid During the Years Ended December 31, 2011 and 2010:
| | | | | | | | | |
| | | 2011 | | 2010 |
| |
| Ordinary income | | $ | 3,566,752 | | | $ | 4,059,693 | |
| |
Tax Components of Net Assets at Period-End:
| | | | | |
| | | 2011 |
| |
| Undistributed ordinary income | | $ | 6,660,322 | |
| |
| Net unrealized appreciation — investments | | | 1,445,342 | |
| |
| Net unrealized appreciation — other investments | | | 72,456 | |
| |
| Temporary book/tax differences | | | (56,199 | ) |
| |
| Capital loss carryforward | | | (102,468,511 | ) |
| |
| Shares of beneficial interest | | | 416,621,316 | |
| |
| Total net assets | | $ | 322,274,726 | |
| |
The difference between book-basis and tax-basis unrealized appreciation (depreciation) is due to differences in the timing of recognition of gains and losses on investments for tax and book purposes. The Fund’s net unrealized appreciation (depreciation) difference is attributable primarily to wash sales.
The temporary book/tax differences are a result of timing differences between book and tax recognition of income and/or expenses. The Fund’s temporary book/tax differences are the result of the trustee deferral of compensation and retirement plan benefits.
Capital loss carryforward is calculated and reported as of a specific date. Results of transactions and other activity after that date may affect the amount of capital loss carryforward actually available for the Fund to utilize. The Regulated Investment Company Modernization Act of 2010 (the “Act”) eliminated the eight-year carryover period for capital losses that arise in taxable years beginning after its enactment date of December 22, 2010. Consequently, these capital losses can be carried forward for an unlimited period. However, capital losses with an expiration period may not be used to offset capital gains until all net capital losses without an expiration date have been utilized. Additionally, post-enactment capital loss carryovers will retain their character as either short-term or long-term capital losses instead of as short-term capital losses as under prior law. The ability to utilize capital loss carryforward in the future may be limited under the Internal Revenue Code and related regulations based on the results of future transactions. Under these limitation rules, the Fund is limited to utilizing $71,259,646 of capital loss carryforward in the fiscal year ending December 31, 2012.
Invesco V.I. Dividend Growth Fund
The Fund utilized $21,591,283 of capital loss carryforward in the current period to offset net realized capital gain for federal income tax purposes. The Fund has a capital loss carryforward as of December 31, 2011, which expires as follows:
| | | | | |
| Capital Loss Carryforward* |
| Expiration | | Short-Term |
| |
| December 31, 2015 | | $ | 7,857,133 | |
| |
| December 31, 2016 | | | 42,750,790 | |
| |
| December 31, 2017 | | | 51,860,588 | |
| |
| | | $ | 102,468,511 | |
| |
| |
| * | Capital loss carryforward as of the date listed above is reduced for limitations, if any, to the extent required by the Internal Revenue Code. To the extent that unrealized gains as of May 2, 2011, the date of reorganizations of Invesco V.I. Financial Services Fund and Invesco V.I. Select Dimensions Dividend Growth Fund into the Fund are realized on securities held in each fund at such date of reorganizations, the capital loss carryforward may be further limited for up to five years from the date of the reorganizations. |
NOTE 9—Investment Securities
The aggregate amount of investment securities (other than short-term securities, U.S. Treasury obligations and money market funds, if any) purchased and sold by the Fund during the year ended December 31, 2011 was $95,771,046 and $87,457,474, respectively. Cost of investments on a tax basis includes the adjustments for financial reporting purposes as of the most recently completed Federal income tax reporting period-end.
| | | | | |
| Unrealized Appreciation (Depreciation) of Investment Securities on a Tax Basis |
| |
| Aggregate unrealized appreciation of investment securities | | $ | 24,738,552 | |
| |
| Aggregate unrealized (depreciation) of investment securities | | | (23,293,210 | ) |
| |
| Net unrealized appreciation of investment securities | | $ | 1,445,342 | |
| |
| Cost of investments for tax purposes is $316,087,548. | | | | |
NOTE 10—Reclassification of Permanent Differences
Primarily as a result of differing book/tax treatment of capital loss carryforward transactions on December 31, 2011, undistributed net investment income was increased by $93,665, undistributed net realized gain (loss) was increased by $51,432,237 and shares of beneficial interest decreased by $51,525,902. Further, primarily as a result of capital loss carryforward acquired in the reorganization of Invesco V.I. Financial Services Fund and Invesco V.I. Select Dimensions Dividend Growth Fund into the Fund, undistributed net investment income was decreased by $28,960, undistributed net realized gain (loss) was decreased by $74,020,269 and shares of beneficial interest increased by $74,049,229. These reclassifications had no effect on the net assets of the Fund.
Invesco V.I. Dividend Growth Fund
NOTE 11—Share Information
| | | | | | | | | | | | | | | | | |
| | | Summary of Share Activity |
| |
| | | Year ended December 31, |
| | | 2011(a) | | 2010 |
| | | Shares | | Amount | | Shares | | Amount |
| |
| Sold: | | | | | | | | | | | | | | | | |
| Series I | | | 600,069 | | | $ | 8,253,518 | | | | 42,162 | | | $ | 556,286 | |
| |
| Series II | | | 243,810 | | | | 3,335,950 | | | | 41,409 | | | | 523,697 | |
| |
| Issued as reinvestment of dividends: | | | | | | | | | | | | | | | | |
| Series I | | | 195,688 | | | | 2,886,405 | | | | 254,971 | | | | 3,255,974 | |
| |
| Series II | | | 46,157 | | | | 680,347 | | | | 63,037 | | | | 803,719 | |
| |
Issued in connection with acquisitions:(b) | | | | | | | | | | | | | | | | |
| Series I | | | 8,156,451 | | | | 124,094,426 | | | | — | | | | — | |
| |
| Series II | | | 2,222,881 | | | | 33,755,005 | | | | — | | | | — | |
| |
| Reacquired: | | | | | | | | | | | | | | | | |
| Series I | | | (3,485,401 | ) | | | (49,401,287 | ) | | | (2,334,157 | ) | | | (30,837,587 | ) |
| |
| Series II | | | (1,246,445 | ) | | | (17,780,324 | ) | | | (1,409,722 | ) | | | (18,741,481 | ) |
| |
| Net increase (decrease) in share activity | | | 6,733,210 | | | $ | 105,824,040 | | | | (3,342,300 | ) | | $ | (44,439,392 | ) |
| |
| | |
| (a) | | There are entities that are record owners of more than 5% of the outstanding shares of the Fund and in the aggregate own 77% of the outstanding shares of the Fund. The Fund and the Fund’s principal underwriter or adviser, are parties to participation agreements with these entities whereby these entities sell units of interest in separate accounts funding variable products that are invested in the Fund. The Fund, Invesco and/or Invesco affiliates may make payments to these entities, which are considered to be related to the Fund, for providing services to the Fund, Invesco and/or Invesco affiliates including but not limited to services such as, securities brokerage, third party record keeping and account servicing and administrative services. The Fund has no knowledge as to whether all or any portion of the shares owned of record by these entities are also owned beneficially. |
| (b) | | As of the opening of business on May 2, 2011, the Fund acquired all of the net assets of Invesco V.I. Financial Services Fund and Invesco V.I. Select Dimensions Dividend Growth Fund (the “Target Funds”) pursuant to a plan of reorganization approved by the Trustees of the Fund on November 10, 2010 and by the shareholders of the Target Funds on April 1, 2011. The acquisition was accomplished by a tax-free exchange of 10,379,332 shares of the Fund for 11,415,021 shares outstanding of Invesco V.I. Financial Services Fund and 5,444,017 shares outstanding of Invesco V.I. Select Dimensions Dividend Growth Fund as of the close of business on April 29, 2011. Series I and Series II shares of the Target Funds were exchanged for Series I and Series II shares of the Fund based on the relative net asset value of each Target Fund to the net asset value of the Fund on the close of business, April 29, 2011. Invesco V.I. Financial Services Fund’s net assets at that date of $67,820,291, including $7,630,530 of unrealized appreciation and Invesco V.I. Select Dimensions Dividend Growth Fund’s net assets at that date of $90,029,140, including $12,545,232 of unrealized appreciation were combined with those of the Fund. The net assets of the Fund immediately before the acquisition were $235,469,889 and $393,319,320 immediately after the acquisition. |
The pro forma results of operations for the year ended December 31, 2011, assuming the reorganization had been completed on January 1, 2011, the beginning of the annual reporting period are as follows:
| | | | | |
| Net investment income | | $ | 6,976,767 | |
| Net realized/unrealized gains (losses) | | | (6,722,411 | ) |
| | | | | |
| Change in net assets resulting from operations | | $ | 254,356 | |
The combined investment portfolios have been managed as a single integrated portfolio since the acquisition was completed, it is not practicable to separate the amounts of revenue and earnings of each Target Fund that has been included in the Fund’s Statement of Operations since May 2, 2011.
Invesco V.I. Dividend Growth Fund
NOTE 12—Financial Highlights
The following schedule presents financial highlights for a share of the Fund outstanding throughout the periods indicated.
| | | | | | | | | | | | | | | | | | | | | | | | | | | | | | | | | | | | | | | | | | | | | | | | | |
| | | | | | | | | | | | | | | | | | | Ratio of
| | Ratio of
| | | | |
| | | | | | | Net gains
| | | | | | | | | | | | expenses
| | expenses
| | | | |
| | | | | | | (losses) on
| | | | | | | | | | | | to average
| | to average net
| | Ratio of net
| | |
| | | Net asset
| | | | securities
| | | | Dividends
| | | | | | | | net assets
| | assets without
| | investment
| | |
| | | value,
| | Net
| | (both
| | Total from
| | from net
| | Net asset
| | | | Net assets,
| | with fee waivers
| | fee waivers
| | income
| | |
| | | beginning
| | investment
| | realized and
| | investment
| | investment
| | value, end
| | Total
| | end of period
| | and/or expenses
| | and/or expenses
| | to average
| | Portfolio
|
| | | of period | | income(a) | | unrealized) | | operations | | income | | of period | | Return(b) | | (000s omitted) | | absorbed | | absorbed | | net assets | | turnover(c) |
| |
| Series I |
| Year ended 12/31/11 | | $ | 14.24 | | | $ | 0.31 | | | $ | (0.27 | ) | | $ | 0.04 | | | $ | (0.24 | ) | | $ | 14.04 | | | | 0.20 | % | | $ | 253,850 | | | | 0.66 | %(d) | | | 0.67 | %(d) | | | 2.24 | %(d) | | | 38 | % |
| Year ended 12/31/10 | | | 13.13 | | | | 0.21 | | | | 1.14 | | | | 1.35 | | | | (0.24 | ) | | | 14.24 | | | | 10.48 | | | | 179,518 | | | | 0.68 | | | | 0.79 | | | | 1.59 | | | | 78 | |
| Year ended 12/31/09 | | | 10.78 | | | | 0.20 | | | | 2.37 | | | | 2.57 | | | | (0.22 | ) | | | 13.13 | | | | 24.30 | | | | 192,279 | | | | 0.67 | | | | 0.67 | | | | 1.80 | | | | 44 | |
| Year ended 12/31/08 | | | 17.01 | | | | 0.25 | | | | (6.41 | ) | | | (6.16 | ) | | | (0.07 | ) | | | 10.78 | | | | (36.35 | ) | | | 184,579 | | | | 0.63 | | | | 0.63 | | | | 1.72 | | | | 61 | |
| Year ended 12/31/07 | | | 16.53 | | | | 0.22 | | | | 0.48 | | | | 0.70 | | | | (0.22 | ) | | | 17.01 | | | | 4.22 | | | | 368,737 | | | | 0.58 | | | | 0.58 | | | | 1.27 | | | | 48 | |
| |
| Series II |
| Year ended 12/31/11 | | | 14.20 | | | | 0.28 | | | | (0.28 | ) | | | 0.00 | | | | (0.20 | ) | | | 14.00 | | | | (0.06 | ) | | | 68,424 | | | | 0.91 | (d) | | | 0.92 | (d) | | | 1.99 | (d) | | | 38 | |
| Year ended 12/31/10 | | | 13.09 | | | | 0.19 | | | | 1.12 | | | | 1.31 | | | | (0.20 | ) | | | 14.20 | | | | 10.20 | | | | 51,394 | | | | 0.93 | | | | 1.04 | | | | 1.34 | | | | 78 | |
| Year ended 12/31/09 | | | 10.75 | | | | 0.17 | | | | 2.36 | | | | 2.53 | | | | (0.19 | ) | | | 13.09 | | | | 23.94 | | | | 64,463 | | | | 0.92 | | | | 0.92 | | | | 1.55 | | | | 44 | |
| Year ended 12/31/08 | | | 16.98 | | | | 0.21 | | | | (6.38 | ) | | | (6.17 | ) | | | (0.06 | ) | | | 10.75 | | | | (36.46 | ) | | | 59,030 | | | | 0.88 | | | | 0.88 | | | | 1.47 | | | | 61 | |
| Year ended 12/31/07 | | | 16.51 | | | | 0.17 | | | | 0.48 | | | | 0.65 | | | | (0.18 | ) | | | 16.98 | | | | 3.90 | | | | 116,271 | | | | 0.83 | | | | 0.83 | | | | 1.02 | | | | 48 | |
| |
| | |
| (a) | | Calculated using average shares outstanding. |
| (b) | | Includes adjustments in accordance with accounting principles generally accepted in the United States of America and as such, the net asset value for financial reporting purposes and the returns based upon those net asset values may differ from the net asset value and returns for shareholder transactions. Total returns are not annualized for periods less than one year, if applicable and do not reflect charges assessed in connection with a variable product, which if included would reduce total returns. |
| (c) | | Portfolio turnover is calculated at the fund level and is not annualized for periods less than one year, if applicable. For the period ending December 31, 2011, the portfolio turnover calculation excludes the value of securities purchased of $134,975,378 and sold of $57,441,776 in the effort to realign the Fund’s portfolio holdings after the reorganization of Invesco V.I. Select Dimensions Dividend Growth Fund and Invesco V.I. Financial Services Fund into the Fund. |
| (d) | | Ratios are based on average daily net assets (000’s) of $236,795 and $64,764 for Series I and Series II shares, respectively. |
Invesco V.I. Dividend Growth Fund
Report of Independent Registered Public Accounting Firm
To the Board of Trustees of AIM Variable Insurance Funds (Invesco Variable Insurance Funds)
and Shareholders of Invesco V.I. Dividend Growth Fund:
In our opinion, the accompanying statement of assets and liabilities, including the schedule of investments, and the related statements of operations and of changes in net assets and the financial highlights present fairly, in all material respects, the financial position of Invesco V.I. Dividend Growth Fund (one of the funds constituting AIM Variable Insurance Funds (Invesco Variable Insurance Funds), hereafter referred to as the “Fund”) at December 31, 2011, the results of its operations for the year then ended, the changes in its net assets and the financial highlights for each of the two years in the period then ended, in conformity with accounting principles generally accepted in the United States of America. These financial statements and financial highlights (hereafter referred to as “financial statements”) are the responsibility of the Fund’s management; our responsibility is to express an opinion on these financial statements based on our audits. We conducted our audits of these financial statements in accordance with the standards of the Public Company Accounting Oversight Board (United States). Those standards require that we plan and perform the audits to obtain reasonable assurance about whether the financial statements are free of material misstatement. An audit includes examining, on a test basis, evidence supporting the amounts and disclosures in the financial statements, assessing the accounting principles used and significant estimates made by management, and evaluating the overall financial statement presentation. We believe that our audits, which included confirmation of securities at December 31, 2011 by correspondence with the custodian and brokers, provide a reasonable basis for our opinion. The financial highlights of the Fund for the periods ended December 31, 2009 and prior were audited by other independent auditors whose report dated February 26, 2010 expressed an unqualified opinion on those financial statements.
PRICEWATERHOUSECOOPERS LLP
February 14, 2012
Houston, Texas
Invesco V.I. Dividend Growth Fund
Calculating your ongoing Fund expenses
Example
As a shareholder of the Fund, you incur ongoing costs, including management fees; distribution and/or service fees (12b-1); and other Fund expenses. This example is intended to help you understand your ongoing costs (in dollars) of investing in the Fund and to compare these costs with ongoing costs of investing in other mutual funds. The example is based on an investment of $1,000 invested at the beginning of the period and held for the entire period July 1, 2011 through December 31, 2011.
The actual and hypothetical expenses in the examples below do not represent the effect of any fees or other expenses assessed in connection with a variable product; if they did, the expenses shown would be higher while the ending account values shown would be lower.
Actual expenses
The table below provides information about actual account values and actual expenses. You may use the information in this table, together with the amount you invested, to estimate the expenses that you paid over the period. Simply divide your account value by $1,000 (for example, an $8,600 account value divided by $1,000 = 8.6), then multiply the result by the number in the table under the heading entitled “Actual Expenses Paid During Period” to estimate the expenses you paid on your account during this period.
Hypothetical example for comparison purposes
The table below also provides information about hypothetical account values and hypothetical expenses based on the Fund’s actual expense ratio and an assumed rate of return of 5% per year before expenses, which is not the Fund’s actual return.
The hypothetical account values and expenses may not be used to estimate the actual ending account balance or expenses you paid for the period. You may use this information to compare the ongoing costs of investing in the Fund and other funds. To do so, compare this 5% hypothetical example with the 5% hypothetical examples that appear in the shareholder reports of the other funds.
Please note that the expenses shown in the table are meant to highlight your ongoing costs. Therefore, the hypothetical information is useful in comparing ongoing costs, and will not help you determine the relative total costs of owning different funds.
| | | | | | | | | | | | | | | | | | | | | | | | | | | | | | | |
| | | | | | | | | | HYPOTHETICAL
| | | |
| | | | | | | ACTUAL | | | (5% annual return before expenses) | | | |
| | | | Beginning
| | | Ending
| | | Expenses
| | | Ending
| | | Expenses
| | | Annualized
|
| | | | Account Value
| | | Account Value
| | | Paid During
| | | Account Value
| | | Paid During
| | | Expense
|
| Class | | | (07/01/11) | | | (12/31/11)1 | | | Period2 | | | (12/31/11) | | | Period2 | | | Ratio |
| Series I | | | $ | 1,000.00 | | | | $ | 940.40 | | | | $ | 3.23 | | | | $ | 1,021.88 | | | | $ | 3.36 | | | | | 0.66 | % |
| | | | | | | | | | | | | | | | | | | | | | | | | | | | | | | |
| Series II | | | | 1,000.00 | | | | | 939.00 | | | | | 4.45 | | | | | 1,020.62 | | | | | 4.63 | | | | | 0.91 | |
| | | | | | | | | | | | | | | | | | | | | | | | | | | | | | | |
| |
| 1 | The actual ending account value is based on the actual total return of the Fund for the period July 1, 2011 through December 31, 2011, after actual expenses and will differ from the hypothetical ending account value which is based on the Fund’s expense ratio and a hypothetical annual return of 5% before expenses. |
| 2 | Expenses are equal to the Fund’s annualized expense ratio as indicated above multiplied by the average account value over the period, multiplied by 184/365 to reflect the most recent fiscal half year. |
Invesco V.I. Dividend Growth Fund
Form 1099-DIV, Form 1042-S and other year-end tax information provide shareholders with actual calendar year amounts that should be included in their tax returns. Shareholders should consult their tax advisors.
The following distribution information is being provided as required by the Internal Revenue Code or to meet a specific state’s requirement.
The Fund designates the following amounts or, if subsequently determined to be different, the maximum amount allowable for its fiscal year ended December 31, 2011:
| | | | | |
Federal and State Income Tax | | |
| |
| Corporate Dividends Received Deduction* | | | 100.00% | |
| | |
| | * | The above percentages are based on ordinary income dividends paid to shareholders during the Fund’s fiscal year. |
Invesco V.I. Dividend Growth Fund
Trustees and Officers
The address of each trustee and officer is AIM Variable Insurance Funds (Invesco Variable Insurance Funds) (the “Trust”), 11 Greenway Plaza, Suite 2500, Houston, Texas 77046-1173. The trustees serve for the life of the Trust, subject to their earlier death, incapacitation, resignation, retirement or removal as more specifically provided in the Trust’s organizational documents. Each officer serves for a one year term or until their successors are elected and qualified. Column two below includes length of time served with predecessor entities, if any.
| | | | | | | | | |
| | | | | | | Number of Funds
| | |
Name, Year of Birth and
| | Trustee and/
| | Principal Occupation(s)
| | in Fund Complex
| | Other Directorship(s)
|
| Position(s) Held with the Trust | | or Officer Since | | During Past 5 Years | | Overseen by Trustee | | Held by Trustee |
| | | | | | | | | |
| | | | | | | | | |
| | | | | | | | | |
| Interested Persons | | | | | | | | |
| | | | | | | | | |
| | | | | | | | | |
| | | | | | | | | |
Martin L. Flanagan1 — 1960
Trustee | | 2007 | | Executive Director, Chief Executive Officer and President, Invesco Ltd. (ultimate parent of Invesco and a global investment management firm); Advisor to the Board, Invesco Advisers, Inc. (formerly known as Invesco Institutional (N.A.), Inc.); Trustee, The Invesco Funds; Vice Chair, Investment Company Institute; and Member of Executive Board, SMU Cox School of Business
Formerly: Chairman, Invesco Advisers, Inc. (registered investment adviser); Director, Chairman, Chief Executive Officer and President, IVZ Inc. (holding company), INVESCO Group Services, Inc. (service provider) and Invesco North American Holdings, Inc. (holding company); Director, Chief Executive Officer and President, Invesco Holding Company Limited (parent of Invesco and a global investment management firm); Director, Invesco Ltd.; Chairman, Investment Company Institute and President, Co-Chief Executive Officer, Co-President, Chief Operating Officer and Chief Financial Officer, Franklin Resources, Inc. (global investment management organization) | | 140 | | None |
| | | | | | | | | |
| | | | | | | | | |
| | | | | | | | | |
Philip A. Taylor2 — 1954
Trustee, President and Principal Executive Officer | | 2006 | | Head of North American Retail and Senior Managing Director, Invesco Ltd.; Director, Co-Chairman, Co-President and Co-Chief Executive Officer, Invesco Advisers, Inc. (formerly known as Invesco Institutional (N.A.), Inc.) (registered investment adviser); Director, Chairman, Chief Executive Officer and President, Invesco Management Group, Inc. (formerly Invesco Aim Management Group, Inc.) (financial services holding company); Director and President, INVESCO Funds Group, Inc. (registered investment adviser and registered transfer agent); Director and Chairman, Invesco Investment Services, Inc. (formerly known as Invesco Aim Investment Services, Inc.) (registered transfer agent) and IVZ Distributors, Inc. (formerly known as INVESCO Distributors, Inc.) (registered broker dealer); Director, President and Chairman, Invesco Inc. (holding company) and Invesco Canada Holdings Inc. (holding company); Chief Executive Officer, Invesco Corporate Class Inc. (corporate mutual fund company) and Invesco Canada Fund Inc. (corporate mutual fund company); Director, Chairman and Chief Executive Officer, Invesco Canada Ltd. (formerly known as Invesco Trimark Ltd./Invesco Trimark Ltèe) (registered investment adviser and registered transfer agent); Trustee, President and Principal Executive Officer, The Invesco Funds (other than AIM Treasurer’s Series Trust (Invesco Treasurer’s Series Trust) and Short-Term Investments Trust); Trustee and Executive Vice President, The Invesco Funds (AIM Treasurer’s Series Trust (Invesco Treasurer’s Series Trust) and Short-Term Investments Trust only); Director, Invesco Investment Advisers LLC (formerly known as Van Kampen Asset Management); Director, Chief Executive Officer and President, Van Kampen Exchange Corp. | | 140 | | None |
| | | | | | | | | |
| | | | | | | | | |
| | | | | Formerly: Director and Chairman, Van Kampen Investor Services Inc.: Director, Chief Executive Officer and President, 1371 Preferred Inc. (holding company); and Van Kampen Investments Inc.; Director and President, AIM GP Canada Inc. (general partner for limited partnerships); and Van Kampen Advisors, Inc.; Director and Chief Executive Officer, Invesco Trimark Dealer Inc. (registered broker dealer); Director, Invesco Distributors, Inc. (formerly known as Invesco Aim Distributors, Inc.) (registered broker dealer); Manager, Invesco PowerShares Capital Management LLC; Director, Chief Executive Officer and President, Invesco Advisers, Inc.; Director, Chairman, Chief Executive Officer and President, Invesco Aim Capital Management, Inc.; President, Invesco Trimark Dealer Inc. and Invesco Trimark Ltd./Invesco Trimark Ltèe; Director and President, AIM Trimark Corporate Class Inc. and AIM Trimark Canada Fund Inc.; Senior Managing Director, Invesco Holding Company Limited; Trustee and Executive Vice President, Tax-Free Investments Trust; Director and Chairman, Fund Management Company (former registered broker dealer); President and Principal Executive Officer, The Invesco Funds (AIM Treasurer’s Series Trust (Invesco Treasurer’s Series Trust), Short-Term Investments Trust and Tax-Free Investments Trust only); President, AIM Trimark Global Fund Inc. and AIM Trimark Canada Fund Inc. | | | | |
| | | | | | | | | |
| | | | | | | | | |
| | | | | | | | | |
Wayne W. Whalen3 — 1939
Trustee | | 2010 | | Of Counsel, and prior to 2010, partner in the law firm of Skadden, Arps, Slate, Meagher & Flom LLP, legal counsel to funds in the Fund Complex | | 158 | | Director of the Abraham Lincoln Presidential Library Foundation |
| | | | | | | | | |
| | | | | | | | | |
| | | | | | | | | |
| Independent Trustees | | | | | | | | |
| | | | | | | | | |
| | | | | | | | | |
| | | | | | | | | |
Bruce L. Crockett — 1944
Trustee and Chair | | 1993 | | Chairman, Crockett Technology Associates (technology consulting company) | | 140 | | ACE Limited (insurance company); and Investment Company Institute |
| | | | | Formerly: Director, Captaris (unified messaging provider); Director, President and Chief Executive Officer COMSAT Corporation; and Chairman, Board of Governors of INTELSAT (international communications company) | | | | |
| | | | | | | | | |
| |
| 1 | Mr. Flanagan is considered an interested person of the Trust because he is an officer of the adviser to the Trust, and an officer and a director of Invesco Ltd., ultimate parent of the adviser to the Trust. |
| 2 | Mr. Taylor is considered an interested person of the Trust because he is an officer and a director of the adviser to, and a director of the principal underwriter of, the Trust. |
| 3 | Mr. Whalen is considered an “interested person” (within the meaning of Section 2(a)(19) of the 1940 Act) of certain Funds in the Fund Complex by reason of he and his firm currently providing legal services as legal counsel to such Funds in the Fund Complex. |
Invesco V.I. Dividend Growth Fund
Trustees and Officers—(continued)
The address of each trustee and officer is AIM Variable Insurance Funds (Invesco Variable Insurance Funds) (the “Trust”), 11 Greenway Plaza, Suite 2500, Houston, Texas 77046-1173. The trustees serve for the life of the Trust, subject to their earlier death, incapacitation, resignation, retirement or removal as more specifically provided in the Trust’s organizational documents. Each officer serves for a one year term or until their successors are elected and qualified. Column two below includes length of time served with predecessor entities, if any.
| | | | | | | | | |
| | | | | | | Number of Funds
| | |
Name, Year of Birth and
| | Trustee and/
| | Principal Occupation(s)
| | in Fund Complex
| | Other Directorship(s)
|
| Position(s) Held with the Trust | | or Officer Since | | During Past 5 Years | | Overseen by Trustee | | Held by Trustee |
| | | | | | | | | |
| | | | | | | | | |
| | | | | | | |
Independent Trustees—(continued) | | | | | | |
| | | | | | | | | |
| | | | | | | | | |
| | | | | | | | | |
David C. Arch — 1945
Trustee | | 2010 | | Chairman and Chief Executive Officer of Blistex Inc., a consumer health care products manufacturer. | | 158 | | Member of the Heartland Alliance Advisory Board, a nonprofit organization serving human needs based in Chicago. Board member of the Illinois Manufacturers’ Association. Member of the Board of Visitors, Institute for the Humanities, University of Michigan |
| | | | | | | | | |
| | | | | | | | | |
| | | | | | | | | |
Frank S. Bayley — 1939
Trustee | | 2001 | | Retired
Formerly: Director, Badgley Funds, Inc. (registered investment company) (2 portfolios) and Partner, law firm of Baker & McKenzie
Formerly: Director, Badgley Funds, Inc. (registered investment company) (2 portfolios) and Partner, law firm of Baker & McKenzie | | 140 | | Director and Chairman, C.D. Stimson Company (a real estate investment company) |
| | | | | | | | | |
| | | | | | | | | |
| | | | | | | | | |
James T. Bunch — 1942
Trustee | | 2004 | | Managing Member, Grumman Hill Group LLC (family office private equity management)
Formerly: Founder, Green, Manning & Bunch Ltd. (investment banking firm)(1988-2010); Executive Committee, United States Golf Association; and Director, Policy Studies, Inc. and Van Gilder Insurance Corporation | | 140 | | Vice Chairman, Board of Governors, Western Golf Association/Evans Scholars Foundation and Director, Denver Film Society |
| | | | | | | | | |
| | | | | | | | | |
| | | | | | | | | |
Rodney F. Dammeyer — 1940
Trustee | | 2010 | | President of CAC, LLC, a private company offering capital investment and management advisory services.
Formerly: Prior to January 2004, Director of TeleTech Holdings Inc.; Prior to 2002, Director of Arris Group, Inc.; Prior to 2001, Managing Partner at Equity Group Corporate Investments. Prior to 1995, Vice Chairman of Anixter International. Prior to 1985, experience includes Senior Vice President and Chief Financial Officer of Household International, Inc., Executive Vice President and Chief Financial Officer of Northwest Industries, Inc. and Partner of Arthur Andersen & Co. | | 158 | | Director of Quidel Corporation and Stericycle, Inc. Prior to May 2008, Trustee of The Scripps Research Institute. Prior to February 2008, Director of Ventana Medical Systems, Inc. Prior to April 2007, Director of GATX Corporation. Prior to April 2004, Director of TheraSense, Inc. |
| | | | | | | | | |
| | | | | | | | | |
| | | | | | | | | |
Albert R. Dowden — 1941
Trustee | | 2000 | | Director of a number of public and private business corporations, including the Boss Group, Ltd. (private investment and management); Reich & Tang Funds (5 portfolios) (registered investment company); and Homeowners of America Holding Corporation/ Homeowners of America Insurance Company (property casualty company)
Formerly: Director, Continental Energy Services, LLC (oil and gas pipeline service); Director, CompuDyne Corporation (provider of product and services to the public security market) and Director, Annuity and Life Re (Holdings), Ltd. (reinsurance company); Director, President and Chief Executive Officer, Volvo Group North America, Inc.; Senior Vice President, AB Volvo; Director of various public and private corporations; Chairman, DHJ Media, Inc.; Director Magellan Insurance Company; and Director, The Hertz Corporation, Genmar Corporation (boat manufacturer), National Media Corporation; Advisory Board of Rotary Power International (designer, manufacturer, and seller of rotary power engines); and Chairman, Cortland Trust, Inc. (registered investment company) | | 140 | | Board of Nature’s Sunshine Products, Inc. |
| | | | | | | | | |
| | | | | | | | | |
| | | | | | | | | |
Jack M. Fields — 1952
Trustee | | 1997 | | Chief Executive Officer, Twenty First Century Group, Inc. (government affairs company); and Owner and Chief Executive Officer, Dos Angelos Ranch, L.P. (cattle, hunting, corporate entertainment), Discovery Global Education Fund (non-profit) and Cross Timbers Quail Research Ranch (non-profit)
Formerly: Chief Executive Officer, Texana Timber LP (sustainable forestry company) and member of the U.S. House of Representatives | | 140 | | Administaff |
| | | | | | | | | |
| | | | | | | | | |
| | | | | | | | | |
Carl Frischling — 1937
Trustee | | 1993 | | Partner, law firm of Kramer Levin Naftalis and Frankel LLP | | 140 | | Director, Reich & Tang Funds (16 portfolios) |
| | | | | | | | | |
| | | | | | | | | |
Invesco V.I. Dividend Growth Fund
Trustees and Officers—(continued)
The address of each trustee and officer is AIM Variable Insurance Funds (Invesco Variable Insurance Funds) (the “Trust”), 11 Greenway Plaza, Suite 2500, Houston, Texas 77046-1173. The trustees serve for the life of the Trust, subject to their earlier death, incapacitation, resignation, retirement or removal as more specifically provided in the Trust’s organizational documents. Each officer serves for a one year term or until their successors are elected and qualified. Column two below includes length of time served with predecessor entities, if any.
| | | | | | | | | |
| | | | | | | Number of Funds
| | |
Name, Year of Birth and
| | Trustee and/
| | Principal Occupation(s)
| | in Fund Complex
| | Other Directorship(s)
|
| Position(s) Held with the Trust | | or Officer Since | | During Past 5 Years | | Overseen by Trustee | | Held by Trustee |
Independent Trustees—(continued) | | | | | | |
| | | | | | | | | |
| | | | | | | | | |
| | | | | | | | | |
Prema Mathai-Davis — 1950
Trustee | | 1998 | | Retired
Formerly: Chief Executive Officer, YWCA of the U.S.A. | | 140 | | None |
| | | | | | | | | |
| | | | | | | | | |
| | | | | | | | | |
Larry Soll — 1942
Trustee | | 2004 | | Retired
Formerly, Chairman, Chief Executive Officer and President, Synergen Corp. (a biotechnology company) | | 140 | | None |
| | | | | | | | | |
| | | | | | | | | |
| | | | | | | | | |
Hugo F. Sonnenschein — 1940
Trustee | | 2010 | | President Emeritus and Honorary Trustee of the University of Chicago and the Adam Smith Distinguished Service Professor in the Department of Economics at the University of Chicago. Prior to July 2000, President of the University of Chicago. | | 158 | | Trustee of the University of Rochester and a member of its investment committee. Member of the National Academy of Sciences, the American Philosophical Society and a fellow of the American Academy of Arts and Sciences |
| | | | | | | | | |
| | | | | | | | | |
| | | | | | | | | |
| Raymond Stickel, Jr. — 1944 Trustee | | 2005 | | Retired
Formerly: Director, Mainstay VP Series Funds, Inc. (25 portfolios) and Partner, Deloitte & Touche | | 140 | | None |
| | | | | | | | | |
| | | | | | | | | |
| | | | | | | | | |
| Other Officers | | | | | | | | |
| | | | | | | | | |
| | | | | | | | | |
| | | | | | | | | |
Russell C. Burk — 1958
Senior Vice President and Senior Officer | | 2005 | | Senior Vice President and Senior Officer, The Invesco Funds | | N/A | | N/A |
| | | | | | | | | |
| | | | | | | | | |
| | | | | | | | | |
John M. Zerr — 1962
Senior Vice President, Chief Legal Officer and Secretary | | 2006 | | Director, Senior Vice President, Secretary and General Counsel, Invesco Management Group, Inc. (formerly known as Invesco Aim Management Group, Inc.) and Van Kampen Exchange Corp.; Senior Vice President, Invesco Advisers, Inc. (formerly known as Invesco Institutional (N.A.), Inc.) (registered investment adviser); Senior Vice President and Secretary, Invesco Distributors, Inc. (formerly known as Invesco Aim Distributors, Inc.); Director, Vice President and Secretary, Invesco Investment Services, Inc. (formerly known as Invesco Aim Investment Services, Inc.) and IVZ Distributors, Inc. (formerly known as INVESCO Distributors, Inc.); Director and Vice President, INVESCO Funds Group, Inc.; Senior Vice President, Chief Legal Officer and Secretary, The Invesco Funds; Manager, Invesco PowerShares Capital Management LLC; Director, Secretary and General Counsel, Invesco Investment Advisers LLC (formerly known as Van Kampen Asset Management); Secretary and General Counsel, Van Kampen Funds Inc. and Chief Legal Officer, PowerShares Exchange-Traded Fund Trust, PowerShares Exchange-Traded Fund Trust II, PowerShares India Exchange-Traded Fund Trust and PowerShares Actively Managed Exchange-Traded Fund Trust
Formerly: Director and Secretary, Van Kampen Advisors Inc.; Director Vice President, Secretary and General Counsel Van Kampen Investor Services Inc.; Director, Invesco Distributors, Inc. (formerly known as Invesco Aim Distributors, Inc.); Director, Senior Vice President, General Counsel and Secretary, Invesco Advisers, Inc.; and Van Kampen Investments Inc.; Director, Vice President and Secretary, Fund Management Company; Director, Senior Vice President, Secretary, General Counsel and Vice President, Invesco Aim Capital Management, Inc.; Chief Operating Officer and General Counsel, Liberty Ridge Capital, Inc. (an investment adviser); Vice President and Secretary, PBHG Funds (an investment company) and PBHG Insurance Series Fund (an investment company); Chief Operating Officer, General Counsel and Secretary, Old Mutual Investment Partners (a broker-dealer); General Counsel and Secretary, Old Mutual Fund Services (an administrator) and Old Mutual Shareholder Services (a shareholder servicing center); Executive Vice President, General Counsel and Secretary, Old Mutual Capital, Inc. (an investment adviser); and Vice President and Secretary, Old Mutual Advisors Funds (an investment company) | | N/A | | N/A |
| | | | | | | | | |
| | | | | | | | | |
| | | | | | | | | |
Lisa O. Brinkley — 1959
Vice President | | 2004 | | Global Compliance Director, Invesco Ltd.; Chief Compliance Officer, Invesco Investment Services, Inc.(formerly known as Invesco Aim Investment Services, Inc.); and Vice President, The Invesco Funds
Formerly: Chief Compliance Officer, Invesco Distributors, Inc. (formerly known as Invesco Aim Distributors, Inc.) and Van Kampen Investor Services Inc.; Senior Vice President, Invesco Management Group, Inc.; Senior Vice President and Chief Compliance Officer, Invesco Advisers, Inc. and The Invesco Funds; Vice President and Chief Compliance Officer, Invesco Aim Capital Management, Inc. and Invesco Distributors, Inc.; Vice President, Invesco Investment Services, Inc. and Fund Management Company | | N/A | | N/A |
| | | | | | | | | |
Invesco V.I. Dividend Growth Fund
Trustees and Officers—(continued)
The address of each trustee and officer is AIM Variable Insurance Funds (Invesco Variable Insurance Funds) (the “Trust”), 11 Greenway Plaza, Suite 2500, Houston, Texas 77046-1173. The trustees serve for the life of the Trust, subject to their earlier death, incapacitation, resignation, retirement or removal as more specifically provided in the Trust’s organizational documents. Each officer serves for a one year term or until their successors are elected and qualified. Column two below includes length of time served with predecessor entities, if any.
| | | | | | | | | |
| | | | | | | Number of Funds
| | |
Name, Year of Birth and
| | Trustee and/
| | Principal Occupation(s)
| | in Fund Complex
| | Other Directorship(s)
|
| Position(s) Held with the Trust | | or Officer Since | | During Past 5 Years | | Overseen by Trustee | | Held by Trustee |
Other Officers—(continued) | | | | | | |
| | | | | | | | | |
| | | | | | | | | |
| | | | | | | | | |
Sheri Morris — 1964
Vice President, Treasurer and Principal Financial Officer | | 1999 | | Vice President, Treasurer and Principal Financial Officer, The Invesco Funds; Vice President, Invesco Advisers, Inc. (formerly known as Invesco Institutional (N.A.), Inc.) (registered investment adviser).
Formerly: Treasurer, PowerShares Exchange-Traded Fund Trust, PowerShares Exchange-Traded Fund Trust II, PowerShares India Exchange-Traded Fund Trust and PowerShares Actively Managed Exchange-Traded Fund Trust, Vice President, Invesco Advisers, Inc., Invesco Aim Capital Management, Inc. and Invesco Aim Private Asset Management, Inc.; Assistant Vice President and Assistant Treasurer, The Invesco Funds and Assistant Vice President, Invesco Advisers, Inc., Invesco Aim Capital Management, Inc. and Invesco Aim Private Asset Management, Inc. | | N/A | | N/A |
| | | | | | | | | |
| | | | | | | | | |
| | | | | | | | | |
Karen Dunn Kelley — 1960
Vice President | | 1993 | | Head of Invesco’s World Wide Fixed Income and Cash Management Group; Senior Vice President, Invesco Management Group, Inc. (formerly known as Invesco Aim Management Group, Inc.) and Invesco Advisers, Inc. (formerly known as Invesco Institutional (N.A.), Inc.) (registered investment adviser); Executive Vice President, Invesco Distributors, Inc. (formerly known as Invesco Aim Distributors, Inc.); Director, Invesco Mortgage Capital Inc.; Vice President, The Invesco Funds (other than AIM Treasurer’s Series Trust (Invesco Treasurer’s Series Trust) and Short-Term Investments Trust); and President and Principal Executive Officer, The Invesco Funds (AIM Treasurer’s Series Trust (Invesco Treasurer’s Series Trust) and Short-Term Investments Trust only).
Formerly: Senior Vice President, Van Kampen Investments Inc.; Vice President, Invesco Advisers, Inc. (formerly known as Invesco Institutional (N.A.), Inc.); Director of Cash Management and Senior Vice President, Invesco Advisers, Inc. and Invesco Aim Capital Management, Inc.; President and Principal Executive Officer, Tax-Free Investments Trust; Director and President, Fund Management Company; Chief Cash Management Officer, Director of Cash Management, Senior Vice President, and Managing Director, Invesco Aim Capital Management, Inc.; Director of Cash Management, Senior Vice President, and Vice President, Invesco Advisers, Inc. and The Invesco Funds (AIM Treasurer’s Series Trust (Invesco Treasurer’s Series Trust), Short-Term Investments Trust and Tax-Free Investments Trust only) | | N/A | | N/A |
| | | | | | | | | |
| | | | | | | | | |
| | | | | | | | | |
Yinka Akinsola — 1977
Anti-Money Laundering Compliance Officer | | 2011 | | Anti-Money Laundering Compliance Officer, Invesco Advisers, Inc. (formerly known as Invesco Institutional (N.A.), Inc.) (registered investment adviser); Invesco Distributors, Inc. (formerly known as Invesco Aim Distributors, Inc.), Invesco Investment Services, Inc. (formerly known as Invesco Aim Investment Services, Inc.), Invesco Management Group, Inc., The Invesco Funds, Invesco Van Kampen Closed-End Funds, Van Kampen Exchange Corp. and Van Kampen Funds Inc. | | N/A | | N/A |
| | | | | | | | | |
| | | | | | | | | |
| | | | | | | | | |
Todd L. Spillane — 1958
Chief Compliance Officer | | 2006 | | Senior Vice President, Invesco Management Group, Inc. (formerly known as Invesco Aim Management Group, Inc.) and Van Kampen Exchange Corp.; Senior Vice President and Chief Compliance Officer, Invesco Advisers, Inc. (registered investment adviser) (formerly known as Invesco Institutional (N.A.), Inc.); Chief Compliance Officer, The Invesco Funds, INVESCO Private Capital Investments, Inc. (holding company) and Invesco Private Capital, Inc. (registered investment adviser); Vice President, Invesco Distributors, Inc. (formerly known as Invesco Aim Distributors, Inc.) and Invesco Investment Services, Inc. (formerly known as Invesco Aim Investment Services, Inc.).
Formerly: Chief Compliance Officer, Invesco Van Kampen Closed-End Funds PowerShares Exchange-Traded Fund Trust, PowerShares Exchange-Traded Fund Trust II, PowerShares India Exchange-Traded Fund Trust, and PowerShares Actively Managed Exchange-Traded Fund Trust; Senior Vice President, Van Kampen Investments Inc.; Senior Vice President and Chief Compliance Officer, Invesco Advisers, Inc. and Invesco Aim Capital Management, Inc.; Chief Compliance Officer, Invesco Global Asset Management (N.A.), Inc., Invesco Senior Secured Management, Inc. (registered investment adviser) and Van Kampen Investor Services Inc.; Vice President, Invesco Aim Capital Management, Inc. and Fund Management Company | | N/A | | N/A |
| | | | | | | | | |
The Statement of Additional Information of the Trust includes additional information about the Fund’s Trustees and is available upon request, without charge, by calling 1.800.959.4246. Please refer to the Fund’s prospectus for information on the Fund’s sub-advisers.
| | | | | | | |
Office of the Fund
11 Greenway Plaza, Suite 2500
Houston, TX 77046-1173 | | Investment Adviser
Invesco Advisers, Inc.
1555 Peachtree Street, N.E.
Atlanta, GA 30309 | | Distributor
Invesco Distributors, Inc.
11 Greenway Plaza, Suite 2500
Houston, TX 77046-1173 | | Auditors
PricewaterhouseCoopers LLP
1201 Louisiana Street, Suite 2900
Houston, TX 77002-5678 |
| | | | | | | |
| | | | | | | |
Counsel to the Fund
Stradley Ronon Stevens & Young, LLP
2600 One Commerce Square
Philadelphia, PA 19103 | | Counsel to the Independent Trustees
Kramer, Levin, Naftalis & Frankel LLP
1177 Avenue of the Americas
New York, NY 10036-2714 | | Transfer Agent
Invesco Investment Services, Inc.
11 Greenway Plaza, Suite 2500
Houston, TX77046-1173 | | Custodian
State Street Bank and Trust Company
225 Franklin
Boston, MA 02110-2801 |
Invesco V.I. Dividend Growth Fund
Invesco V.I. Global Health Care FundAnnual Report to Shareholders§ December 31, 2011The Fund provides a complete list of its holdings four times in each fiscal year, at the quarter-ends. For the second and fourth quarters, the lists appear in the Fund’s semiannual and annual reports to shareholders. For the first and third quarters, the Fund files the lists with the Securities and Exchange Commission (SEC) on Form N-Q. The Fund’s Form N-Q filings are available on the SEC website, sec.gov. Copies of the Fund’s Forms N-Q may be reviewed and copied at the SEC Public Reference Room in Washington, D.C. You can obtain information on the operation of the Public Reference Room, including information about duplicating fee charges, by calling 202 551 8090 or 800 732 0330, or by electronic request at the following email address: publicinfo@sec.gov. The SEC file numbers for the Fund are 811-07452 and 033-57340. The Fund’s most recent portfolio holdings, as filed on Form N-Q, have also been made available to insurance companies issuing variable annuity contracts and variable life insurance policies (“variable products”) that invest in the Fund.
A description of the policies and procedures that the Fund uses to determine how to vote proxies relating to portfolio securities is available without charge, upon request, from our Client Services department at 800 959 4246 or at invesco.com/proxyguidelines. The information is also available on the SEC website, sec.gov.
Information regarding how the Fund voted proxies related to its portfolio securities during the 12 months ended June 30, 2011, is available at invesco.com/proxysearch. The information is also available on the SEC website, sec.gov.
Invesco Advisers, Inc. is an investment adviser; it provides investment advisory services to individual and institutional clients and does not sell securities. Invesco Distributors, Inc. is the U.S. distributor for Invesco Ltd.’s retail mutual funds, exchange-traded funds and institutional money market funds. Both are wholly owned, indirect subsidiaries of Invesco Ltd.
This report must be accompanied or preceded by a currently effective Fund prospectus and variable product prospectus, which contain more complete information, including sales charges and expenses. Investors should read each carefully before investing.
Invesco Distributors, Inc.
I-VIGHC-AR-1
| | | | | |
|
| | | | | |
NOT FDIC INSURED | | MAY LOSE VALUE | | NO BANK GUARANTEE |
Management’s Discussion of Fund Performance
Performance summary
For the year ended December 31, 2011, Invesco V.I. Global Health Care Fund, excluding variable product issuer charges, outperformed the Fund’s broad market index, the MSCI World Index, but underperformed the Fund’s style-specific benchmark, the MSCI World Health Care Index. The Fund’s relative results were largely attributable to holdings in the pharmaceuticals industry, which underperformed those within the style-specific benchmark. The Fund’s life sciences tools and services holdings and its cash position also detracted from relative results. Managed health care stocks made the largest contribution to results on both a relative and absolute basis.
Your Fund’s long-term performance appears later in this report.
Fund vs. Indexes
Total returns, 12/31/10 to 12/31/11, excluding variable product issuer charges.
If variable product issuer charges were included, returns would be lower.
| | | | | |
|
| Series I Shares | | | 3.95 | % |
| |
| Series II Shares | | | 3.72 | |
| |
MSCI World Index▼ (Broad Market Index) | | | -5.54 | |
| |
MSCI World Health Care Index▼ (Style-Specific Index) | | | 9.46 | |
| |
Lipper VUF Health/Biotechnology Funds Category Average▼ (Peer Group) | | 7.48 |
| |
Source(s): ▼Lipper Inc.
How we invest
We seek health care stocks of all market capitalizations from around the world that we believe are attractively priced and have the potential to benefit from long-term earnings and cash flow growth.
In selecting securities for the Fund, we first screen the global investment universe. Stocks of at least $200 million in market capitalization are considered for further evaluation if they are identified as having attractive growth prospects relative to their current valuations. We use a research-oriented bottom-up investment approach, focusing on company fundamentals in an effort to uncover future growth prospects which are not yet appreciated by the market.
In analyzing specific industries for possible investment, we ordinarily look for several of the following characteristics: above-average growth and demand; scientific and medical advances; below-average
reimbursement risk; and high barriers to entry.
In analyzing specific companies for possible investment, we ordinarily look for several of the following characteristics: leading companies with defensible franchises; companies in the midst of a new product cycle; value-added and/or niche-oriented products and/or services; potentially sustainable revenue growth; the potential to expand profit margins and improve profitability; superior earnings-per-share growth; strong balance sheet and moderate financial leverage; and a capable management team.
Stock selection is then further refined by valuation analysis. In general, we target stocks trading at compelling valuations based on one or more of the following parameters: price-to-earnings (P/E); P/E ratio versus expected earnings per share growth rate; enterprise value to earnings-before-interest-taxes-depreciation-and
amortization (EBITDA); discounted cash flow analysis; and sum of parts analysis.
The resulting target portfolio typically consists of 50-80 individual securities with exposure across most subsectors of health care and diversified by region. Additionally, position size is limited in an effort to maximize risk-adjusted returns.
We may consider selling a security when:
| n | | A stock’s price reaches its valuation target. |
| |
| n | | A company’s fundamentals deteriorate. |
| |
| n | | A company no longer meets our investment criteria. |
Market conditions and your Fund
The year began with equity markets fueled on the second round of “quantitative easing” by the U.S. Federal Reserve. Markets rose through the first quarter of 2011. Thereafter, volatility drastically increased due to civil unrest in Egypt and Libya and the devastating earthquake and tsunami in Japan. Corporate earnings were largely positive, but often overshadowed by investor concerns about continuing high unemployment, weak consumer spending and soft housing data. At the same time, the sovereign debt crisis intensified in the eurozone and growth in developed economies slowed, weighing on investor sentiment and prompting fears of a global recession. Despite signs of sustained but muted growth, these macroeconomic factors continued to weigh on markets through the end of the reporting period.
In this environment, major domestic equity indexes delivered mixed returns for the year. The MSCI World Index produced a negative return for the year, with six out of 10 sectors posting losses.1 The health care sector, however, had the highest return among the sectors.1
Portfolio Composition
By country
| | | | | |
|
| United States | | | 67.5 | % |
| |
| Switzerland | | | 7.9 | |
| |
| Ireland | | | 6.2 | |
| |
| Germany | | | 3.9 | |
| |
| Israel | | | 2.5 | |
| |
| Brazil | | | 2.3 | |
| |
| United Kingdom | | | 2.1 | |
| |
| Countries Each Less Than 2% of Portfolio | | | 3.2 | |
| |
Money Market Funds | | | | |
Plus Other Assets Less Liabilities | | | 4.4 | |
Top 10 Equity Holdings*
| | | | | | | | | |
|
| | 1. | | | Roche Holding AG | | | 4.2 | % |
| |
| | 2. | | | Gilead Sciences, Inc. | | | 4.0 | |
| |
| | 3. | | | CVS Caremark Corp. | | | 3.4 | |
| |
| | 4. | | | Thermo Fisher Scientific, Inc. | | | 3.3 | |
| |
| | 5. | | | BioMarin Pharmaceutical Inc. | | | 2.9 | |
| |
| | 6. | | | Aetna Inc. | | | 2.7 | |
| |
| | 7. | | | UnitedHealth Group Inc. | | | 2.7 | |
| |
| | 8. | | | Novartis AG-ADR | | | 2.7 | |
| |
| | 9. | | | Abbott Laboratories | | | 2.7 | |
| |
| | 10. | | | Bayer AG | | | 2.6 | |
Top Five Industries
| | | | | | | | | |
|
| | 1. | | | Pharmaceuticals | | | 25.9 | % |
| |
| | 2. | | | Biotechnology | | | 18.4 | |
| |
| | 3. | | | Managed Health Care | | | 15.5 | |
| |
| | 4. | | | Health Care Equipment | | | 10.5 | |
| |
| | 5. | | | Health Care Services | | | 6.3 | |
| | | | | |
|
| Total Net Assets | | $141.9 million | |
| | | | | |
| Total Number of Holdings* | | | 60 | |
The Fund’s holdings are subject to change, and there is no assurance that the Fund will continue to hold any particular security.
*Excluding money market fund holdings.
Invesco V.I. Global Health Care Fund
The largest contributor to Fund results during the reporting period was Pharmasset, a biotechnology company whose primary focus is the development of oral therapeutics for the treatment of hepatitis C. While the company has no products currently on the market, a number of its experimental-stage oral treatments have produced encouraging results and helped increase the company’s share price. In the third quarter of 2011, the Food and Drug Administration (FDA) granted “fast track” designation to one of the company’s antiviral drug candidates, PSI-938, which may expedite its development and speed up a possible review. In September, Pharmasset released promising data on the ability of one of its other drugs to suppress hepatitis C infections. Both events sent shares of the company higher.
Biogen Idec was another contributor to Fund performance for the year. The company develops and markets therapeutics in the areas of neurology, immunology, hemophilia and oncology. In recent years, the company has embarked on a restructuring initiative to cut costs and focus on its unique expertise in developing treatments for multiple sclerosis (MS). The company has delivered better-than-expected revenue growth due largely to its newest MS drug, Tysabri. During the period, Biogen Idec released strong positive results in the Phase III clinical trial of its experimental MS drug, BG-12, increasing the likelihood of FDA approval. Shares of the company rose sharply following the announcement.
Hospira, which manufactures generic injectable pharmaceuticals and medication-management devices, was the largest detractor from Fund results. The company has faced headwinds related to quality issues with its North Carolina manufacturing facilities. The company is addressing these issues, but they have proven costlier than anticipated, which has depressed earnings in the short term. We eliminated this stock from the Fund during the reporting period.
Another detractor from Fund performance for the reporting period was Teva Pharmaceutical, the world’s largest generic drug maker. Teva also operates in the branded drug market, and the stock’s weak performance was partly due to concerns about the upcoming patent expiration of its largest branded drug, Copaxone, in 2013. Shares were also hurt when Teva reported that its MS drug, Laquinimod, failed to meet a critical goal for reducing relapse rates in its
Phase III trial. Despite this outcome, the company has submitted applications to U.S. and European regulatory authorities seeking approval of the drug; it has stated that it expects FDA approval by early 2012. We felt the market overreacted to these issues and we used the opportunity to increase our investment in the company.
The Fund held derivative instruments in the form of currency futures contracts in order to hedge our European currency exposure. The net cumulative effect of these derivative contracts was positive for overall Fund performance during the year.
We continued to focus on companies with new product cycles, less reimbursement risk and less competition. Relative to the MSCI World Health Care Index, we maintained a significant underweight position in large-cap pharmaceutical stocks because many firms face looming patent expirations with limited drug pipelines, which may result in modest (if any) earnings growth.
At the close of the reporting period, we continued to emphasize specialty pharmaceuticals and biotechnology stocks based on their generally robust in-line portfolios, compelling pipelines and because many of these companies could be targets of ongoing consolidation. The Fund was primarily invested in U.S. stocks, where we found more companies that fit our fundamental selection criteria. The international allocation was focused mainly on European large-cap pharmaceutical companies that have fewer patent expiration concerns than their U.S. counterparts.
As always, thank you for your continued investment in Invesco V.I. Global Health Care Fund.
1 Source: Lipper Inc.
The views and opinions expressed in management’s discussion of Fund performance are those of Invesco Advisers, Inc. These views and opinions are subject to change at any time based on factors such as market and economic conditions. These views and opinions may not be relied upon as investment advice or recommendations, or as an offer for a particular security. The information is not a complete analysis of every aspect of any market, country, industry, security or the Fund. Statements of fact are from sources considered reliable, but Invesco Advisers, Inc. makes no representation or warranty as to their completeness or accuracy. Although historical performance is no guarantee of future results, these insights may help you understand our investment management philosophy.
See important Fund and, if applicable, index disclosures later in this report.
Derek Taner
Chartered Financial Analyst, portfolio manager, is lead manager of Invesco V.I. Global Health Care Fund. Mr. Taner joined Invesco in 2005. Mr. Taner earned a B.S. in business administration and an M.B.A. from the Haas School of Business at the University of California at Berkeley.
Dean Dillard
Chartered Financial Analyst, portfolio manager, is manager of Invesco V.I. Global Health Care Fund. Mr. Dillard joined Invesco in 2000. He earned a B.S. in corporate finance from the University of Alabama and an M.B.A. from the Owen School of Business at Vanderbilt University.
Invesco V.I. Global Health Care Fund
Your Fund’s Long-Term Performance
Results of a $10,000 Investment – Oldest Share Class(es)
Fund and index data from 12/31/01*
| * | | During the reporting period, Invesco changed its policy regarding growth of $10,000 charts. For funds older than 10 years, we previously showed performance since inception. Going forward, we will show performance for the most recent 10 years, since this more accurately reflects the experience of the typical shareholder. As a result, charts now may include benchmarks that did not appear previously, because the funds’ inception pre-dated the benchmarks’ inception. Also, all charts will now be presented using a linear format. |
Past performance cannot guarantee comparable future results.
Average Annual Total Returns
As of 12/31/11
| | | | | | | | | |
|
| Series I Shares | | | | |
| |
| Inception (5/21/97) | | | 6.44 | % |
| |
| 10 | | | Years | | | 2.80 | |
| |
| 5 | | | Years | | | 2.21 | |
| |
| |
| 1 | | | Year | | | 3.95 | |
| | | | | | | | | |
| Series II Shares | | | | |
| |
| |
| 10 | | | Years | | | 2.54 | % |
| |
| 5 | | | Years | | | 1.96 | |
| |
| 1 | | | Year | | | 3.72 | |
Series II shares incepted on April 30, 2004. Performance shown prior to that date is that of Series I shares, restated to reflect the higher 12b-1 fees applicable to Series II. Series I performance reflects any applicable fee waivers or expense reimbursements. The performance of the Fund’s Series I and Series II share classes will differ primarily due to different class expenses.
The performance data quoted represent past performance and cannot guarantee comparable future results;
current performance may be lower or higher. Please contact your variable product issuer or financial adviser for the most recent month-end variable product performance. Performance figures reflect Fund expenses, reinvested distributions and changes in net asset value. Investment return and principal value will fluctuate so that you may have a gain or loss when you sell shares.
The total annual Fund operating expense ratio set forth in the most recent Fund prospectus as of the date of this report for Series I and Series II shares was 1.12% and 1.37%, respectively. The expense ratios presented above may vary from the expense ratios presented in other sections of this report that are based on expenses incurred during the period covered by this report.
Invesco V.I. Global Health Care Fund, a series portfolio of AIM Variable Insurance Funds (Invesco Variable
Insurance Funds), is currently offered through insurance companies issuing variable products. You cannot purchase shares of the Fund directly. Performance figures given represent the Fund and are not intended to reflect actual variable product values. They do not reflect sales charges, expenses and fees assessed in connection with a variable product. Sales charges, expenses and fees, which are determined by the variable product issuers, will vary and will lower the total return.
The most recent month-end performance data at the Fund level, excluding variable product charges, is available at 800 451 4246. As mentioned above, for the most recent month-end performance including variable product charges, please contact your variable product issuer or financial adviser.
Invesco V.I. Global Health Care Fund
Invesco V.I. Global Health Care Fund’s investment objective is long-term growth of capital.
| n | | Unless otherwise stated, information presented in this report is as of December 31, 2011, and is based on total net assets. |
| |
| n | | Unless otherwise noted, all data provided by Invesco. |
| |
| n | | To access your Fund’s reports/prospectus, visit invesco.com/fundreports. |
Principal risks of investing in the Fund
Developing markets securities risk. Securities issued by foreign companies and governments located in developing countries may be affected more negatively by inflation, devaluation of their currencies, higher transaction costs, delays in settlement, adverse political developments, the introduction of capital controls, withholding taxes, nationalization of private assets, expropriation, social unrest, war or lack of timely information than those in developed countries.
Foreign securities risk. The Fund’s foreign investments may be affected by changes in a foreign country’s exchange rates; political and social instability; changes in economic or taxation policies; difficulties when enforcing obligations; decreased liquidity; and increased volatility. Foreign companies may be subject to less regulation resulting in less publicly available information about the companies.
Health care sector risk. The Fund’s performance is vulnerable to factors affecting the health care industry, including government regulation, obsolescence caused by scientific advances and technological innovations.
Management risk. The investment techniques and risk analysis used by the Fund’s portfolio managers may not produce the desired results.
Market risk. The prices of and the income generated by the Fund’s securities may decline in response to, among other things, investor sentiment; general economic and market conditions; regional or global instability; and currency and interest rate fluctuations.
Synthetic securities risk. Fluctuations in the values of synthetic instruments may not correlate perfectly with the instruments they are designed to replicate. Some synthetic instruments are more sensitive to interest rate changes and market price fluctuations than others. These instruments may be subject to counterparty risk and liquidity risk.
About indexes used in this report
The MSCI World IndexSM is an unmanaged index considered representative of stocks of developed countries.
The MSCI World Health Care Index is an unmanaged index considered representative of health care stocks of developed countries.
The Lipper VUF Health/
Biotechnology Funds Category Average represents an average of all of the variable insurance underlying funds in the Lipper Health/ Biotechnology Funds category.
The Fund is not managed to track the performance of any particular index, including the index(es) defined here, and consequently, the performance of the Fund may deviate significantly from the performance of the index(es).
A direct investment cannot be made in an index. Unless otherwise indicated, index results include reinvested dividends, and they do not reflect sales charges. Performance of the peer group, if applicable, reflects fund expenses; performance of a market index does not.
Other information
The Chartered Financial Analyst® (CFA®) designation is globally recognized and attests to a charterholder’s success in a rigorous and comprehensive study program in the field of investment management and research analysis.
Industry classifications used in this report are generally according to the Global Industry Classification Standard, which was developed by and is the exclusive property and a service mark of MSCI Inc. and Standard & Poor’s.
The returns shown in management’s discussion of Fund performance are based on net asset values calculated for shareholder transactions. Generally accepted accounting principles require adjustments to be made to the net assets of the Fund at period end for financial reporting purposes, and as such, the net asset values for shareholder transactions and the returns based on those net asset values may differ from the net asset values and returns reported in the Financial Highlights. Additionally, the returns and net asset values shown throughout this report are at the Fund level only and do not include variable product issuer charges. If such charges were included, the total returns would be lower.
Invesco V.I. Global Health Care Fund
Schedule of Investments(a)
December 31, 2011
| | | | | | | | | |
| | | Shares | | Value |
| |
Common Stocks & Other Equity Interests–95.63%
| | | | |
Biotechnology–18.35%
| | | | |
Actelion Ltd. (Switzerland)(b) | | | 39,679 | | | $ | 1,356,882 | |
| |
Amarin Corp. PLC–ADR (United Kingdom)(b) | | | 251,726 | | | | 1,885,428 | |
| |
Biogen Idec Inc.(b) | | | 23,529 | | | | 2,589,367 | |
| |
BioMarin Pharmaceutical Inc.(b) | | | 119,610 | | | | 4,112,192 | |
| |
Celgene Corp.(b) | | | 33,695 | | | | 2,277,782 | |
| |
Gilead Sciences, Inc.(b) | | | 137,469 | | | | 5,626,606 | |
| |
Incyte Corp.(b) | | | 139,437 | | | | 2,092,949 | |
| |
Medivation Inc.(b) | | | 25,811 | | | | 1,190,145 | |
| |
Onyx Pharmaceuticals, Inc.(b) | | | 36,039 | | | | 1,583,914 | |
| |
Pharmasset, Inc.(b) | | | 13,816 | | | | 1,771,211 | |
| |
United Therapeutics Corp.(b) | | | 32,888 | | | | 1,553,958 | |
| |
| | | | | | | | 26,040,434 | |
| |
Drug Retail–4.15%
| | | | |
| CVS Caremark Corp. | | | 119,213 | | | | 4,861,506 | |
| |
| Raia Drogasil S.A. (Brazil) | | | 148,860 | | | | 1,034,237 | |
| |
| | | | | | | | 5,895,743 | |
| |
Health Care Distributors–2.58%
| | | | |
| McKesson Corp. | | | 46,899 | | | | 3,653,901 | |
| |
Health Care Equipment–10.55%
| | | | |
| Baxter International Inc. | | | 64,753 | | | | 3,203,978 | |
| |
CareFusion Corp.(b) | | | 56,767 | | | | 1,442,449 | |
| |
| Covidien PLC (Ireland) | | | 73,204 | | | | 3,294,912 | |
| |
DexCom Inc.(b) | | | 91,485 | | | | 851,725 | |
| |
Hologic, Inc.(b) | | | 138,056 | | | | 2,417,361 | |
| |
MAKO Surgical Corp.(b) | | | 39,385 | | | | 992,896 | |
| |
| Olympus Corp. (Japan) | | | 98,500 | | | | 1,295,581 | |
| |
Wright Medical Group, Inc.(b) | | | 89,359 | | | | 1,474,424 | |
| |
| | | | | | | | 14,973,326 | |
| |
Health Care Facilities–3.10%
| | | | |
| Assisted Living Concepts Inc.–Class A | | | 62,920 | | | | 936,879 | |
| |
| Rhoen-Klinikum AG (Germany) | | | 101,257 | | | | 1,929,158 | |
| |
| Universal Health Services, Inc.–Class B | | | 39,598 | | | | 1,538,778 | |
| |
| | | | | | | | 4,404,815 | |
| |
Health Care Services–6.27%
| | | | |
DaVita, Inc.(b) | | | 45,574 | | | | 3,454,965 | |
| |
Express Scripts, Inc.(b) | | | 40,201 | | | | 1,796,582 | |
| |
Medco Health Solutions, Inc.(b) | | | 24,770 | | | | 1,384,643 | |
| |
| Quest Diagnostics Inc. | | | 38,879 | | | | 2,257,315 | |
| |
| | | | | | | | 8,893,505 | |
| |
Health Care Supplies–0.58%
| | | | |
| Meridian Bioscience, Inc. | | | 44,039 | | | | 829,695 | |
| |
Health Care Technology–3.10%
| | | | |
Allscripts Healthcare Solutions, Inc.(b) | | | 110,436 | | | | 2,091,658 | |
| |
Cerner Corp.(b) | | | 37,696 | | | | 2,308,880 | |
| |
| | | | | | | | 4,400,538 | |
| |
Life Sciences Tools & Services–4.86%
| | | | |
Life Technologies Corp.(b) | | | 56,766 | | | | 2,208,765 | |
| |
Thermo Fisher Scientific, Inc.(b) | | | 104,215 | | | | 4,686,549 | |
| |
| | | | | | | | 6,895,314 | |
| |
Managed Health Care–15.51%
| | | | |
| Aetna Inc. | | | 90,961 | | | | 3,837,645 | |
| |
AMERIGROUP Corp.(b) | | | 24,512 | | | | 1,448,169 | |
| |
Amil Participacoes S.A. (Brazil)(c) | | | 133,900 | | | | 1,178,475 | |
| |
Aveta, Inc.(b)(c) | | | 122,652 | | | | 1,042,542 | |
| |
| CIGNA Corp. | | | 49,320 | | | | 2,071,440 | |
| |
Health Net Inc.(b) | | | 73,072 | | | | 2,222,850 | |
| |
| Humana Inc. | | | 32,981 | | | | 2,889,465 | |
| |
| UnitedHealth Group Inc. | | | 75,182 | | | | 3,810,224 | |
| |
| WellPoint, Inc. | | | 53,096 | | | | 3,517,610 | |
| |
| | | | | | | | 22,018,420 | |
| |
Pharmaceuticals–25.89%
| | | | |
| Abbott Laboratories | | | 66,902 | | | | 3,761,899 | |
| |
| Bayer AG (Germany) | | | 57,423 | | | | 3,671,536 | |
| |
EastPharma Ltd. REGS-GDR (Turkey)(b)(c) | | | 109,515 | | | | 98,563 | |
| |
Elan Corp. PLC–ADR (Ireland)(b) | | | 132,537 | | | | 1,821,058 | |
| |
| Hikma Pharmaceuticals PLC (United Kingdom) | | | 119,052 | | | | 1,143,083 | |
| |
MAP Pharmaceuticals Inc.(b) | | | 54,176 | | | | 713,498 | |
| |
| Medicis Pharmaceutical Corp.–Class A | | | 55,616 | | | | 1,849,232 | |
| |
| Nippon Shinyaku Co., Ltd. (Japan) | | | 116,000 | | | | 1,433,793 | |
| |
| Novartis AG–ADR (Switzerland) | | | 66,353 | | | | 3,793,401 | |
| |
| Pfizer Inc. | | | 160,703 | | | | 3,477,613 | |
| |
Pharmstandard–GDR (Russia)(b)(c) | | | 23,450 | | | | 330,645 | |
| |
| Roche Holding AG (Switzerland) | | | 35,416 | | | | 5,990,106 | |
| |
| Sanofi–ADR (France) | | | 38,905 | | | | 1,421,589 | |
| |
| Shire PLC–ADR (United Kingdom) | | | 22,669 | | | | 2,355,309 | |
| |
| Teva Pharmaceutical Industries Ltd.–ADR (Israel) | | | 89,331 | | | | 3,605,399 | |
| |
Warner Chilcott PLC–Class A (Ireland)(b) | | | 84,075 | | | | 1,272,055 | |
| |
| | | | | | | | 36,738,779 | |
| |
| | | | | | | | | |
| | | | | | | | | |
See accompanying Notes to Financial Statements which are an integral part of the financial statements.
Invesco V.I. Global Health Care Fund
| | | | | | | | | |
| | | Shares | | Value |
| |
Research & Consulting Services–0.69%
| | | | |
Qualicorp S.A. (Brazil)(b)(c) | | | 109,000 | | | $ | 978,011 | |
| |
| Total Common Stocks & Other Equity Interests (Cost $124,708,978) | | | | | | | 135,722,481 | |
| |
Money Market Funds–4.22%
| | | | |
Liquid Assets Portfolio–Institutional Class(d) | | | 2,991,745 | | | | 2,991,745 | |
| |
Premier Portfolio–Institutional Class(d) | | | 2,991,745 | | | | 2,991,745 | |
| |
| Total Money Market Funds (Cost $5,983,490) | | | | | | | 5,983,490 | |
| |
| TOTAL INVESTMENTS–99.85% (Cost $130,692,468) | | | | | | | 141,705,971 | |
| |
| OTHER ASSETS LESS LIABILITIES–0.15% | | | | | | | 217,870 | |
| |
| NET ASSETS–100.00% | | | | | | $ | 141,923,841 | |
| |
Investment Abbreviations:
| | | |
| ADR | | – American Depositary Receipt |
| GDR | | – Global Depositary Receipt |
| REGS | | – Regulation S |
Notes to Schedule of Investments:
| | |
| (a) | | Industry and/or sector classifications used in this report are generally according to the Global Industry Classification Standard, which was developed by and is the exclusive property and a service mark of MSCI Inc. and Standard & Poor’s. |
| (b) | | Non-income producing security. |
| (c) | | Security purchased or received in a transaction exempt from registration under the Securities Act of 1933, as amended. The security may be resold pursuant to an exemption from registration under the 1933 Act, typically to qualified institutional buyers. The aggregate value of these securities at December 31, 2011 was $3,628,236, which represented 2.56% of the Fund’s Net Assets. |
| (d) | | The money market fund and the Fund are affiliated by having the same investment adviser. |
See accompanying Notes to Financial Statements which are an integral part of the financial statements.
Invesco V.I. Global Health Care Fund
Statement of Assets and Liabilities
December 31, 2011
| | | | | |
Assets:
|
| Investments, at value (Cost $124,708,978) | | $ | 135,722,481 | |
| |
| Investments in affiliated money market funds, at value and cost | | | 5,983,490 | |
| |
| Total investments, at value (Cost $130,692,468) | | | 141,705,971 | |
| |
| Receivable for: | | | | |
| Fund shares sold | | | 52,870 | |
| |
| Dividends | | | 164,326 | |
| |
| Foreign currency contracts outstanding | | | 336,420 | |
| |
| Investment for trustee deferred compensation and retirement plans | | | 21,878 | |
| |
| Total assets | | | 142,281,465 | |
| |
| | | | | |
| | | | | |
Liabilities:
|
| Payable for: | | | | |
| Fund shares reacquired | | | 156,684 | |
| |
| Accrued fees to affiliates | | | 107,628 | |
| |
| Accrued other operating expenses | | | 40,698 | |
| |
| Trustee deferred compensation and retirement plans | | | 52,614 | |
| |
| Total liabilities | | | 357,624 | |
| |
| Net assets applicable to shares outstanding | | $ | 141,923,841 | |
| |
| | | | | |
| | | | | |
Net assets consist of:
|
| Shares of beneficial interest | | $ | 145,930,223 | |
| |
| Undistributed net investment income (loss) | | | (50,444 | ) |
| |
| Undistributed net realized gain (loss) | | | (15,310,532 | ) |
| |
| Unrealized appreciation | | | 11,354,594 | |
| |
| | | $ | 141,923,841 | |
| |
| | | | | |
| | | | | |
Net Assets:
|
| Series I | | $ | 114,476,135 | |
| |
| Series II | | $ | 27,447,706 | |
| |
| | | | | |
| | | | | |
Shares outstanding, $0.001 par value per share, with an unlimited number of shares authorized:
|
| Series I | | | 6,590,040 | |
| |
| Series II | | | 1,615,886 | |
| |
| Series I: | | | | |
| Net asset value per share | | $ | 17.37 | |
| |
| Series II: | | | | |
| Net asset value per share | | $ | 16.99 | |
| |
Statement of Operations
For the year ended December 31, 2011
| | | | | |
Investment income:
|
| Dividends (net of foreign withholding taxes of $119,460) | | $ | 1,689,153 | |
| |
| Dividends from affiliated money market funds (includes securities lending income of $43,364) | | | 51,067 | |
| |
| Total investment income | | | 1,740,220 | |
| |
| | | | | |
| | | | | |
Expenses:
|
| Advisory fees | | | 1,142,861 | |
| |
| Administrative services fees | | | 426,480 | |
| |
| Custodian fees | | | 21,156 | |
| |
| Distribution fees — Series II | | | 67,554 | |
| |
| Transfer agent fees | | | 39,202 | |
| |
| Trustees’ and officers’ fees and benefits | | | 23,911 | |
| |
| Other | | | 54,313 | |
| |
| Total expenses | | | 1,775,477 | |
| |
| Less: Fees waived | | | (10,456 | ) |
| |
| Net expenses | | | 1,765,021 | |
| |
| Net investment income (loss) | | | (24,801 | ) |
| |
| | | | | |
| | | | | |
Realized and unrealized gain (loss) from:
|
| Net realized gain (loss) from: | | | | |
| Investment securities | | | 6,777,035 | |
| |
| Foreign currencies | | | (73,982 | ) |
| |
| Foreign currency contracts | | | (242,692 | ) |
| |
| | | | 6,460,361 | |
| |
| Change in net unrealized appreciation (depreciation) of: | | | | |
| Investment securities | | | (1,688,331 | ) |
| |
| Foreign currencies | | | (2,128 | ) |
| |
| Foreign currency contracts | | | 313,740 | |
| |
| | | | (1,376,719 | ) |
| |
| Net realized and unrealized gain | | | 5,083,642 | |
| |
| Net increase in net assets resulting from operations | | $ | 5,058,841 | |
| |
See accompanying Notes to Financial Statements which are an integral part of the financial statements.
Invesco V.I. Global Health Care Fund
Statement of Changes in Net Assets
For the years ended December 31, 2011 and 2010
| | | | | | | | | |
| | | 2011 | | 2010 |
| |
Operations:
| | | | |
| Net investment income (loss) | | $ | (24,801 | ) | | $ | (352,936 | ) |
| |
| Net realized gain | | | 6,460,361 | | | | 6,635,670 | |
| |
| Change in net unrealized appreciation (depreciation) | | | (1,376,719 | ) | | | 672,232 | |
| |
| Net increase in net assets resulting from operations | | | 5,058,841 | | | | 6,954,966 | |
| |
Share transactions–net:
| | | | |
| Series I | | | (14,012,631 | ) | | | (24,973,014 | ) |
| |
| Series II | | | 373,177 | | | | (1,847,042 | ) |
| |
| Net increase (decrease) in net assets resulting from share transactions | | | (13,639,454 | ) | | | (26,820,056 | ) |
| |
| Net increase (decrease) in net assets | | | (8,580,613 | ) | | | (19,865,090 | ) |
| |
| | | | | | | | | |
| | | | | | | | | |
Net assets:
| | | | |
| Beginning of year | | | 150,504,454 | | | | 170,369,544 | |
| |
| End of year (includes undistributed net investment income (loss) of $(50,444) and $(41,772), respectively) | | $ | 141,923,841 | | | $ | 150,504,454 | |
| |
Notes to Financial Statements
December 31, 2011
NOTE 1—Significant Accounting Policies
Invesco V.I. Global Health Care Fund (the “Fund”) is a series portfolio of AIM Variable Insurance Funds (Invesco Variable Insurance Funds) (the “Trust”). The Trust is a Delaware statutory trust registered under the Investment Company Act of 1940, as amended (the “1940 Act”), as an open-end series management investment company consisting of twenty-eight separate portfolios, (each constituting a “Fund”). The assets, liabilities and operations of each portfolio are accounted for separately. Information presented in these financial statements pertains only to the Fund. Matters affecting each Fund or class will be voted on exclusively by the shareholders of such Fund or class. Current Securities and Exchange Commission (“SEC”) guidance, however, requires participating insurance companies offering separate accounts to vote shares proportionally in accordance with the instructions of the contract owners whose investments are funded by shares of each Fund or class.
The Fund’s investment objective is long-term growth of capital.
The Fund currently offers two classes of shares, Series I and Series II, both of which are offered to insurance company separate accounts funding variable annuity contracts and variable life insurance policies (“variable products”).
The following is a summary of the significant accounting policies followed by the Fund in the preparation of its financial statements.
| | |
| A. | | Security Valuations — Securities, including restricted securities, are valued according to the following policy. |
| | A security listed or traded on an exchange (except convertible bonds) is valued at its last sales price or official closing price as of the close of the customary trading session on the exchange where the security is principally traded, or lacking any sales or official closing price on a particular day, the security may be valued at the closing bid price on that day. Securities traded in the over-the-counter market are valued based on prices furnished by independent pricing services or market makers. When such securities are valued by an independent pricing service they may be considered fair valued. Futures contracts are valued at the final settlement price set by an exchange on which they are principally traded. Listed options are valued at the mean between the last bid and ask prices from the exchange on which they are principally traded. Options not listed on an exchange are valued by an independent source at the mean between the last bid and ask prices. For purposes of determining net asset value per share, futures and option contracts generally are valued 15 minutes after the close of the customary trading session of the New York Stock Exchange (“NYSE”). |
| | Investments in open-end and closed-end registered investment companies that do not trade on an exchange are valued at the end of day net asset value per share. Investments in open-end and closed-end registered investment companies that trade on an exchange are valued at the last sales price or official closing price as of the close of the customary trading session on the exchange where the security is principally traded. |
| | Debt obligations (including convertible bonds) and unlisted equities are fair valued using an evaluated quote provided by an independent pricing service. Evaluated quotes provided by the pricing service may be determined without exclusive reliance on quoted prices, and may reflect appropriate factors such as institution-size trading in similar groups of securities, developments related to specific securities, dividend rate, yield, quality, type of issue, coupon rate, maturity, individual trading characteristics and other market data. Debt securities are subject to interest rate and credit risks. In addition, all debt securities involve some risk of default with respect to interest and/or principal payments. |
| | Foreign securities (including foreign exchange contracts) are converted into U.S. dollar amounts using the applicable exchange rates as of the close of the NYSE. If market quotations are available and reliable for foreign exchange traded equity securities, the securities will be valued at the market |
Invesco V.I. Global Health Care Fund
| | |
| | quotations. Because trading hours for certain foreign securities end before the close of the NYSE, closing market quotations may become unreliable. If between the time trading ends on a particular security and the close of the customary trading session on the NYSE, events occur that are significant and make the closing price unreliable, the Fund may fair value the security. If the event is likely to have affected the closing price of the security, the security will be valued at fair value in good faith using procedures approved by the Board of Trustees. Adjustments to closing prices to reflect fair value may also be based on a screening process of an independent pricing service to indicate the degree of certainty, based on historical data, that the closing price in the principal market where a foreign security trade is not the current value as of the close of the NYSE. Foreign securities meeting the approved degree of certainty that the price is not reflective of current value will be priced at the indication of fair value from the independent pricing service. Multiple factors may be considered by the independent pricing service in determining adjustments to reflect fair value and may include information relating to sector indices, American Depositary Receipts and domestic and foreign index futures. Foreign securities may have additional risks including exchange rate changes, potential for sharply devalued currencies and high inflation, political and economic upheaval, the relative lack of issuer information, relatively low market liquidity and the potential lack of strict financial and accounting controls and standards. |
| | Securities for which market prices are not provided by any of the above methods may be valued based upon quotes furnished by independent sources. The last bid price may be used to value equity securities. The mean between the last bid and asked prices is used to value debt obligations, including Corporate Loans. |
| | Securities for which market quotations are not readily available or are unreliable are valued at fair value as determined in good faith by or under the supervision of the Trust’s officers following procedures approved by the Board of Trustees. Issuer specific events, market trends, bid/ask quotes of brokers and information providers and other market data may be reviewed in the course of making a good faith determination of a security’s fair value. |
| | Valuations change in response to many factors including the historical and prospective earnings of the issuer, the value of the issuer’s assets, general economic conditions, interest rates, investor perceptions and market liquidity. Because of the inherent uncertainties of valuation, the values reflected in the financial statements may materially differ from the value received upon actual sale of those investments. |
| B. | | Securities Transactions and Investment Income — Securities transactions are accounted for on a trade date basis. Realized gains or losses on sales are computed on the basis of specific identification of the securities sold. Interest income is recorded on the accrual basis from settlement date. Dividend income (net of withholding tax, if any) is recorded on the ex-dividend date. |
| | The Fund may periodically participate in litigation related to Fund investments. As such, the Fund may receive proceeds from litigation settlements. Any proceeds received are included in the Statement of Operations as realized gain (loss) for investments no longer held and as unrealized gain (loss) for investments still held. |
| | Brokerage commissions and mark ups are considered transaction costs and are recorded as an increase to the cost basis of securities purchased and/or a reduction of proceeds on a sale of securities. Such transaction costs are included in the determination of net realized and unrealized gain (loss) from investment securities reported in the Statement of Operations and the Statement of Changes in Net Assets and the net realized and unrealized gains (losses) on securities per share in the Financial Highlights. Transaction costs are included in the calculation of the Fund’s net asset value and, accordingly, they reduce the Fund’s total returns. These transaction costs are not considered operating expenses and are not reflected in net investment income reported in the Statement of Operations and Statement of Changes in Net Assets, or the net investment income per share and ratios of expenses and net investment income reported in the Financial Highlights, nor are they limited by any expense limitation arrangements between the Fund and the investment adviser. |
| | The Fund allocates income and realized and unrealized capital gains and losses to a class based on the relative net assets of each class. |
| C. | | Country Determination — For the purposes of making investment selection decisions and presentation in the Schedule of Investments, the investment adviser may determine the country in which an issuer is located and/or credit risk exposure based on various factors. These factors include the laws of the country under which the issuer is organized, where the issuer maintains a principal office, the country in which the issuer derives 50% or more of its total revenues and the country that has the primary market for the issuer’s securities, as well as other criteria. Among the other criteria that may be evaluated for making this determination are the country in which the issuer maintains 50% or more of its assets, the type of security, financial guarantees and enhancements, the nature of the collateral and the sponsor organization. Country of issuer and/or credit risk exposure has been determined to be the United States of America, unless otherwise noted. |
| D. | | Distributions — Distributions from income and net realized capital gain, if any, are generally paid to separate accounts of participating insurance companies annually and recorded on ex-dividend date. |
| E. | | Federal Income Taxes — The Fund intends to comply with the requirements of Subchapter M of the Internal Revenue Code necessary to qualify as a regulated investment company and to distribute substantially all of the Fund’s taxable earnings to shareholders. As such, the Fund will not be subject to federal income taxes on otherwise taxable income (including net realized capital gain) that is distributed to shareholders. Therefore, no provision for federal income taxes is recorded in the financial statements. |
| | The Fund files tax returns in the U.S. Federal jurisdiction and certain other jurisdictions. Generally, the Fund is subject to examinations by such taxing authorities for up to three years after the filing of the return for the tax period. |
| F. | | Expenses — Fees provided for under the Rule 12b-1 plan of a particular class of the Fund and which are directly attributable to that class are charged to the operations of such class. All other expenses are allocated among the classes based on relative net assets. |
| G. | | Accounting Estimates — The preparation of financial statements in conformity with accounting principles generally accepted in the United States of America (“GAAP”) requires management to make estimates and assumptions that affect the reported amounts of assets and liabilities at the date of the financial statements and the reported amounts of revenues and expenses during the reporting period including estimates and assumptions related to taxation. Actual results could differ from those estimates by a significant amount. In addition, the Fund monitors for material events or transactions that may occur or become known after the period-end date and before the date the financial statements are released to print. |
| H. | | Indemnifications — Under the Trust’s organizational documents, each Trustee, officer, employee or other agent of the Trust is indemnified against certain liabilities that may arise out of performance of their duties to the Fund. Additionally, in the normal course of business, the Fund enters into contracts, including the Fund’s servicing agreements that contain a variety of indemnification clauses. The Fund’s maximum exposure under these |
Invesco V.I. Global Health Care Fund
| | |
| | arrangements is unknown as this would involve future claims that may be made against the Fund that have not yet occurred. The risk of material loss as a result of such indemnification claims is considered remote. |
| I. | | Other Risks — The Fund may invest a large percentage of assets in securities of a limited number of companies, such that each investment may have a greater effect on the Fund’s overall performance, and any change in the value of those securities could significantly affect the value of your investment in the Fund. |
| | The Fund has invested in non-publicly traded companies, some of which are in the startup or development stages. These investments are inherently risky, as the market for the technologies or products these companies are developing are typically in the early stages and may never materialize. The Fund could lose its entire investment in these companies. These investments are valued at fair value as determined in good faith in accordance with procedures approved by the Board of Trustees. Investments in privately held venture capital securities are illiquid. |
| J. | | Securities Lending — The Fund may lend portfolio securities having a market value up to one-third of the Fund’s total assets. Such loans are secured by collateral equal to no less than the market value of the loaned securities determined daily by the securities lending provider. Such collateral will be cash or debt securities issued or guaranteed by the U.S. Government or any of its sponsored agencies. Cash collateral received in connection with these loans is invested in short-term money market instruments or affiliated money market funds and is shown as such on the Schedule of Investments. It is the Fund’s policy to obtain additional collateral from or return excess collateral to the borrower by the end of the next business day, following the valuation date of the securities loaned. Therefore, the value of the collateral held may be temporarily less than the value of the securities on loan. Lending securities entails a risk of loss to the Fund if and to the extent that the market value of the securities loaned were to increase and the borrower did not increase the collateral accordingly, and the borrower fails to return the securities. Upon the failure of the borrower to return the securities, collateral may be liquidated and the securities may be purchased on the open market to replace the loaned securities. The Fund could experience delays and costs in gaining access to the collateral. The Fund bears the risk of any deficiency in the amount of the collateral available for return to the borrower due to any loss on the collateral invested. Dividends received on cash collateral investments for securities lending transactions, which are net of compensation to counterparties, is included in Dividends from affiliated money market funds on the Statement of Operations. The aggregate value of securities out on loan is shown as a footnote on the Statement of Assets and Liabilities, if any. |
| K. | | Foreign Currency Translations — Foreign currency is valued at the close of the NYSE based on quotations posted by banks and major currency dealers. Portfolio securities and other assets and liabilities denominated in foreign currencies are translated into U.S. dollar amounts at date of valuation. Purchases and sales of portfolio securities (net of foreign taxes withheld on disposition) and income items denominated in foreign currencies are translated into U.S. dollar amounts on the respective dates of such transactions. The Fund does not separately account for the portion of the results of operations resulting from changes in foreign exchange rates on investments and the fluctuations arising from changes in market prices of securities held. The combined results of changes in foreign exchange rates and the fluctuation of market prices on investments (net of estimated foreign tax withholding) are included with the net realized and unrealized gain or loss from investments in the Statement of Operations. Reported net realized foreign currency gains or losses arise from (1) sales of foreign currencies, (2) currency gains or losses realized between the trade and settlement dates on securities transactions, and (3) the difference between the amounts of dividends, interest, and foreign withholding taxes recorded on the Fund’s books and the U.S. dollar equivalent of the amounts actually received or paid. Net unrealized foreign currency gains and losses arise from changes in the fair values of assets and liabilities, other than investments in securities at fiscal period end, resulting from changes in exchange rates. |
| | The Fund may invest in foreign securities which may be subject to foreign taxes on income, gains on investments or currency repatriation, a portion of which may be recoverable. |
| L. | | Foreign Currency Contracts — The Fund may enter into foreign currency contracts to manage or minimize currency or exchange rate risk. The Fund may also enter into foreign currency contracts for the purchase or sale of a security denominated in a foreign currency in order to “lock in” the U.S. dollar price of that security. A foreign currency contract is an obligation to purchase or sell a specific currency for an agreed-upon price at a future date. The use of foreign currency contracts does not eliminate fluctuations in the price of the underlying securities the Fund owns or intends to acquire but establishes a rate of exchange in advance. Fluctuations in the value of these contracts are measured by the difference in the contract date and reporting date exchange rates and are recorded as unrealized appreciation (depreciation) until the contracts are closed. When the contracts are closed, realized gains (losses) are recorded. Realized and unrealized gains (losses) on the contracts are included in the Statement of Operations. The primary risks associated with foreign currency contracts include failure of the counterparty to meet the terms of the contract and the value of the foreign currency changing unfavorably. These risks may be in excess of the amounts reflected in the Statement of Assets and Liabilities. |
NOTE 2—Advisory Fees and Other Fees Paid to Affiliates
The Trust has entered into a master investment advisory agreement with Invesco Advisers, Inc. (the “Adviser” or “Invesco”). Under the terms of the investment advisory agreement, the Fund pays an advisory fee to the Adviser based on the annual rate of the Fund’s average daily net assets as follows:
| | | | | |
| Average Daily Net Assets | | Rate |
| |
| First $250 million | | | 0 | .75% |
| |
| Next $250 million | | | 0 | .74% |
| |
| Next $500 million | | | 0 | .73% |
| |
| Next $1.5 billion | | | 0 | .72% |
| |
| Next $2.5 billion | | | 0 | .71% |
| |
| Next $2.5 billion | | | 0 | .70% |
| |
| Next $2.5 billion | | | 0 | .69% |
| |
| Over $10 billion | | | 0 | .68% |
| |
Invesco V.I. Global Health Care Fund
Under the terms of a master sub-advisory agreement between the Adviser and each of Invesco Asset Management Deutschland GmbH, Invesco Asset Management Limited, Invesco Asset Management (Japan) Limited, Invesco Australia Limited, Invesco Hong Kong Limited, Invesco Senior Secured Management, Inc. and Invesco Canada Ltd. (collectively, the “Affiliated Sub-Advisers”) the Adviser, not the Fund, may pay 40% of the fees paid to the Adviser to any such Affiliated Sub-Adviser(s) that provide discretionary investment management services to the Fund based on the percentage of assets allocated to such Sub-Adviser(s).
The Adviser has contractually agreed, through at least April 30, 2013, to waive advisory fees and/or reimburse expenses of all shares to the extent necessary to limit total annual fund operating expenses after fee waiver and/or expense reimbursement (excluding certain items discussed below) of Series I shares to 1.30% and Series II shares to 1.45% of average daily net assets. In determining the Adviser’s obligation to waive advisory fees and/or reimburse expenses, the following expenses are not taken into account, and could cause the total annual fund operating expenses after fee waiver and/or expense reimbursement to exceed the numbers reflected above: (1) interest; (2) taxes; (3) dividend expense on short sales; (4) extraordinary or non-routine items, including litigation expenses; and (5) expenses that the Fund has incurred but did not actually pay because of an expense offset arrangement. Unless the Board of the Trustees and Invesco mutually agree to amend or continue the fee waiver agreement, it will terminate on April 30, 2013. The Adviser did not waive fees and/or reimburse expenses during the period under this expense limitation.
Further, the Adviser has contractually agreed, through at least June 30, 2012, to waive the advisory fee payable by the Fund in an amount equal to 100% of the net advisory fees the Adviser receives from the affiliated money market funds on investments by the Fund of uninvested cash (excluding investments of cash collateral from securities lending) in such affiliated money market funds.
For the year ended December 31, 2011, the Adviser waived advisory fees of $10,456.
The Trust has entered into a master administrative services agreement with Invesco pursuant to which the Fund has agreed to pay Invesco a fee for costs incurred in providing accounting services and fund administrative services to the Fund and to reimburse Invesco for administrative services fees paid to insurance companies that have agreed to provide services to the participants of separate accounts. These administrative services provided by the insurance companies may include, among other things: the printing of prospectuses, financial reports and proxy statements and the delivery of the same to existing participants; the maintenance of master accounts; the facilitation of purchases and redemptions requested by the participants; and the servicing of participants’ accounts. Pursuant to such agreement, for the year ended December 31, 2011, Invesco was paid $50,000 for accounting and fund administrative services and reimbursed $376,480 for services provided by insurance companies.
The Trust has entered into a transfer agency and service agreement with Invesco Investment Services, Inc. (“IIS”) pursuant to which the Fund has agreed to pay IIS a fee for providing transfer agency and shareholder services to the Fund and reimburse IIS for certain expenses incurred by IIS in the course of providing such services. For the year ended December 31, 2011, expenses incurred under the agreement are shown in the Statement of Operations as transfer agent fees.
The Trust has entered into a master distribution agreement with Invesco Distributors, Inc. (“IDI”) to serve as the distributor for the Fund. The Trust has adopted a plan pursuant to Rule 12b-1 under the 1940 Act with respect to the Fund’s Series II shares (the “Plan”). The Fund, pursuant to the Plan, pays IDI compensation at the annual rate of 0.25% of the Fund’s average daily net assets of Series II shares. Of the Plan payments, up to 0.25% of the average daily net assets of the Series II shares may be paid to insurance companies who furnish continuing personal shareholder services to customers who purchase and own Series II shares of the Fund. For the year ended December 31, 2011, expenses incurred under the Plan are detailed in the Statement of Operations as distribution fees.
Certain officers and trustees of the Trust are officers and directors of the Adviser, IIS and/or IDI.
NOTE 3—Additional Valuation Information
GAAP defines fair value as the price that would be received to sell an asset or paid to transfer a liability in an orderly transaction between market participants at the measurement date, under current market conditions. GAAP establishes a hierarchy that prioritizes the inputs to valuation methods giving the highest priority to readily available unadjusted quoted prices in an active market for identical assets (Level 1) and the lowest priority to significant unobservable inputs (Level 3) generally when market prices are not readily available or are unreliable. Based on the valuation inputs, the securities or other investments are tiered into one of three levels. Changes in valuation methods may result in transfers in or out of an investment’s assigned level:
| | |
| | Level 1 — | Prices are determined using quoted prices in an active market for identical assets. |
| | Level 2 — | Prices are determined using other significant observable inputs. Observable inputs are inputs that other market participants may use in pricing a security. These may include quoted prices for similar securities, interest rates, prepayment speeds, credit risk, yield curves, loss severities, default rates, discount rates, volatilities and others. |
| | Level 3 — | Prices are determined using significant unobservable inputs. In situations where quoted prices or observable inputs are unavailable (for example, when there is little or no market activity for an investment at the end of the period), unobservable inputs may be used. Unobservable inputs reflect the Fund’s own assumptions about the factors market participants would use in determining fair value of the securities or instruments and would be based on the best available information. |
The following is a summary of the tiered valuation input levels, as of December 31, 2011. The level assigned to the securities valuations may not be an indication of the risk or liquidity associated with investing in those securities. Because of the inherent uncertainties of valuation, the values reflected in the financial statements may materially differ from the value received upon actual sale of those investments.
During the year ended December 31, 2011, there were no significant transfers between investment levels.
Invesco V.I. Global Health Care Fund
| | | | | | | | | | | | | | | | | |
| | | Level 1 | | Level 2 | | Level 3 | | Total |
| |
| Equity Securities | | $ | 131,842,714 | | | $ | 9,863,257 | | | $ | — | | | $ | 141,705,971 | |
| |
| Foreign Currency Contracts* | | | — | | | | 336,420 | | | | — | | | | 336,420 | |
| |
| Total Investments | | $ | 131,842,714 | | | $ | 10,199,677 | | | $ | — | | | $ | 142,042,391 | |
| |
| |
| * | Unrealized appreciation. |
NOTE 4—Derivative Investments
Value of Derivative Instruments at Period-End
The table below summarizes the value of the Fund’s derivative instruments, detailed by primary risk exposure, held as of December 31, 2011:
| | | | | | | | | |
| | | Value |
| Risk Exposure/Derivative Type | | Assets | | Liabilities |
| |
| Currency risk | | | | | | | | |
Foreign Currency Contracts(a) | | $ | 336,420 | | | $ | — | |
| |
| | |
| (a) | | Values are disclosed on the Statement of Assets and Liabilities under the Foreign currency contracts outstanding. |
Effect of Derivative Instruments for the year ended December 31, 2011
The table below summarizes the gains (losses) on derivative instruments, detailed by primary risk exposure, recognized in earnings during the period:
| | | | | |
| | | Location of Gain (Loss) on
|
| | | Statement of Operations |
| | | Foreign Currency
|
| | | Contracts* |
| |
| Realized Gain (Loss) | | | | |
| Currency risk | | $ | (242,692 | ) |
| |
| Change in Unrealized Appreciation | | | | |
| Currency risk | | | 313,740 | |
| |
| Total | | $ | 71,048 | |
| |
| |
| * | The average notional value of foreign currency contracts outstanding during the period was $6,220,419. |
| | | | | | | | | | | | | | | | | | | | | | | |
| Open Foreign Currency Contracts |
Settlement
| | | | Contract to | | Notional
| | Unrealized
|
| Date | | Counterparty | | Deliver | | Receive | | Value | | Appreciation |
| |
| 02/10/12 | | Citibank Capital | | CHF | | | 2,900,000 | | | USD | | | 3,241,165 | | | $ | 3,090,153 | | | $ | 151,012 | |
| |
| 02/10/12 | | Citibank Capital | | EUR | | | 2,200,000 | | | USD | | | 3,033,910 | | | | 2,848,502 | | | | 185,408 | |
| |
| Total open foreign currency contracts | | | | | | | | | | | | | | | | | | | | $ | 336,420 | |
| |
| | | |
| Currency Abbreviations: |
| CHF | | – Swiss Franc |
| EUR | | – Euro |
| USD | | – U.S. Dollar |
NOTE 5—Trustees’ and Officers’ Fees and Benefits
“Trustees’ and Officers’ Fees and Benefits” include amounts accrued by the Fund to pay remuneration to certain Trustees and Officers of the Fund. Trustees have the option to defer compensation payable by the Fund, and “Trustees’ and Officers’ Fees and Benefits” also include amounts accrued by the Fund to fund such deferred compensation amounts. Those Trustees who defer compensation have the option to select various Invesco Funds in which their deferral accounts shall be deemed to be invested. Finally, certain current Trustees are eligible to participate in a retirement plan that provides for benefits to be paid upon retirement to Trustees over a period of time based on the number of years of service. The Fund may have certain former Trustees who also participate in a retirement plan and receive benefits under such plan. “Trustees’ and Officers’ Fees and Benefits” include amounts accrued by the Fund to fund such retirement benefits. Obligations under the deferred compensation and retirement plans represent unsecured claims against the general assets of the Fund.
During the year ended December 31, 2011, the Fund paid legal fees of $1,311 for services rendered by Kramer, Levin, Naftalis & Frankel LLP as counsel to the Independent Trustees. A partner of that firm is a Trustee of the Trust.
NOTE 6—Cash Balances
The Fund is permitted to temporarily carry a negative or overdrawn balance in its account with The State Street Bank and Trust Company, the custodian bank. To compensate the custodian bank for such overdrafts, the overdrawn Fund may either (1) leave funds as a compensating balance in the account so the
Invesco V.I. Global Health Care Fund
custodian bank can be compensated by earning the additional interest; or (2) compensate by paying the custodian bank at a rate agreed upon by the custodian bank and Invesco, not to exceed the contractually agreed upon rate.
NOTE 7—Distributions to Shareholders and Tax Components of Net Assets
Tax Character of Distributions to Shareholders Paid During the Years Ended December 31, 2011 and 2010:
There were no ordinary income or long term capital gain distributions paid during the years ended December 31, 2011 and 2010.
Tax Components of Net Assets at Period-End:
| | | | | |
| | | 2011 |
| |
| Net unrealized appreciation — investments | | $ | 11,009,904 | |
| |
| Net unrealized appreciation — other investments | | | 4,671 | |
| |
| Temporary book/tax differences | | | (50,444 | ) |
| |
| Capital loss carryforward | | | (14,970,513 | ) |
| |
| Shares of beneficial interest | | | 145,930,223 | |
| |
| Total net assets | | $ | 141,923,841 | |
| |
The difference between book-basis and tax-basis unrealized appreciation (depreciation) is due to differences in the timing of recognition of gains and losses on investments for tax and book purposes. The Fund’s net unrealized appreciation difference is attributable primarily to wash sales.
The temporary book/tax differences are a result of timing differences between book and tax recognition of income and/or expenses. The Fund’s temporary book/tax differences are the result of the trustee deferral of compensation and retirement plan benefits.
Capital loss carryforward is calculated and reported as of a specific date. Results of transactions and other activity after that date may affect the amount of capital loss carryforward actually available for the Fund to utilize. The Regulated Investment Company Modernization Act of 2010 (the “Act”) eliminated the eight-year carryover period for capital losses that arise in taxable years beginning after its enactment date of December 22, 2010. Consequently, these capital losses can be carried forward for an unlimited period. However, capital losses with an expiration period may not be used to offset capital gains until all net capital losses without an expiration date have been utilized. Additionally, post-enactment capital loss carryovers will retain their character as either short-term or long-term capital losses instead of as short-term capital losses as under prior law. The ability to utilize capital loss carryforward in the future may be limited under the Internal Revenue Code and related regulations based on the results of future transactions.
The Fund utilized $6,826,503 of capital loss carryforward in the current period to offset net realized capital gain for federal income tax purposes. The Fund has a capital loss carryforward as of December 31, 2011, which expires as follows:
| | | | | | | | | | | | | |
| Capital Loss Carryforward* |
| Expiration | | Short-Term | | Long-Term | | Total |
| |
| December 31, 2017 | | $ | 14,970,513 | | | $ | — | | | $ | 14,970,513 | |
| |
| |
| * | Capital loss carryforward as of the date listed above is reduced for limitations, if any, to the extent required by the Internal Revenue Code. |
NOTE 8—Investment Securities
The aggregate amount of investment securities (other than short-term securities, U.S. Treasury obligations and money market funds, if any) purchased and sold by the Fund during the year ended December 31, 2011 was $61,223,176 and $75,700,042, respectively. Cost of investments on a tax basis includes the adjustments for financial reporting purposes as of the most recently completed Federal income tax reporting period-end.
| | | | | |
| Unrealized Appreciation (Depreciation) of Investment Securities on a Tax Basis |
| |
| Aggregate unrealized appreciation of investment securities | | $ | 19,790,306 | |
| |
| Aggregate unrealized (depreciation) of investment securities | | | (8,780,402 | ) |
| |
| Net unrealized appreciation of investment securities | | $ | 11,009,904 | |
| |
| Cost of investments for tax purposes is $130,696,067. |
NOTE 9—Reclassification of Permanent Differences
Primarily as a result of differing book/tax treatment of foreign currency transactions and net operating losses, on December 31, 2011, undistributed net investment income (loss) was increased by $16,129, undistributed net realized gain (loss) was increased by $73,981 and shares of beneficial interest decreased by $90,110. This reclassification had no effect on the net assets of the Fund.
Invesco V.I. Global Health Care Fund
NOTE 10—Share Information
| | | | | | | | | | | | | | | | | |
| | | Summary of Share Activity |
| |
| | | Year ended December 31, |
| | | 2011(a) | | 2010 |
| | | Shares | | Amount | | Shares | | Amount |
| |
| Sold: | | | | | | | | | | | | | | | | |
| Series I | | | 1,299,440 | | | $ | 23,576,064 | | | | 1,324,865 | | | $ | 21,365,905 | |
| |
| Series II | | | 275,720 | | | | 4,760,125 | | | | 218,080 | | | | 3,429,179 | |
| |
| Reacquired: | | | | | | | | | | | | | | | | |
| Series I | | | (2,157,315 | ) | | | (37,588,695 | ) | | | (2,928,835 | ) | | | (46,338,919 | ) |
| |
| Series II | | | (251,096 | ) | | | (4,386,948 | ) | | | (340,143 | ) | | | (5,276,221 | ) |
| |
| Net increase (decrease) in share activity | | | (833,251 | ) | | $ | (13,639,454 | ) | | | (1,726,033 | ) | | $ | (26,820,056 | ) |
| |
| | |
| (a) | | There are entities that are record owners of more than 5% of the outstanding shares of the Fund and in the aggregate own 64% of the outstanding shares of the Fund. The Fund and the Fund’s principal underwriter or adviser, are parties to participation agreements with these entities whereby these entities sell units of interest in separate accounts funding variable products that are invested in the Fund. The Fund, Invesco and/or Invesco affiliates may make payments to these entities, which are considered to be related to the Fund, for providing services to the Fund, Invesco and/or Invesco affiliates including but not limited to services such as, securities brokerage, third party record keeping and account servicing and administrative services. The Fund has no knowledge as to whether all or any portion of the shares owned of record by these entities are also owned beneficially. |
NOTE 11—Financial Highlights
The following schedule presents financial highlights for a share of the Fund outstanding throughout the periods indicated.
| | | | | | | | | | | | | | | | | | | | | | | | | | | | | | | | | | | | | | | | | | | | | | | | | | | | | | | | | |
| | | | | | | | | | | | | | | | | | | | | | | Ratio of
| | Ratio of
| | | | |
| | | | | | | Net gains
| | | | | | | | | | | | | | | | expenses
| | expenses
| | | | |
| | | | | | | (losses)
| | | | | | | | | | | | | | | | to average
| | to average net
| | Ratio of net
| | |
| | | Net asset
| | Net
| | on securities
| | | | Dividends
| | Distributions
| | | | | | | | | | net assets
| | assets without
| | investment
| | |
| | | value,
| | investment
| | (both
| | Total from
| | from net
| | from net
| | | | Net asset
| | | | Net assets,
| | with fee waivers
| | fee waivers
| | income (loss)
| | |
| | | beginning
| | income
| | realized and
| | investment
| | investment
| | realized
| | Total
| | value, end
| | Total
| | end of period
| | and/or expenses
| | and/or expenses
| | to average
| | Portfolio
|
| | | of period | | (loss)(a) | | unrealized) | | operations | | income | | gains | | Distributions | | of period | | Return(b) | | (000s omitted) | | absorbed | | absorbed | | net assets | | turnover(c) |
| |
| Series I | | | | | | | | | | | | | | | | | | | | | | | | | | | | | | | | | | | | | | | | | | | | | | | | | | | | | | | | |
| Year ended 12/31/11 | | $ | 16.71 | | | $ | 0.00 | | | $ | 0.66 | | | $ | 0.66 | | | $ | — | | | $ | — | | | $ | — | | | $ | 17.37 | | | | 3.95 | % | | $ | 114,476 | | | | 1.11 | %(d) | | | 1.12 | %(d) | | | 0.03 | %(d) | | | 42 | % |
| Year ended 12/31/10 | | | 15.87 | | | | (0.03 | ) | | | 0.87 | | | | 0.84 | | | | — | | | | — | | | | — | | | | 16.71 | | | | 5.29 | | | | 124,441 | | | | 1.11 | | | | 1.12 | | | | (0.18 | ) | | | 16 | |
| Year ended 12/31/09 | | | 12.47 | | | | (0.01 | ) | | | 3.46 | | | | 3.45 | | | | (0.05 | ) | | | — | | | | (0.05 | ) | | | 15.87 | | | | 27.67 | | | | 143,648 | | | | 1.13 | | | | 1.14 | | | | (0.05 | ) | | | 45 | |
| Year ended 12/31/08 | | | 24.06 | | | | 0.07 | (e) | | | (7.16 | ) | | | (7.09 | ) | | | — | | | | (4.50 | ) | | | (4.50 | ) | | | 12.47 | | | | (28.62 | ) | | | 128,563 | | | | 1.12 | | | | 1.13 | | | | 0.34 | (e) | | | 67 | |
| Year ended 12/31/07 | | | 21.51 | | | | (0.01 | ) | | | 2.56 | | | | 2.55 | | | | — | | | | — | | | | — | | | | 24.06 | | | | 11.85 | | | | 223,448 | | | | 1.06 | | | | 1.07 | | | | (0.06 | ) | | | 66 | |
| |
| Series II |
| Year ended 12/31/11 | | | 16.38 | | | | (0.04 | ) | | | 0.65 | | | | 0.61 | | | | — | | | | — | | | | — | | | | 16.99 | | | | 3.72 | | | | 27,448 | | | | 1.36 | (d) | | | 1.37 | (d) | | | (0.22 | )(d) | | | 42 | |
| Year ended 12/31/10 | | | 15.60 | | | | (0.07 | ) | | | 0.85 | | | | 0.78 | | | | — | | | | — | | | | — | | | | 16.38 | | | | 5.00 | | | | 26,063 | | | | 1.36 | | | | 1.37 | | | | (0.43 | ) | | | 16 | |
| Year ended 12/31/09 | | | 12.26 | | | | (0.04 | ) | | | 3.40 | | | | 3.36 | | | | (0.02 | ) | | | — | | | | (0.02 | ) | | | 15.60 | | | | 27.39 | | | | 26,722 | | | | 1.38 | | | | 1.39 | | | | (0.30 | ) | | | 45 | |
| Year ended 12/31/08 | | | 23.82 | | | | 0.02 | (e) | | | (7.08 | ) | | | (7.06 | ) | | | — | | | | (4.50 | ) | | | (4.50 | ) | | | 12.26 | | | | (28.78 | ) | | | 19,886 | | | | 1.37 | | | | 1.38 | | | | 0.09 | (e) | | | 67 | |
| Year ended 12/31/07 | | | 21.36 | | | | (0.07 | ) | | | 2.53 | | | | 2.46 | | | | — | | | | — | | | | — | | | | 23.82 | | | | 11.52 | | | | 20,817 | | | | 1.31 | | | | 1.32 | | | | (0.31 | ) | | | 66 | |
| |
| | |
| (a) | | Calculated using average shares outstanding. |
| (b) | | Includes adjustments in accordance with accounting principles generally accepted in the United States of America and as such, the net asset value for financial reporting purposes and the returns based upon those net asset values may differ from the net asset value and returns for shareholder transactions. Total returns are not annualized for periods less than one year, if applicable and do not reflect charges assessed in connection with a variable product, which if included would reduce total returns. |
| (c) | | Portfolio turnover is calculated at the fund level and is not annualized for periods less than one year, if applicable. |
| (d) | | Ratios are based on average daily net assets (000’s) of $125,360 and $27,022 for Series I and Series II shares, respectively. |
| (e) | | Net investment income (loss) per share and the ratio of net investment income (loss) to average net assets include a special cash dividend received of $5.23 per share owned of All-scripts-Misys Healthcare Solutions, Inc. on October 13, 2008. Net investment income (loss) per share and the ratio of net investment income (loss) to average net assets excluding the special dividend are $0.02 and 0.08% and $(0.03) and (0.17)% for Series I and Series II shares, respectively. |
Invesco V.I. Global Health Care Fund
Report of Independent Registered Public Accounting Firm
To the Board of Trustees of AIM Variable Insurance Funds (Invesco Variable Insurance Funds)
and Shareholders of Invesco V.I. Global Health Care Fund:
In our opinion, the accompanying statement of assets and liabilities, including the schedule of investments, and the related statements of operations and of changes in net assets and the financial highlights present fairly, in all material respects, the financial position of Invesco V.I. Global Health Care Fund (one of the funds constituting AIM Variable Insurance Funds (Invesco Variable Insurance Funds), hereafter referred to as the “Fund”) at December 31, 2011, the results of its operations for the year then ended, the changes in its net assets for each of the two years in the period then ended and the financial highlights for each of the five years in the period then ended, in conformity with accounting principles generally accepted in the United States of America. These financial statements and financial highlights (hereafter referred to as “financial statements”) are the responsibility of the Fund’s management; our responsibility is to express an opinion on these financial statements based on our audits. We conducted our audits of these financial statements in accordance with the standards of the Public Company Accounting Oversight Board (United States). Those standards require that we plan and perform the audit to obtain reasonable assurance about whether the financial statements are free of material misstatement. An audit includes examining, on a test basis, evidence supporting the amounts and disclosures in the financial statements, assessing the accounting principles used and significant estimates made by management, and evaluating the overall financial statement presentation. We believe that our audits, which included confirmation of securities at December 31, 2011 by correspondence with the custodian and brokers, provide a reasonable basis for our opinion.
PRICEWATERHOUSECOOPERS LLP
February 14, 2012
Houston, Texas
Invesco V.I. Global Health Care Fund
Calculating your ongoing Fund expenses
Example
As a shareholder of the Fund, you incur ongoing costs, including management fees; distribution and/or service fees (12b-1); and other Fund expenses. This example is intended to help you understand your ongoing costs (in dollars) of investing in the Fund and to compare these costs with ongoing costs of investing in other mutual funds. The example is based on an investment of $1,000 invested at the beginning of the period and held for the entire period July 1, 2011 through December 31, 2011.
The actual and hypothetical expenses in the examples below do not represent the effect of any fees or other expenses assessed in connection with a variable product; if they did, the expenses shown would be higher while the ending account values shown would be lower.
Actual expenses
The table below provides information about actual account values and actual expenses. You may use the information in this table, together with the amount you invested, to estimate the expenses that you paid over the period. Simply divide your account value by $1,000 (for example, an $8,600 account value divided by $1,000 = 8.6), then multiply the result by the number in the table under the heading entitled “Actual Expenses Paid During Period” to estimate the expenses you paid on your account during this period.
Hypothetical example for comparison purposes
The table below also provides information about hypothetical account values and hypothetical expenses based on the Fund’s actual expense ratio and an assumed rate of return of 5% per year before expenses, which is not the Fund’s actual return.
The hypothetical account values and expenses may not be used to estimate the actual ending account balance or expenses you paid for the period. You may use this information to compare the ongoing costs of investing in the Fund and other funds. To do so, compare this 5% hypothetical example with the 5% hypothetical examples that appear in the shareholder reports of the other funds.
Please note that the expenses shown in the table are meant to highlight your ongoing costs. Therefore, the hypothetical information is useful in comparing ongoing costs, and will not help you determine the relative total costs of owning different funds.
| | | | | | | | | | | | | | | | | | | | | | | | | | | | | | | |
| | | | | | | | | | HYPOTHETICAL
| | | |
| | | | | | | ACTUAL | | | (5% annual return before expenses) | | | |
| | | | Beginning
| | | Ending
| | | Expenses
| | | Ending
| | | Expenses
| | | Annualized
|
| | | | Account Value
| | | Account Value
| | | Paid During
| | | Account Value
| | | Paid During
| | | Expense
|
| Class | | | (07/01/11) | | | (12/31/11)1 | | | Period2 | | | (12/31/11) | | | Period2 | | | Ratio |
| Series I | | | $ | 1,000.00 | | | | $ | 907.50 | | | | $ | 5.43 | | | | $ | 1,019.51 | | | | $ | 5.75 | | | | | 1.13 | % |
| | | | | | | | | | | | | | | | | | | | | | | | | | | | | | | |
| Series II | | | | 1,000.00 | | | | | 906.60 | | | | | 6.63 | | | | | 1,018.25 | | | | | 7.02 | | | | | 1.38 | |
| | | | | | | | | | | | | | | | | | | | | | | | | | | | | | | |
| |
| 1 | The actual ending account value is based on the actual total return of the Fund for the period July 1, 2011 through December 31, 2011, after actual expenses and will differ from the hypothetical ending account value which is based on the Fund’s expense ratio and a hypothetical annual return of 5% before expenses. |
| 2 | Expenses are equal to the Fund’s annualized expense ratio as indicated above multiplied by the average account value over the period, multiplied by 184/365 to reflect the most recent fiscal half year. |
Invesco V.I. Global Health Care Fund
The address of each trustee and officer is AIM Variable Insurance Funds (Invesco Variable Insurance Funds) (the “Trust”), 11 Greenway Plaza, Suite 2500, Houston, Texas 77046-1173. The trustees serve for the life of the Trust, subject to their earlier death, incapacitation, resignation, retirement or removal as more specifically provided in the Trust’s organizational documents. Each officer serves for a one year term or until their successors are elected and qualified. Column two below includes length of time served with predecessor entities, if any.
| | | | | | | | | |
| | | | | | | Number of Funds
| | |
Name, Year of Birth and
| | Trustee and/
| | Principal Occupation(s)
| | in Fund Complex
| | Other Directorship(s)
|
| Position(s) Held with the Trust | | or Officer Since | | During Past 5 Years | | Overseen by Trustee | | Held by Trustee |
| | | | | | | | | |
| | | | | | | | | |
| | | | | | | | | |
Interested Persons | | | | | | | | |
| | | | | | | | | |
| | | | | | | | | |
| | | | | | | | | |
Martin L. Flanagan1 — 1960
Trustee | | 2007 | | Executive Director, Chief Executive Officer and President, Invesco Ltd. (ultimate parent of Invesco and a global investment management firm); Advisor to the Board, Invesco Advisers, Inc. (formerly known as Invesco Institutional (N.A.), Inc.); Trustee, The Invesco Funds; Vice Chair, Investment Company Institute; and Member of Executive Board, SMU Cox School of Business
Formerly: Chairman, Invesco Advisers, Inc. (registered investment adviser); Director, Chairman, Chief Executive Officer and President, IVZ Inc. (holding company), INVESCO Group Services, Inc. (service provider) and Invesco North American Holdings, Inc. (holding company); Director, Chief Executive Officer and President, Invesco Holding Company Limited (parent of Invesco and a global investment management firm); Director, Invesco Ltd.; Chairman, Investment Company Institute and President, Co-Chief Executive Officer, Co-President, Chief Operating Officer and Chief Financial Officer, Franklin Resources, Inc. (global investment management organization) | | 140 | | None |
| | | | | | | | | |
| | | | | | | | | |
| | | | | | | | | |
Philip A. Taylor2 — 1954
Trustee, President and Principal Executive Officer | | 2006 | | Head of North American Retail and Senior Managing Director, Invesco Ltd.; Director, Co-Chairman, Co-President and Co-Chief Executive Officer, Invesco Advisers, Inc. (formerly known as Invesco Institutional (N.A.), Inc.) (registered investment adviser); Director, Chairman, Chief Executive Officer and President, Invesco Management Group, Inc. (formerly Invesco Aim Management Group, Inc.) (financial services holding company); Director and President, INVESCO Funds Group, Inc. (registered investment adviser and registered transfer agent); Director and Chairman, Invesco Investment Services, Inc. (formerly known as Invesco Aim Investment Services, Inc.) (registered transfer agent) and IVZ Distributors, Inc. (formerly known as INVESCO Distributors, Inc.) (registered broker dealer); Director, President and Chairman, Invesco Inc. (holding company) and Invesco Canada Holdings Inc. (holding company); Chief Executive Officer, Invesco Corporate Class Inc. (corporate mutual fund company) and Invesco Canada Fund Inc. (corporate mutual fund company); Director, Chairman and Chief Executive Officer, Invesco Canada Ltd. (formerly known as Invesco Trimark Ltd./Invesco Trimark Ltèe) (registered investment adviser and registered transfer agent); Trustee, President and Principal Executive Officer, The Invesco Funds (other than AIM Treasurer’s Series Trust (Invesco Treasurer’s Series Trust) and Short-Term Investments Trust); Trustee and Executive Vice President, The Invesco Funds (AIM Treasurer’s Series Trust (Invesco Treasurer’s Series Trust) and Short-Term Investments Trust only); Director, Invesco Investment Advisers LLC (formerly known as Van Kampen Asset Management); Director, Chief Executive Officer and President, Van Kampen Exchange Corp. | | 140 | | None |
| | | | | | | | | |
| | | | | | | | | |
| | | | | Formerly: Director and Chairman, Van Kampen Investor Services Inc.: Director, Chief Executive Officer and President, 1371 Preferred Inc. (holding company); and Van Kampen Investments Inc.; Director and President, AIM GP Canada Inc. (general partner for limited partnerships); and Van Kampen Advisors, Inc.; Director and Chief Executive Officer, Invesco Trimark Dealer Inc. (registered broker dealer); Director, Invesco Distributors, Inc. (formerly known as Invesco Aim Distributors, Inc.) (registered broker dealer); Manager, Invesco PowerShares Capital Management LLC; Director, Chief Executive Officer and President, Invesco Advisers, Inc.; Director, Chairman, Chief Executive Officer and President, Invesco Aim Capital Management, Inc.; President, Invesco Trimark Dealer Inc. and Invesco Trimark Ltd./Invesco Trimark Ltèe; Director and President, AIM Trimark Corporate Class Inc. and AIM Trimark Canada Fund Inc.; Senior Managing Director, Invesco Holding Company Limited; Trustee and Executive Vice President, Tax-Free Investments Trust; Director and Chairman, Fund Management Company (former registered broker dealer); President and Principal Executive Officer, The Invesco Funds (AIM Treasurer’s Series Trust (Invesco Treasurer’s Series Trust), Short-Term Investments Trust and Tax-Free Investments Trust only); President, AIM Trimark Global Fund Inc. and AIM Trimark Canada Fund Inc. | | | | |
| | | | | | | | | |
| | | | | | | | | |
| | | | | | | | | |
Wayne W. Whalen3 — 1939
Trustee | | 2010 | | Of Counsel, and prior to 2010, partner in the law firm of Skadden, Arps, Slate, Meagher & Flom LLP, legal counsel to funds in the Fund Complex | | 158 | | Director of the Abraham Lincoln Presidential Library Foundation |
| | | | | | | | | |
| | | | | | | | | |
| | | | | | | | | |
Independent Trustees | | | | | | | | |
| | | | | | | | | |
| | | | | | | | | |
| | | | | | | | | |
Bruce L. Crockett — 1944
Trustee and Chair | | 1993 | | Chairman, Crockett Technology Associates (technology consulting company) | | 140 | | ACE Limited (insurance company); and Investment Company Institute |
| | | | | Formerly: Director, Captaris (unified messaging provider); Director, President and Chief Executive Officer COMSAT Corporation; and Chairman, Board of Governors of INTELSAT (international communications company) | | | | |
| | | | | | | | | |
| |
| 1 | Mr. Flanagan is considered an interested person of the Trust because he is an officer of the adviser to the Trust, and an officer and a director of Invesco Ltd., ultimate parent of the adviser to the Trust. |
| 2 | Mr. Taylor is considered an interested person of the Trust because he is an officer and a director of the adviser to, and a director of the principal underwriter of, the Trust. |
| 3 | Mr. Whalen is considered an “interested person” (within the meaning of Section 2(a)(19) of the 1940 Act) of certain Funds in the Fund Complex by reason of he and his firm currently providing legal services as legal counsel to such Funds in the Fund Complex. |
Invesco V.I. Global Health Care Fund
Trustees and Officers—(continued)
The address of each trustee and officer is AIM Variable Insurance Funds (Invesco Variable Insurance Funds) (the “Trust”), 11 Greenway Plaza, Suite 2500, Houston, Texas 77046-1173. The trustees serve for the life of the Trust, subject to their earlier death, incapacitation, resignation, retirement or removal as more specifically provided in the Trust’s organizational documents. Each officer serves for a one year term or until their successors are elected and qualified. Column two below includes length of time served with predecessor entities, if any.
| | | | | | | | | |
| | | | | | | Number of Funds
| | |
Name, Year of Birth and
| | Trustee and/
| | Principal Occupation(s)
| | in Fund Complex
| | Other Directorship(s)
|
| Position(s) Held with the Trust | | or Officer Since | | During Past 5 Years | | Overseen by Trustee | | Held by Trustee |
| | | | | | | | | |
| | | | | | | | | |
| | | | | | | |
Independent Trustees—(continued) | | | | | | |
| | | | | | | | | |
| | | | | | | | | |
| | | | | | | | | |
David C. Arch — 1945
Trustee | | 2010 | | Chairman and Chief Executive Officer of Blistex Inc., a consumer health care products manufacturer. | | 158 | | Member of the Heartland Alliance Advisory Board, a nonprofit organization serving human needs based in Chicago. Board member of the Illinois Manufacturers’ Association. Member of the Board of Visitors, Institute for the Humanities, University of Michigan |
| | | | | | | | | |
| | | | | | | | | |
| | | | | | | | | |
Frank S. Bayley — 1939
Trustee | | 2001 | | Retired
Formerly: Director, Badgley Funds, Inc. (registered investment company) (2 portfolios) and Partner, law firm of Baker & McKenzie
Formerly: Director, Badgley Funds, Inc. (registered investment company) (2 portfolios) and Partner, law firm of Baker & McKenzie | | 140 | | Director and Chairman, C.D. Stimson Company (a real estate investment company) |
| | | | | | | | | |
| | | | | | | | | |
| | | | | | | | | |
James T. Bunch — 1942
Trustee | | 2004 | | Managing Member, Grumman Hill Group LLC (family office private equity management)
Formerly: Founder, Green, Manning & Bunch Ltd. (investment banking firm)(1988-2010); Executive Committee, United States Golf Association; and Director, Policy Studies, Inc. and Van Gilder Insurance Corporation | | 140 | | Vice Chairman, Board of Governors, Western Golf Association/Evans Scholars Foundation and Director, Denver Film Society |
| | | | | | | | | |
| | | | | | | | | |
| | | | | | | | | |
Rodney F. Dammeyer — 1940
Trustee | | 2010 | | President of CAC, LLC, a private company offering capital investment and management advisory services.
Formerly: Prior to January 2004, Director of TeleTech Holdings Inc.; Prior to 2002, Director of Arris Group, Inc.; Prior to 2001, Managing Partner at Equity Group Corporate Investments. Prior to 1995, Vice Chairman of Anixter International. Prior to 1985, experience includes Senior Vice President and Chief Financial Officer of Household International, Inc., Executive Vice President and Chief Financial Officer of Northwest Industries, Inc. and Partner of Arthur Andersen & Co. | | 158 | | Director of Quidel Corporation and Stericycle, Inc. Prior to May 2008, Trustee of The Scripps Research Institute. Prior to February 2008, Director of Ventana Medical Systems, Inc. Prior to April 2007, Director of GATX Corporation. Prior to April 2004, Director of TheraSense, Inc. |
| | | | | | | | | |
| | | | | | | | | |
| | | | | | | | | |
Albert R. Dowden — 1941
Trustee | | 2000 | | Director of a number of public and private business corporations, including the Boss Group, Ltd. (private investment and management); Reich & Tang Funds (5 portfolios) (registered investment company); and Homeowners of America Holding Corporation/ Homeowners of America Insurance Company (property casualty company)
Formerly: Director, Continental Energy Services, LLC (oil and gas pipeline service); Director, CompuDyne Corporation (provider of product and services to the public security market) and Director, Annuity and Life Re (Holdings), Ltd. (reinsurance company); Director, President and Chief Executive Officer, Volvo Group North America, Inc.; Senior Vice President, AB Volvo; Director of various public and private corporations; Chairman, DHJ Media, Inc.; Director Magellan Insurance Company; and Director, The Hertz Corporation, Genmar Corporation (boat manufacturer), National Media Corporation; Advisory Board of Rotary Power International (designer, manufacturer, and seller of rotary power engines); and Chairman, Cortland Trust, Inc. (registered investment company) | | 140 | | Board of Nature’s Sunshine Products, Inc. |
| | | | | | | | | |
| | | | | | | | | |
| | | | | | | | | |
Jack M. Fields — 1952
Trustee | | 1997 | | Chief Executive Officer, Twenty First Century Group, Inc. (government affairs company); and Owner and Chief Executive Officer, Dos Angelos Ranch, L.P. (cattle, hunting, corporate entertainment), Discovery Global Education Fund (non-profit) and Cross Timbers Quail Research Ranch (non-profit)
Formerly: Chief Executive Officer, Texana Timber LP (sustainable forestry company) and member of the U.S. House of Representatives | | 140 | | Administaff |
| | | | | | | | | |
| | | | | | | | | |
| | | | | | | | | |
Carl Frischling — 1937
Trustee | | 1993 | | Partner, law firm of Kramer Levin Naftalis and Frankel LLP | | 140 | | Director, Reich & Tang Funds (16 portfolios) |
| | | | | | | | | |
| | | | | | | | | |
Invesco V.I. Global Health Care Fund
Trustees and Officers—(continued)
The address of each trustee and officer is AIM Variable Insurance Funds (Invesco Variable Insurance Funds) (the “Trust”), 11 Greenway Plaza, Suite 2500, Houston, Texas 77046-1173. The trustees serve for the life of the Trust, subject to their earlier death, incapacitation, resignation, retirement or removal as more specifically provided in the Trust’s organizational documents. Each officer serves for a one year term or until their successors are elected and qualified. Column two below includes length of time served with predecessor entities, if any.
| | | | | | | | | |
| | | | | | | Number of Funds
| | |
Name, Year of Birth and
| | Trustee and/
| | Principal Occupation(s)
| | in Fund Complex
| | Other Directorship(s)
|
| Position(s) Held with the Trust | | or Officer Since | | During Past 5 Years | | Overseen by Trustee | | Held by Trustee |
| | | Independent Trustees—(continued) | | | | |
| | | | | | | | | |
| | | | | | | | | |
| | | | | | | | | |
Prema Mathai-Davis — 1950
Trustee | | 1998 | | Retired
Formerly: Chief Executive Officer, YWCA of the U.S.A. | | 140 | | None |
| | | | | | | | | |
| | | | | | | | | |
| | | | | | | | | |
Larry Soll — 1942
Trustee | | 2004 | | Retired
Formerly, Chairman, Chief Executive Officer and President, Synergen Corp. (a biotechnology company) | | 140 | | None |
| | | | | | | | | |
| | | | | | | | | |
| | | | | | | | | |
Hugo F. Sonnenschein — 1940
Trustee | | 2010 | | President Emeritus and Honorary Trustee of the University of Chicago and the Adam Smith Distinguished Service Professor in the Department of Economics at the University of Chicago. Prior to July 2000, President of the University of Chicago. | | 158 | | Trustee of the University of Rochester and a member of its investment committee. Member of the National Academy of Sciences, the American Philosophical Society and a fellow of the American Academy of Arts and Sciences |
| | | | | | | | | |
| | | | | | | | | |
| | | | | | | | | |
| Raymond Stickel, Jr. — 1944 Trustee | | 2005 | | Retired
Formerly: Director, Mainstay VP Series Funds, Inc. (25 portfolios) and Partner, Deloitte & Touche | | 140 | | None |
| | | | | | | | | |
| | | | | | | | | |
| | | | | | | | | |
Other Officers | | | | | | | | |
| | | | | | | | | |
| | | | | | | | | |
| | | | | | | | | |
Russell C. Burk — 1958
Senior Vice President and Senior Officer | | 2005 | | Senior Vice President and Senior Officer, The Invesco Funds | | N/A | | N/A |
| | | | | | | | | |
| | | | | | | | | |
| | | | | | | | | |
John M. Zerr — 1962
Senior Vice President, Chief Legal Officer and Secretary | | 2006 | | Director, Senior Vice President, Secretary and General Counsel, Invesco Management Group, Inc. (formerly known as Invesco Aim Management Group, Inc.) and Van Kampen Exchange Corp.; Senior Vice President, Invesco Advisers, Inc. (formerly known as Invesco Institutional (N.A.), Inc.) (registered investment adviser); Senior Vice President and Secretary, Invesco Distributors, Inc. (formerly known as Invesco Aim Distributors, Inc.); Director, Vice President and Secretary, Invesco Investment Services, Inc. (formerly known as Invesco Aim Investment Services, Inc.) and IVZ Distributors, Inc. (formerly known as INVESCO Distributors, Inc.); Director and Vice President, INVESCO Funds Group, Inc.; Senior Vice President, Chief Legal Officer and Secretary, The Invesco Funds; Manager, Invesco PowerShares Capital Management LLC; Director, Secretary and General Counsel, Invesco Investment Advisers LLC (formerly known as Van Kampen Asset Management); Secretary and General Counsel, Van Kampen Funds Inc. and Chief Legal Officer, PowerShares Exchange-Traded Fund Trust, PowerShares Exchange-Traded Fund Trust II, PowerShares India Exchange-Traded Fund Trust and PowerShares Actively Managed Exchange-Traded Fund Trust
Formerly: Director and Secretary, Van Kampen Advisors Inc.; Director Vice President, Secretary and General Counsel Van Kampen Investor Services Inc.; Director, Invesco Distributors, Inc. (formerly known as Invesco Aim Distributors, Inc.); Director, Senior Vice President, General Counsel and Secretary, Invesco Advisers, Inc.; and Van Kampen Investments Inc.; Director, Vice President and Secretary, Fund Management Company; Director, Senior Vice President, Secretary, General Counsel and Vice President, Invesco Aim Capital Management, Inc.; Chief Operating Officer and General Counsel, Liberty Ridge Capital, Inc. (an investment adviser); Vice President and Secretary, PBHG Funds (an investment company) and PBHG Insurance Series Fund (an investment company); Chief Operating Officer, General Counsel and Secretary, Old Mutual Investment Partners (a broker-dealer); General Counsel and Secretary, Old Mutual Fund Services (an administrator) and Old Mutual Shareholder Services (a shareholder servicing center); Executive Vice President, General Counsel and Secretary, Old Mutual Capital, Inc. (an investment adviser); and Vice President and Secretary, Old Mutual Advisors Funds (an investment company) | | N/A | | N/A |
| | | | | | | | | |
| | | | | | | | | |
| | | | | | | | | |
Lisa O. Brinkley — 1959
Vice President | | 2004 | | Global Compliance Director, Invesco Ltd.; Chief Compliance Officer, Invesco Investment Services, Inc.(formerly known as Invesco Aim Investment Services, Inc.); and Vice President, The Invesco Funds
Formerly: Chief Compliance Officer, Invesco Distributors, Inc. (formerly known as Invesco Aim Distributors, Inc.) and Van Kampen Investor Services Inc.; Senior Vice President, Invesco Management Group, Inc.; Senior Vice President and Chief Compliance Officer, Invesco Advisers, Inc. and The Invesco Funds; Vice President and Chief Compliance Officer, Invesco Aim Capital Management, Inc. and Invesco Distributors, Inc.; Vice President, Invesco Investment Services, Inc. and Fund Management Company | | N/A | | N/A |
| | | | | | | | | |
Invesco V.I. Global Health Care Fund
Trustees and Officers—(continued)
The address of each trustee and officer is AIM Variable Insurance Funds (Invesco Variable Insurance Funds) (the “Trust”), 11 Greenway Plaza, Suite 2500, Houston, Texas 77046-1173. The trustees serve for the life of the Trust, subject to their earlier death, incapacitation, resignation, retirement or removal as more specifically provided in the Trust’s organizational documents. Each officer serves for a one year term or until their successors are elected and qualified. Column two below includes length of time served with predecessor entities, if any.
| | | | | | | | | |
| | | | | | | Number of Funds
| | |
Name, Year of Birth and
| | Trustee and/
| | Principal Occupation(s)
| | in Fund Complex
| | Other Directorship(s)
|
| Position(s) Held with the Trust | | or Officer Since | | During Past 5 Years | | Overseen by Trustee | | Held by Trustee |
| | | Other Officers—(continued) | | | | |
| | | | | | | | | |
| | | | | | | | | |
| | | | | | | | | |
Sheri Morris — 1964
Vice President, Treasurer and Principal Financial Officer | | 1999 | | Vice President, Treasurer and Principal Financial Officer, The Invesco Funds; Vice President, Invesco Advisers, Inc. (formerly known as Invesco Institutional (N.A.), Inc.) (registered investment adviser).
Formerly: Treasurer, PowerShares Exchange-Traded Fund Trust, PowerShares Exchange-Traded Fund Trust II, PowerShares India Exchange-Traded Fund Trust and PowerShares Actively Managed Exchange-Traded Fund Trust, Vice President, Invesco Advisers, Inc., Invesco Aim Capital Management, Inc. and Invesco Aim Private Asset Management, Inc.; Assistant Vice President and Assistant Treasurer, The Invesco Funds and Assistant Vice President, Invesco Advisers, Inc., Invesco Aim Capital Management, Inc. and Invesco Aim Private Asset Management, Inc. | | N/A | | N/A |
| | | | | | | | | |
| | | | | | | | | |
| | | | | | | | | |
Karen Dunn Kelley — 1960
Vice President | | 1993 | | Head of Invesco’s World Wide Fixed Income and Cash Management Group; Senior Vice President, Invesco Management Group, Inc. (formerly known as Invesco Aim Management Group, Inc.) and Invesco Advisers, Inc. (formerly known as Invesco Institutional (N.A.), Inc.) (registered investment adviser); Executive Vice President, Invesco Distributors, Inc. (formerly known as Invesco Aim Distributors, Inc.); Director, Invesco Mortgage Capital Inc.; Vice President, The Invesco Funds (other than AIM Treasurer’s Series Trust (Invesco Treasurer’s Series Trust) and Short-Term Investments Trust); and President and Principal Executive Officer, The Invesco Funds (AIM Treasurer’s Series Trust (Invesco Treasurer’s Series Trust) and Short-Term Investments Trust only).
Formerly: Senior Vice President, Van Kampen Investments Inc.; Vice President, Invesco Advisers, Inc. (formerly known as Invesco Institutional (N.A.), Inc.); Director of Cash Management and Senior Vice President, Invesco Advisers, Inc. and Invesco Aim Capital Management, Inc.; President and Principal Executive Officer, Tax-Free Investments Trust; Director and President, Fund Management Company; Chief Cash Management Officer, Director of Cash Management, Senior Vice President, and Managing Director, Invesco Aim Capital Management, Inc.; Director of Cash Management, Senior Vice President, and Vice President, Invesco Advisers, Inc. and The Invesco Funds (AIM Treasurer’s Series Trust (Invesco Treasurer’s Series Trust), Short-Term Investments Trust and Tax-Free Investments Trust only) | | N/A | | N/A |
| | | | | | | | | |
| | | | | | | | | |
| | | | | | | | | |
Yinka Akinsola — 1977
Anti-Money Laundering Compliance Officer | | 2011 | | Anti-Money Laundering Compliance Officer, Invesco Advisers, Inc. (formerly known as Invesco Institutional (N.A.), Inc.) (registered investment adviser); Invesco Distributors, Inc. (formerly known as Invesco Aim Distributors, Inc.), Invesco Investment Services, Inc. (formerly known as Invesco Aim Investment Services, Inc.), Invesco Management Group, Inc., The Invesco Funds, Invesco Van Kampen Closed-End Funds, Van Kampen Exchange Corp. and Van Kampen Funds Inc. | | N/A | | N/A |
| | | | | | | | | |
| | | | | | | | | |
| | | | | | | | | |
Todd L. Spillane — 1958
Chief Compliance Officer | | 2006 | | Senior Vice President, Invesco Management Group, Inc. (formerly known as Invesco Aim Management Group, Inc.) and Van Kampen Exchange Corp.; Senior Vice President and Chief Compliance Officer, Invesco Advisers, Inc. (registered investment adviser) (formerly known as Invesco Institutional (N.A.), Inc.); Chief Compliance Officer, The Invesco Funds, INVESCO Private Capital Investments, Inc. (holding company) and Invesco Private Capital, Inc. (registered investment adviser); Vice President, Invesco Distributors, Inc. (formerly known as Invesco Aim Distributors, Inc.) and Invesco Investment Services, Inc. (formerly known as Invesco Aim Investment Services, Inc.).
Formerly: Chief Compliance Officer, Invesco Van Kampen Closed-End Funds PowerShares Exchange-Traded Fund Trust, PowerShares Exchange-Traded Fund Trust II, PowerShares India Exchange-Traded Fund Trust, and PowerShares Actively Managed Exchange-Traded Fund Trust; Senior Vice President, Van Kampen Investments Inc.; Senior Vice President and Chief Compliance Officer, Invesco Advisers, Inc. and Invesco Aim Capital Management, Inc.; Chief Compliance Officer, Invesco Global Asset Management (N.A.), Inc., Invesco Senior Secured Management, Inc. (registered investment adviser) and Van Kampen Investor Services Inc.; Vice President, Invesco Aim Capital Management, Inc. and Fund Management Company | | N/A | | N/A |
| | | | | | | | | |
The Statement of Additional Information of the Trust includes additional information about the Fund’s Trustees and is available upon request, without charge, by calling 1.800.959.4246. Please refer to the Fund’s prospectus for information on the Fund’s sub-advisers.
| | | | | | | |
Office of the Fund
11 Greenway Plaza, Suite 2500
Houston, TX 77046-1173 | | Investment Adviser
Invesco Advisers, Inc.
1555 Peachtree Street, N.E.
Atlanta, GA 30309 | | Distributor
Invesco Distributors, Inc.
11 Greenway Plaza, Suite 2500
Houston, TX 77046-1173 | | Auditors
PricewaterhouseCoopers LLP
1201 Louisiana Street, Suite 2900
Houston, TX 77002-5678 |
| | | | | | | |
| | | | | | | |
Counsel to the Fund
Stradley Ronon Stevens & Young, LLP
2600 One Commerce Square
Philadelphia, PA 19103 | | Counsel to the Independent Trustees
Kramer, Levin, Naftalis & Frankel LLP
1177 Avenue of the Americas
New York, NY 10036-2714 | | Transfer Agent
Invesco Investment Services, Inc.
11 Greenway Plaza, Suite 2500
Houston, TX77046-1173 | | Custodian
State Street Bank and Trust Company
225 Franklin
Boston, MA 02110-2801 |
Invesco V.I. Global Health Care Fund
Invesco V.I. Global Real Estate Fund
Annual Report to Shareholders § December 31, 2011
The Fund provides a complete list of its holdings four times in each fiscal year, at the quarter-ends. For the second and fourth quarters, the lists appear in the Fund’s semiannual and annual reports to shareholders. For the first and third quarters, the Fund files the lists with the Securities and Exchange Commission (SEC) on Form N-Q. The Fund’s Form N-Q filings are available on the SEC website, sec.gov. Copies of the Fund’s Forms N-Q may be reviewed and copied at the SEC Public Reference Room in Washington, D.C. You can obtain information on the operation of the Public Reference Room, including information about duplicating fee charges, by calling 202 551 8090 or 800 732 0330, or by electronic request at the following email address: publicinfo@sec.gov. The SEC file numbers for the Fund are 811-07452 and 033-57340. The Fund’s most recent portfolio holdings, as filed on Form N-Q, have also been made available to insurance companies issuing variable annuity contracts and variable life insurance policies (“variable products”) that invest in the Fund.
A description of the policies and procedures that the Fund uses to determine how to vote proxies relating to portfolio securities is available without charge, upon request, from our Client Services department at 800 959 4246 or at invesco.com/proxyguidelines. The information is also available on the SEC website, sec.gov.
Information regarding how the Fund voted proxies related to its portfolio securities during the 12 months ended June 30, 2011, is available at invesco.com/proxysearch. The information is also available on the SEC website, sec.gov.
Invesco Advisers, Inc. is an investment adviser; it provides investment advisory services to individual and institutional clients and does not sell securities. Invesco Distributors, Inc. is the U.S. distributor for Invesco Ltd.’s retail mutual funds, exchange-traded funds and institutional money market funds. Both are wholly owned, indirect subsidiaries of Invesco Ltd.
This report must be accompanied or preceded by a currently effective Fund prospectus and variable product prospectus, which contain more complete information, including sales charges and expenses. Investors should read each carefully before investing.
Invesco Distributors, Inc.
VIGRE-AR-1
| | | | | |
| |
| NOT FDIC INSURED | | MAY LOSE VALUE | | NO BANK GUARANTEE |
Management’s Discussion of Fund Performance
Performance summary
For the year ended December 31, 2011, investors generally favored U.S. securities over international securities as the European debt crisis remained at the forefront of investor concerns. Despite stronger U.S. real estate securities performance, global real estate securities delivered negative returns during the reporting period, under-performing the broad market. Similarly, Invesco V.I. Global Real Estate Fund also delivered negative returns for the reporting period and underperformed the Fund’s broad market index, the MSCI World Index. The Fund’s underperformance relative to its style-specific benchmark, the FTSE EPRA/NAREIT Developed Real Estate Index, was primarily the result of security selection in select countries, including Japan and Australia.
Your Fund’s long-term performance appears later in this report.
Fund vs. Indexes
Total returns, 12/31/10 to 12/31/11, excluding variable product issuer charges. If variable product issuer charges were included, returns would be lower.
| | | | | |
| Series I Shares | | | -6.51 | % |
| |
| Series II Shares | | | -6.73 | |
| |
MSCI World Index▼ (Broad Market Index) | | | -5.54 | |
| |
FTSE EPRA/NAREIT Developed Real Estate Index■ (Style-Specific Index) | | | -5.82 | |
| |
Lipper VUF Real Estate Funds Category Average▼ (Peer Group) | | | 2.04 | |
| |
| | |
| Source(s): ▼Lipper Inc.; ■ Invesco, Bloomberg L.P. |
How we invest
Your Fund holds primarily real estate investment trusts (REITs) and other property-related securities from the U.S. and abroad whose value is driven by tangible assets. Our goal is to create a global Fund focused on total return that will perform at or above index levels with comparable levels of risk. Our investment strategy focuses on identifying U.S. and non-U.S. property types we believe will benefit from long-term sector trends. We use a fundamentals-driven investment process, including property market cycle analysis, property evaluation and management and structure review, to identify securities with:
| n | | Quality underlying properties. |
| n | | Solid management teams and flexible balance sheets. |
| |
| n | | Attractive valuations relative to peer investment alternatives. |
We attempt to manage risk by diversifying property types and geographic locations as well as limiting the size of any one holding.
We consider selling a holding when:
| n | | Relative valuation falls below desired levels. |
| |
| n | | Risk/return relationships change significantly. |
| |
| n | | Company fundamentals (property type, geography or management) change. |
| |
| n | | A more attractive investment opportunity is identified. |
Portfolio Composition
By country
| | | | | |
| United States | | | 48.0 | % |
| |
| Hong Kong | | | 11.3 | |
| |
| Japan | | | 8.5 | |
| |
| Australia | | | 8.3 | |
| |
| United Kingdom | | | 4.9 | |
| |
| Canada | | | 4.3 | |
| |
| France | | | 3.7 | |
| |
| Singapore | | | 3.6 | |
| |
| Countries each less than 2.0% of portfolio | | | 5.5 | |
| |
Money Market Funds Plus Other Assets | | | | |
| |
Less Liabilities | | | 1.9 | |
The Fund’s holdings are subject to change, and there is no assurance that the Fund will continue to hold any particular security.
*Excluding money market fund holdings.
Top 10 Equity Holdings*
| | | | | | | | | |
| | | | | | | | | |
| | 1. | | | Simon Property Group, Inc. | | | 4.9 | % |
| |
| | 2. | | | Sun Hung Kai Properties Ltd. | | | 3.3 | |
| |
| | 3. | | | Ventas, Inc. | | | 2.6 | |
| |
| | 4. | | | Westfield Group | | | 2.5 | |
| |
| | 5. | | | HCP, Inc. | | | 2.3 | |
| |
| | 6. | | | Unibail-Rodamco S.E. | | | 2.3 | |
| |
| | 7. | | | Mitsubishi Estate Co. Ltd. | | | 2.2 | |
| |
| | 8. | | | Equity Residential | | | 2.1 | |
| |
| | 9. | | | Boston Properties, Inc. | | | 2.1 | |
| |
| | 10. | | | Prologis, Inc. | | | 2.1 | |
| | |
| Total Net Assets | | $196.6 million |
| | | |
| Total Number of Holdings* | | 127 |
Market conditions and your Fund
Equity markets were highly volatile during the year as investors weighed the competing issues of improved corporate profits, soft macroeconomic data and sovereign debt issues in Europe. In the U.S., corporate earnings increased, but often were overshadowed by concerns about high unemployment and a lack of consumer confidence. After generally rising through July, major equity indexes sold off precipitously in August. At the same time, the U.S. received the first-ever downgrade to its credit rating from Standard & Poor’s, while the euro-zone’s sovereign debt concerns prompted fears of a “double-dip” recession. Equity markets rebounded in the fourth quarter of 2011, despite a lack of meaningful resolutions to improve the global economy. Ultimately, major international and global equity indexes produced negative returns for the year, and six of the 10 market sectors of the MSCI World Index posted losses.
In this environment, global real estate securities, as measured by the FTSE EPRA/NAREIT Developed Real Estate Index, and the Fund produced losses for the year and underperformed the broad market, as measured by the MSCI World Index. The Fund’s underperformance relative to its style-specific benchmark was primarily the result of security selection in select countries, including Japan and Australia. Additionally, the Fund’s underweight exposure to Canada hurt relative performance during the year. Conversely, the Fund benefited from security selection in U.S. REITs, as well as security selection and an underweight exposure in Germany. Cash, although only a minor portion of Fund assets, also contributed positively to the Fund’s performance relative to its style-specific benchmark, given the equity market losses during the year.
Top contributors during the year included Simon Property Group and Digital Realty Trust. Simon Property Group is one of the largest real estate companies with interests in approximately 392 retail real estate properties in North America, Europe and Asia. Demand for Digital Realty Trust, an integrated technology-related REIT, remained robust as data storage remains a priority for many companies.
Invesco V.I. Global Real Estate Fund
Top detractors from the Fund’s performance included Sun Hung Kai Properties and Hong Kong Land. These two property companies experienced lackluster performance during the year, along with most Asian property stocks, which underperformed the style-specific benchmark. Sun Hung Kai Properties is one of the largest property companies in Hong Kong focusing on premium quality residential and commercial development. Hong Kong Land primarily owns and manages prime commercial space in Hong Kong and also develops premium properties in China and Singapore.
At the end of 2011 and relative to our style-specific benchmark, we were modestly overweight in France, Hong Kong and Australia. Conversely, we were underweight in the U.S., Netherlands, Canada, the U.K. and Japan. We generally maintained our bias toward companies with higher quality assets, tenant rosters and flexible yet generally lower-leveraged balance sheets with longer-term debt maturities. As a result of improvements in economic growth, we sought to add positions in companies capable of delivering higher cash flow growth. We continued to maintain a well-diversified portfolio across all property types and global economic regions, based on a combination of relative fundamentals and stock valuations.
We thank you for your continued investment in Invesco V.I. Global Real Estate Fund.
The views and opinions expressed in management’s discussion of Fund performance are those of Invesco Advisers, Inc. These views and opinions are subject to change at any time based on factors such as market and economic conditions. These views and opinions may not be relied upon as investment advice or recommendations, or as an offer for a particular security. The information is not a complete analysis of every aspect of any market, country, industry, security or the Fund. Statements of fact are from sources considered reliable, but Invesco Advisers, Inc. makes no representation or warranty as to their completeness or accuracy. Although historical performance is no guarantee of future results, these insights may help you understand our investment management philosophy.
See important Fund and, if applicable, index disclosures later in this report.
Joe Rodriguez, Jr.
Portfolio manager, is lead manager of Invesco V.I. Global Real Estate Fund. He is head of real estate securities for Invesco Real Estate, where he oversees all phases of the unit, including securities research and administration. Mr. Rodriguez began his investment career in 1983 and joined Invesco in 1990. He earned a B.B.A. in economics and finance and an M.B.A. in finance from Baylor University.
Mark Blackburn
Chartered Financial Analyst, portfolio manager, is manager of Invesco V.I. Global Real Estate Fund. He joined Invesco in 1998. Mr. Blackburn earned a B.S. in accounting from Louisiana State University and an M.B.A. from Southern Methodist University. He is a Certified Public Accountant.
James Cowen
Portfolio manager, is manager of Invesco V.I. Global Real Estate Fund. Mr. Cowen has worked in the financial industry since 1998 and joined Invesco in 2000. He earned a Master of Town and Country Planning degree from the University of Manchester and a Master of Philosophy degree in land economy from Cambridge University.
Paul Curbo
Chartered Financial Analyst, portfolio manager, is manager of Invesco V.I. Global Real Estate Fund. He joined Invesco in 1998. Mr. Curbo earned a B.B.A. in finance from The University of Texas at Dallas.
Darin Turner
Portfolio manager, is manager of Invesco V.I. Global Real Estate Fund. He joined Invesco in 2005. Mr. Turner earned a B.B.A. in finance from Baylor University, an M.S. in real estate from The University of Texas at Arlington and an M.B.A. specializing in investments from Southern Methodist University.
Ping Ying Wang
Chartered Financial Analyst, portfolio manager, is manager of Invesco V.I. Global Real Estate Fund. She joined Invesco in 1998. She earned a B.S. in international finance from the People’s University of China and a Ph.D. in finance from The University of Texas at Dallas.
Invesco V.I. Global Real Estate Fund
Your Fund’s Long-Term Performance
Results of a $10,000 Investment – Oldest Share Class(es)
Fund and index data from 12/31/01*
| |
| |
| * | During the reporting period, Invesco changed its policy regarding growth of $10,000 charts. For funds older than 10 years, we previously showed performance since inception. Going forward, we will show performance for the most recent 10 years, since this more accurately reflects the experience of the typical shareholder. As a result, charts now may include benchmarks that did not appear previously, because the funds’ inception pre-dated the benchmarks’ inception. Also, all charts will now be presented using a linear format. |
Past performance cannot guarantee comparable future results.
| | | | |
| |
| Average Annual Total Returns |
| As of 12/31/11 |
| | | | | |
Series I Shares | | | | |
| |
| Inception (3/31/98) | | | 7.42 | % |
| |
| 10 Years | | | 9.52 | |
| |
| 5 Years | | | -5.45 | |
| |
| 1 Year | | | -6.51 | |
| |
| | | | | |
Series II Shares | | | | |
| |
| 10 Years | | | 9.26 | % |
| |
| 5 Years | | | -5.67 | |
| |
| 1 Year | | | -6.73 | |
Series II shares incepted on April 30, 2004. Performance shown prior to that date is that of Series I shares, restated to reflect the higher 12b-1 fees applicable to Series II. Series I performance reflects any applicable fee waivers or expense reimbursements. The performance of the Fund’s Series I and Series II share classes will differ primarily due to different class expenses.
The performance data quoted represent past performance and cannot guarantee comparable future results;
current performance may be lower or higher. Please contact your variable product issuer or financial adviser for the most recent month-end variable product performance. Performance figures reflect Fund expenses, reinvested distributions and changes in net asset value. Investment return and principal value will fluctuate so that you may have a gain or loss when you sell shares.
The total annual Fund operating expense ratio set forth in the most recent Fund prospectus as of the date of this report for Series I and Series II shares was 1.20% and 1.45%, respectively. The expense ratios presented above may vary from the expense ratios presented in other sections of this report that are based on expenses incurred during the period covered by this report.
Invesco V.I. Global Real Estate Fund, a series portfolio of AIM Variable Insurance Funds (Invesco Variable Insurance Funds), is currently offered
through insurance companies issuing variable products. You cannot purchase shares of the Fund directly. Performance figures given represent the Fund and are not intended to reflect actual variable product values. They do not reflect sales charges, expenses and fees assessed in connection with a variable product. Sales charges, expenses and fees, which are determined by the variable product issuers, will vary and will lower the total return.
The most recent month-end performance data at the Fund level, excluding variable product charges, is available at 800 451 4246. As mentioned above, for the most recent month-end performance including variable product charges, please contact your variable product issuer or financial adviser.
Had the adviser not waived fees and/or reimbursed expenses in the past, performance would have been lower.
Invesco V.I. Global Real Estate Fund
Invesco V.I. Global Real Estate Fund’s investment objective is total return through growth of capital and current income.
| n | | Unless otherwise stated, information presented in this report is as of December 31, 2011, and is based on total net assets. |
| |
| n | | Unless otherwise noted, all data provided by Invesco. |
| |
| n | | To access your Fund’s reports/prospectus, visit invesco.com/fundreports. |
Principal risks of investing in the Fund
Concentration risk. To the extent the Fund invests a greater amount in any one sector or industry, the Fund’s performance will depend to a greater extent on the overall condition of the sector or industry, and there is increased risk to the Fund if conditions adversely affect that sector or industry.
Credit risk. The issuer of instruments in which the Fund invests may be unable to meet interest and/or principal payments, thereby causing its instruments to decrease in value and lowering the issuer’s credit rating.
Foreign securities risk. The Fund’s foreign investments may be affected by changes in a foreign country’s exchange rates; political and social instability; changes in economic or taxation policies; difficulties when enforcing obligations; decreased liquidity; and increased volatility. Foreign companies may be subject to less regulation resulting in less publicly available information about the companies.
High yield bond (junk bond) risk. Junk bonds involve a greater risk of default or price changes due to changes in the credit quality of the issuer. The values of junk bonds fluctuate more than those of high-quality bonds in response to company, political, regulatory or economic developments. Values of junk bonds can decline significantly over short periods of time.
Interest rate risk. Interest rate risk refers to the risk that bond prices generally fall as interest rates rise; conversely, bond prices generally rise as interest rates fall. Specific bonds differ in their sensitivity to changes in interest rates depending on their individual characteristics, including duration.
Management risk. The investment techniques and risk analysis used by the Fund’s portfolio managers may not produce the desired results.
Market risk. The prices of and the income generated by the Fund’s securities may decline in response to, among other things, investor sentiment; general economic and market conditions; regional or global instability; and currency and interest rate fluctuations.
REIT risk/real estate risk. Investments in real-estate related instruments may be affected by economic, legal, cultural, environmental or technological factors that affect property values, rents or occupancies of real estate related to the Fund’s holdings. Real estate companies, including REITs or similar structures, tend to be small and mid-cap companies and their shares may be more volatile and less liquid. The value of investments in real estate related companies may be affected by the quality of management, the ability to repay loans, the utilization of leverage and financial covenants related thereto, whether the company carries adequate insurance and environmental factors. If a real estate related company defaults, the Fund may own real estate directly, which involves the following additional risks: environmental liabilities; difficulty in valuing and selling the real estate; and economic or regulatory changes.
Short sales risk. Short sales may cause the Fund to repurchase a security at a higher price, thereby causing a loss. As there is no limit on how much the price of the security can increase, the Fund’s exposure is unlimited.
U.S. government obligations risk. The Fund may invest in obligations issued by U.S. government agencies and instrumentalities that may receive varying levels of support from the government, which could affect the Fund’s ability to recover should they default.
About indexes used in this report
The MSCI World IndexSM is an unmanaged index considered representative of stocks of developed countries.
The FTSE EPRA/NAREIT Developed Real Estate Index is an unmanaged index considered representative of global real estate companies and REITs.
The Lipper VUF Real Estate Funds Category Average represents an average of all of the variable insurance underlying funds in the Lipper Real Estate Funds category.
The Fund is not managed to track the performance of any particular index, including the indexes defined here, and consequently, the performance of the Fund may deviate significantly from the performance of the indexes.
A direct investment cannot be made in an index. Unless otherwise indicated, index results include reinvested dividends, and they do not reflect sales charges. Performance of the peer group, if applicable, reflects fund expenses; performance of a market index does not.
Other information
The Chartered Financial Analyst® (CFA®) designation is globally recognized and attests to a charterholder’s success in a rigorous and comprehensive study program in the field of investment management and research analysis.
CPA® and Certified Public Accountant® are trademarks owned by the American Institute of Certified Public Accountants.
The returns shown in management’s discussion of Fund performance are based on net asset values calculated for shareholder transactions. Generally accepted accounting principles require adjustments to be made to the net assets of the Fund at period end for financial reporting purposes, and as such, the net asset values for shareholder transactions and the returns based on those net asset values may differ from the net asset values and returns reported in the Financial Highlights. Additionally, the returns and net asset values shown throughout this report are at the Fund level only and do not include variable product issuer charges. If such charges were included, the total returns would be lower.
Invesco V.I. Global Real Estate Fund
Schedule of Investments
December 31, 2011
| | | | | | | | | |
| | | Shares | | Value |
| |
Common Stocks & Other Equity Interests–98.07%
| | | | |
Australia–8.33%
| | | | |
| CFS Retail Property Trust | | | 1,008,969 | | | $ | 1,738,875 | |
| |
| Dexus Property Group | | | 1,245,450 | | | | 1,057,292 | |
| |
| Goodman Group | | | 2,187,009 | | | | 1,272,886 | |
| |
| GPT Group | | | 478,322 | | | | 1,501,929 | |
| |
| Investa Office Fund | | | 1,680,781 | | | | 1,031,462 | |
| |
| Stockland | | | 736,278 | | | | 2,402,278 | |
| |
| Westfield Group | | | 610,689 | | | | 4,878,225 | |
| |
| Westfield Retail Trust | | | 981,611 | | | | 2,499,939 | |
| |
| | | | | | | | 16,382,886 | |
| |
Austria–0.35%
| | | | |
| Conwert Immobilien Invest S.E. | | | 61,287 | | | | 679,803 | |
| |
Canada–4.25%
| | | | |
| Boardwalk REIT | | | 28,992 | | | | 1,435,372 | |
| |
| Canadian REIT | | | 18,500 | | | | 642,815 | |
| |
| Chartwell Seniors Housing REIT | | | 155,400 | | | | 1,296,525 | |
| |
| H&R REIT | | | 66,500 | | | | 1,518,247 | |
| |
| Primaris Retail REIT | | | 72,600 | | | | 1,468,675 | |
| |
| RioCan REIT | | | 76,600 | | | | 1,987,179 | |
| |
| | | | | | | | 8,348,813 | |
| |
China–0.61%
| | | | |
| Agile Property Holdings Ltd. | | | 312,000 | | | | 279,597 | |
| |
| Country Garden Holdings Co. | | | 938,000 | | | | 351,451 | |
| |
| Shimao Property Holdings Ltd. | | | 348,000 | | | | 297,072 | |
| |
| Soho China Ltd. | | | 415,000 | | | | 276,253 | |
| |
| | | | | | | | 1,204,373 | |
| |
Finland–0.46%
| | | | |
| Sponda Oyj | | | 222,579 | | | | 895,673 | |
| |
France–3.73%
| | | | |
| Fonciere des Regions | | | 7,205 | | | | 461,061 | |
| |
| Gecina S.A. | | | 4,790 | | | | 402,980 | |
| |
| Klepierre | | | 28,122 | | | | 798,980 | |
| |
| Mercialys | | | 20,902 | | | | 673,631 | |
| |
| Societe Immobiliere de Location pour I’Industrie et le Commerce | | | 5,022 | | | | 487,043 | |
| |
| Unibail-Rodamco S.E. | | | 25,158 | | | | 4,502,825 | |
| |
| | | | | | | | 7,326,520 | |
| |
Germany–0.85%
| | | | |
| Deutsche Wohnen AG | | | 60,793 | | | | 807,695 | |
| |
GSW Immobilien AG(a) | | | 30,106 | | | | 871,468 | |
| |
| | | | | | | | 1,679,163 | |
| |
Hong Kong–11.29%
| | | | |
| China Overseas Land & Investment Ltd. | | | 1,278,301 | | | | 2,136,372 | |
| |
| China Resources Land Ltd. | | | 758,000 | | | | 1,221,837 | |
| |
| Hang Lung Properties Ltd. | | | 771,000 | | | | 2,193,894 | |
| |
| Henderson Land Development Co. Ltd. | | | 232,000 | | | | 1,148,663 | |
| |
| Hongkong Land Holdings Ltd. | | | 491,000 | | | | 2,222,727 | |
| |
| Hysan Development Co. Ltd. | | | 207,000 | | | | 678,035 | |
| |
| Kerry Properties Ltd. | | | 267,400 | | | | 884,838 | |
| |
| Link REIT (The) | | | 637,000 | | | | 2,345,711 | |
| |
| Sino Land Co. Ltd. | | | 737,600 | | | | 1,050,377 | |
| |
| Sun Hung Kai Properties Ltd. | | | 518,000 | | | | 6,465,448 | |
| |
| Wharf Holdings Ltd. (The) | | | 410,000 | | | | 1,852,934 | |
| |
| | | | | | | | 22,200,836 | |
| |
Italy–0.09%
| | | | |
| Beni Stabili S.p.A. | | | 390,836 | | | | 174,926 | |
| |
Japan–8.46%
| | | | |
| Advance Residence Investment | | | 175 | | | | 337,763 | |
| |
| AEON Mall Co., Ltd. | | | 15,400 | | | | 326,520 | |
| |
| Japan Prime Realty Investment Corp. | | | 266 | | | | 626,798 | |
| |
| Japan Real Estate Investment Corp. | | | 111 | | | | 865,610 | |
| |
| Japan Retail Fund Investment Corp. | | | 473 | | | | 700,832 | |
| |
| Mitsubishi Estate Co. Ltd. | | | 291,000 | | | | 4,343,395 | |
| |
| Mitsui Fudosan Co., Ltd. | | | 253,000 | | | | 3,683,514 | |
| |
| Nippon Building Fund Inc. | | | 127 | | | | 1,039,901 | |
| |
| Nomura Real Estate Office Fund, Inc. | | | 124 | | | | 637,406 | |
| |
| Sumitomo Realty & Development Co., Ltd. | | | 151,000 | | | | 2,641,328 | |
| |
| Tokyu Land Corp. | | | 132,000 | | | | 499,246 | |
| |
| United Urban Investment Corp. | | | 824 | | | | 934,952 | |
| |
| | | | | | | | 16,637,265 | |
| |
Malta–0.00%
| | | | |
BGP Holdings PLC(a) | | | 3,053,090 | | | | 0 | |
| |
Netherlands–0.70%
| | | | |
| Corio N.V. | | | 31,889 | | | | 1,380,700 | |
| |
Norway–0.14%
| | | | |
| Norwegian Property ASA | | | 219,662 | | | | 270,331 | |
| |
Singapore–3.63%
| | | | |
| Ascendas REIT | | | 537,000 | | | | 757,562 | |
| |
| CapitaCommercial Trust | | | 613,000 | | | | 497,669 | |
| |
| Capitaland Ltd. | | | 915,000 | | | | 1,554,532 | |
| |
| CapitaMall Trust | | | 994,550 | | | | 1,301,213 | |
| |
| CapitaMalls Asia Ltd. | | | 558,000 | | | | 485,023 | |
| |
| City Developments Ltd. | | | 110,000 | | | | 752,998 | |
| |
Global Logistic Properties Ltd.(a) | | | 806,000 | | | | 1,087,973 | |
| |
See accompanying Notes to Financial Statements which are an integral part of the financial statements.
Invesco V.I. Global Real Estate Fund
| | | | | | | | | |
| | | Shares | | Value |
| |
Singapore–(continued)
| | | | |
| | | | | | | | | |
| Keppel Land Ltd. | | | 139,000 | | | $ | 237,136 | |
| |
| Suntec REIT | | | 570,000 | | | | 471,602 | |
| |
| | | | | | | | 7,145,708 | |
| |
Sweden–0.92%
| | | | |
| Castellum AB | | | 81,113 | | | | 1,002,889 | |
| |
| Fabege AB | | | 36,185 | | | | 283,427 | |
| |
| Wihlborgs Fastigheter AB | | | 38,877 | | | | 512,776 | |
| |
| | | | | | | | 1,799,092 | |
| |
Switzerland–1.34%
| | | | |
PSP Swiss Property AG(a) | | | 8,560 | | | | 715,085 | |
| |
Swiss Prime Site AG(a) | | | 25,446 | | | | 1,911,430 | |
| |
| | | | | | | | 2,626,515 | |
| |
United Kingdom–4.92%
| | | | |
| Big Yellow Group PLC | | | 139,866 | | | | 531,728 | |
| |
| British Land Co. PLC | | | 245,144 | | | | 1,753,349 | |
| |
| Derwent London PLC | | | 37,635 | | | | 909,268 | |
| |
| Great Portland Estates PLC | | | 164,039 | | | | 820,518 | |
| |
| Hammerson PLC | | | 215,569 | | | | 1,200,231 | |
| |
| Land Securities Group PLC | | | 219,869 | | | | 2,162,261 | |
| |
| SEGRO PLC | | | 230,844 | | | | 747,667 | |
| |
| Shaftesbury PLC | | | 146,426 | | | | 1,062,684 | |
| |
| Unite Group PLC | | | 185,942 | | | | 483,722 | |
| |
| | | | | | | | 9,671,428 | |
| |
United States–48.00%
| | | | |
| Acadia Realty Trust | | | 45,241 | | | | 911,154 | |
| |
| Alexandria Real Estate Equities, Inc. | | | 36,326 | | | | 2,505,404 | |
| |
| American Campus Communities, Inc. | | | 32,700 | | | | 1,372,092 | |
| |
| AvalonBay Communities, Inc. | | | 28,753 | | | | 3,755,142 | |
| |
| Boston Properties, Inc. | | | 41,979 | | | | 4,181,108 | |
| |
| BRE Properties, Inc. | | | 17,021 | | | | 859,220 | |
| |
| Brookfield Office Properties, Inc. | | | 117,143 | | | | 1,836,252 | |
| |
| Camden Property Trust | | | 25,582 | | | | 1,592,224 | |
| |
| CBL & Associates Properties, Inc. | | | 28,700 | | | | 450,590 | |
| |
| DCT Industrial Trust Inc. | | | 80,500 | | | | 412,160 | |
| |
| DDR Corp. | | | 25,000 | | | | 304,250 | |
| |
| DiamondRock Hospitality Co. | | | 117,829 | | | | 1,135,872 | |
| |
| Digital Realty Trust, Inc. | | | 37,019 | | | | 2,468,057 | |
| |
| Douglas Emmett, Inc. | | | 28,338 | | | | 516,885 | |
| |
| Duke Realty Corp. | | | 142,599 | | | | 1,718,318 | |
| |
| Equity Lifestyle Properties, Inc. | | | 13,200 | | | | 880,308 | |
| |
| Equity Residential | | | 73,875 | | | | 4,213,091 | |
| |
| Essex Property Trust, Inc. | | | 17,688 | | | | 2,485,341 | |
| |
| Extra Space Storage Inc. | | | 29,358 | | | | 711,344 | |
| |
| Federal Realty Investment Trust | | | 19,400 | | | | 1,760,550 | |
| |
| General Growth Properties, Inc. | | | 131,587 | | | | 1,976,437 | |
| |
| HCP, Inc. | | | 109,111 | | | | 4,520,469 | |
| |
| Health Care REIT, Inc. | | | 67,797 | | | | 3,696,970 | |
| |
| Healthcare Realty Trust, Inc. | | | 24,800 | | | | 461,032 | |
| |
| Hersha Hospitality Trust | | | 83,636 | | | | 408,144 | |
| |
| Highwoods Properties, Inc. | | | 38,800 | | | | 1,151,196 | |
| |
| Host Hotels & Resorts Inc. | | | 268,424 | | | | 3,964,622 | |
| |
| Kilroy Realty Corp. | | | 29,617 | | | | 1,127,519 | |
| |
| Kimco Realty Corp. | | | 105,500 | | | | 1,713,320 | |
| |
| Macerich Co. (The) | | | 54,140 | | | | 2,739,484 | |
| |
Mid-America Apartment Communities, Inc. | | | 22,500 | | | | 1,407,375 | |
| |
| National Retail Properties Inc. | | | 54,500 | | | | 1,437,710 | |
| |
| Pebblebrook Hotel Trust | | | 16,739 | | | | 321,054 | |
| |
| Piedmont Office Realty Trust Inc.–Class A | | | 53,500 | | | | 911,640 | |
| |
| Prologis, Inc. | | | 142,520 | | | | 4,074,647 | |
| |
| Public Storage | | | 27,135 | | | | 3,648,572 | |
| |
| Regency Centers Corp. | | | 36,200 | | | | 1,361,844 | |
| |
| Retail Opportunity Investments Corp. | | | 67,879 | | | | 803,687 | |
| |
| Senior Housing Properties Trust | | | 36,100 | | | | 810,084 | |
| |
| Simon Property Group, Inc. | | | 74,884 | | | | 9,655,543 | |
| |
| SL Green Realty Corp. | | | 17,986 | | | | 1,198,587 | |
| |
| Sovran Self Storage, Inc. | | | 19,700 | | | | 840,599 | |
| |
| Starwood Hotels & Resorts Worldwide, Inc. | | | 7,096 | | | | 340,395 | |
| |
Sunstone Hotel Investors, Inc.(a) | | | 54,500 | | | | 444,175 | |
| |
| Tanger Factory Outlet Centers, Inc. | | | 20,000 | | | | 586,400 | |
| |
| Taubman Centers, Inc. | | | 9,100 | | | | 565,110 | |
| |
| UDR, Inc. | | | 66,600 | | | | 1,671,660 | |
| |
| Ventas, Inc. | | | 91,305 | | | | 5,033,645 | |
| |
| Vornado Realty Trust | | | 44,675 | | | | 3,433,721 | |
| |
| | | | | | | | 94,375,003 | |
| |
| Total Common Stocks & Other Equity Interests (Cost $178,461,404) | | | | | | | 192,799,035 | |
| |
Money Market Funds–1.58%
| | | | |
Liquid Assets Portfolio–Institutional Class(b) | | | 1,554,441 | | | | 1,554,441 | |
| |
Premier Portfolio–Institutional Class(b) | | | 1,554,441 | | | | 1,554,441 | |
| |
| Total Money Market Funds (Cost $3,108,882) | | | | | | | 3,108,882 | |
| |
| | | | | | | | | |
| TOTAL INVESTMENTS–99.65% (Cost $181,570,286) | | | | | | | 195,907,917 | |
| |
| OTHER ASSETS LESS LIABILITIES–0.35% | | | | | | | 694,707 | |
| |
| NET ASSETS–100.00% | | | | | | $ | 196,602,624 | |
| |
Investment Abbreviations:
| | | |
| REIT | | – Real Estate Investment Trust |
Notes to Schedule of Investments:
| | |
| (a) | | Non-income producing security. |
| |
| (b) | | The money market fund and the Fund are affiliated by having the same investment adviser. |
See accompanying Notes to Financial Statements which are an integral part of the financial statements.
Invesco V.I. Global Real Estate Fund
Statement of Assets and Liabilities
December 31, 2011
| | | | | |
Assets:
|
| Investments, at value (Cost $178,461,404) | | $ | 192,799,035 | |
| |
| Investments in affiliated money market funds, at value and cost | | | 3,108,882 | |
| |
| Total investments, at value (Cost $181,570,286) | | | 195,907,917 | |
| |
| Foreign currencies, at value (Cost $18,530) | | | 18,566 | |
| |
| Receivable for: | | | | |
| Fund shares sold | | | 240,563 | |
| |
| Dividends | | | 919,028 | |
| |
| Investment for trustee deferred compensation and retirement plans | | | 17,121 | |
| |
| Other assets | | | 2,209 | |
| |
| Total assets | | | 197,105,404 | |
| |
Liabilities:
|
| Payable for: | | | | |
| Fund shares reacquired | | | 268,914 | |
| |
| Accrued fees to affiliates | | | 155,516 | |
| |
| Accrued other operating expenses | | | 45,169 | |
| |
| Trustee deferred compensation and retirement plans | | | 33,181 | |
| |
| Total liabilities | | | 502,780 | |
| |
| Net assets applicable to shares outstanding | | $ | 196,602,624 | |
| |
Net assets consist of:
|
| Shares of beneficial interest | | $ | 228,638,434 | |
| |
| Undistributed net investment income | | | (1,251,973 | ) |
| |
| Undistributed net realized gain (loss) | | | (45,120,991 | ) |
| |
| Unrealized appreciation | | | 14,337,154 | |
| |
| | | $ | 196,602,624 | |
| |
Net Assets:
|
| Series I | | $ | 134,253,896 | |
| |
| Series II | | $ | 62,348,728 | |
| |
Shares outstanding, $0.001 par value per share, with an unlimited number of shares authorized:
|
| Series I | | | 11,059,642 | |
| |
| Series II | | | 5,252,183 | |
| |
| Series I: | | | | |
| Net asset value per share | | $ | 12.14 | |
| |
| Series II: | | | | |
| Net asset value per share | | $ | 11.87 | |
| |
Statement of Operations
For the year ended December 31, 2011
| | | | | |
Investment income:
|
| Dividends (net of foreign withholding taxes of $267,086) | | $ | 5,511,528 | |
| |
| Dividends from affiliated money market funds | | | 2,511 | |
| |
| Total investment income | | | 5,514,039 | |
| |
Expenses:
|
| Advisory fees | | | 1,422,673 | |
| |
| Administrative services fees | | | 510,604 | |
| |
| Custodian fees | | | 115,271 | |
| |
| Distribution fees — Series II | | | 128,535 | |
| |
| Transfer agent fees | | | 25,545 | |
| |
| Trustees’ and officers’ fees and benefits | | | 25,721 | |
| |
| Other | | | 53,406 | |
| |
| Total expenses | | | 2,281,755 | |
| |
| Less: Fees waived | | | (3,545 | ) |
| |
| Net expenses | | | 2,278,210 | |
| |
| Net investment income | | | 3,235,829 | |
| |
Realized and unrealized gain (loss) from:
|
| Net realized gain from: | | | | |
| Investment securities | | | 906,910 | |
| |
| Foreign currencies | | | 63,027 | |
| |
| | | | 969,937 | |
| |
| Change in net unrealized appreciation (depreciation) of: | | | | |
| Investment securities | | | (19,896,472 | ) |
| |
| Foreign currencies | | | 3,944 | |
| |
| | | | (19,892,528 | ) |
| |
| Net realized and unrealized gain (loss) | | | (18,922,591 | ) |
| |
| Net increase (decrease) in net assets resulting from operations | | $ | (15,686,762 | ) |
| |
See accompanying Notes to Financial Statements which are an integral part of the financial statements.
Invesco V.I. Global Real Estate Fund
Statement of Changes in Net Assets
For the years ended December 31, 2011 and 2010
| | | | | | | | | |
| | | 2011 | | 2010 |
| |
Operations:
| | | | |
| Net investment income | | $ | 3,235,829 | | | $ | 4,017,480 | |
| |
| Net realized gain | | | 969,937 | | | | 7,130,044 | |
| |
| Change in net unrealized appreciation (depreciation) | | | (19,892,528 | ) | | | 11,160,840 | |
| |
| Net increase (decrease) in net assets resulting from operations | | | (15,686,762 | ) | | | 22,308,364 | |
| |
Distributions to shareholders from net investment income:
| | | | |
| Series I | | | (5,627,461 | ) | | | (6,161,371 | ) |
| |
| Series II | | | (2,275,433 | ) | | | (1,036,283 | ) |
| |
| Total distributions from net investment income | | | (7,902,894 | ) | | | (7,197,654 | ) |
| |
Share transactions–net:
| | | | |
| Series I | | | 19,582,854 | | | | (9,517,933 | ) |
| |
| Series II | | | 35,133,330 | | | | 19,873,135 | |
| |
| Net increase in net assets resulting from share transactions | | | 54,716,184 | | | | 10,355,202 | |
| |
| Net increase in net assets | | | 31,126,528 | | | | 25,465,912 | |
| |
Net assets:
| | | | |
| Beginning of year | | | 165,476,096 | | | | 140,010,184 | |
| |
| End of year (includes undistributed net investment income of $(1,251,973) and $1,843,563, respectively) | | $ | 196,602,624 | | | $ | 165,476,096 | |
| |
Notes to Financial Statements
December 31, 2011
NOTE 1—Significant Accounting Policies
Invesco V.I. Global Real Estate Fund (the “Fund”) is a series portfolio of AIM Variable Insurance Funds (Invesco Variable Insurance Funds) (the “Trust”). The Trust is a Delaware statutory trust registered under the Investment Company Act of 1940, as amended (the “1940 Act”), as an open-end series management investment company consisting of twenty-eight separate portfolios, (each constituting a “Fund”). The assets, liabilities and operations of each portfolio are accounted for separately. Information presented in these financial statements pertains only to the Fund. Matters affecting each Fund or class will be voted on exclusively by the shareholders of such Fund or class. Current Securities and Exchange Commission (“SEC”) guidance, however, requires participating insurance companies offering separate accounts to vote shares proportionally in accordance with the instructions of the contract owners whose investments are funded by shares of each Fund or class.
The Fund’s investment objective is total return through growth of capital and current income.
The Fund currently offers two classes of shares, Series I and Series II, both of which are offered to insurance company separate accounts funding variable annuity contracts and variable life insurance policies (“variable products”).
The following is a summary of the significant accounting policies followed by the Fund in the preparation of its financial statements.
| | |
| A. | | Security Valuations — Securities, including restricted securities, are valued according to the following policy. |
| | A security listed or traded on an exchange (except convertible bonds) is valued at its last sales price or official closing price as of the close of the customary trading session on the exchange where the security is principally traded, or lacking any sales or official closing price on a particular day, the security may be valued at the closing bid price on that day. Securities traded in the over-the-counter market are valued based on prices furnished by independent pricing services or market makers. When such securities are valued by an independent pricing service they may be considered fair valued. Futures contracts are valued at the final settlement price set by an exchange on which they are principally traded. Listed options are valued at the mean between the last bid and ask prices from the exchange on which they are principally traded. Options not listed on an exchange are valued by an independent source at the mean between the last bid and ask prices. For purposes of determining net asset value per share, futures and option contracts generally are valued 15 minutes after the close of the customary trading session of the New York Stock Exchange (“NYSE”). |
| | Investments in open-end and closed-end registered investment companies that do not trade on an exchange are valued at the end of day net asset value per share. Investments in open-end and closed-end registered investment companies that trade on an exchange are valued at the last sales price or official closing price as of the close of the customary trading session on the exchange where the security is principally traded. |
| | Debt obligations (including convertible bonds) and unlisted equities are fair valued using an evaluated quote provided by an independent pricing service. Evaluated quotes provided by the pricing service may be determined without exclusive reliance on quoted prices, and may reflect appropriate factors such as |
Invesco V.I. Global Real Estate Fund
| | |
| | institution-size trading in similar groups of securities, developments related to specific securities, dividend rate, yield, quality, type of issue, coupon rate, maturity, individual trading characteristics and other market data. Debt securities are subject to interest rate and credit risks. In addition, all debt securities involve some risk of default with respect to interest and/or principal payments. |
| | Foreign securities (including foreign exchange contracts) are converted into U.S. dollar amounts using the applicable exchange rates as of the close of the NYSE. If market quotations are available and reliable for foreign exchange traded equity securities, the securities will be valued at the market quotations. Because trading hours for certain foreign securities end before the close of the NYSE, closing market quotations may become unreliable. If between the time trading ends on a particular security and the close of the customary trading session on the NYSE, events occur that are significant and make the closing price unreliable, the Fund may fair value the security. If the event is likely to have affected the closing price of the security, the security will be valued at fair value in good faith using procedures approved by the Board of Trustees. Adjustments to closing prices to reflect fair value may also be based on a screening process of an independent pricing service to indicate the degree of certainty, based on historical data, that the closing price in the principal market where a foreign security trade is not the current value as of the close of the NYSE. Foreign securities meeting the approved degree of certainty that the price is not reflective of current value will be priced at the indication of fair value from the independent pricing service. Multiple factors may be considered by the independent pricing service in determining adjustments to reflect fair value and may include information relating to sector indices, American Depositary Receipts and domestic and foreign index futures. Foreign securities may have additional risks including exchange rate changes, potential for sharply devalued currencies and high inflation, political and economic upheaval, the relative lack of issuer information, relatively low market liquidity and the potential lack of strict financial and accounting controls and standards. |
| | Securities for which market prices are not provided by any of the above methods may be valued based upon quotes furnished by independent sources. The last bid price may be used to value equity securities. The mean between the last bid and asked prices is used to value debt obligations, including Corporate Loans. |
| | Securities for which market quotations are not readily available or are unreliable are valued at fair value as determined in good faith by or under the supervision of the Trust’s officers following procedures approved by the Board of Trustees. Issuer specific events, market trends, bid/ask quotes of brokers and information providers and other market data may be reviewed in the course of making a good faith determination of a security’s fair value. |
| | Valuations change in response to many factors including the historical and prospective earnings of the issuer, the value of the issuer’s assets, general economic conditions, interest rates, investor perceptions and market liquidity. Because of the inherent uncertainties of valuation, the values reflected in the financial statements may materially differ from the value received upon actual sale of those investments. |
| B. | | Securities Transactions and Investment Income — Securities transactions are accounted for on a trade date basis. Realized gains or losses on sales are computed on the basis of specific identification of the securities sold. Interest income is recorded on the accrual basis from settlement date. Dividend income (net of withholding tax, if any) is recorded on the ex-dividend date. |
| | The Fund may periodically participate in litigation related to Fund investments. As such, the Fund may receive proceeds from litigation settlements. Any proceeds received are included in the Statement of Operations as realized gain (loss) for investments no longer held and as unrealized gain (loss) for investments still held. |
| | Brokerage commissions and mark ups are considered transaction costs and are recorded as an increase to the cost basis of securities purchased and/or a reduction of proceeds on a sale of securities. Such transaction costs are included in the determination of net realized and unrealized gain (loss) from investment securities reported in the Statement of Operations and the Statement of Changes in Net Assets and the net realized and unrealized gains (losses) on securities per share in the Financial Highlights. Transaction costs are included in the calculation of the Fund’s net asset value and, accordingly, they reduce the Fund’s total returns. These transaction costs are not considered operating expenses and are not reflected in net investment income reported in the Statement of Operations and Statement of Changes in Net Assets, or the net investment income per share and ratios of expenses and net investment income reported in the Financial Highlights, nor are they limited by any expense limitation arrangements between the Fund and the investment adviser. |
| | The Fund allocates income and realized and unrealized capital gains and losses to a class based on the relative net assets of each class. |
| | The Fund recharacterizes distributions received from REIT investments based on information provided by the REIT into the following categories: ordinary income, long-term and short-term capital gains, and return of capital. If information is not available on a timely basis from the REIT, the recharacterization will be based on available information which may include the previous year’s allocation. If new or additional information becomes available from the REIT at a later date, a recharacterization will be made in the following year. The Fund records as dividend income the amount recharacterized as ordinary income and as realized gain the amount recharacterized as capital gain in the Statement of Operations, and the amount recharacterized as return of capital as a reduction to the cost of investments in the Statement of Assets and Liabilities. These recharacterizations are reflected in the accompanying financial statements. |
| C. | | Country Determination — For the purposes of making investment selection decisions and presentation in the Schedule of Investments, the investment adviser may determine the country in which an issuer is located and/or credit risk exposure based on various factors. These factors include the laws of the country under which the issuer is organized, where the issuer maintains a principal office, the country in which the issuer derives 50% or more of its total revenues and the country that has the primary market for the issuer’s securities, as well as other criteria. Among the other criteria that may be evaluated for making this determination are the country in which the issuer maintains 50% or more of its assets, the type of security, financial guarantees and enhancements, the nature of the collateral and the sponsor organization. Country of issuer and/or credit risk exposure has been determined to be the United States of America, unless otherwise noted. |
| D. | | Distributions — Distributions from income and net realized capital gain, if any, are generally paid to separate accounts of participating insurance companies annually and recorded on ex-dividend date. |
| E. | | Federal Income Taxes — The Fund intends to comply with the requirements of Subchapter M of the Internal Revenue Code necessary to qualify as a regulated investment company and to distribute substantially all of the Fund’s taxable earnings to shareholders. As such, the Fund will not be subject to federal income taxes on otherwise taxable income (including net realized capital gain) that is distributed to shareholders. Therefore, no provision for federal income taxes is recorded in the financial statements. |
Invesco V.I. Global Real Estate Fund
| | |
| | The Fund files tax returns in the U.S. Federal jurisdiction and certain other jurisdictions. Generally, the Fund is subject to examinations by such taxing authorities for up to three years after the filing of the return for the tax period. |
| F. | | Expenses — Fees provided for under the Rule 12b-1 plan of a particular class of the Fund and which are directly attributable to that class are charged to the operations of such class. All other expenses are allocated among the classes based on relative net assets. |
| G. | | Accounting Estimates — The preparation of financial statements in conformity with accounting principles generally accepted in the United States of America (“GAAP”) requires management to make estimates and assumptions that affect the reported amounts of assets and liabilities at the date of the financial statements and the reported amounts of revenues and expenses during the reporting period including estimates and assumptions related to taxation. Actual results could differ from those estimates by a significant amount. In addition, the Fund monitors for material events or transactions that may occur or become known after the period-end date and before the date the financial statements are released to print. |
| H. | | Indemnifications — Under the Trust’s organizational documents, each Trustee, officer, employee or other agent of the Trust is indemnified against certain liabilities that may arise out of performance of their duties to the Fund. Additionally, in the normal course of business, the Fund enters into contracts, including the Fund’s servicing agreements that contain a variety of indemnification clauses. The Fund’s maximum exposure under these arrangements is unknown as this would involve future claims that may be made against the Fund that have not yet occurred. The risk of material loss as a result of such indemnification claims is considered remote. |
| I. | | Other Risks — The Fund’s investments are concentrated in a comparatively narrow segment of the economy. Consequently, the Fund may tend to be more volatile than other mutual funds, and the value of the Fund’s investments may tend to rise and fall more rapidly. |
| | Because, the Fund concentrates its assets in the real estate industry, an investment in the Fund will be closely linked to the performance of the real estate markets. Property values may fall due to increasing vacancies or declining rents resulting from economic, legal, cultural or technological developments. |
| J. | | Foreign Currency Translations — Foreign currency is valued at the close of the NYSE based on quotations posted by banks and major currency dealers. Portfolio securities and other assets and liabilities denominated in foreign currencies are translated into U.S. dollar amounts at date of valuation. Purchases and sales of portfolio securities (net of foreign taxes withheld on disposition) and income items denominated in foreign currencies are translated into U.S. dollar amounts on the respective dates of such transactions. The Fund does not separately account for the portion of the results of operations resulting from changes in foreign exchange rates on investments and the fluctuations arising from changes in market prices of securities held. The combined results of changes in foreign exchange rates and the fluctuation of market prices on investments (net of estimated foreign tax withholding) are included with the net realized and unrealized gain or loss from investments in the Statement of Operations. Reported net realized foreign currency gains or losses arise from (1) sales of foreign currencies, (2) currency gains or losses realized between the trade and settlement dates on securities transactions, and (3) the difference between the amounts of dividends, interest, and foreign withholding taxes recorded on the Fund’s books and the U.S. dollar equivalent of the amounts actually received or paid. Net unrealized foreign currency gains and losses arise from changes in the fair values of assets and liabilities, other than investments in securities at fiscal period end, resulting from changes in exchange rates. |
| | The Fund may invest in foreign securities which may be subject to foreign taxes on income, gains on investments or currency repatriation, a portion of which may be recoverable. |
| K. | | Foreign Currency Contracts — The Fund may enter into foreign currency contracts to manage or minimize currency or exchange rate risk. The Fund may also enter into foreign currency contracts for the purchase or sale of a security denominated in a foreign currency in order to “lock in” the U.S. dollar price of that security. A foreign currency contract is an obligation to purchase or sell a specific currency for an agreed-upon price at a future date. The use of foreign currency contracts does not eliminate fluctuations in the price of the underlying securities the Fund owns or intends to acquire but establishes a rate of exchange in advance. Fluctuations in the value of these contracts are measured by the difference in the contract date and reporting date exchange rates and are recorded as unrealized appreciation (depreciation) until the contracts are closed. When the contracts are closed, realized gains (losses) are recorded. Realized and unrealized gains (losses) on the contracts are included in the Statement of Operations. The primary risks associated with foreign currency contracts include failure of the counterparty to meet the terms of the contract and the value of the foreign currency changing unfavorably. These risks may be in excess of the amounts reflected in the Statement of Assets and Liabilities. |
NOTE 2—Advisory Fees and Other Fees Paid to Affiliates
The Trust has entered into a master investment advisory agreement with Invesco Advisers, Inc. (the “Adviser” or “Invesco”). Under the terms of the investment advisory agreement, the Fund pays an advisory fee to the Adviser based on the annual rate of the Fund’s average daily net assets as follows:
| | | | | |
| Average Daily Net Assets | | Rate |
| |
| First $250 million | | | 0 | .75% |
| |
| Next $250 million | | | 0 | .74% |
| |
| Next $500 million | | | 0 | .73% |
| |
| Next $1.5 billion | | | 0 | .72% |
| |
| Next $2.5 billion | | | 0 | .71% |
| |
| Next $2.5 billion | | | 0 | .70% |
| |
| Next $2.5 billion | | | 0 | .69% |
| |
| Over $10 billion | | | 0 | .68% |
| |
Under the terms of a master sub-advisory agreement between the Adviser and each of Invesco Asset Management Deutschland GmbH, Invesco Asset Management Limited, Invesco Asset Management (Japan) Limited, Invesco Australia Limited, Invesco Hong Kong Limited, Invesco Senior Secured Management,
Invesco V.I. Global Real Estate Fund
Inc. and Invesco Canada Ltd. (collectively, the “Affiliated Sub-Advisers”) the Adviser, not the Fund, may pay 40% of the fees paid to the Adviser to any such Affiliated Sub-Adviser(s) that provide discretionary investment management services to the Fund based on the percentage of assets allocated to such Sub-Adviser(s).
The Adviser has contractually agreed, through at least April 30, 2013, to waive advisory fees and/or reimburse expenses of all shares to the extent necessary to limit total annual fund operating expenses after fee waiver and/or expense reimbursement (excluding certain items discussed below) of Series I shares to 1.30% and Series II shares to 1.45% of average daily net assets. In determining the Adviser’s obligation to waive advisory fees and/or reimburse expenses, the following expenses are not taken into account, and could cause the total annual fund operating expenses after fee waiver and/or expense reimbursement to exceed the numbers reflected above: (1) interest; (2) taxes; (3) dividend expense on short sales; (4) extraordinary or non-routine items, including litigation expenses; and (5) expenses that the Fund has incurred but did not actually pay because of an expense offset arrangement. Unless the Board of the Trustees and Invesco mutually agree to amend or continue the fee waiver agreement, it will terminate on April 30, 2013. The Adviser did not waive fees and/or reimburse expenses during the period under this expense limitation.
Further, the Adviser has contractually agreed, through at least June 30, 2012, to waive the advisory fee payable by the Fund in an amount equal to 100% of the net advisory fees the Adviser receives from the affiliated money market funds on investments by the Fund of uninvested cash in such affiliated money market funds.
For the year ended December 31, 2011, the Adviser waived advisory fees of $3,545.
The Trust has entered into a master administrative services agreement with Invesco pursuant to which the Fund has agreed to pay Invesco a fee for costs incurred in providing accounting services and fund administrative services to the Fund and to reimburse Invesco for administrative services fees paid to insurance companies that have agreed to provide services to the participants of separate accounts. These administrative services provided by the insurance companies may include, among other things: the printing of prospectuses, financial reports and proxy statements and the delivery of the same to existing participants; the maintenance of master accounts; the facilitation of purchases and redemptions requested by the participants; and the servicing of participants’ accounts. Pursuant to such agreement, for the year ended December 31, 2011, Invesco was paid $50,000 for accounting and fund administrative services and reimbursed $460,604 for services provided by insurance companies.
The Trust has entered into a transfer agency and service agreement with Invesco Investment Services, Inc. (“IIS”) pursuant to which the Fund has agreed to pay IIS a fee for providing transfer agency and shareholder services to the Fund and reimburse IIS for certain expenses incurred by IIS in the course of providing such services. For the year ended December 31, 2011, expenses incurred under the agreement are shown in the Statement of Operations as transfer agent fees.
The Trust has entered into a master distribution agreement with Invesco Distributors, Inc. (“IDI”) to serve as the distributor for the Fund. The Trust has adopted a plan pursuant to Rule 12b-1 under the 1940 Act with respect to the Fund’s Series II shares (the “Plan”). The Fund, pursuant to the Plan, pays IDI compensation at the annual rate of 0.25% of the Fund’s average daily net assets of Series II shares. Of the Plan payments, up to 0.25% of the average daily net assets of the Series II shares may be paid to insurance companies who furnish continuing personal shareholder services to customers who purchase and own Series II shares of the Fund. For the year ended December 31, 2011, expenses incurred under the Plan are detailed in the Statement of Operations as distribution fees.
Certain officers and trustees of the Trust are officers and directors of the Adviser, IIS and/or IDI.
NOTE 3—Additional Valuation Information
GAAP defines fair value as the price that would be received to sell an asset or paid to transfer a liability in an orderly transaction between market participants at the measurement date, under current market conditions. GAAP establishes a hierarchy that prioritizes the inputs to valuation methods giving the highest priority to readily available unadjusted quoted prices in an active market for identical assets (Level 1) and the lowest priority to significant unobservable inputs (Level 3) generally when market prices are not readily available or are unreliable. Based on the valuation inputs, the securities or other investments are tiered into one of three levels. Changes in valuation methods may result in transfers in or out of an investment’s assigned level:
| | |
| | Level 1 — | Prices are determined using quoted prices in an active market for identical assets. |
| | Level 2 — | Prices are determined using other significant observable inputs. Observable inputs are inputs that other market participants may use in pricing a security. These may include quoted prices for similar securities, interest rates, prepayment speeds, credit risk, yield curves, loss severities, default rates, discount rates, volatilities and others. |
| | Level 3 — | Prices are determined using significant unobservable inputs. In situations where quoted prices or observable inputs are unavailable (for example, when there is little or no market activity for an investment at the end of the period), unobservable inputs may be used. Unobservable inputs reflect the Fund’s own assumptions about the factors market participants would use in determining fair value of the securities or instruments and would be based on the best available information. |
The following is a summary of the tiered valuation input levels, as of December 31, 2011. The level assigned to the securities valuations may not be an indication of the risk or liquidity associated with investing in those securities. Because of the inherent uncertainties of valuation, the values reflected in the financial statements may materially differ from the value received upon actual sale of those investments.
Invesco V.I. Global Real Estate Fund
During the year ended December 31, 2011, there were no significant transfers between investment levels.
| | | | | | | | | | | | | | | | | |
| | | Level 1 | | Level 2 | | Level 3 | | Total |
| |
| Australia | | $ | 15,110,000 | | | $ | 1,272,886 | | | $ | — | | | $ | 16,382,886 | |
| |
| Austria | | | — | | | | 679,803 | | | | — | | | | 679,803 | |
| |
| Canada | | | 8,348,813 | | | | — | | | | — | | | | 8,348,813 | |
| |
| China | | | 1,204,373 | | | | — | | | | — | | | | 1,204,373 | |
| |
| Finland | | | — | | | | 895,673 | | | | — | | | | 895,673 | |
| |
| France | | | 1,563,654 | | | | 5,762,866 | | | | — | | | | 7,326,520 | |
| |
| Germany | | | 807,695 | | | | 871,468 | | | | — | | | | 1,679,163 | |
| |
| Hong Kong | | | 10,464,126 | | | | 11,736,710 | | | | — | | | | 22,200,836 | |
| |
| Italy | | | 174,926 | | | | — | | | | — | | | | 174,926 | |
| |
| Japan | | | 5,642,508 | | | | 10,994,757 | | | | — | | | | 16,637,265 | |
| |
| Malta | | | — | | | | — | | | | 0 | | | | 0 | |
| |
| Netherlands | | | — | | | | 1,380,700 | | | | — | | | | 1,380,700 | |
| |
| Norway | | | 270,331 | | | | — | | | | — | | | | 270,331 | |
| |
| Singapore | | | 757,562 | | | | 6,388,146 | | | | — | | | | 7,145,708 | |
| |
| Sweden | | | 283,427 | | | | 1,515,665 | | | | — | | | | 1,799,092 | |
| |
| Switzerland | | | 1,911,430 | | | | 715,085 | | | | — | | | | 2,626,515 | |
| |
| United Kingdom | | | 1,810,351 | | | | 7,861,077 | | | | — | | | | 9,671,428 | |
| |
| United States | | | 97,483,885 | | | | — | | | | — | | | | 97,483,885 | |
| |
| Total Investments | | $ | 145,833,081 | | | $ | 50,074,836 | | | $ | 0 | | | $ | 195,907,917 | |
| |
NOTE 4—Trustees’ and Officers’ Fees and Benefits
“Trustees’ and Officers’ Fees and Benefits” include amounts accrued by the Fund to pay remuneration to certain Trustees and Officers of the Fund. Trustees have the option to defer compensation payable by the Fund, and “Trustees’ and Officers’ Fees and Benefits” also include amounts accrued by the Fund to fund such deferred compensation amounts. Those Trustees who defer compensation have the option to select various Invesco Funds in which their deferral accounts shall be deemed to be invested. Finally, certain current Trustees are eligible to participate in a retirement plan that provides for benefits to be paid upon retirement to Trustees over a period of time based on the number of years of service. The Fund may have certain former Trustees who also participate in a retirement plan and receive benefits under such plan. “Trustees’ and Officers’ Fees and Benefits” include amounts accrued by the Fund to fund such retirement benefits. Obligations under the deferred compensation and retirement plans represent unsecured claims against the general assets of the Fund.
During the year ended December 31, 2011, the Fund paid legal fees of $1,331 for services rendered by Kramer, Levin, Naftalis & Frankel LLP as counsel to the Independent Trustees. A partner of that firm is a Trustee of the Trust.
NOTE 5—Cash Balances
The Fund is permitted to temporarily carry a negative or overdrawn balance in its account with State Street Bank and Trust Company, the custodian bank. To compensate the custodian bank for such overdrafts, the overdrawn Fund may either (1) leave funds as a compensating balance in the account so the custodian bank can be compensated by earning the additional interest; or (2) compensate by paying the custodian bank at a rate agreed upon by the custodian bank and Invesco, not to exceed the contractually agreed upon rate.
NOTE 6—Distributions to Shareholders and Tax Components of Net Assets
Tax Character of Distributions to Shareholders Paid During the Years Ended December 31, 2011 and 2010:
| | | | | | | | | |
| | | 2011 | | 2010 |
| |
| Ordinary income | | $ | 7,902,894 | | | $ | 7,197,654 | |
| |
Invesco V.I. Global Real Estate Fund
Tax Components of Net Assets at Period-End:
| | | | | |
| | | 2011 |
| |
| Undistributed ordinary income | | $ | 1,350,512 | |
| |
| Net unrealized appreciation — investments | | | 4,654,440 | |
| |
| Net unrealized appreciation (depreciation) — other investments | | | (477 | ) |
| |
| Temporary book/tax differences | | | (32,564 | ) |
| |
| Capital loss carryforward | | | (38,007,721 | ) |
| |
| Shares of beneficial interest | | | 228,638,434 | |
| |
| Total net assets | | $ | 196,602,624 | |
| |
The difference between book-basis and tax-basis unrealized appreciation (depreciation) is due to differences in the timing of recognition of gains and losses on investments for tax and book purposes. The Fund’s net unrealized appreciation difference is attributable primarily to wash sales.
The temporary book/tax differences are a result of timing differences between book and tax recognition of income and/or expenses. The Fund’s temporary book/tax differences are the result of the trustee deferral of compensation and retirement plan benefits.
Capital loss carryforward is calculated and reported as of a specific date. Results of transactions and other activity after that date may affect the amount of capital loss carryforward actually available for the Fund to utilize. The Regulated Investment Company Modernization Act of 2010 (the “Act”) eliminated the eight-year carryover period for capital losses that arise in taxable years beginning after its enactment date of December 22, 2010. Consequently, these capital losses can be carried forward for an unlimited period. However, capital losses with an expiration period may not be used to offset capital gains until all net capital losses without an expiration date have been utilized. Additionally, post-enactment capital loss carryovers will retain their character as either short-term or long-term capital losses instead of as short-term capital losses as under prior law. The ability to utilize capital loss carryforward in the future may be limited under the Internal Revenue Code and related regulations based on the results of future transactions. Under these limitation rules, the Fund is limited to utilizing $14,511,289 of capital loss carryforward in the fiscal year ending December 31, 2012.
The Fund has a capital loss carryforward as of December 31, 2011, which expires as follows:
| | | | | |
| Capital Loss Carryforward* |
| Expiration | | Short-Term |
| |
| December 31, 2016 | | $ | 14,993,927 | |
| |
| December 31, 2017 | | | 22,621,345 | |
| |
| Not Subject to expiration | | | 392,449 | |
| |
| | | $ | 38,007,721 | |
| |
| |
| * | Capital loss carryforward as of the date listed above is reduced for limitations, if any, to the extent required by the Internal Revenue Code. |
NOTE 7—Investment Securities
The aggregate amount of investment securities (other than short-term securities, U.S. Treasury obligations and money market funds, if any) purchased and sold by the Fund during the year ended December 31, 2011 was $138,004,443 and $88,423,407, respectively. Cost of investments on a tax basis includes the adjustments for financial reporting purposes as of the most recently completed Federal income tax reporting period-end.
| | | | | |
| Unrealized Appreciation (Depreciation) of Investment Securities on a Tax Basis |
| Aggregate unrealized appreciation of investment securities | | $ | 13,921,939 | |
| |
| Aggregate unrealized (depreciation) of investment securities | | | (9,267,499 | ) |
| |
| Net unrealized appreciation of investment securities | | $ | 4,654,440 | |
| |
| Cost of investments for tax purposes is $191,253,477. | | | | |
NOTE 8—Reclassification of Permanent Differences
Primarily as a result of differing book/tax treatment of passive foreign investment companies, on December 31, 2011, undistributed net investment income was increased by $1,571,529, undistributed net realized gain (loss) was decreased by $1,543,909 and shares of beneficial interest decreased by $27,620. This reclassification had no effect on the net assets of the Fund.
Invesco V.I. Global Real Estate Fund
NOTE 9—Share Information
| | | | | | | | | | | | | | | | | |
| | | Summary of Share Activity |
| |
| | | Year ended December 31, |
| | | 2011(a) | | 2010 |
| | | Shares | | Amount | | Shares | | Amount |
| |
| Sold: | | | | | | | | | | | | | | | | |
| Series I | | | 4,052,616 | | | $ | 55,794,931 | | | | 3,250,045 | | | $ | 40,832,439 | |
| |
| Series II | | | 3,043,981 | | | | 39,999,065 | | | | 1,654,806 | | | | 20,893,454 | |
| |
| Issued as reinvestment of dividends: | | | | | | | | | | | | | | | | |
| Series I | | | 496,249 | | | | 5,627,461 | | | | 477,626 | | | | 6,161,371 | |
| |
| Series II | | | 204,994 | | | | 2,275,433 | | | | 81,855 | | | | 1,036,283 | |
| |
| Reacquired: | | | | | | | | | | | | | | | | |
| Series I | | | (3,169,118 | ) | | | (41,839,538 | ) | | | (4,611,903 | ) | | | (56,511,743 | ) |
| |
| Series II | | | (551,566 | ) | | | (7,141,168 | ) | | | (169,623 | ) | | | (2,056,602 | ) |
| |
| Net increase in share activity | | | 4,077,156 | | | $ | 54,716,184 | | | | 682,806 | | | $ | 10,355,202 | |
| |
| | |
| (a) | | There are entities that are record owners of more than 5% of the outstanding shares of the Fund and in the aggregate own 59% of the outstanding shares of the Fund. The Fund and the Fund’s principal underwriter or adviser, are parties to participation agreements with these entities whereby these entities sell units of interest in separate accounts funding variable products that are invested in the Fund. The Fund, Invesco and/or Invesco affiliates may make payments to these entities, which are considered to be related to the Fund, for providing services to the Fund, Invesco and/or Invesco affiliates including but not limited to services such as, securities brokerage, third party record keeping and account servicing and administrative services. The Fund has no knowledge as to whether all or any portion of the shares owned of record by these entities are also owned beneficially. |
NOTE 10—Financial Highlights
The following schedule presents financial highlights for a share of the Fund outstanding throughout the periods indicated.
| | | | | | | | | | | | | | | | | | | | | | | | | | | | | | | | | | | | | | | | | | | | | | | | | | | | | | | | | |
| | | | | | | | | | | | | | | | | | | | | | | Ratio of
| | Ratio of
| | | | |
| | | | | | | Net gains
| | | | | | | | | | | | | | | | expenses
| | expenses
| | | | |
| | | | | | | (losses) on
| | | | | | | | | | | | | | | | to average
| | to average net
| | Ratio of net
| | |
| | | Net asset
| | | | securities
| | | | Dividends
| | Distributions
| | | | | | | | | | net assets
| | assets without
| | investment
| | |
| | | value,
| | Net
| | (both
| | Total from
| | from net
| | from net
| | | | Net asset
| | | | Net assets,
| | with fee waivers
| | fee waivers
| | income
| | |
| | | beginning
| | investment
| | realized
| | investment
| | investment
| | realized
| | Total
| | value, end
| | Total
| | end of period
| | and/or expenses
| | and/or expenses
| | to average
| | Portfolio
|
| | | of period | | income(a) | | and unrealized) | | operations | | income | | gains | | distributions | | of period | | return(b) | | (000s omitted) | | absorbed | | absorbed | | net assets | | turnover(c) |
| |
| Series I |
| Year ended 12/31/11 | | $ | 13.58 | | | $ | 0.24 | | | $ | (1.16 | ) | | $ | (0.92 | ) | | $ | (0.52 | ) | | $ | — | | | $ | (0.52 | ) | | $ | 12.14 | | | | (6.51 | )% | | $ | 134,254 | | | | 1.14 | %(d) | | | 1.14 | %(d) | | | 1.77 | %(d) | | | 47 | % |
| Year ended 12/31/10 | | | 12.14 | | | | 0.35 | | | | 1.74 | | | | 2.09 | | | | (0.65 | ) | | | — | | | | (0.65 | ) | | | 13.58 | | | | 17.51 | | | | 131,462 | | | | 1.20 | | | | 1.20 | | | | 2.82 | | | | 87 | |
| Year ended 12/31/09 | | | 9.23 | | | | 0.26 | | | | 2.65 | | | | 2.91 | | | | — | | | | — | | | | — | | | | 12.14 | | | | 31.53 | | | | 128,224 | | | | 1.26 | | | | 1.26 | | | | 2.59 | | | | 72 | |
| Year ended 12/31/08 | | | 21.88 | | | | 0.44 | | | | (10.35 | ) | | | (9.91 | ) | | | (1.08 | ) | | | (1.66 | ) | | | (2.74 | ) | | | 9.23 | | | | (44.65 | ) | | | 82,582 | | | | 1.17 | | | | 1.17 | | | | 2.51 | | | | 62 | |
| Year ended 12/31/07 | | | 28.74 | | | | 0.38 | | | | (1.52 | ) | | | (1.14 | ) | | | (1.69 | ) | | | (4.03 | ) | | | (5.72 | ) | | | 21.88 | | | | (5.54 | ) | | | 143,773 | | | | 1.13 | | | | 1.22 | | | | 1.31 | | | | 57 | |
| |
| Series II |
| Year ended 12/31/11 | | | 13.31 | | | | 0.20 | | | | (1.13 | ) | | | (0.93 | ) | | | (0.51 | ) | | | — | | | | (0.51 | ) | | | 11.87 | | | | (6.73 | ) | | | 62,349 | | | | 1.39 | (d) | | | 1.39 | (d) | | | 1.52 | (d) | | | 47 | |
| Year ended 12/31/10 | | | 11.93 | | | | 0.32 | | | | 1.70 | | | | 2.02 | | | | (0.64 | ) | | | — | | | | (0.64 | ) | | | 13.31 | | | | 17.24 | | | | 34,014 | | | | 1.45 | | | | 1.45 | | | | 2.57 | | | | 87 | |
| Year ended 12/31/09 | | | 9.10 | | | | 0.24 | | | | 2.59 | | | | 2.83 | | | | — | | | | — | | | | — | | | | 11.93 | | | | 31.10 | | | | 11,786 | | | | 1.45 | | | | 1.51 | | | | 2.40 | | | | 72 | |
| Year ended 12/31/08 | | | 21.66 | | | | 0.36 | | | | (10.19 | ) | | | (9.83 | ) | | | (1.07 | ) | | | (1.66 | ) | | | (2.73 | ) | | | 9.10 | | | | (44.72 | ) | | | 4,203 | | | | 1.42 | | | | 1.42 | | | | 2.26 | | | | 62 | |
| Year ended 12/31/07 | | | 28.57 | | | | 0.29 | | | | (1.49 | ) | | | (1.20 | ) | | | (1.68 | ) | | | (4.03 | ) | | | (5.71 | ) | | | 21.66 | | | | (5.76 | ) | | | 2,646 | | | | 1.38 | | | | 1.47 | | | | 1.06 | | | | 57 | |
| |
| | |
| (a) | | Calculated using average shares outstanding. |
| (b) | | Includes adjustments in accordance with accounting principles generally accepted in the United States of America and as such, the net asset value for financial reporting purposes and the returns based upon those net asset values may differ from the net asset value and returns for shareholder transactions. Total returns do not reflect charges assessed in connection with a variable product, which if included would reduce total returns. |
| (c) | | Portfolio turnover is calculated at the fund level and is not annualized for periods less than one year, if applicable. |
| (d) | | Ratios are based on average daily net assets (000’s) of $138,276 and $51,414 for Series I and Series II shares, respectively. |
Invesco V.I. Global Real Estate Fund
Report of Independent Registered Public Accounting Firm
To the Board of Trustees of AIM Variable Insurance Funds (Invesco Variable Insurance Funds)
and Shareholders of Invesco V.I. Global Real Estate Fund:
In our opinion, the accompanying statement of assets and liabilities, including the schedule of investments, and the related statements of operations and of changes in net assets and the financial highlights present fairly, in all material respects, the financial position of Invesco V.I. Global Real Estate Fund (one of the funds constituting AIM Variable Insurance Funds (Invesco Variable Insurance Funds), hereafter referred to as the “Fund”) at December 31, 2011, the results of its operations for the year then ended, the changes in its net assets for each of the two years in the period then ended and the financial highlights for each of the five years in the period then ended, in conformity with accounting principles generally accepted in the United States of America. These financial statements and financial highlights (hereafter referred to as “financial statements”) are the responsibility of the Fund’s management; our responsibility is to express an opinion on these financial statements based on our audits. We conducted our audits of these financial statements in accordance with the standards of the Public Company Accounting Oversight Board (United States). Those standards require that we plan and perform the audits to obtain reasonable assurance about whether the financial statements are free of material misstatement. An audit includes examining, on a test basis, evidence supporting the amounts and disclosures in the financial statements, assessing the accounting principles used and significant estimates made by management, and evaluating the overall financial statement presentation. We believe that our audits, which included confirmation of securities at December 31, 2011 by correspondence with the custodian, provide a reasonable basis for our opinion.
PRICEWATERHOUSECOOPERS LLP
February 14, 2012
Houston, Texas
Invesco V.I. Global Real Estate Fund
Calculating your ongoing Fund expenses
Example
As a shareholder of the Fund, you incur ongoing costs, including management fees; distribution and/or service fees (12b-1); and other Fund expenses. This example is intended to help you understand your ongoing costs (in dollars) of investing in the Fund and to compare these costs with ongoing costs of investing in other mutual funds. The example is based on an investment of $1,000 invested at the beginning of the period and held for the entire period July 1, 2011 through December 31, 2011.
The actual and hypothetical expenses in the examples below do not represent the effect of any fees or other expenses assessed in connection with a variable product; if they did, the expenses shown would be higher while the ending account values shown would be lower.
Actual expenses
The table below provides information about actual account values and actual expenses. You may use the information in this table, together with the amount you invested, to estimate the expenses that you paid over the period. Simply divide your account value by $1,000 (for example, an $8,600 account value divided by $1,000 = 8.6), then multiply the result by the number in the table under the heading entitled “Actual Expenses Paid During Period” to estimate the expenses you paid on your account during this period.
Hypothetical example for comparison purposes
The table below also provides information about hypothetical account values and hypothetical expenses based on the Fund’s actual expense ratio and an assumed rate of return of 5% per year before expenses, which is not the Fund’s actual return.
The hypothetical account values and expenses may not be used to estimate the actual ending account balance or expenses you paid for the period. You may use this information to compare the ongoing costs of investing in the Fund and other funds. To do so, compare this 5% hypothetical example with the 5% hypothetical examples that appear in the shareholder reports of the other funds.
Please note that the expenses shown in the table are meant to highlight your ongoing costs. Therefore, the hypothetical information is useful in comparing ongoing costs, and will not help you determine the relative total costs of owning different funds.
| | | | | | | | | | | | | | | | | | | | | | | | | | | | | | | |
| | | | | | | | | | HYPOTHETICAL
| | | |
| | | | | | | | | | (5% annual return before
| | | |
| | | | | | | ACTUAL | | | expenses) | | | |
| | | | Beginning
| | | Ending
| | | Expenses
| | | Ending
| | | Expenses
| | | Annualized
|
| | | | Account Value
| | | Account Value
| | | Paid During
| | | Account Value
| | | Paid During
| | | Expense
|
| Class | | | (07/01/11) | | | (12/31/11)1 | | | Period2 | | | (12/31/11) | | | Period2 | | | Ratio |
| Series I | | | $ | 1,000.00 | | | | $ | 884.70 | | | | $ | 5.42 | | | | $ | 1,019.46 | | | | $ | 5.80 | | | | | 1.14 | % |
| | | | | | | | | | | | | | | | | | | | | | | | | | | | | | | |
| Series II | | | | 1,000.00 | | | | | 883.60 | | | | | 6.60 | | | | | 1,018.20 | | | | | 7.07 | | | | | 1.39 | |
| | | | | | | | | | | | | | | | | | | | | | | | | | | | | | | |
| |
| 1 | The actual ending account value is based on the actual total return of the Fund for the period July 1, 2011 through December 31, 2011, after actual expenses and will differ from the hypothetical ending account value which is based on the Fund’s expense ratio and a hypothetical annual return of 5% before expenses. |
| 2 | Expenses are equal to the Fund’s annualized expense ratio as indicated above multiplied by the average account value over the period, multiplied by 184/365 to reflect the most recent fiscal half year. |
Invesco V.I. Global Real Estate Fund
Form 1099-DIV, Form 1042-S and other year-end tax information provide shareholders with actual calendar year amounts that should be included in their tax returns. Shareholders should consult their tax advisors.
The following distribution information is being provided as required by the Internal Revenue Code or to meet a specific state’s requirement.
The Fund designates the following amounts or, if subsequently determined to be different, the maximum amount allowable for its fiscal year ended December 31, 2011:
| | | | | |
Federal and State Income Tax | | |
| |
| Corporate Dividends Received Deduction* | | | 0.00% | |
| | |
| | * | The above percentage is based on ordinary income dividends paid to shareholders during the Fund’s fiscal year. |
Invesco V.I. Global Real Estate Fund
Trustees and Officers
The address of each trustee and officer is AIM Variable Insurance Funds (Invesco Variable Insurance Funds) (the “Trust”), 11 Greenway Plaza, Suite 2500, Houston, Texas 77046-1173. The trustees serve for the life of the Trust, subject to their earlier death, incapacitation, resignation, retirement or removal as more specifically provided in the Trust’s organizational documents. Each officer serves for a one year term or until their successors are elected and qualified. Column two below includes length of time served with predecessor entities, if any.
| | | | | | | | | |
| | | | | | | Number of Funds
| | |
Name, Year of Birth and
| | Trustee and/
| | Principal Occupation(s)
| | in Fund Complex
| | Other Directorship(s)
|
| Position(s) Held with the Trust | | or Officer Since | | During Past 5 Years | | Overseen by Trustee | | Held by Trustee |
| | | | | | | | | |
| | | | | | | | | |
| | | | | | | | | |
Interested Persons | | | | | | | | |
| | | | | | | | | |
| | | | | | | | | |
| | | | | | | | | |
Martin L. Flanagan1 — 1960
Trustee | | 2007 | | Executive Director, Chief Executive Officer and President, Invesco Ltd. (ultimate parent of Invesco and a global investment management firm); Advisor to the Board, Invesco Advisers, Inc. (formerly known as Invesco Institutional (N.A.), Inc.); Trustee, The Invesco Funds; Vice Chair, Investment Company Institute; and Member of Executive Board, SMU Cox School of Business
Formerly: Chairman, Invesco Advisers, Inc. (registered investment adviser); Director, Chairman, Chief Executive Officer and President, IVZ Inc. (holding company), INVESCO Group Services, Inc. (service provider) and Invesco North American Holdings, Inc. (holding company); Director, Chief Executive Officer and President, Invesco Holding Company Limited (parent of Invesco and a global investment management firm); Director, Invesco Ltd.; Chairman, Investment Company Institute and President, Co-Chief Executive Officer, Co-President, Chief Operating Officer and Chief Financial Officer, Franklin Resources, Inc. (global investment management organization) | | 140 | | None |
| | | | | | | | | |
| | | | | | | | | |
| | | | | | | | | |
Philip A. Taylor2 — 1954
Trustee, President and Principal Executive Officer | | 2006 | | Head of North American Retail and Senior Managing Director, Invesco Ltd.; Director, Co-Chairman, Co-President and Co-Chief Executive Officer, Invesco Advisers, Inc. (formerly known as Invesco Institutional (N.A.), Inc.) (registered investment adviser); Director, Chairman, Chief Executive Officer and President, Invesco Management Group, Inc. (formerly Invesco Aim Management Group, Inc.) (financial services holding company); Director and President, INVESCO Funds Group, Inc. (registered investment adviser and registered transfer agent); Director and Chairman, Invesco Investment Services, Inc. (formerly known as Invesco Aim Investment Services, Inc.) (registered transfer agent) and IVZ Distributors, Inc. (formerly known as INVESCO Distributors, Inc.) (registered broker dealer); Director, President and Chairman, Invesco Inc. (holding company) and Invesco Canada Holdings Inc. (holding company); Chief Executive Officer, Invesco Corporate Class Inc. (corporate mutual fund company) and Invesco Canada Fund Inc. (corporate mutual fund company); Director, Chairman and Chief Executive Officer, Invesco Canada Ltd. (formerly known as Invesco Trimark Ltd./Invesco Trimark Ltèe) (registered investment adviser and registered transfer agent); Trustee, President and Principal Executive Officer, The Invesco Funds (other than AIM Treasurer’s Series Trust (Invesco Treasurer’s Series Trust) and Short-Term Investments Trust); Trustee and Executive Vice President, The Invesco Funds (AIM Treasurer’s Series Trust (Invesco Treasurer’s Series Trust) and Short-Term Investments Trust only); Director, Invesco Investment Advisers LLC (formerly known as Van Kampen Asset Management); Director, Chief Executive Officer and President, Van Kampen Exchange Corp. | | 140 | | None |
| | | | | | | | | |
| | | | | | | | | |
| | | | | Formerly: Director and Chairman, Van Kampen Investor Services Inc.: Director, Chief Executive Officer and President, 1371 Preferred Inc. (holding company); and Van Kampen Investments Inc.; Director and President, AIM GP Canada Inc. (general partner for limited partnerships); and Van Kampen Advisors, Inc.; Director and Chief Executive Officer, Invesco Trimark Dealer Inc. (registered broker dealer); Director, Invesco Distributors, Inc. (formerly known as Invesco Aim Distributors, Inc.) (registered broker dealer); Manager, Invesco PowerShares Capital Management LLC; Director, Chief Executive Officer and President, Invesco Advisers, Inc.; Director, Chairman, Chief Executive Officer and President, Invesco Aim Capital Management, Inc.; President, Invesco Trimark Dealer Inc. and Invesco Trimark Ltd./Invesco Trimark Ltèe; Director and President, AIM Trimark Corporate Class Inc. and AIM Trimark Canada Fund Inc.; Senior Managing Director, Invesco Holding Company Limited; Trustee and Executive Vice President, Tax-Free Investments Trust; Director and Chairman, Fund Management Company (former registered broker dealer); President and Principal Executive Officer, The Invesco Funds (AIM Treasurer’s Series Trust (Invesco Treasurer’s Series Trust), Short-Term Investments Trust and Tax-Free Investments Trust only); President, AIM Trimark Global Fund Inc. and AIM Trimark Canada Fund Inc. | | | | |
| | | | | | | | | |
| | | | | | | | | |
| | | | | | | | | |
Wayne W. Whalen3 — 1939
Trustee | | 2010 | | Of Counsel, and prior to 2010, partner in the law firm of Skadden, Arps, Slate, Meagher & Flom LLP, legal counsel to funds in the Fund Complex | | 158 | | Director of the Abraham Lincoln Presidential Library Foundation |
| | | | | | | | | |
| | | | | | | | | |
| | | | | | | | | |
Independent Trustees | | | | | | | | |
| | | | | | | | | |
| | | | | | | | | |
| | | | | | | | | |
Bruce L. Crockett — 1944
Trustee and Chair | | 1993 | | Chairman, Crockett Technology Associates (technology consulting company) | | 140 | | ACE Limited (insurance company); and Investment Company Institute |
| | | | | Formerly: Director, Captaris (unified messaging provider); Director, President and Chief Executive Officer COMSAT Corporation; and Chairman, Board of Governors of INTELSAT (international communications company) | | | | |
| | | | | | | | | |
| |
| 1 | Mr. Flanagan is considered an interested person of the Trust because he is an officer of the adviser to the Trust, and an officer and a director of Invesco Ltd., ultimate parent of the adviser to the Trust. |
| 2 | Mr. Taylor is considered an interested person of the Trust because he is an officer and a director of the adviser to, and a director of the principal underwriter of, the Trust. |
Invesco V.I. Global Real Estate Fund
Trustees and Officers—(continued)
The address of each trustee and officer is AIM Variable Insurance Funds (Invesco Variable Insurance Funds) (the “Trust”), 11 Greenway Plaza, Suite 2500, Houston, Texas 77046-1173. The trustees serve for the life of the Trust, subject to their earlier death, incapacitation, resignation, retirement or removal as more specifically provided in the Trust’s organizational documents. Each officer serves for a one year term or until their successors are elected and qualified. Column two below includes length of time served with predecessor entities, if any.
| |
| 3 | Mr. Whalen is considered an “interested person” (within the meaning of Section 2(a)(19) of the 1940 Act) of certain Funds in the Fund Complex by reason of he and his firm currently providing legal services as legal counsel to such Funds in the Fund Complex. |
| | | | | | | | | |
| | | | | | | Number of Funds
| | |
Name, Year of Birth and
| | Trustee and/
| | Principal Occupation(s)
| | in Fund Complex
| | Other Directorship(s)
|
| Position(s) Held with the Trust | | or Officer Since | | During Past 5 Years | | Overseen by Trustee | | Held by Trustee |
| | | | | | | | | |
| | | | | | | | | |
| | | | | | | |
Independent Trustees—(continued) | | | | | | |
| | | | | | | | | |
| | | | | | | | | |
| | | | | | | | | |
David C. Arch — 1945
Trustee | | 2010 | | Chairman and Chief Executive Officer of Blistex Inc., a consumer health care products manufacturer. | | 158 | | Member of the Heartland Alliance Advisory Board, a nonprofit organization serving human needs based in Chicago. Board member of the Illinois Manufacturers’ Association. Member of the Board of Visitors, Institute for the Humanities, University of Michigan |
| | | | | | | | | |
| | | | | | | | | |
| | | | | | | | | |
Frank S. Bayley — 1939
Trustee | | 2001 | | Retired
Formerly: Director, Badgley Funds, Inc. (registered investment company) (2 portfolios) and Partner, law firm of Baker & McKenzie
Formerly: Director, Badgley Funds, Inc. (registered investment company) (2 portfolios) and Partner, law firm of Baker & McKenzie | | 140 | | Director and Chairman, C.D. Stimson Company (a real estate investment company) |
| | | | | | | | | |
| | | | | | | | | |
| | | | | | | | | |
James T. Bunch — 1942
Trustee | | 2004 | | Managing Member, Grumman Hill Group LLC (family office private equity management)
Formerly: Founder, Green, Manning & Bunch Ltd. (investment banking firm)(1988-2010); Executive Committee, United States Golf Association; and Director, Policy Studies, Inc. and Van Gilder Insurance Corporation | | 140 | | Vice Chairman, Board of Governors, Western Golf Association/Evans Scholars Foundation and Director, Denver Film Society |
| | | | | | | | | |
| | | | | | | | | |
| | | | | | | | | |
Rodney F. Dammeyer — 1940
Trustee | | 2010 | | President of CAC, LLC, a private company offering capital investment and management advisory services.
Formerly: Prior to January 2004, Director of TeleTech Holdings Inc.; Prior to 2002, Director of Arris Group, Inc.; Prior to 2001, Managing Partner at Equity Group Corporate Investments. Prior to 1995, Vice Chairman of Anixter International. Prior to 1985, experience includes Senior Vice President and Chief Financial Officer of Household International, Inc., Executive Vice President and Chief Financial Officer of Northwest Industries, Inc. and Partner of Arthur Andersen & Co. | | 158 | | Director of Quidel Corporation and Stericycle, Inc. Prior to May 2008, Trustee of The Scripps Research Institute. Prior to February 2008, Director of Ventana Medical Systems, Inc. Prior to April 2007, Director of GATX Corporation. Prior to April 2004, Director of TheraSense, Inc. |
| | | | | | | | | |
| | | | | | | | | |
| | | | | | | | | |
Albert R. Dowden — 1941
Trustee | | 2000 | | Director of a number of public and private business corporations, including the Boss Group, Ltd. (private investment and management); Reich & Tang Funds (5 portfolios) (registered investment company); and Homeowners of America Holding Corporation/ Homeowners of America Insurance Company (property casualty company)
Formerly: Director, Continental Energy Services, LLC (oil and gas pipeline service); Director, CompuDyne Corporation (provider of product and services to the public security market) and Director, Annuity and Life Re (Holdings), Ltd. (reinsurance company); Director, President and Chief Executive Officer, Volvo Group North America, Inc.; Senior Vice President, AB Volvo; Director of various public and private corporations; Chairman, DHJ Media, Inc.; Director Magellan Insurance Company; and Director, The Hertz Corporation, Genmar Corporation (boat manufacturer), National Media Corporation; Advisory Board of Rotary Power International (designer, manufacturer, and seller of rotary power engines); and Chairman, Cortland Trust, Inc. (registered investment company) | | 140 | | Board of Nature’s Sunshine Products, Inc. |
| | | | | | | | | |
| | | | | | | | | |
| | | | | | | | | |
Jack M. Fields — 1952
Trustee | | 1997 | | Chief Executive Officer, Twenty First Century Group, Inc. (government affairs company); and Owner and Chief Executive Officer, Dos Angelos Ranch, L.P. (cattle, hunting, corporate entertainment), Discovery Global Education Fund (non-profit) and Cross Timbers Quail Research Ranch (non-profit)
Formerly: Chief Executive Officer, Texana Timber LP (sustainable forestry company) and member of the U.S. House of Representatives | | 140 | | Administaff |
| | | | | | | | | |
| | | | | | | | | |
| | | | | | | | | |
Carl Frischling — 1937
Trustee | | 1993 | | Partner, law firm of Kramer Levin Naftalis and Frankel LLP | | 140 | | Director, Reich & Tang Funds (16 portfolios) |
| | | | | | | | | |
| | | | | | | | | |
Invesco V.I. Global Real Estate Fund
Trustees and Officers—(continued)
The address of each trustee and officer is AIM Variable Insurance Funds (Invesco Variable Insurance Funds) (the “Trust”), 11 Greenway Plaza, Suite 2500, Houston, Texas 77046-1173. The trustees serve for the life of the Trust, subject to their earlier death, incapacitation, resignation, retirement or removal as more specifically provided in the Trust’s organizational documents. Each officer serves for a one year term or until their successors are elected and qualified. Column two below includes length of time served with predecessor entities, if any.
| | | | | | | | | |
| | | | | | | Number of Funds
| | |
Name, Year of Birth and
| | Trustee and/
| | Principal Occupation(s)
| | in Fund Complex
| | Other Directorship(s)
|
| Position(s) Held with the Trust | | or Officer Since | | During Past 5 Years | | Overseen by Trustee | | Held by Trustee |
| | | Independent Trustees—(continued) | | | | |
| | | | | | | | | |
| | | | | | | | | |
| | | | | | | | | |
Prema Mathai-Davis — 1950
Trustee | | 1998 | | Retired
Formerly: Chief Executive Officer, YWCA of the U.S.A. | | 140 | | None |
| | | | | | | | | |
| | | | | | | | | |
| | | | | | | | | |
Larry Soll — 1942
Trustee | | 2004 | | Retired
Formerly, Chairman, Chief Executive Officer and President, Synergen Corp. (a biotechnology company) | | 140 | | None |
| | | | | | | | | |
| | | | | | | | | |
| | | | | | | | | |
Hugo F. Sonnenschein — 1940
Trustee | | 2010 | | President Emeritus and Honorary Trustee of the University of Chicago and the Adam Smith Distinguished Service Professor in the Department of Economics at the University of Chicago. Prior to July 2000, President of the University of Chicago. | | 158 | | Trustee of the University of Rochester and a member of its investment committee. Member of the National Academy of Sciences, the American Philosophical Society and a fellow of the American Academy of Arts and Sciences |
| | | | | | | | | |
| | | | | | | | | |
| | | | | | | | | |
| Raymond Stickel, Jr. — 1944 Trustee | | 2005 | | Retired
Formerly: Director, Mainstay VP Series Funds, Inc. (25 portfolios) and Partner, Deloitte & Touche | | 140 | | None |
| | | | | | | | | |
| | | | | | | | | |
| | | | | | | | | |
Other Officers | | | | | | | | |
| | | | | | | | | |
| | | | | | | | | |
| | | | | | | | | |
Russell C. Burk — 1958
Senior Vice President and Senior Officer | | 2005 | | Senior Vice President and Senior Officer, The Invesco Funds | | N/A | | N/A |
| | | | | | | | | |
| | | | | | | | | |
| | | | | | | | | |
John M. Zerr — 1962
Senior Vice President, Chief Legal Officer and Secretary | | 2006 | | Director, Senior Vice President, Secretary and General Counsel, Invesco Management Group, Inc. (formerly known as Invesco Aim Management Group, Inc.) and Van Kampen Exchange Corp.; Senior Vice President, Invesco Advisers, Inc. (formerly known as Invesco Institutional (N.A.), Inc.) (registered investment adviser); Senior Vice President and Secretary, Invesco Distributors, Inc. (formerly known as Invesco Aim Distributors, Inc.); Director, Vice President and Secretary, Invesco Investment Services, Inc. (formerly known as Invesco Aim Investment Services, Inc.) and IVZ Distributors, Inc. (formerly known as INVESCO Distributors, Inc.); Director and Vice President, INVESCO Funds Group, Inc.; Senior Vice President, Chief Legal Officer and Secretary, The Invesco Funds; Manager, Invesco PowerShares Capital Management LLC; Director, Secretary and General Counsel, Invesco Investment Advisers LLC (formerly known as Van Kampen Asset Management); Secretary and General Counsel, Van Kampen Funds Inc. and Chief Legal Officer, PowerShares Exchange-Traded Fund Trust, PowerShares Exchange-Traded Fund Trust II, PowerShares India Exchange-Traded Fund Trust and PowerShares Actively Managed Exchange-Traded Fund Trust
Formerly: Director and Secretary, Van Kampen Advisors Inc.; Director Vice President, Secretary and General Counsel Van Kampen Investor Services Inc.; Director, Invesco Distributors, Inc. (formerly known as Invesco Aim Distributors, Inc.); Director, Senior Vice President, General Counsel and Secretary, Invesco Advisers, Inc.; and Van Kampen Investments Inc.; Director, Vice President and Secretary, Fund Management Company; Director, Senior Vice President, Secretary, General Counsel and Vice President, Invesco Aim Capital Management, Inc.; Chief Operating Officer and General Counsel, Liberty Ridge Capital, Inc. (an investment adviser); Vice President and Secretary, PBHG Funds (an investment company) and PBHG Insurance Series Fund (an investment company); Chief Operating Officer, General Counsel and Secretary, Old Mutual Investment Partners (a broker-dealer); General Counsel and Secretary, Old Mutual Fund Services (an administrator) and Old Mutual Shareholder Services (a shareholder servicing center); Executive Vice President, General Counsel and Secretary, Old Mutual Capital, Inc. (an investment adviser); and Vice President and Secretary, Old Mutual Advisors Funds (an investment company) | | N/A | | N/A |
| | | | | | | | | |
| | | | | | | | | |
| | | | | | | | | |
Lisa O. Brinkley — 1959
Vice President | | 2004 | | Global Compliance Director, Invesco Ltd.; Chief Compliance Officer, Invesco Investment Services, Inc.(formerly known as Invesco Aim Investment Services, Inc.); and Vice President, The Invesco Funds
Formerly: Chief Compliance Officer, Invesco Distributors, Inc. (formerly known as Invesco Aim Distributors, Inc.) and Van Kampen Investor Services Inc.; Senior Vice President, Invesco Management Group, Inc.; Senior Vice President and Chief Compliance Officer, Invesco Advisers, Inc. and The Invesco Funds; Vice President and Chief Compliance Officer, Invesco Aim Capital Management, Inc. and Invesco Distributors, Inc.; Vice President, Invesco Investment Services, Inc. and Fund Management Company | | N/A | | N/A |
| | | | | | | | | |
Invesco V.I. Global Real Estate Fund
Trustees and Officers—(continued)
The address of each trustee and officer is AIM Variable Insurance Funds (Invesco Variable Insurance Funds) (the “Trust”), 11 Greenway Plaza, Suite 2500, Houston, Texas 77046-1173. The trustees serve for the life of the Trust, subject to their earlier death, incapacitation, resignation, retirement or removal as more specifically provided in the Trust’s organizational documents. Each officer serves for a one year term or until their successors are elected and qualified. Column two below includes length of time served with predecessor entities, if any.
| | | | | | | | | |
| | | | | | | Number of Funds
| | |
Name, Year of Birth and
| | Trustee and/
| | Principal Occupation(s)
| | in Fund Complex
| | Other Directorship(s)
|
| Position(s) Held with the Trust | | or Officer Since | | During Past 5 Years | | Overseen by Trustee | | Held by Trustee |
| | | Other Officers—(continued) | | | | |
| | | | | | | | | |
| | | | | | | | | |
| | | | | | | | | |
Sheri Morris — 1964
Vice President, Treasurer and Principal Financial Officer | | 1999 | | Vice President, Treasurer and Principal Financial Officer, The Invesco Funds; Vice President, Invesco Advisers, Inc. (formerly known as Invesco Institutional (N.A.), Inc.) (registered investment adviser).
Formerly: Treasurer, PowerShares Exchange-Traded Fund Trust, PowerShares Exchange-Traded Fund Trust II, PowerShares India Exchange-Traded Fund Trust and PowerShares Actively Managed Exchange-Traded Fund Trust, Vice President, Invesco Advisers, Inc., Invesco Aim Capital Management, Inc. and Invesco Aim Private Asset Management, Inc.; Assistant Vice President and Assistant Treasurer, The Invesco Funds and Assistant Vice President, Invesco Advisers, Inc., Invesco Aim Capital Management, Inc. and Invesco Aim Private Asset Management, Inc. | | N/A | | N/A |
| | | | | | | | | |
| | | | | | | | | |
| | | | | | | | | |
Karen Dunn Kelley — 1960
Vice President | | 1993 | | Head of Invesco’s World Wide Fixed Income and Cash Management Group; Senior Vice President, Invesco Management Group, Inc. (formerly known as Invesco Aim Management Group, Inc.) and Invesco Advisers, Inc. (formerly known as Invesco Institutional (N.A.), Inc.) (registered investment adviser); Executive Vice President, Invesco Distributors, Inc. (formerly known as Invesco Aim Distributors, Inc.); Director, Invesco Mortgage Capital Inc.; Vice President, The Invesco Funds (other than AIM Treasurer’s Series Trust (Invesco Treasurer’s Series Trust) and Short-Term Investments Trust); and President and Principal Executive Officer, The Invesco Funds (AIM Treasurer’s Series Trust (Invesco Treasurer’s Series Trust) and Short-Term Investments Trust only).
Formerly: Senior Vice President, Van Kampen Investments Inc.; Vice President, Invesco Advisers, Inc. (formerly known as Invesco Institutional (N.A.), Inc.); Director of Cash Management and Senior Vice President, Invesco Advisers, Inc. and Invesco Aim Capital Management, Inc.; President and Principal Executive Officer, Tax-Free Investments Trust; Director and President, Fund Management Company; Chief Cash Management Officer, Director of Cash Management, Senior Vice President, and Managing Director, Invesco Aim Capital Management, Inc.; Director of Cash Management, Senior Vice President, and Vice President, Invesco Advisers, Inc. and The Invesco Funds (AIM Treasurer’s Series Trust (Invesco Treasurer’s Series Trust), Short-Term Investments Trust and Tax-Free Investments Trust only) | | N/A | | N/A |
| | | | | | | | | |
| | | | | | | | | |
| | | | | | | | | |
Yinka Akinsola — 1977
Anti-Money Laundering Compliance Officer | | 2011 | | Anti-Money Laundering Compliance Officer, Invesco Advisers, Inc. (formerly known as Invesco Institutional (N.A.), Inc.) (registered investment adviser); Invesco Distributors, Inc. (formerly known as Invesco Aim Distributors, Inc.), Invesco Investment Services, Inc. (formerly known as Invesco Aim Investment Services, Inc.), Invesco Management Group, Inc., The Invesco Funds, Invesco Van Kampen Closed-End Funds, Van Kampen Exchange Corp. and Van Kampen Funds Inc. | | N/A | | N/A |
| | | | | | | | | |
| | | | | | | | | |
| | | | | | | | | |
Todd L. Spillane — 1958
Chief Compliance Officer | | 2006 | | Senior Vice President, Invesco Management Group, Inc. (formerly known as Invesco Aim Management Group, Inc.) and Van Kampen Exchange Corp.; Senior Vice President and Chief Compliance Officer, Invesco Advisers, Inc. (registered investment adviser) (formerly known as Invesco Institutional (N.A.), Inc.); Chief Compliance Officer, The Invesco Funds, INVESCO Private Capital Investments, Inc. (holding company) and Invesco Private Capital, Inc. (registered investment adviser); Vice President, Invesco Distributors, Inc. (formerly known as Invesco Aim Distributors, Inc.) and Invesco Investment Services, Inc. (formerly known as Invesco Aim Investment Services, Inc.).
Formerly: Chief Compliance Officer, Invesco Van Kampen Closed-End Funds PowerShares Exchange-Traded Fund Trust, PowerShares Exchange-Traded Fund Trust II, PowerShares India Exchange-Traded Fund Trust, and PowerShares Actively Managed Exchange-Traded Fund Trust; Senior Vice President, Van Kampen Investments Inc.; Senior Vice President and Chief Compliance Officer, Invesco Advisers, Inc. and Invesco Aim Capital Management, Inc.; Chief Compliance Officer, Invesco Global Asset Management (N.A.), Inc., Invesco Senior Secured Management, Inc. (registered investment adviser) and Van Kampen Investor Services Inc.; Vice President, Invesco Aim Capital Management, Inc. and Fund Management Company | | N/A | | N/A |
| | | | | | | | | |
The Statement of Additional Information of the Trust includes additional information about the Fund’s Trustees and is available upon request, without charge, by calling 1.800.959.4246. Please refer to the Fund’s prospectus for information on the Fund’s sub-advisers.
| | | | | | | |
Office of the Fund
11 Greenway Plaza, Suite 2500
Houston, TX 77046-1173 | | Investment Adviser
Invesco Advisers, Inc.
1555 Peachtree Street, N.E.
Atlanta, GA 30309 | | Distributor
Invesco Distributors, Inc.
11 Greenway Plaza, Suite 2500
Houston, TX 77046-1173 | | Auditors
PricewaterhouseCoopers LLP
1201 Louisiana Street, Suite 2900
Houston, TX 77002-5678 |
| | | | | | | |
| | | | | | | |
Counsel to the Fund
Stradley Ronon Stevens & Young, LLP
2600 One Commerce Square
Philadelphia, PA 19103 | | Counsel to the Independent Trustees
Kramer, Levin, Naftalis & Frankel LLP
1177 Avenue of the Americas
New York, NY 10036-2714 | | Transfer Agent
Invesco Investment Services, Inc.
11 Greenway Plaza, Suite 2500
Houston, TX77046-1173 | | Custodian
State Street Bank and Trust Company
225 Franklin
Boston, MA 02110-2801 |
Invesco V.I. Global Real Estate Fund
Invesco V.I. Government Securities FundAnnual Report to Shareholders § December 31, 2011The Fund provides a complete list of its holdings four times in each fiscal year, at the quarter-ends. For the second and fourth quarters, the lists appear in the Fund’s semiannual and annual reports to shareholders. For the first and third quarters, the Fund files the lists with the Securities and Exchange Commission (SEC) on Form N-Q. The Fund’s Form N-Q filings are available on the SEC website, sec.gov. Copies of the Fund’s Forms N-Q may be reviewed and copied at the SEC Public Reference Room in Washington, D.C. You can obtain information on the operation of the Public Reference Room, including information about duplicating fee charges, by calling 202 551 8090 or 800 732 0330, or by electronic request at the following email address: publicinfo@sec.gov. The SEC file numbers for the Fund are 811-07452 and 033-57340. The Fund’s most recent portfolio holdings, as filed on Form N-Q, have also been made available to insurance companies issuing variable annuity contracts and variable life insurance policies (“variable products”) that invest in the Fund.
A description of the policies and procedures that the Fund uses to determine how to vote proxies relating to portfolio securities is available without charge, upon request, from our Client Services department at 800 959 4246 or at invesco.com/proxyguidelines. The information is also available on the SEC website, sec.gov.
Information regarding how the Fund voted proxies related to its portfolio securities during the 12 months ended June 30, 2011, is available at invesco.com/proxysearch. The information is also available on the SEC website, sec.gov.
Invesco Advisers, Inc. is an investment adviser; it provides investment advisory services to individual and institutional clients and does not sell securities. Invesco Distributors, Inc. is the U.S. distributor for Invesco Ltd.’s retail mutual funds, exchange-traded funds and institutional money market funds. Both are wholly owned, indirect subsidiaries of Invesco Ltd.
This report must be accompanied or preceded by a currently effective Fund prospectus and variable product prospectus, which contain more complete information, including sales charges and expenses. Investors should read each carefully before investing.
Invesco Distributors, Inc.
VIGOV-AR-1
| | | | | |
|
| | | | | |
NOT FDIC INSURED | | MAY LOSE VALUE | | NO BANK GUARANTEE |
Management’s Discussion of Fund Performance
Performance summary
For the year ended December 31, 2011, Invesco V.I. Government Securities Fund underperformed the Fund’s style-specific index. The reason for this underperformance was the Fund’s duration positioning and sector allocation that favored agency mortgage-backed securities (MBS).
Your Fund’s long-term performance appears later in this report.
Fund vs. Indexes
Total returns, 12/31/10 to 12/31/11, excluding variable product issuer charges. If variable product issuer charges were included, returns would be lower.
| | | | | |
|
| Series I Shares | | | 7.91 | % |
| |
| Series II Shares | | | 7.63 | |
| |
Barclays Capital U.S. Aggregate Index▼ (Broad Market Index) | | | 7.84 | |
| |
Barclays Capital U.S. Government Index▼ (Style-Specific Index) | | | 9.02 | |
| |
Lipper VUF General U.S. Government Funds Index▼ (Peer Group Index) | | | 9.17 | |
Source(s): ▼Lipper Inc.
How we invest
We invest primarily in debt securities issued, guaranteed or backed by the U.S. government or its agencies and instrumentalities. These securities include: U.S. Treasury notes and bonds, U.S. agency debentures and agency-backed mortgage-backed securities (MBS). The Fund may invest in derivative instruments such as interest rate futures contracts and swap agreements, and engage in mortgage dollar roll transactions, a form of repurchase agreement activity in the to-be-announced (TBA) market for agency mortgage-backed securities.
Our security selection is supported by a team of independent specialists. Team members conduct top-down macroeconomic as well as bottom-up analysis on individual securities. Recommendations are communicated to portfolio managers through proprietary technology that allows all investment professionals to communicate in a timely manner.
Portfolio construction begins with a well-defined Fund design that establishes the target investment vehicles for generating the desired “alpha” (the extra return above a specific benchmark) as
well as the risk parameters for the Fund. Investment vehicles are evaluated for liquidity and relative value.
Sell decisions are based on:
| n | | A conscious decision to alter the Fund’s macro risk exposure (such as duration, yield curve positioning, sector exposure). |
| |
| n | | The need to limit or reduce exposure to a particular sector or issuer. |
| |
| n | | Degradation of an issuer’s credit quality. |
| |
| n | | Realignment of a valuation target. |
| |
| n | | Presentation of a better relative value opportunity. |
| |
| n | | The general liquidity needs of the Fund. |
Market conditions and your Fund
Global financial markets were unsettled and volatile during 2011 as investors assessed and reacted to the economic implications of several global events, including the Japanese earthquake and tsunami, the U.S. debt ceiling debate, and a reinvigorated eurozone sovereign debt crisis. The U.S. economy showed signs of faltering and there was little consensus regarding the threat of U.S. inflation. However, starting in the second quarter, anxiety linked to the aforementioned
events and related concerns about global financial instability began dominating headlines and investor psyche, leading to periods of extreme risk aversion, wider credit spreads and high demand for the perceived safe haven of U.S. government bonds. By the end of the year, U.S. interest rates were pushed to near-historic lows, in spite of Standard & Poor’s credit rating downgrade of the U.S. in the third quarter.
U.S. Treasury yields for maturities of between two and 30 years ended the year lower than at the start of the year, generating strong positive 12-month returns across government bond sectors. With inflation expectations held in check, long-term bonds outperformed short and intermediate maturities as investors were willing to extend out on the yield curve for incrementally higher returns. The broad U.S. investment grade bond market, as measured by the Barclays Capital U.S. Aggregate Index, also generated a positive total return for the 12 months ended December 31, 2011. While U.S. credit spreads widened to reflect heightened systemic risks, the significant decline in rates across the yield curve created gains across most domestic bond market sectors for the year.
The Fund allocated a significant portion of assets to agency MBS. These securities provided a higher yield than U.S. Treasury or agency debentures but gave up some average life certainty. During the year, the U.S. government made several attempts to adjust home refinancing programs, increasing MBS performance volatility. This volatility widened MBS yield spreads which had a negative impact on the Fund’s performance relative to the style specific benchmark. Our allocation to agency MBS also meant the Fund had a smaller allocation to U.S. Treasury securities and agency debentures than the benchmark.
Portfolio Composition
By security type
| | | | | |
|
| U.S. Government Sponsored | | | | |
| Mortgage-Backed Securities | | | 73.5 | % |
| |
| U.S. Government Sponsored | | | | |
| Agency Securities | | | 13.7 | |
| |
| U.S. Treasury Securities | | | 12.4 | |
| |
| Non-U.S. Dollar Denominated | | | | |
| Bonds & Notes | | | 2.6 | |
| |
| U.S. Dollar Denominated Bonds & Notes | | | 1.3 | |
| |
Money Market Funds | | | | |
Plus Other Assets Less Liabilities | | | –3.5 | |
Top 10 Fixed Income Issuers*
| | | | | | | | | |
|
| | 1. | | | Federal National Mortgage Association | | | 22.6 | % |
| |
| | 2. | | | Freddie Mac REMICs | | | 12.5 | |
| |
| | 3. | | | Fannie Mae REMICs | | | 12.4 | |
| |
| | 4. | | | U.S. Treasury | | | 12.4 | |
| |
| | 5. | | | Federal Home Loan Mortgage Corp. | | | 12.0 | |
| |
| | 6. | | | Ginnie Mae REMICs | | | 9.6 | |
| |
| | 7. | | | Federal Agricultural Mortgage Corp. | | | 4.5 | |
| |
| | 8. | | | Federal Home Loan Bank | | | 4.4 | |
| |
| | 9. | | | Federal Farm Credit Bank | | | 4.1 | |
| |
| | 10. | | | Government | | | | |
| | | | | National Mortgage Association | | | 3.5 | |
| | | | | |
|
| Total Net Assets | | $1.3 billion | |
| | | | | |
| Total Number of Holdings* | | | 922 | |
The Fund’s holdings are subject to change, and there is no assurance that the Fund will continue to hold any particular security.
*Excluding money market fund holdings.
Invesco V.I. Government Securities Fund
We used dollar rolls, a type of repurchase transaction in the highly liquid TBA market for agency MBS, to produce additional income for the Fund. A dollar roll involves the Fund selling MBS to a financial institution, with an agreement to repurchase a substantially similar security at an agreed upon price and date. Excess portfolio cash resulting from the use of this strategy is subsequently invested in short-term instruments to generate additional return on the portfolio.
The Fund also uses active duration and yield curve positioning for risk management and for generating alpha versus its style-specific benchmark. Duration measures a portfolio’s price sensitivity to interest rate changes, with a longer duration tending to be more sensitive to interest rate changes than the benchmark. The Fund’s duration and yield curve positions during the year had a modest negative effect on performance. The portfolio did own Treasury Inflation Protected Securities (TIPS) during the year. These securities pay a semiannual coupon and the principal is adjusted for changes in inflation. TIPS had a negligible effect on performance for the year. In addition, U.S. Treasury futures were an important investment tool in the management of our targeted portfolio duration and the Fund realized a small gain from the use of futures during the reporting period.
We thank you for your investment in Invesco V.I. Government Securities Fund.
The views and opinions expressed in management’s discussion of Fund performance are those of Invesco Advisers, Inc. These views and opinions are subject to change at any time based on factors such as market and economic conditions. These views and opinions may not be relied upon as investment advice or recommendations, or as an offer for a particular security. The information is not a complete analysis of every aspect of any market, country, industry, security or the Fund. Statements of fact are from sources considered reliable, but Invesco Advisers, Inc. makes no representation or warranty as to their completeness or accuracy. Although historical performance is no guarantee of future results, these insights may help you understand our investment management philosophy.
See important Fund and, if applicable, index disclosures later in this report.
Clint Dudley
Chartered Financial Analyst, portfolio manager, is manager of Invesco V.I. Government Securities Fund. He joined Invesco in 1998. Mr. Dudley earned a B.B.A. and an M.B.A. from Baylor University.
Brian Schneider
Chartered Financial Analyst, portfolio manager, is manager of Invesco V.I. Government Securities Fund. He joined Invesco in 1987. Mr. Schneider earned a B.A. in economics and an M.B.A., both from Bellarmine College.
Invesco V.I. Government Securities Fund
Your Fund’s Long-Term Performance
Results of a $10,000 Investment – Oldest Share Class(es)
Fund and index data from 12/31/01*
| * | | During the reporting period, Invesco changed its policy regarding growth of $10,000 charts. For funds older than 10 years, we previously showed performance since inception. Going forward, we will show performance for the most recent 10 years, since this more accurately reflects the experience of the typical shareholder. As a result, charts now may include benchmarks that did not appear previously, because the funds’ inception pre-dated the benchmarks’ inception. Also, all charts will now be presented using a linear format. |
Past performance cannot guarantee comparable future results.
Average Annual Total Returns
As of 12/31/11
| | | | | | | | | |
|
| Series I Shares | | | | |
| |
| Inception (5/5/93) | | | 5.21 | % |
| |
| 10 | | | Years | | | 4.97 | |
| |
| 5 | | | Years | | | 6.31 | |
| |
| 1 | | | Year | | | 7.91 | |
| |
| | | | | | | | | |
| Series II Shares | | | | |
| |
| Inception (9/19/01) | | | 4.59 | % |
| |
| 10 | | | Years | | | 4.70 | |
| |
| 5 | | | Years | | | 6.04 | |
| |
| 1 | | | Year | | | 7.63 | |
| |
The performance of the Fund’s Series I and Series II share classes will differ primarily due to different class expenses.
The performance data quoted represent past performance and cannot guarantee comparable future results; current performance may be lower or higher. Please contact your variable product issuer or financial adviser for the most recent month-end variable product performance.
Performance figures reflect Fund expenses, reinvested distributions and changes in net asset value. Investment return and principal value will fluctuate so that you may have a gain or loss when you sell shares.
The net annual Fund operating expense ratio set forth in the most recent Fund prospectus as of the date of this report for Series I and Series II shares was 0.60% and 0.85%, respectively.1 The total annual Fund operating expense ratio set forth in the most recent Fund prospectus as of the date of this report for Series I and Series II shares was 0.76% and 1.01%, respectively. The expense ratios presented above may vary from the expense ratios presented in other sections of this report that are based on expenses incurred during the period covered by this report.
Invesco V.I. Government Securities Fund, a series portfolio of AIM Variable Insurance Funds (Invesco Variable Insurance Funds), is currently offered
through insurance companies issuing variable products. You cannot purchase shares of the Fund directly. Performance figures given represent the Fund and are not intended to reflect actual variable product values. They do not reflect sales charges, expenses and fees assessed in connection with a variable product. Sales charges, expenses and fees, which are determined by the variable product issuers, will vary and will lower the total return.
The most recent month-end performance data at the Fund level, excluding variable product charges, is available at 800 451 4246. As mentioned above, for the most recent month-end performance including variable product charges, please contact your variable product issuer or financial adviser.
| 1 | | Total annual Fund operating expenses after any contractual fee waivers and/or expense reimbursements by the adviser in effect through at least June 30, 2012. See current prospectus for more information. |
Invesco V.I. Government Securities Fund
Invesco V.I. Government Securities Fund’s investment objective is total return, comprised of current income and capital appreciation.
| n | | Unless otherwise stated, information presented in this report is as of December 31, 2011, and is based on total net assets. |
| |
| n | | Unless otherwise noted, all data provided by Invesco. |
| |
| n | | To access your Fund’s reports/prospectus, visit invesco.com/fundreports. |
Principal risks of investing in the Fund
Derivatives risk. Derivatives may be more difficult to purchase, sell or value than other investments and may be subject to market, interest rate, credit, leverage, counterparty and management risks. A fund investing in a derivative could lose more than the cash amount invested or incur higher taxes. Over-the-counter derivatives are also subject to counterparty risk, which is the risk that the other party to the contract will not fulfill its contractual obligation to complete the transaction with the Fund.
Dollar roll transactions risk. Dollar roll transactions involve the risk that the market value and yield of the securities retained by the Fund may decline below the price of the mortgage-related securities sold by the Fund that it is obligated to repurchase.
Interest rate risk. Interest rate risk refers to the risk that bond prices generally fall as interest rates rise; conversely, bond prices generally rise as interest rates fall. Specific bonds differ in their sensitivity to changes in interest rates depending on their individual characteristics, including duration.
Leverage risk. Leverage exists when the Fund purchases or sells an instrument or enters into a transaction without investing cash in an amount equal to the full economic exposure of the instrument or transaction and the Fund could lose more than it invested. Leverage created from borrowing or certain types of transactions or instruments, including derivatives, may impair the Fund’s liquidity, cause it to liquidate positions at an unfavorable time, increase volatility or otherwise not achieve its intended objective.
Management risk. The investment techniques and risk analysis used by the Fund’s portfolio managers may not produce the desired results.
Market risk. The prices of and the income generated by the Fund’s securities may decline in response to, among other things, investor sentiment; general economic and market conditions; regional or global instability; and currency and interest rate fluctuations.
Mortgage- and asset-backed securities risk. The Fund may invest in mortgage- and asset-backed securities that are
subject to prepayment or call risk, which is the risk that the borrower’s payments may be received earlier or later than expected due to changes in prepayment rates on underlying loans. Faster prepayments often happen when interest rates are falling. As a result, the Fund may reinvest these early payments at lower interest rates, thereby reducing the Fund’s income. Conversely, when interest rates rise, prepayments may happen more slowly, causing the security to lengthen in duration. Longer duration securities tend to be more volatile. Securities may be prepaid at a price less than the original purchase value. An unexpectedly high rate of defaults on the mortgages held by a mortgage pool may adversely affect the value of mortgage-backed securities and could result in losses to the Fund. The risk of such defaults is generally higher in the case of mortgage pools that include subprime mortgages. Subprime mortgages refer to loans made to borrowers with weakened credit histories or with lower capacity to make timely payments on their mortgages.
Reinvestment risk. Reinvestment risk is the risk that a bond’s cash flows (coupon income and principal repayment) will be reinvested at an interest rate below that on the original bond.
Reverse repurchase agreement risk. Reverse repurchase agreements involve the risk that the market value of securities to be repurchased may decline below the repurchase price or that the other party may default on its obligation, resulting in delays, additional costs or the restriction of proceeds from the sale.
U.S. government obligations risk. The Fund may invest in obligations issued by U.S. government agencies and instrumentalities that may receive varying levels of support from the government, which could affect the Fund’s ability to recover should they default.
About indexes used in this report
The Barclays Capital U.S. Aggregate Index is an unmanaged index considered representative of the U.S. investment-grade, fixed-rate bond market.
The Barclays Capital U.S. Government Index is an unmanaged index considered representative of fixed-income obligations
issued by the U.S. Treasury, government agencies and quasi-federal corporations.
The Lipper VUF General U.S. Government Funds Index is an unmanaged index considered representative of general U.S. government variable insurance underlying funds tracked by Lipper.
The Fund is not managed to track the performance of any particular index, including the index(es) defined here, and consequently, the performance of the Fund may deviate significantly from the performance of the index(es).
A direct investment cannot be made in an index. Unless otherwise indicated, index results include reinvested dividends, and they do not reflect sales charges. Performance of the peer group, if applicable, reflects fund expenses; performance of a market index does not.
Other information
The Chartered Financial Analyst® (CFA®) designation is globally recognized and attests to a charterholder’s success in a rigorous and comprehensive study program in the field of investment management and research analysis.
The returns shown in management’s discussion of Fund performance are based on net asset values calculated for shareholder transactions. Generally accepted accounting principles require adjustments to be made to the net assets of the Fund at period end for financial reporting purposes, and as such, the net asset values for shareholder transactions and the returns based on those net asset values may differ from the net asset values and returns reported in the Financial Highlights. Additionally, the returns and net asset values shown throughout this report are at the Fund level only and do not include variable product issuer charges. If such charges were included, the total returns would be lower.
Invesco V.I. Government Securities Fund
Schedule of Investments
December 31, 2011
| | | | | | | | | |
| | | Principal
| | |
| | | Amount | | Value |
| |
U.S. Government Sponsored Mortgage-Backed Securities–73.50%
|
Collateralized Mortgage Obligations–39.13%
| | | | |
| Fannie Mae Grantor Trust, 5.34%, 04/25/12 | | $ | 4,500,000 | | | $ | 4,544,383 | |
| |
| Fannie Mae REMICs, | | | | | | | | |
4.50%, 11/25/16 to 07/25/27 | | | 12,706,358 | | | | 13,167,504 | |
| |
4.00%, 07/25/18 to 07/25/40 | | | 20,213,517 | | | | 21,342,287 | |
| |
5.00%, 08/25/19 to 09/25/37 | | | 35,162,507 | | | | 37,276,339 | |
| |
4.25%, 12/25/19 to 02/25/37 | | | 16,336,233 | | | | 17,390,999 | |
| |
3.00%, 07/25/22 to 09/25/36 | | | 18,820,962 | | | | 19,449,660 | |
| |
| 2.50%, 03/25/26 | | | 6,013,337 | | | | 6,177,361 | |
| |
| 7.00%, 09/18/27 | | | 998,613 | | | | 1,148,313 | |
| |
6.50%, 01/25/30 to 03/25/32 | | | 3,450,499 | | | | 3,930,089 | |
| |
| 3.50%, 12/25/31 | | | 3,432,555 | | | | 3,531,492 | |
| |
| 4.75%, 07/25/33 | | | 6,519,329 | | | | 6,738,433 | |
| |
| 5.75%, 10/25/35 | | | 1,273,358 | | | | 1,437,706 | |
| |
0.59%, 05/25/36(a) | | | 12,877,173 | | | | 12,839,762 | |
| |
6.58%, 06/25/39(a) | | | 10,360,931 | | | | 12,269,507 | |
| |
| Fannie Mae Whole Loans, 5.50%, 07/25/34 | | | 956,150 | | | | 973,122 | |
| |
| Federal Home Loan Bank, | | | | | | | | |
| 4.55%, 04/27/12 | | | 920,393 | | | | 930,777 | |
| |
| 5.27%, 12/28/12 | | | 10,237,680 | | | | 10,607,036 | |
| |
| 5.07%, 10/20/15 | | | 2,121,106 | | | | 2,306,215 | |
| |
| 5.46%, 11/27/15 | | | 30,374,534 | | | | 33,786,815 | |
| |
| 5.77%, 03/23/18 | | | 5,098,739 | | | | 5,683,916 | |
| |
| Freddie Mac REMICs, | | | | | | | | |
| 0.85%, 03/15/13 | | | 2,725,461 | | | | 2,725,907 | |
| |
4.75%, 07/15/14 to 05/15/23 | | | 1,779,402 | | | | 1,801,464 | |
| |
3.50%, 10/15/16 to 12/15/27 | | | 3,359,027 | | | | 3,441,550 | |
| |
| 4.38%, 05/15/17 | | | 642,150 | | | | 650,738 | |
| |
| 4.16%, 07/15/17 | | | 762,928 | | | | 773,790 | |
| |
| 3.77%, 09/15/17 | | | 783,328 | | | | 797,912 | |
| |
| 3.84%, 09/15/17 | | | 1,099,761 | | | | 1,121,312 | |
| |
4.50%, 10/15/17 to 10/15/36 | | | 15,634,965 | | | | 16,131,172 | |
| |
4.00%, 12/15/17 to 03/15/38 | | | 21,554,042 | | | | 22,430,372 | |
| |
5.00%, 02/15/18 to 09/15/32 | | | 17,432,455 | | | | 18,373,846 | |
| |
3.00%, 10/15/18 to 04/15/26 | | | 18,390,634 | | | | 19,066,053 | |
| |
| 3.75%, 10/15/18 | | | 5,910,777 | | | | 6,121,914 | |
| |
| 4.25%, 01/15/19 | | | 1,263,295 | | | | 1,305,666 | |
| |
0.68%, 04/15/28 to 06/15/37(a) | | | 19,441,952 | | | | 19,418,494 | |
| |
5.50%, 10/15/28 to 02/15/33 | | | 3,579,642 | | | | 3,611,260 | |
| |
| 6.00%, 09/15/29 | | | 178,646 | | | | 178,591 | |
| |
| 5.25%, 08/15/32 | | | 7,654,109 | | | | 7,933,899 | |
| |
0.58%, 03/15/36(a) | | | 12,628,318 | | | | 12,613,177 | |
| |
| 5.75%, 05/15/36 | | | 1,252,389 | | | | 1,314,070 | |
| |
0.62%, 11/15/36(a) | | | 12,688,846 | | | | 12,717,154 | |
| |
1.14%, 11/15/39(a) | | | 5,815,681 | | | | 5,872,528 | |
| |
| Ginnie Mae REMICs, | | | | | | | | |
| 6.00%, 01/16/25 | | | 2,843,803 | | | | 3,171,499 | |
| |
5.00%, 09/16/27 to 08/16/35 | | | 5,137,001 | | | | 5,504,944 | |
| |
4.50%, 01/16/31 to 08/20/35 | | | 59,860,077 | | | | 62,593,606 | |
| |
| 5.50%, 04/16/31 | | | 642,205 | | | | 643,417 | |
| |
| 4.75%, 09/20/32 | | | 2,101,089 | | | | 2,210,785 | |
| |
4.00%, 04/16/33 to 02/20/38 | | | 28,155,374 | | | | 29,458,834 | |
| |
5.76%, 08/20/34(a) | | | 3,889,410 | | | | 4,410,013 | |
| |
5.84%, 01/20/39(a) | | | 11,564,465 | | | | 13,192,470 | |
| |
| | | | | | | | 495,118,153 | |
| |
Federal Deposit Insurance Company (FDIC)–0.09%
| | | | |
Series 2010-S1, Class 1A, Floating Rate Pass Through Ctfs., 0.82%, 02/25/48 (Acquired 03/05/10; Cost $1,191,682)(a)(c) | | | 1,191,682 | | | | 1,190,434 | |
| |
Federal Home Loan Mortgage Corp. (FHLMC)–10.49%
| | | | |
| Pass Through Ctfs., | | | | | | | | |
6.50%, 10/01/12 to 12/01/35 | | | 12,131,268 | | | | 13,725,990 | |
| |
6.00%, 09/01/13 to 07/01/38 | | | 6,914,630 | | | | 7,586,360 | |
| |
7.00%, 07/01/14 to 12/01/37 | | | 12,535,923 | | | | 14,517,209 | |
| |
8.00%, 07/01/15 to 09/01/36 | | | 11,549,160 | | | | 13,822,198 | |
| |
7.50%, 03/01/16 to 08/01/36 | | | 4,531,939 | | | | 5,365,191 | |
| |
5.00%, 07/01/18 to 01/01/40 | | | 6,746,792 | | | | 7,296,578 | |
| |
| 10.50%, 08/01/19 | | | 3,032 | | | | 3,406 | |
| |
4.50%, 09/01/20 to 08/01/41 | | | 28,820,057 | | | | 30,828,008 | |
| |
8.50%, 09/01/20 to 08/01/31 | | | 941,579 | | | | 1,122,768 | |
| |
| 10.00%, 03/01/21 | | | 59,690 | | | | 70,307 | |
| |
9.00%, 06/01/21 to 06/01/22 | | | 420,350 | | | | 481,698 | |
| |
5.50%, 12/01/22 to 11/01/39 | | | 3,628,123 | | | | 3,954,754 | |
| |
| 3.50%, 08/01/26 | | | 2,897,043 | | | | 3,053,052 | |
| |
| 7.05%, 05/20/27 | | | 313,510 | | | | 360,867 | |
| |
| 6.03%, 10/20/30 | | | 1,963,262 | | | | 2,259,514 | |
| |
| Pass Through Ctfs., ARM | | | | | | | | |
2.66%, 10/01/36(a) | | | 640,120 | | | | 680,856 | |
| |
5.46%, 01/01/38(a) | | | 353,577 | | | | 377,304 | |
| |
Pass Through Ctfs., TBA, 4.00%, 01/01/42(b) | | | 26,000,000 | | | | 27,275,625 | |
| |
| | | | | | | | 132,781,685 | |
| |
| | | | | | | | | |
| | | | | | | | | |
See accompanying Notes to Financial Statements which are an integral part of the financial statements.
Invesco V.I. Government Securities Fund
| | | | | | | | | |
| | | Principal
| | |
| | | Amount | | Value |
| |
Federal National Mortgage Association (FNMA)–20.28%
| | | | |
| Pass Through Ctfs., | | | | | | | | |
8.00%, 06/01/12 to 11/01/37 | | $ | 12,000,550 | | | $ | 14,220,642 | |
| |
8.50%, 06/01/12 to 08/01/37 | | | 4,719,003 | | | | 5,614,803 | |
| |
7.50%, 09/01/12 to 08/01/37 | | | 14,441,308 | | | | 17,092,591 | |
| |
6.50%, 05/01/13 to 04/01/38 | | | 14,452,098 | | | | 16,096,382 | |
| |
| 10.00%, 09/01/13 | | | 6,687 | | | | 6,789 | |
| |
6.00%, 01/01/14 to 10/01/38 | | | 13,593,478 | | | | 15,038,619 | |
| |
7.00%, 01/15/14 to 06/01/36 | | | 17,691,825 | | | | 19,976,969 | |
| |
5.00%, 11/01/17 to 03/01/40 | | | 41,421,436 | | | | 44,859,720 | |
| |
4.50%, 09/01/18 to 08/01/41 | | | 56,731,963 | | | | 61,007,673 | |
| |
5.50%, 03/01/21 to 08/01/38 | | | 17,285,322 | | | | 18,899,221 | |
| |
| 6.75%, 07/01/24 | | | 1,014,260 | | | | 1,153,715 | |
| |
| 6.95%, 10/01/25 | | | 56,880 | | | | 65,775 | |
| |
| Pass Through Ctfs., ARM, | | | | | | | | |
2.40%, 05/01/35(a) | | | 1,147,538 | | | | 1,209,076 | |
| |
4.73%, 03/01/38(a) | | | 230,809 | | | | 246,632 | |
| |
| Pass Through Ctfs., Balloon, 3.84%, 04/01/18 | | | 6,600,000 | | | | 7,153,949 | |
| |
| Pass Through Ctfs., TBA, | | | | | | | | |
4.00%, 01/01/27(b) | | | 5,825,000 | | | | 6,144,465 | |
| |
3.50%, 01/01/42(b) | | | 27,000,000 | | | | 27,776,250 | |
| |
| | | | | | | | 256,563,271 | |
| |
Government National Mortgage Association (GNMA)–3.51%
| | | | |
| Pass Through Ctfs., | | | | | | | | |
6.50%, 02/20/12 to 01/15/37 | | | 11,550,301 | | | | 13,217,450 | |
| |
8.00%, 07/15/12 to 01/15/37 | | | 3,592,484 | | | | 4,250,542 | |
| |
| 6.75%, 08/15/13 | | | 11,092 | | | | 11,602 | |
| |
7.50%, 10/15/14 to 10/15/35 | | | 6,127,808 | | | | 7,081,317 | |
| |
| 11.00%, 10/15/15 | | | 1,560 | | | | 1,572 | |
| |
9.00%, 10/20/16 to 12/20/16 | | | 79,183 | | | | 80,932 | |
| |
7.00%, 04/15/17 to 01/15/37 | | | 4,526,272 | | | | 5,257,917 | |
| |
10.50%, 09/15/17 to 11/15/19 | | | 3,141 | | | | 3,163 | |
| |
8.50%, 12/15/17 to 01/15/37 | | | 673,979 | | | | 776,206 | |
| |
| 10.00%, 06/15/19 | | | 26,486 | | | | 29,801 | |
| |
6.00%, 09/15/20 to 08/15/33 | | | 1,804,608 | | | | 2,041,089 | |
| |
| 5.00%, 02/15/25 | | | 758,430 | | | | 850,532 | |
| |
6.95%, 08/20/25 to 08/20/27 | | | 695,529 | | | | 803,428 | |
| |
6.38%, 10/20/27 to 09/20/28 | | | 703,604 | | | | 799,346 | |
| |
| 6.10%, 12/20/33 | | | 7,862,012 | | | | 9,176,943 | |
| |
| | | | | | | | 44,381,840 | |
| |
Total U.S. Government Sponsored Mortgage-Backed
Securities (Cost $905,451,422) | | | 930,035,383 | |
| |
U.S. Government Sponsored Agency Securities–13.69%
|
Federal Agricultural Mortgage Corp.–4.45%
| | | | |
| Medium-Term Notes, 2.11%, 03/15/12 | | | 37,000,000 | | | | 37,151,009 | |
| |
| Sr. Unsec. Notes, 2.00%, 07/27/16 | | | 4,000,000 | | | | 4,103,684 | |
| |
| Unsec. Medium-Term Notes, | | | | | | | | |
| 1.25%, 12/06/13 | | | 8,000,000 | | | | 8,099,978 | |
| |
| 0.85%, 08/11/14 | | | 7,000,000 | | | | 6,987,767 | |
| |
| | | | | | | | 56,342,438 | |
| |
Federal Farm Credit Bank (FFCB)–4.09%
| | | | |
| Bonds, | | | | | | | | |
| 1.13%, 02/27/14 | | | 13,000,000 | | | | 13,183,863 | |
| |
| 3.00%, 09/22/14 | | | 5,000,000 | | | | 5,318,910 | |
| |
| 1.63%, 11/19/14 | | | 4,800,000 | | | | 4,941,364 | |
| |
| 1.50%, 11/16/15 | | | 11,000,000 | | | | 11,270,116 | |
| |
| 5.75%, 01/18/22 | | | 2,775,000 | | | | 2,780,811 | |
| |
| Global Bonds, 1.38%, 06/25/13 | | | 10,000,000 | | | | 10,161,764 | |
| |
| Medium-Term Notes, 5.75%, 12/07/28 | | | 3,100,000 | | | | 4,095,608 | |
| |
| | | | | | | | 51,752,436 | |
| |
Federal Home Loan Bank (FHLB)–0.40%
| | | | |
| Unsec. Global Bonds, 1.88%, 06/21/13 | | | 5,000,000 | | | | 5,119,701 | |
| |
Federal Home Loan Mortgage Corp. (FHLMC)–1.46%
| | | | |
| Unsec. Global Notes, | | | | | | | | |
| 0.63%, 12/29/14 | | | 5,000,000 | | | | 5,008,170 | |
| |
| 1.75%, 09/10/15 | | | 6,500,000 | | | | 6,725,893 | |
| |
| 2.00%, 08/25/16 | | | 6,500,000 | | | | 6,773,388 | |
| |
| | | | | | | | 18,507,451 | |
| |
Federal National Mortgage Association (FNMA)–2.33%
| | | | |
| Sr. Unsec. Global Notes, | | | | | | | | |
| 2.50%, 05/15/14 | | | 4,875,000 | | | | 5,104,674 | |
| |
| 0.75%, 12/19/14 | | | 10,000,000 | | | | 10,049,619 | |
| |
| Unsec. Global Notes, | | | | | | | | |
| 3.00%, 09/16/14 | | | 7,500,000 | | | | 7,988,177 | |
| |
| 2.38%, 04/11/16 | | | 6,000,000 | | | | 6,351,710 | |
| |
| | | | | | | | 29,494,180 | |
| |
Financing Corp (FICO)–0.32%
| | | | |
| Sec. Bonds, 9.80%, 04/06/18 | | | 700,000 | | | | 1,031,487 | |
| |
| Series E, Sec. Bonds, 9.65%, 11/02/18 | | | 1,985,000 | | | | 2,954,139 | |
| |
| | | | | | | | 3,985,626 | |
| |
Tennessee Valley Authority (TVA)–0.64%
| | | | |
| Global Notes, 5.50%, 07/18/17 | | | 2,420,000 | | | | 2,948,953 | |
| |
| Series A, Bonds, 6.79%, 05/23/12 | | | 5,000,000 | | | | 5,130,427 | |
| |
| | | | | | | | 8,079,380 | |
| |
| Total U.S. Government Sponsored Agency Securities (Cost $168,919,668) | | | 173,281,212 | |
| |
| | | | | | | | | |
| | | | | | | | | |
See accompanying Notes to Financial Statements which are an integral part of the financial statements.
Invesco V.I. Government Securities Fund
| | | | | | | | | |
| | | Principal
| | |
| | | Amount | | Value |
| |
U.S. Treasury Securities–12.42%
|
U.S. Treasury Notes–8.38%
| | | | |
| 0.75%, 06/15/14 | | $ | 7,000,000 | | | $ | 7,075,469 | |
| |
| 2.38%, 10/31/14 | | | 450,000 | | | | 475,383 | |
| |
| 0.38%, 11/15/14 | | | 20,000,000 | | | | 20,015,625 | |
| |
| 2.13%, 11/30/14 | | | 150,000 | | | | 157,570 | |
| |
| 2.25%, 01/31/15 | | | 3,500,000 | | | | 3,697,422 | |
| |
| 1.25%, 08/31/15 | | | 3,000,000 | | | | 3,080,156 | |
| |
| 2.00%, 01/31/16 | | | 1,200,000 | | | | 1,266,188 | |
| |
| 1.00%, 10/31/16 | | | 9,000,000 | | | | 9,087,187 | |
| |
| 0.88%, 11/30/16 | | | 8,000,000 | | | | 8,025,000 | |
| |
2.75%, 05/31/17(d) | | | 10,000,000 | | | | 10,943,750 | |
| |
2.38%, 07/31/17(d) | | | 10,000,000 | | | | 10,750,000 | |
| |
| 3.13%, 05/15/21 | | | 1,000,000 | | | | 1,116,563 | |
| |
| 2.13%, 08/15/21 | | | 5,000,000 | | | | 5,127,344 | |
| |
| 2.00%, 11/15/21 | | | 25,000,000 | | | | 25,285,156 | |
| |
| | | | | | | | 106,102,813 | |
| |
U.S. Treasury Bonds–3.02%
| | | | |
| 8.75%, 05/15/20 | | | 3,500,000 | | | | 5,480,781 | |
| |
| 7.88%, 02/15/21 | | | 1,100,000 | | | | 1,678,875 | |
| |
| 7.50%, 11/15/24 | | | 4,370,000 | | | | 6,975,612 | |
| |
| 7.63%, 02/15/25 | | | 550,000 | | | | 889,453 | |
| |
| 5.38%, 02/15/31 | | | 3,800,000 | | | | 5,417,969 | |
| |
4.25%, 05/15/39(d) | | | 3,685,000 | | | | 4,684,556 | |
| |
| 4.38%, 11/15/39 | | | 3,000,000 | | | | 3,891,563 | |
| |
| 4.63%, 02/15/40 | | | 2,700,000 | | | | 3,638,672 | |
| |
| 4.75%, 02/15/41 | | | 4,000,000 | | | | 5,508,125 | |
| |
| | | | | | | | 38,165,606 | |
| |
U.S. Treasury Inflation–Indexed Bonds–1.02%
| | | | |
| 0.63%, 07/15/21 | | | 12,056,880(e | ) | | | 12,895,210 | |
| |
| Total U.S. Treasury Securities (Cost $147,379,988) | | | | | | | 157,163,629 | |
| |
Foreign Bonds–2.63%
|
Sovereign Debt–0.38%
| | | | |
| Israel Government Agency for International Development (AID) Bond (Israel), Gtd. Bonds, 5.13%, 11/01/24 | | | 3,800,000 | | | | 4,767,548 | |
| |
Panama–2.25%
| | | | |
La Hipotecaria S.A. (Panama), Series 2010-1 GA, Class A, Floating Rate Pass Through Ctfs., 3.50%, 09/08/39 (Acquired 11/05/10; Cost $28,363,176)(a)(c) | | | 27,453,770 | | | | 28,448,968 | |
| |
| Total Foreign Bonds (Cost $32,171,695) | | | | | | | 33,216,516 | |
| |
Corporate Bonds and Notes–1.29%
|
Diversified Banks–0.52%
| | | | |
| Ally Financial, Inc., Gtd. Notes, 2.20%, 12/19/12 | | | 1,700,000 | | | | 1,733,105 | |
| |
| Citibank N.A., Sr. Unsec. Gtd. Notes, 1.75%, 12/28/12 | | | 2,500,000 | | | | 2,537,418 | |
| |
| U.S. Central Federal Credit Union, Unsec. Gtd. Notes, 1.90%, 10/19/12 | | | 2,260,000 | | | | 2,291,123 | |
| |
| | | | | | | | 6,561,646 | |
| |
Industrial Conglomerates–0.22%
| | | | |
| General Electric Capital Corp., Series G, Sr. Unsec. Gtd. Medium-Term Global Notes, 2.63%, 12/28/12 | | | 2,800,000 | | | | 2,867,554 | |
| |
Private Export Funding Corp.–0.55%
| | | | |
| Sec. Gtd. Notes, | | | | | | | | |
| 2.13%, 07/15/16 | | | 5,000,000 | | | | 5,178,164 | |
| |
| 4.30%, 12/15/21 | | | 1,540,000 | | | | 1,770,426 | |
| |
| | | | | | | | 6,948,590 | |
| |
| Total Corporate Bonds and Notes (Cost $15,817,224) | | | | | | | 16,377,790 | |
| |
| | | | | | | | | |
| | | Shares | | |
Money Market Funds–1.11%
|
Government & Agency Portfolio–Institutional Class (Cost $13,989,842)(f) | | | 13,989,842 | | | | 13,989,842 | |
| |
| TOTAL INVESTMENTS–104.64% (Cost $1,283,729,839) | | | | | | | 1,324,064,372 | |
| |
| OTHER ASSETS LESS LIABILITIES–(4.64)% | | | | | | | (58,717,799 | ) |
| |
| NET ASSETS–100.00% | | | | | | $ | 1,265,346,573 | |
| |
Investment Abbreviations:
| | | |
| ARM | | – Adjustable Rate Mortgage |
| Ctfs. | | – Certificates |
| Gtd. | | – Guaranteed |
| REMIC | | – Real Estate Mortgage Investment Conduits |
| Sec. | | – Secured |
| Sr. | | – Senior |
| TBA | | – To Be Announced |
| Unsec. | | – Unsecured |
Notes to Schedule of Investments:
| | |
| (a) | | Interest or dividend rate is redetermined periodically. Rate shown is the rate in effect on December 31, 2011. |
| (b) | | Security purchased on a forward commitment basis. This security is subject to dollar roll transactions. See Note 1J. |
| (c) | | Security purchased or received in a transaction exempt from registration under the Securities Act of 1933, as amended. The security may be resold pursuant to an exemption from registration under the 1933 Act, typically to qualified institutional buyers. The aggregate value of these securities at December 31, 2011 was $29,639,402, which represented 2.34% of the Fund’s Net Assets. |
| (d) | | All or a portion of the value was pledged as collateral to cover margin requirements for open futures contracts. See Note 1L and Note 4. |
| (e) | | Principal amount of security and interest payments are adjusted for inflation. |
| (f) | | The money market fund and the Fund are affiliated by having the same investment adviser. |
See accompanying Notes to Financial Statements which are an integral part of the financial statements.
Invesco V.I. Government Securities Fund
Statement of Assets and Liabilities
December 31, 2011
| | | | | |
Assets:
|
| Investments, at value (Cost $1,269,739,997) | | $ | 1,310,074,530 | |
| |
| Investments in affiliated money market funds, at value and cost | | | 13,989,842 | |
| |
| Total investments, at value (Cost $1,283,729,839) | | | 1,324,064,372 | |
| |
| Cash | | | 64,336 | |
| |
| Receivable for: | | | | |
| Variation margin | | | 967,485 | |
| |
| Fund shares sold | | | 299,336 | |
| |
| Dividends and interest | | | 4,703,424 | |
| |
| Principal paydowns | | | 150,077 | |
| |
| Investment for trustee deferred compensation and retirement plans | | | 59,953 | |
| |
| Other assets | | | 19,641 | |
| |
| Total assets | | | 1,330,328,624 | |
| |
| | | | | |
| | | | | |
Liabilities:
|
| Payable for: | | | | |
| Investments purchased | | | 60,823,351 | |
| |
| Fund shares reacquired | | | 2,869,605 | |
| |
| Accrued fees to affiliates | | | 1,009,587 | |
| |
| Accrued other operating expenses | | | 91,885 | |
| |
| Trustee deferred compensation and retirement plans | | | 187,623 | |
| |
| Total liabilities | | | 64,982,051 | |
| |
| Net assets applicable to shares outstanding | | $ | 1,265,346,573 | |
| |
| | | | | |
| | | | | |
Net assets consist of:
|
| Shares of beneficial interest | | $ | 1,198,490,336 | |
| |
| Undistributed net investment income | | | 35,365,149 | |
| |
| Undistributed net realized gain | | | (10,184,603 | ) |
| |
| Unrealized appreciation | | | 41,675,691 | |
| |
| | | $ | 1,265,346,573 | |
| |
| | | | | |
| | | | | |
Net Assets:
|
| Series I | | $ | 970,028,967 | |
| |
| Series II | | $ | 295,317,606 | |
| |
| | | | | |
| | | | | |
Shares outstanding, $0.001 par value per share, with an unlimited number of shares authorized:
|
| Series I | | | 77,641,599 | |
| |
| Series II | | | 23,829,742 | |
| |
| Series I: | | | | |
| Net asset value per share | | $ | 12.49 | |
| |
| Series II: | | | | |
| Net asset value per share | | $ | 12.39 | |
| |
Statement of Operations
For the year ended December 31, 2011
| | | | | |
Investment income:
|
| Interest | | $ | 33,067,104 | |
| |
| Dividends from affiliated money market funds | | | 5,182 | |
| |
| Total investment income | | | 33,072,286 | |
| |
| | | | | |
| | | | | |
Expenses:
|
| Advisory fees | | | 5,702,112 | |
| |
| Administrative services fees | | | 3,324,390 | |
| |
| Custodian fees | | | 65,041 | |
| |
| Distribution fees — Series II | | | 511,963 | |
| |
| Transfer agent fees | | | 29,622 | |
| |
| Trustees’ and officers’ fees and benefits | | | 74,352 | |
| |
| Other | | | 129,421 | |
| |
| Total expenses | | | 9,836,901 | |
| |
| Less: Fees waived and expense offset arrangement(s) | | | (1,429,118 | ) |
| |
| Net expenses | | | 8,407,783 | |
| |
| Net investment income | | | 24,664,503 | |
| |
| | | | | |
| | | | | |
Realized and unrealized gain from:
|
| Net realized gain from: | | | | |
| Investment securities | | | 5,705,758 | |
| |
| Futures contracts | | | 45,162,306 | |
| |
| | | | 50,868,064 | |
| |
| Change in net unrealized appreciation of: | | | | |
| Investment securities | | | 15,226,003 | |
| |
| Futures contracts | | | 7,923,699 | |
| |
| | | | 23,149,702 | |
| |
| Net realized and unrealized gain | | | 74,017,766 | |
| |
| Net increase in net assets resulting from operations | | $ | 98,682,269 | |
| |
See accompanying Notes to Financial Statements which are an integral part of the financial statements.
Invesco V.I. Government Securities Fund
Statement of Changes in Net Assets
For the years ended December 31, 2011 and 2010
| | | | | | | | | |
| | | 2011 | | 2010 |
| |
Operations:
|
| Net investment income | | $ | 24,664,503 | | | $ | 23,688,971 | |
| |
| Net realized gain | | | 50,868,064 | | | | 32,820,078 | |
| |
| Change in net unrealized appreciation | | | 23,149,702 | | | | 7,306,223 | |
| |
| Net increase in net assets resulting from operations | | | 98,682,269 | | | | 63,815,272 | |
| |
Distributions to shareholders from net investment income:
|
| Series I | | | (36,635,024 | ) | | | (54,918,096 | ) |
| |
| Series II | | | (1,001,427 | ) | | | (859,253 | ) |
| |
| Total distributions from net investment income | | | (37,636,451 | ) | | | (55,777,349 | ) |
| |
Share transactions–net:
|
| Series I | | | (145,217,239 | ) | | | (128,842,349 | ) |
| |
| Series II | | | 253,038,769 | | | | 9,854,940 | |
| |
| Net increase (decrease) in net assets resulting from share transactions | | | 107,821,530 | | | | (118,987,409 | ) |
| |
| Net increase (decrease) in net assets | | | 168,867,348 | | | | (110,949,486 | ) |
| |
Net assets:
|
| Beginning of year | | | 1,096,479,225 | | | | 1,207,428,711 | |
| |
| End of year (includes undistributed net investment income of $35,365,149 and $37,474,465, respectively) | | $ | 1,265,346,573 | | | $ | 1,096,479,225 | |
| |
Notes to Financial Statements
December 31, 2011
NOTE 1—Significant Accounting Policies
Invesco V.I. Government Securities Fund (the “Fund”) is a series portfolio of AIM Variable Insurance Funds (Invesco Variable Insurance Funds) (the “Trust”). The Trust is a Delaware statutory trust registered under the Investment Company Act of 1940, as amended (the “1940 Act”), as an open-end series management investment company consisting of twenty-eight separate portfolios, (each constituting a “Fund”). The assets, liabilities and operations of each portfolio are accounted for separately. Information presented in these financial statements pertains only to the Fund. Matters affecting each Fund or class will be voted on exclusively by the shareholders of such Fund or class. Current Securities and Exchange Commission (“SEC”) guidance, however, requires participating insurance companies offering separate accounts to vote shares proportionally in accordance with the instructions of the contract owners whose investments are funded by shares of each Fund or class.
The Fund’s investment objective is total return, comprised of current income and capital appreciation.
The Fund currently offers two classes of shares, Series I and Series II, both of which are offered to insurance company separate accounts funding variable annuity contracts and variable life insurance policies (“variable products”).
The following is a summary of the significant accounting policies followed by the Fund in the preparation of its financial statements.
| | |
| A. | | Security Valuations — Securities, including restricted securities, are valued according to the following policy. |
| | Debt obligations (including convertible bonds) and unlisted equities are fair valued using an evaluated quote provided by an independent pricing service. Evaluated quotes provided by the pricing service may be determined without exclusive reliance on quoted prices, and may reflect appropriate factors such as institution-size trading in similar groups of securities, developments related to specific securities, dividend rate, yield, quality, type of issue, coupon rate, maturity, individual trading characteristics and other market data. Debt securities are subject to interest rate and credit risks. In addition, all debt securities involve some risk of default with respect to interest and/or principal payments. |
| | A security listed or traded on an exchange (except convertible bonds) is valued at its last sales price or official closing price as of the close of the customary trading session on the exchange where the security is principally traded, or lacking any sales or official closing price on a particular day, the security may be valued at the closing bid price on that day. Securities traded in the over-the-counter market are valued based on prices furnished by independent pricing services or market makers. When such securities are valued by an independent pricing service they may be considered fair valued. Futures contracts are valued at the final settlement price set by an exchange on which they are principally traded. Listed options are valued at the mean between the last bid and ask prices from the exchange on which they are principally traded. Options not listed on an exchange are valued by an independent source at the mean between the last bid and ask prices. For purposes of determining net asset value per share, futures and option contracts generally are valued 15 minutes after the close of the customary trading session of the New York Stock Exchange (“NYSE”). |
Invesco V.I. Government Securities Fund
| | |
| | Investments in open-end and closed-end registered investment companies that do not trade on an exchange are valued at the end of day net asset value per share. Investments in open-end and closed-end registered investment companies that trade on an exchange are valued at the last sales price or official closing price as of the close of the customary trading session on the exchange where the security is principally traded. |
| | Foreign securities (including foreign exchange contracts) are converted into U.S. dollar amounts using the applicable exchange rates as of the close of the NYSE. If market quotations are available and reliable for foreign exchange traded equity securities, the securities will be valued at the market quotations. Because trading hours for certain foreign securities end before the close of the NYSE, closing market quotations may become unreliable. If between the time trading ends on a particular security and the close of the customary trading session on the NYSE, events occur that are significant and make the closing price unreliable, the Fund may fair value the security. If the event is likely to have affected the closing price of the security, the security will be valued at fair value in good faith using procedures approved by the Board of Trustees. Adjustments to closing prices to reflect fair value may also be based on a screening process of an independent pricing service to indicate the degree of certainty, based on historical data, that the closing price in the principal market where a foreign security trade is not the current value as of the close of the NYSE. Foreign securities meeting the approved degree of certainty that the price is not reflective of current value will be priced at the indication of fair value from the independent pricing service. Multiple factors may be considered by the independent pricing service in determining adjustments to reflect fair value and may include information relating to sector indices, American Depositary Receipts and domestic and foreign index futures. Foreign securities may have additional risks including exchange rate changes, potential for sharply devalued currencies and high inflation, political and economic upheaval, the relative lack of issuer information, relatively low market liquidity and the potential lack of strict financial and accounting controls and standards. |
| | Securities for which market prices are not provided by any of the above methods may be valued based upon quotes furnished by independent sources. The last bid price may be used to value equity securities. The mean between the last bid and asked prices is used to value debt obligations, including Corporate Loans. |
| | Securities for which market quotations are not readily available or are unreliable are valued at fair value as determined in good faith by or under the supervision of the Trust’s officers following procedures approved by the Board of Trustees. Issuer specific events, market trends, bid/ask quotes of brokers and information providers and other market data may be reviewed in the course of making a good faith determination of a security’s fair value. |
| | Valuations change in response to many factors including the historical and prospective earnings of the issuer, the value of the issuer’s assets, general economic conditions, interest rates, investor perceptions and market liquidity. Because of the inherent uncertainties of valuation, the values reflected in the financial statements may materially differ from the value received upon actual sale of those investments. |
| B. | | Securities Transactions and Investment Income — Securities transactions are accounted for on a trade date basis. Realized gains or losses on sales are computed on the basis of specific identification of the securities sold. Interest income is recorded on the accrual basis from settlement date. Paydown gains and losses on mortgage and asset-backed securities are recorded as adjustments to interest income. Dividend income (net of withholding tax, if any) is recorded on the ex-dividend date. Bond premiums and discounts are amortized and/or accreted for financial reporting purposes. |
| | The Fund may periodically participate in litigation related to Fund investments. As such, the Fund may receive proceeds from litigation settlements. Any proceeds received are included in the Statement of Operations as realized gain (loss) for investments no longer held and as unrealized gain (loss) for investments still held. |
| | Brokerage commissions and mark ups are considered transaction costs and are recorded as an increase to the cost basis of securities purchased and/or a reduction of proceeds on a sale of securities. Such transaction costs are included in the determination of net realized and unrealized gain (loss) from investment securities reported in the Statement of Operations and the Statement of Changes in Net Assets and the net realized and unrealized gains (losses) on securities per share in the Financial Highlights. Transaction costs are included in the calculation of the Fund’s net asset value and, accordingly, they reduce the Fund’s total returns. These transaction costs are not considered operating expenses and are not reflected in net investment income reported in the Statement of Operations and Statement of Changes in Net Assets, or the net investment income per share and ratios of expenses and net investment income reported in the Financial Highlights, nor are they limited by any expense limitation arrangements between the Fund and the investment adviser. |
| | The Fund allocates income and realized and unrealized capital gains and losses to a class based on the relative net assets of each class. |
| C. | | Country Determination — For the purposes of making investment selection decisions and presentation in the Schedule of Investments, the investment adviser may determine the country in which an issuer is located and/or credit risk exposure based on various factors. These factors include the laws of the country under which the issuer is organized, where the issuer maintains a principal office, the country in which the issuer derives 50% or more of its total revenues and the country that has the primary market for the issuer’s securities, as well as other criteria. Among the other criteria that may be evaluated for making this determination are the country in which the issuer maintains 50% or more of its assets, the type of security, financial guarantees and enhancements, the nature of the collateral and the sponsor organization. Country of issuer and/or credit risk exposure has been determined to be the United States of America, unless otherwise noted. |
| D. | | Distributions — Distributions from income and net realized capital gain, if any, are generally paid to separate accounts of participating insurance companies annually and recorded on ex-dividend date. |
| E. | | Federal Income Taxes — The Fund intends to comply with the requirements of Subchapter M of the Internal Revenue Code necessary to qualify as a regulated investment company and to distribute substantially all of the Fund’s taxable earnings to shareholders. As such, the Fund will not be subject to federal income taxes on otherwise taxable income (including net realized capital gain) that is distributed to shareholders. Therefore, no provision for federal income taxes is recorded in the financial statements. |
| | The Fund files tax returns in the U.S. Federal jurisdiction and certain other jurisdictions. Generally, the Fund is subject to examinations by such taxing authorities for up to three years after the filing of the return for the tax period. |
| F. | | Expenses — Fees provided for under the Rule 12b-1 plan of a particular class of the Fund and which are directly attributable to that class are charged to the operations of such class. All other expenses are allocated among the classes based on relative net assets. |
| G. | | Accounting Estimates — The preparation of financial statements in conformity with accounting principles generally accepted in the United States of America (“GAAP”) requires management to make estimates and assumptions that affect the reported amounts of assets and liabilities at the date of the |
Invesco V.I. Government Securities Fund
| | |
| | financial statements and the reported amounts of revenues and expenses during the reporting period including estimates and assumptions related to taxation. Actual results could differ from those estimates by a significant amount. In addition, the Fund monitors for material events or transactions that may occur or become known after the period-end date and before the date the financial statements are released to print. |
| H. | | Indemnifications — Under the Trust’s organizational documents, each Trustee, officer, employee or other agent of the Trust is indemnified against certain liabilities that may arise out of performance of their duties to the Fund. Additionally, in the normal course of business, the Fund enters into contracts, including the Fund’s servicing agreements that contain a variety of indemnification clauses. The Fund’s maximum exposure under these arrangements is unknown as this would involve future claims that may be made against the Fund that have not yet occurred. The risk of material loss as a result of such indemnification claims is considered remote. |
| I. | | Other Risks — The Funds may invest in obligations issued by agencies and instrumentalities of the U.S. Government that may vary in the level of support they receive from the government. The government may choose not to provide financial support to government sponsored agencies or instrumentalities if it is not legally obligated to do so. In this case, if the issuer defaulted, the underlying fund holding securities of such issuer might not be able to recover its investment from the U.S. Government. Many securities purchased by the Fund are not guaranteed by the U.S. Government. |
| J. | | Dollar Rolls and Forward Commitment Transactions — The Fund may enter into dollar roll transactions to enhance the Fund’s performance. The Fund executes its dollar roll transactions in the to be announced (“TBA”) market whereby the Fund makes a forward commitment to purchase a security and, instead of accepting delivery, the position is offset by the sale of the security with a simultaneous agreement to repurchase at a future date. |
| | The Fund accounts for dollar roll transactions as purchases and sales and realizes gains and losses on these transactions. These transactions increase the Fund’s portfolio turnover rate. The Fund will segregate liquid assets in an amount equal to its dollar roll commitments. Dollar roll transactions are considered borrowings under the 1940 Act. |
| | Dollar roll transactions involve the risk that a counter-party to the transaction may fail to complete the transaction. If this occurs, the Fund may lose the opportunity to purchase or sell the security at the agreed upon price. Dollar rolls transactions also involve the risk that the value of the securities retained by the Fund may decline below the price of the securities that the Fund has sold but is obligated to purchase under the agreement. |
| K. | | Foreign Currency Translations — Foreign currency is valued at the close of the NYSE based on quotations posted by banks and major currency dealers. Portfolio securities and other assets and liabilities denominated in foreign currencies are translated into U.S. dollar amounts at date of valuation. Purchases and sales of portfolio securities (net of foreign taxes withheld on disposition) and income items denominated in foreign currencies are translated into U.S. dollar amounts on the respective dates of such transactions. The Fund does not separately account for the portion of the results of operations resulting from changes in foreign exchange rates on investments and the fluctuations arising from changes in market prices of securities held. The combined results of changes in foreign exchange rates and the fluctuation of market prices on investments (net of estimated foreign tax withholding) are included with the net realized and unrealized gain or loss from investments in the Statement of Operations. Reported net realized foreign currency gains or losses arise from (1) sales of foreign currencies, (2) currency gains or losses realized between the trade and settlement dates on securities transactions, and (3) the difference between the amounts of dividends, interest, and foreign withholding taxes recorded on the Fund’s books and the U.S. dollar equivalent of the amounts actually received or paid. Net unrealized foreign currency gains and losses arise from changes in the fair values of assets and liabilities, other than investments in securities at fiscal period end, resulting from changes in exchange rates. |
| | The Fund may invest in foreign securities which may be subject to foreign taxes on income, gains on investments or currency repatriation, a portion of which may be recoverable. |
| L. | | Futures Contracts — The Fund may enter into futures contracts to manage exposure to interest rate, equity and market price movements and/or currency risks. A futures contract is an agreement between two parties to purchase or sell a specified underlying security, currency or commodity (or delivery of a cash settlement price, in the case of an index future) for a fixed price at a future date. The Fund currently invests only in exchange-traded futures and they are standardized as to maturity date and underlying financial instrument. Initial margin deposits required upon entering into futures contracts are satisfied by the segregation of specific securities or cash as collateral at the futures commission merchant (broker). During the period the futures contracts are open, changes in the value of the contracts are recognized as unrealized gains or losses by recalculating the value of the contracts on a daily basis. Subsequent or variation margin payments are received or made depending upon whether unrealized gains or losses are incurred. These amounts are reflected as receivables or payables on the Statement of Assets and Liabilities. When the contracts are closed or expire, the Fund recognizes a realized gain or loss equal to the difference between the proceeds from, or cost of, the closing transaction and the Fund’s basis in the contract. The net realized gain (loss) and the change in unrealized gain (loss) on futures contracts held during the period is included on the Statement of Operations. The primary risks associated with futures contracts are market risk and the absence of a liquid secondary market. If the Fund were unable to liquidate a futures contract and/or enter into an offsetting closing transaction, the Fund would continue to be subject to market risk with respect to the value of the contracts and continue to be required to maintain the margin deposits on the futures contracts. Futures contracts have minimal counterparty risk since the exchange’s clearinghouse, as counterparty to all exchange-traded futures, guarantees the futures against default. Risks may exceed amounts recognized in the Statement of Assets and Liabilities. |
| M. | | Collateral — To the extent the Fund has pledged or segregated a security as collateral and that security is subsequently sold, it is the Fund’s practice to replace such collateral no later than the next business day. |
Invesco V.I. Government Securities Fund
NOTE 2—Advisory Fees and Other Fees Paid to Affiliates
The Trust has entered into a master investment advisory agreement with Invesco Advisers, Inc. (the “Adviser” or “Invesco”). Under the terms of the investment advisory agreement, the Fund pays an advisory fee to the Adviser based on the annual rate of the Fund’s average daily net assets as follows:
| | | | | |
| Average Daily Net Assets | | Rate |
| |
| First $250 million | | | 0 | .50% |
| |
| Over $250 million | | | 0 | .45% |
| |
Under the terms of a master sub-advisory agreement between the Adviser and each of Invesco Asset Management Deutschland GmbH, Invesco Asset Management Limited, Invesco Asset Management (Japan) Limited, Invesco Australia Limited, Invesco Hong Kong Limited, Invesco Senior Secured Management, Inc. and Invesco Canada Ltd. (collectively, the “Affiliated Sub-Advisers”) the Adviser, not the Fund, may pay 40% of the fees paid to the Adviser to any such Affiliated Sub-Adviser(s) that provide discretionary investment management services to the Fund based on the percentage of assets allocated to such Sub-Adviser(s).
Effective May 2, 2011, the Adviser has contractually agreed, through at least June 30, 2012, to waive advisory fees and/or reimburse expenses of all shares to the extent necessary to limit total annual fund operating expenses after fee waiver and/or expense reimbursement (excluding certain items discussed below) of Series I shares to 0.60% and Series II shares to 0.85% of average daily net assets. Prior to May 2, 2011, the Adviser had contractually agreed to waive advisory fees and/or reimburse expenses of all shares to the extent necessary to limit total annual fund operating expenses after fee waiver and/or expense reimbursement (excluding certain items discussed below) of Series I to 0.73% and Series II to 0.98% of average daily net assets. In determining the Adviser’s obligation to waive advisory fees and/or reimburse expenses, the following expenses are not taken into account, and could cause the total annual fund operating expenses after fee waiver and/or expense reimbursement to exceed the numbers reflected above: (1) interest; (2) taxes; (3) dividend expense on short sales; (4) extraordinary or non-routine items, including litigation expenses; and (5) expenses that the Fund has incurred but did not actually pay because of an expense offset arrangement. Unless the Board of the Trustees and Invesco mutually agree to amend or continue the fee waiver agreement, it will terminate on June 30, 2012.
Further, the Adviser has contractually agreed, through at least June 30, 2012, to waive the advisory fee payable by the Fund in an amount equal to 100% of the net advisory fees the Adviser receives from the affiliated money market funds on investments by the Fund of uninvested cash in such affiliated money market funds.
For the year ended December 31, 2011, the Adviser waived advisory fees of $1,428,955.
The Trust has entered into a master administrative services agreement with Invesco pursuant to which the Fund has agreed to pay Invesco a fee for costs incurred in providing accounting services and fund administrative services to the Fund and to reimburse Invesco for administrative services fees paid to insurance companies that have agreed to provide services to the participants of separate accounts. These administrative services provided by the insurance companies may include, among other things: the printing of prospectuses, financial reports and proxy statements and the delivery of the same to existing participants; the maintenance of master accounts; the facilitation of purchases and redemptions requested by the participants; and the servicing of participants’ accounts. Pursuant to such agreement, for the year ended December 31, 2011, Invesco was paid $295,052 for accounting and fund administrative services and reimbursed $3,029,338 for services provided by insurance companies.
The Trust has entered into a transfer agency and service agreement with Invesco Investment Services, Inc. (“IIS”) pursuant to which the Fund has agreed to pay IIS a fee for providing transfer agency and shareholder services to the Fund and reimburse IIS for certain expenses incurred by IIS in the course of providing such services. For the year ended December 31, 2011, expenses incurred under the agreement are shown in the Statement of Operations as transfer agent fees.
The Trust has entered into a master distribution agreement with Invesco Distributors, Inc. (“IDI”) to serve as the distributor for the Fund. The Trust has adopted a plan pursuant to Rule 12b-1 under the 1940 Act with respect to the Fund’s Series II shares (the “Plan”). The Fund, pursuant to the Plan, pays IDI compensation at the annual rate of 0.25% of the Fund’s average daily net assets of Series II shares. Of the Plan payments, up to 0.25% of the average daily net assets of the Series II shares may be paid to insurance companies who furnish continuing personal shareholder services to customers who purchase and own Series II shares of the Fund. For the year ended December 31, 2011, expenses incurred under the Plan are detailed in the Statement of Operations as distribution fees.
Certain officers and trustees of the Trust are officers and directors of the Adviser, Invesco Ltd., IIS and/or IDI.
NOTE 3—Additional Valuation Information
GAAP defines fair value as the price that would be received to sell an asset or paid to transfer a liability in an orderly transaction between market participants at the measurement date, under current market conditions. GAAP establishes a hierarchy that prioritizes the inputs to valuation methods giving the highest priority to readily available unadjusted quoted prices in an active market for identical assets (Level 1) and the lowest priority to significant unobservable inputs (Level 3) generally when market prices are not readily available or are unreliable. Based on the valuation inputs, the securities or other investments are tiered into one of three levels. Changes in valuation methods may result in transfers in or out of an investment’s assigned level:
| | |
| | Level 1 — | Prices are determined using quoted prices in an active market for identical assets. |
| | Level 2 — | Prices are determined using other significant observable inputs. Observable inputs are inputs that other market participants may use in pricing a security. These may include quoted prices for similar securities, interest rates, prepayment speeds, credit risk, yield curves, loss severities, default rates, discount rates, volatilities and others. |
| | Level 3 — | Prices are determined using significant unobservable inputs. In situations where quoted prices or observable inputs are unavailable (for example, when there is little or no market activity for an investment at the end of the period), unobservable inputs may be used. Unobservable inputs reflect the Fund’s own assumptions about the factors market participants would use in determining fair value of the securities or instruments and would be based on the best available information. |
Invesco V.I. Government Securities Fund
The following is a summary of the tiered valuation input levels, as of December 31, 2011. The level assigned to the securities valuations may not be an indication of the risk or liquidity associated with investing in those securities. Because of the inherent uncertainties of valuation, the values reflected in the financial statements may materially differ from the value received upon actual sale of those investments.
During the year ended December 31, 2011, there were no significant transfers between investment levels.
| | | | | | | | | | | | | | | | | |
| | | Level 1 | | Level 2 | | Level 3 | | Total |
| |
| Equity Securities | | $ | 13,989,842 | | | $ | — | | | $ | — | | | $ | 13,989,842 | |
| |
| U.S. Treasury Securities | | | — | | | | 157,163,629 | | | | — | | | | 157,163,629 | |
| |
| U.S. Government Sponsored Securities | | | — | | | | 1,103,316,595 | | | | — | | | | 1,103,316,595 | |
| |
| Corporate Debt Securities | | | — | | | | 16,377,790 | | | | — | | | | 16,377,790 | |
| |
| Foreign Debt Securities | | | — | | | | 28,448,968 | | | | — | | | | 28,448,968 | |
| |
| Foreign Sovereign Debt Securities | | | — | | | | 4,767,548 | | | | — | | | | 4,767,548 | |
| |
| | | $ | 13,989,842 | | | $ | 1,310,074,530 | | | $ | — | | | $ | 1,324,064,372 | |
| |
| Futures* | | | 1,341,158 | | | | — | | | | — | | | | 1,341,158 | |
| |
| Total Investments | | $ | 15,331,000 | | | $ | 1,310,074,530 | | | $ | — | | | $ | 1,325,405,530 | |
| |
| |
| * | Unrealized appreciation. |
NOTE 4—Derivative Investments
Value of Derivative Instruments at Period-End
The table below summarizes the value of the Fund’s derivative instruments, detailed by primary risk exposure, held as of December 31, 2011:
| | | | | | | | | |
| | | Value |
| Risk Exposure/Derivative Type | | Assets | | Liabilities |
| |
| Interest rate risk | | | | | | | | |
Futures contracts(a) | | $ | 4,495,580 | | | $ | (3,154,422 | ) |
| |
| | |
| (a) | | Includes cumulative appreciation (depreciation) of futures contracts. Only current day’s variation margin receivable is reported within the Statement of Assets and Liabilities. |
Effect of Derivative Instruments for the year ended December 31, 2011
The table below summarizes the gains on derivative instruments, detailed by primary risk exposure, recognized in earnings during the period:
| | | | | |
| | | Location of Gain on
|
| | | Statement of Operations |
| | | Futures* |
| |
| Realized Gain | | | | |
| Interest rate risk | | $ | 45,162,306 | |
| |
| Change in Unrealized Appreciation | | | | |
| Interest rate risk | | $ | 7,923,699 | |
| |
| Total | | $ | 53,086,005 | |
| |
| |
| * | The average notional value of futures outstanding during the period was $541,866,941. |
| | | | | | | | | | | | | | | | | |
| Open Futures Contracts |
| | | | | | | | | Unrealized
|
| | | Number of
| | Expiration
| | Notional
| | Appreciation
|
| Long Contracts | | Contracts | | Month | | Value | | (Depreciation) |
| |
| U.S. Treasury 2 Year Notes | | | 307 | | | | March-2012 | | | $ | 67,707,891 | | | $ | 20,021 | |
| |
| U.S. Treasury 10 Year Notes | | | 2,257 | | | | March-2012 | | | | 295,949,125 | | | | 2,587,284 | |
| |
| Ultra U.S. Treasury Bonds | | | 1,037 | | | | March-2012 | | | | 166,114,438 | | | | 1,888,275 | |
| |
| Subtotal | | | | | | | | | | $ | 529,771,454 | | | $ | 4,495,580 | |
| |
Short Contracts | | | | | | | | | | | | | | | | |
| |
| U.S. Treasury 5 Year Notes | | | 434 | | | | March-2012 | | | $ | (53,493,891 | ) | | $ | (215,148 | ) |
| |
| U.S. Treasury 30 Year Bonds | | | 640 | | | | March-2012 | | | | (92,680,000 | ) | | | (2,939,274 | ) |
| |
| Subtotal | | | | | | | | | | $ | (146,173,891 | ) | | $ | (3,154,422 | ) |
| |
| Total | | | | | | | | | | $ | 383,597,563 | | | $ | 1,341,158 | |
| |
Invesco V.I. Government Securities Fund
NOTE 5—Expense Offset Arrangement(s)
The expense offset arrangement is comprised of custodian credits which result from periodic overnight cash balances at the custodian. For the year ended December 31, 2011, the Fund received credits from this arrangement, which resulted in the reduction of the Fund’s total expenses of $163.
NOTE 6—Trustees’ and Officers’ Fees and Benefits
“Trustees’ and Officers’ Fees and Benefits” include amounts accrued by the Fund to pay remuneration to certain Trustees and Officers of the Fund. Trustees have the option to defer compensation payable by the Fund, and “Trustees’ and Officers’ Fees and Benefits” also include amounts accrued by the Fund to fund such deferred compensation amounts. Those Trustees who defer compensation have the option to select various Invesco Funds in which their deferral accounts shall be deemed to be invested. Finally, certain current Trustees are eligible to participate in a retirement plan that provides for benefits to be paid upon retirement to Trustees over a period of time based on the number of years of service. The Fund may have certain former Trustees who also participate in a retirement plan and receive benefits under such plan. “Trustees’ and Officers’ Fees and Benefits” include amounts accrued by the Fund to fund such retirement benefits. Obligations under the deferred compensation and retirement plans represent unsecured claims against the general assets of the Fund.
During the year ended December 31, 2011, the Fund paid legal fees of $2,537 for services rendered by Kramer, Levin, Naftalis & Frankel LLP as counsel to the Independent Trustees. A partner of that firm is a Trustee of the Trust.
NOTE 7—Cash Balances
The Fund may borrow for leveraging in an amount up to 5% of the Fund’s total assets (excluding the amount borrowed) at the time the borrowing is made. In doing so, the Fund is permitted to temporarily carry a negative or overdrawn balance in its account with State Street Bank and Trust Company, the custodian bank. To compensate the custodian bank for such overdrafts, the overdrawn Fund may either (1) leave funds as a compensating balance in the account so the custodian bank can be compensated by earning the additional interest; or (2) compensate by paying the custodian bank at a rate agreed upon by the custodian bank and Invesco, not to exceed the contractually agreed upon rate. A Fund may not purchase additional securities when any borrowings from banks exceeds 5% of the Fund’s total assets.
NOTE 8—Distributions to Shareholders and Tax Components of Net Assets
Tax Character of Distributions to Shareholders Paid During the Years Ended December 31, 2011 and 2010:
| | | | | | | | | |
| | | 2011 | | 2010 |
| |
| Ordinary income | | $ | 37,636,451 | | | $ | 55,777,349 | |
| |
Tax Components of Net Assets at Period-End:
| | | | | |
| | | 2011 |
| |
| Undistributed ordinary income | | $ | 35,549,690 | |
| |
| Net unrealized appreciation — investments | | | 39,723,086 | |
| |
| Temporary book/tax differences | | | (184,540 | ) |
| |
| Capital loss carryforward | | | (8,231,999 | ) |
| |
| Shares of beneficial interest | | | 1,198,490,336 | |
| |
| Total net assets | | $ | 1,265,346,573 | |
| |
The difference between book-basis and tax-basis unrealized appreciation is due to differences in the timing of recognition of gains and losses on investments for tax and book purposes. The Fund’s net unrealized appreciation difference is attributable primarily to wash sales and straddles.
The temporary book/tax differences are a result of timing differences between book and tax recognition of income and/or expenses. The Fund’s temporary book/tax differences are the result of the trustee deferral of compensation and retirement plan benefits.
Capital loss carryforward is calculated and reported as of a specific date. Results of transactions and other activity after that date may affect the amount of capital loss carryforward actually available for the Fund to utilize. The Regulated Investment Company Modernization Act of 2010 (the “Act”) eliminated the eight-year carryover period for capital losses that arise in taxable years beginning after its enactment date of December 22, 2010. Consequently, these capital losses can be carried forward for an unlimited period. However, capital losses with an expiration period may not be used to offset capital gains until all net capital losses without an expiration date have been utilized. Additionally, post-enactment capital loss carryovers will retain their character as either short-term or long-term capital losses instead of as short-term capital losses as under prior law. The ability to utilize capital loss carryforward in the future may be limited under the Internal Revenue Code and related regulations based on the results of future transactions.
Invesco V.I. Government Securities Fund
The Fund utilized $31,259,261 of capital loss carryforward in the current period to offset net realized capital gain for federal income tax purposes. The Fund has a capital loss carryforward as of December 31, 2011, which expires as follows:
| | | | | |
| Capital Loss Carryforward* |
| Expiration | | Short-Term |
| |
| December 31, 2015 | | $ | 3,869,214 | |
| |
| December 31, 2017 | | | 4,362,785 | |
| |
| Total | | $ | 8,231,999 | |
| |
| |
| * | Capital loss carryforward as of the date listed above is reduced for limitations, if any, to the extent required by the Internal Revenue Code. To the extent that unrealized gains as of May 2, 2011, the date of reorganization of Invesco Van Kampen V.I. Government Fund into the Fund are realized on securities held in each fund at such date of reorganization, the capital loss carryforward may be further limited for up to five years from the date of the reorganization. |
NOTE 9—Investment Securities
The aggregate amount of investment securities (other than short-term securities, U.S. Treasury obligations and money market funds, if any) purchased and sold by the Fund during the year ended December 31, 2011 was $723,594,200 and $861,702,067, respectively. During the same period, purchases and sales of U.S. Treasury obligations were $191,925,362 and $140,535,317. Cost of investments on a tax basis includes the adjustments for financial reporting purposes as of the most recently completed Federal income tax reporting period end.
| | | | | |
| Unrealized Appreciation (Depreciation) of Investment Securities on a Tax Basis |
| |
| Aggregate unrealized appreciation of investment securities | | $ | 41,994,759 | |
| |
| Aggregate unrealized (depreciation) of investment securities | | | (2,271,673 | ) |
| |
| Net unrealized appreciation of investment securities | | $ | 39,723,086 | |
| |
| Cost of investments for tax purposes is $1,284,341,286. | | | | |
NOTE 10—Reclassification of Permanent Differences
Primarily as a result of differing book/tax treatment of paydown gains (losses) and dollar rolls, on December 31, 2011, undistributed net investment income was increased by $10,868,957 and undistributed net realized gain was decreased by $10,868,957. Further, as a result of tax deferrals acquired in the reorganization of Invesco Van Kampen V.I. Government Fund into the Fund, undistributed net investment income was decreased by $6,325, undistributed net realized gain was decreased by $14,724,973 and shares of beneficial interest increased by $14,731,298. These reclassifications had no effect on the net assets of the Fund.
Invesco V.I. Government Securities Fund
NOTE 11—Share Information
| | | | | | | | | | | | | | | | | |
| | | Summary of Share Activity |
| |
| | | Years ended December 31, |
| | | 2011(a) | | 2010 |
| | | Shares | | Amount | | Shares | | Amount |
| |
| Sold: | | | | | | | | | | | | | | | | |
| Series I | | | 10,663,153 | | | $ | 128,843,040 | | | | 14,868,780 | | | $ | 182,569,736 | |
| |
| Series II | | | 5,300,488 | | | | 64,070,452 | | | | 1,086,469 | | | | 13,335,480 | |
| |
| Issued as reinvestment of dividends: | | | | | | | | | | | | | | | | |
| Series I | | | 3,158,192 | | | | 36,635,024 | | | | 4,508,875 | | | | 54,918,094 | |
| |
| Series II | | | 86,854 | | | | 1,001,427 | | | | 70,954 | | | | 859,253 | |
| |
Issued in connection with acquistions:(b) | | | | | | | | | | | | | | | | |
| Series I | | | 2,587,718 | | | | 30,250,210 | | | | — | | | | — | |
| |
| Series II | | | 22,298,634 | | | | 259,005,451 | | | | — | | | | — | |
| |
| Reacquired: | | | | | | | | | | | | | | | | |
| Series I | | | (28,160,963 | ) | | | (340,945,513 | ) | | | (29,794,392 | ) | | | (366,330,179 | ) |
| |
| Series II | | | (5,875,436 | ) | | | (71,038,561 | ) | | | (355,134 | ) | | | (4,339,793 | ) |
| |
| Net increase (decrease) in share activity | | | 10,058,640 | | | $ | 107,821,530 | | | | (9,614,448 | ) | | $ | (118,987,409 | ) |
| |
| | |
| (a) | | There are entities that are record owners of more than 5% of the outstanding shares of the Fund and in the aggregate own 80% of the outstanding shares of the Fund. The Fund and the Fund’s principal underwriter or adviser, are parties to participation agreements with these entities whereby these entities sell units of interest in separate accounts funding variable products that are invested in the Fund. The Fund, Invesco and/or Invesco affiliates may make payments to these entities, which are considered to be related to the Fund, for providing services to the Fund, Invesco and/or Invesco affiliates including but not limited to services such as, securities brokerage, third party record keeping and account servicing and administrative services. The Fund has no knowledge as to whether all or any portion of the shares owned of record by these entities are also owned beneficially. |
| (b) | | As of the opening of business on May 2, 2011 the Fund acquired all the net assets of Invesco Van Kampen V.I. Government Fund (the “Target Fund”) pursuant to a plan of reorganization approved by the Trustees of the Fund on November 10, 2010 and by the shareholders of the Target Fund on April 1, 2011. The acquisition was accomplished by a tax-free exchange of 24,886,352 shares of the Fund for 32,516,244 shares outstanding of the Target Fund as of the close of business on April 29, 2011. Each class of the Target Fund was exchanged for the like class of shares of the Fund based on the relative net asset value of the Target Fund to the net asset value of the Fund as of the close of business on April 29, 2011. The Target Fund’s net assets at that date of $289,255,661, including $4,992,514 of unrealized appreciation, were combined with those of the Fund. The net assets of the Fund immediately before the acquisition were $1,059,348,706. The net assets of the Fund subsequent to the acquisition were $1,348,604,367. The pro forma results of operations for the year ended December 31, 2011 assuming the reorganization had been completed on January 1, 2011, the beginning of the annual reporting period, are as follows: |
| | | | | |
| Net investment income | | $ | 28,166,317 | |
| |
| Net realized/unrealized gains | | | 72,785,041 | |
| |
| Change in net assets resulting from operations | | $ | 100,951,358 | |
| |
| | |
| | The combined investment portfolios have been managed as a single integrated portfolio since the acquisition was completed, it is not practicable to separate the amounts of revenue and earnings of the Target Fund that has been included in the Fund’s Statement of Operations since May 2, 2011. |
Invesco V.I. Government Securities Fund
NOTE 12—Financial Highlights
The following schedule presents financial highlights for a share of the Fund outstanding throughout the periods indicated.
| | | | | | | | | | | | | | | | | | | | | | | | | | | | | | | | | | | | | | | | | | | | | | | | | | | | | | | | | |
| | | | | | | | | | | | | | | | | | | | | | | Ratio of
| | Ratio of
| | | | |
| | | | | | | Net gains
| | | | | | | | | | | | | | | | expenses
| | expenses
| | | | |
| | | | | | | (losses) on
| | | | | | | | | | | | | | | | to average
| | to average net
| | Ratio of net
| | |
| | | Net asset
| | | | securities
| | | | Dividends
| | Distributions
| | | | | | | | | | net assets
| | assets without
| | investment
| | |
| | | value,
| | Net
| | (both
| | Total from
| | from net
| | from net
| | | | Net asset
| | | | Net assets,
| | with fee waivers
| | fee waivers
| | income
| | |
| | | beginning
| | investment
| | realized and
| | investment
| | investment
| | realized
| | Total
| | value, end
| | Total
| | end of period
| | and/or expenses
| | and/or expenses
| | to average
| | Portfolio
|
| | | of period | | income(a) | | unrealized) | | operations | | income | | gains | | Distributions | | of period | | Return(b) | | (000s omitted) | | absorbed | | absorbed | | net assets | | turnover(c) |
| |
| Series I |
| Year ended 12/31/11 | | $ | 12.00 | | | $ | 0.25 | | | $ | 0.67 | | | $ | 0.92 | | | $ | (0.43 | ) | | $ | — | | | $ | (0.43 | ) | | $ | 12.49 | | | | 7.91 | % | | $ | 970,029 | | | | 0.63 | %(d) | | | 0.75 | %(d) | | | 2.03 | %(d) | | | 85 | % |
| Year ended 12/31/10 | | | 11.95 | | | | 0.24 | | | | 0.41 | | | | 0.65 | | | | (0.60 | ) | | | — | | | | (0.60 | ) | | | 12.00 | | | | 5.40 | | | | 1,072,405 | | | | 0.73 | | | | 0.75 | | | | 1.98 | | | | 61 | |
| Year ended 12/31/09 | | | 13.05 | | | | 0.45 | | | | (0.43 | ) | | | 0.02 | | | | (0.65 | ) | | | (0.47 | ) | | | (1.12 | ) | | | 11.95 | | | | (0.01 | ) | | | 1,192,967 | | | | 0.73 | | | | 0.75 | | | | 3.47 | | | | 55 | |
| Year ended 12/31/08 | | | 12.06 | | | | 0.50 | | | | 0.96 | | | | 1.46 | | | | (0.47 | ) | | | — | | | | (0.47 | ) | | | 13.05 | | | | 12.22 | | | | 1,591,799 | | | | 0.73 | | | | 0.76 | | | | 3.96 | | | | 109 | |
| Year ended 12/31/07 | | | 11.80 | | | | 0.59 | | | | 0.16 | | | | 0.75 | | | | (0.49 | ) | | | — | | | | (0.49 | ) | | | 12.06 | | | | 6.43 | | | | 1,169,985 | | | | 0.73 | | | | 0.76 | | | | 4.93 | | | | 106 | |
| |
| Series II |
| Year ended 12/31/11 | | | 11.92 | | | | 0.21 | | | | 0.67 | | | | 0.88 | | | | (0.41 | ) | | | — | | | | (0.41 | ) | | | 12.39 | | | | 7.63 | | | | 295,318 | | | | 0.88 | (d) | | | 1.00 | (d) | | | 1.78 | (d) | | | 85 | |
| Year ended 12/31/10 | | | 11.88 | | | | 0.22 | | | | 0.40 | | | | 0.62 | | | | (0.58 | ) | | | — | | | | (0.58 | ) | | | 11.92 | | | | 5.10 | | | | 24,074 | | | | 0.98 | | | | 1.00 | | | | 1.73 | | | | 61 | |
| Year ended 12/31/09 | | | 12.97 | | | | 0.41 | | | | (0.43 | ) | | | (0.02 | ) | | | (0.60 | ) | | | (0.47 | ) | | | (1.07 | ) | | | 11.88 | | | | (0.26 | ) | | | 14,462 | | | | 0.98 | | | | 1.00 | | | | 3.22 | | | | 55 | |
| Year ended 12/31/08 | | | 11.99 | | | | 0.46 | | | | 0.97 | | | | 1.43 | | | | (0.45 | ) | | | — | | | | (0.45 | ) | | | 12.97 | | | | 11.98 | | | | 20,362 | | | | 0.98 | | | | 1.01 | | | | 3.71 | | | | 109 | |
| Year ended 12/31/07 | | | 11.74 | | | | 0.56 | | | | 0.15 | | | | 0.71 | | | | (0.46 | ) | | | — | | | | (0.46 | ) | | | 11.99 | | | | 6.11 | | | | 18,770 | | | | 0.98 | | | | 1.01 | | | | 4.68 | | | | 106 | |
| |
| | |
| (a) | | Calculated using average shares outstanding. |
| (b) | | Includes adjustments in accordance with accounting principles generally accepted in the United States of America and as such, the net asset value for financial reporting purposes and the returns based upon those net asset values may differ from the net asset value and returns for shareholder transactions. Total returns are not annualized for periods less than one year, if applicable, and do not reflect charges assessed in connection with a variable product, which if included would reduce total returns. |
| (c) | | Portfolio turnover is calculated at the fund level and is not annualized for periods less than one year, if applicable. For the period ended December 31, 2011, the portfolio turnover calculation excludes the value of securities purchased of $309,171,077 and sold of $25,033,352 in the effort to realign the Fund’s portfolio holdings after the reorganization of Invesco Van Kampen V.I. Government Fund into the Fund. |
| (d) | | Ratios are based on average daily net assets (000’s) of $1,034,573 and $204,785 for Series I and Series II shares, respectively. |
Invesco V.I. Government Securities Fund
Report of Independent Registered Public Accounting Firm
To the Board of Trustees of AIM Variable Insurance Funds (Invesco Variable Insurance Funds)
and Shareholders of Invesco V.I. Government Securities Fund:
In our opinion, the accompanying statement of assets and liabilities, including the schedule of investments, and the related statements of operations and of changes in net assets and the financial highlights present fairly, in all material respects, the financial position of Invesco V.I. Government Securities Fund (one of the funds constituting AIM Variable Insurance Funds (Invesco Variable Insurance Funds), hereafter referred to as the “Fund”) at December 31, 2011, the results of its operations for the year then ended, the changes in its net assets for each of the two years in the period then ended and the financial highlights for each of the five years in the period then ended, in conformity with accounting principles generally accepted in the United States of America. These financial statements and financial highlights (hereafter referred to as “financial statements”) are the responsibility of the Fund’s management; our responsibility is to express an opinion on these financial statements based on our audits. We conducted our audits of these financial statements in accordance with the standards of the Public Company Accounting Oversight Board (United States). Those standards require that we plan and perform the audits to obtain reasonable assurance about whether the financial statements are free of material misstatement. An audit includes examining, on a test basis, evidence supporting the amounts and disclosures in the financial statements, assessing the accounting principles used and significant estimates made by management, and evaluating the overall financial statement presentation. We believe that our audits, which included confirmation of securities at December 31, 2011 by correspondence with the custodian and brokers, provide a reasonable basis for our opinion.
PRICEWATERHOUSECOOPERS LLP
February 17, 2012
Houston, Texas
Invesco V.I. Government Securities Fund
Calculating your ongoing Fund expenses
Example
As a shareholder of the Fund, you incur ongoing costs, including management fees; distribution and/or service fees (12b-1); and other Fund expenses. This example is intended to help you understand your ongoing costs (in dollars) of investing in the Fund and to compare these costs with ongoing costs of investing in other mutual funds. The example is based on an investment of $1,000 invested at the beginning of the period and held for the entire period July 1, 2011 through December 31, 2011.
The actual and hypothetical expenses in the examples below do not represent the effect of any fees or other expenses assessed in connection with a variable product; if they did, the expenses shown would be higher while the ending account values shown would be lower.
Actual expenses
The table below provides information about actual account values and actual expenses. You may use the information in this table, together with the amount you invested, to estimate the expenses that you paid over the period. Simply divide your account value by $1,000 (for example, an $8,600 account value divided by $1,000 = 8.6), then multiply the result by the number in the table under the heading entitled “Actual Expenses Paid During Period” to estimate the expenses you paid on your account during this period.
Hypothetical example for comparison purposes
The table below also provides information about hypothetical account values and hypothetical expenses based on the Fund’s actual expense ratio and an assumed rate of return of 5% per year before expenses, which is not the Fund’s actual return.
The hypothetical account values and expenses may not be used to estimate the actual ending account balance or expenses you paid for the period. You may use this information to compare the ongoing costs of investing in the Fund and other funds. To do so, compare this 5% hypothetical example with the 5% hypothetical examples that appear in the shareholder reports of the other funds.
Please note that the expenses shown in the table are meant to highlight your ongoing costs. Therefore, the hypothetical information is useful in comparing ongoing costs, and will not help you determine the relative total costs of owning different funds.
| | | | | | | | | | | | | | | | | | | | | | | | | | | | | | | |
| | | | | | | | | | HYPOTHETICAL
| | | |
| | | | | | | ACTUAL | | | (5% annual return before expenses) | | | |
| | | | Beginning
| | | Ending
| | | Expenses
| | | Ending
| | | Expenses
| | | Annualized
|
| | | | Account Value
| | | Account Value
| | | Paid During
| | | Account Value
| | | Paid During
| | | Expense
|
| Class | | | (07/01/11) | | | (12/31/11)1 | | | Period2 | | | (12/31/11) | | | Period2 | | | Ratio |
| Series I | | | $ | 1,000.00 | | | | $ | 1,058.50 | | | | $ | 3.11 | | | | $ | 1,022.18 | | | | $ | 3.06 | | | | | 0.60 | % |
| | | | | | | | | | | | | | | | | | | | | | | | | | | | | | | |
| Series II | | | | 1,000.00 | | | | | 1,057.20 | | | | | 4.41 | | | | | 1,020.92 | | | | | 4.33 | | | | | 0.85 | |
| | | | | | | | | | | | | | | | | | | | | | | | | | | | | | | |
| |
| 1 | The actual ending account value is based on the actual total return of the Fund for the period July 1, 2011 through December 31, 2011, after actual expenses and will differ from the hypothetical ending account value which is based on the Fund’s expense ratio and a hypothetical annual return of 5% before expenses. |
| 2 | Expenses are equal to the Fund’s annualized expense ratio as indicated above multiplied by the average account value over the period, multiplied by184/365 to reflect the most recent fiscal half year. |
Invesco V.I. Government Securities Fund
Form 1099-DIV, Form 1042-S and other year–end tax information provide shareholders with actual calendar year amounts that should be included in their tax returns. Shareholders should consult their tax advisors.
The following distribution information is being provided as required by the Internal Revenue Code or to meet a specific state’s requirement.
The Fund designates the following amounts or, if subsequently determined to be different, the maximum amount allowable for its fiscal year ended December 31, 2011:
| | | | | |
Federal and State Income Tax | | |
| |
| Corporate Dividends Received Deduction* | | | 0.04% | |
| U.S. Treasury Obligations* | | | 7.93% | |
| | |
| | * | The above percentages are based on ordinary income dividends paid to shareholders during the Fund’s fiscal year. |
Invesco V.I. Government Securities Fund
Trustees and Officers
The address of each trustee and officer is AIM Variable Insurance Funds (Invesco Variable Insurance Funds) (the “Trust”), 11 Greenway Plaza, Suite 2500, Houston, Texas 77046-1173. The trustees serve for the life of the Trust, subject to their earlier death, incapacitation, resignation, retirement or removal as more specifically provided in the Trust’s organizational documents. Each officer serves for a one year term or until their successors are elected and qualified. Column two below includes length of time served with predecessor entities, if any.
| | | | | | | | | |
| | | | | | | Number of Funds
| | |
Name, Year of Birth and
| | Trustee and/
| | Principal Occupation(s)
| | in Fund Complex
| | Other Directorship(s)
|
| Position(s) Held with the Trust | | or Officer Since | | During Past 5 Years | | Overseen by Trustee | | Held by Trustee |
| | | | | | | | | |
| | | | | | | | | |
| | | | | | | | | |
| Interested Persons | | | | | | | | |
| | | | | | | | | |
| | | | | | | | | |
| | | | | | | | | |
Martin L. Flanagan1 — 1960
Trustee | | 2007 | | Executive Director, Chief Executive Officer and President, Invesco Ltd. (ultimate parent of Invesco and a global investment management firm); Advisor to the Board, Invesco Advisers, Inc. (formerly known as Invesco Institutional (N.A.), Inc.); Trustee, The Invesco Funds; Vice Chair, Investment Company Institute; and Member of Executive Board, SMU Cox School of Business
Formerly: Chairman, Invesco Advisers, Inc. (registered investment adviser); Director, Chairman, Chief Executive Officer and President, IVZ Inc. (holding company), INVESCO Group Services, Inc. (service provider) and Invesco North American Holdings, Inc. (holding company); Director, Chief Executive Officer and President, Invesco Holding Company Limited (parent of Invesco and a global investment management firm); Director, Invesco Ltd.; Chairman, Investment Company Institute and President, Co-Chief Executive Officer, Co-President, Chief Operating Officer and Chief Financial Officer, Franklin Resources, Inc. (global investment management organization) | | 140 | | None |
| | | | | | | | | |
| | | | | | | | | |
| | | | | | | | | |
Philip A. Taylor2 — 1954
Trustee, President and Principal Executive Officer | | 2006 | | Head of North American Retail and Senior Managing Director, Invesco Ltd.; Director, Co-Chairman, Co-President and Co-Chief Executive Officer, Invesco Advisers, Inc. (formerly known as Invesco Institutional (N.A.), Inc.) (registered investment adviser); Director, Chairman, Chief Executive Officer and President, Invesco Management Group, Inc. (formerly Invesco Aim Management Group, Inc.) (financial services holding company); Director and President, INVESCO Funds Group, Inc. (registered investment adviser and registered transfer agent); Director and Chairman, Invesco Investment Services, Inc. (formerly known as Invesco Aim Investment Services, Inc.) (registered transfer agent) and IVZ Distributors, Inc. (formerly known as INVESCO Distributors, Inc.) (registered broker dealer); Director, President and Chairman, Invesco Inc. (holding company) and Invesco Canada Holdings Inc. (holding company); Chief Executive Officer, Invesco Corporate Class Inc. (corporate mutual fund company) and Invesco Canada Fund Inc. (corporate mutual fund company); Director, Chairman and Chief Executive Officer, Invesco Canada Ltd. (formerly known as Invesco Trimark Ltd./Invesco Trimark Ltèe) (registered investment adviser and registered transfer agent); Trustee, President and Principal Executive Officer, The Invesco Funds (other than AIM Treasurer’s Series Trust (Invesco Treasurer’s Series Trust) and Short-Term Investments Trust); Trustee and Executive Vice President, The Invesco Funds (AIM Treasurer’s Series Trust (Invesco Treasurer’s Series Trust) and Short-Term Investments Trust only); Director, Invesco Investment Advisers LLC (formerly known as Van Kampen Asset Management); Director, Chief Executive Officer and President, Van Kampen Exchange Corp. | | 140 | | None |
| | | | | | | | | |
| | | | | | | | | |
| | | | | Formerly: Director and Chairman, Van Kampen Investor Services Inc.: Director, Chief Executive Officer and President, 1371 Preferred Inc. (holding company); and Van Kampen Investments Inc.; Director and President, AIM GP Canada Inc. (general partner for limited partnerships); and Van Kampen Advisors, Inc.; Director and Chief Executive Officer, Invesco Trimark Dealer Inc. (registered broker dealer); Director, Invesco Distributors, Inc. (formerly known as Invesco Aim Distributors, Inc.) (registered broker dealer); Manager, Invesco PowerShares Capital Management LLC; Director, Chief Executive Officer and President, Invesco Advisers, Inc.; Director, Chairman, Chief Executive Officer and President, Invesco Aim Capital Management, Inc.; President, Invesco Trimark Dealer Inc. and Invesco Trimark Ltd./Invesco Trimark Ltèe; Director and President, AIM Trimark Corporate Class Inc. and AIM Trimark Canada Fund Inc.; Senior Managing Director, Invesco Holding Company Limited; Trustee and Executive Vice President, Tax-Free Investments Trust; Director and Chairman, Fund Management Company (former registered broker dealer); President and Principal Executive Officer, The Invesco Funds (AIM Treasurer’s Series Trust (Invesco Treasurer’s Series Trust), Short-Term Investments Trust and Tax-Free Investments Trust only); President, AIM Trimark Global Fund Inc. and AIM Trimark Canada Fund Inc. | | | | |
| | | | | | | | | |
| | | | | | | | | |
| | | | | | | | | |
Wayne W. Whalen3 — 1939
Trustee | | 2010 | | Of Counsel, and prior to 2010, partner in the law firm of Skadden, Arps, Slate, Meagher & Flom LLP, legal counsel to funds in the Fund Complex | | 158 | | Director of the Abraham Lincoln Presidential Library Foundation |
| | | | | | | | | |
| | | | | | | | | |
| | | | | | | | | |
| Independent Trustees | | | | | | | | |
| | | | | | | | | |
| | | | | | | | | |
| | | | | | | | | |
Bruce L. Crockett — 1944
Trustee and Chair | | 1993 | | Chairman, Crockett Technology Associates (technology consulting company) | | 140 | | ACE Limited (insurance company); and Investment Company Institute |
| | | | | Formerly: Director, Captaris (unified messaging provider); Director, President and Chief Executive Officer COMSAT Corporation; and Chairman, Board of Governors of INTELSAT (international communications company) | | | | |
| | | | | | | | | |
| |
| 1 | Mr. Flanagan is considered an interested person of the Trust because he is an officer of the adviser to the Trust, and an officer and a director of Invesco Ltd., ultimate parent of the adviser to the Trust. |
| 2 | Mr. Taylor is considered an interested person of the Trust because he is an officer and a director of the adviser to, and a director of the principal underwriter of, the Trust. |
| 3 | Mr. Whalen is considered an “interested person” (within the meaning of Section 2(a)(19) of the 1940 Act) of certain Funds in the Fund Complex by reason of he and his firm currently providing legal services as legal counsel to such Funds in the Fund Complex. |
Invesco V.I. Government Securities Fund
Trustees and Officers—(continued)
The address of each trustee and officer is AIM Variable Insurance Funds (Invesco Variable Insurance Funds) (the “Trust”), 11 Greenway Plaza, Suite 2500, Houston, Texas 77046-1173. The trustees serve for the life of the Trust, subject to their earlier death, incapacitation, resignation, retirement or removal as more specifically provided in the Trust’s organizational documents. Each officer serves for a one year term or until their successors are elected and qualified. Column two below includes length of time served with predecessor entities, if any.
| | | | | | | | | |
| | | | | | | Number of Funds
| | |
Name, Year of Birth and
| | Trustee and/
| | Principal Occupation(s)
| | in Fund Complex
| | Other Directorship(s)
|
| Position(s) Held with the Trust | | or Officer Since | | During Past 5 Years | | Overseen by Trustee | | Held by Trustee |
| | | | | | | | | |
| | | | | | | | | |
| | | | | | | |
Independent Trustees—(continued) | | | | | | |
| | | | | | | | | |
| | | | | | | | | |
| | | | | | | | | |
David C. Arch — 1945
Trustee | | 2010 | | Chairman and Chief Executive Officer of Blistex Inc., a consumer health care products manufacturer. | | 158 | | Member of the Heartland Alliance Advisory Board, a nonprofit organization serving human needs based in Chicago. Board member of the Illinois Manufacturers’ Association. Member of the Board of Visitors, Institute for the Humanities, University of Michigan |
| | | | | | | | | |
| | | | | | | | | |
| | | | | | | | | |
Frank S. Bayley — 1939
Trustee | | 2001 | | Retired
Formerly: Director, Badgley Funds, Inc. (registered investment company) (2 portfolios) and Partner, law firm of Baker & McKenzie
Formerly: Director, Badgley Funds, Inc. (registered investment company) (2 portfolios) and Partner, law firm of Baker & McKenzie | | 140 | | Director and Chairman, C.D. Stimson Company (a real estate investment company) |
| | | | | | | | | |
| | | | | | | | | |
| | | | | | | | | |
James T. Bunch — 1942
Trustee | | 2004 | | Managing Member, Grumman Hill Group LLC (family office private equity management)
Formerly: Founder, Green, Manning & Bunch Ltd. (investment banking firm)(1988-2010); Executive Committee, United States Golf Association; and Director, Policy Studies, Inc. and Van Gilder Insurance Corporation | | 140 | | Vice Chairman, Board of Governors, Western Golf Association/Evans Scholars Foundation and Director, Denver Film Society |
| | | | | | | | | |
| | | | | | | | | |
| | | | | | | | | |
Rodney F. Dammeyer — 1940
Trustee | | 2010 | | President of CAC, LLC, a private company offering capital investment and management advisory services.
Formerly: Prior to January 2004, Director of TeleTech Holdings Inc.; Prior to 2002, Director of Arris Group, Inc.; Prior to 2001, Managing Partner at Equity Group Corporate Investments. Prior to 1995, Vice Chairman of Anixter International. Prior to 1985, experience includes Senior Vice President and Chief Financial Officer of Household International, Inc., Executive Vice President and Chief Financial Officer of Northwest Industries, Inc. and Partner of Arthur Andersen & Co. | | 158 | | Director of Quidel Corporation and Stericycle, Inc. Prior to May 2008, Trustee of The Scripps Research Institute. Prior to February 2008, Director of Ventana Medical Systems, Inc. Prior to April 2007, Director of GATX Corporation. Prior to April 2004, Director of TheraSense, Inc. |
| | | | | | | | | |
| | | | | | | | | |
| | | | | | | | | |
Albert R. Dowden — 1941
Trustee | | 2000 | | Director of a number of public and private business corporations, including the Boss Group, Ltd. (private investment and management); Reich & Tang Funds (5 portfolios) (registered investment company); and Homeowners of America Holding Corporation/ Homeowners of America Insurance Company (property casualty company)
Formerly: Director, Continental Energy Services, LLC (oil and gas pipeline service); Director, CompuDyne Corporation (provider of product and services to the public security market) and Director, Annuity and Life Re (Holdings), Ltd. (reinsurance company); Director, President and Chief Executive Officer, Volvo Group North America, Inc.; Senior Vice President, AB Volvo; Director of various public and private corporations; Chairman, DHJ Media, Inc.; Director Magellan Insurance Company; and Director, The Hertz Corporation, Genmar Corporation (boat manufacturer), National Media Corporation; Advisory Board of Rotary Power International (designer, manufacturer, and seller of rotary power engines); and Chairman, Cortland Trust, Inc. (registered investment company) | | 140 | | Board of Nature’s Sunshine Products, Inc. |
| | | | | | | | | |
| | | | | | | | | |
| | | | | | | | | |
Jack M. Fields — 1952
Trustee | | 1997 | | Chief Executive Officer, Twenty First Century Group, Inc. (government affairs company); and Owner and Chief Executive Officer, Dos Angelos Ranch, L.P. (cattle, hunting, corporate entertainment), Discovery Global Education Fund (non-profit) and Cross Timbers Quail Research Ranch (non-profit)
Formerly: Chief Executive Officer, Texana Timber LP (sustainable forestry company) and member of the U.S. House of Representatives | | 140 | | Administaff |
| | | | | | | | | |
| | | | | | | | | |
| | | | | | | | | |
Carl Frischling — 1937
Trustee | | 1993 | | Partner, law firm of Kramer Levin Naftalis and Frankel LLP | | 140 | | Director, Reich & Tang Funds (16 portfolios) |
| | | | | | | | | |
| | | | | | | | | |
Invesco V.I. Government Securities Fund
Trustees and Officers—(continued)
The address of each trustee and officer is AIM Variable Insurance Funds (Invesco Variable Insurance Funds) (the “Trust”), 11 Greenway Plaza, Suite 2500, Houston, Texas 77046-1173. The trustees serve for the life of the Trust, subject to their earlier death, incapacitation, resignation, retirement or removal as more specifically provided in the Trust’s organizational documents. Each officer serves for a one year term or until their successors are elected and qualified. Column two below includes length of time served with predecessor entities, if any.
| | | | | | | | | |
| | | | | | | Number of Funds
| | |
Name, Year of Birth and
| | Trustee and/
| | Principal Occupation(s)
| | in Fund Complex
| | Other Directorship(s)
|
| Position(s) Held with the Trust | | or Officer Since | | During Past 5 Years | | Overseen by Trustee | | Held by Trustee |
| | | Independent Trustees—(continued) | | | | |
| | | | | | | | | |
| | | | | | | | | |
| | | | | | | | | |
Prema Mathai-Davis — 1950
Trustee | | 1998 | | Retired
Formerly: Chief Executive Officer, YWCA of the U.S.A. | | 140 | | None |
| | | | | | | | | |
| | | | | | | | | |
| | | | | | | | | |
Larry Soll — 1942
Trustee | | 2004 | | Retired
Formerly, Chairman, Chief Executive Officer and President, Synergen Corp. (a biotechnology company) | | 140 | | None |
| | | | | | | | | |
| | | | | | | | | |
| | | | | | | | | |
Hugo F. Sonnenschein — 1940
Trustee | | 2010 | | President Emeritus and Honorary Trustee of the University of Chicago and the Adam Smith Distinguished Service Professor in the Department of Economics at the University of Chicago. Prior to July 2000, President of the University of Chicago. | | 158 | | Trustee of the University of Rochester and a member of its investment committee. Member of the National Academy of Sciences, the American Philosophical Society and a fellow of the American Academy of Arts and Sciences |
| | | | | | | | | |
| | | | | | | | | |
| | | | | | | | | |
| Raymond Stickel, Jr. — 1944 Trustee | | 2005 | | Retired
Formerly: Director, Mainstay VP Series Funds, Inc. (25 portfolios) and Partner, Deloitte & Touche | | 140 | | None |
| | | | | | | | | |
| | | | | | | | | |
| | | | | | | | | |
| Other Officers | | | | | | | | |
| | | | | | | | | |
| | | | | | | | | |
| | | | | | | | | |
Russell C. Burk — 1958
Senior Vice President and Senior Officer | | 2005 | | Senior Vice President and Senior Officer, The Invesco Funds | | N/A | | N/A |
| | | | | | | | | |
| | | | | | | | | |
| | | | | | | | | |
John M. Zerr — 1962
Senior Vice President, Chief Legal Officer and Secretary | | 2006 | | Director, Senior Vice President, Secretary and General Counsel, Invesco Management Group, Inc. (formerly known as Invesco Aim Management Group, Inc.) and Van Kampen Exchange Corp.; Senior Vice President, Invesco Advisers, Inc. (formerly known as Invesco Institutional (N.A.), Inc.) (registered investment adviser); Senior Vice President and Secretary, Invesco Distributors, Inc. (formerly known as Invesco Aim Distributors, Inc.); Director, Vice President and Secretary, Invesco Investment Services, Inc. (formerly known as Invesco Aim Investment Services, Inc.) and IVZ Distributors, Inc. (formerly known as INVESCO Distributors, Inc.); Director and Vice President, INVESCO Funds Group, Inc.; Senior Vice President, Chief Legal Officer and Secretary, The Invesco Funds; Manager, Invesco PowerShares Capital Management LLC; Director, Secretary and General Counsel, Invesco Investment Advisers LLC (formerly known as Van Kampen Asset Management); Secretary and General Counsel, Van Kampen Funds Inc. and Chief Legal Officer, PowerShares Exchange-Traded Fund Trust, PowerShares Exchange-Traded Fund Trust II, PowerShares India Exchange-Traded Fund Trust and PowerShares Actively Managed Exchange-Traded Fund Trust
Formerly: Director and Secretary, Van Kampen Advisors Inc.; Director Vice President, Secretary and General Counsel Van Kampen Investor Services Inc.; Director, Invesco Distributors, Inc. (formerly known as Invesco Aim Distributors, Inc.); Director, Senior Vice President, General Counsel and Secretary, Invesco Advisers, Inc.; and Van Kampen Investments Inc.; Director, Vice President and Secretary, Fund Management Company; Director, Senior Vice President, Secretary, General Counsel and Vice President, Invesco Aim Capital Management, Inc.; Chief Operating Officer and General Counsel, Liberty Ridge Capital, Inc. (an investment adviser); Vice President and Secretary, PBHG Funds (an investment company) and PBHG Insurance Series Fund (an investment company); Chief Operating Officer, General Counsel and Secretary, Old Mutual Investment Partners (a broker-dealer); General Counsel and Secretary, Old Mutual Fund Services (an administrator) and Old Mutual Shareholder Services (a shareholder servicing center); Executive Vice President, General Counsel and Secretary, Old Mutual Capital, Inc. (an investment adviser); and Vice President and Secretary, Old Mutual Advisors Funds (an investment company) | | N/A | | N/A |
| | | | | | | | | |
| | | | | | | | | |
| | | | | | | | | |
Lisa O. Brinkley — 1959
Vice President | | 2004 | | Global Compliance Director, Invesco Ltd.; Chief Compliance Officer, Invesco Investment Services, Inc.(formerly known as Invesco Aim Investment Services, Inc.); and Vice President, The Invesco Funds
Formerly: Chief Compliance Officer, Invesco Distributors, Inc. (formerly known as Invesco Aim Distributors, Inc.) and Van Kampen Investor Services Inc.; Senior Vice President, Invesco Management Group, Inc.; Senior Vice President and Chief Compliance Officer, Invesco Advisers, Inc. and The Invesco Funds; Vice President and Chief Compliance Officer, Invesco Aim Capital Management, Inc. and Invesco Distributors, Inc.; Vice President, Invesco Investment Services, Inc. and Fund Management Company | | N/A | | N/A |
| | | | | | | | | |
Invesco V.I. Government Securities Fund
Trustees and Officers—(continued)
The address of each trustee and officer is AIM Variable Insurance Funds (Invesco Variable Insurance Funds) (the “Trust”), 11 Greenway Plaza, Suite 2500, Houston, Texas 77046-1173. The trustees serve for the life of the Trust, subject to their earlier death, incapacitation, resignation, retirement or removal as more specifically provided in the Trust’s organizational documents. Each officer serves for a one year term or until their successors are elected and qualified. Column two below includes length of time served with predecessor entities, if any.
| | | | | | | | | |
| | | | | | | Number of Funds
| | |
Name, Year of Birth and
| | Trustee and/
| | Principal Occupation(s)
| | in Fund Complex
| | Other Directorship(s)
|
| Position(s) Held with the Trust | | or Officer Since | | During Past 5 Years | | Overseen by Trustee | | Held by Trustee |
| | | Other Officers—(continued) | | | | |
| | | | | | | | | |
| | | | | | | | | |
| | | | | | | | | |
Sheri Morris — 1964
Vice President, Treasurer and Principal Financial Officer | | 1999 | | Vice President, Treasurer and Principal Financial Officer, The Invesco Funds; Vice President, Invesco Advisers, Inc. (formerly known as Invesco Institutional (N.A.), Inc.) (registered investment adviser).
Formerly: Treasurer, PowerShares Exchange-Traded Fund Trust, PowerShares Exchange-Traded Fund Trust II, PowerShares India Exchange-Traded Fund Trust and PowerShares Actively Managed Exchange-Traded Fund Trust, Vice President, Invesco Advisers, Inc., Invesco Aim Capital Management, Inc. and Invesco Aim Private Asset Management, Inc.; Assistant Vice President and Assistant Treasurer, The Invesco Funds and Assistant Vice President, Invesco Advisers, Inc., Invesco Aim Capital Management, Inc. and Invesco Aim Private Asset Management, Inc. | | N/A | | N/A |
| | | | | | | | | |
| | | | | | | | | |
| | | | | | | | | |
Karen Dunn Kelley — 1960
Vice President | | 1993 | | Head of Invesco’s World Wide Fixed Income and Cash Management Group; Senior Vice President, Invesco Management Group, Inc. (formerly known as Invesco Aim Management Group, Inc.) and Invesco Advisers, Inc. (formerly known as Invesco Institutional (N.A.), Inc.) (registered investment adviser); Executive Vice President, Invesco Distributors, Inc. (formerly known as Invesco Aim Distributors, Inc.); Director, Invesco Mortgage Capital Inc.; Vice President, The Invesco Funds (other than AIM Treasurer’s Series Trust (Invesco Treasurer’s Series Trust) and Short-Term Investments Trust); and President and Principal Executive Officer, The Invesco Funds (AIM Treasurer’s Series Trust (Invesco Treasurer’s Series Trust) and Short-Term Investments Trust only).
Formerly: Senior Vice President, Van Kampen Investments Inc.; Vice President, Invesco Advisers, Inc. (formerly known as Invesco Institutional (N.A.), Inc.); Director of Cash Management and Senior Vice President, Invesco Advisers, Inc. and Invesco Aim Capital Management, Inc.; President and Principal Executive Officer, Tax-Free Investments Trust; Director and President, Fund Management Company; Chief Cash Management Officer, Director of Cash Management, Senior Vice President, and Managing Director, Invesco Aim Capital Management, Inc.; Director of Cash Management, Senior Vice President, and Vice President, Invesco Advisers, Inc. and The Invesco Funds (AIM Treasurer’s Series Trust (Invesco Treasurer’s Series Trust), Short-Term Investments Trust and Tax-Free Investments Trust only) | | N/A | | N/A |
| | | | | | | | | |
| | | | | | | | | |
| | | | | | | | | |
Yinka Akinsola — 1977
Anti-Money Laundering Compliance Officer | | 2011 | | Anti-Money Laundering Compliance Officer, Invesco Advisers, Inc. (formerly known as Invesco Institutional (N.A.), Inc.) (registered investment adviser); Invesco Distributors, Inc. (formerly known as Invesco Aim Distributors, Inc.), Invesco Investment Services, Inc. (formerly known as Invesco Aim Investment Services, Inc.), Invesco Management Group, Inc., The Invesco Funds, Invesco Van Kampen Closed-End Funds, Van Kampen Exchange Corp. and Van Kampen Funds Inc. | | N/A | | N/A |
| | | | | | | | | |
| | | | | | | | | |
| | | | | | | | | |
Todd L. Spillane — 1958
Chief Compliance Officer | | 2006 | | Senior Vice President, Invesco Management Group, Inc. (formerly known as Invesco Aim Management Group, Inc.) and Van Kampen Exchange Corp.; Senior Vice President and Chief Compliance Officer, Invesco Advisers, Inc. (registered investment adviser) (formerly known as Invesco Institutional (N.A.), Inc.); Chief Compliance Officer, The Invesco Funds, INVESCO Private Capital Investments, Inc. (holding company) and Invesco Private Capital, Inc. (registered investment adviser); Vice President, Invesco Distributors, Inc. (formerly known as Invesco Aim Distributors, Inc.) and Invesco Investment Services, Inc. (formerly known as Invesco Aim Investment Services, Inc.).
Formerly: Chief Compliance Officer, Invesco Van Kampen Closed-End Funds PowerShares Exchange-Traded Fund Trust, PowerShares Exchange-Traded Fund Trust II, PowerShares India Exchange-Traded Fund Trust, and PowerShares Actively Managed Exchange-Traded Fund Trust; Senior Vice President, Van Kampen Investments Inc.; Senior Vice President and Chief Compliance Officer, Invesco Advisers, Inc. and Invesco Aim Capital Management, Inc.; Chief Compliance Officer, Invesco Global Asset Management (N.A.), Inc., Invesco Senior Secured Management, Inc. (registered investment adviser) and Van Kampen Investor Services Inc.; Vice President, Invesco Aim Capital Management, Inc. and Fund Management Company | | N/A | | N/A |
| | | | | | | | | |
The Statement of Additional Information of the Trust includes additional information about the Fund’s Trustees and is available upon request, without charge, by calling 1.800.959.4246. Please refer to the Fund’s prospectus for information on the Fund’s sub-advisers.
| | | | | | | |
Office of the Fund
11 Greenway Plaza, Suite 2500
Houston, TX 77046-1173 | | Investment Adviser
Invesco Advisers, Inc.
1555 Peachtree Street, N.E.
Atlanta, GA 30309 | | Distributor
Invesco Distributors, Inc.
11 Greenway Plaza, Suite 2500
Houston, TX 77046-1173 | | Auditors
PricewaterhouseCoopers LLP
1201 Louisiana Street, Suite 2900
Houston, TX 77002-5678 |
| | | | | | | |
| | | | | | | |
Counsel to the Fund
Stradley Ronon Stevens & Young, LLP
2600 One Commerce Square
Philadelphia, PA 19103 | | Counsel to the Independent Trustees
Kramer, Levin, Naftalis & Frankel LLP
1177 Avenue of the Americas
New York, NY 10036-2714 | | Transfer Agent
Invesco Investment Services, Inc.
11 Greenway Plaza, Suite 2500
Houston, TX77046-1173 | | Custodian
State Street Bank and Trust Company
225 Franklin
Boston, MA 02110-2801 |
Invesco V.I. Government Securities Fund
Invesco V.I. High Yield Fund
Annual Report to Shareholders § December 31, 2011
The Fund provides a complete list of its holdings four times in each fiscal year, at the quarter-ends. For the second and fourth quarters, the lists appear in the Fund’s semiannual and annual reports to shareholders. For the first and third quarters, the Fund files the lists with the Securities and Exchange Commission (SEC) on Form N-Q. The Fund’s Form N-Q filings are available on the SEC website, sec.gov. Copies of the Fund’s Forms N-Q may be reviewed and copied at the SEC Public Reference Room in Washington, D.C. You can obtain information on the operation of the Public Reference Room, including information about duplicating fee charges, by calling 202 551 8090 or 800 732 0330, or by electronic request at the following email address: publicinfo@sec.gov. The SEC file numbers for the Fund are 811-07452 and 033-57340. The Fund’s most recent portfolio holdings, as filed on Form N-Q, have also been made available to insurance companies issuing variable annuity contracts and variable life insurance policies (“variable products”) that invest in the Fund.
A description of the policies and procedures that the Fund uses to determine how to vote proxies relating to portfolio securities is available without charge, upon request, from our Client Services department at 800 959 4246 or at invesco.com/proxyguidelines. The information is also available on the SEC website, sec.gov.
Information regarding how the Fund voted proxies related to its portfolio securities during the 12 months ended June 30, 2011, is available at invesco.com/proxysearch. The information is also available on the SEC website, sec.gov.
Invesco Advisers, Inc. is an investment adviser; it provides investment advisory services to individual and institutional clients and does not sell securities. Invesco Distributors, Inc. is the U.S. distributor for Invesco Ltd.’s retail mutual funds, exchange-traded funds and institutional money market funds. Both are wholly owned, indirect subsidiaries of Invesco Ltd.
This report must be accompanied or preceded by a currently effective Fund prospectus and variable product prospectus, which contain more complete information, including sales charges and expenses. Investors should read each carefully before investing.
Invesco Distributors, Inc.
VIHYI-AR-1
| | | | | | | | | |
|
| | | | | | | |
NOT FDIC INSURED | | | MAY LOSE VALUE | | | NO BANK GUARANTEE |
Management’s Discussion of Fund Performance
Performance summary
For the year ended December 31, 2011, Invesco V.I. High Yield Fund underperformed the Barclays Capital U.S. Corporate High Yield 2% Issuer Cap Index, due mainly to the Fund’s issuer selection and our underweighting of higher quality assets in the market.
Your Fund’s long-term performance appears later in this report.
Fund vs. Indexes
Total returns, 12/31/10 to 12/31/11, excluding variable product issuer charges. If variable product issuer charges were included, returns would be lower.
| | | | | |
|
| Series I Shares* | | | 0.96 | % |
| |
| Series II Shares* | | | 0.61 | |
| |
Barclays Capital U.S. Aggregate Index▼ (Broad Market Index) | | | 7.84 | |
| |
Barclays Capital U.S. Corporate High Yield 2% Issuer Cap Index▼ (Style-Specific Index) | | | 4.96 | |
| |
Lipper VUF High Current Yield Bond Funds Category Average▼ (Peer Group) | | | 3.35 | |
| |
Source(s): ▼Lipper Inc.
| |
| * | Performance includes litigation proceeds. Had these proceeds not been received, total return would have been lower. |
How we invest
We invest primarily in debt securities that are determined to be below investment grade quality. These bonds, commonly known as “junk bonds,” are typically corporate bonds of U.S.-based companies, many of which are moderately sized firms. We principally invest in junk bonds although we tend to underweight the lowest-quality bonds in the asset class. We may invest in convertible bonds, preferred stock, derivatives and bank loans, but do not expect these instruments to be a substantial part of our portfolio. We may invest up to 25% of total assets in foreign securities. The Fund also may invest up to 15% of its total assets in securities of issuers located in developing markets.
The primary driver of our security selection is fundamental bottom-up credit analysis conducted by a team of analysts who specialize by industry.
This approach is augmented with an ongoing review of the relative value of securities and a top-down process that includes sector, economic and quantitative analysis. Changes in a security’s risk/ return profile or relative value and top-down factors generally determine buy and sell decisions.
Portfolio construction begins with a well-defined Fund design that emphasizes diversification and establishes the target investment vehicles for generating the desired “alpha” (the return expected from an investment) as well as the risk parameters appropriate for the current positioning in the credit cycle. Investments are evaluated for liquidity and risk versus relative value. Working closely with other investment specialists and traders, we determine the timing and amount of each alpha decision to use in the portfolio at any time, taking into account security selection skill and market opportunities.
| | | Sell decisions are based on: |
| n | | Low equity value to debt, high subordination and negative free cash flow coupled with negative news, declining expectations or an increasing risk profile. |
| |
| n | | Very low yields. |
| |
| n | | Presentation of a better relative value opportunity. |
Market conditions and your Fund
The high yield market depends heavily on the underlying health of the economy, principally in the U.S. and, secondarily, in Europe. Growth remained slow as deleveraging and caution constrained economic activity and job creation. The situation in Europe was generally worse than in the U.S., owing to the sovereign debt crisis, slower economic growth and the threat of renewed recession.
Financial stimulus remained robust and appeared likely to stay accommodative. While the U.S. Federal Reserve’s (the Fed) second round of quantitative easing ended, the Fed committed to keeping short-term interest rates anchored near zero through mid-2013. (In January 2012, after the close of the reporting period, the Fed extended its commitment to keep short-term interest rates near zero through late 2014.) In Europe, the tightening cycle appeared to have ended as interest rates were cut. In this way, fixed income asset classes were broadly supported by the underlying interest rate structure.
The high yield market moved from becoming increasingly aggressive early in the reporting period to increasingly defensive as the reporting period ended. The change was due to slower growth expectations, including a U.S. growth scare over the summer and fears of
Portfolio Composition
By credit quality
| | | | | |
|
| A | | | 0.6 | % |
| |
| BBB | | | 5.0 | |
| |
| BB | | | 30.4 | |
| |
| B | | | 39.0 | |
| |
| CCC | | | 7.4 | |
| |
| CC | | | 0.4 | |
| |
| C | | | 0.1 | |
| |
| Non-Rated | | | 5.2 | |
| |
| Cash | | | 11.9 | |
Source: Standard & Poor’s. A credit rating is an assessment provided by a nationally recognized statistical rating organization (NRSRO) of the creditworthiness of an issuer with respect to debt obligations, including specific securities, money
Top 10 Fixed Income Issuers*
| | | | | | | | | |
|
| | 1. | | | International Lease Financing Corp. | | | 1.8 | % |
| |
| | 2. | | | Ally Financial Inc. | | | 1.4 | |
| |
| | 3. | | | CIT Group Inc. | | | 1.2 | |
| |
| | 4. | | | Tenet Healthcare Corp. | | | 1.0 | |
| |
| | 5. | | | Building Materials Corp. of America | | | 1.0 | |
| |
| | 6. | | | Hertz Corp. (The) | | | 0.9 | |
| |
| | 7. | | | Intelsat Jackson Holdings S.A. | | | 0.9 | |
| |
| | 8. | | | Cricket Communications, Inc. | | | 0.9 | |
| |
| | 9. | | | Century Aluminum Co. | | | 0.8 | |
| |
| | 10. | | | Delta Air Lines, Inc. | | | 0.8 | |
market instruments or other debts. Ratings are measured on a scale that generally ranges from AAA (highest) to D (lowest); ratings are subject to change without notice. “Non-Rated” indicates the debtor was not rated, and should not be interpreted
| | | | | |
|
| Total Net Assets | | $111.9 million |
| | | | | |
| Total Number of Holdings* | | | | 380 |
The Fund’s holdings are subject to change, and there is no assurance that the Fund will continue to hold any particular security.
*Excluding money market fund holdings.
as indicating low quality. For more information on Standard & Poor’s rating methodology, please visit standardandpoors.com and select “Understanding Ratings” under “Ratings Resources” on the homepage.
Invesco V.I. High Yield Fund
a deepening financial crisis centered in the eurozone. Volatility and correlations were high as the high yield market experienced what is generally called the “risk on/risk off” market. Lower capital utilization by broker dealers, who were limiting their own risk-taking, further exacerbated market movements.
Defaults in the high yield bond market remained muted during 2011. The annualized par-weighted default rate for the year was only 2.03% according to Standard & Poor’s. Very low defaults are to be expected after periods of high defaults and recession. We expect a gradual increase in defaults as we exit the immediate post-downturn period, although without renewed recession, we expect defaults will likely remain below average.
The broad U.S. high yield bond market, as measured by the Barclays Capital U.S. Corporate High Yield 2% Issuer Cap Index, generated a positive total return for the year ended December 31, 2011. In August and September 2011, debt concerns in Europe and the downgrade of U.S. debt by Standard & Poor’s caused investors to scale back their risk profiles. The risk-on trade returned at the end of the reporting period, as we had potentially good news from Europe and economic data out of the U.S. improved.
In this environment, the Fund generated positive returns for the 12-month period but underperformed its style-specific index, the Barclays Capital U.S. High Yield 2% Issuer Cap Index. While valuations in the market have improved, we did not increase our weights to distressed and very high risk bonds.
The main detractor from Fund performance was issuer selection in construction materials bonds. The Fund’s issuer selection in the distiller and vintners industry also hurt, as some of our off-index issuers were oversold throughout much of the reporting period. In addition, the Fund’s issuer selection in the automotive manufacturing industry detracted from performance; our holding in one of the big U.S. manufacturers sold off during the year. Our position in an integrated telecommunications services company also detracted from performance. This was due mainly to our exposure to a Greek wireless company which sold off. Another line item that detracted was an off-index position in the oil and gas storage and transportation industry.
Investments that contributed to the Fund’s performance varied. The Fund’s primary contributors to performance were issuer selection in the oil and gas
exploration and production industry and issuer selection in the integrated telecommunication services industry. Avoidance of the non-captive consumer industry was beneficial as that was one of the worst performers during the reporting period. Finally, issuer selection in the technology industry also proved beneficial to Fund performance.
At the close of the reporting period, we remained generally positive in our assessment of high yield securities. However, while the economy appeared to be strengthening in the U.S., substantial obstacles remained, including resolution of U.S. deficits (the pending fiscal adjustment) and the European sovereign debt situation and its potential bank solvency and credit implications.
Thank you for investing in Invesco V.I. High Yield Fund and for sharing our long-term investment horizon.
The views and opinions expressed in management’s discussion of Fund performance are those of Invesco Advisers, Inc. These views and opinions are subject to change at any time based on factors such as market and economic conditions. These views and opinions may not be relied upon as investment advice or recommendations, or as an offer for a particular security. The information is not a complete analysis of every aspect of any market, country, industry, security or the Fund. Statements of fact are from sources considered reliable, but Invesco Advisers, Inc. makes no representation or warranty as to their completeness or accuracy. Although historical performance is no guarantee of future results, these insights may help you understand our investment management philosophy.
See important Fund and, if applicable, index disclosures later in this report.
Peter Ehret
Chartered Financial Analyst, portfolio manager, is lead manager of Invesco V.I. High Yield Fund. He joined Invesco in 2001. Mr. Ehret graduated cum laude with a B.S. in economics from the University of Minnesota. He also earned an M.S. in real estate appraisal and investment analysis from the University of Wisconsin-Madison.
Darren Hughes
Chartered Financial Analyst, portfolio manager, is manager of Invesco V.I. High Yield Fund. He joined Invesco in 1992. Mr. Hughes earned a B.B.A. in finance and economics from Baylor University.
Scott Roberts
Chartered Financial Analyst, portfolio manager, is manager of Invesco V.I. High Yield Fund. He joined Invesco in 2000. Mr. Roberts earned a B.B.A. in finance from the University of Houston.
Invesco V.I. High Yield Fund
Your Fund’s Long-Term Performance
Results of a $10,000 Investment – Oldest Share Class(es)
Fund and index data from 12/31/01*
| | |
| * | | During the reporting period, Invesco changed its policy regarding growth of $10,000 charts. For funds older than 10 years, we previously showed performance since inception. Going forward, we will show performance for the most recent 10 years, since this more accurately reflects the experience of the typical shareholder. As a result, charts now may include benchmarks that did not appear previously, because the funds’ inception pre-dated the benchmarks’ inception. Also, all charts will now be presented using a linear format. |
Past performance cannot guarantee comparable future results.
Average Annual Total Returns
As of 12/31/11
| | | | | |
|
Series I Shares | | | | |
| |
| Inception (5/1/98) | | | 3.40 | % |
| |
| 10 Years | | | 7.23 | |
| |
| 5 Years | | | 5.68 | |
| |
| 1 Year | | | 0.96 | |
| |
| | | | | |
Series II Shares | | | | |
| |
| 10 Years | | | 6.99 | % |
| |
| 5 Years | | | 5.41 | |
| |
| 1 Year | | | 0.61 | |
Performance includes litigation proceeds. Had these proceeds not been received, total return would have been lower.
Series II shares incepted on March 26, 2002. Performance shown prior to that date is that of Series I shares, restated to reflect the higher 12b-1 fees applicable to Series II. Series I performance reflects any applicable fee waivers or expense reimbursements. The performance of the Fund’s Series I and Series II share classes will differ primarily due to different class expenses.
The performance data quoted represent past performance and cannot guarantee comparable future results; current performance may be lower or
higher. Please contact your variable product issuer or financial adviser for the most recent month-end variable product performance. Performance figures reflect Fund expenses, reinvested distributions and changes in net asset value. Investment return and principal value will fluctuate so that you may have a gain or loss when you sell shares.
The net annual Fund operating expense ratio set forth in the most recent Fund prospectus as of the date of this report for Series I and Series II shares was 0.80% and 1.05%, respectively.1 The total annual Fund operating expense ratio set forth in the most recent Fund prospectus as of the date of this report for Series I and Series II shares was 1.09% and 1.34%, respectively. The expense ratios presented above may vary from the expense ratios presented in other sections of this report that are based on expenses incurred during the period covered by this report.
Invesco V.I. High Yield Fund, a series portfolio of AIM Variable Insurance Funds (Invesco Variable Insurance Funds), is currently offered through
insurance companies issuing variable products. You cannot purchase shares of the Fund directly. Performance figures given represent the Fund and are not intended to reflect actual variable product values. They do not reflect sales charges, expenses and fees assessed in connection with a variable product. Sales charges, expenses and fees, which are determined by the variable product issuers, will vary and will lower the total return.
The most recent month-end performance data at the Fund level, excluding variable product charges, is available at 800 451 4246. As mentioned above, for the most recent month-end performance including variable product charges, please contact your variable product issuer or financial adviser.
Had the adviser not waived fees and/ or expenses, performance would have been lower.
| | |
| 1 | | Total annual Fund operating expenses after any contractual fee waivers and/or expense reimbursements by the adviser in effect through at least June 30, 2013. See current prospectus for more information. |
Invesco V.I. High Yield Fund
Invesco V.I. High Yield Fund’s investment objective is total return, comprised of current income and capital appreciation.
| n | | Unless otherwise stated, information presented in this report is as of December 31, 2011, and is based on total net assets. |
| |
| n | | Unless otherwise noted, all data provided by Invesco. |
| |
| n | | To access your Fund’s reports/prospectus, visit invesco.com/fundreports. |
Principal risks of investing in the Fund
Credit risk. The issuer of instruments in which the Fund invests may be unable to meet interest and/or principal payments, thereby causing its instruments to decrease in value and lowering the issuer’s credit rating.
Developing markets securities risk. Securities issued by foreign companies and governments located in developing countries may be affected more negatively by inflation, devaluation of their currencies, higher transaction costs, delays in settlement, adverse political developments, the introduction of capital controls, withholding taxes, nationalization of private assets, expropriation, social unrest, war or lack of timely information than those in developed countries.
Foreign securities risk. The Fund’s foreign investments may be affected by changes in a foreign country’s exchange rates; political and social instability; changes in economic or taxation policies; difficulties when enforcing obligations; decreased liquidity; and increased volatility. Foreign companies may be subject to less regulation resulting in less publicly available information about the companies.
High yield bond (junk bond) risk. Junk bonds involve a greater risk of default or price changes due to changes in the credit quality of the issuer. The values of junk bonds fluctuate more than those of high-quality bonds in response to company, political, regulatory or economic developments. Values of junk bonds can decline significantly over short periods of time.
Interest rate risk. Interest rate risk refers to the risk that bond prices generally fall as interest rates rise; conversely, bond prices generally rise as interest rates fall. Specific bonds differ in their sensitivity to changes in interest rates depending on their individual characteristics, including duration.
Leverage risk. Leverage exists when the Fund purchases or sells an instrument or enters into a transaction without investing cash in an amount equal to the full economic exposure of the instrument or transaction and the Fund could lose more than it invested. Leverage created from borrowing or certain types of transactions or instruments, including derivatives, may impair the Fund’s liquidity, cause it to liquidate positions at an unfavorable time, increase volatility or otherwise not achieve its intended objective.
Management risk. The investment techniques and risk analysis used by the Fund’s portfolio managers may not produce the desired results.
Market risk. The prices of and the income generated by the Fund’s securities may decline in response to, among other things, investor sentiment; general economic and market conditions; regional or global instability; and currency and interest rate fluctuations.
Reinvestment risk. Reinvestment risk is the risk that a bond’s cash flows (coupon income and principal repayment) will be reinvested at an interest rate below that on the original bond.
About indexes used in this report
The Barclays Capital U.S. Aggregate Index is an unmanaged index considered representative of the U.S. investment-grade, fixed-rate bond market.
The Barclays Capital U.S. Corporate High Yield 2% Issuer Cap Index is an unmanaged index that covers U.S. corporate, fixed-rate, non-investment grade debt with at least one year to maturity and at least $150 million in par outstanding. Index weights for each issuer are capped at 2%.
The Lipper VUF High Current Yield Bond Funds Category Average represents an average of all of the variable insurance underlying funds in the Lipper High Current Yield Bond Funds category.
The Fund is not managed to track the performance of any particular index, including the index(es) defined here, and consequently, the performance of the Fund may deviate significantly from the performance of the index(es).
A direct investment cannot be made in an index. Unless otherwise indicated, index results include reinvested dividends, and they do not reflect sales charges. Performance of the peer group, if applicable, reflects fund expenses; performance of a market index does not.
Other information
The Chartered Financial Analyst® (CFA®) designation is globally recognized and attests to a charterholder’s success in a rigorous and comprehensive study program in the field of investment management and research analysis.
Industry classifications used in this report are generally according to the Global Industry Classification Standard, which was developed by and is the exclusive property and a service mark of MSCI Inc. and Standard & Poor’s.
The returns shown in management’s discussion of Fund performance are based on net asset values calculated for shareholder transactions. Generally accepted accounting principles require adjustments to be made to the net assets of the Fund at period end for financial reporting purposes, and as such, the net asset values for shareholder transactions and the returns based on those net asset values may differ from the net asset values and returns reported in the Financial Highlights. Additionally, the returns and net asset values shown throughout this report are at the Fund level only and do not include variable product issuer charges. If such charges were included, the total returns would be lower.
Invesco V.I. High Yield Fund
Schedule of Investments(a)
December 31, 2011
| | | | | | | | | |
| | | Principal
| | |
| | | Amount | | Value |
| |
U.S. Dollar Denominated Bonds and Notes–74.44%
| | | | |
Aerospace & Defense–0.81%
| | | | |
| BE Aerospace, Inc., Sr. Unsec. Notes, 6.88%, 10/01/20 | | $ | 115,000 | | | $ | 126,212 | |
| |
Bombardier Inc. (Canada), Sr. Unsec. Notes, 7.75%, 03/15/20(b) | | | 230,000 | | | | 251,850 | |
| |
Huntington Ingalls Industries Inc.,
Sr. Unsec. Gtd. Notes, | | | | | | | | |
6.88%, 03/15/18(b) | | | 165,000 | | | | 162,937 | |
| |
7.13%, 03/15/21(b) | | | 95,000 | | | | 93,813 | |
| |
| Spirit Aerosystems Inc., Sr. Unsec. Gtd. Global Notes, 6.75%, 12/15/20 | | | 240,000 | | | | 251,400 | |
| |
| Triumph Group, Inc., Sr. Unsec. Gtd. Sub. Global Notes, 8.00%, 11/15/17 | | | 20,000 | | | | 21,500 | |
| |
| | | | | | | | 907,712 | |
| |
Airlines–2.69%
| | | | |
American Airlines Inc., Sr. Sec. Gtd. Notes, 7.50%, 03/15/16(b)(c) | | | 1,015,000 | | | | 730,800 | |
| |
American Airlines Pass Through Trust, Series 2011-1, Class B, Sec. Gtd. Pass Through Ctfs., 7.00%, 01/31/18(b) | | | 79,472 | | | | 70,730 | |
| |
| Continental Airlines Inc., | | | | | | | | |
Series 2000-2, Class B,
Sec. Sub. Pass Through Ctfs.,
8.31%, 04/02/18 | | | 57,504 | | | | 56,354 | |
| |
Series 2007-1, Class C,
Sec. Sub. Global Pass Through Ctfs.,
7.34%, 04/19/14 | | | 300,872 | | | | 297,863 | |
| |
Series 2009-1,
Sec. Pass Through Ctfs.,
9.00%, 07/08/16 | | | 54,724 | | | | 60,333 | |
| |
Series 2009-2, Class B,
Sec. Global Pass Through Ctfs.,
9.25%, 05/10/17 | | | 146,689 | | | | 151,411 | |
| |
Delta Air Lines, Inc.,
Sec. Notes,
12.25%, 03/15/15(b) | | | 85,000 | | | | 90,100 | |
| |
Sr. Sec. Notes,
9.50%, 09/15/14(b) | | | 222,000 | | | | 229,215 | |
| |
Series 2002-1, Class C,
Sec. Pass Through Ctfs.,
7.78%, 01/02/12 | | | 9,495 | | | | 9,495 | |
| |
Series 2007-1, Class C,
Sec. Global Pass Through Ctfs.,
8.95%, 08/10/14 | | | 385,852 | | | | 378,135 | |
| |
Series 2010-1, Class B,
Sec. Pass Through Ctfs.,
6.38%, 01/02/16(b) | | | 85,000 | | | | 79,050 | |
| |
Series 2010-2, Class B,
Sec. Pass Through Ctfs.,
6.75%, 11/23/15(b) | | | 125,000 | | | | 116,250 | |
| |
| UAL Pass Through Trust, | | | | | | | | |
Series 2007-1, Class A,
Sec. Gtd. Global Pass Through Ctfs., 6.64%, 07/02/22 | | | 40,036 | | | | 39,911 | |
| |
Series 2007-1, Class B,
Sr. Sec. Gtd. Global Pass Through Ctfs., 7.34%, 07/02/19 | | | 116,944 | | | | 110,804 | |
| |
Series 2009-1,
Sr. Sec. Gtd. Global Pass Through Ctfs., 10.40%, 11/01/16 | | | 142,053 | | | | 158,035 | |
| |
Series 2009-2, Class B,
Sec. Gtd. Pass Through Ctfs.,
12.00%, 01/15/16(b) | | | 213,468 | | | | 223,074 | |
| |
US Airways Pass Through Trust, Series 1998-1, Class C, Sec. Pass Through Ctfs., 6.82%, 01/30/14 | | | 234,563 | | | | 209,934 | |
| |
| | | | | | | | 3,011,494 | |
| |
Alternative Carriers–1.17%
| | | | |
Cogent Communications Group, Inc.,
Sr. Sec. Gtd. Notes, 8.38%, 02/15/18(b) | | | 395,000 | | | | 407,837 | |
| |
Level 3 Communications Inc.,
Sr. Unsec. Global Notes, 11.88%, 02/01/19 | | | 245,000 | | | | 261,537 | |
| |
Level 3 Financing Inc.,
Sr. Unsec. Gtd. Global Notes, | | | | | | | | |
| 9.25%, 11/01/14 | | | 59,000 | | | | 60,328 | |
| |
| 9.38%, 04/01/19 | | | 335,000 | | | | 350,075 | |
| |
Sr. Unsec. Gtd. Notes, 8.13%, 07/01/19(b) | | | 230,000 | | | | 227,700 | |
| |
| | | | | | | | 1,307,477 | |
| |
Aluminum–0.85%
| | | | |
| Century Aluminum Co., Sr. Sec. Gtd. Notes, 8.00%, 05/15/14 | | | 950,630 | | | | 946,471 | |
| |
Apparel Retail–1.07%
| | | | |
Express LLC/Express Finance Corp.,
Sr. Unsec. Gtd. Global Notes, 8.75%, 03/01/18 | | | 390,000 | | | | 426,075 | |
| |
| Gap, Inc. (The), Sr. Unsec. Notes, 5.95%, 04/12/21 | | | 310,000 | | | | 296,437 | |
| |
| J. Crew Group, Inc., Sr. Unsec. Gtd. Global Notes, 8.13%, 03/01/19 | | | 305,000 | | | | 292,037 | |
| |
Limited Brands Inc.,
Sr. Unsec. Gtd. Global Notes, 8.50%, 06/15/19 | | | 100,000 | | | | 118,000 | |
| |
| Sr. Unsec. Gtd. Notes, | | | | | | | | |
| 6.63%, 04/01/21 | | | 40,000 | | | | 42,600 | |
| |
| 7.00%, 05/01/20 | | | 25,000 | | | | 27,188 | |
| |
| | | | | | | | 1,202,337 | |
| |
Apparel, Accessories & Luxury Goods–1.93%
| | | | |
| Hanesbrands Inc., Sr. Unsec. Gtd. Global Notes, 6.38%, 12/15/20 | | | 575,000 | | | | 587,937 | |
| |
| Jones Group Inc. (The), Sr. Unsec. Notes, 6.88%, 03/15/19 | | | 625,000 | | | | 565,625 | |
| |
See accompanying Notes to Financial Statements which are an integral part of the financial statements.
Invesco V.I. High Yield Fund
| | | | | | | | | |
| | | Principal
| | |
| | | Amount | | Value |
| |
Apparel, Accessories & Luxury Goods–(continued)
| | | | |
| | | | | | | | | |
| Levi Strauss & Co., Sr. Unsec. Global Notes, 7.63%, 05/15/20 | | $ | 525,000 | | | $ | 539,438 | |
| |
| Quiksilver Inc., Sr. Unsec. Gtd. Global Notes, 6.88%, 04/15/15 | | | 505,000 | | | | 469,650 | |
| |
| | | | | | | | 2,162,650 | |
| |
Auto Parts & Equipment–1.29%
| | | | |
Allison Transmission Inc., Sr. Unsec. Gtd Notes, 7.13%, 05/15/19(b) | | | 360,000 | | | | 354,600 | |
| |
| American Axle & Manufacturing, Inc., Sr. Unsec. Gtd. Notes, 7.75%, 11/15/19 | | | 315,000 | | | | 310,275 | |
| |
| Dana Holding Corp., Sr. Unsec. Notes, 6.75%, 02/15/21 | | | 450,000 | | | | 462,375 | |
| |
Tenneco Inc., Sr. Unsec. Gtd. Global Notes,
6.88%, 12/15/20 | | | 190,000 | | | | 196,650 | |
| |
| 7.75%, 08/15/18 | | | 110,000 | | | | 116,875 | |
| |
| | | | | | | | 1,440,775 | |
| |
Automobile Manufacturers–1.15%
| | | | |
Chrysler Group LLC/CG Co.-Issuer Inc.,
Sr. Sec. Gtd. Notes, 8.00%, 06/15/19(b) | | | 450,000 | | | | 412,875 | |
| |
| Ford Motor Co., Sr. Unsec. Global Notes, 7.45%, 07/16/31 | | | 720,000 | | | | 864,000 | |
| |
Motors Liquidation Corp.,
Sr. Unsec. Global Notes, 7.20%(c)(d) | | | 445,000 | | | | 3,682 | |
| |
Sr. Unsec. Notes, 8.38%, 07/15/33(c)(d) | | | 755,000 | | | | 6,268 | |
| |
| | | | | | | | 1,286,825 | |
| |
Biotechnology–0.22%
| | | | |
| Grifols Inc., Sr. Unsec. Gtd. Global Notes, 8.25%, 02/01/18 | | | 70,000 | | | | 73,850 | |
| |
Savient Pharmaceuticals Inc., Sr. Unsec. Conv. Notes,
4.75%, 02/01/18 | | | 90,000 | | | | 43,200 | |
| |
STHI Holding Corp., Sec. Gtd. Notes, 8.00%, 03/15/18(b) | | | 125,000 | | | | 129,063 | |
| |
| | | | | | | | 246,113 | |
| |
Broadcasting–0.41%
| | | | |
| Allbritton Communications Co., Sr. Unsec. Global Notes, 8.00%, 05/15/18 | | | 130,000 | | | | 130,000 | |
| |
| Clear Channel Communications, Inc., Sr. Sec. Gtd. Global Notes, 9.00%, 03/01/21 | | | 395,000 | | | | 333,775 | |
| |
| | | | | | | | 463,775 | |
| |
Building Products–3.73%
| | | | |
American Standard Americas, Sr. Sec. Notes, 10.75%, 01/15/16(b) | | | 310,000 | | | | 184,450 | |
| |
Associated Materials LLC, Sr. Sec. Gtd. Global Notes,
9.13%, 11/01/17 | | | 455,000 | | | | 403,813 | |
| |
Building Materials Corp. of America,
Sr. Sec. Gtd. Notes, 7.50%, 03/15/20(b) | | | 370,000 | | | | 399,600 | |
| |
Sr. Unsec. Notes,
6.75%, 05/01/21(b) | | | 150,000 | | | | 158,250 | |
| |
6.88%, 08/15/18(b) | | | 490,000 | | | | 514,500 | |
| |
| Gibraltar Industries Inc., Series B, Sr. Unsec. Gtd. Sub. Global Notes, 8.00%, 12/01/15 | | | 535,000 | | | | 537,675 | |
| |
Nortek Inc.,
Sr. Unsec. Gtd. Notes, | | | | | | | | |
8.50%, 04/15/21(b) | | | 770,000 | | | | 655,462 | |
| |
10.00%, 12/01/18(b) | | | 140,000 | | | | 133,350 | |
| |
Ply Gem Industries Inc.,
Sr. Sec. Gtd. Global Notes, 8.25%, 02/15/18 | | | 215,000 | | | | 188,394 | |
| |
Sr. Unsec. Gtd. Sub. Global Notes, 13.13%, 07/15/14 | | | 265,000 | | | | 235,850 | |
| |
Roofing Supply Group LLC/Roofing Supply Finance Inc., Sr. Sec. Notes, 8.63%, 12/01/17(b) | | | 472,000 | | | | 482,620 | |
| |
USG Corp.,
Sr. Unsec. Gtd. Notes, | | | | | | | | |
8.38%, 10/15/18(b) | | | 25,000 | | | | 23,125 | |
| |
9.75%, 08/01/14(b) | | | 105,000 | | | | 107,100 | |
| |
Sr. Unsec. Notes, 9.75%, 01/15/18 | | | 180,000 | | | | 154,800 | |
| |
| | | | | | | | 4,178,989 | |
| |
Cable & Satellite–0.73%
| | | | |
| EH Holding Corp., | | | | | | | | |
Sr. Sec. Gtd. Notes, 6.50%, 06/15/19(b) | | | 140,000 | | | | 146,650 | |
| |
Sr. Unsec. Gtd. Notes, 7.63%, 06/15/21(b) | | | 80,000 | | | | 84,300 | |
| |
Kabel BW (Germany), Sr. Sec. Gtd. Notes, 7.50%, 03/15/19(b) | | | 560,000 | | | | 590,800 | |
| |
| | | | | | | | 821,750 | |
| |
Casinos & Gaming–3.76%
| | | | |
Ameristar Casinos Inc., Sr. Unsec. Gtd. Global Notes,
7.50%, 04/15/21 | | | 345,000 | | | | 357,075 | |
| |
| Caesars Entertainment Operating Co. Inc., | | | | | | | | |
Sec. Gtd. Global Notes, 12.75%, 04/15/18 | | | 265,000 | | | | 212,000 | |
| |
Sr. Sec. Gtd. Global Notes, 11.25%, 06/01/17 | | | 171,000 | | | | 182,542 | |
| |
Sr. Unsec. Gtd. Global Bonds, 5.63%, 06/01/15 | | | 389,000 | | | | 217,840 | |
| |
CityCenter Holdings LLC/CityCenter Finance Corp.,
Sr. Sec. Gtd. Notes, 7.63%, 01/15/16(b) | | | 15,000 | | | | 15,413 | |
| |
Sr. Sec. Gtd. PIK Notes, 10.75%, 01/15/17(b) | | | 248,890 | | | | 257,601 | |
| |
| Mandalay Resort Group, Sr. Unsec. Gtd. Sub. Notes, 7.63%, 07/15/13 | | | 200,000 | | | | 199,500 | |
| |
MGM Resorts International,
Sr. Unsec. Gtd. Conv. Notes, 4.25%, 04/15/15 | | | 95,000 | | | | 90,369 | |
| |
| Sr. Unsec. Gtd. Global Notes, | | | | | | | | |
| 6.63%, 07/15/15 | | | 393,000 | | | | 376,789 | |
| |
| 6.75%, 04/01/13 | | | 405,000 | | | | 410,062 | |
| |
Sr. Unsec. Gtd. Notes, 5.88%, 02/27/14 | | | 10,000 | | | | 9,725 | |
| |
See accompanying Notes to Financial Statements which are an integral part of the financial statements.
Invesco V.I. High Yield Fund
| | | | | | | | | |
| | | Principal
| | |
| | | Amount | | Value |
| |
Casinos & Gaming–(continued)
| | | | |
| | | | | | | | | |
Midwest Gaming Borrower LLC/ Midwest Finance Corp., Sr. Sec. Notes, 11.63%, 04/15/16(b) | | $ | 45,000 | | | $ | 49,050 | |
| |
Pinnacle Entertainment Inc.,
Sr. Unsec. Gtd. Global Notes, 8.63%, 08/01/17 | | | 145,000 | | | | 154,063 | |
| |
Scientific Games International Inc.,
Sr. Unsec. Gtd. Sub. Global Notes, 9.25%, 06/15/19 | | | 195,000 | | | | 207,187 | |
| |
Seneca Gaming Corp., Sr. Unsec. Gtd. Notes, 8.25%, 12/01/18(b) | | | 180,000 | | | | 175,950 | |
| |
Snoqualmie Entertainment Authority,
Sr. Sec. Floating Rate Notes, 4.18%, 02/01/14(b)(e) | | | 300,000 | | | | 268,500 | |
| |
Sr. Sec. Notes, 9.13%, 02/01/15(b) | | | 440,000 | | | | 422,400 | |
| |
Wynn Las Vegas LLC/Wynn Las Vegas Capital Corp.,
Sec. Gtd. First Mortgage Global Notes, 7.75%, 08/15/20 | | | 450,000 | | | | 500,625 | |
| |
Sr. Sec. Gtd. First Mortgage Global Notes, 7.88%, 11/01/17 | | | 90,000 | | | | 98,944 | |
| |
| | | | | | | | 4,205,635 | |
| |
Coal & Consumable Fuels–0.45%
| | | | |
CONSOL Energy Inc., Sr. Unsec. Gtd. Global Notes,
8.00%, 04/01/17 | | | 35,000 | | | | 38,587 | |
| |
| 8.25%, 04/01/20 | | | 70,000 | | | | 77,700 | |
| |
Peabody Energy Corp., Sr. Unsec. Gtd. Notes,
6.00%, 11/15/18(b) | | | 380,000 | | | | 389,500 | |
| |
| | | | | | | | 505,787 | |
| |
Communications Equipment–0.44%
| | | | |
Avaya Inc., Sr. Sec. Gtd. Notes, 7.00%, 04/01/19(b) | | | 505,000 | | | | 492,375 | |
| |
Computer & Electronics Retail–0.55%
| | | | |
Rent-A-Center Inc., Sr. Unsec. Gtd Global Notes, 6.63%, 11/15/20 | | | 605,000 | | | | 611,050 | |
| |
Computer Storage & Peripherals–0.34%
| | | | |
Seagate HDD Cayman, Sr. Unsec. Gtd. Notes, 7.00%, 11/01/21(b) | | | 365,000 | | | | 375,950 | |
| |
Construction & Engineering–1.37%
| | | | |
| Dycom Investments Inc., Sr. Unsec. Gtd. Sub. Global Notes, 7.13%, 01/15/21 | | | 585,000 | | | | 593,775 | |
| |
| MasTec, Inc., Sr. Unsec. Gtd. Global Notes, 7.63%, 02/01/17 | | | 315,000 | | | | 328,781 | |
| |
| Tutor Perini Corp., Sr. Unsec. Gtd. Global Notes, 7.63%, 11/01/18 | | | 650,000 | | | | 614,250 | |
| |
| | | | | | | | 1,536,806 | |
| |
Construction & Farm Machinery & Heavy Trucks–1.05%
| | | | |
| Case New Holland Inc., Sr. Unsec. Gtd. Global Notes, 7.88%, 12/01/17 | | | 215,000 | | | | 244,025 | |
| |
Commercial Vehicle Group, Inc., Sr. Sec. Gtd. Notes, 7.88%, 04/15/19(b) | | | 235,000 | | | | 227,656 | |
| |
| Manitowoc Co. Inc. (The), Sr. Unsec. Gtd. Notes, 8.50%, 11/01/20 | | | 105,000 | | | | 110,250 | |
| |
Navistar International Corp., Sr. Unsec. Gtd. Notes,
8.25%, 11/01/21 | | | 270,000 | | | | 287,550 | |
| |
Titan International Inc., Sr. Sec. Gtd. Global Notes,
7.88%, 10/01/17 | | | 290,000 | | | | 303,050 | |
| |
| | | | | | | | 1,172,531 | |
| |
Construction Materials–0.81%
| | | | |
Cemex Finance LLC, Sr. Sec. Gtd. Bonds, 9.50%, 12/14/16(b) | | | 495,000 | | | | 434,548 | |
| |
| Cemex S.A.B. de C.V. (Mexico), Unsec. Sub. Conv. Notes, 4.88%, 03/15/15 | | | 100,000 | | | | 65,750 | |
| |
Texas Industries Inc., Sr. Unsec. Gtd. Global Notes,
9.25%, 08/15/20 | | | 415,000 | | | | 373,500 | |
| |
U.S. Concrete Inc., Sr. Sec. Conv. Notes, 9.50%, 08/31/15(b) | | | 40,000 | | | | 38,200 | |
| |
| | | | | | | | 911,998 | |
| |
Consumer Finance–2.50%
| | | | |
Ally Financial Inc.,
Sr. Unsec. Gtd. Global Notes, | | | | | | | | |
| 7.50%, 09/15/20 | | | 260,000 | | | | 263,900 | |
| |
| 8.00%, 03/15/20 | | | 1,065,000 | | | | 1,096,950 | |
| |
| 8.00%, 11/01/31 | | | 216,000 | | | | 208,980 | |
| |
Ford Motor Credit Co. LLC,
Sr. Unsec. Notes, | | | | | | | | |
| 5.88%, 08/02/21 | | | 500,000 | | | | 521,250 | |
| |
| 8.00%, 12/15/16 | | | 245,000 | | | | 281,138 | |
| |
| National Money Mart Co. (Canada), Sr. Unsec. Gtd. Global Notes, 10.38%, 12/15/16 | | | 395,000 | | | | 423,637 | |
| |
| | | | | | | | 2,795,855 | |
| |
Data Processing & Outsourced Services–0.86%
| | | | |
CoreLogic, Inc., Sr. Unsec. Gtd. Notes, 7.25%, 06/01/21(b) | | | 670,000 | | | | 643,200 | |
| |
First Data Corp., Sr. Sec. Gtd. Notes, 7.38%, 06/15/19(b) | | | 135,000 | | | | 127,575 | |
| |
SunGard Data Systems Inc.,
Sr. Unsec. Gtd. Global Notes, | | | | | | | | |
| 7.38%, 11/15/18 | | | 65,000 | | | | 66,788 | |
| |
| 7.63%, 11/15/20 | | | 123,000 | | | | 126,997 | |
| |
| | | | | | | | 964,560 | |
| |
Department Stores–0.24%
| | | | |
| Sears Holdings Corp., Sr. Sec. Gtd. Global Notes, 6.63%, 10/15/18 | | | 350,000 | | | | 267,750 | |
| |
| | | | | | | | | |
| | | | | | | | | |
See accompanying Notes to Financial Statements which are an integral part of the financial statements.
Invesco V.I. High Yield Fund
| | | | | | | | | |
| | | Principal
| | |
| | | Amount | | Value |
| |
Distillers & Vintners–0.48%
| | | | |
CEDC Finance Corp. International Inc.,
Sr. Sec. Gtd. Notes, 9.13%, 12/01/16(b) | | $ | 305,000 | | | $ | 215,025 | |
| |
| Constellation Brands Inc., Sr. Unsec. Gtd. Global Notes, 7.25%, 05/15/17 | | | 295,000 | | | | 323,762 | |
| |
| | | | | | | | 538,787 | |
| |
Diversified Banks–0.07%
| | | | |
RBS Capital Trust II, Jr. Unsec. Gtd. Sub. Global Bonds, 6.43%(f)(g) | | | 150,000 | | | | 77,625 | |
| |
Diversified Commercial & Professional Services–0.01%
| | | | |
| Corrections Corp. of America, Sr. Unsec. Gtd. Global Notes, 6.25%, 03/15/13 | | | 10,000 | | | | 10,019 | |
| |
Diversified Metals & Mining–0.65%
| | | | |
FMG Resources Pty. Ltd. (Australia),
Sr. Unsec. Gtd. Notes, | | | | | | | | |
6.38%, 02/01/16(b) | | | 250,000 | | | | 243,131 | |
| |
7.00%, 11/01/15(b) | | | 185,000 | | | | 187,775 | |
| |
Midwest Vanadium Pty. Ltd. (Australia),
Sr. Sec. Gtd. Mortgage Notes, 11.50%, 02/15/18(b) | | | 65,000 | | | | 47,797 | |
| |
Vedanta Resources PLC (United Kingdom),
Sr. Unsec. Notes, 9.50%, 07/18/18(b) | | | 295,000 | | | | 252,385 | |
| |
| | | | | | | | 731,088 | |
| |
Electric Utilities–0.47%
| | | | |
Centrais Eletricas Brasileiras S.A. (Brazil),
Sr. Unsec. Notes, 5.75%, 10/27/21(b) | | | 230,000 | | | | 241,107 | |
| |
| Edison Mission Energy, Sr. Unsec. Notes, 7.50%, 06/15/13 | | | 10,000 | | | | 9,700 | |
| |
LSP Energy L.P./LSP Batesville Funding Corp.,
Series C, Sr. Sec. Mortgage Bonds, 7.16%, 01/15/14 | | | 61,046 | | | | 50,515 | |
| |
Series D, Sr. Sec. Bonds, 8.16%, 07/15/25 | | | 275,000 | | | | 228,250 | |
| |
| | | | | | | | 529,572 | |
| |
Electrical Components & Equipment–0.06%
| | | | |
| Polypore International Inc., Sr. Unsec. Gtd. Global Notes, 7.50%, 11/15/17 | | | 65,000 | | | | 67,438 | |
| |
Electronic Manufacturing Services–0.38%
| | | | |
Sanmina-SCI Corp., Sr. Unsec. Gtd. Notes, 7.00%, 05/15/19(b) | | | 440,000 | | | | 421,300 | |
| |
Environmental & Facilities Services–0.10%
| | | | |
| EnergySolutions Inc./LLC, Sr. Unsec. Gtd. Global Notes, 10.75%, 08/15/18 | | | 125,000 | | | | 117,500 | |
| |
Food Retail–0.30%
| | | | |
| New Albertsons Inc., Sr. Unsec. Bonds, 8.00%, 05/01/31 | | | 205,000 | | | | 164,512 | |
| |
Simmons Foods Inc., Sec. Notes, 10.50%, 11/01/17(b) | | | 205,000 | | | | 172,200 | |
| |
| | | | | | | | 336,712 | |
| |
Forest Products–0.19%
| | | | |
Millar Western Forest Products Ltd. (Canada), Sr. Unsec. Notes, 8.50%, 04/01/21(b) | | | 260,000 | | | | 200,850 | |
| |
Sino-Forest Corp. (Canada), Sr. Unsec. Gtd. Notes, 6.25%, 10/21/17(b) | | | 30,000 | | | | 8,250 | |
| |
| | | | | | | | 209,100 | |
| |
Gas Utilities–0.72%
| | | | |
| Ferrellgas L.P./Ferrellgas Finance Corp., Sr. Unsec. Global Notes, 6.50%, 05/01/21 | | | 433,000 | | | | 383,205 | |
| |
| Suburban Propane Partners, L.P./Suburban Energy Finance Corp., Sr. Unsec. Notes, 7.38%, 03/15/20 | | | 410,000 | | | | 428,450 | |
| |
| | | | | | | | 811,655 | |
| |
Health Care Equipment–0.28%
| | | | |
DJO Finance LLC/Corp.,
Sr. Unsec. Gtd. Global Notes, | | | | | | | | |
| 7.75%, 04/15/18 | | | 35,000 | | | | 26,775 | |
| |
| 10.88%, 11/15/14 | | | 195,000 | | | | 182,813 | |
| |
Sr. Unsec. Gtd. Sub. Global Notes, 9.75%, 10/15/17 | | | 130,000 | | | | 101,400 | |
| |
| | | | | | | | 310,988 | |
| |
Health Care Facilities–1.82%
| | | | |
| HCA, Inc., | | | | | | | | |
Sr. Sec. Gtd. Global Notes, 7.88%, 02/15/20 | | | 288,000 | | | | 312,480 | |
| |
Sr. Unsec. Notes, 7.19%, 11/15/15 | | | 155,000 | | | | 156,356 | |
| |
| Health Management Associates Inc., Sr. Sec. Gtd. Notes, 6.13%, 04/15/16 | | | 70,000 | | | | 72,625 | |
| |
HealthSouth Corp.,
Sr. Unsec. Gtd. Notes, | | | | | | | | |
| 7.25%, 10/01/18 | | | 90,000 | | | | 89,550 | |
| |
| 7.75%, 09/15/22 | | | 85,000 | | | | 83,938 | |
| |
| 8.13%, 02/15/20 | | | 90,000 | | | | 91,125 | |
| |
Select Medical Holdings Corp., Sr. Unsec. Floating Rate Global Notes, 6.27%, 09/15/15(e) | | | 155,000 | | | | 134,075 | |
| |
Tenet Healthcare Corp.,
Sr. Sec. Gtd. Global Notes, 10.00%, 05/01/18 | | | 180,000 | | | | 206,550 | |
| |
| Sr. Unsec. Global Notes, | | | | | | | | |
| 8.00%, 08/01/20 | | | 310,000 | | | | 310,000 | |
| |
| 9.25%, 02/01/15 | | | 545,000 | | | | 580,425 | |
| |
| | | | | | | | 2,037,124 | |
| |
Health Care Services–0.41%
| | | | |
| Radnet Management Inc., Sr. Unsec. Gtd. Global Notes, 10.38%, 04/01/18 | | | 225,000 | | | | 201,375 | |
| |
| Universal Hospital Services Inc., Sec. Gtd. PIK Global Notes, 8.50%, 06/01/15 | | | 250,000 | | | | 254,062 | |
| |
| | | | | | | | 455,437 | |
| |
Health Care Supplies–0.12%
| | | | |
| Alere Inc., Sr. Unsec. Gtd. Sub. Notes, 9.00%, 05/15/16 | | | 135,000 | | | | 137,025 | |
| |
| | | | | | | | | |
| | | | | | | | | |
See accompanying Notes to Financial Statements which are an integral part of the financial statements.
Invesco V.I. High Yield Fund
| | | | | | | | | |
| | | Principal
| | |
| | | Amount | | Value |
| |
Health Care Technology–0.29%
| | | | |
| MedAssets Inc., Sr. Unsec. Gtd. Global Notes, 8.00%, 11/15/18 | | $ | 330,000 | | | $ | 325,050 | |
| |
Homebuilding–1.19%
| | | | |
Beazer Homes USA Inc.,
Sr. Unsec. Gtd. Global Notes, | | | | | | | | |
| 6.88%, 07/15/15 | | | 140,000 | | | | 105,350 | |
| |
| 8.13%, 06/15/16 | | | 300,000 | | | | 223,500 | |
| |
| K. Hovnanian Enterprises Inc., Sr. Sec. Gtd. Global Notes, 10.63%, 10/15/16 | | | 490,000 | | | | 392,000 | |
| |
| Lennar Corp., Sr. Unsec. Gtd. Global Notes, 6.95%, 06/01/18 | | | 435,000 | | | | 424,125 | |
| |
| M/I Homes Inc., Sr. Unsec. Gtd. Global Notes, 8.63%, 11/15/18 | | | 205,000 | | | | 181,937 | |
| |
| | | | | | | | 1,326,912 | |
| |
Hotels, Resorts & Cruise Lines–0.15%
| | | | |
Royal Caribbean Cruises Ltd.,
Sr. Unsec. Global Notes, | | | | | | | | |
| 7.25%, 03/15/18 | | | 85,000 | | | | 89,462 | |
| |
| 7.50%, 10/15/27 | | | 75,000 | | | | 73,688 | |
| |
| | | | | | | | 163,150 | |
| |
Household Products–0.29%
| | | | |
| Central Garden & Pet Co., Sr. Gtd. Sub. Notes, 8.25%, 03/01/18 | | | 325,000 | | | | 320,938 | |
| |
Housewares & Specialties–0.45%
| | | | |
| American Greetings Corp., Sr. Unsec. Gtd. Notes, 7.38%, 12/01/21 | | | 500,000 | | | | 506,875 | |
| |
Independent Power Producers & Energy Traders–1.02%
| | | | |
| AES Corp. (The), | | | | | | | | |
| Sr. Unsec. Global Notes, | | | | | | | | |
| 7.75%, 10/15/15 | | | 340,000 | | | | 369,750 | |
| |
| 8.00%, 10/15/17 | | | 190,000 | | | | 209,000 | |
| |
| AES Red Oak LLC, Series A, Sr. Sec. Bonds, 8.54%, 11/30/19 | | | 207,274 | | | | 213,492 | |
| |
Calpine Corp., Sr. Sec. Notes, 7.25%, 10/15/17(b) | | | 335,000 | | | | 350,075 | |
| |
| | | | | | | | 1,142,317 | |
| |
Industrial Conglomerates–0.00%
| | | | |
Indalex Holding Corp., Series B, Sec. Gtd. Global Notes, 11.50%, 02/01/14(c) | | | 230,000 | | | | 2,013 | |
| |
Industrial Machinery–0.44%
| | | | |
Cleaver-Brooks Inc., Sr. Sec. Notes, 12.25%, 05/01/16(b) | | | 305,000 | | | | 308,050 | |
| |
| Columbus McKinnon Corp., Sr. Unsec. Gtd. Sub. Global Notes, 7.88%, 02/01/19 | | | 25,000 | | | | 26,094 | |
| |
| SPX Corp., Sr. Unsec. Gtd. Global Notes, 6.88%, 09/01/17 | | | 145,000 | | | | 157,325 | |
| |
| | | | | | | | 491,469 | |
| |
Industrial REIT’s–0.10%
| | | | |
| DuPont Fabros Technology L.P., Sr. Unsec. Gtd. Global Notes, 8.50%, 12/15/17 | | | 100,000 | | | | 107,750 | |
| |
Integrated Telecommunication Services–1.08%
| | | | |
Integra Telecom Holdings Inc., Sr. Sec. Notes, 10.75%, 04/15/16(b) | | | 200,000 | | | | 162,000 | |
| |
Intelsat Jackson Holdings S.A. (Luxembourg),
Sr. Unsec. Gtd. Global Notes, 7.25%, 10/15/20 | | | 415,000 | | | | 424,337 | |
| |
| Sr. Unsec. Gtd. Notes, | | | | | | | | |
7.25%, 04/01/19(b) | | | 130,000 | | | | 133,250 | |
| |
7.50%, 04/01/21(b) | | | 390,000 | | | | 399,750 | |
| |
Windstream Corp., Sr. Unsec. Gtd. Notes, 7.50%, 06/01/22(b) | | | 95,000 | | | | 95,475 | |
| |
| | | | | | | | 1,214,812 | |
| |
Internet Retail–0.07%
| | | | |
| Travelport LLC/Inc., Sr. Unsec. Gtd. Global Notes, 9.00%, 03/01/16 | | | 135,000 | | | | 76,613 | |
| |
Internet Software & Services–0.30%
| | | | |
| Equinix Inc., | | | | | | | | |
| Sr. Unsec. Notes, | | | | | | | | |
| 7.00%, 07/15/21 | | | 50,000 | | | | 53,250 | |
| |
| 8.13%, 03/01/18 | | | 255,000 | | | | 281,775 | |
| |
| | | | | | | | 335,025 | |
| |
Investment Banking & Brokerage–0.48%
| | | | |
Cantor Fitzgerald L.P., Bonds, 7.88%, 10/15/19(b) | | | 325,000 | | | | 326,135 | |
| |
| E*Trade Financial Corp., | | | | | | | | |
| Sr. Unsec. Notes, | | | | | | | | |
| 6.75%, 06/01/16 | | | 100,000 | | | | 97,500 | |
| |
| 7.88%, 12/01/15 | | | 110,000 | | | | 111,100 | |
| |
| | | | | | | | 534,735 | |
| |
Leisure Facilities–0.06%
| | | | |
| Speedway Motorsports Inc., Sr. Unsec. Gtd. Global Notes, 6.75%, 02/01/19 | | | 70,000 | | | | 71,050 | |
| |
Leisure Products–0.50%
| | | | |
Toys R US-Delaware Inc., Sr. Sec. Gtd. Notes, 7.38%, 09/01/16(b) | | | 550,000 | | | | 558,250 | |
| |
Life Sciences Tools & Services–0.14%
| | | | |
Patheon Inc. (Canada), Sr. Sec. Gtd. Notes, 8.63%, 04/15/17(b) | | | 190,000 | | | | 153,900 | |
| |
Marine–0.11%
| | | | |
| Navios Maritime Acquisition Corp./Navios Acquisition Finance U.S. Inc. (Greece), Sr. Sec. Gtd. Global Notes, 8.63%, 11/01/17 | | | 40,000 | | | | 28,600 | |
| |
| Stena A.B. (Sweden), Sr. Unsec. Global Notes, 7.00%, 12/01/16 | | | 105,000 | | | | 96,994 | |
| |
| | | | | | | | 125,594 | |
| |
| | | | | | | | | |
| | | | | | | | | |
See accompanying Notes to Financial Statements which are an integral part of the financial statements.
Invesco V.I. High Yield Fund
| | | | | | | | | |
| | | Principal
| | |
| | | Amount | | Value |
| |
Movies & Entertainment–1.04%
| | | | |
AMC Entertainment Inc.,
Sr. Gtd. Sub. Global Notes, 9.75%, 12/01/20 | | $ | 400,000 | | | $ | 382,000 | |
| |
Sr. Unsec. Gtd. Global Notes, 8.75%, 06/01/19 | | | 314,000 | | | | 326,168 | |
| |
NAI Entertainment Holdings LLC, Sr. Sec. Notes, 8.25%, 12/15/17(b) | | | 430,000 | | | | 457,412 | |
| |
| | | | | | | | 1,165,580 | |
| |
Multi-Line Insurance–1.75%
| | | | |
American International Group Inc.,
Jr. Unsec. Sub. Global Deb., 8.18%, 05/15/58 | | | 380,000 | | | | 344,850 | |
| |
Fairfax Financial Holdings Ltd. (Canada),
Sr. Unsec. Notes, 5.80%, 05/15/21(b) | | | 255,000 | | | | 241,613 | |
| |
Hartford Financial Services Group Inc. (The),
Jr. Unsec. Sub. Deb., 8.13%, 06/15/38 | | | 190,000 | | | | 189,050 | |
| |
Sr. Unsec. Global Notes, 5.95%, 10/15/36 | | | 90,000 | | | | 83,149 | |
| |
Liberty Mutual Group Inc., Jr. Unsec. Gtd. Sub. Bonds, 7.80%, 03/15/37 (Acquired 09/16/10-10/01/10; Cost $471,375)(b) | | | 495,000 | | | | 444,262 | |
| |
Nationwide Mutual Insurance Co.,
Unsec. Sub. Notes, 9.38%, 08/15/39(b) | | | 545,000 | | | | 657,275 | |
| |
| | | | | | | | 1,960,199 | |
| |
Multi-Sector Holdings–0.16%
| | | | |
Reynolds Group Issuer Inc./LLC/Luxembourg S.A., Sr. Unsec. Gtd. Notes, 8.25%, 02/15/21(b) | | | 200,000 | | | | 178,000 | |
| |
Office Services & Supplies–0.26%
| | | | |
| IKON Office Solutions, Inc., Sr. Unsec. Notes, 6.75%, 12/01/25 | | | 265,000 | | | | 259,037 | |
| |
| Interface Inc., Sr. Unsec. Gtd. Global Notes, 7.63%, 12/01/18 | | | 35,000 | | | | 37,188 | |
| |
| | | | | | | | 296,225 | |
| |
Oil & Gas Equipment & Services–1.35%
| | | | |
| Bristow Group, Inc., Sr. Unsec. Gtd. Global Notes, 7.50%, 09/15/17 | | | 530,000 | | | | 548,550 | |
| |
| Key Energy Services, Inc., Sr. Unsec. Gtd. Notes, 6.75%, 03/01/21 | | | 805,000 | | | | 809,025 | |
| |
| SESI LLC, Sr. Unsec. Gtd. Global Notes, 6.38%, 05/01/19 | | | 145,000 | | | | 148,625 | |
| |
| | | | | | | | 1,506,200 | |
| |
Oil & Gas Exploration & Production–4.78%
| | | | |
| Berry Petroleum Co., Sr. Unsec. Notes, 6.75%, 11/01/20 | | | 95,000 | | | | 96,544 | |
| |
Chaparral Energy Inc.,
Sr. Unsec. Gtd. Global Notes, | | | | | | | | |
| 8.25%, 09/01/21 | | | 305,000 | | | | 310,337 | |
| |
| 8.88%, 02/01/17 | | | 295,000 | | | | 305,694 | |
| |
Chesapeake Energy Corp.,
Sr. Unsec. Gtd. Global Notes, 6.88%, 11/15/20 | | | 185,000 | | | | 197,025 | |
| |
Sr. Unsec. Gtd. Notes, 6.13%, 02/15/21 | | | 185,000 | | | | 190,319 | |
| |
| Cimarex Energy Co., Sr. Unsec. Gtd. Notes, 7.13%, 05/01/17 | | | 65,000 | | | | 68,169 | |
| |
Continental Resources Inc.,
Sr. Unsec. Gtd. Global Notes, | | | | | | | | |
| 7.13%, 04/01/21 | | | 85,000 | | | | 92,438 | |
| |
| 7.38%, 10/01/20 | | | 190,000 | | | | 207,812 | |
| |
| 8.25%, 10/01/19 | | | 130,000 | | | | 143,487 | |
| |
| EXCO Resources Inc., Sr. Unsec. Gtd. Notes, 7.50%, 09/15/18 | | | 590,000 | | | | 560,500 | |
| |
| Forest Oil Corp., Sr. Unsec. Gtd. Global Notes, 7.25%, 06/15/19 | | | 195,000 | | | | 196,950 | |
| |
| McMoRan Exploration Co., Sr. Unsec. Gtd. Notes, 11.88%, 11/15/14 | | | 200,000 | | | | 213,500 | |
| |
| Newfield Exploration Co., Sr. Unsec. Sub. Global Notes, 7.13%, 05/15/18 | | | 518,000 | | | | 547,759 | |
| |
OGX Petroleo e Gas Participacoes S.A. (Brazil),
Sr. Unsec. Gtd. Notes, 8.50%, 06/01/18(b) | | | 260,000 | | | | 256,290 | |
| |
Plains Exploration & Production Co.,
Sr. Unsec. Gtd. Notes, | | | | | | | | |
| 7.63%, 06/01/18 | | | 520,000 | | | | 553,800 | |
| |
| 8.63%, 10/15/19 | | | 100,000 | | | | 110,250 | |
| |
| Range Resources Corp., Sr. Unsec. Gtd. Sub. Notes, 5.75%, 06/01/21 | | | 340,000 | | | | 366,350 | |
| |
SM Energy Co.,
Sr. Unsec. Notes, | | | | | | | | |
6.63%, 02/15/19(b) | | | 140,000 | | | | 144,900 | |
| |
6.50%, 11/15/21(b) | | | 680,000 | | | | 703,800 | |
| |
| Whiting Petroleum Corp., Sr. Unsec. Gtd. Sub. Notes, 6.50%, 10/01/18 | | | 80,000 | | | | 83,700 | |
| |
| | | | | | | | 5,349,624 | |
| |
Oil & Gas Refining & Marketing–0.65%
| | | | |
| United Refining Co., Sr. Sec. Gtd. Global Notes, 10.50%, 02/28/18 | | | 770,000 | | | | 723,800 | |
| |
Oil & Gas Storage & Transportation–3.60%
| | | | |
Atlas Pipeline Partners L.P./Atlas Pipeline Finance Corp., Sr. Unsec. Gtd. Notes, 8.75%, 06/15/18(b) | | | 575,000 | | | | 608,062 | |
| |
Chesapeake Midstream Partners L.P./CHKM Finance Corp., Sr. Unsec. Gtd. Notes, 5.88%, 04/15/21(b) | | | 535,000 | | | | 540,350 | |
| |
| Copano Energy LLC/Copano Energy Finance Corp., Sr. Unsec. Gtd. Notes, 7.13%, 04/01/21 | | | 485,000 | | | | 492,275 | |
| |
| Energy Transfer Equity L.P., Sr. Sec. Gtd. Notes, 7.50%, 10/15/20 | | | 385,000 | | | | 418,206 | |
| |
| Inergy L.P./Inergy Finance Corp., Sr. Unsec. Gtd. Global Notes, 6.88%, 08/01/21 | | | 183,000 | | | | 185,288 | |
| |
| MarkWest Energy Partners L.P./MarkWest Energy Finance Corp., Sr. Unsec. Gtd. Notes, 6.25%, 06/15/22 | | | 410,000 | | | | 430,500 | |
| |
Overseas Shipholding Group, Inc.,
Sr. Unsec. Notes, 8.13%, 03/30/18 | | | 375,000 | | | | 229,687 | |
| |
See accompanying Notes to Financial Statements which are an integral part of the financial statements.
Invesco V.I. High Yield Fund
| | | | | | | | | |
| | | Principal
| | |
| | | Amount | | Value |
| |
Oil & Gas Storage & Transportation–(continued)
| | | | |
| | | | | | | | | |
| Regency Energy Partners L.P./Regency Energy Finance Corp., Sr. Unsec. Gtd. Notes, 6.88%, 12/01/18 | | $ | 245,000 | | | $ | 260,619 | |
| |
Targa Resources Partners L.P./Targa Resources Partners Finance Corp., Sr. Unsec. Gtd. Notes, 6.88%, 02/01/21(b) | | | 305,000 | | | | 310,337 | |
| |
| Teekay Corp. (Canada), Sr. Unsec. Global Notes, 8.50%, 01/15/20 | | | 105,000 | | | | 101,588 | |
| |
WPX Energy Inc., Sr. Unsec. Notes, 6.00%, 01/15/22(b) | | | 440,000 | | | | 452,100 | |
| |
| | | | | | | | 4,029,012 | |
| |
Other Diversified Financial Services–1.92%
| | | | |
Aircastle Ltd., Sr. Notes, 9.75%, 08/01/18(b) | | | 90,000 | | | | 94,950 | |
| |
| International Lease Finance Corp., | | | | | | | | |
| Sr. Sec. Notes, | | | | | | | | |
6.75%, 09/01/16(b) | | | 145,000 | | | | 148,897 | |
| |
7.13%, 09/01/18(b) | | | 200,000 | | | | 206,938 | |
| |
| Sr. Unsec. Global Notes, | | | | | | | | |
| 5.75%, 05/15/16 | | | 65,000 | | | | 60,572 | |
| |
| 6.25%, 05/15/19 | | | 100,000 | | | | 92,500 | |
| |
| 8.63%, 09/15/15 | | | 370,000 | | | | 378,880 | |
| |
| 8.75%, 03/15/17 | | | 285,000 | | | | 294,797 | |
| |
Sr. Unsec. Notes, 8.25%, 12/15/20 | | | 860,000 | | | | 871,287 | |
| |
| | | | | | | | 2,148,821 | |
| |
Packaged Foods & Meats–0.26%
| | | | |
| Del Monte Corp., Sr. Unsec. Gtd. Global Notes, 7.63%, 02/15/19 | | | 305,000 | | | | 295,088 | |
| |
Paper Packaging–0.22%
| | | | |
| Cascades Inc. (Canada), Sr. Unsec. Gtd. Global Notes, 7.88%, 01/15/20 | | | 250,000 | | | | 244,375 | |
| |
Paper Products–1.34%
| | | | |
| Boise Cascade LLC, Sr. Unsec. Gtd. Sub. Global Notes, 7.13%, 10/15/14 | | | 785,000 | | | | 781,075 | |
| |
| Clearwater Paper Corp., Sr. Unsec. Gtd. Global Notes, 7.13%, 11/01/18 | | | 225,000 | | | | 234,562 | |
| |
| Mercer International Inc., Sr. Unsec. Gtd. Global Notes, 9.50%, 12/01/17 | | | 205,000 | | | | 210,638 | |
| |
| NewPage Corp., Sr. Sec. Gtd. Global Notes, 11.38%, 12/31/14 | | | 215,000 | | | | 159,638 | |
| |
| P.H. Glatfelter Co., Sr. Unsec. Gtd. Global Notes, 7.13%, 05/01/16 | | | 105,000 | | | | 108,806 | |
| |
| | | | | | | | 1,494,719 | |
| |
Pharmaceuticals–1.16%
| | | | |
| Aptalis Pharma Inc., Sr. Unsec. Gtd. Global Notes, 12.75%, 03/01/16 | | | 95,000 | | | | 100,700 | |
| |
Elan Finance PLC/Corp. (Ireland),
Sr. Unsec. Gtd. Global Notes, | | | | | | | | |
| 8.75%, 10/15/16 | | | 105,000 | | | | 112,875 | |
| |
| 8.75%, 10/15/16 | | | 100,000 | | | | 107,250 | |
| |
| Endo Pharmaceuticals Holdings Inc., Sr. Unsec. Gtd. Global Notes, 7.00%, 12/15/20 | | | 30,000 | | | | 32,025 | |
| |
Mylan Inc., Sr. Unsec. Gtd. Notes, 6.00%, 11/15/18(b) | | | 135,000 | | | | 139,388 | |
| |
| NBTY Inc., Sr. Unsec. Gtd. Global Notes, 9.00%, 10/01/18 | | | 400,000 | | | | 440,000 | |
| |
Valeant Pharmaceuticals International,
Sr. Unsec. Gtd. Notes, | | | | | | | | |
6.75%, 10/01/17(b) | | | 85,000 | | | | 85,000 | |
| |
6.75%, 08/15/21(b) | | | 285,000 | | | | 278,231 | |
| |
| | | | | | | | 1,295,469 | |
| |
Property & Casualty Insurance–0.32%
| | | | |
QBE Capital Funding III Ltd. (Botswana), Unsec. Gtd. Sub. Notes, 7.25%, 05/24/41(b) | | | 200,000 | | | | 176,820 | |
| |
XL Group PLC (Ireland), Series E,
Jr. Sub. Global Pfd. Bonds, 6.50%(g) | | | 225,000 | | | | 177,187 | |
| |
| | | | | | | | 354,007 | |
| |
Publishing–0.02%
| | | | |
MediMedia USA Inc., Sr. Unsec. Sub. Notes, 11.38%, 11/15/14(b) | | | 30,000 | | | | 26,625 | |
| |
Real Estate Services–0.20%
| | | | |
| CB Richard Ellis Services Inc., Sr. Unsec. Gtd. Global Notes, 6.63%, 10/15/20 | | | 215,000 | | | | 221,988 | |
| |
Regional Banks–1.53%
| | | | |
| AmSouth Bancorp., Unsec. Sub. Deb., 6.75%, 11/01/25 | | | 75,000 | | | | 61,500 | |
| |
| BB&T Capital Trust II, Jr. Unsec. Ltd. Gtd. Sub. Global Trust Pfd. Capital Securities, 6.75%, 06/07/36 | | | 180,000 | | | | 179,831 | |
| |
PNC Financial Services Group, Inc., Series O,
Jr. Unsec. Sub. Pfd. Notes, 6.75%(g) | | | 120,000 | | | | 118,200 | |
| |
Regions Financial Corp.,
Sr. Unsec. Notes, 5.75%, 06/15/15 | | | 500,000 | | | | 483,750 | |
| |
Unsec. Sub. Notes, 7.38%, 12/10/37 | | | 465,000 | | | | 384,787 | |
| |
| Susquehanna Capital II, Jr. Unsec. Ltd. Gtd. Sub. Notes, 11.00%, 03/23/40 | | | 175,000 | | | | 181,782 | |
| |
| Synovus Financial Corp., Unsec. Sub. Global Notes, 5.13%, 06/15/17 | | | 355,000 | | | | 302,638 | |
| |
| | | | | | | | 1,712,488 | |
| |
Research & Consulting Services–0.26%
| | | | |
| FTI Consulting Inc., Sr. Unsec. Gtd. Global Notes, 6.75%, 10/01/20 | | | 275,000 | | | | 288,063 | |
| |
| | | | | | | | | |
| | | | | | | | | |
See accompanying Notes to Financial Statements which are an integral part of the financial statements.
Invesco V.I. High Yield Fund
| | | | | | | | | |
| | | Principal
| | |
| | | Amount | | Value |
| |
Semiconductor Equipment–0.75%
| | | | |
Amkor Technology Inc.,
Sr. Unsec. Global Notes, | | | | | | | | |
| 6.63%, 06/01/21 | | $ | 210,000 | | | $ | 202,125 | |
| |
| 7.38%, 05/01/18 | | | 315,000 | | | | 322,875 | |
| |
Sensata Technologies B.V. (Netherlands),
Sr. Unsec. Gtd. Notes, 6.50%, 05/15/19(b) | | | 320,000 | | | | 319,200 | |
| |
| | | | | | | | 844,200 | |
| |
Semiconductors–0.56%
| | | | |
Freescale Semiconductor Inc.,
Sr. Sec. Gtd. Notes, 9.25%, 04/15/18(b) | | | 125,000 | | | | 134,062 | |
| |
| Sr. Unsec. Gtd. Global Notes, | | | | | | | | |
| 8.05%, 02/01/20 | | | 325,000 | | | | 305,500 | |
| |
| 10.75%, 08/01/20 | | | 175,000 | | | | 182,875 | |
| |
| | | | | | | | 622,437 | |
| |
Specialized Finance–1.25%
| | | | |
CIT Group Inc., Sec. Gtd. Bonds, 7.00%, 05/02/17(b) | | | 1,395,000 | | | | 1,398,487 | |
| |
Specialized REIT’s–0.80%
| | | | |
| Host Hotels & Resorts L.P., | | | | | | | | |
Sr. Gtd. Global Notes, 6.00%, 11/01/20 | | | 205,000 | | | | 210,125 | |
| |
Sr. Unsec. Gtd. Notes, 6.00%, 10/01/21(b) | | | 325,000 | | | | 334,750 | |
| |
| MPT Operating Partnership L.P./MPT Finance Corp., Sr. Unsec. Gtd. Global Notes, 6.88%, 05/01/21 | | | 200,000 | | | | 199,250 | |
| |
| Omega Healthcare Investors, Inc., Sr. Unsec. Gtd. Global Notes, 6.75%, 10/15/22 | | | 155,000 | | | | 155,581 | |
| |
| | | | | | | | 899,706 | |
| |
Specialty Chemicals–1.17%
| | | | |
| Ferro Corp., Sr. Unsec. Notes, 7.88%, 08/15/18 | | | 260,000 | | | | 263,900 | |
| |
Huntsman International LLC,
Sr. Unsec. Gtd. Global Notes, 5.50%, 06/30/16 | | | 245,000 | | | | 241,938 | |
| |
Sr. Unsec. Gtd. Sub. Global Notes, 8.63%, 03/15/21 | | | 263,000 | | | | 280,095 | |
| |
| NewMarket Corp., Sr. Unsec. Gtd. Global Notes, 7.13%, 12/15/16 | | | 150,000 | | | | 153,656 | |
| |
| PolyOne Corp., Sr. Unsec. Notes, 7.38%, 09/15/20 | | | 360,000 | | | | 372,600 | |
| |
| | | | | | | | 1,312,189 | |
| |
Specialty Stores–0.58%
| | | | |
| Michaels Stores Inc., | | | | | | | | |
Sr. Unsec. Gtd. Global Notes, 7.75%, 11/01/18 | | | 185,000 | | | | 188,700 | |
| |
Sr. Unsec. Gtd. Sub. Disc. Global Notes, 13.00%, 11/01/16 | | | 135,000 | | | | 143,944 | |
| |
Sally Holdings LLC/Sally Capital Inc.,
Sr. Unsec. Gtd. Notes, 6.88%, 11/15/19(b) | | | 305,000 | | | | 318,725 | |
| |
| | | | | | | | 651,369 | |
| |
Steel–0.24%
| | | | |
APERAM (Luxembourg), Sr. Unsec. Notes, 7.38%, 04/01/16(b) | | | 150,000 | | | | 130,125 | |
| |
| United States Steel Corp., Sr. Unsec. Notes, 7.00%, 02/01/18 | | | 140,000 | | | | 139,300 | |
| |
| | | | | | | | 269,425 | |
| |
Systems Software–0.48%
| | | | |
Allen Systems Group Inc., Sec. Gtd. Notes, 10.50%, 11/15/16(b) | | | 615,000 | | | | 538,125 | |
| |
Tires & Rubber–0.35%
| | | | |
| Cooper Tire & Rubber Co., Sr. Unsec. Notes, 8.00%, 12/15/19 | | | 350,000 | | | | 365,750 | |
| |
| Goodyear Tire & Rubber Co. (The), Sr. Unsec. Gtd. Notes, 8.25%, 08/15/20 | | | 20,000 | | | | 21,900 | |
| |
| | | | | | | | 387,650 | |
| |
Trading Companies & Distributors–2.18%
| | | | |
Avis Budget Car Rental LLC/Avis Budget Finance Inc.,
Sr. Unsec. Gtd. Global Notes, | | | | | | | | |
| 8.25%, 01/15/19 | | | 585,000 | | | | 583,537 | |
| |
| 9.75%, 03/15/20 | | | 70,000 | | | | 72,450 | |
| |
| H&E Equipment Services Inc., Sr. Unsec. Gtd. Global Notes, 8.38%, 07/15/16 | | | 485,000 | | | | 496,519 | |
| |
Hertz Corp. (The),
Sr. Unsec. Gtd. Global Notes, | | | | | | | | |
| 6.75%, 04/15/19 | | | 260,000 | | | | 264,550 | |
| |
| 7.38%, 01/15/21 | | | 500,000 | | | | 513,750 | |
| |
| 7.50%, 10/15/18 | | | 170,000 | | | | 178,075 | |
| |
| 8.88%, 01/01/14 | | | 2,569 | | | | 2,572 | |
| |
| Interline Brands, Inc., Sr. Unsec. Gtd. Global Notes, 7.00%, 11/15/18 | | | 125,000 | | | | 129,688 | |
| |
| RSC Equipment Rental Inc./RSC Holdings III LLC, Sr. Unsec. Gtd. Global Notes, 8.25%, 02/01/21 | | | 195,000 | | | | 199,875 | |
| |
| | | | | | | | 2,441,016 | |
| |
Wireless Telecommunication Services–4.11%
| | | | |
| Clearwire Communications LLC/Clearwire Finance, Inc., | | | | | | | | |
Sr. Sec. Gtd. Notes, 12.00%, 12/01/15(b) | | | 465,000 | | | | 449,887 | |
| |
Sr. Unsec. Gtd. Conv. Notes, 8.25%, 12/01/17(b)(h) | | | 60,000 | | | | 38,700 | |
| |
Cricket Communications, Inc.,
Sr. Sec. Gtd. Global Notes, 7.75%, 05/15/16 | | | 225,000 | | | | 234,281 | |
| |
Sr. Unsec. Gtd. Global Notes, 7.75%, 10/15/20 | | | 820,000 | | | | 721,600 | |
| |
Digicel Group Ltd. (Bermuda), Sr. Unsec. Notes, 8.88%, 01/15/15(b) | | | 200,000 | | | | 196,750 | |
| |
Digicel Ltd. (Bermuda), Sr. Unsec. Notes, 8.25%, 09/01/17(b) | | | 255,000 | | | | 258,825 | |
| |
See accompanying Notes to Financial Statements which are an integral part of the financial statements.
Invesco V.I. High Yield Fund
| | | | | | | | | |
| | | Principal
| | |
| | | Amount | | Value |
| |
Wireless Telecommunication Services–(continued)
| | | | |
| | | | | | | | | |
MetroPCS Wireless Inc.,
Sr. Unsec. Gtd. Notes, | | | | | | | | |
| 6.63%, 11/15/20 | | $ | 235,000 | | | $ | 222,075 | |
| |
| 7.88%, 09/01/18 | | | 190,000 | | | | 192,969 | |
| |
| SBA Telecommunications Inc., Sr. Unsec. Gtd. Global Notes, 8.25%, 08/15/19 | | | 240,000 | | | | 262,500 | |
| |
| Sprint Capital Corp., Sr. Unsec. Gtd. Global Notes, 6.90%, 05/01/19 | | | 250,000 | | | | 205,625 | |
| |
Sprint Nextel Corp.,
Sr. Unsec. Gtd. Notes, 9.00%, 11/15/18(b) | | | 285,000 | | | | 300,319 | |
| |
| Sr. Unsec. Notes, | | | | | | | | |
| 8.38%, 08/15/17 | | | 340,000 | | | | 307,275 | |
| |
11.50%, 11/15/21(b) | | | 125,000 | | | | 124,219 | |
| |
VimpelCom (Ireland), Unsec. Notes, 7.75%, 02/02/21(b) | | | 400,000 | | | | 343,000 | |
| |
Wind Acquisition Finance S.A. (Luxembourg),
Sr. Sec. Gtd. Notes, | | | | | | | | |
7.25%, 02/15/18(b) | | | 200,000 | | | | 181,500 | |
| |
11.75%, 07/15/17(b) | | | 625,000 | | | | 559,375 | |
| |
| | | | | | | | 4,598,900 | |
| |
| Total U.S. Dollar Denominated Bonds and Notes (Cost $84,223,075) | | | | | | | 83,318,275 | |
| |
Non-U.S. Dollar Denominated Bonds & Notes–7.42%(i)
| | | | |
Canada–0.22%
| | | | |
Gateway Casinos & Entertainment Ltd., Sec. Gtd. Notes, 8.88%, 11/15/17(b) | | CAD | 240,000 | | | | 240,283 | |
| |
Croatia–0.10%
| | | | |
Agrokor D.D., Sr. Unsec. Gtd. Notes, 10.00%, 12/07/16(b) | | EUR | 90,000 | | | | 108,620 | |
| |
Czech Republic–0.13%
| | | | |
CET 21 spol sro, Sr. Sec. Notes, 9.00%, 11/01/17(b) | | EUR | 115,000 | | | | 142,147 | |
| |
| | | | | | | | | |
| | | | | |
Ireland–1.21%
| | | | |
Ardagh Packaging Finance PLC, Sr. Unsec. Gtd. Notes, 9.25%, 10/15/20(b) | | EUR | 400,000 | | | | 469,831 | |
| |
| Bord Gais Eireann, Sr. Unsec. Medium-Term Euro Notes, 5.75%, 06/16/14 | | EUR | 255,000 | | | | 313,872 | |
| |
Nara Cable Funding Ltd., Sr. Sec. Notes, 8.88%, 12/01/18(b) | | EUR | 500,000 | | | | 571,110 | |
| |
| | | | | | | | 1,354,813 | |
| |
Italy–0.12%
| | | | |
Lottomatica SpA, REGS, Jr. Unsec. Sub. Euro Bonds, 8.25%, 03/31/66(b) | | EUR | 130,000 | | | | 132,083 | |
| |
Luxembourg–2.69%
| | | | |
Boardriders S.A., Sr. Unsec. Gtd. Notes, 8.88%, 12/15/17(b) | | EUR | 315,000 | | | | 358,780 | |
| |
Cirsa Funding Luxembourg S.A.,
Sr. Unsec. Gtd. Notes, 8.75%, 05/15/18(b) | | EUR | 180,000 | | | | 191,912 | |
| |
REGS, Sr. Gtd. Euro Notes, 8.75%, 05/15/18(b) | | EUR | 150,000 | | | | 159,927 | |
| |
Codere Finance Luxembourg S.A.,
Sr. Sec. Gtd. Notes, 8.25%, 06/15/15(b) | | EUR | 100,000 | | | | 119,723 | |
| |
REGS, Sr. Sec. Gtd. Euro Notes, 8.25%, 06/15/15(b) | | EUR | 390,000 | | | | 466,919 | |
| |
ConvaTec Healthcare S.A.,
Sr. Sec. Gtd. Notes, 7.38%, 12/15/17(b) | | EUR | 200,000 | | | | 245,917 | |
| |
Sr. Unsec. Gtd. Notes, 10.88%, 12/15/18(b) | | EUR | 100,000 | | | | 112,604 | |
| |
KION Finance S.A., Sr. Sec. Gtd Notes, 7.88%, 04/15/18(b) | | EUR | 200,000 | | | | 192,851 | |
| |
Mark IV Europe Lux SCA/Mark IV USA SCA,
Sr. Sec. Gtd. Notes, 8.88%, 12/15/17(b) | | EUR | 300,000 | | | | 394,114 | |
| |
Sunrise Communications Holdings S.A., REGS,
Sr. Sec. Gtd. Medium-Term Euro Notes, 8.50%, 12/31/18(b) | | EUR | 200,000 | | | | 262,743 | |
| |
TMD Friction Finance S.A., Sr. Sec. Gtd. Bonds, 10.75%, 05/15/17(b) | | EUR | 210,000 | | | | 284,034 | |
| |
Wind Acquisition Finance S.A., Sr. Gtd. Notes, 11.75%, 07/15/17(b) | | EUR | 100,000 | | | | 107,751 | |
| |
Xefin Lux SCA, Sr. Sec. Notes, 8.00%, 06/01/18(b) | | EUR | 100,000 | | | | 117,781 | |
| |
| | | | | | | | 3,015,056 | |
| |
Netherlands–1.05%
| | | | |
| Boats Investments B.V., Sec. PIK Medium-Term Euro Notes, 11.00%, 03/31/17 | | EUR | 81,472 | | | | 62,261 | |
| |
Carlson Wagonlit B.V., Sr. Gtd. Floating Rate Notes, 7.34%, 05/01/15(b)(e) | | EUR | 140,000 | | | | 150,398 | |
| |
Goodyear Dunlop Tires Europe B.V., Sr. Unsec. Gtd. Notes, 6.75%, 04/15/19(b) | | EUR | 400,000 | | | | 481,480 | |
| |
Polish Television Holding B.V., Sr. Sec. Notes, 11.25%, 05/15/17(b)(j) | | EUR | 60,000 | | | | 78,823 | |
| |
Ziggo Bond Co. B.V., Sr. Sec. Gtd. Notes, 8.00%, 05/15/18(b) | | EUR | 310,000 | | | | 407,251 | |
| |
| | | | | | | | 1,180,213 | |
| |
Sweden–0.12%
| | | | |
TVN Finance Corp II A.B., Sr. Unsec. Gtd. Notes, 10.75%, 11/15/17(b) | | EUR | 100,000 | | | | 135,254 | |
| |
United Kingdom–1.48%
| | | | |
EC Finance PLC, REGS, Sr. Sec. Gtd. Euro Notes, 9.75%, 08/01/17(b) | | EUR | 100,000 | | | | 100,308 | |
| |
Exova PLC, Sr. Unsec. Notes, 10.50%, 10/15/18(b) | | GBP | 200,000 | | | | 246,991 | |
| |
Infinis PLC, Sr. Sec. Notes, 9.13%, 12/15/14(b) | | GBP | 80,000 | | | | 126,136 | |
| |
Kerling PLC, Sr. Sec. Gtd. Notes, 10.63%, 02/01/17(b) | | EUR | 130,000 | | | | 149,750 | |
| |
Odeon & UCI Finco PLC, Sr. Sec. Gtd. Notes, 9.00%, 08/01/18(b) | | GBP | 210,000 | | | | 300,932 | |
| |
See accompanying Notes to Financial Statements which are an integral part of the financial statements.
Invesco V.I. High Yield Fund
| | | | | | | | | |
| | | Principal
| | |
| | | Amount | | Value |
| |
United Kingdom–(continued)
| | | | |
| | | | | | | | | |
Pipe Holdings PLC, Sr. Sec. Gtd. Bonds, 9.50%, 11/01/15(b) | | GBP | 200,000 | | | $ | 277,282 | |
| |
R&R Ice Cream PLC,
Sr. Sec. Gtd. Notes, 8.38%, 11/15/17(b) | | EUR | 300,000 | | | | 343,637 | |
| |
REGS, Sr. Sec. Gtd. Euro Notes, 8.38%, 11/15/17(b) | | EUR | 100,000 | | | | 114,546 | |
| |
| | | | | | | | 1,659,582 | |
| |
United States–0.30%
| | | | |
CEDC Finance Corp. International Inc.,
Sr. Sec. Gtd. Notes, 8.88%, 12/01/16(b) | | EUR | 355,000 | | | | 330,823 | |
| |
Total Non-U.S. Dollar Denominated Bonds &
Notes (Cost $9,679,515) | | | | | | | 8,298,874 | |
| |
| | | | | | | | | |
| | | Shares | | |
Common Stocks & Other Equity Interests–1.48%
| | | | |
Automobile Manufacturers–0.17%
| | | | |
General Motors Co.(d)(k) | | | 4,888 | | | | 99,080 | |
| |
General Motors Co., Wts. expiring 07/10/16(d)(k) | | | 4,443 | | | | 52,116 | |
| |
General Motors Co., Wts. expiring 07/10/19(d)(k) | | | 4,443 | | | | 34,744 | |
| |
| | | | | | | | 185,940 | |
| |
Broadcasting–0.00%
| | | | |
Adelphia Communications Corp.(l) | | | — | | | | 820 | |
| |
Adelphia Recovery Trust, Series ACC-1(l) | | | 318,570 | | | | 319 | |
| |
Adelphia Recovery Trust, Series Arahova(l) | | | 109,170 | | | | 4,476 | |
| |
| | | | | | | | 5,615 | |
| |
Building Products–0.01%
| | | | |
Nortek, Inc.(k) | | | 215 | | | | 5,624 | |
| |
Construction Materials–0.05%
| | | | |
U.S. Concrete, Inc.(k) | | | 20,786 | | | | 60,279 | |
| |
Integrated Telecommunication Services–0.21%
| | | | |
Hawaiian Telcom Holdco Inc.–Wts. expiring 10/28/15(k) | | | 1,527 | | | | 6,108 | |
| |
Largo Limited–Class A (Luxembourg)(k) | | | 17,563 | | | | 22,732 | |
| |
Largo Limited–Class B (Luxembourg)(k) | | | 158,069 | | | | 204,589 | |
| |
| | | | | | | | 233,429 | |
| |
Investment Companies–Mutual Funds–1.03%
| | | | |
| BlackRock Corporate High Yield Fund V, Inc. | | | 50,000 | | | | 584,500 | |
| |
| BlackRock Corporate High Yield Fund VI, Inc. | | | 50,000 | | | | 569,000 | |
| |
| | | | | | | | 1,153,500 | |
| |
Publishing–0.00%
| | | | |
Reader’s Digest Association Inc. (The), Wts. expiring 02/19/14(k) | | | 669 | | | | 0 | |
| |
Semiconductors–0.01%
| | | | |
Magnachip Semiconductor Corp.(k) | | | 1,372 | | | | 10,263 | |
| |
| Total Common Stocks & Other Equity Interests (Cost $3,530,237) | | | | | | | 1,654,650 | |
| |
Preferred Stocks–1.43%
| | | | |
Automobile Manufacturers–0.11%
| | | | |
| General Motors Co., Series B, $2.38 Conv. Pfd. | | | 3,580 | | | | 122,615 | |
| |
Consumer Finance–0.65%
| | | | |
Ally Financial, Inc.,
Series A, 8.50% Pfd. | | | 7,845 | | | | 144,269 | |
| |
Series G, 7.00% Pfd.(b) | | | 581 | | | | 416,523 | |
| |
GMAC Capital Trust I, Series 2, 8.13%
Jr. Gtd. Sub. Pfd.(e) | | | 8,630 | | | | 166,904 | |
| |
| | | | | | | | 727,696 | |
| |
Industrial REIT’s–0.07%
| | | | |
| DuPont Fabros Technology, Inc., Series B, 7.63% Pfd. | | | 3,020 | | | | 75,319 | |
| |
Regional Banks–0.49%
| | | | |
| Zions Bancorp., Series C, 9.50% Pfd. | | | 21,800 | | | | 550,450 | |
| |
Tires & Rubber–0.11%
| | | | |
| Goodyear Tire & Rubber Co. (The), $2.94 Conv. Pfd. | | | 2,490 | | | | 121,139 | |
| |
| Total Preferred Stocks (Cost $1,715,918) | | | | | | | 1,597,219 | |
| |
| | | | | | | | | |
| | | Principal
| | |
| | | Amount | | |
U.S. Treasury Bills–0.56%(m)
| | | | |
0.06%, 05/24/12(n) (Cost $629,854) | | $ | 630,000 | | | | 629,894 | |
| |
Bundled Securities–0.03%
| | | | |
Investment Banking & Brokerage–0.03%
| | | | |
Targeted Return Index Securities Trust, Series HY 2006-1, Sec. Variable Rate Bonds, 7.12%, 05/01/16 (Acquired 08/15/08; Cost $28,350) (Cost $28,950)(b)(e) | | | 30,000 | | | | 29,511 | |
| |
| | | | | | | | | |
| | | Shares | | |
Money Market Funds–10.75%
| | | | |
Liquid Assets Portfolio–Institutional Class(o) | | | 6,017,716 | | | | 6,017,716 | |
| |
Premier Portfolio–Institutional Class(o) | | | 6,017,715 | | | | 6,017,715 | |
| |
| Total Money Market Funds (Cost $12,035,431) | | | 12,035,431 | |
| |
| TOTAL INVESTMENTS–96.11% (Cost $111,842,980) | | | 107,563,854 | |
| |
| OTHER ASSETS LESS LIABILITIES–3.89% | | | | | | | 4,355,882 | |
| |
| NET ASSETS–100.00% | | | | | | $ | 111,919,736 | |
| |
See accompanying Notes to Financial Statements which are an integral part of the financial statements.
Invesco V.I. High Yield Fund
Investment Abbreviations:
| | | |
| CAD | | – Canadian Dollar |
| Conv. | | – Convertible |
| Ctfs. | | – Certificates |
| Deb. | | – Debentures |
| Disc. | | – Discounted |
| EUR | | – Euro |
| GBP | | – British Pound |
| Gtd. | | – Guaranteed |
| Jr. | | – Junior |
| Pfd. | | – Preferred |
| PIK | | – Payment in Kind |
| REGS | | – Regulation S |
| REIT | | – Real Estate Investment Trust |
| Sec. | | – Secured |
| Sr. | | – Senior |
| Sub. | | – Subordinated |
| Unsec. | | – Unsecured |
| Wts. | | – Warrants |
Notes to Schedule of Investments:
| | |
| (a) | | Industry and/or sector classifications used in this report are generally according to the Global Industry Classification Standard, which was developed by and is the exclusive property and a service mark of MSCI Inc. and Standard & Poor’s. |
| (b) | | Security purchased or received in a transaction exempt from registration under the Securities Act of 1933, as amended. The security may be resold pursuant to an exemption from registration under the 1933 Act, typically to qualified institutional buyers. The aggregate value of these securities at December 31, 2011 was $35,600,798, which represented 31.81% of the Trust’s Net Assets. |
| (c) | | Defaulted security. Currently, the issuer is partially or fully in default with respect to interest payments. The aggregate value of these securities at December 31, 2011 was $742,763, which represented 0.66% of the Fund’s Net Assets. |
| (d) | | Acquired as part of the General Motors reorganization. |
| (e) | | Interest or dividend rate is redetermined periodically. Rate shown is the rate in effect on December 31, 2011. |
| (f) | | Interest payments have been suspended under European Union agreement for 24 months beginning April 30, 2010. |
| (g) | | Perpetual bond with no specified maturity date. |
| (h) | | Security has an irrevocable call by the issuer or mandatory put by the holder. Maturity date reflects such call or put. |
| (i) | | Foreign denominated security. Principal amount is denominated in currency indicated. |
| (j) | | Step coupon bond issued at discount. The interest rate represents the coupon rate at which the bond will accrue at a specified future date. |
| (k) | | Non-income producing security. |
| (l) | | Non-income producing security acquired as part of the Adelphia Communications bankruptcy reorganization. |
| (m) | | Security traded on a discount basis. The interest rate shown represents the discount rate at the time of purchase by the Fund. |
| (n) | | A portion of the principal balance was pledged as collateral for open credit default swap contracts. See Note 1M and Note 4. |
| (o) | | The money market fund and the Fund are affiliated by having the same investment adviser. |
See accompanying Notes to Financial Statements which are an integral part of the financial statements.
Invesco V.I. High Yield Fund
Statement of Assets and Liabilities
December 31, 2011
| | | | | |
Assets:
|
| Investments, at value (Cost $99,807,549) | | $ | 95,528,423 | |
| |
| Investments in affiliated money market funds, at value and cost | | | 12,035,431 | |
| |
| Total investments, at value (Cost $111,842,980) | | | 107,563,854 | |
| |
| Foreign currencies, at value (Cost $474,445) | | | 470,094 | |
| |
| Receivable for: | | | | |
| Investments sold | | | 82,854 | |
| |
| Fund shares sold | | | 2,288,053 | |
| |
| Dividends and interest | | | 1,773,310 | |
| |
| Foreign currency contracts | | | 512,358 | |
| |
| Unrealized appreciation on swap agreements | | | 17,439 | |
| |
| Investment for trustee deferred compensation and retirement plans | | | 38,719 | |
| |
| Total assets | | | 112,746,681 | |
| |
Liabilities:
|
| Payable for: | | | | |
| Investments purchased | | | 353 | |
| |
| Fund shares reacquired | | | 206,043 | |
| |
| Accrued fees to affiliates | | | 101,955 | |
| |
| Accrued other operating expenses | | | 49,658 | |
| |
| Trustee deferred compensation and retirement plans | | | 47,020 | |
| |
| Premiums received on swap agreements | | | 421,916 | |
| |
| Total liabilities | | | 826,945 | |
| |
| Net assets applicable to shares outstanding | | $ | 111,919,736 | |
| |
Net assets consist of:
|
| Shares of beneficial interest | | $ | 121,938,972 | |
| |
| Undistributed net investment income | | | 5,493,549 | |
| |
| Undistributed net realized gain (loss) | | | (11,717,723 | ) |
| |
| Unrealized appreciation (depreciation) | | | (3,795,062 | ) |
| |
| | | $ | 111,919,736 | |
| |
Net Assets:
|
| Series I | | $ | 106,556,691 | |
| |
| Series II | | $ | 5,363,045 | |
| |
Shares outstanding, $0.001 par value per share, with an unlimited number of shares authorized:
|
| Series I | | | 21,148,580 | |
| |
| Series II | | | 1,065,588 | |
| |
| Series I: | | | | |
| Net asset value per share | | $ | 5.04 | |
| |
| Series II: | | | | |
| Net asset value per share | | $ | 5.03 | |
| |
Statement of Operations
For the year ended December 31, 2011
| | | | | |
Investment income:
|
| Interest (net of foreign withholding taxes of $(285)) | | $ | 6,132,993 | |
| |
| Dividends | | | 143,967 | |
| |
| Dividends from affiliated money market funds (includes securities lending income of $14) | | | 5,225 | |
| |
| Total investment income | | | 6,282,185 | |
| |
Expenses:
|
| Advisory fees | | | 512,057 | |
| |
| Administrative services fees | | | 228,977 | |
| |
| Custodian fees | | | 25,198 | |
| |
| Distribution fees — Series II | | | 5,398 | |
| |
| Transfer agent fees | | | 22,690 | |
| |
| Trustees’ and officers’ fees and benefits | | | 20,526 | |
| |
| Other | | | 62,780 | |
| |
| Total expenses | | | 877,626 | |
| |
| Less: Fees waived | | | (191,950 | ) |
| |
| Net expenses | | | 685,676 | |
| |
| Net investment income | | | 5,596,509 | |
| |
Realized and unrealized gain (loss) from:
|
| Net realized gain (loss) from: | | | | |
| Investment securities | | | 1,963,734 | |
| |
| Foreign currencies | | | (8,212 | ) |
| |
| Foreign currency contracts | | | 27,134 | |
| |
| Swap agreements | | | 6,312 | |
| |
| | | | 1,988,968 | |
| |
| Change in net unrealized appreciation (depreciation) of: | | | | |
| Investment securities | | | (8,420,039 | ) |
| |
| Foreign currencies | | | (15,872 | ) |
| |
| Foreign currency contracts | | | 536,238 | |
| |
| Swap agreements | | | 17,439 | |
| |
| | | | (7,882,234 | ) |
| |
| Net realized and unrealized gain (loss) | | | (5,893,266 | ) |
| |
| Net increase (decrease) in net assets resulting from operations | | $ | (296,757 | ) |
| |
See accompanying Notes to Financial Statements which are an integral part of the financial statements.
Invesco V.I. High Yield Fund
Statement of Changes in Net Assets
For the years ended December 31, 2011 and 2010
| | | | | | | | | |
| | | December 31,
| | December 31,
|
| | | 2011 | | 2010 |
| |
Operations:
| | | | |
| Net investment income | | $ | 5,596,509 | | | $ | 4,456,145 | |
| |
| Net realized gain | | | 1,988,968 | | | | 3,536,654 | |
| |
| Change in net unrealized appreciation (depreciation) | | | (7,882,234 | ) | | | (977,968 | ) |
| |
| Net increase (decrease) in net assets resulting from operations | | | (296,757 | ) | | | 7,014,831 | |
| |
Distributions to shareholders from net investment income:
| | | | |
| Series I | | | (4,229,022 | ) | | | (5,284,452 | ) |
| |
| Series II | | | (46,712 | ) | | | (38,411 | ) |
| |
| Total distributions from net investment income | | | (4,275,734 | ) | | | (5,322,863 | ) |
| |
Share transactions–net:
| | | | |
| Series I | | | 55,281,125 | | | | (6,523,411 | ) |
| |
| Series II | | | 4,911,560 | | | | 17,659 | |
| |
| Net increase (decrease) in net assets resulting from share transactions | | | 60,192,685 | | | | (6,505,752 | ) |
| |
| Net increase (decrease) in net assets | | | 55,620,194 | | | | (4,813,784 | ) |
| |
Net assets:
| | | | |
| Beginning of year | | | 56,299,542 | | | | 61,113,326 | |
| |
| End of year (includes undistributed net investment income of $5,493,549 and $4,198,259, respectively) | | $ | 111,919,736 | | | $ | 56,299,542 | |
| |
Notes to Financial Statements
December 31, 2011
NOTE 1—Significant Accounting Policies
Invesco V.I. High Yield Fund (the “Fund”) is a series portfolio of AIM Variable Insurance Funds (Invesco Variable Insurance Funds) (the “Trust”). The Trust is a Delaware statutory trust registered under the Investment Company Act of 1940, as amended (the “1940 Act”), as an open-end series management investment company consisting of twenty-eight separate portfolios, (each constituting a “Fund”). The assets, liabilities and operations of each portfolio are accounted for separately. Information presented in these financial statements pertains only to the Fund. Matters affecting each Fund or class will be voted on exclusively by the shareholders of such Fund or class. Current Securities and Exchange Commission (“SEC”) guidance, however, requires participating insurance companies offering separate accounts to vote shares proportionally in accordance with the instructions of the contract owners whose investments are funded by shares of each Fund or class.
The Fund’s investment objective is total return, comprised of current income and capital appreciation.
The Fund currently offers two classes of shares, Series I and Series II, both of which are offered to insurance company separate accounts funding variable annuity contracts and variable life insurance policies (“variable products”).
The following is a summary of the significant accounting policies followed by the Fund in the preparation of its financial statements.
| | |
| A. | | Security Valuations — Securities, including restricted securities, are valued according to the following policy. |
| | Debt obligations (including convertible bonds) and unlisted equities are fair valued using an evaluated quote provided by an independent pricing service. Evaluated quotes provided by the pricing service may be determined without exclusive reliance on quoted prices, and may reflect appropriate factors such as institution-size trading in similar groups of securities, developments related to specific securities, dividend rate, yield, quality, type of issue, coupon rate, maturity, individual trading characteristics and other market data. Debt securities are subject to interest rate and credit risks. In addition, all debt securities involve some risk of default with respect to interest and/or principal payments. |
| | Senior secured floating rate loans and senior secured floating rate debt securities are fair valued using an evaluated quote provided by an independent pricing service. Evaluated quotes provided by the pricing service may reflect appropriate factors such as ratings, tranche type, industry, company performance, spread, individual trading characteristics, institution-size trading in similar groups of securities and other market data. |
| | A security listed or traded on an exchange (except convertible bonds) is valued at its last sales price or official closing price as of the close of the customary trading session on the exchange where the security is principally traded, or lacking any sales or official closing price on a particular day, the security may be valued at the closing bid price on that day. Securities traded in the over-the-counter market are valued based on prices furnished by independent pricing services or market makers. When such securities are valued by an independent pricing service they may be considered fair valued. |
Invesco V.I. High Yield Fund
| | |
| | Futures contracts are valued at the final settlement price set by an exchange on which they are principally traded. Listed options are valued at the mean between the last bid and ask prices from the exchange on which they are principally traded. Options not listed on an exchange are valued by an independent source at the mean between the last bid and ask prices. For purposes of determining net asset value per share, futures and option contracts generally are valued 15 minutes after the close of the customary trading session of the New York Stock Exchange (“NYSE”). |
| | Investments in open-end and closed-end registered investment companies that do not trade on an exchange are valued at the end of day net asset value per share. Investments in open-end and closed-end registered investment companies that trade on an exchange are valued at the last sales price or official closing price as of the close of the customary trading session on the exchange where the security is principally traded. |
| | Swap agreements are fair valued using an evaluated quote provided by an independent pricing service. Evaluated quotes provided by the pricing service are valued based on a model which may include end of day net present values, spreads, ratings, industry, and company performance. |
| | Foreign securities (including foreign exchange contracts) are converted into U.S. dollar amounts using the applicable exchange rates as of the close of the NYSE. If market quotations are available and reliable for foreign exchange traded equity securities, the securities will be valued at the market quotations. Because trading hours for certain foreign securities end before the close of the NYSE, closing market quotations may become unreliable. If between the time trading ends on a particular security and the close of the customary trading session on the NYSE, events occur that are significant and make the closing price unreliable, the Fund may fair value the security. If the event is likely to have affected the closing price of the security, the security will be valued at fair value in good faith using procedures approved by the Board of Trustees. Adjustments to closing prices to reflect fair value may also be based on a screening process of an independent pricing service to indicate the degree of certainty, based on historical data, that the closing price in the principal market where a foreign security trade is not the current value as of the close of the NYSE. Foreign securities meeting the approved degree of certainty that the price is not reflective of current value will be priced at the indication of fair value from the independent pricing service. Multiple factors may be considered by the independent pricing service in determining adjustments to reflect fair value and may include information relating to sector indices, American Depositary Receipts and domestic and foreign index futures. Foreign securities may have additional risks including exchange rate changes, potential for sharply devalued currencies and high inflation, political and economic upheaval, the relative lack of issuer information, relatively low market liquidity and the potential lack of strict financial and accounting controls and standards. |
| | Securities for which market prices are not provided by any of the above methods may be valued based upon quotes furnished by independent sources. The last bid price may be used to value equity securities. The mean between the last bid and asked prices is used to value debt obligations, including Corporate Loans. |
| | Securities for which market quotations are not readily available or are unreliable are valued at fair value as determined in good faith by or under the supervision of the Trust’s officers following procedures approved by the Board of Trustees. Issuer specific events, market trends, bid/ask quotes of brokers and information providers and other market data may be reviewed in the course of making a good faith determination of a security’s fair value. |
| | Valuations change in response to many factors including the historical and prospective earnings of the issuer, the value of the issuer’s assets, general economic conditions, interest rates, investor perceptions and market liquidity. Because of the inherent uncertainties of valuation, the values reflected in the financial statements may materially differ from the value received upon actual sale of those investments. |
| B. | | Securities Transactions and Investment Income — Securities transactions are accounted for on a trade date basis. Realized gains or losses on sales are computed on the basis of specific identification of the securities sold. Interest income is recorded on the accrual basis from settlement date. Paydown gains and losses on mortgage and asset-backed securities are recorded as adjustments to interest income. Dividend income (net of withholding tax, if any) is recorded on the ex-dividend date. Bond premiums and discounts are amortized and/or accreted for financial reporting purposes. |
| | The Fund may periodically participate in litigation related to Fund investments. As such, the Fund may receive proceeds from litigation settlements. Any proceeds received are included in the Statement of Operations as realized gain (loss) for investments no longer held and as unrealized gain (loss) for investments still held. |
| | Brokerage commissions and mark ups are considered transaction costs and are recorded as an increase to the cost basis of securities purchased and/or a reduction of proceeds on a sale of securities. Such transaction costs are included in the determination of net realized and unrealized gain (loss) from investment securities reported in the Statement of Operations and the Statement of Changes in Net Assets and the net realized and unrealized gains (losses) on securities per share in the Financial Highlights. Transaction costs are included in the calculation of the Fund’s net asset value and, accordingly, they reduce the Fund’s total returns. These transaction costs are not considered operating expenses and are not reflected in net investment income reported in the Statement of Operations and Statement of Changes in Net Assets, or the net investment income per share and ratios of expenses and net investment income reported in the Financial Highlights, nor are they limited by any expense limitation arrangements between the Fund and the investment adviser. |
| | The Fund allocates income and realized and unrealized capital gains and losses to a class based on the relative net assets of each class. |
| C. | | Country Determination — For the purposes of making investment selection decisions and presentation in the Schedule of Investments, the investment adviser may determine the country in which an issuer is located and/or credit risk exposure based on various factors. These factors include the laws of the country under which the issuer is organized, where the issuer maintains a principal office, the country in which the issuer derives 50% or more of its total revenues and the country that has the primary market for the issuer’s securities, as well as other criteria. Among the other criteria that may be evaluated for making this determination are the country in which the issuer maintains 50% or more of its assets, the type of security, financial guarantees and enhancements, the nature of the collateral and the sponsor organization. Country of issuer and/or credit risk exposure has been determined to be the United States of America, unless otherwise noted. |
| D. | | Distributions — Distributions from income and net realized capital gain, if any, are generally paid to separate accounts of participating insurance companies annually and recorded on ex-dividend date. |
| E. | | Federal Income Taxes — The Fund intends to comply with the requirements of Subchapter M of the Internal Revenue Code necessary to qualify as a regulated investment company and to distribute substantially all of the Fund’s taxable earnings to shareholders. As such, the Fund will not be subject to federal income taxes on otherwise taxable income (including net realized capital gain) that is distributed to shareholders. Therefore, no provision for federal income taxes is recorded in the financial statements. |
Invesco V.I. High Yield Fund
| | |
| | The Fund files tax returns in the U.S. Federal jurisdiction and certain other jurisdictions. Generally, the Fund is subject to examinations by such taxing authorities for up to three years after the filing of the return for the tax period. |
| F. | | Expenses — Fees provided for under the Rule 12b-1 plan of a particular class of the Fund and which are directly attributable to that class are charged to the operations of such class. All other expenses are allocated among the classes based on relative net assets. |
| G. | | Accounting Estimates — The preparation of financial statements in conformity with accounting principles generally accepted in the United States of America (“GAAP”) requires management to make estimates and assumptions that affect the reported amounts of assets and liabilities at the date of the financial statements and the reported amounts of revenues and expenses during the reporting period including estimates and assumptions related to taxation. Actual results could differ from those estimates by a significant amount. In addition, the Fund monitors for material events or transactions that may occur or become known after the period-end date and before the date the financial statements are released to print. |
| H. | | Indemnifications — Under the Trust’s organizational documents, each Trustee, officer, employee or other agent of the Trust is indemnified against certain liabilities that may arise out of performance of their duties to the Fund. Additionally, in the normal course of business, the Fund enters into contracts, including the Fund’s servicing agreements that contain a variety of indemnification clauses. The Fund’s maximum exposure under these arrangements is unknown as this would involve future claims that may be made against the Fund that have not yet occurred. The risk of material loss as a result of such indemnification claims is considered remote. |
| I. | | Lower-Rated Securities — The Fund normally invests at least 80% of its net assets in lower-quality debt securities, i.e., “junk bonds”. Investments in lower-rated securities or unrated securities of comparable quality tend to be more sensitive to economic conditions than higher rated securities. Junk bonds involve a greater risk of default by the issuer because such securities are generally unsecured and are often subordinated to other creditors’ claims. |
| J. | | Securities Lending — The Fund may lend portfolio securities having a market value up to one-third of the Fund’s total assets. Such loans are secured by collateral equal to no less than the market value of the loaned securities determined daily by the securities lending provider. Such collateral will be cash or debt securities issued or guaranteed by the U.S. Government or any of its sponsored agencies. Cash collateral received in connection with these loans is invested in short-term money market instruments or affiliated money market funds and is shown as such on the Schedule of Investments. It is the Fund’s policy to obtain additional collateral from or return excess collateral to the borrower by the end of the next business day, following the valuation date of the securities loaned. Therefore, the value of the collateral held may be temporarily less than the value of the securities on loan. Lending securities entails a risk of loss to the Fund if and to the extent that the market value of the securities loaned were to increase and the borrower did not increase the collateral accordingly, and the borrower fails to return the securities. Upon the failure of the borrower to return the securities, collateral may be liquidated and the securities may be purchased on the open market to replace the loaned securities. The Fund could experience delays and costs in gaining access to the collateral. The Fund bears the risk of any deficiency in the amount of the collateral available for return to the borrower due to any loss on the collateral invested. Dividends received on cash collateral investments for securities lending transactions, which are net of compensation to counterparties, is included in Dividends from affiliated money market funds on the Statement of Operations. The aggregate value of securities out on loan is shown as a footnote on the Statement of Assets and Liabilities, if any. |
| K. | | Foreign Currency Translations — Foreign currency is valued at the close of the NYSE based on quotations posted by banks and major currency dealers. Portfolio securities and other assets and liabilities denominated in foreign currencies are translated into U.S. dollar amounts at date of valuation. Purchases and sales of portfolio securities (net of foreign taxes withheld on disposition) and income items denominated in foreign currencies are translated into U.S. dollar amounts on the respective dates of such transactions. The Fund does not separately account for the portion of the results of operations resulting from changes in foreign exchange rates on investments and the fluctuations arising from changes in market prices of securities held. The combined results of changes in foreign exchange rates and the fluctuation of market prices on investments (net of estimated foreign tax withholding) are included with the net realized and unrealized gain or loss from investments in the Statement of Operations. Reported net realized foreign currency gains or losses arise from (1) sales of foreign currencies, (2) currency gains or losses realized between the trade and settlement dates on securities transactions, and (3) the difference between the amounts of dividends, interest, and foreign withholding taxes recorded on the Fund’s books and the U.S. dollar equivalent of the amounts actually received or paid. Net unrealized foreign currency gains and losses arise from changes in the fair values of assets and liabilities, other than investments in securities at fiscal period end, resulting from changes in exchange rates. |
| | The Fund may invest in foreign securities which may be subject to foreign taxes on income, gains on investments or currency repatriation, a portion of which may be recoverable. |
| L. | | Foreign Currency Contracts — The Fund may enter into foreign currency contracts to manage or minimize currency or exchange rate risk. The Fund may also enter into foreign currency contracts for the purchase or sale of a security denominated in a foreign currency in order to “lock in” the U.S. dollar price of that security. A foreign currency contract is an obligation to purchase or sell a specific currency for an agreed-upon price at a future date. The use of foreign currency contracts does not eliminate fluctuations in the price of the underlying securities the Fund owns or intends to acquire but establishes a rate of exchange in advance. Fluctuations in the value of these contracts are measured by the difference in the contract date and reporting date exchange rates and are recorded as unrealized appreciation (depreciation) until the contracts are closed. When the contracts are closed, realized gains (losses) are recorded. Realized and unrealized gains (losses) on the contracts are included in the Statement of Operations. The primary risks associated with foreign currency contracts include failure of the counterparty to meet the terms of the contract and the value of the foreign currency changing unfavorably. These risks may be in excess of the amounts reflected in the Statement of Assets and Liabilities. |
| M. | | Swap Agreements — The Fund may enter into various swap transactions, including interest rate, total return, index, currency exchange rate and credit default swap contracts (“CDS”) for investment purposes or to manage interest rate, currency or credit risk. |
| | Interest rate, total return, index, and currency exchange rate swap agreements are two-party contracts entered into primarily to exchange the returns (or differentials in rates of returns) earned or realized on particular predetermined investments or instruments. The gross returns to be exchanged or “swapped” between the parties are calculated with respect to a notional amount, i.e., the return on or increase in value of a particular dollar amount invested at a particular interest rate or return of an underlying asset, in a particular foreign currency, or in a “basket” of securities representing a particular index. |
Invesco V.I. High Yield Fund
| | |
| | A CDS is an agreement between two parties (“Counterparties”) to exchange the credit risk of an issuer. A buyer of a CDS is said to buy protection by paying a fixed payment over the life of the agreement and in some situations an upfront payment to the seller of the CDS. If a defined credit event occurs (such as payment default or bankruptcy), the Fund as a protection buyer would cease paying its fixed payment, the Fund would deliver eligible bonds issued by the reference entity to the seller, and the seller would pay the full notional value, or the “par value”, of the referenced obligation to the Fund. A seller of a CDS is said to sell protection and thus would receive a fixed payment over the life of the agreement and an upfront payment, if applicable. If a credit event occurs, the Fund as a protection seller would cease to receive the fixed payment stream, the Fund would pay the buyer “par value” or the full notional value of the referenced obligation, and the Fund would receive the eligible bonds issued by the reference entity. In turn, these bonds may be sold in order to realize a recovery value. Alternatively, the seller of the CDS and its counterparty may agree to net the notional amount and the market value of the bonds and make a cash payment equal to the difference to the buyer of protection. If no credit event occurs, the Fund receives the fixed payment over the life of the agreement. As the seller, the Fund would effectively add leverage to its portfolio because, in addition to its total net assets, the Fund would be subject to investment exposure on the notional amount of the CDS. In connection with these agreements, cash and securities may be identified as collateral in accordance with the terms of the respective swap agreements to provide assets of value and recourse in the event of default under the swap agreement or bankruptcy/insolvency of a party to the swap agreement. If a counterparty becomes bankrupt or otherwise fails to perform its obligations due to financial difficulties, the Fund may experience significant delays in obtaining any recovery in a bankruptcy or other reorganization proceeding. The Fund may obtain only limited recovery or may obtain no recovery in such circumstances. |
| | Implied credit spreads represent the current level at which protection could be bought or sold given the terms of the existing CDS contract and serve as an indicator of the current status of the payment/performance risk of the CDS. An implied spread that has widened or increased since entry into the initial contract may indicate a deteriorating credit profile and increased risk of default for the reference entity. A declining or narrowing spread may indicate an improving credit profile or decreased risk of default for the reference entity. Alternatively, credit spreads may increase or decrease reflecting the general tolerance for risk in the credit markets. |
| | Changes in the value of swap agreements are recognized as unrealized gains (losses) in the Statement of Operations by “marking to market” on a daily basis to reflect the value of the swap agreement at the end of each trading day. Payments received or paid at the beginning of the agreement are reflected as such on the Statement of Assets and Liabilities and may be referred to as upfront payments. The Fund accrues for the fixed payment stream and amortizes upfront payments, if any, on swap agreements on a daily basis with the net amount, recorded as a component of realized gain (loss) on the Statement of Operations. A liquidation payment received or made at the termination of a swap agreement is recorded as realized gain (loss) on the Statement of Operations. The Fund segregates liquid securities having a value at least equal to the amount of the potential obligation of a Fund under any swap transaction. The Fund’s maximum risk of loss from counterparty risk, either as the protection seller or as the protection buyer, is the value of the contract. The risk may be mitigated by having a master netting arrangement between the Fund and the counterparty and by the posting of collateral by the counterparty to cover the Fund’s exposure to the counterparty. Entering into these agreements involves, to varying degrees, lack of liquidity and elements of credit, market, and counterparty risk in excess of amounts recognized on the Statement of Assets and Liabilities. Such risks involve the possibility that a swap is difficult to sell or liquidate; the counterparty does not honor its obligations under the agreement and unfavorable interest rates and market fluctuations. |
NOTE 2—Advisory Fees and Other Fees Paid to Affiliates
The Trust has entered into a master investment advisory agreement with Invesco Advisers, Inc. (the “Adviser” or “Invesco”). Under the terms of the investment advisory agreement, the Fund pays an advisory fee to the Adviser based on the annual rate of the Fund’s average daily net assets as follows:
| | | | | |
| Average Net Assets | | Rate |
| |
| First $200 million | | | 0 | .625% |
| |
| Next $300 million | | | 0 | .55% |
| |
| Next $500 million | | | 0 | .50% |
| |
| Over $1 billion | | | 0 | .45% |
| |
Under the terms of a master sub-advisory agreement between the Adviser and each of Invesco Asset Management Deutschland GmbH, Invesco Asset Management Limited, Invesco Asset Management (Japan) Limited, Invesco Australia Limited, Invesco Hong Kong Limited, Invesco Senior Secured Management, Inc. and Invesco Canada Ltd. (collectively, the “Affiliated Sub-Advisers”) the Adviser, not the Fund, may pay 40% of the fees paid to the Adviser to any such Affiliated Sub-Adviser(s) that provide discretionary investment management services to the Fund based on the percentage of assets allocated to such Sub-Adviser(s).
Effective May 2, 2011, the Adviser has contractually agreed, through at least June 30, 2013, to waive advisory fees and/or reimburse expenses of all shares to the extent necessary to limit total annual fund operating expenses after fee waiver and/or expense reimbursement (excluding certain items discussed below) of Series I shares to 0.80% and Series II shares to 1.05% of average daily net assets. Prior to May 2, 2011, the Adviser had contractually agreed to waive advisory fees and/or reimburse expenses of all shares to the extent necessary to limit total annual fund operating expenses after fee waiver and/or expense reimbursement (excluding certain items discussed below) of Series I shares to 0.95% and Series II shares to 1.20% of average daily net assets. In determining the Adviser’s obligation to waive advisory fees and/or reimburse expenses, the following expenses are not taken into account, and could cause the total annual fund operating expenses after fee waiver and/or expense reimbursement to exceed the numbers reflected above: (1) interest; (2) taxes; (3) dividend expense on short sales; (4) extraordinary items or non-routine items, including litigation expenses; and (5) expenses that the Fund has incurred but did not actually pay because of an expense offset arrangement. Unless the Board of the Trustees and Invesco mutually agree to amend or continue the fee waiver agreement, it will terminate on June 30, 2013.
Invesco V.I. High Yield Fund
Further, the Adviser has contractually agreed, through at least June 30, 2012, to waive the advisory fee payable by the Fund in an amount equal to 100% of the net advisory fees the Adviser receives from the affiliated money market funds on investments by the Fund of uninvested cash (excluding investments of cash collateral from securities lending) in such affiliated money market funds.
For the year ended December 31, 2011, the Adviser waived advisory fees of $191,950.
The Trust has entered into a master administrative services agreement with Invesco pursuant to which the Fund has agreed to pay Invesco a fee for costs incurred in providing accounting services and fund administrative services to the Fund and to reimburse Invesco for administrative services fees paid to insurance companies that have agreed to provide services to the participants of separate accounts. These administrative services provided by the insurance companies may include, among other things: the printing of prospectuses, financial reports and proxy statements and the delivery of the same to existing participants; the maintenance of master accounts; the facilitation of purchases and redemptions requested by the participants; and the servicing of participants’ accounts. Pursuant to such agreement, for the year ended December 31, 2011, Invesco was paid $50,000 for accounting and fund administrative services and reimbursed $178,977 for services provided by insurance companies.
The Trust has entered into a transfer agency and service agreement with Invesco Investment Services, Inc. (“IIS”) pursuant to which the Fund has agreed to pay IIS a fee for providing transfer agency and shareholder services to the Fund and reimburse IIS for certain expenses incurred by IIS in the course of providing such services. For the year ended December 31, 2011, expenses incurred under the agreement are shown in the Statement of Operations as transfer agent fees.
The Trust has entered into a master distribution agreement with Invesco Distributors, Inc. (“IDI”) to serve as the distributor for the Fund. The Trust has adopted a plan pursuant to Rule 12b-1 under the 1940 Act with respect to the Fund’s Series II shares (the “Plan”). The Fund, pursuant to the Plan, pays IDI compensation at the annual rate of 0.25% of the Fund’s average daily net assets of Series II shares. Of the Plan payments, up to 0.25% of the average daily net assets of the Series II shares may be paid to insurance companies who furnish continuing personal shareholder services to customers who purchase and own Series II shares of the Fund. For the year ended December 31, 2011, expenses incurred under the Plan are detailed in the Statement of Operations as distribution fees.
Certain officers and trustees of the Trust are officers and directors of the Adviser, Invesco Ltd., IIS and/or IDI.
NOTE 3—Additional Valuation Information
GAAP defines fair value as the price that would be received to sell an asset or paid to transfer a liability in an orderly transaction between market participants at the measurement date, under current market conditions. GAAP establishes a hierarchy that prioritizes the inputs to valuation methods giving the highest priority to readily available unadjusted quoted prices in an active market for identical assets (Level 1) and the lowest priority to significant unobservable inputs (Level 3) generally when market prices are not readily available or are unreliable. Based on the valuation inputs, the securities or other investments are tiered into one of three levels. Changes in valuation methods may result in transfers in or out of an investment’s assigned level:
| | |
| | Level 1 — | Prices are determined using quoted prices in an active market for identical assets. |
| | Level 2 — | Prices are determined using other significant observable inputs. Observable inputs are inputs that other market participants may use in pricing a security. These may include quoted prices for similar securities, interest rates, prepayment speeds, credit risk, yield curves, loss severities, default rates, discount rates, volatilities and others. |
| | Level 3 — | Prices are determined using significant unobservable inputs. In situations where quoted prices or observable inputs are unavailable (for example, when there is little or no market activity for an investment at the end of the period), unobservable inputs may be used. Unobservable inputs reflect the Fund’s own assumptions about the factors market participants would use in determining fair value of the securities or instruments and would be based on the best available information. |
The following is a summary of the tiered valuation input levels, as of December 31, 2011. The level assigned to the securities valuations may not be an indication of the risk or liquidity associated with investing in those securities. Because of the inherent uncertainties of valuation, the values reflected in the financial statements may materially differ from the value received upon actual sale of those investments.
During the year ended December 31, 2011, there were no significant transfers between investment levels.
| | | | | | | | | | | | | | | | | |
| | | Level 1 | | Level 2 | | Level 3 | | Total |
| |
| Equity Securities | | $ | 14,642,636 | | | $ | 644,664 | | | $ | 0 | | | $ | 15,287,300 | |
| |
| U.S. Treasury Securities | | | — | | | | 629,894 | | | | — | | | | 629,894 | |
| |
| Corporate Debt Securities | | | — | | | | 83,337,836 | | | | 9,950 | | | | 83,347,786 | |
| |
| Foreign Corporate Debt Securities | | | — | | | | 8,298,874 | | | | | | | | 8,298,874 | |
| |
| | | $ | 14,642,636 | | | $ | 92,911,268 | | | $ | 9,950 | | | $ | 107,563,854 | |
| |
| Foreign Currency Contracts* | | | — | | | | 476,920 | | | | — | | | | 476,920 | |
| |
| Swap Agreements* | | | — | | | | 17,439 | | | | — | | | | 17,439 | |
| |
| Total Investments | | $ | 14,642,636 | | | $ | 93,405,627 | | | $ | 9,950 | | | $ | 108,058,213 | |
| |
| |
| * | Unrealized appreciation. |
Invesco V.I. High Yield Fund
NOTE 4—Derivative Investments
Value of Derivative Instruments at Period-End
The table below summarizes the value of the Fund’s derivative instruments, detailed by primary risk exposure, held as of December 31, 2011:
| | | | | | | | | |
| | | Value |
| Risk Exposure/Derivative Type | | Assets | | Liabilities |
| |
| Credit risk | | | | | | | | |
Swap agreements(a) | | $ | 17,439 | | | $ | — | |
| |
| Currency risk | | | | | | | | |
Foreign currency contracts(b) | | | 512,358 | | | | — | |
| |
| | | $ | 529,797 | | | $ | — | |
| |
| | |
| (a) | | Value is disclosed on the Statement of Assets and Liabilities as Unrealized appreciation on swap agreements. |
| (b) | | Value is disclosed on the Statement of Assets and Liabilities as Foreign currency contracts. |
Effect of Derivative Instruments for the year ended December 31, 2011
The table below summarizes the gains (losses) on derivative instruments, detailed by primary risk exposure, recognized in earnings during the period:
| | | | | | | | | |
| | | Location of Gain (Loss) on
|
| | | Statement of Operations |
| | | Swap
| | Foreign Currency
|
| | | Agreements* | | Contracts* |
| |
| Realized Gain (Loss) | | | | | | | | |
| Credit risk | | $ | 6,312 | | | $ | — | |
| |
| Currency risk | | | — | | | | 27,134 | |
| |
| Change in Unrealized Appreciation | | | | | | | | |
| Credit risk | | | 17,439 | | | | — | |
| |
| Currency risk | | | — | | | | 536,238 | |
| |
| Total | | $ | 23,751 | | | $ | 563,372 | |
| |
| |
| * | The average notional value of swap agreements and foreign currency contracts outstanding during the period was $1,406,667 and $8,450,691, respectively. |
| | | | | | | | | | | | | | | | | | | | | | | |
| Open Foreign Currency Contracts |
Settlement
| | | | Contract to | | Notional
| | Unrealized
|
| Date | | Counterparty | | Deliver | | Receive | | Value | | Appreciation |
| |
| | | | | | | | | | | | | | | | | | | | | | | |
| 02/09/12 | | RBC Dain Rauscher | | EUR | | | 5,527,000 | | | USD | | | 7,609,132 | | | $ | 7,156,142 | | | $ | 452,990 | |
| |
| 02/17/12 | | Morgan Stanley | | GBP | | | 777,000 | | | USD | | | 1,230,363 | | | | 1,206,433 | | | | 23,930 | |
| |
| Total open foreign currency contracts | | $ | 8,362,575 | | | $ | 476,920 | |
| |
| | | | | | | | | | | | | | | | | | | | | | | |
| Closed Foreign Currency Contracts |
Closed
| | | | Contract to | | Notional
| | |
| Date | | Counterparty | | Deliver | | Receive | | Value | | Realized Gain |
| |
| | | | | | | | | | | | | | | | | | | | | | | |
| 11/21/11 | | RBC Dain Rauscher | | EUR | | | 207,000 | | | USD | | | 284,981 | | | $ | 280,322 | | | $ | 4,659 | |
| |
| 11/25/11 | | RBC Dain Rauscher | | EUR | | | 155,000 | | | USD | | | 213,392 | | | | 206,118 | | | | 7,274 | |
| |
| 11/29/11 | | RBC Dain Rauscher | | EUR | | | 141,000 | | | USD | | | 194,117 | | | | 187,987 | | | | 6,130 | |
| |
| 12/15/11 | | RBC Dain Rauscher | | EUR | | | 79,000 | | | USD | | | 108,761 | | | | 102,720 | | | | 6,041 | |
| |
| 12/22/11 | | Morgan Stanley | | GBP | | | 22,000 | | | USD | | | 34,837 | | | | 34,475 | | | | 362 | |
| |
| 12/22/11 | | RBC Dain Rauscher | | EUR | | | 157,000 | | | USD | | | 216,145 | | | | 205,173 | | | | 10,972 | |
| |
| Total closed foreign currency contracts | | $ | 1,016,795 | | | $ | 35,438 | |
| |
| Total foreign currency contracts | | $ | 512,358 | |
| |
| | | |
| Currency Abbreviations: |
| EUR | | – Euro |
| GBP | | – British Pound Sterling |
| USD | | – U.S. Dollar |
Invesco V.I. High Yield Fund
| | | | | | | | | | | | | | | | | | | | | | | | | | | |
| Open Credit Default Swap Agreements |
| | | | | | | | | | | | | | | Value
|
| | | | | | | | | | | Implied
| | Notional
| | Unrealized
|
| | | | | Buy/Sell
| | (Pay)/Receive
| | Expiration
| | Credit
| | Amount
| | Appreciation
|
| Counterparty | | Reference Entity | | Protection | | Fixed Rate | | Date | | Spread(a) | | (000) | | (Depreciation) |
| |
| JPMorgan Chase Bank | | CDX North American High Yield | | | Sell | | | | 5.00 | % | | | 12/20/2016 | | | | 6.80 | % | | | 4,900 | | | $ | 19,664 | (b) |
| |
| JPMorgan Chase Bank | | CDX North American High Yield | | | Sell | | | | 5.00 | % | | | 12/20/2016 | | | | 6.80 | % | | | 980 | | | | (2,225 | )(b) |
| |
| Total Credit Default Swap Agreements | | $ | 17,439 | |
| |
| | |
| (a) | | Implied credit spreads represent the current level at which protection could be bought or sold given the terms of the existing credit default swap contract and serve as an indicator of the current status of the payment/performance risk of the credit default swap contract. An implied credit spread that has widened or increased since entry into the initial contract may indicate a deteriorating credit profile and increased risk of default for the reference entity. A declining or narrowing spread may indicate an improving credit profile or decreased risk of default for the reference entity. Alternatively, credit spreads may increase or decrease reflecting the general tolerance for risk in the credit markets generally. |
| (b) | | Includes unamortized premium at period-end of $421,916. |
NOTE 5—Trustees’ and Officers’ Fees and Benefits
“Trustees’ and Officers’ Fees and Benefits” include amounts accrued by the Fund to pay remuneration to certain Trustees and Officers of the Fund. Trustees have the option to defer compensation payable by the Fund, and “Trustees’ and Officers’ Fees and Benefits” also include amounts accrued by the Fund to fund such deferred compensation amounts. Those Trustees who defer compensation have the option to select various Invesco Funds in which their deferral accounts shall be deemed to be invested. Finally, certain current Trustees are eligible to participate in a retirement plan that provides for benefits to be paid upon retirement to Trustees over a period of time based on the number of years of service. The Fund may have certain former Trustees who also participate in a retirement plan and receive benefits under such plan. “Trustees’ and Officers’ Fees and Benefits” include amounts accrued by the Fund to fund such retirement benefits. Obligations under the deferred compensation and retirement plans represent unsecured claims against the general assets of the Fund.
During the year ended December 31, 2011, the Fund paid legal fees of $1,200 for services rendered by Kramer, Levin, Naftalis & Frankel LLP as counsel to the Independent Trustees. A partner of that firm is a Trustee of the Trust.
NOTE 6—Cash Balances
The Fund may borrow for leveraging in an amount up to 5% of the Fund’s total assets (excluding the amount borrowed) at the time the borrowing is made. In doing so, the Fund is permitted to temporarily carry a negative or overdrawn balance in its account with The State Street Bank and Trust Company, the custodian bank. To compensate the custodian bank for such overdrafts, the overdrawn Fund may either (1) leave funds as a compensating balance in the account so the custodian bank can be compensated by earning the additional interest; or (2) compensate by paying the custodian bank at a rate agreed upon by the custodian bank and Invesco, not to exceed the contractually agreed upon rate. A Fund may not purchase additional securities when any borrowings from banks exceeds 5% of the Fund’s total assets.
NOTE 7—Distributions to Shareholders and Tax Components of Net Assets
Tax Character of Distributions to Shareholders Paid During the Years Ended December 31, 2011 and 2010:
| | | | | | | | | |
| | | 2011 | | 2010 |
| |
| Ordinary income | | $ | 4,275,733 | | | $ | 5,322,863 | |
| |
Tax Components of Net Assets at Period-End:
| | | | | |
| | | 2011 |
| |
| Undistributed ordinary income | | $ | 5,538,695 | |
| |
| Net unrealized appreciation (depreciation) — investments | | | (4,335,103 | ) |
| |
| Net unrealized appreciation — other investments | | | 7,145 | |
| |
| Temporary book/tax differences | | | (45,146 | ) |
| |
| Capital loss carryforward | | | (11,184,827 | ) |
| |
| Shares of beneficial interest | | | 121,938,972 | |
| |
| Total net assets | | $ | 111,919,736 | |
| |
Invesco V.I. High Yield Fund
The difference between book-basis and tax-basis unrealized appreciation (depreciation) is due to differences in the timing of recognition of gains and losses on investments for tax and book purposes. The Fund’s net unrealized appreciation (depreciation) difference is attributable primarily to wash sales.
The temporary book/tax differences are a result of timing differences between book and tax recognition of income and/or expenses. The Fund’s temporary book/tax differences are the result of the trustee deferral of compensation and retirement plan benefits.
Capital loss carryforward is calculated and reported as of a specific date. Results of transactions and other activity after that date may affect the amount of capital loss carryforward actually available for the Fund to utilize. The Regulated Investment Company Modernization Act of 2010 (the “Act”) eliminated the eight-year carryover period for capital losses that arise in taxable years beginning after its enactment date of December 22, 2010. Consequently, these capital losses can be carried forward for an unlimited period. However, capital losses with an expiration period may not be used to offset capital gains until all net capital losses without an expiration date have been utilized. Additionally, post-enactment capital loss carryovers will retain their character as either short-term or long-term capital losses instead of as short-term capital losses as under prior law. The ability to utilize capital loss carryforward in the future may be limited under the Internal Revenue Code and related regulations based on the results of future transactions. Under these limitation rules, the Fund is limited to utilizing $3,605,428 of capital loss carryforward in the fiscal year ending December 31, 2012.
The Fund utilized $2,269,937 of capital loss carryforward in the current period to offset net realized capital gain for federal income tax purposes. The Fund has a capital loss carryforward as of December 31, 2011, which expires as follows:
| | | | | | | | | | | | | |
| Capital Loss Carryforward |
| Expiration | | Short-Term | | Long-Term | | Total |
| |
| December 31, 2015 | | $ | 329,831 | | | $ | — | | | $ | 329,831 | |
| |
| December 31, 2016 | | | 9,020,578 | | | | — | | | | 9,020,578 | |
| |
| December 31, 2017 | | | 1,834,418 | | | | — | | | | 1,834,418 | |
| |
| Total capital loss carryforward | | $ | 11,184,827 | | | $ | — | | | $ | 11,184,827 | |
| |
| |
| * | Capital loss carryforward as of the date listed above is reduced for limitations, if any, to the extent required by the Internal Revenue Code. |
NOTE 8—Investment Securities
The aggregate amount of investment securities (other than short-term securities, U.S. Treasury obligations and money market funds, if any) purchased and sold by the Fund during the year ended December 31, 2011 was $67,945,216 and $44,444,414, respectively. Cost of investments on a tax basis includes the adjustments for financial reporting purposes as of the most recently completed Federal income tax reporting period-end.
| | | | | |
| Unrealized Appreciation (Depreciation) of Investment Securities on a Tax Basis |
| |
| Aggregate unrealized appreciation of investment securities | | $ | 2,271,515 | |
| |
| Aggregate unrealized (depreciation) of investment securities | | | (6,606,618 | ) |
| |
| Net unrealized appreciation (depreciation) of investment securities | | $ | (4,335,103 | ) |
| |
| Cost of investments for tax purposes is $111,898,957. |
NOTE 9—Reclassification of Permanent Differences
Primarily as a result of differing book/tax treatment of capital loss carryforward, on December 31, 2011, undistributed net investment income was decreased by $21,452, undistributed net realized gain was increased by $2,340,736 and shares of beneficial interest decreased by $2,319,284. Further, as a result of tax deferrals acquired in the reorganization of Invesco Van Kampen V.I. High Yield Fund into the Fund, undistributed net investment income was decreased by $4,033, undistributed net realized gain was decreased by $10,506,909 and shares of beneficial interest increased by $10,510,942. These reclassifications had no effect on the net assets of the Fund.
Invesco V.I. High Yield Fund
NOTE 10—Share Information
| | | | | | | | | | | | | | | | | |
| | | Summary of Share Activity |
| |
| | | Year ended December 31, |
| | | 2011(a) | | 2010 |
| | | Shares | | Amount | | Shares | | Amount |
| |
| Sold: | | | | | | | | | | | | | | | | |
| Series I | | | 11,649,443 | | | $ | 59,272,659 | | | | 4,999,888 | | | $ | 26,982,826 | |
| |
| Series II | | | 1,343,316 | | | | 6,766,855 | | | | 16,305 | | | | 86,476 | |
| |
| Issued as reinvestment of dividends: | | | | | | | | | | | | | | | | |
| Series I | | | 814,841 | | | | 4,229,022 | | | | 1,018,199 | | | | 5,284,452 | |
| |
| Series II | | | 9,000 | | | | 46,711 | | | | 7,401 | | | | 38,411 | |
| |
Issued in connection with acquisitions:(b) | | | | | | | | | | | | | | | | |
| Series I | | | 6,239,174 | | | | 32,616,526 | | | | — | | | | — | |
| |
| Series II | | | 1,983 | | | | 10,369 | | | | — | | | | — | |
| |
| Reacquired: | | | | | | | | | | | | | | | | |
| Series I | | | (7,984,170 | ) | | | (40,837,082 | ) | | | (7,205,545 | ) | | | (38,790,689 | ) |
| |
| Series II | | | (381,629 | ) | | | (1,912,375 | ) | | | (19,746 | ) | | | (107,228 | ) |
| |
| Net increase (decrease) in share activity | | | 11,691,958 | | | $ | 60,192,685 | | | | (1,183,498 | ) | | $ | (6,505,752 | ) |
| |
| | |
| (a) | | There are entities that are record owners of more than 5% of the outstanding shares of the Fund and in the aggregate own 62% of the outstanding shares of the Fund. The Fund and the Fund’s principal underwriter or adviser, are parties to participation agreements with these entities whereby these entities sell units of interest in separate accounts funding variable products that are invested in the Fund. The Fund, Invesco and/or Invesco affiliates may make payments to these entities, which are considered to be related to the Fund, for providing services to the Fund, Invesco and/or Invesco affiliates including but not limited to services such as, securities brokerage, third party record keeping and account servicing and administrative services. The Fund has no knowledge as to whether all or any portion of the shares owned of record by these entities are also owned beneficially. |
| (b) | | As of the opening of business on May 2, 2011, the Fund acquired all the net assets of Invesco Van Kampen V.I. High Yield Fund (the “Target Fund”) pursuant to a plan of reorganization approved by the Trustees of the Fund on November 10, 2010 and by the shareholders of the Target Fund on April 1, 2011. The acquisition was accomplished by a tax-free exchange of 6,241,157 shares of the Fund for 2,940,652 shares outstanding of the Target Fund as of the close of business on April 29, 2011. Each class of the Target Fund was exchanged for the like class of shares of the Fund, based on the relative net asset value of the Target Fund to the net asset value of the Fund on the close of business, April 29, 2011. The Target Fund’s net assets at that date of $32,626,895 including $1,685,415 of unrealized appreciation, was combined with those of the Fund. The net assets of the Fund immediately before the acquisition were $63,972,559. The net assets immediately after the acquisition were $96,599,454. |
| | The pro forma results of operations for the year ended December 31, 2011 assuming the reorganization had been completed on January 1, 2011, the beginning of the annual reporting period, are as follows: |
| | | | | |
| Net investment income | | $ | 6,329,832 | |
| Net realized/unrealized gains (losses) | | | (4,990,283 | ) |
| | | | | |
| Change in net assets resulting from operations | | $ | 1,339,549 | |
| | |
| | The combined investment portfolios have been managed as a single integrated portfolio since the acquisition was completed, it is not practicable to separate the amounts of revenue and earnings of the Target Fund that has been included in the Fund’s Statement of Operations since May 2, 2011. |
Invesco V.I. High Yield Fund
NOTE 11—Financial Highlights
The following schedule presents financial highlights for a share of the Fund outstanding throughout the periods indicated.
| | | | | | | | | | | | | | | | | | | | | | | | | | | | | | | | | | | | | | | | | | | | | | | | | |
| | | | | | | | | | | | | | | | | | | Ratio of
| | Ratio of
| | | | |
| | | | | | | Net gains
| | | | | | | | | | | | expenses
| | expenses
| | | | |
| | | | | | | (losses) on
| | | | | | | | | | | | to average
| | to average net
| | Ratio of net
| | |
| | | Net asset
| | | | securities
| | | | Dividends
| | | | | | | | net assets
| | assets without
| | investment
| | |
| | | value,
| | Net
| | (both
| | Total from
| | from net
| | Net asset
| | | | Net assets,
| | with fee waivers
| | fee waivers
| | income
| | |
| | | beginning
| | investment
| | realized and
| | investment
| | investment
| | value, end
| | Total
| | end of period
| | and/or expenses
| | and/or expenses
| | to average
| | Portfolio
|
| | | of period | | income(a) | | unrealized) | | operations | | income | | of period | | Return(b) | | (000s omitted) | | absorbed | | absorbed | | net assets | | turnover(c) |
| |
| Series I |
| Year ended 12/31/11 | | $ | 5.35 | | | $ | 0.35 | | | $ | (0.29 | ) | | $ | 0.06 | | | $ | (0.37 | ) | | $ | 5.04 | | | | 0.96 | % | | $ | 106,557 | | | | 0.83 | %(d) | | | 1.06 | %(d) | | | 6.84 | %(d) | | | 71 | % |
| Year ended 12/31/10 | | | 5.22 | | | | 0.43 | | | | 0.26 | | | | 0.69 | | | | (0.56 | ) | | | 5.35 | | | | 13.57 | | | | 55,803 | | | | 0.95 | | | | 1.17 | | | | 8.04 | | | | 102 | |
| Year ended 12/31/09 | | | 3.69 | | | | 0.47 | | | | 1.47 | | | | 1.94 | | | | (0.41 | ) | | | 5.22 | | | | 52.79 | | | | 60,649 | | | | 0.95 | | | | 1.22 | | | | 10.29 | | | | 125 | |
| Year ended 12/31/08 | | | 5.74 | | | | 0.49 | | | | (2.00 | ) | | | (1.51 | ) | | | (0.54 | ) | | | 3.69 | | | | (25.69 | ) | | | 39,918 | | | | 0.95 | | | | 1.22 | | | | 9.19 | | | | 85 | |
| Year ended 12/31/07 | | | 6.12 | | | | 0.46 | | | | (0.38 | ) | | | 0.08 | | | | (0.46 | ) | | | 5.74 | | | | 1.24 | | | | 51,225 | | | | 0.96 | | | | 1.15 | | | | 7.42 | | | | 113 | |
| |
| Series II |
| Year ended 12/31/11 | | | 5.35 | | | | 0.33 | | | | (0.29 | ) | | | 0.04 | | | | (0.36 | ) | | | 5.03 | | | | 0.61 | | | | 5,363 | | | | 1.08 | (d) | | | 1.31 | (d) | | | 6.59 | (d) | | | 71 | |
| Year ended 12/31/10 | | | 5.22 | | | | 0.42 | | | | 0.26 | | | | 0.68 | | | | (0.55 | ) | | | 5.35 | | | | 13.27 | | | | 497 | | | | 1.20 | | | | 1.42 | | | | 7.79 | | | | 102 | |
| Year ended 12/31/09 | | | 3.68 | | | | 0.46 | | | | 1.48 | | | | 1.94 | | | | (0.40 | ) | | | 5.22 | | | | 52.77 | | | | 464 | | | | 1.20 | | | | 1.47 | | | | 10.04 | | | | 125 | |
| Year ended 12/31/08 | | | 5.72 | | | | 0.47 | | | | (1.99 | ) | | | (1.52 | ) | | | (0.52 | ) | | | 3.68 | | | | (26.00 | ) | | | 374 | | | | 1.20 | | | | 1.47 | | | | 8.94 | | | | 85 | |
| Year ended 12/31/07 | | | 6.09 | | | | 0.44 | | | | (0.38 | ) | | | 0.06 | | | | (0.43 | ) | | | 5.72 | | | | 1.01 | | | | 666 | | | | 1.21 | | | | 1.40 | | | | 7.17 | | | | 113 | |
| |
| | |
| (a) | | Calculated using average shares outstanding. |
| (b) | | Includes adjustments in accordance with accounting principles generally accepted in the United States of America and as such, the net asset value for financial reporting purposes and the returns based upon those net asset values may differ from the net asset value and returns for shareholder transactions. Total returns are not annualized for periods less than one year, if applicable and do not reflect charges assessed in connection with a variable product, which if included would reduce total returns. |
| (c) | | Portfolio turnover is calculated at the fund level and is not annualized for periods less than one year, if applicable. For the period ending December 31, 2011, the portfolio turnover calculation excludes the value of securities purchased of $30,901,742 and sold of $8,109,618 in effect to realign the Fund’s portfolio holdings after the reorganization of Invesco Van Kampen V.I. High Yield Fund into the Fund. |
| (d) | | Ratios are based on average daily net assets (000’s) of $79,770 and $2,159 for Series I and Series II, respectively. |
Invesco V.I. High Yield Fund
Report of Independent Registered Public Accounting Firm
To the Board of Trustees of AIM Variable Insurance Funds (Invesco Variable Insurance Funds)
and Shareholders of Invesco V.I. High Yield Fund:
In our opinion, the accompanying statement of assets and liabilities, including the schedule of investments, and the related statements of operations and of changes in net assets and the financial highlights present fairly, in all material respects, the financial position of Invesco V.I. High Yield Fund (one of the funds constituting AIM Variable Insurance Funds (Invesco Variable Insurance Funds), hereafter referred to as the “Fund”) at December 31, 2011, the results of its operations for the year then ended, the changes in its net assets for each of the two years in the period then ended and the financial highlights for each of the five years in the period then ended, in conformity with accounting principles generally accepted in the United States of America. These financial statements and financial highlights (hereafter referred to as “financial statements”) are the responsibility of the Fund’s management; our responsibility is to express an opinion on these financial statements based on our audits. We conducted our audits of these financial statements in accordance with the standards of the Public Company Accounting Oversight Board (United States). Those standards require that we plan and perform the audits to obtain reasonable assurance about whether the financial statements are free of material misstatement. An audit includes examining, on a test basis, evidence supporting the amounts and disclosures in the financial statements, assessing the accounting principles used and significant estimates made by management, and evaluating the overall financial statement presentation. We believe that our audits, which included confirmation of securities at December 31, 2011 by correspondence with the custodian and brokers, provide a reasonable basis for our opinion.
PRICEWATERHOUSECOOPERS LLP
February 17, 2012
Houston, Texas
Invesco V.I. High Yield Fund
Calculating your ongoing Fund expenses
Example
As a shareholder of the Fund, you incur ongoing costs, including management fees; distribution and/or service fees (12b-1); and other Fund expenses. This example is intended to help you understand your ongoing costs (in dollars) of investing in the Fund and to compare these costs with ongoing costs of investing in other mutual funds. The example is based on an investment of $1,000 invested at the beginning of the period and held for the entire period July 1, 2011 through December 31, 2011.
The actual and hypothetical expenses in the examples below do not represent the effect of any fees or other expenses assessed in connection with a variable product; if they did, the expenses shown would be higher while the ending account values shown would be lower.
Actual expenses
The table below provides information about actual account values and actual expenses. You may use the information in this table, together with the amount you invested, to estimate the expenses that you paid over the period. Simply divide your account value by $1,000 (for example, an $8,600 account value divided by $1,000 = 8.6), then multiply the result by the number in the table under the heading entitled “Actual Expenses Paid During Period” to estimate the expenses you paid on your account during this period.
Hypothetical example for comparison purposes
The table below also provides information about hypothetical account values and hypothetical expenses based on the Fund’s actual expense ratio and an assumed rate of return of 5% per year before expenses, which is not the Fund’s actual return.
The hypothetical account values and expenses may not be used to estimate the actual ending account balance or expenses you paid for the period. You may use this information to compare the ongoing costs of investing in the Fund and other funds. To do so, compare this 5% hypothetical example with the 5% hypothetical examples that appear in the shareholder reports of the other funds.
Please note that the expenses shown in the table are meant to highlight your ongoing costs. Therefore, the hypothetical information is useful in comparing ongoing costs, and will not help you determine the relative total costs of owning different funds.
| | | | | | | | | | | | | | | | | | | | | | | | | | | | | | | |
| | | | | | | | | | HYPOTHETICAL
| | | |
| | | | | | | ACTUAL | | | (5% annual return before expenses) | | | |
| | | | Beginning
| | | Ending
| | | Expenses
| | | Ending
| | | Expenses
| | | Annualized
|
| | | | Account Value
| | | Account Value
| | | Paid During
| | | Account Value
| | | Paid During
| | | Expense
|
| Class | | | (07/01/11) | | | (12/31/11)1 | | | Period2 | | | (12/31/11) | | | Period2 | | | Ratio |
| Series I | | | $ | 1,000.00 | | | | $ | 976.70 | | | | $ | 3.94 | | | | $ | 1,021.22 | | | | $ | 4.02 | | | | | 0.79 | % |
| | | | | | | | | | | | | | | | | | | | | | | | | | | | | | | |
| Series II | | | | 1,000.00 | | | | | 974.80 | | | | | 5.18 | | | | | 1,019.96 | | | | | 5.30 | | | | | 1.04 | |
| | | | | | | | | | | | | | | | | | | | | | | | | | | | | | | |
| |
| 1 | The actual ending account value is based on the actual total return of the Fund for the period July 1, 2011 through December 31, 2011, after actual expenses and will differ from the hypothetical ending account value which is based on the Fund’s expense ratio and a hypothetical annual return of 5% before expenses. |
| 2 | Expenses are equal to the Fund’s annualized expense ratio as indicated above multiplied by the average account value over the period, multiplied by 184/365 to reflect the most recent fiscal half year. |
Invesco V.I. High Yield Fund
Form 1099-DIV, Form 1042-S and other year-end tax information provide shareholders with actual calendar year amounts that should be included in their tax returns. Shareholders should consult their tax advisors.
The following distribution information is being provided as required by the Internal Revenue Code or to meet a specific state’s requirement.
The Fund designates the following amounts or, if subsequently determined to be different, the maximum amount allowable for its fiscal year ended December 31, 2011:
| | | | | |
Federal and State Income Tax | | |
| |
| Corporate Dividends Received Deduction* | | | 0.00% | |
| | |
| | * | The above percentages are based on ordinary income dividends paid to shareholders during the Fund’s fiscal year. |
Invesco V.I. High Yield Fund
Trustees and Officers
The address of each trustee and officer is AIM Variable Insurance Funds (Invesco Variable Insurance Funds) (the “Trust”), 11 Greenway Plaza, Suite 2500, Houston, Texas 77046-1173. The trustees serve for the life of the Trust, subject to their earlier death, incapacitation, resignation, retirement or removal as more specifically provided in the Trust’s organizational documents. Each officer serves for a one year term or until their successors are elected and qualified. Column two below includes length of time served with predecessor entities, if any.
| | | | | | | | | |
| | | | | | | Number of Funds
| | |
Name, Year of Birth and
| | Trustee and/
| | Principal Occupation(s)
| | in Fund Complex
| | Other Directorship(s)
|
| Position(s) Held with the Trust | | or Officer Since | | During Past 5 Years | | Overseen by Trustee | | Held by Trustee |
| | | | | | | | | |
| | | | | | | | | |
| | | | | | | | | |
Interested Persons | | | | | | | | |
| | | | | | | | | |
| | | | | | | | | |
| | | | | | | | | |
Martin L. Flanagan1 — 1960
Trustee | | 2007 | | Executive Director, Chief Executive Officer and President, Invesco Ltd. (ultimate parent of Invesco and a global investment management firm); Advisor to the Board, Invesco Advisers, Inc. (formerly known as Invesco Institutional (N.A.), Inc.); Trustee, The Invesco Funds; Vice Chair, Investment Company Institute; and Member of Executive Board, SMU Cox School of Business
Formerly: Chairman, Invesco Advisers, Inc. (registered investment adviser); Director, Chairman, Chief Executive Officer and President, IVZ Inc. (holding company), INVESCO Group Services, Inc. (service provider) and Invesco North American Holdings, Inc. (holding company); Director, Chief Executive Officer and President, Invesco Holding Company Limited (parent of Invesco and a global investment management firm); Director, Invesco Ltd.; Chairman, Investment Company Institute and President, Co-Chief Executive Officer, Co-President, Chief Operating Officer and Chief Financial Officer, Franklin Resources, Inc. (global investment management organization) | | 140 | | None |
| | | | | | | | | |
| | | | | | | | | |
| | | | | | | | | |
Philip A. Taylor2 — 1954
Trustee, President and Principal Executive Officer | | 2006 | | Head of North American Retail and Senior Managing Director, Invesco Ltd.; Director, Co-Chairman, Co-President and Co-Chief Executive Officer, Invesco Advisers, Inc. (formerly known as Invesco Institutional (N.A.), Inc.) (registered investment adviser); Director, Chairman, Chief Executive Officer and President, Invesco Management Group, Inc. (formerly Invesco Aim Management Group, Inc.) (financial services holding company); Director and President, INVESCO Funds Group, Inc. (registered investment adviser and registered transfer agent); Director and Chairman, Invesco Investment Services, Inc. (formerly known as Invesco Aim Investment Services, Inc.) (registered transfer agent) and IVZ Distributors, Inc. (formerly known as INVESCO Distributors, Inc.) (registered broker dealer); Director, President and Chairman, Invesco Inc. (holding company) and Invesco Canada Holdings Inc. (holding company); Chief Executive Officer, Invesco Corporate Class Inc. (corporate mutual fund company) and Invesco Canada Fund Inc. (corporate mutual fund company); Director, Chairman and Chief Executive Officer, Invesco Canada Ltd. (formerly known as Invesco Trimark Ltd./Invesco Trimark Ltèe) (registered investment adviser and registered transfer agent); Trustee, President and Principal Executive Officer, The Invesco Funds (other than AIM Treasurer’s Series Trust (Invesco Treasurer’s Series Trust) and Short-Term Investments Trust); Trustee and Executive Vice President, The Invesco Funds (AIM Treasurer’s Series Trust (Invesco Treasurer’s Series Trust) and Short-Term Investments Trust only); Director, Invesco Investment Advisers LLC (formerly known as Van Kampen Asset Management); Director, Chief Executive Officer and President, Van Kampen Exchange Corp. | | 140 | | None |
| | | | | | | | | |
| | | | | | | | | |
| | | | | Formerly: Director and Chairman, Van Kampen Investor Services Inc.: Director, Chief Executive Officer and President, 1371 Preferred Inc. (holding company); and Van Kampen Investments Inc.; Director and President, AIM GP Canada Inc. (general partner for limited partnerships); and Van Kampen Advisors, Inc.; Director and Chief Executive Officer, Invesco Trimark Dealer Inc. (registered broker dealer); Director, Invesco Distributors, Inc. (formerly known as Invesco Aim Distributors, Inc.) (registered broker dealer); Manager, Invesco PowerShares Capital Management LLC; Director, Chief Executive Officer and President, Invesco Advisers, Inc.; Director, Chairman, Chief Executive Officer and President, Invesco Aim Capital Management, Inc.; President, Invesco Trimark Dealer Inc. and Invesco Trimark Ltd./Invesco Trimark Ltèe; Director and President, AIM Trimark Corporate Class Inc. and AIM Trimark Canada Fund Inc.; Senior Managing Director, Invesco Holding Company Limited; Trustee and Executive Vice President, Tax-Free Investments Trust; Director and Chairman, Fund Management Company (former registered broker dealer); President and Principal Executive Officer, The Invesco Funds (AIM Treasurer’s Series Trust (Invesco Treasurer’s Series Trust), Short-Term Investments Trust and Tax-Free Investments Trust only); President, AIM Trimark Global Fund Inc. and AIM Trimark Canada Fund Inc. | | | | |
| | | | | | | | | |
| | | | | | | | | |
| | | | | | | | | |
Wayne W. Whalen3 — 1939
Trustee | | 2010 | | Of Counsel, and prior to 2010, partner in the law firm of Skadden, Arps, Slate, Meagher & Flom LLP, legal counsel to funds in the Fund Complex | | 158 | | Director of the Abraham Lincoln Presidential Library Foundation |
| | | | | | | | | |
| | | | | | | | | |
| | | | | | | | | |
Independent Trustees | | | | | | | | |
| | | | | | | | | |
| | | | | | | | | |
| | | | | | | | | |
Bruce L. Crockett — 1944
Trustee and Chair | | 1993 | | Chairman, Crockett Technology Associates (technology consulting company) | | 140 | | ACE Limited (insurance company); and Investment Company Institute |
| | | | | Formerly: Director, Captaris (unified messaging provider); Director, President and Chief Executive Officer COMSAT Corporation; and Chairman, Board of Governors of INTELSAT (international communications company) | | | | |
| | | | | | | | | |
| |
| 1 | Mr. Flanagan is considered an interested person of the Trust because he is an officer of the adviser to the Trust, and an officer and a director of Invesco Ltd., ultimate parent of the adviser to the Trust. |
| 2 | Mr. Taylor is considered an interested person of the Trust because he is an officer and a director of the adviser to, and a director of the principal underwriter of, the Trust. |
| 3 | Mr. Whalen is considered an “interested person” (within the meaning of Section 2(a)(19) of the 1940 Act) of certain Funds in the Fund Complex by reason of he and his firm currently providing legal services as legal counsel to such Funds in the Fund Complex. |
Invesco V.I. High Yield Fund
Trustees and Officers—(continued)
The address of each trustee and officer is AIM Variable Insurance Funds (Invesco Variable Insurance Funds) (the “Trust”), 11 Greenway Plaza, Suite 2500, Houston, Texas 77046-1173. The trustees serve for the life of the Trust, subject to their earlier death, incapacitation, resignation, retirement or removal as more specifically provided in the Trust’s organizational documents. Each officer serves for a one year term or until their successors are elected and qualified. Column two below includes length of time served with predecessor entities, if any.
| | | | | | | | | |
| | | | | | | Number of Funds
| | |
Name, Year of Birth and
| | Trustee and/
| | Principal Occupation(s)
| | in Fund Complex
| | Other Directorship(s)
|
| Position(s) Held with the Trust | | or Officer Since | | During Past 5 Years | | Overseen by Trustee | | Held by Trustee |
| | | | | | | | | |
| | | | | | | | | |
| | | | | | | |
Independent Trustees—(continued) | | | | | | |
| | | | | | | | | |
| | | | | | | | | |
| | | | | | | | | |
David C. Arch — 1945
Trustee | | 2010 | | Chairman and Chief Executive Officer of Blistex Inc., a consumer health care products manufacturer. | | 158 | | Member of the Heartland Alliance Advisory Board, a nonprofit organization serving human needs based in Chicago. Board member of the Illinois Manufacturers’ Association. Member of the Board of Visitors, Institute for the Humanities, University of Michigan |
| | | | | | | | | |
| | | | | | | | | |
| | | | | | | | | |
Frank S. Bayley — 1939
Trustee | | 2001 | | Retired
Formerly: Director, Badgley Funds, Inc. (registered investment company) (2 portfolios) and Partner, law firm of Baker & McKenzie
Formerly: Director, Badgley Funds, Inc. (registered investment company) (2 portfolios) and Partner, law firm of Baker & McKenzie | | 140 | | Director and Chairman, C.D. Stimson Company (a real estate investment company) |
| | | | | | | | | |
| | | | | | | | | |
| | | | | | | | | |
James T. Bunch — 1942
Trustee | | 2004 | | Managing Member, Grumman Hill Group LLC (family office private equity management)
Formerly: Founder, Green, Manning & Bunch Ltd. (investment banking firm)(1988-2010); Executive Committee, United States Golf Association; and Director, Policy Studies, Inc. and Van Gilder Insurance Corporation | | 140 | | Vice Chairman, Board of Governors, Western Golf Association/Evans Scholars Foundation and Director, Denver Film Society |
| | | | | | | | | |
| | | | | | | | | |
| | | | | | | | | |
Rodney F. Dammeyer — 1940
Trustee | | 2010 | | President of CAC, LLC, a private company offering capital investment and management advisory services.
Formerly: Prior to January 2004, Director of TeleTech Holdings Inc.; Prior to 2002, Director of Arris Group, Inc.; Prior to 2001, Managing Partner at Equity Group Corporate Investments. Prior to 1995, Vice Chairman of Anixter International. Prior to 1985, experience includes Senior Vice President and Chief Financial Officer of Household International, Inc., Executive Vice President and Chief Financial Officer of Northwest Industries, Inc. and Partner of Arthur Andersen & Co. | | 158 | | Director of Quidel Corporation and Stericycle, Inc. Prior to May 2008, Trustee of The Scripps Research Institute. Prior to February 2008, Director of Ventana Medical Systems, Inc. Prior to April 2007, Director of GATX Corporation. Prior to April 2004, Director of TheraSense, Inc. |
| | | | | | | | | |
| | | | | | | | | |
| | | | | | | | | |
Albert R. Dowden — 1941
Trustee | | 2000 | | Director of a number of public and private business corporations, including the Boss Group, Ltd. (private investment and management); Reich & Tang Funds (5 portfolios) (registered investment company); and Homeowners of America Holding Corporation/ Homeowners of America Insurance Company (property casualty company)
Formerly: Director, Continental Energy Services, LLC (oil and gas pipeline service); Director, CompuDyne Corporation (provider of product and services to the public security market) and Director, Annuity and Life Re (Holdings), Ltd. (reinsurance company); Director, President and Chief Executive Officer, Volvo Group North America, Inc.; Senior Vice President, AB Volvo; Director of various public and private corporations; Chairman, DHJ Media, Inc.; Director Magellan Insurance Company; and Director, The Hertz Corporation, Genmar Corporation (boat manufacturer), National Media Corporation; Advisory Board of Rotary Power International (designer, manufacturer, and seller of rotary power engines); and Chairman, Cortland Trust, Inc. (registered investment company) | | 140 | | Board of Nature’s Sunshine Products, Inc. |
| | | | | | | | | |
| | | | | | | | | |
| | | | | | | | | |
Jack M. Fields — 1952
Trustee | | 1997 | | Chief Executive Officer, Twenty First Century Group, Inc. (government affairs company); and Owner and Chief Executive Officer, Dos Angelos Ranch, L.P. (cattle, hunting, corporate entertainment), Discovery Global Education Fund (non-profit) and Cross Timbers Quail Research Ranch (non-profit)
Formerly: Chief Executive Officer, Texana Timber LP (sustainable forestry company) and member of the U.S. House of Representatives | | 140 | | Administaff |
| | | | | | | | | |
| | | | | | | | | |
| | | | | | | | | |
Carl Frischling — 1937
Trustee | | 1993 | | Partner, law firm of Kramer Levin Naftalis and Frankel LLP | | 140 | | Director, Reich & Tang Funds (16 portfolios) |
| | | | | | | | | |
| | | | | | | | | |
Invesco V.I. High Yield Fund
Trustees and Officers—(continued)
The address of each trustee and officer is AIM Variable Insurance Funds (Invesco Variable Insurance Funds) (the “Trust”), 11 Greenway Plaza, Suite 2500, Houston, Texas 77046-1173. The trustees serve for the life of the Trust, subject to their earlier death, incapacitation, resignation, retirement or removal as more specifically provided in the Trust’s organizational documents. Each officer serves for a one year term or until their successors are elected and qualified. Column two below includes length of time served with predecessor entities, if any.
| | | | | | | | | |
| | | | | | | Number of Funds
| | |
Name, Year of Birth and
| | Trustee and/
| | Principal Occupation(s)
| | in Fund Complex
| | Other Directorship(s)
|
| Position(s) Held with the Trust | | or Officer Since | | During Past 5 Years | | Overseen by Trustee | | Held by Trustee |
| | | | | | | | | |
Independent Trustees—(continued) | | | | | | |
| | | | | | | | | |
| | | | | | | | | |
| | | | | | | | | |
Prema Mathai-Davis — 1950
Trustee | | 1998 | | Retired
Formerly: Chief Executive Officer, YWCA of the U.S.A. | | 140 | | None |
| | | | | | | | | |
| | | | | | | | | |
| | | | | | | | | |
Larry Soll — 1942
Trustee | | 2004 | | Retired
Formerly, Chairman, Chief Executive Officer and President, Synergen Corp. (a biotechnology company) | | 140 | | None |
| | | | | | | | | |
| | | | | | | | | |
| | | | | | | | | |
Hugo F. Sonnenschein — 1940
Trustee | | 2010 | | President Emeritus and Honorary Trustee of the University of Chicago and the Adam Smith Distinguished Service Professor in the Department of Economics at the University of Chicago. Prior to July 2000, President of the University of Chicago. | | 158 | | Trustee of the University of Rochester and a member of its investment committee. Member of the National Academy of Sciences, the American Philosophical Society and a fellow of the American Academy of Arts and Sciences |
| | | | | | | | | |
| | | | | | | | | |
| | | | | | | | | |
| Raymond Stickel, Jr. — 1944 Trustee | | 2005 | | Retired
Formerly: Director, Mainstay VP Series Funds, Inc. (25 portfolios) and Partner, Deloitte & Touche | | 140 | | None |
| | | | | | | | | |
| | | | | | | | | |
| | | | | | | | | |
Other Officers | | | | | | | | |
| | | | | | | | | |
| | | | | | | | | |
| | | | | | | | | |
Russell C. Burk — 1958
Senior Vice President and Senior Officer | | 2005 | | Senior Vice President and Senior Officer, The Invesco Funds | | N/A | | N/A |
| | | | | | | | | |
| | | | | | | | | |
| | | | | | | | | |
John M. Zerr — 1962
Senior Vice President, Chief Legal Officer and Secretary | | 2006 | | Director, Senior Vice President, Secretary and General Counsel, Invesco Management Group, Inc. (formerly known as Invesco Aim Management Group, Inc.) and Van Kampen Exchange Corp.; Senior Vice President, Invesco Advisers, Inc. (formerly known as Invesco Institutional (N.A.), Inc.) (registered investment adviser); Senior Vice President and Secretary, Invesco Distributors, Inc. (formerly known as Invesco Aim Distributors, Inc.); Director, Vice President and Secretary, Invesco Investment Services, Inc. (formerly known as Invesco Aim Investment Services, Inc.) and IVZ Distributors, Inc. (formerly known as INVESCO Distributors, Inc.); Director and Vice President, INVESCO Funds Group, Inc.; Senior Vice President, Chief Legal Officer and Secretary, The Invesco Funds; Manager, Invesco PowerShares Capital Management LLC; Director, Secretary and General Counsel, Invesco Investment Advisers LLC (formerly known as Van Kampen Asset Management); Secretary and General Counsel, Van Kampen Funds Inc. and Chief Legal Officer, PowerShares Exchange-Traded Fund Trust, PowerShares Exchange-Traded Fund Trust II, PowerShares India Exchange-Traded Fund Trust and PowerShares Actively Managed Exchange-Traded Fund Trust
Formerly: Director and Secretary, Van Kampen Advisors Inc.; Director Vice President, Secretary and General Counsel Van Kampen Investor Services Inc.; Director, Invesco Distributors, Inc. (formerly known as Invesco Aim Distributors, Inc.); Director, Senior Vice President, General Counsel and Secretary, Invesco Advisers, Inc.; and Van Kampen Investments Inc.; Director, Vice President and Secretary, Fund Management Company; Director, Senior Vice President, Secretary, General Counsel and Vice President, Invesco Aim Capital Management, Inc.; Chief Operating Officer and General Counsel, Liberty Ridge Capital, Inc. (an investment adviser); Vice President and Secretary, PBHG Funds (an investment company) and PBHG Insurance Series Fund (an investment company); Chief Operating Officer, General Counsel and Secretary, Old Mutual Investment Partners (a broker-dealer); General Counsel and Secretary, Old Mutual Fund Services (an administrator) and Old Mutual Shareholder Services (a shareholder servicing center); Executive Vice President, General Counsel and Secretary, Old Mutual Capital, Inc. (an investment adviser); and Vice President and Secretary, Old Mutual Advisors Funds (an investment company) | | N/A | | N/A |
| | | | | | | | | |
| | | | | | | | | |
| | | | | | | | | |
Lisa O. Brinkley — 1959
Vice President | | 2004 | | Global Compliance Director, Invesco Ltd.; Chief Compliance Officer, Invesco Investment Services, Inc.(formerly known as Invesco Aim Investment Services, Inc.); and Vice President, The Invesco Funds
Formerly: Chief Compliance Officer, Invesco Distributors, Inc. (formerly known as Invesco Aim Distributors, Inc.) and Van Kampen Investor Services Inc.; Senior Vice President, Invesco Management Group, Inc.; Senior Vice President and Chief Compliance Officer, Invesco Advisers, Inc. and The Invesco Funds; Vice President and Chief Compliance Officer, Invesco Aim Capital Management, Inc. and Invesco Distributors, Inc.; Vice President, Invesco Investment Services, Inc. and Fund Management Company | | N/A | | N/A |
| | | | | | | | | |
Invesco V.I. High Yield Fund
Trustees and Officers—(continued)
The address of each trustee and officer is AIM Variable Insurance Funds (Invesco Variable Insurance Funds) (the “Trust”), 11 Greenway Plaza, Suite 2500, Houston, Texas 77046-1173. The trustees serve for the life of the Trust, subject to their earlier death, incapacitation, resignation, retirement or removal as more specifically provided in the Trust’s organizational documents. Each officer serves for a one year term or until their successors are elected and qualified. Column two below includes length of time served with predecessor entities, if any.
| | | | | | | | | |
| | | | | | | Number of Funds
| | |
Name, Year of Birth and
| | Trustee and/
| | Principal Occupation(s)
| | in Fund Complex
| | Other Directorship(s)
|
| Position(s) Held with the Trust | | or Officer Since | | During Past 5 Years | | Overseen by Trustee | | Held by Trustee |
| | | | | | | | | |
Other Officers—(continued) | | | | | | |
| | | | | | | | | |
| | | | | | | | | |
| | | | | | | | | |
Sheri Morris — 1964
Vice President, Treasurer and Principal Financial Officer | | 1999 | | Vice President, Treasurer and Principal Financial Officer, The Invesco Funds; Vice President, Invesco Advisers, Inc. (formerly known as Invesco Institutional (N.A.), Inc.) (registered investment adviser).
Formerly: Treasurer, PowerShares Exchange-Traded Fund Trust, PowerShares Exchange-Traded Fund Trust II, PowerShares India Exchange-Traded Fund Trust and PowerShares Actively Managed Exchange-Traded Fund Trust, Vice President, Invesco Advisers, Inc., Invesco Aim Capital Management, Inc. and Invesco Aim Private Asset Management, Inc.; Assistant Vice President and Assistant Treasurer, The Invesco Funds and Assistant Vice President, Invesco Advisers, Inc., Invesco Aim Capital Management, Inc. and Invesco Aim Private Asset Management, Inc. | | N/A | | N/A |
| | | | | | | | | |
| | | | | | | | | |
| | | | | | | | | |
Karen Dunn Kelley — 1960
Vice President | | 1993 | | Head of Invesco’s World Wide Fixed Income and Cash Management Group; Senior Vice President, Invesco Management Group, Inc. (formerly known as Invesco Aim Management Group, Inc.) and Invesco Advisers, Inc. (formerly known as Invesco Institutional (N.A.), Inc.) (registered investment adviser); Executive Vice President, Invesco Distributors, Inc. (formerly known as Invesco Aim Distributors, Inc.); Director, Invesco Mortgage Capital Inc.; Vice President, The Invesco Funds (other than AIM Treasurer’s Series Trust (Invesco Treasurer’s Series Trust) and Short-Term Investments Trust); and President and Principal Executive Officer, The Invesco Funds (AIM Treasurer’s Series Trust (Invesco Treasurer’s Series Trust) and Short-Term Investments Trust only).
Formerly: Senior Vice President, Van Kampen Investments Inc.; Vice President, Invesco Advisers, Inc. (formerly known as Invesco Institutional (N.A.), Inc.); Director of Cash Management and Senior Vice President, Invesco Advisers, Inc. and Invesco Aim Capital Management, Inc.; President and Principal Executive Officer, Tax-Free Investments Trust; Director and President, Fund Management Company; Chief Cash Management Officer, Director of Cash Management, Senior Vice President, and Managing Director, Invesco Aim Capital Management, Inc.; Director of Cash Management, Senior Vice President, and Vice President, Invesco Advisers, Inc. and The Invesco Funds (AIM Treasurer’s Series Trust (Invesco Treasurer’s Series Trust), Short-Term Investments Trust and Tax-Free Investments Trust only) | | N/A | | N/A |
| | | | | | | | | |
| | | | | | | | | |
| | | | | | | | | |
Yinka Akinsola — 1977
Anti-Money Laundering Compliance Officer | | 2011 | | Anti-Money Laundering Compliance Officer, Invesco Advisers, Inc. (formerly known as Invesco Institutional (N.A.), Inc.) (registered investment adviser); Invesco Distributors, Inc. (formerly known as Invesco Aim Distributors, Inc.), Invesco Investment Services, Inc. (formerly known as Invesco Aim Investment Services, Inc.), Invesco Management Group, Inc., The Invesco Funds, Invesco Van Kampen Closed-End Funds, Van Kampen Exchange Corp. and Van Kampen Funds Inc. | | N/A | | N/A |
| | | | | | | | | |
| | | | | | | | | |
| | | | | | | | | |
Todd L. Spillane — 1958
Chief Compliance Officer | | 2006 | | Senior Vice President, Invesco Management Group, Inc. (formerly known as Invesco Aim Management Group, Inc.) and Van Kampen Exchange Corp.; Senior Vice President and Chief Compliance Officer, Invesco Advisers, Inc. (registered investment adviser) (formerly known as Invesco Institutional (N.A.), Inc.); Chief Compliance Officer, The Invesco Funds, INVESCO Private Capital Investments, Inc. (holding company) and Invesco Private Capital, Inc. (registered investment adviser); Vice President, Invesco Distributors, Inc. (formerly known as Invesco Aim Distributors, Inc.) and Invesco Investment Services, Inc. (formerly known as Invesco Aim Investment Services, Inc.).
Formerly: Chief Compliance Officer, Invesco Van Kampen Closed-End Funds PowerShares Exchange-Traded Fund Trust, PowerShares Exchange-Traded Fund Trust II, PowerShares India Exchange-Traded Fund Trust, and PowerShares Actively Managed Exchange-Traded Fund Trust; Senior Vice President, Van Kampen Investments Inc.; Senior Vice President and Chief Compliance Officer, Invesco Advisers, Inc. and Invesco Aim Capital Management, Inc.; Chief Compliance Officer, Invesco Global Asset Management (N.A.), Inc., Invesco Senior Secured Management, Inc. (registered investment adviser) and Van Kampen Investor Services Inc.; Vice President, Invesco Aim Capital Management, Inc. and Fund Management Company | | N/A | | N/A |
| | | | | | | | | |
The Statement of Additional Information of the Trust includes additional information about the Fund’s Trustees and is available upon request, without charge, by calling 1.800.959.4246. Please refer to the Fund’s prospectus for information on the Fund’s sub-advisers.
| | | | | | | |
Office of the Fund
11 Greenway Plaza, Suite 2500
Houston, TX 77046-1173 | | Investment Adviser
Invesco Advisers, Inc.
1555 Peachtree Street, N.E.
Atlanta, GA 30309 | | Distributor
Invesco Distributors, Inc.
11 Greenway Plaza, Suite 2500
Houston, TX 77046-1173 | | Auditors
PricewaterhouseCoopers LLP
1201 Louisiana Street, Suite 2900
Houston, TX 77002-5678 |
| | | | | | | |
| | | | | | | |
Counsel to the Fund
Stradley Ronon Stevens & Young, LLP
2600 One Commerce Square
Philadelphia, PA 19103 | | Counsel to the Independent Trustees
Kramer, Levin, Naftalis & Frankel LLP
1177 Avenue of the Americas
New York, NY 10036-2714 | | Transfer Agent
Invesco Investment Services, Inc.
11 Greenway Plaza, Suite 2500
Houston, TX77046-1173 | | Custodian
State Street Bank and Trust Company
225 Franklin
Boston, MA 02110-2801 |
Invesco V.I. High Yield Fund
Invesco V.I. High Yield Securities FundAnnual Report to Shareholders § December 31, 2011
The Fund provides a complete list of its holdings four times in each fiscal year, at the quarter-ends. For the second and fourth quarters, the lists appear in the Fund’s semiannual and annual reports to shareholders. For the first and third quarters, the Fund files the lists with the Securities and Exchange Commission (SEC) on Form N-Q. The Fund’s Form N-Q filings are available on the SEC website, sec.gov. Copies of the Fund’s Forms N-Q may be reviewed and copied at the SEC Public Reference Room in Washington, D.C. You can obtain information on the operation of the Public Reference Room, including information about duplicating fee charges, by calling 202 551 8090 or 800 732 0330, or by electronic request at the following email address: publicinfo@sec.gov. The SEC file numbers for the Fund are 811-07452 and 033-57340. The Fund’s most recent portfolio holdings, as filed on Form N-Q, have also been made available to insurance companies issuing variable annuity contracts and variable life insurance policies (“variable products”) that invest in the Fund.
A description of the policies and procedures that the Fund uses to determine how to vote proxies relating to portfolio securities is available without charge, upon request, from our Client Services department at 800 959 4246 or at invesco.com/proxyguidelines. The information is also available on the SEC website, sec.gov.
Information regarding how the Fund voted proxies related to its portfolio securities during the 12 months ended June 30, 2011, is available at invesco.com/proxysearch. The information is also available on the SEC website, sec.gov.
Invesco Advisers, Inc. is an investment adviser; it provides investment advisory services to individual and institutional clients and does not sell securities. Invesco Distributors, Inc. is the U.S. distributor for Invesco Ltd.’s retail mutual funds, exchange-traded funds and institutional money market funds. Both are wholly owned, indirect subsidiaries of Invesco Ltd.
This report must be accompanied or preceded by a currently effective Fund prospectus and variable product prospectus, which contain more complete information, including sales charges and expenses. Investors should read each carefully before investing.
Invesco Distributors, Inc.
MS-VIHYI-AR-1
| | | | | |
|
| | | | | |
NOT FDIC INSURED | | MAY LOSE VALUE | | NO BANK GUARANTEE |
Management’s Discussion of Fund Performance
Performance summary
For the year ended December 31, 2011, Invesco V.I. High Yield Securities Fund underperformed the Fund’s broad market/style-specific index, the Barclays Capital U.S. Corporate High Yield 2% Issuer Cap Index. This was due mainly to the Fund’s issuer selection and its underweight exposure to higher quality credits during the 12-month reporting period.
Your Fund’s long-term performance appears later in this report.
Fund vs. Indexes
Total returns, 12/31/10 to 12/31/11, excluding variable product issuer charges.
If variable product issuer charges were included, returns would be lower.
| | | | | |
|
| Series I Shares | | | 1.99 | % |
| |
| Series II Shares | | | 1.65 | |
| |
Barclays Capital U.S. Corporate High Yield 2% Issuer Cap Index▼
(Broad Market/Style-Specific Index) | | | 4.96 | |
| |
How we invest
We invest primarily in debt securities that are determined to be below investment grade quality. These bonds, commonly known as “junk bonds,” are typically corporate bonds of U.S.-based companies, many of which are moderately sized firms. We principally invest in junk bonds, although we tend to underweight the lowest-quality bonds in the asset class. We may invest in convertible bonds, preferred stock, derivatives and bank loans, but do not expect these instruments to be a substantial part of our portfolio. We may invest up to 30% of total assets in foreign securities.
The primary driver of our security selection is fundamental bottom-up credit analysis conducted by a team of analysts who specialize by industry. This approach is augmented with an ongoing review of the relative value of securities and a top-down process that includes sector, economic and quantitative
analysis. Changes in a security’s risk/ return profile or relative value and top-down factors generally determine buy and sell decisions.
Portfolio construction begins with a well-defined Fund design that emphasizes diversification and establishes the target investment vehicles for generating the desired “alpha” (the return expected from an investment) as well as the risk parameters appropriate for the current positioning in the credit cycle. Investments are evaluated for liquidity and risk versus relative value. Working closely with other investment specialists and traders, we determine the timing and amount of each alpha decision to use in the portfolio at any time, taking into account security selection skill and market opportunities.
Sell decisions are based on:
| n | | Low equity value to debt, high subordination and negative free cash flow coupled with negative news, declining expectations, or an increasing risk profile. |
| n | | Very low yields. |
| |
| n | | Presentation of a better relative value opportunity. |
Market conditions and your Fund
The high yield market depends heavily on the underlying health of the economy, principally in the U.S. and, secondarily, in Europe. Growth remained slow as deleveraging and caution constrained economic activity and job creation. The situation in Europe was generally worse than in the U.S., owing to the sovereign debt crisis, slower economic growth and the threat of renewed recession.
Financial stimulus remained robust and appeared likely to stay accommodative. While the U.S. Federal Reserve’s (the Fed) second round of quantitative easing ended, the Fed committed to keeping short-term interest rates anchored near zero through mid-2013. (In January 2012, after the close of the reporting period, the Fed extended its commitment to keep short-term interest rates near zero through late 2014.) In Europe, the tightening cycle appeared to have ended, as interest rates were cut. In this way, fixed income asset classes were broadly supported by the underlying interest rate structure.
The high yield market moved from becoming increasingly aggressive early in the reporting period to increasingly defensive as the reporting period ended. The change was due to slower growth expectations, including a U.S. growth scare over the summer and fears of a deepening financial crisis centered in the eurozone. Volatility and correlations were high as the high yield market experienced what is generally called the “risk on/risk off” market.
Portfolio Composition
By credit quality
| | | | | |
|
| A | | | 0.8 | % |
| |
| BBB | | | 5.4 | |
| |
| BB | | | 33.5 | |
| |
| B | | | 45.6 | |
| |
| CCC | | | 8.8 | |
| |
| CC | | | 0.3 | |
| |
| C | | | 0.1 | |
| |
| Non-Rated | | | 5.1 | |
| |
| Cash | | | 0.4 | |
| | | | | | | |
| |
| Top 10 Fixed Income Issuers* |
| |
| 1. | | Building Materials Corp. of America | | | 1.5 | % |
| |
| 2. | | International Lease Finance Corp. | | | 1.5 | |
| |
| 3. | | Ford Motor Co. | | | 1.3 | |
| |
| 4. | | MGM Resorts International | | | 1.2 | |
| |
| 5. | | Tenet Healthcare Corp. | | | 1.1 | |
| |
| 6. | | Continental Airlines Pass Through Trust | | | 1.1 | |
| |
| 7. | | Intelsat Jackson Holdings S.A. | | | 1.1 | |
| |
| 8. | | Nortek Inc. | | | 1.1 | |
| |
| 9. | | Cricket Communications, Inc. | | | 1.0 | |
| |
| 10. | | CIT Group Inc. | | | 1.0 | |
Top Five Industries*
| | | | | | | |
|
| 1. | | Casinos & Gaming | | | 6.7 | % |
| |
| 2. | | Building Products | | | 5.8 | |
| |
| 3. | | Wireless Telecommunication Services | | | 5.4 | |
| |
| 4. | | Oil & Gas Exploration & Production | | | 5.2 | |
| |
| 5. | | Airlines | | | 3.3 | |
| | | | | |
|
| Total Net Assets | | $ | 25.7 million | |
| |
| Total Number of Holdings* | | | 304 | |
The Fund’s holdings are subject to change, and there is no assurance that the Fund will continue to hold any particular security.
| | |
| *Excluding money market fund holdings. |
Source: Standard & Poor’s. A credit rating is an assessment provided by a nationally recognized statistical rating organization (NRSRO) of the creditworthiness of an issuer with respect to debt obligations, including specific securities, money
market instruments or other debts. Ratings are measured on a scale that generally ranges from AAA (highest) to D (lowest); ratings are subject to change without notice. “Non-Rated” indicates the debtor was not rated, and should not be interpreted
as indicating low quality. For more information on Standard & Poor’s rating methodology, please visit standardandpoors.com and select “Understanding Ratings” under “Ratings Resources” on the homepage.
Invesco V.I. High Yield Securities Fund
Defaults in the high yield bond market remained muted during 2011. The annualized par-weighted default rate for the fiscal year was only 2.03% according to Standard & Poor’s. Very low defaults are to be expected after periods of high defaults and recession. We expect a gradual increase in defaults as we exit the immediate post-downturn period, although without renewed recession, we expect defaults will likely remain below average.
The broad U.S. high yield bond market, as measured by the Barclays Capital U.S. Corporate High Yield 2% Issuer Cap Index, generated a positive total return for the year ended December 31, 2011. In August and September 2011, debt concerns in Europe and the downgrade of U.S. debt by Standard & Poor’s caused investors to scale back their risk profile. The risk-on trade returned at the end of the reporting period, as we had potentially good news from Europe and as U.S. economic data improved.
In this environment, the Fund generated positive returns for the 12-month reporting period but underperformed its style-specific index.
The main detractors from Fund performance for the year were issuer selection and overweight exposure to building materials bonds. The Fund’s issuer selection in the automotive industry also detracted from performance during the year; our holding in one of the big U.S. manufacturers sold off. Issuer selection in the food and beverage industry hurt, as some of our off-index issuers experienced overselling in their bonds. In the financials sector, the non-captive diversified industry was one of the main detractors from Fund performance.
Investments that contributed to the Fund’s performance varied. The Fund’s primary contributors to performance were an overweight position and issuer selection in the independent industry, and issuer selection and an underweight position in the media non-cable industry. The Fund’s issuer selection in the technology industry was beneficial throughout the reporting period. Avoidance of the non-captive consumer industry was beneficial, as that was one of the worst performers during the reporting period. Finally, issuer selection in the aerospace/ defense industry also proved beneficial to Fund performance.
At the close of the reporting period, we remained generally positive in our assessment of high yield securities. However, while the economy appeared to be strengthening in the U.S., substantial obstacles remained, including resolution of U.S. deficits (the pending fiscal adjustment) and the European sovereign debt situation and its potential bank solvency and credit implications.
Thank you for investing in Invesco V.I. High Yield Securities Fund and for sharing our long-term investment horizon.
The views and opinions expressed in management’s discussion of Fund performance are those of Invesco Advisers, Inc. These views and opinions are subject to change at any time based on factors such as market and economic conditions. These views and opinions may not be relied upon as investment advice or recommendations, or as an offer for a particular security. The information is not a complete analysis of every aspect of any market, country, industry, security or the Fund. Statements of fact are from sources considered reliable, but Invesco Advisers, Inc. makes no representation or warranty as to their completeness or accuracy. Although historical performance is no guarantee of future results, these insights may help you understand our investment management philosophy.
See important Fund and, if applicable, index disclosures later in this report.
Peter Ehret
Chartered Financial Analyst, portfolio manager, is lead manager of Invesco V.I. High Yield Securities Fund. He joined Invesco in 2001. Mr. Ehret graduated cum laude with a B.S. in economics from the University of Minnesota. He also earned an M.S. in real estate appraisal and investment analysis from the University of Wisconsin-Madison.
Darren Hughes
Chartered Financial Analyst, portfolio manager, is manager of Invesco V.I. High Yield Securities Fund. He joined Invesco in 1992. Mr. Hughes earned a B.B.A. in finance and economics from Baylor University.
Scott Roberts
Chartered Financial Analyst, portfolio manager, is manager of Invesco V.I. High Yield Securities Fund. He joined Invesco in 2000. Mr. Roberts earned a B.B.A. in finance from the University of Houston.
Invesco V.I. High Yield Securities Fund
Your Fund’s Long-Term Performance
Results of a $10,000 Investment – Oldest Share Class(es)
Fund and index data from 12/31/01*
| | |
| |
| 1 | | Source: Lipper Inc. |
| |
| * | | During the reporting period, Invesco changed its policy regarding growth of $10,000 charts. For funds older than 10 years, we previously showed performance since inception. Going forward, we will show performance for the most recent 10 years, since this more accurately reflects the experience of the typical shareholder. As a result, charts now may include benchmarks that did not appear previously, because the funds’ inception pre-dated the benchmarks’ inception. Also, all charts will now be presented using a linear format. |
Past performance cannot guarantee comparable future results.
Average Annual Total Returns
As of 12/31/11
| | | | | | | |
|
| Series I Shares | | | | |
| Inception (3/9/84) | | | 4.07 | % |
| |
| 10 | | Years | | | 6.59 | |
| |
| 5 | | Years | | | 5.41 | |
| |
| 1 | | Year | | | 1.99 | |
| |
| | | | | | | |
| Series II Shares | | | | |
| Inception (6/5/00) | | | -1.34 | % |
| |
| 10 | | Years | | | 6.34 | |
| |
| 5 | | Years | | | 5.17 | |
| |
| 1 | | Year | | | 1.65 | |
| |
Effective June 1, 2010, Class X and Class Y shares of the predecessor fund, Morgan Stanley Variable Investment High Yield Portfolio, advised by Morgan Stanley Investment Advisors Inc. were reorganized into Series I and Series II shares, respectively, of Invesco V.I. High Yield Securities Fund. Returns shown above for Series I and Series II shares are blended returns of the predecessor fund and Invesco V.I. High Yield Securities Fund. Share class
returns will differ from the predecessor fund because of different expenses.
The performance data quoted represent past performance and cannot guarantee comparable future results; current performance may be lower or higher. Please contact your variable product issuer or financial adviser for the most recent month-end variable product performance. Performance figures reflect Fund expenses, reinvested distributions and changes in net asset value. Investment return and principal value will fluctuate so that you may have a gain or loss when you sell shares.
The total annual Fund operating expense ratio set forth in the most recent Fund prospectus as of the date of this report for Series and Series II shares was 1.69% and 1.94%, respectively. The expense ratios presented above may vary from the expense ratios presented in other sections of this report that are based on expenses incurred during the period covered by this report.
Invesco V.I. High Yield Securities Fund, a series portfolio of AIM Variable Insurance Funds (Invesco Variable Insurance Funds), is currently offered through insurance companies issuing variable products. You cannot purchase shares of the Fund directly. Performance figures given represent the Fund and are not intended to reflect actual variable product values. They do not reflect sales charges, expenses and fees assessed in connection with a variable product. Sales charges, expenses and fees, which are determined by the variable product issuers, will vary and will lower the total return.
The most recent month-end performance data at the Fund level, excluding variable product charges, is available at 800 451 4246. As mentioned above, for the most recent month-end performance including variable product charges, please contact your variable product issuer or financial adviser.
Invesco V.I. High Yield Securities Fund
Invesco V.I. High Yield Securities Fund’s investment objective is to provide a high level of current income by investing in a diversified portfolio consisting principally of fixed-income securities, which may include both non-convertible and convertible debt securities and preferred stocks. As a secondary objective the Fund will seek capital appreciation, but only when consistent with its primary objective.
| n | | Unless otherwise stated, information presented in this report is as of December 31, 2011, and is based on total net assets. |
| |
| n | | Unless otherwise noted, all data provided by Invesco. |
| |
| n | | To access your Fund’s reports/prospectus, visit invesco.com/fundreports. |
Principal risks of investing in the Fund
Convertible securities risk. The Fund may own convertible securities, the value of which may be affected by market interest rates, the risk that the issuer will default, the value of the underlying stock or the right of the issuer to buy back the convertible securities.
Defaulted securities risk. Defaulted securities involve the substantial risk that principal will not be repaid. Defaulted securities and any securities received in an exchange for such securities may be subject to restrictions on resale.
Derivatives risk. Derivatives may be more difficult to purchase, sell or value than other investments and may be subject to market, interest rate, credit, leverage, counterparty and management risks. A fund investing in a derivative could lose more than the cash amount invested or incur higher taxes. Over-the-counter derivatives are also subject to counterparty risk, which is the risk that the other party to the contract will not fulfill its contractual obligation to complete the transaction with the Fund.
Developing markets securities risk. Securities issued by foreign companies and governments located in developing countries may be affected more negatively by inflation, devaluation of their currencies, higher transaction costs, delays in settlement, adverse political developments, the introduction of capital controls, withholding taxes, nationalization of private assets, expropriation, social unrest, war or lack of timely information than those in developed countries.
Fixed-income securities risk. Principal risks of investing in the Fund are associated with its fixed-income securities investments that are rated below investment grade. All fixed-income securities, such as junk bonds, are subject to two types of risk: credit risk and interest rate risk. Credit risk refers to the possibility that the issuer of a security will be unable to make interest payments and/or repay the principal on its debt. Interest rate risk refers to fluctuations in the value of a fixed-income security resulting from changes in the general level of interest rates. When the general level of interest
rates goes up, the prices of most fixed-income securities go down. When the general level of interest rates goes down, the prices of most fixed-income securities go up. (Zero coupon securities are typically subject to greater price fluctuations than comparable securities that pay interest.)
Lower rated securities (junk bonds) risk. Junk bonds are subject to greater risk of loss of income and principal than higher rated securities and may have a higher incidence of default than higher rated securities. The prices of junk bonds are likely to be more sensitive to adverse economic changes or individual corporate developments than higher rated securities. Rule 144A securities could have the effect of increasing the level of Fund illiquidity to the extent the Fund may be unable to find qualified institutional buyers interested in purchasing the securities.
Foreign risks. The risks of investing in securities of foreign issuers, including emerging market issuers, can include fluctuations in foreign currencies, foreign currency exchange controls, political and economic instability, differences in securities regulation and trading, and foreign taxation issues.
Public bank loans risk. Certain public bank loans are illiquid, meaning the Fund may not be able to sell them quickly at a fair price. Illiquid securities are also difficult to value. Bank loans are subject to the risk of default in the payment of interest or principal on a loan, which will result in a reduction of income to the Fund, and a potential decrease in the Fund’s net asset value. Public bank loans present a greater degree of investment risk due to the fact that the cash flow or other property of the borrower securing the bank loan may be insufficient to meet scheduled payments.
Swaps risk. A swap contract is an agreement between two parties pursuant to which the parties exchange payments at specified dates on the basis of a specified notional amount, with the payments calculated by reference to specified securities, indexes, reference rates, currencies or other instruments. Swaps are subject to credit risk and counterparty risk.
About indexes used in this report
The Barclays Capital U.S. Corporate High Yield 2% Issuer Cap Index is an unmanaged index that covers U.S. corporate, fixed-rate, non-investment grade debt with at least one year to maturity and at least $150 million in par outstanding. Index weights for each issuer are capped at 2%.
The Fund is not managed to track the performance of any particular index, including the index(es) defined here, and consequently, the performance of the Fund may deviate significantly from the performance of the index(es).
A direct investment cannot be made in an index. Unless otherwise indicated, index results include reinvested dividends, and they do not reflect sales charges. Performance of the peer group, if applicable, reflects fund expenses; performance of a market index does not.
Other information
The Chartered Financial Analyst® (CFA®) designation is globally recognized and attests to a charterholder’s success in a rigorous and comprehensive study program in the field of investment management and research analysis.
Industry classifications used in this report are generally according to the Global Industry Classification Standard, which was developed by and is the exclusive property and a service mark of MSCI Inc. and Standard & Poor’s.
The returns shown in management’s discussion of Fund performance are based on net asset values calculated for shareholder transactions. Generally accepted accounting principles require adjustments to be made to the net assets of the Fund at period end for financial reporting purposes, and as such, the net asset values for shareholder transactions and the returns based on those net asset values may differ from the net asset values and returns reported in the Financial Highlights. Additionally, the returns and net asset values shown throughout this report are at the Fund level only and do not include variable product issuer charges. If such charges were included, the total returns would be lower.
Invesco V.I. High Yield Securities Fund
Schedule of Investments(a)
December 31, 2011
| | | | | | | | | |
| | | Principal
| | |
| | | Amount | | Value |
| |
U.S. Dollar Denominated Bonds and Notes–87.16%
|
Aerospace & Defense–0.93%
| | | | |
| BE Aerospace, Inc., Sr. Unsec. Notes, 6.88%, 10/01/20 | | $ | 50,000 | | | $ | 54,875 | |
| |
Bombardier Inc. (Canada), Sr. Unsec. Notes, 7.75%, 03/15/20(b) | | | 20,000 | | | | 21,900 | |
| |
| Huntington Ingalls Industries Inc., Sr. Unsec. Gtd. Notes, | | | | | | | | |
6.88%, 03/15/18(b) | | | 20,000 | | | | 19,750 | |
| |
7.13%, 03/15/21(b) | | | 65,000 | | | | 64,187 | |
| |
| Spirit Aerosystems Inc., Sr. Unsec. Gtd. Global Notes, 6.75%, 12/15/20 | | | 55,000 | | | | 57,613 | |
| |
| Triumph Group, Inc., Sr. Unsec. Gtd. Sub. Global Notes, 8.00%, 11/15/17 | | | 20,000 | | | | 21,500 | |
| |
| | | | | | | | 239,825 | |
| |
Airlines–3.29%
| | | | |
American Airlines Inc., Sr. Sec. Gtd. Notes, 7.50%, 03/15/16(b)(c) | | | 155,000 | | | | 111,600 | |
| |
American Airlines Inc., Series 2011-1, Class B, Sec. Gtd. Pass Through Ctfs., 7.00%, 01/31/18(b) | | | 29,802 | | | | 26,524 | |
| |
Continental Airlines Inc.,
Series 2007-1, Class C, Sec. Sub. Global Pass Through Ctfs., 7.34%, 04/19/14 | | | 172,318 | | | | 170,594 | |
| |
Series 2009-2, Class B, Sec. Global Pass Through Ctfs., 9.25%, 05/10/17 | | | 113,160 | | | | 116,803 | |
| |
Delta Air Lines, Inc.,
Sec. Notes, 12.25%, 03/15/15(b) | | | 150,000 | | | | 159,000 | |
| |
Series 2010-1, Class B, Sec. Pass Through Ctfs., 6.38%, 01/02/16(b) | | | 30,000 | | | | 27,900 | |
| |
Series 2010-2, Class B, Sec. Pass Through Ctfs., 6.75%, 11/23/15(b) | | | 40,000 | | | | 37,200 | |
| |
UAL Pass Through Trust,
Series 2007-1, Class A, Sec. Gtd. Global Pass Through Ctfs., 6.64%, 07/02/22 | | | 36,033 | | | | 35,920 | |
| |
Series 2009-2, Class B, Sec. Gtd. Pass Through Ctfs., 12.00%, 01/15/16(b) | | | 81,118 | | | | 84,768 | |
| |
US Airways Pass Through Trust, Series 1998-1, Class C, Sec. Pass Through Ctfs., 6.82%, 01/30/14 | | | 83,075 | | | | 74,352 | |
| |
| | | | | | | | 844,661 | |
| |
Alternative Carriers–2.39%
| | | | |
Cogent Communications Group, Inc., Sr. Sec. Gtd. Notes, 8.38%, 02/15/18(b) | | | 85,000 | | | | 87,762 | |
| |
| Intelsat Jackson Holdings S.A. (Luxembourg), Sr. Unsec. Gtd. Global Notes, 7.25%, 10/15/20 | | | 270,000 | | | | 276,075 | |
| |
| Level 3 Communications Inc., Sr. Unsec. Global Notes, 11.88%, 02/01/19 | | | 90,000 | | | | 96,075 | |
| |
| Level 3 Financing Inc., | | | | | | | | |
| Sr. Unsec. Gtd. Global Notes, | | | | | | | | |
| 9.25%, 11/01/14 | | | 71,000 | | | | 72,598 | |
| |
| 9.38%, 04/01/19 | | | 45,000 | | | | 47,025 | |
| |
Sr. Unsec. Gtd. Notes, 8.13%, 07/01/19(b) | | | 35,000 | | | | 34,650 | |
| |
| | | | | | | | 614,185 | |
| |
Aluminum–0.50%
| | | | |
| Century Aluminum Co., Sr. Sec. Gtd. Notes, 8.00%, 05/15/14 | | | 130,000 | | | | 129,431 | |
| |
Apparel Retail–1.18%
| | | | |
| Express LLC/Express Finance Corp., Sr. Unsec. Gtd. Global Notes, 8.75%, 03/01/18 | | | 90,000 | | | | 98,325 | |
| |
| Gap, Inc. (The), Sr. Unsec. Notes, 5.95%, 04/12/21 | | | 95,000 | | | | 90,844 | |
| |
| J. Crew Group, Inc., Sr. Unsec. Gtd. Global Notes, 8.13%, 03/01/19 | | | 75,000 | | | | 71,812 | |
| |
| Limited Brands Inc., Sr. Unsec. Gtd. Notes, 6.63%, 04/01/21 | | | 40,000 | | | | 42,600 | |
| |
| | | | | | | | 303,581 | |
| |
Apparel, Accessories & Luxury Goods–2.45%
| | | | |
| Hanesbrands Inc., Sr. Unsec. Gtd. Global Notes, 6.38%, 12/15/20 | | | 80,000 | | | | 81,800 | |
| |
| Jones Group Inc. (The), Sr. Unsec. Notes, 6.88%, 03/15/19 | | | 210,000 | | | | 190,050 | |
| |
| Levi Strauss & Co., Sr. Unsec. Global Notes, 7.63%, 05/15/20 | | | 165,000 | | | | 169,537 | |
| |
| Quiksilver Inc., Sr. Unsec. Gtd. Global Notes, 6.88%, 04/15/15 | | | 200,000 | | | | 186,000 | |
| |
| | | | | | | | 627,387 | |
| |
Auto Parts & Equipment–0.99%
| | | | |
Allison Transmission Inc., Sr. Unsec. Gtd Notes, 7.13%, 05/15/19(b) | | | 100,000 | | | | 98,500 | |
| |
| Dana Holding Corp., Sr. Unsec. Notes, 6.75%, 02/15/21 | | | 85,000 | | | | 87,337 | |
| |
| Tenneco Inc., Sr. Unsec. Gtd. Global Notes, | | | | | | | | |
| 6.88%, 12/15/20 | | | 25,000 | | | | 25,875 | |
| |
| | | | | | | | | |
| 7.75%, 08/15/18 | | | 40,000 | | | | 42,500 | |
| |
| | | | | | | | 254,212 | |
| |
Automobile Manufacturers–2.04%
| | | | |
Chrysler Group LLC/CG Co-Issuer Inc., Sr. Sec. Gtd. Notes, 8.00%, 06/15/19(b) | | | 200,000 | | | | 183,500 | |
| |
| Ford Motor Co., Sr. Unsec. Global Notes, 7.45%, 07/16/31 | | | 282,000 | | | | 338,400 | |
| |
See accompanying Notes to Financial Statements which are an integral part of the financial statements.
Invesco V.I. High Yield Securities Fund
| | | | | | | | | |
| | | Principal
| | |
| | | Amount | | Value |
| |
Automobile Manufacturers–(continued)
| | | | |
| | | | | | | | | |
Motors Liquidation Corp., Sr. Unsec. Notes, 8.38%, 07/15/33(c)(d) | | $ | 305,000 | | | $ | 2,532 | |
| |
| | | | | | | | 524,432 | |
| |
Biotechnology–0.34%
| | | | |
| Grifols Inc., Sr. Unsec. Gtd. Global Notes, 8.25%, 02/01/18 | | | 30,000 | | | | 31,650 | |
| |
| Savient Pharmaceuticals Inc., Sr. Unsec. Conv. Notes, 4.75%, 02/01/18 | | | 30,000 | | | | 14,400 | |
| |
STHI Holding Corp., Sec. Gtd. Notes, 8.00%, 03/15/18(b) | | | 40,000 | | | | 41,300 | |
| |
| | | | | | | | 87,350 | |
| |
Broadcasting–0.60%
| | | | |
| Allbritton Communications Co., Sr. Unsec. Global Notes, 8.00%, 05/15/18 | | | 45,000 | | | | 45,000 | |
| |
| Clear Channel Communications, Inc., Sr. Sec. Gtd. Global Notes, 9.00%, 03/01/21 | | | 130,000 | | | | 109,850 | |
| |
| | | | | | | | 154,850 | |
| |
Building Products–5.31%
| | | | |
American Standard Americas, Sr. Sec. Notes, 10.75%, 01/15/16(b) | | | 80,000 | | | | 47,600 | |
| |
| Associated Materials LLC, Sr. Sec. Gtd. Global Notes, 9.13%, 11/01/17 | | | 165,000 | | | | 146,438 | |
| |
Building Materials Corp. of America,
Sr. Sec. Gtd. Notes, 7.50%, 03/15/20(b) | | | 160,000 | | | | 172,800 | |
| |
| Sr. Unsec. Notes, | | | | | | | | |
6.75%, 05/01/21(b) | | | 40,000 | | | | 42,200 | |
| |
6.88%, 08/15/18(b) | | | 150,000 | | | | 157,500 | |
| |
| Gibraltar Industries Inc., Series B, Sr. Unsec. Gtd. Sub. Global Notes, 8.00%, 12/01/15 | | | 105,000 | | | | 105,525 | |
| |
Nortek Inc., Sr. Unsec. Gtd. Notes,
8.50%, 04/15/21(b) | | | 250,000 | | | | 212,812 | |
| |
10.00%, 12/01/18(b) | | | 75,000 | | | | 71,438 | |
| |
Ply Gem Industries Inc.,
Sr. Sec. Gtd. Global Notes, 8.25%, 02/15/18 | | | 125,000 | | | | 109,531 | |
| |
Sr. Unsec. Gtd. Sub. Global Notes, 13.13%, 07/15/14 | | | 55,000 | | | | 48,950 | |
| |
Roofing Supply Group LLC/Roofing Supply Finance Inc., Sr. Sec. Notes, 8.63%, 12/01/17(b) | | | 158,000 | | | | 161,555 | |
| |
USG Corp.,
Sr. Unsec. Gtd. Notes, | | | | | | | | |
8.38%, 10/15/18(b) | | | 10,000 | | | | 9,250 | |
| |
9.75%, 08/01/14(b) | | | 20,000 | | | | 20,400 | |
| |
Sr. Unsec. Notes, 9.75%, 01/15/18 | | | 65,000 | | | | 55,900 | |
| |
| | | | | | | | 1,361,899 | |
| |
Cable & Satellite–0.88%
| | | | |
EH Holding Corp.,
Sr. Sec. Gtd. Notes, 6.50%, 06/15/19(b) | | | 40,000 | | | | 41,900 | |
| |
Sr. Unsec. Gtd. Notes, 7.63%, 06/15/21(b) | | | 25,000 | | | | 26,344 | |
| |
Kabel BW GmbH (Germany), Sr. Sec. Gtd. Notes, 7.50%, 03/15/19(b) | | | 150,000 | | | | 158,250 | |
| |
| | | | | | | | 226,494 | |
| |
Casinos & Gaming–5.71%
| | | | |
| Ameristar Casinos Inc., Sr. Unsec. Gtd. Global Notes, 7.50%, 04/15/21 | | | 115,000 | | | | 119,025 | |
| |
Caesars Entertainment Operating Co. Inc.,
Sec. Gtd. Global Notes, 12.75%, 04/15/18 | | | 85,000 | | | | 68,000 | |
| |
Sr. Sec. Gtd. Global Notes, 11.25%, 06/01/17 | | | 100,000 | | | | 106,750 | |
| |
Sr. Unsec. Gtd. Global Bonds, 5.63%, 06/01/15 | | | 115,000 | | | | 64,400 | |
| |
CityCenter Holdings LLC/CityCenter Finance Corp.,
Sr. Sec. Gtd. Notes, 7.63%, 01/15/16(b) | | | 5,000 | | | | 5,138 | |
| |
Sr. Sec. Gtd. PIK Notes, 10.75%, 01/15/17(b) | | | 81,389 | | | | 84,238 | |
| |
| Mandalay Resort Group, Sr. Unsec. Gtd. Sub. Notes, 7.63%, 07/15/13 | | | 100,000 | | | | 99,750 | |
| |
| MGM Resorts International, Sr. Unsec. Gtd. Global Notes, | | | | | | | | |
| 6.63%, 07/15/15 | | | 65,000 | | | | 62,319 | |
| |
| 6.75%, 04/01/13 | | | 245,000 | | | | 248,062 | |
| |
| Pinnacle Entertainment Inc., Sr. Unsec. Gtd. Global Notes, 8.63%, 08/01/17 | | | 45,000 | | | | 47,812 | |
| |
Resort at Summerlin L.P., Series B, Sr. Unsec. Sub. Notes, 13.00%, 12/15/07(c) | | | 7,210,050 | | | | — | |
| |
| Scientific Games International Inc., Sr. Unsec. Gtd. Sub. Global Notes, 9.25%, 06/15/19 | | | 80,000 | | | | 85,000 | |
| |
Seneca Gaming Corp., Sr. Unsec. Gtd. Notes, 8.25%, 12/01/18(b) | | | 65,000 | | | | 63,537 | |
| |
Snoqualmie Entertainment Authority,
Sr. Sec. Floating Rate Notes, 4.18%, 02/01/14(b)(e) | | | 75,000 | | | | 67,125 | |
| |
Sr. Sec. Notes, 9.13%, 02/01/15(b) | | | 150,000 | | | | 144,000 | |
| |
| Wynn Las Vegas LLC/Wynn Las Vegas Capital Corp., Sec. Gtd. First Mortgage Global Notes, 7.75%, 08/15/20 | | | 180,000 | | | | 200,250 | |
| |
| | | | | | | | 1,465,406 | |
| |
Coal & Consumable Fuels–0.39%
| | | | |
| CONSOL Energy Inc., Sr. Unsec. Gtd. Global Notes, 8.25%, 04/01/20 | | | 35,000 | | | | 38,850 | |
| |
Peabody Energy Corp., Sr. Unsec. Gtd. Notes, 6.00%, 11/15/18(b) | | | 60,000 | | | | 61,500 | |
| |
| | | | | | | | 100,350 | |
| |
Communications Equipment–0.61%
| | | | |
Avaya Inc., Sr. Sec. Gtd. Notes, 7.00%, 04/01/19(b) | | | 160,000 | | | | 156,000 | |
| |
| | | | | | | | | |
| | | | | | | | | |
See accompanying Notes to Financial Statements which are an integral part of the financial statements.
Invesco V.I. High Yield Securities Fund
| | | | | | | | | |
| | | Principal
| | |
| | | Amount | | Value |
| |
Computer & Electronics Retail–0.31%
| | | | |
Rent-A-Center Inc., Sr. Unsec. Gtd Global Notes, 6.63%, 11/15/20 | | $ | 80,000 | | | $ | 80,800 | |
| |
Computer Storage & Peripherals–0.43%
| | | | |
| Seagate HDD Cayman, Sr. Unsec. Gtd. Notes, | | | | | | | | |
7.00%, 11/01/21(b) | | | 30,000 | | | | 30,900 | |
| |
7.75%, 12/15/18(b) | | | 75,000 | | | | 80,250 | |
| |
| | | | | | | | 111,150 | |
| |
Construction & Engineering–1.38%
| | | | |
| Dycom Investments Inc., Sr. Unsec. Gtd. Sub. Global Notes, 7.13%, 01/15/21 | | | 115,000 | | | | 116,725 | |
| |
| Tutor Perini Corp., Sr. Unsec. Gtd. Global Notes, 7.63%, 11/01/18 | | | 250,000 | | | | 236,250 | |
| |
| | | | | | | | 352,975 | |
| |
Construction & Farm Machinery & Heavy Trucks–1.59%
| | | | |
| Case New Holland Inc., Sr. Unsec. Gtd. Global Notes, 7.88%, 12/01/17 | | | 75,000 | | | | 85,125 | |
| |
Commercial Vehicle Group, Inc., Sr. Sec. Gtd. Notes, 7.88%, 04/15/19(b) | | | 95,000 | | | | 92,031 | |
| |
| Manitowoc Co. Inc. (The), Sr. Unsec. Gtd. Notes, 8.50%, 11/01/20 | | | 50,000 | | | | 52,500 | |
| |
| Navistar International Corp., Sr. Unsec. Gtd. Notes, 8.25%, 11/01/21 | | | 85,000 | | | | 90,525 | |
| |
| Titan International Inc., Sr. Sec. Gtd. Global Notes, 7.88%, 10/01/17 | | | 85,000 | | | | 88,825 | |
| |
| | | | | | | | 409,006 | |
| |
Construction Materials–1.22%
| | | | |
Cemex Finance LLC, Sr. Sec. Gtd. Bonds, 9.50%, 12/14/16(b) | | | 100,000 | | | | 87,787 | |
| |
| Texas Industries Inc., Sr. Unsec. Gtd. Global Notes, 9.25%, 08/15/20 | | | 250,000 | | | | 225,000 | |
| |
| | | | | | | | 312,787 | |
| |
Consumer Finance–1.52%
| | | | |
| Ally Financial Inc., Sr. Unsec. Gtd. Global Notes, | | | | | | | | |
| 7.50%, 09/15/20 | | | 75,000 | | | | 76,125 | |
| |
| 8.00%, 03/15/20 | | | 120,000 | | | | 123,600 | |
| |
| 8.00%, 11/01/31 | | | 15,000 | | | | 14,513 | |
| |
| Ford Motor Credit Co. LLC, Sr. Unsec. Notes, 8.00%, 12/15/16 | | | 45,000 | | | | 51,637 | |
| |
| National Money Mart Co. (Canada), Sr. Unsec. Gtd. Global Notes, 10.38%, 12/15/16 | | | 115,000 | | | | 123,337 | |
| |
| | | | | | | | 389,212 | |
| |
Data Processing & Outsourced Services–0.91%
| | | | |
CoreLogic, Inc., Sr. Unsec. Gtd. Notes, 7.25%, 06/01/21(b) | | | 140,000 | | | | 134,400 | |
| |
First Data Corp., Sr. Sec. Gtd. Notes, 7.38%, 06/15/19(b) | | | 45,000 | | | | 42,525 | |
| |
| SunGard Data Systems Inc., Sr. Unsec. Gtd. Global Notes, | | | | | | | | |
| 7.38%, 11/15/18 | | | 30,000 | | | | 30,825 | |
| |
| 7.63%, 11/15/20 | | | 25,000 | | | | 25,812 | |
| |
| | | | | | | | 233,562 | |
| |
Department Stores–0.19%
| | | | |
| Sears Holdings Corp., Sr. Sec. Gtd. Global Notes, 6.63%, 10/15/18 | | | 65,000 | | | | 49,725 | |
| |
Distillers & Vintners–0.77%
| | | | |
CEDC Finance Corp. International Inc., Sr. Sec. Gtd. Notes, 9.13%, 12/01/16(b) | | | 100,000 | | | | 70,500 | |
| |
| Constellation Brands Inc., Sr. Unsec. Gtd. Global Notes, 7.25%, 05/15/17 | | | 115,000 | | | | 126,212 | |
| |
| | | | | | | | 196,712 | |
| |
Diversified Banks–0.10%
| | | | |
RBS Capital Trust II, Jr. Unsec. Gtd. Sub. Global Bonds, 6.43%(f)(g) | | | 50,000 | | | | 25,875 | |
| |
Diversified Metals & Mining–0.80%
| | | | |
| FMG Resources Pty. Ltd. (Australia), Sr. Unsec. Gtd. Notes, | | | | | | | | |
6.38%, 02/01/16(b) | | | 90,000 | | | | 87,527 | |
| |
7.00%, 11/01/15(b) | | | 10,000 | | | | 10,150 | |
| |
Midwest Vanadium Pty. Ltd. (Australia), Sr. Sec. Gtd. Mortgage Notes, 11.50%, 02/15/18(b) | | | 30,000 | | | | 22,060 | |
| |
Vedanta Resources PLC (United Kingdom), Sr. Unsec. Notes, 9.50%, 07/18/18(b) | | | 100,000 | | | | 85,555 | |
| |
| | | | | | | | 205,292 | |
| |
Electrical Components & Equipment–0.10%
| | | | |
| Polypore International Inc., Sr. Unsec. Gtd. Global Notes, 7.50%, 11/15/17 | | | 25,000 | | | | 25,938 | |
| |
Electronic Manufacturing Services–0.30%
| | | | |
Sanmina-SCI Corp., Sr. Unsec. Gtd. Notes, 7.00%, 05/15/19(b) | | | 80,000 | | | | 76,600 | |
| |
Environmental & Facilities Services–0.13%
| | | | |
| EnergySolutions Inc./LLC, Sr. Unsec. Gtd. Global Notes, 10.75%, 08/15/18 | | | 35,000 | | | | 32,900 | |
| |
Food Retail–0.26%
| | | | |
Simmons Foods Inc., Sec. Notes, 10.50%, 11/01/17(b) | | | 80,000 | | | | 67,200 | |
| |
Forest Products–0.27%
| | | | |
Millar Western Forest Products Ltd. (Canada), Sr. Unsec. Notes, 8.50%, 04/01/21(b) | | | 85,000 | | | | 65,663 | |
| |
Sino-Forest Corp. (Canada), Sr. Unsec. Gtd. Notes, 6.25%, 10/21/17(b) | | | 10,000 | | | | 2,750 | |
| |
| | | | | | | | 68,413 | |
| |
| | | | | | | | | |
| | | | | | | | | |
See accompanying Notes to Financial Statements which are an integral part of the financial statements.
Invesco V.I. High Yield Securities Fund
| | | | | | | | | |
| | | Principal
| | |
| | | Amount | | Value |
| |
Gas Utilities–0.66%
| | | | |
| Ferrellgas L.P./Ferrellgas Finance Corp., Sr. Unsec. Global Notes, 6.50%, 05/01/21 | | $ | 90,000 | | | $ | 79,650 | |
| |
| Suburban Propane Partners, L.P./Suburban Energy Finance Corp., Sr. Unsec. Notes, 7.38%, 03/15/20 | | | 85,000 | | | | 88,825 | |
| |
| | | | | | | | 168,475 | |
| |
Health Care Equipment–0.42%
| | | | |
| DJO Finance LLC/Corp., | | | | | | | | |
| Sr. Unsec. Gtd. Global Notes, | | | | | | | | |
| 7.75%, 04/15/18 | | | 10,000 | | | | 7,650 | |
| |
| 10.88%, 11/15/14 | | | 90,000 | | | | 84,375 | |
| |
Sr. Unsec. Gtd. Sub. Global Notes, 9.75%, 10/15/17 | | | 20,000 | | | | 15,600 | |
| |
| | | | | | | | 107,625 | |
| |
Health Care Facilities–2.22%
| | | | |
| HCA, Inc., Sr. Sec. Gtd. Global Notes, 7.88%, 02/15/20 | | | 105,000 | | | | 113,925 | |
| |
| Health Management Associates Inc., Sr. Sec. Gtd. Notes, 6.13%, 04/15/16 | | | 30,000 | | | | 31,125 | |
| |
| HealthSouth Corp., Sr. Unsec. Gtd. Notes, | | | | | | | | |
| 7.25%, 10/01/18 | | | 60,000 | | | | 59,700 | |
| |
| 7.75%, 09/15/22 | | | 35,000 | | | | 34,563 | |
| |
Select Medical Holdings Corp., Sr. Unsec. Floating Rate Global Notes, 6.27%, 09/15/15(e) | | | 45,000 | | | | 38,925 | |
| |
Tenet Healthcare Corp.,
Sr. Sec. Gtd. Global Notes, 10.00%, 05/01/18 | | | 135,000 | | | | 154,912 | |
| |
| Sr. Unsec. Global Notes, | | | | | | | | |
| 8.00%, 08/01/20 | | | 20,000 | | | | 20,000 | |
| |
| 9.25%, 02/01/15 | | | 110,000 | | | | 117,150 | |
| |
| | | | | | | | 570,300 | |
| |
Health Care Services–0.38%
| | | | |
| Radnet Management Inc., Sr. Unsec. Gtd. Global Notes, 10.38%, 04/01/18 | | | 80,000 | | | | 71,600 | |
| |
| Universal Hospital Services Inc., Sec. Gtd. PIK Global Notes, 8.50%, 06/01/15 | | | 25,000 | | | | 25,406 | |
| |
| | | | | | | | 97,006 | |
| |
Health Care Technology–0.48%
| | | | |
| MedAssets Inc., Sr. Unsec. Gtd. Global Notes, 8.00%, 11/15/18 | | | 125,000 | | | | 123,125 | |
| |
Homebuilding–1.56%
| | | | |
| Beazer Homes USA Inc., Sr. Unsec. Gtd. Global Notes, | | | | | | | | |
| 6.88%, 07/15/15 | | | 80,000 | | | | 60,200 | |
| |
| 8.13%, 06/15/16 | | | 100,000 | | | | 74,500 | |
| |
| K. Hovnanian Enterprises Inc., Sr. Sec. Gtd. Global Notes, 10.63%, 10/15/16 | | | 190,000 | | | | 152,000 | |
| |
| Lennar Corp., Sr. Unsec. Gtd. Global Notes, 6.95%, 06/01/18 | | | 85,000 | | | | 82,875 | |
| |
| M/I Homes Inc., Sr. Unsec. Gtd. Global Notes, 8.63%, 11/15/18 | | | 35,000 | | | | 31,062 | |
| |
| | | | | | | | 400,637 | |
| |
Hotels, Resorts & Cruise Lines–0.06%
| | | | |
| Royal Caribbean Cruises Ltd., Sr. Unsec. Global Notes, 7.25%, 03/15/18 | | | 15,000 | | | | 15,788 | |
| |
Household Products–0.31%
| | | | |
| Central Garden & Pet Co., Sr. Gtd. Sub. Notes, 8.25%, 03/01/18 | | | 80,000 | | | | 79,000 | |
| |
Housewares & Specialties–0.20%
| | | | |
| American Greetings Corp., Sr. Unsec. Gtd. Notes, 7.38%, 12/01/21 | | | 50,000 | | | | 50,688 | |
| |
Independent Power Producers & Energy Traders–1.10%
| | | | |
| AES Corp. (The), Sr. Unsec. Global Notes, 7.75%, 10/15/15 | | | 220,000 | | | | 239,250 | |
| |
Calpine Corp., Sr. Sec. Notes, 7.25%, 10/15/17(b) | | | 40,000 | | | | 41,800 | |
| |
| | | | | | | | 281,050 | |
| |
Industrial Machinery–0.71%
| | | | |
Cleaver-Brooks Inc., Sr. Sec. Notes, 12.25%, 05/01/16(b) | | | 110,000 | | | | 111,100 | |
| |
| Columbus McKinnon Corp., Sr. Unsec. Gtd. Sub. Global Notes, 7.88%, 02/01/19 | | | 10,000 | | | | 10,437 | |
| |
| SPX Corp., Sr. Unsec. Gtd. Global Notes, 6.88%, 09/01/17 | | | 55,000 | | | | 59,675 | |
| |
| | | | | | | | 181,212 | |
| |
Industrial REIT’s–0.15%
| | | | |
| DuPont Fabros Technology L.P., Sr. Unsec. Gtd. Global Notes, 8.50%, 12/15/17 | | | 35,000 | | | | 37,713 | |
| |
Integrated Telecommunication Services–0.34%
| | | | |
Integra Telecom Holdings Inc., Sr. Sec. Notes, 10.75%, 04/15/16(b) | | | 70,000 | | | | 56,700 | |
| |
Intelsat Jackson Holdings S.A. (Luxembourg), Sr. Unsec. Gtd. Notes, 7.50%, 04/01/21(b) | | | 10,000 | | | | 10,250 | |
| |
Windstream Corp., Sr. Unsec. Gtd. Notes, 7.50%, 06/01/22(b) | | | 20,000 | | | | 20,100 | |
| |
| | | | | | | | 87,050 | |
| |
Internet Retail–0.19%
| | | | |
| Travelport LLC/Inc., Sr. Unsec. Gtd. Global Notes, 9.00%, 03/01/16 | | | 85,000 | | | | 48,238 | |
| |
| | | | | | | | | |
| | | | | | | | | |
See accompanying Notes to Financial Statements which are an integral part of the financial statements.
Invesco V.I. High Yield Securities Fund
| | | | | | | | | |
| | | Principal
| | |
| | | Amount | | Value |
| |
Internet Software & Services–0.64%
| | | | |
| Equinix Inc., Sr. Unsec. Notes, | | | | | | | | |
| 7.00%, 07/15/21 | | $ | 60,000 | | | $ | 63,900 | |
| |
| 8.13%, 03/01/18 | | | 90,000 | | | | 99,450 | |
| |
| | | | | | | | 163,350 | |
| |
Investment Banking & Brokerage–0.52%
| | | | |
Cantor Fitzgerald L.P., Bonds, 7.88%, 10/15/19(b) | | | 105,000 | | | | 105,367 | |
| |
| E*Trade Financial Corp., Sr. Unsec. Notes, 6.75%, 06/01/16 | | | 30,000 | | | | 29,250 | |
| |
| | | | | | | | 134,617 | |
| |
Leisure Facilities–0.10%
| | | | |
| Speedway Motorsports Inc., Sr. Unsec. Gtd. Global Notes, 6.75%, 02/01/19 | | | 25,000 | | | | 25,375 | |
| |
Leisure Products–0.44%
| | | | |
Toys R US-Delaware Inc., Sr. Sec. Gtd. Notes, 7.38%, 09/01/16(b) | | | 110,000 | | | | 111,650 | |
| |
Life Sciences Tools & Services–0.21%
| | | | |
Patheon Inc. (Canada), Sr. Sec. Gtd. Notes, 8.63%, 04/15/17(b) | | | 65,000 | | | | 52,650 | |
| |
Marine–0.17%
| | | | |
| Navios Maritime Acquisition Corp./Navios Acquisition Finance U.S. Inc. (Greece), Sr. Sec. Gtd. Global Notes, 8.63%, 11/01/17 | | | 10,000 | | | | 7,150 | |
| |
| Stena A.B. (Sweden), Sr. Unsec. Global Notes, 7.00%, 12/01/16 | | | 40,000 | | | | 36,950 | |
| |
| | | | | | | | 44,100 | |
| |
Movies & Entertainment–1.34%
| | | | |
AMC Entertainment Inc.,
Sr. Gtd. Sub. Global Notes, 9.75%, 12/01/20 | | | 50,000 | | | | 47,750 | |
| |
Sr. Unsec. Gtd. Global Notes, 8.75%, 06/01/19 | | | 115,000 | | | | 119,456 | |
| |
NAI Entertainment Holdings LLC, Sr. Sec. Notes, 8.25%, 12/15/17(b) | | | 165,000 | | | | 175,519 | |
| |
| | | | | | | | 342,725 | |
| |
Multi-Line Insurance–2.84%
| | | | |
| American International Group Inc., Jr. Unsec. Sub. Global Deb., 8.18%, 05/15/58 | | | 215,000 | | | | 195,112 | |
| |
Fairfax Financial Holdings Ltd. (Canada), Sr. Unsec. Notes, 5.80%, 05/15/21(b) | | | 45,000 | | | | 42,638 | |
| |
| Hartford Financial Services Group Inc., Jr. Unsec. Sub. Deb., 8.13%, 06/15/38 | | | 85,000 | | | | 84,575 | |
| |
Liberty Mutual Group Inc., Jr. Unsec. Gtd. Sub. Bonds, 7.80%, 03/15/37(b) | | | 230,000 | | | | 206,425 | |
| |
Nationwide Mutual Insurance Co., Unsec. Sub. Notes, 9.38%, 08/05/39(b) | | | 165,000 | | | | 198,991 | |
| |
| | | | | | | | 727,741 | |
| |
Office Services & Supplies–0.22%
| | | | |
| IKON Office Solutions, Inc., Sr. Unsec. Notes, 6.75%, 12/01/25 | | | 35,000 | | | | 34,213 | |
| |
| Interface Inc., Sr. Unsec. Gtd. Global Notes, 7.63%, 12/01/18 | | | 20,000 | | | | 21,250 | |
| |
| | | | | | | | 55,463 | |
| |
Oil & Gas Equipment & Services–1.11%
| | | | |
| Bristow Group, Inc., Sr. Unsec. Gtd. Global Notes, 7.50%, 09/15/17 | | | 110,000 | | | | 113,850 | |
| |
| Key Energy Services, Inc., Sr. Unsec. Gtd. Notes, 6.75%, 03/01/21 | | | 125,000 | | | | 125,625 | |
| |
| SESI LLC, Sr. Unsec. Gtd. Global Notes, 6.38%, 05/01/19 | | | 45,000 | | | | 46,125 | |
| |
| | | | | | | | 285,600 | |
| |
Oil & Gas Exploration & Production–5.17%
| | | | |
| Berry Petroleum Co., Sr. Unsec. Notes, 6.75%, 11/01/20 | | | 35,000 | | | | 35,569 | |
| |
| Chaparral Energy Inc., Sr. Unsec. Gtd. Global Notes, | | | | | | | | |
| 8.25%, 09/01/21 | | | 110,000 | | | | 111,925 | |
| |
| 8.88%, 02/01/17 | | | 90,000 | | | | 93,262 | |
| |
Chesapeake Energy Corp.,
Sr. Unsec. Gtd. Global Notes, 6.88%, 11/15/20 | | | 30,000 | | | | 31,950 | |
| |
| Sr. Unsec. Gtd. Notes, | | | | | | | | |
| 6.13%, 02/15/21 | | | 10,000 | | | | 10,288 | |
| |
| 6.63%, 08/15/20 | | | 73,000 | | | | 78,201 | |
| |
| Cimarex Energy Co., Sr. Unsec. Gtd. Notes, 7.13%, 05/01/17 | | | 50,000 | | | | 52,438 | |
| |
| Continental Resources Inc., Sr. Unsec. Gtd. Global Notes, | | | | | | | | |
| 7.13%, 04/01/21 | | | 30,000 | | | | 32,625 | |
| |
| 7.38%, 10/01/20 | | | 55,000 | | | | 60,156 | |
| |
| 8.25%, 10/01/19 | | | 50,000 | | | | 55,188 | |
| |
| EXCO Resources Inc., Sr. Unsec. Gtd. Notes, 7.50%, 09/15/18 | | | 130,000 | | | | 123,500 | |
| |
| Forest Oil Corp., Sr. Unsec. Gtd. Global Notes, 7.25%, 06/15/19 | | | 45,000 | | | | 45,450 | |
| |
| McMoRan Exploration Co., Sr. Unsec. Gtd. Notes, 11.88%, 11/15/14 | | | 155,000 | | | | 165,462 | |
| |
| Newfield Exploration Co., Sr. Unsec. Sub. Global Notes, 7.13%, 05/15/18 | | | 70,000 | | | | 74,022 | |
| |
| Plains Exploration & Production Co., Sr. Unsec. Gtd. Notes, 7.63%, 06/01/18 | | | 120,000 | | | | 127,800 | |
| |
| Range Resources Corp., Sr. Unsec. Gtd. Sub. Notes, 5.75%, 06/01/21 | | | 105,000 | | | | 113,137 | |
| |
| SM Energy Co., Sr. Unsec. Notes, | | | | | | | | |
6.50%, 11/15/21(b) | | | 15,000 | | | | 15,525 | |
| |
6.63%, 02/15/19(b) | | | 50,000 | | | | 51,750 | |
| |
See accompanying Notes to Financial Statements which are an integral part of the financial statements.
Invesco V.I. High Yield Securities Fund
| | | | | | | | | |
| | | Principal
| | |
| | | Amount | | Value |
| |
Oil & Gas Exploration & Production–(continued)
| | | | |
| | | | | | | | | |
| Whiting Petroleum Corp., Sr. Unsec. Gtd. Sub. Notes, 6.50%, 10/01/18 | | $ | 45,000 | | | $ | 47,081 | |
| |
| | | | | | | | 1,325,329 | |
| |
Oil & Gas Refining & Marketing–0.71%
| | | | |
| United Refining Co., Sr. Sec. Gtd. Global Notes, 10.50%, 02/28/18 | | | 195,000 | | | | 183,300 | |
| |
Oil & Gas Storage & Transportation–3.19%
| | | | |
Atlas Pipeline Partners L.P./Atlas Pipeline Finance Corp., Sr. Unsec. Gtd. Notes, 8.75%, 06/15/18(b) | | | 60,000 | | | | 63,450 | |
| |
Chesapeake Midstream Partners L.P./CHKM Finance Corp., Sr. Unsec. Gtd. Notes, 5.88%, 04/15/21(b) | | | 75,000 | | | | 75,750 | |
| |
| Copano Energy LLC/Copano Energy Finance Corp., Sr. Unsec. Gtd. Notes, 7.13%, 04/01/21 | | | 115,000 | | | | 116,725 | |
| |
| Energy Transfer Equity L.P., Sr. Sec. Gtd. Notes, 7.50%, 10/15/20 | | | 95,000 | | | | 103,194 | |
| |
| Inergy L.P./Inergy Finance Corp., Sr. Unsec. Gtd. Global Notes, 6.88%, 08/01/21 | | | 66,000 | | | | 66,825 | |
| |
| MarkWest Energy Partners L.P./MarkWest Energy Finance Corp., Sr. Unsec. Gtd. Notes, | | | | | | | | |
| 6.25%, 06/15/22 | | | 45,000 | | | | 47,250 | |
| |
| 6.50%, 08/15/21 | | | 40,000 | | | | 41,900 | |
| |
| Overseas Shipholding Group, Inc., Sr. Unsec. Notes, 8.13%, 03/30/18 | | | 100,000 | | | | 61,250 | |
| |
| Regency Energy Partners L.P./Regency Energy Finance Corp., Sr. Unsec. Gtd. Notes, 6.88%, 12/01/18 | | | 75,000 | | | | 79,781 | |
| |
Targa Resources Partners L.P./Targa Resouces Partners Finance Corp., Sr. Unsec. Gtd. Notes, 6.88%, 02/01/21(b) | | | 105,000 | | | | 106,837 | |
| |
WPX Energy Inc., Sr. Unsec. Notes, 6.00%, 01/15/22(b) | | | 55,000 | | | | 56,513 | |
| |
| | | | | | | | 819,475 | |
| |
Other Diversified Financial Services–1.52%
| | | | |
Aircastle Ltd., Sr. Notes, 9.75%, 08/01/18(b) | | | 20,000 | | | | 21,100 | |
| |
| International Lease Finance Corp., | | | | | | | | |
| Sr. Sec. Notes, | | | | | | | | |
6.75%, 09/01/16(b) | | | 45,000 | | | | 46,209 | |
| |
7.13%, 09/01/18(b) | | | 65,000 | | | | 67,255 | |
| |
| Sr. Unsec. Global Notes, | | | | | | | | |
| 5.75%, 05/15/16 | | | 20,000 | | | | 18,638 | |
| |
| 6.25%, 05/15/19 | | | 30,000 | | | | 27,750 | |
| |
| 8.63%, 09/15/15 | | | 145,000 | | | | 148,480 | |
| |
| 8.75%, 03/15/17 | | | 44,000 | | | | 45,512 | |
| |
Sr. Unsec. Notes, 8.25%, 12/15/20 | | | 15,000 | | | | 15,197 | |
| |
| | | | | | | | 390,141 | |
| |
Packaged Foods & Meats–0.24%
| | | | |
| Del Monte Corp., Sr. Unsec. Gtd. Global Notes, 7.63%, 02/15/19 | | | 65,000 | | | | 62,888 | |
| |
Paper Packaging–0.55%
| | | | |
| Cascades Inc. (Canada), Sr. Unsec. Gtd. Global Notes, 7.88%, 01/15/20 | | | 145,000 | | | | 141,738 | |
| |
Paper Products–1.89%
| | | | |
| Boise Cascade LLC, Sr. Unsec. Gtd. Sub. Global Notes, 7.13%, 10/15/14 | | | 165,000 | | | | 164,175 | |
| |
| Clearwater Paper Corp., Sr. Unsec. Gtd. Global Notes, 7.13%, 11/01/18 | | | 75,000 | | | | 78,187 | |
| |
| Mercer International Inc., Sr. Unsec. Gtd. Global Notes, 9.50%, 12/01/17 | | | 75,000 | | | | 77,063 | |
| |
| NewPage Corp., Sr. Sec. Gtd. Global Notes, 11.38%, 12/31/14 | | | 70,000 | | | | 51,975 | |
| |
| P.H. Glatfelter Co., Sr. Unsec. Gtd. Global Notes, 7.13%, 05/01/16 | | | 110,000 | | | | 113,987 | |
| |
| | | | | | | | 485,387 | |
| |
Pharmaceuticals–1.80%
| | | | |
| Aptalis Pharma Inc., Sr. Unsec. Gtd. Global Notes, 12.75%, 03/01/16 | | | 60,000 | | | | 63,600 | |
| |
| Elan Finance PLC/Corp. (Ireland), Sr. Unsec. Gtd. Global Notes, 8.75%, 10/15/16 | | | 100,000 | | | | 107,250 | |
| |
| Endo Pharmaceuticals Holdings Inc., Sr. Unsec. Gtd. Global Notes, 7.00%, 12/15/20 | | | 15,000 | | | | 16,013 | |
| |
Mylan Inc., Sr. Unsec. Gtd. Notes, 6.00%, 11/15/18(b) | | | 50,000 | | | | 51,625 | |
| |
| NBTY Inc., Sr. Unsec. Gtd. Global Notes, 9.00%, 10/01/18 | | | 100,000 | | | | 110,000 | |
| |
| Valeant Pharmaceuticals International, Sr. Unsec. Gtd. Notes, | | | | | | | | |
6.75%, 10/01/17(b) | | | 30,000 | | | | 30,000 | |
| |
6.75%, 08/15/21(b) | | | 85,000 | | | | 82,981 | |
| |
| | | | | | | | 461,469 | |
| |
Property & Casualty Insurance–0.26%
| | | | |
XL Group PLC (Ireland), Series E, Jr. Sub. Global Pfd. Bonds, 6.50%(f) | | | 85,000 | | | | 66,938 | |
| |
Real Estate Services–0.32%
| | | | |
| CB Richard Ellis Services Inc., Sr. Unsec. Gtd. Global Notes, 6.63%, 10/15/20 | | | 80,000 | | | | 82,600 | |
| |
Regional Banks–1.51%
| | | | |
| AmSouth Bancorp., Unsec. Sub. Deb., 6.75%, 11/01/25 | | | 25,000 | | | | 20,500 | |
| |
| BB&T Capital Trust II, Jr. Unsec. Ltd. Gtd. Sub. Global Notes, 6.75%, 06/07/36 | | | 60,000 | | | | 59,944 | |
| |
PNC Financial Services Group, Inc., Series O, Jr. Unsec. Sub. Pfd. Notes, 6.75%(f) | | | 40,000 | | | | 39,400 | |
| |
Regions Financial Corp.,
Sr. Unsec. Notes, 5.75%, 06/15/15 | | | 60,000 | | | | 58,050 | |
| |
Unsec. Sub. Notes, 7.38%, 12/10/37 | | | 150,000 | | | | 124,125 | |
| |
See accompanying Notes to Financial Statements which are an integral part of the financial statements.
Invesco V.I. High Yield Securities Fund
| | | | | | | | | |
| | | Principal
| | |
| | | Amount | | Value |
| |
Regional Banks–(continued)
| | | | |
| | | | | | | | | |
| Synovus Financial Corp., Unsec. Sub. Global Notes, 5.13%, 06/15/17 | | $ | 100,000 | | | $ | 85,250 | |
| |
| | | | | | | | 387,269 | |
| |
Research & Consulting Services–0.37%
| | | | |
| FTI Consulting Inc., Sr. Unsec. Gtd. Global Notes, 6.75%, 10/01/20 | | | 90,000 | | | | 94,275 | |
| |
Semiconductor Equipment–1.12%
| | | | |
| Amkor Technology Inc., Sr. Unsec. Global Notes, | | | | | | | | |
| 6.63%, 06/01/21 | | | 15,000 | | | | 14,437 | |
| |
| 7.38%, 05/01/18 | | | 160,000 | | | | 164,000 | |
| |
Sensata Technologies B.V. (Netherlands), Sr. Unsec. Gtd. Notes, 6.50%, 05/15/19(b) | | | 110,000 | | | | 109,725 | |
| |
| | | | | | | | 288,162 | |
| |
Semiconductors–0.81%
| | | | |
Freescale Semiconductor Inc.,
Sr. Sec. Gtd. Notes, 9.25%, 04/15/18(b) | | | 109,000 | | | | 116,902 | |
| |
| Sr. Unsec. Gtd. Global Notes, | | | | | | | | |
| 8.05%, 02/01/20 | | | 25,000 | | | | 23,500 | |
| |
| 10.75%, 08/01/20 | | | 65,000 | | | | 67,925 | |
| |
| | | | | | | | 208,327 | |
| |
Specialized Finance–0.96%
| | | | |
CIT Group Inc., Sec. Gtd. Bonds, 7.00%, 05/02/17(b) | | | 245,000 | | | | 245,612 | |
| |
Specialized REIT’s–0.69%
| | | | |
| Host Hotels & Resorts L.P., Sr. Gtd. Global Notes, 6.00%, 11/01/20 | | | 75,000 | | | | 76,875 | |
| |
| MPT Operating Partnership L.P./MPT Finance Corp., Sr. Unsec. Gtd. Global Notes, 6.88%, 05/01/21 | | | 45,000 | | | | 44,831 | |
| |
| Omega Healthcare Investors, Inc., Sr. Unsec. Gtd. Global Notes, 6.75%, 10/15/22 | | | 55,000 | | | | 55,207 | |
| |
| | | | | | | | 176,913 | |
| |
Specialty Chemicals–1.65%
| | | | |
| Ferro Corp., Sr. Unsec. Notes, 7.88%, 08/15/18 | | | 105,000 | | | | 106,575 | |
| |
Huntsman International LLC,
Sr. Unsec. Gtd. Global Notes, 5.50%, 06/30/16 | | | 30,000 | | | | 29,625 | |
| |
Sr. Unsec. Gtd. Sub. Global Notes, 8.63%, 03/15/21 | | | 90,000 | | | | 95,850 | |
| |
| NewMarket Corp., Sr. Unsec. Gtd. Global Notes, 7.13%, 12/15/16 | | | 45,000 | | | | 46,097 | |
| |
| PolyOne Corp., Sr. Unsec. Notes, 7.38%, 09/15/20 | | | 140,000 | | | | 144,900 | |
| |
| | | | | | | | 423,047 | |
| |
Specialty Stores–0.66%
| | | | |
Michaels Stores Inc.,
Sr. Unsec. Gtd. Global Notes, 7.75%, 11/01/18 | | | 25,000 | | | | 25,500 | |
| |
Sr. Unsec. Gtd. Sub. Disc. Global Notes, 13.00%, 11/01/16 | | | 135,000 | | | | 143,944 | |
| |
| | | | | | | | 169,444 | |
| |
Steel–0.14%
| | | | |
| United States Steel Corp., Sr. Unsec. Notes, 7.00%, 02/01/18 | | | 35,000 | | | | 34,825 | |
| |
Systems Software–0.77%
| | | | |
Allen Systems Group Inc., Sec. Gtd. Notes, 10.50%, 11/15/16(b) | | | 225,000 | | | | 196,875 | |
| |
Tires & Rubber–0.48%
| | | | |
| Cooper Tire & Rubber Co., Sr. Unsec. Notes, 8.00%, 12/15/19 | | | 110,000 | | | | 114,950 | |
| |
| Goodyear Tire & Rubber Co. (The), Sr. Unsec. Gtd Notes, 8.25%, 08/15/20 | | | 7,000 | | | | 7,665 | |
| |
| | | | | | | | 122,615 | |
| |
Trading Companies & Distributors–2.59%
| | | | |
| Avis Budget Car Rental LLC/Avis Budget Finance Inc., Sr. Unsec. Gtd. Global Notes, 8.25%, 01/15/19 | | | 160,000 | | | | 159,600 | |
| |
| H&E Equipment Services Inc., Sr. Unsec. Gtd. Global Notes, 8.38%, 07/15/16 | | | 185,000 | | | | 189,394 | |
| |
| Hertz Corp. (The), Sr. Unsec. Gtd. Global Notes, | | | | | | | | |
| 6.75%, 04/15/19 | | | 45,000 | | | | 45,788 | |
| |
| 7.38%, 01/15/21 | | | 125,000 | | | | 128,437 | |
| |
| 7.50%, 10/15/18 | | | 55,000 | | | | 57,612 | |
| |
| Interline Brands, Inc., Sr. Unsec. Gtd. Global Notes, 7.00%, 11/15/18 | | | 40,000 | | | | 41,500 | |
| |
| RSC Equipment Rental Inc./RSC Holdings III LLC, Sr. Unsec. Gtd. Global Notes, 8.25%, 02/01/21 | | | 40,000 | | | | 41,000 | |
| |
| | | | | | | | 663,331 | |
| |
Trucking–0.10%
| | | | |
| Avis Budget Car Rental LLC/Avis Budget Finance Inc., Sr. Unsec. Gtd. Global Notes, 9.75%, 03/15/20 | | | 25,000 | | | | 25,875 | |
| |
Wireless Telecommunication Services–5.40%
| | | | |
Clearwire Communications LLC/Clearwire Finance, Inc.,
Sr. Sec. Gtd. Notes, 12.00%, 12/01/15(b) | | | 165,000 | | | | 159,637 | |
| |
Sr. Unsec. Gtd. Conv. Notes, 8.25%, 12/01/17(b)(h) | | | 35,000 | | | | 22,575 | |
| |
Cricket Communications, Inc.,
Sr. Sec. Gtd. Global Notes, 7.75%, 05/15/16 | | | 115,000 | | | | 119,744 | |
| |
Sr. Unsec. Gtd. Global Notes, 7.75%, 10/15/20 | | | 165,000 | | | | 145,200 | |
| |
Digicel Group Ltd. (Bermuda), Sr. Unsec. Notes, 8.88%, 01/15/15(b) | | | 150,000 | | | | 147,562 | |
| |
See accompanying Notes to Financial Statements which are an integral part of the financial statements.
Invesco V.I. High Yield Securities Fund
| | | | | | | | | |
| | | Principal
| | |
| | | Amount | | Value |
| |
Wireless Telecommunication Services–(continued)
| | | | |
| | | | | | | | | |
| MetroPCS Wireless Inc., Sr. Unsec. Gtd. Notes, | | | | | | | | |
| 6.63%, 11/15/20 | | $ | 95,000 | | | $ | 89,775 | |
| |
| 7.88%, 09/01/18 | | | 65,000 | | | | 66,016 | |
| |
| SBA Telecommunications Inc., Sr. Unsec. Gtd. Global Notes, 8.25%, 08/15/19 | | | 50,000 | | | | 54,688 | |
| |
| Sprint Capital Corp., Sr. Unsec. Gtd. Global Notes, 6.90%, 05/01/19 | | | 165,000 | | | | 135,712 | |
| |
Sprint Nextel Corp.,
Sr. Unsec. Gtd. Notes, 9.00%, 11/15/18(b) | | | 65,000 | | | | 68,494 | |
| |
Sr. Unsec. Notes, 11.50%, 11/15/21(b) | | | 25,000 | | | | 24,844 | |
| |
VimpelCom (Ireland), Unsec. Loan Participation Notes, 7.75%, 02/02/21(b) | | | 200,000 | | | | 171,500 | |
| |
Wind Acquisition Finance S.A. (Luxembourg), Sr. Sec. Gtd. Notes, 11.75%, 07/15/17(b) | | | 200,000 | | | | 179,000 | |
| |
| | | | | | | | 1,384,747 | |
| |
| Total U.S. Dollar Denominated Bonds and Notes (Cost $29,993,804) | | | | | | | 22,359,970 | |
| |
Non-U.S. Dollar Denominated Bonds & Notes–6.94%(i)
|
Canada–0.33%
| | | | |
Gateway Casinos & Entertainment Ltd., Sec. Gtd. Notes, 8.88%, 11/15/17(b) | | CAD | 85,000 | | | | 85,100 | |
| |
Czech Republic–0.24%
| | | | |
CET 21 Spol S.R.O., Sr. Sec. Notes, 9.00%, 11/01/17(b) | | EUR | 50,000 | | | | 61,803 | |
| |
Ireland–1.36%
| | | | |
Ardagh Packaging Finance PLC, Sr. Unsec. Gtd. Notes, 9.25%, 10/15/20(b) | | EUR | 100,000 | | | | 117,457 | |
| |
| Bord Gais Eireann, Sr. Unsec. Medium-Term Euro Notes, 5.75%, 06/16/14 | | EUR | 95,000 | | | | 116,933 | |
| |
Nara Cable Funding Ltd., Sr. Sec. Notes, 8.88%, 12/01/18(b) | | EUR | 100,000 | | | | 114,222 | |
| |
| | | | | | | | 348,612 | |
| |
Italy–0.20%
| | | | |
Lottomatica SpA–REGS, Jr. Unsec. Sub. Euro Bonds, 8.25%, 03/31/66(b) | | EUR | 50,000 | | | | 50,801 | |
| |
Luxembourg–2.22%
| | | | |
Cirsa Funding Luxembourg S.A., Sr. Unsec. Gtd. Notes, 8.75%, 05/15/18(b) | | EUR | 50,000 | | | | 53,309 | |
| |
REGS, Sr. Gtd. Euro Notes, 8.75%, 05/15/18(b) | | EUR | 50,000 | | | | 53,309 | |
| |
Codere Finance Luxembourg S.A., Sr. Sec. Gtd. Notes, 8.25%, 06/15/15(b) | | EUR | 100,000 | | | | 119,723 | |
| |
ConvaTec Healthcare S.A., Sr. Sec. Gtd. Notes, 7.38%, 12/15/17(b) | | EUR | 100,000 | | | | 122,959 | |
| |
Mark IV Europe Lux SCA/Mark IV USA SCA, Sr. Sec. Gtd. Notes, 8.88%, 12/15/17(b) | | EUR | 100,000 | | | | 131,371 | |
| |
TMD Friction Finance S.A., Sr. Sec. Gtd. Bonds, 10.75%, 05/15/17(b) | | EUR | 65,000 | | | | 87,915 | |
| |
| | | | | | | | 568,586 | |
| |
Netherlands–0.56%
| | | | |
Ziggo Bond Co. B.V., Sr. Sec. Gtd. Notes, 8.00%, 05/15/18(b) | | EUR | 110,000 | | | | 144,509 | |
| |
Sweden–0.26%
| | | | |
TVN Finance Corp II A.B., Sr. Unsec. Gtd. Notes, 10.75%, 11/15/17(b) | | EUR | 50,000 | | | | 67,627 | |
| |
United Kingdom–1.41%
| | | | |
EC Finance PLC–REGS, Sr. Sec. Gtd. Euro Notes, 9.75%, 08/01/17(b) | | EUR | 50,000 | | | | 50,154 | |
| |
Kerling PLC, Sr. Sec. Gtd. Notes, 10.63%, 02/01/17(b) | | EUR | 50,000 | | | | 57,596 | |
| |
Pipe Holdings PLC, Sr. Sec. Gtd. Bonds, 9.50%, 11/01/15(b) | | GBP | 100,000 | | | | 138,641 | |
| |
R&R Ice Cream PLC, Sr. Sec. Gtd. Notes, 8.38%, 11/15/17(b) | | EUR | 100,000 | | | | 114,546 | |
| |
| | | | | | | | 360,937 | |
| |
United States–0.36%
| | | | |
CEDC Finance Corp. International Inc., Sr. Sec. Gtd. Notes, 8.88%, 12/01/16(b) | | EUR | 100,000 | | | | 93,190 | |
| |
| Total Non-U.S. Dollar Denominated Bonds & Notes (Cost $2,008,866) | | | | | | | 1,781,165 | |
| |
| | | | | | | | | |
| | | Shares | | |
Preferred Stocks–2.85%
|
Automobile Manufacturers–0.29%
| | | | |
General Motors Co., Series B, $2.38 Conv. Pfd.(d) | | | 2,130 | | | | 72,953 | |
| |
Consumer Finance–1.16%
| | | | |
Ally Financial, Inc.,
Series A,, 8.50% Pfd., | | | 2,690 | | | | 49,469 | |
| |
Series G, 7.00% Pfd.(b) | | | 264 | | | | 189,263 | |
| |
GMAC Capital Trust I, Series 2, 8.13% Jr. Gtd.
Sub. Pfd. | | | 3,025 | | | | 58,504 | |
| |
| | | | | | | | 297,236 | |
| |
Industrial REIT’s–0.10%
| | | | |
DuPont Fabros Technology, Inc., Series B,
7.63% Pfd. | | | 1,045 | | | | 26,062 | |
| |
Regional Banks–1.14%
| | | | |
| Zions Bancorp., Series C, 9.50% Pfd. | | | 11,600 | | | | 292,900 | |
| |
| | | | | | | | | |
| | | | | | | | | |
See accompanying Notes to Financial Statements which are an integral part of the financial statements.
Invesco V.I. High Yield Securities Fund
| | | | | | | | | |
| | | Shares | | Value |
| |
Tires & Rubber–0.16%
| | | | |
Goodyear Tire & Rubber Co. (The), $2.94
Conv. Pfd. | | | 855 | | | $ | 41,596 | |
| |
| Total Preferred Stocks (Cost $782,024) | | | | | | | 730,747 | |
| |
Common Stocks & Other Equity Interests–0.18%
|
Automobile Manufacturers–0.18%
| | | | |
General Motors Co.(d)(j) | | | 1,239 | | | | 25,115 | |
| |
General Motors Co., Wts. expiring 07/10/16(d)(k) | | | 1,125 | | | | 13,196 | |
| |
General Motors Co., Wts. expiring 07/10/19(d)(k) | | | 1,125 | | | | 8,797 | |
| |
| Total Common Stocks & Other Equity Interests (Cost $95,241) | | | | | | | 47,108 | |
| |
Money Market Funds–0.27%
|
Liquid Assets Portfolio–Institutional Class(l) | | | 34,509 | | | | 34,509 | |
| |
Premier Portfolio–Institutional Class(l) | | | 34,509 | | | | 34,509 | |
| |
| Total Money Market Funds (Cost $69,018) | | | | | | | 69,018 | |
| |
| TOTAL INVESTMENTS–97.40% (Cost $32,948,953) | | | | | | | 24,988,008 | |
| |
| OTHER ASSETS LESS LIABILITIES–2.60% | | | | | | | 667,491 | |
| |
| NET ASSETS–100.00% | | | | | | $ | 25,655,499 | |
| |
Investment Abbreviations:
| | | |
| CAD | | – Canadian Dollar |
| Conv. | | – Convertible |
| Ctfs. | | – Certificates |
| Deb. | | – Debentures |
| EUR | | – Euro |
| GBP | | – British Pound |
| Gtd. | | – Guaranteed |
| Jr. | | – Junior |
| Pfd. | | – Preferred |
| PIK | | – Payment in Kind |
| REGS | | – Regulation S |
| REIT | | – Real Estate Investment Trust |
| Sec. | | – Secured |
| Sr. | | – Senior |
| Sub. | | – Subordinated |
| Unsec. | | – Unsecured |
| Wts. | | – Warrants |
Notes to Schedule of Investments:
| | |
| (a) | | Industry and/or sector classifications used in this report are generally according to the Global Industry Classification Standard, which was developed by and is the exclusive property and a service mark of MSCI Inc. and Standard & Poor’s. |
| (b) | | Security purchased or received in a transaction exempt from registration under the Securities Act of 1933, as amended. The security may be resold pursuant to an exemption from registration under the 1933 Act, typically to qualified institutional buyers. The aggregate value of these securities at December 31, 2011 was $8,756,432, which represented 34,13% of the Fund’s Net Assets. |
| (c) | | Defaulted security. Currently, the issuer is partially or fully in default with respect to interest payments. The aggregate value of these securities at December 31, 2011 was $114,132, which represented 0.44% of the Fund’s Net Assets |
| (d) | | Acquired as part of the General Motors reorganization. |
| (e) | | Interest or dividend rate is redetermined periodically. Rate shown is the rate in effect on December 31, 2011. |
| (f) | | Perpetual bond with no specified maturity date. |
| (g) | | Interest payments have been suspended under the European Union agreement for 24 months beginning April 30, 2010. |
| (h) | | Security has an irrevocable call by the issuer or mandatory put by the holder. Maturity date reflects such call or put. |
| (i) | | Foreign denominated security. Principal amount is denominated in currency indicated. |
| (j) | | Non-income producing security. |
| (k) | | Non-income producing security acquired through a corporate action. |
| (l) | | The money market fund and the Fund are affiliated by having the same investment adviser. |
See accompanying Notes to Financial Statements which are an integral part of the financial statements.
Invesco V.I. High Yield Securities Fund
Statement of Assets and Liabilities
December 31, 2011
| | | | | |
Assets:
|
| Investments, at value (Cost $32,879,935) | | $ | 24,918,990 | |
| |
| Investments in affiliated money market funds, at value and cost | | | 69,018 | |
| |
| Total investments, at value (Cost $32,948,953) | | | 24,988,008 | |
| |
| Foreign currencies, at value (Cost $147,463) | | | 147,463 | |
| |
| Receivable for: | | | | |
| Investments sold | | | 49,303 | |
| |
| Fund shares sold | | | 43,186 | |
| |
| Dividends and interest | | | 471,892 | |
| |
| Foreign currency contracts | | | 118,995 | |
| |
| Investment for trustee deferred compensation and retirement plans | | | 4,960 | |
| |
| Other assets | | | 4,367 | |
| |
| Total assets | | | 25,828,174 | |
| |
Liabilities:
|
| Payable for: | | | | |
| Investments purchased | | | 10,184 | |
| |
| Fund shares reacquired | | | 80 | |
| |
| Accrued fees to affiliates | | | 55,479 | |
| |
| Accrued other operating expenses | | | 100,070 | |
| |
| Trustee deferred compensation and retirement plans | | | 6,862 | |
| |
| Total liabilities | | | 172,675 | |
| |
| Net assets applicable to shares outstanding | | $ | 25,655,499 | |
| |
Net assets consist of:
|
| Shares of beneficial interest | | $ | 134,321,802 | |
| |
| Undistributed net investment income | | | 1,509,910 | |
| |
| Undistributed net realized gain (loss) | | | (102,315,886 | ) |
| |
| Unrealized appreciation (depreciation) | | | (7,860,327 | ) |
| |
| | | $ | 25,655,499 | |
| |
Net Assets:
|
| Series I | | $ | 13,403,102 | |
| |
| Series II | | $ | 12,252,397 | |
| |
Shares outstanding, $0.001 par value per share, with an unlimited number of shares authorized:
|
| Series I | | | 12,599,391 | |
| |
| Series II | | | 11,516,979 | |
| |
| Series I: | | | | |
| Net asset value per share | | $ | 1.06 | |
| |
| Series II: | | | | |
| Net asset value per share | | $ | 1.06 | |
| |
Statement of Operations
For the year ended December 31, 2011
| | | | | |
Investment income:
|
| Interest | | $ | 2,230,543 | |
| |
| Dividends | | | 55,690 | |
| |
| Dividends from affiliated money market funds | | | 131 | |
| |
| Total investment income | | | 2,286,364 | |
| |
Expenses:
|
| Advisory fees | | | 121,485 | |
| |
| Administrative services fees | | | 77,372 | |
| |
| Custodian fees | | | 15,643 | |
| |
| Distribution fees — Series II | | | 35,130 | |
| |
| Transfer agent fees | | | 2,744 | |
| |
| Trustees’ and officers’ fees and benefits | | | 18,136 | |
| |
| Professional services fees | | | 228,779 | |
| |
| Other | | | 18,212 | |
| |
| Total expenses | | | 517,501 | |
| |
| Less: Fees waived | | | (269 | ) |
| |
| Net expenses | | | 517,232 | |
| |
| Net investment income | | | 1,769,132 | |
| |
Realized and unrealized gain (loss) from:
|
| Net realized gain (loss) from: | | | | |
| Investment securities | | | 1,133,562 | |
| |
| Foreign currencies | | | (5,103 | ) |
| |
| Foreign currency contracts | | | (36,120 | ) |
| |
| | | | 1,092,339 | |
| |
| Change in net unrealized appreciation (depreciation) of: | | | | |
| Investment securities | | | (2,453,106 | ) |
| |
| Foreign currencies | | | (1,169 | ) |
| |
| Foreign currency contracts | | | 101,990 | |
| |
| | | | (2,352,285 | ) |
| |
| Net realized and unrealized gain (loss) | | | (1,259,946 | ) |
| |
| Net increase in net assets resulting from operations | | $ | 509,186 | |
| |
See accompanying Notes to Financial Statements which are an integral part of the financial statements.
Invesco V.I. High Yield Securities Fund
Statement of Changes in Net Assets
For the years ended December 31, 2011 and 2010
| | | | | | | | | |
| | | 2011 | | 2010 |
| |
Operations:
|
| Net investment income | | $ | 1,769,132 | | | $ | 2,370,243 | |
| |
| Net realized gain (loss) | | | 1,092,339 | | | | (43,900,656 | ) |
| |
| Change in net unrealized appreciation (depreciation) | | | (2,352,285 | ) | | | 44,931,025 | |
| |
| Net increase in net assets resulting from operations | | | 509,186 | | | | 3,400,612 | |
| |
Distributions to shareholders from net investment income:
|
| Series I | | | (1,187,359 | ) | | | (1,323,198 | ) |
| |
| Series II | | | (1,065,238 | ) | | | (1,325,494 | ) |
| |
| Total distributions from net investment income | | | (2,252,597 | ) | | | (2,648,692 | ) |
| |
Share transactions–net:
|
| Series I | | | (1,728,255 | ) | | | (1,163,101 | ) |
| |
| Series II | | | (3,049,386 | ) | | | (958,872 | ) |
| |
| Net increase (decrease) in net assets resulting from share transactions | | | (4,777,641 | ) | | | (2,121,973 | ) |
| |
| Net increase (decrease) in net assets | | | (6,521,052 | ) | | | (1,370,053 | ) |
| |
Net assets:
|
| Beginning of year | | | 32,176,551 | | | | 33,546,604 | |
| |
| End of year (includes undistributed net investment income of $1,509,910 and $1,946,344, respectively) | | $ | 25,655,499 | | | $ | 32,176,551 | |
| |
Notes to Financial Statements
December 31, 2011
NOTE 1—Significant Accounting Policies
Invesco V.I. High Yield Securities Fund (the “Fund”) is a series portfolio of AIM Variable Insurance Funds (Invesco Variable Insurance Funds) (the “Trust”). The Trust is a Delaware statutory trust registered under the Investment Company Act of 1940, as amended (the “1940 Act”), as an open-end series management investment company consisting of twenty-eight separate portfolios, (each constituting a “Fund”). The assets, liabilities and operations of each portfolio are accounted for separately. Information presented in these financial statements pertains only to the Fund. Matters affecting each Fund or class will be voted on exclusively by the shareholders of such Fund or class. Current Securities and Exchange Commission (“SEC”) guidance, however, requires participating insurance companies offering separate accounts to vote shares proportionally in accordance with the instructions of the contract owners whose investments are funded by shares of each Fund or class.
The Fund’s investment objective is to provide a high level of current income by investing in a diversified portfolio consisting principally of fixed-income securities, which may include both non-convertible and convertible debt securities and preferred stocks. As a secondary objective the Fund will seek capital appreciation, but only when consistent with its primary objective.
The Fund currently offers two classes of shares, Series I and Series II, both of which are offered to insurance company separate accounts funding variable annuity contracts and variable life insurance policies (“variable products”).
The following is a summary of the significant accounting policies followed by the Fund in the preparation of its financial statements.
| | |
| A. | | Security Valuations — Securities, including restricted securities, are valued according to the following policy. |
| | Debt obligations (including convertible bonds) and unlisted equities are fair valued using an evaluated quote provided by an independent pricing service. Evaluated quotes provided by the pricing service may be determined without exclusive reliance on quoted prices, and may reflect appropriate factors such as institution-size trading in similar groups of securities, developments related to specific securities, dividend rate, yield, quality, type of issue, coupon rate, maturity, individual trading characteristics and other market data. Debt securities are subject to interest rate and credit risks. In addition, all debt securities involve some risk of default with respect to interest and/or principal payments. |
| | A security listed or traded on an exchange (except convertible bonds) is valued at its last sales price or official closing price as of the close of the customary trading session on the exchange where the security is principally traded, or lacking any sales or official closing price on a particular day, the security may be valued at the closing bid price on that day. Securities traded in the over-the-counter market are valued based on prices furnished by independent pricing services or market makers. When such securities are valued by an independent pricing service they may be considered fair valued. Futures contracts are valued at the final settlement price set by an exchange on which they are principally traded. Listed options are valued at the mean |
Invesco V.I. High Yield Securities Fund
| | |
| | between the last bid and ask prices from the exchange on which they are principally traded. Options not listed on an exchange are valued by an independent source at the mean between the last bid and ask prices. For purposes of determining net asset value per share, futures and option contracts generally are valued 15 minutes after the close of the customary trading session of the New York Stock Exchange (“NYSE”). |
| | Investments in open-end and closed-end registered investment companies that do not trade on an exchange are valued at the end of day net asset value per share. Investments in open-end and closed-end registered investment companies that trade on an exchange are valued at the last sales price or official closing price as of the close of the customary trading session on the exchange where the security is principally traded. |
| | Swap agreements are fair valued using an evaluated quote provided by an independent pricing service. Evaluated quotes provided by the pricing service are valued based on a model which may include end of day net present values, spreads, ratings, industry, and company performance. |
| | Foreign securities (including foreign exchange contracts) are converted into U.S. dollar amounts using the applicable exchange rates as of the close of the NYSE. If market quotations are available and reliable for foreign exchange traded equity securities, the securities will be valued at the market quotations. Because trading hours for certain foreign securities end before the close of the NYSE, closing market quotations may become unreliable. If between the time trading ends on a particular security and the close of the customary trading session on the NYSE, events occur that are significant and make the closing price unreliable, the Fund may fair value the security. If the event is likely to have affected the closing price of the security, the security will be valued at fair value in good faith using procedures approved by the Board of Trustees. Adjustments to closing prices to reflect fair value may also be based on a screening process of an independent pricing service to indicate the degree of certainty, based on historical data, that the closing price in the principal market where a foreign security trade is not the current value as of the close of the NYSE. Foreign securities meeting the approved degree of certainty that the price is not reflective of current value will be priced at the indication of fair value from the independent pricing service. Multiple factors may be considered by the independent pricing service in determining adjustments to reflect fair value and may include information relating to sector indices, American Depositary Receipts and domestic and foreign index futures. Foreign securities may have additional risks including exchange rate changes, potential for sharply devalued currencies and high inflation, political and economic upheaval, the relative lack of issuer information, relatively low market liquidity and the potential lack of strict financial and accounting controls and standards. |
| | Securities for which market prices are not provided by any of the above methods may be valued based upon quotes furnished by independent sources. The last bid price may be used to value equity securities. The mean between the last bid and asked prices is used to value debt obligations, including Corporate Loans. |
| | Securities for which market quotations are not readily available or are unreliable are valued at fair value as determined in good faith by or under the supervision of the Trust’s officers following procedures approved by the Board of Trustees. Issuer specific events, market trends, bid/ask quotes of brokers and information providers and other market data may be reviewed in the course of making a good faith determination of a security’s fair value. |
| | Valuations change in response to many factors including the historical and prospective earnings of the issuer, the value of the issuer’s assets, general economic conditions, interest rates, investor perceptions and market liquidity. Because of the inherent uncertainties of valuation, the values reflected in the financial statements may materially differ from the value received upon actual sale of those investments. |
| B. | | Securities Transactions and Investment Income — Securities transactions are accounted for on a trade date basis. Realized gains or losses on sales are computed on the basis of specific identification of the securities sold. Interest income is recorded on the accrual basis from settlement date. Paydown gains and losses on mortgage and asset-backed securities are recorded as adjustments to interest income. Dividend income (net of withholding tax, if any) is recorded on the ex-dividend date. Bond premiums and discounts are amortized and/or accreted for financial reporting purposes. |
| | The Fund may periodically participate in litigation related to Fund investments. As such, the Fund may receive proceeds from litigation settlements. Any proceeds received are included in the Statement of Operations as realized gain (loss) for investments no longer held and as unrealized gain (loss) for investments still held. |
| | Brokerage commissions and mark ups are considered transaction costs and are recorded as an increase to the cost basis of securities purchased and/or a reduction of proceeds on a sale of securities. Such transaction costs are included in the determination of net realized and unrealized gain (loss) from investment securities reported in the Statement of Operations and the Statement of Changes in Net Assets and the net realized and unrealized gains (losses) on securities per share in the Financial Highlights. Transaction costs are included in the calculation of the Fund’s net asset value and, accordingly, they reduce the Fund’s total returns. These transaction costs are not considered operating expenses and are not reflected in net investment income reported in the Statement of Operations and Statement of Changes in Net Assets, or the net investment income per share and ratios of expenses and net investment income reported in the Financial Highlights, nor are they limited by any expense limitation arrangements between the Fund and the investment adviser. |
| | The Fund allocates income and realized and unrealized capital gains and losses to a class based on the relative net assets of each class. |
| C. | | Country Determination — For the purposes of making investment selection decisions and presentation in the Schedule of Investments, the investment adviser may determine the country in which an issuer is located and/or credit risk exposure based on various factors. These factors include the laws of the country under which the issuer is organized, where the issuer maintains a principal office, the country in which the issuer derives 50% or more of its total revenues and the country that has the primary market for the issuer’s securities, as well as other criteria. Among the other criteria that may be evaluated for making this determination are the country in which the issuer maintains 50% or more of its assets, the type of security, financial guarantees and enhancements, the nature of the collateral and the sponsor organization. Country of issuer and/or credit risk exposure has been determined to be the United States of America, unless otherwise noted. |
| D. | | Distributions — Distributions from income and net realized capital gain, if any, are generally paid to separate accounts of participating insurance companies annually and recorded on ex-dividend date. |
| E. | | Federal Income Taxes — The Fund intends to comply with the requirements of Subchapter M of the Internal Revenue Code necessary to qualify as a regulated investment company and to distribute substantially all of the Fund’s taxable earnings to shareholders. As such, the Fund will not be subject to federal income taxes on otherwise taxable income (including net realized capital gain) that is distributed to shareholders. Therefore, no provision for federal income taxes is recorded in the financial statements. |
Invesco V.I. High Yield Securities Fund
| | |
| | The Fund files tax returns in the U.S. Federal jurisdiction and certain other jurisdictions. Generally, the Fund is subject to examinations by such taxing authorities for up to three years after the filing of the return for the tax period. |
| F. | | Expenses — Fees provided for under the Rule 12b-1 plan of a particular class of the Fund and which are directly attributable to that class are charged to the operations of such class. All other expenses are allocated among the classes based on relative net assets. |
| G. | | Accounting Estimates — The preparation of financial statements in conformity with accounting principles generally accepted in the United States of America (“GAAP”) requires management to make estimates and assumptions that affect the reported amounts of assets and liabilities at the date of the financial statements and the reported amounts of revenues and expenses during the reporting period including estimates and assumptions related to taxation. Actual results could differ from those estimates by a significant amount. In addition, the Fund monitors for material events or transactions that may occur or become known after the period-end date and before the date the financial statements are released to print. |
| H. | | Indemnifications — Under the Trust’s organizational documents, each Trustee, officer, employee or other agent of the Trust is indemnified against certain liabilities that may arise out of performance of their duties to the Fund. Additionally, in the normal course of business, the Fund enters into contracts, including the Fund’s servicing agreements that contain a variety of indemnification clauses. The Fund’s maximum exposure under these arrangements is unknown as this would involve future claims that may be made against the Fund that have not yet occurred. The risk of material loss as a result of such indemnification claims is considered remote. |
| I. | | Foreign Currency Translations — Foreign currency is valued at the close of the NYSE based on quotations posted by banks and major currency dealers. Portfolio securities and other assets and liabilities denominated in foreign currencies are translated into U.S. dollar amounts at date of valuation. Purchases and sales of portfolio securities (net of foreign taxes withheld on disposition) and income items denominated in foreign currencies are translated into U.S. dollar amounts on the respective dates of such transactions. The Fund does not separately account for the portion of the results of operations resulting from changes in foreign exchange rates on investments and the fluctuations arising from changes in market prices of securities held. The combined results of changes in foreign exchange rates and the fluctuation of market prices on investments (net of estimated foreign tax withholding) are included with the net realized and unrealized gain or loss from investments in the Statement of Operations. Reported net realized foreign currency gains or losses arise from (1) sales of foreign currencies, (2) currency gains or losses realized between the trade and settlement dates on securities transactions, and (3) the difference between the amounts of dividends, interest, and foreign withholding taxes recorded on the Fund’s books and the U.S. dollar equivalent of the amounts actually received or paid. Net unrealized foreign currency gains and losses arise from changes in the fair values of assets and liabilities, other than investments in securities at fiscal period end, resulting from changes in exchange rates. |
| | The Fund may invest in foreign securities which may be subject to foreign taxes on income, gains on investments or currency repatriation, a portion of which may be recoverable. |
| J. | | Foreign Currency Contracts — The Fund may enter into foreign currency contracts to manage or minimize currency or exchange rate risk. The Fund may also enter into foreign currency contracts for the purchase or sale of a security denominated in a foreign currency in order to “lock in” the U.S. dollar price of that security. A foreign currency contract is an obligation to purchase or sell a specific currency for an agreed-upon price at a future date. The use of foreign currency contracts does not eliminate fluctuations in the price of the underlying securities the Fund owns or intends to acquire but establishes a rate of exchange in advance. Fluctuations in the value of these contracts are measured by the difference in the contract date and reporting date exchange rates and are recorded as unrealized appreciation (depreciation) until the contracts are closed. When the contracts are closed, realized gains (losses) are recorded. Realized and unrealized gains (losses) on the contracts are included in the Statement of Operations. The primary risks associated with foreign currency contracts include failure of the counterparty to meet the terms of the contract and the value of the foreign currency changing unfavorably. These risks may be in excess of the amounts reflected in the Statement of Assets and Liabilities. |
NOTE 2—Advisory Fees and Other Fees Paid to Affiliates
The Trust has entered into a master investment advisory agreement with Invesco Advisers, Inc. (the “Adviser” or “Invesco”). Under the terms of the investment advisory agreement, the Fund pays an advisory fee to the Adviser based on the annual rate of the Fund’s average daily net assets as follows:
| | | | | |
| Average Net Assets | | Rate |
| |
| First $500 million | | | 0 | .42% |
| |
| Next $250 million | | | 0 | .345% |
| |
| Next $250 million | | | 0 | .295% |
| |
| Next $1 billion | | | 0 | .27% |
| |
| Next $1 billion | | | 0 | .245% |
| |
| Over $3 billion | | | 0 | .22% |
| |
Under the terms of a master sub-advisory agreement between the Adviser and each of Invesco Asset Management Deutschland GmbH, Invesco Asset Management Limited, Invesco Asset Management (Japan) Limited, Invesco Australia Limited, Invesco Hong Kong Limited, Invesco Senior Secured Management, Inc. and Invesco Canada Ltd. (collectively, the “Affiliated Sub-Advisers”) the Adviser, not the Fund, may pay 40% of the fees paid to the Adviser to any such Affiliated Sub-Adviser(s) that provide discretionary investment management services to the Fund based on the percentage of assets allocated to such Sub-Adviser(s).
The Adviser has contractually agreed, through at least June 30, 2012, to waive advisory fees and/or reimburse expenses of all shares to the extent necessary to limit total annual fund operating expenses after fee waiver and/or expense reimbursement (excluding certain items discussed below) of Series I shares to 1.75% and Series II shares to 2.00% of average daily net assets. In determining the Adviser’s obligation to waive advisory fees and/or reimburse expenses, the following expenses are not taken into account, and could cause the total annual fund operating expenses after fee waiver and/or expense reimbursement to exceed the numbers reflected above: (1) interest; (2) taxes; (3) dividend expense on short sales; (4) extraordinary or non-routine items, including litigation expenses; and
Invesco V.I. High Yield Securities Fund
(5) expenses that the Fund has incurred but did not actually pay because of an expense offset arrangement. Unless the Board of the Trustees and Invesco mutually agree to amend or continue the fee waiver agreement, it will terminate on June 30, 2012. The Adviser did not waive fees and/or reimburse expenses during the period under this expense limitation.
Further, the Adviser has contractually agreed, through at least June 30, 2012, to waive the advisory fee payable by the Fund in an amount equal to 100% of the net advisory fees the Adviser receives from the affiliated money market funds on investments by the Fund of uninvested cash in such affiliated money market funds.
For the year ended December 31, 2011, the Adviser waived advisory fees of $269.
The Trust has entered into a master administrative services agreement with Invesco pursuant to which the Fund has agreed to pay Invesco a fee for costs incurred in providing accounting services and fund administrative services to the Fund and to reimburse Invesco for administrative services fees paid to insurance companies that have agreed to provide services to the participants of separate accounts. These administrative services provided by the insurance companies may include, among other things: the printing of prospectuses, financial reports and proxy statements and the delivery of the same to existing participants; the maintenance of master accounts; the facilitation of purchases and redemptions requested by the participants; and the servicing of participants’ accounts. Pursuant to such agreement, for the year ended December 31, 2011, Invesco was paid $50,000 for accounting and fund administrative services and reimbursed $27,372 for services provided by insurance companies.
The Trust has entered into a transfer agency and service agreement with Invesco Investment Services, Inc. (“IIS”) pursuant to which the Fund has agreed to pay IIS a fee for providing transfer agency and shareholder services to the Fund and reimburse IIS for certain expenses incurred by IIS in the course of providing such services. For the year ended December 31, 2011, expenses incurred under the agreement are shown in the Statement of Operations as transfer agent fees.
The Trust has entered into a master distribution agreement with Invesco Distributors, Inc. (“IDI”) to serve as the distributor for the Fund. The Trust has adopted a plan pursuant to Rule 12b-1 under the 1940 Act with respect to the Fund’s Series II shares (the “Plan”). The Fund, pursuant to the Plan, pays IDI compensation at the annual rate of 0.25% of the Fund’s average daily net assets of Series II shares. Of the Plan payments, up to 0.25% of the average daily net assets of the Series II shares may be paid to insurance companies who furnish continuing personal shareholder services to customers who purchase and own Series II shares of the Fund. For the year ended December 31, 2011, expenses incurred under the Plan are detailed in the Statement of Operations as distribution fees.
Certain officers and trustees of the Trust are officers and directors of the Adviser, IIS and/or IDI.
NOTE 3—Additional Valuation Information
GAAP defines fair value as the price that would be received to sell an asset or paid to transfer a liability in an orderly transaction between market participants at the measurement date, under current market conditions. GAAP establishes a hierarchy that prioritizes the inputs to valuation methods giving the highest priority to readily available unadjusted quoted prices in an active market for identical assets (Level 1) and the lowest priority to significant unobservable inputs (Level 3) generally when market prices are not readily available or are unreliable. Based on the valuation inputs, the securities or other investments are tiered into one of three levels. Changes in valuation methods may result in transfers in or out of an investment’s assigned level:
| | |
| | Level 1 — | Prices are determined using quoted prices in an active market for identical assets. |
| | Level 2 — | Prices are determined using other significant observable inputs. Observable inputs are inputs that other market participants may use in pricing a security. These may include quoted prices for similar securities, interest rates, prepayment speeds, credit risk, yield curves, loss severities, default rates, discount rates, volatilities and others. |
| | Level 3 — | Prices are determined using significant unobservable inputs. In situations where quoted prices or observable inputs are unavailable (for example, when there is little or no market activity for an investment at the end of the period), unobservable inputs may be used. Unobservable inputs reflect the Fund’s own assumptions about the factors market participants would use in determining fair value of the securities or instruments and would be based on the best available information. |
The following is a summary of the tiered valuation input levels, as of December 31, 2011. The level assigned to the securities valuations may not be an indication of the risk or liquidity associated with investing in those securities. Because of the inherent uncertainties of valuation, the values reflected in the financial statements may materially differ from the value received upon actual sale of those investments.
During the year ended December 31, 2011, there were no significant transfers between investment levels.
| | | | | | | | | | | | | | | | | |
| | | Level 1 | | Level 2 | | Level 3 | | Total |
| |
| Equity Securities | | $ | 657,609 | | | $ | 189,264 | | | $ | — | | | $ | 846,873 | |
| |
| Corporate Debt Securities | | | — | | | | 22,357,438 | | | | 2,532 | | | | 22,359,970 | |
| |
| Foreign Debt Securities | | | — | | | | 1,781,165 | | | | — | | | | 1,781,165 | |
| |
| | | $ | 657,609 | | | $ | 24,327,867 | | | $ | 2,532 | | | $ | 24,988,008 | |
| |
| Foreign Currency Contracts* | | | — | | | | 101,990 | | | | — | | | | 101,990 | |
| |
| Total Investments | | $ | 657,609 | | | $ | 24,429,857 | | | $ | 2,532 | | | $ | 25,089,998 | |
| |
| |
| * | Unrealized appreciation. |
Invesco V.I. High Yield Securities Fund
NOTE 4—Derivative Investments
Value of Derivative Instruments at Period-End
The table below summarizes the value of the Fund’s derivative instruments, detailed by primary risk exposure, held as of December 31, 2011:
| | | | | | | | | |
| | | Value |
| Risk Exposure/Derivative Type | | Assets | | Liabilities |
| |
Currency risk(a) | | | | | | | | |
| Foreign Currency Contracts | | $ | 101,990 | | | $ | — | |
| |
| | |
| (a) | | Values are disclosed on the Statement of Assets and Liabilities under the Foreign currency contracts outstanding. |
Effect of Derivative Instruments for the year ended December 31, 2011
The table below summarizes the gains (losses) on derivative instruments, detailed by primary risk exposure, recognized in earnings during the period:
| | | | | |
| | | Location of Gain (Loss) on
|
| | | Statement of Operations |
| | | Foreign Currency
|
| | | Contracts* |
| |
| Realized Gain (Loss) | | | | |
| Currency risk | | $ | (36,120 | ) |
| |
| Change in Unrealized Appreciation | | | | |
| Currency risk | | | 101,990 | |
| |
| Total | | $ | 65,870 | |
| |
| |
| * | The average notional value of foreign currency contracts outstanding during the period was $2,500,017. |
| | | | | | | | | | | | | | | | | | | | | | | |
| Open Foreign Currency Contracts |
Settlement
| | | | Contract to | | Notional
| | Unrealized
|
| Date | | Counterparty | | Deliver | | Receive | | Value | | Appreciation |
| |
| 02/09/12 | | RBC Capital Markets Corp. | | EUR | | | 1,176,000 | | | USD | | | 1,619,024 | | | $ | 1,522,639 | | | $ | 96,385 | |
| |
| 02/17/12 | | Morgan Stanley | | GBP | | | 182,000 | | | USD | | | 288,193 | | | | 282,588 | | | | 5,605 | |
| |
| Total open foreign currency contracts | | | | | | | | | | | | | | | | | | | | $ | 101,990 | |
| |
| | | | | | | | | | | | | | | | | | | | | | | |
| | | | | | | | | | | | | | | | | | | | | | | |
| Closed Foreign Currency Contracts |
Closed
| | | | Contract to | | Notional
| | Realized
|
| Date | | Counterparty | | Deliver | | Receive | | Value | | Gain |
| |
| 11/21/11 | | RBC Capital Markets Corp. | | EUR | | | 56,000 | | | USD | | | 77,096 | | | $ | 75,836 | | | $ | 1,260 | |
| |
| 11/25/11 | | RBC Capital Markets Corp. | | EUR | | | 184,000 | | | USD | | | 253,317 | | | | 244,681 | | | | 8,636 | |
| |
| 11/29/11 | | RBC Capital Markets Corp. | | EUR | | | 82,000 | | | USD | | | 112,891 | | | | 109,326 | | | | 3,565 | |
| |
| 12/15/11 | | RBC Capital Markets Corp. | | EUR | | | 37,000 | | | USD | | | 50,939 | | | | 48,110 | | | | 2,829 | |
| |
| 12/22/11 | | Morgan Stanley | | GBP | | | 1,000 | | | USD | | | 1,583 | | | | 1,567 | | | | 16 | |
| |
| 12/22/11 | | RBC Capital Markets Corp. | | EUR | | | 10,000 | | | USD | | | 13,767 | | | | 13,068 | | | | 699 | |
| |
| Total closed foreign currency contracts | | | | | | | | | | | | | | | | | | | | $ | 17,005 | |
| |
| Total foreign currency contracts | | | | | | | | | | | | | | | | | | | | $ | 118,995 | |
| |
| | | |
| Currency Abbreviations: |
| EUR | | – Euro |
| GBP | | – British Pound Sterling |
| USD | | – U.S. Dollar |
NOTE 5—Trustees’ and Officers’ Fees and Benefits
“Trustees’ and Officers’ Fees and Benefits” include amounts accrued by the Fund to pay remuneration to certain Trustees and Officers of the Fund. Trustees have the option to defer compensation payable by the Fund, and “Trustees’ and Officers’ Fees and Benefits” also include amounts accrued by the Fund to fund such deferred compensation amounts. Those Trustees who defer compensation have the option to select various Invesco Funds in which their deferral accounts shall be deemed to be invested. Finally, certain current Trustees are eligible to participate in a retirement plan that provides for benefits to be paid upon retirement to Trustees over a period of time based on the number of years of service. The Fund may have certain former Trustees who also participate in a retirement plan and receive benefits under such plan. “Trustees’ and Officers’ Fees and Benefits” include amounts accrued by the Fund to fund such retirement benefits. Obligations under the deferred compensation and retirement plans represent unsecured claims against the general assets of the Fund.
During the year ended December 31, 2011, the Fund paid legal fees of $1,158 for services rendered by Kramer, Levin, Naftalis & Frankel LLP as counsel to the Independent Trustees. A partner of that firm is a Trustee of the Trust.
Invesco V.I. High Yield Securities Fund
NOTE 6—Cash Balances
The Fund is permitted to temporarily carry a negative or overdrawn balance in its account with State Street Bank and Trust Company, the custodian bank. To compensate the custodian bank for such overdrafts, the overdrawn Fund may either (1) leave funds as a compensating balance in the account so the custodian bank can be compensated by earning the additional interest; or (2) compensate by paying the custodian bank at a rate agreed upon by the custodian bank and Invesco, not to exceed the contractually agreed upon rate.
NOTE 7—Distributions to Shareholders and Tax Components of Net Assets
Tax Character of Distributions to Shareholders Paid During the Years Ended December 31, 2011 and 2010:
| | | | | | | | | |
| | | 2011 | | 2010 |
| |
| Ordinary income | | $ | 2,252,597 | | | $ | 2,648,692 | |
| |
Tax Components of Net Assets at Period-End:
| | | | | |
| | | 2011 |
| |
| Undistributed ordinary income | | $ | 1,838,811 | |
| |
| Net unrealized appreciation (depreciation) — investments | | | (8,286,459 | ) |
| |
| Net unrealized appreciation (depreciation) — other investments | | | (1,372 | ) |
| |
| Temporary book/tax differences | | | (6,862 | ) |
| |
| Capital loss carryforward | | | (102,210,421 | ) |
| |
| Shares of beneficial interest | | | 134,321,802 | |
| |
| Total net assets | | $ | 25,655,499 | |
| |
The difference between book-basis and tax-basis unrealized appreciation (depreciation) is due to differences in the timing of recognition of gains and losses on investments for tax and book purposes. The Fund’s net unrealized appreciation (depreciation) difference is attributable primarily to wash sales.
The temporary book/tax differences are a result of timing differences between book and tax recognition of income and/or expenses. The Fund’s temporary book/tax differences are the result of the trustee deferral of compensation and retirement plan benefits.
Capital loss carryforward is calculated and reported as of a specific date. Results of transactions and other activity after that date may affect the amount of capital loss carryforward actually available for the Fund to utilize. The Regulated Investment Company Modernization Act of 2010 (the “Act”) eliminated the eight-year carryover period for capital losses that arise in taxable years beginning after its enactment date of December 22, 2010. Consequently, these capital losses can be carried forward for an unlimited period. However, capital losses with an expiration period may not be used to offset capital gains until all net capital losses without an expiration date have been utilized. Additionally, post-enactment capital loss carryovers will retain their character as either short-term or long-term capital losses instead of as short-term capital losses as under prior law. The ability to utilize capital loss carryforward in the future may be limited under the Internal Revenue Code and related regulations based on the results of future transactions.
The Fund utilized $1,148,876 of capital loss carryforward in the current period to offset net realized capital gain for federal income tax purposes. The Fund has a capital loss carryforward as of December 31, 2011, which expires as follows:
| | | | | | | | | | | | | |
| Capital Loss Carryforward* |
| Expiration | | Short-Term | | Long-Term | | Total |
| |
| December 31, 2012 | | $ | 24,097,705 | | | $ | — | | | $ | 24,097,705 | |
| |
| December 31, 2013 | | | 15,736,680 | | | | — | | | | 15,736,680 | |
| |
| December 31, 2014 | | | 6,219,062 | | | | — | | | | 6,219,062 | |
| |
| December 31, 2016 | | | 1,794,343 | | | | — | | | | 1,794,343 | |
| |
| December 31, 2017 | | | 10,401,018 | | | | — | | | | 10,401,018 | |
| |
| December 31, 2018 | | | 43,961,613 | | | | — | | | | 43,961,613 | |
| |
| | | $ | 102,210,421 | | | $ | — | | | $ | 102,210,421 | |
| |
| |
| * | Capital loss carryforward as of the date listed above is reduced for limitations, if any, to the extent required by the Internal Revenue Code. |
Invesco V.I. High Yield Securities Fund
NOTE 8—Investment Securities
The aggregate amount of investment securities (other than short-term securities, U.S. Treasury obligations and money market funds, if any) purchased and sold by the Fund during the year ended December 31, 2011 was $18,124,189 and $22,992,846, respectively. Cost of investments on a tax basis includes the adjustments for financial reporting purposes as of the most recently completed Federal income tax reporting period-end.
| | | | | |
| Unrealized Appreciation (Depreciation) of Investment Securities on a Tax Basis |
| |
| Aggregate unrealized appreciation of investment securities | | $ | 634,602 | |
| |
| Aggregate unrealized (depreciation) of investment securities | | | (8,921,061 | ) |
| |
| Net unrealized appreciation (depreciation) of investment securities | | $ | (8,286,459 | ) |
| |
| Cost of investments for tax purposes is $33,274,467. |
NOTE 9—Reclassification of Permanent Differences
Primarily as a result of differing book/tax treatment of foreign currency transactions and expired capital loss carryforward, on December 31, 2011, undistributed net investment income was increased by $47,031, undistributed net realized gain (loss) was increased by $80,261,734 and shares of beneficial interest decreased by $80,308,765. This reclassification had no effect on the net assets of the Fund.
NOTE 10—Share Information
| | | | | | | | | | | | | | | | | |
| | | Summary of Share Activity |
| |
| | | Year ended December 31, |
| | | 2011(a) | | 2010 |
| | | Shares | | Amount | | Shares | | Amount |
| |
| Sold: | | | | | | | | | | | | | | | | |
| Series I | | | 692,930 | | | $ | 784,581 | | | | 685,783 | | | $ | 764,001 | |
| |
| Series II | | | 139,366 | | | | 158,013 | | | | 598,859 | | | | 659,318 | |
| |
| Issued as reinvestment of dividends: | | | | | | | | | | | | | | | | |
| Series I | | | 1,164,078 | | | | 1,187,359 | | | | 1,272,306 | | | | 1,323,198 | |
| |
| Series II | | | 1,044,351 | | | | 1,065,238 | | | | 1,274,514 | | | | 1,325,494 | |
| |
| Reacquired: | | | | | | | | | | | | | | | | |
| Series I | | | (3,232,497 | ) | | | (3,700,195 | ) | | | (2,886,241 | ) | | | (3,250,300 | ) |
| |
| Series II | | | (3,722,675 | ) | | | (4,272,637 | ) | | | (2,643,132 | ) | | | (2,943,684 | ) |
| |
| Net increase (decrease) in share activity | | | (3,914,447 | ) | | $ | (4,777,641 | ) | | | (1,697,911 | ) | | $ | (2,121,973 | ) |
| |
| | |
| (a) | | There are entities that are record owners of more than 5% of the outstanding shares of the Fund and in the aggregate own 97% of the outstanding shares of the Fund. The Fund and the Fund’s principal underwriter or adviser, are parties to participation agreements with these entities whereby these entities sell units of interest in separate accounts funding variable products that are invested in the Fund. The Fund, Invesco and/or Invesco affiliates may make payments to these entities, which are considered to be related to the Fund, for providing services to the Fund, Invesco and/or Invesco affiliates including but not limited to services such as, securities brokerage, third party record keeping and account servicing and administrative services. The Fund has no knowledge as to whether all or any portion of the shares owned of record by these entities are also owned beneficially. |
Invesco V.I. High Yield Securities Fund
NOTE 11—Financial Highlights
The following schedule presents financial highlights for a share of the Fund outstanding throughout the periods indicated.
| | | | | | | | | | | | | | | | | | | | | | | | | | | | | | | | | | | | | | | | | | | | | | | | | |
| | | | | | | | | | | | | | | | | | | Ratio of
| | Ratio of
| | | | |
| | | | | | | Net gains
| | | | | | | | | | | | expenses
| | expenses
| | | | |
| | | | | | | (losses) on
| | | | | | | | | | | | to average
| | to average net
| | Ratio of net
| | |
| | | Net asset
| | | | securities
| | | | Dividends
| | | | | | | | net assets
| | assets without
| | investment
| | |
| | | value,
| | Net
| | (both
| | Total from
| | from net
| | Net asset
| | | | Net assets,
| | with fee waivers
| | fee waivers
| | income
| | |
| | | beginning
| | investment
| | realized and
| | investment
| | investment
| | value, end
| | Total
| | end of period
| | and/or expenses
| | and/or expenses
| | to average
| | Portfolio
|
| | | of period | | income(a) | | unrealized) | | operations | | income | | of period | | Return(b) | | (000s omitted) | | absorbed | | absorbed | | net assets | | turnover(c) |
| |
| Series I |
| Year ended 12/31/11 | | $ | 1.15 | | | $ | 0.07 | | | $ | (0.06 | ) | | $ | 0.01 | | | $ | (0.10 | ) | | $ | 1.06 | | | | 1.10 | % | | $ | 13,403 | | | | 1.67 | %(d) | | | 1.67 | %(d) | | | 6.24 | %(d) | | | 63 | % |
| Year ended 12/31/10 | | | 1.13 | | | | 0.08 | | | | 0.04 | | | | 0.12 | | | | (0.10 | ) | | | 1.15 | | | | 10.19 | | | | 16,049 | | | | 1.97 | | | | 1.98 | | | | 7.37 | | | | 116 | |
| Year ended 12/31/09 | | | 0.85 | | | | 0.09 | | | | 0.27 | | | | 0.36 | | | | (0.08 | ) | | | 1.13 | | | | 44.56 | | | | 16,824 | | | | 1.74 | (e) | | | 1.75 | (e) | | | 8.76 | (e) | | | 75 | |
| Year ended 12/31/08 | | | 1.13 | | | | 0.07 | | | | (0.33 | ) | | | (0.26 | ) | | | (0.02 | ) | | | 0.85 | | | | (23.13 | ) | | | 13,226 | | | | 1.48 | (e) | | | 1.48 | (e) | | | 6.90 | (e) | | | 44 | |
| Year ended 12/31/07 | | | 1.16 | | | | 0.08 | | | | (0.03 | ) | | | 0.05 | | | | (0.08 | ) | | | 1.13 | | | | 4.17 | | | | 21,625 | | | | 1.18 | | | | 1.18 | | | | 6.48 | | | | 26 | |
| |
| Series II |
| Year ended 12/31/11 | | | 1.15 | | | | 0.07 | | | | (0.06 | ) | | | 0.01 | | | | (0.10 | ) | | | 1.06 | | | | 0.77 | | | | 12,252 | | | | 1.92 | (d) | | | 1.92 | (d) | | | 5.99 | (d) | | | 63 | |
| Year ended 12/31/10 | | | 1.13 | | | | 0.08 | | | | 0.03 | | | | 0.11 | | | | (0.09 | ) | | | 1.15 | | | | 10.36 | | | | 16,128 | | | | 2.22 | | | | 2.23 | | | | 7.12 | | | | 116 | |
| Year ended 12/31/09 | | | 0.85 | | | | 0.08 | | | | 0.28 | | | | 0.36 | | | | (0.08 | ) | | | 1.13 | | | | 44.27 | | | | 16,723 | | | | 1.99 | (e) | | | 2.00 | (e) | | | 8.51 | (e) | | | 75 | |
| Year ended 12/31/08 | | | 1.13 | | | | 0.07 | | | | (0.33 | ) | | | (0.26 | ) | | | (0.02 | ) | | | 0.85 | | | | (23.20 | ) | | | 13,973 | | | | 1.73 | (e) | | | 1.73 | (e) | | | 6.65 | (e) | | | 44 | |
| Year ended 12/31/07 | | | 1.16 | | | | 0.07 | | | | (0.03 | ) | | | 0.04 | | | | (0.07 | ) | | | 1.13 | | | | 3.90 | | | | 24,433 | | | | 1.43 | | | | 1.43 | | | | 6.23 | | | | 26 | |
| |
| | |
| (a) | | Calculated using average shares outstanding. |
| (b) | | Includes adjustments in accordance with accounting principles generally accepted in the United States of America and as such, the net asset value for financial reporting purposes and the returns based upon those net asset values may differ from the net asset value and returns for shareholder transactions. Total returns are not annualized for periods less than one year, if applicable and do not reflect charges assessed in connection with a variable product, which if included would reduce total returns. |
| (c) | | Portfolio turnover is calculated at the fund level and is not annualized for periods less than one year, if applicable. |
| (d) | | Ratios are based on average daily net assets (000’s) of $14,873 and $14,052 for Series I and Series II shares, respectively. |
| (e) | | The ratios reflect the rebate of certain Fund expenses in connection with investments in a Morgan Stanley affiliate during the period. The effect of the ratios are 0.01% and less than 0.005% for the years ended December 31, 2009 and 2008, respectively. |
Invesco V.I. High Yield Securities Fund
Report of Independent Registered Public Accounting Firm
To the Board of Trustees of AIM Variable Insurance Funds (Invesco Variable Insurance Funds)
and Shareholders of Invesco V.I. High Yield Securities Fund:
In our opinion, the accompanying statement of assets and liabilities, including the schedule of investments, and the related statements of operations and of changes in net assets and the financial highlights present fairly, in all material respects, the financial position of Invesco V.I. High Yield Securities Fund (one of the funds constituting AIM Variable Insurance Funds (Invesco Variable Insurance Funds), hereafter referred to as the “Fund”) at December 31, 2011, the results of its operations for the year then ended, and the changes in its net assets and the financial highlights for each of the two years in the period then ended, in conformity with accounting principles generally accepted in the United States of America. These financial statements and financial highlights (hereafter referred to as “financial statements”) are the responsibility of the Fund’s management; our responsibility is to express an opinion on these financial statements based on our audits. We conducted our audits of these financial statements in accordance with the standards of the Public Company Accounting Oversight Board (United States). Those standards require that we plan and perform the audits to obtain reasonable assurance about whether the financial statements are free of material misstatement. An audit includes examining, on a test basis, evidence supporting the amounts and disclosures in the financial statements, assessing the accounting principles used and significant estimates made by management, and evaluating the overall financial statement presentation. We believe that our audits, which included confirmation of securities at December 31, 2011 by correspondence with the custodian and brokers, provide a reasonable basis for our opinion. The financial highlights of the Fund for the periods ended December 31, 2009 and prior were audited by other independent auditors whose report dated February 26, 2010 expressed an unqualified opinion on those financial statements.
PRICEWATERHOUSECOOPERS LLP
February 17, 2012
Houston, Texas
Invesco V.I. High Yield Securities Fund
Calculating your ongoing Fund expenses
Example
As a shareholder of the Fund, you incur ongoing costs, including management fees; distribution and/or service fees (12b-1); and other Fund expenses. This example is intended to help you understand your ongoing costs (in dollars) of investing in the Fund and to compare these costs with ongoing costs of investing in other mutual funds. The example is based on an investment of $1,000 invested at the beginning of the period and held for the entire period July 1, 2011 through December 31, 2011.
The actual and hypothetical expenses in the examples below do not represent the effect of any fees or other expenses assessed in connection with a variable product; if they did, the expenses shown would be higher while the ending account values shown would be lower.
Actual expenses
The table below provides information about actual account values and actual expenses. You may use the information in this table, together with the amount you invested, to estimate the expenses that you paid over the period. Simply divide your account value by $1,000 (for example, an $8,600 account value divided by $1,000 = 8.6), then multiply the result by the number in the table under the heading entitled “Actual Expenses Paid During Period” to estimate the expenses you paid on your account during this period.
Hypothetical example for comparison purposes
The table below also provides information about hypothetical account values and hypothetical expenses based on the Fund’s actual expense ratio and an assumed rate of return of 5% per year before expenses, which is not the Fund’s actual return.
The hypothetical account values and expenses may not be used to estimate the actual ending account balance or expenses you paid for the period. You may use this information to compare the ongoing costs of investing in the Fund and other funds. To do so, compare this 5% hypothetical example with the 5% hypothetical examples that appear in the shareholder reports of the other funds.
Please note that the expenses shown in the table are meant to highlight your ongoing costs. Therefore, the hypothetical information is useful in comparing ongoing costs, and will not help you determine the relative total costs of owning different funds.
| | | | | | | | | | | | | | | | | | | | | | | | | | | | | | | |
| | | | | | | | | | HYPOTHETICAL
| | | |
| | | | | | | ACTUAL | | | (5% annual return before expenses) | | | |
| | | | Beginning
| | | Ending
| | | Expenses
| | | Ending
| | | Expenses
| | | Annualized
|
| | | | Account Value
| | | Account Value
| | | Paid During
| | | Account Value
| | | Paid During
| | | Expense
|
| Class | | | (07/01/11) | | | (12/31/11)1 | | | Period2 | | | (12/31/11) | | | Period2 | | | Ratio |
| Series I | | | $ | 1,000.00 | | | | $ | 977.00 | | | | $ | 7.08 | | | | $ | 1,018.05 | | | | $ | 7.22 | | | | | 1.42 | % |
| | | | | | | | | | | | | | | | | | | | | | | | | | | | | | | |
| Series II | | | | 1,000.00 | | | | | 973.80 | | | | | 8.31 | | | | | 1,016.79 | | | | | 8.49 | | | | | 1.67 | |
| | | | | | | | | | | | | | | | | | | | | | | | | | | | | | | |
| |
| 1 | The actual ending account value is based on the actual total return of the Fund for the period July 1, 2011 through December 31, 2011, after actual expenses and will differ from the hypothetical ending account value which is based on the Fund’s expense ratio and a hypothetical annual return of 5% before expenses. |
| 2 | Expenses are equal to the Fund’s annualized expense ratio as indicated above multiplied by the average account value over the period, multiplied by 184/365 to reflect the most recent fiscal half year. |
Invesco V.I. High Yield Securities Fund
Form 1099-DIV, Form 1042-S and other year-end tax information provide shareholders with actual calendar year amounts that should be included in their tax returns. Shareholders should consult their tax advisors.
The following distribution information is being provided as required by the Internal Revenue Code or to meet a specific state’s requirement.
The Fund designates the following amounts or, if subsequently determined to be different, the maximum amount allowable for its fiscal year ended December 31, 2011:
| | | | | |
Federal and State Income Tax | | |
| |
| Corporate Dividends Received Deduction* | | | 0.00% | |
| | |
| | * | The above percentage is based on ordinary income dividends paid to shareholders during the Fund’s fiscal year. |
Invesco V.I. High Yield Securities Fund
Trustees and Officers
The address of each trustee and officer is AIM Variable Insurance Funds (Invesco Variable Insurance Funds) (the “Trust”), 11 Greenway Plaza, Suite 2500, Houston, Texas 77046-1173. The trustees serve for the life of the Trust, subject to their earlier death, incapacitation, resignation, retirement or removal as more specifically provided in the Trust’s organizational documents. Each officer serves for a one year term or until their successors are elected and qualified. Column two below includes length of time served with predecessor entities, if any.
| | | | | | | | | |
| | | | | | | Number of Funds
| | |
Name, Year of Birth and
| | Trustee and/
| | Principal Occupation(s)
| | in Fund Complex
| | Other Directorship(s)
|
| Position(s) Held with the Trust | | or Officer Since | | During Past 5 Years | | Overseen by Trustee | | Held by Trustee |
| | | | | | | | | |
| | | | | | | | | |
| | | | | | | | | |
| Interested Persons | | | | | | | | |
| | | | | | | | | |
| | | | | | | | | |
| | | | | | | | | |
Martin L. Flanagan1 — 1960
Trustee | | 2007 | | Executive Director, Chief Executive Officer and President, Invesco Ltd. (ultimate parent of Invesco and a global investment management firm); Advisor to the Board, Invesco Advisers, Inc. (formerly known as Invesco Institutional (N.A.), Inc.); Trustee, The Invesco Funds; Vice Chair, Investment Company Institute; and Member of Executive Board, SMU Cox School of Business
Formerly: Chairman, Invesco Advisers, Inc. (registered investment adviser); Director, Chairman, Chief Executive Officer and President, IVZ Inc. (holding company), INVESCO Group Services, Inc. (service provider) and Invesco North American Holdings, Inc. (holding company); Director, Chief Executive Officer and President, Invesco Holding Company Limited (parent of Invesco and a global investment management firm); Director, Invesco Ltd.; Chairman, Investment Company Institute and President, Co-Chief Executive Officer, Co-President, Chief Operating Officer and Chief Financial Officer, Franklin Resources, Inc. (global investment management organization) | | 140 | | None |
| | | | | | | | | |
| | | | | | | | | |
| | | | | | | | | |
Philip A. Taylor2 — 1954
Trustee, President and Principal Executive Officer | | 2006 | | Head of North American Retail and Senior Managing Director, Invesco Ltd.; Director, Co-Chairman, Co-President and Co-Chief Executive Officer, Invesco Advisers, Inc. (formerly known as Invesco Institutional (N.A.), Inc.) (registered investment adviser); Director, Chairman, Chief Executive Officer and President, Invesco Management Group, Inc. (formerly Invesco Aim Management Group, Inc.) (financial services holding company); Director and President, INVESCO Funds Group, Inc. (registered investment adviser and registered transfer agent); Director and Chairman, Invesco Investment Services, Inc. (formerly known as Invesco Aim Investment Services, Inc.) (registered transfer agent) and IVZ Distributors, Inc. (formerly known as INVESCO Distributors, Inc.) (registered broker dealer); Director, President and Chairman, Invesco Inc. (holding company) and Invesco Canada Holdings Inc. (holding company); Chief Executive Officer, Invesco Corporate Class Inc. (corporate mutual fund company) and Invesco Canada Fund Inc. (corporate mutual fund company); Director, Chairman and Chief Executive Officer, Invesco Canada Ltd. (formerly known as Invesco Trimark Ltd./Invesco Trimark Ltèe) (registered investment adviser and registered transfer agent); Trustee, President and Principal Executive Officer, The Invesco Funds (other than AIM Treasurer’s Series Trust (Invesco Treasurer’s Series Trust) and Short-Term Investments Trust); Trustee and Executive Vice President, The Invesco Funds (AIM Treasurer’s Series Trust (Invesco Treasurer’s Series Trust) and Short-Term Investments Trust only); Director, Invesco Investment Advisers LLC (formerly known as Van Kampen Asset Management); Director, Chief Executive Officer and President, Van Kampen Exchange Corp. | | 140 | | None |
| | | | | | | | | |
| | | | | | | | | |
| | | | | Formerly: Director and Chairman, Van Kampen Investor Services Inc.: Director, Chief Executive Officer and President, 1371 Preferred Inc. (holding company); and Van Kampen Investments Inc.; Director and President, AIM GP Canada Inc. (general partner for limited partnerships); and Van Kampen Advisors, Inc.; Director and Chief Executive Officer, Invesco Trimark Dealer Inc. (registered broker dealer); Director, Invesco Distributors, Inc. (formerly known as Invesco Aim Distributors, Inc.) (registered broker dealer); Manager, Invesco PowerShares Capital Management LLC; Director, Chief Executive Officer and President, Invesco Advisers, Inc.; Director, Chairman, Chief Executive Officer and President, Invesco Aim Capital Management, Inc.; President, Invesco Trimark Dealer Inc. and Invesco Trimark Ltd./Invesco Trimark Ltèe; Director and President, AIM Trimark Corporate Class Inc. and AIM Trimark Canada Fund Inc.; Senior Managing Director, Invesco Holding Company Limited; Trustee and Executive Vice President, Tax-Free Investments Trust; Director and Chairman, Fund Management Company (former registered broker dealer); President and Principal Executive Officer, The Invesco Funds (AIM Treasurer’s Series Trust (Invesco Treasurer’s Series Trust), Short-Term Investments Trust and Tax-Free Investments Trust only); President, AIM Trimark Global Fund Inc. and AIM Trimark Canada Fund Inc. | | | | |
| | | | | | | | | |
| | | | | | | | | |
| | | | | | | | | |
Wayne W. Whalen3 — 1939
Trustee | | 2010 | | Of Counsel, and prior to 2010, partner in the law firm of Skadden, Arps, Slate, Meagher & Flom LLP, legal counsel to funds in the Fund Complex | | 158 | | Director of the Abraham Lincoln Presidential Library Foundation |
| | | | | | | | | |
| | | | | | | | | |
| | | | | | | | | |
| Independent Trustees | | | | | | | | |
| | | | | | | | | |
| | | | | | | | | |
| | | | | | | | | |
Bruce L. Crockett — 1944
Trustee and Chair | | 1993 | | Chairman, Crockett Technology Associates (technology consulting company) | | 140 | | ACE Limited (insurance company); and Investment Company Institute |
| | | | | Formerly: Director, Captaris (unified messaging provider); Director, President and Chief Executive Officer COMSAT Corporation; and Chairman, Board of Governors of INTELSAT (international communications company) | | | | |
| | | | | | | | | |
| |
| 1 | Mr. Flanagan is considered an interested person of the Trust because he is an officer of the adviser to the Trust, and an officer and a director of Invesco Ltd., ultimate parent of the adviser to the Trust. |
| 2 | Mr. Taylor is considered an interested person of the Trust because he is an officer and a director of the adviser to, and a director of the principal underwriter of, the Trust. |
| 3 | Mr. Whalen is considered an “interested person” (within the meaning of Section 2(a)(19) of the 1940 Act) of certain Funds in the Fund Complex by reason of he and his firm currently providing legal services as legal counsel to such Funds in the Fund Complex. |
Invesco V.I. High Yield Securities Fund
Trustees and Officers—(continued)
The address of each trustee and officer is AIM Variable Insurance Funds (Invesco Variable Insurance Funds) (the “Trust”), 11 Greenway Plaza, Suite 2500, Houston, Texas 77046-1173. The trustees serve for the life of the Trust, subject to their earlier death, incapacitation, resignation, retirement or removal as more specifically provided in the Trust’s organizational documents. Each officer serves for a one year term or until their successors are elected and qualified. Column two below includes length of time served with predecessor entities, if any.
| | | | | | | | | |
| | | | | | | Number of Funds
| | |
Name, Year of Birth and
| | Trustee and/
| | Principal Occupation(s)
| | in Fund Complex
| | Other Directorship(s)
|
| Position(s) Held with the Trust | | or Officer Since | | During Past 5 Years | | Overseen by Trustee | | Held by Trustee |
| | | | | | | | | |
| | | | | | | | | |
| | | | | | | |
Independent Trustees—(continued) | | | | | | |
| | | | | | | | | |
| | | | | | | | | |
| | | | | | | | | |
David C. Arch — 1945
Trustee | | 2010 | | Chairman and Chief Executive Officer of Blistex Inc., a consumer health care products manufacturer. | | 158 | | Member of the Heartland Alliance Advisory Board, a nonprofit organization serving human needs based in Chicago. Board member of the Illinois Manufacturers’ Association. Member of the Board of Visitors, Institute for the Humanities, University of Michigan |
| | | | | | | | | |
| | | | | | | | | |
| | | | | | | | | |
Frank S. Bayley — 1939
Trustee | | 2001 | | Retired
Formerly: Director, Badgley Funds, Inc. (registered investment company) (2 portfolios) and Partner, law firm of Baker & McKenzie
Formerly: Director, Badgley Funds, Inc. (registered investment company) (2 portfolios) and Partner, law firm of Baker & McKenzie | | 140 | | Director and Chairman, C.D. Stimson Company (a real estate investment company) |
| | | | | | | | | |
| | | | | | | | | |
| | | | | | | | | |
James T. Bunch — 1942
Trustee | | 2004 | | Managing Member, Grumman Hill Group LLC (family office private equity management)
Formerly: Founder, Green, Manning & Bunch Ltd. (investment banking firm)(1988-2010); Executive Committee, United States Golf Association; and Director, Policy Studies, Inc. and Van Gilder Insurance Corporation | | 140 | | Vice Chairman, Board of Governors, Western Golf Association/Evans Scholars Foundation and Director, Denver Film Society |
| | | | | | | | | |
| | | | | | | | | |
| | | | | | | | | |
Rodney F. Dammeyer — 1940
Trustee | | 2010 | | President of CAC, LLC, a private company offering capital investment and management advisory services.
Formerly: Prior to January 2004, Director of TeleTech Holdings Inc.; Prior to 2002, Director of Arris Group, Inc.; Prior to 2001, Managing Partner at Equity Group Corporate Investments. Prior to 1995, Vice Chairman of Anixter International. Prior to 1985, experience includes Senior Vice President and Chief Financial Officer of Household International, Inc., Executive Vice President and Chief Financial Officer of Northwest Industries, Inc. and Partner of Arthur Andersen & Co. | | 158 | | Director of Quidel Corporation and Stericycle, Inc. Prior to May 2008, Trustee of The Scripps Research Institute. Prior to February 2008, Director of Ventana Medical Systems, Inc. Prior to April 2007, Director of GATX Corporation. Prior to April 2004, Director of TheraSense, Inc. |
| | | | | | | | | |
| | | | | | | | | |
| | | | | | | | | |
Albert R. Dowden — 1941
Trustee | | 2000 | | Director of a number of public and private business corporations, including the Boss Group, Ltd. (private investment and management); Reich & Tang Funds (5 portfolios) (registered investment company); and Homeowners of America Holding Corporation/ Homeowners of America Insurance Company (property casualty company)
Formerly: Director, Continental Energy Services, LLC (oil and gas pipeline service); Director, CompuDyne Corporation (provider of product and services to the public security market) and Director, Annuity and Life Re (Holdings), Ltd. (reinsurance company); Director, President and Chief Executive Officer, Volvo Group North America, Inc.; Senior Vice President, AB Volvo; Director of various public and private corporations; Chairman, DHJ Media, Inc.; Director Magellan Insurance Company; and Director, The Hertz Corporation, Genmar Corporation (boat manufacturer), National Media Corporation; Advisory Board of Rotary Power International (designer, manufacturer, and seller of rotary power engines); and Chairman, Cortland Trust, Inc. (registered investment company) | | 140 | | Board of Nature’s Sunshine Products, Inc. |
| | | | | | | | | |
| | | | | | | | | |
| | | | | | | | | |
Jack M. Fields — 1952
Trustee | | 1997 | | Chief Executive Officer, Twenty First Century Group, Inc. (government affairs company); and Owner and Chief Executive Officer, Dos Angelos Ranch, L.P. (cattle, hunting, corporate entertainment), Discovery Global Education Fund (non-profit) and Cross Timbers Quail Research Ranch (non-profit)
Formerly: Chief Executive Officer, Texana Timber LP (sustainable forestry company) and member of the U.S. House of Representatives | | 140 | | Administaff |
| | | | | | | | | |
| | | | | | | | | |
| | | | | | | | | |
Carl Frischling — 1937
Trustee | | 1993 | | Partner, law firm of Kramer Levin Naftalis and Frankel LLP | | 140 | | Director, Reich & Tang Funds (16 portfolios) |
| | | | | | | | | |
| | | | | | | | | |
Invesco V.I. High Yield Securities Fund
Trustees and Officers—(continued)
The address of each trustee and officer is AIM Variable Insurance Funds (Invesco Variable Insurance Funds) (the “Trust”), 11 Greenway Plaza, Suite 2500, Houston, Texas 77046-1173. The trustees serve for the life of the Trust, subject to their earlier death, incapacitation, resignation, retirement or removal as more specifically provided in the Trust’s organizational documents. Each officer serves for a one year term or until their successors are elected and qualified. Column two below includes length of time served with predecessor entities, if any.
| | | | | | | | | |
| | | | | | | Number of Funds
| | |
Name, Year of Birth and
| | Trustee and/
| | Principal Occupation(s)
| | in Fund Complex
| | Other Directorship(s)
|
| Position(s) Held with the Trust | | or Officer Since | | During Past 5 Years | | Overseen by Trustee | | Held by Trustee |
| | | | | | | | | |
Independent Trustees—(continued) | | | | | | |
| | | | | | | | | |
| | | | | | | | | |
| | | | | | | | | |
Prema Mathai-Davis — 1950
Trustee | | 1998 | | Retired
Formerly: Chief Executive Officer, YWCA of the U.S.A. | | 140 | | None |
| | | | | | | | | |
| | | | | | | | | |
| | | | | | | | | |
Larry Soll — 1942
Trustee | | 2004 | | Retired
Formerly, Chairman, Chief Executive Officer and President, Synergen Corp. (a biotechnology company) | | 140 | | None |
| | | | | | | | | |
| | | | | | | | | |
| | | | | | | | | |
Hugo F. Sonnenschein — 1940
Trustee | | 2010 | | President Emeritus and Honorary Trustee of the University of Chicago and the Adam Smith Distinguished Service Professor in the Department of Economics at the University of Chicago. Prior to July 2000, President of the University of Chicago. | | 158 | | Trustee of the University of Rochester and a member of its investment committee. Member of the National Academy of Sciences, the American Philosophical Society and a fellow of the American Academy of Arts and Sciences |
| | | | | | | | | |
| | | | | | | | | |
| | | | | | | | | |
| Raymond Stickel, Jr. — 1944 Trustee | | 2005 | | Retired
Formerly: Director, Mainstay VP Series Funds, Inc. (25 portfolios) and Partner, Deloitte & Touche | | 140 | | None |
| | | | | | | | | |
| | | | | | | | | |
| | | | | | | | | |
| Other Officers | | | | | | | | |
| | | | | | | | | |
| | | | | | | | | |
| | | | | | | | | |
Russell C. Burk — 1958
Senior Vice President and Senior Officer | | 2005 | | Senior Vice President and Senior Officer, The Invesco Funds | | N/A | | N/A |
| | | | | | | | | |
| | | | | | | | | |
| | | | | | | | | |
John M. Zerr — 1962
Senior Vice President, Chief Legal Officer and Secretary | | 2006 | | Director, Senior Vice President, Secretary and General Counsel, Invesco Management Group, Inc. (formerly known as Invesco Aim Management Group, Inc.) and Van Kampen Exchange Corp.; Senior Vice President, Invesco Advisers, Inc. (formerly known as Invesco Institutional (N.A.), Inc.) (registered investment adviser); Senior Vice President and Secretary, Invesco Distributors, Inc. (formerly known as Invesco Aim Distributors, Inc.); Director, Vice President and Secretary, Invesco Investment Services, Inc. (formerly known as Invesco Aim Investment Services, Inc.) and IVZ Distributors, Inc. (formerly known as INVESCO Distributors, Inc.); Director and Vice President, INVESCO Funds Group, Inc.; Senior Vice President, Chief Legal Officer and Secretary, The Invesco Funds; Manager, Invesco PowerShares Capital Management LLC; Director, Secretary and General Counsel, Invesco Investment Advisers LLC (formerly known as Van Kampen Asset Management); Secretary and General Counsel, Van Kampen Funds Inc. and Chief Legal Officer, PowerShares Exchange-Traded Fund Trust, PowerShares Exchange-Traded Fund Trust II, PowerShares India Exchange-Traded Fund Trust and PowerShares Actively Managed Exchange-Traded Fund Trust
Formerly: Director and Secretary, Van Kampen Advisors Inc.; Director Vice President, Secretary and General Counsel Van Kampen Investor Services Inc.; Director, Invesco Distributors, Inc. (formerly known as Invesco Aim Distributors, Inc.); Director, Senior Vice President, General Counsel and Secretary, Invesco Advisers, Inc.; and Van Kampen Investments Inc.; Director, Vice President and Secretary, Fund Management Company; Director, Senior Vice President, Secretary, General Counsel and Vice President, Invesco Aim Capital Management, Inc.; Chief Operating Officer and General Counsel, Liberty Ridge Capital, Inc. (an investment adviser); Vice President and Secretary, PBHG Funds (an investment company) and PBHG Insurance Series Fund (an investment company); Chief Operating Officer, General Counsel and Secretary, Old Mutual Investment Partners (a broker-dealer); General Counsel and Secretary, Old Mutual Fund Services (an administrator) and Old Mutual Shareholder Services (a shareholder servicing center); Executive Vice President, General Counsel and Secretary, Old Mutual Capital, Inc. (an investment adviser); and Vice President and Secretary, Old Mutual Advisors Funds (an investment company) | | N/A | | N/A |
| | | | | | | | | |
| | | | | | | | | |
| | | | | | | | | |
Lisa O. Brinkley — 1959
Vice President | | 2004 | | Global Compliance Director, Invesco Ltd.; Chief Compliance Officer, Invesco Investment Services, Inc.(formerly known as Invesco Aim Investment Services, Inc.); and Vice President, The Invesco Funds
Formerly: Chief Compliance Officer, Invesco Distributors, Inc. (formerly known as Invesco Aim Distributors, Inc.) and Van Kampen Investor Services Inc.; Senior Vice President, Invesco Management Group, Inc.; Senior Vice President and Chief Compliance Officer, Invesco Advisers, Inc. and The Invesco Funds; Vice President and Chief Compliance Officer, Invesco Aim Capital Management, Inc. and Invesco Distributors, Inc.; Vice President, Invesco Investment Services, Inc. and Fund Management Company | | N/A | | N/A |
| | | | | | | | | |
Invesco V.I. High Yield Securities Fund
Trustees and Officers—(continued)
The address of each trustee and officer is AIM Variable Insurance Funds (Invesco Variable Insurance Funds) (the “Trust”), 11 Greenway Plaza, Suite 2500, Houston, Texas 77046-1173. The trustees serve for the life of the Trust, subject to their earlier death, incapacitation, resignation, retirement or removal as more specifically provided in the Trust’s organizational documents. Each officer serves for a one year term or until their successors are elected and qualified. Column two below includes length of time served with predecessor entities, if any.
| | | | | | | | | |
| | | | | | | Number of Funds
| | |
Name, Year of Birth and
| | Trustee and/
| | Principal Occupation(s)
| | in Fund Complex
| | Other Directorship(s)
|
| Position(s) Held with the Trust | | or Officer Since | | During Past 5 Years | | Overseen by Trustee | | Held by Trustee |
| | | | | | | | | |
Other Officers—(continued) | | | | | | |
| | | | | | | | | |
| | | | | | | | | |
| | | | | | | | | |
Sheri Morris — 1964
Vice President, Treasurer and Principal Financial Officer | | 1999 | | Vice President, Treasurer and Principal Financial Officer, The Invesco Funds; Vice President, Invesco Advisers, Inc. (formerly known as Invesco Institutional (N.A.), Inc.) (registered investment adviser).
Formerly: Treasurer, PowerShares Exchange-Traded Fund Trust, PowerShares Exchange-Traded Fund Trust II, PowerShares India Exchange-Traded Fund Trust and PowerShares Actively Managed Exchange-Traded Fund Trust, Vice President, Invesco Advisers, Inc., Invesco Aim Capital Management, Inc. and Invesco Aim Private Asset Management, Inc.; Assistant Vice President and Assistant Treasurer, The Invesco Funds and Assistant Vice President, Invesco Advisers, Inc., Invesco Aim Capital Management, Inc. and Invesco Aim Private Asset Management, Inc. | | N/A | | N/A |
| | | | | | | | | |
| | | | | | | | | |
| | | | | | | | | |
Karen Dunn Kelley — 1960
Vice President | | 1993 | | Head of Invesco’s World Wide Fixed Income and Cash Management Group; Senior Vice President, Invesco Management Group, Inc. (formerly known as Invesco Aim Management Group, Inc.) and Invesco Advisers, Inc. (formerly known as Invesco Institutional (N.A.), Inc.) (registered investment adviser); Executive Vice President, Invesco Distributors, Inc. (formerly known as Invesco Aim Distributors, Inc.); Director, Invesco Mortgage Capital Inc.; Vice President, The Invesco Funds (other than AIM Treasurer’s Series Trust (Invesco Treasurer’s Series Trust) and Short-Term Investments Trust); and President and Principal Executive Officer, The Invesco Funds (AIM Treasurer’s Series Trust (Invesco Treasurer’s Series Trust) and Short-Term Investments Trust only).
Formerly: Senior Vice President, Van Kampen Investments Inc.; Vice President, Invesco Advisers, Inc. (formerly known as Invesco Institutional (N.A.), Inc.); Director of Cash Management and Senior Vice President, Invesco Advisers, Inc. and Invesco Aim Capital Management, Inc.; President and Principal Executive Officer, Tax-Free Investments Trust; Director and President, Fund Management Company; Chief Cash Management Officer, Director of Cash Management, Senior Vice President, and Managing Director, Invesco Aim Capital Management, Inc.; Director of Cash Management, Senior Vice President, and Vice President, Invesco Advisers, Inc. and The Invesco Funds (AIM Treasurer’s Series Trust (Invesco Treasurer’s Series Trust), Short-Term Investments Trust and Tax-Free Investments Trust only) | | N/A | | N/A |
| | | | | | | | | |
| | | | | | | | | |
| | | | | | | | | |
Yinka Akinsola — 1977
Anti-Money Laundering Compliance Officer | | 2011 | | Anti-Money Laundering Compliance Officer, Invesco Advisers, Inc. (formerly known as Invesco Institutional (N.A.), Inc.) (registered investment adviser); Invesco Distributors, Inc. (formerly known as Invesco Aim Distributors, Inc.), Invesco Investment Services, Inc. (formerly known as Invesco Aim Investment Services, Inc.), Invesco Management Group, Inc., The Invesco Funds, Invesco Van Kampen Closed-End Funds, Van Kampen Exchange Corp. and Van Kampen Funds Inc. | | N/A | | N/A |
| | | | | | | | | |
| | | | | | | | | |
| | | | | | | | | |
Todd L. Spillane — 1958
Chief Compliance Officer | | 2006 | | Senior Vice President, Invesco Management Group, Inc. (formerly known as Invesco Aim Management Group, Inc.) and Van Kampen Exchange Corp.; Senior Vice President and Chief Compliance Officer, Invesco Advisers, Inc. (registered investment adviser) (formerly known as Invesco Institutional (N.A.), Inc.); Chief Compliance Officer, The Invesco Funds, INVESCO Private Capital Investments, Inc. (holding company) and Invesco Private Capital, Inc. (registered investment adviser); Vice President, Invesco Distributors, Inc. (formerly known as Invesco Aim Distributors, Inc.) and Invesco Investment Services, Inc. (formerly known as Invesco Aim Investment Services, Inc.).
Formerly: Chief Compliance Officer, Invesco Van Kampen Closed-End Funds PowerShares Exchange-Traded Fund Trust, PowerShares Exchange-Traded Fund Trust II, PowerShares India Exchange-Traded Fund Trust, and PowerShares Actively Managed Exchange-Traded Fund Trust; Senior Vice President, Van Kampen Investments Inc.; Senior Vice President and Chief Compliance Officer, Invesco Advisers, Inc. and Invesco Aim Capital Management, Inc.; Chief Compliance Officer, Invesco Global Asset Management (N.A.), Inc., Invesco Senior Secured Management, Inc. (registered investment adviser) and Van Kampen Investor Services Inc.; Vice President, Invesco Aim Capital Management, Inc. and Fund Management Company | | N/A | | N/A |
| | | | | | | | | |
The Statement of Additional Information of the Trust includes additional information about the Fund’s Trustees and is available upon request, without charge, by calling 1.800.959.4246. Please refer to the Fund’s prospectus for information on the Fund’s sub-advisers.
| | | | | | | |
Office of the Fund
11 Greenway Plaza, Suite 2500
Houston, TX 77046-1173 | | Investment Adviser
Invesco Advisers, Inc.
1555 Peachtree Street, N.E.
Atlanta, GA 30309 | | Distributor
Invesco Distributors, Inc.
11 Greenway Plaza, Suite 2500
Houston, TX 77046-1173 | | Auditors
PricewaterhouseCoopers LLP
1201 Louisiana Street, Suite 2900
Houston, TX 77002-5678 |
| | | | | | | |
| | | | | | | |
Counsel to the Fund
Stradley Ronon Stevens & Young, LLP
2600 One Commerce Square
Philadelphia, PA 19103 | | Counsel to the Independent Trustees
Kramer, Levin, Naftalis & Frankel LLP
1177 Avenue of the Americas
New York, NY 10036-2714 | | Transfer Agent
Invesco Investment Services, Inc.
11 Greenway Plaza, Suite 2500
Houston, TX77046-1173 | | Custodian
State Street Bank and Trust Company
225 Franklin
Boston, MA 02110-2801 |
Invesco V.I. High Yield Securities Fund
Invesco V.I. International Growth FundAnnual Report to Shareholders § December 31, 2011The Fund provides a complete list of its holdings four times in each fiscal year, at the quarter-ends. For the second and fourth quarters, the lists appear in the Fund’s semiannual and annual reports to shareholders. For the first and third quarters, the Fund files the lists with the Securities and Exchange Commission (SEC) on Form N-Q. The Fund’s Form N-Q filings are available on the SEC website, sec.gov. Copies of the Fund’s Forms N-Q may be reviewed and copied at the SEC Public Reference Room in Washington, D.C. You can obtain information on the operation of the Public Reference Room, including information about duplicating fee charges, by calling 202 551 8090 or 800 732 0330, or by electronic request at the following email address: publicinfo@sec.gov. The SEC file numbers for the Fund are 811-07452 and 033-57340. The Fund’s most recent portfolio holdings, as filed on Form N-Q, have also been made available to insurance companies issuing variable annuity contracts and variable life insurance policies (“variable products”) that invest in the Fund.
A description of the policies and procedures that the Fund uses to determine how to vote proxies relating to portfolio securities is available without charge, upon request, from our Client Services department at 800 959 4246 or at invesco.com/proxyguidelines. The information is also available on the SEC website, sec.gov.
Information regarding how the Fund voted proxies related to its portfolio securities during the 12 months ended June 30, 2011, is available at invesco.com/proxysearch. The information is also available on the SEC website, sec.gov.
Invesco Advisers, Inc. is an investment adviser; it provides investment advisory services to individual and institutional clients and does not sell securities. Invesco Distributors, Inc. is the U.S. distributor for Invesco Ltd.’s retail mutual funds, exchange-traded funds and institutional money market funds. Both are wholly owned, indirect subsidiaries of Invesco Ltd.
This report must be accompanied or preceded by a currently effective Fund prospectus and variable product prospectus, which contain more complete information, including sales charges and expenses. Investors should read each carefully before investing.
Invesco Distributors, Inc.
VIIGR-AR-1
| | | | | |
|
| | | | | |
NOT FDIC INSURED | | MAY LOSE VALUE | | NO BANK GUARANTEE |
Management’s Discussion of Fund Performance
Performance summary
Global equity markets faced headwinds in 2011. China’s growth continued to slow as the U.S. battled high unemployment and runaway deficits. Several European countries faced similar deficits, which brought to light the imperfect structure of the euro. The reporting period ended with a market upswing, however, as European leaders took steps to address the Greek sovereign debt issue and stabilize their banking system.
Invesco V.I. International Growth Fund was not immune to this volatility, closing the year ended December 31, 2011, in negative territory. The Fund’s relative results were favorable, however, with the Fund outperforming the Fund’s style-specific benchmark, the MSCI EAFE Growth Index.
Your Fund’s long-term performance appears later in this report.
Fund vs. Indexes
Total returns, 12/31/10 to 12/31/11, excluding variable product issuer charges. If variable product issuer charges were included, returns would be lower.
| | | | | |
|
| Series I Shares | | | -6.74 | % |
| |
| Series II Shares | | | -6.99 | |
| |
MSCI EAFE Index ▼ (Broad Market Index) | | | -12.14 | |
| |
MSCI EAFE Growth Index▼ (Style-Specific Index) | | | -12.11 | |
| |
Lipper VUF International Growth Funds Index▼ (Peer Group Index) | | | -13.10 | |
Source(s): ▼Lipper Inc.
How we invest
When selecting stocks for your Fund, we use a disciplined investment strategy that emphasizes fundamental research, supported by both quantitative analysis and portfolio construction techniques. Our earnings, quality, valuation (EQV) strategy focuses primarily on identifying quality companies that have experienced, or exhibit the potential for, accelerated or above-average earnings growth, but their stock prices have not fully reflected these attributes.
While research responsibilities within the portfolio management team are focused by geographic region, we select investments for the Fund using a bottom-up investment approach, which means we construct the Fund primarily on a stock-by-stock basis. We focus on the strengths of individual companies rather than sectors, countries or market-cap trends.
We believe disciplined sell decisions are
key to successful investing. We consider selling a stock for one of the following reasons:
| n | | A company’s fundamentals deteriorate, or it posts disappointing earnings. |
| |
| n | | A stock’s price seems overvalued. |
| |
| n | | A more attractive opportunity becomes available. |
Market conditions and your Fund
Market volatility was intense during the reporting period. During mid-2011, Greek sovereign debt concerns and signs of slowing global growth continued to worry investors. In addition, numerous world events caught investors’ attention, including the growing unrest in the Middle East and northern Africa, and the devastating earthquake and tsunami in Japan in March. Renewed credit problems overseas and the market correction that occurred mid-year created a more uncertain environment, which prompted
many investors to favor safety over risk.
In this environment, we continued to manage the Fund’s portfolio with a long-term view and a bottom-up approach (i.e., selecting stocks on an individual basis). From a sector perspective, the Fund fared better than its style-specific benchmark in six of 10 sectors, significantly outperforming in the consumer discretionary, materials and financials sectors. In each instance, strong stock selection played a key role in driving results. A modest cash exposure during the volatile reporting period was supportive on a relative basis as well.
In the consumer discretionary sector, favorable stock selection in the retail industry and the hotels, restaurants and leisure industry contributed positively to both relative and absolute results. Top stock level contributors included U.K. retailer Next. Zero exposure to several weak index names, including Sony and Panasonic (not Fund holdings) in the household durables industry, was supportive on a relative basis as well.
In financials, the reporting period’s weakest sector, stock selection combined with underweight exposure, drove the Fund’s relative results. As noted previously, the European sovereign debt situation was the focal point of investor concern through most of the reporting period, and we believe it will remain a key issue for markets entering 2012. Notably, the Fund ended the reporting period with limited direct exposure to companies based in Portugal, Ireland, Italy, Greece or Spain. (The Fund did hold two U.K. companies incorporated in Ireland for tax purposes.)
In the materials sector, the Fund’s continued underweight exposure to a sector that was down almost 20%1 for the reporting period, was a key driver of relative outperformance versus the index. At the end of the reporting period,
Portfolio Composition
By sector
| | | | | |
|
| Consumer Discretionary | | | 18.0 | % |
| |
| Consumer Staples | | | 14.1 | |
| |
| Health Care | | | 11.3 | |
| |
| Energy | | | 10.1 | |
| |
| Information Technology | | | 10.1 | |
| |
| Industrials | | | 9.6 | |
| |
| Financials | | | 9.5 | |
| |
| Telecommunication Services | | | 4.0 | |
| |
| Materials | | | 3.6 | |
| |
| Utilities | | | 1.6 | |
| |
Money Market Funds | | | | |
Plus Other Assets Less Liabilities | | | 8.1 | |
Top 10 Equity Holdings*
| | | | | | | | | |
|
| | 1. | | Compass Group PLC | | | 2.3 | % |
| |
| | 2. | | Imperial Tobacco Group PLC | | | 2.1 | |
| |
| | 3. | | Anheuser-Busch InBev N.V. | | | 1.9 | |
| |
| | 4. | | Canon, Inc. | | | 1.8 | |
| |
| | 5. | | Teva Pharmaceutical Industries Ltd. | | | 1.7 | |
| |
| | 6. | | Yamada Denki Co., Ltd. | | | 1.7 | |
| |
| | 7. | | Banco Bradesco S.A. | | | 1.7 | |
| |
| | 8. | | Novartis AG | | | 1.7 | |
| |
| | 9. | | BG Group PLC | | | 1.6 | |
| |
| | 10. | | British American Tobacco PLC | | | 1.6 | |
Top Five Industries
| | | | | | | | | |
|
| | 1. | | Pharmaceuticals | | | 8.4 | % |
| |
| | 2. | | Integrated Oil & Gas | | | 7.9 | |
| |
| | 3. | | Diversified Banks | | | 6.2 | |
| |
| | 4. | | Packaged Foods & Meats | | | 4.2 | |
| |
| | 5. | | Tobacco | | | 3.7 | |
| | | | | |
|
| Total Net Assets | | $1.2 billion | |
| | | | | |
| Total Number of Holdings* | | | 85 | |
The Fund’s holdings are subject to change, and there is no assurance that the Fund will continue to hold any particular security.
*Excluding money market fund holdings.
Invesco V.I. International Growth Fund
the Fund held approximately 4% of its total net assets in this sector while the MSCI EAFE Growth Index held close to 14%.2
In contrast, underweight exposure to consumer staples, the reporting period’s strongest performing sector, also detracted from relative Fund results. However, solid stock selection enabled the Fund to deliver double-digit gains, outperforming the style-specific index within this sector despite our underweight position.
Fund holdings in the telecommunication services sector (predominantly in the wireless industry) detracted from the Fund’s relative and absolute results. Mexican telecommunications company America Movil was one such detractor. Concerns about increased competition and rising regulatory risk in Mexico weighed on the stock price. We reduced the Fund’s position in America Movil over the reporting period. Fund exposure in the information technology (IT) sector detracted on a relative basis as well, but the impact was modest.
In broad geographic terms, the Fund outperformed the MSCI EAFE Growth Index in both Europe and Asia. Outperformance in Europe was led by strong results in the U.K., which at about 20%, was the Fund’s largest single country exposure. All five top stock level contributors were U.K.-based holdings, including Imperial Tobacco Group and Shire.
In Asia, the Fund’s exposure to Japan was the key driver of relative results. In Japan, the effects of the March earthquake and tsunami have largely passed, and production levels returned to normal. However, Japan faced the effects of a new natural disaster with flooding in Thailand; Japanese manufacturers use Thailand as a production hub. The yen’s continued strength and weak export numbers to the U.S. and Europe produced a steady stream of earnings growth downgrades as well. As a result, the Fund’s underweight position in Japan contributed positively to relative performance.
In contrast, the Fund’s exposure to emerging markets detracted from both absolute and relative results as the MSCI EAFE Growth Index did not have exposure to this segment of the market. During the reporting period, emerging markets underperformed developed markets due to multiple macroeconomic headwinds, including the European debt crisis, a deteriorating global economy, rising inflation and tightening monetary policies.
As long-term, bottom-up stock selectors, we see volatility as an opportunity to buy quality growth companies at more
attractive-than-usual valuations. Consequently, we took advantage of market volatility to buy several stocks that had long been on our EQV radar.
Stock selection in the portfolio continued to be driven by the underlying fundamentals of companies, not any top-down macroeconomic views. That said, because of our belief in the long-term strength of consumer growth outside the U.S., we maintained overweight exposure to the consumer discretionary sector at the end of the reporting period. We reduced our exposure to the health care sector slightly but remained overweight compared to the Fund’s style-specific index. The Fund also ended the reporting period with overweight exposure to the energy and IT sectors, while our largest underweight positions were in the materials, industrials, and consumer staples sectors.
At the close of the reporting period, we remained focused on investing according to our bottom-up stock selection process and maintaining our long-term investment view.
We thank you for your continued investment in Invesco V.I. International Growth Fund.
| | |
| 1 | | Source: Lipper Inc. |
| |
| 2 | | Source: MSCI: Neither MSCI nor any other party involved in or related to compiling, computing or creating the MSCI data makes any express or implied warranties or representations with respect to such data (or the results to be obtained by the use thereof), and all such parties hereby expressly disclaim all warranties of originality, accuracy, completeness, merchantability or fitness for a particular purpose with respect to any of such data. Without limiting any of the foregoing, in no event shall MSCI, any of its affiliates or any third party involved in or related to compiling, computing or creating the data have any liability for any direct, indirect, special, punitive, consequential or any other damages (including lost profits) even if notified of the possibility of such damages. No further distribution or dissemination of the MSCI data is permitted without MSCI’s express written consent. |
The views and opinions expressed in management’s discussion of Fund performance are those of Invesco Advisers, Inc. These views and opinions are subject to change at any time based on factors such as market and economic conditions. These views and opinions may not be relied upon as investment advice or recommendations, or as an offer for a particular security. The information is not a complete analysis of every aspect of any market, country, industry, security or the Fund. Statements of fact are from sources considered reliable, but Invesco Advisers, Inc. makes no representation or warranty as to their completeness or accuracy. Although historical performance is no guarantee of future results, these insights may help you understand our investment management philosophy.
See important Fund and, if applicable, index disclosures later in this report.
Clas Olsson
Portfolio manager and CIO of Invesco’s International Growth Investment Management Unit, is lead manager of Invesco V.I. International Growth Fund. He joined Invesco in 1994. Mr. Olsson became a commissioned officer at the Royal Swedish Naval Academy in 1988. He also earned a B.B.A. from The University of Texas at Austin.
Steve Cao
Chartered Financial Analyst, portfolio manager, is manager of Invesco V.I. International Growth Fund. He joined Invesco in 1997. Mr. Cao earned a B.A. in English from the Tianjin Foreign Language Institute. He earned an M.B.A. from Texas A&M University. He is also a Certified Public Accountant.
Matthew Dennis
Chartered Financial Analyst, portfolio manager, is manager of Invesco V.I. International Growth Fund. He joined Invesco in 2000. Mr. Dennis earned a B.A. in economics from The University of Texas at Austin. He also earned an M.S. in finance from Texas A&M University.
Jason Holzer
Chartered Financial Analyst, portfolio manager, is manager of Invesco V.I. International Growth Fund. He joined Invesco in 1996. Mr. Holzer earned a B.A. in quantitative economics and an M.S. in engineering economic systems from Stanford University.
Mark Jason
Chartered Financial Analyst, portfolio manager, is manager of Invesco V.I. International Growth Fund. He joined Invesco in 2001. Mr. Jason earned a B.S. in finance and a B.S. in real estate from California State University at Northridge.
Invesco V.I. International Growth Fund
Your Fund’s Long-Term Performance
Results of a $10,000 Investment – Oldest Share Class(es)
Fund and index data from 12/31/01*
| |
| * | During the reporting period, Invesco changed its policy regarding growth of $10,000 charts. For funds older than 10 years, we previously showed performance since inception. Going forward, we will show performance for the most recent 10 years, since this more accurately reflects the experience of the typical shareholder. As a result, charts now may include benchmarks that did not appear previously, because the funds’ inception pre-dated the benchmarks’ inception. Also, all charts will now be presented using a linear format. |
Past performance cannot guarantee comparable future results.
Average Annual Total Returns
As of 12/31/11
| | | | | | | | | |
|
| Series I Shares | | | | |
| |
| Inception (5/5/93) | | | 6.99 | % |
| |
| | 10 | | | Years | | | 7.11 | |
| |
| | 5 | | | Years | | | -0.53 | |
| |
| | 1 | | | Year | | | -6.74 | |
| |
| | | | | | | | | |
| Series II Shares | | | | |
| |
| Inception (9/19/01) | | | 7.31 | % |
| |
| | 10 | | | Years | | | 6.83 | |
| |
| | 5 | | | Years | | | -0.78 | |
| |
| | 1 | | | Year | | | -6.99 | |
The performance of the Fund’s Series I and Series II share classes will differ primarily due to different class expenses.
The performance data quoted represent past performance and cannot guarantee comparable future results; current performance may be lower or higher. Please contact your variable
product issuer or financial adviser for the most recent month-end variable product performance. Performance figures reflect Fund expenses, reinvested distributions and changes in net asset value. Investment return and principal value will fluctuate so that you may have a gain or loss when you sell shares.
The total annual Fund operating expense ratio set forth in the most recent Fund prospectus as of the date of this report for Series I and Series II shares was 1.04% and 1.29%, respectively. The expense ratios presented above may vary from the expense ratios presented in other sections of this report that are based on expenses incurred during the period covered by this report.
Invesco V.I. International Growth Fund, a series portfolio of AIM Variable Insurance Funds (Invesco Variable
Insurance Funds), is currently offered through insurance companies issuing variable products. You cannot purchase shares of the Fund directly. Performance figures given represent the Fund and are not intended to reflect actual variable product values. They do not reflect sales charges, expenses and fees assessed in connection with a variable product. Sales charges, expenses and fees, which are determined by the variable product issuers, will vary and will lower the total return.
The most recent month-end performance data at the Fund level, excluding variable product charges, is available at 800 451 4246. As mentioned above, for the most recent month-end performance including variable product charges, please contact your variable product issuer or financial adviser.
Invesco V.I. International Growth Fund
Invesco V.I. International Growth Fund’s investment objective is long-term growth of capital.
| n | | Unless otherwise stated, information presented in this report is as of December 31, 2011, and is based on total net assets. |
| |
| n | | Unless otherwise noted, all data provided by Invesco. |
| |
| n | | To access your Fund’s reports/prospectus, visit invesco.com/fundreports. |
Principal risks of investing in the Fund
Developing markets securities risk. Securities issued by foreign companies and governments located in developing countries may be affected more negatively by inflation, devaluation of their currencies, higher transaction costs, delays in settlement, adverse political developments, the introduction of capital controls, withholding taxes, nationalization of private assets, expropriation, social unrest, war or lack of timely information than those in developed countries.
Foreign securities risk. The Fund’s foreign investments may be affected by changes in a foreign country’s exchange rates; political and social instability; changes in economic or taxation policies; difficulties when enforcing obligations; decreased liquidity; and increased volatility. Foreign companies may be subject to less regulation resulting in less publicly available information about the companies.
Growth investing risk. Growth stocks tend to be more expensive relative to their earnings or assets compared with other types of stock. As a result they tend to be more sensitive to changes in their earnings and can be more volatile.
Management risk. The investment techniques and risk analysis used by the Fund’s portfolio managers may not produce the desired results.
Market risk. The prices of and the income generated by the Fund’s securities may decline in response to, among other things, investor sentiment; general economic and market conditions; regional or global instability; and currency and interest rate fluctuations.
About indexes used in this report
The MSCI EAFE® Index is an unmanaged index considered representative of stocks of Europe, Australasia and the Far East.
The MSCI EAFE® Growth Index is an unmanaged index considered representative of growth stocks of Europe, Australasia and the Far East.
The Lipper VUF International Growth Funds Index is an unmanaged index considered representative of international growth variable insurance underlying funds tracked by Lipper.
The Fund is not managed to track the performance of any particular index, including the index(es) defined here, and consequently, the performance of the Fund may deviate significantly from the performance of the index(es).
A direct investment cannot be made in an index. Unless otherwise indicated, index results include reinvested dividends, and they do not reflect sales charges. Performance of the peer group, if applicable, reflects fund expenses; performance of a market index does not.
Other information
The Chartered Financial Analyst® (CFA®) designation is globally recognized and attests to a charterholder’s success in a rigorous and comprehensive study program in the field of investment management and research analysis.
CPA® and Certified Public Accountant® are trademarks owned by the American Institute of Certified Public Accountants.
Industry classifications used in this report are generally according to the Global Industry Classification Standard, which was developed by and is the exclusive property and a service mark of MSCI Inc. and Standard & Poor’s.
The returns shown in management’s discussion of Fund performance are based on net asset values calculated for shareholder transactions. Generally accepted accounting principles require adjustments to be made to the net assets of the Fund at period end for financial reporting purposes, and as such, the net asset values for shareholder transactions and the returns based on those net asset values may differ from the net asset values and returns reported in the Financial Highlights. Additionally, the returns and net asset values shown throughout this report are at the Fund level only and do not include variable product issuer charges. If such charges were included, the total returns would be lower.
Invesco V.I. International Growth Fund
Schedule of Investments
December 31, 2011
| | | | | | | | | |
| | | Shares | | Value |
| |
Common Stocks & Other Equity Interests–90.94%
|
Australia–5.82%
| | | | |
| BHP Billiton Ltd. | | | 455,880 | | | $ | 16,091,924 | |
| |
| Brambles Ltd. | | | 2,235,983 | | | | 16,374,658 | |
| |
| CSL Ltd. | | | 286,823 | | | | 9,387,602 | |
| |
| QBE Insurance Group Ltd. | | | 701,757 | | | | 9,294,954 | |
| |
| WorleyParsons Ltd. | | | 606,233 | | | | 15,882,514 | |
| |
| | | | | | | | 67,031,652 | |
| |
Belgium–1.93%
| | | | |
| Anheuser-Busch InBev N.V. | | | 362,640 | | | | 22,148,200 | |
| |
Brazil–2.46%
| | | | |
| Banco Bradesco S.A.–ADR | | | 1,180,003 | | | | 19,682,450 | |
| |
| Petroleo Brasileiro S.A.–ADR | | | 369,109 | | | | 8,670,371 | |
| |
| | | | | | | | 28,352,821 | |
| |
Canada–5.85%
| | | | |
| Agrium Inc. | | | 132,231 | | | | 8,875,104 | |
| |
| Canadian National Railway Co. | | | 129,482 | | | | 10,186,477 | |
| |
| Canadian Natural Resources Ltd. | | | 253,593 | | | | 9,496,047 | |
| |
| Cenovus Energy Inc. | | | 320,865 | | | | 10,654,557 | |
| |
| Fairfax Financial Holdings Ltd. | | | 25,187 | | | | 10,803,858 | |
| |
| Suncor Energy, Inc. | | | 601,017 | | | | 17,332,037 | |
| |
| | | | | | | | 67,348,080 | |
| |
China–1.20%
| | | | |
| Industrial & Commercial Bank of China Ltd.–Class H | | | 23,195,000 | | | | 13,804,265 | |
| |
Denmark–1.49%
| | | | |
| Novo Nordisk A.S.–Class B | | | 149,589 | | | | 17,191,443 | |
| |
France–6.27%
| | | | |
| BNP Paribas S.A. | | | 219,077 | | | | 8,605,784 | |
| |
| Cap Gemini S.A. | | | 260,708 | | | | 8,109,655 | |
| |
| Cie Generale des Etablissements Michelin–Class B | | | 104,786 | | | | 6,160,418 | |
| |
| Danone S.A. | | | 226,689 | | | | 14,250,612 | |
| |
| Eutelsat Communications S.A | | | 193,492 | | | | 7,536,139 | |
| |
| L’Oreal S.A | | | 70,004 | | | | 7,311,918 | |
| |
| Publicis Groupe S.A. | | | 128,186 | | | | 5,883,282 | |
| |
| Schneider Electric S.A. | | | 126,621 | | | | 6,617,570 | |
| |
| Total S.A. | | | 150,487 | | | | 7,681,300 | |
| |
| | | | | | | | 72,156,678 | |
| |
Germany–4.92%
| | | | |
| Adidas AG | | | 252,490 | | | | 16,424,858 | |
| |
| Bayer AG | | | 90,629 | | | | 5,794,675 | |
| |
| Bayerische Motoren Werke AG | | | 55,889 | | | | 3,736,614 | |
| |
| Fresenius Medical Care AG & Co. KGaA | | | 201,842 | | | | 13,715,315 | |
| |
| SAP AG | | | 321,057 | | | | 16,974,976 | |
| |
| | | | | | | | 56,646,438 | |
| |
Hong Kong–2.28%
| | | | |
| China Mobile Ltd. | | | 1,340,000 | | | | 13,064,872 | |
| |
| Hutchison Whampoa Ltd. | | | 1,585,000 | | | | 13,210,463 | |
| |
| | | | | | | | 26,275,335 | |
| |
India–0.87%
| | | | |
| Infosys Ltd. | | | 192,539 | | | | 10,042,035 | |
| |
Israel–1.73%
| | | | |
| Teva Pharmaceutical Industries Ltd.–ADR | | | 493,993 | | | | 19,937,558 | |
| |
Japan–9.21%
| | | | |
| Canon Inc. | | | 456,900 | | | | 20,249,922 | |
| |
| Denso Corp. | | | 464,800 | | | | 12,821,715 | |
| |
| FANUC Corp. | | | 69,600 | | | | 10,656,200 | |
| |
| Keyence Corp. | | | 45,300 | | | | 10,927,580 | |
| |
| Komatsu Ltd. | | | 292,137 | | | | 6,815,500 | |
| |
| Nidec Corp. | | | 142,495 | | | | 12,372,842 | |
| |
| Toyota Motor Corp. | | | 368,800 | | | | 12,278,726 | |
| |
| Yamada Denki Co., Ltd. | | | 292,630 | | | | 19,929,571 | |
| |
| | | | | | | | 106,052,056 | |
| |
Mexico–3.45%
| | | | |
| America Movil SAB de C.V.–Series L–ADR | | | 629,027 | | | | 14,216,010 | |
| |
| Fomento Economico Mexicano, S.A.B. de C.V.–ADR | | | 212,219 | | | | 14,793,787 | |
| |
| Grupo Televisa S.A.B.–ADR | | | 506,722 | | | | 10,671,565 | |
| |
| | | | | | | | 39,681,362 | |
| |
Netherlands–2.88%
| | | | |
| Koninklijke (Royal) KPN N.V. | | | 168,309 | | | | 2,009,512 | |
| |
| Koninklijke Ahold N.V. | | | 898,204 | | | | 12,079,338 | |
| |
| Unilever N.V. | | | 454,154 | | | | 15,596,927 | |
| |
| VimpelCom Ltd.–ADR | | | 363,183 | | | | 3,439,343 | |
| |
| | | | | | | | 33,125,120 | |
| |
Russia–0.92%
| | | | |
| Gazprom OAO–ADR | | | 994,429 | | | | 10,600,613 | |
| |
Singapore–2.35%
| | | | |
| Keppel Corp. Ltd. | | | 2,084,661 | | | | 14,900,788 | |
| |
| United Overseas Bank Ltd. | | | 1,031,000 | | | | 12,106,338 | |
| |
| | | | | | | | 27,007,126 | |
| |
| | | | | | | | | |
| | | | | | | | | |
See accompanying Notes to Financial Statements which are an integral part of the financial statements.
Invesco V.I. International Growth Fund
| | | | | | | | | |
| | | Shares | | Value |
| |
South Korea–2.46%
| | | | |
| Hyundai Mobis | | | 54,347 | | | $ | 13,770,076 | |
| |
NHN Corp.(a) | | | 79,662 | | | | 14,585,172 | |
| |
| | | | | | | | 28,355,248 | |
| |
Spain–0.53%
| | | | |
| Amadeus IT Holding S.A.–Class A | | | 380,769 | | | | 6,151,361 | |
| |
Sweden–3.02%
| | | | |
| Kinnevik Investment A.B.–Class B | | | 286,593 | | | | 5,584,928 | |
| |
| Swedbank A.B.–Class A | | | 778,397 | | | | 10,084,298 | |
| |
| Telefonaktiebolaget LM Ericsson–Class B | | | 1,282,861 | | | | 13,032,357 | |
| |
| Volvo A.B.–Class B | | | 552,654 | | | | 6,008,790 | |
| |
| | | | | | | | 34,710,373 | |
| |
Switzerland–8.10%
| | | | |
ABB Ltd.(a) | | | 682,815 | | | | 12,853,672 | |
| |
Julius Baer Group Ltd.(a) | | | 310,808 | | | | 12,089,228 | |
| |
| Nestle S.A. | | | 316,875 | | | | 18,194,622 | |
| |
| Novartis AG | | | 343,762 | | | | 19,655,046 | |
| |
| Roche Holding AG | | | 84,080 | | | | 14,220,921 | |
| |
Syngenta AG(a) | | | 55,277 | | | | 16,270,728 | |
| |
| | | | | | | | 93,284,217 | |
| |
Taiwan–1.39%
| | | | |
| Taiwan Semiconductor Manufacturing Co. Ltd.–ADR | | | 1,243,220 | | | | 16,049,970 | |
| |
Turkey–0.63%
| | | | |
| Akbank T.A.S. | | | 2,270,373 | | | | 7,201,103 | |
| |
United Kingdom–21.18%
| | | | |
| BG Group PLC | | | 880,867 | | | | 18,791,373 | |
| |
| British American Tobacco PLC | | | 395,410 | | | | 18,767,794 | |
| |
| Centrica PLC | | | 2,302,316 | | | | 10,346,576 | |
| |
| Compass Group PLC | | | 2,766,196 | | | | 26,198,250 | |
| |
| GlaxoSmithKline PLC | | | 416,138 | | | | 9,491,482 | |
| |
| Imperial Tobacco Group PLC | | | 642,681 | | | | 24,309,595 | |
| |
| Informa PLC | | | 1,655,582 | | | | 9,256,239 | |
| |
| International Power PLC | | | 1,556,037 | | | | 8,150,623 | |
| |
| Kingfisher PLC | | | 2,752,677 | | | | 10,719,953 | |
| |
| Next PLC | | | 346,548 | | | | 14,734,028 | |
| |
| Reed Elsevier PLC | | | 2,039,801 | | | | 16,445,173 | |
| |
| Royal Dutch Shell PLC–Class B | | | 462,183 | | | | 17,618,618 | |
| |
| Shire PLC | | | 302,315 | | | | 10,495,643 | |
| |
| Smith & Nephew PLC | | | 1,105,477 | | | | 10,714,726 | |
| |
| Tesco PLC | | | 2,443,252 | | | | 15,312,330 | |
| |
| Vodafone Group PLC | | | 4,679,475 | | | | 13,004,414 | |
| |
| WPP PLC | | | 911,833 | | | | 9,524,986 | |
| |
| | | | | | | | 243,881,803 | |
| |
Total Common Stocks & Other Equity Interests
(Cost $836,474,217) | | | 1,047,034,857 | |
| |
Preferred Stocks–0.99%
|
Germany–0.99%
| | | | |
| Volkswagen AG -1.63% Pfd. (Cost $14,017,517) | | | 76,068 | | | | 11,375,563 | |
| |
Money Market Funds–8.43%
|
Liquid Assets Portfolio–Institutional Class(b) | | | 48,544,895 | | | | 48,544,895 | |
| |
Premier Portfolio–Institutional Class(b) | | | 48,544,895 | | | | 48,544,895 | |
| |
| Total Money Market Funds (Cost $97,089,790) | | | | | | | 97,089,790 | |
| |
| TOTAL INVESTMENTS–100.36% (Cost $947,581,524) | | | | | | | 1,155,500,210 | |
| |
| OTHER ASSETS LESS LIABILITIES–(0.36)% | | | | | | | (4,088,300 | ) |
| |
| NET ASSETS–100.00% | | | | | | $ | 1,151,411,910 | |
| |
Investment Abbreviations:
| | | |
| ADR | | – American Depositary Receipt |
| Pfd. | | – Preferred |
Notes to Schedule of Investments:
| | |
| (a) | | Non-income producing security. |
| (b) | | The money market fund and the Fund are affiliated by having the same investment adviser. |
See accompanying Notes to Financial Statements which are an integral part of the financial statements.
Invesco V.I. International Growth Fund
Statement of Assets and Liabilities
December 31, 2011
| | | | | |
Assets:
|
| Investments, at value (Cost $850,491,734) | | $ | 1,058,410,420 | |
| |
| Investments in affiliated money market funds, at value and cost | | | 97,089,790 | |
| |
| Total investments, at value (Cost $947,581,524) | | | 1,155,500,210 | |
| |
| Foreign currencies, at value (Cost $816,921) | | | 823,809 | |
| |
| Receivable for: | | | | |
| Investments sold | | | 17,956 | |
| |
| Fund shares sold | | | 1,803,402 | |
| |
| Dividends | | | 4,175,652 | |
| |
| Investment for trustee deferred compensation and retirement plans | | | 61,727 | |
| |
| Other assets | | | 190 | |
| |
| Total assets | | | 1,162,382,946 | |
| |
| | | | | |
| | | | | |
Liabilities:
|
| Payable for: | | | | |
| Investments purchased | | | 8,389,244 | |
| |
| Fund shares reacquired | | | 1,047,060 | |
| |
| Accrued fees to affiliates | | | 1,087,627 | |
| |
| Accrued other operating expenses | | | 266,148 | |
| |
| Trustee deferred compensation and retirement plans | | | 180,957 | |
| |
| Total liabilities | | | 10,971,036 | |
| |
| Net assets applicable to shares outstanding | | $ | 1,151,411,910 | |
| |
| | | | | |
| | | | | |
Net assets consist of:
|
| Shares of beneficial interest | | $ | 1,183,401,097 | |
| |
| Undistributed net investment income | | | 18,339,786 | |
| |
| Undistributed net realized gain (loss) | | | (258,508,038 | ) |
| |
| Unrealized appreciation | | | 208,179,065 | |
| |
| | | $ | 1,151,411,910 | |
| |
| | | | | |
| | | | | |
Net Assets:
|
| Series I | | $ | 544,142,504 | |
| |
| Series II | | $ | 607,269,406 | |
| |
| | | | | |
| | | | | |
Shares outstanding, $0.001 par value per share, with an unlimited number of shares authorized:
|
| Series I | | | 20,637,504 | |
| |
| Series II | | | 23,284,098 | |
| |
| Series I: | | | | |
| Net asset value per share | | $ | 26.37 | |
| |
| Series II: | | | | |
| Net asset value per share | | $ | 26.08 | |
| |
Statement of Operations
For the year ended December 31, 2011
| | | | | |
Investment income:
|
| Dividends (net of foreign withholding taxes of $2,436,148) | | $ | 32,571,151 | |
| |
| Dividends from affiliated money market funds | | | 86,398 | |
| |
| Total investment income | | | 32,657,549 | |
| |
| | | | | |
| | | | | |
Expenses:
|
| Advisory fees | | | 8,381,388 | |
| |
| Administrative services fees | | | 3,137,238 | |
| |
| Custodian fees | | | 364,091 | |
| |
| Distribution fees — Series II | | | 1,505,155 | |
| |
| Transfer agent fees | | | 76,233 | |
| |
| Trustees’ and officers’ fees and benefits | | | 68,410 | |
| |
| Other | | | 131,751 | |
| |
| Total expenses | | | 13,664,266 | |
| |
| Less: Fees waived | | | (126,641 | ) |
| |
| Net expenses | | | 13,537,625 | |
| |
| Net investment income | | | 19,119,924 | |
| |
| | | | | |
| | | | | |
Realized and unrealized gain (loss) from:
|
| Net realized gain (loss) from: | | | | |
| Investment securities (net of tax on the sale of foreign investments of $186) | | | 54,328,405 | |
| |
| Foreign currencies | | | (512,075 | ) |
| |
| | | | 53,816,330 | |
| |
| Change in net unrealized appreciation (depreciation) of: | | | | |
| Investment securities (net of foreign taxes on holdings of $2,336,660) | | | (159,501,801 | ) |
| |
| Foreign currencies | | | (35,056 | ) |
| |
| | | | (159,536,857 | ) |
| |
| Net realized and unrealized gain (loss) | | | (105,720,527 | ) |
| |
| Net increase (decrease) in net assets resulting from operations | | $ | (86,600,603 | ) |
| |
See accompanying Notes to Financial Statements which are an integral part of the financial statements.
Invesco V.I. International Growth Fund
Statement of Changes in Net Assets
For the years ended December 31, 2011 and 2010
| | | | | | | | | |
| | | 2011 | | 2010 |
| |
Operations:
|
| Net investment income | | $ | 19,119,924 | | | $ | 18,371,750 | |
| |
| Net realized gain (loss) | | | 53,816,330 | | | | (17,156,987 | ) |
| |
| Change in net unrealized appreciation (depreciation) | | | (159,536,857 | ) | | | 41,178,093 | |
| |
| Net increase (decrease) in net assets resulting from operations | | | (86,600,603 | ) | | | 42,392,856 | |
| |
| | | | | | | | | |
| | | | | | | | | |
Distributions to shareholders from net investment income:
|
| Series I | | | (8,703,100 | ) | | | (11,906,519 | ) |
| |
| Series II | | | (6,565,728 | ) | | | (9,115,881 | ) |
| |
| Total distributions from net investment income | | | (15,268,828 | ) | | | (21,022,400 | ) |
| |
| | | | | | | | | |
| | | | | | | | | |
Share transactions–net:
|
| Series I | | | 6,595,238 | | | | (19,927,647 | ) |
| |
| Series II | | | 90,856,363 | | | | (903,010,172 | ) |
| |
| Net increase (decrease) in net assets resulting from share transactions | | | 97,451,601 | | | | (922,937,819 | ) |
| |
| Net increase (decrease) in net assets | | | (4,417,830 | ) | | | (901,567,363 | ) |
| |
| | | | | | | | | |
| | | | | | | | | |
Net assets:
|
| Beginning of year | | | 1,155,829,740 | | | | 2,057,397,103 | |
| |
| End of year (includes undistributed net investment income of $18,339,786 and $15,003,445, respectively) | | $ | 1,151,411,910 | | | $ | 1,155,829,740 | |
| |
Notes to Financial Statements
December 31, 2011
NOTE 1—Significant Accounting Policies
Invesco V.I. International Growth Fund (the “Fund”) is a series portfolio of AIM Variable Insurance Funds (Invesco Variable Insurance Funds) (the “Trust”). The Trust is a Delaware statutory trust registered under the Investment Company Act of 1940, as amended (the “1940 Act”), as an open-end series management investment company consisting of twenty-eight separate portfolios, (each constituting a “Fund”). The assets, liabilities and operations of each portfolio are accounted for separately. Information presented in these financial statements pertains only to the Fund. Matters affecting each Fund or class will be voted on exclusively by the shareholders of such Fund or class. Current Securities and Exchange Commission (“SEC”) guidance, however, requires participating insurance companies offering separate accounts to vote shares proportionally in accordance with the instructions of the contract owners whose investments are funded by shares of each Fund or class.
The Fund’s investment objective is long-term growth of capital.
The Fund currently offers two classes of shares, Series I and Series II, both of which are offered to insurance company separate accounts funding variable annuity contracts and variable life insurance policies (“variable products”).
The following is a summary of the significant accounting policies followed by the Fund in the preparation of its financial statements.
| | |
| A. | | Security Valuations — Securities, including restricted securities, are valued according to the following policy. |
| | A security listed or traded on an exchange (except convertible bonds) is valued at its last sales price or official closing price as of the close of the customary trading session on the exchange where the security is principally traded, or lacking any sales or official closing price on a particular day, the security may be valued at the closing bid price on that day. Securities traded in the over-the-counter market are valued based on prices furnished by independent pricing services or market makers. When such securities are valued by an independent pricing service they may be considered fair valued. Futures contracts are valued at the final settlement price set by an exchange on which they are principally traded. Listed options are valued at the mean between the last bid and ask prices from the exchange on which they are principally traded. Options not listed on an exchange are valued by an independent source at the mean between the last bid and ask prices. For purposes of determining net asset value per share, futures and option contracts generally are valued 15 minutes after the close of the customary trading session of the New York Stock Exchange (“NYSE”). |
| | Investments in open-end and closed-end registered investment companies that do not trade on an exchange are valued at the end of day net asset value per share. Investments in open-end and closed-end registered investment companies that trade on an exchange are valued at the last sales price or official closing price as of the close of the customary trading session on the exchange where the security is principally traded. |
| | Debt obligations (including convertible bonds) and unlisted equities are fair valued using an evaluated quote provided by an independent pricing service. Evaluated quotes provided by the pricing service may be determined without exclusive reliance on quoted prices, and may reflect appropriate factors such as |
Invesco V.I. International Growth Fund
| | |
| | institution-size trading in similar groups of securities, developments related to specific securities, dividend rate, yield, quality, type of issue, coupon rate, maturity, individual trading characteristics and other market data. Debt securities are subject to interest rate and credit risks. In addition, all debt securities involve some risk of default with respect to interest and/or principal payments. |
| | Foreign securities (including foreign exchange contracts) are converted into U.S. dollar amounts using the applicable exchange rates as of the close of the NYSE. If market quotations are available and reliable for foreign exchange traded equity securities, the securities will be valued at the market quotations. Because trading hours for certain foreign securities end before the close of the NYSE, closing market quotations may become unreliable. If between the time trading ends on a particular security and the close of the customary trading session on the NYSE, events occur that are significant and make the closing price unreliable, the Fund may fair value the security. If the event is likely to have affected the closing price of the security, the security will be valued at fair value in good faith using procedures approved by the Board of Trustees. Adjustments to closing prices to reflect fair value may also be based on a screening process of an independent pricing service to indicate the degree of certainty, based on historical data, that the closing price in the principal market where a foreign security trade is not the current value as of the close of the NYSE. Foreign securities meeting the approved degree of certainty that the price is not reflective of current value will be priced at the indication of fair value from the independent pricing service. Multiple factors may be considered by the independent pricing service in determining adjustments to reflect fair value and may include information relating to sector indices, American Depositary Receipts and domestic and foreign index futures. Foreign securities may have additional risks including exchange rate changes, potential for sharply devalued currencies and high inflation, political and economic upheaval, the relative lack of issuer information, relatively low market liquidity and the potential lack of strict financial and accounting controls and standards. |
| | Securities for which market prices are not provided by any of the above methods may be valued based upon quotes furnished by independent sources. The last bid price may be used to value equity securities. The mean between the last bid and asked prices is used to value debt obligations, including Corporate Loans. |
| | Securities for which market quotations are not readily available or are unreliable are valued at fair value as determined in good faith by or under the supervision of the Trust’s officers following procedures approved by the Board of Trustees. Issuer specific events, market trends, bid/ask quotes of brokers and information providers and other market data may be reviewed in the course of making a good faith determination of a security’s fair value. |
| | Valuations change in response to many factors including the historical and prospective earnings of the issuer, the value of the issuer’s assets, general economic conditions, interest rates, investor perceptions and market liquidity. Because of the inherent uncertainties of valuation, the values reflected in the financial statements may materially differ from the value received upon actual sale of those investments. |
| B. | | Securities Transactions and Investment Income — Securities transactions are accounted for on a trade date basis. Realized gains or losses on sales are computed on the basis of specific identification of the securities sold. Interest income is recorded on the accrual basis from settlement date. Dividend income (net of withholding tax, if any) is recorded on the ex-dividend date. |
| | The Fund may periodically participate in litigation related to Fund investments. As such, the Fund may receive proceeds from litigation settlements. Any proceeds received are included in the Statement of Operations as realized gain (loss) for investments no longer held and as unrealized gain (loss) for investments still held. |
| | Brokerage commissions and mark ups are considered transaction costs and are recorded as an increase to the cost basis of securities purchased and/or a reduction of proceeds on a sale of securities. Such transaction costs are included in the determination of net realized and unrealized gain (loss) from investment securities reported in the Statement of Operations and the Statement of Changes in Net Assets and the net realized and unrealized gains (losses) on securities per share in the Financial Highlights. Transaction costs are included in the calculation of the Fund’s net asset value and, accordingly, they reduce the Fund’s total returns. These transaction costs are not considered operating expenses and are not reflected in net investment income reported in the Statement of Operations and Statement of Changes in Net Assets, or the net investment income per share and ratios of expenses and net investment income reported in the Financial Highlights, nor are they limited by any expense limitation arrangements between the Fund and the investment adviser. |
| | The Fund allocates income and realized and unrealized capital gains and losses to a class based on the relative net assets of each class. |
| C. | | Country Determination — For the purposes of making investment selection decisions and presentation in the Schedule of Investments, the investment adviser may determine the country in which an issuer is located and/or credit risk exposure based on various factors. These factors include the laws of the country under which the issuer is organized, where the issuer maintains a principal office, the country in which the issuer derives 50% or more of its total revenues and the country that has the primary market for the issuer’s securities, as well as other criteria. Among the other criteria that may be evaluated for making this determination are the country in which the issuer maintains 50% or more of its assets, the type of security, financial guarantees and enhancements, the nature of the collateral and the sponsor organization. Country of issuer and/or credit risk exposure has been determined to be the United States of America, unless otherwise noted. |
| D. | | Distributions — Distributions from income and net realized capital gain, if any, are generally paid to separate accounts of participating insurance companies annually and recorded on ex-dividend date. |
| E. | | Federal Income Taxes — The Fund intends to comply with the requirements of Subchapter M of the Internal Revenue Code necessary to qualify as a regulated investment company and to distribute substantially all of the Fund’s taxable earnings to shareholders. As such, the Fund will not be subject to federal income taxes on otherwise taxable income (including net realized capital gain) that is distributed to shareholders. Therefore, no provision for federal income taxes is recorded in the financial statements. |
| | The Fund files tax returns in the U.S. Federal jurisdiction and certain other jurisdictions. Generally, the Fund is subject to examinations by such taxing authorities for up to three years after the filing of the return for the tax period. |
| F. | | Expenses — Fees provided for under the Rule 12b-1 plan of a particular class of the Fund and which are directly attributable to that class are charged to the operations of such class. All other expenses are allocated among the classes based on relative net assets. |
| G. | | Accounting Estimates — The preparation of financial statements in conformity with accounting principles generally accepted in the United States of America (“GAAP”) requires management to make estimates and assumptions that affect the reported amounts of assets and liabilities at the date of the financial statements and the reported amounts of revenues and expenses during the reporting period including estimates and assumptions related to |
Invesco V.I. International Growth Fund
| | |
| | taxation. Actual results could differ from those estimates by a significant amount. In addition, the Fund monitors for material events or transactions that may occur or become known after the period-end date and before the date the financial statements are released to print. |
| H. | | Indemnifications — Under the Trust’s organizational documents, each Trustee, officer, employee or other agent of the Trust is indemnified against certain liabilities that may arise out of performance of their duties to the Fund. Additionally, in the normal course of business, the Fund enters into contracts, including the Fund’s servicing agreements that contain a variety of indemnification clauses. The Fund’s maximum exposure under these arrangements is unknown as this would involve future claims that may be made against the Fund that have not yet occurred. The risk of material loss as a result of such indemnification claims is considered remote. |
| I. | | Foreign Currency Translations — Foreign currency is valued at the close of the NYSE based on quotations posted by banks and major currency dealers. Portfolio securities and other assets and liabilities denominated in foreign currencies are translated into U.S. dollar amounts at date of valuation. Purchases and sales of portfolio securities (net of foreign taxes withheld on disposition) and income items denominated in foreign currencies are translated into U.S. dollar amounts on the respective dates of such transactions. The Fund does not separately account for the portion of the results of operations resulting from changes in foreign exchange rates on investments and the fluctuations arising from changes in market prices of securities held. The combined results of changes in foreign exchange rates and the fluctuation of market prices on investments (net of estimated foreign tax withholding) are included with the net realized and unrealized gain or loss from investments in the Statement of Operations. Reported net realized foreign currency gains or losses arise from (1) sales of foreign currencies, (2) currency gains or losses realized between the trade and settlement dates on securities transactions, and (3) the difference between the amounts of dividends, interest, and foreign withholding taxes recorded on the Fund’s books and the U.S. dollar equivalent of the amounts actually received or paid. Net unrealized foreign currency gains and losses arise from changes in the fair values of assets and liabilities, other than investments in securities at fiscal period end, resulting from changes in exchange rates. |
| | The Fund may invest in foreign securities which may be subject to foreign taxes on income, gains on investments or currency repatriation, a portion of which may be recoverable. |
| J. | | Foreign Currency Contracts — The Fund may enter into foreign currency contracts to manage or minimize currency or exchange rate risk. The Fund may also enter into foreign currency contracts for the purchase or sale of a security denominated in a foreign currency in order to “lock in” the U.S. dollar price of that security. A foreign currency contract is an obligation to purchase or sell a specific currency for an agreed-upon price at a future date. The use of foreign currency contracts does not eliminate fluctuations in the price of the underlying securities the Fund owns or intends to acquire but establishes a rate of exchange in advance. Fluctuations in the value of these contracts are measured by the difference in the contract date and reporting date exchange rates and are recorded as unrealized appreciation (depreciation) until the contracts are closed. When the contracts are closed, realized gains (losses) are recorded. Realized and unrealized gains (losses) on the contracts are included in the Statement of Operations. The primary risks associated with foreign currency contracts include failure of the counterparty to meet the terms of the contract and the value of the foreign currency changing unfavorably. These risks may be in excess of the amounts reflected in the Statement of Assets and Liabilities. |
NOTE 2—Advisory Fees and Other Fees Paid to Affiliates
The Trust has entered into a master investment advisory agreement with Invesco Advisers, Inc. (the “Adviser” or “Invesco”). Under the terms of the investment advisory agreement, the Fund pays an advisory fee to the Adviser based on the annual rate of the Fund’s average daily net assets as follows:
| | | | | |
| Average Net Assets | | Rate |
| |
| First $250 million | | | 0 | .75% |
| |
| Over $250 million | | | 0 | .70% |
| |
Under the terms of a master sub-advisory agreement between the Adviser and each of Invesco Asset Management Deutschland GmbH, Invesco Asset Management Limited, Invesco Asset Management (Japan) Limited, Invesco Australia Limited, Invesco Hong Kong Limited, Invesco Senior Secured Management, Inc. and Invesco Canada Ltd. (collectively, the “Affiliated Sub-Advisers”) the Adviser, not the Fund, may pay 40% of the fees paid to the Adviser to any such Affiliated Sub-Adviser(s) that provide discretionary investment management services to the Fund based on the percentage of assets allocated to such Sub-Adviser(s).
Effective May 2, 2011, the Adviser has contractually agreed, through at least June 30, 2012, to waive advisory fees and/or reimburse expenses of all shares to the extent necessary to limit total annual fund operating expenses after fee waiver and/or expense reimbursement (excluding certain items discussed below) of Series I shares to 1.11% and Series II shares to 1.36% of average daily net assets. Prior to May 2, 2011, the Adviser had contractually agreed to waive advisory fees and/or reimburse expenses of all shares to the extent necessary to limit total annual fund operating expenses after fee waiver and/or expense reimbursement (excluding certain items discussed below) of Series I shares to 1.30% and Series II shares to 1.45% of average daily net assets. In determining the Adviser’s obligation to waive advisory fees and/or reimburse expenses, the following expenses are not taken into account, and could cause the total annual fund operating expenses after fee waiver and/or expense reimbursement to exceed the numbers reflected above: (1) interest; (2) taxes; (3) dividend expense on short sales; (4) extraordinary items or non-routine items, including litigation expenses; and (5) expenses that the Fund has incurred but did not actually pay because of an expense offset arrangement. Unless the Board of the Trustees and Invesco mutually agree to amend or continue the fee waiver agreement, it will terminate on June 30, 2012. The Adviser did not waive fees and/or reimburse expenses during the period under the expense limitation.
Further, the Adviser has contractually agreed, through at least June 30, 2012, to waive the advisory fee payable by the Fund in an amount equal to 100% of the net advisory fees the Adviser receives from the affiliated money market funds on investments by the Fund of uninvested cash (excluding investments of cash collateral from securities lending) in such affiliated money market funds.
For the year ended December 31, 2011, the Adviser waived advisory fees of $126,641.
The Trust has entered into a master administrative services agreement with Invesco pursuant to which the Fund has agreed to pay Invesco a fee for costs incurred in providing accounting services and fund administrative services to the Fund and to reimburse Invesco for administrative services fees paid to
Invesco V.I. International Growth Fund
insurance companies that have agreed to provide services to the participants of separate accounts. These administrative services provided by the insurance companies may include, among other things: the printing of prospectuses, financial reports and proxy statements and the delivery of the same to existing participants; the maintenance of master accounts; the facilitation of purchases and redemptions requested by the participants; and the servicing of participants’ accounts. Pursuant to such agreement, for the year ended December 31, 2011, Invesco was paid $281,281 for accounting and fund administrative services and reimbursed $2,855,957 for services provided by insurance companies.
The Trust has entered into a transfer agency and service agreement with Invesco Investment Services, Inc. (“IIS”) pursuant to which the Fund has agreed to pay IIS a fee for providing transfer agency and shareholder services to the Fund and reimburse IIS for certain expenses incurred by IIS in the course of providing such services. For the year ended December 31, 2011, expenses incurred under the agreement are shown in the Statement of Operations as transfer agent fees.
The Trust has entered into a master distribution agreement with Invesco Distributors, Inc. (“IDI”) to serve as the distributor for the Fund. The Trust has adopted a plan pursuant to Rule 12b-1 under the 1940 Act with respect to the Fund’s Series II shares (the “Plan”). The Fund, pursuant to the Plan, pays IDI compensation at the annual rate of 0.25% of the Fund’s average daily net assets of Series II shares. Of the Plan payments, up to 0.25% of the average daily net assets of the Series II shares may be paid to insurance companies who furnish continuing personal shareholder services to customers who purchase and own Series II shares of the Fund. For the year ended December 31, 2011, expenses incurred under the Plan are detailed in the Statement of Operations as distribution fees.
Certain officers and trustees of the Trust are officers and directors of the Adviser, Invesco Ltd., IIS and/or IDI.
NOTE 3—Additional Valuation Information
GAAP defines fair value as the price that would be received to sell an asset or paid to transfer a liability in an orderly transaction between market participants at the measurement date, under current market conditions. GAAP establishes a hierarchy that prioritizes the inputs to valuation methods giving the highest priority to readily available unadjusted quoted prices in an active market for identical assets (Level 1)��and the lowest priority to significant unobservable inputs (Level 3) generally when market prices are not readily available or are unreliable. Based on the valuation inputs, the securities or other investments are tiered into one of three levels. Changes in valuation methods may result in transfers in or out of an investment’s assigned level:
| | |
| | Level 1 — | Prices are determined using quoted prices in an active market for identical assets. |
| | Level 2 — | Prices are determined using other significant observable inputs. Observable inputs are inputs that other market participants may use in pricing a security. These may include quoted prices for similar securities, interest rates, prepayment speeds, credit risk, yield curves, loss severities, default rates, discount rates, volatilities and others. |
| | Level 3 — | Prices are determined using significant unobservable inputs. In situations where quoted prices or observable inputs are unavailable (for example, when there is little or no market activity for an investment at the end of the period), unobservable inputs may be used. Unobservable inputs reflect the Fund’s own assumptions about the factors market participants would use in determining fair value of the securities or instruments and would be based on the best available information. |
The following is a summary of the tiered valuation input levels, as of December 31, 2011. The level assigned to the securities valuations may not be an indication of the risk or liquidity associated with investing in those securities. Because of the inherent uncertainties of valuation, the values reflected in the financial statements may materially differ from the value received upon actual sale of those investments.
| | | | | | | | | | | | | | | | | |
| | | Level 1* | | Level 2* | | Level 3 | | Total |
| |
| Australia | | $ | 35,057,214 | | | $ | 31,974,438 | | | $ | — | | | $ | 67,031,652 | |
| |
| Belgium | | | — | | | | 22,148,200 | | | | — | | | | 22,148,200 | |
| |
| Brazil | | | 28,352,821 | | | | — | | | | — | | | | 28,352,821 | |
| |
| Canada | | | 67,348,080 | | | | — | | | | — | | | | 67,348,080 | |
| |
| China | | | — | | | | 13,804,265 | | | | — | | | | 13,804,265 | |
| |
| Denmark | | | 17,191,443 | | | | — | | | | — | | | | 17,191,443 | |
| |
| France | | | 30,168,314 | | | | 41,988,364 | | | | — | | | | 72,156,678 | |
| |
| Germany | | | 52,909,824 | | | | 15,112,177 | | | | — | | | | 68,022,001 | |
| |
| Hong Kong | | | — | | | | 26,275,335 | | | | — | | | | 26,275,335 | |
| |
| India | | | 10,042,035 | | | | — | | | | — | | | | 10,042,035 | |
| |
| Israel | | | 19,937,558 | | | | — | | | | — | | | | 19,937,558 | |
| |
| Japan | | | 61,763,273 | | | | 44,288,783 | | | | — | | | | 106,052,056 | |
| |
| Mexico | | | 39,681,362 | | | | — | | | | — | | | | 39,681,362 | |
| |
| Netherlands | | | 3,439,343 | | | | 29,685,777 | | | | — | | | | 33,125,120 | |
| |
| Russia | | | 10,600,613 | | | | — | | | | — | | | | 10,600,613 | |
| |
| Singapore | | | — | | | | 27,007,126 | | | | — | | | | 27,007,126 | |
| |
| South Korea | | | 28,355,248 | | | | — | | | | — | | | | 28,355,248 | |
| |
| Spain | | | — | | | | 6,151,361 | | | | — | | | | 6,151,361 | |
| |
| Sweden | | | 15,669,226 | | | | 19,041,147 | | | | — | | | | 34,710,373 | |
| |
Invesco V.I. International Growth Fund
| | | | | | | | | | | | | | | | | |
| | | Level 1* | | Level 2* | | Level 3 | | Total |
| |
| Switzerland | | | 32,508,718 | | | | 60,775,499 | | | | — | | | | 93,284,217 | |
| |
| Taiwan | | | 16,049,970 | | | | — | | | | — | | | | 16,049,970 | |
| |
| Turkey | | | — | | | | 7,201,103 | | | | | | | | 7,201,103 | |
| |
| United Kingdom | | | 149,409,104 | | | | 94,472,699 | | | | — | | | | 243,881,803 | |
| |
| United States | | | 97,089,790 | | | | — | | | | — | | | | 97,089,790 | |
| |
| Total Investments | | $ | 715,573,936 | | | $ | 439,926,274 | | | $ | — | | | $ | 1,155,500,210 | |
| |
| |
| * | Transfers occurred between Level 1 and Level 2 due to foreign fair value adjustments. |
NOTE 4—Trustees’ and Officers’ Fees and Benefits
“Trustees’ and Officers’ Fees and Benefits” include amounts accrued by the Fund to pay remuneration to certain Trustees and Officers of the Fund. Trustees have the option to defer compensation payable by the Fund, and “Trustees’ and Officers’ Fees and Benefits” also include amounts accrued by the Fund to fund such deferred compensation amounts. Those Trustees who defer compensation have the option to select various Invesco Funds in which their deferral accounts shall be deemed to be invested. Finally, certain current Trustees are eligible to participate in a retirement plan that provides for benefits to be paid upon retirement to Trustees over a period of time based on the number of years of service. The Fund may have certain former Trustees who also participate in a retirement plan and receive benefits under such plan. “Trustees’ and Officers’ Fees and Benefits” include amounts accrued by the Fund to fund such retirement benefits. Obligations under the deferred compensation and retirement plans represent unsecured claims against the general assets of the Fund.
During the year ended December 31, 2011, the Fund paid legal fees of $2,606 for services rendered by Kramer, Levin, Naftalis & Frankel LLP as counsel to the Independent Trustees. A partner of that firm is a Trustee of the Trust.
NOTE 5—Cash Balances
The Fund is permitted to temporarily carry a negative or overdrawn balance in its account with The State Street Bank and Trust Company, the custodian bank. To compensate the custodian bank for such overdrafts, the overdrawn Fund may either (1) leave funds as a compensating balance in the account so the custodian bank can be compensated by earning the additional interest; or (2) compensate by paying the custodian bank at a rate agreed upon by the custodian bank and Invesco, not to exceed the contractually agreed upon rate.
NOTE 6—Distributions to Shareholders and Tax Components of Net Assets
Tax Character of Distributions to Shareholders Paid During the Years Ended December 31, 2011 and 2010:
| | | | | | | | | |
| | | 2011 | | 2010 |
| |
| Ordinary income | | $ | 15,268,828 | | | $ | 21,022,400 | |
| |
Tax Components of Net Assets at Period-End:
| | | | | |
| | | 2011 |
| |
| Undistributed ordinary income | | $ | 18,518,772 | |
| |
| Net unrealized appreciation — investments | | | 185,778,657 | |
| |
| Net unrealized appreciation — other investments | | | 260,384 | |
| |
| Temporary book/tax differences | | | (178,985 | ) |
| |
| Capital loss carryforward | | | (236,368,015 | ) |
| |
| Shares of beneficial interest | | | 1,183,401,097 | |
| |
| Total net assets | | $ | 1,151,411,910 | |
| |
The difference between book-basis and tax-basis unrealized appreciation (depreciation) is due to differences in the timing of recognition of gains and losses on investments for tax and book purposes. The Fund’s net unrealized appreciation difference is attributable primarily to wash sales.
The temporary book/tax differences are a result of timing differences between book and tax recognition of income and/or expenses. The Fund’s temporary book/tax differences are the result of the trustee deferral of compensation and retirement plan benefits.
Capital loss carryforward is calculated and reported as of a specific date. Results of transactions and other activity after that date may affect the amount of capital loss carryforward actually available for the Fund to utilize. The Regulated Investment Company Modernization Act of 2010 (the “Act”) eliminated the eight-year carryover period for capital losses that arise in taxable years beginning after its enactment date of December 22, 2010. Consequently, these capital losses can be carried forward for an unlimited period. However, capital losses with an expiration period may not be used to offset capital gains until all net capital losses without an expiration date have been utilized. Additionally, post-enactment capital loss carryovers will retain their character as either short-term or long-term capital losses instead of as short-term capital losses as under prior law. The ability to utilize capital loss carryforward in the future may be limited under the Internal Revenue Code and related regulations based on the results of future transactions. Under these limitation rules, the Fund is limited to utilizing $226,177,234 of capital loss carryforward in the fiscal year ending December 31, 2012.
Invesco V.I. International Growth Fund
The Fund utilized $46,997,606 of capital loss carryforward in the current period to offset net realized capital gain for federal income tax purposes. The Fund has a capital loss carryforward as of December 31, 2011, which expires as follows:
| | | | | |
| Capital Loss Carryforward |
| Expiration | | Short-Term |
| |
| December 31, 2016 | | $ | 55,375,763 | |
| |
| December 31, 2017 | | | 143,189,697 | |
| |
| December 31, 2018 | | | 37,802,555 | |
| |
| | | $ | 236,368,015 | |
| |
| |
| * | Capital loss carryforward as of the date listed above is reduced for limitations, if any, to the extent required by the Internal Revenue Code. |
NOTE 7—Investment Securities
The aggregate amount of investment securities (other than short-term securities, U.S. Treasury obligations and money market funds, if any) purchased and sold by the Fund during the year ended December 31, 2011 was $335,013,091 and $280,952,344, respectively. Cost of investments on a tax basis includes the adjustments for financial reporting purposes as of the most recently completed Federal income tax reporting period-end.
| | | | | |
| Unrealized Appreciation (Depreciation) of Investment Securities on a Tax Basis |
| |
| Aggregate unrealized appreciation of investment securities | | $ | 222,745,738 | |
| |
| Aggregate unrealized (depreciation) of investment securities | | | (36,967,081 | ) |
| |
| Net unrealized appreciation of investment securities | | $ | 185,778,657 | |
| |
| Cost of investments for tax purposes is $969,721,553. |
NOTE 8—Reclassification of Permanent Differences
Primarily as a result of differing book/tax treatment of expired capital loss carryforward and foreign currency transactions, on December 31, 2011, undistributed net investment income was decreased by $512,075, undistributed net realized gain (loss) was increased by $29,108,216 and shares of beneficial interest decreased by $28,596,141. Further, as a result of tax deferrals and capital loss carryforward acquired in the reorganization of Invesco Van Kampen V.I. International Growth Equity Fund into the Fund, undistributed net investment income was decreased by $2,680, undistributed net realized gain (loss) was decreased by $44,174,791 and shares of beneficial interest increased by $44,177,471. These reclassifications had no effect on the net assets of the Fund.
Invesco V.I. International Growth Fund
NOTE 9—Share Information
| | | | | | | | | | | | | | | | | |
| | | Summary of Share Activity |
| |
| | | Year ended December 31, |
| | | 2011(a) | | 2010 |
| | | Shares | | Amount | | Shares | | Amount |
| |
| Sold: | | | | | | | | | | | | | | | | |
| Series I | | | 4,674,557 | | | $ | 132,444,153 | | | | 3,482,926 | | | $ | 94,266,556 | |
| |
| Series II | | | 5,695,478 | | | | 157,043,118 | | | | 6,653,404 | | | | 171,405,013 | |
| |
| Issued as reinvestment of dividends: | | | | | | | | | | | | | | | | |
| Series I | | | 292,246 | | | | 8,703,100 | | | | 445,770 | | | | 11,906,519 | |
| |
| Series II | | | 222,492 | | | | 6,565,728 | | | | 345,168 | | | | 9,115,882 | |
| |
Issued in connection with acquisitions:(b) | | | | | | | | | | | | | | | | |
| Series I | | | 426 | | | | 13,190 | | | | — | | | | — | |
| |
| Series II | | | 1,107,888 | | | | 34,002,342 | | | | — | | | | — | |
| |
| Reacquired: | | | | | | | | | | | | | | | | |
| Series I | | | (4,761,021 | ) | | | (134,565,205 | ) | | | (4,909,461 | ) | | | (126,100,722 | ) |
| |
| Series II | | | (3,833,060 | ) | | | (106,754,825 | ) | | | (45,442,204 | ) | | | (1,083,531,067 | ) |
| |
| Net increase (decrease) in share activity | | | 3,399,006 | | | $ | 97,451,601 | | | | (39,424,397 | ) | | $ | (922,937,819 | ) |
| |
| | |
| (a) | | There are entities that are record owners of more than 5% of the outstanding shares of the Fund and in the aggregate own 35% of the outstanding shares of the Fund. The Fund and the Fund’s principal underwriter or adviser, are parties to participation agreements with these entities whereby these entities sell units of interest in separate accounts funding variable products that are invested in the Fund. The Fund, Invesco and/or Invesco affiliates may make payments to these entities, which are considered to be related to the Fund, for providing services to the Fund, Invesco and/or Invesco affiliates including but not limited to services such as, securities brokerage, third party record keeping and account servicing and administrative services. The Fund has no knowledge as to whether all or any portion of the shares owned of record by these entities are also owned beneficially. |
| (b) | | As of the open of business on May 2, 2011, the Fund acquired all the net assets of Invesco Van Kampen V.I. International Growth Equity Fund (the “Target Fund”) pursuant to a plan of reorganization approved by the Trustees of the Fund on November 10, 2010 and by the shareholders of the Target Fund on April 1, 2011. The acquisition was accomplished by a tax-free exchange of 1,108,314 shares of the Fund for 3,524,810 shares outstanding of the Target Fund as of the close of business on April 29, 2011. Each class of the Target Fund was exchanged for the like class of shares of the Fund based on the relative net asset value of the Target Fund to the net asset value of the Fund on the close of business, April 29, 2011. The Target Fund’s net assets at that date of $34,015,533 including $7,388,865 of unrealized appreciation, was combined with those of the Fund. The net assets of the Fund immediately before the acquisition were $1,248,419,884. The net assets of the Fund immediately following the acquisition were $1,282,435,417. |
| | The pro forma results of operations for the year ended December 31, 2011, assuming the reorganization had been completed on January 1, 2011, the beginning of the annual reporting period are as follows: |
| | | | | |
| Net investment income | | $ | 19,406,572 | |
| Net realized/unrealized gains (losses) | | | (102,914,763 | ) |
| | | | | |
| Change in net assets resulting from operations | | $ | (83,508,191 | ) |
| | |
| | | The combined investment portfolios have been managed as a single integrated portfolio since the acquisition was completed, it is not practicable to separate the amounts of revenue and earrings of the Target Fund that have been included in the Fund’s Statement of Operations since May 2, 2011. |
NOTE 10—Financial Highlights
The following schedule presents financial highlights for a share of the Fund outstanding throughout the periods indicated.
| | | | | | | | | | | | | | | | | | | | | | | | | | | | | | | | | | | | | | | | | | | | | | | | | | | | | | | | | |
| | | | | | | | | | | | | | | | | | | | | | | Ratio of
| | Ratio of
| | | | |
| | | | | | | Net gains
| | | | | | | | | | | | | | | | expenses
| | expenses
| | | | |
| | | | | | | (losses)
| | | | | | | | | | | | | | | | to average
| | to average net
| | Ratio of net
| | |
| | | Net asset
| | | | on securities
| | | | Dividends
| | Distributions
| | | | | | | | | | net assets
| | assets without
| | investment
| | |
| | | value,
| | Net
| | (both
| | Total from
| | from net
| | from net
| | | | Net asset
| | | | Net assets,
| | with fee waivers
| | fee waivers
| | income
| | |
| | | beginning
| | investment
| | realized and
| | investment
| | investment
| | realized
| | Total
| | value, end
| | Total
| | end of period
| | and/or expenses
| | and/or expenses
| | to average
| | Portfolio
|
| | | of period | | income(a) | | unrealized) | | operations | | income | | gains | | Distributions | | of period | | Return(b) | | (000s omitted) | | absorbed | | absorbed | | net assets | | turnover(c) |
| |
| Series I |
| Year ended 12/31/11 | | $ | 28.69 | | | $ | 0.50 | | | $ | (2.38 | ) | | $ | (1.88 | ) | | $ | (0.44 | ) | | $ | — | | | $ | (0.44 | ) | | $ | 26.37 | | | | (6.74 | )% | | $ | 544,143 | | | | 1.02 | %(d) | | | 1.03 | %(d) | | | 1.75 | %(d) | | | 26 | % |
| Year ended 12/31/10 | | | 26.01 | | | | 0.38 | | | | 2.92 | | | | 3.30 | | | | (0.62 | ) | | | — | | | | (0.62 | ) | | | 28.69 | | | | 12.86 | | | | 586,219 | | | | 1.03 | | | | 1.04 | | | | 1.46 | | | | 38 | |
| Year ended 12/31/09 | | | 19.49 | | | | 0.32 | | | | 6.55 | | | | 6.87 | | | | (0.35 | ) | | | — | | | | (0.35 | ) | | | 26.01 | | | | 35.24 | | | | 556,883 | | | | 1.02 | | | | 1.04 | | | | 1.47 | | | | 27 | |
| Year ended 12/31/08 | | | 33.63 | | | | 0.54 | | | | (14.16 | ) | | | (13.62 | ) | | | (0.15 | ) | | | (0.37 | ) | | | (0.52 | ) | | | 19.49 | | | | (40.38 | ) | | | 446,437 | | | | 1.05 | | | | 1.06 | | | | 1.96 | | | | 44 | |
| Year ended 12/31/07 | | | 29.44 | | | | 0.34 | | | | 3.98 | | | | 4.32 | | | | (0.13 | ) | | | — | | | | (0.13 | ) | | | 33.63 | | | | 14.68 | | | | 792,779 | | | | 1.06 | | | | 1.07 | | | | 1.06 | | | | 20 | |
| |
| Series II |
| Year ended 12/31/11 | | | 28.35 | | | | 0.42 | | | | (2.36 | ) | | | (1.94 | ) | | | (0.33 | ) | | | — | | | | (0.33 | ) | | | 26.08 | | | | (6.99 | ) | | | 607,269 | | | | 1.27 | (d) | | | 1.28 | (d) | | | 1.50 | (d) | | | 26 | |
| Year ended 12/31/10 | | | 25.63 | | | | 0.31 | | | | 2.89 | | | | 3.20 | | | | (0.48 | ) | | | — | | | | (0.48 | ) | | | 28.35 | | | | 12.61 | | | | 569,610 | | | | 1.28 | | | | 1.29 | | | | 1.21 | | | | 38 | |
| Year ended 12/31/09 | | | 19.23 | | | | 0.27 | | | | 6.44 | | | | 6.71 | | | | (0.31 | ) | | | — | | | | (0.31 | ) | | | 25.63 | | | | 34.91 | | | | 1,500,514 | | | | 1.27 | | | | 1.29 | | | | 1.22 | | | | 27 | |
| Year ended 12/31/08 | | | 33.24 | | | | 0.45 | | | | (13.96 | ) | | | (13.51 | ) | | | (0.13 | ) | | | (0.37 | ) | | | (0.50 | ) | | | 19.23 | | | | (40.55 | ) | | | 793,365 | | | | 1.30 | | | | 1.31 | | | | 1.71 | | | | 44 | |
| Year ended 12/31/07 | | | 29.16 | | | | 0.26 | | | | 3.94 | | | | 4.20 | | | | (0.12 | ) | | | — | | | | (0.12 | ) | | | 33.24 | | | | 14.41 | | | | 745,206 | | | | 1.31 | | | | 1.32 | | | | 0.81 | | | | 20 | |
| |
| | |
| (a) | | Calculated using the average shares outstanding. |
| (b) | | Includes adjustments in accordance with accounting principles generally accepted in the United States of America and as such, the net asset value for financial reporting purposes and the returns based upon those net asset values may differ from the net asset value and returns for shareholder transactions. Total returns are not annualized for periods less than one year, if applicable and do not reflect charges assessed in connection with a variable product, which if included would reduce total returns. |
| (c) | | Portfolio turnover is calculated at the fund level and is not annualized for periods less than one year, if applicable. For the period ending December 31, 2011, the portfolio turnover calculation excludes the value of securities purchased of $23,376,285 and sold of $8,831,296 in the effort to realign the Fund’s portfolio holdings after the reorganization of Invesco Van Kampen V.I. International Growth Equity Fund into the Fund. |
| (d) | | Ratios are based on average daily net assets (000’s omitted) of $577,422 and $602,062 for Series I and Series II shares, respectively. |
Invesco V.I. International Growth Fund
Report of Independent Registered Public Accounting Firm
To the Board of Trustees of AIM Variable Insurance Funds (Invesco Variable Insurance Funds)
and Shareholders of Invesco V.I. International Growth Fund:
In our opinion, the accompanying statement of assets and liabilities, including the schedule of investments, and the related statements of operations and of changes in net assets and the financial highlights present fairly, in all material respects, the financial position of Invesco V.I. International Growth Fund (one of the funds constituting AIM Variable Insurance Funds (Invesco Variable Insurance Funds), hereafter referred to as the “Fund”) at December 31, 2011, the results of its operations for the year then ended, the changes in its net assets for each of the two years in the period then ended and the financial highlights for each of the five years in the period then ended, in conformity with accounting principles generally accepted in the United States of America. These financial statements and financial highlights (hereafter referred to as “financial statements”) are the responsibility of the Fund’s management; our responsibility is to express an opinion on these financial statements based on our audits. We conducted our audits of these financial statements in accordance with the standards of the Public Company Accounting Oversight Board (United States). Those standards require that we plan and perform the audits to obtain reasonable assurance about whether the financial statements are free of material misstatement. An audit includes examining, on a test basis, evidence supporting the amounts and disclosures in the financial statements, assessing the accounting principles used and significant estimates made by management, and evaluating the overall financial statement presentation. We believe that our audits, which included confirmation of securities at December 31, 2011 by correspondence with the custodian and brokers, provide a reasonable basis for our opinion.
PRICEWATERHOUSECOOPERS LLP
February 14, 2012
Houston, Texas
Invesco V.I. International Growth Fund
Calculating your ongoing Fund expenses
Example
As a shareholder of the Fund, you incur ongoing costs, including management fees; distribution and/or service fees (12b-1); and other Fund expenses. This example is intended to help you understand your ongoing costs (in dollars) of investing in the Fund and to compare these costs with ongoing costs of investing in other mutual funds. The example is based on an investment of $1,000 invested at the beginning of the period and held for the entire period July 1, 2011 through December 31, 2011.
The actual and hypothetical expenses in the examples below do not represent the effect of any fees or other expenses assessed in connection with a variable product; if they did, the expenses shown would be higher while the ending account values shown would be lower.
Actual expenses
The table below provides information about actual account values and actual expenses. You may use the information in this table, together with the amount you invested, to estimate the expenses that you paid over the period. Simply divide your account value by $1,000 (for example, an $8,600 account value divided by $1,000 = 8.6), then multiply the result by the number in the table under the heading entitled “Actual Expenses Paid During Period” to estimate the expenses you paid on your account during this period.
Hypothetical example for comparison purposes
The table below also provides information about hypothetical account values and hypothetical expenses based on the Fund’s actual expense ratio and an assumed rate of return of 5% per year before expenses, which is not the Fund’s actual return.
The hypothetical account values and expenses may not be used to estimate the actual ending account balance or expenses you paid for the period. You may use this information to compare the ongoing costs of investing in the Fund and other funds. To do so, compare this 5% hypothetical example with the 5% hypothetical examples that appear in the shareholder reports of the other funds.
Please note that the expenses shown in the table are meant to highlight your ongoing costs. Therefore, the hypothetical information is useful in comparing ongoing costs, and will not help you determine the relative total costs of owning different funds.
| | | | | | | | | | | | | | | | | | | | | | | | | | | | | | | |
| | | | | | | | | | HYPOTHETICAL
| | | |
| | | | | | | | | | (5% annual return before
| | | |
| | | | | | | ACTUAL | | | expenses) | | | |
| | | | Beginning
| | | Ending
| | | Expenses
| | | Ending
| | | Expenses
| | | Annualized
|
| | | | Account Value
| | | Account Value
| | | Paid During
| | | Account Value
| | | Paid During
| | | Expense
|
| Class | | | (07/01/11) | | | (12/31/11)1 | | | Period2 | | | (12/31/11) | | | Period2 | | | Ratio |
| Series I | | | $ | 1,000.00 | | | | $ | 874.60 | | | | $ | 4.82 | | | | $ | 1,020.06 | | | | $ | 5.19 | | | | | 1.02 | % |
| | | | | | | | | | | | | | | | | | | | | | | | | | | | | | | |
| Series II | | | | 1,000.00 | | | | | 873.40 | | | | | 6.00 | | | | | 1,018.80 | | | | | 6.46 | | | | | 1.27 | |
| | | | | | | | | | | | | | | | | | | | | | | | | | | | | | | |
| |
| 1 | The actual ending account value is based on the actual total return of the Fund for the period July 1, 2011 through December 31, 2011, after actual expenses and will differ from the hypothetical ending account value which is based on the Fund’s expense ratio and a hypothetical annual return of 5% before expenses. |
| 2 | Expenses are equal to the Fund’s annualized expense ratio as indicated above multiplied by the average account value over the period, multiplied by 184/365 to reflect the most recent fiscal half year. |
Invesco V.I. International Growth Fund
Form 1099-DIV, Form 1042-S and other year-end tax information provide shareholders with actual calendar year amounts that should be included in their tax returns. Shareholders should consult their tax advisors.
The following distribution information is being provided as required by the Internal Revenue Code or to meet a specific state’s requirement.
The Fund designates the following amounts or, if subsequently determined to be different, the maximum amount allowable for its fiscal year ended December 31, 2011:
| | | | | |
Federal and State Income Tax | | |
| |
| Corporate Dividends Received Deduction* | | | 0% | |
| Foreign Taxes | | $ | 0.0523 per share | |
| Foreign Source Income | | $ | 0.8758 per share | |
| | |
| | * | The above percentages are based on ordinary income dividends paid to shareholders during the Fund’s fiscal year. |
Invesco V.I. International Growth Fund
Trustees and Officers
The address of each trustee and officer is AIM Variable Insurance Funds (Invesco Variable Insurance Funds) (the “Trust”), 11 Greenway Plaza, Suite 2500, Houston, Texas 77046-1173. The trustees serve for the life of the Trust, subject to their earlier death, incapacitation, resignation, retirement or removal as more specifically provided in the Trust’s organizational documents. Each officer serves for a one year term or until their successors are elected and qualified. Column two below includes length of time served with predecessor entities, if any.
| | | | | | | | | |
| | | | | | | Number of Funds
| | |
Name, Year of Birth and
| | Trustee and/
| | Principal Occupation(s)
| | in Fund Complex
| | Other Directorship(s)
|
| Position(s) Held with the Trust | | or Officer Since | | During Past 5 Years | | Overseen by Trustee | | Held by Trustee |
| | | | | | | | | |
| | | | | | | | | |
| | | | | | | | | |
| Interested Persons | | | | | | | | |
| | | | | | | | | |
| | | | | | | | | |
| | | | | | | | | |
Martin L. Flanagan1 — 1960
Trustee | | 2007 | | Executive Director, Chief Executive Officer and President, Invesco Ltd. (ultimate parent of Invesco and a global investment management firm); Advisor to the Board, Invesco Advisers, Inc. (formerly known as Invesco Institutional (N.A.), Inc.); Trustee, The Invesco Funds; Vice Chair, Investment Company Institute; and Member of Executive Board, SMU Cox School of Business
Formerly: Chairman, Invesco Advisers, Inc. (registered investment adviser); Director, Chairman, Chief Executive Officer and President, IVZ Inc. (holding company), INVESCO Group Services, Inc. (service provider) and Invesco North American Holdings, Inc. (holding company); Director, Chief Executive Officer and President, Invesco Holding Company Limited (parent of Invesco and a global investment management firm); Director, Invesco Ltd.; Chairman, Investment Company Institute and President, Co-Chief Executive Officer, Co-President, Chief Operating Officer and Chief Financial Officer, Franklin Resources, Inc. (global investment management organization) | | 140 | | None |
| | | | | | | | | |
| | | | | | | | | |
| | | | | | | | | |
Philip A. Taylor2 — 1954
Trustee, President and Principal Executive Officer | | 2006 | | Head of North American Retail and Senior Managing Director, Invesco Ltd.; Director, Co-Chairman, Co-President and Co-Chief Executive Officer, Invesco Advisers, Inc. (formerly known as Invesco Institutional (N.A.), Inc.) (registered investment adviser); Director, Chairman, Chief Executive Officer and President, Invesco Management Group, Inc. (formerly Invesco Aim Management Group, Inc.) (financial services holding company); Director and President, INVESCO Funds Group, Inc. (registered investment adviser and registered transfer agent); Director and Chairman, Invesco Investment Services, Inc. (formerly known as Invesco Aim Investment Services, Inc.) (registered transfer agent) and IVZ Distributors, Inc. (formerly known as INVESCO Distributors, Inc.) (registered broker dealer); Director, President and Chairman, Invesco Inc. (holding company) and Invesco Canada Holdings Inc. (holding company); Chief Executive Officer, Invesco Corporate Class Inc. (corporate mutual fund company) and Invesco Canada Fund Inc. (corporate mutual fund company); Director, Chairman and Chief Executive Officer, Invesco Canada Ltd. (formerly known as Invesco Trimark Ltd./Invesco Trimark Ltèe) (registered investment adviser and registered transfer agent); Trustee, President and Principal Executive Officer, The Invesco Funds (other than AIM Treasurer’s Series Trust (Invesco Treasurer’s Series Trust) and Short-Term Investments Trust); Trustee and Executive Vice President, The Invesco Funds (AIM Treasurer’s Series Trust (Invesco Treasurer’s Series Trust) and Short-Term Investments Trust only); Director, Invesco Investment Advisers LLC (formerly known as Van Kampen Asset Management); Director, Chief Executive Officer and President, Van Kampen Exchange Corp. | | 140 | | None |
| | | | | | | | | |
| | | | | | | | | |
| | | | | Formerly: Director and Chairman, Van Kampen Investor Services Inc.: Director, Chief Executive Officer and President, 1371 Preferred Inc. (holding company); and Van Kampen Investments Inc.; Director and President, AIM GP Canada Inc. (general partner for limited partnerships); and Van Kampen Advisors, Inc.; Director and Chief Executive Officer, Invesco Trimark Dealer Inc. (registered broker dealer); Director, Invesco Distributors, Inc. (formerly known as Invesco Aim Distributors, Inc.) (registered broker dealer); Manager, Invesco PowerShares Capital Management LLC; Director, Chief Executive Officer and President, Invesco Advisers, Inc.; Director, Chairman, Chief Executive Officer and President, Invesco Aim Capital Management, Inc.; President, Invesco Trimark Dealer Inc. and Invesco Trimark Ltd./Invesco Trimark Ltèe; Director and President, AIM Trimark Corporate Class Inc. and AIM Trimark Canada Fund Inc.; Senior Managing Director, Invesco Holding Company Limited; Trustee and Executive Vice President, Tax-Free Investments Trust; Director and Chairman, Fund Management Company (former registered broker dealer); President and Principal Executive Officer, The Invesco Funds (AIM Treasurer’s Series Trust (Invesco Treasurer’s Series Trust), Short-Term Investments Trust and Tax-Free Investments Trust only); President, AIM Trimark Global Fund Inc. and AIM Trimark Canada Fund Inc. | | | | |
| | | | | | | | | |
| | | | | | | | | |
| | | | | | | | | |
Wayne W. Whalen3 — 1939
Trustee | | 2010 | | Of Counsel, and prior to 2010, partner in the law firm of Skadden, Arps, Slate, Meagher & Flom LLP, legal counsel to funds in the Fund Complex | | 158 | | Director of the Abraham Lincoln Presidential Library Foundation |
| | | | | | | | | |
| | | | | | | | | |
| | | | | | | | | |
| Independent Trustees | | | | | | | | |
| | | | | | | | | |
| | | | | | | | | |
| | | | | | | | | |
Bruce L. Crockett — 1944
Trustee and Chair | | 1993 | | Chairman, Crockett Technology Associates (technology consulting company) | | 140 | | ACE Limited (insurance company); and Investment Company Institute |
| | | | | Formerly: Director, Captaris (unified messaging provider); Director, President and Chief Executive Officer COMSAT Corporation; and Chairman, Board of Governors of INTELSAT (international communications company) | | | | |
| | | | | | | | | |
| |
| 1 | Mr. Flanagan is considered an interested person of the Trust because he is an officer of the adviser to the Trust, and an officer and a director of Invesco Ltd., ultimate parent of the adviser to the Trust. |
| 2 | Mr. Taylor is considered an interested person of the Trust because he is an officer and a director of the adviser to, and a director of the principal underwriter of, the Trust. |
| 3 | Mr. Whalen is considered an “interested person” (within the meaning of Section 2(a)(19) of the 1940 Act) of certain Funds in the Fund Complex by reason of he and his firm currently providing legal services as legal counsel to such Funds in the Fund Complex. |
Invesco V.I. International Growth Fund
Trustees and Officers—(continued)
The address of each trustee and officer is AIM Variable Insurance Funds (Invesco Variable Insurance Funds) (the “Trust”), 11 Greenway Plaza, Suite 2500, Houston, Texas 77046-1173. The trustees serve for the life of the Trust, subject to their earlier death, incapacitation, resignation, retirement or removal as more specifically provided in the Trust’s organizational documents. Each officer serves for a one year term or until their successors are elected and qualified. Column two below includes length of time served with predecessor entities, if any.
| | | | | | | | | |
| | | | | | | Number of Funds
| | |
Name, Year of Birth and
| | Trustee and/
| | Principal Occupation(s)
| | in Fund Complex
| | Other Directorship(s)
|
| Position(s) Held with the Trust | | or Officer Since | | During Past 5 Years | | Overseen by Trustee | | Held by Trustee |
| | | | | | | | | |
| | | | | | | | | |
| | | | | | | |
Independent Trustees—(continued) | | | | | | |
| | | | | | | | | |
| | | | | | | | | |
| | | | | | | | | |
David C. Arch — 1945
Trustee | | 2010 | | Chairman and Chief Executive Officer of Blistex Inc., a consumer health care products manufacturer. | | 158 | | Member of the Heartland Alliance Advisory Board, a nonprofit organization serving human needs based in Chicago. Board member of the Illinois Manufacturers’ Association. Member of the Board of Visitors, Institute for the Humanities, University of Michigan |
| | | | | | | | | |
| | | | | | | | | |
| | | | | | | | | |
Frank S. Bayley — 1939
Trustee | | 2001 | | Retired
Formerly: Director, Badgley Funds, Inc. (registered investment company) (2 portfolios) and Partner, law firm of Baker & McKenzie
Formerly: Director, Badgley Funds, Inc. (registered investment company) (2 portfolios) and Partner, law firm of Baker & McKenzie | | 140 | | Director and Chairman, C.D. Stimson Company (a real estate investment company) |
| | | | | | | | | |
| | | | | | | | | |
| | | | | | | | | |
James T. Bunch — 1942
Trustee | | 2004 | | Managing Member, Grumman Hill Group LLC (family office private equity management)
Formerly: Founder, Green, Manning & Bunch Ltd. (investment banking firm)(1988-2010); Executive Committee, United States Golf Association; and Director, Policy Studies, Inc. and Van Gilder Insurance Corporation | | 140 | | Vice Chairman, Board of Governors, Western Golf Association/Evans Scholars Foundation and Director, Denver Film Society |
| | | | | | | | | |
| | | | | | | | | |
| | | | | | | | | |
Rodney F. Dammeyer — 1940
Trustee | | 2010 | | President of CAC, LLC, a private company offering capital investment and management advisory services.
Formerly: Prior to January 2004, Director of TeleTech Holdings Inc.; Prior to 2002, Director of Arris Group, Inc.; Prior to 2001, Managing Partner at Equity Group Corporate Investments. Prior to 1995, Vice Chairman of Anixter International. Prior to 1985, experience includes Senior Vice President and Chief Financial Officer of Household International, Inc., Executive Vice President and Chief Financial Officer of Northwest Industries, Inc. and Partner of Arthur Andersen & Co. | | 158 | | Director of Quidel Corporation and Stericycle, Inc. Prior to May 2008, Trustee of The Scripps Research Institute. Prior to February 2008, Director of Ventana Medical Systems, Inc. Prior to April 2007, Director of GATX Corporation. Prior to April 2004, Director of TheraSense, Inc. |
| | | | | | | | | |
| | | | | | | | | |
| | | | | | | | | |
Albert R. Dowden — 1941
Trustee | | 2000 | | Director of a number of public and private business corporations, including the Boss Group, Ltd. (private investment and management); Reich & Tang Funds (5 portfolios) (registered investment company); and Homeowners of America Holding Corporation/ Homeowners of America Insurance Company (property casualty company)
Formerly: Director, Continental Energy Services, LLC (oil and gas pipeline service); Director, CompuDyne Corporation (provider of product and services to the public security market) and Director, Annuity and Life Re (Holdings), Ltd. (reinsurance company); Director, President and Chief Executive Officer, Volvo Group North America, Inc.; Senior Vice President, AB Volvo; Director of various public and private corporations; Chairman, DHJ Media, Inc.; Director Magellan Insurance Company; and Director, The Hertz Corporation, Genmar Corporation (boat manufacturer), National Media Corporation; Advisory Board of Rotary Power International (designer, manufacturer, and seller of rotary power engines); and Chairman, Cortland Trust, Inc. (registered investment company) | | 140 | | Board of Nature’s Sunshine Products, Inc. |
| | | | | | | | | |
| | | | | | | | | |
| | | | | | | | | |
Jack M. Fields — 1952
Trustee | | 1997 | | Chief Executive Officer, Twenty First Century Group, Inc. (government affairs company); and Owner and Chief Executive Officer, Dos Angelos Ranch, L.P. (cattle, hunting, corporate entertainment), Discovery Global Education Fund (non-profit) and Cross Timbers Quail Research Ranch (non-profit)
Formerly: Chief Executive Officer, Texana Timber LP (sustainable forestry company) and member of the U.S. House of Representatives | | 140 | | Administaff |
| | | | | | | | | |
| | | | | | | | | |
| | | | | | | | | |
Carl Frischling — 1937
Trustee | | 1993 | | Partner, law firm of Kramer Levin Naftalis and Frankel LLP | | 140 | | Director, Reich & Tang Funds (16 portfolios) |
| | | | | | | | | |
| | | | | | | | | |
Invesco V.I. International Growth Fund
Trustees and Officers—(continued)
The address of each trustee and officer is AIM Variable Insurance Funds (Invesco Variable Insurance Funds) (the “Trust”), 11 Greenway Plaza, Suite 2500, Houston, Texas 77046-1173. The trustees serve for the life of the Trust, subject to their earlier death, incapacitation, resignation, retirement or removal as more specifically provided in the Trust’s organizational documents. Each officer serves for a one year term or until their successors are elected and qualified. Column two below includes length of time served with predecessor entities, if any.
| | | | | | | | | |
| | | | | | | Number of Funds
| | |
Name, Year of Birth and
| | Trustee and/
| | Principal Occupation(s)
| | in Fund Complex
| | Other Directorship(s)
|
| Position(s) Held with the Trust | | or Officer Since | | During Past 5 Years | | Overseen by Trustee | | Held by Trustee |
| | | Independent Trustees—(continued) | | | | |
| | | | | | | | | |
| | | | | | | | | |
| | | | | | | | | |
Prema Mathai-Davis — 1950
Trustee | | 1998 | | Retired
Formerly: Chief Executive Officer, YWCA of the U.S.A. | | 140 | | None |
| | | | | | | | | |
| | | | | | | | | |
| | | | | | | | | |
Larry Soll — 1942
Trustee | | 2004 | | Retired
Formerly, Chairman, Chief Executive Officer and President, Synergen Corp. (a biotechnology company) | | 140 | | None |
| | | | | | | | | |
| | | | | | | | | |
| | | | | | | | | |
Hugo F. Sonnenschein — 1940
Trustee | | 2010 | | President Emeritus and Honorary Trustee of the University of Chicago and the Adam Smith Distinguished Service Professor in the Department of Economics at the University of Chicago. Prior to July 2000, President of the University of Chicago. | | 158 | | Trustee of the University of Rochester and a member of its investment committee. Member of the National Academy of Sciences, the American Philosophical Society and a fellow of the American Academy of Arts and Sciences |
| | | | | | | | | |
| | | | | | | | | |
| | | | | | | | | |
| Raymond Stickel, Jr. — 1944 Trustee | | 2005 | | Retired
Formerly: Director, Mainstay VP Series Funds, Inc. (25 portfolios) and Partner, Deloitte & Touche | | 140 | | None |
| | | | | | | | | |
| | | | | | | | | |
| | | | | | | | | |
| Other Officers | | | | | | | | |
| | | | | | | | | |
| | | | | | | | | |
| | | | | | | | | |
Russell C. Burk — 1958
Senior Vice President and Senior Officer | | 2005 | | Senior Vice President and Senior Officer, The Invesco Funds | | N/A | | N/A |
| | | | | | | | | |
| | | | | | | | | |
| | | | | | | | | |
John M. Zerr — 1962
Senior Vice President, Chief Legal Officer and Secretary | | 2006 | | Director, Senior Vice President, Secretary and General Counsel, Invesco Management Group, Inc. (formerly known as Invesco Aim Management Group, Inc.) and Van Kampen Exchange Corp.; Senior Vice President, Invesco Advisers, Inc. (formerly known as Invesco Institutional (N.A.), Inc.) (registered investment adviser); Senior Vice President and Secretary, Invesco Distributors, Inc. (formerly known as Invesco Aim Distributors, Inc.); Director, Vice President and Secretary, Invesco Investment Services, Inc. (formerly known as Invesco Aim Investment Services, Inc.) and IVZ Distributors, Inc. (formerly known as INVESCO Distributors, Inc.); Director and Vice President, INVESCO Funds Group, Inc.; Senior Vice President, Chief Legal Officer and Secretary, The Invesco Funds; Manager, Invesco PowerShares Capital Management LLC; Director, Secretary and General Counsel, Invesco Investment Advisers LLC (formerly known as Van Kampen Asset Management); Secretary and General Counsel, Van Kampen Funds Inc. and Chief Legal Officer, PowerShares Exchange-Traded Fund Trust, PowerShares Exchange-Traded Fund Trust II, PowerShares India Exchange-Traded Fund Trust and PowerShares Actively Managed Exchange-Traded Fund Trust
Formerly: Director and Secretary, Van Kampen Advisors Inc.; Director Vice President, Secretary and General Counsel Van Kampen Investor Services Inc.; Director, Invesco Distributors, Inc. (formerly known as Invesco Aim Distributors, Inc.); Director, Senior Vice President, General Counsel and Secretary, Invesco Advisers, Inc.; and Van Kampen Investments Inc.; Director, Vice President and Secretary, Fund Management Company; Director, Senior Vice President, Secretary, General Counsel and Vice President, Invesco Aim Capital Management, Inc.; Chief Operating Officer and General Counsel, Liberty Ridge Capital, Inc. (an investment adviser); Vice President and Secretary, PBHG Funds (an investment company) and PBHG Insurance Series Fund (an investment company); Chief Operating Officer, General Counsel and Secretary, Old Mutual Investment Partners (a broker-dealer); General Counsel and Secretary, Old Mutual Fund Services (an administrator) and Old Mutual Shareholder Services (a shareholder servicing center); Executive Vice President, General Counsel and Secretary, Old Mutual Capital, Inc. (an investment adviser); and Vice President and Secretary, Old Mutual Advisors Funds (an investment company) | | N/A | | N/A |
| | | | | | | | | |
| | | | | | | | | |
| | | | | | | | | |
Lisa O. Brinkley — 1959
Vice President | | 2004 | | Global Compliance Director, Invesco Ltd.; Chief Compliance Officer, Invesco Investment Services, Inc.(formerly known as Invesco Aim Investment Services, Inc.); and Vice President, The Invesco Funds
Formerly: Chief Compliance Officer, Invesco Distributors, Inc. (formerly known as Invesco Aim Distributors, Inc.) and Van Kampen Investor Services Inc.; Senior Vice President, Invesco Management Group, Inc.; Senior Vice President and Chief Compliance Officer, Invesco Advisers, Inc. and The Invesco Funds; Vice President and Chief Compliance Officer, Invesco Aim Capital Management, Inc. and Invesco Distributors, Inc.; Vice President, Invesco Investment Services, Inc. and Fund Management Company | | N/A | | N/A |
| | | | | | | | | |
Invesco V.I. International Growth Fund
Trustees and Officers—(continued)
The address of each trustee and officer is AIM Variable Insurance Funds (Invesco Variable Insurance Funds) (the “Trust”), 11 Greenway Plaza, Suite 2500, Houston, Texas 77046-1173. The trustees serve for the life of the Trust, subject to their earlier death, incapacitation, resignation, retirement or removal as more specifically provided in the Trust’s organizational documents. Each officer serves for a one year term or until their successors are elected and qualified. Column two below includes length of time served with predecessor entities, if any.
| | | | | | | | | |
| | | | | | | Number of Funds
| | |
Name, Year of Birth and
| | Trustee and/
| | Principal Occupation(s)
| | in Fund Complex
| | Other Directorship(s)
|
| Position(s) Held with the Trust | | or Officer Since | | During Past 5 Years | | Overseen by Trustee | | Held by Trustee |
| | | Other Officers—(continued) | | | | |
| | | | | | | | | |
| | | | | | | | | |
| | | | | | | | | |
Sheri Morris — 1964
Vice President, Treasurer and Principal Financial Officer | | 1999 | | Vice President, Treasurer and Principal Financial Officer, The Invesco Funds; Vice President, Invesco Advisers, Inc. (formerly known as Invesco Institutional (N.A.), Inc.) (registered investment adviser).
Formerly: Treasurer, PowerShares Exchange-Traded Fund Trust, PowerShares Exchange-Traded Fund Trust II, PowerShares India Exchange-Traded Fund Trust and PowerShares Actively Managed Exchange-Traded Fund Trust, Vice President, Invesco Advisers, Inc., Invesco Aim Capital Management, Inc. and Invesco Aim Private Asset Management, Inc.; Assistant Vice President and Assistant Treasurer, The Invesco Funds and Assistant Vice President, Invesco Advisers, Inc., Invesco Aim Capital Management, Inc. and Invesco Aim Private Asset Management, Inc. | | N/A | | N/A |
| | | | | | | | | |
| | | | | | | | | |
| | | | | | | | | |
Karen Dunn Kelley — 1960
Vice President | | 1993 | | Head of Invesco’s World Wide Fixed Income and Cash Management Group; Senior Vice President, Invesco Management Group, Inc. (formerly known as Invesco Aim Management Group, Inc.) and Invesco Advisers, Inc. (formerly known as Invesco Institutional (N.A.), Inc.) (registered investment adviser); Executive Vice President, Invesco Distributors, Inc. (formerly known as Invesco Aim Distributors, Inc.); Director, Invesco Mortgage Capital Inc.; Vice President, The Invesco Funds (other than AIM Treasurer’s Series Trust (Invesco Treasurer’s Series Trust) and Short-Term Investments Trust); and President and Principal Executive Officer, The Invesco Funds (AIM Treasurer’s Series Trust (Invesco Treasurer’s Series Trust) and Short-Term Investments Trust only).
Formerly: Senior Vice President, Van Kampen Investments Inc.; Vice President, Invesco Advisers, Inc. (formerly known as Invesco Institutional (N.A.), Inc.); Director of Cash Management and Senior Vice President, Invesco Advisers, Inc. and Invesco Aim Capital Management, Inc.; President and Principal Executive Officer, Tax-Free Investments Trust; Director and President, Fund Management Company; Chief Cash Management Officer, Director of Cash Management, Senior Vice President, and Managing Director, Invesco Aim Capital Management, Inc.; Director of Cash Management, Senior Vice President, and Vice President, Invesco Advisers, Inc. and The Invesco Funds (AIM Treasurer’s Series Trust (Invesco Treasurer’s Series Trust), Short-Term Investments Trust and Tax-Free Investments Trust only) | | N/A | | N/A |
| | | | | | | | | |
| | | | | | | | | |
| | | | | | | | | |
Yinka Akinsola — 1977
Anti-Money Laundering Compliance Officer | | 2011 | | Anti-Money Laundering Compliance Officer, Invesco Advisers, Inc. (formerly known as Invesco Institutional (N.A.), Inc.) (registered investment adviser); Invesco Distributors, Inc. (formerly known as Invesco Aim Distributors, Inc.), Invesco Investment Services, Inc. (formerly known as Invesco Aim Investment Services, Inc.), Invesco Management Group, Inc., The Invesco Funds, Invesco Van Kampen Closed-End Funds, Van Kampen Exchange Corp. and Van Kampen Funds Inc. | | N/A | | N/A |
| | | | | | | | | |
| | | | | | | | | |
| | | | | | | | | |
Todd L. Spillane — 1958
Chief Compliance Officer | | 2006 | | Senior Vice President, Invesco Management Group, Inc. (formerly known as Invesco Aim Management Group, Inc.) and Van Kampen Exchange Corp.; Senior Vice President and Chief Compliance Officer, Invesco Advisers, Inc. (registered investment adviser) (formerly known as Invesco Institutional (N.A.), Inc.); Chief Compliance Officer, The Invesco Funds, INVESCO Private Capital Investments, Inc. (holding company) and Invesco Private Capital, Inc. (registered investment adviser); Vice President, Invesco Distributors, Inc. (formerly known as Invesco Aim Distributors, Inc.) and Invesco Investment Services, Inc. (formerly known as Invesco Aim Investment Services, Inc.).
Formerly: Chief Compliance Officer, Invesco Van Kampen Closed-End Funds PowerShares Exchange-Traded Fund Trust, PowerShares Exchange-Traded Fund Trust II, PowerShares India Exchange-Traded Fund Trust, and PowerShares Actively Managed Exchange-Traded Fund Trust; Senior Vice President, Van Kampen Investments Inc.; Senior Vice President and Chief Compliance Officer, Invesco Advisers, Inc. and Invesco Aim Capital Management, Inc.; Chief Compliance Officer, Invesco Global Asset Management (N.A.), Inc., Invesco Senior Secured Management, Inc. (registered investment adviser) and Van Kampen Investor Services Inc.; Vice President, Invesco Aim Capital Management, Inc. and Fund Management Company | | N/A | | N/A |
| | | | | | | | | |
The Statement of Additional Information of the Trust includes additional information about the Fund’s Trustees and is available upon request, without charge, by calling 1.800.959.4246. Please refer to the Fund’s prospectus for information on the Fund’s sub-advisers.
| | | | | | | |
Office of the Fund
11 Greenway Plaza, Suite 2500
Houston, TX 77046-1173 | | Investment Adviser
Invesco Advisers, Inc.
1555 Peachtree Street, N.E.
Atlanta, GA 30309 | | Distributor
Invesco Distributors, Inc.
11 Greenway Plaza, Suite 2500
Houston, TX 77046-1173 | | Auditors
PricewaterhouseCoopers LLP
1201 Louisiana Street, Suite 2900
Houston, TX 77002-5678 |
| | | | | | | |
| | | | | | | |
Counsel to the Fund
Stradley Ronon Stevens & Young, LLP
2600 One Commerce Square
Philadelphia, PA 19103 | | Counsel to the Independent Trustees
Kramer, Levin, Naftalis & Frankel LLP
1177 Avenue of the Americas
New York, NY 10036-2714 | | Transfer Agent
Invesco Investment Services, Inc.
11 Greenway Plaza, Suite 2500
Houston, TX77046-1173 | | Custodian
State Street Bank and Trust Company
225 Franklin
Boston, MA 02110-2801 |
Invesco V.I. International Growth Fund
Invesco V.I. Leisure Fund
Annual Report to Shareholders § December 31, 2011
The Fund provides a complete list of its holdings four times in each fiscal year, at the quarter-ends. For the second and fourth quarters, the lists appear in the Fund’s semiannual and annual reports to shareholders. For the first and third quarters, the Fund files the lists with the Securities and Exchange Commission (SEC) on Form N-Q. The Fund’s Form N-Q filings are available on the SEC website, sec.gov. Copies of the Fund’s Forms N-Q may be reviewed and copied at the SEC Public Reference Room in Washington, D.C. You can obtain information on the operation of the Public Reference Room, including information about duplicating fee charges, by calling 202 551 8090 or 800 732 0330, or by electronic request at the following email address: publicinfo@sec.gov. The SEC file numbers for the Fund are 811-07452 and 033-57340. The Fund’s most recent portfolio holdings, as filed on Form N-Q, have also been made available to insurance companies issuing variable annuity contracts and variable life insurance policies (“variable products”) that invest in the Fund.
A description of the policies and procedures that the Fund uses to determine how to vote proxies relating to portfolio securities is available without charge, upon request, from our Client Services department at 800 959 4246 or at invesco.com/proxyguidelines. The information is also available on the SEC website, sec.gov.
Information regarding how the Fund voted proxies related to its portfolio securities during the 12 months ended June 30, 2011, is available at invesco.com/proxysearch. The information is also available on the SEC website, sec.gov.
Invesco Advisers, Inc. is an investment adviser; it provides investment advisory services to individual and institutional clients and does not sell securities. Invesco Distributors, Inc. is the U.S. distributor for Invesco Ltd.’s retail mutual funds, exchange-traded funds and institutional money market funds. Both are wholly owned, indirect subsidiaries of Invesco Ltd.
This report must be accompanied or preceded by a currently effective Fund prospectus and variable product prospectus, which contain more complete information, including sales charges and expenses. Investors should read each carefully before investing.
Invesco Distributors, Inc.
I-VILEI -AR-1
| | | | | |
|
| | | | | |
NOT FDIC INSURED | | MAY LOSE VALUE | | NO BANK GUARANTEE |
Management’s Discussion of Fund Performance
Performance summary
On May 2, 2011, Ido Cohen became the lead portfolio manager of the Invesco V.I. Leisure Fund. Mr. Cohen is a portfolio manager for Invesco large-cap growth equity strategies and has 14 years of experience in the investment industry. Juan Hartsfield was named co-manager.
Equity markets were quite volatile during the year ended December 31, 2011, and investors generally favored less economically sensitive sectors. Invesco V.I. Leisure Fund underperformed its broad market benchmark, the S&P 500 Index, as well as its style-specific benchmark, the S&P 500 Consumer Discretionary Index, for the reporting period. Underperformance relative to the Fund’s style-specific index was predominately the result of security selection within the hotels, restaurants and leisure industry, the software industry and the media industry.
Your Fund’s long-term performance can be found later in this report.
Fund vs. Indexes
Total returns, 12/31/10 to 12/31/11, excluding variable product issuer charges.
If variable product issuer charges were included, returns would be lower.
| | | | | |
|
| Series I Shares | | | -3.85 | % |
| |
| Series II Shares | | | -4.04 | |
| |
S&P 500 Index▼ (Broad Market Index) | | | 2.09 | |
| |
S&P 500 Consumer Discretionary Index▼ (Style-Specific Index) | | | 6.13 | |
| |
Source(s): ▼Lipper Inc.
How we invest
We focus on companies that profit from consumer spending on leisure activities – products or services purchased with consumers’ discretionary dollars. The Fund emphasizes stocks of cable television, publishing, cruise line, advertising, hotel, casino, electronic game and toy manufacturing, restaurant, retailing and entertainment companies.
Stock selection is based on a research driven bottom-up investment approach focusing on company fundamentals and growth prospects. Quantitative screens are used to help identify attractive stock candidates within the universe of leisure-related companies. Portfolio candidates are further refined by fundamental analysis performed at the company level, which includes an evaluation of industry dynamics, competitive intensity, and drivers of growth.
The investment process seeks to identify attractively valued leisure-related companies exhibiting the following characteristics:
| n | | Attractive revenue growth profile. |
| |
| n | | Strong free cash flow generation. |
| |
| n | | Returns on invested capital in excess of weighted-average cost of capital. |
| |
| n | | Operating in low capital intensity businesses. |
| |
| n | | Management teams that are good stewards of capital. |
We construct the portfolio with the goal of holding from 40 to 75 individual stocks with an average investment horizon of 18 to 24 months. Portfolio weightings are adjusted based on current economic and industry conditions.
We may reduce or eliminate exposure to a stock when:
| n | | A company reaches its price target. |
| |
| n | | A more compelling opportunity is identified. |
| n | | A change in fundamentals occurs – either company specific or industry wide. |
| n | | A stock’s technical profile indicates negative underlying information which is further determined to have violated a fundamental investment thesis. |
Market conditions and your Fund
Equity markets were highly volatile during 2011 as investors weighed the competing issues of improved corporate profits, soft macroeconomic data and sovereign debt issues in Europe. In the U.S., corporate earnings increased, but often were overshadowed by concerns about high unemployment and a lack of consumer confidence. After generally rising through July, major equity indexes sold off precipitously in August as the U.S. received the first-ever downgrade to its credit rating from Standard & Poor’s, and while the sovereign debt crisis unfolded in the eurozone, prompting fears of a “double-dip” recession. Equity markets rebounded in the fourth quarter of 2011, despite a lack of meaningful resolutions to improve the global economy.
Major domestic equity indexes produced positive returns for the calendar year, and seven out of 10 sectors in the S&P 500 Index posted gains. 1 Less economically sensitive sectors such as utilities, consumer staples and health care had the highest returns. Conversely, financials, materials and industrials were the market laggards and produced losses for the reporting period.
The Fund’s underperformance relative to the S&P 500 Consumer Discretionary Index was predominately the result of security selection in the hotels, restaurants and leisure industry, the software industry and the media industry. Top individual detractors from Fund performance included Rovi and Starwood Hotels and
Portfolio Composition
By sector
| | | | | |
|
| Consumer Discretionary | | | 84.1 | % |
| |
| Information Technology | | | 11.0 | |
| |
| Consumer Staples | | | 3.6 | |
| |
| Financials | | | 0.5 | |
| |
Money Market Funds | | | | |
Plus Other Assets Less Liabilities | | | 0.8 | |
Top 10 Equity Holdings*
| | | | | | | | | |
|
| | 1. | | | Apple Inc. | | | 4.8 | % |
| |
| | 2. | | | Home Depot, Inc. (The) | | | 4.6 | |
| |
| | 3. | | | NIKE, Inc.-Class B | | | 4.5 | |
| |
| | 4. | | | Comcast Corp.-Class A | | | 4.5 | |
| |
| | 5. | | | Starbucks Corp. | | | 4.2 | |
| |
| | 6. | | | Macy’s, Inc. | | | 4.2 | |
| |
| | 7. | | | DIRECTV-Class A | | | 4.2 | |
| |
| | 8. | | | Interpublic Group of Cos., Inc. (The) | | 3.1 | |
| |
| | 9. | | | CBS Corp.-Class B | | | 2.8 | |
| |
| | 10. | | | Amazon.com, Inc. | | | 2.8 | |
Top Five Industries
| | | | | | | | | |
|
| | 1. | | | Restaurants | | | 9.7 | % |
| |
| | 2. | | | Cable & Satellite | | | 8.6 | |
| |
| | 3. | | | Movies & Entertainment | | | 8.5 | |
| |
| | 4. | | | Broadcasting | | | 6.3 | |
| |
| | 5. | | | Footwear | | | 6.1 | |
| | | | | |
|
| Total Net Assets | | $17.0 million | |
| | | | | |
| Total Number of Holdings* | | | 58 | |
The Fund’s holdings are subject to change, and there is no assurance that the Fund will continue to hold any particular security.
*Excluding money market fund holdings.
Invesco V.I. Leisure Fund
Resorts. Rovi is a global leader in digital entertainment products and services, while Starwood Hotels and Resorts is a hotel and leisure company with brand names such as St. Regis, Westin and Sheraton. Investors reacted negatively when both companies announced earnings projections for the third quarter and for fiscal year 2011 that would fall short of analysts’ expectations. We continued to hold the stocks at the close of the reporting period.
The Fund benefited from exposure to industries outside of the consumer discretionary sector; specifically, security selection in the computers and peripherals industry, the beverages industry, and the Internet software and services industry contributed positively to the Fund’s relative performance. Top individual contributors to performance during the reporting period included Starbucks and Hansen Natural. In general, both companies benefited from investor preference for consumer staples stocks given the volatility of the equity market in 2011. In addition, Starbucks acquired Evolution Fresh – known for its premium juice brand Naked Juice, in November, further affirming its interest in consumer packaged goods.
During the year, we increased our exposure to a number of trends we expect to continue for the foreseeable future. First, we expect income growth in emerging markets to continue to outpace U.S. income growth. As a result, we expect companies levered to both high- and low-end discretionary spending in emerging markets will continue to see more rapid growth than their U.S.- and European-focused peers. Second, we expect the shift toward increased online retail consumption will continue. As a result, we expect online retailers will continue to take share from traditional retailers, and thus see more rapid growth. And third, we expect the shift toward online media consumption will continue, and will take share from more traditional formats.
We believe the rate of growth of global discretionary spending may lag prior recoveries as U.S. consumer leverage remains above the long-term average and personal savings as a percentage of disposable income will likely remain above recent levels as consumers reduce their leverage. We believe consumer spending at the low-end of the spectrum in the U.S. may also remain constrained given continued high levels of unemployment.
As always, we thank you for your continued investment in Invesco V.I. Leisure Fund.
1 Source: Lipper Inc.
The views and opinions expressed in management’s discussion of Fund performance are those of Invesco Advisers, Inc. These views and opinions are subject to change at any time based on factors such as market and economic conditions. These views and opinions may not be relied upon as investment advice or recommendations, or as an offer for a particular security. The information is not a complete analysis of every aspect of any market, country, industry, security or the Fund. Statements of fact are from sources considered reliable, but Invesco Advisers, Inc. makes no representation or warranty as to their completeness or accuracy. Although historical performance is no guarantee of future results, these insights may help you understand our investment management philosophy.
See important Fund and, if applicable, index disclosures later in this report.
Ido Cohen
Portfolio manager, is lead manager of Invesco V.I. Leisure Fund. Mr. Cohen joined Invesco in 2010. He is a cum laude graduate of The Wharton School of the University of Pennsylvania with a B.S. in economics.
Juan Hartsfield
Chartered Financial Analyst, portfolio manager, is manager of Invesco V.I. Leisure Fund. Mr. Hartsfield joined Invesco in 2004. He earned a B.S. in petroleum engineering from The University of Texas at Austin and an M.B.A. from the University of Michigan.
Invesco V.I. Leisure Fund
Your Fund’s Long-Term Performance
Results of a $10,000 Investment – Oldest Share Class(es) since Inception
Fund and index data from 4/30/02
1 Source: Lipper Inc.
Past performance cannot guarantee comparable future results.
Average Annual Total Returns
As of 12/31/11
| | | | | | | | | |
|
| Series I Shares | | | | |
| |
| Inception (4/30/02) | | | 3.11 | % |
| |
| | 5 | | | Years | | | -2.55 | |
| |
| | 1 | | | Year | | | -3.85 | |
| |
| | | | | | | | | |
| Series II Shares | | | | |
| |
| Inception | | | 2.89 | % |
| |
| | 5 | | | Years | | | -2.76 | |
| |
| | 1 | | | Year | | | -4.04 | |
Series II shares incepted on April 30, 2004. Performance shown prior to that date is that of Series I shares, restated to reflect the higher 12b-1 fees applicable to Series II. Series I performance reflects any applicable fee waivers or expense reimbursements. The performance of the Fund’s Series I and Series II share classes will differ primarily due to different class expenses.
The performance data quoted represent past performance and cannot guarantee comparable future results; current performance may be lower or higher. Please contact your variable product issuer or financial adviser for the most recent month-end variable
product performance. Performance figures reflect Fund expenses, reinvested distributions and changes in net asset value. Investment return and principal value will fluctuate so that you may have a gain or loss when you sell shares.
The net annual Fund operating expense ratio set forth in the most recent Fund prospectus as of the date of this report for Series I and Series II shares was 1.01% and 1.26%, respectively.1 The total annual Fund operating expense ratio set forth in the most recent Fund prospectus as of the date of this report for Series I and Series II shares was 1.65% and 1.90%, respectively. The expense ratios presented above may vary from the expense ratios presented in other sections of this report that are based on expenses incurred during the period covered by this report.
Invesco V.I. Leisure Fund, a series portfolio of AIM Variable Insurance Funds (Invesco Variable Insurance Funds), is currently offered through insurance companies issuing variable products. You cannot purchase shares
of the Fund directly. Performance figures given represent the Fund and are not intended to reflect actual variable product values. They do not reflect sales charges, expenses and fees assessed in connection with a variable product. Sales charges, expenses and fees, which are determined by the variable product issuers, will vary and will lower the total return.
The most recent month-end performance data at the Fund level, excluding variable product charges, is available at 800 451 4246. As mentioned above, for the most recent month-end performance including variable product charges, please contact your variable product issuer or financial adviser
Had the adviser not waived fees and/or expenses, performance would have been lower.
| | |
| 1 | | Total annual Fund operating expenses after any contractual fee waivers and/or expense reimbursements by the adviser in effect through at least April 30, 2013. See current prospectus for more information. |
Invesco V.I. Leisure Fund
Invesco V.I. Leisure Fund’s investment objective is long-term growth of capital.
| n | | Unless otherwise stated, information presented in this report is as of December 31, 2011, and is based on total net assets. |
| |
| n | | Unless otherwise noted, all data provided by Invesco. |
| |
| n | | To access your Fund’s reports/prospectus, visit invesco.com/fundreports. |
Principal risks of investing in the Fund
Foreign securities risk. The Fund’s foreign investments may be affected by changes in a foreign country’s exchange rates; political and social instability; changes in economic or taxation policies; difficulties when enforcing obligations; decreased liquidity; and increased volatility. Foreign companies may be subject to less regulation resulting in less publicly available information about the companies.
Initial Public Offering (IPO) risk. The prices of IPO securities may fluctuate more than prices of equity securities of companies with longer trading histories. In addition, companies offering securities in IPOs may have less experienced management or limited operating histories. There can be no assurance that the Fund will have favorable IPO investment opportunities.
Leisure industry risk. The leisure sector depends on consumer discretionary spending, which generally falls during economic downturns. Securities of gambling casinos are often subject to high price volatility and are considered speculative. Securities of companies that make video and electronic games may be affected by the games’ risk of rapid obsolescence.
Management risk. The investment techniques and risk analysis used by the Fund’s portfolio managers may not produce the desired results.
Market risk. The prices of and the income generated by the Fund’s securities may decline in response to, among other things, investor sentiment; general economic and market conditions; regional or global instability; and currency and interest rate fluctuations.
Sector fund risk. The Fund’s investments are concentrated in a comparatively narrow segment of the economy, which may make the Fund more volatile than non-concentrated funds.
About indexes used in this report
The S&P 500® Index is an unmanaged index considered representative of the U.S. stock market.
The S&P 500 Consumer Discretionary Index is an unmanaged index considered representative of the consumer discretionary market.
The Fund is not managed to track the performance of any particular index, including the index(es) defined here, and consequently, the performance of the Fund may deviate significantly from the performance of the index(es).”
A direct investment cannot be made in an index. Unless otherwise indicated, index results include reinvested dividends, and they do not reflect sales charges. Performance of the peer group, if applicable, reflects fund expenses; performance of a market index does not.
Other information
The Chartered Financial Analyst® (CFA®) designation is globally recognized and attests to a charterholder’s success in a rigorous and comprehensive study program in the field of investment management and research analysis.
Industry classifications used in this report are generally according to the Global Industry Classification Standard, which was developed by and is the exclusive property and a service mark of MSCI Inc. and Standard & Poor’s.
The returns shown in management’s discussion of Fund performance are based on net asset values calculated for shareholder transactions. Generally accepted accounting principles require adjustments to be made to the net assets of the Fund at period end for financial reporting purposes, and as such, the net asset values for shareholder transactions and the returns based on those net asset values may differ from the net asset values and returns reported in the Financial Highlights. Additionally, the returns and net asset values shown throughout this report are at the Fund level only and do not include variable product issuer charges. If such charges were included, the total returns would be lower.
Invesco V.I. Leisure Fund
Schedule of Investments(a)
December 31, 2011
| | | | | | | | | |
| | | Shares | | Value |
| |
Common Stocks & Other Equity Interests–99.22%
|
Advertising–3.84%
| | | | |
| Interpublic Group of Cos., Inc. (The) | | | 54,404 | | | $ | 529,351 | |
| |
| National CineMedia, Inc. | | | 10,089 | | | | 125,104 | |
| |
| | | | | | | | 654,455 | |
| |
Apparel Retail–1.98%
| | | | |
| Express, Inc. | | | 8,401 | | | | 167,516 | |
| |
| TJX Cos., Inc. | | | 2,626 | | | | 169,508 | |
| |
| | | | | | | | 337,024 | |
| |
Apparel, Accessories & Luxury Goods–3.78%
| | | | |
Michael Kors Holdings Ltd.(b) | | | 9,117 | | | | 248,438 | |
| |
Prada S.p.A. (Italy)(b) | | | 48,500 | | | | 218,164 | |
| |
Under Armour, Inc.–Class A(b) | | | 2,470 | | | | 177,321 | |
| |
| | | | | | | | 643,923 | |
| |
Auto Parts & Equipment–1.85%
| | | | |
| Johnson Controls, Inc. | | | 10,066 | | | | 314,663 | |
| |
Automobile Manufacturers–2.75%
| | | | |
Ford Motor Co.(b) | | | 15,041 | | | | 161,841 | |
| |
| Honda Motor Co., Ltd. (Japan) | | | 5,293 | | | | 161,247 | |
| |
Tesla Motors, Inc.(b)(c) | | | 5,118 | | | | 146,170 | |
| |
| | | | | | | | 469,258 | |
| |
Automotive Retail–2.44%
| | | | |
AutoZone, Inc.(b) | | | 681 | | | | 221,304 | |
| |
| Group 1 Automotive, Inc. | | | 3,752 | | | | 194,354 | |
| |
| | | | | | | | 415,658 | |
| |
Broadcasting–6.25%
| | | | |
| CBS Corp.–Class B | | | 17,785 | | | | 482,685 | |
| |
| Scripps Networks Interactive–Class A | | | 9,100 | | | | 386,022 | |
| |
Sirius XM Radio Inc.(b) | | | 107,319 | | | | 195,321 | |
| |
| | | | | | | | 1,064,028 | |
| |
Cable & Satellite–8.62%
| | | | |
| Comcast Corp.–Class A | | | 32,084 | | | | 760,712 | |
| |
DIRECTV–Class A(b) | | | 16,565 | | | | 708,319 | |
| |
| | | | | | | | 1,469,031 | |
| |
Casinos & Gaming–3.71%
| | | | |
Las Vegas Sands Corp.(b) | | | 6,264 | | | | 267,661 | |
| |
Penn National Gaming, Inc.(b) | | | 9,555 | | | | 363,759 | |
| |
| | | | | | | | 631,420 | |
| |
Computer Hardware–4.80%
| | | | |
Apple Inc.(b) | | | 2,021 | | | | 818,505 | |
| |
Consumer Finance–0.49%
| | | | |
EZCORP, Inc.–Class A(b) | | | 3,144 | | | | 82,907 | |
| |
Department Stores–4.19%
| | | | |
| Macy’s, Inc. | | | 22,157 | | | | 713,012 | |
| |
Distributors–1.25%
| | | | |
| Pool Corp. | | | 7,054 | | | | 212,325 | |
| |
Footwear–6.13%
| | | | |
Deckers Outdoor Corp.(b) | | | 3,706 | | | | 280,062 | |
| |
| NIKE, Inc.–Class B | | | 7,921 | | | | 763,347 | |
| |
| | | | | | | | 1,043,409 | |
| |
General Merchandise Stores–1.52%
| | | | |
Dollar Tree, Inc.(b) | | | 1,111 | | | | 92,335 | |
| |
| Target Corp. | | | 3,240 | | | | 165,953 | |
| |
| | | | | | | | 258,288 | |
| |
Home Entertainment Software–1.88%
| | | | |
Electronic Arts Inc.(b) | | | 15,533 | | | | 319,980 | |
| |
Home Improvement Retail–6.08%
| | | | |
| Home Depot, Inc. (The) | | | 18,525 | | | | 778,791 | |
| |
| Lowe’s Cos., Inc. | | | 10,087 | | | | 256,008 | |
| |
| | | | | | | | 1,034,799 | |
| |
Homebuilding–0.62%
| | | | |
| D.R. Horton, Inc. | | | 8,373 | | | | 105,584 | |
| |
Homefurnishing Retail–2.98%
| | | | |
Bed Bath & Beyond Inc.(b) | | | 4,464 | | | | 258,778 | |
| |
Mattress Firm Holding Corp.(b) | | | 10,754 | | | | 249,385 | |
| |
| | | | | | | | 508,163 | |
| |
Hotels, Resorts & Cruise Lines–3.18%
| | | | |
Hyatt Hotels Corp.–Class A(b) | | | 7,076 | | | | 266,341 | |
| |
| Marriott International Inc.–Class A | | | 4,484 | | | | 130,798 | |
| |
| Starwood Hotels & Resorts Worldwide, Inc. | | | 3,000 | | | | 143,910 | |
| |
| | | | | | | | 541,049 | |
| |
Hypermarkets & Super Centers–1.53%
| | | | |
| Costco Wholesale Corp. | | | 3,128 | | | | 260,625 | |
| |
Internet Retail–3.15%
| | | | |
Amazon.com, Inc.(b) | | | 2,713 | | | | 469,620 | |
| |
Priceline.com Inc.(b) | | | 143 | | | | 66,883 | |
| |
| | | | | | | | 536,503 | |
| |
Internet Software & Services–2.86%
| | | | |
Baidu, Inc.–ADR (China)(b) | | | 729 | | | | 84,907 | |
| |
eBay Inc.(b) | | | 2,684 | | | | 81,406 | |
| |
See accompanying Notes to Financial Statements which are an integral part of the financial statements.
Invesco V.I. Leisure Fund
| | | | | | | | | |
| | | Shares | | Value |
| |
Internet Software & Services–(continued)
| | | | |
| | | | | | | | | |
Google Inc.–Class A(b) | | | 421 | | | $ | 271,924 | |
| |
Yandex NV–Class A (Netherlands)(b)(c) | | | 2,476 | | | | 48,777 | |
| |
| | | | | | | | 487,014 | |
| |
Motorcycle Manufacturers–1.60%
| | | | |
| Harley-Davidson, Inc. | | | 7,005 | | | | 272,284 | |
| |
Movies & Entertainment–8.52%
| | | | |
| News Corp.–Class A | | | 12,771 | | | | 227,835 | |
| |
| Time Warner Inc. | | | 10,065 | | | | 363,749 | |
| |
Viacom Inc.–Class A(c) | | | 6,785 | | | | 361,844 | |
| |
| Viacom Inc.–Class B | | | 4,329 | | | | 196,580 | |
| |
| Walt Disney Co. (The) | | | 8,018 | | | | 300,675 | |
| |
| | | | | | | | 1,450,683 | |
| |
Packaged Foods & Meats–1.25%
| | | | |
Diamond Foods, Inc.(c) | | | 6,631 | | | | 213,982 | |
| |
Restaurants–9.72%
| | | | |
Chipotle Mexican Grill, Inc.(b) | | | 1,371 | | | | 463,041 | |
| |
Domino’s Pizza, Inc.(b) | | | 2,567 | | | | 87,150 | |
| |
| McDonald’s Corp. | | | 2,987 | | | | 299,686 | |
| |
| P.F. Chang’s China Bistro, Inc. | | | 2,957 | | | | 91,401 | |
| |
| Starbucks Corp. | | | 15,509 | | | | 713,569 | |
| |
| | | | | | | | 1,654,847 | |
| |
Soft Drinks–0.82%
| | | | |
Hansen Natural Corp.(b) | | | 1,510 | | | | 139,131 | |
| |
Systems Software–1.43%
| | | | |
Rovi Corp.(b) | | | 9,885 | | | | 242,973 | |
| |
| Total Common Stocks & Other Equity Interests (Cost $14,519,045) | | | | | | | 16,895,523 | |
| |
Money Market Funds–0.84%
|
Liquid Assets Portfolio–Institutional Class(d) | | | 71,339 | | | | 71,339 | |
| |
Premier Portfolio–Institutional Class(d) | | | 71,339 | | | | 71,339 | |
| |
| Total Money Market Funds (Cost $142,678) | | | | | | | 142,678 | |
| |
| TOTAL INVESTMENTS (excluding investments purchased with cash collateral from securities on loan)–100.06% (Cost $14,661,723) | | | | | | | 17,038,201 | |
| |
Investments Purchased with Cash Collateral from Securities on Loan
|
Money Market Funds–2.02%
|
Liquid Assets Portfolio–Institutional Class (Cost $344,030)(d)(e) | | | 344,030 | | | | 344,030 | |
| |
| TOTAL INVESTMENTS–102.08% (Cost $15,005,753) | | | | | | | 17,382,231 | |
| |
| OTHER ASSETS LESS LIABILITIES–(2.08)% | | | | | | | (353,365 | ) |
| |
| NET ASSETS–100.00% | | | | | | $ | 17,028,866 | |
| |
Investment Abbreviations:
| | | |
| ADR | | – American Depositary Receipt |
Notes to Schedule of Investments:
| | |
| (a) | | Industry and/or sector classifications used in this report are generally according to the Global Industry Classification Standard, which was developed by and is the exclusive property and a service mark of MSCI Inc. and Standard & Poor’s. |
| (b) | | Non-income producing security. |
| (c) | | All or a portion of this security was out on loan at December 31, 2011. |
| (d) | | The money market fund and the Fund are affiliated by having the same investment adviser. |
| (e) | | The security has been segregated to satisfy the commitment to return the cash collateral received in securities lending transactions upon the borrower’s return of the securities loaned. See Note 1J. |
See accompanying Notes to Financial Statements which are an integral part of the financial statements.
Invesco V.I. Leisure Fund
Statement of Assets and Liabilities
December 31, 2011
| | | | | |
Assets:
|
| Investments, at value (Cost $14,519,045)* | | $ | 16,895,523 | |
| |
| Investments in affiliated money market funds, at value and cost | | | 486,708 | |
| |
| Total investments, at value (Cost $15,005,753) | | | 17,382,231 | |
| |
| Receivable for: | | | | |
| Investments sold | | | 207,644 | |
| |
| Dividends | | | 21,179 | |
| |
| Investment for trustee deferred compensation and retirement plans | | | 15,005 | |
| |
| Total assets | | | 17,626,059 | |
| |
| | | | | |
| | | | | |
Liabilities:
|
| Payable for: | | | | |
| Investments purchased | | | 167,067 | |
| |
| Fund shares reacquired | | | 17,227 | |
| |
| Collateral upon return of securities loaned | | | 344,030 | |
| |
| Accrued fees to affiliates | | | 17,643 | |
| |
| Accrued other operating expenses | | | 32,787 | |
| |
| Trustee deferred compensation and retirement plans | | | 18,439 | |
| |
| Total liabilities | | | 597,193 | |
| |
| Net assets applicable to shares outstanding | | $ | 17,028,866 | |
| |
| | | | | |
| | | | | |
Net assets consist of:
|
| Shares of beneficial interest | | $ | 16,797,777 | |
| |
| Undistributed net investment income | | | (156 | ) |
| |
| Undistributed net realized gain (loss) | | | (2,145,244 | ) |
| |
| Unrealized appreciation | | | 2,376,489 | |
| |
| | | $ | 17,028,866 | |
| |
| | | | | |
| | | | | |
Net Assets:
|
| Series I | | $ | 16,701,147 | |
| |
| Series II | | $ | 327,719 | |
| |
| | | | | |
| | | | | |
Shares outstanding, $0.001 par value per share, with an unlimited number of shares authorized:
|
| Series I | | | 2,197,332 | |
| |
| Series II | | | 43,250 | |
| |
| Series I: | | | | |
| Net asset value per share | | $ | 7.60 | |
| |
| Series II: | | | | |
| Net asset value per share | | $ | 7.58 | |
| |
| |
| * | At December 31, 2011, securities with an aggregate value of $340,539 were on loan to brokers. |
Statement of Operations
For the year ended December 31, 2011
| | | | | |
Investment income:
|
| Dividends (net of foreign withholding taxes of $403) | | $ | 205,334 | |
| |
| Dividends from affiliated money market funds (includes securities lending income of $10,247) | | | 10,526 | |
| |
| Total investment income | | | 215,860 | |
| |
Expenses:
|
| Advisory fees | | | 144,463 | |
| |
| Administrative services fees | | | 98,099 | |
| |
| Custodian fees | | | 8,028 | |
| |
| Distribution fees — Series II | | | 655 | |
| |
| Transfer agent fees | | | 3,053 | |
| |
| Trustees’ and officers’ fees and benefits | | | 18,008 | |
| |
| Professional services fees | | | 32,328 | |
| |
| Other | | | 16,507 | |
| |
| Total expenses | | | 321,141 | |
| |
| Less: Fees waived | | | (126,010 | ) |
| |
| Net expenses | | | 195,131 | |
| |
| Net investment income | | | 20,729 | |
| |
Realized and unrealized gain (loss) from:
|
| Net realized gain (loss) from: | | | | |
| Investment securities (includes net gains from securities sold to affiliates of $85,725) | | | 1,945,302 | |
| |
| Foreign currencies | | | (55 | ) |
| |
| | | | 1,945,247 | |
| |
| Change in net unrealized appreciation (depreciation) of: | | | | |
| Investment securities | | | (2,646,202 | ) |
| |
| Foreign currencies | | | 109 | |
| |
| | | | (2,646,093 | ) |
| |
| Net realized and unrealized gain (loss) | | | (700,846 | ) |
| |
| Net increase (decrease) in net assets resulting from operations | | $ | (680,117 | ) |
| |
See accompanying Notes to Financial Statements which are an integral part of the financial statements.
Invesco V.I. Leisure Fund
Statement of Changes in Net Assets
For the years ended December 31, 2011 and 2010
| | | | | | | | | |
| | | 2011 | | 2010 |
| |
Operations:
|
| Net investment income | | $ | 20,729 | | | $ | 82,921 | |
| |
| Net realized gain | | | 1,945,247 | | | | 1,755,492 | |
| |
| Change in net unrealized appreciation (depreciation) | | | (2,646,093 | ) | | | 2,139,829 | |
| |
| Net increase (decrease) in net assets resulting from operations | | | (680,117 | ) | | | 3,978,242 | |
| |
Distributions to shareholders from net investment income:
|
| Series I | | | (74,798 | ) | | | (104,603 | ) |
| |
| Series II | | | (1,157 | ) | | | (460 | ) |
| |
| Total distributions from net investment income | | | (75,955 | ) | | | (105,063 | ) |
| |
Share transactions–net:
|
| Series I | | | (3,335,030 | ) | | | (3,420,143 | ) |
| |
| Series II | | | 202,301 | | | | 122,973 | |
| |
| Net increase (decrease) in net assets resulting from share transactions | | | (3,132,729 | ) | | | (3,297,170 | ) |
| |
| Net increase (decrease) in net assets | | | (3,888,801 | ) | | | 576,009 | |
| |
Net assets:
|
| Beginning of year | | | 20,917,667 | | | | 20,341,658 | |
| |
| End of year (includes undistributed net investment income of ($156) and $55,122, respectively) | | $ | 17,028,866 | | | $ | 20,917,667 | |
| |
Notes to Financial Statements
December 31, 2011
NOTE 1—Significant Accounting Policies
Invesco V.I. Leisure Fund (the “Fund”) is a series portfolio of AIM Variable Insurance Funds (Invesco Variable Insurance Funds) (the “Trust”). The Trust is a Delaware statutory trust registered under the Investment Company Act of 1940, as amended (the “1940 Act”), as an open-end series management investment company consisting of twenty-eight separate portfolios, (each constituting a “Fund”). The assets, liabilities and operations of each portfolio are accounted for separately. Information presented in these financial statements pertains only to the Fund. Matters affecting each Fund or class will be voted on exclusively by the shareholders of such Fund or class. Current Securities and Exchange Commission (“SEC”) guidance, however, requires participating insurance companies offering separate accounts to vote shares proportionally in accordance with the instructions of the contract owners whose investments are funded by shares of each Fund or class.
The Fund’s investment objective is long-term capital growth.
The Fund currently offers two classes of shares, Series I and Series II, both of which are offered to insurance company separate accounts funding variable annuity contracts and variable life insurance policies (“variable products”).
The following is a summary of the significant accounting policies followed by the Fund in the preparation of its financial statements.
| | |
| A. | | Security Valuations — Securities, including restricted securities, are valued according to the following policy. |
| | A security listed or traded on an exchange (except convertible bonds) is valued at its last sales price or official closing price as of the close of the customary trading session on the exchange where the security is principally traded, or lacking any sales or official closing price on a particular day, the security may be valued at the closing bid price on that day. Securities traded in the over-the-counter market are valued based on prices furnished by independent pricing services or market makers. When such securities are valued by an independent pricing service they may be considered fair valued. Futures contracts are valued at the final settlement price set by an exchange on which they are principally traded. Listed options are valued at the mean between the last bid and ask prices from the exchange on which they are principally traded. Options not listed on an exchange are valued by an independent source at the mean between the last bid and ask prices. For purposes of determining net asset value per share, futures and option contracts generally are valued 15 minutes after the close of the customary trading session of the New York Stock Exchange (“NYSE”). |
| | Investments in open-end and closed-end registered investment companies that do not trade on an exchange are valued at the end of day net asset value per share. Investments in open-end and closed-end registered investment companies that trade on an exchange are valued at the last sales price or official closing price as of the close of the customary trading session on the exchange where the security is principally traded. |
| | Debt obligations (including convertible bonds) and unlisted equities are fair valued using an evaluated quote provided by an independent pricing service. Evaluated quotes provided by the pricing service may be determined without exclusive reliance on quoted prices, and may reflect appropriate factors such as |
Invesco V.I. Leisure Fund
| | |
| | institution-size trading in similar groups of securities, developments related to specific securities, dividend rate, yield, quality, type of issue, coupon rate, maturity, individual trading characteristics and other market data. Debt securities are subject to interest rate and credit risks. In addition, all debt securities involve some risk of default with respect to interest and/or principal payments. |
| | Foreign securities (including foreign exchange contracts) are converted into U.S. dollar amounts using the applicable exchange rates as of the close of the NYSE. If market quotations are available and reliable for foreign exchange traded equity securities, the securities will be valued at the market quotations. Because trading hours for certain foreign securities end before the close of the NYSE, closing market quotations may become unreliable. If between the time trading ends on a particular security and the close of the customary trading session on the NYSE, events occur that are significant and make the closing price unreliable, the Fund may fair value the security. If the event is likely to have affected the closing price of the security, the security will be valued at fair value in good faith using procedures approved by the Board of Trustees. Adjustments to closing prices to reflect fair value may also be based on a screening process of an independent pricing service to indicate the degree of certainty, based on historical data, that the closing price in the principal market where a foreign security trade is not the current value as of the close of the NYSE. Foreign securities meeting the approved degree of certainty that the price is not reflective of current value will be priced at the indication of fair value from the independent pricing service. Multiple factors may be considered by the independent pricing service in determining adjustments to reflect fair value and may include information relating to sector indices, American Depositary Receipts and domestic and foreign index futures. Foreign securities may have additional risks including exchange rate changes, potential for sharply devalued currencies and high inflation, political and economic upheaval, the relative lack of issuer information, relatively low market liquidity and the potential lack of strict financial and accounting controls and standards. |
| | Securities for which market prices are not provided by any of the above methods may be valued based upon quotes furnished by independent sources. The last bid price may be used to value equity securities. The mean between the last bid and asked prices is used to value debt obligations, including Corporate Loans. |
| | Securities for which market quotations are not readily available or are unreliable are valued at fair value as determined in good faith by or under the supervision of the Trust’s officers following procedures approved by the Board of Trustees. Issuer specific events, market trends, bid/ask quotes of brokers and information providers and other market data may be reviewed in the course of making a good faith determination of a security’s fair value. |
| | Valuations change in response to many factors including the historical and prospective earnings of the issuer, the value of the issuer’s assets, general economic conditions, interest rates, investor perceptions and market liquidity. Because of the inherent uncertainties of valuation, the values reflected in the financial statements may materially differ from the value received upon actual sale of those investments. |
| B. | | Securities Transactions and Investment Income — Securities transactions are accounted for on a trade date basis. Realized gains or losses on sales are computed on the basis of specific identification of the securities sold. Interest income is recorded on the accrual basis from settlement date. Dividend income (net of withholding tax, if any) is recorded on the ex-dividend date. |
| | The Fund may periodically participate in litigation related to Fund investments. As such, the Fund may receive proceeds from litigation settlements. Any proceeds received are included in the Statement of Operations as realized gain (loss) for investments no longer held and as unrealized gain (loss) for investments still held. |
| | Brokerage commissions and mark ups are considered transaction costs and are recorded as an increase to the cost basis of securities purchased and/or a reduction of proceeds on a sale of securities. Such transaction costs are included in the determination of net realized and unrealized gain (loss) from investment securities reported in the Statement of Operations and the Statement of Changes in Net Assets and the net realized and unrealized gains (losses) on securities per share in the Financial Highlights. Transaction costs are included in the calculation of the Fund’s net asset value and, accordingly, they reduce the Fund’s total returns. These transaction costs are not considered operating expenses and are not reflected in net investment income reported in the Statement of Operations and Statement of Changes in Net Assets, or the net investment income per share and ratios of expenses and net investment income reported in the Financial Highlights, nor are they limited by any expense limitation arrangements between the Fund and the investment adviser. |
| | The Fund allocates income and realized and unrealized capital gains and losses to a class based on the relative net assets of each class. |
| C. | | Country Determination — For the purposes of making investment selection decisions and presentation in the Schedule of Investments, the investment adviser may determine the country in which an issuer is located and/or credit risk exposure based on various factors. These factors include the laws of the country under which the issuer is organized, where the issuer maintains a principal office, the country in which the issuer derives 50% or more of its total revenues and the country that has the primary market for the issuer’s securities, as well as other criteria. Among the other criteria that may be evaluated for making this determination are the country in which the issuer maintains 50% or more of its assets, the type of security, financial guarantees and enhancements, the nature of the collateral and the sponsor organization. Country of issuer and/or credit risk exposure has been determined to be the United States of America, unless otherwise noted. |
| D. | | Distributions — Distributions from income and net realized capital gain, if any, are generally paid to separate accounts of participating insurance companies annually and recorded on ex-dividend date. |
| E. | | Federal Income Taxes — The Fund intends to comply with the requirements of Subchapter M of the Internal Revenue Code necessary to qualify as a regulated investment company and to distribute substantially all of the Fund’s taxable earnings to shareholders. As such, the Fund will not be subject to federal income taxes on otherwise taxable income (including net realized capital gain) that is distributed to shareholders. Therefore, no provision for federal income taxes is recorded in the financial statements. |
| | The Fund files tax returns in the U.S. Federal jurisdiction and certain other jurisdictions. Generally, the Fund is subject to examinations by such taxing authorities for up to three years after the filing of the return for the tax period. |
| F. | | Expenses — Fees provided for under the Rule 12b-1 plan of a particular class of the Fund and which are directly attributable to that class are charged to the operations of such class. All other expenses are allocated among the classes based on relative net assets. |
| G. | | Accounting Estimates — The preparation of financial statements in conformity with accounting principles generally accepted in the United States of America (“GAAP”) requires management to make estimates and assumptions that affect the reported amounts of assets and liabilities at the date of the financial statements and the reported amounts of revenues and expenses during the reporting period including estimates and assumptions related to |
Invesco V.I. Leisure Fund
| | |
| | taxation. Actual results could differ from those estimates by a significant amount. In addition, the Fund monitors for material events or transactions that may occur or become known after the period-end date and before the date the financial statements are released to print. |
| H. | | Indemnifications — Under the Trust’s organizational documents, each Trustee, officer, employee or other agent of the Trust is indemnified against certain liabilities that may arise out of performance of their duties to the Fund. Additionally, in the normal course of business, the Fund enters into contracts, including the Fund’s servicing agreements that contain a variety of indemnification clauses. The Fund’s maximum exposure under these arrangements is unknown as this would involve future claims that may be made against the Fund that have not yet occurred. The risk of material loss as a result of such indemnification claims is considered remote. |
| I. | | Other Risks — The Fund’s investments are concentrated in a comparatively narrow segment of the economy, which may make the Fund more volatile. |
| | The leisure sector depends on consumer discretionary spending, which generally falls during economic downturns. Securities of gambling casinos are often subject to high price volatility and are considered speculative. Securities of companies that make video and electronic games may be affected by the games’ risk of rapid obsolescence. |
| J. | | Securities Lending — The Fund may lend portfolio securities having a market value up to one-third of the Fund’s total assets. Such loans are secured by collateral equal to no less than the market value of the loaned securities determined daily by the securities lending provider. Such collateral will be cash or debt securities issued or guaranteed by the U.S. Government or any of its sponsored agencies. Cash collateral received in connection with these loans is invested in short-term money market instruments or affiliated money market funds and is shown as such on the Schedule of Investments. It is the Fund’s policy to obtain additional collateral from or return excess collateral to the borrower by the end of the next business day, following the valuation date of the securities loaned. Therefore, the value of the collateral held may be temporarily less than the value of the securities on loan. Lending securities entails a risk of loss to the Fund if and to the extent that the market value of the securities loaned were to increase and the borrower did not increase the collateral accordingly, and the borrower fails to return the securities. Upon the failure of the borrower to return the securities, collateral may be liquidated and the securities may be purchased on the open market to replace the loaned securities. The Fund could experience delays and costs in gaining access to the collateral. The Fund bears the risk of any deficiency in the amount of the collateral available for return to the borrower due to any loss on the collateral invested. Dividends received on cash collateral investments for securities lending transactions, which are net of compensation to counterparties, is included in Dividends from affiliated money market funds on the Statement of Operations. The aggregate value of securities out on loan is shown as a footnote on the Statement of Assets and Liabilities, if any. |
| K. | | Foreign Currency Translations — Foreign currency is valued at the close of the NYSE based on quotations posted by banks and major currency dealers. Portfolio securities and other assets and liabilities denominated in foreign currencies are translated into U.S. dollar amounts at date of valuation. Purchases and sales of portfolio securities (net of foreign taxes withheld on disposition) and income items denominated in foreign currencies are translated into U.S. dollar amounts on the respective dates of such transactions. The Fund does not separately account for the portion of the results of operations resulting from changes in foreign exchange rates on investments and the fluctuations arising from changes in market prices of securities held. The combined results of changes in foreign exchange rates and the fluctuation of market prices on investments (net of estimated foreign tax withholding) are included with the net realized and unrealized gain or loss from investments in the Statement of Operations. Reported net realized foreign currency gains or losses arise from (1) sales of foreign currencies, (2) currency gains or losses realized between the trade and settlement dates on securities transactions, and (3) the difference between the amounts of dividends, interest, and foreign withholding taxes recorded on the Fund’s books and the U.S. dollar equivalent of the amounts actually received or paid. Net unrealized foreign currency gains and losses arise from changes in the fair values of assets and liabilities, other than investments in securities at fiscal period end, resulting from changes in exchange rates. |
| | The Fund may invest in foreign securities which may be subject to foreign taxes on income, gains on investments or currency repatriation, a portion of which may be recoverable. |
| L. | | Foreign Currency Contracts — The Fund may enter into foreign currency contracts to manage or minimize currency or exchange rate risk. The Fund may also enter into foreign currency contracts for the purchase or sale of a security denominated in a foreign currency in order to “lock in” the U.S. dollar price of that security. A foreign currency contract is an obligation to purchase or sell a specific currency for an agreed-upon price at a future date. The use of foreign currency contracts does not eliminate fluctuations in the price of the underlying securities the Fund owns or intends to acquire but establishes a rate of exchange in advance. Fluctuations in the value of these contracts are measured by the difference in the contract date and reporting date exchange rates and are recorded as unrealized appreciation (depreciation) until the contracts are closed. When the contracts are closed, realized gains (losses) are recorded. Realized and unrealized gains (losses) on the contracts are included in the Statement of Operations. The primary risks associated with foreign currency contracts include failure of the counterparty to meet the terms of the contract and the value of the foreign currency changing unfavorably. These risks may be in excess of the amounts reflected in the Statement of Assets and Liabilities. |
Invesco V.I. Leisure Fund
NOTE 2—Advisory Fees and Other Fees Paid to Affiliates
The Trust has entered into a master investment advisory agreement with Invesco Advisers, Inc. (the “Adviser” or “Invesco”). Under the terms of the investment advisory agreement, the Fund pays an advisory fee to the Adviser based on the annual rate of the Fund’s average daily net assets as follows:
| | | | | |
| Average Net Assets | | Rate |
| |
| First $250 million | | | 0 | .75% |
| |
| Next $250 million | | | 0 | .74% |
| |
| Next $500 million | | | 0 | .73% |
| |
| Next $1.5 billion | | | 0 | .72% |
| |
| Next $2.5 billion | | | 0 | .71% |
| |
| Next $2.5 billion | | | 0 | .70% |
| |
| Next $2.5 billion | | | 0 | .69% |
| |
| Over $10 billion | | | 0 | .68% |
| |
Under the terms of a master sub-advisory agreement between the Adviser and each of Invesco Asset Management Deutschland GmbH, Invesco Asset Management Limited, Invesco Asset Management (Japan) Limited, Invesco Australia Limited, Invesco Hong Kong Limited, Invesco Senior Secured Management, Inc. and Invesco Canada Ltd. (collectively, the “Affiliated Sub-Advisers”) the Adviser, not the Fund, may pay 40% of the fees paid to the Adviser to any such Affiliated Sub-Adviser(s) that provide discretionary investment management services to the Fund based on the percentage of assets allocated to such Sub-Adviser(s).
The Adviser has contractually agreed, through at least April 30, 2013, to waive advisory fees and/or reimburse expenses to the extent necessary to limit total annual operating expenses after fee waiver and/or expense reimbursement (excluding certain items discussed below) of Series I shares to 1.01% and Series II shares to 1.26% of average daily net assets. In determining the Adviser’s obligation to waive advisory fees and/or reimburse expenses, the following expenses are not taken into account, and could cause the total annual operating expenses after fee waiver and/or expense reimbursement to exceed the numbers reflected above: (1) interest; (2) taxes; (3) dividend expense on short sales; (4) extraordinary or non-routine items, including litigation expenses; and (5) expenses that the Fund has incurred but did not actually pay because of an expense offset arrangement. Unless the Board of the Trustees and Invesco mutually agree to amend or continue the fee waiver agreement, it will terminate on April 30, 2013.
Further, the Adviser has contractually agreed, through at least June 30, 2012, to waive the advisory fee payable by the Fund in an amount equal to 100% of the net advisory fees the Adviser receives from the affiliated money market funds on investments by the Fund of uninvested cash (excluding investments of cash collateral from securities lending) in such affiliated money market funds.
For the year ended December 31, 2011, the Adviser waived advisory fees of $126,010.
The Trust has entered into a master administrative services agreement with Invesco pursuant to which the Fund has agreed to pay Invesco a fee for costs incurred in providing accounting services and fund administrative services to the Fund and to reimburse Invesco for administrative services fees paid to insurance companies that have agreed to provide services to the participants of separate accounts. These administrative services provided by the insurance companies may include, among other things: the printing of prospectuses, financial reports and proxy statements and the delivery of the same to existing participants; the maintenance of master accounts; the facilitation of purchases and redemptions requested by the participants; and the servicing of participants’ accounts. Pursuant to such agreement, for the year ended December 31, 2011, Invesco was paid $50,000 for accounting and fund administrative services and reimbursed $48,099 for services provided by insurance companies.
The Trust has entered into a transfer agency and service agreement with Invesco Investment Services, Inc. (“IIS”) pursuant to which the Fund has agreed to pay IIS a fee for providing transfer agency and shareholder services to the Fund and reimburse IIS for certain expenses incurred by IIS in the course of providing such services. For the year ended December 31, 2011, expenses incurred under the agreement are shown in the Statement of Operations as transfer agent fees.
The Trust has entered into a master distribution agreement with Invesco Distributors, Inc. (“IDI”) to serve as the distributor for the Fund. The Trust has adopted a plan pursuant to Rule 12b-1 under the 1940 Act with respect to the Fund’s Series II shares (the “Plan”). The Fund, pursuant to the Plan, pays IDI compensation at the annual rate of 0.25% of the Fund’s average daily net assets of Series II shares. Of the Plan payments, up to 0.25% of the average daily net assets of the Series II shares may be paid to insurance companies who furnish continuing personal shareholder services to customers who purchase and own Series II shares of the Fund. For the year ended December 31, 2011, expenses incurred under the Plan are detailed in the Statement of Operations as distribution fees.
Certain officers and trustees of the Trust are officers and directors of the Adviser, IIS and/or IDI.
NOTE 3—Additional Valuation Information
GAAP defines fair value as the price that would be received to sell an asset or paid to transfer a liability in an orderly transaction between market participants at the measurement date, under current market conditions. GAAP establishes a hierarchy that prioritizes the inputs to valuation methods giving the highest priority to readily available unadjusted quoted prices in an active market for identical assets (Level 1) and the lowest priority to significant unobservable inputs (Level 3) generally when market prices are not readily available or are unreliable. Based on the valuation inputs, the securities or other investments are tiered into one of three levels. Changes in valuation methods may result in transfers in or out of an investment’s assigned level:
| | |
| | Level 1 — | Prices are determined using quoted prices in an active market for identical assets. |
Invesco V.I. Leisure Fund
| | |
| | Level 2 — | Prices are determined using other significant observable inputs. Observable inputs are inputs that other market participants may use in pricing a security. These may include quoted prices for similar securities, interest rates, prepayment speeds, credit risk, yield curves, loss severities, default rates, discount rates, volatilities and others. |
| | Level 3 — | Prices are determined using significant unobservable inputs. In situations where quoted prices or observable inputs are unavailable (for example, when there is little or no market activity for an investment at the end of the period), unobservable inputs may be used. Unobservable inputs reflect the Fund’s own assumptions about the factors market participants would use in determining fair value of the securities or instruments and would be based on the best available information. |
The following is a summary of the tiered valuation input levels, as of December 31, 2011. The level assigned to the securities valuations may not be an indication of the risk or liquidity associated with investing in those securities. Because of the inherent uncertainties of valuation, the values reflected in the financial statements may materially differ from the value received upon actual sale of those investments.
During the year ended December 31, 2011, there were no significant transfers between investment levels.
| | | | | | | | | | | | | | | | | |
| | | Level 1 | | Level 2 | | Level 3 | | Total |
| |
| Equity Securities | | $ | 17,002,820 | | | $ | 379,411 | | | $ | — | | | $ | 17,382,231 | |
| |
NOTE 4—Security Transactions with Affiliated Funds
The Fund is permitted to purchase or sell securities from or to certain other Invesco Funds under specified conditions outlined in procedures adopted by the Board of Trustees of the Trust. The procedures have been designed to ensure that any purchase or sale of securities by the Fund from or to another fund or portfolio that is or could be considered an affiliate by virtue of having a common investment adviser (or affiliated investment advisers), common Trustees and/or common officers complies with Rule 17a-7 of the 1940 Act. Further, as defined under the procedures, each transaction is effected at the current market price. Pursuant to these procedures, for the year ended December 31, 2011, the Fund engaged in securities purchases of $30,467 and securities sales of $392,619, which resulted in net realized gains of $85,725.
NOTE 5—Trustees’ and Officers’ Fees and Benefits
“Trustees’ and Officers’ Fees and Benefits” include amounts accrued by the Fund to pay remuneration to certain Trustees and Officers of the Fund. Trustees have the option to defer compensation payable by the Fund, and “Trustees’ and Officers’ Fees and Benefits” also include amounts accrued by the Fund to fund such deferred compensation amounts. Those Trustees who defer compensation have the option to select various Invesco Funds in which their deferral accounts shall be deemed to be invested. Finally, certain current Trustees are eligible to participate in a retirement plan that provides for benefits to be paid upon retirement to Trustees over a period of time based on the number of years of service. The Fund may have certain former Trustees who also participate in a retirement plan and receive benefits under such plan. “Trustees’ and Officers’ Fees and Benefits” include amounts accrued by the Fund to fund such retirement benefits. Obligations under the deferred compensation and retirement plans represent unsecured claims against the general assets of the Fund.
During the year ended December 31, 2011, the Fund paid legal fees of $1,144 for services rendered by Kramer, Levin, Naftalis & Frankel LLP as counsel to the Independent Trustees. A partner of that firm is a Trustee of the Trust.
NOTE 6—Cash Balances
The Fund is permitted to temporarily carry a negative or overdrawn balance in its account with State Street Bank and Trust Company, the custodian bank. To compensate the custodian bank for such overdrafts, the overdrawn Fund may either (1) leave funds as a compensating balance in the account so the custodian bank can be compensated by earning the additional interest; or (2) compensate by paying the custodian bank at a rate agreed upon by the custodian bank and Invesco, not to exceed the contractually agreed upon rate.
NOTE 7—Distributions to Shareholders and Tax Components of Net Assets
Tax Character of Distributions to Shareholders Paid During the Years Ended December 31, 2011 and 2010:
| | | | | | | | | |
| | | 2011 | | 2010 |
| |
| Ordinary income | | $ | 75,955 | | | $ | 105,063 | |
| |
Tax Components of Net Assets at Period-End:
| | | | | |
| | | 2011 |
| |
| Undistributed ordinary income | | $ | 18,281 | |
| |
| Net unrealized appreciation — investments | | | 2,374,536 | |
| |
| Net unrealized appreciation — other investments | | | 11 | |
| |
| Temporary book/tax differences | | | (18,437 | ) |
| |
| Capital loss carryforward | | | (2,143,302 | ) |
| |
| Shares of beneficial interest | | | 16,797,777 | |
| |
| Total net assets | | $ | 17,028,866 | |
| |
Invesco V.I. Leisure Fund
The difference between book-basis and tax-basis unrealized appreciation (depreciation) is due to differences in the timing of recognition of gains and losses on investments for tax and book purposes. The Fund’s net unrealized appreciation difference is attributable primarily to wash sales.
The temporary book/tax differences are a result of timing differences between book and tax recognition of income and/or expenses. The Fund’s temporary book/tax differences are the result of the trustee deferral of compensation and retirement plan benefits.
Capital loss carryforward is calculated and reported as of a specific date. Results of transactions and other activity after that date may affect the amount of capital loss carryforward actually available for the Fund to utilize. The Regulated Investment Company Modernization Act of 2010 (the “Act”) eliminated the eight-year carryover period for capital losses that arise in taxable years beginning after its enactment date of December 22, 2010. Consequently, these capital losses can be carried forward for an unlimited period. However, capital losses with an expiration period may not be used to offset capital gains until all net capital losses without an expiration date have been utilized. Additionally, post-enactment capital loss carryovers will retain their character as either short-term or long-term capital losses instead of as short-term capital losses as under prior law. The ability to utilize capital loss carryforward in the future may be limited under the Internal Revenue Code and related regulations based on the results of future transactions.
The Fund utilized $1,926,808 of capital loss carryforward in the current period to offset net realized capital gain for federal income tax purposes. The Fund has a capital loss carryforward as of December 31, 2011, which expires as follows:
| | | | | | | | | | | | | |
| Capital Loss Carryforward* |
| Expiration | | Short-Term | | Long-Term | | Total |
| |
| December 31, 2017 | | $ | 2,143,302 | | | $ | — | | | $ | 2,143,302 | |
| |
| |
| * | Capital loss carryforward as of the date listed above is reduced for limitations, if any, to the extent required by the Internal Revenue Code. |
NOTE 8—Investment Securities
The aggregate amount of investment securities (other than short-term securities, U.S. Treasury obligations and money market funds, if any) purchased and sold by the Fund during the year ended December 31, 2011 was $13,438,203 and $16,734,302, respectively. Cost of investments on a tax basis includes the adjustments for financial reporting purposes as of the most recently completed Federal income tax reporting period-end.
| | | | | |
| Unrealized Appreciation (Depreciation) of Investment Securities on a Tax Basis |
| |
| Aggregate unrealized appreciation of investment securities | | $ | 2,949,728 | |
| |
| Aggregate unrealized (depreciation) of investment securities | | | (575,192 | ) |
| |
| Net unrealized appreciation of investment securities | | $ | 2,374,536 | |
| |
| Cost of investments for tax purposes is $15,007,695. |
NOTE 9—Reclassification of Permanent Differences
Primarily as a result of differing book/tax treatment of foreign currency transactions, on December 31, 2011, undistributed net investment income was decreased by $52 and undistributed net realized gain (loss) was increased by $52. This reclassification had no effect on the net assets of the Fund.
NOTE 10—Share Information
| | | | | | | | | | | | | | | | | |
| | | Summary of Share Activity |
| |
| | | Year ended December 31, |
| | | 2011(a) | | 2010 |
| | | Shares | | Amount | | Shares | | Amount |
| |
| Sold: | | | | | | | | | | | | | | | | |
| Series I | | | 7,213 | | | $ | 57,118 | | | | 28,641 | | | $ | 201,622 | |
| |
| Series II | | | 33,680 | | | | 270,258 | | | | 28,815 | | | | 204,872 | |
| |
| Issued as reinvestment of dividends: | | | | | | | | | | | | | | | | |
| Series I | | | 10,260 | | | | 74,798 | | | | 14,816 | | | | 104,602 | |
| |
| Series II | | | 155 | | | | 1,127 | | | | 65 | | | | 460 | |
| |
| Reacquired: | | | | | | | | | | | | | | | | |
| Series I | | | (436,760 | ) | | | (3,466,946 | ) | | | (531,332 | ) | | | (3,726,367 | ) |
| |
| Series II | | | (8,996 | ) | | | (69,084 | ) | | | (11,814 | ) | | | (82,359 | ) |
| |
| Net increase (decrease) in share activity | | | (394,448 | ) | | $ | (3,132,729 | ) | | | (470,809 | ) | | $ | (3,297,170 | ) |
| |
| | |
| (a) | | There are entities that are record owners of more than 5% of the outstanding shares of the Fund and in the aggregate own 97% of the outstanding shares of the Fund. The Fund and the Fund’s principal underwriter or adviser, are parties to participation agreements with these entities whereby these entities sell units of interest in separate accounts funding variable products that are invested in the Fund. The Fund, Invesco and/or Invesco affiliates may make payments to these entities, which are considered to be related to the Fund, for providing services to the Fund, Invesco and/or Invesco affiliates including but not limited to services such as, securities brokerage, third party record keeping and account servicing and administrative services. The Fund has no knowledge as to whether all or any portion of the shares owned of record by these entities are also owned beneficially. |
Invesco V.I. Leisure Fund
NOTE 11—Financial Highlights
The following schedule presents financial highlights for a share of the Fund outstanding throughout the periods indicated.
| | | | | | | | | | | | | | | | | | | | | | | | | | | | | | | | | | | | | | | | | | | | | | | | | | | | | | | | | |
| | | | | | | | | | | | | | | | | | | | | | | Ratio of
| | Ratio of
| | | | |
| | | | | | | Net gains
| | | | | | | | | | | | | | | | expenses
| | expenses
| | | | |
| | | | | | | (losses) on
| | | | | | | | | | | | | | | | to average
| | to average net
| | Ratio of net
| | |
| | | Net asset
| | Net
| | securities
| | | | Dividends
| | Distributions
| | | | | | | | | | net assets
| | assets without
| | investment
| | |
| | | value,
| | investment
| | (both
| | Total from
| | from net
| | from net
| | | | Net asset
| | | | Net assets,
| | with fee waivers
| | fee waivers
| | income (loss)
| | |
| | | beginning
| | income
| | realized and
| | investment
| | investment
| | realized
| | Total
| | value, end
| | Total
| | end of period
| | and/or expenses
| | and/or expenses
| | to average
| | Portfolio
|
| | | of period | | (loss) | | unrealized) | | operations | | income | | gains | | distributions | | of period | | return(a) | | (000s omitted) | | absorbed | | absorbed | | net assets | | turnover(b) |
| |
| Series I | | | | | | | | | | | | | | | | | | | | | | | | | | | | | | | | | | | | | | | | | | | | | | | | | | | | | | | | |
| Year ended 12/31/11 | | $ | 7.94 | | | $ | 0.01 | (c) | | $ | (0.32 | ) | | $ | (0.31 | ) | | $ | (0.03 | ) | | $ | — | | | $ | (0.03 | ) | | $ | 7.60 | | | | (3.85 | )% | | $ | 16,701 | | | | 1.01 | %(d) | | | 1.66 | %(d) | | | 0.11 | %(d) | | | 70 | % |
| Year ended 12/31/10 | | | 6.55 | | | | 0.03 | (c) | | | 1.40 | | | | 1.43 | | | | (0.04 | ) | | | — | | | | (0.04 | ) | | | 7.94 | | | | 21.88 | | | | 20,772 | | | | 1.01 | | | | 1.65 | | | | 0.41 | | | | 59 | |
| Year ended 12/31/09 | | | 5.02 | | | | 0.04 | (c) | | | 1.60 | | | | 1.64 | | | | (0.11 | ) | | | — | | | | (0.11 | ) | | | 6.55 | | | | 32.78 | | | | 20,333 | | | | 1.01 | | | | 1.74 | | | | 0.69 | | | | 61 | |
| Year ended 12/31/08 | | | 12.67 | | | | 0.12 | (c) | | | (5.67 | ) | | | (5.55 | ) | | | (0.12 | ) | | | (1.98 | ) | | | (2.10 | ) | | | 5.02 | | | | (43.04 | ) | | | 18,003 | | | | 1.01 | | | | 1.44 | | | | 1.15 | | | | 7 | |
| Year ended 12/31/07 | | | 13.82 | | | | 0.09 | | | | (0.15 | ) | | | (0.06 | ) | | | (0.24 | ) | | | (0.85 | ) | | | (1.09 | ) | | | 12.67 | | | | (0.79 | ) | | | 42,593 | | | | 1.01 | | | | 1.28 | | | | 0.50 | | | | 15 | |
| |
| Series II | | | | | | | | | | | | | | | | | | | | | | | | | | | | | | | | | | | | | | | | | | | | | | | | | | | | | | | | |
| Year ended 12/31/11 | | | 7.93 | | | | (0.01 | )(c) | | | (0.31 | ) | | | (0.32 | ) | | | (0.03 | ) | | | — | | | | (0.03 | ) | | | 7.58 | | | | (4.04 | ) | | | 328 | | | | 1.26 | (d) | | | 1.91 | (d) | | | (0.14 | )(d) | | | 70 | |
| Year ended 12/31/10 | | | 6.55 | | | | 0.01 | (c) | | | 1.41 | | | | 1.42 | | | | (0.04 | ) | | | — | | | | (0.04 | ) | | | 7.93 | | | | 21.70 | | | | 146 | | | | 1.26 | | | | 1.90 | | | | 0.16 | | | | 59 | |
| Year ended 12/31/09 | | | 5.02 | | | | 0.02 | (c) | | | 1.61 | | | | 1.63 | | | | (0.10 | ) | | | — | | | | (0.10 | ) | | | 6.55 | | | | 32.47 | | | | 9 | | | | 1.26 | | | | 1.99 | | | | 0.44 | | | | 61 | |
| Year ended 12/31/08 | | | 12.63 | | | | 0.09 | (c) | | | (5.64 | ) | | | (5.55 | ) | | | (0.08 | ) | | | (1.98 | ) | | | (2.06 | ) | | | 5.02 | | | | (43.17 | ) | | | 6 | | | | 1.26 | | | | 1.69 | | | | 0.90 | | | | 7 | |
| Year ended 12/31/07 | | | 13.78 | | | | 0.05 | | | | (0.15 | ) | | | (0.10 | ) | | | (0.20 | ) | | | (0.85 | ) | | | (1.05 | ) | | | 12.63 | | | | (1.13 | ) | | | 9 | | | | 1.26 | | | | 1.53 | | | | 0.25 | | | | 15 | |
| |
| | |
| (a) | | Includes adjustments in accordance with accounting principles generally accepted in the United States of America and as such, the net asset value for financial reporting purposes and the returns based upon those net asset values may differ from the net asset value and returns for shareholder transactions. Total returns are not annualized for periods less than one year, if applicable, and do not reflect charges assessed in connection with a variable product, which if included would reduce total returns. |
| (b) | | Portfolio turnover is calculated at the fund level and is not annualized for periods less than one year, if applicable. |
| (c) | | Calculated using average shares outstanding. |
| (d) | | Ratios are based on average daily net assets (000’s omitted) of $19,000 and $262 for Series I and Series II shares, respectively. |
NOTE 12—Proposed Reorganization
The Board of Trustees of the Fund unanimously approved an Agreement and Plan of Reorganization (the “Agreement”) pursuant to which the Fund would transfer all of its assets and liabilities to Invesco Van Kampen V.I. Capital Growth Fund (the “Acquiring Fund”).
The Agreement requires approval of the Fund’s shareholders and will be submitted to the shareholders for their consideration at a meeting to be held in or around April 2012. Upon closing of the reorganization, shareholders of the Fund will receive a corresponding class of shares of the Acquiring Fund in exchange for their shares of the Fund and the Fund will liquidate and cease operations.
Invesco V.I. Leisure Fund
Report of Independent Registered Public Accounting Firm
To the Board of Trustees of AIM Variable Insurance Funds (Invesco Variable Insurance Funds)
and Shareholders of Invesco V.I. Leisure Fund:
In our opinion, the accompanying statement of assets and liabilities, including the schedule of investments, and the related statements of operations and of changes in net assets and the financial highlights present fairly, in all material respects, the financial position of Invesco V.I. Leisure Fund (one of the funds constituting AIM Variable Insurance Funds (Invesco Variable Insurance Funds), hereafter referred to as the “Fund”) at December 31, 2011, the results of its operations for the year then ended, the changes in its net assets for each of the two years in the period then ended and the financial highlights for each of the five years in the period then ended, in conformity with accounting principles generally accepted in the United States of America. These financial statements and financial highlights (hereafter referred to as “financial statements”) are the responsibility of the Fund’s management; our responsibility is to express an opinion on these financial statements based on our audits. We conducted our audits of these financial statements in accordance with the standards of the Public Company Accounting Oversight Board (United States). Those standards require that we plan and perform the audits to obtain reasonable assurance about whether the financial statements are free of material misstatement. An audit includes examining, on a test basis, evidence supporting the amounts and disclosures in the financial statements, assessing the accounting principles used and significant estimates made by management, and evaluating the overall financial statement presentation. We believe that our audits, which included confirmation of securities at December 31, 2011 by correspondence with the custodian and brokers, provide a reasonable basis for our opinion.
PRICEWATERHOUSECOOPERS LLP
February 14, 2012
Houston, Texas
Invesco V.I. Leisure Fund
Calculating your ongoing Fund expenses
Example
As a shareholder of the Fund, you incur ongoing costs, including management fees; distribution and/or service fees (12b-1); and other Fund expenses. This example is intended to help you understand your ongoing costs (in dollars) of investing in the Fund and to compare these costs with ongoing costs of investing in other mutual funds. The example is based on an investment of $1,000 invested at the beginning of the period and held for the entire period July 1, 2011 through December 31, 2011.
The actual and hypothetical expenses in the examples below do not represent the effect of any fees or other expenses assessed in connection with a variable product; if they did, the expenses shown would be higher while the ending account values shown would be lower.
Actual expenses
The table below provides information about actual account values and actual expenses. You may use the information in this table, together with the amount you invested, to estimate the expenses that you paid over the period. Simply divide your account value by $1,000 (for example, an $8,600 account value divided by $1,000 = 8.6), then multiply the result by the number in the table under the heading entitled “Actual Expenses Paid During Period” to estimate the expenses you paid on your account during this period.
Hypothetical example for comparison purposes
The table below also provides information about hypothetical account values and hypothetical expenses based on the Fund’s actual expense ratio and an assumed rate of return of 5% per year before expenses, which is not the Fund’s actual return.
The hypothetical account values and expenses may not be used to estimate the actual ending account balance or expenses you paid for the period. You may use this information to compare the ongoing costs of investing in the Fund and other funds. To do so, compare this 5% hypothetical example with the 5% hypothetical examples that appear in the shareholder reports of the other funds.
Please note that the expenses shown in the table are meant to highlight your ongoing costs. Therefore, the hypothetical information is useful in comparing ongoing costs, and will not help you determine the relative total costs of owning different funds.
| | | | | | | | | | | | | | | | | | | | | | | | | | | | | | | |
| | | | | | | | | | HYPOTHETICAL
| | | |
| | | | | | | | | | (5% annual return before
| | | |
| | | | | | | ACTUAL | | | expenses) | | | |
| | | | Beginning
| | | Ending
| | | Expenses
| | | Ending
| | | Expenses
| | | Annualized
|
| | | | Account Value
| | | Account Value
| | | Paid During
| | | Account Value
| | | Paid During
| | | Expense
|
| Class | | | (07/01/11) | | | (12/31/11)1 | | | Period2 | | | (12/31/11) | | | Period2 | | | Ratio |
| Series I | | | $ | 1,000.00 | | | | $ | 900.20 | | | | $ | 4.85 | | | | $ | 1,020.10 | | | | $ | 5.15 | | | | | 1.01 | % |
| | | | | | | | | | | | | | | | | | | | | | | | | | | | | | | |
| Series II | | | | 1,000.00 | | | | | 899.50 | | | | | 6.04 | | | | | 1,018.84 | | | | | 6.42 | | | | | 1.26 | |
| | | | | | | | | | | | | | | | | | | | | | | | | | | | | | | |
| |
| 1 | The actual ending account value is based on the actual total return of the Fund for the period July 1, 2011 through December 31, 2011, after actual expenses and will differ from the hypothetical ending account value which is based on the Fund’s expense ratio and a hypothetical annual return of 5% before expenses. |
| 2 | Expenses are equal to the Fund’s annualized expense ratio as indicated above multiplied by the average account value over the period, multiplied by 184/365 to reflect the most recent fiscal half year. |
Invesco V.I. Leisure Fund
Form 1099-DIV, Form 1042-S and other year-end tax information provide shareholders with actual calendar year amounts that should be included in their tax returns. Shareholders should consult their tax advisors.
The following distribution information is being provided as required by the Internal Revenue Code or to meet a specific state’s requirement.
The Fund designates the following amounts or, if subsequently determined to be different, the maximum amount allowable for its fiscal year ended December 31, 2011:
| | | | | |
Federal and State Income Tax | | |
| |
| Corporate Dividends Received Deduction* | | | 100% | |
| | |
| | * | The above percentage is based on ordinary income dividends paid to shareholders during the Fund’s fiscal year. |
Invesco V.I. Leisure Fund
Trustees and Officers
The address of each trustee and officer is AIM Variable Insurance Funds (Invesco Variable Insurance Funds) (the “Trust”), 11 Greenway Plaza, Suite 2500, Houston, Texas 77046-1173. The trustees serve for the life of the Trust, subject to their earlier death, incapacitation, resignation, retirement or removal as more specifically provided in the Trust’s organizational documents. Each officer serves for a one year term or until their successors are elected and qualified. Column two below includes length of time served with predecessor entities, if any.
| | | | | | | | | |
| | | | | | | Number of Funds
| | |
Name, Year of Birth and
| | Trustee and/
| | Principal Occupation(s)
| | in Fund Complex
| | Other Directorship(s)
|
| Position(s) Held with the Trust | | or Officer Since | | During Past 5 Years | | Overseen by Trustee | | Held by Trustee |
| | | | | | | | | |
| | | | | | | | | |
| | | | | | | | | |
| Interested Persons | | | | | | | | |
| | | | | | | | | |
| | | | | | | | | |
| | | | | | | | | |
Martin L. Flanagan1 — 1960
Trustee | | 2007 | | Executive Director, Chief Executive Officer and President, Invesco Ltd. (ultimate parent of Invesco and a global investment management firm); Advisor to the Board, Invesco Advisers, Inc. (formerly known as Invesco Institutional (N.A.), Inc.); Trustee, The Invesco Funds; Vice Chair, Investment Company Institute; and Member of Executive Board, SMU Cox School of Business
Formerly: Chairman, Invesco Advisers, Inc. (registered investment adviser); Director, Chairman, Chief Executive Officer and President, IVZ Inc. (holding company), INVESCO Group Services, Inc. (service provider) and Invesco North American Holdings, Inc. (holding company); Director, Chief Executive Officer and President, Invesco Holding Company Limited (parent of Invesco and a global investment management firm); Director, Invesco Ltd.; Chairman, Investment Company Institute and President, Co-Chief Executive Officer, Co-President, Chief Operating Officer and Chief Financial Officer, Franklin Resources, Inc. (global investment management organization) | | 140 | | None |
| | | | | | | | | |
| | | | | | | | | |
| | | | | | | | | |
Philip A. Taylor2 — 1954
Trustee, President and Principal Executive Officer | | 2006 | | Head of North American Retail and Senior Managing Director, Invesco Ltd.; Director, Co-Chairman, Co-President and Co-Chief Executive Officer, Invesco Advisers, Inc. (formerly known as Invesco Institutional (N.A.), Inc.) (registered investment adviser); Director, Chairman, Chief Executive Officer and President, Invesco Management Group, Inc. (formerly Invesco Aim Management Group, Inc.) (financial services holding company); Director and President, INVESCO Funds Group, Inc. (registered investment adviser and registered transfer agent); Director and Chairman, Invesco Investment Services, Inc. (formerly known as Invesco Aim Investment Services, Inc.) (registered transfer agent) and IVZ Distributors, Inc. (formerly known as INVESCO Distributors, Inc.) (registered broker dealer); Director, President and Chairman, Invesco Inc. (holding company) and Invesco Canada Holdings Inc. (holding company); Chief Executive Officer, Invesco Corporate Class Inc. (corporate mutual fund company) and Invesco Canada Fund Inc. (corporate mutual fund company); Director, Chairman and Chief Executive Officer, Invesco Canada Ltd. (formerly known as Invesco Trimark Ltd./Invesco Trimark Ltèe) (registered investment adviser and registered transfer agent); Trustee, President and Principal Executive Officer, The Invesco Funds (other than AIM Treasurer’s Series Trust (Invesco Treasurer’s Series Trust) and Short-Term Investments Trust); Trustee and Executive Vice President, The Invesco Funds (AIM Treasurer’s Series Trust (Invesco Treasurer’s Series Trust) and Short-Term Investments Trust only); Director, Invesco Investment Advisers LLC (formerly known as Van Kampen Asset Management); Director, Chief Executive Officer and President, Van Kampen Exchange Corp. | | 140 | | None |
| | | | | | | | | |
| | | | | | | | | |
| | | | | Formerly: Director and Chairman, Van Kampen Investor Services Inc.: Director, Chief Executive Officer and President, 1371 Preferred Inc. (holding company); and Van Kampen Investments Inc.; Director and President, AIM GP Canada Inc. (general partner for limited partnerships); and Van Kampen Advisors, Inc.; Director and Chief Executive Officer, Invesco Trimark Dealer Inc. (registered broker dealer); Director, Invesco Distributors, Inc. (formerly known as Invesco Aim Distributors, Inc.) (registered broker dealer); Manager, Invesco PowerShares Capital Management LLC; Director, Chief Executive Officer and President, Invesco Advisers, Inc.; Director, Chairman, Chief Executive Officer and President, Invesco Aim Capital Management, Inc.; President, Invesco Trimark Dealer Inc. and Invesco Trimark Ltd./Invesco Trimark Ltèe; Director and President, AIM Trimark Corporate Class Inc. and AIM Trimark Canada Fund Inc.; Senior Managing Director, Invesco Holding Company Limited; Trustee and Executive Vice President, Tax-Free Investments Trust; Director and Chairman, Fund Management Company (former registered broker dealer); President and Principal Executive Officer, The Invesco Funds (AIM Treasurer’s Series Trust (Invesco Treasurer’s Series Trust), Short-Term Investments Trust and Tax-Free Investments Trust only); President, AIM Trimark Global Fund Inc. and AIM Trimark Canada Fund Inc. | | | | |
| | | | | | | | | |
| | | | | | | | | |
| | | | | | | | | |
Wayne W. Whalen3 — 1939
Trustee | | 2010 | | Of Counsel, and prior to 2010, partner in the law firm of Skadden, Arps, Slate, Meagher & Flom LLP, legal counsel to funds in the Fund Complex | | 158 | | Director of the Abraham Lincoln Presidential Library Foundation |
| | | | | | | | | |
| | | | | | | | �� | |
| | | | | | | | | |
| Independent Trustees | | | | | | | | |
| | | | | | | | | |
| | | | | | | | | |
| | | | | | | | | |
Bruce L. Crockett — 1944
Trustee and Chair | | 1993 | | Chairman, Crockett Technology Associates (technology consulting company) | | 140 | | ACE Limited (insurance company); and Investment Company Institute |
| | | | | Formerly: Director, Captaris (unified messaging provider); Director, President and Chief Executive Officer COMSAT Corporation; and Chairman, Board of Governors of INTELSAT (international communications company) | | | | |
| | | | | | | | | |
| |
| 1 | Mr. Flanagan is considered an interested person of the Trust because he is an officer of the adviser to the Trust, and an officer and a director of Invesco Ltd., ultimate parent of the adviser to the Trust. |
| 2 | Mr. Taylor is considered an interested person of the Trust because he is an officer and a director of the adviser to, and a director of the principal underwriter of, the Trust. |
| 3 | Mr. Whalen is considered an “interested person” (within the meaning of Section 2(a)(19) of the 1940 Act) of certain Funds in the Fund Complex by reason of he and his firm currently providing legal services as legal counsel to such Funds in the Fund Complex. |
Invesco V.I. Leisure Fund
Trustees and Officers—(continued)
The address of each trustee and officer is AIM Variable Insurance Funds (Invesco Variable Insurance Funds) (the “Trust”), 11 Greenway Plaza, Suite 2500, Houston, Texas 77046-1173. The trustees serve for the life of the Trust, subject to their earlier death, incapacitation, resignation, retirement or removal as more specifically provided in the Trust’s organizational documents. Each officer serves for a one year term or until their successors are elected and qualified. Column two below includes length of time served with predecessor entities, if any.
| | | | | | | | | |
| | | | | | | Number of Funds
| | |
Name, Year of Birth and
| | Trustee and/
| | Principal Occupation(s)
| | in Fund Complex
| | Other Directorship(s)
|
| Position(s) Held with the Trust | | or Officer Since | | During Past 5 Years | | Overseen by Trustee | | Held by Trustee |
| | | | | | | | | |
| | | | | | | | | |
| | | | | | | |
Independent Trustees—(continued) | | | | | | |
| | | | | | | | | |
| | | | | | | | | |
| | | | | | | | | |
David C. Arch — 1945
Trustee | | 2010 | | Chairman and Chief Executive Officer of Blistex Inc., a consumer health care products manufacturer. | | 158 | | Member of the Heartland Alliance Advisory Board, a nonprofit organization serving human needs based in Chicago. Board member of the Illinois Manufacturers’ Association. Member of the Board of Visitors, Institute for the Humanities, University of Michigan |
| | | | | | | | | |
| | | | | | | | | |
| | | | | | | | | |
Frank S. Bayley — 1939
Trustee | | 2001 | | Retired
Formerly: Director, Badgley Funds, Inc. (registered investment company) (2 portfolios) and Partner, law firm of Baker & McKenzie
Formerly: Director, Badgley Funds, Inc. (registered investment company) (2 portfolios) and Partner, law firm of Baker & McKenzie | | 140 | | Director and Chairman, C.D. Stimson Company (a real estate investment company) |
| | | | | | | | | |
| | | | | | | | | |
| | | | | | | | | |
James T. Bunch — 1942
Trustee | | 2004 | | Managing Member, Grumman Hill Group LLC (family office private equity management)
Formerly: Founder, Green, Manning & Bunch Ltd. (investment banking firm)(1988-2010); Executive Committee, United States Golf Association; and Director, Policy Studies, Inc. and Van Gilder Insurance Corporation | | 140 | | Vice Chairman, Board of Governors, Western Golf Association/Evans Scholars Foundation and Director, Denver Film Society |
| | | | | | | | | |
| | | | | | | | | |
| | | | | | | | | |
Rodney F. Dammeyer — 1940
Trustee | | 2010 | | President of CAC, LLC, a private company offering capital investment and management advisory services.
Formerly: Prior to January 2004, Director of TeleTech Holdings Inc.; Prior to 2002, Director of Arris Group, Inc.; Prior to 2001, Managing Partner at Equity Group Corporate Investments. Prior to 1995, Vice Chairman of Anixter International. Prior to 1985, experience includes Senior Vice President and Chief Financial Officer of Household International, Inc., Executive Vice President and Chief Financial Officer of Northwest Industries, Inc. and Partner of Arthur Andersen & Co. | | 158 | | Director of Quidel Corporation and Stericycle, Inc. Prior to May 2008, Trustee of The Scripps Research Institute. Prior to February 2008, Director of Ventana Medical Systems, Inc. Prior to April 2007, Director of GATX Corporation. Prior to April 2004, Director of TheraSense, Inc. |
| | | | | | | | | |
| | | | | | | | | |
| | | | | | | | | |
Albert R. Dowden — 1941
Trustee | | 2000 | | Director of a number of public and private business corporations, including the Boss Group, Ltd. (private investment and management); Reich & Tang Funds (5 portfolios) (registered investment company); and Homeowners of America Holding Corporation/ Homeowners of America Insurance Company (property casualty company)
Formerly: Director, Continental Energy Services, LLC (oil and gas pipeline service); Director, CompuDyne Corporation (provider of product and services to the public security market) and Director, Annuity and Life Re (Holdings), Ltd. (reinsurance company); Director, President and Chief Executive Officer, Volvo Group North America, Inc.; Senior Vice President, AB Volvo; Director of various public and private corporations; Chairman, DHJ Media, Inc.; Director Magellan Insurance Company; and Director, The Hertz Corporation, Genmar Corporation (boat manufacturer), National Media Corporation; Advisory Board of Rotary Power International (designer, manufacturer, and seller of rotary power engines); and Chairman, Cortland Trust, Inc. (registered investment company) | | 140 | | Board of Nature’s Sunshine Products, Inc. |
| | | | | | | | | |
| | | | | | | | | |
| | | | | | | | | |
Jack M. Fields — 1952
Trustee | | 1997 | | Chief Executive Officer, Twenty First Century Group, Inc. (government affairs company); and Owner and Chief Executive Officer, Dos Angelos Ranch, L.P. (cattle, hunting, corporate entertainment), Discovery Global Education Fund (non-profit) and Cross Timbers Quail Research Ranch (non-profit)
Formerly: Chief Executive Officer, Texana Timber LP (sustainable forestry company) and member of the U.S. House of Representatives | | 140 | | Administaff |
| | | | | | | | | |
| | | | | | | | | |
| | | | | | | | | |
Carl Frischling — 1937
Trustee | | 1993 | | Partner, law firm of Kramer Levin Naftalis and Frankel LLP | | 140 | | Director, Reich & Tang Funds (16 portfolios) |
| | | | | | | | | |
| | | | | | | | | |
Invesco V.I. Leisure Fund
Trustees and Officers—(continued)
The address of each trustee and officer is AIM Variable Insurance Funds (Invesco Variable Insurance Funds) (the “Trust”), 11 Greenway Plaza, Suite 2500, Houston, Texas 77046-1173. The trustees serve for the life of the Trust, subject to their earlier death, incapacitation, resignation, retirement or removal as more specifically provided in the Trust’s organizational documents. Each officer serves for a one year term or until their successors are elected and qualified. Column two below includes length of time served with predecessor entities, if any.
| | | | | | | | | |
| | | | | | | Number of Funds
| | |
Name, Year of Birth and
| | Trustee and/
| | Principal Occupation(s)
| | in Fund Complex
| | Other Directorship(s)
|
| Position(s) Held with the Trust | | or Officer Since | | During Past 5 Years | | Overseen by Trustee | | Held by Trustee |
Independent Trustees—(continued) | | | | | | |
| | | | | | | | | |
| | | | | | | | | |
| | | | | | | | | |
Prema Mathai-Davis — 1950
Trustee | | 1998 | | Retired
Formerly: Chief Executive Officer, YWCA of the U.S.A. | | 140 | | None |
| | | | | | | | | |
| | | | | | | | | |
| | | | | | | | | |
Larry Soll — 1942
Trustee | | 2004 | | Retired
Formerly, Chairman, Chief Executive Officer and President, Synergen Corp. (a biotechnology company) | | 140 | | None |
| | | | | | | | | |
| | | | | | | | | |
| | | | | | | | | |
Hugo F. Sonnenschein — 1940
Trustee | | 2010 | | President Emeritus and Honorary Trustee of the University of Chicago and the Adam Smith Distinguished Service Professor in the Department of Economics at the University of Chicago. Prior to July 2000, President of the University of Chicago. | | 158 | | Trustee of the University of Rochester and a member of its investment committee. Member of the National Academy of Sciences, the American Philosophical Society and a fellow of the American Academy of Arts and Sciences |
| | | | | | | | | |
| | | | | | | | | |
| | | | | | | | | |
| Raymond Stickel, Jr. — 1944 Trustee | | 2005 | | Retired
Formerly: Director, Mainstay VP Series Funds, Inc. (25 portfolios) and Partner, Deloitte & Touche | | 140 | | None |
| | | | | | | | | |
| | | | | | | | | |
| | | | | | | | | |
| Other Officers | | | | | | | | |
| | | | | | | | | |
| | | | | | | | | |
| | | | | | | | | |
Russell C. Burk — 1958
Senior Vice President and Senior Officer | | 2005 | | Senior Vice President and Senior Officer, The Invesco Funds | | N/A | | N/A |
| | | | | | | | | |
| | | | | | | | | |
| | | | | | | | | |
John M. Zerr — 1962
Senior Vice President, Chief Legal Officer and Secretary | | 2006 | | Director, Senior Vice President, Secretary and General Counsel, Invesco Management Group, Inc. (formerly known as Invesco Aim Management Group, Inc.) and Van Kampen Exchange Corp.; Senior Vice President, Invesco Advisers, Inc. (formerly known as Invesco Institutional (N.A.), Inc.) (registered investment adviser); Senior Vice President and Secretary, Invesco Distributors, Inc. (formerly known as Invesco Aim Distributors, Inc.); Director, Vice President and Secretary, Invesco Investment Services, Inc. (formerly known as Invesco Aim Investment Services, Inc.) and IVZ Distributors, Inc. (formerly known as INVESCO Distributors, Inc.); Director and Vice President, INVESCO Funds Group, Inc.; Senior Vice President, Chief Legal Officer and Secretary, The Invesco Funds; Manager, Invesco PowerShares Capital Management LLC; Director, Secretary and General Counsel, Invesco Investment Advisers LLC (formerly known as Van Kampen Asset Management); Secretary and General Counsel, Van Kampen Funds Inc. and Chief Legal Officer, PowerShares Exchange-Traded Fund Trust, PowerShares Exchange-Traded Fund Trust II, PowerShares India Exchange-Traded Fund Trust and PowerShares Actively Managed Exchange-Traded Fund Trust
Formerly: Director and Secretary, Van Kampen Advisors Inc.; Director Vice President, Secretary and General Counsel Van Kampen Investor Services Inc.; Director, Invesco Distributors, Inc. (formerly known as Invesco Aim Distributors, Inc.); Director, Senior Vice President, General Counsel and Secretary, Invesco Advisers, Inc.; and Van Kampen Investments Inc.; Director, Vice President and Secretary, Fund Management Company; Director, Senior Vice President, Secretary, General Counsel and Vice President, Invesco Aim Capital Management, Inc.; Chief Operating Officer and General Counsel, Liberty Ridge Capital, Inc. (an investment adviser); Vice President and Secretary, PBHG Funds (an investment company) and PBHG Insurance Series Fund (an investment company); Chief Operating Officer, General Counsel and Secretary, Old Mutual Investment Partners (a broker-dealer); General Counsel and Secretary, Old Mutual Fund Services (an administrator) and Old Mutual Shareholder Services (a shareholder servicing center); Executive Vice President, General Counsel and Secretary, Old Mutual Capital, Inc. (an investment adviser); and Vice President and Secretary, Old Mutual Advisors Funds (an investment company) | | N/A | | N/A |
| | | | | | | | | |
| | | | | | | | | |
| | | | | | | | | |
Lisa O. Brinkley — 1959
Vice President | | 2004 | | Global Compliance Director, Invesco Ltd.; Chief Compliance Officer, Invesco Investment Services, Inc.(formerly known as Invesco Aim Investment Services, Inc.); and Vice President, The Invesco Funds
Formerly: Chief Compliance Officer, Invesco Distributors, Inc. (formerly known as Invesco Aim Distributors, Inc.) and Van Kampen Investor Services Inc.; Senior Vice President, Invesco Management Group, Inc.; Senior Vice President and Chief Compliance Officer, Invesco Advisers, Inc. and The Invesco Funds; Vice President and Chief Compliance Officer, Invesco Aim Capital Management, Inc. and Invesco Distributors, Inc.; Vice President, Invesco Investment Services, Inc. and Fund Management Company | | N/A | | N/A |
| | | | | | | | | |
Invesco V.I. Leisure Fund
Trustees and Officers—(continued)
The address of each trustee and officer is AIM Variable Insurance Funds (Invesco Variable Insurance Funds) (the “Trust”), 11 Greenway Plaza, Suite 2500, Houston, Texas 77046-1173. The trustees serve for the life of the Trust, subject to their earlier death, incapacitation, resignation, retirement or removal as more specifically provided in the Trust’s organizational documents. Each officer serves for a one year term or until their successors are elected and qualified. Column two below includes length of time served with predecessor entities, if any.
| | | | | | | | | |
| | | | | | | Number of Funds
| | |
Name, Year of Birth and
| | Trustee and/
| | Principal Occupation(s)
| | in Fund Complex
| | Other Directorship(s)
|
| Position(s) Held with the Trust | | or Officer Since | | During Past 5 Years | | Overseen by Trustee | | Held by Trustee |
Other Officers—(continued) | | | | | | |
| | | | | | | | | |
| | | | | | | | | |
| | | | | | | | | |
Sheri Morris — 1964
Vice President, Treasurer and Principal Financial Officer | | 1999 | | Vice President, Treasurer and Principal Financial Officer, The Invesco Funds; Vice President, Invesco Advisers, Inc. (formerly known as Invesco Institutional (N.A.), Inc.) (registered investment adviser).
Formerly: Treasurer, PowerShares Exchange-Traded Fund Trust, PowerShares Exchange-Traded Fund Trust II, PowerShares India Exchange-Traded Fund Trust and PowerShares Actively Managed Exchange-Traded Fund Trust, Vice President, Invesco Advisers, Inc., Invesco Aim Capital Management, Inc. and Invesco Aim Private Asset Management, Inc.; Assistant Vice President and Assistant Treasurer, The Invesco Funds and Assistant Vice President, Invesco Advisers, Inc., Invesco Aim Capital Management, Inc. and Invesco Aim Private Asset Management, Inc. | | N/A | | N/A |
| | | | | | | | | |
| | | | | | | | | |
| | | | | | | | | |
Karen Dunn Kelley — 1960
Vice President | | 1993 | | Head of Invesco’s World Wide Fixed Income and Cash Management Group; Senior Vice President, Invesco Management Group, Inc. (formerly known as Invesco Aim Management Group, Inc.) and Invesco Advisers, Inc. (formerly known as Invesco Institutional (N.A.), Inc.) (registered investment adviser); Executive Vice President, Invesco Distributors, Inc. (formerly known as Invesco Aim Distributors, Inc.); Director, Invesco Mortgage Capital Inc.; Vice President, The Invesco Funds (other than AIM Treasurer’s Series Trust (Invesco Treasurer’s Series Trust) and Short-Term Investments Trust); and President and Principal Executive Officer, The Invesco Funds (AIM Treasurer’s Series Trust (Invesco Treasurer’s Series Trust) and Short-Term Investments Trust only).
Formerly: Senior Vice President, Van Kampen Investments Inc.; Vice President, Invesco Advisers, Inc. (formerly known as Invesco Institutional (N.A.), Inc.); Director of Cash Management and Senior Vice President, Invesco Advisers, Inc. and Invesco Aim Capital Management, Inc.; President and Principal Executive Officer, Tax-Free Investments Trust; Director and President, Fund Management Company; Chief Cash Management Officer, Director of Cash Management, Senior Vice President, and Managing Director, Invesco Aim Capital Management, Inc.; Director of Cash Management, Senior Vice President, and Vice President, Invesco Advisers, Inc. and The Invesco Funds (AIM Treasurer’s Series Trust (Invesco Treasurer’s Series Trust), Short-Term Investments Trust and Tax-Free Investments Trust only) | | N/A | | N/A |
| | | | | | | | | |
| | | | | | | | | |
| | | | | | | | | |
Yinka Akinsola — 1977
Anti-Money Laundering Compliance Officer | | 2011 | | Anti-Money Laundering Compliance Officer, Invesco Advisers, Inc. (formerly known as Invesco Institutional (N.A.), Inc.) (registered investment adviser); Invesco Distributors, Inc. (formerly known as Invesco Aim Distributors, Inc.), Invesco Investment Services, Inc. (formerly known as Invesco Aim Investment Services, Inc.), Invesco Management Group, Inc., The Invesco Funds, Invesco Van Kampen Closed-End Funds, Van Kampen Exchange Corp. and Van Kampen Funds Inc. | | N/A | | N/A |
| | | | | | | | | |
| | | | | | | | | |
| | | | | | | | | |
Todd L. Spillane — 1958
Chief Compliance Officer | | 2006 | | Senior Vice President, Invesco Management Group, Inc. (formerly known as Invesco Aim Management Group, Inc.) and Van Kampen Exchange Corp.; Senior Vice President and Chief Compliance Officer, Invesco Advisers, Inc. (registered investment adviser) (formerly known as Invesco Institutional (N.A.), Inc.); Chief Compliance Officer, The Invesco Funds, INVESCO Private Capital Investments, Inc. (holding company) and Invesco Private Capital, Inc. (registered investment adviser); Vice President, Invesco Distributors, Inc. (formerly known as Invesco Aim Distributors, Inc.) and Invesco Investment Services, Inc. (formerly known as Invesco Aim Investment Services, Inc.).
Formerly: Chief Compliance Officer, Invesco Van Kampen Closed-End Funds PowerShares Exchange-Traded Fund Trust, PowerShares Exchange-Traded Fund Trust II, PowerShares India Exchange-Traded Fund Trust, and PowerShares Actively Managed Exchange-Traded Fund Trust; Senior Vice President, Van Kampen Investments Inc.; Senior Vice President and Chief Compliance Officer, Invesco Advisers, Inc. and Invesco Aim Capital Management, Inc.; Chief Compliance Officer, Invesco Global Asset Management (N.A.), Inc., Invesco Senior Secured Management, Inc. (registered investment adviser) and Van Kampen Investor Services Inc.; Vice President, Invesco Aim Capital Management, Inc. and Fund Management Company | | N/A | | N/A |
| | | | | | | | | |
The Statement of Additional Information of the Trust includes additional information about the Fund’s Trustees and is available upon request, without charge, by calling 1.800.959.4246. Please refer to the Fund’s prospectus for information on the Fund’s sub-advisers.
| | | | | | | |
Office of the Fund
11 Greenway Plaza, Suite 2500
Houston, TX 77046-1173 | | Investment Adviser
Invesco Advisers, Inc.
1555 Peachtree Street, N.E.
Atlanta, GA 30309 | | Distributor
Invesco Distributors, Inc.
11 Greenway Plaza, Suite 2500
Houston, TX 77046-1173 | | Auditors
PricewaterhouseCoopers LLP
1201 Louisiana Street, Suite 2900
Houston, TX 77002-5678 |
| | | | | | | |
| | | | | | | |
Counsel to the Fund
Stradley Ronon Stevens & Young, LLP
2600 One Commerce Square
Philadelphia, PA 19103 | | Counsel to the Independent Trustees
Kramer, Levin, Naftalis & Frankel LLP
1177 Avenue of the Americas
New York, NY 10036-2714 | | Transfer Agent
Invesco Investment Services, Inc.
11 Greenway Plaza, Suite 2500
Houston, TX77046-1173 | | Custodian
State Street Bank and Trust Company
225 Franklin
Boston, MA 02110-2801 |
Invesco V.I. Leisure Fund
Invesco V.I. Mid Cap Core Equity Fund
Annual Report to Shareholders § December 31, 2011
The Fund provides a complete list of its holdings four times in each fiscal year, at the quarter-ends. For the second and fourth quarters, the lists appear in the Fund’s semiannual and annual reports to shareholders. For the first and third quarters, the Fund files the lists with the Securities and Exchange Commission (SEC) on Form N-Q. The Fund’s Form N-Q filings are available on the SEC website, sec.gov. Copies of the Fund’s Forms N-Q may be reviewed and copied at the SEC Public Reference Room in Washington, D.C. You can obtain information on the operation of the Public Reference Room, including information about duplicating fee charges, by calling 202 551 8090 or 800 732 0330, or by electronic request at the following email address: publicinfo@sec.gov. The SEC file numbers for the Fund are 811-07452 and 033-57340. The Fund’s most recent portfolio holdings, as filed on Form N-Q, have also been made available to insurance companies issuing variable annuity contracts and variable life insurance policies (“variable products”) that invest in the Fund.
A description of the policies and procedures that the Fund uses to determine how to vote proxies relating to portfolio securities is available without charge, upon request, from our Client Services department at 800 959 4246 or at invesco.com/proxyguidelines. The information is also available on the SEC website, sec.gov.
Information regarding how the Fund voted proxies related to its portfolio securities during the 12 months ended June 30, 2011, is available at invesco.com/proxysearch. The information is also available on the SEC website, sec.gov.
Invesco Advisers, Inc. is an investment adviser; it provides investment advisory services to individual and institutional clients and does not sell securities. Invesco Distributors, Inc. is the U.S. distributor for Invesco Ltd.’s retail mutual funds, exchange-traded funds and institutional money market funds. Both are wholly owned, indirect subsidiaries of Invesco Ltd.
This report must be accompanied or preceded by a currently effective Fund prospectus and variable product prospectus, which contain more complete information, including sales charges and expenses. Investors should read each carefully before investing.
Invesco Distributors, Inc.
VIMCCE-AR-1
| | | | | |
| |
| NOT FDIC INSURED | | MAY LOSE VALUE | | NO BANK GUARANTEE |
Management’s Discussion of Fund Performance
Performance summary
Invesco V.I. Mid Cap Core Equity Fund delivered negative returns for the year ended December 31, 2011, trailing the broad U.S. stock market, as measured by the S&P 500 Index, and the Fund’s style-specific benchmark, the Russell Midcap Index. The Fund benefited from holdings in the health care and utilities sectors, while holdings in the energy and industrials sectors detracted from results. The Fund’s underweight exposure to the consumer staples and utilities sectors was the largest detractor from results versus the style-specific benchmark.
Your Fund’s long-term performance appears later in this report.
Fund vs. Indexes
Total returns, 12/31/10 to 12/31/11, excluding variable product issuer charges. If variable product issuer charges were included, returns would be lower.
| | | | | |
| Series I Shares | | | -6.38 | % |
| |
| Series II Shares | | | -6.50 | |
| |
S&P 500 Index▼ (Broad Market Index) | | | 2.09 | |
| |
Russell Midcap Index▼ (Style-Specific Index) | | | -1.55 | |
| |
Lipper VUF Mid-Cap Core Funds Index▼ (Peer Group Index) | | | -3.51 | |
| |
How we invest
We seek to provide returns in excess of those provided by passive benchmarks, across a full market cycle, which we define as market trough to market trough, or market peak to market peak. In order to potentially realize these returns, we believe that investors need to be given a reason to stick with the Fund for long periods of time. As Fund managers, we believe the best way we can encourage this is by delivering a smoother, or less volatile, investor experience, particularly in turbulent, down-trending markets. The portfolio we construct is intended to provide attractive participation during positive-trending equity and a measure of downside protection during more turbulent, down-trending equity markets. We seek to manage your Fund using a conservative approach to mid-cap investing, keeping in mind that securities of mid-sized companies may be more volatile than securities of large-sized companies. As part of a well-diversified asset allocation strategy, the Fund may complement
more aggressive or cyclical investment strategies.
The Fund’s portfolio is comprised of what we call “core” stocks. A core stock encompasses elements of growth (revenues, profits, economic value) and value (both absolute and comparative measures). Along this growth-value continuum, we seek to identify and invest in areas of temporary disconnection between market perception and the view our research uncovers.
In order to build a portfolio of core stocks, we conduct thorough fundamental research of companies and their businesses to gain a deeper understanding of their prospects, growth potential and return on invested capital characteristics. The process we use to identify potential investments for the Fund includes three phases: financial analysis, business analysis and valuation analysis.
Financial analysis provides insights into historical returns on invested capital, a key indicator of business quality, and historical capital allocation, a key indicator
of management quality. Business analysis, which evaluates the competitive landscape and any structural or cyclical business opportunities or threats, allows us to identify key revenue, profit and return drivers of the company. Both the financial and business analyses serve as a basis to construct valuation models that help us appraise a company’s intrinsic worth. In our valuation analysis, we use three primary techniques, including discounted cash flow, traditional valuation multiples and net asset value.
We consider selling a stock when it exceeds our target price, when we have not seen a demonstrable improvement in fundamentals or when a more compelling investments opportunity exists.
Market conditions and your Fund
The year began with equity markets fueled on the second round of “quantitative easing” by the U.S. Federal Reserve. Markets rose through the first quarter of 2011. Thereafter, volatility drastically increased due to civil unrest in Egypt and Libya and the devastating earthquake and tsunami in Japan. Corporate earnings were largely positive, but often overshadowed by investor concerns about continuing high unemployment, weak consumer spending and soft housing data. At the same time, the sovereign debt crisis intensified in the eurozone and growth in developed economies slowed, weighing on investor sentiment and prompting fears of a global recession. Despite signs of sustained but muted growth, these macroeconomic factors continued to weigh on markets through the end of the reporting period.
In this environment, major U.S. equity indexes delivered somewhat flat results for the year. The S&P 500 Index was up slightly for the year, but the Nasdaq Composite Index declined slightly. These tepid results masked a great deal of volatility in 2011, and we were active managers
Portfolio Composition
By sector
| | | | | |
| Industrials | | | 18.3 | % |
| |
| Information Technology | | | 17.3 | |
| |
| Health Care | | | 11.3 | |
| |
| Energy | | | 9.8 | |
| |
| Financials | | | 8.7 | |
| |
| Consumer Discretionary | | | 6.4 | |
| |
| Consumer Staples | | | 4.3 | |
| |
| Materials | | | 3.7 | |
| |
| Telecommunication Services | | | 0.7 | |
| |
| Utilities | | | 0.5 | |
| |
Money Market Fund Plus Other
Assets Less Liabilities | | | 19.0 | |
Top 10 Equity Holdings*
| | | | | | | | | |
| | 1. | | | Symantec Corp. | | | 2.5 | % |
| |
| | 2. | | | Adobe Systems Inc. | | | 2.0 | |
| |
| | 3. | | | Weatherford International Ltd. | | | 1.9 | |
| |
| | 4. | | | Safeway Inc. | | | 1.9 | |
| |
| | 5. | | | Linear Technology Corp. | | | 1.9 | |
| |
| | 6. | | | Southwestern Energy Co. | | | 1.8 | |
| |
| | 7. | | | Hologic, Inc. | | | 1.8 | |
| |
| | 8. | | | Molson Coors Brewing Co.-Class B | | | 1.8 | |
| |
| | 9. | | | Aetna Inc. | | | 1.7 | |
| |
| | 10. | | | Kirby Corp. | | | 1.5 | |
Top Five Industries
| | | | | |
| 1. Oil & Gas Equipment & Services | | | 4.9 | % |
| |
| 2. Aerospace & Defense | | | 4.3 | |
| |
| 3. Oil & Gas Exploration & Production | | | 3.8 | |
| |
| 4. Industrial Machinery | | | 3.8 | |
| |
| 5. Systems Software | | | 3.7 | |
| | |
| Total Net Assets | | $387.3 million |
| | | |
| Total Number of Holdings* | | 85 |
The Fund’s holdings are subject to change, and there is no assurance that the Fund will continue to hold any particular security.
*Excluding money market fund holdings.
Invesco V.I. Mid Cap Core Equity Fund
throughout – taking profits into the market’s strength in the first half of the year and using weakness in the third quarter to invest in attractively valued, core stocks.
One area of strength in which we reduced our position was Motorola Mobility, the largest contributor to Fund results for the year. The company, a spin-off from parent company Motorola Solutions, is focused primarily on the handset and home DVR and cable equipment businesses. We also held Motorola Solutions during the reporting period but sold our position in the stock before the close of the reporting period. In August, Google (not a Fund holding at the close of the reporting period) announced plans to acquire Motorola Mobility at a premium for $12.5 billion in cash, or $40 per share.1
Another strong contributor to Fund performance for the year was Aetna, one of the largest managed health care providers in the U.S. The company has been a good investment for the Fund. We originally purchased Aetna in early 2010. The managed health care industry had been under pressure for quite some time due to health care reform concerns and weak margins. Also, historically high unemployment has resulted in shrinking enrollment and utilization and a less favorable membership mix within plans. Our view at the time of our purchase was that the company was under-earning but was taking steps to improve its pricing, which would improve its margins over time. In 2011, the company’s earnings improved considerably, largely driven by an improvement in margins. We reduced some of our exposure during the reporting period on relative strength, but at the end of the year, it remained one of the Fund’s top holdings.
Some of the Fund’s largest detractors during the year were in the energy sector. These detractors included Cal Dive International and Weatherford International.
Cal Dive International, a provider of underwater services to offshore oil and natural gas firms, reported weak earnings and utilization, citing a lack of new drilling in the Gulf of Mexico due to slow permitting activity following a 2010 oil spill. We sold our position in Cal Dive International before the close of the reporting period.
Oil services firm Weatherford International was a new investment for us in 2011. The company faced a number of headline issues early in the year that negatively affected the stock. These issues included a restatement of the company’s financial results due to improper income tax reporting. The company faced additional pressures (as did some of its peers) through the summer due to fears of a global economic recession and its
potential impact on energy demand. We believe the company has room to improve its margins and that oil equipment and service firms will continue to benefit from increased capital expenditures and the need for more sophisticated extraction technologies. We were active investors in the company throughout the year as the stock’s valuation became increasingly attractive.
The largest individual detractor from Fund results was Foster Wheeler, a global construction and engineering firm that specializes in project engineering, procurement, construction and maintenance services primarily related to the oil and gas industry. The company is a traditional “late cycle” business that has lagged other commodity-related cyclical companies in recent years. We invested in the company during the market pull-back over the summer. We believed the company’s contract backlog had reached a low point, and that global infrastructure spending is likely to accelerate in the coming years. The company is geographically diversified across developed and emerging markets and, in our view, may benefit from exposure to these markets.
Over the year, our cash weighting fluctuated as market choppiness allowed us to buy on weakness and sell into strength. Markets rallied in the first half of the reporting period, providing us with opportunities to take profits; however, as market volatility increased over the summer, we purchased quality companies that are leveraged to growth markets around the world. During the year, we increased our exposure to the information technology, consumer discretionary and energy sectors, and we reduced our exposure to the health care, financials and materials sectors. As a result of our buys and sells, our cash position increased slightly compared to the prior year-end, and it stood at approximately 19% of total net assets at the end of the reporting period.
Maintaining a conservative approach is an enduring part of our investment strategy. Amid the market’s volatility, we sought judicious long-term investments for the Fund. At the end of the year, the Fund was positioned with more or less a “barbell” approach, balancing our more cyclical holdings in energy, industrials and information technology with cash and health care holdings, which typically tend to be more defensive.
Regardless of market conditions, our goal remains the same: to provide upside participation with a measure of downside protection, so that over a full market cycle we may deliver strong investment results with reduced risk relative to the Fund’s style-specific benchmark.
As always, we would like to thank you for your continued investment in Invesco V.I. Mid Cap Core Equity Fund.
1 Source: Google
The views and opinions expressed in management’s discussion of Fund performance are those of Invesco Advisers, Inc. These views and opinions are subject to change at any time based on factors such as market and economic conditions. These views and opinions may not be relied upon as investment advice or recommendations, or as an offer for a particular security. The information is not a complete analysis of every aspect of any market, country, industry, security or the Fund. Statements of fact are from sources considered reliable, but Invesco Advisers, Inc. makes no representation or warranty as to their completeness or accuracy. Although historical performance is no guarantee of future results, these insights may help you understand our investment management philosophy.
See important Fund and, if applicable, index disclosures later in this report.
Ronald Sloan
Chartered Financial Analyst, portfolio manager, is lead manager of Invesco V.I. Mid Cap Core Equity Fund. He joined Invesco in 1998. Mr. Sloan earned a B.S. in business administration and an M.B.A. from the University of Missouri.
Douglas Asiello
Chartered Financial Analyst, portfolio manager, is manager of Invesco V.I. Mid Cap Core Equity Fund. He joined Invesco in 2001. Mr. Asiello graduated summa cum laude with Phi Beta Kappa honors from Vanderbilt University, where he earned a B.A. in international relations and Spanish. He earned an M.B.A. with a concentration in finance from The Wharton School at the University of Pennsylvania. He also earned an M.A. in international management from the Joseph H. Lauder Institute of Management and International Studies.
Brian Nelson
Chartered Financial Analyst, portfolio manager, is manager of Invesco V.I. Mid Cap Core Equity Fund. Mr. Nelson joined Invesco in 2004. He earned a B.A. from the University of California-Santa Barbara.
Invesco V.I. Mid Cap Core Equity Fund
Your Fund’s Long-Term Performance
Results of a $10,000 Investment
Fund and index data from 12/31/01*
| | |
| * | During the reporting period, Invesco changed its policy regarding growth of $10,000 charts. For funds older than 10 years, we previously showed performance since inception. Going forward, we will show performance for the most recent 10 years, since this more accurately reflects the experience of the typical shareholder. As a result, charts now may include benchmarks that did not appear previously, because the funds’ inception pre-dated the benchmarks’ inception. Also, all charts will now be presented using a linear format. |
Past performance cannot guarantee comparable future results.
| | | | |
| |
| Average Annual Total Returns |
| As of 12/31/11 |
| | | | | |
Series I Shares | | | | |
| |
| Inception (9/10/01) | | | 5.89 | % |
| |
| 10 Years | | | 5.32 | |
| |
| 5 Years | | | 1.73 | |
| |
| 1 Year | | | -6.38 | |
| |
| | | | | |
Series II Shares | | | | |
| |
| Inception (9/10/01) | | | 5.64 | % |
| |
| 10 Years | | | 5.09 | |
| |
| 5 Years | | | 1.49 | |
| |
| 1 Year | | | -6.50 | |
The performance of the Fund’s Series I and Series II share classes will differ primarily due to different class expenses.
The performance data quoted represent past performance and cannot guarantee comparable future results; current performance may be lower or higher. Please contact your variable product issuer or financial adviser for
the most recent month-end variable product performance. Performance figures reflect Fund expenses, reinvested distributions and changes in net asset value. Investment return and principal value will fluctuate so that you may have a gain or loss when you sell shares.
The total annual Fund operating expense ratio set forth in the most recent Fund prospectus as of the date of this report for Series I and Series II shares was 1.03% and 1.28%, respectively. The expense ratios presented above may vary from the expense ratios presented in other sections of this report that are based on expenses incurred during the period covered by this report.
Invesco V.I. Mid Cap Core Equity Fund, a series portfolio of AIM Variable Insurance Funds (Invesco Variable Insurance Funds), is currently offered through insurance companies issuing
variable products. You cannot purchase shares of the Fund directly. Performance figures given represent the Fund and are not intended to reflect actual variable product values. They do not reflect sales charges, expenses and fees assessed in connection with a variable product. Sales charges, expenses and fees, which are determined by the variable product issuers, will vary and will lower the total return.
The most recent month-end performance data at the Fund level, excluding variable product charges, is available at 800 451 4246. As mentioned above, for the most recent month-end performance including variable product charges, please contact your variable product issuer or financial adviser.
Invesco V.I. Mid Cap Core Equity Fund
Invesco V.I. Mid Cap Core Equity Fund’s investment objective is long-term growth of capital.
| n | | Unless otherwise stated, information presented in this report is as of December 31, 2011, and is based on total net assets. |
| |
| n | | Unless otherwise noted, all data provided by Invesco. |
| |
| n | | To access your Fund’s reports/prospectus, visit invesco.com/fundreports. |
Principal risks of investing in the Fund
Cash/cash equivalents risk. Holding cash or cash equivalents may negatively affect performance.
Credit risk. The issuer of instruments in which the Fund invests may be unable to meet interest and/or principal payments, thereby causing its instruments to decrease in value and lowering the issuer’s credit rating.
Foreign securities risk. The Fund’s foreign investments may be affected by changes in a foreign country’s exchange rates; political and social instability; changes in economic or taxation policies; difficulties when enforcing obligations; decreased liquidity; and increased volatility. Foreign companies may be subject to less regulation resulting in less publicly available information about the companies.
Interest rate risk. Interest rate risk refers to the risk that bond prices generally fall as interest rates rise; conversely, bond prices generally rise as interest rates fall. Specific bonds differ in their sensitivity to changes in interest rates depending on their individual characteristics, including duration.
Management risk. The investment techniques and risk analysis used by the Fund’s portfolio managers may not produce the desired results.
Market risk. The prices of and the income generated by the Fund’s securities may decline in response to, among other things, investor sentiment; general economic and market conditions; regional or global instability; and currency and interest rate fluctuations.
Small and mid-capitalization risk. Stocks of small and mid-sized companies tend to be more vulnerable to adverse developments in the above factors and may have little or no operating history or track record of success, and limited product lines, markets, management and financial resources. The securities of small and mid-sized companies may be more volatile due to less market interest
and less publicly available information about the issuer. They also may be illiquid or restricted as to resale, or may trade less frequently and in smaller volumes, all of which may cause difficulty when establishing or closing a position at a desirable price.
U.S. government obligations risk. The Fund may invest in obligations issued by U.S. government agencies and instrumentalities that may receive varying levels of support from the government, which could affect the Fund’s ability to recover should they default.
About indexes used in this report
The S&P 500® Index is an unmanaged index considered representative of the U.S. stock market.
The Russell Midcap® Index is an unmanaged index considered representative of mid-cap stocks. The Russell Midcap Index is a trademark/service mark of the Frank Russell Co. Russell® is a trademark of the Frank Russell Co.
The Lipper VUF Mid-Cap Core Funds Index is an unmanaged index considered representative of mid-cap core variable insurance underlying funds tracked by Lipper.
The Dow Jones Industrial Average is a price-weighted index of the 30 largest, most widely held stocks traded on the New York Stock Exchange.
The Nasdaq Composite Index (price-only) is a broad-based capitalization-weighted index of all NASDAQ National Market & Small Cap stocks.
The Fund is not managed to track the performance of any particular index, including the index(es) defined here, and consequently, the performance of the Fund may deviate significantly from the performance of the index(es).
A direct investment cannot be made in an index. Unless otherwise indicated, index results include reinvested dividends, and they do not reflect sales charges. Performance of the peer group, if applicable, reflects fund expenses; performance of a market index does not.
Other information
The Chartered Financial Analyst® (CFA®) designation is globally recognized and attests to a charterholder’s success in a rigorous and comprehensive study program in the field of investment management and research analysis.
Industry classifications used in this report are generally according to the Global Industry Classification Standard, which was developed by and is the exclusive property and a service mark of MSCI Inc. and Standard & Poor’s.
The returns shown in management’s discussion of Fund performance are based on net asset values calculated for shareholder transactions. Generally accepted accounting principles require adjustments to be made to the net assets of the Fund at period end for financial reporting purposes, and as such, the net asset values for shareholder transactions and the returns based on those net asset values may differ from the net asset values and returns reported in the Financial Highlights. Additionally, the returns and net asset values shown throughout this report are at the Fund level only and do not include variable product issuer charges. If such charges were included, the total returns would be lower.
Invesco V.I. Mid Cap Core Equity Fund
Schedule of Investments(a)
December 31, 2011
| | | | | | | | | |
| | | Shares | | Value |
| |
Common Stocks–81.01%
|
Aerospace & Defense–4.30%
| | | | |
| Alliant Techsystems Inc. | | | 62,631 | | | $ | 3,579,988 | |
| |
| Exelis Inc. | | | 429,815 | | | | 3,889,826 | |
| |
| ITT Corp. | | | 128,006 | | | | 2,474,356 | |
| |
Moog Inc.–Class A(b) | | | 78,143 | | | | 3,432,822 | |
| |
| Xylem, Inc. | | | 127,752 | | | | 3,281,949 | |
| |
| | | | | | | | 16,658,941 | |
| |
Air Freight & Logistics–0.80%
| | | | |
| Expeditors International of Washington, Inc. | | | 75,261 | | | | 3,082,691 | |
| |
Apparel Retail–1.22%
| | | | |
Citi Trends Inc.(b) | | | 145,654 | | | | 1,278,842 | |
| |
| Guess?, Inc. | | | 115,272 | | | | 3,437,411 | |
| |
| | | | | | | | 4,716,253 | |
| |
Apparel, Accessories & Luxury Goods–0.21%
| | | | |
Michael Kors Holdings Ltd.(b) | | | 30,494 | | | | 830,962 | |
| |
Application Software–1.97%
| | | | |
Adobe Systems Inc.(b) | | | 270,539 | | | | 7,648,138 | |
| |
Asset Management & Custody Banks–1.94%
| | | | |
| Legg Mason, Inc. | | | 126,816 | | | | 3,049,925 | |
| |
| Northern Trust Corp. | | | 112,569 | | | | 4,464,486 | |
| |
| | | | | | | | 7,514,411 | |
| |
Auto Parts & Equipment–0.98%
| | | | |
Tenneco Inc.(b) | | | 127,364 | | | | 3,792,900 | |
| |
Biotechnology–0.54%
| | | | |
Biogen Idec Inc.(b) | | | 18,850 | | | | 2,074,442 | |
| |
Brewers–1.78%
| | | | |
| Molson Coors Brewing Co.–Class B | | | 157,910 | | | | 6,875,401 | |
| |
Communications Equipment–3.29%
| | | | |
Juniper Networks, Inc.(b) | | | 209,205 | | | | 4,269,874 | |
| |
Motorola Mobility Holdings Inc.(b) | | | 103,804 | | | | 4,027,595 | |
| |
Research In Motion Ltd. (Canada)(b) | | | 168,895 | | | | 2,448,977 | |
| |
| Tellabs, Inc. | | | 498,168 | | | | 2,012,599 | |
| |
| | | | | | | | 12,759,045 | |
| |
Computer & Electronics Retail–1.05%
| | | | |
GameStop Corp.–Class A(b) | | | 167,935 | | | | 4,052,272 | |
| |
Computer Storage & Peripherals–0.54%
| | | | |
NetApp, Inc.(b) | | | 45,332 | | | | 1,644,192 | |
| |
SMART Technologies Inc.–Class A (Canada)(b) | | | 124,683 | | | | 460,080 | |
| |
| | | | | | | | 2,104,272 | |
| |
Construction & Engineering–2.63%
| | | | |
| Chicago Bridge & Iron Co. N.V.–New York Shares (Netherlands) | | | 133,006 | | | | 5,027,627 | |
| |
Foster Wheeler AG (Switzerland)(b) | | | 269,120 | | | | 5,150,957 | |
| |
| | | | | | | | 10,178,584 | |
| |
Construction & Farm Machinery & Heavy Trucks–1.17%
| | | | |
Terex Corp.(b) | | | 336,381 | | | | 4,544,507 | |
| |
Construction Materials–0.90%
| | | | |
| CRH PLC (Ireland) | | | 175,244 | | | | 3,483,929 | |
| |
Consumer Electronics–0.53%
| | | | |
| Garmin Ltd. (Switzerland) | | | 51,206 | | | | 2,038,511 | |
| |
Data Processing & Outsourced Services–0.86%
| | | | |
| Western Union Co. | | | 181,683 | | | | 3,317,532 | |
| |
Department Stores–1.02%
| | | | |
| Macy’s, Inc. | | | 122,861 | | | | 3,953,667 | |
| |
Electric Utilities–0.51%
| | | | |
| Edison International | | | 47,596 | | | | 1,970,474 | |
| |
Electrical Components & Equipment–2.32%
| | | | |
| Cooper Industries PLC (Ireland) | | | 79,618 | | | | 4,311,315 | |
| |
Thomas & Betts Corp.(b) | | | 85,556 | | | | 4,671,357 | |
| |
| | | | | | | | 8,982,672 | |
| |
Electronic Components–2.27%
| | | | |
| Amphenol Corp.–Class A | | | 119,389 | | | | 5,419,067 | |
| |
Dolby Laboratories Inc.–Class A(b) | | | 110,380 | | | | 3,367,694 | |
| |
| | | | | | | | 8,786,761 | |
| |
Electronic Equipment & Instruments–0.40%
| | | | |
Checkpoint Systems, Inc.(b) | | | 142,826 | | | | 1,562,516 | |
| |
Electronic Manufacturing Services–0.79%
| | | | |
| Molex Inc. | | | 128,999 | | | | 3,077,916 | |
| |
Environmental & Facilities Services–1.17%
| | | | |
| Republic Services, Inc. | | | 165,020 | | | | 4,546,301 | |
| |
Food Retail–1.90%
| | | | |
| Safeway Inc. | | | 350,538 | | | | 7,375,320 | |
| |
Health Care Equipment–2.80%
| | | | |
Boston Scientific Corp.(b) | | | 485,379 | | | | 2,591,924 | |
| |
Hologic, Inc.(b) | | | 398,795 | | | | 6,982,900 | |
| |
| Olympus Corp. (Japan) | | | 97,900 | | | | 1,287,689 | |
| |
| | | | | | | | 10,862,513 | |
| |
| | | | | | | | | |
| | | | | | | | | |
See accompanying Notes to Financial Statements which are an integral part of the financial statements.
Invesco V.I. Mid Cap Core Equity Fund
| | | | | | | | | |
| | | Shares | | Value |
| |
Health Care Facilities–1.22%
| | | | |
| Rhoen-Klinikum AG (Germany) | | | 110,662 | | | $ | 2,108,343 | |
| |
VCA Antech, Inc.(b) | | | 131,480 | | | | 2,596,730 | |
| |
| | | | | | | | 4,705,073 | |
| |
Health Care Services–2.39%
| | | | |
DaVita, Inc.(b) | | | 28,511 | | | | 2,161,419 | |
| |
Laboratory Corp. of America Holdings(b) | | | 36,264 | | | | 3,117,616 | |
| |
| Quest Diagnostics Inc. | | | 68,385 | | | | 3,970,433 | |
| |
| | | | | | | | 9,249,468 | |
| |
Industrial Conglomerates–0.57%
| | | | |
| Tyco International Ltd. | | | 47,106 | | | | 2,200,321 | |
| |
Industrial Machinery–3.76%
| | | | |
| IDEX Corp. | | | 7,928 | | | | 294,208 | |
| |
| Ingersoll-Rand PLC (Ireland) | | | 157,861 | | | | 4,810,025 | |
| |
| Parker Hannifin Corp. | | | 60,296 | | | | 4,597,570 | |
| |
| SPX Corp. | | | 80,437 | | | | 4,847,938 | |
| |
| | | | | | | | 14,549,741 | |
| |
Insurance Brokers–1.19%
| | | | |
| Marsh & McLennan Cos., Inc. | | | 145,297 | | | | 4,594,291 | |
| |
Investment Banking & Brokerage–0.71%
| | | | |
| Charles Schwab Corp. (The) | | | 243,884 | | | | 2,746,134 | |
| |
Leisure Products–0.39%
| | | | |
| Hasbro, Inc. | | | 47,704 | | | | 1,521,281 | |
| |
Life & Health Insurance–1.14%
| | | | |
| Torchmark Corp. | | | 102,154 | | | | 4,432,462 | |
| |
Life Sciences Tools & Services–2.28%
| | | | |
Agilent Technologies, Inc.(b) | | | 142,803 | | | | 4,988,109 | |
| |
Waters Corp.(b) | | | 51,739 | | | | 3,831,273 | |
| |
| | | | | | | | 8,819,382 | |
| |
Managed Health Care–1.72%
| | | | |
| Aetna Inc. | | | 158,161 | | | | 6,672,813 | |
| |
Marine–1.52%
| | | | |
Kirby Corp.(b) | | | 89,512 | | | | 5,893,470 | |
| |
Multi-Sector Holdings–0.37%
| | | | |
PICO Holdings, Inc.(b) | | | 69,441 | | | | 1,429,096 | |
| |
Oil & Gas Drilling–0.62%
| | | | |
| Transocean Ltd. | | | 62,636 | | | | 2,404,596 | |
| |
Oil & Gas Equipment & Services–4.95%
| | | | |
Cameron International Corp.(b) | | | 116,354 | | | | 5,723,453 | |
| |
Dresser-Rand Group, Inc.(b) | | | 82,674 | | | | 4,126,259 | |
| |
| ShawCor Ltd. (Canada) | | | 65,431 | | | | 1,854,778 | |
| |
Weatherford International Ltd.(b) | | | 509,144 | | | | 7,453,868 | |
| |
| | | | | | | | 19,158,358 | |
| |
Oil & Gas Exploration & Production–3.76%
| | | | |
| Cimarex Energy Co. | | | 38,348 | | | | 2,373,741 | |
| |
Newfield Exploration Co.(b) | | | 134,176 | | | | 5,062,461 | |
| |
Southwestern Energy Co.(b) | | | 222,845 | | | | 7,117,669 | |
| |
| | | | | | | | 14,553,871 | |
| |
Oil & Gas Refining & Marketing–0.48%
| | | | |
| Valero Energy Corp. | | | 88,288 | | | | 1,858,462 | |
| |
Personal Products–0.62%
| | | | |
| Avon Products, Inc. | | | 137,269 | | | | 2,398,089 | |
| |
Pharmaceuticals–0.39%
| | | | |
Hospira, Inc.(b) | | | 49,112 | | | | 1,491,531 | |
| |
Property & Casualty Insurance–1.48%
| | | | |
| Progressive Corp. (The) | | | 293,274 | | | | 5,721,776 | |
| |
Restaurants–1.03%
| | | | |
| Darden Restaurants, Inc. | | | 87,582 | | | | 3,991,988 | |
| |
Semiconductors–3.44%
| | | | |
| Linear Technology Corp. | | | 241,126 | | | | 7,241,014 | |
| |
| Microchip Technology Inc. | | | 75,218 | | | | 2,755,235 | |
| |
| Xilinx, Inc. | | | 103,602 | | | | 3,321,480 | |
| |
| | | | | | | | 13,317,729 | |
| |
Specialized Finance–0.74%
| | | | |
| Moody’s Corp. | | | 85,062 | | | | 2,864,888 | |
| |
Specialty Chemicals–2.32%
| | | | |
| International Flavors & Fragrances Inc. | | | 89,648 | | | | 4,699,348 | |
| |
| Sigma-Aldrich Corp. | | | 68,839 | | | | 4,299,684 | |
| |
| | | | | | | | 8,999,032 | |
| |
Steel–0.44%
| | | | |
| Allegheny Technologies, Inc. | | | 35,974 | | | | 1,719,557 | |
| |
Systems Software–3.71%
| | | | |
| CA, Inc. | | | 228,504 | | | | 4,619,208 | |
| |
Symantec Corp.(b) | | | 623,130 | | | | 9,751,985 | |
| |
| | | | | | | | 14,371,193 | |
| |
Thrifts & Mortgage Finance–1.12%
| | | | |
| People’s United Financial Inc. | | | 338,579 | | | | 4,350,740 | |
| |
| | | | | | | | | |
| | | | | | | | | |
See accompanying Notes to Financial Statements which are an integral part of the financial statements.
Invesco V.I. Mid Cap Core Equity Fund
| | | | | | | | | |
| | | Shares | | Value |
| |
Trucking–0.11%
| | | | |
| Con-way Inc. | | | 14,557 | | | $ | 424,482 | |
| |
Wireless Telecommunication Services–0.65%
| | | | |
MetroPCS Communications, Inc.(b) | | | 289,931 | | | | 2,516,601 | |
| |
| Total Common Stocks (Cost $282,442,662) | | | | | | | 313,747,356 | |
| |
Money Market Funds–20.24%
|
Liquid Assets Portfolio–Institutional Class(c) | | | 39,197,101 | | | | 39,197,101 | |
| |
Premier Portfolio–Institutional Class(c) | | | 39,197,100 | | | | 39,197,100 | |
| |
| Total Money Market Funds (Cost $78,394,201) | | | | | | | 78,394,201 | |
| |
| TOTAL INVESTMENTS–101.25% (Cost $360,836,863) | | | | | | | 392,141,557 | |
| |
| OTHER ASSETS LESS LIABILITIES–(1.25)% | | | | | | | (4,843,552 | ) |
| |
| NET ASSETS–100.00% | | | | | | $ | 387,298,005 | |
| |
Notes to Schedule of Investments:
| | |
| (a) | | Industry and/or sector classifications used in this report are generally according to the Global Industry Classification Standard, which was developed by and is the exclusive property and a service mark of MSCI Inc. and Standard & Poor’s. |
| (b) | | Non-income producing security. |
| (c) | | The money market fund and the Fund are affiliated by having the same investment adviser. |
See accompanying Notes to Financial Statements which are an integral part of the financial statements.
Invesco V.I. Mid Cap Core Equity Fund
Statement of Assets and Liabilities
December 31, 2011
| | | | | |
Assets:
|
| Investments, at value (Cost $282,442,662) | | $ | 313,747,356 | |
| |
| Investments in affiliated money market funds, at value and cost | | | 78,394,201 | |
| |
| Total investments, at value (Cost $360,836,863) | | | 392,141,557 | |
| |
| Receivable for: | | | | |
| Investments sold | | | 58,019 | |
| |
| Fund shares sold | | | 952,143 | |
| |
| Dividends | | | 345,496 | |
| |
| Investment for trustee deferred compensation and retirement plans | | | 27,584 | |
| |
| Total assets | | | 393,524,799 | |
| |
Liabilities:
|
| Payable for: | | | | |
| Investments purchased | | | 5,384,985 | |
| |
| Fund shares reacquired | | | 466,142 | |
| |
| Accrued fees to affiliates | | | 274,912 | |
| |
| Accrued other operating expenses | | | 12,530 | |
| |
| Trustee deferred compensation and retirement plans | | | 88,225 | |
| |
| Total liabilities | | | 6,226,794 | |
| |
| Net assets applicable to shares outstanding | | $ | 387,298,005 | |
| |
Net assets consist of:
|
| Shares of beneficial interest | | $ | 355,313,593 | |
| |
| Undistributed net investment income | | | 103,625 | |
| |
| Undistributed net realized gain | | | 576,282 | |
| |
| Unrealized appreciation | | | 31,304,505 | |
| |
| | | $ | 387,298,005 | |
| |
Net Assets:
|
| Series I | | $ | 322,102,473 | |
| |
| Series II | | $ | 65,195,532 | |
| |
Shares outstanding, $0.001 par value per share, with an unlimited number of shares authorized:
|
| Series I | | | 27,853,344 | |
| |
| Series II | | | 5,685,658 | |
| |
| Series I: | | | | |
| Net asset value per share | | $ | 11.56 | |
| |
| Series II: | | | | |
| Net asset value per share | | $ | 11.47 | |
| |
Statement of Operations
For the year ended December 31, 2011
| | | | | |
Investment income:
|
| Dividends (net of foreign withholding taxes of $26,707) | | $ | 4,714,782 | |
| |
| Dividends from affiliated money market funds (includes securities lending income of $11,715) | | | 79,314 | |
| |
| Total investment income | | | 4,794,096 | |
| |
Expenses:
|
| Advisory fees | | | 3,202,658 | |
| |
| Administrative services fees | | | 1,224,573 | |
| |
| Custodian fees | | | 12,581 | |
| |
| Distribution fees — Series II | | | 160,829 | |
| |
| Transfer agent fees | | | 21,973 | |
| |
| Trustees’ and officers’ fees and benefits | | | 36,700 | |
| |
| Other | | | 38,351 | |
| |
| Total expenses | | | 4,697,665 | |
| |
| Less: Fees waived | | | (96,968 | ) |
| |
| Net expenses | | | 4,600,697 | |
| |
| Net investment income | | | 193,399 | |
| |
Realized and unrealized gain (loss) from:
|
| Net realized gain (loss) from: | | | | |
| Investment securities (includes net gains from securities sold to affiliates of $114,930) | | | 34,270,404 | |
| |
| Foreign currencies | | | (7,232 | ) |
| |
| Option contracts written | | | 21,601 | |
| |
| | | | 34,284,773 | |
| |
| Change in net unrealized appreciation (depreciation) of: | | | | |
| Investment securities | | | (61,222,154 | ) |
| |
| Foreign currencies | | | 39 | |
| |
| | | | (61,222,115 | ) |
| |
| Net realized and unrealized gain (loss) | | | (26,937,342 | ) |
| |
| Net increase (decrease) in net assets resulting from operations | | $ | (26,743,943 | ) |
| |
See accompanying Notes to Financial Statements which are an integral part of the financial statements.
Invesco V.I. Mid Cap Core Equity Fund
Statement of Changes in Net Assets
For the years ended December 31, 2011 and 2010
| | | | | | | | | |
| | | 2011 | | 2010 |
| |
Operations:
|
| Net investment income | | $ | 193,399 | | | $ | 1,149,522 | |
| |
| Net realized gain | | | 34,284,773 | | | | 41,205,337 | |
| |
| Change in net unrealized appreciation (depreciation) | | | (61,222,115 | ) | | | 18,415,260 | |
| |
| Net increase (decrease) in net assets resulting from operations | | | (26,743,943 | ) | | | 60,770,119 | |
| |
Distributions to shareholders from net investment income:
|
| Series I | | | (1,052,469 | ) | | | (2,274,130 | ) |
| |
| Series II | | | (54,708 | ) | | | (186,084 | ) |
| |
| Total distributions from net investment income | | | (1,107,177 | ) | | | (2,460,214 | ) |
| |
Share transactions–net:
|
| Series I | | | (66,537,862 | ) | | | (71,565,903 | ) |
| |
| Series II | | | 8,287,414 | | | | (1,706,198 | ) |
| |
| Net increase (decrease) in net assets resulting from share transactions | | | (58,250,448 | ) | | | (73,272,101 | ) |
| |
| Net increase (decrease) in net assets | | | (86,101,568 | ) | | | (14,962,196 | ) |
| |
Net assets:
|
| Beginning of year | | | 473,399,573 | | | | 488,361,769 | |
| |
| End of year (includes undistributed net investment income of $103,625 and $1,024,635, respectively) | | $ | 387,298,005 | | | $ | 473,399,573 | |
| |
Notes to Financial Statements
December 31, 2011
NOTE 1—Significant Accounting Policies
Invesco V.I. Mid Cap Core Equity Fund (the “Fund”) is a series portfolio of AIM Variable Insurance Funds (Invesco Variable Insurance Funds) (the “Trust”). The Trust is a Delaware statutory trust registered under the Investment Company Act of 1940, as amended (the “1940 Act”), as an open-end series management investment company consisting of twenty-eight separate portfolios, (each constituting a “Fund”). The assets, liabilities and operations of each portfolio are accounted for separately. Information presented in these financial statements pertains only to the Fund. Matters affecting each Fund or class will be voted on exclusively by the shareholders of such Fund or class. Current Securities and Exchange Commission (“SEC”) guidance, however, requires participating insurance companies offering separate accounts to vote shares proportionally in accordance with the instructions of the contract owners whose investments are funded by shares of each Fund or class.
The Fund’s investment objective is long-term growth of capital.
The Fund currently offers two classes of shares, Series I and Series II, both of which are offered to insurance company separate accounts funding variable annuity contracts and variable life insurance policies (“variable products”).
The following is a summary of the significant accounting policies followed by the Fund in the preparation of its financial statements.
| | |
| A. | | Security Valuations — Securities, including restricted securities, are valued according to the following policy. |
| | A security listed or traded on an exchange (except convertible bonds) is valued at its last sales price or official closing price as of the close of the customary trading session on the exchange where the security is principally traded, or lacking any sales or official closing price on a particular day, the security may be valued at the closing bid price on that day. Securities traded in the over-the-counter market are valued based on prices furnished by independent pricing services or market makers. When such securities are valued by an independent pricing service they may be considered fair valued. Futures contracts are valued at the final settlement price set by an exchange on which they are principally traded. Listed options are valued at the mean between the last bid and ask prices from the exchange on which they are principally traded. Options not listed on an exchange are valued by an independent source at the mean between the last bid and ask prices. For purposes of determining net asset value per share, futures and option contracts generally are valued 15 minutes after the close of the customary trading session of the New York Stock Exchange (“NYSE”). |
| | Investments in open-end and closed-end registered investment companies that do not trade on an exchange are valued at the end of day net asset value per share. Investments in open-end and closed-end registered investment companies that trade on an exchange are valued at the last sales price or official closing price as of the close of the customary trading session on the exchange where the security is principally traded. |
Invesco V.I. Mid Cap Core Equity Fund
| | |
| | Debt obligations (including convertible bonds) and unlisted equities are fair valued using an evaluated quote provided by an independent pricing service. Evaluated quotes provided by the pricing service may be determined without exclusive reliance on quoted prices, and may reflect appropriate factors such as institution-size trading in similar groups of securities, developments related to specific securities, dividend rate, yield, quality, type of issue, coupon rate, maturity, individual trading characteristics and other market data. Debt securities are subject to interest rate and credit risks. In addition, all debt securities involve some risk of default with respect to interest and/or principal payments. |
| | Foreign securities (including foreign exchange contracts) are converted into U.S. dollar amounts using the applicable exchange rates as of the close of the NYSE. If market quotations are available and reliable for foreign exchange traded equity securities, the securities will be valued at the market quotations. Because trading hours for certain foreign securities end before the close of the NYSE, closing market quotations may become unreliable. If between the time trading ends on a particular security and the close of the customary trading session on the NYSE, events occur that are significant and make the closing price unreliable, the Fund may fair value the security. If the event is likely to have affected the closing price of the security, the security will be valued at fair value in good faith using procedures approved by the Board of Trustees. Adjustments to closing prices to reflect fair value may also be based on a screening process of an independent pricing service to indicate the degree of certainty, based on historical data, that the closing price in the principal market where a foreign security trade is not the current value as of the close of the NYSE. Foreign securities meeting the approved degree of certainty that the price is not reflective of current value will be priced at the indication of fair value from the independent pricing service. Multiple factors may be considered by the independent pricing service in determining adjustments to reflect fair value and may include information relating to sector indices, American Depositary Receipts and domestic and foreign index futures. Foreign securities may have additional risks including exchange rate changes, potential for sharply devalued currencies and high inflation, political and economic upheaval, the relative lack of issuer information, relatively low market liquidity and the potential lack of strict financial and accounting controls and standards. |
| | Securities for which market prices are not provided by any of the above methods may be valued based upon quotes furnished by independent sources. The last bid price may be used to value equity securities. The mean between the last bid and asked prices is used to value debt obligations, including Corporate Loans. |
| | Securities for which market quotations are not readily available or are unreliable are valued at fair value as determined in good faith by or under the supervision of the Trust’s officers following procedures approved by the Board of Trustees. Issuer specific events, market trends, bid/ask quotes of brokers and information providers and other market data may be reviewed in the course of making a good faith determination of a security’s fair value. |
| | Valuations change in response to many factors including the historical and prospective earnings of the issuer, the value of the issuer’s assets, general economic conditions, interest rates, investor perceptions and market liquidity. Because of the inherent uncertainties of valuation, the values reflected in the financial statements may materially differ from the value received upon actual sale of those investments. |
| B. | | Securities Transactions and Investment Income — Securities transactions are accounted for on a trade date basis. Realized gains or losses on sales are computed on the basis of specific identification of the securities sold. Interest income is recorded on the accrual basis from settlement date. Dividend income (net of withholding tax, if any) is recorded on the ex-dividend date. |
| | The Fund may periodically participate in litigation related to Fund investments. As such, the Fund may receive proceeds from litigation settlements. Any proceeds received are included in the Statement of Operations as realized gain (loss) for investments no longer held and as unrealized gain (loss) for investments still held. |
| | Brokerage commissions and mark ups are considered transaction costs and are recorded as an increase to the cost basis of securities purchased and/or a reduction of proceeds on a sale of securities. Such transaction costs are included in the determination of net realized and unrealized gain (loss) from investment securities reported in the Statement of Operations and the Statement of Changes in Net Assets and the net realized and unrealized gains (losses) on securities per share in the Financial Highlights. Transaction costs are included in the calculation of the Fund’s net asset value and, accordingly, they reduce the Fund’s total returns. These transaction costs are not considered operating expenses and are not reflected in net investment income reported in the Statement of Operations and Statement of Changes in Net Assets, or the net investment income per share and ratios of expenses and net investment income reported in the Financial Highlights, nor are they limited by any expense limitation arrangements between the Fund and the investment adviser. |
| | The Fund allocates income and realized and unrealized capital gains and losses to a class based on the relative net assets of each class. |
| C. | | Country Determination — For the purposes of making investment selection decisions and presentation in the Schedule of Investments, the investment adviser may determine the country in which an issuer is located and/or credit risk exposure based on various factors. These factors include the laws of the country under which the issuer is organized, where the issuer maintains a principal office, the country in which the issuer derives 50% or more of its total revenues and the country that has the primary market for the issuer’s securities, as well as other criteria. Among the other criteria that may be evaluated for making this determination are the country in which the issuer maintains 50% or more of its assets, the type of security, financial guarantees and enhancements, the nature of the collateral and the sponsor organization. Country of issuer and/or credit risk exposure has been determined to be the United States of America, unless otherwise noted. |
| D. | | Distributions — Distributions from income and net realized capital gain, if any, are generally paid to separate accounts of participating insurance companies annually and recorded on ex-dividend date. |
| E. | | Federal Income Taxes — The Fund intends to comply with the requirements of Subchapter M of the Internal Revenue Code necessary to qualify as a regulated investment company and to distribute substantially all of the Fund’s taxable earnings to shareholders. As such, the Fund will not be subject to federal income taxes on otherwise taxable income (including net realized capital gain) that is distributed to shareholders. Therefore, no provision for federal income taxes is recorded in the financial statements. |
| | The Fund files tax returns in the U.S. Federal jurisdiction and certain other jurisdictions. Generally, the Fund is subject to examinations by such taxing authorities for up to three years after the filing of the return for the tax period. |
| F. | | Expenses — Fees provided for under the Rule 12b-1 plan of a particular class of the Fund and which are directly attributable to that class are charged to the operations of such class. All other expenses are allocated among the classes based on relative net assets. |
Invesco V.I. Mid Cap Core Equity Fund
| | |
| G. | | Accounting Estimates — The preparation of financial statements in conformity with accounting principles generally accepted in the United States of America (“GAAP”) requires management to make estimates and assumptions that affect the reported amounts of assets and liabilities at the date of the financial statements and the reported amounts of revenues and expenses during the reporting period including estimates and assumptions related to taxation. Actual results could differ from those estimates by a significant amount. In addition, the Fund monitors for material events or transactions that may occur or become known after the period-end date and before the date the financial statements are released to print. |
| H. | | Indemnifications — Under the Trust’s organizational documents, each Trustee, officer, employee or other agent of the Trust is indemnified against certain liabilities that may arise out of performance of their duties to the Fund. Additionally, in the normal course of business, the Fund enters into contracts, including the Fund’s servicing agreements that contain a variety of indemnification clauses. The Fund’s maximum exposure under these arrangements is unknown as this would involve future claims that may be made against the Fund that have not yet occurred. The risk of material loss as a result of such indemnification claims is considered remote. |
| I. | | Securities Lending — The Fund may lend portfolio securities having a market value up to one-third of the Fund’s total assets. Such loans are secured by collateral equal to no less than the market value of the loaned securities determined daily by the securities lending provider. Such collateral will be cash or debt securities issued or guaranteed by the U.S. Government or any of its sponsored agencies. Cash collateral received in connection with these loans is invested in short-term money market instruments or affiliated money market funds and is shown as such on the Schedule of Investments. It is the Fund’s policy to obtain additional collateral from or return excess collateral to the borrower by the end of the next business day, following the valuation date of the securities loaned. Therefore, the value of the collateral held may be temporarily less than the value of the securities on loan. Lending securities entails a risk of loss to the Fund if and to the extent that the market value of the securities loaned were to increase and the borrower did not increase the collateral accordingly, and the borrower fails to return the securities. Upon the failure of the borrower to return the securities, collateral may be liquidated and the securities may be purchased on the open market to replace the loaned securities. The Fund could experience delays and costs in gaining access to the collateral. The Fund bears the risk of any deficiency in the amount of the collateral available for return to the borrower due to any loss on the collateral invested. Dividends received on cash collateral investments for securities lending transactions, which are net of compensation to counterparties, is included in Dividends from affiliated money market funds on the Statement of Operations. The aggregate value of securities out on loan is shown as a footnote on the Statement of Assets and Liabilities, if any. |
| J. | | Foreign Currency Translations — Foreign currency is valued at the close of the NYSE based on quotations posted by banks and major currency dealers. Portfolio securities and other assets and liabilities denominated in foreign currencies are translated into U.S. dollar amounts at date of valuation. Purchases and sales of portfolio securities (net of foreign taxes withheld on disposition) and income items denominated in foreign currencies are translated into U.S. dollar amounts on the respective dates of such transactions. The Fund does not separately account for the portion of the results of operations resulting from changes in foreign exchange rates on investments and the fluctuations arising from changes in market prices of securities held. The combined results of changes in foreign exchange rates and the fluctuation of market prices on investments (net of estimated foreign tax withholding) are included with the net realized and unrealized gain or loss from investments in the Statement of Operations. Reported net realized foreign currency gains or losses arise from (1) sales of foreign currencies, (2) currency gains or losses realized between the trade and settlement dates on securities transactions, and (3) the difference between the amounts of dividends, interest, and foreign withholding taxes recorded on the Fund’s books and the U.S. dollar equivalent of the amounts actually received or paid. Net unrealized foreign currency gains and losses arise from changes in the fair values of assets and liabilities, other than investments in securities at fiscal period end, resulting from changes in exchange rates. |
| | The Fund may invest in foreign securities which may be subject to foreign taxes on income, gains on investments or currency repatriation, a portion of which may be recoverable. |
| K. | | Foreign Currency Contracts — The Fund may enter into foreign currency contracts to manage or minimize currency or exchange rate risk. The Fund may also enter into foreign currency contracts for the purchase or sale of a security denominated in a foreign currency in order to “lock in” the U.S. dollar price of that security. A foreign currency contract is an obligation to purchase or sell a specific currency for an agreed-upon price at a future date. The use of foreign currency contracts does not eliminate fluctuations in the price of the underlying securities the Fund owns or intends to acquire but establishes a rate of exchange in advance. Fluctuations in the value of these contracts are measured by the difference in the contract date and reporting date exchange rates and are recorded as unrealized appreciation (depreciation) until the contracts are closed. When the contracts are closed, realized gains (losses) are recorded. Realized and unrealized gains (losses) on the contracts are included in the Statement of Operations. The primary risks associated with foreign currency contracts include failure of the counterparty to meet the terms of the contract and the value of the foreign currency changing unfavorably. These risks may be in excess of the amounts reflected in the Statement of Assets and Liabilities. |
| L. | | Call Options Written — The Fund may write call options. A call option gives the purchaser of such option the right to buy, and the writer (the Fund) the obligation to sell, the underlying security at the stated exercise price during the option period. Written call options are recorded as a liability in the Statement of Assets and Liabilities. The amount of the liability is subsequently valued to reflect the current market value of the option written. If a written call option expires on the stipulated expiration date, or if the Fund enters into a closing purchase transaction, the Fund realizes a gain (or a loss if the closing purchase transaction exceeds the premium received when the option was written) without regard to any unrealized gain or loss on the underlying security, and the liability related to such option is extinguished. If a written option is exercised, the Fund realizes a gain or a loss from the sale of the underlying security and the proceeds of the sale are increased by the premium originally received. Realized gains and losses on these contracts are included in the Statement of Operations. A risk in writing a covered call option is that the Fund gives up the opportunity for profit if the market price of the security increases and the option is exercised. |
| M. | | Put Options Purchased — The Fund may purchase put options including options on securities indexes and/or futures contracts. By purchasing a put option, the Fund obtains the right (but not the obligation) to sell the option’s underlying instrument at a fixed strike price. In return for this right, the Fund pays an option premium. The option’s underlying instrument may be a security, securities index, or a futures contract. Put options may be used by the Fund to hedge securities it owns by locking in a minimum price at which the Fund can sell. If security prices fall, the put option could be exercised to offset all or a portion of the Fund’s resulting losses. At the same time, because the maximum the Fund has at risk is the cost of the option, |
Invesco V.I. Mid Cap Core Equity Fund
| | |
| | purchasing put options does not eliminate the potential for the Fund to profit from an increase in the value of the securities hedged. Realized and unrealized gains and losses on these contracts are included in the Statement of Operations. A risk in buying an option is that the Fund pays a premium whether or not the option is exercised. In addition, there can be no assurance that a liquid secondary market will exist for any option purchased. |
NOTE 2—Advisory Fees and Other Fees Paid to Affiliates
The Trust has entered into a master investment advisory agreement with Invesco Advisers, Inc. (the “Adviser” or “Invesco”). Under the terms of the investment advisory agreement, the Fund pays an advisory fee to the Adviser based on the annual rate of the Fund’s average daily net assets as follows:
| | | | | |
| Average Net Assets | | Rate |
| |
| First $500 million | | | 0 | .725% |
| |
| Next $500 million | | | 0 | .70% |
| |
| Next $500 million | | | 0 | .675% |
| |
| Over $1.5 billion | | | 0 | .65% |
| |
Under the terms of a master sub-advisory agreement between the Adviser and each of Invesco Asset Management Deutschland GmbH, Invesco Asset Management Limited, Invesco Asset Management (Japan) Limited, Invesco Australia Limited, Invesco Hong Kong Limited, Invesco Senior Secured Management, Inc. and Invesco Canada Ltd. (collectively, the “Affiliated Sub-Advisers”) the Adviser, not the Fund, may pay 40% of the fees paid to the Adviser to any such Affiliated Sub-Adviser(s) that provide discretionary investment management services to the Fund based on the percentage of assets allocated to such Sub-Adviser(s).
The Adviser has contractually agreed, through at least April 30, 2013, to waive advisory fees and/or reimburse expenses to the extent necessary to limit total annual operating expenses after fee waiver and/or expense reimbursement (excluding certain items discussed below) of Series I shares to 1.30% and Series II shares to 1.45% of average daily net assets. In determining the Adviser’s obligation to waive advisory fees and/or reimburse expenses, the following expenses are not taken into account, and could cause the total annual fund operating expenses after fee waiver and/or expense reimbursement to exceed the numbers reflected above: (1) interest; (2) taxes; (3) dividend expense on short sales; (4) extraordinary or non-routine items, including litigation expenses; and (5) expenses that the Fund has incurred but did not actually pay because of an expense offset arrangement. Unless the Board of the Trustees and Invesco mutually agree to amend or continue the fee waiver agreement, it will terminate on April 30, 2013. The Adviser did not waive fees and/or reimburse expenses during the period under this expense limitation.
Further, the Adviser has contractually agreed, through at least June 30, 2012, to waive the advisory fee payable by the Fund in an amount equal to 100% of the net advisory fees the Adviser receives from the affiliated money market funds on investments by the Fund of uninvested cash (excluding investments of cash collateral from securities lending) in such affiliated money market funds.
For the year ended December 31, 2011, the Adviser waived advisory fees of $96,968.
The Trust has entered into a master administrative services agreement with Invesco pursuant to which the Fund has agreed to pay Invesco a fee for costs incurred in providing accounting services and fund administrative services to the Fund and to reimburse Invesco for administrative services fees paid to insurance companies that have agreed to provide services to the participants of separate accounts. These administrative services provided by the insurance companies may include, among other things: the printing of prospectuses, financial reports and proxy statements and the delivery of the same to existing participants; the maintenance of master accounts; the facilitation of purchases and redemptions requested by the participants; and the servicing of participants’ accounts. Pursuant to such agreement, for the year ended December 31, 2011, Invesco was paid $111,601 for accounting and fund administrative services and reimbursed $1,112,972 for services provided by insurance companies.
The Trust has entered into a transfer agency and service agreement with Invesco Investment Services, Inc. (“IIS”) pursuant to which the Fund has agreed to pay IIS a fee for providing transfer agency and shareholder services to the Fund and reimburse IIS for certain expenses incurred by IIS in the course of providing such services. For the year ended December 31, 2011, expenses incurred under the agreement are shown in the Statement of Operations as transfer agent fees.
The Trust has entered into a master distribution agreement with Invesco Distributors, Inc. (“IDI”) to serve as the distributor for the Fund. The Trust has adopted a plan pursuant to Rule 12b-1 under the 1940 Act with respect to the Fund’s Series II shares (the “Plan”). The Fund, pursuant to the Plan, pays IDI compensation at the annual rate of 0.25% of the Fund’s average daily net assets of Series II shares. Of the Plan payments, up to 0.25% of the average daily net assets of the Series II shares may be paid to insurance companies who furnish continuing personal shareholder services to customers who purchase and own Series II shares of the Fund. For the year ended December 31, 2011, expenses incurred under the Plan are detailed in the Statement of Operations as distribution fees.
Certain officers and trustees of the Trust are officers and directors of the Adviser, Invesco Ltd., IIS and/or IDI.
NOTE 3—Additional Valuation Information
GAAP defines fair value as the price that would be received to sell an asset or paid to transfer a liability in an orderly transaction between market participants at the measurement date, under current market conditions. GAAP establishes a hierarchy that prioritizes the inputs to valuation methods giving the highest priority to readily available unadjusted quoted prices in an active market for identical assets (Level 1) and the lowest priority to significant unobservable inputs (Level 3) generally when market prices are not readily available or are unreliable. Based on the valuation inputs, the securities or other investments are tiered into one of three levels. Changes in valuation methods may result in transfers in or out of an investment’s assigned level:
| | |
| | Level 1 — | Prices are determined using quoted prices in an active market for identical assets. |
Invesco V.I. Mid Cap Core Equity Fund
| | |
| | Level 2 — | Prices are determined using other significant observable inputs. Observable inputs are inputs that other market participants may use in pricing a security. These may include quoted prices for similar securities, interest rates, prepayment speeds, credit risk, yield curves, loss severities, default rates, discount rates, volatilities and others. |
| | Level 3 — | Prices are determined using significant unobservable inputs. In situations where quoted prices or observable inputs are unavailable (for example, when there is little or no market activity for an investment at the end of the period), unobservable inputs may be used. Unobservable inputs reflect the Fund’s own assumptions about the factors market participants would use in determining fair value of the securities or instruments and would be based on the best available information. |
The following is a summary of the tiered valuation input levels, as of December 31, 2011. The level assigned to the securities valuations may not be an indication of the risk or liquidity associated with investing in those securities. Because of the inherent uncertainties of valuation, the values reflected in the financial statements may materially differ from the value received upon actual sale of those investments.
During the year ended December 31, 2011, there were no significant transfers between investment levels.
| | | | | | | | | | | | | | | | | |
| | | Level 1 | | Level 2 | | Level 3 | | Total |
| |
| Equity Securities | | $ | 392,141,557 | | | $ | — | | | $ | — | | | $ | 392,141,557 | |
| |
NOTE 4—Derivative Investments
Effect of Derivative Instruments for the year ended December 31, 2011
The table below summarizes the gains on derivative instruments, detailed by primary risk exposure, recognized in earnings during the period:
| | | | | |
| | | Location of Gain on
|
| | | Statement of Operations |
| | | Options |
| |
| Realized Gain | | | | |
| Equity risk | | $ | 21,601 | |
| |
| | | | | | | | | |
| Transactions During the Period |
| | | Call Option Contracts |
| | | Number of
| | Premiums
|
| | | Contracts | | Received |
| |
| Beginning of period | | | — | | | $ | — | |
| |
| Written | | | 786 | | | | 21,601 | |
| |
| Expired | | | (786 | ) | | | (21,601 | ) |
| |
| End of period | | | 0 | | | $ | 0 | |
| |
NOTE 5—Security Transactions with Affiliated Funds
The Fund is permitted to purchase or sell securities from or to certain other Invesco Funds under specified conditions outlined in procedures adopted by the Board of Trustees of the Trust. The procedures have been designed to ensure that any purchase or sale of securities by the Fund from or to another fund or portfolio that is or could be considered an affiliate by virtue of having a common investment adviser (or affiliated investment advisers), common Trustees and/or common officers complies with Rule 17a-7 of the 1940 Act. Further, as defined under the procedures, each transaction is effected at the current market price. Pursuant to these procedures, for the year ended December 31, 2011, the Fund engaged in securities purchases of $3,129,311 and securities sales of $508,551, which resulted in net realized gains of $114,930.
NOTE 6—Trustees’ and Officers’ Fees and Benefits
“Trustees’ and Officers’ Fees and Benefits” include amounts accrued by the Fund to pay remuneration to certain Trustees and Officers of the Fund. Trustees have the option to defer compensation payable by the Fund, and “Trustees’ and Officers’ Fees and Benefits” also include amounts accrued by the Fund to fund such deferred compensation amounts. Those Trustees who defer compensation have the option to select various Invesco Funds in which their deferral accounts shall be deemed to be invested. Finally, certain current Trustees are eligible to participate in a retirement plan that provides for benefits to be paid upon retirement to Trustees over a period of time based on the number of years of service. The Fund may have certain former Trustees who also participate in a retirement plan and receive benefits under such plan. “Trustees’ and Officers’ Fees and Benefits” include amounts accrued by the Fund to fund such retirement benefits. Obligations under the deferred compensation and retirement plans represent unsecured claims against the general assets of the Fund.
During the year ended December 31, 2011, the Fund paid legal fees of $1,707 for services rendered by Kramer, Levin, Naftalis & Frankel LLP as counsel to the Independent Trustees. A partner of that firm is a Trustee of the Trust.
NOTE 7—Cash Balances
The Fund is permitted to temporarily carry a negative or overdrawn balance in its account with The State Street Bank and Trust Company, the custodian bank. To compensate the custodian bank for such overdrafts, the overdrawn Fund may either (1) leave funds as a compensating balance in the account so the
Invesco V.I. Mid Cap Core Equity Fund
custodian bank can be compensated by earning the additional interest; or (2) compensate by paying the custodian bank at a rate agreed upon by the custodian bank and Invesco, not to exceed the contractually agreed upon rate.
NOTE 8—Distributions to Shareholders and Tax Components of Net Assets
Tax Character of Distributions to Shareholders Paid During the Years Ended December 31, 2011 and 2010:
| | | | | | | | | |
| | | 2011 | | 2010 |
| |
| Ordinary income | | $ | 1,107,177 | | | $ | 2,460,214 | |
| |
Tax Components of Net Assets at Period-End:
| | | | | |
| | | 2011 |
| |
| Undistributed ordinary income | | $ | 190,969 | |
| |
| Undistributed long-term gain | | | 3,215,961 | |
| |
| Net unrealized appreciation — investments | | | 28,665,015 | |
| |
| Net unrealized appreciation (depreciation) — other investments | | | (189 | ) |
| |
| Temporary book/tax differences | | | (87,344 | ) |
| |
| Shares of beneficial interest | | | 355,313,593 | |
| |
| Total net assets | | $ | 387,298,005 | |
| |
The difference between book-basis and tax-basis unrealized appreciation (depreciation) is due to differences in the timing of recognition of gains and losses on investments for tax and book purposes. The Fund’s net unrealized appreciation (depreciation) difference is attributable primarily to wash sales.
The temporary book/tax differences are a result of timing differences between book and tax recognition of income and/or expenses. The Fund’s temporary book/tax differences are the result of the trustee deferral of compensation and retirement plan benefits.
Capital loss carryforward is calculated and reported as of a specific date. Results of transactions and other activity after that date may affect the amount of capital loss carryforward actually available for the Fund to utilize. The Regulated Investment Company Modernization Act of 2010 (the “Act”) eliminated the eight-year carryover period for capital losses that arise in taxable years beginning after its enactment date of December 22, 2010. Consequently, these capital losses can be carried forward for an unlimited period. However, capital losses with an expiration period may not be used to offset capital gains until all net capital losses without an expiration date have been utilized. Additionally, post-enactment capital loss carryovers will retain their character as either short-term or long-term capital losses instead of as short-term capital losses as under prior law. The ability to utilize capital loss carryforward in the future may be limited under the Internal Revenue Code and related regulations based on the results of future transactions.
The Fund utilized $30,475,922 of capital loss carryforward in the current period to offset net realized capital gain for federal income tax purposes. The Fund does not have a capital loss carryforward at period-end.
NOTE 9—Investment Securities
The aggregate amount of investment securities (other than short-term securities, U.S. Treasury obligations and money market funds, if any) purchased and sold by the Fund during the year ended December 31, 2011 was $218,368,941 and $298,216,720, respectively. Cost of investments on a tax basis includes the adjustments for financial reporting purposes as of the most recently completed Federal income tax reporting period-end.
| | | | | |
| Unrealized Appreciation (Depreciation) of Investment Securities on a Tax Basis |
| |
| Aggregate unrealized appreciation of investment securities | | $ | 45,524,815 | |
| |
| Aggregate unrealized (depreciation) of investment securities | | | (16,859,800 | ) |
| |
| Net unrealized appreciation of investment securities | | $ | 28,665,015 | |
| |
| Cost of investments for tax purposes is $363,476,542. |
NOTE 10—Reclassification of Permanent Differences
Primarily as a result of differing book/tax treatment of foreign currency transactions on December 31, 2011, undistributed net investment income was decreased by $7,232 and undistributed net realized gain was increased by $7,232. This reclassification had no effect on the net assets of the Fund.
Invesco V.I. Mid Cap Core Equity Fund
NOTE 11—Share Information
| | | | | | | | | | | | | | | | | |
| | | Summary of Share Activity |
| |
| | | Year ended December 31, |
| | | 2011(a) | | 2010 |
| | | Shares | | Amount | | Shares | | Amount |
| |
| Sold: | | | | | | | | | | | | | | | | |
| Series I | | | 2,474,245 | | | $ | 30,771,619 | | | | 1,854,251 | | | $ | 21,138,305 | |
| |
| Series II | | | 3,309,461 | | | | 40,140,590 | | | | 2,043,008 | | | | 22,984,219 | |
| |
| Issued as reinvestment of dividends: | | | | | | | | | | | | | | | | |
| Series I | | | 98,178 | | | | 1,052,469 | | | | 201,607 | | | | 2,274,130 | |
| |
| Series II | | | 5,142 | | | | 54,708 | | | | 16,630 | | | | 186,084 | |
| |
| Reacquired: | | | | | | | | | | | | | | | | |
| Series I | | | (7,967,805 | ) | | | (98,361,950 | ) | | | (8,395,150 | ) | | | (94,978,338 | ) |
| |
| Series II | | | (2,643,335 | ) | | | (31,907,884 | ) | | | (2,228,501 | ) | | | (24,876,501 | ) |
| |
| Net increase (decrease) in share activity | | | (4,724,114 | ) | | $ | (58,250,448 | ) | | | (6,508,155 | ) | | $ | (73,272,101 | ) |
| |
| | |
| (a) | | There are entities that are record owners of more than 5% of the outstanding shares of the Fund and in the aggregate own 73% of the outstanding shares of the Fund. The Fund and the Fund’s principal underwriter or adviser, are parties to participation agreements with these entities whereby these entities sell units of interest in separate accounts funding variable products that are invested in the Fund. The Fund, Invesco and/or Invesco affiliates may make payments to these entities, which are considered to be related to the Fund, for providing services to the Fund, Invesco and/or Invesco affiliates including but not limited to services such as, securities brokerage, third party record keeping and account servicing and administrative services. The Fund has no knowledge as to whether all or any portion of the shares owned of record by these entities are also owned beneficially. |
NOTE 12—Financial Highlights
The following schedule presents financial highlights for a share of the Fund outstanding throughout the periods indicated.
| | | | | | | | | | | | | | | | | | | | | | | | | | | | | | | | | | | | | | | | | | | | | | | | | | | | | | | | | |
| | | | | | | | | | | | | | | | | | | | | | | Ratio of
| | Ratio of
| | | | |
| | | | | | | Net gains
| | | | | | | | | | | | | | | | expenses
| | expenses
| | | | |
| | | | | | | (losses) on
| | | | | | | | | | | | | | | | to average
| | to average net
| | Ratio of net
| | |
| | | Net asset
| | Net
| | securities
| | | | Dividends
| | Distributions
| | | | | | | | | | net assets
| | assets without
| | investment
| | |
| | | value,
| | investment
| | (both
| | Total from
| | from net
| | from net
| | | | Net asset
| | | | Net assets,
| | with fee waivers
| | fee waivers
| | income (loss)
| | |
| | | beginning
| | income
| | realized and
| | investment
| | investment
| | realized
| | Total
| | value, end
| | Total
| | end of period
| | and/or expenses
| | and/or expenses
| | to average
| | Portfolio
|
| | | of period | | (loss) | | unrealized) | | operations | | income | | gains | | Distributions | | of period | | Return(a) | | (000s omitted) | | absorbed | | absorbed | | net assets | | turnover(b) |
| |
| Series I |
| Year ended 12/31/11 | | $ | 12.39 | | | $ | 0.01 | (c) | | $ | (0.80 | ) | | $ | (0.79 | ) | | $ | (0.04 | ) | | $ | — | | | $ | (0.04 | ) | | $ | 11.56 | | | | (6.38 | )% | | $ | 322,102 | | | | 1.01 | %(d) | | | 1.03 | %(d) | | | 0.08 | %(d) | | | 57 | % |
| Year ended 12/31/10 | | | 10.92 | | | | 0.03 | (c) | | | 1.50 | | | | 1.53 | | | | (0.06 | ) | | | — | | | | (0.06 | ) | | | 12.39 | | | | 14.11 | | | | 411,812 | | | | 1.01 | | | | 1.03 | | | | 0.27 | | | | 61 | |
| Year ended 12/31/09 | | | 8.59 | | | | 0.06 | (c) | | | 2.53 | | | | 2.59 | | | | (0.13 | ) | | | (0.13 | ) | | | (0.26 | ) | | | 10.92 | | | | 30.21 | | | | 432,233 | | | | 1.02 | | | | 1.04 | | | | 0.60 | | | | 41 | |
| Year ended 12/31/08 | | | 14.57 | | | | 0.14 | (c) | | | (4.33 | ) | | | (4.19 | ) | | | (0.22 | ) | | | (1.57 | ) | | | (1.79 | ) | | | 8.59 | | | | (28.52 | ) | | | 352,788 | | | | 1.01 | | | | 1.04 | | | | 1.05 | | | | 62 | |
| Year ended 12/31/07 | | | 13.52 | | | | 0.19 | | | | 1.11 | | | | 1.30 | | | | (0.04 | ) | | | (0.21 | ) | | | (0.25 | ) | | | 14.57 | | | | 9.55 | | | | 585,608 | | | | 1.00 | | | | 1.01 | | | | 1.23 | | | | 62 | |
| |
| Series II |
| Year ended 12/31/11 | | | 12.28 | | | | (0.02 | )(c) | | | (0.78 | ) | | | (0.80 | ) | | | (0.01 | ) | | | — | | | | (0.01 | ) | | | 11.47 | | | | (6.50 | ) | | | 65,196 | | | | 1.26 | (d) | | | 1.28 | (d) | | | (0.17 | )(d) | | | 57 | |
| Year ended 12/31/10 | | | 10.83 | | | | 0.00 | (c) | | | 1.49 | | | | 1.49 | | | | (0.04 | ) | | | — | | | | (0.04 | ) | | | 12.28 | | | | 13.78 | | | | 61,587 | | | | 1.26 | | | | 1.28 | | | | 0.02 | | | | 61 | |
| Year ended 12/31/09 | | | 8.52 | | | | 0.03 | (c) | | | 2.51 | | | | 2.54 | | | | (0.10 | ) | | | (0.13 | ) | | | (0.23 | ) | | | 10.83 | | | | 29.85 | | | | 56,129 | | | | 1.27 | | | | 1.29 | | | | 0.35 | | | | 41 | |
| Year ended 12/31/08 | | | 14.45 | | | | 0.10 | (c) | | | (4.28 | ) | | | (4.18 | ) | | | (0.18 | ) | | | (1.57 | ) | | | (1.75 | ) | | | 8.52 | | | | (28.68 | ) | | | 48,489 | | | | 1.26 | | | | 1.29 | | | | 0.80 | | | | 62 | |
| Year ended 12/31/07 | | | 13.42 | | | | 0.13 | | | | 1.12 | | | | 1.25 | | | | (0.01 | ) | | | (0.21 | ) | | | (0.22 | ) | | | 14.45 | | | | 9.29 | | | | 79,079 | | | | 1.25 | | | | 1.26 | | | | 0.98 | | | | 62 | |
| |
| | |
| (a) | | Includes adjustments in accordance with accounting principles generally accepted in the United States of America and as such, the net asset value for financial reporting purposes and the returns based upon those net asset values may differ from the net asset value and returns for shareholder transactions. Total returns do not reflect charges assessed in connection with a variable product, which if included would reduce total returns. |
| (b) | | Portfolio turnover is calculated at the fund level and is not annualized for periods less than one year, if applicable. |
| (c) | | Calculated using average shares outstanding. |
| (d) | | Ratios are annualized and based on average daily net assets (000’s omitted) of $377,414 and $64,332 for Series I and Series II shares, respectively. |
Invesco V.I. Mid Cap Core Equity Fund
Report of Independent Registered Public Accounting Firm
To the Board of Trustees of AIM Variable Insurance Funds (Invesco Variable Insurance Funds)
and Shareholders of Invesco V.I. Mid Cap Core Equity Fund:
In our opinion, the accompanying statement of assets and liabilities, including the schedule of investments, and the related statements of operations and of changes in net assets and the financial highlights present fairly, in all material respects, the financial position of Invesco V.I. Mid Cap Core Equity Fund (one of the funds constituting AIM Variable Insurance Funds (Invesco Variable Insurance Funds), hereafter referred to as the “Fund”) at December 31, 2011, the results of its operations for the year then ended, the changes in its net assets for each of the two years in the period then ended and the financial highlights for each of the five years in the period then ended, in conformity with accounting principles generally accepted in the United States of America. These financial statements and financial highlights (hereafter referred to as “financial statements”) are the responsibility of the Fund’s management; our responsibility is to express an opinion on these financial statements based on our audits. We conducted our audits of these financial statements in accordance with the standards of the Public Company Accounting Oversight Board (United States). Those standards require that we plan and perform the audits to obtain reasonable assurance about whether the financial statements are free of material misstatement. An audit includes examining, on a test basis, evidence supporting the amounts and disclosures in the financial statements, assessing the accounting principles used and significant estimates made by management, and evaluating the overall financial statement presentation. We believe that our audits, which included confirmation of securities at December 31, 2011 by correspondence with the custodian and brokers, provide a reasonable basis for our opinion.
PRICEWATERHOUSECOOPERS LLP
February 14, 2012
Houston, Texas
Invesco V.I. Mid Cap Core Equity Fund
Calculating your ongoing Fund expenses
Example
As a shareholder of the Fund, you incur ongoing costs, including management fees; distribution and/or service fees (12b-1); and other Fund expenses. This example is intended to help you understand your ongoing costs (in dollars) of investing in the Fund and to compare these costs with ongoing costs of investing in other mutual funds. The example is based on an investment of $1,000 invested at the beginning of the period and held for the entire period July 1, 2011 through December 31, 2011.
The actual and hypothetical expenses in the examples below do not represent the effect of any fees or other expenses assessed in connection with a variable product; if they did, the expenses shown would be higher while the ending account values shown would be lower.
Actual expenses
The table below provides information about actual account values and actual expenses. You may use the information in this table, together with the amount you invested, to estimate the expenses that you paid over the period. Simply divide your account value by $1,000 (for example, an $8,600 account value divided by $1,000 = 8.6), then multiply the result by the number in the table under the heading entitled “Actual Expenses Paid During Period” to estimate the expenses you paid on your account during this period.
Hypothetical example for comparison purposes
The table below also provides information about hypothetical account values and hypothetical expenses based on the Fund’s actual expense ratio and an assumed rate of return of 5% per year before expenses, which is not the Fund’s actual return.
The hypothetical account values and expenses may not be used to estimate the actual ending account balance or expenses you paid for the period. You may use this information to compare the ongoing costs of investing in the Fund and other funds. To do so, compare this 5% hypothetical example with the 5% hypothetical examples that appear in the shareholder reports of the other funds.
Please note that the expenses shown in the table are meant to highlight your ongoing costs. Therefore, the hypothetical information is useful in comparing ongoing costs, and will not help you determine the relative total costs of owning different funds.
| | | | | | | | | | | | | | | | | | | | | | | | | | | | | | | |
| | | | | | | | | | | | | HYPOTHETICAL
| | | |
| | | | | | | ACTUAL | | | (5% annual return before expenses) | | | |
| | | | Beginning
| | | Ending
| | | Expenses
| | | Ending
| | | Expenses
| | | Annualized
|
| | | | Account Value
| | | Account Value
| | | Paid During
| | | Account Value
| | | Paid During
| | | Expense
|
| Class | | | (07/01/11) | | | (12/31/11)1 | | | Period2 | | | (12/31/11) | | | Period2 | | | Ratio |
| Series I | | | $ | 1,000.00 | | | | $ | 880.10 | | | | $ | 4.83 | | | | $ | 1,020.06 | | | | $ | 5.19 | | | | | 1.02 | % |
| | | | | | | | | | | | | | | | | | | | | | | | | | | | | | | |
| Series II | | | | 1,000.00 | | | | | 879.10 | | | | | 6.02 | | | | | 1,018.80 | | | | | 6.46 | | | | | 1.27 | |
| | | | | | | | | | | | | | | | | | | | | | | | | | | | | | | |
| |
| 1 | The actual ending account value is based on the actual total return of the Fund for the period July 1, 2011 through December 31, 2011, after actual expenses and will differ from the hypothetical ending account value which is based on the Fund’s expense ratio and a hypothetical annual return of 5% before expenses. |
| 2 | Expenses are equal to the Fund’s annualized expense ratio as indicated above multiplied by the average account value over the period, multiplied by 184/365 to reflect the most recent fiscal half year. |
Invesco V.I. Mid Cap Core Equity Fund
Form 1099-DIV, Form 1042-S and other year-end tax information provide shareholders with actual calendar year amounts that should be included in their tax returns. Shareholders should consult their tax advisors.
The following distribution information is being provided as required by the Internal Revenue Code or to meet a specific state’s requirement.
The Fund designates the following amounts or, if subsequently determined to be different, the maximum amount allowable for its fiscal year ended December 31, 2011:
| | | | | |
Federal and State Income Tax | | |
| |
| Corporate Dividends Received Deduction* | | | 100% | |
| | |
| | * | The above percentages are based on ordinary income dividends paid to shareholders during the Fund’s fiscal year. |
Invesco V.I. Mid Cap Core Equity Fund
The address of each trustee and officer is AIM Variable Insurance Funds (Invesco Variable Insurance Funds) (the “Trust”), 11 Greenway Plaza, Suite 2500, Houston, Texas 77046-1173. The trustees serve for the life of the Trust, subject to their earlier death, incapacitation, resignation, retirement or removal as more specifically provided in the Trust’s organizational documents. Each officer serves for a one year term or until their successors are elected and qualified. Column two below includes length of time served with predecessor entities, if any.
| | | | | | | | | |
| | | | | | | Number of Funds
| | |
Name, Year of Birth and
| | Trustee and/
| | Principal Occupation(s)
| | in Fund Complex
| | Other Directorship(s)
|
| Position(s) Held with the Trust | | or Officer Since | | During Past 5 Years | | Overseen by Trustee | | Held by Trustee |
| | | | | | | | | |
| | | | | | | | | |
| | | | | | | | | |
| Interested Persons | | | | | | | | |
| | | | | | | | | |
| | | | | | | | | |
| | | | | | | | | |
Martin L. Flanagan1 — 1960
Trustee | | 2007 | | Executive Director, Chief Executive Officer and President, Invesco Ltd. (ultimate parent of Invesco and a global investment management firm); Advisor to the Board, Invesco Advisers, Inc. (formerly known as Invesco Institutional (N.A.), Inc.); Trustee, The Invesco Funds; Vice Chair, Investment Company Institute; and Member of Executive Board, SMU Cox School of Business
Formerly: Chairman, Invesco Advisers, Inc. (registered investment adviser); Director, Chairman, Chief Executive Officer and President, IVZ Inc. (holding company), INVESCO Group Services, Inc. (service provider) and Invesco North American Holdings, Inc. (holding company); Director, Chief Executive Officer and President, Invesco Holding Company Limited (parent of Invesco and a global investment management firm); Director, Invesco Ltd.; Chairman, Investment Company Institute and President, Co-Chief Executive Officer, Co-President, Chief Operating Officer and Chief Financial Officer, Franklin Resources, Inc. (global investment management organization) | | 140 | | None |
| | | | | | | | | |
| | | | | | | | | |
| | | | | | | | | |
Philip A. Taylor2 — 1954
Trustee, President and Principal Executive Officer | | 2006 | | Head of North American Retail and Senior Managing Director, Invesco Ltd.; Director, Co-Chairman, Co-President and Co-Chief Executive Officer, Invesco Advisers, Inc. (formerly known as Invesco Institutional (N.A.), Inc.) (registered investment adviser); Director, Chairman, Chief Executive Officer and President, Invesco Management Group, Inc. (formerly Invesco Aim Management Group, Inc.) (financial services holding company); Director and President, INVESCO Funds Group, Inc. (registered investment adviser and registered transfer agent); Director and Chairman, Invesco Investment Services, Inc. (formerly known as Invesco Aim Investment Services, Inc.) (registered transfer agent) and IVZ Distributors, Inc. (formerly known as INVESCO Distributors, Inc.) (registered broker dealer); Director, President and Chairman, Invesco Inc. (holding company) and Invesco Canada Holdings Inc. (holding company); Chief Executive Officer, Invesco Corporate Class Inc. (corporate mutual fund company) and Invesco Canada Fund Inc. (corporate mutual fund company); Director, Chairman and Chief Executive Officer, Invesco Canada Ltd. (formerly known as Invesco Trimark Ltd./Invesco Trimark Ltèe) (registered investment adviser and registered transfer agent); Trustee, President and Principal Executive Officer, The Invesco Funds (other than AIM Treasurer’s Series Trust (Invesco Treasurer’s Series Trust) and Short-Term Investments Trust); Trustee and Executive Vice President, The Invesco Funds (AIM Treasurer’s Series Trust (Invesco Treasurer’s Series Trust) and Short-Term Investments Trust only); Director, Invesco Investment Advisers LLC (formerly known as Van Kampen Asset Management); Director, Chief Executive Officer and President, Van Kampen Exchange Corp. | | 140 | | None |
| | | | | | | | | |
| | | | | | | | | |
| | | | | Formerly: Director and Chairman, Van Kampen Investor Services Inc.: Director, Chief Executive Officer and President, 1371 Preferred Inc. (holding company); and Van Kampen Investments Inc.; Director and President, AIM GP Canada Inc. (general partner for limited partnerships); and Van Kampen Advisors, Inc.; Director and Chief Executive Officer, Invesco Trimark Dealer Inc. (registered broker dealer); Director, Invesco Distributors, Inc. (formerly known as Invesco Aim Distributors, Inc.) (registered broker dealer); Manager, Invesco PowerShares Capital Management LLC; Director, Chief Executive Officer and President, Invesco Advisers, Inc.; Director, Chairman, Chief Executive Officer and President, Invesco Aim Capital Management, Inc.; President, Invesco Trimark Dealer Inc. and Invesco Trimark Ltd./Invesco Trimark Ltèe; Director and President, AIM Trimark Corporate Class Inc. and AIM Trimark Canada Fund Inc.; Senior Managing Director, Invesco Holding Company Limited; Trustee and Executive Vice President, Tax-Free Investments Trust; Director and Chairman, Fund Management Company (former registered broker dealer); President and Principal Executive Officer, The Invesco Funds (AIM Treasurer’s Series Trust (Invesco Treasurer’s Series Trust), Short-Term Investments Trust and Tax-Free Investments Trust only); President, AIM Trimark Global Fund Inc. and AIM Trimark Canada Fund Inc. | | | | |
| | | | | | | | | |
| | | | | | | | | |
| | | | | | | | | |
Wayne W. Whalen3 — 1939
Trustee | | 2010 | | Of Counsel, and prior to 2010, partner in the law firm of Skadden, Arps, Slate, Meagher & Flom LLP, legal counsel to funds in the Fund Complex | | 158 | | Director of the Abraham Lincoln Presidential Library Foundation |
| | | | | | | | | |
| | | | | | | | | |
| | | | | | | | | |
| Independent Trustees | | | | | | | | |
| | | | | | | | | |
| | | | | | | | | |
| | | | | | | | | |
Bruce L. Crockett — 1944
Trustee and Chair | | 1993 | | Chairman, Crockett Technology Associates (technology consulting company) | | 140 | | ACE Limited (insurance company); and Investment Company Institute |
| | | | | Formerly: Director, Captaris (unified messaging provider); Director, President and Chief Executive Officer COMSAT Corporation; and Chairman, Board of Governors of INTELSAT (international communications company) | | | | |
| | | | | | | | | |
| |
| 1 | Mr. Flanagan is considered an interested person of the Trust because he is an officer of the adviser to the Trust, and an officer and a director of Invesco Ltd., ultimate parent of the adviser to the Trust. |
| 2 | Mr. Taylor is considered an interested person of the Trust because he is an officer and a director of the adviser to, and a director of the principal underwriter of, the Trust. |
| 3 | Mr. Whalen is considered an “interested person” (within the meaning of Section 2(a)(19) of the 1940 Act) of certain Funds in the Fund Complex by reason of he and his firm currently providing legal services as legal counsel to such Funds in the Fund Complex. |
Invesco V.I. Mid Cap Core Equity Fund
Trustees and Officers—(continued)
The address of each trustee and officer is AIM Variable Insurance Funds (Invesco Variable Insurance Funds) (the “Trust”), 11 Greenway Plaza, Suite 2500, Houston, Texas 77046-1173. The trustees serve for the life of the Trust, subject to their earlier death, incapacitation, resignation, retirement or removal as more specifically provided in the Trust’s organizational documents. Each officer serves for a one year term or until their successors are elected and qualified. Column two below includes length of time served with predecessor entities, if any.
| | | | | | | | | |
| | | | | | | Number of Funds
| | |
Name, Year of Birth and
| | Trustee and/
| | Principal Occupation(s)
| | in Fund Complex
| | Other Directorship(s)
|
| Position(s) Held with the Trust | | or Officer Since | | During Past 5 Years | | Overseen by Trustee | | Held by Trustee |
| | | | | | | | | |
| | | | | | | | | |
| | | | | | | |
Independent Trustees—(continued) | | | | | | |
| | | | | | | | | |
| | | | | | | | | |
| | | | | | | | | |
David C. Arch — 1945
Trustee | | 2010 | | Chairman and Chief Executive Officer of Blistex Inc., a consumer health care products manufacturer. | | 158 | | Member of the Heartland Alliance Advisory Board, a nonprofit organization serving human needs based in Chicago. Board member of the Illinois Manufacturers’ Association. Member of the Board of Visitors, Institute for the Humanities, University of Michigan |
| | | | | | | | | |
| | | | | | | | | |
| | | | | | | | | |
Frank S. Bayley — 1939
Trustee | | 2001 | | Retired
Formerly: Director, Badgley Funds, Inc. (registered investment company) (2 portfolios) and Partner, law firm of Baker & McKenzie
Formerly: Director, Badgley Funds, Inc. (registered investment company) (2 portfolios) and Partner, law firm of Baker & McKenzie | | 140 | | Director and Chairman, C.D. Stimson Company (a real estate investment company) |
| | | | | | | | | |
| | | | | | | | | |
| | | | | | | | | |
James T. Bunch — 1942
Trustee | | 2004 | | Managing Member, Grumman Hill Group LLC (family office private equity management)
Formerly: Founder, Green, Manning & Bunch Ltd. (investment banking firm)(1988-2010); Executive Committee, United States Golf Association; and Director, Policy Studies, Inc. and Van Gilder Insurance Corporation | | 140 | | Vice Chairman, Board of Governors, Western Golf Association/Evans Scholars Foundation and Director, Denver Film Society |
| | | | | | | | | |
| | | | | | | | | |
| | | | | | | | | |
Rodney F. Dammeyer — 1940
Trustee | | 2010 | | President of CAC, LLC, a private company offering capital investment and management advisory services.
Formerly: Prior to January 2004, Director of TeleTech Holdings Inc.; Prior to 2002, Director of Arris Group, Inc.; Prior to 2001, Managing Partner at Equity Group Corporate Investments. Prior to 1995, Vice Chairman of Anixter International. Prior to 1985, experience includes Senior Vice President and Chief Financial Officer of Household International, Inc., Executive Vice President and Chief Financial Officer of Northwest Industries, Inc. and Partner of Arthur Andersen & Co. | | 158 | | Director of Quidel Corporation and Stericycle, Inc. Prior to May 2008, Trustee of The Scripps Research Institute. Prior to February 2008, Director of Ventana Medical Systems, Inc. Prior to April 2007, Director of GATX Corporation. Prior to April 2004, Director of TheraSense, Inc. |
| | | | | | | | | |
| | | | | | | | | |
| | | | | | | | | |
Albert R. Dowden — 1941
Trustee | | 2000 | | Director of a number of public and private business corporations, including the Boss Group, Ltd. (private investment and management); Reich & Tang Funds (5 portfolios) (registered investment company); and Homeowners of America Holding Corporation/ Homeowners of America Insurance Company (property casualty company)
Formerly: Director, Continental Energy Services, LLC (oil and gas pipeline service); Director, CompuDyne Corporation (provider of product and services to the public security market) and Director, Annuity and Life Re (Holdings), Ltd. (reinsurance company); Director, President and Chief Executive Officer, Volvo Group North America, Inc.; Senior Vice President, AB Volvo; Director of various public and private corporations; Chairman, DHJ Media, Inc.; Director Magellan Insurance Company; and Director, The Hertz Corporation, Genmar Corporation (boat manufacturer), National Media Corporation; Advisory Board of Rotary Power International (designer, manufacturer, and seller of rotary power engines); and Chairman, Cortland Trust, Inc. (registered investment company) | | 140 | | Board of Nature’s Sunshine Products, Inc. |
| | | | | | | | | |
| | | | | | | | | |
| | | | | | | | | |
Jack M. Fields — 1952
Trustee | | 1997 | | Chief Executive Officer, Twenty First Century Group, Inc. (government affairs company); and Owner and Chief Executive Officer, Dos Angelos Ranch, L.P. (cattle, hunting, corporate entertainment), Discovery Global Education Fund (non-profit) and Cross Timbers Quail Research Ranch (non-profit)
Formerly: Chief Executive Officer, Texana Timber LP (sustainable forestry company) and member of the U.S. House of Representatives | | 140 | | Administaff |
| | | | | | | | | |
| | | | | | | | | |
| | | | | | | | | |
Carl Frischling — 1937
Trustee | | 1993 | | Partner, law firm of Kramer Levin Naftalis and Frankel LLP | | 140 | | Director, Reich & Tang Funds (16 portfolios) |
| | | | | | | | | |
| | | | | | | | | |
Invesco V.I. Mid Cap Core Equity Fund
Trustees and Officers—(continued)
The address of each trustee and officer is AIM Variable Insurance Funds (Invesco Variable Insurance Funds) (the “Trust”), 11 Greenway Plaza, Suite 2500, Houston, Texas 77046-1173. The trustees serve for the life of the Trust, subject to their earlier death, incapacitation, resignation, retirement or removal as more specifically provided in the Trust’s organizational documents. Each officer serves for a one year term or until their successors are elected and qualified. Column two below includes length of time served with predecessor entities, if any.
| | | | | | | | | |
| | | | | | | Number of Funds
| | |
Name, Year of Birth and
| | Trustee and/
| | Principal Occupation(s)
| | in Fund Complex
| | Other Directorship(s)
|
| Position(s) Held with the Trust | | or Officer Since | | During Past 5 Years | | Overseen by Trustee | | Held by Trustee |
| | | Independent Trustees—(continued) | | | | |
| | | | | | | | | |
| | | | | | | | | |
| | | | | | | | | |
Prema Mathai-Davis — 1950
Trustee | | 1998 | | Retired
Formerly: Chief Executive Officer, YWCA of the U.S.A. | | 140 | | None |
| | | | | | | | | |
| | | | | | | | | |
| | | | | | | | | |
Larry Soll — 1942
Trustee | | 2004 | | Retired
Formerly, Chairman, Chief Executive Officer and President, Synergen Corp. (a biotechnology company) | | 140 | | None |
| | | | | | | | | |
| | | | | | | | | |
| | | | | | | | | |
Hugo F. Sonnenschein — 1940
Trustee | | 2010 | | President Emeritus and Honorary Trustee of the University of Chicago and the Adam Smith Distinguished Service Professor in the Department of Economics at the University of Chicago. Prior to July 2000, President of the University of Chicago. | | 158 | | Trustee of the University of Rochester and a member of its investment committee. Member of the National Academy of Sciences, the American Philosophical Society and a fellow of the American Academy of Arts and Sciences |
| | | | | | | | | |
| | | | | | | | | |
| | | | | | | | | |
| Raymond Stickel, Jr. — 1944 Trustee | | 2005 | | Retired
Formerly: Director, Mainstay VP Series Funds, Inc. (25 portfolios) and Partner, Deloitte & Touche | | 140 | | None |
| | | | | | | | | |
| | | | | | | | | |
| | | | | | | | | |
| Other Officers | | | | | | | | |
| | | | | | | | | |
| | | | | | | | | |
| | | | | | | | | |
Russell C. Burk — 1958
Senior Vice President and Senior Officer | | 2005 | | Senior Vice President and Senior Officer, The Invesco Funds | | N/A | | N/A |
| | | | | | | | | |
| | | | | | | | | |
| | | | | | | | | |
John M. Zerr — 1962
Senior Vice President, Chief Legal Officer and Secretary | | 2006 | | Director, Senior Vice President, Secretary and General Counsel, Invesco Management Group, Inc. (formerly known as Invesco Aim Management Group, Inc.) and Van Kampen Exchange Corp.; Senior Vice President, Invesco Advisers, Inc. (formerly known as Invesco Institutional (N.A.), Inc.) (registered investment adviser); Senior Vice President and Secretary, Invesco Distributors, Inc. (formerly known as Invesco Aim Distributors, Inc.); Director, Vice President and Secretary, Invesco Investment Services, Inc. (formerly known as Invesco Aim Investment Services, Inc.) and IVZ Distributors, Inc. (formerly known as INVESCO Distributors, Inc.); Director and Vice President, INVESCO Funds Group, Inc.; Senior Vice President, Chief Legal Officer and Secretary, The Invesco Funds; Manager, Invesco PowerShares Capital Management LLC; Director, Secretary and General Counsel, Invesco Investment Advisers LLC (formerly known as Van Kampen Asset Management); Secretary and General Counsel, Van Kampen Funds Inc. and Chief Legal Officer, PowerShares Exchange-Traded Fund Trust, PowerShares Exchange-Traded Fund Trust II, PowerShares India Exchange-Traded Fund Trust and PowerShares Actively Managed Exchange-Traded Fund Trust
Formerly: Director and Secretary, Van Kampen Advisors Inc.; Director Vice President, Secretary and General Counsel Van Kampen Investor Services Inc.; Director, Invesco Distributors, Inc. (formerly known as Invesco Aim Distributors, Inc.); Director, Senior Vice President, General Counsel and Secretary, Invesco Advisers, Inc.; and Van Kampen Investments Inc.; Director, Vice President and Secretary, Fund Management Company; Director, Senior Vice President, Secretary, General Counsel and Vice President, Invesco Aim Capital Management, Inc.; Chief Operating Officer and General Counsel, Liberty Ridge Capital, Inc. (an investment adviser); Vice President and Secretary, PBHG Funds (an investment company) and PBHG Insurance Series Fund (an investment company); Chief Operating Officer, General Counsel and Secretary, Old Mutual Investment Partners (a broker-dealer); General Counsel and Secretary, Old Mutual Fund Services (an administrator) and Old Mutual Shareholder Services (a shareholder servicing center); Executive Vice President, General Counsel and Secretary, Old Mutual Capital, Inc. (an investment adviser); and Vice President and Secretary, Old Mutual Advisors Funds (an investment company) | | N/A | | N/A |
| | | | | | | | | |
| | | | | | | | | |
| | | | | | | | | |
Lisa O. Brinkley — 1959
Vice President | | 2004 | | Global Compliance Director, Invesco Ltd.; Chief Compliance Officer, Invesco Investment Services, Inc.(formerly known as Invesco Aim Investment Services, Inc.); and Vice President, The Invesco Funds
Formerly: Chief Compliance Officer, Invesco Distributors, Inc. (formerly known as Invesco Aim Distributors, Inc.) and Van Kampen Investor Services Inc.; Senior Vice President, Invesco Management Group, Inc.; Senior Vice President and Chief Compliance Officer, Invesco Advisers, Inc. and The Invesco Funds; Vice President and Chief Compliance Officer, Invesco Aim Capital Management, Inc. and Invesco Distributors, Inc.; Vice President, Invesco Investment Services, Inc. and Fund Management Company | | N/A | | N/A |
| | | | | | | | | |
Invesco V.I. Mid Cap Core Equity Fund
Trustees and Officers—(continued)
The address of each trustee and officer is AIM Variable Insurance Funds (Invesco Variable Insurance Funds) (the “Trust”), 11 Greenway Plaza, Suite 2500, Houston, Texas 77046-1173. The trustees serve for the life of the Trust, subject to their earlier death, incapacitation, resignation, retirement or removal as more specifically provided in the Trust’s organizational documents. Each officer serves for a one year term or until their successors are elected and qualified. Column two below includes length of time served with predecessor entities, if any.
| | | | | | | | | |
| | | | | | | Number of Funds
| | |
Name, Year of Birth and
| | Trustee and/
| | Principal Occupation(s)
| | in Fund Complex
| | Other Directorship(s)
|
| Position(s) Held with the Trust | | or Officer Since | | During Past 5 Years | | Overseen by Trustee | | Held by Trustee |
| | | Other Officers—(continued) | | | | |
| | | | | | | | | |
| | | | | | | | | |
| | | | | | | | | |
Sheri Morris — 1964
Vice President, Treasurer and Principal Financial Officer | | 1999 | | Vice President, Treasurer and Principal Financial Officer, The Invesco Funds; Vice President, Invesco Advisers, Inc. (formerly known as Invesco Institutional (N.A.), Inc.) (registered investment adviser).
Formerly: Treasurer, PowerShares Exchange-Traded Fund Trust, PowerShares Exchange-Traded Fund Trust II, PowerShares India Exchange-Traded Fund Trust and PowerShares Actively Managed Exchange-Traded Fund Trust, Vice President, Invesco Advisers, Inc., Invesco Aim Capital Management, Inc. and Invesco Aim Private Asset Management, Inc.; Assistant Vice President and Assistant Treasurer, The Invesco Funds and Assistant Vice President, Invesco Advisers, Inc., Invesco Aim Capital Management, Inc. and Invesco Aim Private Asset Management, Inc. | | N/A | | N/A |
| | | | | | | | | |
| | | | | | | | | |
| | | | | | | | | |
Karen Dunn Kelley — 1960
Vice President | | 1993 | | Head of Invesco’s World Wide Fixed Income and Cash Management Group; Senior Vice President, Invesco Management Group, Inc. (formerly known as Invesco Aim Management Group, Inc.) and Invesco Advisers, Inc. (formerly known as Invesco Institutional (N.A.), Inc.) (registered investment adviser); Executive Vice President, Invesco Distributors, Inc. (formerly known as Invesco Aim Distributors, Inc.); Director, Invesco Mortgage Capital Inc.; Vice President, The Invesco Funds (other than AIM Treasurer’s Series Trust (Invesco Treasurer’s Series Trust) and Short-Term Investments Trust); and President and Principal Executive Officer, The Invesco Funds (AIM Treasurer’s Series Trust (Invesco Treasurer’s Series Trust) and Short-Term Investments Trust only).
Formerly: Senior Vice President, Van Kampen Investments Inc.; Vice President, Invesco Advisers, Inc. (formerly known as Invesco Institutional (N.A.), Inc.); Director of Cash Management and Senior Vice President, Invesco Advisers, Inc. and Invesco Aim Capital Management, Inc.; President and Principal Executive Officer, Tax-Free Investments Trust; Director and President, Fund Management Company; Chief Cash Management Officer, Director of Cash Management, Senior Vice President, and Managing Director, Invesco Aim Capital Management, Inc.; Director of Cash Management, Senior Vice President, and Vice President, Invesco Advisers, Inc. and The Invesco Funds (AIM Treasurer’s Series Trust (Invesco Treasurer’s Series Trust), Short-Term Investments Trust and Tax-Free Investments Trust only) | | N/A | | N/A |
| | | | | | | | | |
| | | | | | | | | |
| | | | | | | | | |
Yinka Akinsola — 1977
Anti-Money Laundering Compliance Officer | | 2011 | | Anti-Money Laundering Compliance Officer, Invesco Advisers, Inc. (formerly known as Invesco Institutional (N.A.), Inc.) (registered investment adviser); Invesco Distributors, Inc. (formerly known as Invesco Aim Distributors, Inc.), Invesco Investment Services, Inc. (formerly known as Invesco Aim Investment Services, Inc.), Invesco Management Group, Inc., The Invesco Funds, Invesco Van Kampen Closed-End Funds, Van Kampen Exchange Corp. and Van Kampen Funds Inc. | | N/A | | N/A |
| | | | | | | | | |
| | | | | | | | | |
| | | | | | | | | |
Todd L. Spillane — 1958
Chief Compliance Officer | | 2006 | | Senior Vice President, Invesco Management Group, Inc. (formerly known as Invesco Aim Management Group, Inc.) and Van Kampen Exchange Corp.; Senior Vice President and Chief Compliance Officer, Invesco Advisers, Inc. (registered investment adviser) (formerly known as Invesco Institutional (N.A.), Inc.); Chief Compliance Officer, The Invesco Funds, INVESCO Private Capital Investments, Inc. (holding company) and Invesco Private Capital, Inc. (registered investment adviser); Vice President, Invesco Distributors, Inc. (formerly known as Invesco Aim Distributors, Inc.) and Invesco Investment Services, Inc. (formerly known as Invesco Aim Investment Services, Inc.).
Formerly: Chief Compliance Officer, Invesco Van Kampen Closed-End Funds PowerShares Exchange-Traded Fund Trust, PowerShares Exchange-Traded Fund Trust II, PowerShares India Exchange-Traded Fund Trust, and PowerShares Actively Managed Exchange-Traded Fund Trust; Senior Vice President, Van Kampen Investments Inc.; Senior Vice President and Chief Compliance Officer, Invesco Advisers, Inc. and Invesco Aim Capital Management, Inc.; Chief Compliance Officer, Invesco Global Asset Management (N.A.), Inc., Invesco Senior Secured Management, Inc. (registered investment adviser) and Van Kampen Investor Services Inc.; Vice President, Invesco Aim Capital Management, Inc. and Fund Management Company | | N/A | | N/A |
| | | | | | | | | |
The Statement of Additional Information of the Trust includes additional information about the Fund’s Trustees and is available upon request, without charge, by calling 1.800.959.4246. Please refer to the Fund’s prospectus for information on the Fund’s sub-advisers.
| | | | | | | |
Office of the Fund
11 Greenway Plaza, Suite 2500
Houston, TX 77046-1173 | | Investment Adviser
Invesco Advisers, Inc.
1555 Peachtree Street, N.E.
Atlanta, GA 30309 | | Distributor
Invesco Distributors, Inc.
11 Greenway Plaza, Suite 2500
Houston, TX 77046-1173 | | Auditors
PricewaterhouseCoopers LLP
1201 Louisiana Street, Suite 2900
Houston, TX 77002-5678 |
| | | | | | | |
| | | | | | | |
Counsel to the Fund
Stradley Ronon Stevens & Young, LLP
2600 One Commerce Square
Philadelphia, PA 19103 | | Counsel to the Independent Trustees
Kramer, Levin, Naftalis & Frankel LLP
1177 Avenue of the Americas
New York, NY 10036-2714 | | Transfer Agent
Invesco Investment Services, Inc.
11 Greenway Plaza, Suite 2500
Houston, TX77046-1173 | | Custodian
State Street Bank and Trust Company
225 Franklin
Boston, MA 02110-2801 |
Invesco V.I. Mid Cap Core Equity Fund
Invesco V.I. Money Market Fund
Annual Report to Shareholders § December 31, 2011
The Fund provides a complete list of its holdings four times in each fiscal year, at the quarter-ends. For the second and fourth quarters, the lists appear in the Fund’s semiannual and annual reports to shareholders. For the first and third quarters, the Fund files the lists with the Securities and Exchange Commission (SEC) on Form N-Q. The Fund’s Form N-Q filings are available on the SEC website, sec.gov. Copies of the Fund’s Forms N-Q may be reviewed and copied at the SEC Public Reference Room in Washington, D.C. You can obtain information on the operation of the Public Reference Room, including information about duplicating fee charges, by calling 202 551 8090 or 800 732 0330, or by electronic request at the following email address: publicinfo@sec.gov. The SEC file numbers for the Fund are 811-07452 and 033-57340. The Fund’s most recent portfolio holdings, as filed on Form N-Q, have also been made available to insurance companies issuing variable annuity contracts and variable life insurance policies (“variable products”) that invest in the Fund.
A description of the policies and procedures that the Fund uses to determine how to vote proxies relating to portfolio securities is available without charge, upon request, from our Client Services department at 800 959 4246 or at invesco.com/proxyguidelines. The information is also available on the SEC website, sec.gov.
Information regarding how the Fund voted proxies related to its portfolio securities during the 12 months ended June 30, 2011, is available at invesco.com/proxysearch. The information is also available on the SEC website, sec.gov.
Invesco Advisers, Inc. is an investment adviser; it provides investment advisory services to individual and institutional clients and does not sell securities. Invesco Distributors, Inc. is the U.S. distributor for Invesco Ltd.’s retail mutual funds, exchange-traded funds and institutional money market funds. Both are wholly owned, indirect subsidiaries of Invesco Ltd.
This report must be accompanied or preceded by a currently effective Fund prospectus and variable product prospectus, which contain more complete information, including sales charges and expenses. Investors should read each carefully before investing.
Invesco Distributors, Inc.
VIMKT-AR-1
| | | | | | | | | |
|
| | | | | | | |
NOT FDIC INSURED | | | MAY LOSE VALUE | | | NO BANK GUARANTEE |
Management’s Discussion
Fund information
This annual report on the performance of Invesco V.I. Money Market Fund covers the fiscal year ended December 31, 2011.
As of December 31, 2011, the Fund had 47 holdings and its net assets totaled $199.5 million. As of the same date, the Fund’s weighted average maturity was 19.87 days and the Fund’s weighted average life was 28.38 days.
Weighted average maturity (WAM) is an average of the maturities of all securities held in the portfolio, weighted by each security’s percentage of net assets. The days to maturity for WAM is the lower of the stated maturity date or next interest rate reset date. WAM reflects how a portfolio would react to interest rate changes.
Weighted average life (WAL) is an average of all the maturities of all securities held in the portfolio, weighted by each security’s percentage of net assets. The days to maturity for WAL is the lower of the stated maturity date or next demand feature date. WAL reflects how a portfolio would react to deteriorating credit (widening spreads) or tightening liquidity conditions.
How we invest
The Fund invests only in high-quality U.S. dollar-denominated short-term fixed-income obligations. During the year covered by this report, as always, your Fund focused on three objectives:
n Safety of principal
n Liquidity
n The highest possible yield consistent with safety of principal
Market conditions and your Fund
The period covered by this report was characterized by continued economic uncertainty and increased market volatility, into which the European debt crisis figured prominently.
The crisis, which began in Greece and ultimately spread to the region’s third-largest economy, Italy, threatened the liquidity of European banks and the viability of the euro as the region’s common currency. European leaders worked diligently for the past two years to strengthen their national economies, increase fiscal discipline among European Union member governments and stabilize the European banking system.
In 2010, European leaders created the European Financial Stability Facility in an effort to preserve financial stability in Europe by providing loans to member governments facing financial difficulties. In October 2011, they agreed to additional measures to recapitalize European banks, to better ensure they have adequate financial resources to weather possible future financial turmoil. In December 2011, European leaders concluded an intergovernmental agreement to increase coordination of fiscal policy. These initiatives were complemented by the European Central Bank which, in a series of efforts coordinated with other central banks in Europe, Asia and the U.S.,
sought to ensure U.S. dollar liquidity to European banks. As the situation in Europe continued to unfold, U.S. money market funds pared back their exposure to European financial institutions, reducing their exposure from 53.0% in May 2011 to 34.5% in December.1
Increasingly over the reporting period, it appeared that U.S. economic growth struggled to gain a solid footing. Gross domestic product, the broadest measure of overall U.S. economic activity, grew only modestly in 2011, with annualized rates of 2.0% or less in the first three quarters of 2011.2 So while the economy expanded, it did so at a rate slower than is necessary to significantly reduce unemployment, which remained elevated at around 9.0% for most of the reporting period.3
Against this backdrop, the U.S. Federal Reserve (the Fed) maintained its accommodative monetary policy. The Fed maintained its target policy rate in a range of between zero and 0.25%, committing in its August 9 statement to keep its target policy rate at these ultra-low levels at least through mid-2013.4 The Fed subsequently announced “Operation Twist,” which aimed to lower long-term interest rates in order to boost borrowing by extending the average maturity of portfolio holdings on the Fed’s balance sheet. For money market funds, this could translate into a slight pickup in supply of short term paper, with a minimal impact on yields. More broadly, however, with no change to monetary policy, money market funds continued to operate in an ultra-low interest rate environment.
Over the course of the year covered by this report, yields on short-term Treasury bills declined. The yield on three-month Treasury notes fell from 0.12% on
December 31, 2010, to 0.01% on December 30, 2011.5 Since reaching an all-time low of 0.25% in June,5 the three-month Libor6 more than doubled to 0.58% on December 30, 2011, revisiting highs last seen in June 2010, when the European debt crisis first emerged.5
In this evolving and challenging environment for money market funds, Invesco Global Cash Management remains committed to the preservation of principal and providing daily liquidity, while seeking to deliver a competitive yield.
Thank you for investing with us.
| 1 | | Source: Investment Company Institute |
| |
| 2 | | Source: Bureau of Economic Analysis |
| |
| 3 | | Source: Bureau of Labor Statistics |
| |
| 4 | | Source: U.S. Federal Reserve |
| |
| 5 | | Source: Bloomberg LP |
| |
| 6 | | Libor is the world’s most widely followed benchmark for short-term interest rates. Fixed daily, the Libor is the interest rate at which banks in the London interbank market can borrow overnight funds from one another. It serves as a base when determining interest rates for corporations and other large borrowers. |
The views and opinions expressed in management’s discussion of Fund performance are those of Invesco Advisers, Inc. These views and opinions are subject to change at any time based on factors such as market and economic conditions. These views and opinions may not be relied upon as investment advice or recommendations, or as an offer for a particular security. The information is not a complete analysis of every aspect of any market, country, industry, security or the Fund. Statements of fact are from sources considered reliable, but Invesco Advisers, Inc. makes no representation or warranty as to their completeness or accuracy. Although historical performance is no guarantee of future results, these insights may help you understand our investment management philosophy.
See important Fund and, if applicable, index disclosures later in this report.
Team managed by Invesco Advisers, Inc.
An investment in the Fund is not insured or guaranteed by the Federal Deposit Insurance Corporation or any other government agency. Although the Fund seeks to preserve the value of your investment at $1.00 per share, you may lose money by investing in the Fund.
Invesco V.I. Money Market Fund
Invesco V.I. Money Market Fund’s investment objective is to provide as high a level of current income as is consistent with the preservation of capital and liquidity.
n Unless otherwise stated, information presented in this report is as of December 31, 2011, and is based on total net assets.
n Unless otherwise noted, all data provided by Invesco.
n To access your Fund’s reports/prospectus, visit invesco.com/fundreports.
Principal risks of investing in the Fund
Counterparty risk. Individually negotiated or over-the-counter derivatives are also subject to counterparty risk, which is the risk that the other party to the contract (such as a futures contract or swap agreement) will not fulfill its contractual obligations, which may cause losses or additional costs to the Fund.
Credit risk. The issuer of instruments in which the Fund invests may be unable to meet interest and/or principal payments, thereby causing its instruments to decrease in value and lowering the issuer’s credit rating.
Foreign securities risk. The Fund’s foreign investments may be affected by changes in a foreign country’s exchange rates; political and social instability; changes in economic or taxation policies; difficulties when enforcing obligations; decreased liquidity; and increased volatility. Foreign companies may be subject to less regulation resulting in less publicly available information about the companies.
Industry focus risk. To the extent a fund invests in securities issued or guaranteed by companies in the banking and financial services industries, the fund’s performance will depend on the overall condition of those industries, which may be affected by the following factors: the supply of short-term financing; changes in government regulation and interest rates; and overall economy.
Interest rate risk. Interest rate risk refers to the risk that bond prices generally fall as interest rates rise; conversely, bond prices generally rise as interest rates fall. Specific bonds differ in their sensitivity to changes in interest rates depending on their individual characteristics, including duration.
Liquidity risk. The Fund may hold illiquid securities that it is unable to sell at the preferred time or price and could lose its entire investment in such securities.
Management risk. The investment techniques and risk analysis used by the Fund’s portfolio managers may not produce the desired results.
Market risk. The prices of and the income generated by the Fund’s securities may decline in response to, among other things, investor sentiment; general economic and market conditions; regional or global instability; and currency and interest rate fluctuations.
Municipal securities risk. The Fund may invest in municipal securities. Constitutional amendments, legislative enactments, executive orders, administrative regulations, voter initiatives, and the issuer’s regional economic conditions may affect the municipal security’s value, interest payments, repayment of principal and the Fund’s ability to sell it. Failure of a municipal security issuer to comply with applicable tax requirements may make income paid thereon taxable, resulting in a decline in the security’s value. In addition, there could be changes in
applicable tax laws or tax treatments that reduce or eliminate the current federal income tax exemption on municipal securities or otherwise adversely affect the current federal or state tax status of municipal securities.
Repurchase agreement risk. If the seller of a repurchase agreement in which the Fund invests defaults on its obligation or declares bankruptcy, the Fund may experience delays in selling the securities underlying the repurchase agreement, resulting in losses.
Synthetic securities risk. Fluctuations in the values of synthetic instruments may not correlate perfectly with the instruments they are designed to replicate. Some synthetic instruments are more sensitive to interest rate changes and market price fluctuations than others. These instruments may be subject to counterparty risk and liquidity risk.
U.S. government obligations risk.
The Fund may invest in obligations issued by U.S. government agencies and instrumentalities that may receive varying levels of support from the government, which could affect the Fund’s ability to recover should they default.
Variable-rate demand notes risk.
The absence of an active secondary market for certain variable and floating rate notes could make it difficult to dispose of the instruments, and a portfolio could suffer a loss if the issuer defaults during periods in which a portfolio is not entitled to exercise its demand rights.
Portfolio Composition by Maturity
In days, as of 12/31/11
| | | | |
|
| 1-7 | | | 46.6 | % |
| |
| 8-30 | | | 34.2 | |
| |
| 31-60 | | | 14.9 | |
| |
| 61-90 | | | 2.0 | |
| |
| 91-180 | | | 2.3 | |
The number of days to maturity of each holding is determined in accordance with the provisions of Rule 2a-7 of the Investment Company Act of 1940.
Invesco V.I. Money Market Fund, a series portfolio of AIM Variable Insurance Funds (Invesco Variable Insurance Funds), is currently offered through insurance companies issuing variable products. You cannot purchase shares of the Fund directly. Performance figures given represent the Fund and are not intended to reflect actual variable product values. They do not reflect sales charges, expenses and fees assessed in connection with a variable product. Sales charges,
expenses and fees, which are determined by the variable product issuers, will vary and will lower the total return.
The most recent month-end performance data at the Fund level, excluding variable product charges, is available at 800 451 4246. As mentioned above, for the most recent month-end performance including variable product charges, please contact your variable product issuer or financial adviser.
Invesco V.I. Money Market Fund
Schedule of Investments
December 31, 2011
| | | | | | | | | | | | | | | | | |
| | | | | | | Principal
| | |
| | | Interest
| | Maturity
| | Amount
| | |
| | | Rate | | Date | | (000) | | Value |
| |
Commercial Paper–64.64%(a)
|
Asset-Backed Securities–Commercial Loans/Leases–2.50%
| | | | | | | | | | | | |
Atlantis One Funding Corp.(b)(c) | | | 0.30 | % | | | 01/03/12 | | | $ | 5,000 | | | $ | 4,999,917 | |
| |
Asset-Backed Securities–Consumer Receivables–9.53%
| | | | | | | | | | | | |
| Bryant Park Funding LLC | | | 0.17 | % | | | 01/20/12 | | | | 5,000 | | | | 4,999,551 | |
| |
Old Line Funding, LLC(b) | | | 0.22 | % | | | 01/03/12 | | | | 4,919 | | | | 4,918,940 | |
| |
Old Line Funding, LLC(b) | | | 0.22 | % | | | 02/01/12 | | | | 3,069 | | | | 3,068,419 | |
| |
Sheffield Receivables Corp.(b) | | | 0.32 | % | | | 01/13/12 | | | | 6,025 | | | | 6,024,357 | |
| |
| | | | | | | | | | | | | | | | 19,011,267 | |
| |
Asset-Backed Securities–Fully Supported Bank–12.38%
| | | | | | | | | | | | |
Fairway Finance Co., LLC (CEP–Bank of Montreal)(c) | | | 0.18 | % | | | 02/24/12 | | | | 9,500 | | | | 9,497,435 | |
| |
Gotham Funding Corp. (CEP–Bank of Tokyo-Mitsubishi UFJ, Ltd. (The))(b)(c) | | | 0.18 | % | | | 01/03/12 | | | | 2,500 | | | | 2,499,975 | |
| |
| Govco LLC (CEP–Citibank, N.A.) | | | 0.15 | % | | | 01/23/12 | | | | 8,200 | | | | 8,199,248 | |
| |
Victory Receivables Corp. (CEP–Bank of Tokyo-Mitsubishi UFJ, Ltd. (The))(b)(c) | | | 0.35 | % | | | 01/12/12 | | | | 4,500 | | | | 4,499,519 | |
| |
| | | | | | | | | | | | | | | | 24,696,177 | |
| |
Asset-Backed Securities–Multi-Purpose–22.04%
| | | | | | | | | | | | |
| CAFCO, LLC | | | 0.24 | % | | | 01/04/12 | | | | 5,000 | | | | 4,999,900 | |
| |
| Chariot Funding, LLC/Ltd. | | | 0.16 | % | | | 02/14/12 | | | | 3,000 | | | | 2,999,413 | |
| |
| Chariot Funding, LLC/Ltd. | | | 0.18 | % | | | 02/16/12 | | | | 6,200 | | | | 6,198,574 | |
| |
| CRC Funding LLC | | | 0.24 | % | | | 01/04/12 | | | | 4,000 | | | | 3,999,920 | |
| |
| CRC Funding LLC | | | 0.14 | % | | | 01/17/12 | | | | 5,500 | | | | 5,499,658 | |
| |
| Jupiter Securitization Corp. | | | 0.20 | % | | | 01/05/12 | | | | 5,000 | | | | 4,999,889 | |
| |
| Jupiter Securitization Corp. | | | 0.22 | % | | | 03/15/12 | | | | 4,000 | | | | 3,998,191 | |
| |
Nieuw Amsterdam Receivables Corp.(b)(c) | | | 0.20 | % | | | 01/03/12 | | | | 5,000 | | | | 4,999,944 | |
| |
Regency Markets No. 1, LLC(b)(c) | | | 0.27 | % | | | 01/12/12 | | | | 6,284 | | | | 6,283,482 | |
| |
| | | | | | | | | | | | | | | | 43,978,971 | |
| |
Asset-Backed Securities–Securities–2.50%
| | | | | | | | | | | | |
Solitaire Funding Ltd./LLC(b)(c) | | | 0.38 | % | | | 01/13/12 | | | | 5,000 | | | | 4,999,367 | |
| |
Asset-Backed Securities–Trade Receivables–4.79%
| | | | | | | | | | | | |
Market Street Funding LLC(b) | | | 0.16 | % | | | 02/13/12 | | | | 5,000 | | | | 4,999,044 | |
| |
Market Street Funding LLC(b) | | | 0.25 | % | | | 04/02/12 | | | | 4,571 | | | | 4,568,080 | |
| |
| | | | | | | | | | | | | | | | 9,567,124 | |
| |
Diversified Banks–3.76%
| | | | | | | | | | | | |
National Australia Funding Delaware Inc.(b)(c) | | | 0.25 | % | | | 01/23/12 | | | | 7,500 | | | | 7,498,862 | |
| |
Diversified Metals & Mining–4.38%
| | | | | | | | | | | | |
BHP Biliton Finance USA Ltd.(b)(c) | | | 0.13 | % | | | 01/24/12 | | | | 8,750 | | | | 8,749,273 | |
| |
Life & Health Insurance–2.76%
| | | | | | | | | | | | |
MetLife Short Term Funding LLC(b) | | | 0.16 | % | | | 01/20/12 | | | | 5,500 | | | | 5,499,536 | |
| |
| Total Commercial Paper (Cost $129,000,494) | | | | | | | | | | | | | | | 129,000,494 | |
| |
| | | | | | | | | | | | | | | | | |
| | | | | | | | | | | | | | | | | |
See accompanying Notes to Financial Statements which are an integral part of the financial statements.
Invesco V.I. Money Market Fund
| | | | | | | | | | | | | | | | | |
| | | | | | | Principal
| | |
| | | Interest
| | Maturity
| | Amount
| | |
| | | Rate | | Date | | (000) | | Value |
| |
Variable Rate Demand Notes–14.92%(d)
|
Credit Enhanced–14.92%
| | | | | | | | | | | | |
Atlanticare Health Services, Inc.; Series 2003, VRD Taxable Bonds (LOC–Wells Fargo Bank, N.A.)(e) | | | 0.22 | % | | | 10/01/33 | | | $ | 4,740 | | | $ | 4,740,000 | |
| |
Benjamin Rose Institute (The) (Kethley House); Series 2005, VRD Taxable Notes (LOC–JPMorgan Chase Bank, N.A.)(e) | | | 0.22 | % | | | 12/01/28 | | | | 4,800 | | | | 4,800,000 | |
| |
Collier (County of), Florida Industrial Development Authority (Allete, Inc.); Series 2006, Ref. VRD IDR (LOC–Wells Fargo Bank, N.A.)(e) | | | 0.14 | % | | | 10/01/25 | | | | 1,000 | | | | 1,000,000 | |
| |
Connecticut (State of) Development Authority (Northeast Foods, Inc.); Series 1998, VRD IDR (LOC–Bank of America, N.A.)(b)(e) | | | 0.59 | % | | | 06/01/13 | | | | 725 | | | | 725,000 | |
| |
Hamilton (County of), Ohio (Children’s Hospital Medical Center); Series 1997 A, VRD Hospital Facilities RB (LOC–PNC Bank, N.A.)(e) | | | 0.10 | % | | | 05/15/17 | | | | 600 | | | | 600,000 | |
| |
M3 Realty, LLC; Series 2007, VRD RN (LOC–General Electric Capital Corp.)(b)(e) | | | 0.30 | % | | | 01/01/33 | | | | 2,200 | | | | 2,200,000 | |
| |
Massachusetts (State of) Development Finance Agency (Milton Academy); Series 2009 B, VRD Taxable RB (LOC–TD Bank, N.A.)(e) | | | 0.17 | % | | | 03/01/39 | | | | 3,400 | | | | 3,400,000 | |
| |
Massachusetts (State of) Development Finance Agency (Salema Family Limited Partnership); Series 1999 A, VRD IDR (LOC–Bank of America, N.A.)(e) | | | 0.55 | % | | | 12/01/20 | | | | 655 | | | | 655,000 | |
| |
Massachusetts (State of) Housing Finance Agency; Series 2009 B, VRD Taxable RB (LOC–Bank of America, N.A.)(e) | | | 0.27 | % | | | 01/01/44 | | | | 4,800 | | | | 4,800,000 | |
| |
Nashville (City of) & Davidson (County of), Tennessee Metropolitan Government Industrial Development Board (L & S, LLC); Series 2001, VRD IDR (LOC–JPMorgan Chase Bank, N.A.)(e) | | | 0.10 | % | | | 03/01/26 | | | | 385 | | | | 385,000 | |
| |
Ogden (City of), Utah Redevelopment Agency; Series 2009 B-1, Ref. VRD Taxable RB (LOC–Wells Fargo Bank, N.A.)(e) | | | 0.22 | % | | | 12/01/27 | | | | 2,530 | | | | 2,530,000 | |
| |
Pitney Road Partners, LLC; Series 2008, VRD Notes (LOC–General Electric
Capital Corp.)(b)(e) | | | 0.25 | % | | | 07/01/25 | | | | 2,055 | | | | 2,055,000 | |
| |
Rock Island (County of), Illinois Metropolitan Airport Authority (Quad City International Airport Air Freight); Series 1998 A, VRD Priority RB (LOC–U.S. Bank, N.A.)(e) | | | 0.28 | % | | | 12/01/18 | | | | 390 | | | | 390,000 | |
| |
St. Jean Industries, Inc.; Series 2006, VRD Taxable Notes (LOC–General Electric Capital Corp.)(b)(e) | | | 0.25 | % | | | 10/01/21 | | | | 1,000 | | | | 1,000,000 | |
| |
St. Paul (City of), Minnesota Port Authority; Series 2009-10 CC, VRD District Cooling RB (LOC–Deutsche Bank AG)(c)(e) | | | 0.20 | % | | | 03/01/29 | | | | 500 | | | | 500,000 | |
| |
| Total Variable Rate Demand Notes (Cost $29,780,000) | | | | | | | | | | | | | | | 29,780,000 | |
| |
Certificates of Deposit–12.03%
| | | | | | | | | | | | |
| Bank of Nova Scotia | | | 0.25 | % | | | 01/11/12 | | | | 4,000 | | | | 4,000,000 | |
| |
Deutsche Bank AG (Cayman Islands)(c) | | | 0.06 | % | | | 01/03/12 | | | | 9,000 | | | | 9,000,000 | |
| |
Svenska Handelsbanken A.B. (United Kingdom)(c) | | | 0.45 | % | | | 02/27/12 | | | | 3,000 | | | | 3,000,023 | |
| |
Svenska Handelsbanken A.B. (Cayman Islands)(c) | | | 0.01 | % | | | 01/03/12 | | | | 6,000 | | | | 6,000,000 | |
| |
| Toronto-Dominion Bank | | | 0.26 | % | | | 01/12/12 | | | | 2,000 | | | | 2,000,000 | |
| |
| Total Certificates of Deposit (Cost $24,000,023) | | | | | | | | | | | | | | | 24,000,023 | |
| |
Bank Notes–2.26%
| | | | | | | | | | | | |
Toyota Motor Credit Corp., Sr. Unsec. Floating Rate MTN(f) (Cost $4,500,000) | | | 0.80 | % | | | 01/15/13 | | | | 4,500 | | | | 4,500,000 | |
| |
| TOTAL INVESTMENTS (excluding Repurchase Agreements)–93.85% (Cost $187,280,517) | | | | | | | | | | | | | | | 187,280,517 | |
| |
| | | | | | | | | | | | | | | | | |
| | | | | | | Repurchase
| | |
| | | | | | | Amount | | |
Repurchase Agreements–6.24%(g)
| | | | | | | | | | | | |
Wells Fargo Securities, LLC, Joint agreement dated 12/30/11, maturing value $500,002,778 (collateralized by U.S. Treasury obligations valued at $510,000,001; 2.35%-5.52%, 11/01/21-12/15/41) | | | 0.05 | % | | | 01/03/12 | | | | 3,457,808 | | | | 3,457,789 | |
| |
Wells Fargo Securities, LLC, Joint agreement dated 12/30/11, aggregate maturing value $500,007,778 (collateralized by Mortgage-Backed securities and other instruments valued at $525,000,001; 0%-6.98%, 03/13/12-07/15/56) | | | 0.14 | % | | | 01/03/12 | | | | 9,000,140 | | | | 9,000,000 | |
| |
| Total Repurchase Agreements (Cost $12,457,789) | | | | | | | | | | | | | | | 12,457,789 | |
| |
TOTAL INVESTMENTS(h)(i)–100.09% (Cost $199,738,306) | | | | | | | | | | | | | | | 199,738,306 | |
| |
| OTHER ASSETS LESS LIABILITIES–(0.09)% | | | | | | | | | | | | | | | (183,538 | ) |
| |
| NET ASSETS–100.00% | | | | | | | | | | | | | | $ | 199,554,768 | |
| |
See accompanying Notes to Financial Statements which are an integral part of the financial statements.
Invesco V.I. Money Market Fund
Investment Abbreviations:
| | | |
| CEP | | – Credit Enhancement Provider |
| IDR | | – Industrial Development Revenue Bonds |
| LOC | | – Letter of Credit |
| MTN | | – Medium-Term Notes |
| RB | | – Revenue Bonds |
| Ref. | | – Refunding |
| RN | | – Revenue Notes |
| VRD | | – Variable Rate Demand |
Notes to Schedule of Investments:
| | |
| (a) | | Security may be traded on a discount basis. The interest rate shown represents the discount rate at the time of purchase by the Fund. |
| (b) | | Security purchased or received in a transaction exempt from registration under the Securities Act of 1933, as amended. The security may be resold pursuant to an exemption from registration under the 1933 Act, typically to qualified institutional buyers. The aggregate value of these securities at December 31, 2011 was $79,588,715, which represented 39.88% of the Fund’s Net Assets. |
| (c) | | The security is credit guaranteed, enhanced or has credit risk by a foreign entity. The foreign credit exposure to countries other than the United States of America (as a percentage of net assets) is summarized as follows: Australia: 8.1%; Cayman Islands: 7.5%; United Kingdom: 7.2%; Netherlands: 5.0%; other countries less than 5% each: 8.5%. |
| (d) | | Demand security payable upon demand by the Fund at specified time intervals no greater than thirteen months. Interest rate is redetermined periodically. Rate shown is the rate in effect on December 31, 2011. |
| (e) | | Principal and interest payments are fully enhanced by a letter of credit from the bank listed or a predecessor bank, branch or subsidiary. |
| (f) | | Interest or dividend rate is redetermined periodically. Rate shown is the rate in effect on December 31, 2011. |
| (g) | | Principal amount equals value at period end. See Note 1I. |
| (h) | | Also represents cost for federal income tax purposes. |
| (i) | | Entities may either issue, guarantee, back or otherwise enhance the credit quality of a security. The entities are not primarily responsible for the issuer’s obligation but may be called upon to satisfy the issuer’s obligations. No concentration of any single entity was greater than 5% each. |
See accompanying Notes to Financial Statements which are an integral part of the financial statements.
Invesco V.I. Money Market Fund
Statement of Assets and Liabilities
December 31, 2011
| | | | | |
Assets:
|
| Investments, at value (Cost $199,738,306) | | $ | 199,738,306 | |
| |
| Interest receivable | | | 19,682 | |
| |
| Investment for trustee deferred compensation and retirement plans | | | 37,529 | |
| |
| Total assets | | | 199,795,517 | |
| |
Liabilities:
|
| Payable for: | | | | |
| Fund shares reacquired | | | 38,047 | |
| |
| Dividends | | | 3,074 | |
| |
| Accrued fees to affiliates | | | 119,733 | |
| |
| Accrued other operating expenses | | | 31,397 | |
| |
| Trustee deferred compensation and retirement plans | | | 48,498 | |
| |
| Total liabilities | | | 240,749 | |
| |
| Net assets applicable to shares outstanding | | $ | 199,554,768 | |
| |
Net assets consist of:
|
| Shares of beneficial interest | | $ | 199,559,407 | |
| |
| Undistributed net investment income | | | (2,496 | ) |
| |
| Undistributed net realized gain (loss) | | | (2,143 | ) |
| |
| | | $ | 199,554,768 | |
| |
| | | | | |
| | | | | |
Net Assets:
|
| Series I | | $ | 198,532,755 | |
| |
| Series II | | $ | 1,022,013 | |
| |
Shares outstanding, $0.001 par value per share, with an unlimited number of shares authorized:
|
| Series I | | | 198,533,674 | |
| |
| Series II | | | 1,021,811 | |
| |
| Series I: | | | | |
| Net asset value per share | | $ | 1.00 | |
| |
| Series II: | | | | |
| Net asset value per share | | $ | 1.00 | |
| |
Statement of Operations
For the year ended December 31, 2011
| | | | | |
Investment income:
|
| Interest | | $ | 237,010 | |
| |
Expenses:
|
| Advisory fees | | | 422,712 | |
| |
| Administrative services fees | | | 94,704 | |
| |
| Custodian fees | | | 15,275 | |
| |
| Distribution fees — Series II | | | 2,534 | |
| |
| Transfer agent fees | | | 5,364 | |
| |
| Trustees’ and officers’ fees and benefits | | | 20,665 | |
| |
| Professional services fees | | | 30,922 | |
| |
| Other | | | 12,927 | |
| |
| Total expenses | | | 605,103 | |
| |
| Less: Fees waived | | | (422,026 | ) |
| |
| Net expenses | | | 183,077 | |
| |
| Net investment income | | | 53,933 | |
| |
| Net increase in net assets resulting from operations | | $ | 53,933 | |
| |
See accompanying Notes to Financial Statements which are an integral part of the financial statements.
Invesco V.I. Money Market Fund
Statement of Changes in Net Assets
For the years ended December 31, 2011 and 2010
| | | | | | | | | |
| | | 2011 | | 2010 |
| |
Operations:
|
| Net investment income | | $ | 53,933 | | | $ | 55,671 | |
| |
| Net realized gain (loss) | | | — | | | | (2,143 | ) |
| |
| Net increase in net assets resulting from operations | | | 53,933 | | | | 53,528 | |
| |
Distributions to shareholders from net investment income:
|
| Series I | | | (53,437 | ) | | | (53,205 | ) |
| |
| Series II | | | (496 | ) | | | (2,466 | ) |
| |
| Total distributions from net investment income | | | (53,933 | ) | | | (55,671 | ) |
| |
Share transactions–net:
|
| Series I | | | 172,954,380 | | | | (7,905,234 | ) |
| |
| Series II | | | (2,229 | ) | | | (665,170 | ) |
| |
| Net increase (decrease) in net assets resulting from share transactions | | | 172,952,151 | | | | (8,570,404 | ) |
| |
| Net increase (decrease) in net assets | | | 172,952,151 | | | | (8,572,547 | ) |
| |
Net assets:
|
| Beginning of year | | | 26,602,617 | | | | 35,175,164 | |
| |
| End of year (includes undistributed net investment income of $(2,496) and $0, respectively) | | $ | 199,554,768 | | | $ | 26,602,617 | |
| |
Notes to Financial Statements
December 31, 2011
NOTE 1—Significant Accounting Policies
Invesco V.I. Money Market Fund (the “Fund”) is a series portfolio of AIM Variable Insurance Funds (Invesco Variable Insurance Funds) (the “Trust”). The Trust is a Delaware statutory trust registered under the Investment Company Act of 1940, as amended (the “1940 Act”), as an open-end series management investment company consisting of twenty-eight separate portfolios, (each constituting a “Fund”). The assets, liabilities and operations of each portfolio are accounted for separately. Information presented in these financial statements pertains only to the Fund. Matters affecting each Fund or class will be voted on exclusively by the shareholders of such Fund or class. Current Securities and Exchange Commission (“SEC”) guidance, however, requires participating insurance companies offering separate accounts to vote shares proportionally in accordance with the instructions of the contract owners whose investments are funded by shares of each Fund or class.
The Fund’s investment objective is to provide as high a level of current income as is consistent with the preservation of capital and liquidity.
The Fund currently offers two classes of shares, Series I and Series II, both of which are offered to insurance company separate accounts funding variable annuity contracts and variable life insurance policies (“variable products”).
The following is a summary of the significant accounting policies followed by the Fund in the preparation of its financial statements.
| | |
| A. | | Security Valuations — The Fund’s securities are recorded on the basis of amortized cost which approximates value as permitted by Rule 2a-7 under the 1940 Act. This method values a security at its cost on the date of purchase and, thereafter, assumes a constant amortization to maturity of any premiums or accretion of any discounts. |
| | Because of the inherent uncertainties of valuation, the values reflected in the financial statements may materially differ from the value received upon actual sale of those investments. |
| B. | | Securities Transactions and Investment Income — Securities transactions are accounted for on a trade date basis. Realized gains or losses on sales are computed on the basis of specific identification of the securities sold. Interest income, adjusted for amortization of premiums and accretion of discounts on investments, is recorded on the accrual basis from settlement date. Paydown gains and losses on mortgage and asset-backed securities are recorded as adjustments to interest income. |
| | The Fund may periodically participate in litigation related to Fund investments. As such, the Fund may receive proceeds from litigation settlements. Any proceeds received are included in the Statement of Operations as realized gain (loss) for investments no longer held and as unrealized gain (loss) for investments still held. |
| | Brokerage commissions and mark ups are considered transaction costs and are recorded as an increase to the cost basis of securities purchased and/or a reduction of proceeds on a sale of securities. Such transaction costs are included in the determination of net realized gain (loss) from investment securities reported in the Statement of Operations and the Statement of Changes in Net Assets and the net realized gains (losses) on securities per share in the |
Invesco V.I. Money Market Fund
| | |
| | Financial Highlights. Transaction costs are included in the calculation of the Fund’s net asset value and, accordingly, they reduce the Fund’s total returns. These transaction costs are not considered operating expenses and are not reflected in net investment income reported in the Statement of Operations and Statement of Changes in Net Assets, or the net investment income per share and ratios of expenses and net investment income reported in the Financial Highlights, nor are they limited by any expense limitation arrangements between the Fund and the investment adviser. |
| | The Fund allocates realized and unrealized capital gains and losses to a class based on the relative net assets of each class. The Fund allocates income to a class based on the relative value of the settled shares of each class. |
| C. | | Country Determination — For the purposes of making investment selection decisions and presentation in the Schedule of Investments, the investment adviser may determine the country in which an issuer is located and/or credit risk exposure based on various factors. These factors include the laws of the country under which the issuer is organized, where the issuer maintains a principal office, the country in which the issuer derives 50% or more of its total revenues and the country that has the primary market for the issuer’s securities, as well as other criteria. Among the other criteria that may be evaluated for making this determination are the country in which the issuer maintains 50% or more of its assets, the type of security, financial guarantees and enhancements, the nature of the collateral and the sponsor organization. Country of issuer and/or credit risk exposure has been determined to be the United States of America, unless otherwise noted. |
| D. | | Distributions — Distributions from income are declared daily and paid monthly to separate accounts of participating insurance companies. Distributions from net realized gain, if any, are generally paid annually and recorded on ex-dividend date. |
| E. | | Federal Income Taxes — The Fund intends to comply with the requirements of Subchapter M of the Internal Revenue Code necessary to qualify as a regulated investment company and to distribute substantially all of the Fund’s taxable earnings to shareholders. As such, the Fund will not be subject to federal income taxes on otherwise taxable income (including net realized capital gain) that is distributed to shareholders. Therefore, no provision for federal income taxes is recorded in the financial statements. |
| | The Fund files tax returns in the U.S. Federal jurisdiction and certain other jurisdictions. Generally, the Fund is subject to examinations by such taxing authorities for up to three years after the filing of the return for the tax period. |
| F. | | Expenses — Fees provided for under the Rule 12b-1 plan of a particular class of the Fund and which are directly attributable to that class are charged to the operations of such class. All other expenses are allocated among the classes based on relative net assets. |
| G. | | Accounting Estimates — The preparation of financial statements in conformity with accounting principles generally accepted in the United States of America (“GAAP”) requires management to make estimates and assumptions that affect the reported amounts of assets and liabilities at the date of the financial statements and the reported amounts of revenues and expenses during the reporting period including estimates and assumptions related to taxation. Actual results could differ from those estimates by a significant amount. In addition, the Fund monitors for material events or transactions that may occur or become known after the period-end date and before the date the financial statements are released to print. |
| H. | | Indemnifications — Under the Trust’s organizational documents, each Trustee, officer, employee or other agent of the Trust is indemnified against certain liabilities that may arise out of performance of their duties to the Fund. Additionally, in the normal course of business, the Fund enters into contracts, including the Fund’s servicing agreements that contain a variety of indemnification clauses. The Fund’s maximum exposure under these arrangements is unknown as this would involve future claims that may be made against the Fund that have not yet occurred. The risk of material loss as a result of such indemnification claims is considered remote. |
| I. | | Repurchase Agreements — The Fund may enter into repurchase agreements. Collateral on repurchase agreements, including the Fund’s pro-rata interest in joint repurchase agreements, is taken into possession by the Fund upon entering into the repurchase agreement. Eligible securities for collateral are securities consistent with the Fund’s investment objectives and may consist of U.S. Government Securities, U.S. Government Sponsored Agency Securities and/or, Investment Grade Debt Securities. Collateral consisting of U.S. Government Securities and U.S. Government Sponsored Agency Securities is marked to market daily to ensure its market value is at least 102% of the sales price of the repurchase agreement. Collateral consisting of Investment Grade Debt Securities is marked to market daily to ensure its market value is at least 105% of the sales price of the repurchase agreement. The investments in some repurchase agreements, pursuant to procedures approved by the Board of Trustees, are through participation with other mutual funds, private accounts and certain non-registered investment companies managed by the investment advisor or its affiliates (“Joint repurchase agreements”). The principal amount of the repurchase agreement is equal to the value at period-end. If the seller of a repurchase agreement fails to repurchase the security in accordance with the terms of the agreement, the Fund might incur expenses in enforcing its rights, and could experience losses, including a decline in the value of the collateral and loss of income. |
NOTE 2—Advisory Fees and Other Fees Paid to Affiliates
The Trust has entered into a master investment advisory agreement with Invesco Advisers, Inc. (the “Adviser” or “Invesco”). Under the terms of the investment advisory agreement, the Fund pays an advisory fee to the Adviser based on the annual rate of the Fund’s average daily net assets as follows:
| | | | | |
| Average Daily Net Assets | | Rate |
| |
| First $250 million | | | 0 | .40% |
| |
| Over $250 million | | | 0 | .35% |
| |
Under the terms of a master sub-advisory agreement between the Adviser and each of Invesco Asset Management Deutschland GmbH, Invesco Asset Management Limited, Invesco Asset Management (Japan) Limited, Invesco Australia Limited, Invesco Hong Kong Limited, Invesco Senior Secured Management, Inc. and Invesco Canada Ltd. (collectively, the “Affiliated Sub-Advisers”) the Adviser, not the Fund, may pay 40% of the fees paid to the Adviser to any such Affiliated Sub-Adviser(s) that provide discretionary investment management services to the Fund based on the percentage of assets allocated to such Sub-Adviser(s).
Invesco V.I. Money Market Fund
The Adviser has contractually agreed, through at least April 30, 2013, to waive advisory fees and/or reimburse expenses to the extent necessary to limit total annual operating expenses after fee waiver and/or expense reimbursement (excluding certain items discussed below) of Series I shares to 1.30% and Series II shares to 1.45% of average daily net assets. In determining the Adviser’s obligation to waive advisory fees and/or reimburse expenses, the following expenses are not taken into account, and could cause the total annual operating expenses after fee waiver and/or expense reimbursement to exceed the numbers reflected above: (1) interest; (2) taxes; (3) dividend expense on short sales; (4) extraordinary or non-routine items, including litigation expenses; and (5) expenses that the Fund has incurred but did not actually pay because of an expense offset arrangement. Unless the Board of the Trustees and Invesco mutually agree to amend or continue the fee waiver agreement, it will terminate on April 30, 2013.
The Adviser and/or Invesco Distributors, Inc., (“IDI”) voluntarily agreed to waive fees and/or reimburse expenses in order to increase the Fund’s yield. Voluntary fee waivers and/or reimbursements may be modified at any time upon consultation with the Board of Trustees without further notice to investors.
For the year ended December 31, 2011, the Adviser voluntarily waived advisory fees of $419,492 and reimbursed class level expenses of $2,534 for Series II shares, in order to increase the Fund’s yields.
The Trust has entered into a master administrative services agreement with Invesco pursuant to which the Fund has agreed to pay Invesco a fee for costs incurred in providing accounting services and fund administrative services to the Fund and to reimburse Invesco for administrative services fees paid to insurance companies that have agreed to provide services to the participants of separate accounts. These administrative services provided by the insurance companies may include, among other things: the printing of prospectuses, financial reports and proxy statements and the delivery of the same to existing participants; the maintenance of master accounts; the facilitation of purchases and redemptions requested by the participants; and the servicing of participants’ accounts. Pursuant to such agreement, for the year ended December 31, 2011, Invesco was paid $50,000 for accounting and fund administrative services and reimbursed $44,704 for services provided by insurance companies.
The Trust has entered into a transfer agency and service agreement with Invesco Investment Services, Inc. (“IIS”) pursuant to which the Fund has agreed to pay IIS a fee for providing transfer agency and shareholder services to the Fund and reimburse IIS for certain expenses incurred by IIS in the course of providing such services. For the year ended December 31, 2011, expenses incurred under the agreement are shown in the Statement of Operations as transfer agent fees.
The Trust has entered into a master distribution agreement with IDI to serve as the distributor for the Fund. The Trust has adopted a plan pursuant to Rule 12b-1 under the 1940 Act with respect to the Fund’s Series II shares (the “Plan”). The Fund, pursuant to the Plan, pays IDI compensation at the annual rate of 0.25% of the Fund’s average daily net assets of Series II shares. Of the Plan payments, up to 0.25% of the average daily net assets of the Series II shares may be paid to insurance companies who furnish continuing personal shareholder services to customers who purchase and own Series II shares of the Fund. For the year ended December 31, 2011, expenses incurred under the Plan are detailed in the Statement of Operations as distribution fees.
Certain officers and trustees of the Trust are officers and directors of the Adviser, IIS and/or IDI.
NOTE 3—Additional Valuation Information
GAAP defines fair value as the price that would be received to sell an asset or paid to transfer a liability in an orderly transaction between market participants at the measurement date, under current market conditions. GAAP establishes a hierarchy that prioritizes the inputs to valuation methods giving the highest priority to readily available unadjusted quoted prices in an active market for identical assets (Level 1) and the lowest priority to significant unobservable inputs (Level 3) generally when market prices are not readily available or are unreliable. Based on the valuation inputs, the securities or other investments are tiered into one of three levels. Changes in valuation methods may result in transfers in or out of an investment’s assigned level:
| | |
| | Level 1 — | Prices are determined using quoted prices in an active market for identical assets. |
| | Level 2 — | Prices are determined using other significant observable inputs. Observable inputs are inputs that other market participants may use in pricing a security. These may include quoted prices for similar securities, interest rates, prepayment speeds, credit risk, yield curves, loss severities, default rates, discount rates, volatilities and others. |
| | Level 3 — | Prices are determined using significant unobservable inputs. In situations where quoted prices or observable inputs are unavailable (for example, when there is little or no market activity for an investment at the end of the period), unobservable inputs may be used. Unobservable inputs reflect the Fund’s own assumptions about the factors market participants would use in determining fair value of the securities or instruments and would be based on the best available information. |
The following is a summary of the tiered valuation input levels, as of December 31, 2011. The level assigned to the securities valuations may not be an indication of the risk or liquidity associated with investing in those securities. Because of the inherent uncertainties of valuation, the values reflected in the financial statements may materially differ from the value received upon actual sale of those investments.
During the year ended December 31, 2011, there were no significant transfers between investment levels.
| | | | | | | | | | | | | | | | | |
| | | Level 1 | | Level 2 | | Level 3 | | Total |
| |
| Short-Term Investments | | $ | — | | | $ | 199,738,306 | | | $ | — | | | $ | 199,738,306 | |
| |
NOTE 4—Security Transactions with Affiliated Funds
The Fund is permitted to purchase or sell securities from or to certain other Invesco Funds under specified conditions outlined in procedures adopted by the Board of Trustees of the Trust. The procedures have been designed to ensure that any purchase or sale of securities by the Fund from or to another fund or portfolio that is or could be considered an affiliate by virtue of having a common investment adviser (or affiliated investment advisers), common Trustees and/or common officers complies with Rule 17a-7 of the 1940 Act. Further, as defined under the procedures, each transaction is effected at the current market price. Pursuant to these procedures, for the year ended December 31, 2011, the Fund engaged in securities purchases of $4,855,750.
Invesco V.I. Money Market Fund
NOTE 5—Trustees’ and Officers’ Fees and Benefits
“Trustees’ and Officers’ Fees and Benefits” include amounts accrued by the Fund to pay remuneration to certain Trustees and Officers of the Fund. Trustees have the option to defer compensation payable by the Fund, and “Trustees’ and Officers’ Fees and Benefits” also include amounts accrued by the Fund to fund such deferred compensation amounts. Those Trustees who defer compensation have the option to select various Invesco Funds in which their deferral accounts shall be deemed to be invested. Finally, certain current Trustees are eligible to participate in a retirement plan that provides for benefits to be paid upon retirement to Trustees over a period of time based on the number of years of service. The Fund may have certain former Trustees who also participate in a retirement plan and receive benefits under such plan. “Trustees’ and Officers’ Fees and Benefits” include amounts accrued by the Fund to fund such retirement benefits. Obligations under the deferred compensation and retirement plans represent unsecured claims against the general assets of the Fund.
During the year ended December 31, 2011, the Fund paid legal fees of $1,187 for services rendered by Kramer, Levin, Naftalis & Frankel LLP as counsel to the Independent Trustees. A partner of that firm is a Trustee of the Trust.
NOTE 6—Cash Balances
The Fund is permitted to temporarily carry a negative or overdrawn balance in its account with The Bank of New York Mellon, the custodian bank. To compensate the custodian bank for such overdrafts, the overdrawn Fund may either (1) leave funds as a compensating balance in the account so the custodian bank can be compensated by earning the additional interest; or (2) compensate by paying the custodian bank at a rate agreed upon by the custodian bank and Invesco, not to exceed the contractually agreed upon rate.
NOTE 7—Distributions to Shareholders and Tax Components of Net Assets
Tax Character of Distributions to Shareholders Paid During the Years Ended December 31, 2011 and 2010:
| | | | | | | | | |
| | | 2011 | | 2010 |
| |
| Ordinary income | | $ | 53,933 | | | $ | 55,671 | |
| |
Tax Components of Net Assets at Period-End:
| | | | | |
| | | 2011 |
| |
| Undistributed ordinary income | | $ | 44,802 | |
| |
| Temporary book/tax differences | | | (47,298 | ) |
| |
| Capital loss carryforward | | | (2,143 | ) |
| |
| Shares of beneficial interest | | | 199,559,407 | |
| |
| Total net assets | | $ | 199,554,768 | |
| |
The temporary book/tax differences are a result of timing differences between book and tax recognition of income and/or expenses. The Fund’s temporary book/tax differences are the result of the trustee deferral of compensation and retirement plan benefits.
Capital loss carryforward is calculated and reported as of a specific date. Results of transactions and other activity after that date may affect the amount of capital loss carryforward actually available for the Fund to utilize. The Regulated Investment Company Modernization Act of 2010 (the “Act”) eliminated the eight-year carryover period for capital losses that arise in taxable years beginning after its enactment date of December 22, 2010. Consequently, these capital losses can be carried forward for an unlimited period. However, capital losses with an expiration period may not be used to offset capital gains until all net capital losses without an expiration date have been utilized. Additionally, post-enactment capital loss carryovers will retain their character as either short-term or long-term capital losses instead of as short-term capital losses as under prior law. The ability to utilize capital loss carryforward in the future may be limited under the Internal Revenue Code and related regulations based on the results of future transactions.
The Fund has a capital loss carryforward as of December 31, 2011, which expires as follows:
| | | | | |
| Capital Loss Carryforward* |
| Expiration | | Short-Term |
| |
| December 31, 2018 | | $ | 2,143 | |
| |
| |
| * | Capital loss carryforward as of the date listed above is reduced for limitations, if any, to the extent required by the Internal Revenue Code. |
NOTE 8—Reclassification of Permanent Differences
Primarily as a result of differing book/tax treatment of distributions, on December 31, 2011, undistributed net investment income decreased by $2,496 and shares of beneficial interest increased by $2,496. This reclassification had no effect on the net assets of the Fund.
Invesco V.I. Money Market Fund
NOTE 9—Share Information
| | | | | | | | | | | | | | | | | |
| | | Summary of Share Activity |
| |
| | | Years ended December 31, |
| | | 2011(a) | | 2010 |
| | | Shares | | Amount | | Shares | | Amount |
| |
| Sold: | | | | | | | | | | | | | | | | |
| Series I | | | 255,614,975 | | | $ | 255,614,975 | | | | 9,579,686 | | | $ | 9,579,686 | |
| |
| Series II | | | 171,905 | | | | 171,905 | | | | 36,103 | | | | 36,103 | |
| |
| Issued as reinvestment of dividends: | | | | | | | | | | | | | | | | |
| Series I | | | 11,674 | | | | 11,674 | | | | 53,205 | | | | 53,205 | |
| |
| Series II | | | 496 | | | | 496 | | | | 2,466 | | | | 2,466 | |
| |
| Reacquired: | | | | | | | | | | | | | | | | |
| Series I | | | (82,672,269 | ) | | | (82,672,269 | ) | | | (17,538,125 | ) | | | (17,538,125 | ) |
| |
| Series II | | | (174,630 | ) | | | (174,630 | ) | | | (703,739 | ) | | | (703,739 | ) |
| |
| Net increase (decrease) in share activity | | | 172,952,151 | | | $ | 172,952,151 | | | | (8,570,404 | ) | | $ | (8,570,404 | ) |
| |
| | |
| (a) | | 89% of the outstanding shares of the Fund are owned by affiliated mutual funds. Affiliated mutual funds are other mutual funds that are also advised by Invesco. |
NOTE 10—Financial Highlights
The following schedule presents financial highlights for a share of the Fund outstanding throughout the periods indicated.
| | | | | | | | | | | | | | | | | | | | | | | | | | | | | | | | | | | | | | | | | | | | | |
| | | | | | | | | | | | | | | | | | | Ratio of
| | Ratio of
| | |
| | | | | | | | | | | | | | | | | | | expenses
| | expenses
| | |
| | | | | | | | | | | | | | | | | | | to average
| | to average net
| | Ratio of net
|
| | | Net asset
| | | | | | | | Dividends
| | | | | | | | net assets
| | assets without
| | investment
|
| | | value,
| | Net
| | Net realized
| | Total from
| | from net
| | Net asset
| | | | Net assets,
| | with fee waivers
| | fee waivers
| | income
|
| | | beginning
| | investment
| | gains (losses)
| | investment
| | investment
| | value, end
| | Total
| | end of period
| | and/or expenses
| | and/or expenses
| | to average
|
| | | of period | | income | | on securities | | operations | | income | | of period | | Return(a) | | (000s omitted) | | absorbed | | absorbed | | net assets |
| |
| Series I |
| Year ended 12/31/11 | | $ | 1.00 | | | $ | 0.00 | (b) | | $ | — | | | $ | 0.00 | | | $ | (0.00 | ) | | $ | 1.00 | | | | 0.05 | % | | $ | 198,533 | | | | 0.17 | %(c) | | | 0.57 | %(c) | | | 0.05 | %(c) |
| Year ended 12/31/10 | | | 1.00 | | | | 0.00 | (b) | | | (0.00 | ) | | | 0.00 | | | | (0.00 | ) | | | 1.00 | | | | 0.18 | | | | 25,578 | | | | 0.16 | | | | 1.01 | | | | 0.18 | |
| Year ended 12/31/09 | | | 1.00 | | | | 0.00 | (b) | | | — | | | | 0.00 | | | | (0.00 | ) | | | 1.00 | | | | 0.11 | | | | 33,486 | | | | 0.65 | | | | 0.90 | | | | 0.11 | |
| Year ended 12/31/08 | | | 1.00 | | | | 0.02 | (b) | | | — | | | | 0.02 | | | | (0.02 | ) | | | 1.00 | | | | 2.04 | | | | 49,004 | | | | 0.86 | | | | 0.86 | | | | 2.02 | |
| Year ended 12/31/07 | | | 1.00 | | | | 0.04 | | | | — | | | | 0.04 | | | | (0.04 | ) | | | 1.00 | | | | 4.54 | | | | 46,492 | | | | 0.86 | | | | 0.86 | | | | 4.45 | |
| |
| Series II |
| Year ended 12/31/11 | | | 1.00 | | | | 0.00 | (b) | | | — | | | | 0.00 | | | | (0.00 | ) | | | 1.00 | | | | 0.05 | | | | 1,022 | | | | 0.17 | (c) | | | 0.82 | (c) | | | 0.05 | (c) |
| Year ended 12/31/10 | | | 1.00 | | | | 0.00 | (b) | | | (0.00 | ) | | | 0.00 | | | | (0.00 | ) | | | 1.00 | | | | 0.18 | | | | 1,024 | | | | 0.16 | | | | 1.26 | | | | 0.18 | |
| Year ended 12/31/09 | | | 1.00 | | | | 0.00 | (b) | | | — | | | | 0.00 | | | | (0.00 | ) | | | 1.00 | | | | 0.06 | | | | 1,690 | | | | 0.70 | | | | 1.15 | | | | 0.06 | |
| Year ended 12/31/08 | | | 1.00 | | | | 0.02 | (b) | | | — | | | | 0.02 | | | | (0.02 | ) | | | 1.00 | | | | 1.78 | | | | 2,266 | | | | 1.11 | | | | 1.11 | | | | 1.77 | |
| Year ended 12/31/07 | | | 1.00 | | | | 0.04 | | | | — | | | | 0.04 | | | | (0.04 | ) | | | 1.00 | | | | 4.28 | | | | 2,515 | | | | 1.11 | | | | 1.11 | | | | 4.20 | |
| |
| | |
| (a) | | Includes adjustments in accordance with accounting principles generally accepted in the United States of America. Total returns are not annualized for periods less than one year, if applicable and do not reflect charges assessed in connection with a variable product, which if included would reduce total returns. |
| (b) | | Calculated using average shares outstanding. |
| (c) | | Ratios are based on average daily net assets (000’s) of $104,664 and $1,014 for Series I and Series II shares, respectively. |
Invesco V.I. Money Market Fund
Report of Independent Registered Public Accounting Firm
To the Board of Trustees of AIM Variable Insurance Funds (Invesco Variable Insurance Funds)
and Shareholders of Invesco V.I. Money Market Fund:
In our opinion, the accompanying statement of assets and liabilities, including the schedule of investments, and the related statements of operations and of changes in net assets and the financial highlights present fairly, in all material respects, the financial position of Invesco V.I. Money Market Fund (one of the funds constituting AIM Variable Insurance Funds (Invesco Variable Insurance Funds), hereafter referred to as the “Fund”) at December 31, 2011, the results of its operations for the year then ended, the changes in its net assets for each of the two years in the period then ended and the financial highlights for each of the five years in the period then ended, in conformity with accounting principles generally accepted in the United States of America. These financial statements and financial highlights (hereafter referred to as “financial statements”) are the responsibility of the Fund’s management; our responsibility is to express an opinion on these financial statements based on our audits. We conducted our audits of these financial statements in accordance with the standards of the Public Company Accounting Oversight Board (United States). Those standards require that we plan and perform the audits to obtain reasonable assurance about whether the financial statements are free of material misstatement. An audit includes examining, on a test basis, evidence supporting the amounts and disclosures in the financial statements, assessing the accounting principles used and significant estimates made by management, and evaluating the overall financial statement presentation. We believe that our audits, which included confirmation of securities at December 31, 2011 by correspondence with the custodian and brokers, provide a reasonable basis for our opinion.
PRICEWATERHOUSECOOPERS LLP
February 14, 2012
Houston, Texas
Invesco V.I. Money Market Fund
Calculating your ongoing Fund expenses
Example
As a shareholder of the Fund, you incur ongoing costs, including management fees; distribution and/or service fees (12b-1); and other Fund expenses. This example is intended to help you understand your ongoing costs (in dollars) of investing in the Fund and to compare these costs with ongoing costs of investing in other mutual funds. The example is based on an investment of $1,000 invested at the beginning of the period and held for the entire period July 1, 2011 through December 31, 2011.
The actual and hypothetical expenses in the examples below do not represent the effect of any fees or other expenses assessed in connection with a variable product; if they did, the expenses shown would be higher while the ending account values shown would be lower.
Actual expenses
The table below provides information about actual account values and actual expenses. You may use the information in this table, together with the amount you invested, to estimate the expenses that you paid over the period. Simply divide your account value by $1,000 (for example, an $8,600 account value divided by $1,000 = 8.6), then multiply the result by the number in the table under the heading entitled “Actual Expenses Paid During Period” to estimate the expenses you paid on your account during this period.
Hypothetical example for comparison purposes
The table below also provides information about hypothetical account values and hypothetical expenses based on the Fund’s actual expense ratio and an assumed rate of return of 5% per year before expenses, which is not the Fund’s actual return.
The hypothetical account values and expenses may not be used to estimate the actual ending account balance or expenses you paid for the period. You may use this information to compare the ongoing costs of investing in the Fund and other funds. To do so, compare this 5% hypothetical example with the 5% hypothetical examples that appear in the shareholder reports of the other funds.
Please note that the expenses shown in the table are meant to highlight your ongoing costs. Therefore, the hypothetical information is useful in comparing ongoing costs, and will not help you determine the relative total costs of owning different funds.
| | | | | | | | | | | | | | | | | | | | | | | | | | | | | | | |
| | | | | | | | | | HYPOTHETICAL
| | | |
| | | | | | | | | | (5% annual return before
| | | |
| | | | | | | ACTUAL | | | expenses) | | | |
| | | | Beginning
| | | Ending
| | | Expenses
| | | Ending
| | | Expenses
| | | Annualized
|
| | | | Account Value
| | | Account Value
| | | Paid During
| | | Account Value
| | | Paid During
| | | Expense
|
| Class | | | (07/01/11) | | | (12/31/11)1 | | | Period2 | | | (12/31/11) | | | Period2 | | | Ratio |
| Series I | | | $ | 1,000.00 | | | | $ | 1,000.30 | | | | $ | 0.86 | | | | $ | 1,024.35 | | | | $ | 0.87 | | | | | 0.17 | % |
| | | | | | | | | | | | | | | | | | | | | | | | | | | | | | | |
| Series II | | | | 1,000.00 | | | | | 1,000.30 | | | | | 0.86 | | | | | 1,024.35 | | | | | 0.87 | | | | | 0.17 | |
| | | | | | | | | | | | | | | | | | | | | | | | | | | | | | | |
| |
| 1 | The actual ending account value is based on the actual total return of the Fund for the period July 1, 2011 through December 31, 2011, after actual expenses and will differ from the hypothetical ending account value which is based on the Fund’s expense ratio and a hypothetical annual return of 5% before expenses. |
| 2 | Expenses are equal to the Fund’s annualized expense ratio as indicated above multiplied by the average account value over the period, multiplied by 184/365 to reflect the most recent fiscal half year. |
Invesco V.I. Money Market Fund
Form 1099-DIV, Form 1042-S and other year-end tax information provide shareholders with actual calendar year amounts that should be included in their tax returns. Shareholders should consult their tax advisors.
The following distribution information is being provided as required by the Internal Revenue Code or to meet a specific state’s requirement.
The Fund designates the following amounts or, if subsequently determined to be different, the maximum amount allowable for its fiscal year ended December 31, 2011:
| | | | | |
Federal and State Income Tax | | |
| |
| Corporate Dividends Received Deduction* | | | 0% | |
| | |
| | * | The above percentages are based on ordinary income dividends paid to shareholders during the Fund’s fiscal year. |
Invesco V.I. Money Market Fund
Trustees and Officers
The address of each trustee and officer is AIM Variable Insurance Funds (Invesco Variable Insurance Funds) (the “Trust”), 11 Greenway Plaza, Suite 2500, Houston, Texas 77046-1173. The trustees serve for the life of the Trust, subject to their earlier death, incapacitation, resignation, retirement or removal as more specifically provided in the Trust’s organizational documents. Each officer serves for a one year term or until their successors are elected and qualified. Column two below includes length of time served with predecessor entities, if any.
| | | | | | | | | |
Name, Year of Birth and
| | Trustee and/
| | Principal Occupation(s)
| | Number of Funds
| | Other Directorship(s)
|
| Position(s) Held with the Trust | | or Officer Since | | During Past 5 Years | | in Fund Complex Overseen by Trustee | | Held by Trustee |
| | | | | | | | | |
| | | | | | | | | |
| | | | | | | | | |
| Interested Persons | | | | | | | | |
| | | | | | | | | |
| | | | | | | | | |
| | | | | | | | | |
Martin L. Flanagan1 — 1960
Trustee | | 2007 | | Executive Director, Chief Executive Officer and President, Invesco Ltd. (ultimate parent of Invesco and a global investment management firm); Advisor to the Board, Invesco Advisers, Inc. (formerly known as Invesco Institutional (N.A.), Inc.); Trustee, The Invesco Funds; Vice Chair, Investment Company Institute; and Member of Executive Board, SMU Cox School of Business
Formerly: Chairman, Invesco Advisers, Inc. (registered investment adviser); Director, Chairman, Chief Executive Officer and President, IVZ Inc. (holding company), INVESCO Group Services, Inc. (service provider) and Invesco North American Holdings, Inc. (holding company); Director, Chief Executive Officer and President, Invesco Holding Company Limited (parent of Invesco and a global investment management firm); Director, Invesco Ltd.; Chairman, Investment Company Institute and President, Co-Chief Executive Officer, Co-President, Chief Operating Officer and Chief Financial Officer, Franklin Resources, Inc. (global investment management organization) | | 140 | | None |
| | | | | | | | | |
| | | | | | | | | |
| | | | | | | | | |
Philip A. Taylor2 — 1954
Trustee, President and Principal Executive Officer | | 2006 | | Head of North American Retail and Senior Managing Director, Invesco Ltd.; Director, Co-Chairman, Co-President and Co-Chief Executive Officer, Invesco Advisers, Inc. (formerly known as Invesco Institutional (N.A.), Inc.) (registered investment adviser); Director, Chairman, Chief Executive Officer and President, Invesco Management Group, Inc. (formerly Invesco Aim Management Group, Inc.) (financial services holding company); Director and President, INVESCO Funds Group, Inc. (registered investment adviser and registered transfer agent); Director and Chairman, Invesco Investment Services, Inc. (formerly known as Invesco Aim Investment Services, Inc.) (registered transfer agent) and IVZ Distributors, Inc. (formerly known as INVESCO Distributors, Inc.) (registered broker dealer); Director, President and Chairman, Invesco Inc. (holding company) and Invesco Canada Holdings Inc. (holding company); Chief Executive Officer, Invesco Corporate Class Inc. (corporate mutual fund company) and Invesco Canada Fund Inc. (corporate mutual fund company); Director, Chairman and Chief Executive Officer, Invesco Canada Ltd. (formerly known as Invesco Trimark Ltd./Invesco Trimark Ltèe) (registered investment adviser and registered transfer agent); Trustee, President and Principal Executive Officer, The Invesco Funds (other than AIM Treasurer’s Series Trust (Invesco Treasurer’s Series Trust) and Short-Term Investments Trust); Trustee and Executive Vice President, The Invesco Funds (AIM Treasurer’s Series Trust (Invesco Treasurer’s Series Trust) and Short-Term Investments Trust only); Director, Invesco Investment Advisers LLC (formerly known as Van Kampen Asset Management); Director, Chief Executive Officer and President, Van Kampen Exchange Corp. | | 140 | | None |
| | | | | Formerly: Director and Chairman, Van Kampen Investor Services Inc.: Director, Chief Executive Officer and President, 1371 Preferred Inc. (holding company); and Van Kampen Investments Inc.; Director and President, AIM GP Canada Inc. (general partner for limited partnerships); and Van Kampen Advisors, Inc.; Director and Chief Executive Officer, Invesco Trimark Dealer Inc. (registered broker dealer); Director, Invesco Distributors, Inc. (formerly known as Invesco Aim Distributors, Inc.) (registered broker dealer); Manager, Invesco PowerShares Capital Management LLC; Director, Chief Executive Officer and President, Invesco Advisers, Inc.; Director, Chairman, Chief Executive Officer and President, Invesco Aim Capital Management, Inc.; President, Invesco Trimark Dealer Inc. and Invesco Trimark Ltd./Invesco Trimark Ltèe; Director and President, AIM Trimark Corporate Class Inc. and AIM Trimark Canada Fund Inc.; Senior Managing Director, Invesco Holding Company Limited; Trustee and Executive Vice President, Tax-Free Investments Trust; Director and Chairman, Fund Management Company (former registered broker dealer); President and Principal Executive Officer, The Invesco Funds (AIM Treasurer’s Series Trust (Invesco Treasurer’s Series Trust), Short-Term Investments Trust and Tax-Free Investments Trust only); President, AIM Trimark Global Fund Inc. and AIM Trimark Canada Fund Inc. | | | | |
| | | | | | | | | |
| | | | | | | | | |
| | | | | | | | | |
Wayne W. Whalen3 — 1939
Trustee | | 2010 | | Of Counsel, and prior to 2010, partner in the law firm of Skadden, Arps, Slate, Meagher & Flom LLP, legal counsel to funds in the Fund Complex | | 158 | | Director of the Abraham Lincoln Presidential Library Foundation |
| | | | | | | | | |
| |
| 1 | Mr. Flanagan is considered an interested person of the Trust because he is an officer of the adviser to the Trust, and an officer and a director of Invesco Ltd., ultimate parent of the adviser to the Trust. |
| 2 | Mr. Taylor is considered an interested person of the Trust because he is an officer and a director of the adviser to, and a director of the principal underwriter of, the Trust. |
| 3 | Mr. Whalen is considered an “interested person” (within the meaning of Section 2(a)(19) of the 1940 Act) of certain Funds in the Fund Complex by reason of he and his firm currently providing legal services as legal counsel to such Funds in the Fund Complex. |
Invesco V.I. Money Market Fund
Trustees and Officers—(continued)
The address of each trustee and officer is AIM Variable Insurance Funds (Invesco Variable Insurance Funds) (the “Trust”), 11 Greenway Plaza, Suite 2500, Houston, Texas 77046-1173. The trustees serve for the life of the Trust, subject to their earlier death, incapacitation, resignation, retirement or removal as more specifically provided in the Trust’s organizational documents. Each officer serves for a one year term or until their successors are elected and qualified. Column two below includes length of time served with predecessor entities, if any.
| | | | | | | | | |
Name, Year of Birth and
| | Trustee and/
| | Principal Occupation(s)
| | Number of Funds
| | |
| Position(s) Held with the Trust | | or Officer Since | | During Past 5 Years | | in Fund Complex Overseen by Trustee | | Other Directorship(s) Held by Trustee |
| | | | | | | | | |
| | | | | | | | | |
| | | | | | | | | |
| Independent Trustees | | | | | | | | |
| | | | | | | | | |
| | | | | | | | | |
| | | | | | | | | |
Bruce L. Crockett — 1944
Trustee and Chair | | 1993 | | Chairman, Crockett Technology Associates (technology consulting company)
Formerly: Director, Captaris (unified messaging provider); Director, President and Chief Executive Officer COMSAT Corporation; and Chairman, Board of Governors of INTELSAT (international communications company) | | 140 | | ACE Limited (insurance company); and Investment Company Institute |
| | | | | | | | | |
| | | | | | | | | |
| | | | | | | | | |
David C. Arch — 1945
Trustee | | 2010 | | Chairman and Chief Executive Officer of Blistex Inc., a consumer health care products manufacturer. | | 158 | | Member of the Heartland Alliance Advisory Board, a nonprofit organization serving human needs based in Chicago. Board member of the Illinois Manufacturers’ Association. Member of the Board of Visitors, Institute for the Humanities, University of Michigan |
| | | | | | | | | |
| | | | | | | | | |
| | | | | | | | | |
Frank S. Bayley — 1939
Trustee | | 2001 | | Retired
Formerly: Director, Badgley Funds, Inc. (registered investment company) (2 portfolios) and Partner, law firm of Baker & McKenzie
Formerly: Director, Badgley Funds, Inc. (registered investment company) (2 portfolios) and Partner, law firm of Baker & McKenzie | | 140 | | Director and Chairman, C.D. Stimson Company (a real estate investment company) |
| | | | | | | | | |
| | | | | | | | | |
| | | | | | | | | |
James T. Bunch — 1942
Trustee | | 2004 | | Managing Member, Grumman Hill Group LLC (family office private equity management)
Formerly: Founder, Green, Manning & Bunch Ltd. (investment banking firm)(1988-2010); Executive Committee, United States Golf Association; and Director, Policy Studies, Inc. and Van Gilder Insurance Corporation | | 140 | | Vice Chairman, Board of Governors, Western Golf Association/Evans Scholars Foundation and Director, Denver Film Society |
| | | | | | | | | |
| | | | | | | | | |
| | | | | | | | | |
Rodney F. Dammeyer — 1940
Trustee | | 2010 | | President of CAC, LLC, a private company offering capital investment and management advisory services.
Formerly: Prior to January 2004, Director of TeleTech Holdings Inc.; Prior to 2002, Director of Arris Group, Inc.; Prior to 2001, Managing Partner at Equity Group Corporate Investments. Prior to 1995, Vice Chairman of Anixter International. Prior to 1985, experience includes Senior Vice President and Chief Financial Officer of Household International, Inc., Executive Vice President and Chief Financial Officer of Northwest Industries, Inc. and Partner of Arthur Andersen & Co. | | 158 | | Director of Quidel Corporation and Stericycle, Inc. Prior to May 2008, Trustee of The Scripps Research Institute. Prior to February 2008, Director of Ventana Medical Systems, Inc. Prior to April 2007, Director of GATX Corporation. Prior to April 2004, Director of TheraSense, Inc. |
| | | | | | | | | |
| | | | | | | | | |
| | | | | | | | | |
Albert R. Dowden — 1941
Trustee | | 2000 | | Director of a number of public and private business corporations, including the Boss Group, Ltd. (private investment and management); Reich & Tang Funds (5 portfolios) (registered investment company); and Homeowners of America Holding Corporation/ Homeowners of America Insurance Company (property casualty company)
Formerly: Director, Continental Energy Services, LLC (oil and gas pipeline service); Director, CompuDyne Corporation (provider of product and services to the public security market) and Director, Annuity and Life Re (Holdings), Ltd. (reinsurance company); Director, President and Chief Executive Officer, Volvo Group North America, Inc.; Senior Vice President, AB Volvo; Director of various public and private corporations; Chairman, DHJ Media, Inc.; Director Magellan Insurance Company; and Director, The Hertz Corporation, Genmar Corporation (boat manufacturer), National Media Corporation; Advisory Board of Rotary Power International (designer, manufacturer, and seller of rotary power engines); and Chairman, Cortland Trust, Inc. (registered investment company) | | 140 | | Board of Nature’s Sunshine Products, Inc. |
| | | | | | | | | |
| | | | | | | | | |
| | | | | | | | | |
Jack M. Fields — 1952
Trustee | | 1997 | | Chief Executive Officer, Twenty First Century Group, Inc. (government affairs company); and Owner and Chief Executive Officer, Dos Angelos Ranch, L.P. (cattle, hunting, corporate entertainment), Discovery Global Education Fund (non-profit) and Cross Timbers Quail Research Ranch (non-profit)
Formerly: Chief Executive Officer, Texana Timber LP (sustainable forestry company) and member of the U.S. House of Representatives | | 140 | | Administaff |
| | | | | | | | | |
| | | | | | | | | |
| | | | | | | | | |
Carl Frischling — 1937
Trustee | | 1993 | | Partner, law firm of Kramer Levin Naftalis and Frankel LLP | | 140 | | Director, Reich & Tang Funds (16 portfolios) |
| | | | | | | | | |
| | | | | | | | | |
| | | | | | | | | |
Prema Mathai-Davis — 1950
Trustee | | 1998 | | Retired
Formerly: Chief Executive Officer, YWCA of the U.S.A. | | 140 | | None |
| | | | | | | | | |
| | | | | | | | | |
| | | | | | | | | |
Larry Soll — 1942
Trustee | | 2004 | | Retired
Formerly, Chairman, Chief Executive Officer and President, Synergen Corp. (a biotechnology company) | | 140 | | None |
| | | | | | | | | |
| | | | | | | | | |
| | | | | | | | | |
Hugo F. Sonnenschein — 1940
Trustee | | 2010 | | President Emeritus and Honorary Trustee of the University of Chicago and the Adam Smith Distinguished Service Professor in the Department of Economics at the University of Chicago. Prior to July 2000, President of the University of Chicago. | | 158 | | Trustee of the University of Rochester and a member of its investment committee. Member of the National Academy of Sciences, the American Philosophical Society and a fellow of the American Academy of Arts and Sciences |
| | | | | | | | | |
| | | | | | | | | |
| | | | | | | | | |
Raymond Stickel, Jr. — 1944
Trustee | | 2005 | | Retired
Formerly: Director, Mainstay VP Series Funds, Inc. (25 portfolios) and Partner, Deloitte & Touche | | 140 | | None |
| | | | | | | | | |
Invesco V.I. Money Market Fund
Trustees and Officers—(continued)
The address of each trustee and officer is AIM Variable Insurance Funds (Invesco Variable Insurance Funds) (the “Trust”), 11 Greenway Plaza, Suite 2500, Houston, Texas 77046-1173. The trustees serve for the life of the Trust, subject to their earlier death, incapacitation, resignation, retirement or removal as more specifically provided in the Trust’s organizational documents. Each officer serves for a one year term or until their successors are elected and qualified. Column two below includes length of time served with predecessor entities, if any.
| | | | | | | | | |
Name, Year of Birth and
| | Trustee and/
| | Principal Occupation(s)
| | Number of Funds
| | Other Directorship(s)
|
| Position(s) Held with the Trust | | or Officer Since | | During Past 5 Years | | in Fund Complex Overseen by Trustee | | Held by Trustee |
| | | | | | | | | |
| | | | | | | | | |
| | | | | | | | | |
| Other Officers | | | | | | | | |
| | | | | | | | | |
| | | | | | | | | |
| | | | | | | | | |
Russell C. Burk — 1958
Senior Vice President and Senior Officer | | 2005 | | Senior Vice President and Senior Officer, The Invesco Funds | | N/A | | N/A |
| | | | | | | | | |
| | | | | | | | | |
| | | | | | | | | |
John M. Zerr — 1962
Senior Vice President, Chief Legal Officer and Secretary | | 2006 | | Director, Senior Vice President, Secretary and General Counsel, Invesco Management Group, Inc. (formerly known as Invesco Aim Management Group, Inc.) and Van Kampen Exchange Corp.; Senior Vice President, Invesco Advisers, Inc. (formerly known as Invesco Institutional (N.A.), Inc.) (registered investment adviser); Senior Vice President and Secretary, Invesco Distributors, Inc. (formerly known as Invesco Aim Distributors, Inc.); Director, Vice President and Secretary, Invesco Investment Services, Inc. (formerly known as Invesco Aim Investment Services, Inc.) and IVZ Distributors, Inc. (formerly known as INVESCO Distributors, Inc.); Director and Vice President, INVESCO Funds Group, Inc.; Senior Vice President, Chief Legal Officer and Secretary, The Invesco Funds; Manager, Invesco PowerShares Capital Management LLC; Director, Secretary and General Counsel, Invesco Investment Advisers LLC (formerly known as Van Kampen Asset Management); Secretary and General Counsel, Van Kampen Funds Inc. and Chief Legal Officer, PowerShares Exchange-Traded Fund Trust, PowerShares Exchange-Traded Fund Trust II, PowerShares India Exchange-Traded Fund Trust and PowerShares Actively Managed Exchange-Traded Fund Trust
Formerly: Director and Secretary, Van Kampen Advisors Inc.; Director Vice President, Secretary and General Counsel Van Kampen Investor Services Inc.; Director, Invesco Distributors, Inc. (formerly known as Invesco Aim Distributors, Inc.); Director, Senior Vice President, General Counsel and Secretary, Invesco Advisers, Inc.; and Van Kampen Investments Inc.; Director, Vice President and Secretary, Fund Management Company; Director, Senior Vice President, Secretary, General Counsel and Vice President, Invesco Aim Capital Management, Inc.; Chief Operating Officer and General Counsel, Liberty Ridge Capital, Inc. (an investment adviser); Vice President and Secretary, PBHG Funds (an investment company) and PBHG Insurance Series Fund (an investment company); Chief Operating Officer, General Counsel and Secretary, Old Mutual Investment Partners (a broker-dealer); General Counsel and Secretary, Old Mutual Fund Services (an administrator) and Old Mutual Shareholder Services (a shareholder servicing center); Executive Vice President, General Counsel and Secretary, Old Mutual Capital, Inc. (an investment adviser); and Vice President and Secretary, Old Mutual Advisors Funds (an investment company) | | N/A | | N/A |
| | | | | | | | | |
| | | | | | | | | |
| | | | | | | | | |
Lisa O. Brinkley — 1959
Vice President | | 2004 | | Global Compliance Director, Invesco Ltd.; Chief Compliance Officer, Invesco Investment Services, Inc.(formerly known as Invesco Aim Investment Services, Inc.); and Vice President, The Invesco Funds
Formerly: Chief Compliance Officer, Invesco Distributors, Inc. (formerly known as Invesco Aim Distributors, Inc.) and Van Kampen Investor Services Inc.; Senior Vice President, Invesco Management Group, Inc.; Senior Vice President and Chief Compliance Officer, Invesco Advisers, Inc. and The Invesco Funds; Vice President and Chief Compliance Officer, Invesco Aim Capital Management, Inc. and Invesco Distributors, Inc.; Vice President, Invesco Investment Services, Inc. and Fund Management Company | | N/A | | N/A |
| | | | | | | | | |
| | | | | | | | | |
| | | | | | | | | |
Sheri Morris — 1964
Vice President, Treasurer and Principal Financial Officer | | 1999 | | Vice President, Treasurer and Principal Financial Officer, The Invesco Funds; Vice President, Invesco Advisers, Inc. (formerly known as Invesco Institutional (N.A.), Inc.) (registered investment adviser).
Formerly: Treasurer, PowerShares Exchange-Traded Fund Trust, PowerShares Exchange-Traded Fund Trust II, PowerShares India Exchange-Traded Fund Trust and PowerShares Actively Managed Exchange-Traded Fund Trust, Vice President, Invesco Advisers, Inc., Invesco Aim Capital Management, Inc. and Invesco Aim Private Asset Management, Inc.; Assistant Vice President and Assistant Treasurer, The Invesco Funds and Assistant Vice President, Invesco Advisers, Inc., Invesco Aim Capital Management, Inc. and Invesco Aim Private Asset Management, Inc. | | N/A | | N/A |
| | | | | | | | | |
| | | | | | | | | |
| | | | | | | | | |
Karen Dunn Kelley — 1960
Vice President | | 1993 | | Head of Invesco’s World Wide Fixed Income and Cash Management Group; Senior Vice President, Invesco Management Group, Inc. (formerly known as Invesco Aim Management Group, Inc.) and Invesco Advisers, Inc. (formerly known as Invesco Institutional (N.A.), Inc.) (registered investment adviser); Executive Vice President, Invesco Distributors, Inc. (formerly known as Invesco Aim Distributors, Inc.); Director, Invesco Mortgage Capital Inc.; Vice President, The Invesco Funds (other than AIM Treasurer’s Series Trust (Invesco Treasurer’s Series Trust) and Short-Term Investments Trust); and President and Principal Executive Officer, The Invesco Funds (AIM Treasurer’s Series Trust (Invesco Treasurer’s Series Trust) and Short-Term Investments Trust only).
Formerly: Senior Vice President, Van Kampen Investments Inc.; Vice President, Invesco Advisers, Inc. (formerly known as Invesco Institutional (N.A.), Inc.); Director of Cash Management and Senior Vice President, Invesco Advisers, Inc. and Invesco Aim Capital Management, Inc.; President and Principal Executive Officer, Tax-Free Investments Trust; Director and President, Fund Management Company; Chief Cash Management Officer, Director of Cash Management, Senior Vice President, and Managing Director, Invesco Aim Capital Management, Inc.; Director of Cash Management, Senior Vice President, and Vice President, Invesco Advisers, Inc. and The Invesco Funds (AIM Treasurer’s Series Trust (Invesco Treasurer’s Series Trust), Short-Term Investments Trust and Tax-Free Investments Trust only) | | N/A | | N/A |
| | | | | | | | | |
| | | | | | | | | |
| | | | | | | | | |
Yinka Akinsola — 1977
Anti-Money Laundering Compliance Officer | | 2011 | | Anti-Money Laundering Compliance Officer, Invesco Advisers, Inc. (formerly known as Invesco Institutional (N.A.), Inc.) (registered investment adviser); Invesco Distributors, Inc. (formerly known as Invesco Aim Distributors, Inc.), Invesco Investment Services, Inc. (formerly known as Invesco Aim Investment Services, Inc.), Invesco Management Group, Inc., The Invesco Funds, Invesco Van Kampen Closed-End Funds, Van Kampen Exchange Corp. and Van Kampen Funds Inc. | | N/A | | N/A |
| | | | | | | | | |
| | | | | | | | | |
| | | | | | | | | |
Todd L. Spillane — 1958
Chief Compliance Officer | | 2006 | | Senior Vice President, Invesco Management Group, Inc. (formerly known as Invesco Aim Management Group, Inc.) and Van Kampen Exchange Corp.; Senior Vice President and Chief Compliance Officer, Invesco Advisers, Inc. (registered investment adviser) (formerly known as Invesco Institutional (N.A.), Inc.); Chief Compliance Officer, The Invesco Funds, INVESCO Private Capital Investments, Inc. (holding company) and Invesco Private Capital, Inc. (registered investment adviser); Vice President, Invesco Distributors, Inc. (formerly known as Invesco Aim Distributors, Inc.) and Invesco Investment Services, Inc. (formerly known as Invesco Aim Investment Services, Inc.).
Formerly: Chief Compliance Officer, Invesco Van Kampen Closed-End Funds PowerShares Exchange-Traded Fund Trust, PowerShares Exchange-Traded Fund Trust II, PowerShares India Exchange-Traded Fund Trust, and PowerShares Actively Managed Exchange-Traded Fund Trust; Senior Vice President, Van Kampen Investments Inc.; Senior Vice President and Chief Compliance Officer, Invesco Advisers, Inc. and Invesco Aim Capital Management, Inc.; Chief Compliance Officer, Invesco Global Asset Management (N.A.), Inc., Invesco Senior Secured Management, Inc. (registered investment adviser) and Van Kampen Investor Services Inc.; Vice President, Invesco Aim Capital Management, Inc. and Fund Management Company | | N/A | | N/A |
| | | | | | | | | |
The Statement of Additional Information of the Trust includes additional information about the Fund’s Trustees and is available upon request, without charge, by calling 1.800.959.4246. Please refer to the Fund’s prospectus for information on the Fund’s sub-advisers.
| | | | | | | |
Office of the Fund
11 Greenway Plaza, Suite 2500
Houston, TX 77046-1173 | | Investment Adviser
Invesco Advisers, Inc.
1555 Peachtree Street, N.E.
Atlanta, GA 30309 | | Distributor
Invesco Distributors, Inc.
11 Greenway Plaza, Suite 2500
Houston, TX 77046-1173 | | Auditors
PricewaterhouseCoopers LLP
1201 Louisiana Street, Suite 2900
Houston, TX 77002-5678 |
| | | | | | | |
| | | | | | | |
Counsel to the Fund
Stradley Ronon Stevens & Young, LLP
2600 One Commerce Square
Philadelphia, PA 19103 | | Counsel to the Independent Trustees
Kramer, Levin, Naftalis & Frankel LLP
1177 Avenue of the Americas
New York, NY 10036-2714 | | Transfer Agent
Invesco Investment Services, Inc.
11 Greenway Plaza, Suite 2500
Houston, TX 77046-1173 | | Custodian
Bank of New York Mellon
2 Hanson Place
Brooklyn, NY 11217-1431 |
Invesco V.I. Money Market Fund
Invesco V.I. S&P 500 Index Fund
Annual Report to Shareholders § December 31, 2011
The Fund provides a complete list of its holdings four times in each fiscal year, at the quarter-ends. For the second and fourth quarters, the lists appear in the Fund’s semiannual and annual reports to shareholders. For the first and third quarters, the Fund files the lists with the Securities and Exchange Commission (SEC) on Form N-Q. The Fund’s Form N-Q filings are available on the SEC website, sec.gov. Copies of the Fund’s Forms N-Q may be reviewed and copied at the SEC Public Reference Room in Washington, D.C. You can obtain information on the operation of the Public Reference Room, including information about duplicating fee charges, by calling 202 551 8090 or 800 732 0330, or by electronic request at the following email address: publicinfo@sec.gov. The SEC file numbers for the Fund are 811-07452 and 033-57340. The Fund’s most recent portfolio holdings, as filed on Form N-Q, have also been made available to insurance companies issuing variable annuity contracts and variable life insurance policies (“variable products”) that invest in the Fund.
A description of the policies and procedures that the Fund uses to determine how to vote proxies relating to portfolio securities is available without charge, upon request, from our Client Services department at 800 959 4246 or at invesco.com/proxyguidelines. The information is also available on the SEC website, sec.gov.
Information regarding how the Fund voted proxies related to its portfolio securities during the 12 months ended June 30, 2011, is available at invesco.com/proxysearch. The information is also available on the SEC website, sec.gov.
Invesco Advisers, Inc. is an investment adviser; it provides investment advisory services to individual and institutional clients and does not sell securities. Invesco Distributors, Inc. is the U.S. distributor for Invesco Ltd.’s retail mutual funds, exchange-traded funds and institutional money market funds. Both are wholly owned, indirect subsidiaries of Invesco Ltd.
This report must be accompanied or preceded by a currently effective Fund prospectus and variable product prospectus, which contain more complete information, including sales charges and expenses. Investors should read each carefully before investing.
Invesco Distributors, Inc.
MS-VISPI-AR-1
| | | | | | | | | |
|
| | | | | | | |
NOT FDIC INSURED | | | MAY LOSE VALUE | | | NO BANK GUARANTEE |
Management’s Discussion of Fund Performance
Performance summary
For the year ended December 31, 2011, Series I shares of Invesco V.I. S&P 500 Index Fund slightly underperformed the S&P 500 Index but slightly outperformed the Lipper VUF S&P 500 Funds Index. The Fund seeks to provide investment results that, before expenses, correspond to the total return (i.e., capital appreciation and current income) of the S&P 500 Index.
Your Fund’s long-term performance appears later in this report.
Fund vs. Indexes
Total returns, 12/31/10 to 12/31/11, excluding variable product issuer charges.
If variable product issuer charges were included, returns would be lower.
| | | | | |
|
| Series I Shares | | | 1.85 | % |
| |
| Series II Shares | | | 1.53 | |
| |
S&P 500 Index▼ (Broad Market/Style-Specific Index) | | | 2.09 | |
| |
Lipper VUF S&P 500 Funds Index▼ (Peer Group Index) | | | 1.77 | |
| |
Source(s): ▼Lipper Inc. | | | | |
As noted in the Fund’s latest semiannual report, the Fund has adopted a three-tier benchmark structure to compare its performance to broad market, style-specific and peer group market measures.
How we invest
The Fund invests in a diversified portfolio of common stocks represented in the S&P 500 Index. The S&P 500 Index is a well-known stock market index that includes common stocks of 500 companies. The Fund generally invests in each stock included in the S&P 500 Index in proportion to its market value or market capitalization. The Fund may invest in foreign securities represented in the S&P 500 Index, including depositary receipts. Changes to the Fund’s portfolio are the result of Standard & Poor’s either adding a security to, or deleting a security from, the S&P 500 Index. Changes are not the result of any stock selection model.
The Fund also may invest in S&P 500 futures contracts. This type of investment is a derivative instrument since the price is derived from one or more underlying assets. The purpose of this investment is to provide full stock market exposure to the Fund’s nominal cash holdings.
Market conditions and your Fund
Market volatility persisted throughout the year ended December 31, 2011. A number of factors adversely affected investor sentiment during the year, including sluggish economic growth and persistently high unemployment in the U.S.; political unrest in the Middle East and northern Africa; and the reemergence of sovereign debt concerns in Greece and other eurozone countries. Following the earthquake and tsunami that struck Japan in March – which caused the loss of life, a disruption in the supply chain and fears of a nuclear catastrophe – many market watchers were surprised that global markets merely stalled, rather than declined significantly.
During the second half of the year, the debate on raising the U.S. debt ceiling began and investor sentiment changed from complacency to concern. The president and Congress eventually reached an agreement to raise the debt ceiling and prevent a federal government default, but not before much political wrangling that left investors unsettled. Following
the agreement, Standard & Poor’s issued its first-ever downgrade of long-term U.S. government debt. This caused the U.S. stock market to fall precipitously from its early-July highs.
The U.S. stock market enjoyed a rally at the end of the reporting period as a full-blown financial contagion emanating from Europe did not materialize. Once eurozone leaders announced plans to more aggressively manage their sovereign debt problems, investors refocused their attention on investment opportunities in the U.S. Economic news at home was positive on balance and supportive of the stock market rally. Unemployment continued to inch lower, inflation remained tame as commodity prices slipped and consumer confidence and spending both increased despite a continued decline in home prices. The Federal Reserve continued to support the recovery by keeping short-term interest rates in a range of zero to 0.25% and by indicating no increase is likely until at least mid-2013.1 In January 2012, after the close of the reporting period, the Fed indicated that it was unlikely to raise short-term interest rates before late 2014.1
On the geopolitical front, the war in Iraq officially ended in December. However, sovereign debt troubles in Europe continued to act as an overhang for the markets. In addition, a slowdown in global demand from China as its economy cooled was also a concern. Lastly, the U.S. debt burden still lingered given the failure of the congressional “super committee” to agree to long-term spending cuts. Despite these issues, the U.S. stock market remained resilient.
Major equity indexes delivered mixed performances, with the S&P 500 Index generating a positive return for the year. For the year, larger capitalization stocks generally outperformed small-cap stocks and growth stocks generally edged value stocks.
Portfolio Composition
By sector
| | | | | |
|
| Information Technology | | | 19.1 | % |
| |
| Financials | | | 13.4 | |
| |
| Energy | | | 12.3 | |
| |
| Health Care | | | 11.9 | |
| |
| Consumer Staples | | | 11.6 | |
| |
| Consumer Discretionary | | | 10.8 | |
| |
| Industrials | | | 10.7 | |
| |
| Utilities | | | 3.9 | |
| |
| Materials | | | 3.6 | |
| |
| Telecommunication Services | | | 3.2 | |
| |
Money Market Funds Plus Other Assets Less Liabilities | | | -0.5 | |
Top 10 Equity Holdings*
| | | | | | | | | |
|
| | 1. | | | Exxon Mobil Corp. | | | 3.6 | % |
| |
| | 2. | | | Apple Inc. | | | 3.3 | |
| |
| | 3. | | | International Business Machines Corp. | | | 1.9 | |
| |
| | 4. | | | Chevron Corp. | | | 1.9 | |
| |
| | 5. | | | Microsoft Corp. | | | 1.7 | |
| |
| | 6. | | | General Electric Co. | | | 1.7 | |
| |
| | 7. | | | Procter & Gamble Co. (The) | | | 1.6 | |
| |
| | 8. | | | AT&T Inc. | | | 1.6 | |
| |
| | 9. | | | Johnson & Johnson | | | 1.6 | |
| |
| | 10. | | | Pfizer Inc. | | | 1.5 | |
Top Five Industries
| | | | | | | | | |
|
| | 1. | | | Integrated Oil & Gas | | | 7.2 | % |
| | 2. | | | Pharmaceuticals | | | 6.3 | |
| | 3. | | | Computer Hardware | | | 4.0 | |
| | 4. | | | Systems Software | | | 2.9 | |
| | 5. | | | Integrated Telecommunication Services | | | 2.9 | |
| | | | |
|
| Total Net Assets | | $100.3 million |
| | | | | |
| Total Number of Holdings* | | | 500 | |
The Fund’s holdings are subject to change, and there is no assurance that the Fund will continue to hold any particular security.
| | |
| * Excluding money market fund holdings. |
Invesco V.I. S&P 500 Index Fund
The Fund stayed true to its process by investing in all components of the S&P 500 Index. Sectors that contributed the most to overall Fund performance were the consumer discretionary, consumer staples, energy, health care and utilities sectors. The financials and materials sectors delivered negative performance and were a drag on the Fund’s overall performance for the reporting period. In addition, the Fund’s allocation to S&P 500 futures contracts was a slight detractor from Fund performance.
In the energy sector, Exxon Mobil was a top contributor to Fund performance. In June 2011, Exxon Mobil acquired Phillips Resources and related company TWP. In October, Exxon Mobil sold its distribution assets in Bolivia, Paraguay and Uruguay.
Also contributing to the Fund’s performance were information technology giants Apple and International Business Machines.
Detracting from Fund performance were select holdings in the financials sector, including Bank of America, Citigroup, Goldman Sachs and JP Morgan Chase. During December 2011, Fitch Ratings downgraded several European and U.S. banks, citing increased challenges in the financial markets. The agency cut by one notch its long-term ratings on Bank of America, Citigroup and Goldman Sachs. Fitch said the banks face challenges from economic developments and a myriad of regulatory changes.
At the close of 2011, many of the issues that plagued markets during the year remained unresolved – and seemed likely to contribute to continued high levels of volatility. In Europe, the sovereign debt crisis showed no signs of abating and appeared to have pushed economies in the region back into recession. While economic data thus far remained more resilient in the U.S., overall growth has clearly slowed across the developed and emerging markets. That said, at the end of 2011, corporate balance sheets remained generally healthy and market valuations were attractive from an historical context.
We would like to caution investors against making investment decisions based on short-term performance.
We welcome new investors who joined the Fund during the year and thank all of our shareholders for your investment in Invesco V.I. S&P 500 Index Fund.
The views and opinions expressed in management’s discussion of Fund performance are those of Invesco Advisers, Inc. These views and opinions are subject to change at any time based on factors such as market and economic conditions. These views and opinions may not be relied upon as investment advice or recommendations, or as an offer for a particular security. The information is not a complete analysis of every aspect of any market, country, industry, security or the Fund. Statements of fact are from sources considered reliable, but Invesco Advisers, Inc. makes no representation or warranty as to their completeness or accuracy. Although historical performance is no guarantee of future results, these insights may help you understand our investment management philosophy.
See important Fund and, if applicable, index disclosures later in this report.
Anthony Munchak
Chartered Financial Analyst, portfolio manager, is manager of Invesco V.I. S&P 500 Index Fund. He joined Invesco in 2000. Mr. Munchak earned a B.S. and M.S. in finance from Boston College and an M.B.A. from Bentley College.
Glen Murphy
Chartered Financial Analyst, portfolio manager, is manager of Invesco V.I. S&P 500 Index Fund. He joined Invesco in 1995. Mr. Murphy earned a B.A. in business administration from the University of Massachusetts at Amherst and an M.S. in finance from Boston College.
Francis Orlando
Chartered Financial Analyst, portfolio manager, is manager of Invesco V.I. S&P 500 Index Fund. He joined Invesco in 1987. Mr. Orlando earned a B.A. in business administration from Merrimack College and an M.B.A. from Boston University.
Daniel Tsai
Chartered Financial Analyst, portfolio manager, is manager of Invesco V.I. S&P 500 Index Fund. He joined Invesco in 2000. He earned a B.S. in mechanical engineering from National Taiwan University and an M.S. in mechanical engineering from the University of Michigan. He also earned an M.S. in computer science from Wayne State University.
Anne Unflat
Portfolio manager, is manager of Invesco V.I. S&P 500 Index Fund. She joined Invesco in 1988. Ms. Unflat graduated magna cum laude from Queens College, where she earned a B.A. in economics. She earned an M.B.A. in finance from St. John’s University.
| | |
| 1 | | Source: U.S. Federal Reserve |
Invesco V.I. S&P 500 Index Fund
Your Fund’s Long-Term Performance
Results of a $10,000 Investment – Oldest Share Class(es)
Fund and index data from 12/31/01*
| |
| * | During the reporting period, Invesco changed its policy regarding growth of $10,000 charts. For funds older than 10 years, we previously showed performance since inception. Going forward, we will show performance for the most recent 10 years, since this more accurately reflects the experience of the typical shareholder. As a result, charts now may include benchmarks that did not appear previously, because the funds’ inception pre-dated the benchmarks’ inception. Also, all charts will now be presented using a linear format. |
Past performance cannot guarantee comparable future results.
As noted earlier in this report, the Fund
has adopted a three-tier benchmark structure to compare its performance to broad market, style-specific and peer
group market measures. These additional benchmarks will now be included in the chart above.
Average Annual Total Returns
As of 12/31/11
| | | | | | | | | |
|
| Series I Shares | | | | |
| |
| Inception (5/18/98) | | | 2.46 | % |
| |
| | 10 | | | Years | | | 2.64 | |
| |
| | 5 | | | Years | | | -0.43 | |
| |
| | 1 | | | Year | | | 1.85 | |
| |
| | | | | | | | | |
| Series II Shares | | | | |
| |
| Inception (6/5/00) | | | -0.01 | % |
| |
| | 10 | | | Years | | | 2.37 | |
| |
| | 5 | | | Years | | | -0.69 | |
| |
| | 1 | | | Year | | | 1.53 | |
| |
Effective June 1, 2010, Class X and Class Y shares of the predecessor fund, Morgan Stanley Variable Investment S&P 500 Index Portfolio advised by Morgan Stanley Investment Advisors Inc. were reorganized into Series I and Series II shares, respectively, of Invesco V.I. S&P 500 Index Fund. Returns shown above for Series I and Series II shares are blended returns of the predecessor fund and Invesco V.I. S&P 500 Index Fund. Share class returns will differ from the predecessor fund because of different expenses.
The performance data quoted represent past performance and cannot
guarantee comparable future results; current performance may be lower or higher. Please contact your variable product issuer or financial adviser for the most recent month-end variable product performance. Performance figures reflect Fund expenses, reinvested distributions and changes in net asset value. Investment return and principal value will fluctuate so that you may have a gain or loss when you sell shares.
The net annual Fund operating expense ratio set forth in the most recent Fund prospectus as of the date of this report for Series I and Series II shares was 0.28% and 0.53%, respectively.1 The total annual Fund operating expense ratio set forth in the most recent Fund prospectus as of the date of this report for Series I and Series II shares was 0.51% and 0.76%, respectively. The expense ratios presented above may vary from the expense ratios presented in other sections of this report that are based on expenses incurred during the period covered by this report.
Invesco V.I. S&P 500 Index Fund, a series portfolio of AIM Variable
Insurance Funds (Invesco Variable Insurance Funds), is currently offered through insurance companies issuing variable products. You cannot purchase shares of the Fund directly. Performance figures given represent the Fund and are not intended to reflect actual variable product values. They do not reflect sales charges, expenses and fees assessed in connection with a variable product. Sales charges, expenses and fees, which are determined by the variable product issuers, will vary and will lower the total return.
The most recent month-end performance data at the Fund level, excluding variable product charges, is available at 800 451 4246. As mentioned above, for the most recent month-end performance including variable product charges, please contact your variable product issuer or financial adviser.
| | |
| 1 | | Total annual Fund operating expenses after any contractual fee waivers and/or expense reimbursements by the adviser in effect through at least June 30, 2012. See current prospectus for more information. |
Invesco V.I. S&P 500 Index Fund
Invesco V.I. S&P 500 Index Fund’s investment objective is to provide investment results that, before expenses, correspond to the total return (i.e., the combination of capital changes and income) of the Standard & Poor’s 500 Composite Stock Price Index.
| n Unless otherwise stated, information presented in this report is as of December 31, 2011, and is based on total net assets. |
| |
| n Unless otherwise noted, all data provided by Invesco. |
| n To access your Fund’s reports/prospectus, visit invesco.com/fundreports. |
Principal risks of investing in the Fund
Equity risk. A principal risk of investing in the Fund is associated with its common stock investments. In general, stock values fluctuate in response to activities specific to the company as well as general market, economic and political conditions. Stock prices can fluctuate widely in response to these factors.
Index risk. The Fund is operated as a passively managed index fund. As such, the adverse performance of a particular stock ordinarily will not result in the elimination of the stock from the Fund’s portfolio. The Fund will remain invested in common stocks even when stock prices are generally falling. Ordinarily, the Adviser will not sell the Fund’s portfolio securities except to reflect additions or deletions of the stocks that comprise the S&P 500 Index, or as may be necessary to raise cash to pay Fund shareholders who sell Fund shares. The Fund’s ability to correlate its performance, before expenses, with the S&P 500 Index may be affected by, among other things, changes in securities markets, the manner in which the S&P 500 Index is calculated and the timing of purchases and sales, and also depends to some extent on the size of the Fund’s portfolio, the size of cash flows into and out of the Fund and differences between how and when the Fund and the Index are valued.
About indexes used in this report
The S&P 500® Index is an unmanaged index considered representative of the U.S. stock market.
The Lipper VUF S&P 500 Funds Index is an unmanaged index considered representative of the S&P 500 variable insurance underlying funds tracked by Lipper.
A direct investment cannot be made in an index. Unless otherwise indicated, index results include reinvested dividends, and they do not reflect sales charges. Performance of the peer group, if applicable, reflects fund expenses; performance of a market index does not.
Other information
The Chartered Financial Analyst® (CFA®) designation is globally recognized and attests to a charterholder’s success in a rigorous and comprehensive study program in the field of investment management and research analysis.
Industry classifications used in this report are generally according to the Global Industry Classification Standard, which was developed by and is the exclusive property and a service mark of MSCI Inc. and Standard & Poor’s.
The returns shown in management’s discussion of Fund performance are based on net asset values calculated for shareholder transactions. Generally accepted accounting principles require adjustments to be made to the net assets of the Fund at period end for financial reporting purposes, and as such, the net asset values for shareholder transactions and the returns based on those net asset values may differ from the net asset values and returns reported in the Financial Highlights. Additionally, the returns and net asset values shown throughout this report are at the Fund level only and do not include variable product issuer charges. If such charges were included, the total returns would be lower.
Invesco V.I. S&P 500 Index Fund
Schedule of Investments(a)
December 31, 2011
| | | | | | | | | |
| | | Shares | | Value |
| |
Common Stocks & Other Equity Interests–100.49%
| | | | |
Advertising–0.15%
| | | | |
| Interpublic Group of Cos., Inc. (The) | | | 4,083 | | | $ | 39,727 | |
| |
| Omnicom Group Inc. | | | 2,458 | | | | 109,578 | |
| |
| | | | | | | | 149,305 | |
| |
Aerospace & Defense–2.68%
| | | | |
| Boeing Co. (The) | | | 6,581 | | | | 482,716 | |
| |
| General Dynamics Corp. | | | 3,153 | | | | 209,391 | |
| |
| Goodrich Corp. | | | 1,108 | | | | 137,060 | |
| |
| Honeywell International Inc. | | | 6,849 | | | | 372,243 | |
| |
| L-3 Communications Holdings, Inc. | | | 878 | | | | 58,545 | |
| |
| Lockheed Martin Corp. | | | 2,349 | | | | 190,034 | |
| |
| Northrop Grumman Corp. | | | 2,298 | | | | 134,387 | |
| |
| Precision Castparts Corp. | | | 1,276 | | | | 210,272 | |
| |
| Raytheon Co. | | | 3,064 | | | | 148,236 | |
| |
| Rockwell Collins, Inc. | | | 1,352 | | | | 74,860 | |
| |
| Textron Inc. | | | 2,456 | | | | 45,412 | |
| |
| United Technologies Corp. | | | 8,023 | | | | 586,401 | |
| |
| Xylem, Inc. | | | 1,598 | | | | 41,053 | |
| |
| | | | | | | | 2,690,610 | |
| |
Agricultural Products–0.17%
| | | | |
| Archer-Daniels-Midland Co. | | | 5,946 | | | | 170,056 | |
| |
Air Freight & Logistics–1.03%
| | | | |
| C.H. Robinson Worldwide, Inc. | | | 1,450 | | | | 101,181 | |
| |
| Expeditors International of Washington, Inc. | | | 1,865 | | | | 76,390 | |
| |
| FedEx Corp. | | | 2,808 | | | | 234,496 | |
| |
| United Parcel Service, Inc.–Class B | | | 8,531 | | | | 624,384 | |
| |
| | | | | | | | 1,036,451 | |
| |
Airlines–0.06%
| | | | |
| Southwest Airlines Co. | | | 6,894 | | | | 59,013 | |
| |
Aluminum–0.08%
| | | | |
| Alcoa Inc. | | | 9,469 | | | | 81,907 | |
| |
Apparel Retail–0.52%
| | | | |
| Abercrombie & Fitch Co.–Class A | | | 764 | | | | 37,314 | |
| |
| Gap, Inc. (The) | | | 3,079 | | | | 57,115 | |
| |
| Limited Brands, Inc. | | | 2,178 | | | | 87,882 | |
| |
| Ross Stores, Inc. | | | 2,034 | | | | 96,676 | |
| |
| TJX Cos., Inc. | | | 3,352 | | | | 216,372 | |
| |
Urban Outfitters, Inc.(b) | | | 963 | | | | 26,540 | |
| |
| | | | | | | | 521,899 | |
| |
Apparel, Accessories & Luxury Goods–0.33%
| | | | |
| Coach, Inc. | | | 2,584 | | | | 157,727 | |
| |
| Polo Ralph Lauren Corp. | | | 569 | | | | 78,568 | |
| |
| VF Corp. | | | 771 | | | | 97,909 | |
| |
| | | | | | | | 334,204 | |
| |
Application Software–0.54%
| | | | |
Adobe Systems Inc.(b) | | | 4,326 | | | | 122,296 | |
| |
Autodesk, Inc.(b) | | | 2,013 | | | | 61,054 | |
| |
Citrix Systems, Inc.(b) | | | 1,656 | | | | 100,552 | |
| |
| Intuit Inc. | | | 2,632 | | | | 138,417 | |
| |
Salesforce.com, Inc.(b) | | | 1,203 | | | | 122,057 | |
| |
| | | | | | | | 544,376 | |
| |
Asset Management & Custody Banks–1.10%
| | | | |
| Ameriprise Financial, Inc. | | | 2,002 | | | | 99,379 | |
| |
| Bank of New York Mellon Corp. (The) | | | 10,738 | | | | 213,794 | |
| |
| BlackRock, Inc. | | | 882 | | | | 157,208 | |
| |
| Federated Investors, Inc.–Class B | | | 860 | | | | 13,029 | |
| |
| Franklin Resources, Inc. | | | 1,280 | | | | 122,957 | |
| |
Invesco Ltd.(c) | | | 4,033 | | | | 81,023 | |
| |
| Legg Mason, Inc. | | | 1,094 | | | | 26,311 | |
| |
| Northern Trust Corp. | | | 2,120 | | | | 84,079 | |
| |
| State Street Corp. | | | 4,356 | | | | 175,590 | |
| |
| T. Rowe Price Group Inc. | | | 2,255 | | | | 128,422 | |
| |
| | | | | | | | 1,101,792 | |
| |
Auto Parts & Equipment–0.25%
| | | | |
BorgWarner, Inc.(b) | | | 971 | | | | 61,892 | |
| |
| Johnson Controls, Inc. | | | 6,024 | | | | 188,310 | |
| |
| | | | | | | | 250,202 | |
| |
Automobile Manufacturers–0.36%
| | | | |
| Ford Motor Co. | | | 33,652 | | | | 362,095 | |
| |
Automotive Retail–0.25%
| | | | |
AutoNation, Inc.(b) | | | 436 | | | | 16,075 | |
| |
AutoZone, Inc.(b) | | | 247 | | | | 80,268 | |
| |
CarMax, Inc.(b) | | | 1,990 | | | | 60,655 | |
| |
O’Reilly Automotive, Inc.(b) | | | 1,127 | | | | 90,104 | |
| |
| | | | | | | | 247,102 | |
| |
Biotechnology–1.22%
| | | | |
| Amgen Inc. | | | 7,024 | | | | 451,011 | |
| |
Biogen Idec Inc.(b) | | | 2,151 | | | | 236,718 | |
| |
See accompanying Notes to Financial Statements which are an integral part of the financial statements.
Invesco V.I. S&P 500 Index Fund
| | | | | | | | | |
| | | Shares | | Value |
| |
Biotechnology–(continued)
| | | | |
| | | | | | | | | |
Celgene Corp.(b) | | | 3,930 | | | $ | 265,668 | |
| |
Gilead Sciences, Inc.(b) | | | 6,651 | | | | 272,225 | |
| |
| | | | | | | | 1,225,622 | |
| |
Brewers–0.06%
| | | | |
| Molson Coors Brewing Co.–Class B | | | 1,394 | | | | 60,695 | |
| |
Broadcasting–0.29%
| | | | |
| CBS Corp.–Class B | | | 5,794 | | | | 157,249 | |
| |
Discovery Communications, Inc.–Class A(b) | | | 2,340 | | | | 95,870 | |
| |
| Scripps Networks Interactive–Class A | | | 868 | | | | 36,820 | |
| |
| | | | | | | | 289,939 | |
| |
Building Products–0.03%
| | | | |
| Masco Corp. | | | 3,174 | | | | 33,263 | |
| |
Cable & Satellite–1.04%
| | | | |
| Cablevision Systems Corp.–Class A | | | 1,940 | | | | 27,587 | |
| |
| Comcast Corp.–Class A | | | 24,094 | | | | 571,269 | |
| |
DIRECTV–Class A(b) | | | 6,247 | | | | 267,121 | |
| |
| Time Warner Cable Inc. | | | 2,825 | | | | 179,585 | |
| |
| | | | | | | | 1,045,562 | |
| |
Casinos & Gaming–0.12%
| | | | |
| International Game Technology | | | 2,635 | | | | 45,322 | |
| |
| Wynn Resorts Ltd. | | | 703 | | | | 77,674 | |
| |
| | | | | | | | 122,996 | |
| |
Coal & Consumable Fuels–0.19%
| | | | |
Alpha Natural Resources, Inc.(b) | | | 1,964 | | | | 40,124 | |
| |
| CONSOL Energy Inc. | | | 1,994 | | | | 73,180 | |
| |
| Peabody Energy Corp. | | | 2,398 | | | | 79,398 | |
| |
| | | | | | | | 192,702 | |
| |
Commercial Printing–0.02%
| | | | |
| R. R. Donnelley & Sons Co. | | | 1,660 | | | | 23,954 | |
| |
Communications Equipment–2.11%
| | | | |
| Cisco Systems, Inc. | | | 47,607 | | | | 860,735 | |
| |
F5 Networks, Inc.(b) | | | 710 | | | | 75,345 | |
| |
| Harris Corp. | | | 1,025 | | | | 36,941 | |
| |
JDS Uniphase Corp.(b) | | | 1,980 | | | | 20,671 | |
| |
Juniper Networks, Inc.(b) | | | 4,684 | | | | 95,601 | |
| |
Motorola Mobility Holdings Inc.(b) | | | 2,334 | | | | 90,559 | |
| |
| Motorola Solutions, Inc. | | | 2,520 | | | | 116,651 | |
| |
| QUALCOMM, Inc. | | | 14,889 | | | | 814,428 | |
| |
| | | | | | | | 2,110,931 | |
| |
Computer & Electronics Retail–0.09%
| | | | |
| Best Buy Co., Inc. | | | 2,564 | | | | 59,921 | |
| |
GameStop Corp.–Class A(b) | | | 1,218 | | | | 29,390 | |
| |
| | | | | | | | 89,311 | |
| |
Computer Hardware–3.97%
| | | | |
Apple Inc.(b) | | | 8,229 | | | | 3,332,745 | |
| |
Dell Inc.(b) | | | 13,522 | | | | 197,827 | |
| |
| Hewlett-Packard Co. | | | 17,596 | | | | 453,273 | |
| |
| | | | | | | | 3,983,845 | |
| |
Computer Storage & Peripherals–0.69%
| | | | |
EMC Corp.(b) | | | 18,065 | | | | 389,120 | |
| |
| Lexmark International, Inc.–Class A | | | 658 | | | | 21,760 | |
| |
NetApp, Inc.(b) | | | 3,175 | | | | 115,157 | |
| |
SanDisk Corp.(b) | | | 2,128 | | | | 104,719 | |
| |
Western Digital Corp.(b) | | | 2,051 | | | | 63,479 | |
| |
| | | | | | | | 694,235 | |
| |
Construction & Engineering–0.16%
| | | | |
| Fluor Corp. | | | 1,501 | | | | 75,425 | |
| |
Jacobs Engineering Group, Inc.(b) | | | 1,122 | | | | 45,531 | |
| |
Quanta Services, Inc.(b) | | | 1,816 | | | | 39,117 | |
| |
| | | | | | | | 160,073 | |
| |
Construction & Farm Machinery & Heavy Trucks–1.14%
| | | | |
| Caterpillar Inc. | | | 5,725 | | | | 518,685 | |
| |
| Cummins Inc. | | | 1,713 | | | | 150,778 | |
| |
| Deere & Co. | | | 3,664 | | | | 283,411 | |
| |
| Joy Global Inc. | | | 924 | | | | 69,272 | |
| |
| PACCAR Inc. | | | 3,171 | | | | 118,817 | |
| |
| | | | | | | | 1,140,963 | |
| |
Construction Materials–0.05%
| | | | |
| Vulcan Materials Co. | | | 1,136 | | | | 44,702 | |
| |
Consumer Electronics–0.02%
| | | | |
| Harman International Industries, Inc. | | | 640 | | | | 24,346 | |
| |
Consumer Finance–0.77%
| | | | |
| American Express Co. | | | 8,948 | | | | 422,077 | |
| |
| Capital One Financial Corp. | | | 4,069 | | | | 172,078 | |
| |
| Discover Financial Services | | | 4,892 | | | | 117,408 | |
| |
| SLM Corp. | | | 4,513 | | | | 60,474 | |
| |
| | | | | | | | 772,037 | |
| |
Data Processing & Outsourced Services–1.41%
| | | | |
| Automatic Data Processing, Inc. | | | 4,309 | | | | 232,729 | |
| |
| Computer Sciences Corp. | | | 1,394 | | | | 33,038 | |
| |
| Fidelity National Information Services, Inc. | | | 2,154 | | | | 57,275 | |
| |
Fiserv, Inc.(b) | | | 1,245 | | | | 73,131 | |
| |
See accompanying Notes to Financial Statements which are an integral part of the financial statements.
Invesco V.I. S&P 500 Index Fund
| | | | | | | | | |
| | | Shares | | Value |
| |
Data Processing & Outsourced Services–(continued)
| | | | |
| | | | | | | | | |
| MasterCard, Inc.–Class A | | | 943 | | | $ | 351,569 | |
| |
| Paychex, Inc. | | | 2,835 | | | | 85,362 | |
| |
| Total System Services, Inc. | | | 1,389 | | | | 27,169 | |
| |
| Visa Inc.–Class A | | | 4,501 | | | | 456,986 | |
| |
| Western Union Co. (The) | | | 5,523 | | | | 100,850 | |
| |
| | | | | | | | 1,418,109 | |
| |
Department Stores–0.36%
| | | | |
| JC Penney Co., Inc. | | | 1,257 | | | | 44,184 | |
| |
| Kohl’s Corp. | | | 2,244 | | | | 110,742 | |
| |
| Macy’s, Inc. | | | 3,717 | | | | 119,613 | |
| |
| Nordstrom, Inc. | | | 1,440 | | | | 71,582 | |
| |
Sears Holdings Corp.(b) | | | 344 | | | | 10,932 | |
| |
| | | | | | | | 357,053 | |
| |
Distillers & Vintners–0.17%
| | | | |
| Beam, Inc. | | | 1,359 | | | | 69,622 | |
| |
| Brown-Forman Corp.–Class B | | | 887 | | | | 71,412 | |
| |
Constellation Brands, Inc.–Class A(b) | | | 1,495 | | | | 30,902 | |
| |
| | | | | | | | 171,936 | |
| |
Distributors–0.08%
| | | | |
| Genuine Parts Co. | | | 1,379 | | | | 84,395 | |
| |
Diversified Banks–1.79%
| | | | |
| Comerica Inc. | | | 1,768 | | | | 45,615 | |
| |
| U.S. Bancorp | | | 16,905 | | | | 457,280 | |
| |
Wells Fargo & Co.(b) | | | 46,700 | | | | 1,287,052 | |
| |
| | | | | | | | 1,789,947 | |
| |
Diversified Chemicals–0.89%
| | | | |
| Dow Chemical Co. (The) | | | 10,499 | | | | 301,951 | |
| |
| E. I. du Pont de Nemours and Co. | | | 8,181 | | | | 374,526 | |
| |
| Eastman Chemical Co. | | | 1,235 | | | | 48,239 | |
| |
| FMC Corp. | | | 630 | | | | 54,205 | |
| |
| PPG Industries, Inc. | | | 1,366 | | | | 114,048 | |
| |
| | | | | | | | 892,969 | |
| |
Diversified Metals & Mining–0.32%
| | | | |
| Freeport-McMoRan Copper & Gold Inc. | | | 8,393 | | | | 308,778 | |
| |
| Titanium Metals Corp. | | | 705 | | | | 10,561 | |
| |
| | | | | | | | 319,339 | |
| |
Diversified REIT’s–0.12%
| | | | |
| Vornado Realty Trust | | | 1,622 | | | | 124,667 | |
| |
Diversified Support Services–0.09%
| | | | |
| Cintas Corp. | | | 981 | | | | 34,149 | |
| |
| Iron Mountain Inc. | | | 1,643 | | | | 50,604 | |
| |
| | | | | | | | 84,753 | |
| |
Drug Retail–0.73%
| | | | |
| CVS Caremark Corp. | | | 11,526 | | | | 470,030 | |
| |
| Walgreen Co. | | | 7,868 | | | | 260,116 | |
| |
| | | | | | | | 730,146 | |
| |
Education Services–0.08%
| | | | |
Apollo Group, Inc.–Class A(b) | | | 1,022 | | | | 55,055 | |
| |
| DeVry, Inc. | | | 564 | | | | 21,692 | |
| |
| | | | | | | | 76,747 | |
| |
Electric Utilities–2.10%
| | | | |
| American Electric Power Co., Inc. | | | 4,276 | | | | 176,642 | |
| |
| Duke Energy Corp. | | | 11,825 | | | | 260,150 | |
| |
| Edison International | | | 2,866 | | | | 118,652 | |
| |
| Entergy Corp. | | | 1,555 | | | | 113,593 | |
| |
| Exelon Corp. | | | 5,870 | | | | 254,582 | |
| |
| FirstEnergy Corp. | | | 3,680 | | | | 163,024 | |
| |
| NextEra Energy, Inc. | | | 3,741 | | | | 227,752 | |
| |
| Northeast Utilities | | | 1,556 | | | | 56,125 | |
| |
| Pepco Holdings, Inc. | | | 1,963 | | | | 39,849 | |
| |
| Pinnacle West Capital Corp. | | | 959 | | | | 46,205 | |
| |
| PPL Corp. | | | 5,120 | | | | 150,630 | |
| |
| Progress Energy, Inc. | | | 2,612 | | | | 146,324 | |
| |
| Southern Co. (The) | | | 7,650 | | | | 354,118 | |
| |
| | | | | | | | 2,107,646 | |
| |
Electrical Components & Equipment–0.54%
| | | | |
| Cooper Industries PLC (Ireland) | | | 1,382 | | | | 74,835 | |
| |
| Emerson Electric Co. | | | 6,515 | | | | 303,534 | |
| |
| Rockwell Automation, Inc. | | | 1,260 | | | | 92,446 | |
| |
| Roper Industries, Inc. | | | 845 | | | | 73,405 | |
| |
| | | | | | | | 544,220 | |
| |
Electronic Components–0.25%
| | | | |
| Amphenol Corp.–Class A | | | 1,467 | | | | 66,587 | |
| |
| Corning Inc. | | | 13,933 | | | | 180,850 | |
| |
| | | | | | | | 247,437 | |
| |
Electronic Equipment & Instruments–0.04%
| | | | |
| FLIR Systems, Inc. | | | 1,380 | | | | 34,597 | |
| |
| | | | | | | | | |
| | | | | | | | | |
See accompanying Notes to Financial Statements which are an integral part of the financial statements.
Invesco V.I. S&P 500 Index Fund
| | | | | | | | | |
| | | Shares | | Value |
| |
Electronic Manufacturing Services–0.18%
| | | | |
| Jabil Circuit, Inc. | | | 1,631 | | | $ | 32,066 | |
| |
| Molex Inc. | | | 1,213 | | | | 28,942 | |
| |
| TE Connectivity Ltd. | | | 3,758 | | | | 115,784 | |
| |
| | | | | | | | 176,792 | |
| |
Environmental & Facilities Services–0.27%
| | | | |
| Republic Services, Inc. | | | 2,815 | | | | 77,553 | |
| |
Stericycle, Inc.(b) | | | 757 | | | | 58,986 | |
| |
| Waste Management, Inc. | | | 4,075 | | | | 133,293 | |
| |
| | | | | | | | 269,832 | |
| |
Fertilizers & Agricultural Chemicals–0.55%
| | | | |
| CF Industries Holdings, Inc. | | | 575 | | | | 83,363 | |
| |
| Monsanto Co. | | | 4,741 | | | | 332,202 | |
| |
| Mosaic Co. (The) | | | 2,619 | | | | 132,076 | |
| |
| | | | | | | | 547,641 | |
| |
Food Distributors–0.15%
| | | | |
| Sysco Corp. | | | 5,215 | | | | 152,956 | |
| |
Food Retail–0.31%
| | | | |
| Kroger Co. (The) | | | 5,324 | | | | 128,947 | |
| |
| Safeway Inc. | | | 3,007 | | | | 63,267 | |
| |
| SUPERVALU Inc. | | | 1,831 | | | | 14,868 | |
| |
| Whole Foods Market, Inc. | | | 1,414 | | | | 98,386 | |
| |
| | | | | | | | 305,468 | |
| |
Footwear–0.32%
| | | | |
| NIKE, Inc.–Class B | | | 3,284 | | | | 316,479 | |
| |
Gas Utilities–0.12%
| | | | |
| AGL Resources Inc. | | | 1,025 | | | | 43,316 | |
| |
| ONEOK, Inc. | | | 910 | | | | 78,888 | |
| |
| | | | | | | | 122,204 | |
| |
General Merchandise Stores–0.47%
| | | | |
Big Lots, Inc.(b) | | | 587 | | | | 22,165 | |
| |
Dollar Tree, Inc.(b) | | | 1,053 | | | | 87,515 | |
| |
| Family Dollar Stores, Inc. | | | 1,039 | | | | 59,909 | |
| |
| Target Corp. | | | 5,941 | | | | 304,298 | |
| |
| | | | | | | | 473,887 | |
| |
Gold–0.26%
| | | | |
| Newmont Mining Corp. | | | 4,381 | | | | 262,904 | |
| |
Health Care Distributors–0.40%
| | | | |
| AmerisourceBergen Corp. | | | 2,269 | | | | 84,384 | |
| |
| Cardinal Health, Inc. | | | 3,059 | | | | 124,226 | |
| |
| McKesson Corp. | | | 2,167 | | | | 168,831 | |
| |
| Patterson Cos. Inc. | | | 839 | | | | 24,767 | |
| |
| | | | | | | | 402,208 | |
| |
Health Care Equipment–1.74%
| | | | |
| Baxter International Inc. | | | 5,000 | | | | 247,400 | |
| |
| Becton, Dickinson and Co. | | | 1,913 | | | | 142,939 | |
| |
Boston Scientific Corp.(b) | | | 13,119 | | | | 70,055 | |
| |
| C.R. Bard, Inc. | | | 762 | | | | 65,151 | |
| |
CareFusion Corp.(b) | | | 1,988 | | | | 50,515 | |
| |
| Covidien PLC (Ireland) | | | 4,272 | | | | 192,283 | |
| |
Edwards Lifesciences Corp.(b) | | | 1,011 | | | | 71,478 | |
| |
Intuitive Surgical, Inc.(b) | | | 343 | | | | 158,812 | |
| |
| Medtronic, Inc. | | | 9,345 | | | | 357,446 | |
| |
| St. Jude Medical, Inc. | | | 2,799 | | | | 96,006 | |
| |
| Stryker Corp. | | | 2,880 | | | | 143,165 | |
| |
Varian Medical Systems, Inc.(b) | | | 996 | | | | 66,862 | |
| |
| Zimmer Holdings, Inc. | | | 1,576 | | | | 84,190 | |
| |
| | | | | | | | 1,746,302 | |
| |
Health Care Facilities–0.02%
| | | | |
Tenet Healthcare Corp.(b) | | | 3,881 | | | | 19,909 | |
| |
Health Care Services–0.60%
| | | | |
DaVita, Inc.(b) | | | 821 | | | | 62,240 | |
| |
Express Scripts, Inc.(b) | | | 4,308 | | | | 192,524 | |
| |
Laboratory Corp. of America Holdings(b) | | | 877 | | | | 75,396 | |
| |
Medco Health Solutions, Inc.(b) | | | 3,427 | | | | 191,569 | |
| |
| Quest Diagnostics Inc. | | | 1,392 | | | | 80,820 | |
| |
| | | | | | | | 602,549 | |
| |
Health Care Supplies–0.04%
| | | | |
| DENTSPLY International Inc. | | | 1,243 | | | | 43,493 | |
| |
Health Care Technology–0.08%
| | | | |
Cerner Corp.(b) | | | 1,279 | | | | 78,339 | |
| |
Home Entertainment Software–0.06%
| | | | |
Electronic Arts Inc.(b) | | | 2,941 | | | | 60,585 | |
| |
Home Furnishings–0.03%
| | | | |
| Leggett & Platt, Inc. | | | 1,266 | | | | 29,169 | |
| |
Home Improvement Retail–0.85%
| | | | |
| Home Depot, Inc. (The) | | | 13,651 | | | | 573,888 | |
| |
| Lowe’s Cos., Inc. | | | 11,093 | | | | 281,540 | |
| |
Orchard Supply Hardware Stores Corp.–Class A(b) | | | 15 | | | | 110 | |
| |
| | | | | | | | 855,538 | |
| |
Homebuilding–0.08%
| | | | |
| D.R. Horton, Inc. | | | 2,492 | | | | 31,424 | |
| |
| Lennar Corp.–Class A | | | 1,389 | | | | 27,294 | |
| |
PulteGroup Inc.(b) | | | 3,021 | | | | 19,062 | |
| |
| | | | | | | | 77,780 | |
| |
| | | | | | | | | |
| | | | | | | | | |
See accompanying Notes to Financial Statements which are an integral part of the financial statements.
Invesco V.I. S&P 500 Index Fund
| | | | | | | | | |
| | | Shares | | Value |
| |
Homefurnishing Retail–0.12%
| | | | |
Bed Bath & Beyond Inc.(b) | | | 2,126 | | | $ | 123,244 | |
| |
Hotels, Resorts & Cruise Lines–0.33%
| | | | |
| Carnival Corp. | | | 4,006 | | | | 130,756 | |
| |
| Marriott International Inc.–Class A | | | 2,408 | | | | 70,241 | |
| |
| Starwood Hotels & Resorts Worldwide, Inc. | | | 1,690 | | | | 81,069 | |
| |
| Wyndham Worldwide Corp. | | | 1,342 | | | | 50,768 | |
| |
| | | | | | | | 332,834 | |
| |
Household Appliances–0.03%
| | | | |
| Whirlpool Corp. | | | 672 | | | | 31,886 | |
| |
Household Products–2.35%
| | | | |
| Clorox Co. (The) | | | 1,156 | | | | 76,943 | |
| |
| Colgate-Palmolive Co. | | | 4,281 | | | | 395,522 | |
| |
| Kimberly-Clark Corp. | | | 3,489 | | | | 256,651 | |
| |
| Procter & Gamble Co. (The) | | | 24,364 | | | | 1,625,322 | |
| |
| | | | | | | | 2,354,438 | |
| |
Housewares & Specialties–0.04%
| | | | |
| Newell Rubbermaid Inc. | | | 2,588 | | | | 41,796 | |
| |
Human Resource & Employment Services–0.04%
| | | | |
| Robert Half International, Inc. | | | 1,289 | | | | 36,685 | |
| |
Hypermarkets & Super Centers–1.24%
| | | | |
| Costco Wholesale Corp. | | | 3,837 | | | | 319,699 | |
| |
| Wal-Mart Stores, Inc. | | | 15,469 | | | | 924,427 | |
| |
| | | | | | | | 1,244,126 | |
| |
Independent Power Producers & Energy Traders–0.17%
| | | | |
AES Corp. (The)(b) | | | 5,683 | | | | 67,287 | |
| |
| Constellation Energy Group Inc. | | | 1,771 | | | | 70,255 | |
| |
NRG Energy, Inc.(b) | | | 1,992 | | | | 36,095 | |
| |
| | | | | | | | 173,637 | |
| |
Industrial Conglomerates–2.60%
| | | | |
| 3M Co. | | | 6,205 | | | | 507,135 | |
| |
| Danaher Corp. | | | 5,044 | | | | 237,270 | |
| |
General Electric Co.(d) | | | 93,494 | | | | 1,674,477 | |
| |
| Tyco International Ltd. | | | 4,086 | | | | 190,857 | |
| |
| | | | | | | | 2,609,739 | |
| |
Industrial Gases–0.49%
| | | | |
| Air Products & Chemicals, Inc. | | | 1,862 | | | | 158,624 | |
| |
| Airgas, Inc. | | | 598 | | | | 46,692 | |
| |
| Praxair, Inc. | | | 2,658 | | | | 284,140 | |
| |
| | | | | | | | 489,456 | |
| |
Industrial Machinery–0.84%
| | | | |
| Dover Corp. | | | 1,636 | | | | 94,970 | |
| |
| Eaton Corp. | | | 2,959 | | | | 128,805 | |
| |
| Flowserve Corp. | | | 490 | | | | 48,667 | |
| |
| Illinois Tool Works Inc. | | | 4,279 | | | | 199,872 | |
| |
| Ingersoll-Rand PLC (Ireland) | | | 2,746 | | | | 83,671 | |
| |
| Pall Corp. | | | 1,023 | | | | 58,464 | |
| |
| Parker Hannifin Corp. | | | 1,337 | | | | 101,946 | |
| |
| Snap-on Inc. | | | 521 | | | | 26,373 | |
| |
| Stanley Black & Decker Inc. | | | 1,481 | | | | 100,116 | |
| |
| | | | | | | | 842,884 | |
| |
Industrial REIT’s–0.12%
| | | | |
| Prologis, Inc. | | | 4,022 | | | | 114,989 | |
| |
Insurance Brokers–0.28%
| | | | |
| Aon Corp. | | | 2,874 | | | | 134,503 | |
| |
| Marsh & McLennan Cos., Inc. | | | 4,765 | | | | 150,669 | |
| |
| | | | | | | | 285,172 | |
| |
Integrated Oil & Gas–7.23%
| | | | |
| Chevron Corp. | | | 17,627 | | | | 1,875,513 | |
| |
| ConocoPhillips | | | 11,757 | | | | 856,733 | |
| |
| Exxon Mobil Corp. | | | 42,446 | | | | 3,597,723 | |
| |
| Hess Corp. | | | 2,638 | | | | 149,838 | |
| |
| Murphy Oil Corp. | | | 1,702 | | | | 94,869 | |
| |
| Occidental Petroleum Corp. | | | 7,188 | | | | 673,516 | |
| |
| | | | | | | | 7,248,192 | |
| |
Integrated Telecommunication Services–2.90%
| | | | |
| AT&T Inc. | | | 52,479 | | | | 1,586,965 | |
| |
| CenturyLink Inc. | | | 5,468 | | | | 203,410 | |
| |
| Frontier Communications Corp. | | | 8,862 | | | | 45,639 | |
| |
| Verizon Communications Inc. | | | 25,070 | | | | 1,005,809 | |
| |
| Windstream Corp. | | | 5,160 | | | | 60,578 | |
| |
| | | | | | | | 2,902,401 | |
| |
Internet Retail–0.84%
| | | | |
Amazon.com, Inc.(b) | | | 3,221 | | | | 557,555 | |
| |
| Expedia Inc. | | | 839 | | | | 24,348 | |
| |
Netflix Inc.(b) | | | 490 | | | | 33,952 | |
| |
Priceline.com Inc.(b) | | | 440 | | | | 205,793 | |
| |
TripAdvisor Inc.(b) | | | 839 | | | | 21,151 | |
| |
| | | | | | | | 842,799 | |
| |
Internet Software & Services–2.03%
| | | | |
Akamai Technologies, Inc.(b) | | | 1,622 | | | | 52,358 | |
| |
eBay Inc.(b) | | | 10,198 | | | | 309,305 | |
| |
Google Inc.–Class A(b) | | | 2,237 | | | | 1,444,878 | |
| |
See accompanying Notes to Financial Statements which are an integral part of the financial statements.
Invesco V.I. S&P 500 Index Fund
| | | | | | | | | |
| | | Shares | | Value |
| |
Internet Software & Services–(continued)
| | | | |
| | | | | | | | | |
| VeriSign, Inc. | | | 1,408 | | | $ | 50,294 | |
| |
Yahoo! Inc.(b) | | | 10,983 | | | | 177,156 | |
| |
| | | | | | | | 2,033,991 | |
| |
Investment Banking & Brokerage–0.72%
| | | | |
| Charles Schwab Corp. (The) | | | 9,589 | | | | 107,972 | |
| |
E*TRADE Financial Corp.(b) | | | 2,290 | | | | 18,229 | |
| |
| Goldman Sachs Group, Inc. (The) | | | 4,351 | | | | 393,461 | |
| |
| Morgan Stanley | | | 13,170 | | | | 199,262 | |
| |
| | | | | | | | 718,924 | |
| |
IT Consulting & Other Services–2.49%
| | | | |
| Accenture PLC–Class A (Ireland) | | | 5,670 | | | | 301,814 | |
| |
Cognizant Technology Solutions Corp.–Class A(b) | | | 2,671 | | | | 171,772 | |
| |
| International Business Machines Corp. | | | 10,436 | | | | 1,918,972 | |
| |
SAIC, Inc.(b) | | | 2,466 | | | | 30,307 | |
| |
Teradata Corp.(b) | | | 1,480 | | | | 71,795 | |
| |
| | | | | | | | 2,494,660 | |
| |
Leisure Products–0.12%
| | | | |
| Hasbro, Inc. | | | 1,027 | | | | 32,751 | |
| |
| Mattel, Inc. | | | 3,016 | | | | 83,724 | |
| |
| | | | | | | | 116,475 | |
| |
Life & Health Insurance–0.89%
| | | | |
| Aflac, Inc. | | | 4,111 | | | | 177,842 | |
| |
| Lincoln National Corp. | | | 2,625 | | | | 50,978 | |
| |
| MetLife, Inc. | | | 9,365 | | | | 292,001 | |
| |
| Principal Financial Group, Inc. | | | 2,702 | | | | 66,469 | |
| |
| Prudential Financial, Inc. | | | 4,176 | | | | 209,301 | |
| |
| Torchmark Corp. | | | 924 | | | | 40,092 | |
| |
| Unum Group | | | 2,557 | | | | 53,876 | |
| |
| | | | | | | | 890,559 | |
| |
Life Sciences Tools & Services–0.40%
| | | | |
Agilent Technologies, Inc.(b) | | | 3,054 | | | | 106,677 | |
| |
Life Technologies Corp.(b) | | | 1,587 | | | | 61,750 | |
| |
| PerkinElmer, Inc. | | | 1,005 | | | | 20,100 | |
| |
Thermo Fisher Scientific, Inc.(b) | | | 3,360 | | | | 151,099 | |
| |
Waters Corp.(b) | | | 803 | | | | 59,462 | |
| |
| | | | | | | | 399,088 | |
| |
Managed Health Care–1.09%
| | | | |
| Aetna Inc. | | | 3,207 | | | | 135,303 | |
| |
| CIGNA Corp. | | | 2,511 | | | | 105,462 | |
| |
Coventry Health Care, Inc.(b) | | | 1,277 | | | | 38,783 | |
| |
| Humana Inc. | | | 1,447 | | | | 126,772 | |
| |
| UnitedHealth Group Inc. | | | 9,440 | | | | 478,419 | |
| |
| WellPoint, Inc. | | | 3,073 | | | | 203,586 | |
| |
| | | | | | | | 1,088,325 | |
| |
Metal & Glass Containers–0.08%
| | | | |
| Ball Corp. | | | 1,438 | | | | 51,351 | |
| |
Owens-Illinois, Inc.(b) | | | 1,415 | | | | 27,423 | |
| |
| | | | | | | | 78,774 | |
| |
Motorcycle Manufacturers–0.08%
| | | | |
| Harley-Davidson, Inc. | | | 2,080 | | | | 80,850 | |
| |
Movies & Entertainment–1.48%
| | | | |
| News Corp.–Class A | | | 19,420 | | | | 346,453 | |
| |
| Time Warner Inc. | | | 8,863 | | | | 320,309 | |
| |
| Viacom Inc.–Class B | | | 4,890 | | | | 222,055 | |
| |
| Walt Disney Co. (The) | | | 15,909 | | | | 596,587 | |
| |
| | | | | | | | 1,485,404 | |
| |
Multi-Line Insurance–0.32%
| | | | |
American International Group, Inc.(b) | | | 3,904 | | | | 90,573 | |
| |
| Assurant, Inc. | | | 815 | | | | 33,464 | |
| |
Genworth Financial Inc.–Class A(b) | | | 4,297 | | | | 28,145 | |
| |
| Hartford Financial Services Group, Inc. | | | 3,983 | | | | 64,724 | |
| |
| Loews Corp. | | | 2,703 | | | | 101,768 | |
| |
| | | | | | | | 318,674 | |
| |
Multi-Sector Holdings–0.04%
| | | | |
| Leucadia National Corp. | | | 1,760 | | | | 40,022 | |
| |
Multi-Utilities–1.48%
| | | | |
| Ameren Corp. | | | 2,126 | | | | 70,434 | |
| |
| CenterPoint Energy, Inc. | | | 3,800 | | | | 76,342 | |
| |
| CMS Energy Corp. | | | 2,193 | | | | 48,421 | |
| |
| Consolidated Edison, Inc. | | | 2,593 | | | | 160,844 | |
| |
| Dominion Resources, Inc. | | | 5,044 | | | | 267,736 | |
| |
| DTE Energy Co. | | | 1,489 | | | | 81,076 | |
| |
| Integrys Energy Group, Inc. | | | 685 | | | | 37,113 | |
| |
| NiSource Inc. | | | 2,503 | | | | 59,596 | |
| |
| PG&E Corp. | | | 3,593 | | | | 148,104 | |
| |
| Public Service Enterprise Group Inc. | | | 4,480 | | | | 147,885 | |
| |
| SCANA Corp. | | | 1,010 | | | | 45,511 | |
| |
| Sempra Energy | | | 2,107 | | | | 115,885 | |
| |
| TECO Energy, Inc. | | | 1,951 | | | | 37,342 | |
| |
| Wisconsin Energy Corp. | | | 2,056 | | | | 71,878 | |
| |
| Xcel Energy, Inc. | | | 4,294 | | | | 118,686 | |
| |
| | | | | | | | 1,486,853 | |
| |
| | | | | | | | | |
| | | | | | | | | |
See accompanying Notes to Financial Statements which are an integral part of the financial statements.
Invesco V.I. S&P 500 Index Fund
| | | | | | | | | |
| | | Shares | | Value |
| |
Office Electronics–0.10%
| | | | |
| Xerox Corp. | | | 12,251 | | | $ | 97,518 | |
| |
Office REIT’s–0.13%
| | | | |
| Boston Properties, Inc. | | | 1,306 | | | | 130,078 | |
| |
Office Services & Supplies–0.06%
| | | | |
| Avery Dennison Corp. | | | 931 | | | | 26,701 | |
| |
| Pitney Bowes Inc. | | | 1,775 | | | | 32,909 | |
| |
| | | | | | | | 59,610 | |
| |
Oil & Gas Drilling–0.23%
| | | | |
| Diamond Offshore Drilling, Inc. | | | 611 | | | | 33,764 | |
| |
| Helmerich & Payne, Inc. | | | 942 | | | | 54,975 | |
| |
Nabors Industries Ltd.(b) | | | 2,534 | | | | 43,940 | |
| |
Noble Corp.(b) | | | 2,220 | | | | 67,088 | |
| |
Rowan Cos., Inc.(b) | | | 1,121 | | | | 34,000 | |
| |
| | | | | | | | 233,767 | |
| |
Oil & Gas Equipment & Services–1.75%
| | | | |
| Baker Hughes Inc. | | | 3,864 | | | | 187,945 | |
| |
Cameron International Corp.(b) | | | 2,156 | | | | 106,054 | |
| |
FMC Technologies, Inc.(b) | | | 2,113 | | | | 110,362 | |
| |
| Halliburton Co. | | | 8,148 | | | | 281,188 | |
| |
| National Oilwell Varco Inc. | | | 3,752 | | | | 255,098 | |
| |
| Schlumberger Ltd. | | | 11,875 | | | | 811,181 | |
| |
| | | | | | | | 1,751,828 | |
| |
Oil & Gas Exploration & Production–2.12%
| | | | |
| Anadarko Petroleum Corp. | | | 4,409 | | | | 336,539 | |
| |
| Apache Corp. | | | 3,400 | | | | 307,972 | |
| |
| Cabot Oil & Gas Corp. | | | 919 | | | | 69,752 | |
| |
| Chesapeake Energy Corp. | | | 5,815 | | | | 129,616 | |
| |
Denbury Resources Inc.(b) | | | 3,487 | | | | 52,654 | |
| |
| Devon Energy Corp. | | | 3,565 | | | | 221,030 | |
| |
| EOG Resources, Inc. | | | 2,380 | | | | 234,454 | |
| |
| EQT Corp. | | | 1,314 | | | | 71,994 | |
| |
| Marathon Oil Corp. | | | 6,231 | | | | 182,381 | |
| |
Newfield Exploration Co.(b) | | | 1,164 | | | | 43,918 | |
| |
| Noble Energy, Inc. | | | 1,553 | | | | 146,588 | |
| |
| Pioneer Natural Resources Co. | | | 1,083 | | | | 96,907 | |
| |
| QEP Resources Inc. | | | 1,556 | | | | 45,591 | |
| |
| Range Resources Corp. | | | 1,384 | | | | 85,725 | |
| |
Southwestern Energy Co.(b) | | | 3,061 | | | | 97,768 | |
| |
| | | | | | | | 2,122,889 | |
| |
Oil & Gas Refining & Marketing–0.28%
| | | | |
| Marathon Petroleum Corp. | | | 3,136 | | | | 104,397 | |
| |
| Sunoco, Inc. | | | 969 | | | | 39,748 | |
| |
Tesoro Corp.(b) | | | 1,286 | | | | 30,041 | |
| |
| Valero Energy Corp. | | | 4,934 | | | | 103,861 | |
| |
| | | | | | | | 278,047 | |
| |
Oil & Gas Storage & Transportation–0.53%
| | | | |
| El Paso Corp. | | | 6,829 | | | | 181,447 | |
| |
| Spectra Energy Corp. | | | 5,758 | | | | 177,058 | |
| |
| Williams Cos., Inc. (The) | | | 5,219 | | | | 172,331 | |
| |
| | | | | | | | 530,836 | |
| |
Other Diversified Financial Services–2.29%
| | | | |
| Bank of America Corp. | | | 89,761 | | | | 499,071 | |
| |
| Citigroup Inc. | | | 25,891 | | | | 681,192 | |
| |
| JPMorgan Chase & Co. | | | 33,649 | | | | 1,118,830 | |
| |
| | | | | | | | 2,299,093 | |
| |
Packaged Foods & Meats–1.77%
| | | | |
| Campbell Soup Co. | | | 1,581 | | | | 52,552 | |
| |
| ConAgra Foods, Inc. | | | 3,648 | | | | 96,307 | |
| |
Dean Foods Co.(b) | | | 1,670 | | | | 18,704 | |
| |
| General Mills, Inc. | | | 5,689 | | | | 229,893 | |
| |
| H.J. Heinz Co. | | | 2,824 | | | | 152,609 | |
| |
| Hershey Co. (The) | | | 1,360 | | | | 84,021 | |
| |
| Hormel Foods Corp. | | | 1,222 | | | | 35,792 | |
| |
| J M Smucker Co. (The) | | | 1,001 | | | | 78,248 | |
| |
| Kellogg Co. | | | 2,197 | | | | 111,102 | |
| |
| Kraft Foods Inc.–Class A | | | 15,649 | | | | 584,647 | |
| |
| McCormick & Co., Inc. | | | 1,163 | | | | 58,638 | |
| |
| Mead Johnson Nutrition Co. | | | 1,794 | | | | 123,302 | |
| |
| Sara Lee Corp. | | | 5,181 | | | | 98,025 | |
| |
| Tyson Foods, Inc.–Class A | | | 2,586 | | | | 53,375 | |
| |
| | | | | | | | 1,777,215 | |
| |
Paper Packaging–0.05%
| | | | |
| Bemis Co., Inc. | | | 928 | | | | 27,914 | |
| |
| Sealed Air Corp. | | | 1,401 | | | | 24,111 | |
| |
| | | | | | | | 52,025 | |
| |
Paper Products–0.16%
| | | | |
| International Paper Co. | | | 3,846 | | | | 113,842 | |
| |
| MeadWestvaco Corp. | | | 1,535 | | | | 45,973 | |
| |
| | | | | | | | 159,815 | |
| |
Personal Products–0.18%
| | | | |
| Avon Products, Inc. | | | 3,848 | | | | 67,225 | |
| |
| Estee Lauder Cos. Inc. (The)–Class A | | | 994 | | | | 111,646 | |
| |
| | | | | | | | 178,871 | |
| |
| | | | | | | | | |
| | | | | | | | | |
See accompanying Notes to Financial Statements which are an integral part of the financial statements.
Invesco V.I. S&P 500 Index Fund
| | | | | | | | | |
| | | Shares | | Value |
| |
Pharmaceuticals–6.32%
| | | | |
| Abbott Laboratories | | | 13,805 | | | $ | 776,255 | |
| |
| Allergan, Inc. | | | 2,705 | | | | 237,337 | |
| |
| Bristol-Myers Squibb Co. | | | 15,010 | | | | 528,952 | |
| |
| Eli Lilly & Co. | | | 9,022 | | | | 374,954 | |
| |
Forest Laboratories, Inc.(b) | | | 2,365 | | | | 71,565 | |
| |
Hospira, Inc.(b) | | | 1,450 | | | | 44,037 | |
| |
| Johnson & Johnson | | | 24,183 | | | | 1,585,921 | |
| |
| Merck & Co., Inc. | | | 26,991 | | | | 1,017,561 | |
| |
Mylan Inc.(b) | | | 3,807 | | | | 81,698 | |
| |
| Perrigo Co. | | | 824 | | | | 80,175 | |
| |
| Pfizer Inc. | | | 68,074 | | | | 1,473,121 | |
| |
Watson Pharmaceuticals, Inc.(b) | | | 1,125 | | | | 67,883 | |
| |
| | | | | | | | 6,339,459 | |
| |
Property & Casualty Insurance–2.11%
| | | | |
| ACE Ltd. (Switzerland) | | | 2,973 | | | | 208,467 | |
| |
| Allstate Corp. (The) | | | 4,475 | | | | 122,660 | |
| |
Berkshire Hathaway Inc.–Class B(b) | | | 15,576 | | | | 1,188,449 | |
| |
| Chubb Corp. (The) | | | 2,462 | | | | 170,420 | |
| |
| Cincinnati Financial Corp. | | | 1,431 | | | | 43,588 | |
| |
| Progressive Corp. (The) | | | 5,460 | | | | 106,524 | |
| |
| Travelers Cos., Inc. (The) | | | 3,654 | | | | 216,207 | |
| |
| XL Group PLC (Ireland) | | | 2,805 | | | | 55,455 | |
| |
| | | | | | | | 2,111,770 | |
| |
Publishing–0.16%
| | | | |
| Gannett Co., Inc. | | | 2,139 | | | | 28,598 | |
| |
| McGraw-Hill Cos., Inc. (The) | | | 2,598 | | | | 116,832 | |
| |
| Washington Post Co. (The)–Class B | | | 43 | | | | 16,203 | |
| |
| | | | | | | | 161,633 | |
| |
Railroads–0.86%
| | | | |
| CSX Corp. | | | 9,297 | | | | 195,795 | |
| |
| Norfolk Southern Corp. | | | 2,976 | | | | 216,831 | |
| |
| Union Pacific Corp. | | | 4,278 | | | | 453,211 | |
| |
| | | | | | | | 865,837 | |
| |
Real Estate Services–0.04%
| | | | |
CBRE Group, Inc.–Class A(b) | | | 2,879 | | | | 43,818 | |
| |
Regional Banks–0.89%
| | | | |
| BB&T Corp. | | | 6,133 | | | | 154,367 | |
| |
| Fifth Third Bancorp | | | 8,094 | | | | 102,956 | |
| |
| First Horizon National Corp. | | | 2,326 | | | | 18,608 | |
| |
| Huntington Bancshares Inc. | | | 7,700 | | | | 42,273 | |
| |
| KeyCorp | | | 8,385 | | | | 64,481 | |
| |
| M&T Bank Corp. | | | 1,105 | | | | 84,356 | |
| |
| PNC Financial Services Group, Inc. | | | 4,658 | | | | 268,627 | |
| |
| Regions Financial Corp. | | | 11,183 | | | | 48,087 | |
| |
| SunTrust Banks, Inc. | | | 4,720 | | | | 83,544 | |
| |
| Zions Bancorp. | | | 1,665 | | | | 27,106 | |
| |
| | | | | | | | 894,405 | |
| |
Research & Consulting Services–0.07%
| | | | |
| Dun & Bradstreet Corp. (The) | | | 440 | | | | 32,925 | |
| |
| Equifax Inc. | | | 1,077 | | | | 41,723 | |
| |
| | | | | | | | 74,648 | |
| |
Residential REIT’s–0.28%
| | | | |
| Apartment Investment & Management Co.–Class A | | | 1,040 | | | | 23,826 | |
| |
| AvalonBay Communities, Inc. | | | 841 | | | | 109,835 | |
| |
| Equity Residential | | | 2,608 | | | | 148,734 | |
| |
| | | | | | | | 282,395 | |
| |
Restaurants–1.60%
| | | | |
Chipotle Mexican Grill, Inc.(b) | | | 275 | | | | 92,878 | |
| |
| Darden Restaurants, Inc. | | | 1,184 | | | | 53,967 | |
| |
| McDonald’s Corp. | | | 9,061 | | | | 909,090 | |
| |
| Starbucks Corp. | | | 6,601 | | | | 303,712 | |
| |
| Yum! Brands, Inc. | | | 4,087 | | | | 241,174 | |
| |
| | | | | | | | 1,600,821 | |
| |
Retail REIT’s–0.39%
| | | | |
| Kimco Realty Corp. | | | 3,581 | | | | 58,155 | |
| |
| Simon Property Group, Inc. | | | 2,601 | | | | 335,373 | |
| |
| | | | | | | | 393,528 | |
| |
Semiconductor Equipment–0.24%
| | | | |
| Applied Materials, Inc. | | | 11,595 | | | | 124,182 | |
| |
| KLA-Tencor Corp. | | | 1,469 | | | | 70,879 | |
| |
Novellus Systems, Inc.(b) | | | 589 | | | | 24,320 | |
| |
Teradyne, Inc.(b) | | | 1,649 | | | | 22,476 | |
| |
| | | | | | | | 241,857 | |
| |
Semiconductors–2.11%
| | | | |
Advanced Micro Devices, Inc.(b) | | | 5,212 | | | | 28,145 | |
| |
| Altera Corp. | | | 2,850 | | | | 105,735 | |
| |
| Analog Devices, Inc. | | | 2,634 | | | | 94,245 | |
| |
Broadcom Corp.–Class A(b) | | | 4,314 | | | | 126,659 | |
| |
First Solar, Inc.(b) | | | 526 | | | | 17,758 | |
| |
| Intel Corp. | | | 45,093 | | | | 1,093,505 | |
| |
| Linear Technology Corp. | | | 2,016 | | | | 60,540 | |
| |
LSI Corp.(b) | | | 4,941 | | | | 29,399 | |
| |
| Microchip Technology Inc. | | | 1,676 | | | | 61,392 | |
| |
Micron Technology, Inc.(b) | | | 8,735 | | | | 54,943 | |
| |
NVIDIA Corp.(b) | | | 5,414 | | | | 75,038 | |
| |
See accompanying Notes to Financial Statements which are an integral part of the financial statements.
Invesco V.I. S&P 500 Index Fund
| | | | | | | | | |
| | | Shares | | Value |
| |
| |
Semiconductors–(continued)
| | | | |
| | | | | | | | | |
See accompanying Notes to Financial Statements which are an integral part of the financial statements.
Invesco V.I. S&P 500 Index Fund
| | | | | | | | | |
| | | Shares | | Value |
| |
Biotechnology–(continued)
| | | | |
| | | | | | | | | |
Money Market Funds–0.30%
| | | | |
Liquid Assets Portfolio–Institutional Class(e) | | | 151,832 | | | $ | 151,832 | |
| |
Premier Portfolio–Institutional Class(e) | | | 151,831 | | | | 151,831 | |
| |
| Total Money Market Funds (Cost $303,663) | | | | | | | 303,663 | |
| |
| TOTAL INVESTMENTS–100.79% (Cost $64,284,089) | | | | | | | 101,061,518 | |
| |
| OTHER ASSETS LESS LIABILITIES–(0.79)% | | | | | | | (795,060 | ) |
| |
| NET ASSETS–100.00% | | | | | | $ | 100,266,458 | |
| |
Investment Abbreviations:
| | | |
| REIT – Real Estate Investment Trust | | |
Notes to Schedule of Investments:
| | |
| (a) | | Industry and/or sector classifications used in this report are generally according to the Global Industry Classification Standard, which was developed by and is the exclusive property and a service mark of MSCI Inc. and Standard & Poor’s. |
| (b) | | Non-income producing security. |
| (c) | | Affiliated company during the period. The Fund’s Adviser is a subsidiary of Invesco Ltd. and therefore, Invesco Ltd. is considered to be affiliated with the Fund. See Note 4. |
| (d) | | All or a portion of the value was pledged as collateral to cover margin requirements for open futures contracts. See Note 1I and Note 5. |
| (e) | | The money market fund and the Fund are affiliated by having the same investment adviser. |
See accompanying Notes to Financial Statements which are an integral part of the financial statements.
Invesco V.I. S&P 500 Index Fund
Statement of Assets and Liabilities
December 31, 2011
| | | | | |
Assets:
|
| Investments, at value (Cost $63,879,090) | | $ | 100,676,832 | |
| |
| Investments in affiliates, at value (Cost $404,999) | | | 384,686 | |
| |
| Total investments, at value (Cost $64,284,089) | | | 101,061,518 | |
| |
| Receivable for: | | | | |
| Investments sold | | | 15,676 | |
| |
| Dividends | | | 152,721 | |
| |
| Investment for trustee deferred compensation and retirement plans | | | 5,462 | |
| |
| Other assets | | | 3,148 | |
| |
| Total assets | | | 101,238,525 | |
| |
Liabilities:
|
| Payable for: | | | | |
| Fund shares reacquired | | | 451,553 | |
| |
| Variation margin | | | 1,625 | |
| |
| Accrued fees to affiliates | | | 463,987 | |
| |
| Accrued other operating expenses | | | 40,494 | |
| |
| Trustee deferred compensation and retirement plans | | | 14,408 | |
| |
| Total liabilities | | | 972,067 | |
| |
| Net assets applicable to shares outstanding | | $ | 100,266,458 | |
| |
Net assets consist of:
|
| Shares of beneficial interest | | $ | 81,765,264 | |
| |
| Undistributed net investment income | | | 1,876,324 | |
| |
| Undistributed net realized gain (loss) | | | (20,153,005 | ) |
| |
| Unrealized appreciation | | | 36,777,875 | |
| |
| | | $ | 100,266,458 | |
| |
Net Assets:
|
| Series I | | $ | 32,888,733 | |
| |
| Series II | | $ | 67,377,725 | |
| |
Shares outstanding, $0.001 par value per share, with an unlimited number of shares authorized:
|
| Series I | | | 2,893,884 | |
| |
| Series II | | | 5,961,057 | |
| |
| Series I: | | | | |
| Net asset value per share | | $ | 11.36 | |
| |
| Series II: | | | | |
| Net asset value per share | | $ | 11.30 | |
| |
Statement of Operations
For the year ended December 31, 2011
| | | | | |
Investment income:
|
| Dividends | | $ | 2,403,133 | |
| |
| Dividends from affiliates | | | 3,288 | |
| |
| Total investment income | | | 2,406,421 | |
| |
Expenses:
|
| Advisory fees | | | 137,949 | |
| |
| Administrative services fees | | | 72,757 | |
| |
| Custodian fees | | | 30,899 | |
| |
| Distribution fees — Series II | | | 199,351 | |
| |
| Transfer agent fees | | | 3,081 | |
| |
| Trustees’ and officers’ fees and benefits | | | 22,922 | |
| |
| Professional services fees | | | 36,531 | |
| |
| Other | | | 50,898 | |
| |
| Total expenses | | | 554,388 | |
| |
| Less: Fees waived | | | (34,517 | ) |
| |
| Net expenses | | | 519,871 | |
| |
| Net investment income | | | 1,886,550 | |
| |
Realized and unrealized gain from:
|
| Net realized gain from: | | | | |
| Investment securities | | | 5,309,625 | |
| |
| Futures contracts | | | 101,672 | |
| |
| | | | 5,411,297 | |
| |
| Change in net unrealized appreciation (depreciation) of: | | | | |
| Investment securities | | | (5,201,474 | ) |
| |
| Futures contracts | | | (12,936 | ) |
| |
| | | | (5,214,410 | ) |
| |
| Net realized and unrealized gain | | | 196,887 | |
| |
| Net increase in net assets resulting from operations | | $ | 2,083,437 | |
| |
See accompanying Notes to Financial Statements which are an integral part of the financial statements.
Invesco V.I. S&P 500 Index Fund
Statement of Changes in Net Assets
For the years ended December 31, 2011 and 2010
| | | | | | | | | |
| | | 2011 | | 2010 |
| |
Operations:
| | | | |
| Net investment income | | $ | 1,886,550 | | | $ | 1,995,988 | |
| |
| Net realized gain | | | 5,411,297 | | | | 800,753 | |
| |
| Change in net unrealized appreciation (depreciation) | | | (5,214,410 | ) | | | 14,020,170 | |
| |
| Net increase in net assets resulting from operations | | | 2,083,437 | | | | 16,816,911 | |
| |
Distributions to shareholders from net investment income:
| | | | |
| Series I | | | (682,191 | ) | | | (728,755 | ) |
| |
| Series II | | | (1,324,615 | ) | | | (1,463,002 | ) |
| |
| Total distributions from net investment income | | | (2,006,806 | ) | | | (2,191,757 | ) |
| |
Share transactions–net:
| | | | |
| Series I | | | (4,815,112 | ) | | | (5,557,429 | ) |
| |
| Series II | | | (21,052,946 | ) | | | (13,397,694 | ) |
| |
| Net increase (decrease) in net assets resulting from share transactions | | | (25,868,058 | ) | | | (18,955,123 | ) |
| |
| Net increase (decrease) in net assets | | | (25,791,427 | ) | | | (4,329,969 | ) |
| |
Net assets:
| | | | |
| Beginning of year | | | 126,057,885 | | | | 130,387,854 | |
| |
| End of year (includes undistributed net investment income of $1,876,324 and $2,009,166, respectively) | | $ | 100,266,458 | | | $ | 126,057,885 | |
| |
Notes to Financial Statements
December 31, 2011
NOTE 1—Significant Accounting Policies
Invesco V.I. S&P 500 Index Fund (the “Fund”) is a series portfolio of AIM Variable Insurance Funds (Invesco Variable Insurance Funds) (the “Trust”). The Trust is a Delaware statutory trust registered under the Investment Company Act of 1940, as amended (the “1940 Act”), as an open-end series management investment company consisting of twenty-eight separate portfolios, (each constituting a “Fund”). The assets, liabilities and operations of each portfolio are accounted for separately. Information presented in these financial statements pertains only to the Fund. Matters affecting each Fund or class will be voted on exclusively by the shareholders of such Fund or class. Current Securities and Exchange Commission (“SEC”) guidance, however, requires participating insurance companies offering separate accounts to vote shares proportionally in accordance with the instructions of the contract owners whose investments are funded by shares of each Fund or class.
The Fund’s investment objective is to provide investment results that, before expenses, correspond to the total return (i.e., the combination of capital changes and income) of the Standard & Poor’s 500® Composite Stock Price Index.
The Fund currently offers two classes of shares, Series I and Series II, both of which are offered to insurance company separate accounts funding variable annuity contracts and variable life insurance policies (“variable products”).
The following is a summary of the significant accounting policies followed by the Fund in the preparation of its financial statements.
| | |
| A. | | Security Valuations — Securities, including restricted securities, are valued according to the following policy. |
| | A security listed or traded on an exchange (except convertible bonds) is valued at its last sales price or official closing price as of the close of the customary trading session on the exchange where the security is principally traded, or lacking any sales or official closing price on a particular day, the security may be valued at the closing bid price on that day. Securities traded in the over-the-counter market are valued based on prices furnished by independent pricing services or market makers. When such securities are valued by an independent pricing service they may be considered fair valued. Futures contracts are valued at the final settlement price set by an exchange on which they are principally traded. Listed options are valued at the mean between the last bid and ask prices from the exchange on which they are principally traded. Options not listed on an exchange are valued by an independent source at the mean between the last bid and ask prices. For purposes of determining net asset value per share, futures and option contracts generally are valued 15 minutes after the close of the customary trading session of the New York Stock Exchange (“NYSE”). |
| | Investments in open-end and closed-end registered investment companies that do not trade on an exchange are valued at the end of day net asset value per share. Investments in open-end and closed-end registered investment companies that trade on an exchange are valued at the last sales price or official closing price as of the close of the customary trading session on the exchange where the security is principally traded. |
Invesco V.I. S&P 500 Index Fund
| | |
| | Debt obligations (including convertible bonds) and unlisted equities are fair valued using an evaluated quote provided by an independent pricing service. Evaluated quotes provided by the pricing service may be determined without exclusive reliance on quoted prices, and may reflect appropriate factors such as institution-size trading in similar groups of securities, developments related to specific securities, dividend rate, yield, quality, type of issue, coupon rate, maturity, individual trading characteristics and other market data. Debt securities are subject to interest rate and credit risks. In addition, all debt securities involve some risk of default with respect to interest and/or principal payments. |
| | Foreign securities (including foreign exchange contracts) are converted into U.S. dollar amounts using the applicable exchange rates as of the close of the NYSE. If market quotations are available and reliable for foreign exchange traded equity securities, the securities will be valued at the market quotations. Because trading hours for certain foreign securities end before the close of the NYSE, closing market quotations may become unreliable. If between the time trading ends on a particular security and the close of the customary trading session on the NYSE, events occur that are significant and make the closing price unreliable, the Fund may fair value the security. If the event is likely to have affected the closing price of the security, the security will be valued at fair value in good faith using procedures approved by the Board of Trustees. Adjustments to closing prices to reflect fair value may also be based on a screening process of an independent pricing service to indicate the degree of certainty, based on historical data, that the closing price in the principal market where a foreign security trade is not the current value as of the close of the NYSE. Foreign securities meeting the approved degree of certainty that the price is not reflective of current value will be priced at the indication of fair value from the independent pricing service. Multiple factors may be considered by the independent pricing service in determining adjustments to reflect fair value and may include information relating to sector indices, American Depositary Receipts and domestic and foreign index futures. Foreign securities may have additional risks including exchange rate changes, potential for sharply devalued currencies and high inflation, political and economic upheaval, the relative lack of issuer information, relatively low market liquidity and the potential lack of strict financial and accounting controls and standards. |
| | Securities for which market prices are not provided by any of the above methods may be valued based upon quotes furnished by independent sources. The last bid price may be used to value equity securities. The mean between the last bid and asked prices is used to value debt obligations, including Corporate Loans. |
| | Securities for which market quotations are not readily available or are unreliable are valued at fair value as determined in good faith by or under the supervision of the Trust’s officers following procedures approved by the Board of Trustees. Issuer specific events, market trends, bid/ask quotes of brokers and information providers and other market data may be reviewed in the course of making a good faith determination of a security’s fair value. |
| | Valuations change in response to many factors including the historical and prospective earnings of the issuer, the value of the issuer’s assets, general economic conditions, interest rates, investor perceptions and market liquidity. Because of the inherent uncertainties of valuation, the values reflected in the financial statements may materially differ from the value received upon actual sale of those investments. |
| B. | | Securities Transactions and Investment Income — Securities transactions are accounted for on a trade date basis. Realized gains or losses on sales are computed on the basis of specific identification of the securities sold. Interest income is recorded on the accrual basis from settlement date. Dividend income (net of withholding tax, if any) is recorded on the ex-dividend date. |
| | The Fund may periodically participate in litigation related to Fund investments. As such, the Fund may receive proceeds from litigation settlements. Any proceeds received are included in the Statement of Operations as realized gain (loss) for investments no longer held and as unrealized gain (loss) for investments still held. |
| | Brokerage commissions and mark ups are considered transaction costs and are recorded as an increase to the cost basis of securities purchased and/or a reduction of proceeds on a sale of securities. Such transaction costs are included in the determination of net realized and unrealized gain (loss) from investment securities reported in the Statement of Operations and the Statement of Changes in Net Assets and the net realized and unrealized gains (losses) on securities per share in the Financial Highlights. Transaction costs are included in the calculation of the Fund’s net asset value and, accordingly, they reduce the Fund’s total returns. These transaction costs are not considered operating expenses and are not reflected in net investment income reported in the Statement of Operations and Statement of Changes in Net Assets, or the net investment income per share and ratios of expenses and net investment income reported in the Financial Highlights, nor are they limited by any expense limitation arrangements between the Fund and the investment adviser. |
| | The Fund allocates income and realized and unrealized capital gains and losses to a class based on the relative net assets of each class. |
| C. | | Country Determination — For the purposes of making investment selection decisions and presentation in the Schedule of Investments, the investment adviser may determine the country in which an issuer is located and/or credit risk exposure based on various factors. These factors include the laws of the country under which the issuer is organized, where the issuer maintains a principal office, the country in which the issuer derives 50% or more of its total revenues and the country that has the primary market for the issuer’s securities, as well as other criteria. Among the other criteria that may be evaluated for making this determination are the country in which the issuer maintains 50% or more of its assets, the type of security, financial guarantees and enhancements, the nature of the collateral and the sponsor organization. Country of issuer and/or credit risk exposure has been determined to be the United States of America, unless otherwise noted. |
| D. | | Distributions — Distributions from income and net realized capital gain, if any, are generally paid to separate accounts of participating insurance companies annually and recorded on ex-dividend date. |
| E. | | Federal Income Taxes — The Fund intends to comply with the requirements of Subchapter M of the Internal Revenue Code necessary to qualify as a regulated investment company and to distribute substantially all of the Fund’s taxable earnings to shareholders. As such, the Fund will not be subject to federal income taxes on otherwise taxable income (including net realized capital gain) that is distributed to shareholders. Therefore, no provision for federal income taxes is recorded in the financial statements. |
| | The Fund files tax returns in the U.S. Federal jurisdiction and certain other jurisdictions. Generally, the Fund is subject to examinations by such taxing authorities for up to three years after the filing of the return for the tax period. |
| F. | | Expenses — Fees provided for under the Rule 12b-1 plan of a particular class of the Fund and which are directly attributable to that class are charged to the operations of such class. All other expenses are allocated among the classes based on relative net assets. |
Invesco V.I. S&P 500 Index Fund
| | |
| G. | | Accounting Estimates — The preparation of financial statements in conformity with accounting principles generally accepted in the United States of America (“GAAP”) requires management to make estimates and assumptions that affect the reported amounts of assets and liabilities at the date of the financial statements and the reported amounts of revenues and expenses during the reporting period including estimates and assumptions related to taxation. Actual results could differ from those estimates by a significant amount. In addition, the Fund monitors for material events or transactions that may occur or become known after the period-end date and before the date the financial statements are released to print. |
| H. | | Indemnifications — Under the Trust’s organizational documents, each Trustee, officer, employee or other agent of the Trust is indemnified against certain liabilities that may arise out of performance of their duties to the Fund. Additionally, in the normal course of business, the Fund enters into contracts, including the Fund’s servicing agreements that contain a variety of indemnification clauses. The Fund’s maximum exposure under these arrangements is unknown as this would involve future claims that may be made against the Fund that have not yet occurred. The risk of material loss as a result of such indemnification claims is considered remote. |
| I. | | Futures Contracts — The Fund may enter into futures contracts to manage exposure to interest rate, equity and market price movements and/or currency risks. A futures contract is an agreement between two parties to purchase or sell a specified underlying security, currency or commodity (or delivery of a cash settlement price, in the case of an index future) for a fixed price at a future date. The Fund currently invests only in exchange-traded futures and they are standardized as to maturity date and underlying financial instrument. Initial margin deposits required upon entering into futures contracts are satisfied by the segregation of specific securities or cash as collateral at the futures commission merchant (broker). During the period the futures contracts are open, changes in the value of the contracts are recognized as unrealized gains or losses by recalculating the value of the contracts on a daily basis. Subsequent or variation margin payments are received or made depending upon whether unrealized gains or losses are incurred. These amounts are reflected as receivables or payables on the Statement of Assets and Liabilities. When the contracts are closed or expire, the Fund recognizes a realized gain or loss equal to the difference between the proceeds from, or cost of, the closing transaction and the Fund’s basis in the contract. The net realized gain (loss) and the change in unrealized gain (loss) on futures contracts held during the period is included on the Statement of Operations. The primary risks associated with futures contracts are market risk and the absence of a liquid secondary market. If the Fund were unable to liquidate a futures contract and/or enter into an offsetting closing transaction, the Fund would continue to be subject to market risk with respect to the value of the contracts and continue to be required to maintain the margin deposits on the futures contracts. Futures contracts have minimal counterparty risk since the exchange’s clearinghouse, as counterparty to all exchange-traded futures, guarantees the futures against default. Risks may exceed amounts recognized in the Statement of Assets and Liabilities. |
| J. | | Collateral — To the extent the Fund has pledged or segregated a security as collateral and that security is subsequently sold, it is the Fund’s practice to replace such collateral no later than the next business day. |
NOTE 2—Advisory Fees and Other Fees Paid to Affiliates
The Trust has entered into a master investment advisory agreement with Invesco Advisers, Inc. (the “Adviser” or “Invesco”). Under the terms of the investment advisory agreement, the Fund pays an advisory fee to the Adviser based on the annual rate of the Fund’s average daily net assets as follows:
| | | | | |
| Average Daily Net Assets | | Rate |
| |
| First $2 billion | | | 0 | .12% |
| |
| Over $2 billion | | | 0 | .10% |
| |
Under the terms of a master sub-advisory agreement between the Adviser and each of Invesco Asset Management Deutschland GmbH, Invesco Asset Management Limited, Invesco Asset Management (Japan) Limited, Invesco Australia Limited, Invesco Hong Kong Limited, Invesco Senior Secured Management, Inc. and Invesco Canada Ltd. (collectively, the “Affiliated Sub-Advisers”) the Adviser, not the Fund, may pay 40% of the fees paid to the Adviser to any such Affiliated Sub-Adviser(s) that provide discretionary investment management services to the Fund based on the percentage of assets allocated to such Sub-Adviser(s).
The Adviser has contractually agreed, through at least June 30, 2012, to waive advisory fees and/or reimburse expenses of all shares to the extent necessary to limit total annual fund operating expenses after fee waiver and/or expense reimbursement (excluding certain items discussed below) of Series I shares to 0.28% and Series II shares to 0.53% of average daily net assets. In determining the Adviser’s obligation to waive advisory fees and/or reimburse expenses, the following expenses are not taken into account, and could cause the total annual fund operating expenses after fee waiver and/or expense reimbursement to exceed the numbers reflected above: (1) interest; (2) taxes; (3) dividend expense on short sales; (4) extraordinary or non-routine items, including litigation expenses; and (5) expenses that the Fund has incurred but did not actually pay because of an expense offset arrangement. Unless the Board of the Trustees and Invesco mutually agree to amend or continue the fee waiver agreement, it will terminate on June 30, 2012.
Further, the Adviser has contractually agreed, through at least June 30, 2012, to waive the advisory fee payable by the Fund in an amount equal to 100% of the net advisory fees the Adviser receives from the affiliated money market funds on investments by the Fund of uninvested cash in such affiliated money market funds.
For the year ended December 31, 2011, the Adviser waived advisory fees of $34,517.
The Trust has entered into a master administrative services agreement with Invesco pursuant to which the Fund has agreed to pay Invesco a fee for costs incurred in providing accounting services and fund administrative services to the Fund and to reimburse Invesco for administrative services fees paid to insurance companies that have agreed to provide services to the participants of separate accounts. These administrative services provided by the insurance companies may include, among other things: the printing of prospectuses, financial reports and proxy statements and the delivery of the same to existing participants; the maintenance of master accounts; the facilitation of purchases and redemptions requested by the participants; and the servicing of participants’ accounts. Pursuant to such agreement, for the year ended December 31, 2011, Invesco was paid $50,000 for accounting and fund administrative services and reimbursed $22,757 for services provided by insurance companies.
Invesco V.I. S&P 500 Index Fund
Also, Invesco has entered into service agreements whereby State Street Bank and Trust Company (“SSB”) serves as the custodian, fund accountant and provides certain administrative services to the Fund.
The Trust has entered into a transfer agency and service agreement with Invesco Investment Services, Inc. (“IIS”) pursuant to which the Fund has agreed to pay IIS a fee for providing transfer agency and shareholder services to the Fund and reimburse IIS for certain expenses incurred by IIS in the course of providing such services. For the year ended December 31, 2011, expenses incurred under the agreement are shown in the Statement of Operations as transfer agent fees.
The Trust has entered into a master distribution agreement with Invesco Distributors, Inc. (“IDI”) to serve as the distributor for the Fund. The Trust has adopted a plan pursuant to Rule 12b-1 under the 1940 Act with respect to the Fund’s Series II shares (the “Plan”). The Fund, pursuant to the Plan, pays IDI compensation at the annual rate of 0.25% of the Fund’s average daily net assets of Series II shares. Of the Plan payments, up to 0.25% of the average daily net assets of the Series II shares may be paid to insurance companies who furnish continuing personal shareholder services to customers who purchase and own Series II shares of the Fund. For the year ended December 31, 2011, expenses incurred under the Plan are detailed in the Statement of Operations as distribution fees.
Certain officers and trustees of the Trust are officers and directors of the Adviser, Invesco Ltd., IIS and/or IDI.
NOTE 3—Additional Valuation Information
GAAP defines fair value as the price that would be received to sell an asset or paid to transfer a liability in an orderly transaction between market participants at the measurement date, under current market conditions. GAAP establishes a hierarchy that prioritizes the inputs to valuation methods giving the highest priority to readily available unadjusted quoted prices in an active market for identical assets (Level 1) and the lowest priority to significant unobservable inputs (Level 3) generally when market prices are not readily available or are unreliable. Based on the valuation inputs, the securities or other investments are tiered into one of three levels. Changes in valuation methods may result in transfers in or out of an investment’s assigned level:
| | |
| | Level 1 — | Prices are determined using quoted prices in an active market for identical assets. |
| | Level 2 — | Prices are determined using other significant observable inputs. Observable inputs are inputs that other market participants may use in pricing a security. These may include quoted prices for similar securities, interest rates, prepayment speeds, credit risk, yield curves, loss severities, default rates, discount rates, volatilities and others. |
| | Level 3 — | Prices are determined using significant unobservable inputs. In situations where quoted prices or observable inputs are unavailable (for example, when there is little or no market activity for an investment at the end of the period), unobservable inputs may be used. Unobservable inputs reflect the Fund’s own assumptions about the factors market participants would use in determining fair value of the securities or instruments and would be based on the best available information. |
The following is a summary of the tiered valuation input levels, as of December 31, 2011. The level assigned to the securities valuations may not be an indication of the risk or liquidity associated with investing in those securities. Because of the inherent uncertainties of valuation, the values reflected in the financial statements may materially differ from the value received upon actual sale of those investments.
During the year ended December 31, 2011, there were no significant transfers between investment levels.
| | | | | | | | | | | | | | | | | |
| | | Level 1 | | Level 2 | | Level 3 | | Total |
| |
| Equity Securities | | $ | 101,061,408 | | | $ | 110 | | | $ | 0 | | | $ | 101,061,518 | |
| |
| Futures* | | | 446 | | | | — | | | | — | | | | 446 | |
| |
| Total Investments | | $ | 101,061,854 | | | $ | 110 | | | $ | 0 | | | $ | 101,061,964 | |
| |
| |
| * | Unrealized appreciation. |
NOTE 4—Investments in Affiliates
The Fund’s Adviser is a subsidiary of Invesco Ltd. and therefore, Invesco Ltd. is considered to be affiliated with the Fund. The following is a summary of the transactions in and earnings from investments in Invesco Ltd. for the year ended December 31, 2011.
| | | | | | | | | | | | | | | | | | | | | | | | | | | | | |
| | | | | | | | | Change in
| | | | | | |
| | | | | | | | | Unrealized
| | | | | | |
| | | Value
| | Purchases
| | Proceeds
| | Appreciation
| | Realized
| | Value
| | Dividend
|
| | | 12/31/10 | | at Cost | | from Sales | | (Depreciation) | | Gain (Loss) | | 12/31/11 | | Income |
| |
| Invesco Ltd. | | | $120,733 | | | | $4,293 | | | | $(26,075 | ) | | | $(13,420 | ) | | | $(4,508 | ) | | | $81,023 | | | | $2,157 | |
| |
Invesco V.I. S&P 500 Index Fund
NOTE 5—Derivative Investments
Value of Derivative Instruments at Period-End
The table below summarizes the value of the Fund’s derivative instruments, detailed by primary risk exposure, held as of December 31, 2011:
| | | | | | | | | |
| | | Value |
| Risk Exposure/Derivative Type | | Assets | | Liabilities |
| |
| Interest rate risk | | | | | | | | |
Futures contracts(a) | | $ | 853 | | | $ | (407 | ) |
| |
| | |
| (a) | | Includes cumulative appreciation (depreciation) of futures contracts. Only current day’s variation margin receivable (payable) is reported within the Statement of Assets and Liabilities. |
Effect of Derivative Instruments for the year ended December 31, 2011
The table below summarizes the gains (losses) on derivative instruments, detailed by primary risk exposure, recognized in earnings during the period:
| | | | | |
| | | Location of Gain (Loss) on
|
| | | Statement of Operations |
| | | Futures* |
| |
| Realized Gain | | | | |
| Interest rate risk | | $ | 101,672 | |
| |
| Change in Unrealized Appreciation (Depreciation) | | | | |
| Interest rate risk | | | (12,936 | ) |
| |
| Total | | $ | 88,736 | |
| |
| |
| * | The average notional value of futures outstanding during the period was $1,332,036. |
| | | | | | | | | | | | | | | | | |
| Open Futures Contracts |
| | | Number of
| | Expiration
| | Notional
| | Unrealized
|
| Long Contracts | | Contracts | | Month | | Value | | Appreciation |
| |
E-Mini S&P 500 Index | | | 7 | | | | March-2012 | | | $ | 438,410 | | | $ | 446 | |
| |
NOTE 6—Trustees’ and Officers’ Fees and Benefits
“Trustees’ and Officers’ Fees and Benefits” include amounts accrued by the Fund to pay remuneration to certain Trustees and Officers of the Fund. Trustees have the option to defer compensation payable by the Fund, and “Trustees’ and Officers’ Fees and Benefits” also include amounts accrued by the Fund to fund such deferred compensation amounts. Those Trustees who defer compensation have the option to select various Invesco Funds in which their deferral accounts shall be deemed to be invested. Finally, certain current Trustees are eligible to participate in a retirement plan that provides for benefits to be paid upon retirement to Trustees over a period of time based on the number of years of service. The Fund may have certain former Trustees who also participate in a retirement plan and receive benefits under such plan. “Trustees’ and Officers’ Fees and Benefits” include amounts accrued by the Fund to fund such retirement benefits. Obligations under the deferred compensation and retirement plans represent unsecured claims against the general assets of the Fund.
During the year ended December 31, 2011, the Fund paid legal fees of $1,271 for services rendered by Kramer, Levin, Naftalis & Frankel LLP as counsel to the Independent Trustees. A partner of that firm is a Trustee of the Trust.
NOTE 7—Cash Balances
The Fund is permitted to temporarily carry a negative or overdrawn balance in its account with State Street Bank and Trust Company, the custodian bank. To compensate the custodian bank for such overdrafts, the overdrawn Fund may either (1) leave funds as a compensating balance in the account so the custodian bank can be compensated by earning the additional interest; or (2) compensate by paying the custodian bank at a rate agreed upon by the custodian bank and Invesco, not to exceed the contractually agreed upon rate.
NOTE 8—Distributions to Shareholders and Tax Components of Net Assets
Tax Character of Distributions to Shareholders Paid During the Years Ended December 31, 2011 and 2010:
| | | | | | | | | |
| | | 2011 | | 2010 |
| |
| Ordinary income | | $ | 2,006,806 | | | $ | 2,191,757 | |
| |
Invesco V.I. S&P 500 Index Fund
Tax Components of Net Assets at Period-End:
| | | | | |
| | | 2011 |
| |
| Undistributed ordinary income | | $ | 1,858,926 | |
| |
| Net unrealized appreciation — investments | | | 31,466,476 | |
| |
| Temporary book/tax differences | | | (8,677 | ) |
| |
| Capital loss carryforward | | | (14,815,531 | ) |
| |
| Shares of beneficial interest | | | 81,765,264 | |
| |
| Total net assets | | $ | 100,266,458 | |
| |
The difference between book-basis and tax-basis unrealized appreciation (depreciation) is due to differences in the timing of recognition of gains and losses on investments for tax and book purposes. The Fund’s net unrealized appreciation difference is attributable primarily to wash sales.
The temporary book/tax differences are a result of timing differences between book and tax recognition of income and/or expenses. The Fund’s temporary book/tax differences are the result of the trustee deferral of compensation and retirement plan benefits.
Capital loss carryforward is calculated and reported as of a specific date. Results of transactions and other activity after that date may affect the amount of capital loss carryforward actually available for the Fund to utilize. The Regulated Investment Company Modernization Act of 2010 (the “Act”) eliminated the eight-year carryover period for capital losses that arise in taxable years beginning after its enactment date of December 22, 2010. Consequently, these capital losses can be carried forward for an unlimited period. However, capital losses with an expiration period may not be used to offset capital gains until all net capital losses without an expiration date have been utilized. Additionally, post-enactment capital loss carryovers will retain their character as either short-term or long-term capital losses instead of as short-term capital losses as under prior law. The ability to utilize capital loss carryforward in the future may be limited under the Internal Revenue Code and related regulations based on the results of future transactions.
The Fund utilized $5,191,243 of capital loss carryforward in the current period to offset net realized capital gain for federal income tax purposes. The Fund has a capital loss carryforward as of December 31, 2011, which expires as follows:
| | | | | | | | | | | | | |
| Capital Loss Carryforward |
| Expiration | | Short-Term | | Long-Term | | Total |
| |
| December 31, 2013 | | $ | 7,984,682 | | | $ | | | | $ | 7,984,682 | |
| |
| December 31, 2014 | | | 5,449,556 | | | | | | | | 5,449,556 | |
| |
| December 31, 2017 | | | 1,381,293 | | | | | | | | 1,381,293 | |
| |
| Total capital loss carryforward | | $ | 14,815,531 | | | $ | | | | $ | 14,815,531 | |
| |
| |
| * | Capital loss carryforward as of the date listed above is reduced for limitations, if any, to the extent required by the Internal Revenue Code. |
NOTE 9—Investment Securities
The aggregate amount of investment securities (other than short-term securities, U.S. Treasury obligations and money market funds, if any) purchased and sold by the Fund during the year ended December 31, 2011 was $4,316,509 and $27,804,421, respectively. Cost of investments on a tax basis includes the adjustments for financial reporting purposes as of the most recently completed Federal income tax reporting period-end.
| | | | | |
| Unrealized Appreciation (Depreciation) of Investment Securities on a Tax Basis |
| Aggregate unrealized appreciation of investment securities | | $ | 38,210,576 | |
| |
| Aggregate unrealized (depreciation) of investment securities | | | (6,744,100 | ) |
| |
| Net unrealized appreciation of investment securities | | $ | 31,466,476 | |
| |
| Cost of investments for tax purposes is $69,595,042. | | | | |
NOTE 10—Reclassification of Permanent Differences
Primarily as a result of differing book/tax treatment of litigation settlements and Real Estate Income Trust distributions, on December 31, 2011, undistributed net investment income was decreased by $12,586, undistributed net realized gain (loss) was increased by $8,803 and shares of beneficial interest increased by $3,783. This reclassification had no effect on the net assets of the Fund.
Invesco V.I. S&P 500 Index Fund
NOTE 11—Share Information
| | | | | | | | | | | | | | | | | |
| | | Summary of Share Activity |
| |
| | | Year ended December 31, |
| | | 2011(a) | | 2010 |
| | | Shares | | Amount | | Shares | | Amount |
| |
| Sold: | | | | | | | | | | | | | | | | |
| Series I | | | 95,570 | | | $ | 1,079,344 | | | | 114,148 | | | $ | 1,178,964 | |
| |
| Series II | | | 170,970 | | | | 1,951,516 | | | | 141,688 | | | | 1,423,360 | |
| |
| Issued as reinvestment of dividends: | | | | | | | | | | | | | | | | |
| Series I | | | 66,816 | | | | 682,191 | | | | 73,537 | | | | 728,755 | |
| |
| Series II | | | 130,376 | | | | 1,324,615 | | | | 148,378 | | | | 1,463,002 | |
| |
| Reacquired: | | | | | | | | | | | | | | | | |
| Series I | | | (566,020 | ) | | | (6,576,647 | ) | | | (723,269 | ) | | | (7,465,148 | ) |
| |
| Series II | | | (2,129,902 | ) | | | (24,329,077 | ) | | | (1,577,214 | ) | | | (16,284,056 | ) |
| |
| Net increase (decrease) in share activity | | | (2,232,190 | ) | | $ | (25,868,058 | ) | | | (1,822,732 | ) | | $ | (18,955,123 | ) |
| |
| | |
| (a) | | There are entities that are record owners of more than 5% of the outstanding shares of the Fund and in the aggregate own 92% of the outstanding shares of the Fund. The Fund and the Fund’s principal underwriter or advisor, are parties to participation agreements with these entities whereby these entities sell units of interest in separate accounts funding variable products that are invested in the Fund. The Fund, Invesco and/or Invesco affiliates may make payments to these entities, which are considered to be related to the Fund, for providing services to the Fund, Invesco and/or Invesco affiliates including but not limited to services such as, securities brokerage, third party record keeping and account servicing and administrative services. The Trust has no knowledge as to whether all or portion of the shares owned of record by these entities are also owned beneficially. |
NOTE 12—Financial Highlights
The following schedule presents financial highlights for a share of the Fund outstanding throughout the periods indicated.
| | | | | | | | | | | | | | | | | | | | | | | | | | | | | | | | | | | | | | | | | | | | | | | | | |
| | | | | | | | | | | | | | | | | | | Ratio of
| | Ratio of
| | | | |
| | | | | | | Net gains
| | | | | | | | | | | | expenses
| | expenses
| | | | |
| | | | | | | (losses) on
| | | | | | | | | | | | to average
| | to average net
| | Ratio of net
| | |
| | | Net asset
| | | | securities
| | | | Dividends
| | | | | | | | net assets
| | assets without
| | investment
| | |
| | | value,
| | Net
| | (both
| | Total from
| | from net
| | Net asset
| | | | Net assets,
| | with fee waivers
| | fee waivers
| | income
| | |
| | | beginning
| | investment
| | realized and
| | investment
| | investment
| | value, end
| | Total
| | end of period
| | and/or expenses
| | and/or expenses
| | to average
| | Portfolio
|
| | | of period | | income(a) | | unrealized) | | operations | | income | | of period | | Return(b) | | (000s omitted) | | absorbed | | absorbed | | net assets | | turnover(c) |
| |
| Series I |
| Year ended 12/31/11 | | $ | 11.42 | | | $ | 0.21 | | | $ | (0.04 | ) | | $ | 0.17 | | | $ | (0.23 | ) | | $ | 11.36 | | | | 1.76 | % | | $ | 32,889 | | | | 0.28 | %(d) | | | 0.31 | %(d) | | | 1.81 | %(d) | | | 4 | % |
| Year ended 12/31/10 | | | 10.14 | | | | 0.19 | | | | 1.29 | | | | 1.48 | | | | (0.20 | ) | | | 11.42 | | | | 14.87 | | | | 37,651 | | | | 0.28 | | | | 0.42 | | | | 1.79 | | | | 6 | |
| Year ended 12/31/09 | | | 8.27 | | | | 0.18 | | | | 1.94 | | | | 2.12 | | | | (0.25 | ) | | | 10.14 | | | | 26.34 | | | | 38,873 | | | | 0.28 | (e) | | | 0.28 | (e) | | | 2.09 | (e) | | | 5 | |
| Year ended 12/31/08 | | | 13.46 | | | | 0.23 | | | | (5.14 | ) | | | (4.91 | ) | | | (0.28 | ) | | | 8.27 | | | | (37.07 | ) | | | 33,801 | | | | 0.30 | (e) | | | 0.30 | (e) | | | 2.01 | (e) | | | 14 | |
| Year ended 12/31/07 | | | 13.02 | | | | 0.23 | | | | 0.45 | | | | 0.68 | | | | (0.24 | ) | | | 13.46 | | | | 5.23 | | | | 66,275 | | | | 0.27 | | | | 0.27 | | | | 1.71 | | | | 3 | |
| |
| Series II |
| Year ended 12/31/11 | | | 11.35 | | | | 0.18 | | | | (0.03 | ) | | | 0.15 | | | | (0.20 | ) | | | 11.30 | | | | 1.53 | | | | 67,378 | | | | 0.53 | (d) | | | 0.56 | (d) | | | 1.56 | (d) | | | 4 | |
| Year ended 12/31/10 | | | 10.08 | | | | 0.16 | | | | 1.28 | | | | 1.44 | | | | (0.17 | ) | | | 11.35 | | | | 14.58 | | | | 88,407 | | | | 0.53 | | | | 0.67 | | | | 1.54 | | | | 6 | |
| Year ended 12/31/09 | | | 8.21 | | | | 0.16 | | | | 1.93 | | | | 2.09 | | | | (0.22 | ) | | | 10.08 | | | | 26.06 | | | | 91,515 | | | | 0.53 | (e) | | | 0.53 | (e) | | | 1.84 | (e) | | | 5 | |
| Year ended 12/31/08 | | | 13.36 | | | | 0.20 | | | | (5.11 | ) | | | (4.91 | ) | | | (0.24 | ) | | | 8.21 | | | | (37.27 | ) | | | 80,115 | | | | 0.55 | (e) | | | 0.55 | (e) | | | 1.76 | (e) | | | 14 | |
| Year ended 12/31/07 | | | 12.92 | | | | 0.20 | | | | 0.45 | | | | 0.65 | | | | (0.21 | ) | | | 13.36 | | | | 5.00 | | | | 152,984 | | | | 0.52 | | | | 0.52 | | | | 1.46 | | | | 3 | |
| |
| | |
| (a) | | Calculated using average shares outstanding. |
| (b) | | Includes adjustments in accordance with accounting principles generally accepted in the United States of America and as such, the net asset value for financial reporting purposes and the returns based upon those net asset values may differ from the net asset value and returns for shareholder transactions. Total returns are not annualized for periods less than one year, if applicable, and do not reflect charges assessed in connection with a variable product, which if included would reduce total returns. |
| (c) | | Portfolio turnover is calculated at the fund level and is not annualized for the periods less than one year, if applicable. |
| (d) | | Ratios are based on average daily net assets (000’s omitted) of $35,217 and $79,740 for Series I and Series II shares, respectively. |
| (e) | | The ratios reflect the rebate of certain Fund expenses in connection with investments in an affiliate during the period. The effect of the rebate on the ratios is less than 0.005% |
Invesco V.I. S&P 500 Index Fund
Report of Independent Registered Public Accounting Firm
To the Board of Trustees of AIM Variable Insurance Funds (Invesco Variable Insurance Funds)
and Shareholders of Invesco V.I. S&P 500 Index Fund:
In our opinion, the accompanying statement of assets and liabilities, including the schedule of investments, and the related statements of operations and of changes in net assets and the financial highlights present fairly, in all material respects, the financial position of Invesco V.I. S&P 500 Index Fund (one of the funds constituting AIM Variable Insurance Funds (Invesco Variable Insurance Funds), hereafter referred to as the “Fund”) at December 31, 2011, the results of its operations for the year then ended, and the changes in its net assets and the financial highlights for each of the two years in the period then ended, in conformity with accounting principles generally accepted in the United States of America. These financial statements and financial highlights (hereafter referred to as “financial statements”) are the responsibility of the Fund’s management; our responsibility is to express an opinion on these financial statements based on our audits. We conducted our audits of these financial statements in accordance with the standards of the Public Company Accounting Oversight Board (United States). Those standards require that we plan and perform the audits to obtain reasonable assurance about whether the financial statements are free of material misstatement. An audit includes examining, on a test basis, evidence supporting the amounts and disclosures in the financial statements, assessing the accounting principles used and significant estimates made by management, and evaluating the overall financial statement presentation. We believe that our audits, which included confirmation of securities at December 31, 2011 by correspondence with the custodian and brokers, provide a reasonable basis for our opinion. The financial highlights of the Fund for the periods ended December 31, 2009 and prior were audited by other independent auditors whose report dated February 26, 2010 expressed an unqualified opinion on those financial statements.
PRICEWATERHOUSECOOPERS LLP
February 14, 2012
Houston, Texas
Invesco V.I. S&P 500 Index Fund
Calculating your ongoing Fund expenses
Example
As a shareholder of the Fund, you incur ongoing costs, including management fees; distribution and/or service fees (12b-1); and other Fund expenses. This example is intended to help you understand your ongoing costs (in dollars) of investing in the Fund and to compare these costs with ongoing costs of investing in other mutual funds. The example is based on an investment of $1,000 invested at the beginning of the period and held for the entire period July 1, 2011 through December 31, 2011.
The actual and hypothetical expenses in the examples below do not represent the effect of any fees or other expenses assessed in connection with a variable product; if they did, the expenses shown would be higher while the ending account values shown would be lower.
Actual expenses
The table below provides information about actual account values and actual expenses. You may use the information in this table, together with the amount you invested, to estimate the expenses that you paid over the period. Simply divide your account value by $1,000 (for example, an $8,600 account value divided by $1,000 = 8.6), then multiply the result by the number in the table under the heading entitled “Actual Expenses Paid During Period” to estimate the expenses you paid on your account during this period.
Hypothetical example for comparison purposes
The table below also provides information about hypothetical account values and hypothetical expenses based on the Fund’s actual expense ratio and an assumed rate of return of 5% per year before expenses, which is not the Fund’s actual return.
The hypothetical account values and expenses may not be used to estimate the actual ending account balance or expenses you paid for the period. You may use this information to compare the ongoing costs of investing in the Fund and other funds. To do so, compare this 5% hypothetical example with the 5% hypothetical examples that appear in the shareholder reports of the other funds.
Please note that the expenses shown in the table are meant to highlight your ongoing costs. Therefore, the hypothetical information is useful in comparing ongoing costs, and will not help you determine the relative total costs of owning different funds.
| | | | | | | | | | | | | | | | | | | | | | | | | | | | | | | |
| | | | | | | | | | HYPOTHETICAL
| | | |
| | | | | | | ACTUAL | | | (5% annual return before expenses) | | | |
| | | | Beginning
| | | Ending
| | | Expenses
| | | Ending
| | | Expenses
| | | Annualized
|
| | | | Account Value
| | | Account Value
| | | Paid During
| | | Account Value
| | | Paid During
| | | Expense
|
| Class | | | (07/01/11) | | | (12/31/11)1 | | | Period2 | | | (12/31/11) | | | Period2 | | | Ratio |
| Series I | | | $ | 1,000.00 | | | | $ | 962.00 | | | | $ | 1.38 | | | | $ | 1,023.79 | | | | $ | 1.43 | | | | | 0.28 | % |
| | | | | | | | | | | | | | | | | | | | | | | | | | | | | | | |
| Series II | | | | 1,000.00 | | | | | 959.50 | | | | | 2.62 | | | | | 1,022.53 | | | | | 2.70 | | | | | 0.53 | |
| | | | | | | | | | | | | | | | | | | | | | | | | | | | | | | |
| |
| 1 | The actual ending account value is based on the actual total return of the Fund for the period July 1, 2011 through December 31, 2011, after actual expenses and will differ from the hypothetical ending account value which is based on the Fund’s expense ratio and a hypothetical annual return of 5% before expenses. |
| 2 | Expenses are equal to the Fund’s annualized expense ratio as indicated above multiplied by the average account value over the period, multiplied by 184/365 to reflect the most recent fiscal half year. |
Invesco V.I. S&P 500 Index Fund
Form 1099-DIV, Form 1042-S and other year-end tax information provide shareholders with actual calendar year amounts that should be included in their tax returns. Shareholders should consult their tax advisors.
The following distribution information is being provided as required by the Internal Revenue Code or to meet a specific state’s requirement.
The Fund designates the following amounts or, if subsequently determined to be different, the maximum amount allowable for its fiscal year ended December 31, 2011:
| | | | | |
Federal and State Income Tax | | |
| |
| Qualified Dividend Income* | | | 0.00% | |
| Corporate Dividends Received Deduction* | | | 100% | |
| | |
| | * | The above percentages are based on ordinary income dividends paid to shareholders during the Fund’s fiscal year. |
Invesco V.I. S&P 500 Index Fund
Trustees and Officers
The address of each trustee and officer is AIM Variable Insurance Funds (Invesco Variable Insurance Funds) (the “Trust”), 11 Greenway Plaza, Suite 2500, Houston, Texas 77046-1173. The trustees serve for the life of the Trust, subject to their earlier death, incapacitation, resignation, retirement or removal as more specifically provided in the Trust’s organizational documents. Each officer serves for a one year term or until their successors are elected and qualified. Column two below includes length of time served with predecessor entities, if any.
| | | | | | | | | |
| | | | | | | Number of Funds
| | |
Name, Year of Birth and
| | Trustee and/
| | Principal Occupation(s)
| | in Fund Complex
| | Other Directorship(s)
|
| Position(s) Held with the Trust | | or Officer Since | | During Past 5 Years | | Overseen by Trustee | | Held by Trustee |
| | | | | | | | | |
| | | | | | | | | |
| | | | | | | | | |
Interested Persons | | | | | | | | |
| | | | | | | | | |
| | | | | | | | | |
| | | | | | | | | |
Martin L. Flanagan1 — 1960
Trustee | | 2007 | | Executive Director, Chief Executive Officer and President, Invesco Ltd. (ultimate parent of Invesco and a global investment management firm); Advisor to the Board, Invesco Advisers, Inc. (formerly known as Invesco Institutional (N.A.), Inc.); Trustee, The Invesco Funds; Vice Chair, Investment Company Institute; and Member of Executive Board, SMU Cox School of Business
Formerly: Chairman, Invesco Advisers, Inc. (registered investment adviser); Director, Chairman, Chief Executive Officer and President, IVZ Inc. (holding company), INVESCO Group Services, Inc. (service provider) and Invesco North American Holdings, Inc. (holding company); Director, Chief Executive Officer and President, Invesco Holding Company Limited (parent of Invesco and a global investment management firm); Director, Invesco Ltd.; Chairman, Investment Company Institute and President, Co-Chief Executive Officer, Co-President, Chief Operating Officer and Chief Financial Officer, Franklin Resources, Inc. (global investment management organization) | | 140 | | None |
| | | | | | | | | |
| | | | | | | | | |
| | | | | | | | | |
Philip A. Taylor2 — 1954
Trustee, President and Principal Executive Officer | | 2006 | | Head of North American Retail and Senior Managing Director, Invesco Ltd.; Director, Co-Chairman, Co-President and Co-Chief Executive Officer, Invesco Advisers, Inc. (formerly known as Invesco Institutional (N.A.), Inc.) (registered investment adviser); Director, Chairman, Chief Executive Officer and President, Invesco Management Group, Inc. (formerly Invesco Aim Management Group, Inc.) (financial services holding company); Director and President, INVESCO Funds Group, Inc. (registered investment adviser and registered transfer agent); Director and Chairman, Invesco Investment Services, Inc. (formerly known as Invesco Aim Investment Services, Inc.) (registered transfer agent) and IVZ Distributors, Inc. (formerly known as INVESCO Distributors, Inc.) (registered broker dealer); Director, President and Chairman, Invesco Inc. (holding company) and Invesco Canada Holdings Inc. (holding company); Chief Executive Officer, Invesco Corporate Class Inc. (corporate mutual fund company) and Invesco Canada Fund Inc. (corporate mutual fund company); Director, Chairman and Chief Executive Officer, Invesco Canada Ltd. (formerly known as Invesco Trimark Ltd./Invesco Trimark Ltèe) (registered investment adviser and registered transfer agent); Trustee, President and Principal Executive Officer, The Invesco Funds (other than AIM Treasurer’s Series Trust (Invesco Treasurer’s Series Trust) and Short-Term Investments Trust); Trustee and Executive Vice President, The Invesco Funds (AIM Treasurer’s Series Trust (Invesco Treasurer’s Series Trust) and Short-Term Investments Trust only); Director, Invesco Investment Advisers LLC (formerly known as Van Kampen Asset Management); Director, Chief Executive Officer and President, Van Kampen Exchange Corp. | | 140 | | None |
| | | | | | | | | |
| | | | | | | | | |
| | | | | Formerly: Director and Chairman, Van Kampen Investor Services Inc.: Director, Chief Executive Officer and President, 1371 Preferred Inc. (holding company); and Van Kampen Investments Inc.; Director and President, AIM GP Canada Inc. (general partner for limited partnerships); and Van Kampen Advisors, Inc.; Director and Chief Executive Officer, Invesco Trimark Dealer Inc. (registered broker dealer); Director, Invesco Distributors, Inc. (formerly known as Invesco Aim Distributors, Inc.) (registered broker dealer); Manager, Invesco PowerShares Capital Management LLC; Director, Chief Executive Officer and President, Invesco Advisers, Inc.; Director, Chairman, Chief Executive Officer and President, Invesco Aim Capital Management, Inc.; President, Invesco Trimark Dealer Inc. and Invesco Trimark Ltd./Invesco Trimark Ltèe; Director and President, AIM Trimark Corporate Class Inc. and AIM Trimark Canada Fund Inc.; Senior Managing Director, Invesco Holding Company Limited; Trustee and Executive Vice President, Tax-Free Investments Trust; Director and Chairman, Fund Management Company (former registered broker dealer); President and Principal Executive Officer, The Invesco Funds (AIM Treasurer’s Series Trust (Invesco Treasurer’s Series Trust), Short-Term Investments Trust and Tax-Free Investments Trust only); President, AIM Trimark Global Fund Inc. and AIM Trimark Canada Fund Inc. | | | | |
| | | | | | | | | |
| | | | | | | | | |
| | | | | | | | | |
Wayne W. Whalen3 — 1939
Trustee | | 2010 | | Of Counsel, and prior to 2010, partner in the law firm of Skadden, Arps, Slate, Meagher & Flom LLP, legal counsel to funds in the Fund Complex | | 158 | | Director of the Abraham Lincoln Presidential Library Foundation |
| | | | | | | | | |
| | | | | | | | | |
| | | | | | | | | |
Independent Trustees | | | | | | | | |
| | | | | | | | | |
| | | | | | | | | |
| | | | | | | | | |
Bruce L. Crockett — 1944
Trustee and Chair | | 1993 | | Chairman, Crockett Technology Associates (technology consulting company) | | 140 | | ACE Limited (insurance company); and Investment Company Institute |
| | | | | Formerly: Director, Captaris (unified messaging provider); Director, President and Chief Executive Officer COMSAT Corporation; and Chairman, Board of Governors of INTELSAT (international communications company) | | | | |
| | | | | | | | | |
| |
| 1 | Mr. Flanagan is considered an interested person of the Trust because he is an officer of the adviser to the Trust, and an officer and a director of Invesco Ltd., ultimate parent of the adviser to the Trust. |
| 2 | Mr. Taylor is considered an interested person of the Trust because he is an officer and a director of the adviser to, and a director of the principal underwriter of, the Trust. |
| 3 | Mr. Whalen is considered an “interested person” (within the meaning of Section 2(a)(19) of the 1940 Act) of certain Funds in the Fund Complex by reason of he and his firm currently providing legal services as legal counsel to such Funds in the Fund Complex. |
Invesco V.I. S&P 500 Index Fund
Trustees and Officers—(continued)
The address of each trustee and officer is AIM Variable Insurance Funds (Invesco Variable Insurance Funds) (the “Trust”), 11 Greenway Plaza, Suite 2500, Houston, Texas 77046-1173. The trustees serve for the life of the Trust, subject to their earlier death, incapacitation, resignation, retirement or removal as more specifically provided in the Trust’s organizational documents. Each officer serves for a one year term or until their successors are elected and qualified. Column two below includes length of time served with predecessor entities, if any.
| | | | | | | | | |
| | | | | | | Number of Funds
| | |
Name, Year of Birth and
| | Trustee and/
| | Principal Occupation(s)
| | in Fund Complex
| | Other Directorship(s)
|
| Position(s) Held with the Trust | | or Officer Since | | During Past 5 Years | | Overseen by Trustee | | Held by Trustee |
| | | | | | | | | |
| | | | | | | | | |
| | | | | | | |
Independent Trustees—(continued) | | | | | | |
| | | | | | | | | |
| | | | | | | | | |
| | | | | | | | | |
David C. Arch — 1945
Trustee | | 2010 | | Chairman and Chief Executive Officer of Blistex Inc., a consumer health care products manufacturer. | | 158 | | Member of the Heartland Alliance Advisory Board, a nonprofit organization serving human needs based in Chicago. Board member of the Illinois Manufacturers’ Association. Member of the Board of Visitors, Institute for the Humanities, University of Michigan |
| | | | | | | | | |
| | | | | | | | | |
| | | | | | | | | |
Frank S. Bayley — 1939
Trustee | | 2001 | | Retired
Formerly: Director, Badgley Funds, Inc. (registered investment company) (2 portfolios) and Partner, law firm of Baker & McKenzie
Formerly: Director, Badgley Funds, Inc. (registered investment company) (2 portfolios) and Partner, law firm of Baker & McKenzie | | 140 | | Director and Chairman, C.D. Stimson Company (a real estate investment company) |
| | | | | | | | | |
| | | | | | | | | |
| | | | | | | | | |
James T. Bunch — 1942
Trustee | | 2004 | | Managing Member, Grumman Hill Group LLC (family office private equity management)
Formerly: Founder, Green, Manning & Bunch Ltd. (investment banking firm)(1988-2010); Executive Committee, United States Golf Association; and Director, Policy Studies, Inc. and Van Gilder Insurance Corporation | | 140 | | Vice Chairman, Board of Governors, Western Golf Association/Evans Scholars Foundation and Director, Denver Film Society |
| | | | | | | | | |
| | | | | | | | | |
| | | | | | | | | |
Rodney F. Dammeyer — 1940
Trustee | | 2010 | | President of CAC, LLC, a private company offering capital investment and management advisory services.
Formerly: Prior to January 2004, Director of TeleTech Holdings Inc.; Prior to 2002, Director of Arris Group, Inc.; Prior to 2001, Managing Partner at Equity Group Corporate Investments. Prior to 1995, Vice Chairman of Anixter International. Prior to 1985, experience includes Senior Vice President and Chief Financial Officer of Household International, Inc., Executive Vice President and Chief Financial Officer of Northwest Industries, Inc. and Partner of Arthur Andersen & Co. | | 158 | | Director of Quidel Corporation and Stericycle, Inc. Prior to May 2008, Trustee of The Scripps Research Institute. Prior to February 2008, Director of Ventana Medical Systems, Inc. Prior to April 2007, Director of GATX Corporation. Prior to April 2004, Director of TheraSense, Inc. |
| | | | | | | | | |
| | | | | | | | | |
| | | | | | | | | |
Albert R. Dowden — 1941
Trustee | | 2000 | | Director of a number of public and private business corporations, including the Boss Group, Ltd. (private investment and management); Reich & Tang Funds (5 portfolios) (registered investment company); and Homeowners of America Holding Corporation/ Homeowners of America Insurance Company (property casualty company)
Formerly: Director, Continental Energy Services, LLC (oil and gas pipeline service); Director, CompuDyne Corporation (provider of product and services to the public security market) and Director, Annuity and Life Re (Holdings), Ltd. (reinsurance company); Director, President and Chief Executive Officer, Volvo Group North America, Inc.; Senior Vice President, AB Volvo; Director of various public and private corporations; Chairman, DHJ Media, Inc.; Director Magellan Insurance Company; and Director, The Hertz Corporation, Genmar Corporation (boat manufacturer), National Media Corporation; Advisory Board of Rotary Power International (designer, manufacturer, and seller of rotary power engines); and Chairman, Cortland Trust, Inc. (registered investment company) | | 140 | | Board of Nature’s Sunshine Products, Inc. |
| | | | | | | | | |
| | | | | | | | | |
| | | | | | | | | |
Jack M. Fields — 1952
Trustee | | 1997 | | Chief Executive Officer, Twenty First Century Group, Inc. (government affairs company); and Owner and Chief Executive Officer, Dos Angelos Ranch, L.P. (cattle, hunting, corporate entertainment), Discovery Global Education Fund (non-profit) and Cross Timbers Quail Research Ranch (non-profit)
Formerly: Chief Executive Officer, Texana Timber LP (sustainable forestry company) and member of the U.S. House of Representatives | | 140 | | Administaff |
| | | | | | | | | |
| | | | | | | | | |
| | | | | | | | | |
Carl Frischling — 1937
Trustee | | 1993 | | Partner, law firm of Kramer Levin Naftalis and Frankel LLP | | 140 | | Director, Reich & Tang Funds (16 portfolios) |
| | | | | | | | | |
| | | | | | | | | |
Invesco V.I. S&P 500 Index Fund
Trustees and Officers—(continued)
The address of each trustee and officer is AIM Variable Insurance Funds (Invesco Variable Insurance Funds) (the “Trust”), 11 Greenway Plaza, Suite 2500, Houston, Texas 77046-1173. The trustees serve for the life of the Trust, subject to their earlier death, incapacitation, resignation, retirement or removal as more specifically provided in the Trust’s organizational documents. Each officer serves for a one year term or until their successors are elected and qualified. Column two below includes length of time served with predecessor entities, if any.
| | | | | | | | | |
| | | | | | | Number of Funds
| | |
Name, Year of Birth and
| | Trustee and/
| | Principal Occupation(s)
| | in Fund Complex
| | Other Directorship(s)
|
| Position(s) Held with the Trust | | or Officer Since | | During Past 5 Years | | Overseen by Trustee | | Held by Trustee |
Independent Trustees—(continued) | | | | | | |
| | | | | | | | | |
| | | | | | | | | |
| | | | | | | | | |
Prema Mathai-Davis — 1950
Trustee | | 1998 | | Retired
Formerly: Chief Executive Officer, YWCA of the U.S.A. | | 140 | | None |
| | | | | | | | | |
| | | | | | | | | |
| | | | | | | | | |
Larry Soll — 1942
Trustee | | 2004 | | Retired
Formerly, Chairman, Chief Executive Officer and President, Synergen Corp. (a biotechnology company) | | 140 | | None |
| | | | | | | | | |
| | | | | | | | | |
| | | | | | | | | |
Hugo F. Sonnenschein — 1940
Trustee | | 2010 | | President Emeritus and Honorary Trustee of the University of Chicago and the Adam Smith Distinguished Service Professor in the Department of Economics at the University of Chicago. Prior to July 2000, President of the University of Chicago. | | 158 | | Trustee of the University of Rochester and a member of its investment committee. Member of the National Academy of Sciences, the American Philosophical Society and a fellow of the American Academy of Arts and Sciences |
| | | | | | | | | |
| | | | | | | | | |
| | | | | | | | | |
| Raymond Stickel, Jr. — 1944 Trustee | | 2005 | | Retired
Formerly: Director, Mainstay VP Series Funds, Inc. (25 portfolios) and Partner, Deloitte & Touche | | 140 | | None |
| | | | | | | | | |
| | | | | | | | | |
| | | | | | | | | |
Other Officers | | | | | | | | |
| | | | | | | | | |
| | | | | | | | | |
| | | | | | | | | |
Russell C. Burk — 1958
Senior Vice President and Senior Officer | | 2005 | | Senior Vice President and Senior Officer, The Invesco Funds | | N/A | | N/A |
| | | | | | | | | |
| | | | | | | | | |
| | | | | | | | | |
John M. Zerr — 1962
Senior Vice President, Chief Legal Officer and Secretary | | 2006 | | Director, Senior Vice President, Secretary and General Counsel, Invesco Management Group, Inc. (formerly known as Invesco Aim Management Group, Inc.) and Van Kampen Exchange Corp.; Senior Vice President, Invesco Advisers, Inc. (formerly known as Invesco Institutional (N.A.), Inc.) (registered investment adviser); Senior Vice President and Secretary, Invesco Distributors, Inc. (formerly known as Invesco Aim Distributors, Inc.); Director, Vice President and Secretary, Invesco Investment Services, Inc. (formerly known as Invesco Aim Investment Services, Inc.) and IVZ Distributors, Inc. (formerly known as INVESCO Distributors, Inc.); Director and Vice President, INVESCO Funds Group, Inc.; Senior Vice President, Chief Legal Officer and Secretary, The Invesco Funds; Manager, Invesco PowerShares Capital Management LLC; Director, Secretary and General Counsel, Invesco Investment Advisers LLC (formerly known as Van Kampen Asset Management); Secretary and General Counsel, Van Kampen Funds Inc. and Chief Legal Officer, PowerShares Exchange-Traded Fund Trust, PowerShares Exchange-Traded Fund Trust II, PowerShares India Exchange-Traded Fund Trust and PowerShares Actively Managed Exchange-Traded Fund Trust
Formerly: Director and Secretary, Van Kampen Advisors Inc.; Director Vice President, Secretary and General Counsel Van Kampen Investor Services Inc.; Director, Invesco Distributors, Inc. (formerly known as Invesco Aim Distributors, Inc.); Director, Senior Vice President, General Counsel and Secretary, Invesco Advisers, Inc.; and Van Kampen Investments Inc.; Director, Vice President and Secretary, Fund Management Company; Director, Senior Vice President, Secretary, General Counsel and Vice President, Invesco Aim Capital Management, Inc.; Chief Operating Officer and General Counsel, Liberty Ridge Capital, Inc. (an investment adviser); Vice President and Secretary, PBHG Funds (an investment company) and PBHG Insurance Series Fund (an investment company); Chief Operating Officer, General Counsel and Secretary, Old Mutual Investment Partners (a broker-dealer); General Counsel and Secretary, Old Mutual Fund Services (an administrator) and Old Mutual Shareholder Services (a shareholder servicing center); Executive Vice President, General Counsel and Secretary, Old Mutual Capital, Inc. (an investment adviser); and Vice President and Secretary, Old Mutual Advisors Funds (an investment company) | | N/A | | N/A |
| | | | | | | | | |
| | | | | | | | | |
| | | | | | | | | |
Lisa O. Brinkley — 1959
Vice President | | 2004 | | Global Compliance Director, Invesco Ltd.; Chief Compliance Officer, Invesco Investment Services, Inc.(formerly known as Invesco Aim Investment Services, Inc.); and Vice President, The Invesco Funds
Formerly: Chief Compliance Officer, Invesco Distributors, Inc. (formerly known as Invesco Aim Distributors, Inc.) and Van Kampen Investor Services Inc.; Senior Vice President, Invesco Management Group, Inc.; Senior Vice President and Chief Compliance Officer, Invesco Advisers, Inc. and The Invesco Funds; Vice President and Chief Compliance Officer, Invesco Aim Capital Management, Inc. and Invesco Distributors, Inc.; Vice President, Invesco Investment Services, Inc. and Fund Management Company | | N/A | | N/A |
| | | | | | | | | |
Invesco V.I. S&P 500 Index Fund
Trustees and Officers—(continued)
The address of each trustee and officer is AIM Variable Insurance Funds (Invesco Variable Insurance Funds) (the “Trust”), 11 Greenway Plaza, Suite 2500, Houston, Texas 77046-1173. The trustees serve for the life of the Trust, subject to their earlier death, incapacitation, resignation, retirement or removal as more specifically provided in the Trust’s organizational documents. Each officer serves for a one year term or until their successors are elected and qualified. Column two below includes length of time served with predecessor entities, if any.
| | | | | | | | | |
| | | | | | | Number of Funds
| | |
Name, Year of Birth and
| | Trustee and/
| | Principal Occupation(s)
| | in Fund Complex
| | Other Directorship(s)
|
| Position(s) Held with the Trust | | or Officer Since | | During Past 5 Years | | Overseen by Trustee | | Held by Trustee |
Other Officers—(continued) | | | | | | |
| | | | | | | | | |
| | | | | | | | | |
| | | | | | | | | |
Sheri Morris — 1964
Vice President, Treasurer and Principal Financial Officer | | 1999 | | Vice President, Treasurer and Principal Financial Officer, The Invesco Funds; Vice President, Invesco Advisers, Inc. (formerly known as Invesco Institutional (N.A.), Inc.) (registered investment adviser).
Formerly: Treasurer, PowerShares Exchange-Traded Fund Trust, PowerShares Exchange-Traded Fund Trust II, PowerShares India Exchange-Traded Fund Trust and PowerShares Actively Managed Exchange-Traded Fund Trust, Vice President, Invesco Advisers, Inc., Invesco Aim Capital Management, Inc. and Invesco Aim Private Asset Management, Inc.; Assistant Vice President and Assistant Treasurer, The Invesco Funds and Assistant Vice President, Invesco Advisers, Inc., Invesco Aim Capital Management, Inc. and Invesco Aim Private Asset Management, Inc. | | N/A | | N/A |
| | | | | | | | | |
| | | | | | | | | |
| | | | | | | | | |
Karen Dunn Kelley — 1960
Vice President | | 1993 | | Head of Invesco’s World Wide Fixed Income and Cash Management Group; Senior Vice President, Invesco Management Group, Inc. (formerly known as Invesco Aim Management Group, Inc.) and Invesco Advisers, Inc. (formerly known as Invesco Institutional (N.A.), Inc.) (registered investment adviser); Executive Vice President, Invesco Distributors, Inc. (formerly known as Invesco Aim Distributors, Inc.); Director, Invesco Mortgage Capital Inc.; Vice President, The Invesco Funds (other than AIM Treasurer’s Series Trust (Invesco Treasurer’s Series Trust) and Short-Term Investments Trust); and President and Principal Executive Officer, The Invesco Funds (AIM Treasurer’s Series Trust (Invesco Treasurer’s Series Trust) and Short-Term Investments Trust only).
Formerly: Senior Vice President, Van Kampen Investments Inc.; Vice President, Invesco Advisers, Inc. (formerly known as Invesco Institutional (N.A.), Inc.); Director of Cash Management and Senior Vice President, Invesco Advisers, Inc. and Invesco Aim Capital Management, Inc.; President and Principal Executive Officer, Tax-Free Investments Trust; Director and President, Fund Management Company; Chief Cash Management Officer, Director of Cash Management, Senior Vice President, and Managing Director, Invesco Aim Capital Management, Inc.; Director of Cash Management, Senior Vice President, and Vice President, Invesco Advisers, Inc. and The Invesco Funds (AIM Treasurer’s Series Trust (Invesco Treasurer’s Series Trust), Short-Term Investments Trust and Tax-Free Investments Trust only) | | N/A | | N/A |
| | | | | | | | | |
| | | | | | | | | |
| | | | | | | | | |
Yinka Akinsola — 1977
Anti-Money Laundering Compliance Officer | | 2011 | | Anti-Money Laundering Compliance Officer, Invesco Advisers, Inc. (formerly known as Invesco Institutional (N.A.), Inc.) (registered investment adviser); Invesco Distributors, Inc. (formerly known as Invesco Aim Distributors, Inc.), Invesco Investment Services, Inc. (formerly known as Invesco Aim Investment Services, Inc.), Invesco Management Group, Inc., The Invesco Funds, Invesco Van Kampen Closed-End Funds, Van Kampen Exchange Corp. and Van Kampen Funds Inc. | | N/A | | N/A |
| | | | | | | | | |
| | | | | | | | | |
| | | | | | | | | |
Todd L. Spillane — 1958
Chief Compliance Officer | | 2006 | | Senior Vice President, Invesco Management Group, Inc. (formerly known as Invesco Aim Management Group, Inc.) and Van Kampen Exchange Corp.; Senior Vice President and Chief Compliance Officer, Invesco Advisers, Inc. (registered investment adviser) (formerly known as Invesco Institutional (N.A.), Inc.); Chief Compliance Officer, The Invesco Funds, INVESCO Private Capital Investments, Inc. (holding company) and Invesco Private Capital, Inc. (registered investment adviser); Vice President, Invesco Distributors, Inc. (formerly known as Invesco Aim Distributors, Inc.) and Invesco Investment Services, Inc. (formerly known as Invesco Aim Investment Services, Inc.).
Formerly: Chief Compliance Officer, Invesco Van Kampen Closed-End Funds PowerShares Exchange-Traded Fund Trust, PowerShares Exchange-Traded Fund Trust II, PowerShares India Exchange-Traded Fund Trust, and PowerShares Actively Managed Exchange-Traded Fund Trust; Senior Vice President, Van Kampen Investments Inc.; Senior Vice President and Chief Compliance Officer, Invesco Advisers, Inc. and Invesco Aim Capital Management, Inc.; Chief Compliance Officer, Invesco Global Asset Management (N.A.), Inc., Invesco Senior Secured Management, Inc. (registered investment adviser) and Van Kampen Investor Services Inc.; Vice President, Invesco Aim Capital Management, Inc. and Fund Management Company | | N/A | | N/A |
| | | | | | | | | |
The Statement of Additional Information of the Trust includes additional information about the Fund’s Trustees and is available upon request, without charge, by calling 1.800.959.4246. Please refer to the Fund’s prospectus for information on the Fund’s sub-advisers.
| | | | | | | |
Office of the Fund
11 Greenway Plaza, Suite 2500
Houston, TX 77046-1173 | | Investment Adviser
Invesco Advisers, Inc.
1555 Peachtree Street, N.E.
Atlanta, GA 30309 | | Distributor
Invesco Distributors, Inc.
11 Greenway Plaza, Suite 2500
Houston, TX 77046-1173 | | Auditors
PricewaterhouseCoopers LLP
1201 Louisiana Street, Suite 2900
Houston, TX 77002-5678 |
| | | | | | | |
| | | | | | | |
Counsel to the Fund
Stradley Ronon Stevens & Young, LLP
2600 One Commerce Square
Philadelphia, PA 19103 | | Counsel to the Independent Trustees
Kramer, Levin, Naftalis & Frankel LLP
1177 Avenue of the Americas
New York, NY 10036-2714 | | Transfer Agent
Invesco Investment Services, Inc.
11 Greenway Plaza, Suite 2500
Houston, TX77046-1173 | | Custodian
State Street Bank and Trust Company
225 Franklin
Boston, MA 02110-2801 |
Invesco V.I. S&P 500 Index Fund
Invesco V.I. Select Dimensions Equally-Weighted S&P 500 FundAnnual Report to Shareholders § December 31, 2011The Fund provides a complete list of its holdings four times in each fiscal year, at the quarter-ends. For the second and fourth quarters, the lists appear in the Fund’s semiannual and annual reports to shareholders. For the first and third quarters, the Fund files the lists with the Securities and Exchange Commission (SEC) on Form N-Q. The Fund’s Form N-Q filings are available on the SEC website, sec.gov. Copies of the Fund’s Forms N-Q may be reviewed and copied at the SEC Public Reference Room in Washington, D.C. You can obtain information on the operation of the Public Reference Room, including information about duplicating fee charges, by calling 202 551 8090 or 800 732 0330, or by electronic request at the following email address: publicinfo@sec.gov. The SEC file numbers for the Fund are 811-07452 and 033-57340. The Fund’s most recent portfolio holdings, as filed on Form N-Q, have also been made available to insurance companies issuing variable annuity contracts and variable life insurance policies (“variable products”) that invest in the Fund.
A description of the policies and procedures that the Fund uses to determine how to vote proxies relating to portfolio securities is available without charge, upon request, from our Client Services department at 800 959 4246 or at invesco.com/proxyguidelines. The information is also available on the SEC website, sec.gov.
Information regarding how the Fund voted proxies related to its portfolio securities during the 12 months ended June 30, 2011, is available at invesco.com/proxysearch. The information is also available on the SEC website, sec.gov.
Invesco Advisers, Inc. is an investment adviser; it provides investment advisory services to individual and institutional clients and does not sell securities. Invesco Distributors, Inc. is the U.S. distributor for Invesco Ltd.’s retail mutual funds, exchange-traded funds and institutional money market funds. Both are wholly owned, indirect subsidiaries of Invesco Ltd.
This report must be accompanied or preceded by a currently effective Fund prospectus and variable product prospectus, which contain more complete information, including sales charges and expenses. Investors should read each carefully before investing.
Invesco Distributors, Inc.
MS-VISDEWSP-AR-1
| | | | | |
|
| | | | | |
NOT FDIC INSURED | | MAY LOSE VALUE | | NO BANK GUARANTEE |
Management’s Discussion of Fund Performance
Performance summary
For the year ended December 31, 2011, Invesco V.I. Select Dimensions Equally-Weighted S&P 500 Fund performed generally in line with the S&P 500 Equal Weight Index. The Fund seeks to achieve a high level of total return on its assets through a combination of capital appreciation and current income.
Your Fund’s long-term performance appears later in this report.
Fund vs. Indexes
Total returns, 12/31/10 to 12/31/11, excluding variable product issuer charges.
If variable product issuer charges were included, returns would be lower.
| | | | | |
|
| Series I Shares | | | -0.36 | % |
| |
| Series II Shares | | | -0.66 | |
| |
S&P 500 Index▼ (Broad Market Index) | | | 2.09 | |
| |
S&P 500 Equal Weight Indexn (Style-Specific Index) | | | -0.11 | |
| |
Lipper VUF Multi-Cap Core Funds Index▼ (Peer Group Index) | | | -1.44 | |
Source(s): ▼Lipper Inc.; nInvesco, Bloomberg L.P.
As noted in the Fund’s latest semiannual report, the Fund has adopted a three-tier benchmark structure to compare its performance to broad market, style-specific and peer group market measures.
How we invest
The Fund invests in a diversified portfolio of common stocks represented in the S&P 500 Index (the S&P 500). The S&P 500 is a well known stock market index that includes common stocks of 500 companies. The Fund generally invests in each stock included in the S&P 500 in approximately equal proportions. This approach differs from the S&P 500 because stocks in the S&P 500 are represented in proportion to their market value or market capitalization. For example, the 50 largest companies in the S&P 500 represent approximately 50 percent of the S&P 500’s value; however, the same 50 companies represent roughly 10 percent of the Fund’s value. The Fund may invest in foreign securities represented in the S&P 500, including depositary receipts. Changes to the Fund’s portfolio are the result of Standard & Poor’s either adding a security to, or deleting a security from, the S&P 500 Index. Changes are not the result of any stock selection model.
The Fund also may invest in S&P 500 futures contracts. This type of investment is a derivative instrument since the price is derived from one or more underlying assets. The purpose of this investment is to provide full stock market exposure to the Fund’s nominal cash holdings.
Market conditions and your Fund
Market volatility persisted throughout the year ended December 31, 2011. A number of factors adversely affected investor sentiment during the year, including sluggish economic growth and persistently high unemployment in the U.S.; political unrest in the Middle East and northern Africa; and the reemergence of sovereign debt concerns in Greece and other eurozone countries. Following the earthquake and tsunami that struck Japan in March – which caused loss of life, a disruption in the supply chain and fears of a nuclear catastrophe – many market watchers were surprised that global markets merely stalled, rather than declined significantly.
During the second half of the year, the debate on raising the U.S. debt ceiling began, and investor sentiment changed from complacency to concern. The president and Congress eventually reached an agreement to raise the debt ceiling and prevent a federal government default, but not before much political wrangling that left investors unsettled. Following the agreement, Standard & Poor’s issued its first-ever downgrade of long-term U.S. government debt. This caused the U.S. stock market to fall precipitously from its early-July highs.
The U.S. stock market enjoyed a rally at the end of the reporting period as a full-blown financial contagion emanating from Europe did not materialize. Once eurozone leaders announced plans to more aggressively manage their sovereign debt problems, investors refocused their attention on investment opportunities in the U.S. Economic news at home was positive on balance and supportive of the stock market rally. Unemployment continued to inch lower, inflation remained tame as commodity prices slipped and consumer confidence and spending both increased despite a continued decline in home prices. The Federal Reserve continued to support the recovery by keeping short-term interest rates in a range of zero to 0.25% and by indicating no increase is likely until at least mid-2013.1
On the geopolitical front, the war in Iraq officially ended in December. However, sovereign debt troubles in Europe continued to act as an overhang for the markets. In addition, a slowdown in global demand from China as its economy cooled was also a concern. Lastly, the U.S. debt burden still lingered given the failure of the congressional “super committee” to agree to long-term spending cuts. Despite these issues, the U.S. stock market remained resilient.
Portfolio Composition
By sector
| | | | | |
|
| Consumer Discretionary | | | 16.2 | % |
| |
| Financials | | | 15.8 | |
| |
| Information Technology | | | 13.8 | |
| |
| Industrials | | | 12.2 | |
| |
| Health Care | | | 10.5 | |
| |
| Energy | | | 8.6 | |
| |
| Consumer Staples | | | 8.4 | |
| |
| Utilities | | | 6.6 | |
| |
| Materials | | | 6.2 | |
| |
| Telecommunication Services | | | 1.6 | |
| |
Money Market Funds Plus Other | | | | |
Assets Less Liabilities | | | 0.1 | |
Top 10 Equity Holdings*
| | | | | | | | | |
|
| | 1. | | Akamai Technologies, Inc. | | 0.2 | % |
| |
| | 2. | | Tenet Healthcare Corp. | | 0.2 | |
| |
| | 3. | | Masco Corp. | | 0.2 | |
| |
| | 4. | | Cintas Corp. | | 0.2 | |
| |
| | 5. | | DeVry, Inc. | | 0.2 | |
| |
| | 6. | | Zimmer Holdings, Inc. | | 0.2 | |
| |
| | 7. | | Weyerhaeuser Co. | | 0.2 | |
| |
| | 8. | | Cablevision Systems Corp.-Class A | | 0.2 | |
| |
| | 9. | | CF Industries Holdings, Inc. | | 0.2 | |
| |
| | 10. | | Juniper Networks, Inc. | | 0.2 | |
Top Five Industries
| | | | | | | | | |
|
| | | 1. | Multi-Utilities | | | 3.0 | % |
| |
| | | 2. | Oil & Gas Exploration & Production | | | 3.0 | |
| |
| | | 3. | Packaged Foods & Meats | | | 2.8 | |
| |
| | | 4. | Health Care Equipment | | | 2.7 | |
| |
| | | 5. | Semiconductors | | | 2.6 | |
| | | | |
|
| Total Net Assets | | $77.5 million |
| | | | | |
| Total Number of Holdings* | | | 501 |
The Fund’s holdings are subject to change, and there is no assurance that the Fund will continue to hold any particular security.
*Excluding money market fund holdings.
Invesco V.I. Select Dimensions Equally-Weighted S&P 500 Fund
Major equity indexes delivered mixed performances, with the S&P 500 Index generating a positive return for the year. For the year, large-cap stocks generally outperformed small-cap stocks, and growth stocks, generally edged value stocks.
The Fund stayed true to its process by maintaining balanced exposure to all constituents of the S&P 500. On an absolute basis, the Fund posted negative returns for the reporting period. Sectors that contributed the most to overall Fund performance were the consumer discretionary, consumer staples, health care and utilities sectors. In addition, the Fund’s allocation to Equally Weighted S&P 500 futures contracts contributed to Fund performance. The financials, information technology and materials sectors contributed the least to the Fund’s overall performance.
In the energy sector, El Paso and Cabot Oil & Gas were top contributors. El Paso operates in the natural gas transmission and exploration and production industries, while Cabot Oil & Gas is engaged in the development, exploitation and exploration of oil and gas properties.
Also contributing to Fund performance were health care companies Intuitive Surgical and Biogen Idec. Intuitive Surgical designs, manufactures and markets da Vinci Surgical Systems, which are used to perform surgeries across multiple surgical specialties, including urology, gynecology, cardiothoracic surgery, transoral surgery and general surgery.
Detracting from Fund performance were solar panel developers First Solar and MEMC Electronic Materials. During the year, First Solar announced job cuts, saying profits would be below Wall Street forecasts. MEMC Electronic Materials said it would cut staff and idle some facilities. At the heart of the downturn in the solar panel industry is a global glut of panels and huge excess production capacity that drove down prices by more than 40 percent in 2011.2 We sold our holdings in MEMC Electronic Materials before the close of the reporting period.
At the close of 2011, many of the issues that plagued markets during the year remained unresolved – and seemed likely to contribute to continued high levels of volatility. In Europe, the sovereign debt crisis showed no signs of abating and appeared to have pushed economies in the region back into recession. While economic data thus far remained more resilient in the U.S., overall growth has clearly slowed across developed and emerging markets. That said, at the end of 2011, corporate balance sheets remained generally healthy and market valuations were attractive from a historical context.
We would like to caution investors against making investment decisions based on short-term performance.
We welcome new investors who joined the Fund during the year and thank all of our shareholders for your investment in Invesco V.I. Select Dimensions Equally-Weighted S&P 500 Fund.
| | |
| 1 | | Source: U.S. Federal Reserve |
| 2 | | Source: Reuters |
The views and opinions expressed in management’s discussion of Fund performance are those of Invesco Advisers, Inc. These views and opinions are subject to change at any time based on factors such as market and economic conditions. These views and opinions may not be relied upon as investment advice or recommendations, or as an offer for a particular security. The information is not a complete analysis of every aspect of any market, country, industry, security or the Fund. Statements of fact are from sources considered reliable, but Invesco Advisers, Inc. makes no representation or warranty as to their completeness or accuracy. Although historical performance is no guarantee of future results, these insights may help you understand our investment management philosophy.
See important Fund and, if applicable, index disclosures later in this report.
Anthony Munchak
Chartered Financial Analyst, portfolio manager, is manager of Invesco V.I. Select Dimensions Equally-Weighted S&P 500 Fund. He joined Invesco in 2000. Mr. Munchak earned a B.S. and M.S. in finance from Boston College and an M.B.A. from Bentley College.
Glen Murphy
Chartered Financial Analyst, portfolio manager, is manager of Invesco V.I. Select Dimensions Equally-Weighted S&P 500 Fund. He joined Invesco in 1995. Mr. Murphy earned a B.A. in business administration from the University of Massachusetts at Amherst and an M.S. in finance from Boston College.
Francis Orlando
Chartered Financial Analyst, portfolio manager, is manager of Invesco V.I. Select Dimensions Equally-Weighted S&P 500 Fund. He joined Invesco in 1987. Mr. Orlando earned a B.A. in business administration from Merrimack College and an M.B.A. from Boston University.
Daniel Tsai
Chartered Financial Analyst, portfolio manager, is manager of Invesco V.I. Select Dimensions Equally-Weighted S&P 500 Fund. He joined Invesco in 2000. He earned a B.S. in mechanical engineering from National Taiwan University and an M.S. in mechanical engineering from the University of Michigan. He also earned an M.S. in computer science from Wayne State University.
Anne Unflat
Portfolio manager, is manager of Invesco V.I. Select Dimensions Equally-Weighted S&P 500 Fund. She joined Invesco in 1988. Ms. Unflat graduated magna cum laude from Queens College, where she earned a B.A. in economics. She earned an M.B.A. in finance from St. John’s University.
Invesco V.I. Select Dimensions Equally-Weighted S&P 500 Fund
Your Fund’s Long-Term Performance
Results of a $10,000 Investment – Oldest Share Class(es)
Fund and index data from 12/31/01*
| | |
| * | During the reporting period, Invesco changed its policy regarding growth of $10,000 charts. For funds older than 10 years, we previously showed performance since inception. Going forward, we will show performance for the most recent 10 years, since this more accurately reflects the experience of the typical shareholder. As a result, charts now may include benchmarks that did not appear previously, because the funds’ inception pre-dated the benchmarks’ inception. Also, all charts will now be presented using a linear format. |
Past performance cannot guarantee comparable future results.
As noted earlier in this report, the Fund
has adopted a three-tier benchmark structure to compare its performance to broad market, style-specific and peer
group market measures. These additional benchmarks will now be included in the chart above.
Average Annual Total Returns
As of 12/31/11
| | | | | | | | | |
|
| Series I Shares | | | | |
| |
| Inception (11/9/94) | | | 9.37 | % |
| |
| | 10 | | | Years | | | 6.01 | |
| |
| | 5 | | | Years | | | 1.34 | |
| |
| | 1 | | | Year | | | -0.36 | |
| |
| | | | | | | | | |
| Series II Shares | | | | |
| |
| Inception (7/24/00) | | | 5.73 | % |
| |
| | 10 | | | Years | | | 5.74 | |
| |
| | 5 | | | Years | | | 1.08 | |
| |
| | 1 | | | Year | | | -0.66 | |
Effective June 1, 2010, Class X and Class Y shares of the predecessor fund, Morgan Stanley V.I. Select Dimensions Equally-Weighted S&P 500 Fund, advised by Morgan Stanley Investment Advisors Inc. were reorganized into Series I and Series II shares, respectively, of Invesco V.I. Select Dimensions Equally-Weighted S&P 500 Fund. Returns shown above for Series I and Series II shares are blended returns of the predecessor fund and Invesco V.I. Select Dimensions Equally-Weighted S&P 500 Fund. Share class returns will differ from the predecessor fund because of different expenses.
The performance data quoted represent past performance and cannot guarantee comparable future results; current performance may be lower or higher. Please contact your variable product issuer or financial adviser for the most recent month-end variable product performance. Performance figures reflect Fund expenses, reinvested distributions and changes in net asset value. Investment return and principal value will fluctuate so that you may have a gain or loss when you sell shares.
The net annual Fund operating expense ratio set forth in the most recent Fund prospectus as of the date of this report for Series I and Series II shares was 0.37% and 0.62%, respectively.1 The total annual Fund operating expense ratio set forth in the most recent Fund prospectus as of the date of this report for Series I and Series II shares was 0.49% and 0.74%, respectively. The expense ratios presented above may vary from the expense ratios presented in other sections of this report that are based on expenses incurred during the period covered by this report.
Invesco V.I. Select Dimensions Equally-Weighted S&P 500 Fund, a series portfolio of AIM Variable Insurance Funds (Invesco Variable Insurance Funds), is currently offered through insurance companies issuing variable products. You cannot purchase shares of the Fund directly. Performance figures given represent the Fund and are not intended to reflect actual variable product values. They do not reflect sales charges, expenses and fees assessed in connection with a variable product. Sales charges, expenses and fees, which are determined by the variable product issuers, will vary and will lower the total return.
The most recent month-end performance data at the Fund level, excluding variable product charges, is available at 800 451 4246. As mentioned above, for the most recent month-end performance including variable product charges, please contact your variable product issuer or financial adviser.
| | |
| 1 | | Total annual Fund operating expenses after any contractual fee waivers and/or expense reimbursements by the adviser in effect through at least June 30, 2012. See current prospectus for more information. |
Invesco V.I. Select Dimensions Equally-Weighted S&P 500 Fund
Invesco V.I. Select Dimensions Equally-Weighted S&P 500 Fund’s investment objective is to achieve a high level of total return on its assets through a combination of capital appreciation and current income.
| n | Unless otherwise stated, information presented in this report is as of December 31, 2011, and is based on total net assets. |
| |
| n | Unless otherwise noted, all data provided by Invesco. |
| |
| n | To access your Fund’s reports/prospectus, visit invesco.com/fundreports. |
Principal risks of investing in the Fund
Common stock risk. In general, common stock values fluctuate, and sometimes widely fluctuate, in response to activities specific to the company as well as general market, economic and political conditions.
Depositary receipts risk. Depositary receipts involve many of the same risks as those associated with direct investment in foreign securities. In addition, the underlying issuers of certain depositary receipts, particularly unsponsored or unregistered depositary receipts, are under no obligation to distribute shareholder communications to the holders of such receipts or to pass through to them any voting rights with respect to the deposited securities.
Derivatives risk. Derivatives may be more difficult to purchase, sell or value than other investments and may be subject to market, interest rate, credit, leverage, counterparty and management risks. A fund investing in a derivative could lose more than the cash amount invested or incur higher taxes. Over-the-counter derivatives are also subject to counterparty risk, which is the risk that the other party to the contract will not fulfill its contractual obligation to complete the transaction with the Fund.
Foreign securities risk. The Fund’s foreign investments may be affected by changes in a foreign country’s exchange rates; political and social instability; changes in economic or taxation policies; difficulties when enforcing obligations; decreased liquidity; and increased volatility. Foreign companies may be subject to less regulation resulting in less publicly available information about the companies.
Futures risk. A decision as to whether, when and how to use futures involves the exercise of skill and judgment and even a well conceived futures transaction may be unsuccessful because of market behavior or unexpected events.
Swaps risk. A swap contract is an agreement between two parties pursuant to which the parties exchange payments at specified dates on the basis of a specified notional amount, with the payments calculated by reference to specified securities, indexes, reference rates, currencies or other instruments. Swaps are subject to credit risk and counterparty risk.
About indexes used in this report
The S&P 500® Index is an unmanaged index considered representative of the U.S. stock market.
The S&P 500® Equal Weight Index is the equally weighted version of the S&P 500® Index.
The Lipper VUF Multi-Cap Core Funds Index is an unmanaged index considered representative of multi-cap core variable insurance underlying funds tracked by Lipper.
A direct investment cannot be made in an index. Unless otherwise indicated, index results include reinvested dividends, and they do not reflect sales charges. Performance of the peer group, if applicable, reflects fund expenses; performance of a market index does not.
Other information
The Chartered Financial Analyst® (CFA®) designation is globally recognized and attests to a charterholder’s success in a rigorous and comprehensive study program in the field of investment management and research analysis.
Industry classifications used in this report are generally according to the Global Industry Classification Standard, which was developed by and is the exclusive property and a service mark of MSCI Inc. and Standard & Poor’s.
The returns shown in management’s discussion of Fund performance are based on net asset values calculated for shareholder transactions. Generally accepted accounting principles require adjustments to be made to the net assets of the Fund at period end for financial reporting purposes, and as such, the net asset values for shareholder transactions and the returns based on those net asset values may differ from the net asset values and returns reported in the Financial Highlights. Additionally, the returns and net asset values shown throughout this report are at the Fund level only and do not include variable product issuer charges. If such charges were included, the total returns would be lower.
Invesco V.I. Select Dimensions Equally-Weighted S&P 500 Fund
Schedule of Investments(a)
December 31, 2011
| | | | | | | | | |
| | | Shares | | Value |
| |
Common Stocks & Other Equity Interests–99.95%
| | | | |
Advertising–0.42%
| | | | |
| Interpublic Group of Cos., Inc. (The) | | | 16,521 | | | $ | 160,749 | |
| |
| Omnicom Group Inc. | | | 3,632 | | | | 161,915 | |
| |
| | | | | | | | 322,664 | |
| |
Aerospace & Defense–2.61%
| | | | |
| Boeing Co. (The) | | | 2,114 | | | | 155,062 | |
| |
| General Dynamics Corp. | | | 2,375 | | | | 157,724 | |
| |
| Goodrich Corp. | | | 1,223 | | | | 151,285 | |
| |
| Honeywell International Inc. | | | 2,827 | | | | 153,647 | |
| |
| L-3 Communications Holdings, Inc. | | | 2,329 | | | | 155,298 | |
| |
| Lockheed Martin Corp. | | | 1,947 | | | | 157,512 | |
| |
| Northrop Grumman Corp. | | | 2,697 | | | | 157,720 | |
| |
| Precision Castparts Corp. | | | 962 | | | | 158,528 | |
| |
| Raytheon Co. | | | 3,299 | | | | 159,606 | |
| |
| Rockwell Collins, Inc. | | | 2,802 | | | | 155,147 | |
| |
| Textron Inc. | | | 8,427 | | | | 155,815 | |
| |
| United Technologies Corp. | | | 2,073 | | | | 151,516 | |
| |
| Xylem, Inc. | | | 6,087 | | | | 156,375 | |
| |
| | | | | | | | 2,025,235 | |
| |
Agricultural Products–0.20%
| | | | |
Archer-Daniels-Midland Co.(b) | | | 5,421 | | | | 155,041 | |
| |
Air Freight & Logistics–0.79%
| | | | |
| C.H. Robinson Worldwide, Inc. | | | 2,260 | | | | 157,703 | |
| |
| Expeditors International of Washington, Inc. | | | 3,719 | | | | 152,330 | |
| |
| FedEx Corp. | | | 1,768 | | | | 147,646 | |
| |
| United Parcel Service, Inc.–Class B | | | 2,092 | | | | 153,113 | |
| |
| | | | | | | | 610,792 | |
| |
Airlines–0.19%
| | | | |
| Southwest Airlines Co. | | | 17,242 | | | | 147,592 | |
| |
Aluminum–0.19%
| | | | |
| Alcoa Inc. | | | 17,046 | | | | 147,448 | |
| |
Apparel Retail–1.20%
| | | | |
| Abercrombie & Fitch Co.–Class A | | | 3,224 | | | | 157,460 | |
| |
| Gap, Inc. (The) | | | 8,206 | | | | 152,221 | |
| |
| Limited Brands, Inc. | | | 3,910 | | | | 157,769 | |
| |
| Ross Stores, Inc. | | | 3,195 | | | | 151,858 | |
| |
| TJX Cos., Inc. | | | 2,416 | | | | 155,953 | |
| |
Urban Outfitters, Inc.(c) | | | 5,649 | | | | 155,687 | |
| |
| | | | | | | | 930,948 | |
| |
Apparel, Accessories & Luxury Goods–0.59%
| | | | |
| Coach, Inc. | | | 2,606 | | | | 159,070 | |
| |
| Polo Ralph Lauren Corp. | | | 1,080 | | | | 149,127 | |
| |
| VF Corp. | | | 1,168 | | | | 148,324 | |
| |
| | | | | | | | 456,521 | |
| |
Application Software–0.95%
| | | | |
Adobe Systems Inc.(c) | | | 5,324 | | | | 150,510 | |
| |
Autodesk, Inc.(c) | | | 4,813 | | | | 145,978 | |
| |
Citrix Systems, Inc.(c) | | | 2,342 | | | | 142,206 | |
| |
| Intuit Inc. | | | 2,900 | | | | 152,511 | |
| |
Salesforce.com, Inc.(c) | | | 1,402 | | | | 142,247 | |
| |
| | | | | | | | 733,452 | |
| |
Asset Management & Custody Banks–2.00%
| | | | |
| Ameriprise Financial, Inc. | | | 3,226 | | | | 160,139 | |
| |
| Bank of New York Mellon Corp. (The) | | | 7,854 | | | | 156,373 | |
| |
| BlackRock, Inc. | | | 881 | | | | 157,029 | |
| |
| Federated Investors, Inc.–Class B | | | 10,195 | | | | 154,454 | |
| |
| Franklin Resources, Inc. | | | 1,595 | | | | 153,216 | |
| |
Invesco Ltd.(d) | | | 7,805 | | | | 156,802 | |
| |
| Legg Mason, Inc. | | | 6,387 | | | | 153,607 | |
| |
| Northern Trust Corp. | | | 3,852 | | | | 152,770 | |
| |
| State Street Corp. | | | 3,750 | | | | 151,163 | |
| |
| T. Rowe Price Group Inc. | | | 2,764 | | | | 157,410 | |
| |
| | | | | | | | 1,552,963 | |
| |
Auto Parts & Equipment–0.41%
| | | | |
BorgWarner, Inc.(c) | | | 2,407 | | | | 153,422 | |
| |
| Johnson Controls, Inc. | | | 5,185 | | | | 162,083 | |
| |
| | | | | | | | 315,505 | |
| |
Automobile Manufacturers–0.20%
| | | | |
| Ford Motor Co. | | | 14,652 | | | | 157,656 | |
| |
Automotive Retail–0.78%
| | | | |
AutoNation, Inc.(c) | | | 4,198 | | | | 154,781 | |
| |
AutoZone, Inc.(c) | | | 458 | | | | 148,836 | |
| |
CarMax, Inc.(c) | | | 4,946 | | | | 150,754 | |
| |
O’Reilly Automotive, Inc.(c) | | | 1,879 | | | | 150,226 | |
| |
| | | | | | | | 604,597 | |
| |
Biotechnology–0.82%
| | | | |
| Amgen Inc. | | | 2,500 | | | | 160,525 | |
| |
Biogen Idec Inc.(c) | | | 1,361 | | | | 149,778 | |
| |
Celgene Corp.(c) | | | 2,357 | | | | 159,333 | |
| |
Gilead Sciences, Inc.(c) | | | 4,041 | | | | 165,398 | |
| |
| | | | | | | | 635,034 | |
| |
| | | | | | | | | |
| | | | | | | | | |
See accompanying Notes to Financial Statements which are an integral part of the financial statements.
Invesco V.I. Select Dimensions Equally-Weighted S&P 500 Fund
| | | | | | | | | |
| | | Shares | | Value |
| |
Brewers–0.20%
| | | | |
| Molson Coors Brewing Co.–Class B | | | 3,521 | | | $ | 153,304 | |
| |
Broadcasting–0.61%
| | | | |
| CBS Corp.–Class B | | | 6,046 | | | | 164,088 | |
| |
Discovery Communications, Inc.–Class A(c) | | | 3,738 | | | | 153,146 | |
| |
| Scripps Networks Interactive–Class A | | | 3,593 | | | | 152,415 | |
| |
| | | | | | | | 469,649 | |
| |
Building Products–0.22%
| | | | |
| Masco Corp. | | | 16,395 | | | | 171,820 | |
| |
Cable & Satellite–0.81%
| | | | |
| Cablevision Systems Corp.–Class A | | | 11,779 | | | | 167,497 | |
| |
| Comcast Corp.–Class A | | | 6,437 | | | | 152,621 | |
| |
DIRECTV–Class A(c) | | | 3,576 | | | | 152,910 | |
| |
| Time Warner Cable Inc. | | | 2,413 | | | | 153,395 | |
| |
| | | | | | | | 626,423 | |
| |
Casinos & Gaming–0.41%
| | | | |
| International Game Technology | | | 9,565 | | | | 164,518 | |
| |
| Wynn Resorts Ltd. | | | 1,421 | | | | 157,006 | |
| |
| | | | | | | | 321,524 | |
| |
Coal & Consumable Fuels–0.59%
| | | | |
Alpha Natural Resources, Inc.(c) | | | 7,654 | | | | 156,371 | |
| |
| CONSOL Energy Inc. | | | 4,134 | | | | 151,718 | |
| |
| Peabody Energy Corp. | | | 4,553 | | | | 150,750 | |
| |
| | | | | | | | 458,839 | |
| |
Commercial Printing–0.19%
| | | | |
| R. R. Donnelley & Sons Co. | | | 10,465 | | | | 151,010 | |
| |
Communications Equipment–1.61%
| | | | |
| Cisco Systems, Inc. | | | 8,370 | | | | 151,330 | |
| |
F5 Networks, Inc.(c) | | | 1,432 | | | | 151,964 | |
| |
| Harris Corp. | | | 4,379 | | | | 157,819 | |
| |
JDS Uniphase Corp.(c) | | | 15,758 | | | | 164,514 | |
| |
Juniper Networks, Inc.(c) | | | 8,183 | | | | 167,015 | |
| |
Motorola Mobility Holdings Inc.(c) | | | 3,880 | | | | 150,544 | |
| |
| Motorola Solutions, Inc. | | | 3,253 | | | | 150,581 | |
| |
| QUALCOMM Inc. | | | 2,853 | | | | 156,059 | |
| |
| | | | | | | | 1,249,826 | |
| |
Computer & Electronics Retail–0.40%
| | | | |
| Best Buy Co., Inc. | | | 6,476 | | | | 151,344 | |
| |
GameStop Corp.–Class A(c) | | | 6,434 | | | | 155,253 | |
| |
| | | | | | | | 306,597 | |
| |
Computer Hardware–0.59%
| | | | |
Apple Inc.(c) | | | 394 | | | | 159,570 | |
| |
Dell Inc.(c) | | | 9,995 | | | | 146,227 | |
| |
| Hewlett-Packard Co. | | | 5,812 | | | | 149,717 | |
| |
| | | | | | | | 455,514 | |
| |
Computer Storage & Peripherals–0.97%
| | | | |
EMC Corp.(c) | | | 6,742 | | | | 145,223 | |
| |
| Lexmark International, Inc.–Class A | | | 4,586 | | | | 151,659 | |
| |
NetApp, Inc.(c) | | | 4,205 | | | | 152,515 | |
| |
SanDisk Corp.(c) | | | 3,134 | | | | 154,224 | |
| |
Western Digital Corp.(c) | | | 4,851 | | | | 150,139 | |
| |
| | | | | | | | 753,760 | |
| |
Construction & Engineering–0.60%
| | | | |
| Fluor Corp. | | | 3,122 | | | | 156,881 | |
| |
Jacobs Engineering Group, Inc.(c) | | | 3,772 | | | | 153,068 | |
| |
Quanta Services, Inc.(c) | | | 7,182 | | | | 154,700 | |
| |
| | | | | | | | 464,649 | |
| |
Construction & Farm Machinery & Heavy Trucks–0.99%
| | | | |
| Caterpillar Inc. | | | 1,721 | | | | 155,923 | |
| |
| Cummins Inc. | | | 1,719 | | | | 151,306 | |
| |
| Deere & Co. | | | 2,047 | | | | 158,335 | |
| |
| Joy Global Inc. | | | 1,997 | | | | 149,715 | |
| |
| PACCAR Inc. | | | 4,146 | | | | 155,351 | |
| |
| | | | | | | | 770,630 | |
| |
Construction Materials–0.20%
| | | | |
| Vulcan Materials Co. | | | 3,872 | | | | 152,363 | |
| |
Consumer Electronics–0.21%
| | | | |
| Harman International Industries, Inc. | | | 4,280 | | | | 162,811 | |
| |
Consumer Finance–0.77%
| | | | |
| American Express Co. | | | 3,203 | | | | 151,085 | |
| |
| Capital One Financial Corp. | | | 3,461 | | | | 146,366 | |
| |
| Discover Financial Services | | | 6,198 | | | | 148,752 | |
| |
| SLM Corp. | | | 11,170 | | | | 149,678 | |
| |
| | | | | | | | 595,881 | |
| |
Data Processing & Outsourced Services–1.77%
| | | | |
| Automatic Data Processing, Inc. | | | 2,892 | | | | 156,197 | |
| |
| Computer Sciences Corp. | | | 5,791 | | | | 137,247 | |
| |
| Fidelity National Information Services, Inc. | | | 5,908 | | | | 157,094 | |
| |
Fiserv, Inc.(c) | | | 2,614 | | | | 153,546 | |
| |
| MasterCard, Inc.–Class A | | | 414 | | | | 154,347 | |
| |
| Paychex, Inc. | | | 5,074 | | | | 152,778 | |
| |
| Total System Services, Inc. | | | 7,817 | | | | 152,901 | |
| |
| Visa Inc.–Class A | | | 1,540 | | | | 156,356 | |
| |
| Western Union Co. | | | 8,446 | | | | 154,224 | |
| |
| | | | | | | | 1,374,690 | |
| |
| | | | | | | | | |
| | | | | | | | | |
See accompanying Notes to Financial Statements which are an integral part of the financial statements.
Invesco V.I. Select Dimensions Equally-Weighted S&P 500 Fund
| | | | | | | | | |
| | | Shares | | Value |
| |
Department Stores–0.94%
| | | | |
| JC Penney Co., Inc. | | | 4,600 | | | $ | 161,690 | |
| |
| Kohl’s Corp. | | | 3,076 | | | | 151,801 | |
| |
| Macy’s, Inc. | | | 4,839 | | | | 155,719 | |
| |
| Nordstrom, Inc. | | | 3,193 | | | | 158,724 | |
| |
Sears Holdings Corp.(c) | | | 3,253 | | | | 103,380 | |
| |
| | | | | | | | 731,314 | |
| |
Distillers & Vintners–0.61%
| | | | |
| Beam, Inc. | | | 3,055 | | | | 156,508 | |
| |
| Brown-Forman Corp.–Class B | | | 1,931 | | | | 155,465 | |
| |
Constellation Brands, Inc.–Class A(c) | | | 7,689 | | | | 158,931 | |
| |
| | | | | | | | 470,904 | |
| |
Distributors–0.20%
| | | | |
| Genuine Parts Co. | | | 2,579 | | | | 157,835 | |
| |
Diversified Banks–0.61%
| | | | |
| Comerica Inc. | | | 6,094 | | | | 157,225 | |
| |
| U.S. Bancorp | | | 5,776 | | | | 156,241 | |
| |
Wells Fargo & Co.(c) | | | 5,780 | | | | 159,297 | |
| |
| | | | | | | | 472,763 | |
| |
Diversified Chemicals–1.02%
| | | | |
| Dow Chemical Co. (The) | | | 5,696 | | | | 163,817 | |
| |
| E. I. du Pont de Nemours and Co. | | | 3,414 | | | | 156,293 | |
| |
| Eastman Chemical Co. | | | 4,087 | | | | 159,638 | |
| |
| FMC Corp. | | | 1,776 | | | | 152,807 | |
| |
| PPG Industries, Inc. | | | 1,856 | | | | 154,958 | |
| |
| | | | | | | | 787,513 | |
| |
Diversified Metals & Mining–0.39%
| | | | |
| Freeport-McMoRan Copper & Gold Inc. | | | 4,059 | | | | 149,331 | |
| |
| Titanium Metals Corp. | | | 10,106 | | | | 151,388 | |
| |
| | | | | | | | 300,719 | |
| |
Diversified REIT’s–0.20%
| | | | |
| Vornado Realty Trust | | | 2,022 | | | | 155,411 | |
| |
Diversified Support Services–0.42%
| | | | |
| Cintas Corp. | | | 4,925 | | | | 171,439 | |
| |
| Iron Mountain Inc. | | | 4,978 | | | | 153,323 | |
| |
| | | | | | | | 324,762 | |
| |
Drug Retail–0.40%
| | | | |
| CVS Caremark Corp. | | | 3,999 | | | | 163,079 | |
| |
| Walgreen Co. | | | 4,399 | | | | 145,431 | |
| |
| | | | | | | | 308,510 | |
| |
Education Services–0.43%
| | | | |
Apollo Group, Inc.–Class A(c) | | | 2,994 | | | | 161,287 | |
| |
| DeVry, Inc. | | | 4,403 | | | | 169,339 | |
| |
| | | | | | | | 330,626 | |
| |
Electric Utilities–2.61%
| | | | |
| American Electric Power Co., Inc. | | | 3,786 | | | | 156,400 | |
| |
| Duke Energy Corp. | | | 7,147 | | | | 157,234 | |
| |
| Edison International | | | 3,821 | | | | 158,189 | |
| |
| Entergy Corp. | | | 2,095 | | | | 153,040 | |
| |
| Exelon Corp. | | | 3,497 | | | | 151,665 | |
| |
| FirstEnergy Corp. | | | 3,457 | | | | 153,145 | |
| |
| NextEra Energy, Inc. | | | 2,594 | | | | 157,923 | |
| |
| Northeast Utilities | | | 4,309 | | | | 155,426 | |
| |
| Pepco Holdings, Inc. | | | 7,752 | | | | 157,365 | |
| |
| Pinnacle West Capital Corp. | | | 3,220 | | | | 155,140 | |
| |
| PPL Corp. | | | 5,224 | | | | 153,690 | |
| |
| Progress Energy, Inc. | | | 2,795 | | | | 156,576 | |
| |
| Southern Co. | | | 3,371 | | | | 156,043 | |
| |
| | | | | | | | 2,021,836 | |
| |
Electrical Components & Equipment–0.79%
| | | | |
| Cooper Industries PLC (Ireland) | | | 2,905 | | | | 157,306 | |
| |
| Emerson Electric Co. | | | 3,056 | | | | 142,379 | |
| |
| Rockwell Automation, Inc. | | | 2,089 | | | | 153,270 | |
| |
| Roper Industries, Inc. | | | 1,807 | | | | 156,974 | |
| |
| | | | | | | | 609,929 | |
| |
Electronic Components–0.40%
| | | | |
| Amphenol Corp.–Class A | | | 3,608 | | | | 163,767 | |
| |
| Corning Inc. | | | 11,481 | | | | 149,024 | |
| |
| | | | | | | | 312,791 | |
| |
Electronic Equipment & Instruments–0.19%
| | | | |
| FLIR Systems, Inc. | | | 5,964 | | | | 149,517 | |
| |
Electronic Manufacturing Services–0.60%
| | | | |
| Jabil Circuit, Inc. | | | 7,732 | | | | 152,011 | |
| |
| Molex Inc. | | | 6,598 | | | | 157,429 | |
| |
| TE Connectivity Ltd. | | | 4,931 | | | | 151,924 | |
| |
| | | | | | | | 461,364 | |
| |
Environmental & Facilities Services–0.60%
| | | | |
| Republic Services, Inc. | | | 5,675 | | | | 156,346 | |
| |
Stericycle, Inc.(c) | | | 1,962 | | | | 152,879 | |
| |
| Waste Management, Inc. | | | 4,846 | | | | 158,513 | |
| |
| | | | | | | | 467,738 | |
| |
| | | | | | | | | |
| | | | | | | | | |
See accompanying Notes to Financial Statements which are an integral part of the financial statements.
Invesco V.I. Select Dimensions Equally-Weighted S&P 500 Fund
| | | | | | | | | |
| | | Shares | | Value |
| |
Fertilizers & Agricultural Chemicals–0.62%
| | | | |
| CF Industries Holdings, Inc. | | | 1,155 | | | $ | 167,452 | |
| |
| Monsanto Co. | | | 2,203 | | | | 154,364 | |
| |
| Mosaic Co. (The) | | | 3,121 | | | | 157,392 | |
| |
| | | | | | | | 479,208 | |
| |
Food Distributors–0.20%
| | | | |
| Sysco Corp. | | | 5,195 | | | | 152,369 | |
| |
Food Retail–0.81%
| | | | |
| Kroger Co. (The) | | | 6,334 | | | | 153,410 | |
| |
| Safeway Inc. | | | 7,300 | | | | 153,592 | |
| |
| SUPERVALU Inc. | | | 20,050 | | | | 162,806 | |
| |
| Whole Foods Market, Inc. | | | 2,269 | | | | 157,877 | |
| |
| | | | | | | | 627,685 | |
| |
Footwear–0.20%
| | | | |
| NIKE, Inc.–Class B | | | 1,602 | | | | 154,385 | |
| |
Gas Utilities–0.40%
| | | | |
| AGL Resources Inc. | | | 3,661 | | | | 154,714 | |
| |
| ONEOK, Inc. | | | 1,829 | | | | 158,556 | |
| |
| | | | | | | | 313,270 | |
| |
General Merchandise Stores–0.78%
| | | | |
Big Lots, Inc.(c) | | | 4,100 | | | | 154,816 | |
| |
Dollar Tree, Inc.(c) | | | 1,812 | | | | 150,595 | |
| |
| Family Dollar Stores, Inc. | | | 2,592 | | | | 149,455 | |
| |
| Target Corp. | | | 2,884 | | | | 147,719 | |
| |
| | | | | | | | 602,585 | |
| |
Gold–0.19%
| | | | |
| Newmont Mining Corp. | | | 2,414 | | | | 144,864 | |
| |
Health Care Distributors–0.78%
| | | | |
| AmerisourceBergen Corp. | | | 4,086 | | | | 151,958 | |
| |
| Cardinal Health, Inc. | | | 3,668 | | | | 148,958 | |
| |
| McKesson Corp. | | | 1,932 | | | | 150,522 | |
| |
| Patterson Cos. Inc. | | | 5,259 | | | | 155,246 | |
| |
| | | | | | | | 606,684 | |
| |
Health Care Equipment–2.66%
| | | | |
| Baxter International Inc. | | | 3,123 | | | | 154,526 | |
| |
| Becton, Dickinson and Co. | | | 2,125 | | | | 158,780 | |
| |
Boston Scientific Corp.(c) | | | 29,219 | | | | 156,029 | |
| |
| C.R. Bard, Inc. | | | 1,742 | | | | 148,941 | |
| |
CareFusion Corp.(c) | | | 6,247 | | | | 158,736 | |
| |
| Covidien PLC (Ireland) | | | 3,465 | | | | 155,960 | |
| |
Edwards Lifesciences Corp.(c) | | | 2,227 | | | | 157,449 | |
| |
Intuitive Surgical, Inc.(c) | | | 347 | | | | 160,664 | |
| |
| Medtronic, Inc. | | | 4,238 | | | | 162,104 | |
| |
| St. Jude Medical, Inc. | | | 4,557 | | | | 156,305 | |
| |
| Stryker Corp. | | | 3,249 | | | | 161,508 | |
| |
Varian Medical Systems, Inc.(c) | | | 2,375 | | | | 159,434 | |
| |
| Zimmer Holdings, Inc. | | | 3,160 | | | | 168,807 | |
| |
| | | | | | | | 2,059,243 | |
| |
Health Care Facilities–0.22%
| | | | |
Tenet Healthcare Corp.(c) | | | 33,978 | | | | 174,307 | |
| |
Health Care Services–1.00%
| | | | |
DaVita, Inc.(c) | | | 2,024 | | | | 153,439 | |
| |
Express Scripts, Inc.(c) | | | 3,450 | | | | 154,181 | |
| |
Laboratory Corp. of America Holdings(c) | | | 1,839 | | | | 158,099 | |
| |
Medco Health Solutions, Inc.(c) | | | 2,748 | | | | 153,613 | |
| |
| Quest Diagnostics Inc. | | | 2,669 | | | | 154,962 | |
| |
| | | | | | | | 774,294 | |
| |
Health Care Supplies–0.20%
| | | | |
| DENTSPLY International Inc. | | | 4,332 | | | | 151,577 | |
| |
Health Care Technology–0.21%
| | | | |
Cerner Corp.(c) | | | 2,664 | | | | 163,170 | |
| |
Home Entertainment Software–0.20%
| | | | |
Electronic Arts Inc.(c) | | | 7,425 | | | | 152,955 | |
| |
Home Furnishings–0.20%
| | | | |
| Leggett & Platt, Inc. | | | 6,898 | | | | 158,930 | |
| |
Home Improvement Retail–0.40%
| | | | |
| Home Depot, Inc. (The) | | | 3,715 | | | | 156,178 | |
| |
| Lowe’s Cos., Inc. | | | 6,002 | | | | 152,331 | |
| |
Orchard Supply Hardware Stores Corp.–Class A(c) | | | 113 | | | | 826 | |
| |
| | | | | | | | 309,335 | |
| |
Homebuilding–0.62%
| | | | |
| D.R. Horton, Inc. | | | 12,515 | | | | 157,814 | |
| |
| Lennar Corp.–Class A | | | 8,000 | | | | 157,200 | |
| |
PulteGroup Inc.(c) | | | 26,074 | | | | 164,527 | |
| |
| | | | | | | | 479,541 | |
| |
Homefurnishing Retail–0.18%
| | | | |
Bed Bath & Beyond Inc.(c) | | | 2,452 | | | | 142,142 | |
| |
Hotels, Resorts & Cruise Lines–0.80%
| | | | |
| Carnival Corp. | | | 4,432 | | | | 144,660 | |
| |
| Marriott International Inc.–Class A | | | 5,257 | | | | 153,347 | |
| |
| Starwood Hotels & Resorts Worldwide, Inc. | | | 3,306 | | | | 158,589 | |
| |
| Wyndham Worldwide Corp. | | | 4,310 | | | | 163,047 | |
| |
| | | | | | | | 619,643 | |
| |
Household Appliances–0.20%
| | | | |
| Whirlpool Corp. | | | 3,220 | | | | 152,789 | |
| |
| | | | | | | | | |
| | | | | | | | | |
See accompanying Notes to Financial Statements which are an integral part of the financial statements.
Invesco V.I. Select Dimensions Equally-Weighted S&P 500 Fund
| | | | | | | | | |
| | | Shares | | Value |
| |
Household Products–0.80%
| | | | |
| Clorox Co. (The) | | | 2,309 | | | $ | 153,687 | |
| |
| Colgate-Palmolive Co. | | | 1,670 | | | | 154,291 | |
| |
| Kimberly-Clark Corp. | | | 2,106 | | | | 154,918 | |
| |
| Procter & Gamble Co. (The) | | | 2,304 | | | | 153,700 | |
| |
| | | | | | | | 616,596 | |
| |
Housewares & Specialties–0.21%
| | | | |
| Newell Rubbermaid Inc. | | | 10,018 | | | | 161,791 | |
| |
Human Resource & Employment Services–0.20%
| | | | |
| Robert Half International, Inc. | | | 5,538 | | | | 157,611 | |
| |
Hypermarkets & Super Centers–0.39%
| | | | |
| Costco Wholesale Corp. | | | 1,818 | | | | 151,476 | |
| |
| Wal-Mart Stores, Inc. | | | 2,576 | �� | | | 153,942 | |
| |
| | | | | | | | 305,418 | |
| |
Independent Power Producers & Energy Traders–0.59%
| | | | |
AES Corp. (The)(c) | | | 13,059 | | | | 154,619 | |
| |
| Constellation Energy Group Inc. | | | 3,854 | | | | 152,888 | |
| |
NRG Energy, Inc.(c) | | | 8,201 | | | | 148,602 | |
| |
| | | | | | | | 456,109 | |
| |
Industrial Conglomerates–0.80%
| | | | |
| 3M Co. | | | 1,903 | | | | 155,532 | |
| |
| Danaher Corp. | | | 3,238 | | | | 152,316 | |
| |
| General Electric Co. | | | 8,829 | | | | 158,127 | |
| |
| Tyco International Ltd. | | | 3,347 | | | | 156,338 | |
| |
| | | | | | | | 622,313 | |
| |
Industrial Gases–0.60%
| | | | |
| Air Products & Chemicals, Inc. | | | 1,818 | | | | 154,876 | |
| |
| Airgas, Inc. | | | 1,961 | | | | 153,115 | |
| |
| Praxair, Inc. | | | 1,446 | | | | 154,577 | |
| |
| | | | | | | | 462,568 | |
| |
Industrial Machinery–1.78%
| | | | |
| Dover Corp. | | | 2,674 | | | | 155,226 | |
| |
| Eaton Corp. | | | 3,559 | | | | 154,923 | |
| |
| Flowserve Corp. | | | 1,539 | | | | 152,854 | |
| |
| Illinois Tool Works Inc. | | | 3,264 | | | | 152,461 | |
| |
| Ingersoll-Rand PLC (Ireland) | | | 4,899 | | | | 149,273 | |
| |
| Pall Corp. | | | 2,652 | | | | 151,562 | |
| |
| Parker Hannifin Corp. | | | 2,001 | | | | 152,576 | |
| |
| Snap-On Inc. | | | 3,033 | | | | 153,530 | |
| |
| Stanley Black & Decker Inc. | | | 2,379 | | | | 160,820 | |
| |
| | | | | | | | 1,383,225 | |
| |
Industrial REIT’s–0.20%
| | | | |
| Prologis, Inc. | | | 5,464 | | | | 156,216 | |
| |
Insurance Brokers–0.40%
| | | | |
| Aon Corp. | | | 3,347 | | | | 156,640 | |
| |
| Marsh & McLennan Cos., Inc. | | | 4,936 | | | | 156,076 | |
| |
| | | | | | | | 312,716 | |
| |
Integrated Oil & Gas–1.39%
| | | | |
| Chevron Corp. | | | 1,488 | | | | 158,323 | |
| |
| ConocoPhillips | | | 2,194 | | | | 159,877 | |
| |
| Exxon Mobil Corp. | | | 1,872 | | | | 158,671 | |
| |
| Hess Corp. | | | 2,764 | | | | 156,995 | |
| |
| Murphy Oil Corp. | | | 2,876 | | | | 160,308 | |
| |
| Occidental Petroleum Corp. | | | 1,681 | | | | 157,510 | |
| |
WPX Energy Inc.(c) | | | 7,020 | | | | 127,553 | |
| |
| | | | | | | | 1,079,237 | |
| |
Integrated Telecommunication Services–1.01%
| | | | |
| AT&T Inc. | | | 5,204 | | | | 157,369 | |
| |
| CenturyLink Inc. | | | 4,244 | | | | 157,877 | |
| |
| Frontier Communications Corp. | | | 30,525 | | | | 157,204 | |
| |
| Verizon Communications Inc. | | | 3,872 | | | | 155,344 | |
| |
| Windstream Corp. | | | 12,968 | | | | 152,244 | |
| |
| | | | | | | | 780,038 | |
| |
Internet Retail–0.95%
| | | | |
Amazon.com, Inc.(c) | | | 828 | | | | 143,327 | |
| |
| Expedia Inc. | | | 5,637 | | | | 163,586 | |
| |
Netflix Inc.(c) | | | 2,150 | | | | 148,973 | |
| |
Priceline.com Inc.(c) | | | 328 | | | | 153,409 | |
| |
TripAdvisor Inc.(c) | | | 5,092 | | | | 128,369 | |
| |
| | | | | | | | 737,664 | |
| |
Internet Software & Services–1.04%
| | | | |
Akamai Technologies, Inc.(c) | | | 5,634 | | | | 181,865 | |
| |
eBay Inc.(c) | | | 4,939 | | | | 149,800 | |
| |
Google Inc.–Class A(c) | | | 239 | | | | 154,370 | |
| |
| VeriSign, Inc. | | | 4,325 | | | | 154,489 | |
| |
Yahoo! Inc.(c) | | | 10,038 | | | | 161,913 | |
| |
| | | | | | | | 802,437 | |
| |
Investment Banking & Brokerage–0.79%
| | | | |
| Charles Schwab Corp. (The) | | | 13,841 | | | | 155,850 | |
| |
E*TRADE Financial Corp.(c) | | | 19,453 | | | | 154,846 | |
| |
| Goldman Sachs Group, Inc. (The) | | | 1,666 | | | | 150,656 | |
| |
| Morgan Stanley | | | 10,025 | | | | 151,678 | |
| |
| | | | | | | | 613,030 | |
| |
IT Consulting & Other Services–0.96%
| | | | |
| Accenture PLC–Class A (Ireland) | | | 2,760 | | | | 146,915 | |
| |
Cognizant Technology Solutions Corp.–Class A(c) | | | 2,292 | | | | 147,398 | |
| |
| International Business Machines Corp. | | | 817 | | | | 150,230 | |
| |
See accompanying Notes to Financial Statements which are an integral part of the financial statements.
Invesco V.I. Select Dimensions Equally-Weighted S&P 500 Fund
| | | | | | | | | |
| | | Shares | | Value |
| |
IT Consulting & Other Services–(continued)
| | | | |
| | | | | | | | | |
SAIC, Inc.(c) | | | 12,340 | | | $ | 151,659 | |
| |
Teradata Corp.(c) | | | 3,047 | | | | 147,810 | |
| |
| | | | | | | | 744,012 | |
| |
Leisure Products–0.37%
| | | | |
| Hasbro, Inc. | | | 4,414 | | | | 140,762 | |
| |
| Mattel, Inc. | | | 5,372 | | | | 149,127 | |
| |
| | | | | | | | 289,889 | |
| |
Life & Health Insurance–1.41%
| | | | |
| Aflac, Inc. | | | 3,670 | | | | 158,764 | |
| |
| Lincoln National Corp. | | | 8,112 | | | | 157,535 | |
| |
| MetLife, Inc. | | | 4,967 | | | | 154,871 | |
| |
| Principal Financial Group, Inc. | | | 6,379 | | | | 156,923 | |
| |
| Prudential Financial, Inc. | | | 3,124 | | | | 156,575 | |
| |
| Torchmark Corp. | | | 3,563 | | | | 154,599 | |
| |
| Unum Group | | | 7,297 | | | | 153,748 | |
| |
| | | | | | | | 1,093,015 | |
| |
Life Sciences Tools & Services–1.00%
| | | | |
Agilent Technologies, Inc.(c) | | | 4,487 | | | | 156,731 | |
| |
Life Technologies Corp.(c) | | | 3,861 | | | | 150,231 | |
| |
| PerkinElmer, Inc. | | | 8,086 | | | | 161,720 | |
| |
Thermo Fisher Scientific, Inc.(c) | | | 3,425 | | | | 154,022 | |
| |
Waters Corp.(c) | | | 2,096 | | | | 155,209 | |
| |
| | | | | | | | 777,913 | |
| |
Managed Health Care–1.18%
| | | | |
| Aetna Inc. | | | 3,718 | | | | 156,862 | |
| |
| CIGNA Corp. | | | 3,543 | | | | 148,806 | |
| |
Coventry Health Care, Inc.(c) | | | 4,873 | | | | 147,993 | |
| |
| Humana Inc. | | | 1,771 | | | | 155,157 | |
| |
| UnitedHealth Group, Inc. | | | 3,064 | | | | 155,284 | |
| |
| WellPoint Inc. | | | 2,311 | | | | 153,104 | |
| |
| | | | | | | | 917,206 | |
| |
Metal & Glass Containers–0.40%
| | | | |
| Ball Corp. | | | 4,327 | | | | 154,517 | |
| |
Owens-Illinois, Inc.(c) | | | 8,210 | | | | 159,110 | |
| |
| | | | | | | | 313,627 | |
| |
Motorcycle Manufacturers–0.21%
| | | | |
| Harley-Davidson, Inc. | | | 4,092 | | | | 159,056 | |
| |
Movies & Entertainment–0.82%
| | | | |
| News Corp.–Class A | | | 8,844 | | | | 157,777 | |
| |
| Time Warner Inc. | | | 4,341 | | | | 156,884 | |
| |
| Viacom Inc.–Class B | | | 3,512 | | | | 159,480 | |
| |
| Walt Disney Co. (The) | | | 4,251 | | | | 159,412 | |
| |
| | | | | | | | 633,553 | |
| |
Multi-Line Insurance–0.99%
| | | | |
American International Group, Inc.(c) | | | 6,428 | | | | 149,130 | |
| |
| Assurant, Inc. | | | 3,810 | | | | 156,439 | |
| |
Genworth Financial Inc.–Class A(c) | | | 23,991 | | | | 157,141 | |
| |
| Hartford Financial Services Group, Inc. | | | 9,590 | | | | 155,837 | |
| |
| Loews Corp. | | | 4,043 | | | | 152,219 | |
| |
| | | | | | | | 770,766 | |
| |
Multi-Sector Holdings–0.20%
| | | | |
| Leucadia National Corp. | | | 6,813 | | | | 154,928 | |
| |
Multi-Utilities–3.04%
| | | | |
| Ameren Corp. | | | 4,735 | | | | 156,870 | |
| |
| CenterPoint Energy, Inc. | | | 7,813 | | | | 156,963 | |
| |
| CMS Energy Corp. | | | 7,195 | | | | 158,866 | |
| |
| Consolidated Edison, Inc. | | | 2,511 | | | | 155,757 | |
| |
| Dominion Resources, Inc. | | | 2,965 | | | | 157,382 | |
| |
| DTE Energy Co. | | | 2,904 | | | | 158,123 | |
| |
| Integrys Energy Group, Inc. | | | 2,904 | | | | 157,339 | |
| |
| NiSource Inc. | | | 6,665 | | | | 158,694 | |
| |
| PG&E Corp. | | | 3,756 | | | | 154,822 | |
| |
| Public Service Enterprise Group Inc. | | | 4,799 | | | | 158,415 | |
| |
| SCANA Corp. | | | 3,510 | | | | 158,161 | |
| |
| Sempra Energy | | | 2,848 | | | | 156,640 | |
| |
| TECO Energy, Inc. | | | 8,198 | | | | 156,910 | |
| |
| Wisconsin Energy Corp. | | | 4,490 | | | | 156,970 | |
| |
| Xcel Energy, Inc. | | | 5,685 | | | | 157,133 | |
| |
| | | | | | | | 2,359,045 | |
| |
Office Electronics–0.19%
| | | | |
| Xerox Corp. | | | 18,843 | | | | 149,990 | |
| |
Office REIT’s–0.20%
| | | | |
| Boston Properties, Inc. | | | 1,564 | | | | 155,774 | |
| |
Office Services & Supplies–0.40%
| | | | |
| Avery Dennison Corp. | | | 5,469 | | | | 156,851 | |
| |
| Pitney Bowes Inc. | | | 8,188 | | | | 151,805 | |
| |
| | | | | | | | 308,656 | |
| |
Oil & Gas Drilling–0.99%
| | | | |
| Diamond Offshore Drilling, Inc. | | | 2,765 | | | | 152,794 | |
| |
| Helmerich & Payne, Inc. | | | 2,691 | | | | 157,047 | |
| |
Nabors Industries Ltd.(c) | | | 8,971 | | | | 155,557 | |
| |
Noble Corp.(c) | | | 4,907 | | | | 148,289 | |
| |
Rowan Cos., Inc.(c) | | | 5,027 | | | | 152,469 | |
| |
| | | | | | | | 766,156 | |
| |
Oil & Gas Equipment & Services–1.22%
| | | | |
| Baker Hughes Inc. | | | 3,269 | | | | 159,004 | |
| |
Cameron International Corp.(c) | | | 3,158 | | | | 155,342 | |
| |
See accompanying Notes to Financial Statements which are an integral part of the financial statements.
Invesco V.I. Select Dimensions Equally-Weighted S&P 500 Fund
| | | | | | | | | |
| | | Shares | | Value |
| |
Oil & Gas Equipment & Services–(continued)
| | | | |
| | | | | | | | | |
FMC Technologies, Inc.(c) | | | 3,039 | | | $ | 158,727 | |
| |
| Halliburton Co. | | | 4,728 | | | | 163,163 | |
| |
| National Oilwell Varco Inc. | | | 2,291 | | | | 155,765 | |
| |
| Schlumberger Ltd. | | | 2,243 | | | | 153,220 | |
| |
| | | | | | | | 945,221 | |
| |
Oil & Gas Exploration & Production–2.97%
| | | | |
| Anadarko Petroleum Corp. | | | 2,058 | | | | 157,087 | |
| |
| Apache Corp. | | | 1,691 | | | | 153,171 | |
| |
| Cabot Oil & Gas Corp. | | | 2,024 | | | | 153,622 | |
| |
| Chesapeake Energy Corp. | | | 6,535 | | | | 145,665 | |
| |
Denbury Resources Inc.(c) | | | 10,052 | | | | 151,785 | |
| |
| Devon Energy Corp. | | | 2,483 | | | | 153,946 | |
| |
| EOG Resources, Inc. | | | 1,537 | | | | 151,410 | |
| |
| EQT Corp. | | | 2,762 | | | | 151,330 | |
| |
| Marathon Oil Corp. | | | 5,484 | | | | 160,517 | |
| |
Newfield Exploration Co.(c) | | | 4,057 | | | | 153,071 | |
| |
| Noble Energy, Inc. | | | 1,667 | | | | 157,348 | |
| |
| Pioneer Natural Resources Co. | | | 1,784 | | | | 159,632 | |
| |
| QEP Resources Inc. | | | 5,201 | | | | 152,389 | |
| |
| Range Resources Corp. | | | 2,494 | | | | 154,478 | |
| |
Southwestern Energy Co.(c) | | | 4,483 | | | | 143,187 | |
| |
| | | | | | | | 2,298,638 | |
| |
Oil & Gas Refining & Marketing–0.81%
| | | | |
| Marathon Petroleum Corp. | | | 4,698 | | | | 156,396 | |
| |
| Sunoco, Inc. | | | 3,838 | | | | 157,435 | |
| |
Tesoro Corp.(c) | | | 6,795 | | | | 158,731 | |
| |
| Valero Energy Corp. | | | 7,318 | | | | 154,044 | |
| |
| | | | | | | | 626,606 | |
| |
Oil & Gas Storage & Transportation–0.65%
| | | | |
| El Paso Corp. | | | 6,012 | | | | 159,739 | |
| |
| Spectra Energy Corp. | | | 5,105 | | | | 156,978 | |
| |
Williams Cos., Inc. (The)(c) | | | 1,083 | | | | 29,252 | |
| |
| Williams Cos., Inc. (The) | | | 4,844 | | | | 159,949 | |
| |
| | | | | | | | 505,918 | |
| |
Other Diversified Financial Services–0.60%
| | | | �� |
| Bank of America Corp. | | | 28,882 | | | | 160,584 | |
| |
| Citigroup Inc. | | | 5,768 | | | | 151,756 | |
| |
| JPMorgan Chase & Co. | | | 4,708 | | | | 156,541 | |
| |
| | | | | | | | 468,881 | |
| |
Packaged Foods & Meats–2.77%
| | | | |
| Campbell Soup Co. | | | 4,589 | | | | 152,538 | |
| |
| ConAgra Foods, Inc. | | | 5,901 | | | | 155,787 | |
| |
Dean Foods Co.(c) | | | 14,009 | | | | 156,901 | |
| |
| General Mills, Inc. | | | 3,780 | | | | 152,750 | |
| |
| H.J. Heinz Co. | | | 2,834 | | | | 153,149 | |
| |
| Hershey Co. (The) | | | 2,527 | | | | 156,118 | |
| |
| Hormel Foods Corp. | | | 5,252 | | | | 153,831 | |
| |
| J M Smucker Co. (The) | | | 1,955 | | | | 152,822 | |
| |
| Kellogg Co. | | | 3,079 | | | | 155,705 | |
| |
| Kraft Foods Inc.–Class A | | | 4,115 | | | | 153,737 | |
| |
| McCormick & Co., Inc. | | | 3,080 | | | | 155,294 | |
| |
| Mead Johnson Nutrition Co. | | | 2,058 | | | | 141,446 | |
| |
| Sara Lee Corp. | | | 8,152 | | | | 154,236 | |
| |
| Tyson Foods, Inc.–Class A | | | 7,372 | | | | 152,158 | |
| |
| | | | | | | | 2,146,472 | |
| |
Paper Packaging–0.39%
| | | | |
| Bemis Co., Inc. | | | 5,126 | | | | 154,190 | |
| |
| Sealed Air Corp. | | | 8,620 | | | | 148,350 | |
| |
| | | | | | | | 302,540 | |
| |
Paper Products–0.41%
| | | | |
| International Paper Co. | | | 5,430 | | | | 160,728 | |
| |
| MeadWestvaco Corp. | | | 5,215 | | | | 156,189 | |
| |
| | | | | | | | 316,917 | |
| |
Personal Products–0.40%
| | | | |
| Avon Products, Inc. | | | 8,982 | | | | 156,916 | |
| |
| Estee Lauder Cos. Inc. (The)–Class A | | | 1,388 | | | | 155,900 | |
| |
| | | | | | | | 312,816 | |
| |
Pharmaceuticals–2.39%
| | | | |
| Abbott Laboratories | | | 2,735 | | | | 153,789 | |
| |
| Allergan, Inc. | | | 1,794 | | | | 157,406 | |
| |
| Bristol-Myers Squibb Co. | | | 4,388 | | | | 154,633 | |
| |
| Eli Lilly & Co. | | | 3,705 | | | | 153,980 | |
| |
Forest Laboratories, Inc.(c) | | | 5,172 | | | | 156,505 | |
| |
Hospira, Inc.(c) | | | 5,192 | | | | 157,681 | |
| |
| Johnson & Johnson | | | 2,334 | | | | 153,064 | |
| |
| Merck & Co., Inc. | | | 4,142 | | | | 156,153 | |
| |
Mylan Inc.(c) | | | 7,192 | | | | 154,340 | |
| |
| Perrigo Co. | | | 1,529 | | | | 148,772 | |
| |
| Pfizer Inc. | | | 7,141 | | | | 154,531 | |
| |
Watson Pharmaceuticals, Inc.(c) | | | 2,497 | | | | 150,669 | |
| |
| | | | | | | | 1,851,523 | |
| |
Property & Casualty Insurance–1.59%
| | | | |
| ACE Ltd. (Switzerland) | | | 2,249 | | | | 157,700 | |
| |
| Allstate Corp. (The) | | | 5,679 | | | | 155,661 | |
| |
Berkshire Hathaway Inc.–Class B(c) | | | 1,998 | | | | 152,447 | |
| |
| Chubb Corp. (The) | | | 2,228 | | | | 154,222 | |
| |
| Cincinnati Financial Corp. | | | 5,008 | | | | 152,544 | |
| |
| Progressive Corp. (The) | | | 8,043 | | | | 156,919 | |
| |
See accompanying Notes to Financial Statements which are an integral part of the financial statements.
Invesco V.I. Select Dimensions Equally-Weighted S&P 500 Fund
| | | | | | | | | |
| | | Shares | | Value |
| |
Property & Casualty Insurance–(continued)
| | | | |
| | | | | | | | | |
| Travelers Cos., Inc. (The) | | | 2,621 | | | $ | 155,085 | |
| |
| XL Group PLC (Ireland) | | | 7,646 | | | | 151,161 | |
| |
| | | | | | | | 1,235,739 | |
| |
Publishing–0.61%
| | | | |
| Gannett Co., Inc. | | | 11,624 | | | | 155,413 | |
| |
| McGraw-Hill Cos., Inc. (The) | | | 3,512 | | | | 157,935 | |
| |
| Washington Post Co. (The)–Class B | | | 424 | | | | 159,767 | |
| |
| | | | | | | | 473,115 | |
| |
Railroads–0.61%
| | | | |
| CSX Corp. | | | 7,357 | | | | 154,938 | |
| |
| Norfolk Southern Corp. | | | 2,157 | | | | 157,159 | |
| |
| Union Pacific Corp. | | | 1,503 | | | | 159,228 | |
| |
| | | | | | | | 471,325 | |
| |
Real Estate Services–0.20%
| | | | |
CBRE Group, Inc.–Class A(c) | | | 9,934 | | | | 151,195 | |
| |
Regional Banks–2.06%
| | | | |
| BB&T Corp. | | | 6,244 | | | | 157,162 | |
| |
| Fifth Third Bancorp | | | 12,442 | | | | 158,262 | |
| |
| First Horizon National Corp. | | | 20,240 | | | | 161,920 | |
| |
| Huntington Bancshares Inc. | | | 29,505 | | | | 161,982 | |
| |
| KeyCorp | | | 20,917 | | | | 160,852 | |
| |
| M&T Bank Corp. | | | 2,063 | | | | 157,489 | |
| |
| PNC Financial Services Group, Inc. | | | 2,725 | | | | 157,151 | |
| |
| Regions Financial Corp. | | | 37,640 | | | | 161,852 | |
| |
| SunTrust Banks, Inc. | | | 9,113 | | | | 161,300 | |
| |
| Zions Bancorp. | | | 9,965 | | | | 162,230 | |
| |
| | | | | | | | 1,600,200 | |
| |
Research & Consulting Services–0.40%
| | | | |
| Dun & Bradstreet Corp. (The) | | | 2,121 | | | | 158,715 | |
| |
| Equifax Inc. | | | 3,980 | | | | 154,185 | |
| |
| | | | | | | | 312,900 | |
| |
Residential REIT’s–0.60%
| | | | |
| Apartment Investment & Management Co.–Class A | | | 6,888 | | | | 157,804 | |
| |
| AvalonBay Communities, Inc. | | | 1,166 | | | | 152,279 | |
| |
| Equity Residential | | | 2,688 | | | | 153,297 | |
| |
| | | | | | | | 463,380 | |
| |
Restaurants–1.01%
| | | | |
Chipotle Mexican Grill, Inc.(c) | | | 471 | | | | 159,076 | |
| |
| Darden Restaurants, Inc. | | | 3,438 | | | | 156,704 | |
| |
| McDonald’s Corp. | | | 1,539 | | | | 154,408 | |
| |
| Starbucks Corp. | | | 3,453 | | | | 158,872 | |
| |
| Yum! Brands, Inc. | | | 2,601 | | | | 153,485 | |
| |
| | | | | | | | 782,545 | |
| |
Retail REIT’s–0.40%
| | | | |
| Kimco Realty Corp. | | | 9,310 | | | | 151,194 | |
| |
| Simon Property Group, Inc. | | | 1,217 | | | | 156,920 | |
| |
| | | | | | | | 308,114 | |
| |
Semiconductor Equipment–0.80%
| | | | |
| Applied Materials, Inc. | | | 14,538 | | | | 155,702 | |
| |
| KLA-Tencor Corp. | | | 3,261 | | | | 157,343 | |
| |
Novellus Systems, Inc.(c) | | | 3,737 | | | | 154,301 | |
| |
Teradyne, Inc.(c) | | | 11,376 | | | | 155,055 | |
| |
| | | | | | | | 622,401 | |
| |
Semiconductors–2.65%
| | | | |
Advanced Micro Devices, Inc.(c) | | | 29,275 | | | | 158,085 | |
| |
| Altera Corp. | | | 4,405 | | | | 163,425 | |
| |
| Analog Devices, Inc. | | | 4,390 | | | | 157,074 | |
| |
Broadcom Corp.–Class A(c) | | | 5,228 | | | | 153,494 | |
| |
First Solar, Inc.(c) | | | 4,705 | | | | 158,841 | |
| |
| Intel Corp. | | | 6,464 | | | | 156,752 | |
| |
| Linear Technology Corp. | | | 5,183 | | | | 155,645 | |
| |
LSI Corp.(c) | | | 27,709 | | | | 164,868 | |
| |
| Microchip Technology Inc. | | | 4,355 | | | | 159,524 | |
| |
Micron Technology, Inc.(c) | | | 26,441 | | | | 166,314 | |
| |
NVIDIA Corp.(c) | | | 11,115 | | | | 154,054 | |
| |
| Texas Instruments Inc. | | | 5,233 | | | | 152,333 | |
| |
| Xilinx, Inc. | | | 4,811 | | | | 154,241 | |
| |
| | | | | | | | 2,054,650 | |
| |
Soft Drinks–0.79%
| | | | |
Coca-Cola Co. (The) | | | 2,232 | | | | 156,173 | |
| |
Coca-Cola Enterprises, Inc. | | | 5,825 | | | | 150,169 | |
| |
| Dr. Pepper Snapple Group, Inc. | | | 3,853 | | | | 152,116 | |
| |
| PepsiCo, Inc. | | | 2,320 | | | | 153,932 | |
| |
| | | | | | | | 612,390 | |
| |
Specialized Consumer Services–0.21%
| | | | |
| H&R Block, Inc. | | | 9,777 | | | | 159,658 | |
| |
Specialized Finance–0.98%
| | | | |
| CME Group Inc. | | | 620 | | | | 151,076 | |
| |
IntercontinentalExchange Inc.(c) | | | 1,275 | | | | 153,701 | |
| |
| Moody’s Corp. | | | 4,620 | | | | 155,602 | |
| |
NASDAQ OMX Group, Inc. (The)(c) | | | 6,249 | | | | 153,163 | |
| |
| NYSE Euronext | | | 5,724 | | | | 149,396 | |
| |
| | | | | | | | 762,938 | |
| |
Specialized REIT’s–1.44%
| | | | |
| HCP, Inc. | | | 3,849 | | | | 159,464 | |
| |
| Health Care REIT, Inc. | | | 2,884 | | | | 157,264 | |
| |
| Host Hotels & Resorts Inc. | | | 10,819 | | | | 159,797 | |
| |
| Plum Creek Timber Co., Inc. | | | 4,260 | | | | 155,746 | |
| |
See accompanying Notes to Financial Statements which are an integral part of the financial statements.
Invesco V.I. Select Dimensions Equally-Weighted S&P 500 Fund
| | | | | | | | | |
| | | Shares | | Value |
| |
Specialized REIT’s–(continued)
| | | | |
| | | | | | | | | |
| Public Storage | | | 1,169 | | | $ | 157,184 | |
| |
| Ventas, Inc. | | | 2,838 | | | | 156,459 | |
| |
| Weyerhaeuser Co. | | | 8,993 | | | | 167,899 | |
| |
| | | | | | | | 1,113,813 | |
| |
Specialty Chemicals–0.80%
| | | | |
| Ecolab Inc. | | | 2,743 | | | | 158,573 | |
| |
| International Flavors & Fragrances Inc. | | | 2,894 | | | | 151,703 | |
| |
| Sherwin-Williams Co. (The) | | | 1,773 | | | | 158,276 | |
| |
| Sigma-Aldrich Corp. | | | 2,377 | | | | 148,467 | |
| |
| | | | | | | | 617,019 | |
| |
Specialty Stores–0.40%
| | | | |
| Staples, Inc. | | | 10,665 | | | | 148,137 | |
| |
| Tiffany & Co. | | | 2,397 | | | | 158,825 | |
| |
| | | | | | | | 306,962 | |
| |
Steel–0.79%
| | | | |
| Allegheny Technologies, Inc. | | | 3,358 | | | | 160,512 | |
| |
| Cliffs Natural Resources Inc. | | | 2,347 | | | | 146,336 | |
| |
| Nucor Corp. | | | 3,851 | | | | 152,384 | |
| |
| United States Steel Corp. | | | 5,805 | | | | 153,600 | |
| |
| | | | | | | | 612,832 | |
| |
Systems Software–1.11%
| | | | |
BMC Software, Inc.(c) | | | 4,527 | | | | 148,395 | |
| |
| CA, Inc. | | | 7,463 | | | | 150,865 | |
| |
Microsoft Corp.(b) | | | 5,776 | | | | 149,945 | |
| |
| Oracle Corp. | | | 5,140 | | | | 131,841 | |
| |
Red Hat, Inc.(c) | | | 3,152 | | | | 130,146 | |
| |
Symantec Corp.(c) | | | 9,714 | | | | 152,024 | |
| |
| | | | | | | | 863,216 | |
| |
Thrifts & Mortgage Finance–0.40%
| | | | |
| Hudson City Bancorp, Inc. | | | 25,030 | | | | 156,438 | |
| |
| People’s United Financial Inc. | | | 12,092 | | | | 155,382 | |
| |
| | | | | | | | 311,820 | |
| |
Tires & Rubber–0.20%
| | | | |
Goodyear Tire & Rubber Co. (The)(c) | | | 11,058 | | | | 156,692 | |
| |
Tobacco–0.80%
| | | | |
| Altria Group, Inc. | | | 5,153 | | | | 152,786 | |
| |
| Lorillard, Inc. | | | 1,389 | | | | 158,346 | |
| |
| Philip Morris International Inc. | | | 1,985 | | | | 155,783 | |
| |
| Reynolds American Inc. | | | 3,693 | | | | 152,964 | |
| |
| | | | | | | | 619,879 | |
| |
Trading Companies & Distributors–0.41%
| | | | |
| Fastenal Co. | | | 3,625 | | | | 158,086 | |
| |
| W.W. Grainger, Inc. | | | 838 | | | | 156,865 | |
| |
| | | | | | | | 314,951 | |
| |
Trucking–0.20%
| | | | |
| Ryder System, Inc. | | | 2,958 | | | | 157,188 | |
| |
Wireless Telecommunication Services–0.60%
| | | | |
| American Tower Corp.–Class A | | | 2,538 | | | | 152,305 | |
| |
MetroPCS Communications, Inc.(c) | | | 18,029 | | | | 156,492 | |
| |
Sprint Nextel Corp.(c) | | | 66,749 | | | | 156,193 | |
| |
| | | | | | | | 464,990 | |
| |
| Total Common Stocks & Other Equity Interests (Cost $42,166,529) | | | | | | | 77,483,245 | |
| |
Preferred Stocks–0.00%
| | | | |
| Orchard Supply Hardware Stores Corp.–Series A–Pfd. (Cost $0) | | | 113 | | | | 0 | |
| |
Money Market Funds–0.13%
| | | | |
Liquid Assets Portfolio–Institutional Class(e) | | | 49,993 | | | | 49,993 | |
| |
Premier Portfolio–Institutional Class(e) | | | 49,992 | | | | 49,992 | |
| |
| Total Money Market Funds (Cost $99,985) | | | | | | | 99,985 | |
| |
| TOTAL INVESTMENTS–100.08% (Cost $42,266,514) | | | | | | | 77,583,230 | |
| |
| OTHER ASSETS LESS LIABILITIES–(0.08)% | | | | | | | (62,299 | ) |
| |
| NET ASSETS–100.00% | | | | | | $ | 77,520,931 | |
| |
Investment Abbreviations:
| | | |
| REIT | | – Real Estate Investment Trust |
| Pfd. | | – Preferred |
Notes to Schedule of Investments:
| | |
| (a) | | Industry and/or sector classifications used in this report are generally according to the Global Industry Classification Standard, which was developed by and is the exclusive property and a service mark of MSCI Inc. and Standard & Poor’s. |
| (b) | | All or a portion of the value was pledged as collateral to cover margin requirements for open futures contracts. See Note 1I and Note 4. |
| (c) | | Non-income producing security. |
| (d) | | The Fund’s Adviser is a subsidiary of Invesco Ltd. and therefore, Invesco Ltd. is considered to be affiliated with the Fund. See Note 5. |
| (e) | | The money market fund and the Fund are affiliated by having the same investment adviser. |
See accompanying Notes to Financial Statements which are an integral part of the financial statements.
Invesco V.I. Select Dimensions Equally-Weighted S&P 500 Fund
Statement of Assets and Liabilities
December 31, 2011
| | | | | |
Assets:
|
| Investments, at value (Cost $42,010,508) | | $ | 77,326,443 | |
| |
| Investments in affiliates, at value (Cost $256,006) | | | 256,787 | |
| |
| Total investments, at value (Cost $42,266,514) | | | 77,583,230 | |
| |
| Receivable for: | | | | |
| Investments sold | | | 155,416 | |
| |
| Dividends | | | 111,504 | |
| |
| Investment for trustee deferred compensation and retirement plans | | | 6,129 | |
| |
| Other assets | | | 2,796 | |
| |
| Total assets | | | 77,859,075 | |
| |
Liabilities:
|
| Payable for: | | | | |
| Investments purchased | | | 156,788 | |
| |
| Fund shares reacquired | | | 10,922 | |
| |
| Variation margin | | | 792 | |
| |
| Accrued fees to affiliates | | | 118,588 | |
| |
| Accrued other operating expenses | | | 42,108 | |
| |
| Trustee deferred compensation and retirement plans | | | 8,946 | |
| |
| Total liabilities | | | 338,144 | |
| |
| Net assets applicable to shares outstanding | | $ | 77,520,931 | |
| |
Net assets consist of:
|
| Shares of beneficial interest | | $ | 32,935,793 | |
| |
| Undistributed net investment income | | | 1,220,027 | |
| |
| Undistributed net realized gain | | | 8,042,498 | |
| |
| Unrealized appreciation | | | 35,322,613 | |
| |
| | | $ | 77,520,931 | |
| |
Net Assets:
|
| Series I | | $ | 35,997,999 | |
| |
| Series II | | $ | 41,522,932 | |
| |
Shares outstanding, $0.001 par value per share, with an unlimited number of shares authorized:
|
| Series I | | | 1,964,363 | |
| |
| Series II | | | 2,294,779 | |
| |
| Series I: | | | | |
| Net asset value per share | | $ | 18.33 | |
| |
| Series II: | | | | |
| Net asset value per share | | $ | 18.09 | |
| |
Statement of Operations
For the year ended December 31, 2011
| | | | | |
Investment income:
|
| Dividends | | $ | 1,661,102 | |
| |
| Dividends from affiliates | | | 4,728 | |
| |
| Total investment income | | | 1,665,830 | |
| |
Expenses:
|
| Advisory fees | | | 107,120 | |
| |
| Administrative services fees | | | 199,164 | |
| |
| Custodian fees | | | 64,482 | |
| |
| Distribution fees — Series II | | | 121,532 | |
| |
| Transfer agent fees | | | 2,190 | |
| |
| Trustees’ and officers’ fees and benefits | | | 21,123 | |
| |
| Professional services fees | | | 33,087 | |
| |
| Other | | | 29,313 | |
| |
| Total expenses | | | 578,011 | |
| |
| Less: Fees waived and expenses reimbursed | | | (127,807 | ) |
| |
| Net expenses | | | 450,204 | |
| |
| Net investment income | | | 1,215,626 | |
| |
Realized and unrealized gain (loss) from:
|
| Net realized gain from: | | | | |
| Investment securities | | | 10,895,011 | |
| |
| Futures contracts | | | 32,196 | |
| |
| | | | 10,927,207 | |
| |
| Change in net unrealized appreciation (depreciation) of: | | | | |
| Investment securities | | | (12,103,599 | ) |
| |
| Futures contracts | | | (9,354 | ) |
| |
| | | | (12,112,953 | ) |
| |
| Net realized and unrealized gain (loss) | | | (1,185,746 | ) |
| |
| Net increase in net assets resulting from operations | | $ | 29,880 | |
| |
See accompanying Notes to Financial Statements which are an integral part of the financial statements.
Invesco V.I. Select Dimensions Equally-Weighted S&P 500 Fund
Statement of Changes in Net Assets
For the years ended December 31, 2011 and 2010
| | | | | | | | | |
| | | 2011 | | 2010 |
| |
Operations:
| | | | |
| Net investment income | | $ | 1,215,626 | | | $ | 1,408,741 | |
| |
| Net realized gain | | | 10,927,207 | | | | 8,745,848 | |
| |
| Change in net unrealized appreciation (depreciation) | | | (12,112,953 | ) | | | 8,613,235 | |
| |
| Net increase in net assets resulting from operations | | | 29,880 | | | | 18,767,824 | |
| |
Distributions to shareholders from net investment income:
| | | | |
| Series I | | | (694,111 | ) | | | (629,718 | ) |
| |
| Series II | | | (682,257 | ) | | | (710,006 | ) |
| |
| Total distributions from net investment income | | | (1,376,368 | ) | | | (1,339,724 | ) |
| |
Share transactions–net:
| | | | |
| Series I | | | (6,950,303 | ) | | | (7,540,299 | ) |
| |
| Series II | | | (13,497,863 | ) | | | (11,702,914 | ) |
| |
| Net increase (decrease) in net assets resulting from share transactions | | | (20,448,166 | ) | | | (19,243,213 | ) |
| |
| Net increase (decrease) in net assets | | | (21,794,654 | ) | | | (1,815,113 | ) |
| |
Net assets:
| | | | |
| Beginning of year | | | 99,315,585 | | | | 101,130,698 | |
| |
| End of year (includes undistributed net investment income of $1,220,027 and $1,403,702, respectively) | | $ | 77,520,931 | | | $ | 99,315,585 | |
| |
Notes to Financial Statements
December 31, 2011
NOTE 1—Significant Accounting Policies
Invesco V.I. Select Dimensions Equally-Weighted S&P 500 Fund (the “Fund”) is a series portfolio of AIM Variable Insurance Funds (Invesco Variable Insurance Funds) (the “Trust”). The Trust is a Delaware statutory trust registered under the Investment Company Act of 1940, as amended (the “1940 Act”), as an open-end series management investment company consisting of twenty-eight separate portfolios, (each constituting a “Fund”). The assets, liabilities and operations of each portfolio are accounted for separately. Information presented in these financial statements pertains only to the Fund. Matters affecting each Fund or class will be voted on exclusively by the shareholders of such Fund or class. Current Securities and Exchange Commission (“SEC”) guidance, however, requires participating insurance companies offering separate accounts to vote shares proportionally in accordance with the instructions of the contract owners whose investments are funded by shares of each Fund or class.
The investment objective’s is to achieve a high level of total return on its assets through a combination of capital appreciation and current income.
The Fund currently offers two classes of shares, Series I and Series II, both of which are offered to insurance company separate accounts funding variable annuity contracts and variable life insurance policies (“variable products”).
The following is a summary of the significant accounting policies followed by the Fund in the preparation of its financial statements.
| | |
| A. | | Security Valuations — Securities, including restricted securities, are valued according to the following policy. |
| | A security listed or traded on an exchange (except convertible bonds) is valued at its last sales price or official closing price as of the close of the customary trading session on the exchange where the security is principally traded, or lacking any sales or official closing price on a particular day, the security may be valued at the closing bid price on that day. Securities traded in the over-the-counter market are valued based on prices furnished by independent pricing services or market makers. When such securities are valued by an independent pricing service they may be considered fair valued. Futures contracts are valued at the final settlement price set by an exchange on which they are principally traded. Listed options are valued at the mean between the last bid and ask prices from the exchange on which they are principally traded. Options not listed on an exchange are valued by an independent source at the mean between the last bid and ask prices. For purposes of determining net asset value per share, futures and option contracts generally are valued 15 minutes after the close of the customary trading session of the New York Stock Exchange (“NYSE”). |
| | Investments in open-end and closed-end registered investment companies that do not trade on an exchange are valued at the end of day net asset value per share. Investments in open-end and closed-end registered investment companies that trade on an exchange are valued at the last sales price or official closing price as of the close of the customary trading session on the exchange where the security is principally traded. |
| | Debt obligations (including convertible bonds) and unlisted equities are fair valued using an evaluated quote provided by an independent pricing service. Evaluated quotes provided by the pricing service may be determined without exclusive reliance on quoted prices, and may reflect appropriate factors such as |
Invesco V.I. Select Dimensions Equally-Weighted S&P 500 Fund
| | |
| | institution-size trading in similar groups of securities, developments related to specific securities, dividend rate, yield, quality, type of issue, coupon rate, maturity, individual trading characteristics and other market data. Debt securities are subject to interest rate and credit risks. In addition, all debt securities involve some risk of default with respect to interest and/or principal payments. |
| | Foreign securities (including foreign exchange contracts) are converted into U.S. dollar amounts using the applicable exchange rates as of the close of the NYSE. If market quotations are available and reliable for foreign exchange traded equity securities, the securities will be valued at the market quotations. Because trading hours for certain foreign securities end before the close of the NYSE, closing market quotations may become unreliable. If between the time trading ends on a particular security and the close of the customary trading session on the NYSE, events occur that are significant and make the closing price unreliable, the Fund may fair value the security. If the event is likely to have affected the closing price of the security, the security will be valued at fair value in good faith using procedures approved by the Board of Trustees. Adjustments to closing prices to reflect fair value may also be based on a screening process of an independent pricing service to indicate the degree of certainty, based on historical data, that the closing price in the principal market where a foreign security trade is not the current value as of the close of the NYSE. Foreign securities meeting the approved degree of certainty that the price is not reflective of current value will be priced at the indication of fair value from the independent pricing service. Multiple factors may be considered by the independent pricing service in determining adjustments to reflect fair value and may include information relating to sector indices, American Depositary Receipts and domestic and foreign index futures. Foreign securities may have additional risks including exchange rate changes, potential for sharply devalued currencies and high inflation, political and economic upheaval, the relative lack of issuer information, relatively low market liquidity and the potential lack of strict financial and accounting controls and standards. |
| | Securities for which market prices are not provided by any of the above methods may be valued based upon quotes furnished by independent sources. The last bid price may be used to value equity securities. The mean between the last bid and asked prices is used to value debt obligations, including Corporate Loans. |
| | Securities for which market quotations are not readily available or are unreliable are valued at fair value as determined in good faith by or under the supervision of the Trust’s officers following procedures approved by the Board of Trustees. Issuer specific events, market trends, bid/ask quotes of brokers and information providers and other market data may be reviewed in the course of making a good faith determination of a security’s fair value. |
| | Valuations change in response to many factors including the historical and prospective earnings of the issuer, the value of the issuer’s assets, general economic conditions, interest rates, investor perceptions and market liquidity. Because of the inherent uncertainties of valuation, the values reflected in the financial statements may materially differ from the value received upon actual sale of those investments. |
| B. | | Securities Transactions and Investment Income — Securities transactions are accounted for on a trade date basis. Realized gains or losses on sales are computed on the basis of specific identification of the securities sold. Interest income is recorded on the accrual basis from settlement date. Dividend income (net of withholding tax, if any) is recorded on the ex-dividend date. |
| | The Fund may periodically participate in litigation related to Fund investments. As such, the Fund may receive proceeds from litigation settlements. Any proceeds received are included in the Statement of Operations as realized gain (loss) for investments no longer held and as unrealized gain (loss) for investments still held. |
| | Brokerage commissions and mark ups are considered transaction costs and are recorded as an increase to the cost basis of securities purchased and/or a reduction of proceeds on a sale of securities. Such transaction costs are included in the determination of net realized and unrealized gain (loss) from investment securities reported in the Statement of Operations and the Statement of Changes in Net Assets and the net realized and unrealized gains (losses) on securities per share in the Financial Highlights. Transaction costs are included in the calculation of the Fund’s net asset value and, accordingly, they reduce the Fund’s total returns. These transaction costs are not considered operating expenses and are not reflected in net investment income reported in the Statement of Operations and Statement of Changes in Net Assets, or the net investment income per share and ratios of expenses and net investment income reported in the Financial Highlights, nor are they limited by any expense limitation arrangements between the Fund and the investment adviser. |
| | The Fund allocates income and realized and unrealized capital gains and losses to a class based on the relative net assets of each class. |
| C. | | Country Determination — For the purposes of making investment selection decisions and presentation in the Schedule of Investments, the investment adviser may determine the country in which an issuer is located and/or credit risk exposure based on various factors. These factors include the laws of the country under which the issuer is organized, where the issuer maintains a principal office, the country in which the issuer derives 50% or more of its total revenues and the country that has the primary market for the issuer’s securities, as well as other criteria. Among the other criteria that may be evaluated for making this determination are the country in which the issuer maintains 50% or more of its assets, the type of security, financial guarantees and enhancements, the nature of the collateral and the sponsor organization. Country of issuer and/or credit risk exposure has been determined to be the United States of America, unless otherwise noted. |
| D. | | Distributions — Distributions from income and net realized capital gain, if any, are generally paid to separate accounts of participating insurance companies annually and recorded on ex-dividend date. |
| E. | | Federal Income Taxes — The Fund intends to comply with the requirements of Subchapter M of the Internal Revenue Code necessary to qualify as a regulated investment company and to distribute substantially all of the Fund’s taxable earnings to shareholders. As such, the Fund will not be subject to federal income taxes on otherwise taxable income (including net realized capital gain) that is distributed to shareholders. Therefore, no provision for federal income taxes is recorded in the financial statements. |
| | The Fund files tax returns in the U.S. Federal jurisdiction and certain other jurisdictions. Generally, the Fund is subject to examinations by such taxing authorities for up to three years after the filing of the return for the tax period. |
| F. | | Expenses — Fees provided for under the Rule 12b-1 plan of a particular class of the Fund and which are directly attributable to that class are charged to the operations of such class. All other expenses are allocated among the classes based on relative net assets. |
Invesco V.I. Select Dimensions Equally-Weighted S&P 500 Fund
| | |
| G. | | Accounting Estimates — The preparation of financial statements in conformity with accounting principles generally accepted in the United States of America (“GAAP”) requires management to make estimates and assumptions that affect the reported amounts of assets and liabilities at the date of the financial statements and the reported amounts of revenues and expenses during the reporting period including estimates and assumptions related to taxation. Actual results could differ from those estimates by a significant amount. In addition, the Fund monitors for material events or transactions that may occur or become known after the period-end date and before the date the financial statements are released to print. |
| H. | | Indemnifications — Under the Trust’s organizational documents, each Trustee, officer, employee or other agent of the Trust is indemnified against certain liabilities that may arise out of performance of their duties to the Fund. Additionally, in the normal course of business, the Fund enters into contracts, including the Fund’s servicing agreements that contain a variety of indemnification clauses. The Fund’s maximum exposure under these arrangements is unknown as this would involve future claims that may be made against the Fund that have not yet occurred. The risk of material loss as a result of such indemnification claims is considered remote. |
| I. | | Futures Contracts — The Fund may enter into futures contracts to manage exposure to interest rate, equity and market price movements and/or currency risks. A futures contract is an agreement between two parties to purchase or sell a specified underlying security, currency or commodity (or delivery of a cash settlement price, in the case of an index future) for a fixed price at a future date. The Fund currently invests only in exchange-traded futures and they are standardized as to maturity date and underlying financial instrument. Initial margin deposits required upon entering into futures contracts are satisfied by the segregation of specific securities or cash as collateral at the futures commission merchant (broker). During the period the futures contracts are open, changes in the value of the contracts are recognized as unrealized gains or losses by recalculating the value of the contracts on a daily basis. Subsequent or variation margin payments are received or made depending upon whether unrealized gains or losses are incurred. These amounts are reflected as receivables or payables on the Statement of Assets and Liabilities. When the contracts are closed or expire, the Fund recognizes a realized gain or loss equal to the difference between the proceeds from, or cost of, the closing transaction and the Fund’s basis in the contract. The net realized gain (loss) and the change in unrealized gain (loss) on futures contracts held during the period is included on the Statement of Operations. The primary risks associated with futures contracts are market risk and the absence of a liquid secondary market. If the Fund were unable to liquidate a futures contract and/or enter into an offsetting closing transaction, the Fund would continue to be subject to market risk with respect to the value of the contracts and continue to be required to maintain the margin deposits on the futures contracts. Futures contracts have minimal counterparty risk since the exchange’s clearinghouse, as counterparty to all exchange-traded futures, guarantees the futures against default. Risks may exceed amounts recognized in the Statement of Assets and Liabilities. |
| J. | | Collateral — To the extent each Fund has pledged or segregated a security as collateral and that security is subsequently sold, it is such Fund’s practice to replace such collateral no later than the next business day. |
NOTE 2—Advisory Fees and Other Fees Paid to Affiliates
The Trust has entered into a master investment advisory agreement with Invesco Advisers, Inc. (the “Adviser” or “Invesco”). Under the terms of the investment advisory agreement, the Fund pays an advisory fee to the Adviser based on the annual rate of the Fund’s average daily net assets as follows:
| | | | | |
| Average Daily Net Assets | | Rate |
| |
| First $2 billion | | | 0 | .12% |
| |
| Over $2 billion | | | 0 | .10% |
| |
Under the terms of a master sub-advisory agreement between the Adviser and each of Invesco Asset Management Deutschland GmbH, Invesco Asset Management Limited, Invesco Asset Management (Japan) Limited, Invesco Australia Limited, Invesco Hong Kong Limited, Invesco Senior Secured Management, Inc. and Invesco Canada Ltd. (collectively, the “Affiliated Sub-Advisers”) the Adviser, not the Fund, may pay 40% of the fees paid to the Adviser to any such Affiliated Sub-Adviser(s) that provide discretionary investment management services to each Fund based on the percentage of assets allocated to such Sub-Adviser(s).
The Adviser has contractually agreed, through at least June 30, 2012, to waive advisory fees and/or reimburse expenses of all shares to the extent necessary to limit total annual fund operating expenses after fee waiver and/or expense reimbursement (excluding certain items discussed below) of Series I shares to 0.37% and Series II shares to 0.62% of average daily net assets. In determining the Adviser’s obligation to waive advisory fees and/or reimburse expenses, the following expenses are not taken into account, and could cause the total annual fund operating expenses after fee waiver and/or expense reimbursement to exceed the numbers reflected above: (1) interest; (2) taxes; (3) dividend expense on short sales; (4) extraordinary or non-routine items, including litigation expenses; and (5) expenses that the Fund has incurred but did not actually pay because of an expense offset arrangement. Unless the Board of the Trustees and Invesco mutually agree to amend or continue the fee waiver agreement, it will terminate on June 30, 2012.
Further, the Adviser has contractually agreed, through at least June 30, 2012, to waive the advisory fee payable by the Fund in an amount equal to 100% of the net advisory fees the Adviser receives from the affiliated money market funds on investments by the Fund of uninvested cash in such affiliated money market funds.
For the year ended December 31, 2011, the Adviser waived advisory fees of $107,120 and reimbursed Fund expenses of $20,687.
The Trust has entered into a master administrative services agreement with Invesco pursuant to which the Fund has agreed to pay Invesco a fee for costs incurred in providing accounting services and fund administrative services to the Fund and to reimburse Invesco for administrative services fees paid to insurance companies that have agreed to provide services to the participants of separate accounts. These administrative services provided by the insurance companies may include, among other things: the printing of prospectuses, financial reports and proxy statements and the delivery of the same to existing participants; the maintenance of master accounts; the facilitation of purchases and redemptions requested by the participants; and the servicing of participants’ accounts. Pursuant to such agreement, for the year ended December 31, 2011, Invesco was paid $50,000 for accounting and fund administrative services and reimbursed $149,164 for services provided by insurance companies.
Invesco V.I. Select Dimensions Equally-Weighted S&P 500 Fund
The Trust has entered into a transfer agency and service agreement with Invesco Investment Services, Inc. (“IIS”) pursuant to which the Fund has agreed to pay IIS a fee for providing transfer agency and shareholder services to the Fund and reimburse IIS for certain expenses incurred by IIS in the course of providing such services. For the year ended December 31, 2011, expenses incurred under the agreement are shown in the Statement of Operations as transfer agent fees.
The Trust has entered into a master distribution agreement with Invesco Distributors, Inc. (“IDI”) to serve as the distributor for the Fund. The Trust has adopted a plan pursuant to Rule 12b-1 under the 1940 Act with respect to the Fund’s Series II shares (the “Plan”). The Fund, pursuant to the Plan, pays IDI compensation at the annual rate of 0.25% of the Fund’s average daily net assets of Series II shares. Of the Plan payments, up to 0.25% of the average daily net assets of the Series II shares may be paid to insurance companies who furnish continuing personal shareholder services to customers who purchase and own Series II shares of the Fund. For the year ended December 31, 2011, expenses incurred under the Plan are detailed in the Statement of Operations as distribution fees.
Certain officers and trustees of the Trust are officers and directors of the Adviser, IIS and/or IDI.
NOTE 3—Additional Valuation Information
GAAP defines fair value as the price that would be received to sell an asset or paid to transfer a liability in an orderly transaction between market participants at the measurement date, under current market conditions. GAAP establishes a hierarchy that prioritizes the inputs to valuation methods giving the highest priority to readily available unadjusted quoted prices in an active market for identical assets (Level 1) and the lowest priority to significant unobservable inputs (Level 3) generally when market prices are not readily available or are unreliable. Based on the valuation inputs, the securities or other investments are tiered into one of three levels. Changes in valuation methods may result in transfers in or out of an investment’s assigned level:
| | |
| | Level 1 — | Prices are determined using quoted prices in an active market for identical assets. |
| | Level 2 — | Prices are determined using other significant observable inputs. Observable inputs are inputs that other market participants may use in pricing a security. These may include quoted prices for similar securities, interest rates, prepayment speeds, credit risk, yield curves, loss severities, default rates, discount rates, volatilities and others. |
| | Level 3 — | Prices are determined using significant unobservable inputs. In situations where quoted prices or observable inputs are unavailable (for example, when there is little or no market activity for an investment at the end of the period), unobservable inputs may be used. Unobservable inputs reflect the Fund’s own assumptions about the factors market participants would use in determining fair value of the securities or instruments and would be based on the best available information. |
The following is a summary of the tiered valuation input levels, as of December 31, 2011. The level assigned to the securities valuations may not be an indication of the risk or liquidity associated with investing in those securities. Because of the inherent uncertainties of valuation, the values reflected in the financial statements may materially differ from the value received upon actual sale of those investments.
During the year ended December 31, 2011, there were no significant transfers between investment levels.
| | | | | | | | | | | | | | | | | |
| | | Level 1 | | Level 2 | | Level 3 | | Total |
| |
| Equity Securities | | $ | 77,582,404 | | | $ | 826 | | | $ | — | | | $ | 77,583,230 | |
| |
| Futures* | | | 5,897 | | | | — | | | | — | | | | 5,897 | |
| |
| Total Investments | | $ | 77,588,301 | | | $ | 826 | | | $ | — | | | $ | 77,589,127 | |
| |
| |
| * | Unrealized appreciation. |
NOTE 4—Derivative Investments
Value of Derivative Instruments at Period-End
The table below summarizes the value of the Fund’s derivative instruments, detailed by primary risk exposure, held as of December 31, 2011:
| | | | | | | | | |
| | | Value |
| Risk Exposure/Derivative Type | | Assets | | Liabilities |
| |
| Equity risk | | | | | | | | |
Futures contracts(a) | | $ | 5,897 | | | $ | — | |
| |
| | |
| (a) | | Includes cumulative appreciation (depreciation) of futures contracts. Only current day’s variation margin receivable (payable) is reported within the Statement of Assets and Liabilities. |
Invesco V.I. Select Dimensions Equally-Weighted S&P 500 Fund
Effect of Derivative Instruments for the year ended December 31, 2011
The table below summarizes the gains (losses) on derivative instruments, detailed by primary risk exposure, recognized in earnings during the period:
| | | | | |
| | | Location of Gain (Loss) on
|
| | | Statement of Operations |
| | | Futures* |
| |
| Realized Gain | | | | |
| Equity risk | | $ | 32,196 | |
| |
| Change in Unrealized Appreciation (Depreciation) | | | | |
| Equity risk | | | (9,354 | ) |
| |
| Total | | $ | 22,842 | |
| |
| |
| * | The average notional value of futures outstanding during the period was $897,610. |
| | | | | | | | | | | | | | | | | |
| Open Futures Contracts |
| | | Number of
| | Expiration
| | Notional
| | Unrealized
|
| Long Contracts | | Contracts | | Month | | Value | | Appreciation |
| |
| E-Mini S&P 500 Index | | | 3 | | | | March-2012 | | | $ | 187,890 | | | $ | 5,897 | |
| |
NOTE 5—Investments in Other Affiliates
The Fund’s Adviser is a subsidiary of Invesco Ltd. and therefore, Invesco Ltd. is considered to be affiliated with the Fund. The following is a summary of the transactions in and earnings from investments in Invesco Ltd. for the year ended December 31, 2011.
| | | | | | | | | | | | | | | | | | | | | | | | | | | | | |
| | | | | | | | | Change in
| | | | | | |
| | | Value
| | Purchases
| | Proceeds
| | Unrealized
| | Realized
| | Value
| | Dividend
|
| | | 12/31/10 | | at Cost | | from Sales | | (Depreciation) | | Gain (Loss) | | 12/31/11 | | Income |
| |
| Invesco Ltd. | | $ | 206,651 | | | $ | 33,196 | | | $ | (55,935 | ) | | $ | (19,073 | ) | | $ | (8,037 | ) | | $ | 156,802 | | | $ | 3,756 | |
| |
NOTE 6—Trustees’ and Officers’ Fees and Benefits
“Trustees’ and Officers’ Fees and Benefits” include amounts accrued by the Fund to pay remuneration to certain Trustees and Officers of the Fund. Trustees have the option to defer compensation payable by the Fund, and “Trustees’ and Officers’ Fees and Benefits” also include amounts accrued by the Fund to fund such deferred compensation amounts. Those Trustees who defer compensation have the option to select various Invesco Funds in which their deferral accounts shall be deemed to be invested. Finally, certain current Trustees are eligible to participate in a retirement plan that provides for benefits to be paid upon retirement to Trustees over a period of time based on the number of years of service. The Fund may have certain former Trustees who also participate in a retirement plan and receive benefits under such plan. “Trustees’ and Officers’ Fees and Benefits” include amounts accrued by the Fund to fund such retirement benefits. Obligations under the deferred compensation and retirement plans represent unsecured claims against the general assets of the Fund.
During the year ended December 31, 2011, the Fund paid legal fees of $1,238 for services rendered by Kramer, Levin, Naftalis & Frankel LLP as counsel to the Independent Trustees. A partner of that firm is a Trustee of the Trust.
NOTE 7—Cash Balances
The Fund is permitted to temporarily carry a negative or overdrawn balance in its account with State Street Bank and Trust Company, the custodian bank. To compensate the custodian bank for such overdrafts, the overdrawn Fund may either (1) leave funds as a compensating balance in the account so the custodian bank can be compensated by earning the additional interest; or (2) compensate by paying the custodian bank at a rate agreed upon by the custodian bank and Invesco, not to exceed the contractually agreed upon rate.
NOTE 8—Distributions to Shareholders and Tax Components of Net Assets
Tax Character of Distributions to Shareholders Paid During the Years Ended December 31, 2011 and 2010:
| | | | | | | | | |
| | | 2011 | | 2010 |
| |
| Ordinary income | | $ | 1,376,368 | | | $ | 1,339,724 | |
| |
Invesco V.I. Select Dimensions Equally-Weighted S&P 500 Fund
Tax Components of Net Assets at Period-End:
| | | | | |
| | | 2011 |
| |
| Undistributed ordinary income | | $ | 1,188,885 | |
| |
| Undistributed long-term gain | | | 9,914,497 | |
| |
| Net unrealized appreciation — investments | | | 33,490,506 | |
| |
| Temporary book/tax differences | | | (8,750 | ) |
| |
| Shares of beneficial interest | | | 32,935,793 | |
| |
| Total net assets | | $ | 77,520,931 | |
| |
The difference between book-basis and tax-basis unrealized appreciation (depreciation) is due to differences in the timing of recognition of gains and losses on investments for tax and book purposes. The Fund’s net unrealized appreciation difference is attributable primarily to wash sales.
The temporary book/tax differences are a result of timing differences between book and tax recognition of income and/or expenses. The Fund’s temporary book/tax differences are the result of the trustee deferral of compensation and retirement plan benefits.
The Fund does not have a capital loss carryforward at period-end.
NOTE 9—Investment Securities
The aggregate amount of investment securities (other than short-term securities, U.S. Treasury obligations and money market funds, if any) purchased and sold by the Fund during the year ended December 31, 2011 was $18,446,319 and $38,540,660, respectively. Cost of investments on a tax basis includes the adjustments for financial reporting purposes as of the most recently completed Federal income tax reporting period-end.
| | | | | |
| Unrealized Appreciation (Depreciation) of Investment Securities on a Tax Basis |
| |
| Aggregate unrealized appreciation of investment securities | | $ | 34,947,048 | |
| |
| Aggregate unrealized (depreciation) of investment securities | | | (1,456,542 | ) |
| |
| Net unrealized appreciation of investment securities | | $ | 33,490,506 | |
| |
| Cost of investments for tax purposes is $44,092,724. | | | | |
NOTE 10—Reclassification of Permanent Differences
Primarily as a result of differing book/tax treatment of capital gain/loss reclass and real estate investment trust distributions, on December 31, 2011, undistributed net investment income was decreased by $22,933, undistributed net realized gain was increased by $22,933. This reclassification had no effect on the net assets of the Fund.
Invesco V.I. Select Dimensions Equally-Weighted S&P 500 Fund
NOTE 11—Share Information
| | | | | | | | | | | | | | | | | |
| | | Summary of Share Activity |
| |
| | | Year ended December 31, |
| | | 2011(a) | | 2010 |
| | | Shares | | Amount | | Shares | | Amount |
| |
| Sold: | | | | | | | | | | | | | | | | |
| Series I | | | 15,291 | | | $ | 301,389 | | | | 36,273 | | | $ | 613,769 | |
| |
| Series II | | | 70,617 | | | | 1,284,479 | | | | 70,709 | | | | 1,148,335 | |
| |
| Issued as reinvestment of dividends: | | | | | | | | | | | | | | | | |
| Series I | | | 42,093 | | | | 694,111 | | | | 39,137 | | | | 629,719 | |
| |
| Series II | | | 41,882 | | | | 682,257 | | | | 44,654 | | | | 710,006 | |
| |
| Reacquired: | | | | | | | | | | | | | | | | |
| Series I | | | (418,313 | ) | | | (7,945,803 | ) | | | (525,472 | ) | | | (8,783,787 | ) |
| |
| Series II | | | (820,784 | ) | | | (15,464,599 | ) | | | (829,357 | ) | | | (13,561,255 | ) |
| |
| Net increase (decrease) in share activity | | | (1,069,214 | ) | | $ | (20,448,166 | ) | | | (1,164,056 | ) | | $ | (19,243,213 | ) |
| |
| | |
| (a) | | There are entities that are record owners of more than 5% of the outstanding shares of the Fund and in the aggregate own 96% of the outstanding shares of the Fund. The Fund and the Fund’s principal underwriter or adviser, are parties to participation agreements with these entities whereby these entities sell units of interest in separate accounts funding variable products that are invested in the Fund. The Fund, Invesco and/or Invesco affiliates may make payments to these entities, which are considered to be related to the Fund, for providing services to the Fund, Invesco and/or Invesco affiliates including but not limited to services such as, securities brokerage, third party record keeping and account servicing and administrative services. The Fund has no knowledge as to whether all or any portion of the shares owned of record by these entities are also owned beneficially. |
NOTE 12—Financial Highlights
The following schedule presents financial highlights for a share of the Fund outstanding throughout the periods indicated.
| | | | | | | | | | | | | | | | | | | | | | | | | | | | | | | | | | | | | | | | | | | | | | | | | | | | | | | | | |
| | | | | | | | | | | | | | | | | | | | | | | Ratio of
| | Ratio of
| | | | |
| | | | | | | Net gains
| | | | | | | | | | | | | | | | expenses
| | expenses
| | | | |
| | | | | | | (losses) on
| | | | | | | | | | | | | | | | to average
| | to average net
| | Ratio of net
| | |
| | | Net asset
| | | | securities
| | | | Dividends
| | Distributions
| | | | | | | | | | net assets
| | assets without
| | investment
| | |
| | | value,
| | Net
| | (both
| | Total from
| | from net
| | from net
| | | | Net asset
| | | | Net assets,
| | with fee waivers
| | fee waivers
| | income
| | |
| | | beginning
| | investment
| | realized and
| | investment
| | investment
| | realized
| | Total
| | value, end
| | Total
| | end of period
| | and/or expenses
| | and/or expenses
| | to average
| | Portfolio
|
| | | of period | | income(a) | | unrealized) | | operations | | income | | gains | | Distributions | | of period | | Return(b) | | (000s omitted) | | absorbed | | absorbed | | net assets | | turnover(c) |
| |
| Series I |
| Year ended 12/31/11 | | $ | 18.78 | | | $ | 0.29 | | | $ | (0.40 | ) | | $ | (0.11 | ) | | $ | (0.34 | ) | | $ | — | | | $ | (0.34 | ) | | $ | 18.33 | | | | (0.36 | )% | | $ | 35,998 | | | | 0.37 | %(d) | | | 0.51 | %(d) | | | 1.50 | %(d) | | | 21 | % |
| Year ended 12/31/10 | | | 15.69 | | | | 0.26 | | | | 3.07 | | | | 3.33 | | | | (0.24 | ) | | | — | | | | (0.24 | ) | | | 18.78 | | | | 21.51 | | | | 43,669 | | | | 0.35 | | | | 0.40 | | | | 1.59 | | | | 21 | |
| Year ended 12/31/09 | | | 11.61 | | | | 0.22 | | | | 4.75 | | | | 4.97 | | | | (0.34 | ) | | | (0.55 | ) | | | (0.89 | ) | | | 15.69 | | | | 45.08 | | | | 43,553 | | | | 0.37 | (e) | | | 0.37 | (e) | | | 1.72 | (e) | | | 13 | |
| Year ended 12/31/08 | | | 25.37 | | | | 0.32 | | | | (8.73 | ) | | | (8.41 | ) | | | (0.45 | ) | | | (4.90 | ) | | | (5.35 | ) | | | 11.61 | | | | (40.02 | ) | | | 36,814 | | | | 0.31 | (e) | | | 0.31 | (e) | | | 1.70 | (e) | | | 32 | |
| Year ended 12/31/07 | | | 27.75 | | | | 0.41 | | | | 0.20 | | | | 0.61 | | | | (0.42 | ) | | | (2.57 | ) | | | (2.99 | ) | | | 25.37 | | | | 1.47 | | | | 77,688 | | | | 0.28 | | | | 0.28 | | | | 1.48 | | | | 17 | |
| |
| Series II |
| Year ended 12/31/11 | | | 18.53 | | | | 0.23 | | | | (0.38 | ) | | | (0.15 | ) | | | (0.29 | ) | | | — | | | | (0.29 | ) | | | 18.09 | | | | (0.66 | ) | | | 41,523 | | | | 0.62 | (d) | | | 0.76 | (d) | | | 1.25 | (d) | | | 21 | |
| Year ended 12/31/10 | | | 15.49 | | | | 0.22 | | | | 3.03 | | | | 3.25 | | | | (0.21 | ) | | | — | | | | (0.21 | ) | | | 18.53 | | | | 21.19 | | | | 55,646 | | | | 0.60 | | | | 0.65 | | | | 1.34 | | | | 21 | |
| Year ended 12/31/09 | | | 11.45 | | | | 0.19 | | | | 4.69 | | | | 4.88 | | | | (0.29 | ) | | | (0.55 | ) | | | (0.84 | ) | | | 15.49 | | | | 44.79 | | | | 57,578 | | | | 0.62 | (e) | | | 0.62 | (e) | | | 1.47 | (e) | | | 13 | |
| Year ended 12/31/08 | | | 25.08 | | | | 0.27 | | | | (8.63 | ) | | | (8.36 | ) | | | (0.37 | ) | | | (4.90 | ) | | | (5.27 | ) | | | 11.45 | | | | (40.19 | ) | | | 46,447 | | | | 0.56 | (e) | | | 0.56 | (e) | | | 1.45 | (e) | | | 32 | |
| Year ended 12/31/07 | | | 27.47 | | | | 0.34 | | | | 0.19 | | | | 0.53 | | | | (0.35 | ) | | | (2.57 | ) | | | (2.92 | ) | | | 25.08 | | | | 1.23 | | | | 99,861 | | | | 0.53 | | | | 0.53 | | | | 1.23 | | | | 17 | |
| |
| | |
| (a) | | Calculated using average shares outstanding. |
| (b) | | Includes adjustments in accordance with accounting principles generally accepted in the United States of America and as such, the net asset value for financial reporting purposes and the returns based upon those net asset values may differ from the net asset value and returns for shareholder transactions. Total returns are not annualized for periods less than one year, if applicable and do not reflect charges assessed in connection with a variable product, which if included would reduce total returns. |
| (c) | | Portfolio turnover is calculated at the fund level and is not annualized for periods less than one year, if applicable. |
| (d) | | Ratios are based on average daily net assets (000’s) of $40,654 and $48,613 for Series I and Series II shares, respectively. |
| (e) | | The ratios reflect the rebate of certain Fund expenses in connection with investments in a Morgan Stanley affiliate during the period. The effect of the rebate on the ratios was less than 0.005% for the years ended December 31, 2009 and 2008, respectively. |
Invesco V.I. Select Dimensions Equally-Weighted S&P 500 Fund
Report of Independent Registered Public Accounting Firm
To the Board of Trustees of AIM Variable Insurance Funds (Invesco Variable Insurance Funds)
and Shareholders of Invesco V.I. Select Dimensions Equally-Weighted S&P 500 Fund:
In our opinion, the accompanying statement of assets and liabilities, including the schedule of investments, and the related statements of operations and of changes in net assets and the financial highlights present fairly, in all material respects, the financial position of Invesco V.I. Select Dimensions Equally-Weighted S&P 500 Fund (one of the funds constituting AIM Variable Insurance Funds (Invesco Variable Insurance Funds), hereafter referred to as the “Fund”) at December 31, 2011, the results of its operations for the year then ended, and the changes in its net assets and the financial highlights for each of the two years in the period then ended, in conformity with accounting principles generally accepted in the United States of America. These financial statements and financial highlights (hereafter referred to as “financial statements”) are the responsibility of the Fund’s management; our responsibility is to express an opinion on these financial statements based on our audits. We conducted our audits of these financial statements in accordance with the standards of the Public Company Accounting Oversight Board (United States). Those standards require that we plan and perform the audits to obtain reasonable assurance about whether the financial statements are free of material misstatement. An audit includes examining, on a test basis, evidence supporting the amounts and disclosures in the financial statements, assessing the accounting principles used and significant estimates made by management, and evaluating the overall financial statement presentation. We believe that our audits, which included confirmation of securities at December 31, 2011 by correspondence with the custodian and brokers, provide a reasonable basis for our opinion. The financial highlights of the Fund for the periods ended December 31, 2009 and prior were audited by other independent auditors whose report dated February 26, 2010 expressed an unqualified opinion on those financial statements.
PRICEWATERHOUSECOOPERS LLP
February 14, 2012
Houston, Texas
Invesco V.I. Select Dimensions Equally-Weighted S&P 500 Fund
Calculating your ongoing Fund expenses
Example
As a shareholder of the Fund, you incur ongoing costs, including management fees; distribution and/or service fees (12b-1); and other Fund expenses. This example is intended to help you understand your ongoing costs (in dollars) of investing in the Fund and to compare these costs with ongoing costs of investing in other mutual funds. The example is based on an investment of $1,000 invested at the beginning of the period and held for the entire period July 1, 2011 through December 31, 2011.
The actual and hypothetical expenses in the examples below do not represent the effect of any fees or other expenses assessed in connection with a variable product; if they did, the expenses shown would be higher while the ending account values shown would be lower.
Actual expenses
The table below provides information about actual account values and actual expenses. You may use the information in this table, together with the amount you invested, to estimate the expenses that you paid over the period. Simply divide your account value by $1,000 (for example, an $8,600 account value divided by $1,000 = 8.6), then multiply the result by the number in the table under the heading entitled “Actual Expenses Paid During Period” to estimate the expenses you paid on your account during this period.
Hypothetical example for comparison purposes
The table below also provides information about hypothetical account values and hypothetical expenses based on the Fund’s actual expense ratio and an assumed rate of return of 5% per year before expenses, which is not the Fund’s actual return.
The hypothetical account values and expenses may not be used to estimate the actual ending account balance or expenses you paid for the period. You may use this information to compare the ongoing costs of investing in the Fund and other funds. To do so, compare this 5% hypothetical example with the 5% hypothetical examples that appear in the shareholder reports of the other funds.
Please note that the expenses shown in the table are meant to highlight your ongoing costs. Therefore, the hypothetical information is useful in comparing ongoing costs, and will not help you determine the relative total costs of owning different funds.
| | | | | | | | | | | | | | | | | | | | | | | | | | | | | | | |
| | | | | | | | | | HYPOTHETICAL
| | | |
| | | | | | | ACTUAL | | | (5% annual return before expenses) | | | |
| | | | Beginning
| | | Ending
| | | Expenses
| | | Ending
| | | Expenses
| | | Annualized
|
| | | | Account Value
| | | Account Value
| | | Paid During
| | | Account Value
| | | Paid During
| | | Expense
|
| Class | | | (07/01/11) | | | (12/31/11)1 | | | Period2 | | | (12/31/11) | | | Period2 | | | Ratio |
| Series I | | | $ | 1,000.00 | | | | $ | 1,078.80 | | | | $ | 1.91 | | | | $ | 1,022.96 | | | | $ | 1.86 | | | | | 0.37 | % |
| | | | | | | | | | | | | | | | | | | | | | | | | | | | | | | |
| Series II | | | | 1,000.00 | | | | | 1,077.70 | | | | | 3.19 | | | | | 1,021.72 | | | | | 3.11 | | | | | 0.62 | |
| | | | | | | | | | | | | | | | | | | | | | | | | | | | | | | |
| |
| 1 | The actual ending account value is based on the actual total return of the Fund for the period July 1, 2011 through December 31, 2011, after actual expenses and will differ from the hypothetical ending account value which is based on the Fund’s expense ratio and a hypothetical annual return of 5% before expenses. |
| 2 | Expenses are equal to the Fund’s annualized expense ratio as indicated above multiplied by the average account value over the period, multiplied by 184/365 to reflect the most recent fiscal half year. |
Invesco V.I. Select Dimensions Equally-Weighted S&P 500 Fund
Form 1099-DIV, Form 1042-S and other year-end tax information provide shareholders with actual calendar year amounts that should be included in their tax returns. Shareholders should consult their tax advisors.
The following distribution information is being provided as required by the Internal Revenue Code or to meet a specific state’s requirement.
The Fund designates the following amounts or, if subsequently determined to be different, the maximum amount allowable for its fiscal year ended December 31, 2011:
| | | | | |
Federal and State Income Tax | | |
| |
| Corporate Dividends Received Deduction* | | | 100.00% | |
| | |
| | * | The above percentage is based on ordinary income dividends paid to shareholders during the Fund’s fiscal year. |
Invesco V.I. Select Dimensions Equally-Weighted S&P 500 Fund
Trustees and Officers
The address of each trustee and officer is AIM Variable Insurance Funds (Invesco Variable Insurance Funds) (the “Trust”), 11 Greenway Plaza, Suite 2500, Houston, Texas 77046-1173. The trustees serve for the life of the Trust, subject to their earlier death, incapacitation, resignation, retirement or removal as more specifically provided in the Trust’s organizational documents. Each officer serves for a one year term or until their successors are elected and qualified. Column two below includes length of time served with predecessor entities, if any.
| | | | | | | | | |
| | | | | | | Number of Funds
| | |
Name, Year of Birth and
| | Trustee and/
| | Principal Occupation(s)
| | in Fund Complex
| | Other Directorship(s)
|
| Position(s) Held with the Trust | | or Officer Since | | During Past 5 Years | | Overseen by Trustee | | Held by Trustee |
| | | | | | | | | |
| | | | | | | | | |
| | | | | | | | | |
Interested Persons | | | | | | | | |
| | | | | | | | | |
| | | | | | | | | |
| | | | | | | | | |
Martin L. Flanagan1 — 1960
Trustee | | 2007 | | Executive Director, Chief Executive Officer and President, Invesco Ltd. (ultimate parent of Invesco and a global investment management firm); Advisor to the Board, Invesco Advisers, Inc. (formerly known as Invesco Institutional (N.A.), Inc.); Trustee, The Invesco Funds; Vice Chair, Investment Company Institute; and Member of Executive Board, SMU Cox School of Business
Formerly: Chairman, Invesco Advisers, Inc. (registered investment adviser); Director, Chairman, Chief Executive Officer and President, IVZ Inc. (holding company), INVESCO Group Services, Inc. (service provider) and Invesco North American Holdings, Inc. (holding company); Director, Chief Executive Officer and President, Invesco Holding Company Limited (parent of Invesco and a global investment management firm); Director, Invesco Ltd.; Chairman, Investment Company Institute and President, Co-Chief Executive Officer, Co-President, Chief Operating Officer and Chief Financial Officer, Franklin Resources, Inc. (global investment management organization) | | 140 | | None |
| | | | | | | | | |
| | | | | | | | | |
| | | | | | | | | |
Philip A. Taylor2 — 1954
Trustee, President and Principal Executive Officer | | 2006 | | Head of North American Retail and Senior Managing Director, Invesco Ltd.; Director, Co-Chairman, Co-President and Co-Chief Executive Officer, Invesco Advisers, Inc. (formerly known as Invesco Institutional (N.A.), Inc.) (registered investment adviser); Director, Chairman, Chief Executive Officer and President, Invesco Management Group, Inc. (formerly Invesco Aim Management Group, Inc.) (financial services holding company); Director and President, INVESCO Funds Group, Inc. (registered investment adviser and registered transfer agent); Director and Chairman, Invesco Investment Services, Inc. (formerly known as Invesco Aim Investment Services, Inc.) (registered transfer agent) and IVZ Distributors, Inc. (formerly known as INVESCO Distributors, Inc.) (registered broker dealer); Director, President and Chairman, Invesco Inc. (holding company) and Invesco Canada Holdings Inc. (holding company); Chief Executive Officer, Invesco Corporate Class Inc. (corporate mutual fund company) and Invesco Canada Fund Inc. (corporate mutual fund company); Director, Chairman and Chief Executive Officer, Invesco Canada Ltd. (formerly known as Invesco Trimark Ltd./Invesco Trimark Ltèe) (registered investment adviser and registered transfer agent); Trustee, President and Principal Executive Officer, The Invesco Funds (other than AIM Treasurer’s Series Trust (Invesco Treasurer’s Series Trust) and Short-Term Investments Trust); Trustee and Executive Vice President, The Invesco Funds (AIM Treasurer’s Series Trust (Invesco Treasurer’s Series Trust) and Short-Term Investments Trust only); Director, Invesco Investment Advisers LLC (formerly known as Van Kampen Asset Management); Director, Chief Executive Officer and President, Van Kampen Exchange Corp. | | 140 | | None |
| | | | | | | | | |
| | | | | | | | | |
| | | | | Formerly: Director and Chairman, Van Kampen Investor Services Inc.: Director, Chief Executive Officer and President, 1371 Preferred Inc. (holding company); and Van Kampen Investments Inc.; Director and President, AIM GP Canada Inc. (general partner for limited partnerships); and Van Kampen Advisors, Inc.; Director and Chief Executive Officer, Invesco Trimark Dealer Inc. (registered broker dealer); Director, Invesco Distributors, Inc. (formerly known as Invesco Aim Distributors, Inc.) (registered broker dealer); Manager, Invesco PowerShares Capital Management LLC; Director, Chief Executive Officer and President, Invesco Advisers, Inc.; Director, Chairman, Chief Executive Officer and President, Invesco Aim Capital Management, Inc.; President, Invesco Trimark Dealer Inc. and Invesco Trimark Ltd./Invesco Trimark Ltèe; Director and President, AIM Trimark Corporate Class Inc. and AIM Trimark Canada Fund Inc.; Senior Managing Director, Invesco Holding Company Limited; Trustee and Executive Vice President, Tax-Free Investments Trust; Director and Chairman, Fund Management Company (former registered broker dealer); President and Principal Executive Officer, The Invesco Funds (AIM Treasurer’s Series Trust (Invesco Treasurer’s Series Trust), Short-Term Investments Trust and Tax-Free Investments Trust only); President, AIM Trimark Global Fund Inc. and AIM Trimark Canada Fund Inc. | | | | |
| | | | | | | | | |
| | | | | | | | | |
| | | | | | | | | |
Wayne W. Whalen3 — 1939
Trustee | | 2010 | | Of Counsel, and prior to 2010, partner in the law firm of Skadden, Arps, Slate, Meagher & Flom LLP, legal counsel to funds in the Fund Complex | | 158 | | Director of the Abraham Lincoln Presidential Library Foundation |
| | | | | | | | | |
| | | | | | | | | |
| | | | | | | | | |
Independent Trustees | | | | | | | | |
| | | | | | | | | |
| | | | | | | | | |
| | | | | | | | | |
Bruce L. Crockett — 1944
Trustee and Chair | | 1993 | | Chairman, Crockett Technology Associates (technology consulting company) | | 140 | | ACE Limited (insurance company); and Investment Company Institute |
| | | | | Formerly: Director, Captaris (unified messaging provider); Director, President and Chief Executive Officer COMSAT Corporation; and Chairman, Board of Governors of INTELSAT (international communications company) | | | | |
| | | | | | | | | |
| |
| 1 | Mr. Flanagan is considered an interested person of the Trust because he is an officer of the adviser to the Trust, and an officer and a director of Invesco Ltd., ultimate parent of the adviser to the Trust. |
| 2 | Mr. Taylor is considered an interested person of the Trust because he is an officer and a director of the adviser to, and a director of the principal underwriter of, the Trust. |
| 3 | Mr. Whalen is considered an “interested person” (within the meaning of Section 2(a)(19) of the 1940 Act) of certain Funds in the Fund Complex by reason of he and his firm currently providing legal services as legal counsel to such Funds in the Fund Complex. |
Invesco V.I. Select Dimensions Equally-Weighted S&P 500 Fund
Trustees and Officers—(continued)
The address of each trustee and officer is AIM Variable Insurance Funds (Invesco Variable Insurance Funds) (the “Trust”), 11 Greenway Plaza, Suite 2500, Houston, Texas 77046-1173. The trustees serve for the life of the Trust, subject to their earlier death, incapacitation, resignation, retirement or removal as more specifically provided in the Trust’s organizational documents. Each officer serves for a one year term or until their successors are elected and qualified. Column two below includes length of time served with predecessor entities, if any.
| | | | | | | | | |
| | | | | | | Number of Funds
| | |
Name, Year of Birth and
| | Trustee and/
| | Principal Occupation(s)
| | in Fund Complex
| | Other Directorship(s)
|
| Position(s) Held with the Trust | | or Officer Since | | During Past 5 Years | | Overseen by Trustee | | Held by Trustee |
| | | | | | | | | |
| | | | | | | | | |
| | | | | | | |
Independent Trustees—(continued) | | | | | | |
| | | | | | | | | |
| | | | | | | | | |
| | | | | | | | | |
David C. Arch — 1945
Trustee | | 2010 | | Chairman and Chief Executive Officer of Blistex Inc., a consumer health care products manufacturer. | | 158 | | Member of the Heartland Alliance Advisory Board, a nonprofit organization serving human needs based in Chicago. Board member of the Illinois Manufacturers’ Association. Member of the Board of Visitors, Institute for the Humanities, University of Michigan |
| | | | | | | | | |
| | | | | | | | | |
| | | | | | | | | |
Frank S. Bayley — 1939
Trustee | | 2001 | | Retired
Formerly: Director, Badgley Funds, Inc. (registered investment company) (2 portfolios) and Partner, law firm of Baker & McKenzie
Formerly: Director, Badgley Funds, Inc. (registered investment company) (2 portfolios) and Partner, law firm of Baker & McKenzie | | 140 | | Director and Chairman, C.D. Stimson Company (a real estate investment company) |
| | | | | | | | | |
| | | | | | | | | |
| | | | | | | | | |
James T. Bunch — 1942
Trustee | | 2004 | | Managing Member, Grumman Hill Group LLC (family office private equity management)
Formerly: Founder, Green, Manning & Bunch Ltd. (investment banking firm)(1988-2010); Executive Committee, United States Golf Association; and Director, Policy Studies, Inc. and Van Gilder Insurance Corporation | | 140 | | Vice Chairman, Board of Governors, Western Golf Association/Evans Scholars Foundation and Director, Denver Film Society |
| | | | | | | | | |
| | | | | | | | | |
| | | | | | | | | |
Rodney F. Dammeyer — 1940
Trustee | | 2010 | | President of CAC, LLC, a private company offering capital investment and management advisory services.
Formerly: Prior to January 2004, Director of TeleTech Holdings Inc.; Prior to 2002, Director of Arris Group, Inc.; Prior to 2001, Managing Partner at Equity Group Corporate Investments. Prior to 1995, Vice Chairman of Anixter International. Prior to 1985, experience includes Senior Vice President and Chief Financial Officer of Household International, Inc., Executive Vice President and Chief Financial Officer of Northwest Industries, Inc. and Partner of Arthur Andersen & Co. | | 158 | | Director of Quidel Corporation and Stericycle, Inc. Prior to May 2008, Trustee of The Scripps Research Institute. Prior to February 2008, Director of Ventana Medical Systems, Inc. Prior to April 2007, Director of GATX Corporation. Prior to April 2004, Director of TheraSense, Inc. |
| | | | | | | | | |
| | | | | | | | | |
| | | | | | | | | |
Albert R. Dowden — 1941
Trustee | | 2000 | | Director of a number of public and private business corporations, including the Boss Group, Ltd. (private investment and management); Reich & Tang Funds (5 portfolios) (registered investment company); and Homeowners of America Holding Corporation/ Homeowners of America Insurance Company (property casualty company)
Formerly: Director, Continental Energy Services, LLC (oil and gas pipeline service); Director, CompuDyne Corporation (provider of product and services to the public security market) and Director, Annuity and Life Re (Holdings), Ltd. (reinsurance company); Director, President and Chief Executive Officer, Volvo Group North America, Inc.; Senior Vice President, AB Volvo; Director of various public and private corporations; Chairman, DHJ Media, Inc.; Director Magellan Insurance Company; and Director, The Hertz Corporation, Genmar Corporation (boat manufacturer), National Media Corporation; Advisory Board of Rotary Power International (designer, manufacturer, and seller of rotary power engines); and Chairman, Cortland Trust, Inc. (registered investment company) | | 140 | | Board of Nature’s Sunshine Products, Inc. |
| | | | | | | | | |
| | | | | | | | | |
| | | | | | | | | |
Jack M. Fields — 1952
Trustee | | 1997 | | Chief Executive Officer, Twenty First Century Group, Inc. (government affairs company); and Owner and Chief Executive Officer, Dos Angelos Ranch, L.P. (cattle, hunting, corporate entertainment), Discovery Global Education Fund (non-profit) and Cross Timbers Quail Research Ranch (non-profit)
Formerly: Chief Executive Officer, Texana Timber LP (sustainable forestry company) and member of the U.S. House of Representatives | | 140 | | Administaff |
| | | | | | | | | |
| | | | | | | | | |
| | | | | | | | | |
Carl Frischling — 1937
Trustee | | 1993 | | Partner, law firm of Kramer Levin Naftalis and Frankel LLP | | 140 | | Director, Reich & Tang Funds (16 portfolios) |
| | | | | | | | | |
| | | | | | | | | |
Invesco V.I. Select Dimensions Equally-Weighted S&P 500 Fund
Trustees and Officers—(continued)
The address of each trustee and officer is AIM Variable Insurance Funds (Invesco Variable Insurance Funds) (the “Trust”), 11 Greenway Plaza, Suite 2500, Houston, Texas 77046-1173. The trustees serve for the life of the Trust, subject to their earlier death, incapacitation, resignation, retirement or removal as more specifically provided in the Trust’s organizational documents. Each officer serves for a one year term or until their successors are elected and qualified. Column two below includes length of time served with predecessor entities, if any.
| | | | | | | | | |
| | | | | | | Number of Funds
| | |
Name, Year of Birth and
| | Trustee and/
| | Principal Occupation(s)
| | in Fund Complex
| | Other Directorship(s)
|
| Position(s) Held with the Trust | | or Officer Since | | During Past 5 Years | | Overseen by Trustee | | Held by Trustee |
| | | Independent Trustees—(continued) | | | | |
| | | | | | | | | |
| | | | | | | | | |
| | | | | | | | | |
Prema Mathai-Davis — 1950
Trustee | | 1998 | | Retired
Formerly: Chief Executive Officer, YWCA of the U.S.A. | | 140 | | None |
| | | | | | | | | |
| | | | | | | | | |
| | | | | | | | | |
Larry Soll — 1942
Trustee | | 2004 | | Retired
Formerly, Chairman, Chief Executive Officer and President, Synergen Corp. (a biotechnology company) | | 140 | | None |
| | | | | | | | | |
| | | | | | | | | |
| | | | | | | | | |
Hugo F. Sonnenschein — 1940
Trustee | | 2010 | | President Emeritus and Honorary Trustee of the University of Chicago and the Adam Smith Distinguished Service Professor in the Department of Economics at the University of Chicago. Prior to July 2000, President of the University of Chicago. | | 158 | | Trustee of the University of Rochester and a member of its investment committee. Member of the National Academy of Sciences, the American Philosophical Society and a fellow of the American Academy of Arts and Sciences |
| | | | | | | | | |
| | | | | | | | | |
| | | | | | | | | |
| Raymond Stickel, Jr. — 1944 Trustee | | 2005 | | Retired
Formerly: Director, Mainstay VP Series Funds, Inc. (25 portfolios) and Partner, Deloitte & Touche | | 140 | | None |
| | | | | | | | | |
| | | | | | | | | |
| | | | | | | | | |
Other Officers | | | | | | | | |
| | | | | | | | | |
| | | | | | | | | |
| | | | | | | | | |
Russell C. Burk — 1958
Senior Vice President and Senior Officer | | 2005 | | Senior Vice President and Senior Officer, The Invesco Funds | | N/A | | N/A |
| | | | | | | | | |
| | | | | | | | | |
| | | | | | | | | |
John M. Zerr — 1962
Senior Vice President, Chief Legal Officer and Secretary | | 2006 | | Director, Senior Vice President, Secretary and General Counsel, Invesco Management Group, Inc. (formerly known as Invesco Aim Management Group, Inc.) and Van Kampen Exchange Corp.; Senior Vice President, Invesco Advisers, Inc. (formerly known as Invesco Institutional (N.A.), Inc.) (registered investment adviser); Senior Vice President and Secretary, Invesco Distributors, Inc. (formerly known as Invesco Aim Distributors, Inc.); Director, Vice President and Secretary, Invesco Investment Services, Inc. (formerly known as Invesco Aim Investment Services, Inc.) and IVZ Distributors, Inc. (formerly known as INVESCO Distributors, Inc.); Director and Vice President, INVESCO Funds Group, Inc.; Senior Vice President, Chief Legal Officer and Secretary, The Invesco Funds; Manager, Invesco PowerShares Capital Management LLC; Director, Secretary and General Counsel, Invesco Investment Advisers LLC (formerly known as Van Kampen Asset Management); Secretary and General Counsel, Van Kampen Funds Inc. and Chief Legal Officer, PowerShares Exchange-Traded Fund Trust, PowerShares Exchange-Traded Fund Trust II, PowerShares India Exchange-Traded Fund Trust and PowerShares Actively Managed Exchange-Traded Fund Trust
Formerly: Director and Secretary, Van Kampen Advisors Inc.; Director Vice President, Secretary and General Counsel Van Kampen Investor Services Inc.; Director, Invesco Distributors, Inc. (formerly known as Invesco Aim Distributors, Inc.); Director, Senior Vice President, General Counsel and Secretary, Invesco Advisers, Inc.; and Van Kampen Investments Inc.; Director, Vice President and Secretary, Fund Management Company; Director, Senior Vice President, Secretary, General Counsel and Vice President, Invesco Aim Capital Management, Inc.; Chief Operating Officer and General Counsel, Liberty Ridge Capital, Inc. (an investment adviser); Vice President and Secretary, PBHG Funds (an investment company) and PBHG Insurance Series Fund (an investment company); Chief Operating Officer, General Counsel and Secretary, Old Mutual Investment Partners (a broker-dealer); General Counsel and Secretary, Old Mutual Fund Services (an administrator) and Old Mutual Shareholder Services (a shareholder servicing center); Executive Vice President, General Counsel and Secretary, Old Mutual Capital, Inc. (an investment adviser); and Vice President and Secretary, Old Mutual Advisors Funds (an investment company) | | N/A | | N/A |
| | | | | | | | | |
| | | | | | | | | |
| | | | | | | | | |
Lisa O. Brinkley — 1959
Vice President | | 2004 | | Global Compliance Director, Invesco Ltd.; Chief Compliance Officer, Invesco Investment Services, Inc.(formerly known as Invesco Aim Investment Services, Inc.); and Vice President, The Invesco Funds
Formerly: Chief Compliance Officer, Invesco Distributors, Inc. (formerly known as Invesco Aim Distributors, Inc.) and Van Kampen Investor Services Inc.; Senior Vice President, Invesco Management Group, Inc.; Senior Vice President and Chief Compliance Officer, Invesco Advisers, Inc. and The Invesco Funds; Vice President and Chief Compliance Officer, Invesco Aim Capital Management, Inc. and Invesco Distributors, Inc.; Vice President, Invesco Investment Services, Inc. and Fund Management Company | | N/A | | N/A |
| | | | | | | | | |
Invesco V.I. Select Dimensions Equally-Weighted S&P 500 Fund
Trustees and Officers—(continued)
The address of each trustee and officer is AIM Variable Insurance Funds (Invesco Variable Insurance Funds) (the “Trust”), 11 Greenway Plaza, Suite 2500, Houston, Texas 77046-1173. The trustees serve for the life of the Trust, subject to their earlier death, incapacitation, resignation, retirement or removal as more specifically provided in the Trust’s organizational documents. Each officer serves for a one year term or until their successors are elected and qualified. Column two below includes length of time served with predecessor entities, if any.
| | | | | | | | | |
| | | | | | | Number of Funds
| | |
Name, Year of Birth and
| | Trustee and/
| | Principal Occupation(s)
| | in Fund Complex
| | Other Directorship(s)
|
| Position(s) Held with the Trust | | or Officer Since | | During Past 5 Years | | Overseen by Trustee | | Held by Trustee |
| | | Other Officers—(continued) | | | | |
| | | | | | | | | |
| | | | | | | | | |
| | | | | | | | | |
Sheri Morris — 1964
Vice President, Treasurer and Principal Financial Officer | | 1999 | | Vice President, Treasurer and Principal Financial Officer, The Invesco Funds; Vice President, Invesco Advisers, Inc. (formerly known as Invesco Institutional (N.A.), Inc.) (registered investment adviser).
Formerly: Treasurer, PowerShares Exchange-Traded Fund Trust, PowerShares Exchange-Traded Fund Trust II, PowerShares India Exchange-Traded Fund Trust and PowerShares Actively Managed Exchange-Traded Fund Trust, Vice President, Invesco Advisers, Inc., Invesco Aim Capital Management, Inc. and Invesco Aim Private Asset Management, Inc.; Assistant Vice President and Assistant Treasurer, The Invesco Funds and Assistant Vice President, Invesco Advisers, Inc., Invesco Aim Capital Management, Inc. and Invesco Aim Private Asset Management, Inc. | | N/A | | N/A |
| | | | | | | | | |
| | | | | | | | | |
| | | | | | | | | |
Karen Dunn Kelley — 1960
Vice President | | 1993 | | Head of Invesco’s World Wide Fixed Income and Cash Management Group; Senior Vice President, Invesco Management Group, Inc. (formerly known as Invesco Aim Management Group, Inc.) and Invesco Advisers, Inc. (formerly known as Invesco Institutional (N.A.), Inc.) (registered investment adviser); Executive Vice President, Invesco Distributors, Inc. (formerly known as Invesco Aim Distributors, Inc.); Director, Invesco Mortgage Capital Inc.; Vice President, The Invesco Funds (other than AIM Treasurer’s Series Trust (Invesco Treasurer’s Series Trust) and Short-Term Investments Trust); and President and Principal Executive Officer, The Invesco Funds (AIM Treasurer’s Series Trust (Invesco Treasurer’s Series Trust) and Short-Term Investments Trust only).
Formerly: Senior Vice President, Van Kampen Investments Inc.; Vice President, Invesco Advisers, Inc. (formerly known as Invesco Institutional (N.A.), Inc.); Director of Cash Management and Senior Vice President, Invesco Advisers, Inc. and Invesco Aim Capital Management, Inc.; President and Principal Executive Officer, Tax-Free Investments Trust; Director and President, Fund Management Company; Chief Cash Management Officer, Director of Cash Management, Senior Vice President, and Managing Director, Invesco Aim Capital Management, Inc.; Director of Cash Management, Senior Vice President, and Vice President, Invesco Advisers, Inc. and The Invesco Funds (AIM Treasurer’s Series Trust (Invesco Treasurer’s Series Trust), Short-Term Investments Trust and Tax-Free Investments Trust only) | | N/A | | N/A |
| | | | | | | | | |
| | | | | | | | | |
| | | | | | | | | |
Yinka Akinsola — 1977
Anti-Money Laundering Compliance Officer | | 2011 | | Anti-Money Laundering Compliance Officer, Invesco Advisers, Inc. (formerly known as Invesco Institutional (N.A.), Inc.) (registered investment adviser); Invesco Distributors, Inc. (formerly known as Invesco Aim Distributors, Inc.), Invesco Investment Services, Inc. (formerly known as Invesco Aim Investment Services, Inc.), Invesco Management Group, Inc., The Invesco Funds, Invesco Van Kampen Closed-End Funds, Van Kampen Exchange Corp. and Van Kampen Funds Inc. | | N/A | | N/A |
| | | | | | | | | |
| | | | | | | | | |
| | | | | | | | | |
Todd L. Spillane — 1958
Chief Compliance Officer | | 2006 | | Senior Vice President, Invesco Management Group, Inc. (formerly known as Invesco Aim Management Group, Inc.) and Van Kampen Exchange Corp.; Senior Vice President and Chief Compliance Officer, Invesco Advisers, Inc. (registered investment adviser) (formerly known as Invesco Institutional (N.A.), Inc.); Chief Compliance Officer, The Invesco Funds, INVESCO Private Capital Investments, Inc. (holding company) and Invesco Private Capital, Inc. (registered investment adviser); Vice President, Invesco Distributors, Inc. (formerly known as Invesco Aim Distributors, Inc.) and Invesco Investment Services, Inc. (formerly known as Invesco Aim Investment Services, Inc.).
Formerly: Chief Compliance Officer, Invesco Van Kampen Closed-End Funds PowerShares Exchange-Traded Fund Trust, PowerShares Exchange-Traded Fund Trust II, PowerShares India Exchange-Traded Fund Trust, and PowerShares Actively Managed Exchange-Traded Fund Trust; Senior Vice President, Van Kampen Investments Inc.; Senior Vice President and Chief Compliance Officer, Invesco Advisers, Inc. and Invesco Aim Capital Management, Inc.; Chief Compliance Officer, Invesco Global Asset Management (N.A.), Inc., Invesco Senior Secured Management, Inc. (registered investment adviser) and Van Kampen Investor Services Inc.; Vice President, Invesco Aim Capital Management, Inc. and Fund Management Company | | N/A | | N/A |
| | | | | | | | | |
The Statement of Additional Information of the Trust includes additional information about the Fund’s Trustees and is available upon request, without charge, by calling 1.800.959.4246. Please refer to the Fund’s prospectus for information on the Fund’s sub-advisers.
| | | | | | | |
Office of the Fund
11 Greenway Plaza, Suite 2500
Houston, TX 77046-1173 | | Investment Adviser
Invesco Advisers, Inc.
1555 Peachtree Street, N.E.
Atlanta, GA 30309 | | Distributor
Invesco Distributors, Inc.
11 Greenway Plaza, Suite 2500
Houston, TX 77046-1173 | | Auditors
PricewaterhouseCoopers LLP
1201 Louisiana Street, Suite 2900
Houston, TX 77002-5678 |
| | | | | | | |
| | | | | | | |
Counsel to the Fund
Stradley Ronon Stevens & Young, LLP
2600 One Commerce Square
Philadelphia, PA 19103 | | Counsel to the Independent Trustees
Kramer, Levin, Naftalis & Frankel LLP
1177 Avenue of the Americas
New York, NY 10036-2714 | | Transfer Agent
Invesco Investment Services, Inc.
11 Greenway Plaza, Suite 2500
Houston, TX77046-1173 | | Custodian
State Street Bank and Trust Company
225 Franklin
Boston, MA 02110-2801 |
Invesco V.I. Select Dimensions Equally-Weighted S&P 500 Fund
Invesco V.I. Small Cap Equity FundAnnual Report to Shareholders § December 31, 2011The Fund provides a complete list of its holdings four times in each fiscal year, at the quarter-ends. For the second and fourth quarters, the lists appear in the Fund’s semiannual and annual reports to shareholders. For the first and third quarters, the Fund files the lists with the Securities and Exchange Commission (SEC) on Form N-Q. The Fund’s Form N-Q filings are available on the SEC website, sec.gov. Copies of the Fund’s Forms N-Q may be reviewed and copied at the SEC Public Reference Room in Washington, D.C. You can obtain information on the operation of the Public Reference Room, including information about duplicating fee charges, by calling 202 551 8090 or 800 732 0330, or by electronic request at the following email address: publicinfo@sec.gov. The SEC file numbers for the Fund are 811-07452 and 033-57340. The Fund’s most recent portfolio holdings, as filed on Form N-Q, have also been made available to insurance companies issuing variable annuity contracts and variable life insurance policies (“variable products”) that invest in the Fund.
A description of the policies and procedures that the Fund uses to determine how to vote proxies relating to portfolio securities is available without charge, upon request, from our Client Services department at 800 959 4246 or at invesco.com/proxyguidelines. The information is also available on the SEC website, sec.gov.
Information regarding how the Fund voted proxies related to its portfolio securities during the 12 months ended June 30, 2011, is available at invesco.com/proxysearch. The information is also available on the SEC website, sec.gov.
Invesco Advisers, Inc. is an investment adviser; it provides investment advisory services to individual and institutional clients and does not sell securities. Invesco Distributors, Inc. is the U.S. distributor for Invesco Ltd.’s retail mutual funds, exchange-traded funds and institutional money market funds. Both are wholly owned, indirect subsidiaries of Invesco Ltd.
This report must be accompanied or preceded by a currently effective Fund prospectus and variable product prospectus, which contain more complete information, including sales charges and expenses. Investors should read each carefully before investing.
Invesco Distributors, Inc.
VISCE-AR-1
| | | | | |
|
| | | | | |
NOT FDIC INSURED | | MAY LOSE VALUE | | NO BANK GUARANTEE |
Management’s Discussion of Fund Performance
Performance summary
For the year ended December 31, 2011, Invesco V.I. Small Cap Equity Fund produced negative returns but outperformed the Fund’s style-specific index, the Russell 2000 Index. The Fund’s returns were driven primarily by stock selection across a number of sectors.
Your Fund’s long-term performance appears later in this report.
Fund vs. Indexes
Total returns, 12/31/10 to 12/31/11, excluding variable product issuer charges.
If variable product issuer charges were included, returns would be lower.
| | | | | |
|
| Series I Shares | | | -0.73 | % |
| |
| Series II Shares | | | -0.98 | |
| |
S&P 500 Index▼ (Broad Market Index) | | | 2.09 | |
| |
Russell 2000 Index▼ (Style-Specific Index) | | | -4.18 | |
| |
Lipper VUF Small-Cap Core Funds Index▼ (Peer Group Index) | | | -3.21 | |
| |
Source(s): ▼Lipper Inc.
How we invest
Our investment process seeks to identify attractively valued small-cap companies with high growth potential, demonstrated by consistent and accelerating revenue and earnings growth.
We begin with a quantitative model that ranks companies based on a set of fundamental, valuation and timeliness factors. This proprietary model provides an objective approach to identifying new investment opportunities, as the highest ranked stocks become the primary focus of our research efforts.
Our stock selection process is based on a rigorous three-step process that includes fundamental, valuation and timeliness analysis:
| n | | Fundamental analysis. Building financial models and conducting in-depth interviews with company management. |
| |
| n | | Valuation analysis. Identifying attractively valued stocks given their growth potential over a one- to two-year horizon. |
| |
| n | | Timeliness analysis. Identifying the “timeliness” of a stock purchase. We |
| | | review trading volume characteristics and trend analysis to make sure there are no signs of the stock deteriorating. This also serves as a risk management measure that helps us confirm our high conviction candidates. |
Portfolio construction plays an important role in risk management. We align the Fund with the S&P SmallCap 600 Index, the benchmark we believe represents the small cap core asset class. We seek to manage risk by keeping the Fund’s sector weightings in line with that index by staying fully diversified in all those sectors. We also seek to limit stock-specific risk by investing, typically, in 120 to 130 holdings.
We consider selling a stock when it no longer meets our investment criteria, based on:
| n | | Our original investment thesis is not valid because the fundamentals are no longer intact. |
| |
| n | | The price target set at purchase is exceeded. |
| |
| n | | The company’s timeliness profile deteriorates. |
Market conditions and your Fund
The fiscal year began with equity markets fueled on the second round of “quantitative easing” by the U.S. Federal Reserve. Markets rose through the first quarter of 2011. However, with the spring came increased volatility and significant macroeconomic distortions due to civil unrest in Egypt and Libya, flooding in Australia and a devastating earthquake and tsunami in Japan. Corporate earnings remained strong with largely positive surprises, but often were overshadowed by investor concerns about continuing high unemployment and soft housing data.
Although markets stabilized and were generally in positive territory through the summer, major equity indexes sold off precipitously in August as the U.S. government struggled to raise the nation’s debt ceiling. Despite an eventual agreement between the White House and Congress, credit rating agency Standard & Poor’s announced the first-ever downgrade to long-term U.S. government debt. Uncertainty created by the downgrade, combined with the continuing saga surrounding the debt crisis in the eurozone, reignited fears of a global recession. Despite evidence of sustained, but muted, economic growth, these macroeconomic factors continued to weigh on markets through the end of the reporting period.
The Fund produced negative returns but outperformed the Russell 2000 Index primarily due to stock selection in the information technology (IT), health care, consumer discretionary, materials, energy and industrials sectors. The Fund underperformed in other sectors, including financials, utilities and telecommunication services.
The Fund outperformed by the widest margin in the IT sector, driven by stock selection. The leading contributor to
Portfolio Composition
By sector
| | | | | |
|
| Information Technology | | | 18.2 | % |
| |
| Industrials | | | 16.0 | |
| |
| Consumer Discretionary | | | 14.8 | |
| |
| Financials | | | 14.8 | |
| |
| Health Care | | | 14.1 | |
| |
| Energy | | | 6.5 | |
| |
| Materials | | | 6.1 | |
| |
| Consumer Staples | | | 4.7 | |
| |
| Utilities | | | 2.1 | |
| |
| Telecommunication Services | | | 0.2 | |
| |
Money Market Funds Plus | | | | |
Other Assets Less Liabilities | | | 2.5 | |
Top 10 Equity Holdings*
| | | | | | | | |
|
| | 1. | | ViroPharma Inc. | | | 1.8 | % |
| |
| | 2. | | Team, Inc. | | | 1.3 | |
| |
| | 3. | | Old Dominion Freight Line, Inc. | | | 1.3 | |
| |
| | 4. | | Novellus Systems, Inc. | | | 1.3 | |
| |
| | 5. | | GNC Holdings, Inc.-Class A | | | 1.3 | |
| |
| | 6. | | Texas Capital Bancshares, Inc. | | | 1.2 | |
| |
| | 7. | | TreeHouse Foods, Inc. | | | 1.2 | |
| |
| | 8. | | Questcor Pharmaceuticals, Inc. | | | 1.2 | |
| |
| | 9. | | OSI Systems, Inc. | | | 1.2 | |
| |
| | 10. | | Genesco Inc. | | | 1.2 | |
Top Five Industries*
| | | | | | | | |
|
| | 1. | | Apparel Retail | | | 4.7 | % |
| |
| | 2. | | Oil & Gas Equipment & Services | | | 4.4 | |
| |
| | 3. | | Regional Banks | | | 4.3 | |
| |
| | 4. | | Pharmaceuticals | | | 3.9 | |
| |
| | 5. | | Environmental & Facilities Services | | | 3.1 | |
| | | | | |
|
| Total Net Assets | | $272.0 million | |
| | | | | |
| Total Number of Holdings* | | | 111 | |
The Fund’s holdings are subject to change, and there is no assurance that the Fund will continue to hold any particular security.
*Excluding money market fund holdings.
Invesco V.I. Small Cap Equity Fund
Fund performance in this sector, and one of the top Fund contributors during the reporting period, was semiconductor and memory chip producer NetLogic. Net-Logic benefited first from the continued expansion of the smartphone market and then, in September, was acquired at a premium. We sold our holdings in Net-Logic, locking in gains for shareholders. Semiconductor equipment maker Novellus Systems also agreed to a buyout at a substantial premium and benefited Fund performance. OSI Systems was another contributor to performance in this sector, as they reported solid earnings and investors appreciated the visibility of the company’s near-term earnings given a strong backlog and continued new business wins relative to peers.
The Fund also outperformed in the health care sector, driven by stock selection in the pharmaceuticals, biotechnology and life sciences tools and services industries. Questcor Pharmaceuticals was the leading contributor to Fund performance during the reporting period based on continued strong sales growth. Profits almost doubled on the strength of the company’s multi-use drug targeting central nervous system conditions. Shares of specialty pharmaceutical company ViroPharma rallied as management announced that a supplementary Food and Drug Administration approval may entitle the company’s most profitable drug to three years of exclusivity. Healthspring agreed to a buyout offer during the reporting period at a substantial premium to its previous closing price. We considered the offer to be at or above fair value and sold our position in the stock for a profit.
Outperformance in the consumer discretionary sector was driven by stock selection in the retailing industry group. The leading contributors in this sector were nutritional supplement retailer GNC Holdings and mall-based shoe and headgear retailer Genesco. Dillard’s also benefited from strong earnings growth, driven primarily by significantly improved inventory management as well as revenue growth.
Some of this outperformance was offset by underperformance in other sectors, including financials, utilities and telecommunication services. The Fund underperformed by the widest margin in the financials sector due to stock selection. One holding that detracted from performance was boutique investment banking firm KBW, which underperformed as merger and acquisition activity was weaker than
expected during the year. We eliminated KBW from the Fund prior to the close of the reporting period. Real estate property manager Jones Lang LaSalle also underperformed due to weakness in the property market during much of the year.
In the relatively small telecommunication services sector (which accounts for less than 1% of the Russell 2000 Index1), Fund holding Alaska Communications Systems detracted from performance. Despite the stock’s weak performance, the Fund continued to own Alaska Communications Systems based on the strong growth potential fueled by oil and gas, military and enterprise expansion.
Utilities account for just 3.4% of the Russell 2000 Index1, but our underweight position in this very strong-performing sector detracted from the Fund’s performance.
Throughout the year, the Fund maintained a “barbell” strategy in positioning that provided exposure to cyclical growth opportunities as well as more defensive areas of the market. Changes during the reporting period were moderate within this framework; however the most significant changes included reduced exposure to the consumer discretionary, energy, financials and industrials sectors. We increased our exposure to the health care and consumer staples sectors.
As we’ve discussed, the stock market experienced significant volatility during the year. We would like to caution investors against making investment decisions based on short-term performance. We thank you for your commitment to Invesco V.I. Small Cap Equity Fund.
1 Source: Frank Russell Co.
The views and opinions expressed in management’s discussion of Fund performance are those of Invesco Advisers, Inc. These views and opinions are subject to change at any time based on factors such as market and economic conditions. These views and opinions may not be relied upon as investment advice or recommendations, or as an offer for a particular security. The information is not a complete analysis of every aspect of any market, country, industry, security or the Fund. Statements of fact are from sources considered reliable, but Invesco Advisers, Inc. makes no representation or warranty as to their completeness or accuracy. Although historical performance is no guarantee of future results, these insights may help you understand our investment management philosophy.
See important Fund and, if applicable, index disclosures later in this report.
Juliet Ellis
Chartered Financial Analyst, portfolio manager, is lead manager of Invesco V.I. Small Cap Equity Fund. She joined Invesco in 2004. Ms. Ellis earned a B.A. in economics and political science from Indiana University.
Juan Hartsfield
Chartered Financial Analyst, portfolio manager, is manager of Invesco V.I. Small Cap Equity Fund. He joined Invesco in 2004. Mr. Hartsfield earned a B.A. in petroleum engineering from The University of Texas at Austin and an M.B.A. from the University of Michigan.
Invesco V.I. Small Cap Equity Fund
Your Fund’s Long-Term Performance
Results of a $10,000 Investment – Since Fund Inception
Fund data from 8/29/03; index data from 8/31/03
Past performance cannot guarantee comparable future results.
Average Annual Total Returns
As of 12/31/11
| | | | | | | | | |
|
| Series I Shares | | | | |
| |
| Inception (8/29/03) | | | 7.09 | % |
| |
| | 5 Years | | | | 2.26 | |
| |
| | 1 Year | | | | -0.73 | |
| |
| | | | | | | | | |
| Series II Shares | | | | |
| |
| Inception (8/29/03) | | | 6.84 | % |
| |
| | 5 Years | | | | 2.00 | |
| |
| | 1 Year | | | | -0.98 | |
The performance of the Fund’s Series I and Series II share classes will differ primarily due to different class expenses.
The performance data quoted represent past performance and cannot guarantee comparable future results; current performance may be lower or higher. Please contact your variable product issuer or financial adviser for the most recent month-end variable product performance. Performance
figures reflect Fund expenses, reinvested distributions and changes in net asset value. Investment return and principal value will fluctuate so that you may have a gain or loss when you sell shares.
The total annual Fund operating expense ratio set forth in the most recent Fund prospectus as of the date of this report for Series I and Series II shares was 1.07% and 1.32%, respectively. The expense ratios presented above may vary from the expense ratios presented in other sections of this report that are based on expenses incurred during the period covered by this report.
Invesco V.I. Small Cap Equity Fund, a series portfolio of AIM Variable Insurance Funds (Invesco Variable Insurance Funds), is currently offered through insurance companies issuing variable products. You cannot purchase shares of the Fund directly.
Performance figures given represent the Fund and are not intended to reflect actual variable product values. They do not reflect sales charges, expenses and fees assessed in connection with a variable product. Sales charges, expenses and fees, which are determined by the variable product issuers, will vary and will lower the total return.
The most recent month-end performance data at the Fund level, excluding variable product charges, is available at 800 451 4246. As mentioned above, for the most recent month-end performance including variable product charges, please contact your variable product issuer or financial adviser.
Had the adviser not waived fees and/ or expenses in the past, performance would have been lower.
Invesco V.I. Small Cap Equity Fund
Invesco V.I. Small Cap Equity Fund’s investment objective is long-term growth of capital.
| n | | Unless otherwise stated, information presented in this report is as of December 31, 2011, and is based on total net assets. |
| |
| n | | Unless otherwise noted, all data provided by Invesco. |
| |
| n | | To access your Fund’s reports/prospectus, visit invesco.com/fundreports. |
Principal risks of investing
in the Fund
Counterparty risk. Individually negotiated or over-the-counter derivatives are also subject to counterparty risk, which is the risk that the other party to the contract (such as a futures contract or swap agreement) will not fulfill its contractual obligations, which may cause losses or additional costs to the Fund.
Foreign securities risk. The Fund’s foreign investments may be affected by changes in a foreign country’s exchange rates; political and social instability; changes in economic or taxation policies; difficulties when enforcing obligations; decreased liquidity; and increased volatility. Foreign companies may be subject to less regulation resulting in less publicly available information about the companies.
Initial public offering risk. Although the Fund’s return during certain periods was positively impacted by its investments in initial public offerings (IPOs), there can be no assurance that the Fund will have favorable IPO investment opportunities in the future.
Management risk. The investment techniques and risk analysis used by the Fund’s portfolio managers may not produce the desired results.
Market risk. The prices of and the income generated by the Fund’s securities may decline in response to, among other things, investor sentiment; general economic and market conditions; regional or global instability; and currency and interest rate fluctuations.
Small- and mid-capitalization risk. Stocks of small and mid-sized companies tend to be more vulnerable to adverse developments in the above factors and may have little or no operating history or track record of success, and limited product lines, markets, management and financial resources. The securities of small and mid-sized companies may be more volatile due to less market interest and less publicly available information about the issuer. They also may be illiquid or restricted as to resale, or may trade less frequently and in smaller volumes, all of which may cause difficulty when establishing or closing a position at a desirable price.
About indexes used in this report
The S&P 500® Index is an unmanaged index considered representative of the U.S. stock market.
The Russell 2000® Index is an unmanaged index considered representative of small-cap stocks. The Russell 2000 Index is a trademark/service mark of the Frank Russell Co. Russell® is a trademark of the Frank Russell Co.
The Lipper VUF Small-Cap Core Funds Index is an unmanaged index considered representative of small-cap core variable insurance underlying funds tracked by Lipper.
The S&P SmallCap 600 is a market-value weighted index that consists of 600 small-cap U.S. stocks chosen for market size, liquidity and industry group representation.
The Fund is not managed to track the performance of any particular index, including the index(es) defined here, and consequently, the performance of the Fund may deviate significantly from the performance of the index(es).
A direct investment cannot be made in an index. Unless otherwise indicated, index results include reinvested dividends, and they do not reflect sales charges. Performance of the peer group, if applicable, reflects fund expenses; performance of a market index does not.
Other information
The Chartered Financial Analyst® (CFA®) designation is globally recognized and attests to a charterholder’s success in a rigorous and comprehensive study program in the field of investment management and research analysis.
Industry classifications used in this report are generally according to the Global Industry Classification Standard, which was developed by and is the exclusive property and a service mark of MSCI Inc. and Standard & Poor’s.
The returns shown in management’s discussion of Fund performance are based on net asset values calculated for shareholder transactions. Generally accepted accounting principles require adjustments to be made to the net assets of the Fund at period end for financial reporting purposes, and as such, the net asset values for shareholder transactions and the returns based on those net asset values may differ from the net asset values and returns reported in the Financial Highlights. Additionally, the returns and net asset values shown throughout this report are at the Fund level only and do not include variable product issuer charges. If such charges were included, the total returns would be lower.
Invesco V.I. Small Cap Equity Fund
Schedule of Investments(a)
December 31, 2011
| | | | | | | | | |
| | | Shares | | Value |
| |
Common Stocks & Other Equity Interests–97.45%
|
Advertising–1.00%
| | | | |
| Interpublic Group of Cos., Inc. (The) | | | 278,700 | | | $ | 2,711,751 | |
| |
Aerospace & Defense–2.49%
| | | | |
| AAR Corp. | | | 111,330 | | | | 2,134,196 | |
| |
Aerovironment Inc.(b) | | | 59,454 | | | | 1,871,017 | |
| |
| Triumph Group Inc. | | | 47,453 | | | | 2,773,628 | |
| |
| | | | | | | | 6,778,841 | |
| |
Agricultural Products–2.00%
| | | | |
| Corn Products International, Inc. | | | 53,674 | | | | 2,822,716 | |
| |
Darling International Inc.(b) | | | 197,504 | | | | 2,624,828 | |
| |
| | | | | | | | 5,447,544 | |
| |
Air Freight & Logistics–0.65%
| | | | |
| UTI Worldwide, Inc. | | | 133,538 | | | | 1,774,720 | |
| |
Apparel Retail–4.75%
| | | | |
| bebe stores, inc. | | | 249,949 | | | | 2,082,075 | |
| |
Buckle, Inc. (The)(c) | | | 62,140 | | | | 2,539,662 | |
| |
| Express, Inc. | | | 128,561 | | | | 2,563,506 | |
| |
| Finish Line, Inc. (The)–Class A | | | 134,193 | | | | 2,587,912 | |
| |
Genesco Inc.(b) | | | 50,754 | | | | 3,133,552 | |
| |
| | | | | | | | 12,906,707 | |
| |
Apparel, Accessories & Luxury Goods–1.13%
| | | | |
| PVH Corp. | | | 43,419 | | | | 3,060,605 | |
| |
Application Software–2.48%
| | | | |
Parametric Technology Corp.(b) | | | 113,786 | | | | 2,077,732 | |
| |
Quest Software, Inc.(b) | | | 113,938 | | | | 2,119,247 | |
| |
TIBCO Software Inc.(b) | | | 106,712 | | | | 2,551,484 | |
| |
| | | | | | | | 6,748,463 | |
| |
Asset Management & Custody Banks–0.78%
| | | | |
Affiliated Managers Group, Inc.(b) | | | 22,041 | | | | 2,114,834 | |
| |
Auto Parts & Equipment–2.12%
| | | | |
Dana Holding Corp.(b) | | | 169,446 | | | | 2,058,769 | |
| |
Modine Manufacturing Co.(b) | | | 200,950 | | | | 1,900,987 | |
| |
TRW Automotive Holdings Corp.(b) | | | 55,415 | | | | 1,806,529 | |
| |
| | | | | | | | 5,766,285 | |
| |
Automotive Retail–0.88%
| | | | |
| Penske Automotive Group, Inc. | | | 124,076 | | | | 2,388,463 | |
| |
Biotechnology–1.10%
| | | | |
Cubist Pharmaceuticals, Inc.(b) | | | 75,720 | | | | 3,000,026 | |
| |
Casinos & Gaming–0.72%
| | | | |
Bally Technologies Inc.(b) | | | 49,493 | | | | 1,957,943 | |
| |
Communications Equipment–1.47%
| | | | |
| ADTRAN, Inc. | | | 84,691 | | | | 2,554,281 | |
| |
JDS Uniphase Corp.(b) | | | 139,339 | | | | 1,454,699 | |
| |
| | | | | | | | 4,008,980 | |
| |
Computer Storage & Peripherals–0.16%
| | | | |
Synaptics Inc.(b) | | | 14,423 | | | | 434,854 | |
| |
Construction & Farm Machinery & Heavy Trucks–1.96%
| | | | |
Titan International, Inc.(c) | | | 133,286 | | | | 2,593,745 | |
| |
| Trinity Industries, Inc. | | | 90,664 | | | | 2,725,360 | |
| |
| | | | | | | | 5,319,105 | |
| |
Construction Materials–0.07%
| | | | |
| Eagle Materials Inc. | | | 7,767 | | | | 199,301 | |
| |
Data Processing & Outsourced Services–1.79%
| | | | |
| Heartland Payment Systems, Inc. | | | 82,457 | | | | 2,008,652 | |
| |
| Henry (Jack) & Associates, Inc. | | | 85,316 | | | | 2,867,471 | |
| |
| | | | | | | | 4,876,123 | |
| |
Department Stores–0.93%
| | | | |
Dillard’s, Inc.–Class A(c) | | | 56,429 | | | | 2,532,533 | |
| |
Diversified Chemicals–0.99%
| | | | |
| FMC Corp. | | | 31,324 | | | | 2,695,117 | |
| |
Diversified Metals & Mining–0.73%
| | | | |
| Compass Minerals International, Inc. | | | 28,859 | | | | 1,986,942 | |
| |
Electrical Components & Equipment–1.75%
| | | | |
| Belden Inc. | | | 81,688 | | | | 2,718,577 | |
| |
GrafTech International Ltd.(b) | | | 150,388 | | | | 2,052,796 | |
| |
| | | | | | | | 4,771,373 | |
| |
Electronic Equipment & Instruments–1.99%
| | | | |
Electro Scientific Industries, Inc.(b) | | | 155,757 | | | | 2,255,361 | |
| |
OSI Systems, Inc.(b) | | | 64,582 | | | | 3,150,310 | |
| |
| | | | | | | | 5,405,671 | |
| |
Environmental & Facilities Services–3.15%
| | | | |
| ABM Industries Inc. | | | 113,540 | | | | 2,341,195 | |
| |
Team, Inc.(b) | | | 123,664 | | | | 3,679,004 | |
| |
| Waste Connections, Inc. | | | 77,090 | | | | 2,554,762 | |
| |
| | | | | | | | 8,574,961 | |
| |
Food Distributors–0.98%
| | | | |
United Natural Foods, Inc.(b) | | | 66,934 | | | | 2,678,029 | |
| |
| | | | | | | | | |
| | | | | | | | | |
See accompanying Notes to Financial Statements which are an integral part of the financial statements.
Invesco V.I. Small Cap Equity Fund
| | | | | | | | | |
| | | Shares | | Value |
| |
Gas Utilities–1.10%
| | | | |
| UGI Corp. | | | 101,923 | | | $ | 2,996,536 | |
| |
Gold–0.46%
| | | | |
Allied Nevada Gold Corp.(b) | | | 21,610 | | | | 654,351 | |
| |
Detour Gold Corp. (Canada)(b) | | | 24,073 | | | | 594,264 | |
| |
| | | | | | | | 1,248,615 | |
| |
Health Care Distributors–0.59%
| | | | |
| Owens & Minor, Inc. | | | 57,324 | | | | 1,593,034 | |
| |
Health Care Equipment–1.78%
| | | | |
Greatbatch, Inc.(b) | | | 112,788 | | | | 2,492,615 | |
| |
| Teleflex Inc. | | | 38,364 | | | | 2,351,329 | |
| |
| | | | | | | | 4,843,944 | |
| |
Health Care Facilities–2.11%
| | | | |
Amsurg Corp.(b) | | | 115,999 | | | | 3,020,614 | |
| |
| Universal Health Services, Inc.–Class B | | | 69,754 | | | | 2,710,640 | |
| |
| | | | | | | | 5,731,254 | |
| |
Health Care Services–1.19%
| | | | |
Gentiva Health Services, Inc.(b) | | | 68,335 | | | | 461,261 | |
| |
IPC The Hospitalist Co.(b) | | | 60,701 | | | | 2,775,250 | |
| |
| | | | | | | | 3,236,511 | |
| |
Health Care Supplies–0.90%
| | | | |
| Cooper Cos., Inc. (The) | | | 34,526 | | | | 2,434,774 | |
| |
Health Care Technology–0.75%
| | | | |
Omnicell, Inc.(b) | | | 124,281 | | | | 2,053,122 | |
| |
Industrial Machinery–2.79%
| | | | |
| Gardner Denver Inc. | | | 32,967 | | | | 2,540,437 | |
| |
| IDEX Corp. | | | 64,925 | | | | 2,409,367 | |
| |
| Valmont Industries, Inc. | | | 29,188 | | | | 2,649,978 | |
| |
| | | | | | | | 7,599,782 | |
| |
Industrial REIT’s–1.05%
| | | | |
DuPont Fabros Technology Inc.(c) | | | 117,400 | | | | 2,843,428 | |
| |
Insurance Brokers–1.11%
| | | | |
| Arthur J. Gallagher & Co. | | | 90,298 | | | | 3,019,565 | |
| |
Integrated Telecommunication Services–0.22%
| | | | |
Alaska Communications Systems Group Inc.(c) | | | 198,608 | | | | 597,810 | |
| |
Internet Software & Services–1.99%
| | | | |
Open Text Corp. (Canada)(b)(c) | | | 46,606 | | | | 2,383,431 | |
| |
ValueClick, Inc.(b) | | | 185,120 | | | | 3,015,605 | |
| |
| | | | | | | | 5,399,036 | |
| |
Investment Banking & Brokerage–0.82%
| | | | |
| Evercore Partners Inc.–Class A | | | 83,357 | | | | 2,218,963 | |
| |
IT Consulting & Other Services–0.97%
| | | | |
| MAXIMUS, Inc. | | | 64,113 | | | | 2,651,073 | |
| |
Life Sciences Tools & Services–1.58%
| | | | |
Bio-Rad Laboratories, Inc.–Class A(b) | | | 24,827 | | | | 2,384,385 | |
| |
Charles River Laboratories International, Inc.(b) | | | 70,311 | | | | 1,921,600 | |
| |
| | | | | | | | 4,305,985 | |
| |
Managed Health Care–0.22%
| | | | |
AMERIGROUP Corp.(b) | | | 9,901 | | | | 584,951 | |
| |
Metal & Glass Containers–0.91%
| | | | |
| AptarGroup, Inc. | | | 47,567 | | | | 2,481,570 | |
| |
Multi-Line Insurance–1.03%
| | | | |
| American Financial Group, Inc. | | | 75,747 | | | | 2,794,307 | |
| |
Office REIT’s–0.94%
| | | | |
| Douglas Emmett, Inc. | | | 140,100 | | | | 2,555,424 | |
| |
Oil & Gas Equipment & Services–4.37%
| | | | |
Dresser-Rand Group, Inc.(b) | | | 52,288 | | | | 2,609,694 | |
| |
| Lufkin Industries, Inc. | | | 31,969 | | | | 2,151,833 | |
| |
| Oceaneering International, Inc. | | | 58,421 | | | | 2,694,961 | |
| |
Oil States International, Inc.(b) | | | 38,251 | | | | 2,921,229 | |
| |
Superior Energy Services, Inc.(b)(c) | | | 52,654 | | | | 1,497,480 | |
| |
| | | | | | | | 11,875,197 | |
| |
Oil & Gas Exploration & Production–3.10%
| | | | |
| Energen Corp. | | | 51,941 | | | | 2,597,050 | |
| |
Forest Oil Corp.(b) | | | 108,229 | | | | 1,466,503 | |
| |
Rosetta Resources, Inc.(b)(c) | | | 59,391 | | | | 2,583,509 | |
| |
SandRidge Energy Inc.(b) | | | 217,446 | | | | 1,774,359 | |
| |
| | | | | | | | 8,421,421 | |
| |
Packaged Foods & Meats–1.20%
| | | | |
TreeHouse Foods, Inc.(b) | | | 49,851 | | | | 3,259,258 | |
| |
Paper Products–1.02%
| | | | |
| Schweitzer-Mauduit International, Inc. | | | 41,908 | | | | 2,785,206 | |
| |
Personal Products–0.47%
| | | | |
Prestige Brands Holdings Inc.(b) | | | 114,307 | | | | 1,288,240 | |
| |
Pharmaceuticals–3.91%
| | | | |
Endo Pharmaceuticals Holdings Inc.(b) | | | 77,748 | | | | 2,684,638 | |
| |
Questcor Pharmaceuticals, Inc.(b) | | | 75,971 | | | | 3,158,874 | |
| |
ViroPharma Inc.(b) | | | 175,186 | | | | 4,798,345 | |
| |
| | | | | | | | 10,641,857 | |
| |
Property & Casualty Insurance–1.00%
| | | | |
| W. R. Berkley Corp. | | | 78,686 | | | | 2,706,012 | |
| |
| | | | | | | | | |
| | | | | | | | | |
See accompanying Notes to Financial Statements which are an integral part of the financial statements.
Invesco V.I. Small Cap Equity Fund
| | | | | | | | | |
| | | Shares | | Value |
| |
Real Estate Services–0.70%
| | | | |
| Jones Lang LaSalle Inc. | | | 31,296 | | | $ | 1,917,193 | |
| |
Regional Banks–4.26%
| | | | |
| Commerce Bancshares, Inc. | | | 48,161 | | | | 1,835,897 | |
| |
| East West Bancorp, Inc. | | | 124,760 | | | | 2,464,010 | |
| |
Texas Capital Bancshares, Inc.(b) | | | 106,855 | | | | 3,270,832 | |
| |
| Wintrust Financial Corp. | | | 85,661 | | | | 2,402,791 | |
| |
| Zions Bancorp. | | | 98,374 | | | | 1,601,529 | |
| |
| | | | | | | | 11,575,059 | |
| |
Residential REIT’s–1.02%
| | | | |
| Education Realty Trust, Inc. | | | 271,400 | | | | 2,776,422 | |
| |
Restaurants–2.02%
| | | | |
DineEquity, Inc.(b) | | | 50,686 | | | | 2,139,456 | |
| |
| P.F. Chang’s China Bistro, Inc. | | | 44,309 | | | | 1,369,591 | |
| |
Papa John’s International, Inc.(b) | | | 52,820 | | | | 1,990,258 | |
| |
| | | | | | | | 5,499,305 | |
| |
Retail REIT’s–1.11%
| | | | |
| Tanger Factory Outlet Centers, Inc. | | | 102,704 | | | | 3,011,281 | |
| |
Semiconductor Equipment–2.28%
| | | | |
Cymer, Inc.(b) | | | 54,424 | | | | 2,708,138 | |
| |
Novellus Systems, Inc.(b) | | | 84,726 | | | | 3,498,337 | |
| |
| | | | | | | | 6,206,475 | |
| |
Semiconductors–3.06%
| | | | |
Diodes Inc.(b) | | | 121,364 | | | | 2,585,053 | |
| |
Lattice Semiconductor Corp.(b) | | | 458,531 | | | | 2,723,674 | |
| |
Semtech Corp.(b) | | | 121,221 | | | | 3,008,706 | |
| |
| | | | | | | | 8,317,433 | |
| |
Specialized REIT’s–0.96%
| | | | |
| LaSalle Hotel Properties | | | 108,188 | | | | 2,619,232 | |
| |
Specialty Chemicals–1.91%
| | | | |
| Innophos Holdings, Inc. | | | 59,682 | | | | 2,898,158 | |
| |
| PolyOne Corp. | | | 198,239 | | | | 2,289,660 | |
| |
| | | | | | | | 5,187,818 | |
| |
Specialty Stores–1.28%
| | | | |
GNC Holdings, Inc.–Class A(b) | | | 120,366 | | | | 3,484,596 | |
| |
Systems Software–0.92%
| | | | |
Ariba Inc.(b) | | | 89,556 | | | | 2,514,733 | |
| |
Technology Distributors–1.11%
| | | | |
Arrow Electronics, Inc.(b) | | | 81,001 | | | | 3,030,247 | |
| |
Trading Companies & Distributors–0.99%
| | | | |
Beacon Roofing Supply, Inc.(b) | | | 132,418 | | | | 2,678,816 | |
| |
Trucking–2.18%
| | | | |
| Landstar System, Inc. | | | 48,008 | | | | 2,300,544 | |
| |
Old Dominion Freight Line, Inc.(b) | | | 89,270 | | | | 3,618,113 | |
| |
| | | | | | | | 5,918,657 | |
| |
| Total Common Stocks & Other Equity Interests (Cost $217,726,466) | | | | | | | 265,043,313 | |
| |
Money Market Funds–2.45%
|
Liquid Assets Portfolio–Institutional Class(d) | | | 3,335,595 | | | | 3,335,595 | |
| |
Premier Portfolio–Institutional Class(d) | | | 3,335,595 | | | | 3,335,595 | |
| |
| Total Money Market Funds (Cost $6,671,190) | | | | | | | 6,671,190 | |
| |
| TOTAL INVESTMENTS (excluding investments purchased with cash collateral from securities on loan)–99.90% (Cost $224,397,656) | | | | | | | 271,714,503 | |
| |
Investments Purchased with Cash Collateral from Securities on Loan
|
Money Market Funds–3.99%
|
Liquid Assets Portfolio–Institutional Class (Cost $10,853,794)(d)(e) | | | 10,853,794 | | | | 10,853,794 | |
| |
| TOTAL INVESTMENTS–103.89% (Cost $235,251,450) | | | | | | | 282,568,297 | |
| |
| OTHER ASSETS LESS LIABILITIES–(3.89)% | | | | | | | (10,590,346 | ) |
| |
| NET ASSETS–100.00% | | | | | | $ | 271,977,951 | |
| |
Investment Abbreviations:
| | | |
| REIT | | – Real Estate Investment Trust |
Notes to Schedule of Investments:
| | |
| (a) | | Industry and/or sector classifications used in this report are generally according to the Global Industry Classification Standard, which was developed by and is the exclusive property and a service mark of MSCI Inc. and Standard & Poor’s. |
| (b) | | Non-income producing security. |
| (c) | | All or a portion of this security was out on loan at December 31, 2011. |
| (d) | | The money market fund and the Fund are affiliated by having the same investment adviser. |
| (e) | | The security has been segregated to satisfy the commitment to return the cash collateral received in securities lending transactions upon the borrower’s return of the securities loaned. See Note 1K. |
See accompanying Notes to Financial Statements which are an integral part of the financial statements.
Invesco V.I. Small Cap Equity Fund
Statement of Assets and Liabilities
December 31, 2011
| | | | | |
Assets:
|
| Investments, at value (Cost $217,726,466)* | | $ | 265,043,313 | |
| |
| Investments in affiliated money market funds, at value and cost | | | 17,524,984 | |
| |
| Total investments, at value (Cost $235,251,450) | | | 282,568,297 | |
| |
| Receivable for: | | | | |
| Investments sold | | | 984,570 | |
| |
| Fund shares sold | | | 566,130 | |
| |
| Dividends | | | 143,534 | |
| |
| Investment for trustee deferred compensation and retirement plans | | | 24,820 | |
| |
| Total assets | | | 284,287,351 | |
| |
Liabilities:
|
| Payable for: | | | | |
| Investments purchased | | | 1,065,175 | |
| |
| Fund shares reacquired | | | 121,978 | |
| |
| Collateral upon return of securities loaned | | | 10,853,794 | |
| |
| Accrued fees to affiliates | | | 194,153 | |
| |
| Accrued other operating expenses | | | 31,104 | |
| |
| Trustee deferred compensation and retirement plans | | | 43,196 | |
| |
| Total liabilities | | | 12,309,400 | |
| |
| Net assets applicable to shares outstanding | | $ | 271,977,951 | |
| |
Net assets consist of:
|
| Shares of beneficial interest | | $ | 246,224,560 | |
| |
| Undistributed net investment income (loss) | | | (42,206 | ) |
| |
| Undistributed net realized gain (loss) | | | (21,521,250 | ) |
| |
| Unrealized appreciation | | | 47,316,847 | |
| |
| | | $ | 271,977,951 | |
| |
Net Assets:
|
| Series I | | $ | 217,287,297 | |
| |
| Series II | | $ | 54,690,654 | |
| |
Shares outstanding, $0.001 par value per share, with an unlimited number of shares authorized:
|
| Series I | | | 13,240,495 | |
| |
| Series II | | | 3,394,113 | |
| |
| Series I: | | | | |
| Net asset value per share | | $ | 16.41 | |
| |
| Series II: | | | | |
| Net asset value per share | | $ | 16.11 | |
| |
| |
| * | At December 31, 2011, securities with an aggregate value of $10,589,042 were on loan to brokers. |
Statement of Operations
For the year ended December 31, 2011
| | | | | |
Investment income:
|
| Dividends | | $ | 2,064,431 | |
| |
| Dividends from affiliated money market funds (includes securities lending income of $43,874) | | | 52,403 | |
| |
| Total investment income | | | 2,116,834 | |
| |
Expenses:
|
| Advisory fees | | | 2,060,392 | |
| |
| Administrative services fees | | | 753,200 | |
| |
| Custodian fees | | | 21,823 | |
| |
| Distribution fees — Series II | | | 112,026 | |
| |
| Transfer agent fees | | | 22,483 | |
| |
| Trustees’ and officers’ fees and benefits | | | 28,684 | |
| |
| Other | | | 53,684 | |
| |
| Total expenses | | | 3,052,292 | |
| |
| Less: Fees waived | | | (11,374 | ) |
| |
| Net expenses | | | 3,040,918 | |
| |
| Net investment income (loss) | | | (924,084 | ) |
| |
Realized and unrealized gain (loss) from:
|
| Net realized gain (loss) from: | | | | |
| Investment securities (includes net gains (losses) from securities sold to affiliates of $(75,311)) | | | 16,598,001 | |
| |
| Foreign currencies | | | (2,270 | ) |
| |
| | | | 16,595,731 | |
| |
| Change in net unrealized appreciation (depreciation) of investment securities | | | (20,800,587 | ) |
| |
| Net realized and unrealized gain (loss) | | | (4,204,856 | ) |
| |
| Net increase (decrease) in net assets resulting from operations | | $ | (5,128,940 | ) |
| |
See accompanying Notes to Financial Statements which are an integral part of the financial statements.
Invesco V.I. Small Cap Equity Fund
Statement of Changes in Net Assets
For the years ended December 31, 2011 and 2010
| | | | | | | | | |
| | | 2011 | | 2010 |
| |
Operations:
|
| Net investment income (loss) | | $ | (924,084 | ) | | $ | (290,151 | ) |
| |
| Net realized gain | | | 16,595,731 | | | | 806,612 | |
| |
| Change in net unrealized appreciation (depreciation) | | | (20,800,587 | ) | | | 53,570,548 | |
| |
| Net increase (decrease) in net assets resulting from operations | | | (5,128,940 | ) | | | 54,087,009 | |
| |
Share transactions–net:
|
| Series I | | | 225,192 | | | | (5,817,750 | ) |
| |
| Series II | | | 22,286,320 | | | | 13,329,420 | |
| |
| Net increase in net assets resulting from share transactions | | | 22,511,512 | | | | 7,511,670 | |
| |
| Net increase in net assets | | | 17,382,572 | | | | 61,598,679 | |
| |
Net assets:
|
| Beginning of year | | | 254,595,379 | | | | 192,996,700 | |
| |
| End of year (includes undistributed net investment income (loss) of $(42,206) and $(28,013), respectively) | | $ | 271,977,951 | | | $ | 254,595,379 | |
| |
Notes to Financial Statements
December 31, 2011
NOTE 1—Significant Accounting Policies
Invesco V.I. Small Cap Equity Fund (the “Fund”) is a series portfolio of AIM Variable Insurance Funds (Invesco Variable Insurance Funds) (the “Trust”). The Trust is a Delaware statutory trust registered under the Investment Company Act of 1940, as amended (the “1940 Act”), as an open-end series management investment company consisting of twenty-eight separate portfolios, (each constituting a “Fund”). The assets, liabilities and operations of each portfolio are accounted for separately. Information presented in these financial statements pertains only to the Fund. Matters affecting each Fund or class will be voted on exclusively by the shareholders of such Fund or class. Current Securities and Exchange Commission (“SEC”) guidance, however, requires participating insurance companies offering separate accounts to vote shares proportionally in accordance with the instructions of the contract owners whose investments are funded by shares of each Fund or class.
The Fund’s investment objective is long-term growth of capital.
The Fund currently offers two classes of shares, Series I and Series II, both of which are offered to insurance company separate accounts funding variable annuity contracts and variable life insurance policies (“variable products”).
The following is a summary of the significant accounting policies followed by the Fund in the preparation of its financial statements.
| | |
| A. | | Security Valuations — Securities, including restricted securities, are valued according to the following policy. |
| | A security listed or traded on an exchange (except convertible bonds) is valued at its last sales price or official closing price as of the close of the customary trading session on the exchange where the security is principally traded, or lacking any sales or official closing price on a particular day, the security may be valued at the closing bid price on that day. Securities traded in the over-the-counter market are valued based on prices furnished by independent pricing services or market makers. When such securities are valued by an independent pricing service they may be considered fair valued. Futures contracts are valued at the final settlement price set by an exchange on which they are principally traded. Listed options are valued at the mean between the last bid and ask prices from the exchange on which they are principally traded. Options not listed on an exchange are valued by an independent source at the mean between the last bid and ask prices. For purposes of determining net asset value per share, futures and option contracts generally are valued 15 minutes after the close of the customary trading session of the New York Stock Exchange (“NYSE”). |
| | Investments in open-end and closed-end registered investment companies that do not trade on an exchange are valued at the end of day net asset value per share. Investments in open-end and closed-end registered investment companies that trade on an exchange are valued at the last sales price or official closing price as of the close of the customary trading session on the exchange where the security is principally traded. |
| | Debt obligations (including convertible bonds) and unlisted equities are fair valued using an evaluated quote provided by an independent pricing service. Evaluated quotes provided by the pricing service may be determined without exclusive reliance on quoted prices, and may reflect appropriate factors such as institution-size trading in similar groups of securities, developments related to specific securities, dividend rate, yield, quality, type of issue, coupon rate, maturity, individual trading characteristics and other market data. Debt securities are subject to interest rate and credit risks. In addition, all debt securities involve some risk of default with respect to interest and/or principal payments. |
| | Foreign securities (including foreign exchange contracts) are converted into U.S. dollar amounts using the applicable exchange rates as of the close of the NYSE. If market quotations are available and reliable for foreign exchange traded equity securities, the securities will be valued at the market |
Invesco V.I. Small Cap Equity Fund
| | |
| | quotations. Because trading hours for certain foreign securities end before the close of the NYSE, closing market quotations may become unreliable. If between the time trading ends on a particular security and the close of the customary trading session on the NYSE, events occur that are significant and make the closing price unreliable, the Fund may fair value the security. If the event is likely to have affected the closing price of the security, the security will be valued at fair value in good faith using procedures approved by the Board of Trustees. Adjustments to closing prices to reflect fair value may also be based on a screening process of an independent pricing service to indicate the degree of certainty, based on historical data, that the closing price in the principal market where a foreign security trade is not the current value as of the close of the NYSE. Foreign securities meeting the approved degree of certainty that the price is not reflective of current value will be priced at the indication of fair value from the independent pricing service. Multiple factors may be considered by the independent pricing service in determining adjustments to reflect fair value and may include information relating to sector indices, American Depositary Receipts and domestic and foreign index futures. Foreign securities may have additional risks including exchange rate changes, potential for sharply devalued currencies and high inflation, political and economic upheaval, the relative lack of issuer information, relatively low market liquidity and the potential lack of strict financial and accounting controls and standards. |
| | Securities for which market prices are not provided by any of the above methods may be valued based upon quotes furnished by independent sources. The last bid price may be used to value equity securities. The mean between the last bid and asked prices is used to value debt obligations, including Corporate Loans. |
| | Securities for which market quotations are not readily available or are unreliable are valued at fair value as determined in good faith by or under the supervision of the Trust’s officers following procedures approved by the Board of Trustees. Issuer specific events, market trends, bid/ask quotes of brokers and information providers and other market data may be reviewed in the course of making a good faith determination of a security’s fair value. |
| | Valuations change in response to many factors including the historical and prospective earnings of the issuer, the value of the issuer’s assets, general economic conditions, interest rates, investor perceptions and market liquidity. Because of the inherent uncertainties of valuation, the values reflected in the financial statements may materially differ from the value received upon actual sale of those investments. |
| B. | | Securities Transactions and Investment Income — Securities transactions are accounted for on a trade date basis. Realized gains or losses on sales are computed on the basis of specific identification of the securities sold. Interest income is recorded on the accrual basis from settlement date. Dividend income (net of withholding tax, if any) is recorded on the ex-dividend date. |
| | The Fund may periodically participate in litigation related to Fund investments. As such, the Fund may receive proceeds from litigation settlements. Any proceeds received are included in the Statement of Operations as realized gain (loss) for investments no longer held and as unrealized gain (loss) for investments still held. |
| | Brokerage commissions and mark ups are considered transaction costs and are recorded as an increase to the cost basis of securities purchased and/or a reduction of proceeds on a sale of securities. Such transaction costs are included in the determination of net realized and unrealized gain (loss) from investment securities reported in the Statement of Operations and the Statement of Changes in Net Assets and the net realized and unrealized gains (losses) on securities per share in the Financial Highlights. Transaction costs are included in the calculation of the Fund’s net asset value and, accordingly, they reduce the Fund’s total returns. These transaction costs are not considered operating expenses and are not reflected in net investment income reported in the Statement of Operations and Statement of Changes in Net Assets, or the net investment income per share and ratios of expenses and net investment income reported in the Financial Highlights, nor are they limited by any expense limitation arrangements between the Fund and the investment adviser. |
| | The Fund allocates income and realized and unrealized capital gains and losses to a class based on the relative net assets of each class. |
| C. | | Country Determination — For the purposes of making investment selection decisions and presentation in the Schedule of Investments, the investment adviser may determine the country in which an issuer is located and/or credit risk exposure based on various factors. These factors include the laws of the country under which the issuer is organized, where the issuer maintains a principal office, the country in which the issuer derives 50% or more of its total revenues and the country that has the primary market for the issuer’s securities, as well as other criteria. Among the other criteria that may be evaluated for making this determination are the country in which the issuer maintains 50% or more of its assets, the type of security, financial guarantees and enhancements, the nature of the collateral and the sponsor organization. Country of issuer and/or credit risk exposure has been determined to be the United States of America, unless otherwise noted. |
| D. | | Distributions — Distributions from income and net realized capital gain, if any, are generally paid to separate accounts of participating insurance companies annually and recorded on ex-dividend date. |
| E. | | Federal Income Taxes — The Fund intends to comply with the requirements of Subchapter M of the Internal Revenue Code necessary to qualify as a regulated investment company and to distribute substantially all of the Fund’s taxable earnings to shareholders. As such, the Fund will not be subject to federal income taxes on otherwise taxable income (including net realized capital gain) that is distributed to shareholders. Therefore, no provision for federal income taxes is recorded in the financial statements. |
| | The Fund files tax returns in the U.S. Federal jurisdiction and certain other jurisdictions. Generally, the Fund is subject to examinations by such taxing authorities for up to three years after the filing of the return for the tax period. |
| F. | | Expenses — Fees provided for under the Rule 12b-1 plan of a particular class of the Fund and which are directly attributable to that class are charged to the operations of such class. All other expenses are allocated among the classes based on relative net assets. |
| G. | | Accounting Estimates — The preparation of financial statements in conformity with accounting principles generally accepted in the United States of America (“GAAP”) requires management to make estimates and assumptions that affect the reported amounts of assets and liabilities at the date of the financial statements and the reported amounts of revenues and expenses during the reporting period including estimates and assumptions related to taxation. Actual results could differ from those estimates by a significant amount. In addition, the Fund monitors for material events or transactions that may occur or become known after the period-end date and before the date the financial statements are released to print. |
| H. | | Indemnifications — Under the Trust’s organizational documents, each Trustee, officer, employee or other agent of the Trust is indemnified against certain liabilities that may arise out of performance of their duties to the Fund. Additionally, in the normal course of business, the Fund enters into contracts, including the Fund’s servicing agreements that contain a variety of indemnification clauses. The Fund’s maximum exposure under these |
Invesco V.I. Small Cap Equity Fund
| | |
| | arrangements is unknown as this would involve future claims that may be made against the Fund that have not yet occurred. The risk of material loss as a result of such indemnification claims is considered remote. |
| I. | | Foreign Currency Translations — Foreign currency is valued at the close of the NYSE based on quotations posted by banks and major currency dealers. Portfolio securities and other assets and liabilities denominated in foreign currencies are translated into U.S. dollar amounts at date of valuation. Purchases and sales of portfolio securities (net of foreign taxes withheld on disposition) and income items denominated in foreign currencies are translated into U.S. dollar amounts on the respective dates of such transactions. The Fund does not separately account for the portion of the results of operations resulting from changes in foreign exchange rates on investments and the fluctuations arising from changes in market prices of securities held. The combined results of changes in foreign exchange rates and the fluctuation of market prices on investments (net of estimated foreign tax withholding) are included with the net realized and unrealized gain or loss from investments in the Statement of Operations. Reported net realized foreign currency gains or losses arise from (1) sales of foreign currencies, (2) currency gains or losses realized between the trade and settlement dates on securities transactions, and (3) the difference between the amounts of dividends, interest, and foreign withholding taxes recorded on the Fund’s books and the U.S. dollar equivalent of the amounts actually received or paid. Net unrealized foreign currency gains and losses arise from changes in the fair values of assets and liabilities, other than investments in securities at fiscal period end, resulting from changes in exchange rates. |
| | The Fund may invest in foreign securities which may be subject to foreign taxes on income, gains on investments or currency repatriation, a portion of which may be recoverable. |
| J. | | Foreign Currency Contracts — The Fund may enter into foreign currency contracts to manage or minimize currency or exchange rate risk. The Fund may also enter into foreign currency contracts for the purchase or sale of a security denominated in a foreign currency in order to “lock in” the U.S. dollar price of that security. A foreign currency contract is an obligation to purchase or sell a specific currency for an agreed-upon price at a future date. The use of foreign currency contracts does not eliminate fluctuations in the price of the underlying securities the Fund owns or intends to acquire but establishes a rate of exchange in advance. Fluctuations in the value of these contracts are measured by the difference in the contract date and reporting date exchange rates and are recorded as unrealized appreciation (depreciation) until the contracts are closed. When the contracts are closed, realized gains (losses) are recorded. Realized and unrealized gains (losses) on the contracts are included in the Statement of Operations. The primary risks associated with foreign currency contracts include failure of the counterparty to meet the terms of the contract and the value of the foreign currency changing unfavorably. These risks may be in excess of the amounts reflected in the Statement of Assets and Liabilities. |
| K. | | Securities Lending — The Fund may lend portfolio securities having a market value up to one-third of the Fund’s total assets. Such loans are secured by collateral equal to no less than the market value of the loaned securities determined daily by the securities lending provider. Such collateral will be cash or debt securities issued or guaranteed by the U.S. Government or any of its sponsored agencies. Cash collateral received in connection with these loans is invested in short-term money market instruments or affiliated money market funds and is shown as such on the Schedule of Investments. It is the Fund’s policy to obtain additional collateral from or return excess collateral to the borrower by the end of the next business day, following the valuation date of the securities loaned. Therefore, the value of the collateral held may be temporarily less than the value of the securities on loan. Lending securities entails a risk of loss to the Fund if and to the extent that the market value of the securities loaned were to increase and the borrower did not increase the collateral accordingly, and the borrower fails to return the securities. Upon the failure of the borrower to return the securities, collateral may be liquidated and the securities may be purchased on the open market to replace the loaned securities. The Fund could experience delays and costs in gaining access to the collateral. The Fund bears the risk of any deficiency in the amount of the collateral available for return to the borrower due to any loss on the collateral invested. Dividends received on cash collateral investments for securities lending transactions, which are net of compensation to counterparties, is included in Dividends from affiliated money market funds on the Statement of Operations. The aggregate value of securities out on loan is shown as a footnote on the Statement of Assets and Liabilities, if any. |
NOTE 2—Advisory Fees and Other Fees Paid to Affiliates
The Trust has entered into a master investment advisory agreement with Invesco Advisers, Inc. (the “Adviser” or “Invesco”). Under the terms of the investment advisory agreement, the Fund pays an advisory fee to the Adviser based on the annual rate of the Fund’s average daily net assets as follows:
| | | | | |
| Average Daily Net Assets | | Rate |
| |
| First $250 million | | | 0 | .745% |
| |
| Next $250 million | | | 0 | .73% |
| |
| Next $500 million | | | 0 | .715% |
| |
| Next $1.5 billion | | | 0 | .70% |
| |
| Next $2.5 billion | | | 0 | .685% |
| |
| Next $2.5 billion | | | 0 | .67% |
| |
| Next $2.5 billion | | | 0 | .655% |
| |
| Over $10 billion | | | 0 | .64% |
| |
Under the terms of a master sub-advisory agreement between the Adviser and each of Invesco Asset Management Deutschland GmbH, Invesco Asset Management Limited, Invesco Asset Management (Japan) Limited, Invesco Australia Limited, Invesco Hong Kong Limited, Invesco Senior Secured Management, Inc. and Invesco Canada Ltd. (collectively, the “Affiliated Sub-Advisers”) the Adviser, not the Fund, may pay 40% of the fees paid to the Adviser to any such Affiliated Sub-Adviser(s) that provide discretionary investment management services to the Fund based on the percentage of assets allocated to such Sub-Adviser(s).
Invesco V.I. Small Cap Equity Fund
The Adviser has contractually agreed, through at least April 30, 2013, to waive advisory fees and/or reimburse expenses to the extent necessary to limit total annual fund operating expenses after fee waiver and/or expense reimbursement (excluding certain items discussed below) of Series I shares to 1.15% and Series II shares to 1.40% of average daily net assets. In determining the Adviser’s obligation to waive advisory fees and/or reimburse expenses, the following expenses are not taken into account, and could cause the total annual fund operating expenses after fee waiver and/or expense reimbursement to exceed the numbers reflected above: (1) interest; (2) taxes; (3) dividend expense on short sales; (4) extraordinary or non-routine items, including litigation expenses; and (5) expenses that the Fund has incurred but did not actually pay because of an expense offset arrangement. Unless the Board of the Trustees and Invesco mutually agree to amend or continue the fee waiver agreement, it will terminate on April 30, 2013. The Adviser did not waive fees and/or reimburse expenses during the period under this expense limitation.
Further, the Adviser has contractually agreed, through at least June 30, 2012, to waive the advisory fee payable by the Fund in an amount equal to 100% of the net advisory fees the Adviser receives from the affiliated money market funds on investments by the Fund of uninvested cash (excluding investments of cash collateral from securities lending) in such affiliated money market funds.
For the year ended December 31, 2011, the Adviser waived advisory fees of $11,374.
The Trust has entered into a master administrative services agreement with Invesco pursuant to which the Fund has agreed to pay Invesco a fee for costs incurred in providing accounting services and fund administrative services to the Fund and to reimburse Invesco for administrative services fees paid to insurance companies that have agreed to provide services to the participants of separate accounts. These administrative services provided by the insurance companies may include, among other things: the printing of prospectuses, financial reports and proxy statements and the delivery of the same to existing participants; the maintenance of master accounts; the facilitation of purchases and redemptions requested by the participants; and the servicing of participants’ accounts. Pursuant to such agreement, for the year ended December 31, 2011, Invesco was paid $73,735 for accounting and fund administrative services and reimbursed $679,465 for services provided by insurance companies.
The Trust has entered into a transfer agency and service agreement with Invesco Investment Services, Inc. (“IIS”) pursuant to which the Fund has agreed to pay IIS a fee for providing transfer agency and shareholder services to the Fund and reimburse IIS for certain expenses incurred by IIS in the course of providing such services. For the year ended December 31, 2011, expenses incurred under the agreement are shown in the Statement of Operations as transfer agent fees.
The Trust has entered into a master distribution agreement with Invesco Distributors, Inc. (“IDI”) to serve as the distributor for the Fund. The Trust has adopted a plan pursuant to Rule 12b-1 under the 1940 Act with respect to the Fund’s Series II shares (the “Plan”). The Fund, pursuant to the Plan, pays IDI compensation at the annual rate of 0.25% of the Fund’s average daily net assets of Series II shares. Of the Plan payments, up to 0.25% of the average daily net assets of the Series II shares may be paid to insurance companies who furnish continuing personal shareholder services to customers who purchase and own Series II shares of the Fund. For the year ended December 31, 2011, expenses incurred under the Plan are detailed in the Statement of Operations as distribution fees.
Certain officers and trustees of the Trust are officers and directors of the Adviser, IIS and/or IDI.
NOTE 3—Additional Valuation Information
GAAP defines fair value as the price that would be received to sell an asset or paid to transfer a liability in an orderly transaction between market participants at the measurement date, under current market conditions. GAAP establishes a hierarchy that prioritizes the inputs to valuation methods giving the highest priority to readily available unadjusted quoted prices in an active market for identical assets (Level 1) and the lowest priority to significant unobservable inputs (Level 3) generally when market prices are not readily available or are unreliable. Based on the valuation inputs, the securities or other investments are tiered into one of three levels. Changes in valuation methods may result in transfers in or out of an investment’s assigned level:
| | |
| | Level 1 — | Prices are determined using quoted prices in an active market for identical assets. |
| | Level 2 — | Prices are determined using other significant observable inputs. Observable inputs are inputs that other market participants may use in pricing a security. These may include quoted prices for similar securities, interest rates, prepayment speeds, credit risk, yield curves, loss severities, default rates, discount rates, volatilities and others. |
| | Level 3 — | Prices are determined using significant unobservable inputs. In situations where quoted prices or observable inputs are unavailable (for example, when there is little or no market activity for an investment at the end of the period), unobservable inputs may be used. Unobservable inputs reflect the Fund’s own assumptions about the factors market participants would use in determining fair value of the securities or instruments and would be based on the best available information. |
The following is a summary of the tiered valuation input levels, as of December 31, 2011. The level assigned to the securities valuations may not be an indication of the risk or liquidity associated with investing in those securities. Because of the inherent uncertainties of valuation, the values reflected in the financial statements may materially differ from the value received upon actual sale of those investments.
During the year ended December 31, 2011, there were no significant transfers between investment levels.
| | | | | | | | | | | | | | | | | |
| | | Level 1 | | Level 2 | | Level 3 | | Total |
| |
| Equity Securities | | $ | 282,568,297 | | | $ | — | | | $ | — | | | $ | 282,568,297 | |
| |
NOTE 4—Security Transactions with Affiliated Funds
The Fund is permitted to purchase or sell securities from or to certain other Invesco Funds under specified conditions outlined in procedures adopted by the Board of Trustees of the Trust. The procedures have been designed to ensure that any purchase or sale of securities by the Fund from or to another fund or portfolio that is or could be considered an affiliate by virtue of having a common investment adviser (or affiliated investment advisers), common Trustees and/or common officers complies with Rule 17a-7 of the 1940 Act. Further, as defined under the procedures, each transaction is effected at the current market price.
Invesco V.I. Small Cap Equity Fund
Pursuant to these procedures, for the year ended December 31, 2011, the Fund engaged in securities purchases of $161,028 and securities sales of $3,591,653, which resulted in net realized gains (losses) of $(75,311).
NOTE 5—Trustees’ and Officers’ Fees and Benefits
“Trustees’ and Officers’ Fees and Benefits” include amounts accrued by the Fund to pay remuneration to certain Trustees and Officers of the Fund. Trustees have the option to defer compensation payable by the Fund, and “Trustees’ and Officers’ Fees and Benefits” also include amounts accrued by the Fund to fund such deferred compensation amounts. Those Trustees who defer compensation have the option to select various Invesco Funds in which their deferral accounts shall be deemed to be invested. Finally, certain current Trustees are eligible to participate in a retirement plan that provides for benefits to be paid upon retirement to Trustees over a period of time based on the number of years of service. The Fund may have certain former Trustees who also participate in a retirement plan and receive benefits under such plan. “Trustees’ and Officers’ Fees and Benefits” include amounts accrued by the Fund to fund such retirement benefits. Obligations under the deferred compensation and retirement plans represent unsecured claims against the general assets of the Fund.
During the year ended December 31, 2011, the Fund paid legal fees of $1,451 for services rendered by Kramer, Levin, Naftalis & Frankel LLP as counsel to the Independent Trustees. A partner of that firm is a Trustee of the Trust.
NOTE 6—Cash Balances
The Fund is permitted to temporarily carry a negative or overdrawn balance in its account with State Street Bank and Trust Company, the custodian bank. To compensate the custodian bank for such overdrafts, the overdrawn Fund may either (1) leave funds as a compensating balance in the account so the custodian bank can be compensated by earning the additional interest; or (2) compensate by paying the custodian bank at a rate agreed upon by the custodian bank and Invesco, not to exceed the contractually agreed upon rate.
NOTE 7—Distributions to Shareholders and Tax Components of Net Assets
There were no ordinary income or long-term capital gain distributions paid during the years ended December 31, 2011 and 2010.
Tax Components of Net Assets at Period-End:
| | | | | |
| | | 2011 |
| |
| Net unrealized appreciation — investments | | $ | 45,530,560 | |
| |
| Temporary book/tax differences | | | (42,206 | ) |
| |
| Capital loss carryforward | | | (19,734,963 | ) |
| |
| Shares of beneficial interest | | | 246,224,560 | |
| |
| Total net assets | | $ | 271,977,951 | |
| |
The difference between book-basis and tax-basis unrealized appreciation (depreciation) is due to differences in the timing of recognition of gains and losses on investments for tax and book purposes. The Fund’s net unrealized appreciation difference is attributable primarily to wash sales.
The temporary book/tax differences are a result of timing differences between book and tax recognition of income and/or expenses. The Fund’s temporary book/tax differences are the result of the trustee deferral of compensation and retirement plan benefits.
Capital loss carryforward is calculated and reported as of a specific date. Results of transactions and other activity after that date may affect the amount of capital loss carryforward actually available for the Fund to utilize. The Regulated Investment Company Modernization Act of 2010 (the “Act”) eliminated the eight-year carryover period for capital losses that arise in taxable years beginning after its enactment date of December 22, 2010. Consequently, these capital losses can be carried forward for an unlimited period. However, capital losses with an expiration period may not be used to offset capital gains until all net capital losses without an expiration date have been utilized. Additionally, post-enactment capital loss carryovers will retain their character as either short-term or long-term capital losses instead of as short-term capital losses as under prior law. The ability to utilize capital loss carryforward in the future may be limited under the Internal Revenue Code and related regulations based on the results of future transactions.
The Fund utilized $16,266,395 of capital loss carryforward in the current period to offset net realized capital gain for federal income tax purposes. The Fund has a capital loss carryforward as of December 31, 2011, which expires as follows:
| | | | | | | | | | | | | |
| Capital Loss Carryforward* |
| Expiration | | Short-Term | | Long-Term | | Total |
| |
| December 31, 2017 | | $ | 18,687,986 | | | $ | — | | | $ | 18,687,986 | |
| |
| December 31, 2018 | | | 1,046,977 | | | | — | | | | 1,046,977 | |
| |
| | | $ | 19,734,963 | | | $ | — | | | $ | 19,734,963 | |
| |
| |
| * | Capital loss carryforward as of the date listed above is reduced for limitations, if any, to the extent required by the Internal Revenue Code. |
Invesco V.I. Small Cap Equity Fund
NOTE 8—Investment Securities
The aggregate amount of investment securities (other than short-term securities, U.S. Treasury obligations and money market funds, if any) purchased and sold by the Fund during the year ended December 31, 2011 was $189,631,979 and $164,958,812, respectively. Cost of investments on a tax basis includes the adjustments for financial reporting purposes as of the most recently completed Federal income tax reporting period-end.
| | | | | |
| Unrealized Appreciation (Depreciation) of Investment Securities on a Tax Basis |
| |
| Aggregate unrealized appreciation of investment securities | | $ | 58,584,214 | |
| |
| Aggregate unrealized (depreciation) of investment securities | | | (13,053,654 | ) |
| |
| Net unrealized appreciation of investment securities | | $ | 45,530,560 | |
| |
| Cost of investments for tax purposes is $237,037,737. |
NOTE 9—Reclassification of Permanent Differences
Primarily as a result of differing book/tax treatment of foreign currency transactions and net operating losses, on December 31, 2011, undistributed net investment income (loss) was increased by $909,891, undistributed net realized gain (loss) was decreased by $3,938 and shares of beneficial interest decreased by $905,953. This reclassification had no effect on the net assets of the Fund.
NOTE 10—Share Information
| | | | | | | | | | | | | | | | | |
| | | Summary of Share Activity |
| |
| | | Years ended December 31, |
| | | 2011(a) | | 2010 |
| | | Shares | | Amount | | Shares | | Amount |
| |
| Sold: | | | | | | | | | | | | | | | | |
| | | | | | | | | | | | | | | | | |
| Series I | | | 5,397,940 | | | $ | 93,914,705 | | | | 4,244,898 | | | $ | 60,143,350 | |
| |
| Series II | | | 2,436,175 | | | | 41,035,453 | | | | 1,189,752 | | | | 16,471,236 | |
| |
| Reacquired: | | | | | | | | | | | | | | | | |
| | | | | | | | | | | | | | | | | |
| Series I | | | (5,523,283 | ) | | | (93,689,513 | ) | | | (4,793,630 | ) | | | (65,961,100 | ) |
| |
| Series II | | | (1,111,430 | ) | | | (18,749,133 | ) | | | (227,279 | ) | | | (3,141,816 | ) |
| |
| Net increase in share activity | | | 1,199,402 | | | $ | 22,511,512 | | | | 413,741 | | | $ | 7,511,670 | |
| |
| | |
| (a) | | There are entities that are record owners of more than 5% of the outstanding shares of the Fund and in the aggregate own 69% of the outstanding shares of the Fund. The Fund and the Fund’s principal underwriter or adviser, are parties to participation agreements with these entities whereby these entities sell units of interest in separate accounts funding variable products that are invested in the Fund. The Fund, Invesco and/or Invesco affiliates may make payments to these entities, which are considered to be related to the Fund, for providing services to the Fund, Invesco and/or Invesco affiliates including but not limited to services such as, securities brokerage, third party record keeping and account servicing and administrative services. The Fund has no knowledge as to whether all or any portion of the shares owned of record by these entities are also owned beneficially. |
Invesco V.I. Small Cap Equity Fund
NOTE 11—Financial Highlights
The following schedule presents financial highlights for a share of the Fund outstanding throughout the periods indicated.
| | | | | | | | | | | | | | | | | | | | | | | | | | | | | | | | | | | | | | | | | | | | | | | | | | | | | | | | | |
| | | | | | | | | | | | | | | | | | | | | | | Ratio of
| | Ratio of
| | | | |
| | | | | | | Net gains
| | | | | | | | | | | | | | | | expenses
| | expenses
| | | | |
| | | | | | | (losses) on
| | | | | | | | | | | | | | | | to average
| | to average net
| | Ratio of net
| | |
| | | Net asset
| | Net
| | securities
| | | | Dividends
| | Distributions
| | | | | | | | | | net assets
| | assets without
| | investment
| | |
| | | value,
| | investment
| | (both
| | Total from
| | from net
| | from net
| | | | Net asset
| | | | Net assets,
| | with fee waivers
| | fee waivers
| | income (loss)
| | |
| | | beginning
| | income
| | realized and
| | investment
| | investment
| | realized
| | Total
| | value, end
| | Total
| | end of period
| | and/or expenses
| | and/or expenses
| | to average
| | Portfolio
|
| | | of period | | (loss)(a) | | unrealized) | | operations | | income | | gains | | Distributions | | of period | | Return(b) | | (000s omitted) | | absorbed | | absorbed | | net assets | | turnover(c) |
| |
| Series I |
| Year ended 12/31/11 | | $ | 16.53 | | | $ | (0.05 | ) | | $ | (0.07 | ) | | $ | (0.12 | ) | | $ | — | | | $ | — | | | $ | — | | | $ | 16.41 | | | | (0.73 | )% | | $ | 217,287 | | | | 1.06 | %(d) | | | 1.06 | %(d) | | | (0.27 | )%(d) | | | 61 | % |
| Year ended 12/31/10 | | | 12.86 | | | | (0.02 | ) | | | 3.69 | | | | 3.67 | | | | — | | | | — | | | | — | | | | 16.53 | | | | 28.54 | | | | 220,925 | | | | 1.07 | | | | 1.07 | | | | (0.11 | ) | | | 46 | |
| Year ended 12/31/09 | | | 10.62 | | | | (0.00 | ) | | | 2.26 | | | | 2.26 | | | | (0.02 | ) | | | — | | | | (0.02 | ) | | | 12.86 | | | | 21.29 | | | | 178,949 | | | | 1.09 | | | | 1.09 | | | | (0.01 | ) | | | 46 | |
| Year ended 12/31/08 | | | 15.53 | | | | 0.02 | | | | (4.88 | ) | | | (4.86 | ) | | | — | | | | (0.05 | ) | | | (0.05 | ) | | | 10.62 | | | | (31.31 | ) | | | 152,310 | | | | 1.09 | | | | 1.09 | | | | 0.16 | | | | 55 | |
| Year ended 12/31/07 | | | 15.19 | | | | (0.01 | ) | | | 0.81 | | | | 0.80 | | | | (0.01 | ) | | | (0.45 | ) | | | (0.46 | ) | | | 15.53 | | | | 5.19 | | | | 168,286 | | | | 1.12 | | | | 1.15 | | | | (0.07 | ) | | | 45 | |
| |
| Series II |
| Year ended 12/31/11 | | | 16.27 | | | | (0.09 | ) | | | (0.07 | ) | | | (0.16 | ) | | | — | | | | — | | | | — | | | | 16.11 | | | | (0.98 | ) | | | 54,691 | | | | 1.31 | (d) | | | 1.31 | (d) | | | (0.52 | )(d) | | | 61 | |
| Year ended 12/31/10 | | | 12.69 | | | | (0.05 | ) | | | 3.63 | | | | 3.58 | | | | — | | | | — | | | | — | | | | 16.27 | | | | 28.21 | | | | 33,670 | | | | 1.32 | | | | 1.32 | | | | (0.36 | ) | | | 46 | |
| Year ended 12/31/09 | | | 10.51 | | | | (0.03 | ) | | | 2.23 | | | | 2.20 | | | | (0.02 | ) | | | — | | | | (0.02 | ) | | | 12.69 | | | | 20.90 | | | | 14,048 | | | | 1.34 | | | | 1.34 | | | | (0.26 | ) | | | 46 | |
| Year ended 12/31/08 | | | 15.39 | | | | (0.00 | ) | | | (4.83 | ) | | | (4.83 | ) | | | — | | | | (0.05 | ) | | | (0.05 | ) | | | 10.51 | | | | (31.40 | ) | | | 5,557 | | | | 1.34 | | | | 1.34 | | | | (0.09 | ) | | | 55 | |
| Year ended 12/31/07 | | | 15.10 | | | | (0.05 | ) | | | 0.79 | | | | 0.74 | | | | — | | | | (0.45 | ) | | | (0.45 | ) | | | 15.39 | | | | 4.84 | | | | 32 | | | | 1.37 | | | | 1.40 | | | | (0.32 | ) | | | 45 | |
| |
| | |
| (a) | | Calculated using average shares outstanding. |
| (b) | | Includes adjustments in accordance with accounting principles generally accepted in the United States of America and as such, the net asset value for financial reporting purposes and the returns based upon those net asset values may differ from the net asset value and returns for shareholder transactions. Total returns are not annualized for periods less than one year, if applicable, and do not reflect charges assessed in connection with a variable product, which if included would reduce total returns. |
| (c) | | Portfolio turnover is calculated at the fund level and is not annualized for periods less than one year, if applicable. For the period ending December 31, 2007, the portfolio turnover calculation excludes the value of securities purchased of $17,709,035 and sold of $19,432,514 in the effort to realign the Fund’s portfolio holdings after the reorganization of AIM V.I. Small Cap Growth Fund into the Fund. |
| (d) | | Ratios are based on average daily net assets (000’s) of $232,298, and $44,810 for Series I and Series II shares, respectively. |
Invesco V.I. Small Cap Equity Fund
Report of Independent Registered Public Accounting Firm
To the Board of Trustees of AIM Variable Insurance Funds (Invesco Variable Insurance Funds)
and Shareholders of Invesco V.I. Small Cap Equity Fund:
In our opinion, the accompanying statement of assets and liabilities, including the schedule of investments, and the related statements of operations and of changes in net assets and the financial highlights present fairly, in all material respects, the financial position of Invesco V.I. Small Cap Equity Fund (one of the funds constituting AIM Variable Insurance Funds (Invesco Variable Insurance Funds), hereafter referred to as the “Fund”) at December 31, 2011, the results of its operations for the year then ended, the changes in its net assets for each of the two years in the period then ended and the financial highlights for each of the five years in the period then ended, in conformity with accounting principles generally accepted in the United States of America. These financial statements and financial highlights (hereafter referred to as “financial statements”) are the responsibility of the Fund’s management; our responsibility is to express an opinion on these financial statements based on our audits. We conducted our audits of these financial statements in accordance with the standards of the Public Company Accounting Oversight Board (United States). Those standards require that we plan and perform the audits to obtain reasonable assurance. An audit includes examining, on a test basis, evidence supporting the amounts and disclosures in the financial statements, assessing the accounting principles used and significant estimates made by management, and evaluating the overall financial statement presentation. We believe that our audits, which included confirmation of securities at December 31, 2011 by correspondence with the custodian and brokers, provide a reasonable basis for our opinion.
PRICEWATERHOUSECOOPERS LLP
February 14, 2012
Houston, Texas
Invesco V.I. Small Cap Equity Fund
Calculating your ongoing Fund expenses
Example
As a shareholder of the Fund, you incur ongoing costs, including management fees; distribution and/or service fees (12b-1); and other Fund expenses. This example is intended to help you understand your ongoing costs (in dollars) of investing in the Fund and to compare these costs with ongoing costs of investing in other mutual funds. The example is based on an investment of $1,000 invested at the beginning of the period and held for the entire period July 1, 2011 through December 31, 2011.
The actual and hypothetical expenses in the examples below do not represent the effect of any fees or other expenses assessed in connection with a variable product; if they did, the expenses shown would be higher while the ending account values shown would be lower.
Actual expenses
The table below provides information about actual account values and actual expenses. You may use the information in this table, together with the amount you invested, to estimate the expenses that you paid over the period. Simply divide your account value by $1,000 (for example, an $8,600 account value divided by $1,000 = 8.6), then multiply the result by the number in the table under the heading entitled “Actual Expenses Paid During Period” to estimate the expenses you paid on your account during this period.
Hypothetical example for comparison purposes
The table below also provides information about hypothetical account values and hypothetical expenses based on the Fund’s actual expense ratio and an assumed rate of return of 5% per year before expenses, which is not the Fund’s actual return.
The hypothetical account values and expenses may not be used to estimate the actual ending account balance or expenses you paid for the period. You may use this information to compare the ongoing costs of investing in the Fund and other funds. To do so, compare this 5% hypothetical example with the 5% hypothetical examples that appear in the shareholder reports of the other funds.
Please note that the expenses shown in the table are meant to highlight your ongoing costs. Therefore, the hypothetical information is useful in comparing ongoing costs, and will not help you determine the relative total costs of owning different funds.
| | | | | | | | | | | | | | | | | | | | | | | | | | | | | | | |
| | | | | | | | | | HYPOTHETICAL
| | | |
| | | | | | | ACTUAL | | | (5% annual return before expenses) | | | |
| | | | Beginning
| | | Ending
| | | Expenses
| | | Ending
| | | Expenses
| | | Annualized
|
| | | | Account Value
| | | Account Value
| | | Paid During
| | | Account Value
| | | Paid During
| | | Expense
|
| Class | | | (07/01/11) | | | (12/31/11)1 | | | Period2 | | | (12/31/11) | | | Period2 | | | Ratio |
| Series I | | | $ | 1,000.00 | | | | $ | 898.70 | | | | $ | 5.07 | | | | $ | 1,019.86 | | | | $ | 5.40 | | | | | 1.06 | % |
| | | | | | | | | | | | | | | | | | | | | | | | | | | | | | | |
| Series II | | | | 1,000.00 | | | | | 897.50 | | | | | 6.27 | | | | | 1,018.60 | | | | | 6.67 | | | | | 1.31 | |
| | | | | | | | | | | | | | | | | | | | | | | | | | | | | | | |
| |
| 1 | The actual ending account value is based on the actual total return of the Fund for the period July 1, 2011 through December 31, 2011, after actual expenses and will differ from the hypothetical ending account value which is based on the Fund’s expense ratio and a hypothetical annual return of 5% before expenses. |
| 2 | Expenses are equal to the Fund’s annualized expense ratio as indicated above multiplied by the average account value over the period, multiplied by 184/365 to reflect the most recent fiscal half year. |
Invesco V.I. Small Cap Equity Fund
The address of each trustee and officer is AIM Variable Insurance Funds (Invesco Variable Insurance Funds) (the “Trust”), 11 Greenway Plaza, Suite 2500, Houston, Texas 77046-1173. The trustees serve for the life of the Trust, subject to their earlier death, incapacitation, resignation, retirement or removal as more specifically provided in the Trust’s organizational documents. Each officer serves for a one year term or until their successors are elected and qualified. Column two below includes length of time served with predecessor entities, if any.
| | | | | | | | | |
| | | | | | | Number of Funds
| | |
Name, Year of Birth and
| | Trustee and/
| | Principal Occupation(s)
| | in Fund Complex
| | Other Directorship(s)
|
| Position(s) Held with the Trust | | or Officer Since | | During Past 5 Years | | Overseen by Trustee | | Held by Trustee |
| | | | | | | | | |
| | | | | | | | | |
| | | | | | | | | |
| Interested Persons | | | | | | | | |
| | | | | | | | | |
| | | | | | | | | |
| | | | | | | | | |
Martin L. Flanagan1 — 1960
Trustee | | 2007 | | Executive Director, Chief Executive Officer and President, Invesco Ltd. (ultimate parent of Invesco and a global investment management firm); Advisor to the Board, Invesco Advisers, Inc. (formerly known as Invesco Institutional (N.A.), Inc.); Trustee, The Invesco Funds; Vice Chair, Investment Company Institute; and Member of Executive Board, SMU Cox School of Business
Formerly: Chairman, Invesco Advisers, Inc. (registered investment adviser); Director, Chairman, Chief Executive Officer and President, IVZ Inc. (holding company), INVESCO Group Services, Inc. (service provider) and Invesco North American Holdings, Inc. (holding company); Director, Chief Executive Officer and President, Invesco Holding Company Limited (parent of Invesco and a global investment management firm); Director, Invesco Ltd.; Chairman, Investment Company Institute and President, Co-Chief Executive Officer, Co-President, Chief Operating Officer and Chief Financial Officer, Franklin Resources, Inc. (global investment management organization) | | 140 | | None |
| | | | | | | | | |
| | | | | | | | | |
| | | | | | | | | |
Philip A. Taylor2 — 1954
Trustee, President and Principal Executive Officer | | 2006 | | Head of North American Retail and Senior Managing Director, Invesco Ltd.; Director, Co-Chairman, Co-President and Co-Chief Executive Officer, Invesco Advisers, Inc. (formerly known as Invesco Institutional (N.A.), Inc.) (registered investment adviser); Director, Chairman, Chief Executive Officer and President, Invesco Management Group, Inc. (formerly Invesco Aim Management Group, Inc.) (financial services holding company); Director and President, INVESCO Funds Group, Inc. (registered investment adviser and registered transfer agent); Director and Chairman, Invesco Investment Services, Inc. (formerly known as Invesco Aim Investment Services, Inc.) (registered transfer agent) and IVZ Distributors, Inc. (formerly known as INVESCO Distributors, Inc.) (registered broker dealer); Director, President and Chairman, Invesco Inc. (holding company) and Invesco Canada Holdings Inc. (holding company); Chief Executive Officer, Invesco Corporate Class Inc. (corporate mutual fund company) and Invesco Canada Fund Inc. (corporate mutual fund company); Director, Chairman and Chief Executive Officer, Invesco Canada Ltd. (formerly known as Invesco Trimark Ltd./Invesco Trimark Ltèe) (registered investment adviser and registered transfer agent); Trustee, President and Principal Executive Officer, The Invesco Funds (other than AIM Treasurer’s Series Trust (Invesco Treasurer’s Series Trust) and Short-Term Investments Trust); Trustee and Executive Vice President, The Invesco Funds (AIM Treasurer’s Series Trust (Invesco Treasurer’s Series Trust) and Short-Term Investments Trust only); Director, Invesco Investment Advisers LLC (formerly known as Van Kampen Asset Management); Director, Chief Executive Officer and President, Van Kampen Exchange Corp. | | 140 | | None |
| | | | | | | | | |
| | | | | | | | | |
| | | | | Formerly: Director and Chairman, Van Kampen Investor Services Inc.: Director, Chief Executive Officer and President, 1371 Preferred Inc. (holding company); and Van Kampen Investments Inc.; Director and President, AIM GP Canada Inc. (general partner for limited partnerships); and Van Kampen Advisors, Inc.; Director and Chief Executive Officer, Invesco Trimark Dealer Inc. (registered broker dealer); Director, Invesco Distributors, Inc. (formerly known as Invesco Aim Distributors, Inc.) (registered broker dealer); Manager, Invesco PowerShares Capital Management LLC; Director, Chief Executive Officer and President, Invesco Advisers, Inc.; Director, Chairman, Chief Executive Officer and President, Invesco Aim Capital Management, Inc.; President, Invesco Trimark Dealer Inc. and Invesco Trimark Ltd./Invesco Trimark Ltèe; Director and President, AIM Trimark Corporate Class Inc. and AIM Trimark Canada Fund Inc.; Senior Managing Director, Invesco Holding Company Limited; Trustee and Executive Vice President, Tax-Free Investments Trust; Director and Chairman, Fund Management Company (former registered broker dealer); President and Principal Executive Officer, The Invesco Funds (AIM Treasurer’s Series Trust (Invesco Treasurer’s Series Trust), Short-Term Investments Trust and Tax-Free Investments Trust only); President, AIM Trimark Global Fund Inc. and AIM Trimark Canada Fund Inc. | | | | |
| | | | | | | | | |
| | | | | | | | | |
| | | | | | | | | |
Wayne W. Whalen3 — 1939
Trustee | | 2010 | | Of Counsel, and prior to 2010, partner in the law firm of Skadden, Arps, Slate, Meagher & Flom LLP, legal counsel to funds in the Fund Complex | | 158 | | Director of the Abraham Lincoln Presidential Library Foundation |
| | | | | | | | | |
| | | | | | | | | |
| | | | | | | | | |
| Independent Trustees | | | | | | | | |
| | | | | | | | | |
| | | | | | | | | |
| | | | | | | | | |
Bruce L. Crockett — 1944
Trustee and Chair | | 1993 | | Chairman, Crockett Technology Associates (technology consulting company) | | 140 | | ACE Limited (insurance company); and Investment Company Institute |
| | | | | Formerly: Director, Captaris (unified messaging provider); Director, President and Chief Executive Officer COMSAT Corporation; and Chairman, Board of Governors of INTELSAT (international communications company) | | | | |
| | | | | | | | | |
| |
| 1 | Mr. Flanagan is considered an interested person of the Trust because he is an officer of the adviser to the Trust, and an officer and a director of Invesco Ltd., ultimate parent of the adviser to the Trust. |
| 2 | Mr. Taylor is considered an interested person of the Trust because he is an officer and a director of the adviser to, and a director of the principal underwriter of, the Trust. |
| 3 | Mr. Whalen is considered an “interested person” (within the meaning of Section 2(a)(19) of the 1940 Act) of certain Funds in the Fund Complex by reason of he and his firm currently providing legal services as legal counsel to such Funds in the Fund Complex. |
Invesco V.I. Small Cap Equity Fund
Trustees and Officers—(continued)
The address of each trustee and officer is AIM Variable Insurance Funds (Invesco Variable Insurance Funds) (the “Trust”), 11 Greenway Plaza, Suite 2500, Houston, Texas 77046-1173. The trustees serve for the life of the Trust, subject to their earlier death, incapacitation, resignation, retirement or removal as more specifically provided in the Trust’s organizational documents. Each officer serves for a one year term or until their successors are elected and qualified. Column two below includes length of time served with predecessor entities, if any.
| | | | | | | | | |
| | | | | | | Number of Funds
| | |
Name, Year of Birth and
| | Trustee and/
| | Principal Occupation(s)
| | in Fund Complex
| | Other Directorship(s)
|
| Position(s) Held with the Trust | | or Officer Since | | During Past 5 Years | | Overseen by Trustee | | Held by Trustee |
| | | | | | | | | |
| | | | | | | | | |
| | | | | | | |
Independent Trustees—(continued) | | | | | | |
| | | | | | | | | |
| | | | | | | | | |
| | | | | | | | | |
David C. Arch — 1945
Trustee | | 2010 | | Chairman and Chief Executive Officer of Blistex Inc., a consumer health care products manufacturer. | | 158 | | Member of the Heartland Alliance Advisory Board, a nonprofit organization serving human needs based in Chicago. Board member of the Illinois Manufacturers’ Association. Member of the Board of Visitors, Institute for the Humanities, University of Michigan |
| | | | | | | | | |
| | | | | | | | | |
| | | | | | | | | |
Frank S. Bayley — 1939
Trustee | | 2001 | | Retired
Formerly: Director, Badgley Funds, Inc. (registered investment company) (2 portfolios) and Partner, law firm of Baker & McKenzie
Formerly: Director, Badgley Funds, Inc. (registered investment company) (2 portfolios) and Partner, law firm of Baker & McKenzie | | 140 | | Director and Chairman, C.D. Stimson Company (a real estate investment company) |
| | | | | | | | | |
| | | | | | | | | |
| | | | | | | | | |
James T. Bunch — 1942
Trustee | | 2004 | | Managing Member, Grumman Hill Group LLC (family office private equity management)
Formerly: Founder, Green, Manning & Bunch Ltd. (investment banking firm)(1988-2010); Executive Committee, United States Golf Association; and Director, Policy Studies, Inc. and Van Gilder Insurance Corporation | | 140 | | Vice Chairman, Board of Governors, Western Golf Association/Evans Scholars Foundation and Director, Denver Film Society |
| | | | | | | | | |
| | | | | | | | | |
| | | | | | | | | |
Rodney F. Dammeyer — 1940
Trustee | | 2010 | | President of CAC, LLC, a private company offering capital investment and management advisory services.
Formerly: Prior to January 2004, Director of TeleTech Holdings Inc.; Prior to 2002, Director of Arris Group, Inc.; Prior to 2001, Managing Partner at Equity Group Corporate Investments. Prior to 1995, Vice Chairman of Anixter International. Prior to 1985, experience includes Senior Vice President and Chief Financial Officer of Household International, Inc., Executive Vice President and Chief Financial Officer of Northwest Industries, Inc. and Partner of Arthur Andersen & Co. | | 158 | | Director of Quidel Corporation and Stericycle, Inc. Prior to May 2008, Trustee of The Scripps Research Institute. Prior to February 2008, Director of Ventana Medical Systems, Inc. Prior to April 2007, Director of GATX Corporation. Prior to April 2004, Director of TheraSense, Inc. |
| | | | | | | | | |
| | | | | | | | | |
| | | | | | | | | |
Albert R. Dowden — 1941
Trustee | | 2000 | | Director of a number of public and private business corporations, including the Boss Group, Ltd. (private investment and management); Reich & Tang Funds (5 portfolios) (registered investment company); and Homeowners of America Holding Corporation/ Homeowners of America Insurance Company (property casualty company)
Formerly: Director, Continental Energy Services, LLC (oil and gas pipeline service); Director, CompuDyne Corporation (provider of product and services to the public security market) and Director, Annuity and Life Re (Holdings), Ltd. (reinsurance company); Director, President and Chief Executive Officer, Volvo Group North America, Inc.; Senior Vice President, AB Volvo; Director of various public and private corporations; Chairman, DHJ Media, Inc.; Director Magellan Insurance Company; and Director, The Hertz Corporation, Genmar Corporation (boat manufacturer), National Media Corporation; Advisory Board of Rotary Power International (designer, manufacturer, and seller of rotary power engines); and Chairman, Cortland Trust, Inc. (registered investment company) | | 140 | | Board of Nature’s Sunshine Products, Inc. |
| | | | | | | | | |
| | | | | | | | | |
| | | | | | | | | |
Jack M. Fields — 1952
Trustee | | 1997 | | Chief Executive Officer, Twenty First Century Group, Inc. (government affairs company); and Owner and Chief Executive Officer, Dos Angelos Ranch, L.P. (cattle, hunting, corporate entertainment), Discovery Global Education Fund (non-profit) and Cross Timbers Quail Research Ranch (non-profit)
Formerly: Chief Executive Officer, Texana Timber LP (sustainable forestry company) and member of the U.S. House of Representatives | | 140 | | Administaff |
| | | | | | | | | |
| | | | | | | | | |
| | | | | | | | | |
Carl Frischling — 1937
Trustee | | 1993 | | Partner, law firm of Kramer Levin Naftalis and Frankel LLP | | 140 | | Director, Reich & Tang Funds (16 portfolios) |
| | | | | | | | | |
| | | | | | | | | |
Invesco V.I. Small Cap Equity Fund
Trustees and Officers—(continued)
The address of each trustee and officer is AIM Variable Insurance Funds (Invesco Variable Insurance Funds) (the “Trust”), 11 Greenway Plaza, Suite 2500, Houston, Texas 77046-1173. The trustees serve for the life of the Trust, subject to their earlier death, incapacitation, resignation, retirement or removal as more specifically provided in the Trust’s organizational documents. Each officer serves for a one year term or until their successors are elected and qualified. Column two below includes length of time served with predecessor entities, if any.
| | | | | | | | | |
| | | | | | | Number of Funds
| | |
Name, Year of Birth and
| | Trustee and/
| | Principal Occupation(s)
| | in Fund Complex
| | Other Directorship(s)
|
| Position(s) Held with the Trust | | or Officer Since | | During Past 5 Years | | Overseen by Trustee | | Held by Trustee |
Independent Trustees—(continued) | | | | | | |
| | | | | | | | | |
| | | | | | | | | |
| | | | | | | | | |
Prema Mathai-Davis — 1950
Trustee | | 1998 | | Retired
Formerly: Chief Executive Officer, YWCA of the U.S.A. | | 140 | | None |
| | | | | | | | | |
| | | | | | | | | |
| | | | | | | | | |
Larry Soll — 1942
Trustee | | 2004 | | Retired
Formerly, Chairman, Chief Executive Officer and President, Synergen Corp. (a biotechnology company) | | 140 | | None |
| | | | | | | | | |
| | | | | | | | | |
| | | | | | | | | |
Hugo F. Sonnenschein — 1940
Trustee | | 2010 | | President Emeritus and Honorary Trustee of the University of Chicago and the Adam Smith Distinguished Service Professor in the Department of Economics at the University of Chicago. Prior to July 2000, President of the University of Chicago. | | 158 | | Trustee of the University of Rochester and a member of its investment committee. Member of the National Academy of Sciences, the American Philosophical Society and a fellow of the American Academy of Arts and Sciences |
| | | | | | | | | |
| | | | | | | | | |
| | | | | | | | | |
| Raymond Stickel, Jr. — 1944 Trustee | | 2005 | | Retired
Formerly: Director, Mainstay VP Series Funds, Inc. (25 portfolios) and Partner, Deloitte & Touche | | 140 | | None |
| | | | | | | | | |
| | | | | | | | | |
| | | | | | | | | |
| Other Officers | | | | | | | | |
| | | | | | | | | |
| | | | | | | | | |
| | | | | | | | | |
Russell C. Burk — 1958
Senior Vice President and Senior Officer | | 2005 | | Senior Vice President and Senior Officer, The Invesco Funds | | N/A | | N/A |
| | | | | | | | | |
| | | | | | | | | |
| | | | | | | | | |
John M. Zerr — 1962
Senior Vice President, Chief Legal Officer and Secretary | | 2006 | | Director, Senior Vice President, Secretary and General Counsel, Invesco Management Group, Inc. (formerly known as Invesco Aim Management Group, Inc.) and Van Kampen Exchange Corp.; Senior Vice President, Invesco Advisers, Inc. (formerly known as Invesco Institutional (N.A.), Inc.) (registered investment adviser); Senior Vice President and Secretary, Invesco Distributors, Inc. (formerly known as Invesco Aim Distributors, Inc.); Director, Vice President and Secretary, Invesco Investment Services, Inc. (formerly known as Invesco Aim Investment Services, Inc.) and IVZ Distributors, Inc. (formerly known as INVESCO Distributors, Inc.); Director and Vice President, INVESCO Funds Group, Inc.; Senior Vice President, Chief Legal Officer and Secretary, The Invesco Funds; Manager, Invesco PowerShares Capital Management LLC; Director, Secretary and General Counsel, Invesco Investment Advisers LLC (formerly known as Van Kampen Asset Management); Secretary and General Counsel, Van Kampen Funds Inc. and Chief Legal Officer, PowerShares Exchange-Traded Fund Trust, PowerShares Exchange-Traded Fund Trust II, PowerShares India Exchange-Traded Fund Trust and PowerShares Actively Managed Exchange-Traded Fund Trust
Formerly: Director and Secretary, Van Kampen Advisors Inc.; Director Vice President, Secretary and General Counsel Van Kampen Investor Services Inc.; Director, Invesco Distributors, Inc. (formerly known as Invesco Aim Distributors, Inc.); Director, Senior Vice President, General Counsel and Secretary, Invesco Advisers, Inc.; and Van Kampen Investments Inc.; Director, Vice President and Secretary, Fund Management Company; Director, Senior Vice President, Secretary, General Counsel and Vice President, Invesco Aim Capital Management, Inc.; Chief Operating Officer and General Counsel, Liberty Ridge Capital, Inc. (an investment adviser); Vice President and Secretary, PBHG Funds (an investment company) and PBHG Insurance Series Fund (an investment company); Chief Operating Officer, General Counsel and Secretary, Old Mutual Investment Partners (a broker-dealer); General Counsel and Secretary, Old Mutual Fund Services (an administrator) and Old Mutual Shareholder Services (a shareholder servicing center); Executive Vice President, General Counsel and Secretary, Old Mutual Capital, Inc. (an investment adviser); and Vice President and Secretary, Old Mutual Advisors Funds (an investment company) | | N/A | | N/A |
| | | | | | | | | |
| | | | | | | | | |
| | | | | | | | | |
Lisa O. Brinkley — 1959
Vice President | | 2004 | | Global Compliance Director, Invesco Ltd.; Chief Compliance Officer, Invesco Investment Services, Inc.(formerly known as Invesco Aim Investment Services, Inc.); and Vice President, The Invesco Funds
Formerly: Chief Compliance Officer, Invesco Distributors, Inc. (formerly known as Invesco Aim Distributors, Inc.) and Van Kampen Investor Services Inc.; Senior Vice President, Invesco Management Group, Inc.; Senior Vice President and Chief Compliance Officer, Invesco Advisers, Inc. and The Invesco Funds; Vice President and Chief Compliance Officer, Invesco Aim Capital Management, Inc. and Invesco Distributors, Inc.; Vice President, Invesco Investment Services, Inc. and Fund Management Company | | N/A | | N/A |
| | | | | | | | | |
Invesco V.I. Small Cap Equity Fund
Trustees and Officers—(continued)
The address of each trustee and officer is AIM Variable Insurance Funds (Invesco Variable Insurance Funds) (the “Trust”), 11 Greenway Plaza, Suite 2500, Houston, Texas 77046-1173. The trustees serve for the life of the Trust, subject to their earlier death, incapacitation, resignation, retirement or removal as more specifically provided in the Trust’s organizational documents. Each officer serves for a one year term or until their successors are elected and qualified. Column two below includes length of time served with predecessor entities, if any.
| | | | | | | | | |
| | | | | | | Number of Funds
| | |
Name, Year of Birth and
| | Trustee and/
| | Principal Occupation(s)
| | in Fund Complex
| | Other Directorship(s)
|
| Position(s) Held with the Trust | | or Officer Since | | During Past 5 Years | | Overseen by Trustee | | Held by Trustee |
Other Officers—(continued) | | | | | | |
| | | | | | | | | |
| | | | | | | | | |
| | | | | | | | | |
Sheri Morris — 1964
Vice President, Treasurer and Principal Financial Officer | | 1999 | | Vice President, Treasurer and Principal Financial Officer, The Invesco Funds; Vice President, Invesco Advisers, Inc. (formerly known as Invesco Institutional (N.A.), Inc.) (registered investment adviser).
Formerly: Treasurer, PowerShares Exchange-Traded Fund Trust, PowerShares Exchange-Traded Fund Trust II, PowerShares India Exchange-Traded Fund Trust and PowerShares Actively Managed Exchange-Traded Fund Trust, Vice President, Invesco Advisers, Inc., Invesco Aim Capital Management, Inc. and Invesco Aim Private Asset Management, Inc.; Assistant Vice President and Assistant Treasurer, The Invesco Funds and Assistant Vice President, Invesco Advisers, Inc., Invesco Aim Capital Management, Inc. and Invesco Aim Private Asset Management, Inc. | | N/A | | N/A |
| | | | | | | | | |
| | | | | | | | | |
| | | | | | | | | |
Karen Dunn Kelley — 1960
Vice President | | 1993 | | Head of Invesco’s World Wide Fixed Income and Cash Management Group; Senior Vice President, Invesco Management Group, Inc. (formerly known as Invesco Aim Management Group, Inc.) and Invesco Advisers, Inc. (formerly known as Invesco Institutional (N.A.), Inc.) (registered investment adviser); Executive Vice President, Invesco Distributors, Inc. (formerly known as Invesco Aim Distributors, Inc.); Director, Invesco Mortgage Capital Inc.; Vice President, The Invesco Funds (other than AIM Treasurer’s Series Trust (Invesco Treasurer’s Series Trust) and Short-Term Investments Trust); and President and Principal Executive Officer, The Invesco Funds (AIM Treasurer’s Series Trust (Invesco Treasurer’s Series Trust) and Short-Term Investments Trust only).
Formerly: Senior Vice President, Van Kampen Investments Inc.; Vice President, Invesco Advisers, Inc. (formerly known as Invesco Institutional (N.A.), Inc.); Director of Cash Management and Senior Vice President, Invesco Advisers, Inc. and Invesco Aim Capital Management, Inc.; President and Principal Executive Officer, Tax-Free Investments Trust; Director and President, Fund Management Company; Chief Cash Management Officer, Director of Cash Management, Senior Vice President, and Managing Director, Invesco Aim Capital Management, Inc.; Director of Cash Management, Senior Vice President, and Vice President, Invesco Advisers, Inc. and The Invesco Funds (AIM Treasurer’s Series Trust (Invesco Treasurer’s Series Trust), Short-Term Investments Trust and Tax-Free Investments Trust only) | | N/A | | N/A |
| | | | | | | | | |
| | | | | | | | | |
| | | | | | | | | |
Yinka Akinsola — 1977
Anti-Money Laundering Compliance Officer | | 2011 | | Anti-Money Laundering Compliance Officer, Invesco Advisers, Inc. (formerly known as Invesco Institutional (N.A.), Inc.) (registered investment adviser); Invesco Distributors, Inc. (formerly known as Invesco Aim Distributors, Inc.), Invesco Investment Services, Inc. (formerly known as Invesco Aim Investment Services, Inc.), Invesco Management Group, Inc., The Invesco Funds, Invesco Van Kampen Closed-End Funds, Van Kampen Exchange Corp. and Van Kampen Funds Inc. | | N/A | | N/A |
| | | | | | | | | |
| | | | | | | | | |
| | | | | | | | | |
Todd L. Spillane — 1958
Chief Compliance Officer | | 2006 | | Senior Vice President, Invesco Management Group, Inc. (formerly known as Invesco Aim Management Group, Inc.) and Van Kampen Exchange Corp.; Senior Vice President and Chief Compliance Officer, Invesco Advisers, Inc. (registered investment adviser) (formerly known as Invesco Institutional (N.A.), Inc.); Chief Compliance Officer, The Invesco Funds, INVESCO Private Capital Investments, Inc. (holding company) and Invesco Private Capital, Inc. (registered investment adviser); Vice President, Invesco Distributors, Inc. (formerly known as Invesco Aim Distributors, Inc.) and Invesco Investment Services, Inc. (formerly known as Invesco Aim Investment Services, Inc.).
Formerly: Chief Compliance Officer, Invesco Van Kampen Closed-End Funds PowerShares Exchange-Traded Fund Trust, PowerShares Exchange-Traded Fund Trust II, PowerShares India Exchange-Traded Fund Trust, and PowerShares Actively Managed Exchange-Traded Fund Trust; Senior Vice President, Van Kampen Investments Inc.; Senior Vice President and Chief Compliance Officer, Invesco Advisers, Inc. and Invesco Aim Capital Management, Inc.; Chief Compliance Officer, Invesco Global Asset Management (N.A.), Inc., Invesco Senior Secured Management, Inc. (registered investment adviser) and Van Kampen Investor Services Inc.; Vice President, Invesco Aim Capital Management, Inc. and Fund Management Company | | N/A | | N/A |
| | | | | | | | | |
The Statement of Additional Information of the Trust includes additional information about the Fund’s Trustees and is available upon request, without charge, by calling 1.800.959.4246. Please refer to the Fund’s prospectus for information on the Fund’s sub-advisers.
| | | | | | | |
Office of the Fund
11 Greenway Plaza, Suite 2500
Houston, TX 77046-1173 | | Investment Adviser
Invesco Advisers, Inc.
1555 Peachtree Street, N.E.
Atlanta, GA 30309 | | Distributor
Invesco Distributors, Inc.
11 Greenway Plaza, Suite 2500
Houston, TX 77046-1173 | | Auditors
PricewaterhouseCoopers LLP
1201 Louisiana Street, Suite 2900
Houston, TX 77002-5678 |
| | | | | | | |
| | | | | | | |
Counsel to the Fund
Stradley Ronon Stevens & Young, LLP
2600 One Commerce Square
Philadelphia, PA 19103 | | Counsel to the Independent Trustees
Kramer, Levin, Naftalis & Frankel LLP
1177 Avenue of the Americas
New York, NY 10036-2714 | | Transfer Agent
Invesco Investment Services, Inc.
11 Greenway Plaza, Suite 2500
Houston, TX77046-1173 | | Custodian
State Street Bank and Trust Company
225 Franklin
Boston, MA 02110-2801 |
Invesco V.I. Small Cap Equity Fund
Invesco V.I. Technology FundAnnual Report to Shareholders § December 31, 2011The Fund provides a complete list of its holdings four times in each fiscal year, at the quarter-ends. For the second and fourth quarters, the lists appear in the Fund’s semiannual and annual reports to shareholders. For the first and third quarters, the Fund files the lists with the Securities and Exchange Commission (SEC) on Form N-Q. The Fund’s Form N-Q filings are available on the SEC website, sec.gov. Copies of the Fund’s Forms N-Q may be reviewed and copied at the SEC Public Reference Room in Washington, D.C. You can obtain information on the operation of the Public Reference Room, including information about duplicating fee charges, by calling 202 551 8090 or 800 732 0330, or by electronic request at the following email address: publicinfo@sec.gov. The SEC file numbers for the Fund are 811-07452 and 033-57340. The Fund’s most recent portfolio holdings, as filed on Form N-Q, have also been made available to insurance companies issuing variable annuity contracts and variable life insurance policies (“variable products”) that invest in the Fund.
A description of the policies and procedures that the Fund uses to determine how to vote proxies relating to portfolio securities is available without charge, upon request, from our Client Services department at 800 959 4246 or at invesco.com/proxyguidelines. The information is also available on the SEC website, sec.gov.
Information regarding how the Fund voted proxies related to its portfolio securities during the 12 months ended June 30, 2011, is available at invesco.com/proxysearch. The information is also available on the SEC website, sec.gov.
Invesco Advisers, Inc. is an investment adviser; it provides investment advisory services to individual and institutional clients and does not sell securities. Invesco Distributors, Inc. is the U.S. distributor for Invesco Ltd.’s retail mutual funds, exchange-traded funds and institutional money market funds. Both are wholly owned, indirect subsidiaries of Invesco Ltd.
This report must be accompanied or preceded by a currently effective Fund prospectus and variable product prospectus, which contain more complete information, including sales charges and expenses. Investors should read each carefully before investing.
Invesco Distributors, Inc.
I-VITEC-AR-1
| | | | | | | | | |
|
| | | | | | | |
NOT FDIC INSURED | | | | MAY LOSE VALUE | | | | NO BANK GUARANTEE |
Management’s Discussion of Fund Performance
Performance summary
For the fiscal year ended December 31, 2011, equity markets were quite volatile, and investors generally favored less economically sensitive sectors. Invesco V.I. Technology Fund significantly outperformed its style-specific benchmark, the BofA Merrill Lynch 100 Technology Index, primarily due to the Fund’s security selection in the information technology services, computers and peripherals, and communications equipment industries.
Your Fund’s long-term performance appears later in this report.
Fund vs. Indexes
Total returns, 12/31/10 to 12/31/11, excluding variable product issuer charges.
If variable product issuer charges were included, returns would be lower.
| | | | | |
|
| Series I Shares | | | -5.05 | % |
| |
| Series II Shares | | | -5.32 | |
| |
S&P 500 Index▼ (Broad Market Index) | | | 2.09 | |
| |
BofA Merrill Lynch 100 Technology Index (price only)▼ (Style-Specific Index) | | | -12.27 | |
| |
Lipper VUF Science & Technology Funds Category Average▼ (Peer Group) | | | -6.50 | |
| |
How we invest
We seek to grow capital by investing in companies we believe generate sustainable, superior earnings and cash flow growth that is not fully reflected in investor expectations or equity valuations. The Fund emphasizes companies believed to have a strategic advantage over their competition and operating in industries believed to be beneficiaries of secular trends. The Fund invests in industries such as hardware, software, telecommunications equipment and services, semiconductors and service-related companies in the information technology (IT) sector. We use a research-oriented bottom-up investment approach focusing on company fundamentals and growth prospects.
We place great emphasis on companies exhibiting high returns on invested capital and generating free cash flow, metrics we believe are good indicators of financial health and growth potential. We seek companies with management teams that maintain high quality balance sheets and manageable debt levels. Valuation also plays a critical role in stock selection.
Risk management is an integral part of our portfolio construction process as we attempt to limit volatility and downside risk. Only stocks that exhibit a proper balance of risk and reward are chosen for inclusion in the portfolio. We seek to accomplish this goal by thoroughly understanding the key business drivers of companies in which we invest. The portfolio is constructed with the goal of holding a diversified portfolio of stocks we believe are best suited to capitalize on secular trends prevalent in the IT sector.
We may reduce or eliminate our holding in a stock when:
| n | | A stock’s price reaches its valuation target. |
| n | | A company’s fundamentals change or deteriorate. |
| |
| n | | It no longer meets our investment criteria. |
Market conditions and your Fund
Equity markets were highly volatile during the fiscal year as investors weighed the competing issues of improved corporate profits, soft macroeconomic data and sovereign debt issues in Europe. In the
U.S., corporate earnings increased, but often were overshadowed by concerns about high unemployment and a lack of consumer confidence. After generally rising through July, major equity indexes sold off precipitously in August as the U.S. received the first-ever downgrade to its credit rating from Standard & Poor’s, and while the sovereign debt crisis unfolded in the eurozone, prompting fears of a “double-dip” recession. Equity markets rebounded in the fourth quarter of 2011, despite a lack of meaningful resolutions to improve the global economy.
Major domestic equity indexes garnered positive returns for the fiscal year, and seven out of 10 sectors in the S&P 500 Index posted gains. Less economically sensitive sectors such as utilities, consumer staples and health care had the highest returns. Conversely, the financials, materials and industrials sectors were the market laggers and produced losses for the reporting period.
On an absolute basis, the Fund produced a loss for the fiscal year, following its strong absolute performance from the prior year, primarily as a result of losses in the semiconductors, software and communications equipment industries. Outperformance relative to the Fund’s style-specific index, however, was primarily attributable to security selection, with positive results also stemming from market allocation. Specifically, security selection in IT services, computers and peripherals and communications equipment contributed significantly to the Fund’s relative performance. In terms of market allocation, relative overweight exposures to Internet and catalog retail and software were beneficial. Conversely, the Fund’s security selection and underweight exposure to Internet software and services stocks detracted from relative performance. Additionally, the Fund’s lack of holdings in the household
Portfolio Composition
By sector
| | | | | |
|
| Information Technology | | | 92.2 | % |
| |
| Consumer Discretionary | | | 2.0 | |
| |
| Health Care | | | 1.1 | |
| |
| Materials | | | 1.1 | |
| |
| Industrials | | | 0.6 | |
| |
| Financials | | | 0.3 | |
| |
Money Market Funds Plus Other Assets Less Liabilities | | | 2.7 | |
Top 10 Equity Holdings*
| | | | | | | | | |
|
| | 1. | | | Apple Inc. | | | 9.8 | % |
| |
| | 2. | | | Google Inc.-Class A | | | 4.9 | |
| |
| | 3. | | | QUALCOMM, Inc. | | | 4.2 | |
| |
| | 4. | | | Cognizant Technology
Solutions Corp.-Class A | | | 3.5 | |
| |
| | 5. | | | EMC Corp. | | | 3.3 | |
| |
| | 6. | | | Microsoft Corp. | | | 2.9 | |
| |
| | 7. | | | Oracle Corp. | | | 2.8 | |
| |
| | 8. | | | Check Point Software Technologies Ltd. | | | 2.6 | |
| |
| | 9. | | | Citrix Systems, Inc. | | | 2.5 | |
| |
| | 10. | | | Intel Corp. | | | 2.5 | |
| | | | |
|
| Total Net Assets | | $102.2 million |
| | | | | |
| Total Number of Holdings* | | | 76 |
The Fund’s holdings are subject to change, and there is no assurance that the Fund will continue to hold any particular security.
| | |
| * | Excluding money market fund holdings. |
Invesco V.I. Technology Fund
durables industry, an industry which is part of the style-specific index, negatively affected the Fund’s relative performance in 2011.
Top individual contributors to the Fund’s absolute performance during the fiscal year included Apple and MasterCard. Following four years of exclusivity with AT&T (not a Fund holding), Apple expanded its distribution of the iPhone to Verizon Wireless and Sprint (not Fund holdings) during 2011. Apple also unveiled the iPhone 4 and the iPhone 4S, as well as the new speech-recognition feature called Siri. Despite losing its visionary and founder, Steve Jobs, we believe Apple’s unique competitive advantage to be sustainable. With regards to MasterCard, the company has managed expenses well and, in general, credit card volumes rebounded during the second half of the year.
Top detractors from Fund performance included Rovi and Microsemi. Rovi is a global leader in digital entertainment products and services, while Microsemi designs and manufactures semiconductors for use in defense-related electronics, wireless phones, TVs and other devices. When Rovi announced expectations for the third quarter and overall 2011 fiscal year would fall short of analyst expectations, investors reacted negatively. Microsemi, on the other hand, announced revenue guidance above analyst estimates, yet suffered from poor investor sentiment toward defense budget related stocks. We continued to own Microsemi, and in fact increased our exposure on the company’s weakness. We did, however, sell Rovi before the close of the reporting period.
We remain confident about the medium-term outlook for technology stocks, primarily due to the potential for increased enterprise spending. Businesses have been reluctant to hire additional employees due to ancillary costs and, therefore, are using IT to compensate. Additionally, we believe emerging markets will continue to have increased technology needs. Going forward, we see possible improvements in credit markets, stabilization of demand patterns and conditions for secular growth. Longer term, we continue to see positive trends in the IT sector because we believe three key secular themes, which are independent of short-term catalysts, continue to offer support: 1) globalization – productivity gains support increased technology use in international markets; 2) consumerization – technology demand is consumer-driven; 3) proliferation – technology continues to penetrate products ranging
from automobiles and industrial controls to sporting gear and alternative energy.
As always, we thank you for your continued investment in Invesco V.I. Technology Fund.
The views and opinions expressed in management’s discussion of Fund performance are those of Invesco Advisers, Inc. These views and opinions are subject to change at any time based on factors such as market and economic conditions. These views and opinions may not be relied upon as investment advice or recommendations, or as an offer for a particular security. The information is not a complete analysis of every aspect of any market, country, industry, security or the Fund. Statements of fact are from sources considered reliable, but Invesco Advisers, Inc. makes no representation or warranty as to their completeness or accuracy. Although historical performance is no guarantee of future results, these insights may help you understand our investment management philosophy.
See important Fund and, if applicable, index disclosures later in this report.
Warren Tennant
Chartered Financial Analyst, portfolio manager, is lead manager of Invesco V.I. Technology Fund. Mr. Tennant joined Invesco in 2000 and was named a portfolio manager in 2007 before becoming lead manager of the Fund in 2008. He earned both a B.B.A. in finance and an M.B.A. from The University of Texas at Austin.
Brian Nelson
Chartered Financial Analyst, portfolio manager, is manager of Invesco V.I. Technology Fund. He joined Invesco in 2004. Mr. Nelson earned a B.A. from the University of California Santa Barbara and is a member of the CFA Society of San Francisco.
Invesco V.I. Technology Fund
Your Fund’s Long-Term Performance
Results of a $10,000 Investment – Oldest Share Class(es)
Fund and index data from 12/31/01*
| |
| * | During the reporting period, Invesco changed its policy regarding growth of $10,000 charts. For funds older than 10 years, we previously showed performance since inception. Going forward, we will show performance for the most recent 10 years, since this more accurately reflects the experience of the typical shareholder. As a result, charts now may include benchmarks that did not appear previously, because the funds’ inception pre-dated the benchmarks’ inception. Also, all charts will now be presented using a linear format. |
Past performance cannot guarantee comparable future results.
Average Annual Total Returns
As of 12/31/11
| | | | | | | | | |
|
| Series I Shares | | | | |
| |
| Inception (5/20/97) | | | 2.96 | % |
| |
| | 10 | | | Years | | | -0.12 | |
| |
| | 5 | | | Years | | | 1.62 | |
| |
| | 1 | | | Year | | | -5.05 | |
| |
| | | | | | | | | |
| Series II Shares | | | | |
| |
| | 10 | | | Years | | | -0.39 | % |
| |
| | 5 | | | Years | | | 1.35 | |
| |
| | 1 | | | Year | | | -5.32 | |
| |
Series II shares incepted on April 30, 2004. Performance shown prior to that date is that of Series I shares, restated to reflect the higher 12b-1 fees applicable to Series II. Series I performance reflects any applicable fee waivers or expense reimbursements. The performance of the Fund’s Series I and Series II share classes will differ primarily due to different class expenses.
The performance data quoted represent past performance and cannot guarantee comparable future results; current performance may be lower or higher. Please contact your variable product issuer or financial adviser for the most recent month-end variable product performance. Performance figures reflect Fund expenses, reinvested distributions and changes in net asset value. Investment return and principal
value will fluctuate so that you may have a gain or loss when you sell shares.
The total annual Fund operating expense ratio set forth in the most recent Fund prospectus as of the date of this report for Series I and Series II shares was 1.14% and 1.39%, respectively. The expense ratios presented above may vary from the expense ratios presented in other sections of this report that are based on expenses incurred during the period covered by this report.
Invesco V.I. Technology Fund, a series portfolio of AIM Variable Insurance Funds (Invesco Variable Insurance Funds), is currently offered through insurance companies issuing variable products. You cannot purchase shares of the Fund directly. Performance figures given represent the Fund and are not intended to reflect actual variable product values. They do not reflect sales charges, expenses and fees assessed in connection with a variable product. Sales charges, expenses and fees, which are determined by the variable product issuers, will vary and will lower the total return.
The most recent month-end performance data at the Fund level, excluding variable product charges, is available at 800 451 4246. As mentioned above, for the most recent
month-end performance including variable product charges, please contact your variable product issuer or financial adviser.
Invesco V.I. Technology Fund
Invesco V.I. Technology Fund’s investment objective is long-term growth of capital.
| n | | Unless otherwise stated, information presented in this report is as of December 31, 2011, and is based on total net assets. |
| |
| n | | Unless otherwise noted, all data provided by Invesco. |
| |
| n | | To access your Fund’s reports/prospectus, visit invesco.com/fundreports. |
Principal risks of investing in the Fund
Foreign securities risk. The Fund’s foreign investments may be affected by changes in a foreign country’s exchange rates; political and social instability; changes in economic or taxation policies; difficulties when enforcing obligations; decreased liquidity; and increased volatility. Foreign companies may be subject to less regulation resulting in less publicly available information about the companies
Initial Public Offering (IPO) risk. The prices of IPO securities may fluctuate more than prices of equity securities of companies with longer trading histories. In addition, companies offering securities in IPOs may have less experienced management or limited operating histories. There can be no assurance that the Fund will have favorable IPO investment opportunities.
Management risk. The investment techniques and risk analysis used by the Fund’s portfolio managers may not produce the desired results.
Market risk. The prices of and the income generated by the Fund’s securities may decline in response to, among other things, investor sentiment; general economic and market conditions; regional or global instability; and currency and interest rate fluctuations.
Sector fund risk. The Fund’s investments are concentrated in a comparatively narrow segment of the economy, which may make the Fund more volatile than non-concentrated funds.
Small- and mid-capitalization risks. Stocks of small and mid-sized companies tend to be more vulnerable to adverse developments in the above factors and may have little or no operating history or track record of success, and limited product lines, markets, management and financial resources. The securities of small and mid-sized companies may be more volatile due to less market interest and less publicly available information about the issuer. They also may be illiquid or restricted as to resale, or may trade less frequently and in smaller volumes, all of which may cause difficulty when establishing or closing a position at a desirable price.
Technology sector risk. Many products and services offered in technology-related industries are subject to rapid obsolescence, which may lower the value of the issuers in this sector.
About indexes used in this report
The S&P 500® Index is an unmanaged index considered representative of the U.S. stock market.
The BofA Merrill Lynch 100 Technology Index is a price-only equal-dollar weighted index of 100 stocks designed to measure the performance of a cross section of large, actively traded technology stocks and American Depositary Receipts.
The Lipper VUF Science & Technology Funds Category Average represents an average of all of the variable insurance underlying funds in the Lipper Science & Technology Funds category.
The Fund is not managed to track the performance of any particular index, including the indexes defined here, and consequently, the performance of the Fund may deviate significantly from the performance of the indexes.
A direct investment cannot be made in an index. Unless otherwise indicated, index results include reinvested dividends, and they do not reflect sales charges. Performance of the peer group, if applicable, reflects fund expenses; performance of a market index does not.
Other information
The Chartered Financial Analyst® (CFA®) designation is globally recognized and attests to a charterholder’s success in a rigorous and comprehensive study program in the field of investment management and research analysis.
Industry classifications used in this report are generally according to the Global Industry Classification Standard, which was developed by and is the exclusive property and a service mark of MSCI Inc. and Standard & Poor’s.
The returns shown in management’s discussion of Fund performance are based on net asset values calculated for shareholder transactions. Generally accepted accounting principles require adjustments to be made to the net assets of the Fund at period end for financial reporting purposes, and as such, the net asset values for shareholder transactions and the returns based on those net asset values may differ from the net asset values and returns reported in the Financial Highlights. Additionally, the returns and net asset values shown throughout this report are at the Fund level only and do not include variable product issuer charges. If such charges were included, the total returns would be lower.
Invesco V.I. Technology Fund
Schedule of Investments(a)
December 31, 2011
| | | | | | | | | |
| | | Shares | | Value |
| |
Common Stocks & Other Equity Interests–97.26%
| | | | |
Application Software–7.23%
| | | | |
Autodesk, Inc.(b) | | | 25,447 | | | $ | 771,807 | |
| |
Citrix Systems, Inc.(b) | | | 42,767 | | | | 2,596,812 | |
| |
NICE Systems Ltd.–ADR (Israel)(b) | | | 31,386 | | | | 1,081,248 | |
| |
Nuance Communications, Inc.(b) | | | 43,357 | | | | 1,090,862 | |
| |
Salesforce.com, Inc.(b) | | | 7,747 | | | | 786,011 | |
| |
Taleo Corp.–Class A(b) | | | 9,042 | | | | 349,835 | |
| |
TIBCO Software Inc.(b) | | | 29,620 | | | | 708,214 | |
| |
| | | | | | | | 7,384,789 | |
| |
Communications Equipment–9.47%
| | | | |
| ADTRAN, Inc. | | | 19,204 | | | | 579,193 | |
| |
Ciena Corp.(b) | | | 50,440 | | | | 610,324 | |
| |
F5 Networks, Inc.(b) | | | 9,919 | | | | 1,052,604 | |
| |
Finisar Corp.(b) | | | 19,854 | | | | 332,455 | |
| |
JDS Uniphase Corp.(b) | | | 63,880 | | | | 666,907 | |
| |
Juniper Networks, Inc.(b) | | | 13,111 | | | | 267,596 | |
| |
Polycom, Inc.(b) | | | 40,912 | | | | 666,866 | |
| |
| QUALCOMM, Inc. | | | 77,572 | | | | 4,243,188 | |
| |
Sonus Networks, Inc.(b) | | | 172,767 | | | | 414,641 | |
| |
Sycamore Networks, Inc.(b) | | | 19,967 | | | | 357,409 | |
| |
Ubiquiti Networks Inc.(b) | | | 26,574 | | | | 484,444 | |
| |
| | | | | | | | 9,675,627 | |
| |
Computer Hardware–9.78%
| | | | |
Apple Inc.(b) | | | 24,691 | | | | 9,999,855 | |
| |
Computer Storage & Peripherals–6.62%
| | | | |
EMC Corp.(b) | | | 154,754 | | | | 3,333,401 | |
| |
NetApp, Inc.(b) | | | 30,474 | | | | 1,105,292 | |
| |
SanDisk Corp.(b) | | | 22,095 | | | | 1,087,295 | |
| |
Synaptics Inc.(b) | | | 24,251 | | | | 731,168 | |
| |
Western Digital Corp.(b) | | | 16,557 | | | | 512,439 | |
| |
| | | | | | | | 6,769,595 | |
| |
Data Processing & Outsourced Services–9.98%
| | | | |
Alliance Data Systems Corp.(b) | | | 12,792 | | | | 1,328,321 | |
| |
Genpact Ltd. (Bermuda)(b) | | | 83,942 | | | | 1,254,933 | |
| |
| MasterCard, Inc.–Class A | | | 6,522 | | | | 2,431,532 | |
| |
VeriFone Systems, Inc.(b) | | | 27,146 | | | | 964,226 | |
| |
| Visa Inc.–Class A | | | 24,151 | | | | 2,452,051 | |
| |
| Western Union Co. | | | 43,735 | | | | 798,601 | |
| |
Wright Express Corp.(b) | | | 17,962 | | | | 974,978 | |
| |
| | | | | | | | 10,204,642 | |
| |
Electronic Manufacturing Services–1.79%
| | | | |
| Jabil Circuit, Inc. | | | 68,268 | | | | 1,342,149 | |
| |
| TE Connectivity Ltd. | | | 15,865 | | | | 488,800 | |
| |
| | | | | | | | 1,830,949 | |
| |
Fertilizers & Agricultural Chemicals–1.07%
| | | | |
| Monsanto Co. | | | 15,547 | | | | 1,089,378 | |
| |
Internet Retail–1.97%
| | | | |
Amazon.com, Inc.(b) | | | 11,605 | | | | 2,008,825 | |
| |
Internet Software & Services–8.65%
| | | | |
eBay Inc.(b) | | | 35,794 | | | | 1,085,632 | |
| |
Google Inc.–Class A(b) | | | 7,730 | | | | 4,992,807 | |
| |
Responsys, Inc.(b) | | | 30,217 | | | | 268,629 | |
| |
ValueClick, Inc.(b) | | | 64,484 | | | | 1,050,444 | |
| |
Velti PLC (Ireland)(b) | | | 44,473 | | | | 302,416 | |
| |
| VeriSign, Inc. | | | 31,995 | | | | 1,142,862 | |
| |
| | | | | | | | 8,842,790 | |
| |
IT Consulting & Other Services–6.63%
| | | | |
| Accenture PLC–Class A (Ireland) | | | 26,251 | | | | 1,397,341 | |
| |
Cognizant Technology Solutions Corp.–Class A(b) | | | 55,071 | | | | 3,541,616 | |
| |
| International Business Machines Corp. | | | 9,984 | | | | 1,835,858 | |
| |
| | | | | | | | 6,774,815 | |
| |
Life Sciences Tools & Services–1.06%
| | | | |
Agilent Technologies, Inc.(b) | | | 31,002 | | | | 1,082,900 | |
| |
Other Diversified Financial Services–0.35%
| | | | |
BlueStream Ventures L.P. (Acquired 08/03/00-06/13/08; Acquisition Cost $3,149,655)(c)(d) | | | — | | | | 357,428 | |
| |
Research & Consulting Services–0.65%
| | | | |
Acacia Research-Acacia Technologies(b) | | | 18,257 | | | | 666,563 | |
| |
Semiconductor Equipment–3.24%
| | | | |
| ASML Holding N.V.–New York Shares (Netherlands) | | | 11,797 | | | | 492,997 | |
| |
Cymer, Inc.(b) | | | 19,119 | | | | 951,362 | |
| |
Intermolecular Inc.(b) | | | 51,640 | | | | 443,071 | |
| |
Novellus Systems, Inc.(b) | | | 19,755 | | | | 815,684 | |
| |
Teradyne, Inc.(b) | | | 44,518 | | | | 606,780 | |
| |
| | | | | | | | 3,309,894 | |
| |
Semiconductors–16.01%
| | | | |
| ARM Holdings PLC–ADR (United Kingdom) | | | 8,918 | | | | 246,761 | |
| |
| Avago Technologies Ltd. (Singapore) | | | 19,326 | | | | 557,748 | |
| |
Broadcom Corp.–Class A(b) | | | 64,252 | | | | 1,886,439 | |
| |
Cypress Semiconductor Corp.(b) | | | 70,135 | | | | 1,184,580 | |
| |
Diodes Inc.(b) | | | 26,436 | | | | 563,087 | |
| |
See accompanying Notes to Financial Statements which are an integral part of the financial statements.
Invesco V.I. Technology Fund
| | | | | | | | | |
| | | Shares | | Value |
| |
Semiconductors–(continued)
| | | | |
| | | | | | | | | |
| Intel Corp. | | | 103,235 | | | $ | 2,503,449 | |
| |
Lattice Semiconductor Corp.(b) | | | 166,091 | | | | 986,581 | |
| |
Marvell Technology Group Ltd.(b) | | | 73,572 | | | | 1,018,972 | |
| |
Micron Technology, Inc.(b) | | | 128,143 | | | | 806,020 | |
| |
Microsemi Corp.(b) | | | 146,565 | | | | 2,454,964 | |
| |
ON Semiconductor Corp.(b) | | | 78,045 | | | | 602,507 | |
| |
Semtech Corp.(b) | | | 69,787 | | | | 1,732,113 | |
| |
Skyworks Solutions, Inc.(b) | | | 40,275 | | | | 653,261 | |
| |
Volterra Semiconductor Corp.(b) | | | 27,530 | | | | 705,043 | |
| |
| Xilinx, Inc. | | | 14,206 | | | | 455,444 | |
| |
| | | | | | | | 16,356,969 | |
| |
Systems Software–12.76%
| | | | |
Ariba Inc.(b) | | | 33,765 | | | | 948,121 | |
| |
Check Point Software Technologies Ltd. (Israel)(b) | | | 51,230 | | | | 2,691,624 | |
| |
CommVault Systems, Inc.(b) | | | 14,916 | | | | 637,212 | |
| |
Fortinet Inc.(b) | | | 50,588 | | | | 1,103,324 | |
| |
Imperva Inc.(b) | | | 11,213 | | | | 390,325 | |
| |
| Microsoft Corp. | | | 115,590 | | | | 3,000,716 | |
| |
| Oracle Corp. | | | 109,763 | | | | 2,815,421 | |
| |
Red Hat, Inc.(b) | | | 15,055 | | | | 621,621 | |
| |
Symantec Corp.(b) | | | 52,955 | | | | 828,746 | |
| |
| | | | | | | | 13,037,110 | |
| |
| Total Common Stocks & Other Equity Interests (Cost $85,050,083) | | | | | | | 99,392,129 | |
| |
Money Market Funds–2.65%
| | | | |
Liquid Assets Portfolio–Institutional Class(e) | | | 1,352,232 | | | | 1,352,232 | |
| |
Premier Portfolio–Institutional Class(e) | | | 1,352,233 | | | | 1,352,233 | |
| |
| Total Money Market Funds (Cost $2,704,465) | | | | | | | 2,704,465 | |
| |
| TOTAL INVESTMENTS–99.91% (Cost $87,754,548) | | | | | | | 102,096,594 | |
| |
| OTHER ASSETS LESS LIABILITIES–0.09% | | | | | | | 95,761 | |
| |
| NET ASSETS–100.00% | | | | | | $ | 102,192,355 | |
| |
Investment Abbreviations:
| | | |
| ADR | | – American Depositary Receipt |
Notes to Schedule of Investments:
| | |
| (a) | | Industry and/or sector classifications used in this report are generally according to the Global Industry Classification Standard, which was developed by and is the exclusive property and a service mark of MSCI Inc. and Standard & Poor’s. |
| (b) | | Non-income producing security. |
| (c) | | Security purchased or received in a transaction exempt from registration under the Securities Act of 1933, as amended. The security may be resold pursuant to an exemption from registration under the 1933 Act, typically to qualified institutional buyers. The value of this security at December 31, 2011 represented less than 1% of the Fund’s Net Assets. |
| (d) | | The Fund has a remaining commitment of $101,250 to purchase additional interests in BlueStream Ventures L.P., which is subject to the terms of the limited partnership agreement. |
| (e) | | The money market fund and the Fund are affiliated by having the same investment adviser. |
See accompanying Notes to Financial Statements which are an integral part of the financial statements.
Invesco V.I. Technology Fund
Statement of Assets and Liabilities
December 31, 2011
| | | | | |
Assets:
|
| Investments, at value (Cost $85,050,083) | | $ | 99,392,129 | |
| |
| Investments in affiliated money market funds, at value and cost | | | 2,704,465 | |
| |
| Total investments, at value (Cost $87,754,548) | | | 102,096,594 | |
| |
| Receivable for: | | | | |
| Investments sold | | | 682,733 | |
| |
| Fund shares sold | | | 4,336 | |
| |
| Dividends | | | 335 | |
| |
| Investment for trustee deferred compensation and retirement plans | | | 33,079 | |
| |
| Total assets | | | 102,817,077 | |
| |
Liabilities:
|
| Payable for: | | | | |
| Investments purchased | | | 146,181 | |
| |
| Fund shares reacquired | | | 325,832 | |
| |
| Accrued fees to affiliates | | | 69,587 | |
| |
| Accrued other operating expenses | | | 31,114 | |
| |
| Trustee deferred compensation and retirement plans | | | 52,008 | |
| |
| Total liabilities | | | 624,722 | |
| |
| Net assets applicable to shares outstanding | | $ | 102,192,355 | |
| |
Net assets consist of:
|
| Shares of beneficial interest | | $ | 87,568,585 | |
| |
| Undistributed net investment income | | | 1,881,365 | |
| |
| Undistributed net realized gain (loss) | | | (1,599,641 | ) |
| |
| Unrealized appreciation | | | 14,342,046 | |
| |
| | | $ | 102,192,355 | |
| |
Net Assets:
|
| Series I | | $ | 100,579,223 | |
| |
| Series II | | $ | 1,613,132 | |
| |
Shares outstanding, $0.001 par value per share, with an unlimited number of shares authorized:
|
| Series I | | | 6,635,114 | |
| |
| Series II | | | 108,554 | |
| |
| Series I: | | | | |
| Net asset value per share | | $ | 15.16 | |
| |
| Series II: | | | | |
| Net asset value per share | | $ | 14.86 | |
| |
Statement of Operations
For the year ended December 31, 2011
| | | | | |
Investment income:
|
| Dividends (net of foreign withholding taxes of $3,957) | | $ | 603,217 | |
| |
| Dividends from affiliated money market funds (includes securities lending income of $4,581) | | | 8,048 | |
| |
| Total investment income | | | 611,265 | |
| |
Expenses:
|
| Advisory fees | | | 920,424 | |
| |
| Administrative services fees | | | 352,655 | |
| |
| Custodian fees | | | 6,404 | |
| |
| Distribution fees — Series II | | | 3,713 | |
| |
| Transfer agent fees | | | 23,945 | |
| |
| Trustees’ and officers’ fees and benefits | | | 22,474 | |
| |
| Other | | | 42,864 | |
| |
| Total expenses | | | 1,372,479 | |
| |
| Less: Fees waived | | | (4,687 | ) |
| |
| Net expenses | | | 1,367,792 | |
| |
| Net investment income (loss) | | | (756,527 | ) |
| |
Realized and unrealized gain (loss) from:
|
| Net realized gain from: | | | | |
| Investment securities | | | 11,673,892 | |
| |
| Foreign currencies | | | 1,974 | |
| |
| | | | 11,675,866 | |
| |
| Change in net unrealized appreciation (depreciation) of: | | | | |
| Investment securities | | | (16,912,186 | ) |
| |
| Foreign currencies | | | (795 | ) |
| |
| | | | (16,912,981 | ) |
| |
| Net realized and unrealized gain (loss) | | | (5,237,115 | ) |
| |
| Net increase (decrease) in net assets resulting from operations | | $ | (5,993,642 | ) |
| |
See accompanying Notes to Financial Statements which are an integral part of the financial statements.
Invesco V.I. Technology Fund
Statement of Changes in Net Assets
For the years ended December 31, 2011 and 2010
| | | | | | | | | |
| | | 2011 | | 2010 |
| |
Operations:
| | | | |
| Net investment income (loss) | | $ | (756,527 | ) | | $ | 208,234 | |
| |
| Net realized gain | | | 11,675,866 | | | | 7,911,740 | |
| |
| Change in net unrealized appreciation (depreciation) | | | (16,912,981 | ) | | | 14,071,941 | |
| |
| Net increase (decrease) in net assets resulting from operations | | | (5,993,642 | ) | | | 22,191,915 | |
| |
Distributions to shareholders from net investment income:
| | | | |
| Series I | | | (209,892 | ) | | | — | |
| |
| Series II | | | (1,326 | ) | | | — | |
| |
| Total distributions from net investment income | | | (211,218 | ) | | | — | |
| |
Share transactions–net:
| | | | |
| Series I | | | (21,625,874 | ) | | | (13,096,747 | ) |
| |
| Series II | | | 520,728 | | | | 622,157 | |
| |
| Net increase (decrease) in net assets resulting from share transactions | | | (21,105,146 | ) | | | (12,474,590 | ) |
| |
| Net increase (decrease) in net assets | | | (27,310,006 | ) | | | 9,717,325 | |
| |
Net assets:
| | | | |
| Beginning of year | | | 129,502,361 | | | | 119,785,036 | |
| |
| End of year (includes undistributed net investment income of $1,881,365 and $2,101,126, respectively) | | $ | 102,192,355 | | | $ | 129,502,361 | |
| |
Notes to Financial Statements
December 31, 2011
NOTE 1—Significant Accounting Policies
Invesco V.I. Technology Fund (the “Fund”) is a series portfolio of AIM Variable Insurance Funds (Invesco Variable Insurance Funds) (the “Trust”). The Trust is a Delaware statutory trust registered under the Investment Company Act of 1940, as amended (the “1940 Act”), as an open-end series management investment company consisting of twenty-eight separate portfolios, (each constituting a “Fund”). The assets, liabilities and operations of each portfolio are accounted for separately. Information presented in these financial statements pertains only to the Fund. Matters affecting each Fund or class will be voted on exclusively by the shareholders of such Fund or class. Current Securities and Exchange Commission (“SEC”) guidance, however, requires participating insurance companies offering separate accounts to vote shares proportionally in accordance with the instructions of the contract owners whose investments are funded by shares of each Fund or class.
The Fund’s investment objective is long-term growth of capital.
The Fund currently offers two classes of shares, Series I and Series II, both of which are offered to insurance company separate accounts funding variable annuity contracts and variable life insurance policies (“variable products”).
The following is a summary of the significant accounting policies followed by the Fund in the preparation of its financial statements.
| | |
| A. | | Security Valuations — Securities, including restricted securities, are valued according to the following policy. |
| | A security listed or traded on an exchange (except convertible bonds) is valued at its last sales price or official closing price as of the close of the customary trading session on the exchange where the security is principally traded, or lacking any sales or official closing price on a particular day, the security may be valued at the closing bid price on that day. Securities traded in the over-the-counter market are valued based on prices furnished by independent pricing services or market makers. When such securities are valued by an independent pricing service they may be considered fair valued. Futures contracts are valued at the final settlement price set by an exchange on which they are principally traded. Listed options are valued at the mean between the last bid and ask prices from the exchange on which they are principally traded. Options not listed on an exchange are valued by an independent source at the mean between the last bid and ask prices. For purposes of determining net asset value per share, futures and option contracts generally are valued 15 minutes after the close of the customary trading session of the New York Stock Exchange (“NYSE”). |
| | Investments in open-end and closed-end registered investment companies that do not trade on an exchange are valued at the end of day net asset value per share. Investments in open-end and closed-end registered investment companies that trade on an exchange are valued at the last sales price or official closing price as of the close of the customary trading session on the exchange where the security is principally traded. |
| | Debt obligations (including convertible bonds) and unlisted equities are fair valued using an evaluated quote provided by an independent pricing service. Evaluated quotes provided by the pricing service may be determined without exclusive reliance on quoted prices, and may reflect appropriate factors such as |
Invesco V.I. Technology Fund
| | |
| | institution-size trading in similar groups of securities, developments related to specific securities, dividend rate, yield, quality, type of issue, coupon rate, maturity, individual trading characteristics and other market data. Debt securities are subject to interest rate and credit risks. In addition, all debt securities involve some risk of default with respect to interest and/or principal payments. |
| | Foreign securities (including foreign exchange contracts) are converted into U.S. dollar amounts using the applicable exchange rates as of the close of the NYSE. If market quotations are available and reliable for foreign exchange traded equity securities, the securities will be valued at the market quotations. Because trading hours for certain foreign securities end before the close of the NYSE, closing market quotations may become unreliable. If between the time trading ends on a particular security and the close of the customary trading session on the NYSE, events occur that are significant and make the closing price unreliable, the Fund may fair value the security. If the event is likely to have affected the closing price of the security, the security will be valued at fair value in good faith using procedures approved by the Board of Trustees. Adjustments to closing prices to reflect fair value may also be based on a screening process of an independent pricing service to indicate the degree of certainty, based on historical data, that the closing price in the principal market where a foreign security trade is not the current value as of the close of the NYSE. Foreign securities meeting the approved degree of certainty that the price is not reflective of current value will be priced at the indication of fair value from the independent pricing service. Multiple factors may be considered by the independent pricing service in determining adjustments to reflect fair value and may include information relating to sector indices, American Depositary Receipts and domestic and foreign index futures. Foreign securities may have additional risks including exchange rate changes, potential for sharply devalued currencies and high inflation, political and economic upheaval, the relative lack of issuer information, relatively low market liquidity and the potential lack of strict financial and accounting controls and standards. |
| | Securities for which market prices are not provided by any of the above methods may be valued based upon quotes furnished by independent sources. The last bid price may be used to value equity securities. The mean between the last bid and asked prices is used to value debt obligations, including Corporate Loans. |
| | Securities for which market quotations are not readily available or are unreliable are valued at fair value as determined in good faith by or under the supervision of the Trust’s officers following procedures approved by the Board of Trustees. Issuer specific events, market trends, bid/ask quotes of brokers and information providers and other market data may be reviewed in the course of making a good faith determination of a security’s fair value. |
| | Valuations change in response to many factors including the historical and prospective earnings of the issuer, the value of the issuer’s assets, general economic conditions, interest rates, investor perceptions and market liquidity. Because of the inherent uncertainties of valuation, the values reflected in the financial statements may materially differ from the value received upon actual sale of those investments. |
| B. | | Securities Transactions and Investment Income — Securities transactions are accounted for on a trade date basis. Realized gains or losses on sales are computed on the basis of specific identification of the securities sold. Interest income is recorded on the accrual basis from settlement date. Dividend income (net of withholding tax, if any) is recorded on the ex-dividend date. |
| | The Fund may periodically participate in litigation related to Fund investments. As such, the Fund may receive proceeds from litigation settlements. Any proceeds received are included in the Statement of Operations as realized gain (loss) for investments no longer held and as unrealized gain (loss) for investments still held. |
| | Brokerage commissions and mark ups are considered transaction costs and are recorded as an increase to the cost basis of securities purchased and/or a reduction of proceeds on a sale of securities. Such transaction costs are included in the determination of net realized and unrealized gain (loss) from investment securities reported in the Statement of Operations and the Statement of Changes in Net Assets and the net realized and unrealized gains (losses) on securities per share in the Financial Highlights. Transaction costs are included in the calculation of the Fund’s net asset value and, accordingly, they reduce the Fund’s total returns. These transaction costs are not considered operating expenses and are not reflected in net investment income reported in the Statement of Operations and Statement of Changes in Net Assets, or the net investment income per share and ratios of expenses and net investment income reported in the Financial Highlights, nor are they limited by any expense limitation arrangements between the Fund and the investment adviser. |
| | The Fund allocates income and realized and unrealized capital gains and losses to a class based on the relative net assets of each class. |
| C. | | Country Determination — For the purposes of making investment selection decisions and presentation in the Schedule of Investments, the investment adviser may determine the country in which an issuer is located and/or credit risk exposure based on various factors. These factors include the laws of the country under which the issuer is organized, where the issuer maintains a principal office, the country in which the issuer derives 50% or more of its total revenues and the country that has the primary market for the issuer’s securities, as well as other criteria. Among the other criteria that may be evaluated for making this determination are the country in which the issuer maintains 50% or more of its assets, the type of security, financial guarantees and enhancements, the nature of the collateral and the sponsor organization. Country of issuer and/or credit risk exposure has been determined to be the United States of America, unless otherwise noted. |
| D. | | Distributions — Distributions from income and net realized capital gain, if any, are generally paid to separate accounts of participating insurance companies annually and recorded on ex-dividend date. |
| E. | | Federal Income Taxes — The Fund intends to comply with the requirements of Subchapter M of the Internal Revenue Code necessary to qualify as a regulated investment company and to distribute substantially all of the Fund’s taxable earnings to shareholders. As such, the Fund will not be subject to federal income taxes on otherwise taxable income (including net realized capital gain) that is distributed to shareholders. Therefore, no provision for federal income taxes is recorded in the financial statements. |
| | The Fund files tax returns in the U.S. Federal jurisdiction and certain other jurisdictions. Generally, the Fund is subject to examinations by such taxing authorities for up to three years after the filing of the return for the tax period. |
| F. | | Expenses — Fees provided for under the Rule 12b-1 plan of a particular class of the Fund and which are directly attributable to that class are charged to the operations of such class. All other expenses are allocated among the classes based on relative net assets. |
| G. | | Accounting Estimates — The preparation of financial statements in conformity with accounting principles generally accepted in the United States of America (“GAAP”) requires management to make estimates and assumptions that affect the reported amounts of assets and liabilities at the date of the financial statements and the reported amounts of revenues and expenses during the reporting period including estimates and assumptions related to |
Invesco V.I. Technology Fund
| | |
| | taxation. Actual results could differ from those estimates by a significant amount. In addition, the Fund monitors for material events or transactions that may occur or become known after the period-end date and before the date the financial statements are released to print. |
| H. | | Indemnifications — Under the Trust’s organizational documents, each Trustee, officer, employee or other agent of the Trust is indemnified against certain liabilities that may arise out of performance of their duties to the Fund. Additionally, in the normal course of business, the Fund enters into contracts, including the Fund’s servicing agreements that contain a variety of indemnification clauses. The Fund’s maximum exposure under these arrangements is unknown as this would involve future claims that may be made against the Fund that have not yet occurred. The risk of material loss as a result of such indemnification claims is considered remote. |
| I. | | Other Risks — The Fund’s investments are concentrated in a comparatively narrow segment of the economy, which may make the Fund more volatile. |
| | Many products and services offered in technology-related industries are subject to rapid obsolescence, which may lower the value of the issuers in this sector. |
| J. | | Securities Lending — The Fund may lend portfolio securities having a market value up to one-third of the Fund’s total assets. Such loans are secured by collateral equal to no less than the market value of the loaned securities determined daily by the securities lending provider. Such collateral will be cash or debt securities issued or guaranteed by the U.S. Government or any of its sponsored agencies. Cash collateral received in connection with these loans is invested in short-term money market instruments or affiliated money market funds and is shown as such on the Schedule of Investments. It is the Fund’s policy to obtain additional collateral from or return excess collateral to the borrower by the end of the next business day, following the valuation date of the securities loaned. Therefore, the value of the collateral held may be temporarily less than the value of the securities on loan. Lending securities entails a risk of loss to the Fund if and to the extent that the market value of the securities loaned were to increase and the borrower did not increase the collateral accordingly, and the borrower fails to return the securities. Upon the failure of the borrower to return the securities, collateral may be liquidated and the securities may be purchased on the open market to replace the loaned securities. The Fund could experience delays and costs in gaining access to the collateral. The Fund bears the risk of any deficiency in the amount of the collateral available for return to the borrower due to any loss on the collateral invested. Dividends received on cash collateral investments for securities lending transactions, which are net of compensation to counterparties, is included in Dividends from affiliated money market funds on the Statement of Operations. The aggregate value of securities out on loan is shown as a footnote on the Statement of Assets and Liabilities, if any. |
| K. | | Foreign Currency Translations — Foreign currency is valued at the close of the NYSE based on quotations posted by banks and major currency dealers. Portfolio securities and other assets and liabilities denominated in foreign currencies are translated into U.S. dollar amounts at date of valuation. Purchases and sales of portfolio securities (net of foreign taxes withheld on disposition) and income items denominated in foreign currencies are translated into U.S. dollar amounts on the respective dates of such transactions. The Fund does not separately account for the portion of the results of operations resulting from changes in foreign exchange rates on investments and the fluctuations arising from changes in market prices of securities held. The combined results of changes in foreign exchange rates and the fluctuation of market prices on investments (net of estimated foreign tax withholding) are included with the net realized and unrealized gain or loss from investments in the Statement of Operations. Reported net realized foreign currency gains or losses arise from (1) sales of foreign currencies, (2) currency gains or losses realized between the trade and settlement dates on securities transactions, and (3) the difference between the amounts of dividends, interest, and foreign withholding taxes recorded on the Fund’s books and the U.S. dollar equivalent of the amounts actually received or paid. Net unrealized foreign currency gains and losses arise from changes in the fair values of assets and liabilities, other than investments in securities at fiscal period end, resulting from changes in exchange rates. |
| | The Fund may invest in foreign securities which may be subject to foreign taxes on income, gains on investments or currency repatriation, a portion of which may be recoverable. |
| L. | | Foreign Currency Contracts — The Fund may enter into foreign currency contracts to manage or minimize currency or exchange rate risk. The Fund may also enter into foreign currency contracts for the purchase or sale of a security denominated in a foreign currency in order to “lock in” the U.S. dollar price of that security. A foreign currency contract is an obligation to purchase or sell a specific currency for an agreed-upon price at a future date. The use of foreign currency contracts does not eliminate fluctuations in the price of the underlying securities the Fund owns or intends to acquire but establishes a rate of exchange in advance. Fluctuations in the value of these contracts are measured by the difference in the contract date and reporting date exchange rates and are recorded as unrealized appreciation (depreciation) until the contracts are closed. When the contracts are closed, realized gains (losses) are recorded. Realized and unrealized gains (losses) on the contracts are included in the Statement of Operations. The primary risks associated with foreign currency contracts include failure of the counterparty to meet the terms of the contract and the value of the foreign currency changing unfavorably. These risks may be in excess of the amounts reflected in the Statement of Assets and Liabilities. |
NOTE 2—Advisory Fees and Other Fees Paid to Affiliates
The Trust has entered into a master investment advisory agreement with Invesco Advisers, Inc. (the “Adviser” or “Invesco”). Under the terms of the investment advisory agreement, the Fund pays an advisory fee to the Adviser based on the annual rate of the Fund’s average daily net assets as follows:
| | | | | |
| Average Daily Net Assets | | Rate |
| |
| First $250 million | | | 0 | .75% |
| |
| Next $250 million | | | 0 | .74% |
| |
| Next $500 million | | | 0 | .73% |
| |
| Next $1.5 billion | | | 0 | .72% |
| |
| Next $2.5 billion | | | 0 | .71% |
| |
| Next $2.5 billion | | | 0 | .70% |
| |
| Next $2.5 billion | | | 0 | .69% |
| |
| Over $10 billion | | | 0 | .68% |
| |
Invesco V.I. Technology Fund
Under the terms of a master sub-advisory agreement between the Adviser and each of Invesco Asset Management Deutschland GmbH, Invesco Asset Management Limited, Invesco Asset Management (Japan) Limited, Invesco Australia Limited, Invesco Hong Kong Limited, Invesco Senior Secured Management, Inc. and Invesco Canada Ltd. (collectively, the “Affiliated Sub-Advisers”) the Adviser, not the Fund, may pay 40% of the fees paid to the Adviser to any such Affiliated Sub-Adviser(s) that provide discretionary investment management services to the Fund based on the percentage of assets allocated to such Sub-Adviser(s).
The Adviser has contractually agreed, through at least April 30, 2013, to waive advisory fees and/or reimburse expenses to the extent necessary to limit total annual fund operating expenses after fee waiver and/or expense reimbursement (excluding certain items discussed below) of Series I shares to 1.30% and Series II shares to 1.45% of average daily net assets. In determining the Adviser’s obligation to waive advisory fees and/or reimburse expenses, the following expenses are not taken into account, and could cause the total annual fund operating expenses after fee waiver and/or expense reimbursement to exceed the numbers reflected above: (1) interest; (2) taxes; (3) dividend expense on short sales; (4) extraordinary or non-routine items, including litigation expenses; and (5) expenses that the Fund has incurred but did not actually pay because of an expense offset arrangement. Unless the Board of the Trustees and Invesco mutually agree to amend or continue the fee waiver agreement, it will terminate on April 30, 2013. The Adviser did not waive fees and/or reimburse expenses during the period under this expense limitation.
Further, the Adviser has contractually agreed, through at least June 30, 2012, to waive the advisory fee payable by the Fund in an amount equal to 100% of the net advisory fees the Adviser receives from the affiliated money market funds on investments by the Fund of uninvested cash (excluding investments of cash collateral from securities lending) in such affiliated money market funds.
For the year ended December 31, 2011, the Adviser waived advisory fees of $4,687.
The Trust has entered into a master administrative services agreement with Invesco pursuant to which the Fund has agreed to pay Invesco a fee for costs incurred in providing accounting services and fund administrative services to the Fund and to reimburse Invesco for administrative services fees paid to insurance companies that have agreed to provide services to the participants of separate accounts. These administrative services provided by the insurance companies may include, among other things: the printing of prospectuses, financial reports and proxy statements and the delivery of the same to existing participants; the maintenance of master accounts; the facilitation of purchases and redemptions requested by the participants; and the servicing of participants’ accounts. Pursuant to such agreement, for the year ended December 31, 2011, Invesco was paid $50,000 for accounting and fund administrative services and reimbursed $302,655 for services provided by insurance companies.
The Trust has entered into a transfer agency and service agreement with Invesco Investment Services, Inc. (“IIS”) pursuant to which the Fund has agreed to pay IIS a fee for providing transfer agency and shareholder services to the Fund and reimburse IIS for certain expenses incurred by IIS in the course of providing such services. For the year ended December 31, 2011, expenses incurred under the agreement are shown in the Statement of Operations as transfer agent fees.
The Trust has entered into a master distribution agreement with Invesco Distributors, Inc. (“IDI”) to serve as the distributor for the Fund. The Trust has adopted a plan pursuant to Rule 12b-1 under the 1940 Act with respect to the Fund’s Series II shares (the “Plan”). The Fund, pursuant to the Plan, pays IDI compensation at the annual rate of 0.25% of the Fund’s average daily net assets of Series II shares. Of the Plan payments, up to 0.25% of the average daily net assets of the Series II shares may be paid to insurance companies who furnish continuing personal shareholder services to customers who purchase and own Series II shares of the Fund. For the year ended December 31, 2011, expenses incurred under the Plan are detailed in the Statement of Operations as distribution fees.
Certain officers and trustees of the Trust are officers and directors of the Adviser, Invesco Ltd., IIS and/or IDI.
NOTE 3—Additional Valuation Information
GAAP defines fair value as the price that would be received to sell an asset or paid to transfer a liability in an orderly transaction between market participants at the measurement date, under current market conditions. GAAP establishes a hierarchy that prioritizes the inputs to valuation methods giving the highest priority to readily available unadjusted quoted prices in an active market for identical assets (Level 1) and the lowest priority to significant unobservable inputs (Level 3) generally when market prices are not readily available or are unreliable. Based on the valuation inputs, the securities or other investments are tiered into one of three levels. Changes in valuation methods may result in transfers in or out of an investment’s assigned level:
| | |
| | Level 1 — | Prices are determined using quoted prices in an active market for identical assets. |
| | Level 2 — | Prices are determined using other significant observable inputs. Observable inputs are inputs that other market participants may use in pricing a security. These may include quoted prices for similar securities, interest rates, prepayment speeds, credit risk, yield curves, loss severities, default rates, discount rates, volatilities and others. |
| | Level 3 — | Prices are determined using significant unobservable inputs. In situations where quoted prices or observable inputs are unavailable (for example, when there is little or no market activity for an investment at the end of the period), unobservable inputs may be used. Unobservable inputs reflect the Fund’s own assumptions about the factors market participants would use in determining fair value of the securities or instruments and would be based on the best available information. |
The following is a summary of the tiered valuation input levels, as of December 31, 2011. The level assigned to the securities valuations may not be an indication of the risk or liquidity associated with investing in those securities. Because of the inherent uncertainties of valuation, the values reflected in the financial statements may materially differ from the value received upon actual sale of those investments.
During the year ended December 31, 2011, there were no significant transfers between investment levels.
| | | | | | | | | | | | | | | | | |
| | | Level 1 | | Level 2 | | Level 3 | | Total |
| |
| Equity Securities | | $ | 101,739,166 | | | $ | — | | | $ | 357,428 | | | $ | 102,096,594 | |
| |
Invesco V.I. Technology Fund
NOTE 4—Security Transactions with Affiliated Funds
The Fund is permitted to purchase or sell securities from or to certain other Invesco Funds under specified conditions outlined in procedures adopted by the Board of Trustees of the Trust. The procedures have been designed to ensure that any purchase or sale of securities by the Fund from or to another fund or portfolio that is or could be considered an affiliate by virtue of having a common investment adviser (or affiliated investment advisers), common Trustees and/or common officers complies with Rule 17a-7 of the 1940 Act. Further, as defined under the procedures, each transaction is effected at the current market price. Pursuant to these procedures, for the year ended December 31, 2011, the Fund engaged in securities purchases of $2,791,461.
NOTE 5—Trustees’ and Officers’ Fees and Benefits
“Trustees’ and Officers’ Fees and Benefits” include amounts accrued by the Fund to pay remuneration to certain Trustees and Officers of the Fund. Trustees have the option to defer compensation payable by the Fund, and “Trustees’ and Officers’ Fees and Benefits” also include amounts accrued by the Fund to fund such deferred compensation amounts. Those Trustees who defer compensation have the option to select various Invesco Funds in which their deferral accounts shall be deemed to be invested. Finally, certain current Trustees are eligible to participate in a retirement plan that provides for benefits to be paid upon retirement to Trustees over a period of time based on the number of years of service. The Fund may have certain former Trustees who also participate in a retirement plan and receive benefits under such plan. “Trustees’ and Officers’ Fees and Benefits” include amounts accrued by the Fund to fund such retirement benefits. Obligations under the deferred compensation and retirement plans represent unsecured claims against the general assets of the Fund.
During the year ended December 31, 2011, the Fund paid legal fees of $1,278 for services rendered by Kramer, Levin, Naftalis & Frankel LLP as counsel to the Independent Trustees. A partner of that firm is a Trustee of the Trust.
NOTE 6—Cash Balances
The Fund is permitted to temporarily carry a negative or overdrawn balance in its account with State Street Bank and Trust Company, the custodian bank. To compensate the custodian bank for such overdrafts, the overdrawn Fund may either (1) leave funds as a compensating balance in the account so the custodian bank can be compensated by earning the additional interest; or (2) compensate by paying the custodian bank at a rate agreed upon by the custodian bank and Invesco, not to exceed the contractually agreed upon rate.
NOTE 7—Distributions to Shareholders and Tax Components of Net Assets
Tax Character of Distributions to Shareholders Paid During the Years Ended December 31, 2011 and 2010:
| | | | | | | | | |
| | | 2011 | | 2010 |
| |
| Ordinary income | | $ | 211,218 | | | $ | — | |
| |
Tax Components of Net Assets at Period-End:
| | | | | |
| | | 2011 |
| |
| Net unrealized appreciation — investments | | $ | 16,197,256 | |
| |
| Temporary book/tax differences | | | (49,316 | ) |
| |
| Capital loss carryforward | | | (1,524,170 | ) |
| |
| Shares of beneficial interest | | | 87,568,585 | |
| |
| Total net assets | | $ | 102,192,355 | |
| |
The difference between book-basis and tax-basis unrealized appreciation (depreciation) is due to differences in the timing of recognition of gains and losses on investments for tax and book purposes. The Fund’s net unrealized appreciation difference is attributable primarily to wash sales and partnership interests.
The temporary book/tax differences are a result of timing differences between book and tax recognition of income and/or expenses. The Fund’s temporary book/tax differences are the result of the trustee deferral of compensation and retirement plan benefits.
Capital loss carryforward is calculated and reported as of a specific date. Results of transactions and other activity after that date may affect the amount of capital loss carryforward actually available for the Fund to utilize. The Regulated Investment Company Modernization Act of 2010 (the “Act”) eliminated the eight-year carryover period for capital losses that arise in taxable years beginning after its enactment date of December 22, 2010. Consequently, these capital losses can be carried forward for an unlimited period. However, capital losses with an expiration period may not be used to offset capital gains until all net capital losses without an expiration date have been utilized. Additionally, post-enactment capital loss carryovers will retain their character as either short-term or long-term capital losses instead of as short-term capital losses as under prior law. The ability to utilize capital loss carryforward in the future may be limited under the Internal Revenue Code and related regulations based on the results of future transactions.
The Fund utilized $12,209,745 of capital loss carryforward in the current period to offset net realized capital gain for federal income tax purposes. The Fund has a capital loss carryforward as of December 31, 2011, which expires as follows:
| | | | | | | | | | | | | |
| Capital Loss Carryforward* |
| Expiration | | Short-Term | | Long-Term | | Total |
| |
| December 31, 2017 | | $ | 1,524,170 | | | $ | — | | | $ | 1,524,170 | |
| |
| |
| * | Capital loss carryforward as of the date listed above is reduced for limitations, if any, to the extent required by the Internal Revenue Code. |
Invesco V.I. Technology Fund
NOTE 8—Investment Securities
The aggregate amount of investment securities (other than short-term securities, U.S. Treasury obligations and money market funds, if any) purchased and sold by the Fund during the year ended December 31, 2011 was $49,650,109 and $68,903,019, respectively. Cost of investments on a tax basis includes the adjustments for financial reporting purposes as of the most recently completed Federal income tax reporting period-end.
| | | | | |
| Unrealized Appreciation (Depreciation) of Investment Securities on a Tax Basis |
| |
| Aggregate unrealized appreciation of investment securities | | $ | 24,095,247 | |
| |
| Aggregate unrealized (depreciation) of investment securities | | | (7,897,991 | ) |
| |
| Net unrealized appreciation of investment securities | | $ | 16,197,256 | |
| |
| Cost of investments for tax purposes is $85,899,338. |
NOTE 9—Reclassification of Permanent Differences
Primarily as a result of differing book/tax treatment of foreign currency transactions, partnerships and net operating losses, on December 31, 2011, undistributed net investment income was increased by $747,984, undistributed net realized gain (loss) was increased by $461,482 and shares of beneficial interest decreased by $1,209,466. This reclassification had no effect on the net assets of the Fund.
NOTE 10—Share Information
| | | | | | | | | | | | | | | | | |
| | | Summary of Share Activity |
| |
| | | Year ended December 31, |
| | | 2011(a) | | 2010 |
| | | Shares | | Amount | | Shares | | Amount |
| |
| Sold: | | | | | | | | | | | | | | | | |
| Series I | | | 1,327,553 | | | $ | 22,172,590 | | | | 1,717,411 | | | $ | 23,632,823 | |
| |
| Series II | | | 56,016 | | | | 891,686 | | | | 62,723 | | | | 886,304 | |
| |
| Issued as reinvestment of dividends: | | | | | | | | | | | | | | | | |
| Series I | | | 14,376 | | | | 209,892 | | | | — | | | | — | |
| |
| Series II | | | 93 | | | | 1,326 | | | | — | | | | — | |
| |
| Reacquired: | | | | | | | | | | | | | | | | |
| Series I | | | (2,725,269 | ) | | | (44,008,356 | ) | | | (2,747,969 | ) | | | (36,729,570 | ) |
| |
| Series II | | | (23,813 | ) | | | (372,284 | ) | | | (18,555 | ) | | | (264,147 | ) |
| |
| Net increase (decrease) in share activity | | | (1,351,044 | ) | | $ | (21,105,146 | ) | | | (986,390 | ) | | $ | (12,474,590 | ) |
| |
| | |
| (a) | | There are entities that are record owners of more than 5% of the outstanding shares of the Fund and in the aggregate own 64% of the outstanding shares of the Fund. The Fund and the Fund’s principal underwriter or adviser, are parties to participation agreements with these entities whereby these entities sell units of interest in separate accounts funding variable products that are invested in the Fund. The Fund, Invesco and/or Invesco affiliates may make payments to these entities, which are considered to be related to the Fund, for providing services to the Fund, Invesco and/or Invesco affiliates including but not limited to services such as, securities brokerage, third party record keeping and account servicing and administrative services. The Fund has no knowledge as to whether all or any portion of the shares owned of record by these entities are also owned beneficially. |
Invesco V.I. Technology Fund
NOTE 11—Financial Highlights
The following schedule presents financial highlights for a share of the Fund outstanding throughout the periods indicated.
| | | | | | | | | | | | | | | | | | | | | | | | | | | | | | | | | | | | | | | | | | | | | | | | | |
| | | | | | | | | | | | | | | | | | | Ratio of
| | Ratio of
| | | | |
| | | | | | | Net gains
| | | | | | | | | | | | expenses
| | expenses
| | | | |
| | | | | | | (losses) on
| | | | | | | | | | | | to average
| | to average net
| | Ratio of net
| | |
| | | Net asset
| | Net
| | securities
| | | | Dividends
| | | | | | | | net assets
| | assets without
| | investment
| | |
| | | value,
| | investment
| | (both
| | Total from
| | from net
| | Net asset
| | | | Net assets,
| | with fee waivers
| | fee waivers
| | income (loss)
| | |
| | | beginning
| | income
| | realized and
| | investment
| | investment
| | value, end
| | Total
| | end of period
| | and/or expenses
| | and/or expenses
| | to average
| | Portfolio
|
| | | of period | | (loss) | | unrealized) | | operations | | income | | of period | | Return(a) | | (000s omitted) | | absorbed | | absorbed | | net assets | | turnover(b) |
| |
| Series I |
| Year ended 12/31/11 | | $ | 16.00 | | | $ | (0.10 | )(c) | | $ | (0.71 | ) | | $ | (0.81 | ) | | $ | (0.03 | ) | | $ | 15.16 | | | | (5.05 | )% | | $ | 100,579 | | | | 1.12 | %(d) | | | 1.12 | %(d) | | | (0.62 | )%(d) | | | 41 | % |
| Year ended 12/31/10 | | | 13.19 | | | | 0.02 | (c) | | | 2.79 | | | | 2.81 | | | | — | | | | 16.00 | | | | 21.30 | | | | 128,304 | | | | 1.14 | | | | 1.14 | | | | 0.18 | | | | 43 | |
| Year ended 12/31/09 | | | 8.38 | | | | (0.03 | )(c) | | | 4.84 | | | | 4.81 | | | | — | | | | 13.19 | | | | 57.40 | | | | 119,369 | | | | 1.18 | | | | 1.19 | | | | (0.27 | ) | | | 42 | |
| Year ended 12/31/08 | | | 15.10 | | | | 0.01 | (c) | | | (6.73 | ) | | | (6.72 | ) | | | — | | | | 8.38 | | | | (44.50 | ) | | | 71,546 | | | | 1.15 | | | | 1.16 | | | | 0.05 | | | | 81 | |
| Year ended 12/31/07 | | | 14.02 | | | | (0.06 | ) | | | 1.14 | | | | 1.08 | | | | — | | | | 15.10 | | | | 7.70 | | | | 158,739 | | | | 1.10 | | | | 1.10 | | | | (0.38 | ) | | | 59 | |
| |
| Series II |
| Year ended 12/31/11 | | | 15.71 | | | | (0.14 | )(c) | | | (0.70 | ) | | | (0.84 | ) | | | (0.01 | ) | | | 14.86 | | | | (5.32 | ) | | | 1,613 | | | | 1.37 | (d) | | | 1.37 | (d) | | | (0.87 | )(d) | | | 41 | |
| Year ended 12/31/10 | | | 12.98 | | | | (0.01 | )(c) | | | 2.74 | | | | 2.73 | | | | — | | | | 15.71 | | | | 21.03 | | | | 1,198 | | | | 1.39 | | | | 1.39 | | | | (0.07 | ) | | | 43 | |
| Year ended 12/31/09 | | | 8.26 | | | | (0.06 | )(c) | | | 4.78 | | | | 4.72 | | | | — | | | | 12.98 | | | | 57.14 | | | | 417 | | | | 1.43 | | | | 1.44 | | | | (0.52 | ) | | | 42 | |
| Year ended 12/31/08 | | | 14.95 | | | | (0.02 | )(c) | | | (6.67 | ) | | | (6.69 | ) | | | — | | | | 8.26 | | | | (44.75 | ) | | | 115 | | | | 1.40 | | | | 1.41 | | | | (0.20 | ) | | | 81 | |
| Year ended 12/31/07 | | | 13.91 | | | | (0.10 | ) | | | 1.14 | | | | 1.04 | | | | — | | | | 14.95 | | | | 7.48 | | | | 130 | | | | 1.35 | | | | 1.35 | | | | (0.63 | ) | | | 59 | |
| |
| | |
| (a) | | Includes adjustments in accordance with accounting principles generally accepted in the United States of America and as such, the net asset value for financial reporting purposes and the returns based upon those net asset values may differ from the net asset value and returns for shareholder transactions. Total returns are not annualized for periods less than one year, if applicable and do not reflect charges assessed in connection with a variable product, which if included would reduce total returns. |
| (b) | | Portfolio turnover is calculated at the fund level and is not annualized for periods less than one year, if applicable. |
| (c) | | Calculated using average shares outstanding. |
| (d) | | Ratios are based on average daily net assets (000’s omitted) of $121,238 and $1,485 for Series I and Series II, respectively. |
Invesco V.I. Technology Fund
Report of Independent Registered Public Accounting Firm
To the Board of Trustees of AIM Variable Insurance Funds (Invesco Variable Insurance Funds) and
Shareholders of Invesco V.I. Technology Fund:
In our opinion, the accompanying statement of assets and liabilities, including the schedule of investments, and the related statements of operations and of changes in net assets and the financial highlights present fairly, in all material respects, the financial position of Invesco V.I. Technology Fund (one of the funds constituting AIM Variable Insurance Funds (Invesco Variable Insurance Funds), hereafter referred to as the “Fund”) at December 31, 2011, the results of its operations for the year then ended, the changes in its net assets for each of the two years in the period then ended and the financial highlights for each of the five years in the period then ended, in conformity with accounting principles generally accepted in the United States of America. These financial statements and financial highlights (hereafter referred to as “financial statements”) are the responsibility of the Fund’s management; our responsibility is to express an opinion on these financial statements based on our audits. We conducted our audits of these financial statements in accordance with the standards of the Public Company Accounting Oversight Board (United States). Those standards require that we plan and perform the audits to obtain reasonable assurance about whether the financial statements are free of material misstatement. An audit includes examining, on a test basis, evidence supporting the amounts and disclosures in the financial statements, assessing the accounting principles used and significant estimates made by management, and evaluating the overall financial statement presentation. We believe that our audits, which included confirmation of securities at December 31, 2011 by correspondence with the custodian and brokers, provide a reasonable basis for our opinion.
PRICEWATERHOUSECOOPERS LLP
February 14, 2012
Houston, Texas
Invesco V.I. Technology Fund
Calculating your ongoing Fund expenses
Example
As a shareholder of the Fund, you incur ongoing costs, including management fees; distribution and/or service fees (12b-1); and other Fund expenses. This example is intended to help you understand your ongoing costs (in dollars) of investing in the Fund and to compare these costs with ongoing costs of investing in other mutual funds. The example is based on an investment of $1,000 invested at the beginning of the period and held for the entire period July 1, 2011 through December 31, 2011.
The actual and hypothetical expenses in the examples below do not represent the effect of any fees or other expenses assessed in connection with a variable product; if they did, the expenses shown would be higher while the ending account values shown would be lower.
Actual expenses
The table below provides information about actual account values and actual expenses. You may use the information in this table, together with the amount you invested, to estimate the expenses that you paid over the period. Simply divide your account value by $1,000 (for example, an $8,600 account value divided by $1,000 = 8.6), then multiply the result by the number in the table under the heading entitled “Actual Expenses Paid During Period” to estimate the expenses you paid on your account during this period.
Hypothetical example for comparison purposes
The table below also provides information about hypothetical account values and hypothetical expenses based on the Fund’s actual expense ratio and an assumed rate of return of 5% per year before expenses, which is not the Fund’s actual return.
The hypothetical account values and expenses may not be used to estimate the actual ending account balance or expenses you paid for the period. You may use this information to compare the ongoing costs of investing in the Fund and other funds. To do so, compare this 5% hypothetical example with the 5% hypothetical examples that appear in the shareholder reports of the other funds.
Please note that the expenses shown in the table are meant to highlight your ongoing costs. Therefore, the hypothetical information is useful in comparing ongoing costs, and will not help you determine the relative total costs of owning different funds.
| | | | | | | | | | | | | | | | | | | | | | | | | | | | | | | |
| | | | | | | | | | HYPOTHETICAL
| | | |
| | | | | | | ACTUAL | | | (5% annual return before expenses) | | | |
| | | | Beginning
| | | Ending
| | | Expenses
| | | Ending
| | | Expenses
| | | Annualized
|
| | | | Account Value
| | | Account Value
| | | Paid During
| | | Account Value
| | | Paid During
| | | Expense
|
| Class | | | (07/01/11) | | | (12/31/11)1 | | | Period2 | | | (12/31/11) | | | Period2 | | | Ratio |
| Series I | | | $ | 1,000.00 | | | | $ | 900.50 | | | | $ | 5.41 | | | | $ | 1,019.51 | | | | $ | 5.75 | | | | | 1.13 | % |
| | | | | | | | | | | | | | | | | | | | | | | | | | | | | | | |
| Series II | | | | 1,000.00 | | | | | 899.30 | | | | | 6.61 | | | | | 1,018.25 | | | | | 7.02 | | | | | 1.38 | |
| | | | | | | | | | | | | | | | | | | | | | | | | | | | | | | |
| |
| 1 | The actual ending account value is based on the actual total return of the Fund for the period July 1, 2011 through December 31, 2011, after actual expenses and will differ from the hypothetical ending account value which is based on the Fund’s expense ratio and a hypothetical annual return of 5% before expenses. |
| 2 | Expenses are equal to the Fund’s annualized expense ratio as indicated above multiplied by the average account value over the period, multiplied by 184/365 to reflect the most recent fiscal half year. |
Invesco V.I. Technology Fund
Form 1099-DIV, Form 1042-S and other year-end tax information provide shareholders with actual calendar year amounts that should be included in their tax returns. Shareholders should consult their tax advisors.
The following distribution information is being provided as required by the Internal Revenue Code or to meet a specific state’s requirement.
The Fund designates the following amounts or, if subsequently determined to be different, the maximum amount allowable for its fiscal year ended December 31, 2011:
| | | | | |
Federal and State Income Tax | | |
| |
| Corporate Dividends Received Deduction* | | | 95% | |
| | |
| | * | The above percentage is based on ordinary income dividends paid to shareholders during the Fund’s fiscal year. |
Invesco V.I. Technology Fund
Trustees and Officers
The address of each trustee and officer is AIM Variable Insurance Funds (Invesco Variable Insurance Funds) (the “Trust”), 11 Greenway Plaza, Suite 2500, Houston, Texas 77046-1173. The trustees serve for the life of the Trust, subject to their earlier death, incapacitation, resignation, retirement or removal as more specifically provided in the Trust’s organizational documents. Each officer serves for a one year term or until their successors are elected and qualified. Column two below includes length of time served with predecessor entities, if any.
| | | | | | | | | |
| | | | | | | Number of Funds
| | |
Name, Year of Birth and
| | Trustee and/
| | Principal Occupation(s)
| | in Fund Complex
| | Other Directorship(s)
|
| Position(s) Held with the Trust | | or Officer Since | | During Past 5 Years | | Overseen by Trustee | | Held by Trustee |
| | | | | | | | | |
| | | | | | | | | |
| | | | | | | | | |
Interested Persons | | | | | | | | |
| | | | | | | | | |
| | | | | | | | | |
| | | | | | | | | |
Martin L. Flanagan1 — 1960
Trustee | | 2007 | | Executive Director, Chief Executive Officer and President, Invesco Ltd. (ultimate parent of Invesco and a global investment management firm); Advisor to the Board, Invesco Advisers, Inc. (formerly known as Invesco Institutional (N.A.), Inc.); Trustee, The Invesco Funds; Vice Chair, Investment Company Institute; and Member of Executive Board, SMU Cox School of Business
Formerly: Chairman, Invesco Advisers, Inc. (registered investment adviser); Director, Chairman, Chief Executive Officer and President, IVZ Inc. (holding company), INVESCO Group Services, Inc. (service provider) and Invesco North American Holdings, Inc. (holding company); Director, Chief Executive Officer and President, Invesco Holding Company Limited (parent of Invesco and a global investment management firm); Director, Invesco Ltd.; Chairman, Investment Company Institute and President, Co-Chief Executive Officer, Co-President, Chief Operating Officer and Chief Financial Officer, Franklin Resources, Inc. (global investment management organization) | | 140 | | None |
| | | | | | | | | |
| | | | | | | | | |
| | | | | | | | | |
Philip A. Taylor2 — 1954
Trustee, President and Principal Executive Officer | | 2006 | | Head of North American Retail and Senior Managing Director, Invesco Ltd.; Director, Co-Chairman, Co-President and Co-Chief Executive Officer, Invesco Advisers, Inc. (formerly known as Invesco Institutional (N.A.), Inc.) (registered investment adviser); Director, Chairman, Chief Executive Officer and President, Invesco Management Group, Inc. (formerly Invesco Aim Management Group, Inc.) (financial services holding company); Director and President, INVESCO Funds Group, Inc. (registered investment adviser and registered transfer agent); Director and Chairman, Invesco Investment Services, Inc. (formerly known as Invesco Aim Investment Services, Inc.) (registered transfer agent) and IVZ Distributors, Inc. (formerly known as INVESCO Distributors, Inc.) (registered broker dealer); Director, President and Chairman, Invesco Inc. (holding company) and Invesco Canada Holdings Inc. (holding company); Chief Executive Officer, Invesco Corporate Class Inc. (corporate mutual fund company) and Invesco Canada Fund Inc. (corporate mutual fund company); Director, Chairman and Chief Executive Officer, Invesco Canada Ltd. (formerly known as Invesco Trimark Ltd./Invesco Trimark Ltèe) (registered investment adviser and registered transfer agent); Trustee, President and Principal Executive Officer, The Invesco Funds (other than AIM Treasurer’s Series Trust (Invesco Treasurer’s Series Trust) and Short-Term Investments Trust); Trustee and Executive Vice President, The Invesco Funds (AIM Treasurer’s Series Trust (Invesco Treasurer’s Series Trust) and Short-Term Investments Trust only); Director, Invesco Investment Advisers LLC (formerly known as Van Kampen Asset Management); Director, Chief Executive Officer and President, Van Kampen Exchange Corp. | | 140 | | None |
| | | | | | | | | |
| | | | | | | | | |
| | | | | Formerly: Director and Chairman, Van Kampen Investor Services Inc.: Director, Chief Executive Officer and President, 1371 Preferred Inc. (holding company); and Van Kampen Investments Inc.; Director and President, AIM GP Canada Inc. (general partner for limited partnerships); and Van Kampen Advisors, Inc.; Director and Chief Executive Officer, Invesco Trimark Dealer Inc. (registered broker dealer); Director, Invesco Distributors, Inc. (formerly known as Invesco Aim Distributors, Inc.) (registered broker dealer); Manager, Invesco PowerShares Capital Management LLC; Director, Chief Executive Officer and President, Invesco Advisers, Inc.; Director, Chairman, Chief Executive Officer and President, Invesco Aim Capital Management, Inc.; President, Invesco Trimark Dealer Inc. and Invesco Trimark Ltd./Invesco Trimark Ltèe; Director and President, AIM Trimark Corporate Class Inc. and AIM Trimark Canada Fund Inc.; Senior Managing Director, Invesco Holding Company Limited; Trustee and Executive Vice President, Tax-Free Investments Trust; Director and Chairman, Fund Management Company (former registered broker dealer); President and Principal Executive Officer, The Invesco Funds (AIM Treasurer’s Series Trust (Invesco Treasurer’s Series Trust), Short-Term Investments Trust and Tax-Free Investments Trust only); President, AIM Trimark Global Fund Inc. and AIM Trimark Canada Fund Inc. | | | | |
| | | | | | | | | |
| | | | | | | | | |
| | | | | | | | | |
Wayne W. Whalen3 — 1939
Trustee | | 2010 | | Of Counsel, and prior to 2010, partner in the law firm of Skadden, Arps, Slate, Meagher & Flom LLP, legal counsel to funds in the Fund Complex | | 158 | | Director of the Abraham Lincoln Presidential Library Foundation |
| | | | | | | | | |
| | | | | | | | | |
| | | | | | | | | |
Independent Trustees | | | | | | | | |
| | | | | | | | | |
| | | | | | | | | |
| | | | | | | | | |
Bruce L. Crockett — 1944
Trustee and Chair | | 1993 | | Chairman, Crockett Technology Associates (technology consulting company) | | 140 | | ACE Limited (insurance company); and Investment Company Institute |
| | | | | Formerly: Director, Captaris (unified messaging provider); Director, President and Chief Executive Officer COMSAT Corporation; and Chairman, Board of Governors of INTELSAT (international communications company) | | | | |
| | | | | | | | | |
| |
| 1 | Mr. Flanagan is considered an interested person of the Trust because he is an officer of the adviser to the Trust, and an officer and a director of Invesco Ltd., ultimate parent of the adviser to the Trust. |
| 2 | Mr. Taylor is considered an interested person of the Trust because he is an officer and a director of the adviser to, and a director of the principal underwriter of, the Trust. |
| 3 | Mr. Whalen is considered an “interested person” (within the meaning of Section 2(a)(19) of the 1940 Act) of certain Funds in the Fund Complex by reason of he and his firm currently providing legal services as legal counsel to such Funds in the Fund Complex. |
Invesco V.I. Technology Fund
Trustees and Officers—(continued)
The address of each trustee and officer is AIM Variable Insurance Funds (Invesco Variable Insurance Funds) (the “Trust”), 11 Greenway Plaza, Suite 2500, Houston, Texas 77046-1173. The trustees serve for the life of the Trust, subject to their earlier death, incapacitation, resignation, retirement or removal as more specifically provided in the Trust’s organizational documents. Each officer serves for a one year term or until their successors are elected and qualified. Column two below includes length of time served with predecessor entities, if any.
| | | | | | | | | |
| | | | | | | Number of Funds
| | |
Name, Year of Birth and
| | Trustee and/
| | Principal Occupation(s)
| | in Fund Complex
| | Other Directorship(s)
|
| Position(s) Held with the Trust | | or Officer Since | | During Past 5 Years | | Overseen by Trustee | | Held by Trustee |
| | | | | | | | | |
| | | | | | | | | |
| | | | | | | |
Independent Trustees—(continued) | | | | | | |
| | | | | | | | | |
| | | | | | | | | |
| | | | | | | | | |
David C. Arch — 1945
Trustee | | 2010 | | Chairman and Chief Executive Officer of Blistex Inc., a consumer health care products manufacturer. | | 158 | | Member of the Heartland Alliance Advisory Board, a nonprofit organization serving human needs based in Chicago. Board member of the Illinois Manufacturers’ Association. Member of the Board of Visitors, Institute for the Humanities, University of Michigan |
| | | | | | | | | |
| | | | | | | | | |
| | | | | | | | | |
Frank S. Bayley — 1939
Trustee | | 2001 | | Retired
Formerly: Director, Badgley Funds, Inc. (registered investment company) (2 portfolios) and Partner, law firm of Baker & McKenzie
Formerly: Director, Badgley Funds, Inc. (registered investment company) (2 portfolios) and Partner, law firm of Baker & McKenzie | | 140 | | Director and Chairman, C.D. Stimson Company (a real estate investment company) |
| | | | | | | | | |
| | | | | | | | | |
| | | | | | | | | |
James T. Bunch — 1942
Trustee | | 2004 | | Managing Member, Grumman Hill Group LLC (family office private equity management)
Formerly: Founder, Green, Manning & Bunch Ltd. (investment banking firm)(1988-2010); Executive Committee, United States Golf Association; and Director, Policy Studies, Inc. and Van Gilder Insurance Corporation | | 140 | | Vice Chairman, Board of Governors, Western Golf Association/Evans Scholars Foundation and Director, Denver Film Society |
| | | | | | | | | |
| | | | | | | | | |
| | | | | | | | | |
Rodney F. Dammeyer — 1940
Trustee | | 2010 | | President of CAC, LLC, a private company offering capital investment and management advisory services.
Formerly: Prior to January 2004, Director of TeleTech Holdings Inc.; Prior to 2002, Director of Arris Group, Inc.; Prior to 2001, Managing Partner at Equity Group Corporate Investments. Prior to 1995, Vice Chairman of Anixter International. Prior to 1985, experience includes Senior Vice President and Chief Financial Officer of Household International, Inc., Executive Vice President and Chief Financial Officer of Northwest Industries, Inc. and Partner of Arthur Andersen & Co. | | 158 | | Director of Quidel Corporation and Stericycle, Inc. Prior to May 2008, Trustee of The Scripps Research Institute. Prior to February 2008, Director of Ventana Medical Systems, Inc. Prior to April 2007, Director of GATX Corporation. Prior to April 2004, Director of TheraSense, Inc. |
| | | | | | | | | |
| | | | | | | | | |
| | | | | | | | | |
Albert R. Dowden — 1941
Trustee | | 2000 | | Director of a number of public and private business corporations, including the Boss Group, Ltd. (private investment and management); Reich & Tang Funds (5 portfolios) (registered investment company); and Homeowners of America Holding Corporation/ Homeowners of America Insurance Company (property casualty company)
Formerly: Director, Continental Energy Services, LLC (oil and gas pipeline service); Director, CompuDyne Corporation (provider of product and services to the public security market) and Director, Annuity and Life Re (Holdings), Ltd. (reinsurance company); Director, President and Chief Executive Officer, Volvo Group North America, Inc.; Senior Vice President, AB Volvo; Director of various public and private corporations; Chairman, DHJ Media, Inc.; Director Magellan Insurance Company; and Director, The Hertz Corporation, Genmar Corporation (boat manufacturer), National Media Corporation; Advisory Board of Rotary Power International (designer, manufacturer, and seller of rotary power engines); and Chairman, Cortland Trust, Inc. (registered investment company) | | 140 | | Board of Nature’s Sunshine Products, Inc. |
| | | | | | | | | |
| | | | | | | | | |
| | | | | | | | | |
Jack M. Fields — 1952
Trustee | | 1997 | | Chief Executive Officer, Twenty First Century Group, Inc. (government affairs company); and Owner and Chief Executive Officer, Dos Angelos Ranch, L.P. (cattle, hunting, corporate entertainment), Discovery Global Education Fund (non-profit) and Cross Timbers Quail Research Ranch (non-profit)
Formerly: Chief Executive Officer, Texana Timber LP (sustainable forestry company) and member of the U.S. House of Representatives | | 140 | | Administaff |
| | | | | | | | | |
| | | | | | | | | |
| | | | | | | | | |
Carl Frischling — 1937
Trustee | | 1993 | | Partner, law firm of Kramer Levin Naftalis and Frankel LLP | | 140 | | Director, Reich & Tang Funds (16 portfolios) |
| | | | | | | | | |
| | | | | | | | | |
Invesco V.I. Technology Fund
Trustees and Officers—(continued)
The address of each trustee and officer is AIM Variable Insurance Funds (Invesco Variable Insurance Funds) (the “Trust”), 11 Greenway Plaza, Suite 2500, Houston, Texas 77046-1173. The trustees serve for the life of the Trust, subject to their earlier death, incapacitation, resignation, retirement or removal as more specifically provided in the Trust’s organizational documents. Each officer serves for a one year term or until their successors are elected and qualified. Column two below includes length of time served with predecessor entities, if any.
| | | | | | | | | |
| | | | | | | Number of Funds
| | |
Name, Year of Birth and
| | Trustee and/
| | Principal Occupation(s)
| | in Fund Complex
| | Other Directorship(s)
|
| Position(s) Held with the Trust | | or Officer Since | | During Past 5 Years | | Overseen by Trustee | | Held by Trustee |
Independent Trustees—(continued) | | | | | | |
| | | | | | | | | |
| | | | | | | | | |
| | | | | | | | | |
Prema Mathai-Davis — 1950
Trustee | | 1998 | | Retired
Formerly: Chief Executive Officer, YWCA of the U.S.A. | | 140 | | None |
| | | | | | | | | |
| | | | | | | | | |
| | | | | | | | | |
Larry Soll — 1942
Trustee | | 2004 | | Retired
Formerly, Chairman, Chief Executive Officer and President, Synergen Corp. (a biotechnology company) | | 140 | | None |
| | | | | | | | | |
| | | | | | | | | |
| | | | | | | | | |
Hugo F. Sonnenschein — 1940
Trustee | | 2010 | | President Emeritus and Honorary Trustee of the University of Chicago and the Adam Smith Distinguished Service Professor in the Department of Economics at the University of Chicago. Prior to July 2000, President of the University of Chicago. | | 158 | | Trustee of the University of Rochester and a member of its investment committee. Member of the National Academy of Sciences, the American Philosophical Society and a fellow of the American Academy of Arts and Sciences |
| | | | | | | | | |
| | | | | | | | | |
| | | | | | | | | |
| Raymond Stickel, Jr. — 1944 Trustee | | 2005 | | Retired
Formerly: Director, Mainstay VP Series Funds, Inc. (25 portfolios) and Partner, Deloitte & Touche | | 140 | | None |
| | | | | | | | | |
| | | | | | | | | |
| | | | | | | | | |
Other Officers | | | | | | | | |
| | | | | | | | | |
| | | | | | | | | |
| | | | | | | | | |
Russell C. Burk — 1958
Senior Vice President and Senior Officer | | 2005 | | Senior Vice President and Senior Officer, The Invesco Funds | | N/A | | N/A |
| | | | | | | | | |
| | | | | | | | | |
| | | | | | | | | |
John M. Zerr — 1962
Senior Vice President, Chief Legal Officer and Secretary | | 2006 | | Director, Senior Vice President, Secretary and General Counsel, Invesco Management Group, Inc. (formerly known as Invesco Aim Management Group, Inc.) and Van Kampen Exchange Corp.; Senior Vice President, Invesco Advisers, Inc. (formerly known as Invesco Institutional (N.A.), Inc.) (registered investment adviser); Senior Vice President and Secretary, Invesco Distributors, Inc. (formerly known as Invesco Aim Distributors, Inc.); Director, Vice President and Secretary, Invesco Investment Services, Inc. (formerly known as Invesco Aim Investment Services, Inc.) and IVZ Distributors, Inc. (formerly known as INVESCO Distributors, Inc.); Director and Vice President, INVESCO Funds Group, Inc.; Senior Vice President, Chief Legal Officer and Secretary, The Invesco Funds; Manager, Invesco PowerShares Capital Management LLC; Director, Secretary and General Counsel, Invesco Investment Advisers LLC (formerly known as Van Kampen Asset Management); Secretary and General Counsel, Van Kampen Funds Inc. and Chief Legal Officer, PowerShares Exchange-Traded Fund Trust, PowerShares Exchange-Traded Fund Trust II, PowerShares India Exchange-Traded Fund Trust and PowerShares Actively Managed Exchange-Traded Fund Trust
Formerly: Director and Secretary, Van Kampen Advisors Inc.; Director Vice President, Secretary and General Counsel Van Kampen Investor Services Inc.; Director, Invesco Distributors, Inc. (formerly known as Invesco Aim Distributors, Inc.); Director, Senior Vice President, General Counsel and Secretary, Invesco Advisers, Inc.; and Van Kampen Investments Inc.; Director, Vice President and Secretary, Fund Management Company; Director, Senior Vice President, Secretary, General Counsel and Vice President, Invesco Aim Capital Management, Inc.; Chief Operating Officer and General Counsel, Liberty Ridge Capital, Inc. (an investment adviser); Vice President and Secretary, PBHG Funds (an investment company) and PBHG Insurance Series Fund (an investment company); Chief Operating Officer, General Counsel and Secretary, Old Mutual Investment Partners (a broker-dealer); General Counsel and Secretary, Old Mutual Fund Services (an administrator) and Old Mutual Shareholder Services (a shareholder servicing center); Executive Vice President, General Counsel and Secretary, Old Mutual Capital, Inc. (an investment adviser); and Vice President and Secretary, Old Mutual Advisors Funds (an investment company) | | N/A | | N/A |
| | | | | | | | | |
| | | | | | | | | |
| | | | | | | | | |
Lisa O. Brinkley — 1959
Vice President | | 2004 | | Global Compliance Director, Invesco Ltd.; Chief Compliance Officer, Invesco Investment Services, Inc.(formerly known as Invesco Aim Investment Services, Inc.); and Vice President, The Invesco Funds
Formerly: Chief Compliance Officer, Invesco Distributors, Inc. (formerly known as Invesco Aim Distributors, Inc.) and Van Kampen Investor Services Inc.; Senior Vice President, Invesco Management Group, Inc.; Senior Vice President and Chief Compliance Officer, Invesco Advisers, Inc. and The Invesco Funds; Vice President and Chief Compliance Officer, Invesco Aim Capital Management, Inc. and Invesco Distributors, Inc.; Vice President, Invesco Investment Services, Inc. and Fund Management Company | | N/A | | N/A |
| | | | | | | | | |
Invesco V.I. Technology Fund
Trustees and Officers—(continued)
The address of each trustee and officer is AIM Variable Insurance Funds (Invesco Variable Insurance Funds) (the “Trust”), 11 Greenway Plaza, Suite 2500, Houston, Texas 77046-1173. The trustees serve for the life of the Trust, subject to their earlier death, incapacitation, resignation, retirement or removal as more specifically provided in the Trust’s organizational documents. Each officer serves for a one year term or until their successors are elected and qualified. Column two below includes length of time served with predecessor entities, if any.
| | | | | | | | | |
| | | | | | | Number of Funds
| | |
Name, Year of Birth and
| | Trustee and/
| | Principal Occupation(s)
| | in Fund Complex
| | Other Directorship(s)
|
| Position(s) Held with the Trust | | or Officer Since | | During Past 5 Years | | Overseen by Trustee | | Held by Trustee |
Other Officers—(continued) | | | | | | |
| | | | | | | | | |
| | | | | | | | | |
| | | | | | | | | |
Sheri Morris — 1964
Vice President, Treasurer and Principal Financial Officer | | 1999 | | Vice President, Treasurer and Principal Financial Officer, The Invesco Funds; Vice President, Invesco Advisers, Inc. (formerly known as Invesco Institutional (N.A.), Inc.) (registered investment adviser).
Formerly: Treasurer, PowerShares Exchange-Traded Fund Trust, PowerShares Exchange-Traded Fund Trust II, PowerShares India Exchange-Traded Fund Trust and PowerShares Actively Managed Exchange-Traded Fund Trust, Vice President, Invesco Advisers, Inc., Invesco Aim Capital Management, Inc. and Invesco Aim Private Asset Management, Inc.; Assistant Vice President and Assistant Treasurer, The Invesco Funds and Assistant Vice President, Invesco Advisers, Inc., Invesco Aim Capital Management, Inc. and Invesco Aim Private Asset Management, Inc. | | N/A | | N/A |
| | | | | | | | | |
| | | | | | | | | |
| | | | | | | | | |
Karen Dunn Kelley — 1960
Vice President | | 1993 | | Head of Invesco’s World Wide Fixed Income and Cash Management Group; Senior Vice President, Invesco Management Group, Inc. (formerly known as Invesco Aim Management Group, Inc.) and Invesco Advisers, Inc. (formerly known as Invesco Institutional (N.A.), Inc.) (registered investment adviser); Executive Vice President, Invesco Distributors, Inc. (formerly known as Invesco Aim Distributors, Inc.); Director, Invesco Mortgage Capital Inc.; Vice President, The Invesco Funds (other than AIM Treasurer’s Series Trust (Invesco Treasurer’s Series Trust) and Short-Term Investments Trust); and President and Principal Executive Officer, The Invesco Funds (AIM Treasurer’s Series Trust (Invesco Treasurer’s Series Trust) and Short-Term Investments Trust only).
Formerly: Senior Vice President, Van Kampen Investments Inc.; Vice President, Invesco Advisers, Inc. (formerly known as Invesco Institutional (N.A.), Inc.); Director of Cash Management and Senior Vice President, Invesco Advisers, Inc. and Invesco Aim Capital Management, Inc.; President and Principal Executive Officer, Tax-Free Investments Trust; Director and President, Fund Management Company; Chief Cash Management Officer, Director of Cash Management, Senior Vice President, and Managing Director, Invesco Aim Capital Management, Inc.; Director of Cash Management, Senior Vice President, and Vice President, Invesco Advisers, Inc. and The Invesco Funds (AIM Treasurer’s Series Trust (Invesco Treasurer’s Series Trust), Short-Term Investments Trust and Tax-Free Investments Trust only) | | N/A | | N/A |
| | | | | | | | | |
| | | | | | | | | |
| | | | | | | | | |
Yinka Akinsola — 1977
Anti-Money Laundering Compliance Officer | | 2011 | | Anti-Money Laundering Compliance Officer, Invesco Advisers, Inc. (formerly known as Invesco Institutional (N.A.), Inc.) (registered investment adviser); Invesco Distributors, Inc. (formerly known as Invesco Aim Distributors, Inc.), Invesco Investment Services, Inc. (formerly known as Invesco Aim Investment Services, Inc.), Invesco Management Group, Inc., The Invesco Funds, Invesco Van Kampen Closed-End Funds, Van Kampen Exchange Corp. and Van Kampen Funds Inc. | | N/A | | N/A |
| | | | | | | | | |
| | | | | | | | | |
| | | | | | | | | |
Todd L. Spillane — 1958
Chief Compliance Officer | | 2006 | | Senior Vice President, Invesco Management Group, Inc. (formerly known as Invesco Aim Management Group, Inc.) and Van Kampen Exchange Corp.; Senior Vice President and Chief Compliance Officer, Invesco Advisers, Inc. (registered investment adviser) (formerly known as Invesco Institutional (N.A.), Inc.); Chief Compliance Officer, The Invesco Funds, INVESCO Private Capital Investments, Inc. (holding company) and Invesco Private Capital, Inc. (registered investment adviser); Vice President, Invesco Distributors, Inc. (formerly known as Invesco Aim Distributors, Inc.) and Invesco Investment Services, Inc. (formerly known as Invesco Aim Investment Services, Inc.).
Formerly: Chief Compliance Officer, Invesco Van Kampen Closed-End Funds PowerShares Exchange-Traded Fund Trust, PowerShares Exchange-Traded Fund Trust II, PowerShares India Exchange-Traded Fund Trust, and PowerShares Actively Managed Exchange-Traded Fund Trust; Senior Vice President, Van Kampen Investments Inc.; Senior Vice President and Chief Compliance Officer, Invesco Advisers, Inc. and Invesco Aim Capital Management, Inc.; Chief Compliance Officer, Invesco Global Asset Management (N.A.), Inc., Invesco Senior Secured Management, Inc. (registered investment adviser) and Van Kampen Investor Services Inc.; Vice President, Invesco Aim Capital Management, Inc. and Fund Management Company | | N/A | | N/A |
| | | | | | | | | |
The Statement of Additional Information of the Trust includes additional information about the Fund’s Trustees and is available upon request, without charge, by calling 1.800.959.4246. Please refer to the Fund’s prospectus for information on the Fund’s sub-advisers.
| | | | | | | |
Office of the Fund
11 Greenway Plaza, Suite 2500
Houston, TX 77046-1173 | | Investment Adviser
Invesco Advisers, Inc.
1555 Peachtree Street, N.E.
Atlanta, GA 30309 | | Distributor
Invesco Distributors, Inc.
11 Greenway Plaza, Suite 2500
Houston, TX 77046-1173 | | Auditors
PricewaterhouseCoopers LLP
1201 Louisiana Street, Suite 2900
Houston, TX 77002-5678 |
| | | | | | | |
| | | | | | | |
Counsel to the Fund
Stradley Ronon Stevens & Young, LLP
2600 One Commerce Square
Philadelphia, PA 19103 | | Counsel to the Independent Trustees
Kramer, Levin, Naftalis & Frankel LLP
1177 Avenue of the Americas
New York, NY 10036-2714 | | Transfer Agent
Invesco Investment Services, Inc.
11 Greenway Plaza, Suite 2500
Houston, TX77046-1173 | | Custodian
State Street Bank and Trust Company
225 Franklin
Boston, MA 02110-2801 |
Invesco V.I. Technology Fund
Invesco V.I. Utilities FundAnnual Report to Shareholders § December 31, 2011The Fund provides a complete list of its holdings four times in each fiscal year, at the quarter-ends. For the second and fourth quarters, the lists appear in the Fund’s semiannual and annual reports to shareholders. For the first and third quarters, the Fund files the lists with the Securities and Exchange Commission (SEC) on Form N-Q. The Fund’s Form N-Q filings are available on the SEC website, sec.gov. Copies of the Fund’s Forms N-Q may be reviewed and copied at the SEC Public Reference Room in Washington, D.C. You can obtain information on the operation of the Public Reference Room, including information about duplicating fee charges, by calling 202 551 8090 or 800 732 0330, or by electronic request at the following email address: publicinfo@sec.gov. The SEC file numbers for the Fund are 811-07452 and 033-57340. The Fund’s most recent portfolio holdings, as filed on Form N-Q, have also been made available to insurance companies issuing variable annuity contracts and variable life insurance policies (“variable products”) that invest in the Fund.
A description of the policies and procedures that the Fund uses to determine how to vote proxies relating to portfolio securities is available without charge, upon request, from our Client Services department at 800 959 4246 or at invesco.com/proxyguidelines. The information is also available on the SEC website, sec.gov.
Information regarding how the Fund voted proxies related to its portfolio securities during the 12 months ended June 30, 2011, is available at invesco.com/proxysearch. The information is also available on the SEC website, sec.gov.
Invesco Advisers, Inc. is an investment adviser; it provides investment advisory services to individual and institutional clients and does not sell securities. Invesco Distributors, Inc. is the U.S. distributor for Invesco Ltd.’s retail mutual funds, exchange-traded funds and institutional money market funds. Both are wholly owned, indirect subsidiaries of Invesco Ltd.
This report must be accompanied or preceded by a currently effective Fund prospectus and variable product prospectus, which contain more complete information, including sales charges and expenses. Investors should read each carefully before investing.
Invesco Distributors, Inc.
I-VIUTI-AR-1
| | | | | |
|
| | | | | |
NOT FDIC INSURED | | MAY LOSE VALUE | | NO BANK GUARANTEE |
Management’s Discussion of Fund Performance
Performance summary
For the 12 months ended December 31, 2011, Invesco V.I. Utilities Fund posted gains. Fund returns significantly outpaced the broad market, as measured by the S&P 500 Index, but underperformed the Fund’s style-specific benchmark, the S&P 500 Utilities Index. Performance drivers were primarily stock-specific as the electric utilities and multi-utilities industries contained some of the top contributors to Fund performance as well as the Fund’s top detractors.
Your Fund’s long-term performance appears later in this report.
Fund vs. Indexes
Total returns, 12/31/10 to 12/31/11, excluding variable product issuer charges.
If variable product issuer charges were included, returns would be lower.
| | | | | |
|
| Series I Shares | | | 16.45 | % |
| |
| Series II Shares | | | 16.15 | |
| |
S&P 500 Index▼ (Broad Market Index) | | | 2.09 | |
| |
S&P 500 Utilities Index▼ (Style-Specific Index) | | | 19.91 | |
| |
Lipper VUF Utility Funds Category Average▼ (Peer Group) | | | 7.92 | |
| |
Source(s): ▼Lipper Inc.
How we invest
In selecting investments, we focus on companies in the electric utilities, natural gas, water and telecommunications industries. We emphasize companies with solid balance sheets and operational cash flows that support sustained or increasing dividends. Fundamental research and financial statement analysis are the backbone of our bottom-up investment process. Using a variety of valuation techniques, we estimate the potential return of holdings over a two-year investment period. We construct the portfolio to provide what we believe to be the best combination of price appreciation potential, dividend income and risk profile, and the Fund typically maintains full sector exposure. We strive to manage risk by maintaining an average of 30 to 50 positions, low portfolio turnover, and a rigorous sell discipline.
We are committed to providing strategic exposure to a traditionally defensive and income-oriented asset class by using
a total return approach to managing the Fund, emphasizing capital appreciation, current income and capital preservation.
Market conditions and your Fund
Equity markets were volatile during 2011, but the broad market, as measured by the S&P 500 Index, still managed to post a small gain. In the first quarter most major indexes performed well, fueled by the second round of “quantitative easing” from the U.S. Federal Reserve. However, with the spring came increased volatility and significant macroeconomic distortions due to civil unrest in Egypt and Libya, flooding in Australia, and a devastating earthquake and tsunami in Japan. Corporate earnings remained strong with largely positive surprises, but were often overshadowed by investor concerns about continuing high unemployment and soft housing data. Although markets stabilized and were generally in positive territory throughout the summer, major equity indexes sold off precipitously in
August as the U.S. government struggled to raise the nation’s debt ceiling. Despite an eventual agreement between the White House and Congress, credit rating agency Standard & Poor’s announced the first-ever downgrade to long-term U.S. government debt. Uncertainty created by the downgrade combined with worries over the debt crisis in the eurozone caused fears of a global recession. Despite evidence of sustained but muted growth, these macroeconomic factors continued to weigh on markets through the end of the reporting period. While many of the developments of the past year were newsworthy, as investors, we believe success is achieved by remaining focused on company fundamentals and maintaining a long-term perspective.
Sector performance within the S&P 500 Index was mixed for the year. The utilities sector had the highest return, while financials had the lowest. The utilities sector returned 19.91% for the period, as compared to 2.09% for the overall S&P 500 Index.1
Dominion Resources, a largely regulated utility company, was the largest contributor to the Fund’s performance. The company provides electricity and natural gas to customers in Virginia, West Virginia, Ohio, Pennsylvania and eastern North Carolina as well as operating the largest gas storage facility in the nation. Dominion benefited from a constructive regulatory framework in Virginia, which should allow for continued and stable capital investment at the company’s utility business in the state. Additionally, the company’s infrastructure business remains focused on gas project development in the Marcellus Shale region.
Southern Union was also among the top contributors to Fund performance
Portfolio Composition
By sector
| | | | | |
|
| Utilities | | | 88.5 | % |
| |
| Telecommunication Services | | | 4.4 | |
| |
Money Market Funds Plus Other Assets | | | | |
Less Liabilities | | | 7.1 | |
Top 10 Equity Holdings*
| | | | | | | | | |
|
| | 1. | | Southern Co. | | | 5.0 | % |
| |
| | 2. | | American Electric Power Co., Inc. | | | 4.9 | |
| |
| | 3. | | Xcel Energy, Inc. | | | 4.7 | |
| |
| | 4. | | Dominion Resources, Inc. | | | 4.6 | |
| |
| | 5. | | Portland General Electric Co. | | | 4.5 | |
| |
| | 6. | | Pepco Holdings, Inc. | | | 4.3 | |
| |
| | 7. | | Exelon Corp. | | | 4.3 | |
| |
| | 8. | | National Grid PLC | | | 4.3 | |
| |
| | 9. | | Entergy Corp. | | | 3.9 | |
| |
| | 10. | | Edison International | | | 3.7 | |
| | | | | |
|
| Total Net Assets | | $72.8 million | |
| | | | | |
| Total Number of Holdings* | | | 37 | |
The Fund’s holdings are subject to change, and there is no assurance that the Fund will continue to hold any particular security.
*Excluding money market fund holdings.
Invesco V.I. Utilities Fund
during the year. The company’s earnings increased as a large pipeline expansion project in Florida was completed on time and on budget. The stock’s strong performance was largely due to competing offers from The Williams Companies and Energy Transfer (not Fund holdings) to purchase Southern Union. Terms to acquire the company were announced by Energy Transfer, and it is set to close in early 2012.
The largest detractor from Fund performance was E.ON, a diversified utility provider and nuclear generator based in Germany. Weakness in the stock was driven by government mandated nuclear plant shutdowns following the Fukushima nuclear event in Japan. The company also suffered from weak gas market conditions across Europe.
California based PG&E was also among the largest detractors from results. Following the September 2010 San Bruno gas pipeline explosion, the company faced increased regulatory scrutiny. In March 2011, the California Public Utilities Commission ordered PG&E to turn over records pertaining to safety inspections. The regulatory review is ongoing. Total fines, as well as required spending to improve the pipeline, have yet to be determined.
There were no major positioning changes in the Fund during the reporting period; however, Fund holdings were sold in oil, gas and consumable fuels, while holdings in multi-utilities as well as independent power producers and energy traders were added. We continued to emphasize regulated over nonregulated companies. At the end of the reporting period, the Fund’s largest industry allocations were in the electric utilities and multi-utilities industries.
We’d like to thank you for your continued investment in Invesco V.I. Utilities Fund. We reiterate our commitment to providing investors strategic exposure to a traditionally defensive and income-oriented asset class through our total return approach, emphasizing capital appreciation, current income and capital preservation.
1 Source: Lipper Inc.
The views and opinions expressed in management’s discussion of Fund performance are those of Invesco Advisers, Inc. These views and opinions are subject to change at any time based on factors such as market and economic conditions. These views and opinions may not be relied upon as investment advice or recommendations, or as an offer for a particular security. The information is not a complete analysis of every aspect of any market, country, industry, security or the Fund. Statements of fact are from sources considered reliable, but Invesco Advisers, Inc. makes no representation or warranty as to their completeness or accuracy. Although historical performance is no guarantee of future results, these insights may help you understand our investment management philosophy.
See important Fund and, if applicable, index disclosures later in this report.
Meggan Walsh
Chartered Financial Analyst, portfolio manager, is lead manager of Invesco V.I. Utilities Fund. Ms. Walsh began her career in the investment industry in 1987 and joined Invesco in 1991. Ms. Walsh earned a B.S. in finance from the University of Maryland and an M.B.A. from Loyola University Maryland.
Robert Botard
Chartered Financial Analyst, portfolio manager, is manager of Invesco V.I. Utilities Fund. Mr. Botard began his career in the investment industry in 1991 and joined Invesco in 1993. Mr. Botard earned a B.B.A. in both finance and international business from The University of Texas at Austin and a Master of International Management degree from the American Graduate School of International Management, Thunderbird.
Invesco V.I. Utilities Fund
Your Fund’s Long-Term Performance
Results of a $10,000 Investment – Oldest Share Class(es)
Fund and index data from 12/31/01*
1 Source: Lipper Inc.
| |
| * | During the reporting period, Invesco changed its policy regarding growth of $10,000 charts. For funds older than 10 years, we previously showed performance since inception. Going forward, we will show performance for the most recent 10 years, since this more accurately reflects the experience of the typical shareholder. As a result, charts now may include benchmarks that did not appear previously, because the funds’ inception pre-dated the benchmarks’ inception. Also, all charts will now be presented using a linear format. |
Past performance cannot guarantee comparable future results.
Average Annual Total Returns
As of 12/31/11
| | | | | | | | | |
|
| Series I Shares | | | | |
| |
| Inception (12/30/94) | | | 7.04 | % |
| |
| | 10 | | | Years | | | 7.00 | |
| |
| | 5 | | | Years | | | 3.03 | |
| |
| | 1 | | | Year | | | 16.45 | |
| |
| | | | | | | | | |
| Series II Shares | | | | |
| |
| | 10 | | | Years | | | 6.74 | % |
| |
| | 5 | | | Years | | | 2.76 | |
| |
| | 1 | | | Year | | | 16.15 | |
Series II shares incepted on April 30, 2004. Performance shown prior to that date is that of Series I shares, restated to reflect the higher 12b-1 fees applicable to Series II. Series I performance reflects any applicable fee waivers or expense reimbursements. The performance of the Fund’s Series I and Series II share classes will differ primarily due to different class expenses.
The performance data quoted represent past performance and cannot guarantee comparable future results; current performance may be lower or higher. Please contact your variable
product issuer or financial adviser for the most recent month-end variable product performance. Performance figures reflect Fund expenses, reinvested distributions and changes in net asset value. Investment return and principal value will fluctuate so that you may have a gain or loss when you sell shares.
The net annual Fund operating expense ratio set forth in the most recent Fund prospectus as of the date of this report for Series I and Series II shares was 0.93% and 1.18%, respectively.1 The total annual Fund operating expense ratio set forth in the most recent Fund prospectus as of the date of this report for Series I and Series II shares was 1.04% and 1.29%, respectively. The expense ratios presented above may vary from the expense ratios presented in other sections of this report that are based on expenses incurred during the period covered by this report.
Invesco V.I. Utilities Fund, a series portfolio of AIM Variable Insurance Funds (Invesco Variable Insurance
Funds), is currently offered through insurance companies issuing variable products. You cannot purchase shares of the Fund directly. Performance figures given represent the Fund and are not intended to reflect actual variable product values. They do not reflect sales charges, expenses and fees assessed in connection with a variable product. Sales charges, expenses and fees, which are determined by the variable product issuers, will vary and will lower the total return.
The most recent month-end performance data at the Fund level, excluding variable product charges, is available at 800 451 4246. As mentioned above, for the most recent month-end performance including variable product charges, please contact your variable product issuer or financial adviser.
| | |
| 1 | | Total annual Fund operating expenses after any contractual fee waivers and/or expense reimbursements by the adviser in effect through at least April 30, 2012. See current prospectus for more information. |
Invesco V.I. Utilities Fund
Invesco V.I. Utilities Fund’s investment objective is long-term growth of capital and, secondarily, current income.
| n | | Unless otherwise stated, information presented in this report is as of December 31, 2011, and is based on total net assets. |
| |
| n | | Unless otherwise noted, all data provided by Invesco. |
| |
| n | | To access your Fund’s reports/prospectus, visit invesco.com/fundreports. |
Principal risks of investing
in the Fund
Foreign securities risk. The Fund’s foreign investments may be affected by changes in a foreign country’s exchange rates; political and social instability; changes in economic or taxation policies; difficulties when enforcing obligations; decreased liquidity; and increased volatility. Foreign companies may be subject to less regulation resulting in less publicly available information about the companies.
IPO risk. Although the Fund’s return during certain periods was positively impacted by its investments in initial public offerings (IPOs), there can be no assurance that the Fund will have favorable IPO investment opportunities in the future.
Management risk. The investment techniques and risk analysis used by the Fund’s portfolio managers may not produce the desired results.
Market risk. The prices of and the income generated by the Fund’s securities may decline in response to, among other things, investor sentiment; general economic and market conditions; regional or global instability; and currency and interest rate fluctuations.
Sector fund risk. The Fund’s investments are concentrated in a comparatively narrow segment of the economy, which may make the Fund more volatile than non-concentrated funds.
Small- and mid-capitalization risks. Stocks of small and mid-sized companies tend to be more vulnerable to adverse developments in the above factors and may have little or no operating history or track record of success, and limited product lines, markets, management and financial resources. The securities of small and mid-sized companies may be more volatile due to less market interest and less publicly available information about the issuer. They also may be illiquid or restricted as to resale, or may trade less frequently and in smaller volumes, all of which may cause difficulty when establishing or closing a position at a desirable price.
Utilities sector risk. The following factors may affect the Fund’s investments in the utilities sector: governmental regulation, economic factors, ability of the issuer to obtain financing, prices of natural resources and risks associated with nuclear power.
About indexes used in this report
The S&P 500® Index is an unmanaged index considered representative of the U.S. stock market.
The S&P 500 Utilities Index is an unmanaged index considered representative of the utilities market.
The Lipper VUF Utility Funds Category Average represents an average of all of the variable insurance underlying funds in the Lipper Utility Funds category.
The Fund is not managed to track the performance of any particular index, including the index(es) defined here, and consequently, the performance of the Fund may deviate significantly from the performance of the index(es).
A direct investment cannot be made in an index. Unless otherwise indicated, index results include reinvested dividends, and they do not reflect sales charges. Performance of the peer group, if applicable, reflects fund expenses; performance of a market index does not.
Other information
The Chartered Financial Analyst® (CFA®) designation is globally recognized and attests to a charterholder’s success in a rigorous and comprehensive study program in the field of investment management and research analysis.
Industry classifications used in this report are generally according to the Global Industry Classification Standard, which was developed by and is the exclusive property and a service mark of MSCI Inc. and Standard & Poor’s.
The returns shown in management’s discussion of Fund performance are based on net asset values calculated for shareholder transactions. Generally accepted accounting principles require adjustments to be made to the net assets of the Fund at period end for financial reporting purposes, and as such, the net asset values for shareholder transactions and the returns based on those net asset values may differ from the net asset values and returns reported in the Financial Highlights. Additionally, the returns and net asset values shown throughout this report are at the Fund level only and do not include variable product issuer charges. If such charges were included, the total returns would be lower.
Invesco V.I. Utilities Fund
Schedule of Investments(a)
December 31, 2011
| | | | | | | | | |
| | | Shares | | Value |
| |
Common Stocks–92.92%
| | | | |
Electric Utilities–47.01%
| | | | |
| American Electric Power Co., Inc. | | | 86,745 | | | $ | 3,583,436 | |
| |
| Duke Energy Corp. | | | 99,961 | | | | 2,199,142 | |
| |
| E.ON AG (Germany) | | | 53,357 | | | | 1,147,017 | |
| |
| Edison International | | | 64,154 | | | | 2,655,976 | |
| |
| Entergy Corp. | | | 38,823 | | | | 2,836,020 | |
| |
| Exelon Corp. | | | 71,910 | | | | 3,118,737 | |
| |
| FirstEnergy Corp. | | | 37,067 | | | | 1,642,068 | |
| |
| NextEra Energy, Inc. | | | 13,427 | | | | 817,436 | |
| |
| Northeast Utilities | | | 56,909 | | | | 2,052,708 | |
| |
| Pepco Holdings, Inc. | | | 155,120 | | | | 3,148,936 | |
| |
| Pinnacle West Capital Corp. | | | 23,157 | | | | 1,115,704 | |
| |
| Portland General Electric Co. | | | 129,466 | | | | 3,274,195 | |
| |
| PPL Corp. | | | 60,234 | | | | 1,772,084 | |
| |
| Progress Energy, Inc. | | | 21,604 | | | | 1,210,256 | |
| |
| Southern Co. | | | 79,108 | | | | 3,661,909 | |
| |
| | | | | | | | 34,235,624 | |
| |
Gas Utilities–6.00%
| | | | |
| AGL Resources, Inc. | | | 38,623 | | | | 1,632,208 | |
| |
| Atmos Energy Corp. | | | 16,927 | | | | 564,516 | |
| |
| ONEOK, Inc. | | | 8,842 | | | | 766,513 | |
| |
| UGI Corp. | | | 47,738 | | | | 1,403,497 | |
| |
| | | | | | | | 4,366,734 | |
| |
Independent Power Producers & Energy Traders–6.35%
| | | | |
Calpine Corp.(b) | | | 106,319 | | | | 1,736,189 | |
| |
| Constellation Energy Group, Inc. | | | 31,764 | | | | 1,260,078 | |
| |
NRG Energy, Inc.(b) | | | 90,028 | | | | 1,631,307 | |
| |
| | | | | | | | 4,627,574 | |
| |
Integrated Telecommunication Services–4.43%
| | | | |
| AT&T Inc. | | | 28,008 | | | | 846,962 | |
| |
| CenturyLink Inc. | | | 25,623 | | | | 953,175 | |
| |
| Verizon Communications, Inc. | | | 35,589 | | | | 1,427,831 | |
| |
| | | | | | | | 3,227,968 | |
| |
Multi-Utilities–28.19%
| | | | |
| CMS Energy Corp. | | | 31,778 | | | | 701,658 | |
| |
| Consolidated Edison, Inc. | | | 9,005 | | | | 558,580 | |
| |
| Dominion Resources, Inc. | | | 63,741 | | | | 3,383,372 | |
| |
| DTE Energy Co. | | | 24,967 | | | | 1,359,453 | |
| |
| National Grid PLC (United Kingdom) | | | 320,668 | | | | 3,113,286 | |
| |
| NiSource, Inc. | | | 30,658 | | | | 729,967 | |
| |
| PG&E Corp. | | | 35,059 | | | | 1,445,132 | |
| |
| Public Service Enterprise Group, Inc. | | | 43,704 | | | | 1,442,669 | |
| |
| Sempra Energy | | | 37,558 | | | | 2,065,690 | |
| |
| TECO Energy, Inc. | | | 120,370 | | | | 2,303,882 | |
| |
| Xcel Energy, Inc. | | | 124,133 | | | | 3,431,036 | |
| |
| | | | | | | | 20,534,725 | |
| |
Oil & Gas Storage & Transportation–0.94%
| | | | |
| Southern Union Co. | | | 16,278 | | | | 685,467 | |
| |
| Total Common Stocks (Cost $54,125,148) | | | | | | | 67,678,092 | |
| |
Money Market Funds–6.93%
| | | | |
Liquid Assets Portfolio–Institutional Class(c) | | | 2,524,688 | | | | 2,524,688 | |
| |
Premier Portfolio–Institutional Class(c) | | | 2,524,689 | | | | 2,524,689 | |
| |
| Total Money Market Funds (Cost $5,049,377) | | | | | | | 5,049,377 | |
| |
| TOTAL INVESTMENTS–99.85% (Cost $59,174,525) | | | | | | | 72,727,469 | |
| |
| OTHER ASSETS LESS LIABILITIES–0.15% | | | | | | | 106,044 | |
| |
| NET ASSETS–100.00% | | | | | | $ | 72,833,513 | |
| |
Notes to Schedule of Investments:
| | |
| (a) | | Industry and/or sector classifications used in this report are generally according to the Global Industry Classification Standard, which was developed by and is the exclusive property and a service mark of MSCI Inc. and Standard & Poor’s. |
| (b) | | Non-income producing security. |
| (c) | | The money market fund and the Fund are affiliated by having the same investment adviser. |
See accompanying Notes to Financial Statements which are an integral part of the financial statements.
Invesco V.I. Utilities Fund
Statement of Assets and Liabilities
December 31, 2011
| | | | | |
Assets:
|
| Investments, at value (Cost $54,125,148) | | $ | 67,678,092 | |
| |
| Investments in affiliated money market funds, at value and cost | | | 5,049,377 | |
| |
| Total investments, at value (Cost $59,174,525) | | | 72,727,469 | |
| |
| Receivable for: | | | | |
| Fund shares sold | | | 99,350 | |
| |
| Dividends | | | 318,874 | |
| |
| Investment for trustee deferred compensation and retirement plans | | | 41,249 | |
| |
| Total assets | | | 73,186,942 | |
| |
Liabilities:
|
| Payable for: | | | | |
| Fund shares reacquired | | | 225,190 | |
| |
| Accrued fees to affiliates | | | 40,416 | |
| |
| Accrued other operating expenses | | | 32,119 | |
| |
| Trustee deferred compensation and retirement plans | | | 55,704 | |
| |
| Total liabilities | | | 353,429 | |
| |
| Net assets applicable to shares outstanding | | $ | 72,833,513 | |
| |
Net assets consist of:
|
| Shares of beneficial interest | | $ | 54,988,912 | |
| |
| Undistributed net investment income | | | 2,091,940 | |
| |
| Undistributed net realized gain | | | 2,199,937 | |
| |
| Unrealized appreciation | | | 13,552,724 | |
| |
| | | $ | 72,833,513 | |
| |
Net Assets:
|
| Series I | | $ | 70,955,709 | |
| |
| Series II | | $ | 1,877,804 | |
| |
Shares outstanding, $0.001 par value per share, with an unlimited number of shares authorized:
|
| Series I | | | 4,239,612 | |
| |
| Series II | | | 112,931 | |
| |
| Series I: | | | | |
| Net asset value per share | | $ | 16.74 | |
| |
| Series II: | | | | |
| Net asset value per share | | $ | 16.63 | |
| |
Statement of Operations
For the year ended December 31, 2011
| | | | | |
Investment income:
|
| Dividends (net of foreign withholding taxes of $17,440) | | $ | 2,773,403 | |
| |
| Dividends from affiliated money market funds | | | 3,364 | |
| |
| Total investment income | | | 2,776,767 | |
| |
Expenses: |
|
| Advisory fees | | | 400,703 | |
| |
| Administrative services fees | | | 200,579 | |
| |
| Custodian fees | | | 5,789 | |
| |
| Distribution fees — Series II | | | 4,526 | |
| |
| Transfer agent fees | | | 21,383 | |
| |
| Trustees’ and officers’ fees and benefits | | | 20,446 | |
| |
| Other | | | 48,927 | |
| |
| Total expenses | | | 702,353 | |
| |
| Less: Fees waived | | | (81,236 | ) |
| |
| Net expenses | | | 621,117 | |
| |
| Net investment income | | | 2,155,650 | |
| |
Realized and unrealized gain from:
|
| Net realized gain (loss) from: | | | | |
| Investment securities | | | 3,891,720 | |
| |
| Foreign currencies | | | (2,305 | ) |
| |
| | | | 3,889,415 | |
| |
| Change in net unrealized appreciation (depreciation) of: | | | | |
| Investment securities | | | 4,256,218 | |
| |
| Foreign currencies | | | (3,719 | ) |
| |
| | | | 4,252,499 | |
| |
| Net realized and unrealized gain | | | 8,141,914 | |
| |
| Net increase in net assets resulting from operations | | $ | 10,297,564 | |
| |
See accompanying Notes to Financial Statements which are an integral part of the financial statements.
Invesco V.I. Utilities Fund
Statement of Changes in Net Assets
For the years ended December 31, 2011 and 2010
| | | | | | | | | |
| | | 2011 | | 2010 |
| |
Operations:
| | | | |
| Net investment income | | $ | 2,155,650 | | | $ | 2,154,889 | |
| |
| Net realized gain | | | 3,889,415 | | | | 2,280,276 | |
| |
| Change in net unrealized appreciation (depreciation) | | | 4,252,499 | | | | (674,565 | ) |
| |
| Net increase in net assets resulting from operations | | | 10,297,564 | | | | 3,760,600 | |
| |
Distributions to shareholders from net investment income:
| | | | |
| Series I | | | (2,123,528 | ) | | | (2,309,020 | ) |
| |
| Series II | | | (57,674 | ) | | | (55,316 | ) |
| |
| Total distributions from net investment income | | | (2,181,202 | ) | | | (2,364,336 | ) |
| |
Share transactions–net:
| | | | |
| Series I | | | (898,765 | ) | | | (8,086,914 | ) |
| |
| Series II | | | (34,322 | ) | | | (32,168 | ) |
| |
| Net increase (decrease) in net assets resulting from share transactions | | | (933,087 | ) | | | (8,119,082 | ) |
| |
| Net increase (decrease) in net assets | | | 7,183,275 | | | | (6,722,818 | ) |
| |
Net assets:
| | | | |
| Beginning of year | | | 65,650,238 | | | | 72,373,056 | |
| |
| End of year (includes undistributed net investment income of $2,091,940 and $2,119,797, respectively) | | $ | 72,833,513 | | | $ | 65,650,238 | |
| |
Notes to Financial Statements
December 31, 2011
NOTE 1—Significant Accounting Policies
Invesco V.I. Utilities Fund (the “Fund”) is a series portfolio of AIM Variable Insurance Funds (Invesco Variable Insurance Funds) (the “Trust”). The Trust is a Delaware statutory trust registered under the Investment Company Act of 1940, as amended (the “1940 Act”), as an open-end series management investment company consisting of twenty-eight separate portfolios, (each constituting a “Fund”). The assets, liabilities and operations of each portfolio are accounted for separately. Information presented in these financial statements pertains only to the Fund. Matters affecting each Fund or class will be voted on exclusively by the shareholders of such Fund or class. Current Securities and Exchange Commission (“SEC”) guidance, however, requires participating insurance companies offering separate accounts to vote shares proportionally in accordance with the instructions of the contract owners whose investments are funded by shares of each Fund or class.
The Fund’s investment objective is long-term growth of capital and, secondarily, current income.
The Fund currently offers two classes of shares, Series I and Series II, both of which are offered to insurance company separate accounts funding variable annuity contracts and variable life insurance policies (“variable products”).
The following is a summary of the significant accounting policies followed by the Fund in the preparation of its financial statements.
| | |
| A. | | Security Valuations — Securities, including restricted securities, are valued according to the following policy. |
| | A security listed or traded on an exchange (except convertible bonds) is valued at its last sales price or official closing price as of the close of the customary trading session on the exchange where the security is principally traded, or lacking any sales or official closing price on a particular day, the security may be valued at the closing bid price on that day. Securities traded in the over-the-counter market are valued based on prices furnished by independent pricing services or market makers. When such securities are valued by an independent pricing service they may be considered fair valued. Futures contracts are valued at the final settlement price set by an exchange on which they are principally traded. Listed options are valued at the mean between the last bid and ask prices from the exchange on which they are principally traded. Options not listed on an exchange are valued by an independent source at the mean between the last bid and ask prices. For purposes of determining net asset value per share, futures and option contracts generally are valued 15 minutes after the close of the customary trading session of the New York Stock Exchange (“NYSE”). |
| | Investments in open-end and closed-end registered investment companies that do not trade on an exchange are valued at the end of day net asset value per share. Investments in open-end and closed-end registered investment companies that trade on an exchange are valued at the last sales price or official closing price as of the close of the customary trading session on the exchange where the security is principally traded. |
| | Debt obligations (including convertible bonds) and unlisted equities are fair valued using an evaluated quote provided by an independent pricing service. Evaluated quotes provided by the pricing service may be determined without exclusive reliance on quoted prices, and may reflect appropriate factors such as |
Invesco V.I. Utilities Fund
| | |
| | institution-size trading in similar groups of securities, developments related to specific securities, dividend rate, yield, quality, type of issue, coupon rate, maturity, individual trading characteristics and other market data. Debt securities are subject to interest rate and credit risks. In addition, all debt securities involve some risk of default with respect to interest and/or principal payments. |
| | Foreign securities (including foreign exchange contracts) are converted into U.S. dollar amounts using the applicable exchange rates as of the close of the NYSE. If market quotations are available and reliable for foreign exchange traded equity securities, the securities will be valued at the market quotations. Because trading hours for certain foreign securities end before the close of the NYSE, closing market quotations may become unreliable. If between the time trading ends on a particular security and the close of the customary trading session on the NYSE, events occur that are significant and make the closing price unreliable, the Fund may fair value the security. If the event is likely to have affected the closing price of the security, the security will be valued at fair value in good faith using procedures approved by the Board of Trustees. Adjustments to closing prices to reflect fair value may also be based on a screening process of an independent pricing service to indicate the degree of certainty, based on historical data, that the closing price in the principal market where a foreign security trade is not the current value as of the close of the NYSE. Foreign securities meeting the approved degree of certainty that the price is not reflective of current value will be priced at the indication of fair value from the independent pricing service. Multiple factors may be considered by the independent pricing service in determining adjustments to reflect fair value and may include information relating to sector indices, American Depositary Receipts and domestic and foreign index futures. Foreign securities may have additional risks including exchange rate changes, potential for sharply devalued currencies and high inflation, political and economic upheaval, the relative lack of issuer information, relatively low market liquidity and the potential lack of strict financial and accounting controls and standards. |
| | Securities for which market prices are not provided by any of the above methods may be valued based upon quotes furnished by independent sources. The last bid price may be used to value equity securities. The mean between the last bid and asked prices is used to value debt obligations, including Corporate Loans. |
| | Securities for which market quotations are not readily available or are unreliable are valued at fair value as determined in good faith by or under the supervision of the Trust’s officers following procedures approved by the Board of Trustees. Issuer specific events, market trends, bid/ask quotes of brokers and information providers and other market data may be reviewed in the course of making a good faith determination of a security’s fair value. |
| | Valuations change in response to many factors including the historical and prospective earnings of the issuer, the value of the issuer’s assets, general economic conditions, interest rates, investor perceptions and market liquidity. Because of the inherent uncertainties of valuation, the values reflected in the financial statements may materially differ from the value received upon actual sale of those investments. |
| B. | | Securities Transactions and Investment Income — Securities transactions are accounted for on a trade date basis. Realized gains or losses on sales are computed on the basis of specific identification of the securities sold. Interest income is recorded on the accrual basis from settlement date. Dividend income (net of withholding tax, if any) is recorded on the ex-dividend date. |
| | The Fund may periodically participate in litigation related to Fund investments. As such, the Fund may receive proceeds from litigation settlements. Any proceeds received are included in the Statement of Operations as realized gain (loss) for investments no longer held and as unrealized gain (loss) for investments still held. |
| | Brokerage commissions and mark ups are considered transaction costs and are recorded as an increase to the cost basis of securities purchased and/or a reduction of proceeds on a sale of securities. Such transaction costs are included in the determination of net realized and unrealized gain (loss) from investment securities reported in the Statement of Operations and the Statement of Changes in Net Assets and the net realized and unrealized gains (losses) on securities per share in the Financial Highlights. Transaction costs are included in the calculation of the Fund’s net asset value and, accordingly, they reduce the Fund’s total returns. These transaction costs are not considered operating expenses and are not reflected in net investment income reported in the Statement of Operations and Statement of Changes in Net Assets, or the net investment income per share and ratios of expenses and net investment income reported in the Financial Highlights, nor are they limited by any expense limitation arrangements between the Fund and the investment adviser. |
| | The Fund allocates income and realized and unrealized capital gains and losses to a class based on the relative net assets of each class. |
| C. | | Country Determination — For the purposes of making investment selection decisions and presentation in the Schedule of Investments, the investment adviser may determine the country in which an issuer is located and/or credit risk exposure based on various factors. These factors include the laws of the country under which the issuer is organized, where the issuer maintains a principal office, the country in which the issuer derives 50% or more of its total revenues and the country that has the primary market for the issuer’s securities, as well as other criteria. Among the other criteria that may be evaluated for making this determination are the country in which the issuer maintains 50% or more of its assets, the type of security, financial guarantees and enhancements, the nature of the collateral and the sponsor organization. Country of issuer and/or credit risk exposure has been determined to be the United States of America, unless otherwise noted. |
| D. | | Distributions — Distributions from income and net realized capital gain, if any, are generally paid to separate accounts of participating insurance companies annually and recorded on ex-dividend date. |
| E. | | Federal Income Taxes — The Fund intends to comply with the requirements of Subchapter M of the Internal Revenue Code necessary to qualify as a regulated investment company and to distribute substantially all of the Fund’s taxable earnings to shareholders. As such, the Fund will not be subject to federal income taxes on otherwise taxable income (including net realized capital gain) that is distributed to shareholders. Therefore, no provision for federal income taxes is recorded in the financial statements. |
| | The Fund files tax returns in the U.S. Federal jurisdiction and certain other jurisdictions. Generally, the Fund is subject to examinations by such taxing authorities for up to three years after the filing of the return for the tax period. |
| F. | | Expenses — Fees provided for under the Rule 12b-1 plan of a particular class of the Fund and which are directly attributable to that class are charged to the operations of such class. All other expenses are allocated among the classes based on relative net assets. |
| G. | | Accounting Estimates — The preparation of financial statements in conformity with accounting principles generally accepted in the United States of America (“GAAP”) requires management to make estimates and assumptions that affect the reported amounts of assets and liabilities at the date of the financial statements and the reported amounts of revenues and expenses during the reporting period including estimates and assumptions related to |
Invesco V.I. Utilities Fund
| | |
| | taxation. Actual results could differ from those estimates by a significant amount. In addition, the Fund monitors for material events or transactions that may occur or become known after the period-end date and before the date the financial statements are released to print. |
| H. | | Indemnifications — Under the Trust’s organizational documents, each Trustee, officer, employee or other agent of the Trust is indemnified against certain liabilities that may arise out of performance of their duties to the Fund. Additionally, in the normal course of business, the Fund enters into contracts, including the Fund’s servicing agreements that contain a variety of indemnification clauses. The Fund’s maximum exposure under these arrangements is unknown as this would involve future claims that may be made against the Fund that have not yet occurred. The risk of material loss as a result of such indemnification claims is considered remote. |
| I. | | Other Risks — The Fund’s investments are concentrated in a comparatively narrow segment of the economy, which may make the Fund more volatile. |
| | The Fund may invest a large percentage of its assets in a limited number of securities or other instruments, which could negatively affect the value of the Fund. |
| | The following factors may affect the Fund’s investments in the utilities sector: governmental regulation, economic factors, ability of the issuer to obtain financing, prices of natural resources and risks associated with nuclear power. |
| J. | | Foreign Currency Translations — Foreign currency is valued at the close of the NYSE based on quotations posted by banks and major currency dealers. Portfolio securities and other assets and liabilities denominated in foreign currencies are translated into U.S. dollar amounts at date of valuation. Purchases and sales of portfolio securities (net of foreign taxes withheld on disposition) and income items denominated in foreign currencies are translated into U.S. dollar amounts on the respective dates of such transactions. The Fund does not separately account for the portion of the results of operations resulting from changes in foreign exchange rates on investments and the fluctuations arising from changes in market prices of securities held. The combined results of changes in foreign exchange rates and the fluctuation of market prices on investments (net of estimated foreign tax withholding) are included with the net realized and unrealized gain or loss from investments in the Statement of Operations. Reported net realized foreign currency gains or losses arise from (1) sales of foreign currencies, (2) currency gains or losses realized between the trade and settlement dates on securities transactions, and (3) the difference between the amounts of dividends, interest, and foreign withholding taxes recorded on the Fund’s books and the U.S. dollar equivalent of the amounts actually received or paid. Net unrealized foreign currency gains and losses arise from changes in the fair values of assets and liabilities, other than investments in securities at fiscal period end, resulting from changes in exchange rates. |
| | The Fund may invest in foreign securities which may be subject to foreign taxes on income, gains on investments or currency repatriation, a portion of which may be recoverable. |
| K. | | Foreign Currency Contracts — The Fund may enter into foreign currency contracts to manage or minimize currency or exchange rate risk. The Fund may also enter into foreign currency contracts for the purchase or sale of a security denominated in a foreign currency in order to “lock in” the U.S. dollar price of that security. A foreign currency contract is an obligation to purchase or sell a specific currency for an agreed-upon price at a future date. The use of foreign currency contracts does not eliminate fluctuations in the price of the underlying securities the Fund owns or intends to acquire but establishes a rate of exchange in advance. Fluctuations in the value of these contracts are measured by the difference in the contract date and reporting date exchange rates and are recorded as unrealized appreciation (depreciation) until the contracts are closed. When the contracts are closed, realized gains (losses) are recorded. Realized and unrealized gains (losses) on the contracts are included in the Statement of Operations. The primary risks associated with foreign currency contracts include failure of the counterparty to meet the terms of the contract and the value of the foreign currency changing unfavorably. These risks may be in excess of the amounts reflected in the Statement of Assets and Liabilities. |
NOTE 2—Advisory Fees and Other Fees Paid to Affiliates
The Trust has entered into a master investment advisory agreement with Invesco Advisers, Inc. (the “Adviser” or “Invesco”). Under the terms of the investment advisory agreement, the Fund pays an advisory fee to the Adviser based on the annual rate of 0.60% of the Fund’s average daily net assets.
Under the terms of a master sub-advisory agreement between the Adviser and each of Invesco Asset Management Deutschland GmbH, Invesco Asset Management Limited, Invesco Asset Management (Japan) Limited, Invesco Australia Limited, Invesco Hong Kong Limited, Invesco Senior Secured Management, Inc. and Invesco Canada Ltd. (collectively, the “Affiliated Sub-Advisers”) the Adviser, not the Fund, may pay 40% of the fees paid to the Adviser to any such Affiliated Sub-Adviser(s) that provide discretionary investment management services to the Fund based on the percentage of assets allocated to such Sub-Adviser(s).
The Adviser has contractually agreed, through at least April 30, 2012, to waive advisory fees and/or reimburse expenses to the extent necessary to limit total annual fund operating expenses after fee waiver and/or expense reimbursement (excluding certain items discussed below) of Series I shares to 0.93% and Series II shares to 1.18% of average daily net assets. In determining the Adviser’s obligation to waive advisory fees and/or reimburse expenses, the following expenses are not taken into account, and could cause the total annual fund operating expenses after fee waiver and/or expense reimbursement to exceed the numbers reflected above: (1) interest; (2) taxes; (3) dividend expense on short sales; (4) extraordinary or non-routine items, including litigation expenses; and (5) expenses that the Fund has incurred but did not actually pay because of an expense offset arrangement. Unless the Board of the Trustees and Invesco mutually agree to amend or continue the fee waiver agreement, it will terminate on April 30, 2012.
Further, the Adviser has contractually agreed, through at least June 30, 2012, to waive the advisory fee payable by the Fund in an amount equal to 100% of the net advisory fees the Adviser receives from the affiliated money market funds on investments by the Fund of uninvested cash in such affiliated money market funds.
For the year ended December 31, 2011, the Adviser waived advisory fees of $81,236.
The Trust has entered into a master administrative services agreement with Invesco pursuant to which the Fund has agreed to pay Invesco a fee for costs incurred in providing accounting services and fund administrative services to the Fund and to reimburse Invesco for administrative services fees paid to insurance companies that have agreed to provide services to the participants of separate accounts. These administrative services provided by the insurance companies may include, among other things: the printing of prospectuses, financial reports and proxy statements and the delivery of the same to existing participants; the maintenance of master accounts; the facilitation of purchases and redemptions requested by the participants; and the servicing of participants’
Invesco V.I. Utilities Fund
accounts. Pursuant to such agreement, for the year ended December 31, 2011, Invesco was paid $50,000 for accounting and fund administrative services and reimbursed $150,579 for services provided by insurance companies.
The Trust has entered into a transfer agency and service agreement with Invesco Investment Services, Inc. (“IIS”) pursuant to which the Fund has agreed to pay IIS a fee for providing transfer agency and shareholder services to the Fund and reimburse IIS for certain expenses incurred by IIS in the course of providing such services. For the year ended December 31, 2011, expenses incurred under the agreement are shown in the Statement of Operations as transfer agent fees.
The Trust has entered into a master distribution agreement with Invesco Distributors, Inc. (“IDI”) to serve as the distributor for the Fund. The Trust has adopted a plan pursuant to Rule 12b-1 under the 1940 Act with respect to the Fund’s Series II shares (the “Plan”). The Fund, pursuant to the Plan, pays IDI compensation at the annual rate of 0.25% of the Fund’s average daily net assets of Series II shares. Of the Plan payments, up to 0.25% of the average daily net assets of the Series II shares may be paid to insurance companies who furnish continuing personal shareholder services to customers who purchase and own Series II shares of the Fund. For the year ended December 31, 2011, expenses incurred under the Plan are detailed in the Statement of Operations as distribution fees.
Certain officers and trustees of the Trust are officers and directors of the Adviser, IIS and/or IDI.
NOTE 3—Additional Valuation Information
GAAP defines fair value as the price that would be received to sell an asset or paid to transfer a liability in an orderly transaction between market participants at the measurement date, under current market conditions. GAAP establishes a hierarchy that prioritizes the inputs to valuation methods giving the highest priority to readily available unadjusted quoted prices in an active market for identical assets (Level 1) and the lowest priority to significant unobservable inputs (Level 3) generally when market prices are not readily available or are unreliable. Based on the valuation inputs, the securities or other investments are tiered into one of three levels. Changes in valuation methods may result in transfers in or out of an investment’s assigned level:
| | |
| | Level 1 — | Prices are determined using quoted prices in an active market for identical assets. |
| | Level 2 — | Prices are determined using other significant observable inputs. Observable inputs are inputs that other market participants may use in pricing a security. These may include quoted prices for similar securities, interest rates, prepayment speeds, credit risk, yield curves, loss severities, default rates, discount rates, volatilities and others. |
| | Level 3 — | Prices are determined using significant unobservable inputs. In situations where quoted prices or observable inputs are unavailable (for example, when there is little or no market activity for an investment at the end of the period), unobservable inputs may be used. Unobservable inputs reflect the Fund’s own assumptions about the factors market participants would use in determining fair value of the securities or instruments and would be based on the best available information. |
The following is a summary of the tiered valuation input levels, as of December 31, 2011. The level assigned to the securities valuations may not be an indication of the risk or liquidity associated with investing in those securities. Because of the inherent uncertainties of valuation, the values reflected in the financial statements may materially differ from the value received upon actual sale of those investments.
During the year ended December 31, 2011, there were no significant transfers between investment levels.
| | | | | | | | | | | | | | | | | |
| | | Level 1 | | Level 2 | | Level 3 | | Total |
| |
| Equity securities | | $ | 71,580,452 | | | $ | 1,147,017 | | | $ | — | | | $ | 72,727,469 | |
| |
NOTE 4—Trustees’ and Officers’ Fees and Benefits
“Trustees’ and Officers’ Fees and Benefits” include amounts accrued by the Fund to pay remuneration to certain Trustees and Officers of the Fund. Trustees have the option to defer compensation payable by the Fund, and “Trustees’ and Officers’ Fees and Benefits” also include amounts accrued by the Fund to fund such deferred compensation amounts. Those Trustees who defer compensation have the option to select various Invesco Funds in which their deferral accounts shall be deemed to be invested. Finally, certain current Trustees are eligible to participate in a retirement plan that provides for benefits to be paid upon retirement to Trustees over a period of time based on the number of years of service. The Fund may have certain former Trustees who also participate in a retirement plan and receive benefits under such plan. “Trustees’ and Officers’ Fees and Benefits” include amounts accrued by the Fund to fund such retirement benefits. Obligations under the deferred compensation and retirement plans represent unsecured claims against the general assets of the Fund.
During the year ended December 31, 2011, the Fund paid legal fees of $1,200 for services rendered by Kramer, Levin, Naftalis & Frankel LLP as counsel to the Independent Trustees. A partner of that firm is a Trustee of the Trust.
NOTE 5—Cash Balances
The Fund is permitted to temporarily carry a negative or overdrawn balance in its account with State Street Bank and Trust Company, the custodian bank. To compensate the custodian bank for such overdrafts, the overdrawn Fund may either (1) leave funds as a compensating balance in the account so the custodian bank can be compensated by earning the additional interest; or (2) compensate by paying the custodian bank at a rate agreed upon by the custodian bank and Invesco, not to exceed the contractually agreed upon rate.
Invesco V.I. Utilities Fund
NOTE 6—Distributions to Shareholders and Tax Components of Net Assets
Tax Character of Distributions to Shareholders Paid During the Years Ended December 31, 2011 and 2010:
| | | | | | | | | |
| | | 2011 | | 2010 |
| |
| Ordinary income | | $ | 2,181,202 | | | $ | 2,364,336 | |
| |
Tax Components of Net Assets at Period-End:
| | | | | |
| | | 2011 |
| |
| Undistributed ordinary income | | $ | 2,146,288 | |
| |
| Undistributed long-term gain | | | 2,455,328 | |
| |
| Net unrealized appreciation — investments | | | 13,297,553 | |
| |
| Net unrealized appreciation (depreciation) — other investments | | | (220 | ) |
| |
| Temporary book/tax differences | | | (54,348 | ) |
| |
| Shares of beneficial interest | | | 54,988,912 | |
| |
| Total net assets | | $ | 72,833,513 | |
| |
The difference between book-basis and tax-basis unrealized appreciation (depreciation) is due to differences in the timing of recognition of gains and losses on investments for tax and book purposes. The Fund’s net unrealized appreciation difference is attributable primarily to wash sales.
The temporary book/tax differences are a result of timing differences between book and tax recognition of income and/or expenses. The Fund’s temporary book/tax differences are the result of the trustee deferral of compensation and retirement plan benefits.
Capital loss carryforward is calculated and reported as of a specific date. Results of transactions and other activity after that date may affect the amount of capital loss carryforward actually available for the Fund to utilize. The Regulated Investment Company Modernization Act of 2010 (the “Act”) eliminated the eight-year carryover period for capital losses that arise in taxable years beginning after its enactment date of December 22, 2010. Consequently, these capital losses can be carried forward for an unlimited period. However, capital losses with an expiration period may not be used to offset capital gains until all net capital losses without an expiration date have been utilized. Additionally, post-enactment capital loss carryovers will retain their character as either short-term or long-term capital losses instead of as short-term capital losses as under prior law. The ability to utilize capital loss carryforward in the future may be limited under the Internal Revenue Code and related regulations based on the results of future transactions
The Fund utilized $1,436,392 of capital loss carryforward in the current period to offset net realized capital gain for federal income tax purposes.
The Fund does not have a capital loss carryforward at period-end.
NOTE 7—Investment Securities
The aggregate amount of investment securities (other than short-term securities, U.S. Treasury obligations and money market funds, if any) purchased and sold by the Fund during the year ended December 31, 2011 was $9,006,583 and $12,237,260, respectively. Cost of investments on a tax basis includes the adjustments for financial reporting purposes as of the most recently completed Federal income tax reporting period-end.
| | | | | |
| Unrealized Appreciation (Depreciation) of Investment Securities on a Tax Basis |
| |
| Aggregate unrealized appreciation of investment securities | | $ | 14,266,523 | |
| |
| Aggregate unrealized (depreciation) of investment securities | | | (968,970 | ) |
| |
| Net unrealized appreciation of investment securities | | $ | 13,297,553 | |
| |
| Cost of investments for tax purposes is $59,429,916. |
NOTE 8—Reclassification of Permanent Differences
Primarily as a result of differing book/tax treatment of foreign currency transactions, on December 31, 2011, undistributed net investment income was decreased by $2,305 and undistributed net realized gain was increased by $2,305. This reclassification had no effect on the net assets of the Fund.
Invesco V.I. Utilities Fund
NOTE 9—Share Information
| | | | | | | | | | | | | | | | | |
| | | Summary of Share Activity |
| |
| | | Year ended December 31, |
| | | 2011(a) | | 2010 |
| | | Shares | | Amount | | Shares | | Amount |
| |
| Sold: | | | | | | | | | | | | | | | | |
| Series I | | | 951,541 | | | $ | 15,210,526 | | | | 480,106 | | | $ | 6,843,415 | |
| |
| Series II | | | 16,357 | | | | 261,142 | | | | 7,837 | | | | 110,711 | |
| |
| Issued as reinvestment of dividends: | | | | | | | | | | | | | | | | |
| Series I | | | 136,473 | | | | 2,123,528 | | | | 160,460 | | | | 2,309,020 | |
| |
| Series II | | | 3,727 | | | | 57,674 | | | | 3,865 | | | | 55,316 | |
| |
| Reacquired: | | | | | | | | | | | | | | | | |
| Series I | | | (1,149,620 | ) | | | (18,232,819 | ) | | | (1,210,979 | ) | | | (17,239,349 | ) |
| |
| Series II | | | (22,568 | ) | | | (353,138 | ) | | | (14,275 | ) | | | (198,195 | ) |
| |
| Net increase (decrease) in share activity | | | (64,090 | ) | | $ | (933,087 | ) | | | (572,986 | ) | | $ | (8,119,082 | ) |
| |
| | |
| (a) | | There are entities that are record owners of more than 5% of the outstanding shares of the Fund and in the aggregate own 47% of the outstanding shares of the Fund. The Fund and the Fund’s principal underwriter or adviser, are parties to participation agreements with these entities whereby these entities sell units of interest in separate accounts funding variable products that are invested in the Fund. The Fund, Invesco and/or Invesco affiliates may make payments to these entities, which are considered to be related to the Fund, for providing services to the Fund, Invesco and/or Invesco affiliates including but not limited to services such as, securities brokerage, third party record keeping and account servicing and administrative services. The Fund has no knowledge as to whether all or any portion of the shares owned of record by these entities are also owned beneficially. |
NOTE 10—Financial Highlights
The following schedule presents financial highlights for a share of the Fund outstanding throughout the periods indicated.
| | | | | | | | | | | | | | | | | | | | | | | | | | | | | | | | | | | | | | | | | | | | | | | | | | | | | | | | | |
| | | | | | | | | | | | | | | | | | | | | | | Ratio of
| | Ratio of
| | | | |
| | | | | | | Net gains
| | | | | | | | | | | | | | | | expenses
| | expenses
| | | | |
| | | | | | | (losses) on
| | | | | | | | | | | | | | | | to average
| | to average net
| | Ratio of net
| | |
| | | Net asset
| | | | securities
| | | | Dividends
| | Distributions
| | | | | | | | | | net assets
| | assets without
| | investment
| | |
| | | value,
| | Net
| | (both
| | Total from
| | from net
| | from net
| | | | Net asset
| | | | Net assets,
| | with fee waivers
| | fee waivers
| | income
| | |
| | | beginning
| | investment
| | realized and
| | investment
| | investment
| | realized
| | Total
| | value, end
| | Total
| | end of period
| | and/or expenses
| | and/or expenses
| | to average
| | Portfolio
|
| | | of period | | income(a) | | unrealized) | | operations | | income | | gains | | distributions | | of period | | return(b) | | (000s omitted) | | absorbed | | absorbed | | net assets | | turnover(c) |
| |
| Series I |
| Year ended 12/31/11 | | $ | 14.87 | | | $ | 0.51 | | | $ | 1.90 | | | $ | 2.41 | | | $ | (0.54 | ) | | $ | — | | | $ | (0.54 | ) | | $ | 16.74 | | | | 16.45 | % | | $ | 70,956 | | | | 0.92 | %(d) | | | 1.04 | %(d)) | | | 3.23 | %(d) | | | 14 | % |
| Year ended 12/31/10 | | | 14.51 | | | | 0.47 | | | | 0.43 | | | | 0.90 | | | | (0.54 | ) | | | — | | | | (0.54 | ) | | | 14.87 | | | | 6.30 | | | | 63,945 | | | | 0.92 | | | | 1.04 | | | | 3.25 | | | | 13 | |
| Year ended 12/31/09 | | | 13.38 | | | | 0.45 | | | | 1.53 | | | | 1.98 | | | | (0.68 | ) | | | (0.17 | ) | | | (0.85 | ) | | | 14.51 | | | | 14.93 | | | | 70,671 | | | | 0.93 | | | | 1.04 | | | | 3.35 | | | | 14 | |
| Year ended 12/31/08 | | | 23.97 | | | | 0.52 | | | | (8.36 | ) | | | (7.84 | ) | | | (0.59 | ) | | | (2.16 | ) | | | (2.75 | ) | | | 13.38 | | | | (32.35 | ) | | | 80,704 | | | | 0.93 | | | | 0.96 | | | | 2.53 | | | | 15 | |
| Year ended 12/31/07 | | | 21.23 | | | | 0.47 | | | | 3.94 | | | | 4.41 | | | | (0.47 | ) | | | (1.20 | ) | | | (1.67 | ) | | | 23.97 | | | | 20.64 | | | | 155,748 | | | | 0.93 | | | | 0.94 | | | | 1.97 | | | | 30 | |
| |
| Series II |
| Year ended 12/31/11 | | | 14.78 | | | | 0.47 | | | | 1.88 | | | | 2.35 | | | | (0.50 | ) | | | — | | | | (0.50 | ) | | | 16.63 | | | | 16.15 | | | | 1,878 | | | | 1.17 | (d) | | | 1.29 | (d) | | | 2.98 | (d) | | | 14 | |
| Year ended 12/31/10 | | | 14.43 | | | | 0.43 | | | | 0.42 | | | | 0.85 | | | | (0.50 | ) | | | — | | | | (0.50 | ) | | | 14.78 | | | | 6.01 | | | | 1,706 | | | | 1.17 | | | | 1.29 | | | | 3.00 | | | | 13 | |
| Year ended 12/31/09 | | | 13.30 | | | | 0.41 | | | | 1.52 | | | | 1.93 | | | | (0.63 | ) | | | (0.17 | ) | | | (0.80 | ) | | | 14.43 | | | | 14.61 | | | | 1,702 | | | | 1.18 | | | | 1.29 | | | | 3.10 | | | | 14 | |
| Year ended 12/31/08 | | | 23.80 | | | | 0.46 | | | | (8.28 | ) | | | (7.82 | ) | | | (0.52 | ) | | | (2.16 | ) | | | (2.68 | ) | | | 13.30 | | | | (32.51 | ) | | | 1,717 | | | | 1.18 | | | | 1.21 | | | | 2.28 | | | | 15 | |
| Year ended 12/31/07 | | | 21.12 | | | | 0.41 | | | | 3.91 | | | | 4.32 | | | | (0.44 | ) | | | (1.20 | ) | | | (1.64 | ) | | | 23.80 | | | | 20.32 | | | | 3,293 | | | | 1.18 | | | | 1.19 | | | | 1.72 | | | | 30 | |
| |
| | |
| (a) | | Calculated using average shares outstanding. |
| (b) | | Includes adjustments in accordance with accounting principles generally accepted in the United States of America and as such, the net asset value for financial reporting purposes and the returns based upon those net asset values may differ from the net asset value and returns for shareholder transactions. Total returns are not annualized for periods less than one year, if applicable, and do not reflect charges assessed in connection with a variable product, which if included would reduce total returns. |
| (c) | | Portfolio turnover is calculated at the fund level and is not annualized for periods less than one year, if applicable. |
| (d) | | Ratios are based on average daily net assets (000’s) of $64,973 and $1,811 for Series I and Series II, respectively. |
Invesco V.I. Utilities Fund
Report of Independent Registered Public Accounting Firm
To the Board of Trustees of AIM Variable Insurance Funds (Invesco Variable Insurance Funds)
and Shareholders of Invesco V.I. Utilities Fund:
In our opinion, the accompanying statement of assets and liabilities, including the schedule of investments, and the related statements of operations and of changes in net assets and the financial highlights present fairly, in all material respects, the financial position of Invesco V.I. Utilities Fund (one of the funds constituting AIM Variable Insurance Funds (Invesco Variable Insurance Funds), hereafter referred to as the “Fund”) at December 31, 2011, the results of its operations for the year then ended, the changes in its net assets for each of the two years in the period then ended and the financial highlights for each of the five years in the period then ended, in conformity with accounting principles generally accepted in the United States of America. These financial statements and financial highlights (hereafter referred to as “financial statements”) are the responsibility of the Fund’s management; our responsibility is to express an opinion on these financial statements based on our audits. We conducted our audits of these financial statements in accordance with the standards of the Public Company Accounting Oversight Board (United States). Those standards require that we plan and perform the audits to obtain reasonable assurance about whether the financial statements are free of material misstatement. An audit includes examining, on a test basis, evidence supporting the amounts and disclosures in the financial statements, assessing the accounting principles used and significant estimates made by management, and evaluating the overall financial statement presentation. We believe that our audits, which included confirmation of securities at December 31, 2011 by correspondence with the custodian, provide a reasonable basis for our opinion.
PRICEWATERHOUSECOOPERS LLP
February 14, 2012
Houston, Texas
Invesco V.I. Utilities Fund
Calculating your ongoing Fund expenses
Example
As a shareholder of the Fund, you incur ongoing costs, including management fees; distribution and/or service fees (12b-1); and other Fund expenses. This example is intended to help you understand your ongoing costs (in dollars) of investing in the Fund and to compare these costs with ongoing costs of investing in other mutual funds. The example is based on an investment of $1,000 invested at the beginning of the period and held for the entire period July 1, 2011 through December 31, 2011.
The actual and hypothetical expenses in the examples below do not represent the effect of any fees or other expenses assessed in connection with a variable product; if they did, the expenses shown would be higher while the ending account values shown would be lower.
Actual expenses
The table below provides information about actual account values and actual expenses. You may use the information in this table, together with the amount you invested, to estimate the expenses that you paid over the period. Simply divide your account value by $1,000 (for example, an $8,600 account value divided by $1,000 = 8.6), then multiply the result by the number in the table under the heading entitled “Actual Expenses Paid During Period” to estimate the expenses you paid on your account during this period.
Hypothetical example for comparison purposes
The table below also provides information about hypothetical account values and hypothetical expenses based on the Fund’s actual expense ratio and an assumed rate of return of 5% per year before expenses, which is not the Fund’s actual return.
The hypothetical account values and expenses may not be used to estimate the actual ending account balance or expenses you paid for the period. You may use this information to compare the ongoing costs of investing in the Fund and other funds. To do so, compare this 5% hypothetical example with the 5% hypothetical examples that appear in the shareholder reports of the other funds.
Please note that the expenses shown in the table are meant to highlight your ongoing costs. Therefore, the hypothetical information is useful in comparing ongoing costs, and will not help you determine the relative total costs of owning different funds.
| | | | | | | | | | | | | | | | | | | | | | | | | | | | | | | |
| | | | | | | | | | HYPOTHETICAL
| | | |
| | | | | | | ACTUAL | | | (5% annual return before expenses) | | | |
| | | | Beginning
| | | Ending
| | | Expenses
| | | Ending
| | | Expenses
| | | Annualized
|
| | | | Account Value
| | | Account Value
| | | Paid During
| | | Account Value
| | | Paid During
| | | Expense
|
| Class | | | (07/01/11) | | | (12/31/11)1 | | | Period2 | | | (12/31/11) | | | Period2 | | | Ratio |
| Series I | | | $ | 1,000.00 | | | | $ | 1,052.60 | | | | $ | 4.77 | | | | $ | 1,020.55 | | | | $ | 4.70 | | | | | 0.92 | % |
| | | | | | | | | | | | | | | | | | | | | | | | | | | | | | | |
| Series II | | | | 1,000.00 | | | | | 1,051.30 | | | | | 6.06 | | | | | 1,019.29 | | | | | 5.97 | | | | | 1.17 | |
| | | | | | | | | | | | | | | | | | | | | | | | | | | | | | | |
| |
| 1 | The actual ending account value is based on the actual total return of the Fund for the period July 1, 2011 through December 31, 2011, after actual expenses and will differ from the hypothetical ending account value which is based on the Fund’s expense ratio and a hypothetical annual return of 5% before expenses. |
| 2 | Expenses are equal to the Fund’s annualized expense ratio as indicated above multiplied by the average account value over the period, multiplied by 184/365 to reflect the most recent fiscal half year. |
Invesco V.I. Utilities Fund
Form 1099-DIV, Form 1042-S and other year-end tax information provide shareholders with actual calendar year amounts that should be included in their tax returns. Shareholders should consult their tax advisors.
The following distribution information is being provided as required by the Internal Revenue Code or to meet a specific state’s requirement.
The Fund designates the following amounts or, if subsequently determined to be different, the maximum amount allowable for its fiscal year ended December 31, 2011:
| | | | | |
Federal and State Income Tax | | |
| |
| Corporate Dividends Received Deduction* | | | 100% | |
| | |
| | * | The above percentage is based on ordinary income dividends paid to shareholders during the Fund’s fiscal year. |
Invesco V.I. Utilities Fund
The address of each trustee and officer is AIM Variable Insurance Funds (Invesco Variable Insurance Funds) (the “Trust”), 11 Greenway Plaza, Suite 2500, Houston, Texas 77046-1173. The trustees serve for the life of the Trust, subject to their earlier death, incapacitation, resignation, retirement or removal as more specifically provided in the Trust’s organizational documents. Each officer serves for a one year term or until their successors are elected and qualified. Column two below includes length of time served with predecessor entities, if any.
| | | | | | | | | |
| | | | | | | Number of Funds
| | |
Name, Year of Birth and
| | Trustee and/
| | Principal Occupation(s)
| | in Fund Complex
| | Other Directorship(s)
|
| Position(s) Held with the Trust | | or Officer Since | | During Past 5 Years | | Overseen by Trustee | | Held by Trustee |
| | | | | | | | | |
| | | | | | | | | |
| | | | | | | | | |
Interested Persons | | | | | | | | |
| | | | | | | | | |
| | | | | | | | | |
| | | | | | | | | |
Martin L. Flanagan1 — 1960
Trustee | | 2007 | | Executive Director, Chief Executive Officer and President, Invesco Ltd. (ultimate parent of Invesco and a global investment management firm); Advisor to the Board, Invesco Advisers, Inc. (formerly known as Invesco Institutional (N.A.), Inc.); Trustee, The Invesco Funds; Vice Chair, Investment Company Institute; and Member of Executive Board, SMU Cox School of Business
Formerly: Chairman, Invesco Advisers, Inc. (registered investment adviser); Director, Chairman, Chief Executive Officer and President, IVZ Inc. (holding company), INVESCO Group Services, Inc. (service provider) and Invesco North American Holdings, Inc. (holding company); Director, Chief Executive Officer and President, Invesco Holding Company Limited (parent of Invesco and a global investment management firm); Director, Invesco Ltd.; Chairman, Investment Company Institute and President, Co-Chief Executive Officer, Co-President, Chief Operating Officer and Chief Financial Officer, Franklin Resources, Inc. (global investment management organization) | | 140 | | None |
| | | | | | | | | |
| | | | | | | | | |
| | | | | | | | | |
Philip A. Taylor2 — 1954
Trustee, President and Principal Executive Officer | | 2006 | | Head of North American Retail and Senior Managing Director, Invesco Ltd.; Director, Co-Chairman, Co-President and Co-Chief Executive Officer, Invesco Advisers, Inc. (formerly known as Invesco Institutional (N.A.), Inc.) (registered investment adviser); Director, Chairman, Chief Executive Officer and President, Invesco Management Group, Inc. (formerly Invesco Aim Management Group, Inc.) (financial services holding company); Director and President, INVESCO Funds Group, Inc. (registered investment adviser and registered transfer agent); Director and Chairman, Invesco Investment Services, Inc. (formerly known as Invesco Aim Investment Services, Inc.) (registered transfer agent) and IVZ Distributors, Inc. (formerly known as INVESCO Distributors, Inc.) (registered broker dealer); Director, President and Chairman, Invesco Inc. (holding company) and Invesco Canada Holdings Inc. (holding company); Chief Executive Officer, Invesco Corporate Class Inc. (corporate mutual fund company) and Invesco Canada Fund Inc. (corporate mutual fund company); Director, Chairman and Chief Executive Officer, Invesco Canada Ltd. (formerly known as Invesco Trimark Ltd./Invesco Trimark Ltèe) (registered investment adviser and registered transfer agent); Trustee, President and Principal Executive Officer, The Invesco Funds (other than AIM Treasurer’s Series Trust (Invesco Treasurer’s Series Trust) and Short-Term Investments Trust); Trustee and Executive Vice President, The Invesco Funds (AIM Treasurer’s Series Trust (Invesco Treasurer’s Series Trust) and Short-Term Investments Trust only); Director, Invesco Investment Advisers LLC (formerly known as Van Kampen Asset Management); Director, Chief Executive Officer and President, Van Kampen Exchange Corp. | | 140 | | None |
| | | | | | | | | |
| | | | | | | | | |
| | | | | Formerly: Director and Chairman, Van Kampen Investor Services Inc.: Director, Chief Executive Officer and President, 1371 Preferred Inc. (holding company); and Van Kampen Investments Inc.; Director and President, AIM GP Canada Inc. (general partner for limited partnerships); and Van Kampen Advisors, Inc.; Director and Chief Executive Officer, Invesco Trimark Dealer Inc. (registered broker dealer); Director, Invesco Distributors, Inc. (formerly known as Invesco Aim Distributors, Inc.) (registered broker dealer); Manager, Invesco PowerShares Capital Management LLC; Director, Chief Executive Officer and President, Invesco Advisers, Inc.; Director, Chairman, Chief Executive Officer and President, Invesco Aim Capital Management, Inc.; President, Invesco Trimark Dealer Inc. and Invesco Trimark Ltd./Invesco Trimark Ltèe; Director and President, AIM Trimark Corporate Class Inc. and AIM Trimark Canada Fund Inc.; Senior Managing Director, Invesco Holding Company Limited; Trustee and Executive Vice President, Tax-Free Investments Trust; Director and Chairman, Fund Management Company (former registered broker dealer); President and Principal Executive Officer, The Invesco Funds (AIM Treasurer’s Series Trust (Invesco Treasurer’s Series Trust), Short-Term Investments Trust and Tax-Free Investments Trust only); President, AIM Trimark Global Fund Inc. and AIM Trimark Canada Fund Inc. | | | | |
| | | | | | | | | |
| | | | | | | | | |
| | | | | | | | | |
Wayne W. Whalen3 — 1939
Trustee | | 2010 | | Of Counsel, and prior to 2010, partner in the law firm of Skadden, Arps, Slate, Meagher & Flom LLP, legal counsel to funds in the Fund Complex | | 158 | | Director of the Abraham Lincoln Presidential Library Foundation |
| | | | | | | | | |
| | | | | | | | | |
| | | | | | | | | |
Independent Trustees | | | | | | | | |
| | | | | | | | | |
| | | | | | | | | |
| | | | | | | | | |
Bruce L. Crockett — 1944
Trustee and Chair | | 1993 | | Chairman, Crockett Technology Associates (technology consulting company) | | 140 | | ACE Limited (insurance company); and Investment Company Institute |
| | | | | Formerly: Director, Captaris (unified messaging provider); Director, President and Chief Executive Officer COMSAT Corporation; and Chairman, Board of Governors of INTELSAT (international communications company) | | | | |
| | | | | | | | | |
| |
| 1 | Mr. Flanagan is considered an interested person of the Trust because he is an officer of the adviser to the Trust, and an officer and a director of Invesco Ltd., ultimate parent of the adviser to the Trust. |
| 2 | Mr. Taylor is considered an interested person of the Trust because he is an officer and a director of the adviser to, and a director of the principal underwriter of, the Trust. |
| 3 | Mr. Whalen is considered an “interested person” (within the meaning of Section 2(a)(19) of the 1940 Act) of certain Funds in the Fund Complex by reason of he and his firm currently providing legal services as legal counsel to such Funds in the Fund Complex. |
Invesco V.I. Utilities Fund
Trustees and Officers—(continued)
The address of each trustee and officer is AIM Variable Insurance Funds (Invesco Variable Insurance Funds) (the “Trust”), 11 Greenway Plaza, Suite 2500, Houston, Texas 77046-1173. The trustees serve for the life of the Trust, subject to their earlier death, incapacitation, resignation, retirement or removal as more specifically provided in the Trust’s organizational documents. Each officer serves for a one year term or until their successors are elected and qualified. Column two below includes length of time served with predecessor entities, if any.
| | | | | | | | | |
| | | | | | | Number of Funds
| | |
Name, Year of Birth and
| | Trustee and/
| | Principal Occupation(s)
| | in Fund Complex
| | Other Directorship(s)
|
| Position(s) Held with the Trust | | or Officer Since | | During Past 5 Years | | Overseen by Trustee | | Held by Trustee |
| | | | | | | | | |
| | | | | | | | | |
| | | | | | | |
Independent Trustees—(continued) | | | | | | |
| | | | | | | | | |
| | | | | | | | | |
| | | | | | | | | |
David C. Arch — 1945
Trustee | | 2010 | | Chairman and Chief Executive Officer of Blistex Inc., a consumer health care products manufacturer. | | 158 | | Member of the Heartland Alliance Advisory Board, a nonprofit organization serving human needs based in Chicago. Board member of the Illinois Manufacturers’ Association. Member of the Board of Visitors, Institute for the Humanities, University of Michigan |
| | | | | | | | | |
| | | | | | | | | |
| | | | | | | | | |
Frank S. Bayley — 1939
Trustee | | 2001 | | Retired
Formerly: Director, Badgley Funds, Inc. (registered investment company) (2 portfolios) and Partner, law firm of Baker & McKenzie
Formerly: Director, Badgley Funds, Inc. (registered investment company) (2 portfolios) and Partner, law firm of Baker & McKenzie | | 140 | | Director and Chairman, C.D. Stimson Company (a real estate investment company) |
| | | | | | | | | |
| | | | | | | | | |
| | | | | | | | | |
James T. Bunch — 1942
Trustee | | 2004 | | Managing Member, Grumman Hill Group LLC (family office private equity management)
Formerly: Founder, Green, Manning & Bunch Ltd. (investment banking firm)(1988-2010); Executive Committee, United States Golf Association; and Director, Policy Studies, Inc. and Van Gilder Insurance Corporation | | 140 | | Vice Chairman, Board of Governors, Western Golf Association/Evans Scholars Foundation and Director, Denver Film Society |
| | | | | | | | | |
| | | | | | | | | |
| | | | | | | | | |
Rodney F. Dammeyer — 1940
Trustee | | 2010 | | President of CAC, LLC, a private company offering capital investment and management advisory services.
Formerly: Prior to January 2004, Director of TeleTech Holdings Inc.; Prior to 2002, Director of Arris Group, Inc.; Prior to 2001, Managing Partner at Equity Group Corporate Investments. Prior to 1995, Vice Chairman of Anixter International. Prior to 1985, experience includes Senior Vice President and Chief Financial Officer of Household International, Inc., Executive Vice President and Chief Financial Officer of Northwest Industries, Inc. and Partner of Arthur Andersen & Co. | | 158 | | Director of Quidel Corporation and Stericycle, Inc. Prior to May 2008, Trustee of The Scripps Research Institute. Prior to February 2008, Director of Ventana Medical Systems, Inc. Prior to April 2007, Director of GATX Corporation. Prior to April 2004, Director of TheraSense, Inc. |
| | | | | | | | | |
| | | | | | | | | |
| | | | | | | | | |
Albert R. Dowden — 1941
Trustee | | 2000 | | Director of a number of public and private business corporations, including the Boss Group, Ltd. (private investment and management); Reich & Tang Funds (5 portfolios) (registered investment company); and Homeowners of America Holding Corporation/ Homeowners of America Insurance Company (property casualty company)
Formerly: Director, Continental Energy Services, LLC (oil and gas pipeline service); Director, CompuDyne Corporation (provider of product and services to the public security market) and Director, Annuity and Life Re (Holdings), Ltd. (reinsurance company); Director, President and Chief Executive Officer, Volvo Group North America, Inc.; Senior Vice President, AB Volvo; Director of various public and private corporations; Chairman, DHJ Media, Inc.; Director Magellan Insurance Company; and Director, The Hertz Corporation, Genmar Corporation (boat manufacturer), National Media Corporation; Advisory Board of Rotary Power International (designer, manufacturer, and seller of rotary power engines); and Chairman, Cortland Trust, Inc. (registered investment company) | | 140 | | Board of Nature’s Sunshine Products, Inc. |
| | | | | | | | | |
| | | | | | | | | |
| | | | | | | | | |
Jack M. Fields — 1952
Trustee | | 1997 | | Chief Executive Officer, Twenty First Century Group, Inc. (government affairs company); and Owner and Chief Executive Officer, Dos Angelos Ranch, L.P. (cattle, hunting, corporate entertainment), Discovery Global Education Fund (non-profit) and Cross Timbers Quail Research Ranch (non-profit)
Formerly: Chief Executive Officer, Texana Timber LP (sustainable forestry company) and member of the U.S. House of Representatives | | 140 | | Administaff |
| | | | | | | | | |
| | | | | | | | | |
| | | | | | | | | |
Carl Frischling — 1937
Trustee | | 1993 | | Partner, law firm of Kramer Levin Naftalis and Frankel LLP | | 140 | | Director, Reich & Tang Funds (16 portfolios) |
| | | | | | | | | |
| | | | | | | | | |
Invesco V.I. Utilities Fund
Trustees and Officers—(continued)
The address of each trustee and officer is AIM Variable Insurance Funds (Invesco Variable Insurance Funds) (the “Trust”), 11 Greenway Plaza, Suite 2500, Houston, Texas 77046-1173. The trustees serve for the life of the Trust, subject to their earlier death, incapacitation, resignation, retirement or removal as more specifically provided in the Trust’s organizational documents. Each officer serves for a one year term or until their successors are elected and qualified. Column two below includes length of time served with predecessor entities, if any.
| | | | | | | | | |
| | | | | | | Number of Funds
| | |
Name, Year of Birth and
| | Trustee and/
| | Principal Occupation(s)
| | in Fund Complex
| | Other Directorship(s)
|
| Position(s) Held with the Trust | | or Officer Since | | During Past 5 Years | | Overseen by Trustee | | Held by Trustee |
| | | Independent Trustees—(continued) | | | | |
| | | | | | | | | |
| | | | | | | | | |
| | | | | | | | | |
Prema Mathai-Davis — 1950
Trustee | | 1998 | | Retired
Formerly: Chief Executive Officer, YWCA of the U.S.A. | | 140 | | None |
| | | | | | | | | |
| | | | | | | | | |
| | | | | | | | | |
Larry Soll — 1942
Trustee | | 2004 | | Retired
Formerly, Chairman, Chief Executive Officer and President, Synergen Corp. (a biotechnology company) | | 140 | | None |
| | | | | | | | | |
| | | | | | | | | |
| | | | | | | | | |
Hugo F. Sonnenschein — 1940
Trustee | | 2010 | | President Emeritus and Honorary Trustee of the University of Chicago and the Adam Smith Distinguished Service Professor in the Department of Economics at the University of Chicago. Prior to July 2000, President of the University of Chicago. | | 158 | | Trustee of the University of Rochester and a member of its investment committee. Member of the National Academy of Sciences, the American Philosophical Society and a fellow of the American Academy of Arts and Sciences |
| | | | | | | | | |
| | | | | | | | | |
| | | | | | | | | |
| Raymond Stickel, Jr. — 1944 Trustee | | 2005 | | Retired
Formerly: Director, Mainstay VP Series Funds, Inc. (25 portfolios) and Partner, Deloitte & Touche | | 140 | | None |
| | | | | | | | | |
| | | | | | | | | |
| | | | | | | | | |
Other Officers | | | | | | | | |
| | | | | | | | | |
| | | | | | | | | |
| | | | | | | | | |
Russell C. Burk — 1958
Senior Vice President and Senior Officer | | 2005 | | Senior Vice President and Senior Officer, The Invesco Funds | | N/A | | N/A |
| | | | | | | | | |
| | | | | | | | | |
| | | | | | | | | |
John M. Zerr — 1962
Senior Vice President, Chief Legal Officer and Secretary | | 2006 | | Director, Senior Vice President, Secretary and General Counsel, Invesco Management Group, Inc. (formerly known as Invesco Aim Management Group, Inc.) and Van Kampen Exchange Corp.; Senior Vice President, Invesco Advisers, Inc. (formerly known as Invesco Institutional (N.A.), Inc.) (registered investment adviser); Senior Vice President and Secretary, Invesco Distributors, Inc. (formerly known as Invesco Aim Distributors, Inc.); Director, Vice President and Secretary, Invesco Investment Services, Inc. (formerly known as Invesco Aim Investment Services, Inc.) and IVZ Distributors, Inc. (formerly known as INVESCO Distributors, Inc.); Director and Vice President, INVESCO Funds Group, Inc.; Senior Vice President, Chief Legal Officer and Secretary, The Invesco Funds; Manager, Invesco PowerShares Capital Management LLC; Director, Secretary and General Counsel, Invesco Investment Advisers LLC (formerly known as Van Kampen Asset Management); Secretary and General Counsel, Van Kampen Funds Inc. and Chief Legal Officer, PowerShares Exchange-Traded Fund Trust, PowerShares Exchange-Traded Fund Trust II, PowerShares India Exchange-Traded Fund Trust and PowerShares Actively Managed Exchange-Traded Fund Trust
Formerly: Director and Secretary, Van Kampen Advisors Inc.; Director Vice President, Secretary and General Counsel Van Kampen Investor Services Inc.; Director, Invesco Distributors, Inc. (formerly known as Invesco Aim Distributors, Inc.); Director, Senior Vice President, General Counsel and Secretary, Invesco Advisers, Inc.; and Van Kampen Investments Inc.; Director, Vice President and Secretary, Fund Management Company; Director, Senior Vice President, Secretary, General Counsel and Vice President, Invesco Aim Capital Management, Inc.; Chief Operating Officer and General Counsel, Liberty Ridge Capital, Inc. (an investment adviser); Vice President and Secretary, PBHG Funds (an investment company) and PBHG Insurance Series Fund (an investment company); Chief Operating Officer, General Counsel and Secretary, Old Mutual Investment Partners (a broker-dealer); General Counsel and Secretary, Old Mutual Fund Services (an administrator) and Old Mutual Shareholder Services (a shareholder servicing center); Executive Vice President, General Counsel and Secretary, Old Mutual Capital, Inc. (an investment adviser); and Vice President and Secretary, Old Mutual Advisors Funds (an investment company) | | N/A | | N/A |
| | | | | | | | | |
| | | | | | | | | |
| | | | | | | | | |
Lisa O. Brinkley — 1959
Vice President | | 2004 | | Global Compliance Director, Invesco Ltd.; Chief Compliance Officer, Invesco Investment Services, Inc.(formerly known as Invesco Aim Investment Services, Inc.); and Vice President, The Invesco Funds
Formerly: Chief Compliance Officer, Invesco Distributors, Inc. (formerly known as Invesco Aim Distributors, Inc.) and Van Kampen Investor Services Inc.; Senior Vice President, Invesco Management Group, Inc.; Senior Vice President and Chief Compliance Officer, Invesco Advisers, Inc. and The Invesco Funds; Vice President and Chief Compliance Officer, Invesco Aim Capital Management, Inc. and Invesco Distributors, Inc.; Vice President, Invesco Investment Services, Inc. and Fund Management Company | | N/A | | N/A |
| | | | | | | | | |
Invesco V.I. Utilities Fund
Trustees and Officers—(continued)
The address of each trustee and officer is AIM Variable Insurance Funds (Invesco Variable Insurance Funds) (the “Trust”), 11 Greenway Plaza, Suite 2500, Houston, Texas 77046-1173. The trustees serve for the life of the Trust, subject to their earlier death, incapacitation, resignation, retirement or removal as more specifically provided in the Trust’s organizational documents. Each officer serves for a one year term or until their successors are elected and qualified. Column two below includes length of time served with predecessor entities, if any.
| | | | | | | | | |
| | | | | | | Number of Funds
| | |
Name, Year of Birth and
| | Trustee and/
| | Principal Occupation(s)
| | in Fund Complex
| | Other Directorship(s)
|
| Position(s) Held with the Trust | | or Officer Since | | During Past 5 Years | | Overseen by Trustee | | Held by Trustee |
| | | Other Officers—(continued) | | | | |
| | | | | | | | | |
| | | | | | | | | |
| | | | | | | | | |
Sheri Morris — 1964
Vice President, Treasurer and Principal Financial Officer | | 1999 | | Vice President, Treasurer and Principal Financial Officer, The Invesco Funds; Vice President, Invesco Advisers, Inc. (formerly known as Invesco Institutional (N.A.), Inc.) (registered investment adviser).
Formerly: Treasurer, PowerShares Exchange-Traded Fund Trust, PowerShares Exchange-Traded Fund Trust II, PowerShares India Exchange-Traded Fund Trust and PowerShares Actively Managed Exchange-Traded Fund Trust, Vice President, Invesco Advisers, Inc., Invesco Aim Capital Management, Inc. and Invesco Aim Private Asset Management, Inc.; Assistant Vice President and Assistant Treasurer, The Invesco Funds and Assistant Vice President, Invesco Advisers, Inc., Invesco Aim Capital Management, Inc. and Invesco Aim Private Asset Management, Inc. | | N/A | | N/A |
| | | | | | | | | |
| | | | | | | | | |
| | | | | | | | | |
Karen Dunn Kelley — 1960
Vice President | | 1993 | | Head of Invesco’s World Wide Fixed Income and Cash Management Group; Senior Vice President, Invesco Management Group, Inc. (formerly known as Invesco Aim Management Group, Inc.) and Invesco Advisers, Inc. (formerly known as Invesco Institutional (N.A.), Inc.) (registered investment adviser); Executive Vice President, Invesco Distributors, Inc. (formerly known as Invesco Aim Distributors, Inc.); Director, Invesco Mortgage Capital Inc.; Vice President, The Invesco Funds (other than AIM Treasurer’s Series Trust (Invesco Treasurer’s Series Trust) and Short-Term Investments Trust); and President and Principal Executive Officer, The Invesco Funds (AIM Treasurer’s Series Trust (Invesco Treasurer’s Series Trust) and Short-Term Investments Trust only).
Formerly: Senior Vice President, Van Kampen Investments Inc.; Vice President, Invesco Advisers, Inc. (formerly known as Invesco Institutional (N.A.), Inc.); Director of Cash Management and Senior Vice President, Invesco Advisers, Inc. and Invesco Aim Capital Management, Inc.; President and Principal Executive Officer, Tax-Free Investments Trust; Director and President, Fund Management Company; Chief Cash Management Officer, Director of Cash Management, Senior Vice President, and Managing Director, Invesco Aim Capital Management, Inc.; Director of Cash Management, Senior Vice President, and Vice President, Invesco Advisers, Inc. and The Invesco Funds (AIM Treasurer’s Series Trust (Invesco Treasurer’s Series Trust), Short-Term Investments Trust and Tax-Free Investments Trust only) | | N/A | | N/A |
| | | | | | | | | |
| | | | | | | | | |
| | | | | | | | | |
Yinka Akinsola — 1977
Anti-Money Laundering Compliance Officer | | 2011 | | Anti-Money Laundering Compliance Officer, Invesco Advisers, Inc. (formerly known as Invesco Institutional (N.A.), Inc.) (registered investment adviser); Invesco Distributors, Inc. (formerly known as Invesco Aim Distributors, Inc.), Invesco Investment Services, Inc. (formerly known as Invesco Aim Investment Services, Inc.), Invesco Management Group, Inc., The Invesco Funds, Invesco Van Kampen Closed-End Funds, Van Kampen Exchange Corp. and Van Kampen Funds Inc. | | N/A | | N/A |
| | | | | | | | | |
| | | | | | | | | |
| | | | | | | | | |
Todd L. Spillane — 1958
Chief Compliance Officer | | 2006 | | Senior Vice President, Invesco Management Group, Inc. (formerly known as Invesco Aim Management Group, Inc.) and Van Kampen Exchange Corp.; Senior Vice President and Chief Compliance Officer, Invesco Advisers, Inc. (registered investment adviser) (formerly known as Invesco Institutional (N.A.), Inc.); Chief Compliance Officer, The Invesco Funds, INVESCO Private Capital Investments, Inc. (holding company) and Invesco Private Capital, Inc. (registered investment adviser); Vice President, Invesco Distributors, Inc. (formerly known as Invesco Aim Distributors, Inc.) and Invesco Investment Services, Inc. (formerly known as Invesco Aim Investment Services, Inc.).
Formerly: Chief Compliance Officer, Invesco Van Kampen Closed-End Funds PowerShares Exchange-Traded Fund Trust, PowerShares Exchange-Traded Fund Trust II, PowerShares India Exchange-Traded Fund Trust, and PowerShares Actively Managed Exchange-Traded Fund Trust; Senior Vice President, Van Kampen Investments Inc.; Senior Vice President and Chief Compliance Officer, Invesco Advisers, Inc. and Invesco Aim Capital Management, Inc.; Chief Compliance Officer, Invesco Global Asset Management (N.A.), Inc., Invesco Senior Secured Management, Inc. (registered investment adviser) and Van Kampen Investor Services Inc.; Vice President, Invesco Aim Capital Management, Inc. and Fund Management Company | | N/A | | N/A |
| | | | | | | | | |
The Statement of Additional Information of the Trust includes additional information about the Fund’s Trustees and is available upon request, without charge, by calling 1.800.959.4246. Please refer to the Fund’s prospectus for information on the Fund’s sub-advisers.
| | | | | | | |
Office of the Fund
11 Greenway Plaza, Suite 2500
Houston, TX 77046-1173 | | Investment Adviser
Invesco Advisers, Inc.
1555 Peachtree Street, N.E.
Atlanta, GA 30309 | | Distributor
Invesco Distributors, Inc.
11 Greenway Plaza, Suite 2500
Houston, TX 77046-1173 | | Auditors
PricewaterhouseCoopers LLP
1201 Louisiana Street, Suite 2900
Houston, TX 77002-5678 |
| | | | | | | |
| | | | | | | |
Counsel to the Fund
Stradley Ronon Stevens & Young, LLP
2600 One Commerce Square
Philadelphia, PA 19103 | | Counsel to the Independent Trustees
Kramer, Levin, Naftalis & Frankel LLP
1177 Avenue of the Americas
New York, NY 10036-2714 | | Transfer Agent
Invesco Investment Services, Inc.
11 Greenway Plaza, Suite 2500
Houston, TX77046-1173 | | Custodian
State Street Bank and Trust Company
225 Franklin
Boston, MA 02110-2801 |
Invesco V.I. Utilities Fund
Invesco Van Kampen V.I. Capital Growth Fund
Annual Report to Shareholders § December 31, 2011
The Fund provides a complete list of its holdings four times in each fiscal year, at the quarter-ends. For the second and fourth quarters, the lists appear in the Fund’s semiannual and annual reports to shareholders. For the first and third quarters, the Fund files the lists with the Securities and Exchange Commission (SEC) on Form N-Q. The Fund’s Form N-Q filings are available on the SEC website, sec.gov. Copies of the Fund’s Forms N-Q may be reviewed and copied at the SEC Public Reference Room in Washington, D.C. You can obtain information on the operation of the Public Reference Room, including information about duplicating fee charges, by calling 202 551 8090 or 800 732 0330, or by electronic request at the following email address: publicinfo@sec.gov. The SEC file numbers for the Fund are 811-07452 and 033-57340. The Fund’s most recent portfolio holdings, as filed on Form N-Q, have also been made available to insurance companies issuing variable annuity contracts and variable life insurance policies (“variable products”) that invest in the Fund.
A description of the policies and procedures that the Fund uses to determine how to vote proxies relating to portfolio securities is available without charge, upon request, from our Client Services department at 800 959 4246 or at invesco.com/proxyguidelines. The information is also available on the SEC website, sec.gov.
Information regarding how the Fund voted proxies related to its portfolio securities during the 12 months ended June 30, 2011, is available at invesco.com/proxysearch. The information is also available on the SEC website, sec.gov.
Invesco Advisers, Inc. is an investment adviser; it provides investment advisory services to individual and institutional clients and does not sell securities. Invesco Distributors, Inc. is the U.S. distributor for Invesco Ltd.’s retail mutual funds, exchange-traded funds and institutional money market funds. Both are wholly owned, indirect subsidiaries of Invesco Ltd.
This report must be accompanied or preceded by a currently effective Fund prospectus and variable product prospectus, which contain more complete information, including sales charges and expenses. Investors should read each carefully before investing.
Invesco Distributors, Inc.
VK-VICGR-AR-1
| | | | | |
|
| | | | | |
NOT FDIC INSURED | | MAY LOSE VALUE | | NO BANK GUARANTEE |
Management’s Discussion of Fund Performance
Performance summary
For the fiscal year ended December 31, 2011, Invesco Van Kampen V.I. Capital Growth Fund had negative returns and underperformed the Fund’s style-specific benchmark, the Russell 1000 Growth Index.
Your Fund’s long-term performance appears later in this report.
Fund vs. Indexes
Total returns, 12/31/10 to 12/31/11, excluding variable product issuer charges.
If variable product issuer charges were included, returns would be lower.
| | | | | |
|
| Series I Shares | | | -6.18 | % |
| |
| Series II Shares | | | -6.39 | |
| |
S&P 500 Index▼ (Broad Market Index) | | | 2.09 | |
| |
Russell 1000 Growth Index▼ (Style-Specific Index) | | | 2.64 | |
| |
Lipper VUF Large-Cap Growth Funds Index▼ (Peer Group Index) | | | -2.24 | |
Source(s): ▼Lipper Inc.
As noted in the Fund’s latest semiannual report, the Fund has adopted a three-tier benchmark structure to compare its performance to broad market, style-specific and peer group market measures.
How we invest
We believe a growth investment strategy is an essential component of a diversified portfolio.
Our investment process emphasizes rigorous bottom-up analysis of individual companies. We seek to invest in companies with strong or improving fundamentals, attractive valuation relative to growth prospects and earnings expectations that appear fair to conservative.
To narrow our investment universe, we utilize a holistic approach that emphasizes fundamental research and, to a lesser extent, includes quantitative analysis. At the end of this distillation process, we have a set of stocks to analyze in greater depth.
Our fundamental analysis focuses on identifying companies with strong drivers of growth. To accomplish this goal, we conduct rigorous bottom-up analysis in order to develop higher conviction in each company’s prospects for growth. Through our analysis, we develop a mosaic of each company through detailed discussions with company management teams, competitors, distributors, suppliers, Wall Street analysts and customers. We also utilize a variety of
valuation techniques based on the company in question, the industry in which the company operates, the stage of the business cycle and other factors that best reflect a company’s value.
Risk management plays an important role in portfolio construction, as our target portfolio attempts to maximize the relationship between risk and return. We seek to accomplish this goal by investing in companies with attractive fundamental prospects for growth, and we divide the portfolio between stable growth stocks and catalyst-driven stocks.
We consider selling a stock for any of the following reasons:
| n | | The price target set at purchase has been reached. |
| |
| n | | There is deterioration in fundamentals. |
| |
| n | | The catalysts for growth are no longer present or are reflected in the stock price. |
| |
| n | | There is a more attractive investment opportunity. |
Market conditions and your Fund
The fiscal year began with equity markets fueled on the second round of “quantitative easing” by the U.S. Federal Reserve, and markets rose through the first
quarter of 2011. However, with the spring came increased volatility and significant macroeconomic distortions due to civil unrest in Egypt and Libya, flooding in Australia and a devastating earthquake and tsunami in Japan. Corporate earnings remained strong with largely positive surprises, but were often overshadowed by investor concerns about continuing high unemployment and soft housing data. Although markets stabilized and were generally in positive territory through the summer, major equity indexes sold off precipitously in August as the U.S. government struggled to raise the nation’s debt ceiling. Despite an eventual agreement between the White House and Congress, credit rating agency Standard & Poor’s announced the first-ever downgrade to long-term U.S. government debt. Uncertainty created by the downgrade, combined with the continuing saga surrounding the debt crisis in the eurozone, reignited fears of a global recession. Despite evidence of sustained, but muted, growth, these macroeconomic factors continued to weigh on markets through the end of the reporting period.
In this environment, the Fund produced negative absolute returns and underperformed the Russell 1000 Growth Index for the fiscal year. The Fund underperformed the index by the widest margin in the information technology (IT), health care, energy, industrials, consumer discretionary and consumer staples sectors. Underperformance overall was driven predominately by stock selection.
For the fiscal year, the Fund underperformed by the widest margin in the IT sector primarily attributable to stock selection. Rovi was the largest detractor from Fund performance. Weakening consumer spending in August, along with fourth quarter guidance that some legacy product revenue was decelerating while newer growth products would be postponed, hurt company performance.
Portfolio Composition
By sector
| | | | | |
|
| Information Technology | | | 32.4 | % |
| |
| Consumer Discretionary | | | 16.9 | |
| |
| Industrials | | | 11.5 | |
| |
| Energy | | | 11.3 | |
| |
| Health Care | | | 10.2 | |
| |
| Consumer Staples | | | 7.6 | |
| |
| Financials | | | 3.6 | |
| |
| Materials | | | 3.3 | |
| |
| Telecommunication Services | | | 2.8 | |
| |
Money Market Funds Plus Other Assets Less Liabilities | | | 0.4 | |
Top 10 Equity Holdings*
| | | | | | | | | |
|
| | 1. | | | Apple Inc. | | | 9.5 | % |
| |
| | 2. | | | Google Inc.–Class A | | | 3.5 | |
| |
| | 3. | | | DIRECTV–Class A | | | 3.3 | |
| |
| | 4. | | | QUALCOMM, Inc. | | | 2.9 | |
| |
| | 5. | | | Halliburton Co. | | | 2.8 | |
| |
| | 6. | | | Amazon.com, Inc. | | | 2.8 | |
| |
| | 7. | | | CVS Caremark Corp. | | | 2.5 | |
| |
| | 8. | | | UnitedHealth Group Inc. | | | 2.4 | |
| |
| | 9. | | | American Tower Corp. | | | 2.3 | |
| |
| | 10. | | | JPMorgan Chase & Co. | | | 2.2 | |
| | | | | |
|
| Total Net Assets | | $208.7 million |
| |
| Total Number of Holdings* | | | 72 |
| |
The Fund’s holdings are subject to change, and there is no assurance that the Fund will continue to hold any particular security.
| | |
| *Excluding money market fund holdings. |
Invesco Van Kampen V.I. Capital Growth Fund
Despite these obstacles, we believe long-term growth still exists for Rovi, as the company generally benefits from secular tailwinds – such as the transition from analog to digital cable and the growing adoption of connected televisions. Broadcom also detracted from Fund performance during the reporting period. Weak sales of smartphones and tablets using their semiconductors led management to guide down expectations. Positions in both Rovi and Broadcom offset the positive performance from the two largest contributors to Fund performance, Apple and Visa.
The health care sector was also a detractor from relative Fund performance largely due to stock selection. Examples of holdings that were key detractors included biotechnology company Illumina, and biotechnical instrument producer Agilent Technologies. We sold the Fund’s position in Illumina due to deteriorating fundamentals.
In the energy sector, the Fund also underperformed due to stock selection and an emphasis on service providers and exploration companies with higher growth rates, which were down more than the defensive integrated oil companies and broader energy group. These firms included Weatherford International, Occidental Petroleum, and National Oilwell Varco. We sold the Fund’s position in National Oilwell Varco during the reporting period.
In the industrials sector, the Fund’s underperformance was driven by stock selection. One of the largest single detractors from Fund performance was construction and engineering services firm, Foster Wheeler. The company missed out on an anticipated contract, and later in the reporting period, was disproportionately affected as energy prices declined. Examples of other holdings that were key detractors from Fund performance included industrial electric equipment producer ABB and commercial product manufacturer Ingersoll-Rand. Both companies were affected by wavering sentiment on the prospects for global growth.
The Fund also underperformed in the consumer discretionary sector, again driven by stock selection. Amazon.com detracted from Fund performance due to weak revenue growth late in the reporting period after initial high expectations for the stock. Amazon’s spending was also higher than expected, although directed to building out rapid distribution centers and new products, which could drive future growth.
During the reporting period, consumer staples was one of the stronger performing sectors in the index. Relative to the strong consumer staples benchmark performance, consumer staples holdings in the Fund outperformed. However, the Fund’s underweight position overall in this sector was a net detractor from Fund performance. Beverage company Hansen Natural was a notably strong contributor.
As we’ve discussed, the stock market experienced heavy volatility during the last 12 months. We would like to caution investors against making investment decisions based on short-term performance. We thank you for your commitment to Invesco Van Kampen V.I. Capital Growth Fund.
The views and opinions expressed in management’s discussion of Fund performance are those of Invesco Advisers, Inc. These views and opinions are subject to change at any time based on factors such as market and economic conditions. These views and opinions may not be relied upon as investment advice or recommendations, or as an offer for a particular security. The information is not a complete analysis of every aspect of any market, country, industry, security or the Fund. Statements of fact are from sources considered reliable, but Invesco Advisers, Inc. makes no representation or warranty as to their completeness or accuracy. Although historical performance is no guarantee of future results, these insights may help you understand our investment management philosophy.
See important Fund and, if applicable, index disclosures later in this report.
Erik Voss
Chartered Financial Analyst, portfolio manager, is lead manager of Invesco Van Kampen V.I. Capital Growth Fund. He joined Invesco in 2010. Mr. Voss earned a B.S. in mathematics and an M.S. in finance from the University of Wisconsin.
Ido Cohen
Portfolio manager, is manager of Invesco Van Kampen V.I. Capital Growth Fund. He joined Invesco in 2010. Mr. Cohen is a cum laude graduate of the Wharton School of the University of Pennsylvania, where he earned a B.S. in economics.
Invesco Van Kampen V.I. Capital Growth Fund
Your Fund’s Long-Term Performance
Results of a $10,000 Investment – Oldest Share Class(es)
Fund and index data from 12/31/01*
| | |
| 1 | | Source: Lipper Inc. |
| |
| * | | During the reporting period, Invesco changed its policy regarding growth of $10,000 charts. For funds older than 10 years, we previously showed performance since inception. Going forward, we will show performance for the most recent 10 years, since this more accurately reflects the experience of the typical shareholder. As a result, charts now may include benchmarks that did not appear previously, because the funds’ inception pre-dated the benchmarks’ inception. Also, all charts will now be presented using a linear format. |
Past performance cannot guarantee comparable future results.
As noted earlier in this report, the Fund
has adopted a three-tier benchmark structure to compare its performance to broad market, style-specific and peer
group market measures. These additional benchmarks will now be included in the chart above.
Average Annual Total Returns
As of 12/31/11
| | | | | | | | | |
|
| Series I Shares | | | | |
| |
| Inception (7/3/95) | | | 7.39 | % |
| |
| 10 | Years | | | 1.30 | |
| |
| 5 | Years | | | 2.19 | |
| |
| 1 | Year | | | -6.18 | |
| |
| | | | | | | | | |
| Series II Shares | | | | |
| Inception (9/18/00) | | | -4.59 | % |
| |
| 10 | Years | | | 1.05 | |
| |
| 5 | Years | | | 1.93 | |
| |
| | 1 | Year | | | -6.39 | |
Effective June 1, 2010, Class I and Class II shares of the predecessor fund, Van Kampen Life Investment Trust Capital Growth Portfolio, advised by Van Kampen Asset Management were reorganized into Series I and Series II shares, respectively, of Invesco Van Kampen V.I. Capital Growth Fund. Returns shown above for Series I and Series II shares are blended returns of the predecessor fund and Invesco Van Kampen V.I. Capital Growth Fund. Share class returns will differ from the predecessor fund because of different expenses.
The performance data quoted represent past performance and cannot guarantee comparable future results;
current performance may be lower or higher. Please contact your variable product issuer or financial adviser for the most recent month-end variable product performance. Performance figures reflect Fund expenses, reinvested distributions and changes in net asset value. Investment return and principal value will fluctuate so that you may have a gain or loss when you sell shares.
The net annual Fund operating expense ratio set forth in the most recent Fund prospectus as of the date of this report for Series I and Series II shares was 0.84% and 1.09%, respectively.1 The total annual Fund operating expense ratio set forth in the most recent Fund prospectus as of the date of this report for Series I and Series II shares was 1.03% and 1.28%, respectively. The expense ratios presented above may vary from the expense ratios presented in other sections of this report that are based on expenses incurred during the period covered by this report.
Invesco Van Kampen V.I. Capital Growth Fund, a series portfolio of AIM Variable Insurance Funds (Invesco Variable Insurance Funds), is currently
offered through insurance companies issuing variable products. You cannot purchase shares of the Fund directly. Performance figures given represent the Fund and are not intended to reflect actual variable product values. They do not reflect sales charges, expenses and fees assessed in connection with a variable product. Sales charges, expenses and fees, which are determined by the variable product issuers, will vary and will lower the total return.
The most recent month-end performance data at the Fund level, excluding variable product charges, is available at 800 451 4246. As mentioned above, for the most recent month-end performance including variable product charges, please contact your variable product issuer or financial adviser.
| | |
| 1 | | Total annual Fund operating expenses after any contractual fee waivers and/or expense reimbursements by the adviser in effect through at least June 30, 2012. See current prospectus for more information. |
Invesco Van Kampen V.I. Capital Growth Fund
Invesco Van Kampen V.I. Capital Growth Fund’s investment objective is to seek capital growth.
| n | Unless otherwise stated, information presented in this report is as of December 31, 2011, and is based on total net assets. |
| |
| n | Unless otherwise noted, all data provided by Invesco. |
| |
| n | To access your Fund’s reports/prospectus, visit invesco.com/fundreports. |
Principal risks of investing in the Fund
Active trading risk. The Fund engages in frequent trading of portfolio securities. Active trading results in added expenses and may result in a lower return.
Market risk. Market risk is the possibility that the market values of securities owned by the Fund will decline. Market risk may affect a single issuer, industry, sector of the economy or the market as a whole. Investments in common stocks and other equity securities generally are affected by changes in the stock markets, which fluctuate substantially over time, sometimes suddenly and sharply. The Fund emphasizes a growth style of investing. The market values of growth securities may be more volatile than other types of investments. The returns on growth securities may or may not move in tandem with the returns on other styles of investing or the overall stock markets. Different types of stocks tend to shift in and out of favor depending on market and economic conditions. Thus, the value of the Fund’s investments will vary and at times may be lower or higher than that of other types of investments.
Growth investing risk. Investments in growth-oriented equity securities may have above-average volatility of price movement. The returns on growth securities may or may not move in tandem with the returns on other styles of investing or the overall stock markets.
Foreign risks. The risks of investing in securities of foreign issuers, including emerging market issuers, can include fluctuations in foreign currencies, foreign currency exchange controls, political and economic instability, differences in securities regulation and trading, and foreign taxation issues.
Futures risk. A decision as to whether, when and how to use futures involves the exercise of skill and judgment and even a well-conceived futures transaction may be unsuccessful because of market behavior or unexpected events.
Options risk. A decision as to whether, when and how to use options involves the exercise of skill and judgment and even a well-conceived option transaction may be unsuccessful because of market behavior or unexpected events. The prices of options can be highly volatile and the use of options can lower total returns.
Investing in real estate investment trusts (REITs) risk. Investing in REITs makes the Fund more susceptible to risks associated with the ownership of real estate and with the real estate industry in general, and may involve duplication of management fees and certain other expenses. In addition, REITs depend upon specialized management skills, may be less diversified, may have lower trading volume, and may be subject to more abrupt or erratic price movements than the overall securities markets. REITs must comply with certain requirements of the federal income tax law to maintain their federal income tax status.
Derivatives risk. Risks of derivatives include the possible imperfect correlation between the value of the instruments and the underlying assets; risks of default by the other party to the transaction; risks that the transactions may result in losses that partially or completely offset gains in portfolio positions; and risks that the instruments may not be liquid.
About indexes used in this report
The S&P 500® Index is an unmanaged index considered representative of the U.S. stock market.
The Russell 1000® Growth Index is an unmanaged index considered representative of large-cap growth stocks. The Russell 1000 Growth Index is a trademark/service mark of the Frank Russell Co. Russell is a trademark of the Frank Russell Co.
The Lipper VUF Large-Cap Growth Funds Index is an unmanaged index considered representative of large-cap growth variable insurance underlying funds tracked by Lipper.
The Fund is not managed to track the performance of any particular index, including the index(es) defined here, and consequently, the performance of the Fund may deviate significantly from the performance of the index(es).
A direct investment cannot be made in an index. Unless otherwise indicated, index results include reinvested dividends, and they do not reflect sales charges. Performance of the peer group, if applicable, reflects fund expenses; performance of a market index does not.
Other information
The Chartered Financial Analyst® (CFA®) designation is globally recognized and attests to a charterholder’s success in a rigorous and comprehensive study program in the field of investment management and research analysis.
Industry classifications used in this report are generally according to the Global Industry Classification Standard, which was developed by and is the exclusive property and a service mark of MSCI Inc. and Standard & Poor’s.
The returns shown in management’s discussion of Fund performance are based on net asset values calculated for shareholder transactions. Generally accepted accounting principles require adjustments to be made to the net assets of the Fund at period end for financial reporting purposes, and as such, the net asset values for shareholder transactions and the returns based on those net asset values may differ from the net asset values and returns reported in the Financial Highlights. Additionally, the returns and net asset values shown throughout this report are at the Fund level only and do not include variable product issuer charges. If such charges were included, the total returns would be lower.
Invesco Van Kampen V.I. Capital Growth Fund
Schedule of Investments(a)
December 31, 2011
| | | | | | | | | |
| | | Shares | | Value |
| |
Common Stocks & Other Equity Interests–99.60%
| | | | |
Aerospace & Defense–2.62%
| | | | |
| Boeing Co. (The) | | | 20,835 | | | $ | 1,528,247 | |
| |
| Precision Castparts Corp. | | | 23,942 | | | | 3,945,402 | |
| |
| | | | | | | | 5,473,649 | |
| |
Apparel, Accessories & Luxury Goods–1.02%
| | | | |
| Coach, Inc. | | | 10,661 | | | | 650,747 | |
| |
Prada S.p.A. (Italy)(b) | | | 327,600 | | | | 1,473,615 | |
| |
| | | | | | | | 2,124,362 | |
| |
Application Software–1.19%
| | | | |
Citrix Systems, Inc.(b) | | | 40,846 | | | | 2,480,169 | |
| |
Asset Management & Custody Banks–1.40%
| | | | |
| BlackRock, Inc. | | | 16,366 | | | | 2,917,076 | |
| |
Auto Parts & Equipment–0.30%
| | | | |
BorgWarner, Inc.(b) | | | 9,758 | | | | 621,975 | |
| |
Automotive Retail–0.58%
| | | | |
AutoZone, Inc.(b) | | | 3,704 | | | | 1,203,689 | |
| |
Biotechnology–1.82%
| | | | |
Celgene Corp.(b) | | | 23,731 | | | | 1,604,216 | |
| |
Gilead Sciences, Inc.(b) | | | 53,724 | | | | 2,198,923 | |
| |
| | | | | | | | 3,803,139 | |
| |
Cable & Satellite–4.45%
| | | | |
| Comcast Corp.–Class A | | | 104,319 | | | | 2,473,404 | |
| |
DIRECTV–Class A(b) | | | 159,498 | | | | 6,820,134 | |
| |
| | | | | | | | 9,293,538 | |
| |
Casinos & Gaming–1.14%
| | | | |
Las Vegas Sands Corp.(b) | | | 55,443 | | | | 2,369,079 | |
| |
Communications Equipment–3.62%
| | | | |
F5 Networks, Inc.(b) | | | 8,347 | | | | 885,784 | |
| |
Juniper Networks, Inc.(b) | | | 26,725 | | | | 545,457 | |
| |
| QUALCOMM, Inc. | | | 111,959 | | | | 6,124,157 | |
| |
| | | | | | | | 7,555,398 | |
| |
Computer Hardware–9.46%
| | | | |
Apple Inc.(b) | | | 48,745 | | | | 19,741,725 | |
| |
Computer Storage & Peripherals–3.37%
| | | | |
EMC Corp.(b) | | | 210,653 | | | | 4,537,466 | |
| |
NetApp, Inc.(b) | | | 47,115 | | | | 1,708,861 | |
| |
SanDisk Corp.(b) | | | 16,179 | | | | 796,168 | |
| |
| | | | | | | | 7,042,495 | |
| |
Construction & Engineering–1.09%
| | | | |
Foster Wheeler AG (Switzerland)(b) | | | 118,533 | | | | 2,268,722 | |
| |
Construction & Farm Machinery & Heavy Trucks–1.14%
| | | | |
| Cummins Inc. | | | 27,026 | | | | 2,378,829 | |
| |
Data Processing & Outsourced Services–2.89%
| | | | |
| MasterCard, Inc.–Class A | | | 5,956 | | | | 2,220,516 | |
| |
| Visa Inc.–Class A | | | 37,568 | | | | 3,814,279 | |
| |
| | | | | | | | 6,034,795 | |
| |
Department Stores–1.83%
| | | | |
| Macy’s, Inc. | | | 118,712 | | | | 3,820,152 | |
| |
Drug Retail–2.48%
| | | | |
| CVS Caremark Corp. | | | 127,090 | | | | 5,182,730 | |
| |
Fertilizers & Agricultural Chemicals–1.56%
| | | | |
| Monsanto Co. | | | 27,155 | | | | 1,902,751 | |
| |
| Mosaic Co. (The) | | | 26,808 | | | | 1,351,927 | |
| |
| | | | | | | | 3,254,678 | |
| |
Food Retail–0.50%
| | | | |
| Kroger Co. (The) | | | 43,115 | | | | 1,044,245 | |
| |
Footwear–1.02%
| | | | |
| NIKE, Inc.–Class B | | | 22,155 | | | | 2,135,077 | |
| |
General Merchandise Stores–0.34%
| | | | |
Dollar Tree, Inc.(b) | | | 8,622 | | | | 716,574 | |
| |
Gold–1.73%
| | | | |
| Goldcorp, Inc. (Canada) | | | 81,689 | | | | 3,614,738 | |
| |
Health Care Equipment–0.40%
| | | | |
| Baxter International Inc. | | | 17,016 | | | | 841,952 | |
| |
Health Care Services–1.40%
| | | | |
Express Scripts, Inc.(b) | | | 65,311 | | | | 2,918,749 | |
| |
Health Care Technology–1.11%
| | | | |
Allscripts Healthcare Solutions, Inc.(b) | | | 121,841 | | | | 2,307,669 | |
| |
Heavy Electrical Equipment–1.63%
| | | | |
ABB Ltd.–ADR (Switzerland)(b) | | | 180,683 | | | | 3,402,261 | |
| |
Home Improvement Retail–0.67%
| | | | |
| Home Depot, Inc. (The) | | | 33,251 | | | | 1,397,872 | |
| |
Hotels, Resorts & Cruise Lines–0.85%
| | | | |
| Starwood Hotels & Resorts Worldwide, Inc. | | | 36,993 | | | | 1,774,554 | |
| |
Household Products–2.08%
| | | | |
| Procter & Gamble Co. (The) | | | 65,209 | | | | 4,350,092 | |
| |
| | | | | | | | | |
See accompanying Notes to Financial Statements which are an integral part of the financial statements.
Invesco Van Kampen V.I. Capital Growth Fund
| | | | | | | | | |
| | | Shares | | Value |
| |
Industrial Conglomerates–1.77%
| | | | |
| Danaher Corp. | | | 78,312 | | | $ | 3,683,797 | |
| |
Industrial Machinery–0.73%
| | | | |
| Ingersoll-Rand PLC (Ireland) | | | 49,799 | | | | 1,517,376 | |
| |
Integrated Oil & Gas–2.16%
| | | | |
| Exxon Mobil Corp. | | | 18,761 | | | | 1,590,182 | |
| |
| Occidental Petroleum Corp. | | | 31,233 | | | | 2,926,532 | |
| |
| | | | | | | | 4,516,714 | |
| |
Internet Retail–2.79%
| | | | |
Amazon.com, Inc.(b) | | | 33,657 | | | | 5,826,027 | |
| |
Internet Software & Services–5.16%
| | | | |
Baidu, Inc.–ADR (China)(b) | | | 13,534 | | | | 1,576,305 | |
| |
eBay Inc.(b) | | | 63,650 | | | | 1,930,505 | |
| |
Google Inc.–Class A(b) | | | 11,255 | | | | 7,269,604 | |
| |
| | | | | | | | 10,776,414 | |
| |
IT Consulting & Other Services–2.60%
| | | | |
| Accenture PLC–Class A (Ireland) | | | 24,911 | | | | 1,326,013 | |
| |
Cognizant Technology Solutions Corp.–Class A(b) | | | 63,885 | | | | 4,108,444 | |
| |
| | | | | | | | 5,434,457 | |
| |
Life Sciences Tools & Services–1.48%
| | | | |
Agilent Technologies, Inc.(b) | | | 88,670 | | | | 3,097,243 | |
| |
Managed Health Care–2.36%
| | | | |
| UnitedHealth Group Inc. | | | 97,181 | | | | 4,925,133 | |
| |
Oil & Gas Drilling–1.44%
| | | | |
| Ensco PLC–ADR (United Kingdom) | | | 64,041 | | | | 3,004,804 | |
| |
Oil & Gas Equipment & Services–4.88%
| | | | |
Cameron International Corp.(b) | | | 43,038 | | | | 2,117,039 | |
| |
| Halliburton Co. | | | 170,534 | | | | 5,885,129 | |
| |
Weatherford International Ltd.(b) | | | 149,139 | | | | 2,183,395 | |
| |
| | | | | | | | 10,185,563 | |
| |
Oil & Gas Exploration & Production–2.78%
| | | | |
| Anadarko Petroleum Corp. | | | 56,955 | | | | 4,347,375 | |
| |
| Noble Energy, Inc. | | | 15,402 | | | | 1,453,795 | |
| |
| | | | | | | | 5,801,170 | |
| |
Other Diversified Financial Services–2.24%
| | | | |
| JPMorgan Chase & Co. | | | 140,712 | | | | 4,678,674 | |
| |
Packaged Foods & Meats–0.30%
| | | | |
| Mead Johnson Nutrition Co. | | | 9,139 | | | | 628,124 | |
| |
Pharmaceuticals–1.64%
| | | | |
| Allergan, Inc. | | | 39,050 | | | | 3,426,247 | |
| |
Railroads–1.62%
| | | | |
| Union Pacific Corp. | | | 31,976 | | | | 3,387,537 | |
| |
Restaurants–1.95%
| | | | |
| Starbucks Corp. | | | 88,242 | | | | 4,060,014 | |
| |
Semiconductors–1.71%
| | | | |
Broadcom Corp.–Class A(b) | | | 88,455 | | | | 2,597,039 | |
| |
| Xilinx, Inc. | | | 30,051 | | | | 963,435 | |
| |
| | | | | | | | 3,560,474 | |
| |
Soft Drinks–2.22%
| | | | |
Coca-Cola Co. (The) | | | 50,479 | | | | 3,532,016 | |
| |
Monster Beverage Corp.(b) | | | 11,971 | | | | 1,103,008 | |
| |
| | | | | | | | 4,635,024 | |
| |
Systems Software–2.34%
| | | | |
Check Point Software Technologies Ltd. (Israel)(b) | | | 34,770 | | | | 1,826,816 | |
| |
| Oracle Corp. | | | 16,455 | | | | 422,070 | |
| |
Rovi Corp.(b) | | | 107,086 | | | | 2,632,174 | |
| |
| | | | | | | | 4,881,060 | |
| |
Trucking–0.93%
| | | | |
| J.B. Hunt Transport Services, Inc. | | | 42,826 | | | | 1,930,168 | |
| |
Wireless Telecommunication Services–2.81%
| | | | |
| America Movil SAB de C.V.–Series L–ADR (Mexico) | | | 50,816 | | | | 1,148,442 | |
| |
| American Tower Corp. | | | 78,503 | | | | 4,710,965 | |
| |
| | | | | | | | 5,859,407 | |
| |
| Total Common Stocks & Other Equity Interests (Cost $177,952,196) | | | | | | | 207,885,410 | |
| |
Money Market Funds–0.69%
| | | | |
Liquid Assets Portfolio–Institutional Class(c) | | | 715,784 | | | | 715,784 | |
| |
Premier Portfolio–Institutional Class(c) | | | 715,784 | | | | 715,784 | |
| |
| Total Money Market Funds (Cost $1,431,568) | | | | | | | 1,431,568 | |
| |
| TOTAL INVESTMENTS–100.29% (Cost $179,383,764) | | | | | | | 209,316,978 | |
| |
| OTHER ASSETS LESS LIABILITIES–(0.29)% | | | | | | | (606,954 | ) |
| |
| NET ASSETS–100.00% | | | | | | $ | 208,710,024 | |
| |
Investment Abbreviations:
| | | |
| ADR | | – American Depositary Receipt |
Notes to Schedule of Investments:
| | |
| (a) | | Industry and/or sector classifications used in this report are generally according to the Global Industry Classification Standard, which was developed by and is the exclusive property and a service mark of MSCI Inc. and Standard & Poor’s. |
| (b) | | Non-income producing security. |
| (c) | | The money market fund and the Fund are affiliated by having the same investment adviser. |
See accompanying Notes to Financial Statements which are an integral part of the financial statements.
Invesco Van Kampen V.I. Capital Growth Fund
Statement of Assets and Liabilities
December 31, 2011
| | | | | |
Assets:
|
| Investments, at value (Cost $177,952,196) | | $ | 207,885,410 | |
| |
| Investments in affiliated money market funds, at value and cost | | | 1,431,568 | |
| |
| Total investments, at value (Cost $179,383,764) | | | 209,316,978 | |
| |
| Receivable for: | | | | |
| Investments sold | | | 764,624 | |
| |
| Fund shares sold | | | 185,720 | |
| |
| Dividends | | | 93,057 | |
| |
| Investment for trustee deferred compensation and retirement plans | | | 37,072 | |
| |
| Total assets | | | 210,397,451 | |
| |
Liabilities:
|
| Payable for: | | | | |
| Investments purchased | | | 687,575 | |
| |
| Fund shares reacquired | | | 476,879 | |
| |
| Accrued fees to affiliates | | | 427,583 | |
| |
| Accrued other operating expenses | | | 38,906 | |
| |
| Trustee deferred compensation and retirement plans | | | 56,484 | |
| |
| Total liabilities | | | 1,687,427 | |
| |
| Net assets applicable to shares outstanding | | $ | 208,710,024 | |
| |
Net assets consist of:
|
| Shares of beneficial interest | | $ | 207,075,919 | |
| |
| Undistributed net investment income (loss) | | | (55,300 | ) |
| |
| Undistributed net realized gain (loss) | | | (28,245,683 | ) |
| |
| Unrealized appreciation | | | 29,935,088 | |
| |
| | | $ | 208,710,024 | |
| |
Net Assets:
|
| Series I | | $ | 122,986,268 | |
| |
| Series II | | $ | 85,723,756 | |
| |
Shares outstanding, $0.01 par value per share, with an unlimited number of shares authorized:
|
| Series I | | | 3,855,399 | |
| |
| Series II | | | 2,734,805 | |
| |
| Series I: | | | | |
| Net asset value per share | | $ | 31.90 | |
| |
| Series II: | | | | |
| Net asset value per share | | $ | 31.35 | |
| |
Statement of Operations
For the year ended December 31, 2011
| | | | | |
Investment income:
|
| Dividends (net of foreign withholding taxes of $7,524) | | $ | 1,502,993 | |
| |
| Dividends from affiliated money market funds (includes securities lending income of $132) | | | 2,760 | |
| |
| Interest | | | 12,775 | |
| |
| Total investment income | | | 1,518,528 | |
| |
Expenses:
|
| Advisory fees | | | 1,537,639 | |
| |
| Administrative services fees | | | 525,437 | |
| |
| Custodian fees | | | 22,140 | |
| |
| Distribution fees — Series II | | | 251,055 | |
| |
| Transfer agent fees | | | 25,832 | |
| |
| Trustees’ and officers’ fees and benefits | | | 27,066 | |
| |
| Other | | | 51,122 | |
| |
| Total expenses | | | 2,440,291 | |
| |
| Less: Fees waived | | | (338,298 | ) |
| |
| Net expenses | | | 2,101,993 | |
| |
| Net investment income (loss) | | | (583,465 | ) |
| |
Realized and unrealized gain (loss) from:
|
| Net realized gain (loss) from: | | | | |
| Investment securities (includes net gains from securities sold to affiliates of $3,537,632) | | | 13,212,083 | |
| |
| Foreign currencies | | | (1,340 | ) |
| |
| | | | 13,210,743 | |
| |
| Change in net unrealized appreciation (depreciation) of: | | | | |
| Investment securities | | | (34,131,792 | ) |
| |
| Foreign currencies | | | (1,038 | ) |
| |
| | | | (34,132,830 | ) |
| |
| Net realized and unrealized gain (loss) | | | (20,922,087 | ) |
| |
| Net increase (decrease) in net assets resulting from operations | | $ | (21,505,552 | ) |
| |
See accompanying Notes to Financial Statements which are an integral part of the financial statements.
Invesco Van Kampen V.I. Capital Growth Fund
Statement of Changes in Net Assets
For the years ended December 31, 2011 and 2010
| | | | | | | | | |
| | | 2011 | | 2010 |
| |
Operations:
| | | | |
| Net investment income (loss) | | $ | (583,465 | ) | | $ | (94,648 | ) |
| |
| Net realized gain (loss) | | | 13,210,743 | | | | (8,136,508 | ) |
| |
| Change in net unrealized appreciation (depreciation) | | | (34,132,830 | ) | | | 43,145,195 | |
| |
| Net increase (decrease) in net assets resulting from operations | | | (21,505,552 | ) | | | 34,914,039 | |
| |
Share transactions–net:
| | | | |
| Series I | | | 64,098,694 | | | | (15,642,359 | ) |
| |
| Series II | | | (18,673,081 | ) | | | (21,229,104 | ) |
| |
| Net increase (decrease) in net assets resulting from share transactions | | | 45,425,613 | | | | (36,871,463 | ) |
| |
| Net increase (decrease) in net assets | | | 23,920,061 | | | | (1,957,424 | ) |
| |
Net assets:
| | | | |
| Beginning of year | | | 184,789,963 | | | | 186,747,387 | |
| |
| End of year (includes undistributed net investment income (loss) of $(55,300) and $(3,976), respectively) | | $ | 208,710,024 | | | $ | 184,789,963 | |
| |
Notes to Financial Statements
December 31, 2011
NOTE 1—Significant Accounting Policies
Invesco Van Kampen V.I. Capital Growth Fund (the “Fund”) is a series portfolio of AIM Variable Insurance Funds (Invesco Variable Insurance Funds) (the “Trust”). The Trust is a Delaware statutory trust registered under the Investment Company Act of 1940, as amended (the “1940 Act”), as an open-end series management investment company consisting of twenty-eight separate portfolios, (each constituting a “Fund”). The assets, liabilities and operations of each portfolio are accounted for separately. Information presented in these financial statements pertains only to the Fund. Matters affecting each Fund or class will be voted on exclusively by the shareholders of such Fund or class. Current Securities and Exchange Commission (“SEC”) guidance, however, requires participating insurance companies offering separate accounts to vote shares proportionally in accordance with the instructions of the contract owners whose investments are funded by shares of each Fund or class.
The Fund’s investment objective is to seek capital growth.
The Fund currently offers two classes of shares, Series I and Series II, both of which are offered to insurance company separate accounts funding variable annuity contracts and variable life insurance policies (“variable products”).
The following is a summary of the significant accounting policies followed by the Fund in the preparation of its financial statements.
| | |
| A. | | Security Valuations — Securities, including restricted securities, are valued according to the following policy. |
| | A security listed or traded on an exchange (except convertible bonds) is valued at its last sales price or official closing price as of the close of the customary trading session on the exchange where the security is principally traded, or lacking any sales or official closing price on a particular day, the security may be valued at the closing bid price on that day. Securities traded in the over-the-counter market are valued based on prices furnished by independent pricing services or market makers. When such securities are valued by an independent pricing service they may be considered fair valued. Futures contracts are valued at the final settlement price set by an exchange on which they are principally traded. Listed options are valued at the mean between the last bid and ask prices from the exchange on which they are principally traded. Options not listed on an exchange are valued by an independent source at the mean between the last bid and ask prices. For purposes of determining net asset value per share, futures and option contracts generally are valued 15 minutes after the close of the customary trading session of the New York Stock Exchange (“NYSE”). |
| | Investments in open-end and closed-end registered investment companies that do not trade on an exchange are valued at the end of day net asset value per share. Investments in open-end and closed-end registered investment companies that trade on an exchange are valued at the last sales price or official closing price as of the close of the customary trading session on the exchange where the security is principally traded. |
| | Debt obligations (including convertible bonds) and unlisted equities are fair valued using an evaluated quote provided by an independent pricing service. Evaluated quotes provided by the pricing service may be determined without exclusive reliance on quoted prices, and may reflect appropriate factors such as institution-size trading in similar groups of securities, developments related to specific securities, dividend rate, yield, quality, type of issue, coupon rate, maturity, individual trading characteristics and other market data. Debt securities are subject to interest rate and credit risks. In addition, all debt securities involve some risk of default with respect to interest and/or principal payments. |
| | Foreign securities (including foreign exchange contracts) are converted into U.S. dollar amounts using the applicable exchange rates as of the close of the NYSE. If market quotations are available and reliable for foreign exchange traded equity securities, the securities will be valued at the market |
Invesco Van Kampen V.I. Capital Growth Fund
| | |
| | quotations. Because trading hours for certain foreign securities end before the close of the NYSE, closing market quotations may become unreliable. If between the time trading ends on a particular security and the close of the customary trading session on the NYSE, events occur that are significant and make the closing price unreliable, the Fund may fair value the security. If the event is likely to have affected the closing price of the security, the security will be valued at fair value in good faith using procedures approved by the Board of Trustees. Adjustments to closing prices to reflect fair value may also be based on a screening process of an independent pricing service to indicate the degree of certainty, based on historical data, that the closing price in the principal market where a foreign security trade is not the current value as of the close of the NYSE. Foreign securities meeting the approved degree of certainty that the price is not reflective of current value will be priced at the indication of fair value from the independent pricing service. Multiple factors may be considered by the independent pricing service in determining adjustments to reflect fair value and may include information relating to sector indices, American Depositary Receipts and domestic and foreign index futures. Foreign securities may have additional risks including exchange rate changes, potential for sharply devalued currencies and high inflation, political and economic upheaval, the relative lack of issuer information, relatively low market liquidity and the potential lack of strict financial and accounting controls and standards. |
| | Securities for which market prices are not provided by any of the above methods may be valued based upon quotes furnished by independent sources. The last bid price may be used to value equity securities. The mean between the last bid and asked prices is used to value debt obligations, including Corporate Loans. |
| | Securities for which market quotations are not readily available or are unreliable are valued at fair value as determined in good faith by or under the supervision of the Trust’s officers following procedures approved by the Board of Trustees. Issuer specific events, market trends, bid/ask quotes of brokers and information providers and other market data may be reviewed in the course of making a good faith determination of a security’s fair value. |
| | Valuations change in response to many factors including the historical and prospective earnings of the issuer, the value of the issuer’s assets, general economic conditions, interest rates, investor perceptions and market liquidity. Because of the inherent uncertainties of valuation, the values reflected in the financial statements may materially differ from the value received upon actual sale of those investments. |
| B. | | Securities Transactions and Investment Income — Securities transactions are accounted for on a trade date basis. Realized gains or losses on sales are computed on the basis of specific identification of the securities sold. Interest income is recorded on the accrual basis from settlement date. Dividend income (net of withholding tax, if any) is recorded on the ex-dividend date. |
| | The Fund may periodically participate in litigation related to Fund investments. As such, the Fund may receive proceeds from litigation settlements. Any proceeds received are included in the Statement of Operations as realized gain (loss) for investments no longer held and as unrealized gain (loss) for investments still held. |
| | Brokerage commissions and mark ups are considered transaction costs and are recorded as an increase to the cost basis of securities purchased and/or a reduction of proceeds on a sale of securities. Such transaction costs are included in the determination of net realized and unrealized gain (loss) from investment securities reported in the Statement of Operations and the Statement of Changes in Net Assets and the net realized and unrealized gains (losses) on securities per share in the Financial Highlights. Transaction costs are included in the calculation of the Fund’s net asset value and, accordingly, they reduce the Fund’s total returns. These transaction costs are not considered operating expenses and are not reflected in net investment income reported in the Statement of Operations and Statement of Changes in Net Assets, or the net investment income per share and ratios of expenses and net investment income reported in the Financial Highlights, nor are they limited by any expense limitation arrangements between the Fund and the investment adviser. |
| | The Fund allocates income and realized and unrealized capital gains and losses to a class based on the relative net assets of each class. |
| C. | | Country Determination — For the purposes of making investment selection decisions and presentation in the Schedule of Investments, the investment adviser may determine the country in which an issuer is located and/or credit risk exposure based on various factors. These factors include the laws of the country under which the issuer is organized, where the issuer maintains a principal office, the country in which the issuer derives 50% or more of its total revenues and the country that has the primary market for the issuer’s securities, as well as other criteria. Among the other criteria that may be evaluated for making this determination are the country in which the issuer maintains 50% or more of its assets, the type of security, financial guarantees and enhancements, the nature of the collateral and the sponsor organization. Country of issuer and/or credit risk exposure has been determined to be the United States of America, unless otherwise noted. |
| D. | | Distributions — Distributions from income and net realized capital gain, if any, are generally paid to separate accounts of participating insurance companies annually and recorded on ex-dividend date. |
| E. | | Federal Income Taxes — The Fund intends to comply with the requirements of Subchapter M of the Internal Revenue Code necessary to qualify as a regulated investment company and to distribute substantially all of the Fund’s taxable earnings to shareholders. As such, the Fund will not be subject to federal income taxes on otherwise taxable income (including net realized capital gain) that is distributed to shareholders. Therefore, no provision for federal income taxes is recorded in the financial statements. |
| | The Fund files tax returns in the U.S. Federal jurisdiction and certain other jurisdictions. Generally, the Fund is subject to examinations by such taxing authorities for up to three years after the filing of the return for the tax period. |
| F. | | Expenses — Fees provided for under the Rule 12b-1 plan of a particular class of the Fund and which are directly attributable to that class are charged to the operations of such class. All other expenses are allocated among the classes based on relative net assets. |
| G. | | Accounting Estimates — The preparation of financial statements in conformity with accounting principles generally accepted in the United States of America (“GAAP”) requires management to make estimates and assumptions that affect the reported amounts of assets and liabilities at the date of the financial statements and the reported amounts of revenues and expenses during the reporting period including estimates and assumptions related to taxation. Actual results could differ from those estimates by a significant amount. In addition, the Fund monitors for material events or transactions that may occur or become known after the period-end date and before the date the financial statements are released to print. |
| H. | | Indemnifications — Under the Trust’s organizational documents, each Trustee, officer, employee or other agent of the Trust is indemnified against certain liabilities that may arise out of performance of their duties to the Fund. Additionally, in the normal course of business, the Fund enters into contracts, including the Fund’s servicing agreements that contain a variety of indemnification clauses. The Fund’s maximum exposure under these |
Invesco Van Kampen V.I. Capital Growth Fund
| | |
| | arrangements is unknown as this would involve future claims that may be made against the Fund that have not yet occurred. The risk of material loss as a result of such indemnification claims is considered remote. |
| I. | | Securities Lending — The Fund may lend portfolio securities having a market value up to one-third of the Fund’s total assets. Such loans are secured by collateral equal to no less than the market value of the loaned securities determined daily by the securities lending provider. Such collateral will be cash or debt securities issued or guaranteed by the U.S. Government or any of its sponsored agencies. Cash collateral received in connection with these loans is invested in short-term money market instruments or affiliated money market funds and is shown as such on the Schedule of Investments. It is the Fund’s policy to obtain additional collateral from or return excess collateral to the borrower by the end of the next business day, following the valuation date of the securities loaned. Therefore, the value of the collateral held may be temporarily less than the value of the securities on loan. Lending securities entails a risk of loss to the Fund if and to the extent that the market value of the securities loaned were to increase and the borrower did not increase the collateral accordingly, and the borrower fails to return the securities. Upon the failure of the borrower to return the securities, collateral may be liquidated and the securities may be purchased on the open market to replace the loaned securities. The Fund could experience delays and costs in gaining access to the collateral. The Fund bears the risk of any deficiency in the amount of the collateral available for return to the borrower due to any loss on the collateral invested. Dividends received on cash collateral investments for securities lending transactions, which are net of compensation to counterparties, is included in Dividends from affiliated money market funds on the Statement of Operations. The aggregate value of securities out on loan is shown as a footnote on the Statement of Assets and Liabilities, if any. |
| J. | | Foreign Currency Translations — Foreign currency is valued at the close of the NYSE based on quotations posted by banks and major currency dealers. Portfolio securities and other assets and liabilities denominated in foreign currencies are translated into U.S. dollar amounts at date of valuation. Purchases and sales of portfolio securities (net of foreign taxes withheld on disposition) and income items denominated in foreign currencies are translated into U.S. dollar amounts on the respective dates of such transactions. The Fund does not separately account for the portion of the results of operations resulting from changes in foreign exchange rates on investments and the fluctuations arising from changes in market prices of securities held. The combined results of changes in foreign exchange rates and the fluctuation of market prices on investments (net of estimated foreign tax withholding) are included with the net realized and unrealized gain or loss from investments in the Statement of Operations. Reported net realized foreign currency gains or losses arise from (1) sales of foreign currencies, (2) currency gains or losses realized between the trade and settlement dates on securities transactions, and (3) the difference between the amounts of dividends, interest, and foreign withholding taxes recorded on the Fund’s books and the U.S. dollar equivalent of the amounts actually received or paid. Net unrealized foreign currency gains and losses arise from changes in the fair values of assets and liabilities, other than investments in securities at fiscal period end, resulting from changes in exchange rates. |
| | The Fund may invest in foreign securities which may be subject to foreign taxes on income, gains on investments or currency repatriation, a portion of which may be recoverable. |
| K. | | Foreign Currency Contracts — The Fund may enter into foreign currency contracts to manage or minimize currency or exchange rate risk. The Fund may also enter into foreign currency contracts for the purchase or sale of a security denominated in a foreign currency in order to “lock in” the U.S. dollar price of that security. A foreign currency contract is an obligation to purchase or sell a specific currency for an agreed-upon price at a future date. The use of foreign currency contracts does not eliminate fluctuations in the price of the underlying securities the Fund owns or intends to acquire but establishes a rate of exchange in advance. Fluctuations in the value of these contracts are measured by the difference in the contract date and reporting date exchange rates and are recorded as unrealized appreciation (depreciation) until the contracts are closed. When the contracts are closed, realized gains (losses) are recorded. Realized and unrealized gains (losses) on the contracts are included in the Statement of Operations. The primary risks associated with foreign currency contracts include failure of the counterparty to meet the terms of the contract and the value of the foreign currency changing unfavorably. These risks may be in excess of the amounts reflected in the Statement of Assets and Liabilities. |
NOTE 2—Advisory Fees and Other Fees Paid to Affiliates
The Trust has entered into a master investment advisory agreement with Invesco Advisers, Inc. (the “Adviser” or “Invesco”). Effective May 2, 2011, under the terms of the investment advisory agreement, the Fund pays an advisory fee to the Adviser based on the annual rate of the Fund’s average daily net assets as follows:
| | | | | |
| Average Daily Net Assets | | Rate |
| |
| First $250 million | | | 0 | .695% |
| |
| Next $250 million | | | 0 | .67% |
| |
| Next $500 million | | | 0 | .645% |
| |
| Over $550 million | | | 0 | .62% |
| |
Prior to May 2, 2011, the Fund paid an advisory fee to the Adviser based on the annual rate of the Fund’s average daily net assets as follows:
| | | | | |
| Average Daily Net Assets | | Rate |
| |
| First $500 million | | | 0 | .70% |
| |
| Next $500 million | | | 0 | .65% |
| |
| Over $1 billion | | | 0 | .60% |
| |
Under the terms of a master sub-advisory agreement between the Adviser and each of Invesco Asset Management Deutschland GmbH, Invesco Asset Management Limited, Invesco Asset Management (Japan) Limited, Invesco Australia Limited, Invesco Hong Kong Limited, Invesco Senior Secured Management, Inc. and Invesco Canada Ltd. (collectively, the “Affiliated Sub-Advisers”) the Adviser, not the Fund, may pay 40% of the fees paid to the Adviser to any such
Invesco Van Kampen V.I. Capital Growth Fund
Affiliated Sub-Adviser(s) that provide(s) discretionary investment management services to the Fund based on the percentage of assets allocated to such Sub-Adviser(s).
The Adviser has contractually agreed, through at least June 30, 2012, to waive advisory fees and/or reimburse expenses to the extent necessary to limit total annual operating expenses (excluding certain items discussed below) of Series I shares to 0.84% and Series II shares to 1.09% of average daily net assets. In determining the Adviser’s obligation to waive advisory fees and/or reimburse expenses, the following expenses are not taken into account, and could cause the total annual operating expenses after fee waiver and/or expense reimbursement to exceed the numbers reflected above: (1) interest; (2) taxes; (3) dividend expense on short sales; (4) extraordinary or non-routine items, including litigation expenses; and (5) expenses that the Fund has incurred but did not actually pay because of an expense offset arrangement. Unless the Board of the Trustees and Invesco mutually agree to amend or continue the fee waiver agreement, it will terminate on June 30, 2012.
Further, the Adviser has contractually agreed, through at least June 30, 2012, to waive the advisory fee payable by the Fund in an amount equal to 100% of the net advisory fees the Adviser receives from the affiliated money market funds on investments by the Fund of uninvested cash in such affiliated money market funds.
For the year ended December 31, 2011, the Adviser waived advisory fees of $338,298.
The Trust has entered into a master administrative services agreement with Invesco pursuant to which the Fund has agreed to pay Invesco a fee for costs incurred in providing accounting services and fund administrative services to the Fund and to reimburse Invesco for administrative services fees paid to insurance companies that have agreed to provide services to the participants of separate accounts. These administrative services provided by the insurance companies may include, among other things: the printing of prospectuses, financial reports and proxy statements and the delivery of the same to existing participants; the maintenance of master accounts; the facilitation of purchases and redemptions requested by the participants; and the servicing of participants’ accounts. Pursuant to such agreement, for the year ended December 31, 2011, Invesco was paid $60,782 for accounting and fund administrative services and reimbursed $464,655 for services provided by insurance companies.
The Trust has entered into a transfer agency and service agreement with Invesco Investment Services, Inc. (“IIS”) pursuant to which the Fund has agreed to pay IIS a fee for providing transfer agency and shareholder services to the Fund and reimburse IIS for certain expenses incurred by IIS in the course of providing such services. For the year ended December 31, 2011, expenses incurred under the agreement are shown in the Statement of Operations as transfer agent fees.
The Trust has entered into a master distribution agreement with Invesco Distributors, Inc. (“IDI”) to serve as the distributor for the Fund. The Trust has adopted a plan pursuant to Rule 12b-1 under the 1940 Act with respect to the Fund’s Series II shares (the “Plan”). The Fund, pursuant to the Plan, pays IDI compensation at the annual rate of 0.25% of the Fund’s average daily net assets of Series II shares. Of the Plan payments, up to 0.25% of the average daily net assets of the Series II shares may be paid to insurance companies who furnish continuing personal shareholder services to customers who purchase and own Series II shares of the Fund. For the year ended December 31, 2011, expenses incurred under the Plan are detailed in the Statement of Operations as distribution fees.
Certain officers and trustees of the Trust are officers and directors of the Adviser, IIS and/or IDI.
NOTE 3—Additional Valuation Information
GAAP defines fair value as the price that would be received to sell an asset or paid to transfer a liability in an orderly transaction between market participants at the measurement date, under current market conditions. GAAP establishes a hierarchy that prioritizes the inputs to valuation methods giving the highest priority to readily available unadjusted quoted prices in an active market for identical assets (Level 1) and the lowest priority to significant unobservable inputs (Level 3) generally when market prices are not readily available or are unreliable. Based on the valuation inputs, the securities or other investments are tiered into one of three levels. Changes in valuation methods may result in transfers in or out of an investment’s assigned level:
| | |
| | Level 1 — | Prices are determined using quoted prices in an active market for identical assets. |
| | Level 2 — | Prices are determined using other significant observable inputs. Observable inputs are inputs that other market participants may use in pricing a security. These may include quoted prices for similar securities, interest rates, prepayment speeds, credit risk, yield curves, loss severities, default rates, discount rates, volatilities and others. |
| | Level 3 — | Prices are determined using significant unobservable inputs. In situations where quoted prices or observable inputs are unavailable (for example, when there is little or no market activity for an investment at the end of the period), unobservable inputs may be used. Unobservable inputs reflect the Fund’s own assumptions about the factors market participants would use in determining fair value of the securities or instruments and would be based on the best available information. |
The following is a summary of the tiered valuation input levels, as of December 31, 2011. The level assigned to the securities valuations may not be an indication of the risk or liquidity associated with investing in those securities. Because of the inherent uncertainties of valuation, the values reflected in the financial statements may materially differ from the value received upon actual sale of those investments.
During the year ended December 31, 2011, there were no significant transfers between investment levels.
| | | | | | | | | | | | | | | | | |
| | | Level 1 | | Level 2 | | Level 3 | | Total |
| |
| Equity Securities | | $ | 207,843,363 | | | $ | 1,473,615 | | | $ | — | | | $ | 209,316,978 | |
| |
NOTE 4—Security Transactions with Affiliated Funds
The Fund is permitted to purchase or sell securities from or to certain other Invesco Funds under specified conditions outlined in procedures adopted by the Board of Trustees of the Trust. The procedures have been designed to ensure that any purchase or sale of securities by the Fund from or to another fund or portfolio that is or could be considered an affiliate by virtue of having a common investment adviser (or affiliated investment advisers), common Trustees and/or
Invesco Van Kampen V.I. Capital Growth Fund
common officers complies with Rule 17a-7 of the 1940 Act. Further, as defined under the procedures, each transaction is effected at the current market price. Pursuant to these procedures, for the year ended December 31, 2011, the Fund engaged in securities purchases of $4,424,629 and securities sales of $26,916,419, which resulted in net realized gains of $3,537,632.
NOTE 5—Trustees’ and Officers’ Fees and Benefits
“Trustees’ and Officers’ Fees and Benefits” include amounts accrued by the Fund to pay remuneration to certain Trustees and Officers of the Fund. Trustees have the option to defer compensation payable by the Fund, and “Trustees’ and Officers’ Fees and Benefits” also include amounts accrued by the Fund to fund such deferred compensation amounts. Those Trustees who defer compensation have the option to select various Invesco Funds in which their deferral accounts shall be deemed to be invested. Finally, certain current Trustees are eligible to participate in a retirement plan that provides for benefits to be paid upon retirement to Trustees over a period of time based on the number of years of service. The Fund may have certain former Trustees who also participate in a retirement plan and receive benefits under such plan. “Trustees’ and Officers’ Fees and Benefits” include amounts accrued by the Fund to fund such retirement benefits. Obligations under the deferred compensation and retirement plans represent unsecured claims against the general assets of the Fund.
During the year ended December 31, 2011, the Fund paid legal fees of $1,374 for services rendered by Kramer, Levin, Naftalis & Frankel LLP as counsel to the Independent Trustees. A partner of that firm is a Trustee of the Trust.
NOTE 6—Cash Balances
The Fund is permitted to temporarily carry a negative or overdrawn balance in its account with State Street Bank and Trust Company, the custodian bank. To compensate the custodian bank for such overdrafts, the overdrawn Fund may either (1) leave funds as a compensating balance in the account so the custodian bank can be compensated by earning the additional interest; or (2) compensate by paying the custodian bank at a rate agreed upon by the custodian bank and Invesco, not to exceed the contractually agreed upon rate.
NOTE 7—Distributions to Shareholders and Tax Components of Net Assets
There were no ordinary income or long-term capital gain distributions paid during the years ended December 31, 2011 and 2010.
Tax Components of Net Assets at Period-End:
| | | | | |
| | | 2011 |
| |
| Net unrealized appreciation — investments | | $ | 28,739,702 | |
| |
| Net unrealized appreciation — other investments | | | 1,874 | |
| |
| Temporary book/tax differences | | | (55,300 | ) |
| |
| Capital loss carryforward | | | (27,052,171 | ) |
| |
| Shares of beneficial interest | | | 207,075,919 | |
| |
| Total net assets | | $ | 208,710,024 | |
| |
The difference between book-basis and tax-basis unrealized appreciation (depreciation) is due to differences in the timing of recognition of gains and losses on investments for tax and book purposes. The Fund’s net unrealized appreciation (depreciation) difference is attributable primarily to wash sales.
The temporary book/tax differences are a result of timing differences between book and tax recognition of income and/or expenses. The Fund’s temporary book/tax differences are the result of the trustee deferral of compensation and retirement plan benefits.
Capital loss carryforward is calculated and reported as of a specific date. Results of transactions and other activity after that date may affect the amount of capital loss carryforward actually available for the Fund to utilize. The Regulated Investment Company Modernization Act of 2010 (the “Act”) eliminated the eight-year carryover period for capital losses that arise in taxable years beginning after its enactment date of December 22, 2010. Consequently, these capital losses can be carried forward for an unlimited period. However, capital losses with an expiration period may not be used to offset capital gains until all net capital losses without an expiration date have been utilized. Additionally, post-enactment capital loss carryovers will retain their character as either short-term or long-term capital losses instead of as short-term capital losses as under prior law. The ability to utilize capital loss carryforward in the future may be limited under the Internal Revenue Code and related regulations based on the results of future transactions. Under these limitation rules, the Fund is limited to utilizing $27,052,171 of capital loss carryforward in the fiscal year ending December 31, 2012.
The Fund utilized $10,854,233 of capital loss carryforward in the current period to offset net realized capital gain for federal income tax purposes. The Fund has a capital loss carryforward as of December 31, 2011, which expires as follows:
| | | | | | | | | | | | | |
| Capital Loss Carryforward* |
| Expiration | | Short-Term | | Long-Term | | Total |
| |
| December 31, 2016 | | $ | 7,871,502 | | | $ | — | | | $ | 7,871,502 | |
| |
| December 31, 2017 | | | 5,236,281 | | | | — | | | | 5,236,281 | |
| |
| December 31, 2018 | | | 13,944,388 | | | | — | | | | 13,944,388 | |
| |
| | | $ | 27,052,171 | | | $ | — | | | $ | 27,052,171 | |
| |
| |
| * | Capital loss carryforward as of the date listed above is reduced for limitations, if any, to the extent required by the Internal Revenue Code. To the extent that unrealized gains as of May 2, 2011, the date of reorganization of Invesco V.I. Large Cap Growth Fund into the Fund are realized on securities held in each fund at such date of reorganization, the capital loss carryforward may be further limited for up to five years from the date of the reorganization. |
Invesco Van Kampen V.I. Capital Growth Fund
NOTE 8—Investment Securities
The aggregate amount of investment securities (other than short-term securities, U.S. Treasury obligations and money market funds, if any) purchased and sold by the Fund during the year ended December 31, 2011 was $233,765,289 and $260,748,664, respectively. Cost of investments on a tax basis includes the adjustments for financial reporting purposes as of the most recently completed Federal income tax reporting period-end.
| | | | | |
| Unrealized Appreciation (Depreciation) of Investment Securities on a Tax Basis |
| |
| Aggregate unrealized appreciation of investment securities | | $ | 36,979,510 | |
| |
| Aggregate unrealized (depreciation) of investment securities | | | (8,239,808 | ) |
| |
| Net unrealized appreciation of investment securities | | $ | 28,739,702 | |
| |
| Cost of investments for tax purposes is $180,577,276. |
NOTE 9—Reclassification of Permanent Differences
Primarily as a result of differing book/tax treatment of foreign currency transactions and net operating losses, on December 31, 2011, undistributed net investment income (loss) was increased by $572,101, undistributed net realized gain (loss) was increased by $1,340 and shares of beneficial interest decreased by $573,441. Further, as a result of tax deferrals and capital loss carry forward acquired in the reorganization of Invesco V.I. Large Cap Growth Fund into the Fund, undistributed net investment income (loss) was decreased by $39,960, undistributed net realized gain (loss) was decreased by $4,627,378 and shares of beneficial interest increased by $4,667,338. These reclassifications had no effect on the net assets of the Fund.
NOTE 10—Share Information
| | | | | | | | | | | | | | | | | |
| | | Summary of Share Activity |
| |
| | | Year ended December 31, |
| | | 2011(a) | | 2010 |
| | | Shares | | Amount | | Shares | | Amount |
| |
| Sold: | | | | | | | | | | | | | | | | |
| Series I | | | 148,444 | | | $ | 4,995,733 | | | | 727,223 | | | $ | 20,626,860 | |
| |
| Series II | | | 311,666 | | | | 10,470,974 | | | | 260,787 | | | | 7,680,246 | |
| |
Issued in connection with acquisitions:(b) | | | | | | | | | | | | | | | | |
| Series I | | | 2,764,202 | | | | 102,182,035 | | | | — | | | | — | |
| |
| Series II | | | 17,638 | | | | 641,933 | | | | — | | | | — | |
| |
| Reacquired: | | | | | | | | | | | | | | | | |
| Series I | | | (1,259,447 | ) | | | (43,079,074 | ) | | | (1,140,807 | ) | | | (36,269,219 | ) |
| |
| Series II | | | (876,910 | ) | | | (29,785,988 | ) | | | (995,335 | ) | | | (28,909,350 | ) |
| |
| Net increase in share activity | | | 1,105,593 | | | $ | 45,425,613 | | | | (1,148,132 | ) | | $ | (36,871,463 | ) |
| |
| | |
| (a) | | There are entities that are record owners of more than 5% of the outstanding shares of the Fund and in the aggregate own 58% of the outstanding shares of the Fund. The Fund and the Fund’s principal underwriter or adviser, are parties to participation agreements with these entities whereby these entities sell units of interest in separate accounts funding variable products that are invested in the Fund. The Fund, Invesco and/or Invesco affiliates may make payments to these entities, which are considered to be related to the Fund, for providing services to the Fund, Invesco and/or Invesco affiliates including but not limited to services such as, securities brokerage, third party record keeping and account servicing and administrative services. The Fund has no knowledge as to whether all or any portion of the shares owned of record by these entities are also owned beneficially. |
| (b) | | As of the open of business on May 2, 2011, the Fund acquired all the net assets of Invesco V.I. Large Cap Growth Fund (the “Target Fund”) pursuant to a plan of reorganization approved by the Trustees of the Fund on November 10, 2010 and by the shareholders of the Target Fund on April 1, 2011. The acquisition was accomplished by a tax-free exchange of 2,781,840 shares of the Fund for 6,596,443 shares outstanding of the Target Fund as of the close of business on April 29, 2011. Each class of the Target Fund was exchanged for the like class of shares of the Fund based on the relative net asset value of the Target Fund to the net asset value of the Fund on the close of business, April 29, 2011. The Target Fund’s net assets at that date of $102,823,968 including $19,535,310 of unrealized appreciation, were combined with those of the Fund. The net assets of the Fund immediately before the acquisition were $188,601,217. The net assets of the Fund immediately following the acquisition were $291,425,185. |
| | The pro forma results of operations for the year ended December 31, 2011 assuming the reorganization had been completed on January 1, 2011, the beginning of the annual reporting period are as follows: |
| | | | | |
| Net investment income (loss) | | $ | (731,640 | ) |
| Net realized/unrealized gains (loss) | | | (13,447,533 | ) |
| | | | | |
| Change in net assets resulting from operations | | $ | (14,179,173 | ) |
| | |
| | The combined investment portfolios have been managed as a single integrated portfolio since the acquisition was completed, it is not practicable to separate the amounts of revenue and earnings of the Target Fund that have been included in the Fund’s Statement of Operations since May 2, 2011. |
Invesco Van Kampen V.I. Capital Growth Fund
NOTE 11—Financial Highlights
The following schedule presents financial highlights for a share of the Fund outstanding throughout the periods indicated.
| | | | | | | | | | | | | | | | | | | | | | | | | | | | | | | | | | | | | | | | | | | | | | | | | | | | | | | | | |
| | | | | | | | | | | | | | | | | | | | | | | Ratio of
| | Ratio of
| | | | |
| | | | | | | Net gains
| | | | | | | | | | | | | | | | expenses
| | expenses
| | | | |
| | | | | | | (losses) on
| | | | | | | | | | | | | | | | to average
| | to average net
| | Ratio of net
| | |
| | | Net asset
| | Net
| | securities
| | | | Dividends
| | | | | | | | | | | | net assets
| | assets without
| | investment
| | |
| | | value,
| | investment
| | (both
| | Total from
| | from net
| | Return of
| | | | Net asset
| | | | Net assets,
| | with fee waivers
| | fee waivers
| | income (loss)
| | |
| | | beginning
| | income
| | realized and
| | investment
| | investment
| | capital
| | Total
| | value, end
| | Total
| | end of period
| | and/or expenses
| | and/or expenses
| | to average
| | Portfolio
|
| | | of period | | (loss)(a) | | unrealized) | | operations | | income | | distributions | | distributions | | of period | | return | | (000s omitted) | | absorbed | | absorbed | | net assets | | turnover(b) |
| |
| Series I(c) |
| Year ended 12/31/11 | | $ | 34.00 | | | $ | (0.05 | ) | | $ | (2.05 | ) | | $ | (2.10 | ) | | $ | — | | | $ | — | | | $ | — | | | $ | 31.90 | | | | (6.18 | )%(d) | | $ | 122,986 | | | | 0.84 | %(e) | | | 0.99 | %(e) | | | (0.15 | )%(e) | | | 126 | % |
| Year ended 12/31/10 | | | 28.37 | | | | 0.03 | | | | 5.60 | | | | 5.63 | | | | — | | | | — | | | | — | | | | 34.00 | | | | 19.84 | (d) | | | 74,870 | | | | 0.79 | | | | 0.90 | | | | 0.12 | | | | 158 | |
| Year ended 12/31/09 | | | 17.10 | | | | 0.04 | | | | 11.26 | | | | 11.30 | | | | (0.03 | ) | | | (0.00 | )(f) | | | (0.03 | ) | | | 28.37 | | | | 66.07 | | | | 74,214 | | | | 0.84 | | | | 0.84 | | | | 0.17 | | | | 13 | |
| Year ended 12/31/08 | | | 33.68 | | | | (0.01 | ) | | | (16.43 | ) | | | (16.44 | ) | | | (0.14 | ) | | | — | | | | (0.14 | ) | | | 17.10 | | | | (48.99 | ) | | | 48,599 | | | | 0.85 | | | | 0.87 | | | | (0.04 | ) | | | 42 | |
| Year ended 12/31/07 | | | 28.81 | | | | 0.11 | | | | 4.77 | | | | 4.88 | | | | (0.01 | ) | | | — | | | | (0.01 | ) | | | 33.68 | | | | 16.96 | | | | 143,558 | | | | 0.80 | | | | 0.80 | | | | 0.35 | | | | 177 | |
| |
| Series II(c) |
| Year ended 12/31/11 | | | 33.49 | | | | (0.14 | ) | | | (2.00 | ) | | | (2.14 | ) | | | — | | | | — | | | | — | | | | 31.35 | | | | (6.39 | )(d) | | | 85,724 | | | | 1.09 | (e) | | | 1.24 | (e) | | | (0.40 | )(e) | | | 126 | |
| Year ended 12/31/10 | | | 28.01 | | | | (0.05 | ) | | | 5.53 | | | | 5.48 | | | | — | | | | — | | | | — | | | | 33.49 | | | | 19.56 | (d) | | | 109,920 | | | | 1.04 | | | | 1.15 | | | | (0.18 | ) | | | 158 | |
| Year ended 12/31/09 | | | 16.91 | | | | (0.02 | ) | | | 11.12 | | | | 11.10 | | | | — | | | | — | | | | — | | | | 28.01 | | | | 65.64 | (g) | | | 112,533 | | | | 1.09 | | | | 1.09 | | | | (0.07 | ) | | | 13 | |
| Year ended 12/31/08 | | | 33.29 | | | | (0.08 | ) | | | (16.25 | ) | | | (16.33 | ) | | | (0.05 | ) | | | — | | | | (0.05 | ) | | | 16.91 | | | | (49.11 | )(g) | | | 69,198 | | | | 1.10 | | | | 1.12 | | | | (0.29 | ) | | | 42 | |
| Year ended 12/31/07 | | | 28.54 | | | | 0.03 | | | | 4.72 | | | | 4.75 | | | | — | | | | — | | | | — | | | | 33.29 | | | | 16.64 | (g) | | | 261,198 | | | | 1.05 | | | | 1.05 | | | | 0.11 | | | | 177 | |
| |
| | |
| (a) | | Calculated using average shares outstanding. |
| (b) | | Portfolio turnover is calculated at the fund level and is not annualized for periods less than one year, if applicable. For the year ended December 31, 2011, the portfolio turnover calculation excludes the value of securities purchased of $81,993,574 and sold of $49,870,241 in the effort to realign the Fund’s portfolio holdings after the reorganization of Invesco V.I. Large Cap Growth Fund into the Fund. |
| (c) | | On June 1, 2010, the predecessor Fund’s former Class I and Class II shares were reorganized into Series I and Series II shares. |
| (d) | | Includes adjustments in accordance with accounting principles generally accepted in the United States of America and as such, the net asset value for financial reporting purposes and the returns based upon those net asset values may differ from the net asset value and returns for shareholder transactions. Total returns are not annualized for periods less than one year, if applicable, and do not reflect charges assessed in connection with a variable product, which if included would reduce total returns. |
| (e) | | Ratios are based on average daily net assets (000’s) of $120,372 and $100,422 for Series I and Series II shares, respectively. |
| (f) | | Amount is less than $0.01 per share. |
| (g) | | These returns include combined Rule 12b-1 fees and service fees of up to 0.25%. |
NOTE 12—Proposed Reorganization
The Board of Trustees of the Fund unanimously approved an Agreement and Plan of Reorganization (the “Agreement”) pursuant to which the Fund would acquire all of the assets and liabilities of Invesco V.I. Leisure Fund and Invesco V.I. Capital Appreciation Fund (the “Target Funds”) in exchange for shares of the Fund.
The Agreement requires approval of the Target Funds’ shareholders and will be submitted to the shareholders for their consideration at a meeting to be held in or around April 2012. Upon closing of the reorganization, shareholders of the Target Funds will receive a corresponding class of shares of the Fund in exchange for their shares of the Target Funds and the Target Funds will liquidate and cease operations.
Invesco Van Kampen V.I. Capital Growth Fund
Report of Independent Registered Public Accounting Firm
To the Board of Trustees of AIM Variable Insurance Funds (Invesco Variable Insurance Funds)
and Shareholders of Invesco Van Kampen V.I. Capital Growth Fund:
In our opinion, the accompanying statement of assets and liabilities, including the schedule of investments, and the related statements of operations and of changes in net assets and the financial highlights present fairly, in all material respects, the financial position of Invesco Van Kampen V.I. Capital Growth Fund (one of the funds constituting AIM Variable Insurance Funds (Invesco Variable Insurance Funds), hereafter referred to as the “Fund”) at December 31, 2011, the results of its operations for the year then ended, and the changes in its net assets and the financial highlights for each of the two years in the period then ended, in conformity with accounting principles generally accepted in the United States of America. These financial statements and financial highlights (hereafter referred to as “financial statements”) are the responsibility of the Fund’s management; our responsibility is to express an opinion on these financial statements based on our audits. We conducted our audits of these financial statements in accordance with the standards of the Public Company Accounting Oversight Board (United States). Those standards require that we plan and perform the audits to obtain reasonable assurance about whether the financial statements are free of material misstatement. An audit includes examining, on a test basis, evidence supporting the amounts and disclosures in the financial statements, assessing the accounting principles used and significant estimates made by management, and evaluating the overall financial statement presentation. We believe that our audits, which included confirmation of securities at December 31, 2011 by correspondence with the custodian and brokers, provide a reasonable basis for our opinion. The financial highlights of the Fund for the periods ended December 31, 2009 and prior were audited by other independent auditors whose report dated February 19, 2010 expressed an unqualified opinion on those financial statements.
PRICEWATERHOUSECOOPERS LLP
February 14, 2012
Houston, Texas
Invesco Van Kampen V.I. Capital Growth Fund
Calculating your ongoing Fund expenses
Example
As a shareholder of the Fund, you incur ongoing costs, including management fees; distribution and/or service fees (12b-1); and other Fund expenses. This example is intended to help you understand your ongoing costs (in dollars) of investing in the Fund and to compare these costs with ongoing costs of investing in other mutual funds. The example is based on an investment of $1,000 invested at the beginning of the period and held for the entire period July 1, 2011 through December 31, 2011.
The actual and hypothetical expenses in the examples below do not represent the effect of any fees or other expenses assessed in connection with a variable product; if they did, the expenses shown would be higher while the ending account values shown would be lower.
Actual expenses
The table below provides information about actual account values and actual expenses. You may use the information in this table, together with the amount you invested, to estimate the expenses that you paid over the period. Simply divide your account value by $1,000 (for example, an $8,600 account value divided by $1,000 = 8.6), then multiply the result by the number in the table under the heading entitled “Actual Expenses Paid During Period” to estimate the expenses you paid on your account during this period.
Hypothetical example for comparison purposes
The table below also provides information about hypothetical account values and hypothetical expenses based on the Fund’s actual expense ratio and an assumed rate of return of 5% per year before expenses, which is not the Fund’s actual return.
The hypothetical account values and expenses may not be used to estimate the actual ending account balance or expenses you paid for the period. You may use this information to compare the ongoing costs of investing in the Fund and other funds. To do so, compare this 5% hypothetical example with the 5% hypothetical examples that appear in the shareholder reports of the other funds.
Please note that the expenses shown in the table are meant to highlight your ongoing costs. Therefore, the hypothetical information is useful in comparing ongoing costs, and will not help you determine the relative total costs of owning different funds.
| | | | | | | | | | | | | | | | | | | | | | | | | | | | | | | |
| | | | | | | | | | HYPOTHETICAL
| | | |
| | | | | | | | | | (5% annual return before
| | | |
| | | | | | | ACTUAL | | | expenses) | | | |
| | | | Beginning
| | | Ending
| | | Expenses
| | | Ending
| | | Expenses
| | | Annualized
|
| | | | Account Value
| | | Account Value
| | | Paid During
| | | Account Value
| | | Paid During
| | | Expense
|
| Series | | | (07/01/11) | | | (12/31/11)1 | | | Period2 | | | (12/31/11) | | | Period2 | | | Ratio |
| I | | | $ | 1,000.00 | | | | $ | 884.70 | | | | $ | 3.99 | | | | $ | 1,020.97 | | | | $ | 4.28 | | | | | 0.84 | % |
| | | | | | | | | | | | | | | | | | | | | | | | | | | | | | | |
| II | | | | 1,000.00 | | | | | 883.60 | | | | | 5.17 | | | | | 1,019.71 | | | | | 5.55 | | | | | 1.09 | |
| | | | | | | | | | | | | | | | | | | | | | | | | | | | | | | |
| |
| 1 | The actual ending account value is based on the actual total return of the Fund for the period July 1, 2011 through December 31, 2011, after actual expenses and will differ from the hypothetical ending account value which is based on the Fund’s expense ratio and a hypothetical annual return of 5% before expenses. |
| 2 | Expenses are equal to the Fund’s annualized expense ratio as indicated above multiplied by the average account value over the period, multiplied by 184/365 to reflect the most recent fiscal half year. |
Invesco Van Kampen V.I. Capital Growth Fund
The address of each trustee and officer is AIM Variable Insurance Funds (Invesco Variable Insurance Funds) (the “Trust”), 11 Greenway Plaza, Suite 2500, Houston, Texas 77046-1173. The trustees serve for the life of the Trust, subject to their earlier death, incapacitation, resignation, retirement or removal as more specifically provided in the Trust’s organizational documents. Each officer serves for a one year term or until their successors are elected and qualified. Column two below includes length of time served with predecessor entities, if any.
| | | | | | | | | |
| | | | | | | Number of Funds
| | |
Name, Year of Birth and
| | Trustee and/
| | Principal Occupation(s)
| | in Fund Complex
| | Other Directorship(s)
|
| Position(s) Held with the Trust | | or Officer Since | | During Past 5 Years | | Overseen by Trustee | | Held by Trustee |
| | | | | | | | | |
| | | | | | | | | |
| | | | | | | | | |
Interested Persons | | | | | | | | |
| | | | | | | | | |
| | | | | | | | | |
| | | | | | | | | |
Martin L. Flanagan1 — 1960
Trustee | | 2007 | | Executive Director, Chief Executive Officer and President, Invesco Ltd. (ultimate parent of Invesco and a global investment management firm); Advisor to the Board, Invesco Advisers, Inc. (formerly known as Invesco Institutional (N.A.), Inc.); Trustee, The Invesco Funds; Vice Chair, Investment Company Institute; and Member of Executive Board, SMU Cox School of Business
Formerly: Chairman, Invesco Advisers, Inc. (registered investment adviser); Director, Chairman, Chief Executive Officer and President, IVZ Inc. (holding company), INVESCO Group Services, Inc. (service provider) and Invesco North American Holdings, Inc. (holding company); Director, Chief Executive Officer and President, Invesco Holding Company Limited (parent of Invesco and a global investment management firm); Director, Invesco Ltd.; Chairman, Investment Company Institute and President, Co-Chief Executive Officer, Co-President, Chief Operating Officer and Chief Financial Officer, Franklin Resources, Inc. (global investment management organization) | | 140 | | None |
| | | | | | | | | |
| | | | | | | | | |
| | | | | | | | | |
Philip A. Taylor2 — 1954
Trustee, President and Principal Executive Officer | | 2006 | | Head of North American Retail and Senior Managing Director, Invesco Ltd.; Director, Co-Chairman, Co-President and Co-Chief Executive Officer, Invesco Advisers, Inc. (formerly known as Invesco Institutional (N.A.), Inc.) (registered investment adviser); Director, Chairman, Chief Executive Officer and President, Invesco Management Group, Inc. (formerly Invesco Aim Management Group, Inc.) (financial services holding company); Director and President, INVESCO Funds Group, Inc. (registered investment adviser and registered transfer agent); Director and Chairman, Invesco Investment Services, Inc. (formerly known as Invesco Aim Investment Services, Inc.) (registered transfer agent) and IVZ Distributors, Inc. (formerly known as INVESCO Distributors, Inc.) (registered broker dealer); Director, President and Chairman, Invesco Inc. (holding company) and Invesco Canada Holdings Inc. (holding company); Chief Executive Officer, Invesco Corporate Class Inc. (corporate mutual fund company) and Invesco Canada Fund Inc. (corporate mutual fund company); Director, Chairman and Chief Executive Officer, Invesco Canada Ltd. (formerly known as Invesco Trimark Ltd./Invesco Trimark Ltèe) (registered investment adviser and registered transfer agent); Trustee, President and Principal Executive Officer, The Invesco Funds (other than AIM Treasurer’s Series Trust (Invesco Treasurer’s Series Trust) and Short-Term Investments Trust); Trustee and Executive Vice President, The Invesco Funds (AIM Treasurer’s Series Trust (Invesco Treasurer’s Series Trust) and Short-Term Investments Trust only); Director, Invesco Investment Advisers LLC (formerly known as Van Kampen Asset Management); Director, Chief Executive Officer and President, Van Kampen Exchange Corp. | | 140 | | None |
| | | | | | | | | |
| | | | | | | | | |
| | | | | Formerly: Director and Chairman, Van Kampen Investor Services Inc.: Director, Chief Executive Officer and President, 1371 Preferred Inc. (holding company); and Van Kampen Investments Inc.; Director and President, AIM GP Canada Inc. (general partner for limited partnerships); and Van Kampen Advisors, Inc.; Director and Chief Executive Officer, Invesco Trimark Dealer Inc. (registered broker dealer); Director, Invesco Distributors, Inc. (formerly known as Invesco Aim Distributors, Inc.) (registered broker dealer); Manager, Invesco PowerShares Capital Management LLC; Director, Chief Executive Officer and President, Invesco Advisers, Inc.; Director, Chairman, Chief Executive Officer and President, Invesco Aim Capital Management, Inc.; President, Invesco Trimark Dealer Inc. and Invesco Trimark Ltd./Invesco Trimark Ltèe; Director and President, AIM Trimark Corporate Class Inc. and AIM Trimark Canada Fund Inc.; Senior Managing Director, Invesco Holding Company Limited; Trustee and Executive Vice President, Tax-Free Investments Trust; Director and Chairman, Fund Management Company (former registered broker dealer); President and Principal Executive Officer, The Invesco Funds (AIM Treasurer’s Series Trust (Invesco Treasurer’s Series Trust), Short-Term Investments Trust and Tax-Free Investments Trust only); President, AIM Trimark Global Fund Inc. and AIM Trimark Canada Fund Inc. | | | | |
| | | | | | | | | |
| | | | | | | | | |
| | | | | | | | | |
Wayne W. Whalen3 — 1939
Trustee | | 2010 | | Of Counsel, and prior to 2010, partner in the law firm of Skadden, Arps, Slate, Meagher & Flom LLP, legal counsel to funds in the Fund Complex | | 158 | | Director of the Abraham Lincoln Presidential Library Foundation |
| | | | | | | | | |
| | | | | | | | | |
| | | | | | | | | |
Independent Trustees | | | | | | | | |
| | | | | | | | | |
| | | | | | | | | |
| | | | | | | | | |
Bruce L. Crockett — 1944
Trustee and Chair | | 1993 | | Chairman, Crockett Technology Associates (technology consulting company) | | 140 | | ACE Limited (insurance company); and Investment Company Institute |
| | | | | Formerly: Director, Captaris (unified messaging provider); Director, President and Chief Executive Officer COMSAT Corporation; and Chairman, Board of Governors of INTELSAT (international communications company) | | | | |
| | | | | | | | | |
| |
| 1 | Mr. Flanagan is considered an interested person of the Trust because he is an officer of the adviser to the Trust, and an officer and a director of Invesco Ltd., ultimate parent of the adviser to the Trust. |
| 2 | Mr. Taylor is considered an interested person of the Trust because he is an officer and a director of the adviser to, and a director of the principal underwriter of, the Trust. |
| 3 | Mr. Whalen is considered an “interested person” (within the meaning of Section 2(a)(19) of the 1940 Act) of certain Funds in the Fund Complex by reason of he and his firm currently providing legal services as legal counsel to such Funds in the Fund Complex. |
Invesco Van Kampen V.I. Capital Growth Fund
Trustees and Officers—(continued)
The address of each trustee and officer is AIM Variable Insurance Funds (Invesco Variable Insurance Funds) (the “Trust”), 11 Greenway Plaza, Suite 2500, Houston, Texas 77046-1173. The trustees serve for the life of the Trust, subject to their earlier death, incapacitation, resignation, retirement or removal as more specifically provided in the Trust’s organizational documents. Each officer serves for a one year term or until their successors are elected and qualified. Column two below includes length of time served with predecessor entities, if any.
| | | | | | | | | |
| | | | | | | Number of Funds
| | |
Name, Year of Birth and
| | Trustee and/
| | Principal Occupation(s)
| | in Fund Complex
| | Other Directorship(s)
|
| Position(s) Held with the Trust | | or Officer Since | | During Past 5 Years | | Overseen by Trustee | | Held by Trustee |
| | | | | | | | | |
| | | | | | | | | |
| | | | | | | |
Independent Trustees—(continued) | | | | | | |
| | | | | | | | | |
| | | | | | | | | |
| | | | | | | | | |
David C. Arch — 1945
Trustee | | 2010 | | Chairman and Chief Executive Officer of Blistex Inc., a consumer health care products manufacturer. | | 158 | | Member of the Heartland Alliance Advisory Board, a nonprofit organization serving human needs based in Chicago. Board member of the Illinois Manufacturers’ Association. Member of the Board of Visitors, Institute for the Humanities, University of Michigan |
| | | | | | | | | |
| | | | | | | | | |
| | | | | | | | | |
Frank S. Bayley — 1939
Trustee | | 2001 | | Retired
Formerly: Director, Badgley Funds, Inc. (registered investment company) (2 portfolios) and Partner, law firm of Baker & McKenzie
Formerly: Director, Badgley Funds, Inc. (registered investment company) (2 portfolios) and Partner, law firm of Baker & McKenzie | | 140 | | Director and Chairman, C.D. Stimson Company (a real estate investment company) |
| | | | | | | | | |
| | | | | | | | | |
| | | | | | | | | |
James T. Bunch — 1942
Trustee | | 2004 | | Managing Member, Grumman Hill Group LLC (family office private equity management)
Formerly: Founder, Green, Manning & Bunch Ltd. (investment banking firm)(1988-2010); Executive Committee, United States Golf Association; and Director, Policy Studies, Inc. and Van Gilder Insurance Corporation | | 140 | | Vice Chairman, Board of Governors, Western Golf Association/Evans Scholars Foundation and Director, Denver Film Society |
| | | | | | | | | |
| | | | | | | | | |
| | | | | | | | | |
Rodney F. Dammeyer — 1940
Trustee | | 2010 | | President of CAC, LLC, a private company offering capital investment and management advisory services.
Formerly: Prior to January 2004, Director of TeleTech Holdings Inc.; Prior to 2002, Director of Arris Group, Inc.; Prior to 2001, Managing Partner at Equity Group Corporate Investments. Prior to 1995, Vice Chairman of Anixter International. Prior to 1985, experience includes Senior Vice President and Chief Financial Officer of Household International, Inc., Executive Vice President and Chief Financial Officer of Northwest Industries, Inc. and Partner of Arthur Andersen & Co. | | 158 | | Director of Quidel Corporation and Stericycle, Inc. Prior to May 2008, Trustee of The Scripps Research Institute. Prior to February 2008, Director of Ventana Medical Systems, Inc. Prior to April 2007, Director of GATX Corporation. Prior to April 2004, Director of TheraSense, Inc. |
| | | | | | | | | |
| | | | | | | | | |
| | | | | | | | | |
Albert R. Dowden — 1941
Trustee | | 2000 | | Director of a number of public and private business corporations, including the Boss Group, Ltd. (private investment and management); Reich & Tang Funds (5 portfolios) (registered investment company); and Homeowners of America Holding Corporation/ Homeowners of America Insurance Company (property casualty company)
Formerly: Director, Continental Energy Services, LLC (oil and gas pipeline service); Director, CompuDyne Corporation (provider of product and services to the public security market) and Director, Annuity and Life Re (Holdings), Ltd. (reinsurance company); Director, President and Chief Executive Officer, Volvo Group North America, Inc.; Senior Vice President, AB Volvo; Director of various public and private corporations; Chairman, DHJ Media, Inc.; Director Magellan Insurance Company; and Director, The Hertz Corporation, Genmar Corporation (boat manufacturer), National Media Corporation; Advisory Board of Rotary Power International (designer, manufacturer, and seller of rotary power engines); and Chairman, Cortland Trust, Inc. (registered investment company) | | 140 | | Board of Nature’s Sunshine Products, Inc. |
| | | | | | | | | |
| | | | | | | | | |
| | | | | | | | | |
Jack M. Fields — 1952
Trustee | | 1997 | | Chief Executive Officer, Twenty First Century Group, Inc. (government affairs company); and Owner and Chief Executive Officer, Dos Angelos Ranch, L.P. (cattle, hunting, corporate entertainment), Discovery Global Education Fund (non-profit) and Cross Timbers Quail Research Ranch (non-profit)
Formerly: Chief Executive Officer, Texana Timber LP (sustainable forestry company) and member of the U.S. House of Representatives | | 140 | | Administaff |
| | | | | | | | | |
| | | | | | | | | |
| | | | | | | | | |
Carl Frischling — 1937
Trustee | | 1993 | | Partner, law firm of Kramer Levin Naftalis and Frankel LLP | | 140 | | Director, Reich & Tang Funds (16 portfolios) |
| | | | | | | | | |
| | | | | | | | | |
Invesco Van Kampen V.I. Capital Growth Fund
Trustees and Officers—(continued)
The address of each trustee and officer is AIM Variable Insurance Funds (Invesco Variable Insurance Funds) (the “Trust”), 11 Greenway Plaza, Suite 2500, Houston, Texas 77046-1173. The trustees serve for the life of the Trust, subject to their earlier death, incapacitation, resignation, retirement or removal as more specifically provided in the Trust’s organizational documents. Each officer serves for a one year term or until their successors are elected and qualified. Column two below includes length of time served with predecessor entities, if any.
| | | | | | | | | |
| | | | | | | Number of Funds
| | |
Name, Year of Birth and
| | Trustee and/
| | Principal Occupation(s)
| | in Fund Complex
| | Other Directorship(s)
|
| Position(s) Held with the Trust | | or Officer Since | | During Past 5 Years | | Overseen by Trustee | | Held by Trustee |
Independent Trustees—(continued) | | | | | | |
| | | | | | | | | |
| | | | | | | | | |
| | | | | | | | | |
Prema Mathai-Davis — 1950
Trustee | | 1998 | | Retired
Formerly: Chief Executive Officer, YWCA of the U.S.A. | | 140 | | None |
| | | | | | | | | |
| | | | | | | | | |
| | | | | | | | | |
Larry Soll — 1942
Trustee | | 2004 | | Retired
Formerly, Chairman, Chief Executive Officer and President, Synergen Corp. (a biotechnology company) | | 140 | | None |
| | | | | | | | | |
| | | | | | | | | |
| | | | | | | | | |
Hugo F. Sonnenschein — 1940
Trustee | | 2010 | | President Emeritus and Honorary Trustee of the University of Chicago and the Adam Smith Distinguished Service Professor in the Department of Economics at the University of Chicago. Prior to July 2000, President of the University of Chicago. | | 158 | | Trustee of the University of Rochester and a member of its investment committee. Member of the National Academy of Sciences, the American Philosophical Society and a fellow of the American Academy of Arts and Sciences |
| | | | | | | | | |
| | | | | | | | | |
| | | | | | | | | |
| Raymond Stickel, Jr. — 1944 Trustee | | 2005 | | Retired
Formerly: Director, Mainstay VP Series Funds, Inc. (25 portfolios) and Partner, Deloitte & Touche | | 140 | | None |
| | | | | | | | | |
| | | | | | | | | |
| | | | | | | | | |
Other Officers | | | | | | | | |
| | | | | | | | | |
| | | | | | | | | |
| | | | | | | | | |
Russell C. Burk — 1958
Senior Vice President and Senior Officer | | 2005 | | Senior Vice President and Senior Officer, The Invesco Funds | | N/A | | N/A |
| | | | | | | | | |
| | | | | | | | | |
| | | | | | | | | |
John M. Zerr — 1962
Senior Vice President, Chief Legal Officer and Secretary | | 2006 | | Director, Senior Vice President, Secretary and General Counsel, Invesco Management Group, Inc. (formerly known as Invesco Aim Management Group, Inc.) and Van Kampen Exchange Corp.; Senior Vice President, Invesco Advisers, Inc. (formerly known as Invesco Institutional (N.A.), Inc.) (registered investment adviser); Senior Vice President and Secretary, Invesco Distributors, Inc. (formerly known as Invesco Aim Distributors, Inc.); Director, Vice President and Secretary, Invesco Investment Services, Inc. (formerly known as Invesco Aim Investment Services, Inc.) and IVZ Distributors, Inc. (formerly known as INVESCO Distributors, Inc.); Director and Vice President, INVESCO Funds Group, Inc.; Senior Vice President, Chief Legal Officer and Secretary, The Invesco Funds; Manager, Invesco PowerShares Capital Management LLC; Director, Secretary and General Counsel, Invesco Investment Advisers LLC (formerly known as Van Kampen Asset Management); Secretary and General Counsel, Van Kampen Funds Inc. and Chief Legal Officer, PowerShares Exchange-Traded Fund Trust, PowerShares Exchange-Traded Fund Trust II, PowerShares India Exchange-Traded Fund Trust and PowerShares Actively Managed Exchange-Traded Fund Trust
Formerly: Director and Secretary, Van Kampen Advisors Inc.; Director Vice President, Secretary and General Counsel Van Kampen Investor Services Inc.; Director, Invesco Distributors, Inc. (formerly known as Invesco Aim Distributors, Inc.); Director, Senior Vice President, General Counsel and Secretary, Invesco Advisers, Inc.; and Van Kampen Investments Inc.; Director, Vice President and Secretary, Fund Management Company; Director, Senior Vice President, Secretary, General Counsel and Vice President, Invesco Aim Capital Management, Inc.; Chief Operating Officer and General Counsel, Liberty Ridge Capital, Inc. (an investment adviser); Vice President and Secretary, PBHG Funds (an investment company) and PBHG Insurance Series Fund (an investment company); Chief Operating Officer, General Counsel and Secretary, Old Mutual Investment Partners (a broker-dealer); General Counsel and Secretary, Old Mutual Fund Services (an administrator) and Old Mutual Shareholder Services (a shareholder servicing center); Executive Vice President, General Counsel and Secretary, Old Mutual Capital, Inc. (an investment adviser); and Vice President and Secretary, Old Mutual Advisors Funds (an investment company) | | N/A | | N/A |
| | | | | | | | | |
| | | | | | | | | |
| | | | | | | | | |
Lisa O. Brinkley — 1959
Vice President | | 2004 | | Global Compliance Director, Invesco Ltd.; Chief Compliance Officer, Invesco Investment Services, Inc.(formerly known as Invesco Aim Investment Services, Inc.); and Vice President, The Invesco Funds
Formerly: Chief Compliance Officer, Invesco Distributors, Inc. (formerly known as Invesco Aim Distributors, Inc.) and Van Kampen Investor Services Inc.; Senior Vice President, Invesco Management Group, Inc.; Senior Vice President and Chief Compliance Officer, Invesco Advisers, Inc. and The Invesco Funds; Vice President and Chief Compliance Officer, Invesco Aim Capital Management, Inc. and Invesco Distributors, Inc.; Vice President, Invesco Investment Services, Inc. and Fund Management Company | | N/A | | N/A |
| | | | | | | | | |
Invesco Van Kampen V.I. Capital Growth Fund
Trustees and Officers—(continued)
The address of each trustee and officer is AIM Variable Insurance Funds (Invesco Variable Insurance Funds) (the “Trust”), 11 Greenway Plaza, Suite 2500, Houston, Texas 77046-1173. The trustees serve for the life of the Trust, subject to their earlier death, incapacitation, resignation, retirement or removal as more specifically provided in the Trust’s organizational documents. Each officer serves for a one year term or until their successors are elected and qualified. Column two below includes length of time served with predecessor entities, if any.
| | | | | | | | | |
| | | | | | | Number of Funds
| | |
Name, Year of Birth and
| | Trustee and/
| | Principal Occupation(s)
| | in Fund Complex
| | Other Directorship(s)
|
| Position(s) Held with the Trust | | or Officer Since | | During Past 5 Years | | Overseen by Trustee | | Held by Trustee |
Other Officers—(continued) | | | | | | |
| | | | | | | | | |
| | | | | | | | | |
| | | | | | | | | |
Sheri Morris — 1964
Vice President, Treasurer and Principal Financial Officer | | 1999 | | Vice President, Treasurer and Principal Financial Officer, The Invesco Funds; Vice President, Invesco Advisers, Inc. (formerly known as Invesco Institutional (N.A.), Inc.) (registered investment adviser).
Formerly: Treasurer, PowerShares Exchange-Traded Fund Trust, PowerShares Exchange-Traded Fund Trust II, PowerShares India Exchange-Traded Fund Trust and PowerShares Actively Managed Exchange-Traded Fund Trust, Vice President, Invesco Advisers, Inc., Invesco Aim Capital Management, Inc. and Invesco Aim Private Asset Management, Inc.; Assistant Vice President and Assistant Treasurer, The Invesco Funds and Assistant Vice President, Invesco Advisers, Inc., Invesco Aim Capital Management, Inc. and Invesco Aim Private Asset Management, Inc. | | N/A | | N/A |
| | | | | | | | | |
| | | | | | | | | |
| | | | | | | | | |
Karen Dunn Kelley — 1960
Vice President | | 1993 | | Head of Invesco’s World Wide Fixed Income and Cash Management Group; Senior Vice President, Invesco Management Group, Inc. (formerly known as Invesco Aim Management Group, Inc.) and Invesco Advisers, Inc. (formerly known as Invesco Institutional (N.A.), Inc.) (registered investment adviser); Executive Vice President, Invesco Distributors, Inc. (formerly known as Invesco Aim Distributors, Inc.); Director, Invesco Mortgage Capital Inc.; Vice President, The Invesco Funds (other than AIM Treasurer’s Series Trust (Invesco Treasurer’s Series Trust) and Short-Term Investments Trust); and President and Principal Executive Officer, The Invesco Funds (AIM Treasurer’s Series Trust (Invesco Treasurer’s Series Trust) and Short-Term Investments Trust only).
Formerly: Senior Vice President, Van Kampen Investments Inc.; Vice President, Invesco Advisers, Inc. (formerly known as Invesco Institutional (N.A.), Inc.); Director of Cash Management and Senior Vice President, Invesco Advisers, Inc. and Invesco Aim Capital Management, Inc.; President and Principal Executive Officer, Tax-Free Investments Trust; Director and President, Fund Management Company; Chief Cash Management Officer, Director of Cash Management, Senior Vice President, and Managing Director, Invesco Aim Capital Management, Inc.; Director of Cash Management, Senior Vice President, and Vice President, Invesco Advisers, Inc. and The Invesco Funds (AIM Treasurer’s Series Trust (Invesco Treasurer’s Series Trust), Short-Term Investments Trust and Tax-Free Investments Trust only) | | N/A | | N/A |
| | | | | | | | �� | |
| | | | | | | | | |
| | | | | | | | | |
Yinka Akinsola — 1977
Anti-Money Laundering Compliance Officer | | 2011 | | Anti-Money Laundering Compliance Officer, Invesco Advisers, Inc. (formerly known as Invesco Institutional (N.A.), Inc.) (registered investment adviser); Invesco Distributors, Inc. (formerly known as Invesco Aim Distributors, Inc.), Invesco Investment Services, Inc. (formerly known as Invesco Aim Investment Services, Inc.), Invesco Management Group, Inc., The Invesco Funds, Invesco Van Kampen Closed-End Funds, Van Kampen Exchange Corp. and Van Kampen Funds Inc. | | N/A | | N/A |
| | | | | | | | | |
| | | | | | | | | |
| | | | | | | | | |
Todd L. Spillane — 1958
Chief Compliance Officer | | 2006 | | Senior Vice President, Invesco Management Group, Inc. (formerly known as Invesco Aim Management Group, Inc.) and Van Kampen Exchange Corp.; Senior Vice President and Chief Compliance Officer, Invesco Advisers, Inc. (registered investment adviser) (formerly known as Invesco Institutional (N.A.), Inc.); Chief Compliance Officer, The Invesco Funds, INVESCO Private Capital Investments, Inc. (holding company) and Invesco Private Capital, Inc. (registered investment adviser); Vice President, Invesco Distributors, Inc. (formerly known as Invesco Aim Distributors, Inc.) and Invesco Investment Services, Inc. (formerly known as Invesco Aim Investment Services, Inc.).
Formerly: Chief Compliance Officer, Invesco Van Kampen Closed-End Funds PowerShares Exchange-Traded Fund Trust, PowerShares Exchange-Traded Fund Trust II, PowerShares India Exchange-Traded Fund Trust, and PowerShares Actively Managed Exchange-Traded Fund Trust; Senior Vice President, Van Kampen Investments Inc.; Senior Vice President and Chief Compliance Officer, Invesco Advisers, Inc. and Invesco Aim Capital Management, Inc.; Chief Compliance Officer, Invesco Global Asset Management (N.A.), Inc., Invesco Senior Secured Management, Inc. (registered investment adviser) and Van Kampen Investor Services Inc.; Vice President, Invesco Aim Capital Management, Inc. and Fund Management Company | | N/A | | N/A |
| | | | | | | | | |
The Statement of Additional Information of the Trust includes additional information about the Fund’s Trustees and is available upon request, without charge, by calling 1.800.959.4246. Please refer to the Fund’s prospectus for information on the Fund’s sub-advisers.
| | | | | | | |
Office of the Fund
11 Greenway Plaza, Suite 2500
Houston, TX 77046-1173 | | Investment Adviser
Invesco Advisers, Inc.
1555 Peachtree Street, N.E.
Atlanta, GA 30309 | | Distributor
Invesco Distributors, Inc.
11 Greenway Plaza, Suite 2500
Houston, TX 77046-1173 | | Auditors
PricewaterhouseCoopers LLP
1201 Louisiana Street, Suite 2900
Houston, TX 77002-5678 |
| | | | | | | |
| | | | | | | |
Counsel to the Fund
Stradley Ronon Stevens & Young, LLP
2600 One Commerce Square
Philadelphia, PA 19103 | | Counsel to the Independent Trustees
Kramer, Levin, Naftalis & Frankel LLP
1177 Avenue of the Americas
New York, NY 10036-2714 | | Transfer Agent
Invesco Investment Services, Inc.
11 Greenway Plaza, Suite 2500
Houston, TX77046-1173 | | Custodian
State Street Bank and Trust Company
225 Franklin
Boston, MA 02110-2801 |
Invesco Van Kampen V.I. Capital Growth Fund
Invesco Van Kampen V.I. Comstock FundAnnual Report to Shareholders § December 31, 2011The Fund provides a complete list of its holdings four times in each fiscal year, at the quarter-ends. For the second and fourth quarters, the lists appear in the Fund’s semiannual and annual reports to shareholders. For the first and third quarters, the Fund files the lists with the Securities and Exchange Commission (SEC) on Form N-Q. The Fund’s Form N-Q filings are available on the SEC website, sec.gov. Copies of the Fund’s Forms N-Q may be reviewed and copied at the SEC Public Reference Room in Washington, D.C. You can obtain information on the operation of the Public Reference Room, including information about duplicating fee charges, by calling 202 551 8090 or 800 732 0330, or by electronic request at the following email address: publicinfo@sec.gov. The SEC file numbers for the Fund are 811-07452 and 033-57340. The Fund’s most recent portfolio holdings, as filed on Form N-Q, have also been made available to insurance companies issuing variable annuity contracts and variable life insurance policies (“variable products”) that invest in the Fund.
A description of the policies and procedures that the Fund uses to determine how to vote proxies relating to portfolio securities is available without charge, upon request, from our Client Services department at 800 959 4246 or at invesco.com/proxyguidelines. The information is also available on the SEC website, sec.gov.
Information regarding how the Fund voted proxies related to its portfolio securities during the 12 months ended June 30, 2011, is available at invesco.com/proxysearch. The information is also available on the SEC website, sec.gov.
Invesco Advisers, Inc. is an investment adviser; it provides investment advisory services to individual and institutional clients and does not sell securities. Invesco Distributors, Inc. is the U.S. distributor for Invesco Ltd.’s retail mutual funds, exchange-traded funds and institutional money market funds. Both are wholly owned, indirect subsidiaries of Invesco Ltd.
This report must be accompanied or preceded by a currently effective Fund prospectus and variable product prospectus, which contain more complete information, including sales charges and expenses. Investors should read each carefully before investing.
Invesco Distributors, Inc.
VK-VICOM-AR-1
| | | | | | | | | |
|
| | | | | | | |
NOT FDIC INSURED | | | MAY LOSE VALUE | | | NO BANK GUARANTEE |
Management’s Discussion of Fund Performance
Performance summary
For the year ended December 31, 2011, Invesco Van Kampen V.I. Comstock Fund underperformed its benchmark, the Russell 1000 Value Index. The Fund’s performance was mixed among sectors, with stock selection in the health care, consumer discretionary (specifically media companies) and telecommunication sectors contributing to relative performance. Alternatively, stock selection and an underweight position in the energy sector detracted the most from the Fund’s performance versus its style-specific benchmark.
Your Fund’s long-term performance appears later in this report.
Fund vs. Indexes
Total returns, 12/31/10 to 12/31/11, excluding variable product issuer charges.
If variable product issuer charges were included, returns would be lower.
| | | | | |
|
| Series I Shares | | | -1.84 | % |
| |
| Series II Shares | | | -2.11 | |
| |
S&P 500 Index▼ (Broad Market Index) | | | 2.09 | |
| |
Russell 1000 Value Index▼ (Style-Specific Index) | | | 0.39 | |
| |
Lipper VUF Large-Cap Value Funds Index▼ (Peer Group Index) | | | -1.70 | |
| |
Source(s): ▼Lipper Inc.
As noted in the Fund’s latest semiannual report, the Fund has adopted a three-tier benchmark structure to compare its performance to broad market, style-specific and peer group market measures.
How we invest
Our strategy aims to exploit market inefficiencies by investing in companies that appear undervalued relative to the market in general. Ultimately, we believe the market will recognize the value in these companies, and we will sell as the stock prices begin to reflect their intrinsic value. We feel that stock selection, as opposed to making sector bets, may provide a more consistent opportunity for success. In addition, investors can take advantage of pricing anomalies by purchasing undervalued stocks before a recognizable catalyst arises.
The Fund’s investable universe includes all large-cap U.S.-denominated equities. To distill these investments, we first filter for companies with sufficient liquidity. We filter the remaining securities on valuation metrics depending upon the growth or cyclical nature of their business. The
Portfolio Composition
By sector
| | | | | |
|
| Financials | | | 19.7 | % |
| |
| Consumer Discretionary | | | 16.1 | |
| |
| Health Care | | | 13.6 | |
| |
| Energy | | | 12.1 | |
| |
| Information Technology | | | 11.1 | |
| |
| Consumer Staples | | | 7.7 | |
| |
| Industrials | | | 6.3 | |
| |
| Materials | | | 4.1 | |
| |
| Telecommunication Services | | | 3.8 | |
| |
| Utilities | | | 2.9 | |
| |
Money Market Funds Plus Other Assets
Less Liabilities | | | 2.6 | |
| | | | | |
|
| Total Net Assets | | $1.8 billion | |
| | | | | |
| Total Number of Holdings* | | | 72 | |
result of this filtering process is a pool of highly liquid securities that we believe are statistically inexpensive relative to the broader market. Companies identified in the filtering process are thoroughly analyzed to assess intrinsic value and their ability to achieve fair value.
We will initiate a purchase of a security only if we believe the potential for stock price appreciation outweighs potential downside risk. To be eligible for inclusion in the Fund, a stock must meet the following criteria:
| n | | It is statistically cheap on the basis of its primary valuation criteria, which depends upon the cyclical or growth nature of its business. |
| |
| n | | Rigorous fundamental analysis shows that the company is undervalued and possesses potential financial strength and improved quality of management for future growth. |
Top 10 Equity Holdings*
| | | | | | | | | |
|
| | 1. | | | Comcast Corp. | | | 4.2 | % |
| |
| | 2. | | | International Paper Co. | | | 3.2 | |
| |
| | 3. | | | Pfizer Inc. | | | 2.8 | |
| |
| | 4. | | | JPMorgan Chase & Co. | | | 2.6 | |
| |
| | 5. | | | Viacom Inc. | | | 2.5 | |
| |
| | 6. | | | Microsoft Corp. | | | 2.4 | |
| |
| | 7. | | | Bristol-Myers Squibb Co. | | | 2.3 | |
| |
| | 8. | | | Citigroup Inc. | | | 2.3 | |
| |
| | 9. | | | Allstate Corp. (The) | | | 2.2 | |
| |
| | 10. | | | BP PLC-ADR | | | 2.2 | |
The Fund’s holdings are subject to change, and there is no assurance that the Fund will continue to hold any particular security.
*Excluding money market fund holdings.
Portfolio construction is bottom up and stock specific, concentrating on individual company fundamental analysis and valuations. Therefore, while we monitor and are aware of our positions relative to the benchmark, it does not play a major role in the construction of the Fund.
We seek to manage risk with portfolio construction, mainly though diversification across most major sectors, and through the assistance of an independent quantitative risk control group. Risk management is continuous. The Fund is regularly reviewed to ensure it is optimally constructed on a risk/reward basis. We have the final say on the construction of the Fund, and there is a collegial relationship between the risk management team and the Fund team.
Our sell discipline is just as important as the buy decision and is based on the same principles: relative value and fundamentals. While no sale is automatic, a security is typically sold if it meets one or more of the following criteria:
| n | | We believe the target price has been realized, and we no longer consider the company undervalued. |
| |
| n | | We determine that a better value opportunity can be found elsewhere. |
| |
| n | | Our research shows that a company is experiencing deteriorating fundamentals beyond what we feel to be a tolerable level, and the trend is likely to be a long-term issue. |
Market conditions and your Fund
The fiscal year began with equity markets fueled by the second round of “quantitative easing” by the U.S. Federal Reserve, and markets rose through the first quarter of 2011. However, with the spring came increased volatility and significant macroeconomic distortions due to civil unrest in Egypt and Libya, flooding in Australia and a devastating earthquake and tsunami in Japan. Corporate earnings remained strong with largely positive surprises, but were often overshadowed by investor concerns about continuing high unemployment and soft housing data. Although markets stabilized and were generally in positive territory through the summer, major equity indexes sold off precipitously in August as the U.S. government struggled to raise the nation’s debt ceiling. Despite an eventual agreement between the White House and Congress, credit rating agency Standard & Poor’s announced the first-ever downgrade to long-term U.S. government debt. Uncertainty created by the downgrade combined with the
Invesco Van Kampen V.I. Comstock Fund
continuing saga surrounding the debt crisis in the eurozone reignited fears of a global recession. Despite evidence of sustained, but muted, growth, these macroeconomic factors continued to weigh on markets through the end of the reporting period.
Results were mixed among the sectors of the Russell 1000 Value Index, with cyclical sectors such as financials, materials and information technology (IT) posting negative returns, while defensive sectors such as health care and consumer staples fared better, posting double-digit positive returns.
On the positive side, strong stock selection in the health care sector was the largest contributor to Fund performance. Health care provider UnitedHealth Group and pharmaceuticals companies Bristol-Myers Squibb and GlaxoSmithKline were top performers in this sector on a relative and absolute basis.
Stock selection and a significant overweight position in the consumer discretionary sector also contributed to the Fund’s relative performance. The Fund’s main consumer discretionary exposure was in the media companies industry. Viacom and Comcast were top performers during the reporting period, continuing the trend from the previous fiscal year.
Favorable stock selection in the telecommunication services sector also contributed to Fund performance. Notably, Vodafone Group was one of the largest relative contributors in this sector. Not owning holdings such as Sprint Nextel also helped relative Fund performance versus the Russell 1000 Value Index.
Unfavorable stock selection and a slight underweight position in the energy sector were the largest detractors from Fund performance. Specifically, the Fund had exposure to oil equipment and services companies Halliburton and Weatherford, which were two of the main detractors in this sector. Both holdings were affected by decreasing profit margins from international drilling efforts that fell through during the economic slowdown in Europe and overseas, causing earnings expectations to be lowered, thereby, negatively affecting the stock price.
Unfavorable stock selection and a meaningful overweight to IT companies also hurt Fund performance relative to the style-specific index. Hardware and internet-related stocks, including Cisco Systems and Hewlett-Packard, performed poorly over the reporting period.
Cisco Systems’ stock declined on cautious guidance regarding company revenue forecasts and worries of IT spending cuts from both the U.S. government and corporations. Hewlett-Packard’s stock declined on concerns of overpaying for the acquisition of an enterprise software company. The company’s CEO was replaced in September of 2011 by Meg Whitman, the former CEO of eBay.
A material underweight exposure to the utilities sector was a major detractor from Fund performance. Utilities was the best performing sector for the reporting period, as investors sought defensive oriented, dividend yielding stocks during the market turmoil.
Finally, stock selection in the financials sector acted as a detractor from relative Fund performance for the year. Notably, exposure to diversified financials like Citigroup, Morgan Stanley and Bank of New York Mellon detracted from both absolute and relative Fund performance as investors fled bank stocks beginning in the summer of 2011 on concerns of European debt crisis contagion.
Toward the end of the reporting period, we reduced our exposure to select media, pharmaceuticals and insurance companies due to rising valuations, using the proceeds to increase the Fund’s exposure to select diversified financial, banking, property and casualty insurance and integrated oil companies as they came under pressure.
We believe in our contrarian philosophy and deep value approach of buying extremely undervalued companies, and capitalizing on market volatility and periods of down markets as value is created for new investment opportunities.
Thank you for your investment in Invesco Van Kampen V.I. Comstock Fund and for sharing our long-term investment horizon.
The views and opinions expressed in management’s discussion of Fund performance are those of Invesco Advisers, Inc. These views and opinions are subject to change at any time based on factors such as market and economic conditions. These views and opinions may not be relied upon as investment advice or recommendations, or as an offer for a particular security. The information is not a complete analysis of every aspect of any market, country, industry, security or the Fund. Statements of fact are from sources considered reliable, but Invesco Advisers, Inc. makes no representation or warranty as to their completeness or accuracy. Although historical performance is no guarantee of future results, these insights may help you understand our investment management philosophy.
See important Fund and, if applicable, index disclosures later in this report.
Kevin Holt
Chartered Financial Analyst, portfolio manager, is lead manager of Invesco Van Kampen V.I. Comstock Fund. Mr. Holt joined Invesco in 2010. He earned a bachelor’s degree from the University of Iowa and an M.B.A. from the University of Chicago Graduate School of Business.
Devin Armstrong
Chartered Financial Analyst, portfolio manager, is manager of Invesco Van Kampen V.I. Comstock Fund. Mr. Armstrong joined Invesco in 2010. He earned a B.S. in psychology and finance from the University of Illinois and an M.B.A. in finance from Columbia University.
Jason Leder
Chartered Financial Analyst, portfolio manager, is manager of Invesco Van Kampen V.I. Comstock Fund. Mr. Leder joined Invesco in 2010. He earned a bachelor’s degree from The University of Texas and an M.B.A. from Columbia University.
Matthew Seinsheimer
Chartered Financial Analyst, portfolio manager, is manager of Invesco Van Kampen V.I. Comstock Fund. Mr. Seinsheimer joined Invesco in 1998. He earned a B.B.A. from Southern Methodist University and an M.B.A. from The University of Texas at Austin.
James Warwick
Portfolio manager, is manager of Invesco Van Kampen V.I. Comstock Fund. Mr. Warwick
joined Invesco in 2010. He earned a B.B.A. from Stephen F. Austin State University and an M.B.A. from the University of Houston.
Invesco Van Kampen V.I. Comstock Fund
Your Fund’s Long-Term Performance
Results of a $10,000 Investment – Oldest Share Class(es)
Fund and index data from 12/31/01*
| 1 | | Source: Lipper Inc. |
| |
| * | | During the reporting period, Invesco changed its policy regarding growth of $10,000 charts. For funds older than 10 years, we previously showed performance since inception. Going forward, we will show performance for the most recent 10 years, since this more accurately reflects the experience of the typical shareholder. As a result, charts now may include benchmarks that did not appear previously, because the funds’ inception pre-dated the benchmarks’ inception. Also, all charts will now be presented using a linear format. |
Past performance cannot guarantee comparable future results.
As noted earlier in this report, the Fund has adopted a three-tier benchmark structure to compare its performance
to broad market, style-specific and peer group market measures. These additional benchmarks will now be included in the chart above.
Average Annual Total Returns
As of 12/31/11
| | | | | | | | | |
|
| Series I Shares | | | | |
| |
| Inception (4/30/99) | | | 4.13 | % |
| |
| | 10 | | | Years | | | 3.40 | |
| |
| | 5 | | | Years | | | -1.57 | |
| |
| | 1 | | | Year | | | -1.84 | |
| |
| | | | | | | | | |
| Series II Shares | | | | |
| |
| Inception (9/18/00) | | | 3.97 | % |
| |
| | 10 | | | Years | | | 3.15 | |
| |
| | 5 | | | Years | | | -1.83 | |
| |
| | 1 | | | Year | | | -2.11 | |
| |
Effective June 1, 2010, Class I and Class II shares of the predecessor fund, Van Kampen Life Investment Trust Comstock Portfolio, advised by Van Kampen Asset Management were reorganized into Series I and Series II shares, respectively, of Invesco Van Kampen V.I. Comstock Fund. Returns shown above for Series I and Series II shares are blended returns of the predecessor fund and Invesco Van Kampen V.I. Comstock Fund. Share class returns will differ from the predecessor fund because of different expenses.
The performance data quoted represent past performance and cannot guarantee comparable future results; current performance may be lower or higher. Please contact your variable product issuer or financial adviser for the most recent month-end variable product performance. Performance figures reflect Fund expenses, reinvested distributions and changes in net asset value. Investment return and principal value will fluctuate so that you may have a gain or loss when you sell shares.
The net annual Fund operating expense ratio set forth in the most recent Fund prospectus as of the date of this report for Series I and Series II shares was 0.62% and 0.87%, respectively.1 The total annual Fund operating expense ratio set forth in the most recent Fund prospectus as of the date of this report for Series I and Series II shares was 0.85% and 1.10%, respectively. The expense ratios presented above may vary from the expense ratios presented in other sections of this report that are based on expenses incurred during the period covered by this report.
Invesco Van Kampen V.I. Comstock Fund, a series portfolio of AIM Variable Insurance Funds (Invesco Variable Insurance Funds), is currently offered through insurance companies issuing variable products. You cannot purchase shares of the Fund directly. Performance figures given represent the Fund and are not intended to reflect actual variable product values. They do not reflect sales charges, expenses and fees assessed in connection with a variable product. Sales charges, expenses and fees, which are determined by the variable product issuers, will vary and will lower the total return.
The most recent month-end performance data at the Fund level, excluding variable product charges, is available at 800 451 4246. As mentioned above, for the most recent month-end performance including variable product charges, please contact your variable product issuer or financial adviser.
| 1 | | Total annual Fund operating expenses after any contractual fee waivers and/or expense reimbursements by the adviser in effect through at least June 30, 2012. See current prospectus for more information. |
Invesco Van Kampen V.I. Comstock Fund
Invesco Van Kampen V.I. Comstock Fund’s investment objective is to seek capital growth and income through investments in equity securities, including common stocks, preferred stocks and securities convertible into common and preferred stocks.
| n | | Unless otherwise stated, information presented in this report is as of December 31, 2011, and is based on total net assets. |
| |
| n | | Unless otherwise noted, all data provided by Invesco. |
| |
| n | | To access your Fund’s reports/prospectus, visit invesco.com/fundreports. |
Principal risks of investing in the Fund
Market risk. Market risk is the possibility that the market values of securities owned by the Fund will decline. Market risk may affect a single issuer, industry, sector of the economy or the market as a whole. Investments in equity securities generally are affected by changes in the stock markets which fluctuate substantially over time, sometimes suddenly and sharply. The ability of the Fund’s investment holdings to generate income depends on the earnings and the continuing declaration of dividends by the issuers of such securities. The value of a convertible security tends to decline as interest rates rise and, because of the conversion feature, tends to vary with fluctuations in the market value of the underlying equity security.
Small- and medium-sized companies risk. During an overall stock market decline, stock prices of small- or medium-sized companies often fluctuate more than stock prices of larger companies or the market averages in general. In addition, such companies typically are subject to a greater degree of change in earnings and business prospects than are larger companies and may be less liquid than larger-sized companies. In addition, small- and medium-sized companies may have more limited markets, financial resources and product lines, and may lack the depth of management of larger companies.
Value investing. This style of investing is subject to the risk that the valuations never improve or that the returns on value equity securities are less than the returns on other styles of investing or the overall stock markets.
Foreign risks. The risks of investing in securities of foreign issuers, including emerging market issuers, can include fluctuations in foreign currencies, foreign currency exchange controls, political and economic instability, differences in securities regulation and trading, and foreign taxation issues.
Futures risk. A decision as to whether, when and how to use futures involves the exercise of skill and judgment and even a well-conceived futures transaction may be unsuccessful because of market behavior or unexpected events.
Options risk. A decision as to whether, when and how to use options involves the exercise of skill and judgment and even a well-conceived option transaction may be unsuccessful because of market behavior or unexpected events. The prices of options can be highly volatile and the use of options can lower total returns.
Real estate investment trusts (REITs) risk. Investing in REITs makes the Fund more susceptible to risks associated with the ownership of real estate and with the real estate industry in general and may involve duplication of management fees and certain other expenses. In addition, REITs depend upon specialized management skills, may be less diversified, may have lower trading volume, and may be subject to more abrupt or erratic price movements than the overall securities markets.
Derivative instruments risk. Risks of derivatives include the possible imperfect correlation between the value of the instruments and the underlying assets; risks of default by the other party to certain transactions; risks that the transactions may result in losses that partially or completely offset gains in portfolio positions; and risks that the transactions may not be liquid.
About indexes used in this report
The S&P 500® Index is an unmanaged index considered representative of the U.S. stock market.
The Russell 1000® Value Index is an unmanaged index considered representative of large-cap value stocks. The Russell 1000 Value Index is a trademark/service mark of the Frank Russell Co. Russell® is a trademark of the Frank Russell Co.
The Lipper VUF Large-Cap Value Funds Index is an unmanaged index considered representative of large-cap value variable insurance underlying funds tracked by Lipper.
The Fund is not managed to track the performance of any particular index, including the indexes defined here, and consequently, the performance of the Fund may deviate significantly from the performance of the indexes.
A direct investment cannot be made in an index. Unless otherwise indicated, index results include reinvested dividends, and they do not reflect sales charges. Performance of the peer group, if applicable, reflects fund expenses; performance of a market index does not.
Other information
The Chartered Financial Analyst® (CFA®) designation is globally recognized and attests to a charterholder’s success in a rigorous and comprehensive study program in the field of investment management and research analysis.
Industry classifications used in this report are generally according to the Global Industry Classification Standard, which was developed by and is the exclusive property and a service mark of MSCI Inc. and Standard & Poor’s.
The returns shown in management’s discussion of Fund performance are based on net asset values calculated for shareholder transactions. Generally accepted accounting principles require adjustments to be made to the net assets of the Fund at period end for financial reporting purposes, and as such, the net asset values for shareholder transactions and the returns based on those net asset values may differ from the net asset values and returns reported in the Financial Highlights. Additionally, the returns and net asset values shown throughout this report are at the Fund level only and do not include variable product issuer charges. If such charges were included, the total returns would be lower.
Invesco Van Kampen V.I. Comstock Fund
Schedule of Investments
December 31, 2011
| | | | | | | | | |
| | | Shares | | Value |
| |
Common Stocks & Other Equity Interests–97.36%(a)
|
Aerospace & Defense–2.39%
| | | | |
| Honeywell International Inc. | | | 502,426 | | | $ | 27,306,853 | |
| |
| Textron Inc. | | | 838,070 | | | | 15,495,914 | |
| |
| | | | | | | | 42,802,767 | |
| |
Aluminum–0.90%
| | | | |
| Alcoa Inc. | | | 1,852,362 | | | | 16,022,931 | |
| |
Asset Management & Custody Banks–1.98%
| | | | |
| Bank of New York Mellon Corp. (The) | | | 1,359,091 | | | | 27,059,502 | |
| |
| State Street Corp. | | | 209,852 | | | | 8,459,134 | |
| |
| | | | | | | | 35,518,636 | |
| |
Automobile Manufacturers–1.25%
| | | | |
General Motors Co.(b) | | | 1,103,681 | | | | 22,371,614 | |
| |
Cable & Satellite–5.91%
| | | | |
| Comcast Corp.–Class A | | | 3,140,641 | | | | 74,464,598 | |
| |
| Time Warner Cable Inc. | | | 492,305 | | | | 31,295,829 | |
| |
| | | | | | | | 105,760,427 | |
| |
Communications Equipment–1.03%
| | | | |
| Cisco Systems, Inc. | | | 1,022,014 | | | | 18,478,013 | |
| |
Computer Hardware–2.88%
| | | | |
Dell Inc.(b) | | | 1,220,173 | | | | 17,851,131 | |
| |
| Hewlett-Packard Co. | | | 1,310,961 | | | | 33,770,355 | |
| |
| | | | | | | | 51,621,486 | |
| |
Department Stores–0.36%
| | | | |
| Macy’s, Inc. | | | 202,726 | | | | 6,523,723 | |
| |
Diversified Banks–2.51%
| | | | |
| U.S. Bancorp | | | 416,231 | | | | 11,259,049 | |
| |
| Wells Fargo & Co. | | | 1,222,236 | | | | 33,684,824 | |
| |
| | | | | | | | 44,943,873 | |
| |
Drug Retail–1.94%
| | | | |
| CVS Caremark Corp. | | | 851,348 | | | | 34,717,971 | |
| |
Electric Utilities–2.93%
| | | | |
| FirstEnergy Corp. | | | 482,646 | | | | 21,381,218 | |
| |
| PPL Corp. | | | 1,055,735 | | | | 31,059,723 | |
| |
| | | | | | | | 52,440,941 | |
| |
Electrical Components & Equipment–0.72%
| | | | |
| Emerson Electric Co. | | | 276,777 | | | | 12,895,040 | |
| |
General Merchandise Stores–0.71%
| | | | |
| Target Corp. | | | 249,090 | | | | 12,758,390 | |
| |
Health Care Distributors–0.96%
| | | | |
| Cardinal Health, Inc. | | | 423,278 | | | | 17,189,320 | |
| |
Home Improvement Retail–1.59%
| | | | |
| Home Depot, Inc. (The) | | | 264,000 | | | | 11,098,560 | |
| |
| Lowe’s Cos., Inc. | | | 686,444 | | | | 17,421,949 | |
| |
| | | | | | | | 28,520,509 | |
| |
Household Products–0.37%
| | | | |
| Procter & Gamble Co. (The) | | | 100,077 | | | | 6,676,137 | |
| |
Hypermarkets & Super Centers–1.04%
| | | | |
| Wal-Mart Stores, Inc. | | | 311,852 | | | | 18,636,276 | |
| |
Industrial Conglomerates–1.49%
| | | | |
| General Electric Co. | | | 1,485,952 | | | | 26,613,400 | |
| |
Industrial Machinery–1.67%
| | | | |
| Ingersoll-Rand PLC (Ireland) | | | 982,482 | | | | 29,936,227 | |
| |
Integrated Oil & Gas–7.55%
| | | | |
| BP PLC–ADR (United Kingdom) | | | 901,840 | | | | 38,544,642 | |
| |
| Chevron Corp. | | | 352,014 | | | | 37,454,290 | |
| |
| Murphy Oil Corp. | | | 381,944 | | | | 21,289,558 | |
| |
| Royal Dutch Shell PLC–ADR (United Kingdom) | | | 517,354 | | | | 37,813,404 | |
| |
| | | | | | | | 135,101,894 | |
| |
Integrated Telecommunication Services–2.79%
| | | | |
| AT&T Inc. | | | 662,336 | | | | 20,029,041 | |
| |
| Verizon Communications Inc. | | | 743,243 | | | | 29,818,909 | |
| |
| | | | | | | | 49,847,950 | |
| |
Internet Software & Services–3.73%
| | | | |
eBay Inc.(b) | | | 1,175,614 | | | | 35,656,373 | |
| |
Yahoo! Inc.(b) | | | 1,925,619 | | | | 31,060,234 | |
| |
| | | | | | | | 66,716,607 | |
| |
Investment Banking & Brokerage–1.59%
| | | | |
| Goldman Sachs Group, Inc. (The) | | | 155,300 | | | | 14,043,779 | |
| |
| Morgan Stanley | | | 949,805 | | | | 14,370,550 | |
| |
| | | | | | | | 28,414,329 | |
| |
Life & Health Insurance–1.47%
| | | | |
| Aflac, Inc. | | | 152,674 | | | | 6,604,677 | |
| |
| MetLife, Inc. | | | 631,559 | | | | 19,692,010 | |
| |
| | | | | | | | 26,296,687 | |
| |
Managed Health Care–2.80%
| | | | |
| UnitedHealth Group Inc. | | | 675,078 | | | | 34,212,953 | |
| |
| WellPoint, Inc. | | | 239,724 | | | | 15,881,715 | |
| |
| | | | | | | | 50,094,668 | |
| |
| | | | | | | | | |
| | | | | | | | | |
See accompanying Notes to Financial Statements which are an integral part of the financial statements.
Invesco Van Kampen V.I. Comstock Fund
| | | | | | | | | |
| | | Shares | | Value |
| |
Movies & Entertainment–5.44%
| | | | |
| News Corp.–Class B | | | 1,562,235 | | | $ | 28,401,432 | |
| |
| Time Warner Inc. | | | 651,771 | | | | 23,555,004 | |
| |
| Viacom Inc.–Class B | | | 999,129 | | | | 45,370,448 | |
| |
| | | | | | | | 97,326,884 | |
| |
Oil & Gas Drilling–0.45%
| | | | |
Noble Corp.(b) | | | 267,452 | | | | 8,082,399 | |
| |
Oil & Gas Equipment & Services–3.45%
| | | | |
| Halliburton Co. | | | 1,048,005 | | | | 36,166,652 | |
| |
Weatherford International Ltd.(b) | | | 1,741,934 | | | | 25,501,914 | |
| |
| | | | | | | | 61,668,566 | |
| |
Oil & Gas Exploration & Production–0.61%
| | | | |
| Chesapeake Energy Corp. | | | 491,412 | | | | 10,953,573 | |
| |
Other Diversified Financial Services–5.78%
| | | | |
| Bank of America Corp. | | | 2,716,933 | | | | 15,106,147 | |
| |
| Citigroup Inc. | | | 1,593,390 | | | | 41,922,091 | |
| |
| JPMorgan Chase & Co. | | | 1,399,243 | | | | 46,524,830 | |
| |
| | | | | | | | 103,553,068 | |
| |
Packaged Foods & Meats–3.57%
| | | | |
| Kraft Foods Inc.–Class A | | | 848,843 | | | | 31,712,774 | |
| |
| Unilever N.V.–New York Shares (Netherlands) | | | 938,932 | | | | 32,271,093 | |
| |
| | | | | | | | 63,983,867 | |
| |
Paper Products–3.24%
| | | | |
| International Paper Co. | | | 1,960,925 | | | | 58,043,380 | |
| |
Personal Products–0.30%
| | | | |
| Avon Products, Inc. | | | 310,348 | | | | 5,421,780 | |
| |
Pharmaceuticals–9.87%
| | | | |
| Abbott Laboratories | | | 127,038 | | | | 7,143,347 | |
| |
| Bristol-Myers Squibb Co. | | | 1,143,137 | | | | 40,284,148 | |
| |
| GlaxoSmithKline PLC–ADR (United Kingdom) | | | 454,348 | | | | 20,731,899 | |
| |
| Merck & Co., Inc. | | | 944,427 | | | | 35,604,898 | |
| |
| Pfizer Inc. | | | 2,276,465 | | | | 49,262,703 | |
| |
| Roche Holding AG–ADR (Switzerland) | | | 340,186 | | | | 14,479,098 | |
| |
| Sanofi–ADR (France) | | | 251,412 | | | | 9,186,594 | |
| |
| | | | | | | | 176,692,687 | |
| |
Property & Casualty Insurance–3.95%
| | | | |
| Allstate Corp. (The) | | | 1,422,253 | | | | 38,983,955 | |
| |
| Chubb Corp. (The) | | | 115,482 | | | | 7,993,664 | |
| |
| Travelers Cos., Inc. (The) | | | 400,921 | | | | 23,722,495 | |
| |
| | | | | | | | 70,700,114 | |
| |
Regional Banks–2.38%
| | | | |
| Fifth Third Bancorp | | | 1,205,177 | | | | 15,329,851 | |
| |
| PNC Financial Services Group, Inc. | | | 472,031 | | | | 27,222,028 | |
| |
| | | | | | | | 42,551,879 | |
| |
Semiconductor Equipment–0.39%
| | | | |
| KLA-Tencor Corp. | | | 142,955 | | | | 6,897,579 | |
| |
Semiconductors–0.75%
| | | | |
| Intel Corp. | | | 553,846 | | | | 13,430,766 | |
| |
Soft Drinks–0.48%
| | | | |
| PepsiCo, Inc. | | | 129,128 | | | | 8,567,643 | |
| |
Specialty Stores–0.78%
| | | | |
| Staples, Inc. | | | 1,010,573 | | | | 14,036,859 | |
| |
Systems Software–2.36%
| | | | |
| Microsoft Corp. | | | 1,628,706 | | | | 42,281,208 | |
| |
Wireless Telecommunication Services–1.00%
| | | | |
| Vodafone Group PLC–ADR (United Kingdom) | | | 640,564 | | | | 17,955,009 | |
| |
Total Common Stocks & Other Equity Interests
(Cost $1,928,432,278) | | | 1,743,047,077 | |
| |
Money Market Funds–3.18%
|
Liquid Assets Portfolio–Institutional Class(c) | | | 28,457,270 | | | | 28,457,270 | |
| |
Premier Portfolio–Institutional Class(c) | | | 28,457,270 | | | | 28,457,270 | |
| |
| Total Money Market Funds (Cost $56,914,540) | | | | | | | 56,914,540 | |
| |
| TOTAL INVESTMENTS–100.54% (Cost $1,985,346,818) | | | 1,799,961,617 | |
| |
| OTHER ASSETS LESS LIABILITIES–(0.54)% | | | | | | | (9,576,236 | ) |
| |
| NET ASSETS–100.00% | | | | | | $ | 1,790,385,381 | |
| |
Investment Abbreviations:
| | | |
| ADR | | – American Depositary Receipt |
Notes to Schedule of Investments:
| | |
| (a) | | Industry and/or sector classifications used in this report are generally according to the Global Industry Classification Standard, which was developed by and is the exclusive property and a service mark of MSCI Inc. and Standard & Poor’s. |
| (b) | | Non-income producing security. |
| (c) | | The money market fund and the Fund are affiliated by having the same investment adviser. |
See accompanying Notes to Financial Statements which are an integral part of the financial statements.
Invesco Van Kampen V.I. Comstock Fund
Statement of Assets and Liabilities
December 31, 2011
| | | | | |
Assets:
|
| Investments, at value (Cost $1,928,432,278) | | $ | 1,743,047,077 | |
| |
| Investments in affiliated money market funds, at value and cost | | | 56,914,540 | |
| |
| Total investments, at value (Cost $1,985,346,818) | | | 1,799,961,617 | |
| |
| Receivable for: | | | | |
| Investments sold | | | 6,865,853 | |
| |
| Fund shares sold | | | 289,062 | |
| |
| Dividends | | | 3,932,271 | |
| |
| Investment for trustee deferred compensation and retirement plans | | | 16,694 | |
| |
| Total assets | | | 1,811,065,497 | |
| |
Liabilities:
|
| Payable for: | | | | |
| Investments purchased | | | 7,420,350 | |
| |
| Fund shares reacquired | | | 10,361,827 | |
| |
| Accrued fees to affiliates | | | 2,778,630 | |
| |
| Accrued other operating expenses | | | 45,556 | |
| |
| Trustee deferred compensation and retirement plans | | | 73,753 | |
| |
| Total liabilities | | | 20,680,116 | |
| |
| Net assets applicable to shares outstanding | | $ | 1,790,385,381 | |
| |
Net assets consist of:
|
| Shares of beneficial interest | | $ | 2,435,550,019 | |
| |
| Undistributed net investment income | | | 28,583,510 | |
| |
| Undistributed net realized gain (loss) | | | (488,362,947 | ) |
| |
| Unrealized appreciation (depreciation) | | | (185,385,201 | ) |
| |
| | | $ | 1,790,385,381 | |
| |
Net Assets:
|
| Series I | | $ | 262,318,683 | |
| |
| Series II | | $ | 1,528,066,698 | |
| |
Shares outstanding, $0.001 par value per share, with an unlimited number of shares authorized:
|
| Series I | | | 23,169,949 | |
| |
| Series II | | | 135,455,799 | |
| |
| Series I: | | | | |
| Net asset value per share | | $ | 11.32 | |
| |
| Series II: | | | | |
| Net asset value per share | | $ | 11.28 | |
| |
Statement of Operations
For the year ended December 31, 2011
| | | | | |
Investment income:
|
| Dividends (net of foreign withholding taxes of $642,147) | | $ | 43,988,712 | |
| |
| Dividends from affiliated money market funds | | | 60,620 | |
| |
| Total investment income | | | 44,049,332 | |
| |
Expenses:
|
| Advisory fees | | | 10,548,579 | |
| |
| Administrative services fees | | | 4,748,244 | |
| |
| Custodian fees | | | 8,790 | |
| |
| Distribution fees — Series II | | | 4,011,282 | |
| |
| Transfer agent fees | | | 32,344 | |
| |
| Trustees’ and officers’ fees and benefits | | | 99,190 | |
| |
| Other | | | (447,755 | ) |
| |
| Total expenses | | | 19,000,674 | |
| |
| Less: Fees waived | | | (3,452,557 | ) |
| |
| Net expenses | | | 15,548,117 | |
| |
| Net investment income | | | 28,501,215 | |
| |
| Net realized gain from investment securities (includes net gains from securities sold to affiliates of $1,332,073) | | | 77,412,661 | |
| |
| Change in net unrealized appreciation (depreciation) of investment securities | | | (142,304,555 | ) |
| |
| Net realized and unrealized gain (loss) | | | (64,891,894 | ) |
| |
| Net increase (decrease) in net assets resulting from operations | | $ | (36,390,679 | ) |
| |
See accompanying Notes to Financial Statements which are an integral part of the financial statements.
Invesco Van Kampen V.I. Comstock Fund
Statement of Changes in Net Assets
For the years ended December 31, 2011 and 2010
| | | | | | | | | |
| | | 2011 | | 2010 |
| |
Operations:
|
| Net investment income | | $ | 28,501,215 | | | $ | 26,130,323 | |
| |
| Net realized gain | | | 77,412,661 | | | | 53,876,954 | |
| |
| Change in net unrealized appreciation (depreciation) | | | (142,304,555 | ) | | | 169,893,792 | |
| |
| Net increase (decrease) in net assets resulting from operations | | | (36,390,679 | ) | | | 249,901,069 | |
| |
Distributions to shareholders from net investment income:
|
| Series I | | | (4,436,682 | ) | | | (193,186 | ) |
| |
| Series II | | | (21,508,918 | ) | | | (2,889,112 | ) |
| |
| Total distributions from net investment income | | | (25,945,600 | ) | | | (3,082,298 | ) |
| |
Share transactions–net:
|
| Series I | | | 51,382,742 | | | | 53,459,524 | |
| |
| Series II | | | (86,766,882 | ) | | | (725,552,245 | ) |
| |
| Net increase (decrease) in net assets resulting from share transactions | | | (35,384,140 | ) | | | (672,092,721 | ) |
| |
| Net increase (decrease) in net assets | | | (97,720,419 | ) | | | (425,273,950 | ) |
| |
Net assets:
|
| Beginning of year | | | 1,888,105,800 | | | | 2,313,379,750 | |
| |
| End of year (includes undistributed net investment income of $28,583,510 and $25,786,214, respectively) | | $ | 1,790,385,381 | | | $ | 1,888,105,800 | |
| |
Notes to Financial Statements
December 31, 2011
NOTE 1—Significant Accounting Policies
Invesco Van Kampen V.I. Comstock Fund (the “Fund”) is a series portfolio of AIM Variable Insurance Funds (Invesco Variable Insurance Funds) (the “Trust”). The Trust is a Delaware statutory trust registered under the Investment Company Act of 1940, as amended (the “1940 Act”), as an open-end series management investment company consisting of twenty-eight separate portfolios, (each constituting a “Fund”). The assets, liabilities and operations of each portfolio are accounted for separately. Information presented in these financial statements pertains only to the Fund. Matters affecting each Fund or class will be voted on exclusively by the shareholders of such Fund or class. Current Securities and Exchange Commission (“SEC”) guidance, however, requires participating insurance companies offering separate accounts to vote shares proportionally in accordance with the instructions of the contract owners whose investments are funded by shares of each Fund or class.
The Fund’s investment objective is to seek capital growth and income through investments in equity securities, including common stocks, preferred stocks and securities convertible into common and preferred stocks.
The Fund currently offers two classes of shares, Series I and Series II, both of which are offered to insurance company separate accounts funding variable annuity contracts and variable life insurance policies (“variable products”).
The following is a summary of the significant accounting policies followed by the Fund in the preparation of its financial statements.
| | |
| A. | | Security Valuations — Securities, including restricted securities, are valued according to the following policy. |
| | A security listed or traded on an exchange (except convertible bonds) is valued at its last sales price or official closing price as of the close of the customary trading session on the exchange where the security is principally traded, or lacking any sales or official closing price on a particular day, the security may be valued at the closing bid price on that day. Securities traded in the over-the-counter market are valued based on prices furnished by independent pricing services or market makers. When such securities are valued by an independent pricing service they may be considered fair valued. Futures contracts are valued at the final settlement price set by an exchange on which they are principally traded. Listed options are valued at the mean between the last bid and ask prices from the exchange on which they are principally traded. Options not listed on an exchange are valued by an independent source at the mean between the last bid and ask prices. For purposes of determining net asset value per share, futures and option contracts generally are valued 15 minutes after the close of the customary trading session of the New York Stock Exchange (“NYSE”). |
| | Investments in open-end and closed-end registered investment companies that do not trade on an exchange are valued at the end of day net asset value per share. Investments in open-end and closed-end registered investment companies that trade on an exchange are valued at the last sales price or official closing price as of the close of the customary trading session on the exchange where the security is principally traded. |
Invesco Van Kampen V.I. Comstock Fund
| | |
| | Debt obligations (including convertible bonds) and unlisted equities are fair valued using an evaluated quote provided by an independent pricing service. Evaluated quotes provided by the pricing service may be determined without exclusive reliance on quoted prices, and may reflect appropriate factors such as institution-size trading in similar groups of securities, developments related to specific securities, dividend rate, yield, quality, type of issue, coupon rate, maturity, individual trading characteristics and other market data. Debt securities are subject to interest rate and credit risks. In addition, all debt securities involve some risk of default with respect to interest and/or principal payments. |
| | Foreign securities (including foreign exchange contracts) are converted into U.S. dollar amounts using the applicable exchange rates as of the close of the NYSE. If market quotations are available and reliable for foreign exchange traded equity securities, the securities will be valued at the market quotations. Because trading hours for certain foreign securities end before the close of the NYSE, closing market quotations may become unreliable. If between the time trading ends on a particular security and the close of the customary trading session on the NYSE, events occur that are significant and make the closing price unreliable, the Fund may fair value the security. If the event is likely to have affected the closing price of the security, the security will be valued at fair value in good faith using procedures approved by the Board of Trustees. Adjustments to closing prices to reflect fair value may also be based on a screening process of an independent pricing service to indicate the degree of certainty, based on historical data, that the closing price in the principal market where a foreign security trade is not the current value as of the close of the NYSE. Foreign securities meeting the approved degree of certainty that the price is not reflective of current value will be priced at the indication of fair value from the independent pricing service. Multiple factors may be considered by the independent pricing service in determining adjustments to reflect fair value and may include information relating to sector indices, American Depositary Receipts and domestic and foreign index futures. Foreign securities may have additional risks including exchange rate changes, potential for sharply devalued currencies and high inflation, political and economic upheaval, the relative lack of issuer information, relatively low market liquidity and the potential lack of strict financial and accounting controls and standards. |
| | Securities for which market prices are not provided by any of the above methods may be valued based upon quotes furnished by independent sources. The last bid price may be used to value equity securities. The mean between the last bid and asked prices is used to value debt obligations, including Corporate Loans. |
| | Securities for which market quotations are not readily available or are unreliable are valued at fair value as determined in good faith by or under the supervision of the Trust’s officers following procedures approved by the Board of Trustees. Issuer specific events, market trends, bid/ask quotes of brokers and information providers and other market data may be reviewed in the course of making a good faith determination of a security’s fair value. |
| | Valuations change in response to many factors including the historical and prospective earnings of the issuer, the value of the issuer’s assets, general economic conditions, interest rates, investor perceptions and market liquidity. Because of the inherent uncertainties of valuation, the values reflected in the financial statements may materially differ from the value received upon actual sale of those investments. |
| B. | | Securities Transactions and Investment Income — Securities transactions are accounted for on a trade date basis. Realized gains or losses on sales are computed on the basis of specific identification of the securities sold. Interest income is recorded on the accrual basis from settlement date. Dividend income (net of withholding tax, if any) is recorded on the ex-dividend date. |
| | The Fund may periodically participate in litigation related to Fund investments. As such, the Fund may receive proceeds from litigation settlements. Any proceeds received are included in the Statement of Operations as realized gain (loss) for investments no longer held and as unrealized gain (loss) for investments still held. |
| | Brokerage commissions and mark ups are considered transaction costs and are recorded as an increase to the cost basis of securities purchased and/or a reduction of proceeds on a sale of securities. Such transaction costs are included in the determination of net realized and unrealized gain (loss) from investment securities reported in the Statement of Operations and the Statement of Changes in Net Assets and the net realized and unrealized gains (losses) on securities per share in the Financial Highlights. Transaction costs are included in the calculation of the Fund’s net asset value and, accordingly, they reduce the Fund’s total returns. These transaction costs are not considered operating expenses and are not reflected in net investment income reported in the Statement of Operations and Statement of Changes in Net Assets, or the net investment income per share and ratios of expenses and net investment income reported in the Financial Highlights, nor are they limited by any expense limitation arrangements between the Fund and the investment adviser. |
| | The Fund allocates income and realized and unrealized capital gains and losses to a class based on the relative net assets of each class. |
| C. | | Country Determination — For the purposes of making investment selection decisions and presentation in the Schedule of Investments, the investment adviser may determine the country in which an issuer is located and/or credit risk exposure based on various factors. These factors include the laws of the country under which the issuer is organized, where the issuer maintains a principal office, the country in which the issuer derives 50% or more of its total revenues and the country that has the primary market for the issuer’s securities, as well as other criteria. Among the other criteria that may be evaluated for making this determination are the country in which the issuer maintains 50% or more of its assets, the type of security, financial guarantees and enhancements, the nature of the collateral and the sponsor organization. Country of issuer and/or credit risk exposure has been determined to be the United States of America, unless otherwise noted. |
| D. | | Distributions — Distributions from income and net realized capital gain, if any, are generally paid to separate accounts of participating insurance companies annually and recorded on ex-dividend date. |
| E. | | Federal Income Taxes — The Fund intends to comply with the requirements of Subchapter M of the Internal Revenue Code necessary to qualify as a regulated investment company and to distribute substantially all of the Fund’s taxable earnings to shareholders. As such, the Fund will not be subject to federal income taxes on otherwise taxable income (including net realized capital gain) that is distributed to shareholders. Therefore, no provision for federal income taxes is recorded in the financial statements. |
| | The Fund files tax returns in the U.S. Federal jurisdiction and certain other jurisdictions. Generally, the Fund is subject to examinations by such taxing authorities for up to three years after the filing of the return for the tax period. |
Invesco Van Kampen V.I. Comstock Fund
| | |
| F. | | Expenses — Fees provided for under the Rule 12b-1 plan of a particular class of the Fund and which are directly attributable to that class are charged to the operations of such class. All other expenses are allocated among the classes based on relative net assets. |
| G. | | Accounting Estimates — The preparation of financial statements in conformity with accounting principles generally accepted in the United States of America (“GAAP”) requires management to make estimates and assumptions that affect the reported amounts of assets and liabilities at the date of the financial statements and the reported amounts of revenues and expenses during the reporting period including estimates and assumptions related to taxation. Actual results could differ from those estimates by a significant amount. In addition, the Fund monitors for material events or transactions that may occur or become known after the period-end date and before the date the financial statements are released to print. |
| H. | | Indemnifications — Under the Trust’s organizational documents, each Trustee, officer, employee or other agent of the Trust is indemnified against certain liabilities that may arise out of performance of their duties to the Fund. Additionally, in the normal course of business, the Fund enters into contracts, including the Fund’s servicing agreements that contain a variety of indemnification clauses. The Fund’s maximum exposure under these arrangements is unknown as this would involve future claims that may be made against the Fund that have not yet occurred. The risk of material loss as a result of such indemnification claims is considered remote. |
NOTE 2—Advisory Fees and Other Fees Paid to Affiliates
The Trust has entered into a master investment advisory agreement with Invesco Advisers, Inc. (the “Adviser” or “Invesco”). Under the terms of the investment advisory agreement, the Fund pays an advisory fee to the Adviser based on the annual rate of the Fund’s average daily net assets as follows:
| | | | | |
| Average Daily Net Assets | | Rate |
| |
| First $500 million | | | 0 | .60% |
| |
| Over $500 million | | | 0 | .55% |
| |
Under the terms of a master sub-advisory agreement between the Adviser and each of Invesco Asset Management Deutschland GmbH, Invesco Asset Management Limited, Invesco Asset Management (Japan) Limited, Invesco Australia Limited, Invesco Hong Kong Limited, Invesco Senior Secured Management, Inc. and Invesco Canada Ltd. (collectively, the “Affiliated Sub-Advisers”) the Adviser, not the Fund, may pay 40% of the fees paid to the Adviser to any such Affiliated Sub-Adviser(s) that provide(s) discretionary investment management services to the Fund based on the percentage of assets allocated to such Sub-Adviser(s).
The Adviser has contractually agreed, through at least June 30, 2012, to waive advisory fees and/or reimburse expenses to the extent necessary to limit total annual operating expenses after fee waiver and/or expense reimbursement (excluding certain items discussed below) of Series I shares to 0.62% and Series II shares to 0.87% of average daily net assets. In determining the Adviser’s obligation to waive advisory fees and/or reimburse expenses, the following expenses are not taken into account, and could cause total annual operating expenses after fee waiver and/or expense reimbursement to exceed the numbers reflected above: (1) interest; (2) taxes; (3) dividend expense on short sales; (4) extraordinary or non-routine items, including litigation expenses; and (5) expenses that the Fund has incurred but did not actually pay because of an expense offset arrangement. Unless the Board of the Trustees and Invesco mutually agree to amend or continue the fee waiver agreement, it will terminate on June 30, 2012.
For the year ended December 31, 2011, the Adviser waived advisory fees of $3,452,557.
Further, the Adviser has contractually agreed, through at least June 30, 2012, to waive the advisory fee payable by the Fund in an amount equal to 100% of the net advisory fees the Adviser receives from the affiliated money market funds on investments by the Fund of uninvested cash in such affiliated money market funds.
The Trust has entered into a master administrative services agreement with Invesco pursuant to which the Fund has agreed to pay Invesco a fee for costs incurred in providing accounting services and fund administrative services to the Fund and to reimburse Invesco for administrative services fees paid to insurance companies that have agreed to provide services to the participants of separate accounts. These administrative services provided by the insurance companies may include, among other things: the printing of prospectuses, financial reports and proxy statements and the delivery of the same to existing participants; the maintenance of master accounts; the facilitation of purchases and redemptions requested by the participants; and the servicing of participants’ accounts. Pursuant to such agreement, for the year ended December 31, 2011, Invesco was paid $403,421 for accounting and fund administrative services and reimbursed $4,344,823 for services provided by insurance companies.
The Trust has entered into a transfer agency and service agreement with Invesco Investment Services, Inc. (“IIS”) pursuant to which the Fund has agreed to pay IIS a fee for providing transfer agency and shareholder services to the Fund and reimburse IIS for certain expenses incurred by IIS in the course of providing such services. For the year ended December 31, 2011, expenses incurred under the agreement are shown in the Statement of Operations as transfer agent fees.
The Trust has entered into a master distribution agreement with Invesco Distributors, Inc. (“IDI”) to serve as the distributor for the Fund. The Trust has adopted a plan pursuant to Rule 12b-1 under the 1940 Act with respect to the Fund’s Series II shares (the “Plan”). The Fund, pursuant to the Plan, pays IDI compensation at the annual rate of 0.25% of the Fund’s average daily net assets of Series II shares. Of the Plan payments, up to 0.25% of the average daily net assets of the Series II shares may be paid to insurance companies who furnish continuing personal shareholder services to customers who purchase and own Series II shares of the Fund. For the year ended December 31, 2011, expenses incurred under the Plan are detailed in the Statement of Operations as distribution fees.
Certain officers and trustees of the Trust are officers and directors of the Adviser, Invesco Ltd., IIS and/or IDI.
NOTE 3—Additional Valuation Information
GAAP defines fair value as the price that would be received to sell an asset or paid to transfer a liability in an orderly transaction between market participants at the measurement date, under current market conditions. GAAP establishes a hierarchy that prioritizes the inputs to valuation methods giving the highest priority
Invesco Van Kampen V.I. Comstock Fund
to readily available unadjusted quoted prices in an active market for identical assets (Level 1) and the lowest priority to significant unobservable inputs (Level 3) generally when market prices are not readily available or are unreliable. Based on the valuation inputs, the securities or other investments are tiered into one of three levels. Changes in valuation methods may result in transfers in or out of an investment’s assigned level:
| | |
| | Level 1 — | Prices are determined using quoted prices in an active market for identical assets. |
| | Level 2 — | Prices are determined using other significant observable inputs. Observable inputs are inputs that other market participants may use in pricing a security. These may include quoted prices for similar securities, interest rates, prepayment speeds, credit risk, yield curves, loss severities, default rates, discount rates, volatilities and others. |
| | Level 3 — | Prices are determined using significant unobservable inputs. In situations where quoted prices or observable inputs are unavailable (for example, when there is little or no market activity for an investment at the end of the period), unobservable inputs may be used. Unobservable inputs reflect the Fund’s own assumptions about the factors market participants would use in determining fair value of the securities or instruments and would be based on the best available information. |
The following is a summary of the tiered valuation input levels, as of December 31, 2011. The level assigned to the securities valuations may not be an indication of the risk or liquidity associated with investing in those securities. Because of the inherent uncertainties of valuation, the values reflected in the financial statements may materially differ from the value received upon actual sale of those investments.
During the year ended December 31, 2011, there were no significant transfers between investment levels.
| | | | | | | | | | | | | | | | | |
| | | Level 1 | | Level 2 | | Level 3 | | Total |
| |
| Equity Securities | | $ | 1,785,482,519 | | | $ | 14,479,098 | | | $ | — | | | $ | 1,799,961,617 | |
| |
NOTE 4—Security Transactions with Affiliated Funds
The Fund is permitted to purchase or sell securities from or to certain other Invesco Funds under specified conditions outlined in procedures adopted by the Board of Trustees of the Trust. The procedures have been designed to ensure that any purchase or sale of securities by the Fund from or to another fund or portfolio that is or could be considered an affiliate by virtue of having a common investment adviser (or affiliated investment advisers), common Trustees and/or common officers complies with Rule 17a-7 of the 1940 Act. Further, as defined under the procedures, each transaction is effected at the current market price. Pursuant to these procedures, for the year ended December 31, 2011, the Fund engaged in securities purchases of $4,487,703 and securities sales of $3,290,556, which resulted in net realized gains of $1,332,073.
NOTE 5—Trustees’ and Officers’ Fees and Benefits
“Trustees’ and Officers’ Fees and Benefits” include amounts accrued by the Fund to pay remuneration to certain Trustees and Officers of the Fund. Trustees have the option to defer compensation payable by the Fund, and “Trustees’ and Officers’ Fees and Benefits” also include amounts accrued by the Fund to fund such deferred compensation amounts. Those Trustees who defer compensation have the option to select various Invesco Funds in which their deferral accounts shall be deemed to be invested. Finally, certain current Trustees are eligible to participate in a retirement plan that provides for benefits to be paid upon retirement to Trustees over a period of time based on the number of years of service. The Fund may have certain former Trustees who also participate in a retirement plan and receive benefits under such plan. “Trustees’ and Officers’ Fees and Benefits” include amounts accrued by the Fund to fund such retirement benefits. Obligations under the deferred compensation and retirement plans represent unsecured claims against the general assets of the Fund.
During the year ended December 31, 2011, the Fund paid legal fees of $3,481 for services rendered by Kramer, Levin, Naftalis & Frankel LLP as counsel to the Independent Trustees. A partner of that firm is a Trustee of the Trust.
NOTE 6—Cash Balances
The Fund is permitted to temporarily carry a negative or overdrawn balance in its account with State Street Bank and Trust Company, the custodian bank. To compensate the custodian bank for such overdrafts, the overdrawn Fund may either (1) leave funds as a compensating balance in the account so the custodian bank can be compensated by earning the additional interest; or (2) compensate by paying the custodian bank at a rate agreed upon by the custodian bank and Invesco, not to exceed the contractually agreed upon rate.
NOTE 7—Distributions to Shareholders and Tax Components of Net Assets
Tax Character of Distributions to Shareholders Paid During the Years Ended December 31, 2011 and 2010:
| | | | | | | | | |
| | | 2011 | | 2010 |
| |
| Ordinary income | | $ | 25,945,600 | | | $ | 3,082,298 | |
| |
Invesco Van Kampen V.I. Comstock Fund
Tax Components of Net Assets at Period-End:
| | | | | |
| | | 2011 |
| |
| Undistributed ordinary income | | $ | 28,656,730 | |
| |
| Net unrealized appreciation (depreciation) — investments | | | (190,634,742 | ) |
| |
| Temporary book/tax differences | | | (73,220 | ) |
| |
| Capital loss carryforward | | | (483,113,406 | ) |
| |
| Shares of beneficial interest | | | 2,435,550,019 | |
| |
| Total net assets | | $ | 1,790,385,381 | |
| |
The difference between book-basis and tax-basis unrealized appreciation (depreciation) is due to differences in the timing of recognition of gains and losses on investments for tax and book purposes. The Fund’s net unrealized appreciation (depreciation) difference is attributable primarily to wash sales.
The temporary book/tax differences are a result of timing differences between book and tax recognition of income and/or expenses. The Fund’s temporary book/tax differences are the result of the trustee deferral of compensation and retirement plan benefits.
Capital loss carryforward is calculated and reported as of a specific date. Results of transactions and other activity after that date may affect the amount of capital loss carryforward actually available for the Fund to utilize. The Regulated Investment Company Modernization Act of 2010 (the “Act”) eliminated the eight-year carryover period for capital losses that arise in taxable years beginning after its enactment date of December 22, 2010. Consequently, these capital losses can be carried forward for an unlimited period. However, capital losses with an expiration period may not be used to offset capital gains until all net capital losses without an expiration date have been utilized. Additionally, post-enactment capital loss carryovers will retain their character as either short-term or long-term capital losses instead of as short-term capital losses as under prior law. The ability to utilize capital loss carryforward in the future may be limited under the Internal Revenue Code and related regulations based on the results of future transactions. Under these limitation rules, the Fund is limited to utilizing 481,267,851 of capital loss carryforward in the fiscal year ending December 31, 2012.
The Fund utilized $72,219,646 of capital loss carryforward in the current period to offset net realized capital gain for federal income tax purposes. The Fund has a capital loss carryforward as of December 31, 2011, which expires as follows:
| | | | | |
| Capital Loss Carryforward* |
| Expiration | | Short-Term |
| |
| December 31, 2016 | | $ | 142,015,578 | |
| |
| December 31, 2017 | | | 341,097,828 | |
| |
| | | $ | 483,113,406 | |
| |
| |
| * | Capital loss carryforward as of the date listed above is reduced for limitations, if any, to the extent required by the Internal Revenue Code. To the extent that unrealized gains as of May 2, 2011, the date of reorganization of Invesco Van Kampen V.I. Value Fund into the Fund are realized on securities held in each fund at such date of reorganization, the capital loss carryforward may be further limited for up to five years from the dates of the reorganization. |
NOTE 8—Investment Securities
The aggregate amount of investment securities (other than short-term securities, U.S. Treasury obligations and money market funds, if any) purchased and sold by the Fund during the year ended December 31, 2011 was $452,447,329 and $445,575,544, respectively. Cost of investments on a tax basis includes the adjustments for financial reporting purposes as of the most recently completed Federal income tax reporting period-end.
| | | | | |
| Unrealized Appreciation (Depreciation) of Investment Securities on a Tax Basis |
| |
| Aggregate unrealized appreciation of investment securities | | $ | 130,625,724 | |
| |
| Aggregate unrealized (depreciation) of investment securities | | | (321,260,466 | ) |
| |
| Net unrealized appreciation (depreciation) of investment securities | | $ | (190,634,742 | ) |
| |
| Cost of investments for tax purposes is $1,990,596,359. | | | | |
NOTE 9—Reclassification of Permanent Differences
Primarily as a result of differing book/tax treatment of Convertible Preferred transactions and Fair Fund Payments, on December 31, 2011, undistributed net investment income was increased by $245,580 and undistributed net realized gain (loss) was decreased by $245,580. Further, as a result of tax deferrals acquired in the reorganization of Invesco Van Kampen V.I. Value Fund into the Fund, undistributed net investment income was decreased by $3,899, undistributed net realized gain was decreased by $6,326,412 and shares of beneficial interest increased by $6,330,311. These reclassifications had no effect on the net assets of the Fund.
Invesco Van Kampen V.I. Comstock Fund
NOTE 10—Share Information
| | | | | | | | | | | | | | | | | |
| | | Summary of Share Activity |
| |
| | | Year ended December 31, |
| | | 2011(a) | | 2010 |
| | | Shares | | Amount | | Shares | | Amount |
| |
| Sold: | | | | | | | | | | | | | | | | |
| Series I | | | 6,303,011 | | | $ | 74,837,879 | | | | 7,436,847 | | | $ | 85,067,642 | |
| |
| Series II | | | 10,321,141 | | | | 116,328,044 | | | | 7,860,095 | | | | 81,647,180 | |
| |
| Issued as reinvestment of dividends: | | | | | | | | | | | | | | | | |
| Series I | | | 363,662 | | | | 4,436,682 | | | | 18,487 | | | | 193,186 | |
| |
| Series II | | | 1,767,372 | | | | 21,508,918 | | | | 277,000 | | | | 2,889,112 | |
| |
Issued in connection with acquisitions:(b) | | | | | | | | | | | | | | | | |
| Series I | | | 2,033,402 | | | | 25,661,404 | | | | — | | | | — | |
| |
| Series II | | | 1,023 | | | | 12,889 | | | | — | | | | — | |
| |
| Reacquired: | | | | | | | | | | | | | | | | |
| Series I | | | (4,604,342 | ) | | | (53,553,223 | ) | | | (3,029,626 | ) | | | (31,801,304 | ) |
| |
| Series II | | | (19,330,648 | ) | | | (224,616,733 | ) | | | (79,919,957 | ) | | | (810,088,537 | ) |
| |
| Net increase (decrease) in share activity | | | (3,145,379 | ) | | $ | (35,384,140 | ) | | | (67,357,154 | ) | | $ | (672,092,721 | ) |
| |
| | |
| (a) | | There are entities that are record owners of more than 5% of the outstanding shares of the Fund and in the aggregate own 69% of the outstanding shares of the Fund. The Fund and the Fund’s principal underwriter or adviser, are parties to participation agreements with these entities whereby these entities sell units of interest in separate accounts funding variable products that are invested in the Fund. The Fund, Invesco and/or Invesco affiliates may make payments to these entities, which are considered to be related to the Fund, for providing services to the Fund, Invesco and/or Invesco affiliates including but not limited to services such as, securities brokerage, third party record keeping and account servicing and administrative services. The Fund has no knowledge as to whether all or any portion of the shares owned of record by these entities are also owned beneficially. |
| (b) | | As of the opening of business on May 2, 2011 the Fund acquired all the net assets of Invesco Van Kampen V.I. Value Fund (the “Target Fund”) pursuant to a plan of reorganization approved by the Trustees of the Fund on November 10, 2010 and by the shareholders of the Target fund on April 1, 2011. The acquisition was accomplished by a tax-free exchange of 2,034,425 shares of the Fund for 2,471,069 shares outstanding of the Target fund as of the close of business on April 29, 2011. Class I and Class II shares of the Target fund were exchanged for Series I and Series II shares of the Fund, respectively, based on the relative net asset value of the Target fund to the net asset value of the Fund at the close of business on April 29, 2011. The Target fund’s net assets at that date of $25,674,293, including $4,451,624 of unrealized appreciation, were combined with those of the Fund. The net assets of the Fund immediately before the acquisition were $2,060,987,398. The net assets of the Fund immediately following the acquisition were $2,086,661,691. |
The pro forma results of the operations for the year ended December 31, 2011, assuming the reorganization had been completed on January 1, 2011, the beginning of the annual reporting period, are as follows:
| | | | | |
| Net investment income (loss) | | $ | 28,597,812 | |
| Net realized/unrealized gains (losses) | | | (62,664,518 | ) |
| | | | | |
| Change in net assets resulting from operations | | $ | (34,066,706 | ) |
The combined investment portfolios have been managed as a single integrated portfolio since the acquisition was completed, it is not practicable to separate the amounts of revenue and earnings of the Target fund that have been included in the Fund’s Statement of Operations since May 2, 2011.
Invesco Van Kampen V.I. Comstock Fund
NOTE 11—Financial Highlights
The following schedule presents financial highlights for a share of the Fund outstanding throughout the periods indicated.
| | | | | | | | | | | | | | | | | | | | | | | | | | | | | | | | | | | | | | | | | | | | | | | | | | | | | | | | | |
| | | | | | | | | | | | | | | | | | | | | | | Ratio of
| | Ratio of
| | | | |
| | | | | | | Net gains
| | | | | | | | | | | | | | | | expenses
| | expenses
| | | | |
| | | | | | | (losses) on
| | | | | | | | | | | | | | | | to average
| | to average net
| | Ratio of net
| | |
| | | Net asset
| | | | securities
| | | | Dividends
| | Distributions
| | | | | | | | | | net assets
| | assets without
| | investment
| | |
| | | value,
| | Net
| | (both
| | Total from
| | from net
| | from net
| | | | Net asset
| | | | Net assets,
| | with fee waivers
| | fee waivers
| | income
| | |
| | | beginning
| | investment
| | realized and
| | investment
| | investment
| | realized
| | Total
| | value, end
| | Total
| | end of period
| | and/or expenses
| | and/or expenses
| | to average
| | Portfolio
|
| | | of period | | income(a) | | unrealized) | | operations | | income | | gains | | Distributions | | of period | | Return | | (000s omitted) | | absorbed | | absorbed | | net assets | | turnover(b) |
| |
| Series I(c) |
| Year ended 12/31/11 | | $ | 11.71 | | | $ | 0.20 | | | $ | (0.40 | ) | | $ | (0.20 | ) | | $ | (0.19 | ) | | $ | — | | | $ | (0.19 | ) | | $ | 11.32 | | | | (1.84 | )%(d) | | $ | 262,319 | | | | 0.62 | %(e) | | | 0.80 | %(e) | | | 1.75 | %(e) | | | 24 | % |
| Year ended 12/31/10 | | | 10.11 | | | | 0.17 | | | | 1.44 | | | | 1.61 | | | | (0.01 | ) | | | 0.00 | | | | (0.01 | ) | | | 11.71 | | | | 15.98 | (d) | | | 223,354 | | | | 0.61 | | | | 0.73 | | | | 1.58 | | | | 21 | |
| Year ended 12/31/09 | | | 8.25 | | | | 0.16 | | | | 2.12 | | | | 2.28 | | | | (0.42 | ) | | | 0.00 | | | | (0.42 | ) | | | 10.11 | | | | 28.78 | | | | 148,060 | | | | 0.62 | | | | 0.62 | | | | 1.91 | | | | 27 | |
| Year ended 12/31/08 | | | 13.86 | | | | 0.26 | | | | (4.93 | ) | | | (4.67 | ) | | | (0.30 | ) | | | (0.64 | ) | | | (0.94 | ) | | | 8.25 | | | | (35.67 | ) | | | 192,548 | | | | 0.60 | | | | 0.60 | | | | 2.38 | | | | 38 | |
| Year ended 12/31/07 | | | 14.75 | | | | 0.30 | | | | (0.60 | ) | | | (0.30 | ) | | | (0.26 | ) | | | (0.33 | ) | | | (0.59 | ) | | | 13.86 | | | | (2.04 | ) | | | 309,646 | | | | 0.59 | | | | 0.59 | | | | 2.03 | | | | 25 | |
| |
| Series II(c) |
| Year ended 12/31/11 | | | 11.67 | | | | 0.17 | | | | (0.40 | ) | | | (0.23 | ) | | | (0.16 | ) | | | — | | | | (0.16 | ) | | | 11.28 | | | | (2.11 | )(d) | | | 1,528,067 | | | | 0.87 | (e) | | | 1.05 | (e) | | | 1.50 | (e) | | | 24 | |
| Year ended 12/31/10 | | | 10.10 | | | | 0.14 | | | | 1.44 | | | | 1.58 | | | | (0.01 | ) | | | 0.00 | | | | (0.01 | ) | | | 11.67 | | | | 15.70 | (d) | | | 1,664,751 | | | | 0.86 | | | | 0.98 | | | | 1.32 | | | | 21 | |
| Year ended 12/31/09 | | | 8.22 | | | | 0.14 | | | | 2.11 | | | | 2.25 | | | | (0.37 | ) | | | 0.00 | | | | (0.37 | ) | | | 10.10 | | | | 28.41 | (f) | | | 2,165,319 | | | | 0.87 | | | | 0.87 | | | | 1.63 | | | | 27 | |
| Year ended 12/31/08 | | | 13.80 | | | | 0.23 | | | | (4.91 | ) | | | (4.68 | ) | | | (0.26 | ) | | | (0.64 | ) | | | (0.90 | ) | | | 8.22 | | | | (35.80 | )(f) | | | 2,268,812 | | | | 0.85 | | | | 0.85 | | | | 2.13 | | | | 38 | |
| Year ended 12/31/07 | | | 14.70 | | | | 0.26 | | | | (0.59 | ) | | | (0.33 | ) | | | (0.24 | ) | | | (0.33 | ) | | | (0.57 | ) | | | 13.80 | | | | (2.33 | )(f) | | | 3,521,509 | | | | 0.84 | | | | 0.84 | | | | 1.78 | | | | 25 | |
| |
| | |
| (a) | | Calculated using average shares outstanding. |
| (b) | | Portfolio turnover is calculated at the fund level and is not annualized for periods less than one year, if applicable. For the period ending December 31, 2011, the portfolio turnover calculation excludes the value of securities purchased of $21,084,025 and sold of $6,434,519 in the effort to realign the Fund’s portfolio holdings after the reorganization of Invesco Van Kampen V.I. Value Fund into the Fund. |
| (c) | | On June 1, 2010, the Class I and Class II shares of the predecessor fund were reorganized into Series I and Series II shares of the Fund, respectively. |
| (d) | | Includes adjustments in accordance with accounting principles generally accepted in the United States of America and as such, the net asset value for financial reporting purposes and the returns based upon those net asset values may differ from the net asset value and returns for shareholder transactions. Total returns are not annualized for periods less than one year, if applicable, and do not reflect charges assessed in connection with a variable product, which if included would reduce total returns. |
| (e) | | Ratios are based on average daily net assets (000’s) of $267,956 and $1,604,513 for Series I and Series II shares, respectively. |
| (f) | | These returns include combined Rule 12b-1 fees and service fees of up to 0.25%. |
Invesco Van Kampen V.I. Comstock Fund
Report of Independent Registered Public Accounting Firm
To the Board of Trustees of AIM Variable Insurance Funds (Invesco Variable Insurance Funds)
and Shareholders of Invesco Van Kampen V.I. Comstock Fund:
In our opinion, the accompanying statement of assets and liabilities, including the schedule of investments, and the related statements of operations and of changes in net assets and the financial highlights present fairly, in all material respects, the financial position of Invesco Van Kampen V.I. Comstock Fund (one of the funds constituting AIM Variable Insurance Funds (Invesco Variable Insurance Funds), hereafter referred to as the “Fund”) at December 31, 2011, the results of its operations for the year then ended, and the changes in its net assets and the financial highlights for each of the two years in the period then ended, in conformity with accounting principles generally accepted in the United States of America. These financial statements and financial highlights (hereafter referred to as “financial statements”) are the responsibility of the Fund’s management; our responsibility is to express an opinion on these financial statements based on our audits. We conducted our audits of these financial statements in accordance with the standards of the Public Company Accounting Oversight Board (United States). Those standards require that we plan and perform the audits to obtain reasonable assurance about whether the financial statements are free of material misstatement. An audit includes examining, on a test basis, evidence supporting the amounts and disclosures in the financial statements, assessing the accounting principles used and significant estimates made by management, and evaluating the overall financial statement presentation. We believe that our audits, which included confirmation of securities at December 31, 2011 by correspondence with the custodian and brokers, provide a reasonable basis for our opinion. The financial highlights of the Fund for the periods ended December 31, 2009 and prior were audited by other independent auditors whose report dated February 19, 2010 expressed an unqualified opinion on those financial statements.
PRICEWATERHOUSECOOPERS LLP
February 14, 2012
Houston, Texas
Invesco Van Kampen V.I. Comstock Fund
Calculating your ongoing Fund expenses
Example
As a shareholder of the Fund, you incur ongoing costs, including management fees; distribution and/or service fees (12b-1); and other Fund expenses. This example is intended to help you understand your ongoing costs (in dollars) of investing in the Fund and to compare these costs with ongoing costs of investing in other mutual funds. The example is based on an investment of $1,000 invested at the beginning of the period and held for the entire period July 1, 2011 through December 31, 2011.
The actual and hypothetical expenses in the examples below do not represent the effect of any fees or other expenses assessed in connection with a variable product; if they did, the expenses shown would be higher while the ending account values shown would be lower.
Actual expenses
The table below provides information about actual account values and actual expenses. You may use the information in this table, together with the amount you invested, to estimate the expenses that you paid over the period. Simply divide your account value by $1,000 (for example, an $8,600 account value divided by $1,000 = 8.6), then multiply the result by the number in the table under the heading entitled “Actual Expenses Paid During Period” to estimate the expenses you paid on your account during this period.
Hypothetical example for comparison purposes
The table below also provides information about hypothetical account values and hypothetical expenses based on the Fund’s actual expense ratio and an assumed rate of return of 5% per year before expenses, which is not the Fund’s actual return.
The hypothetical account values and expenses may not be used to estimate the actual ending account balance or expenses you paid for the period. You may use this information to compare the ongoing costs of investing in the Fund and other funds. To do so, compare this 5% hypothetical example with the 5% hypothetical examples that appear in the shareholder reports of the other funds.
Please note that the expenses shown in the table are meant to highlight your ongoing costs. Therefore, the hypothetical information is useful in comparing ongoing costs, and will not help you determine the relative total costs of owning different funds.
| | | | | | | | | | | | | | | | | | | | | | | | | | | | | | | |
| | | | | | | | | | HYPOTHETICAL
| | | |
| | | | | | | | | | (5% annual return before
| | | |
| | | | | | | ACTUAL | | | expenses) | | | |
| | | | Beginning
| | | Ending
| | | Expenses
| | | Ending
| | | Expenses
| | | Annualized
|
| | | | Account Value
| | | Account Value
| | | Paid During
| | | Account Value
| | | Paid During
| | | Expense
|
| Class | | | (07/01/11) | | | (12/31/11)1 | | | Period2 | | | (12/31/11) | | | Period2 | | | Ratio |
| Series I | | | $ | 1,000.00 | | | | $ | 928.60 | | | | $ | 3.01 | | | | $ | 1,022.08 | | | | $ | 3.16 | | | | | 0.62 | % |
| | | | | | | | | | | | | | | | | | | | | | | | | | | | | | | |
| Series II | | | | 1,000.00 | | | | | 927.60 | | | | | 4.23 | | | | | 1,020.82 | | | | | 4.43 | | | | | 0.87 | |
| | | | | | | | | | | | | | | | | | | | | | | | | | | | | | | |
| |
| 1 | The actual ending account value is based on the actual total return of the Fund for the period July 1, 2011 through December 31, 2011, after actual expenses and will differ from the hypothetical ending account value which is based on the Fund’s expense ratio and a hypothetical annual return of 5% before expenses. |
| 2 | Expenses are equal to the Fund’s annualized expense ratio as indicated above multiplied by the average account value over the period, multiplied by 184/365 to reflect the most recent fiscal half year. |
Invesco Van Kampen V.I. Comstock Fund
Form 1099-DIV, Form 1042-S and other year-end tax information provide shareholders with actual calendar year amounts that should be included in their tax returns. Shareholders should consult their tax advisors.
The following distribution information is being provided as required by the Internal Revenue Code or to meet a specific state’s requirement.
The Fund designates the following amounts or, if subsequently determined to be different, the maximum amount allowable for its fiscal year ended December 31, 2011:
| | | | | |
Federal and State Income Tax | | |
| |
| Corporate Dividends Received Deduction* | | | 100.00% | |
| | |
| | * | The above percentages are based on ordinary income dividends paid to shareholders during the Fund’s fiscal year. |
Invesco Van Kampen V.I. Comstock Fund
Trustees and Officers
The address of each trustee and officer is AIM Variable Insurance Funds (Invesco Variable Insurance Funds) (the “Trust”), 11 Greenway Plaza, Suite 2500, Houston, Texas 77046-1173. The trustees serve for the life of the Trust, subject to their earlier death, incapacitation, resignation, retirement or removal as more specifically provided in the Trust’s organizational documents. Each officer serves for a one year term or until their successors are elected and qualified. Column two below includes length of time served with predecessor entities, if any.
| | | | | | | | | |
| | | | | | | Number of Funds
| | |
Name, Year of Birth and
| | Trustee and/
| | Principal Occupation(s)
| | in Fund Complex
| | Other Directorship(s)
|
| Position(s) Held with the Trust | | or Officer Since | | During Past 5 Years | | Overseen by Trustee | | Held by Trustee |
| | | | | | | | | |
| | | | | | | | | |
| | | | | | | | | |
| Interested Persons | | | | | | | | |
| | | | | | | | | |
| | | | | | | | | |
| | | | | | | | | |
Martin L. Flanagan1 — 1960
Trustee | | 2007 | | Executive Director, Chief Executive Officer and President, Invesco Ltd. (ultimate parent of Invesco and a global investment management firm); Advisor to the Board, Invesco Advisers, Inc. (formerly known as Invesco Institutional (N.A.), Inc.); Trustee, The Invesco Funds; Vice Chair, Investment Company Institute; and Member of Executive Board, SMU Cox School of Business
Formerly: Chairman, Invesco Advisers, Inc. (registered investment adviser); Director, Chairman, Chief Executive Officer and President, IVZ Inc. (holding company), INVESCO Group Services, Inc. (service provider) and Invesco North American Holdings, Inc. (holding company); Director, Chief Executive Officer and President, Invesco Holding Company Limited (parent of Invesco and a global investment management firm); Director, Invesco Ltd.; Chairman, Investment Company Institute and President, Co-Chief Executive Officer, Co-President, Chief Operating Officer and Chief Financial Officer, Franklin Resources, Inc. (global investment management organization) | | 140 | | None |
| | | | | | | | | |
| | | | | | | | | |
| | | | | | | | | |
Philip A. Taylor2 — 1954
Trustee, President and Principal Executive Officer | | 2006 | | Head of North American Retail and Senior Managing Director, Invesco Ltd.; Director, Co-Chairman, Co-President and Co-Chief Executive Officer, Invesco Advisers, Inc. (formerly known as Invesco Institutional (N.A.), Inc.) (registered investment adviser); Director, Chairman, Chief Executive Officer and President, Invesco Management Group, Inc. (formerly Invesco Aim Management Group, Inc.) (financial services holding company); Director and President, INVESCO Funds Group, Inc. (registered investment adviser and registered transfer agent); Director and Chairman, Invesco Investment Services, Inc. (formerly known as Invesco Aim Investment Services, Inc.) (registered transfer agent) and IVZ Distributors, Inc. (formerly known as INVESCO Distributors, Inc.) (registered broker dealer); Director, President and Chairman, Invesco Inc. (holding company) and Invesco Canada Holdings Inc. (holding company); Chief Executive Officer, Invesco Corporate Class Inc. (corporate mutual fund company) and Invesco Canada Fund Inc. (corporate mutual fund company); Director, Chairman and Chief Executive Officer, Invesco Canada Ltd. (formerly known as Invesco Trimark Ltd./Invesco Trimark Ltèe) (registered investment adviser and registered transfer agent); Trustee, President and Principal Executive Officer, The Invesco Funds (other than AIM Treasurer’s Series Trust (Invesco Treasurer’s Series Trust) and Short-Term Investments Trust); Trustee and Executive Vice President, The Invesco Funds (AIM Treasurer’s Series Trust (Invesco Treasurer’s Series Trust) and Short-Term Investments Trust only); Director, Invesco Investment Advisers LLC (formerly known as Van Kampen Asset Management); Director, Chief Executive Officer and President, Van Kampen Exchange Corp. | | 140 | | None |
| | | | | | | | | |
| | | | | | | | | |
| | | | | Formerly: Director and Chairman, Van Kampen Investor Services Inc.: Director, Chief Executive Officer and President, 1371 Preferred Inc. (holding company); and Van Kampen Investments Inc.; Director and President, AIM GP Canada Inc. (general partner for limited partnerships); and Van Kampen Advisors, Inc.; Director and Chief Executive Officer, Invesco Trimark Dealer Inc. (registered broker dealer); Director, Invesco Distributors, Inc. (formerly known as Invesco Aim Distributors, Inc.) (registered broker dealer); Manager, Invesco PowerShares Capital Management LLC; Director, Chief Executive Officer and President, Invesco Advisers, Inc.; Director, Chairman, Chief Executive Officer and President, Invesco Aim Capital Management, Inc.; President, Invesco Trimark Dealer Inc. and Invesco Trimark Ltd./Invesco Trimark Ltèe; Director and President, AIM Trimark Corporate Class Inc. and AIM Trimark Canada Fund Inc.; Senior Managing Director, Invesco Holding Company Limited; Trustee and Executive Vice President, Tax-Free Investments Trust; Director and Chairman, Fund Management Company (former registered broker dealer); President and Principal Executive Officer, The Invesco Funds (AIM Treasurer’s Series Trust (Invesco Treasurer’s Series Trust), Short-Term Investments Trust and Tax-Free Investments Trust only); President, AIM Trimark Global Fund Inc. and AIM Trimark Canada Fund Inc. | | | | |
| | | | | | | | | |
| | | | | | | | | |
| | | | | | | | | |
Wayne W. Whalen3 — 1939
Trustee | | 2010 | | Of Counsel, and prior to 2010, partner in the law firm of Skadden, Arps, Slate, Meagher & Flom LLP, legal counsel to funds in the Fund Complex | | 158 | | Director of the Abraham Lincoln Presidential Library Foundation |
| | | | | | | | | |
| | | | | | | | | |
| | | | | | | | | |
| Independent Trustees | | | | | | | | |
| | | | | | | | | |
| | | | | | | | | |
| | | | | | | | | |
Bruce L. Crockett — 1944
Trustee and Chair | | 1993 | | Chairman, Crockett Technology Associates (technology consulting company) | | 140 | | ACE Limited (insurance company); and Investment Company Institute |
| | | | | Formerly: Director, Captaris (unified messaging provider); Director, President and Chief Executive Officer COMSAT Corporation; and Chairman, Board of Governors of INTELSAT (international communications company) | | | | |
| | | | | | | | | |
| |
| 1 | Mr. Flanagan is considered an interested person of the Trust because he is an officer of the adviser to the Trust, and an officer and a director of Invesco Ltd., ultimate parent of the adviser to the Trust. |
| 2 | Mr. Taylor is considered an interested person of the Trust because he is an officer and a director of the adviser to, and a director of the principal underwriter of, the Trust. |
| 3 | Mr. Whalen is considered an “interested person” (within the meaning of Section 2(a)(19) of the 1940 Act) of certain Funds in the Fund Complex by reason of he and his firm currently providing legal services as legal counsel to such Funds in the Fund Complex. |
Invesco Van Kampen V.I. Comstock Fund
Trustees and Officers—(continued)
The address of each trustee and officer is AIM Variable Insurance Funds (Invesco Variable Insurance Funds) (the “Trust”), 11 Greenway Plaza, Suite 2500, Houston, Texas 77046-1173. The trustees serve for the life of the Trust, subject to their earlier death, incapacitation, resignation, retirement or removal as more specifically provided in the Trust’s organizational documents. Each officer serves for a one year term or until their successors are elected and qualified. Column two below includes length of time served with predecessor entities, if any.
| | | | | | | | | |
| | | | | | | Number of Funds
| | |
Name, Year of Birth and
| | Trustee and/
| | Principal Occupation(s)
| | in Fund Complex
| | Other Directorship(s)
|
| Position(s) Held with the Trust | | or Officer Since | | During Past 5 Years | | Overseen by Trustee | | Held by Trustee |
| | | | | | | | | |
| | | | | | | | | |
| | | | | | | |
Independent Trustees—(continued) | | | | | | |
| | | | | | | | | |
| | | | | | | | | |
| | | | | | | | | |
David C. Arch — 1945
Trustee | | 2010 | | Chairman and Chief Executive Officer of Blistex Inc., a consumer health care products manufacturer. | | 158 | | Member of the Heartland Alliance Advisory Board, a nonprofit organization serving human needs based in Chicago. Board member of the Illinois Manufacturers’ Association. Member of the Board of Visitors, Institute for the Humanities, University of Michigan |
| | | | | | | | | |
| | | | | | | | | |
| | | | | | | | | |
Frank S. Bayley — 1939
Trustee | | 2001 | | Retired
Formerly: Director, Badgley Funds, Inc. (registered investment company) (2 portfolios) and Partner, law firm of Baker & McKenzie
Formerly: Director, Badgley Funds, Inc. (registered investment company) (2 portfolios) and Partner, law firm of Baker & McKenzie | | 140 | | Director and Chairman, C.D. Stimson Company (a real estate investment company) |
| | | | | | | | | |
| | | | | | | | | |
| | | | | | | | | |
James T. Bunch — 1942
Trustee | | 2004 | | Managing Member, Grumman Hill Group LLC (family office private equity management)
Formerly: Founder, Green, Manning & Bunch Ltd. (investment banking firm)(1988-2010); Executive Committee, United States Golf Association; and Director, Policy Studies, Inc. and Van Gilder Insurance Corporation | | 140 | | Vice Chairman, Board of Governors, Western Golf Association/Evans Scholars Foundation and Director, Denver Film Society |
| | | | | | | | | |
| | | | | | | | | |
| | | | | | | | | |
Rodney F. Dammeyer — 1940
Trustee | | 2010 | | President of CAC, LLC, a private company offering capital investment and management advisory services.
Formerly: Prior to January 2004, Director of TeleTech Holdings Inc.; Prior to 2002, Director of Arris Group, Inc.; Prior to 2001, Managing Partner at Equity Group Corporate Investments. Prior to 1995, Vice Chairman of Anixter International. Prior to 1985, experience includes Senior Vice President and Chief Financial Officer of Household International, Inc., Executive Vice President and Chief Financial Officer of Northwest Industries, Inc. and Partner of Arthur Andersen & Co. | | 158 | | Director of Quidel Corporation and Stericycle, Inc. Prior to May 2008, Trustee of The Scripps Research Institute. Prior to February 2008, Director of Ventana Medical Systems, Inc. Prior to April 2007, Director of GATX Corporation. Prior to April 2004, Director of TheraSense, Inc. |
| | | | | | | | | |
| | | | | | | | | |
| | | | | | | | | |
Albert R. Dowden — 1941
Trustee | | 2000 | | Director of a number of public and private business corporations, including the Boss Group, Ltd. (private investment and management); Reich & Tang Funds (5 portfolios) (registered investment company); and Homeowners of America Holding Corporation/ Homeowners of America Insurance Company (property casualty company)
Formerly: Director, Continental Energy Services, LLC (oil and gas pipeline service); Director, CompuDyne Corporation (provider of product and services to the public security market) and Director, Annuity and Life Re (Holdings), Ltd. (reinsurance company); Director, President and Chief Executive Officer, Volvo Group North America, Inc.; Senior Vice President, AB Volvo; Director of various public and private corporations; Chairman, DHJ Media, Inc.; Director Magellan Insurance Company; and Director, The Hertz Corporation, Genmar Corporation (boat manufacturer), National Media Corporation; Advisory Board of Rotary Power International (designer, manufacturer, and seller of rotary power engines); and Chairman, Cortland Trust, Inc. (registered investment company) | | 140 | | Board of Nature’s Sunshine Products, Inc. |
| | | | | | | | | |
| | | | | | | | | |
| | | | | | | | | |
Jack M. Fields — 1952
Trustee | | 1997 | | Chief Executive Officer, Twenty First Century Group, Inc. (government affairs company); and Owner and Chief Executive Officer, Dos Angelos Ranch, L.P. (cattle, hunting, corporate entertainment), Discovery Global Education Fund (non-profit) and Cross Timbers Quail Research Ranch (non-profit)
Formerly: Chief Executive Officer, Texana Timber LP (sustainable forestry company) and member of the U.S. House of Representatives | | 140 | | Administaff |
| | | | | | | | | |
| | | | | | | | | |
| | | | | | | | | |
Carl Frischling — 1937
Trustee | | 1993 | | Partner, law firm of Kramer Levin Naftalis and Frankel LLP | | 140 | | Director, Reich & Tang Funds (16 portfolios) |
| | | | | | | | | |
| | | | | | | | | |
Invesco Van Kampen V.I. Comstock Fund
Trustees and Officers—(continued)
The address of each trustee and officer is AIM Variable Insurance Funds (Invesco Variable Insurance Funds) (the “Trust”), 11 Greenway Plaza, Suite 2500, Houston, Texas 77046-1173. The trustees serve for the life of the Trust, subject to their earlier death, incapacitation, resignation, retirement or removal as more specifically provided in the Trust’s organizational documents. Each officer serves for a one year term or until their successors are elected and qualified. Column two below includes length of time served with predecessor entities, if any.
| | | | | | | | | |
| | | | | | | Number of Funds
| | |
Name, Year of Birth and
| | Trustee and/
| | Principal Occupation(s)
| | in Fund Complex
| | Other Directorship(s)
|
| Position(s) Held with the Trust | | or Officer Since | | During Past 5 Years | | Overseen by Trustee | | Held by Trustee |
Independent Trustees—(continued) | | | | | | |
| | | | | | | | | |
| | | | | | | | | |
| | | | | | | | | |
Prema Mathai-Davis — 1950
Trustee | | 1998 | | Retired
Formerly: Chief Executive Officer, YWCA of the U.S.A. | | 140 | | None |
| | | | | | | | | |
| | | | | | | | | |
| | | | | | | | | |
Larry Soll — 1942
Trustee | | 2004 | | Retired
Formerly, Chairman, Chief Executive Officer and President, Synergen Corp. (a biotechnology company) | | 140 | | None |
| | | | | | | | | |
| | | | | | | | | |
| | | | | | | | | |
Hugo F. Sonnenschein — 1940
Trustee | | 2010 | | President Emeritus and Honorary Trustee of the University of Chicago and the Adam Smith Distinguished Service Professor in the Department of Economics at the University of Chicago. Prior to July 2000, President of the University of Chicago. | | 158 | | Trustee of the University of Rochester and a member of its investment committee. Member of the National Academy of Sciences, the American Philosophical Society and a fellow of the American Academy of Arts and Sciences |
| | | | | | | | | |
| | | | | | | | | |
| | | | | | | | | |
| Raymond Stickel, Jr. — 1944 Trustee | | 2005 | | Retired
Formerly: Director, Mainstay VP Series Funds, Inc. (25 portfolios) and Partner, Deloitte & Touche | | 140 | | None |
| | | | | | | | | |
| | | | | | | | | |
| | | | | | | | | |
| Other Officers | | | | | | | | |
| | | | | | | | | |
| | | | | | | | | |
| | | | | | | | | |
Russell C. Burk — 1958
Senior Vice President and Senior Officer | | 2005 | | Senior Vice President and Senior Officer, The Invesco Funds | | N/A | | N/A |
| | | | | | | | | |
| | | | | | | | | |
| | | | | | | | | |
John M. Zerr — 1962
Senior Vice President, Chief Legal Officer and Secretary | | 2006 | | Director, Senior Vice President, Secretary and General Counsel, Invesco Management Group, Inc. (formerly known as Invesco Aim Management Group, Inc.) and Van Kampen Exchange Corp.; Senior Vice President, Invesco Advisers, Inc. (formerly known as Invesco Institutional (N.A.), Inc.) (registered investment adviser); Senior Vice President and Secretary, Invesco Distributors, Inc. (formerly known as Invesco Aim Distributors, Inc.); Director, Vice President and Secretary, Invesco Investment Services, Inc. (formerly known as Invesco Aim Investment Services, Inc.) and IVZ Distributors, Inc. (formerly known as INVESCO Distributors, Inc.); Director and Vice President, INVESCO Funds Group, Inc.; Senior Vice President, Chief Legal Officer and Secretary, The Invesco Funds; Manager, Invesco PowerShares Capital Management LLC; Director, Secretary and General Counsel, Invesco Investment Advisers LLC (formerly known as Van Kampen Asset Management); Secretary and General Counsel, Van Kampen Funds Inc. and Chief Legal Officer, PowerShares Exchange-Traded Fund Trust, PowerShares Exchange-Traded Fund Trust II, PowerShares India Exchange-Traded Fund Trust and PowerShares Actively Managed Exchange-Traded Fund Trust
Formerly: Director and Secretary, Van Kampen Advisors Inc.; Director Vice President, Secretary and General Counsel Van Kampen Investor Services Inc.; Director, Invesco Distributors, Inc. (formerly known as Invesco Aim Distributors, Inc.); Director, Senior Vice President, General Counsel and Secretary, Invesco Advisers, Inc.; and Van Kampen Investments Inc.; Director, Vice President and Secretary, Fund Management Company; Director, Senior Vice President, Secretary, General Counsel and Vice President, Invesco Aim Capital Management, Inc.; Chief Operating Officer and General Counsel, Liberty Ridge Capital, Inc. (an investment adviser); Vice President and Secretary, PBHG Funds (an investment company) and PBHG Insurance Series Fund (an investment company); Chief Operating Officer, General Counsel and Secretary, Old Mutual Investment Partners (a broker-dealer); General Counsel and Secretary, Old Mutual Fund Services (an administrator) and Old Mutual Shareholder Services (a shareholder servicing center); Executive Vice President, General Counsel and Secretary, Old Mutual Capital, Inc. (an investment adviser); and Vice President and Secretary, Old Mutual Advisors Funds (an investment company) | | N/A | | N/A |
| | | | | | | | | |
| | | | | | | | | |
| | | | | | | | | |
Lisa O. Brinkley — 1959
Vice President | | 2004 | | Global Compliance Director, Invesco Ltd.; Chief Compliance Officer, Invesco Investment Services, Inc.(formerly known as Invesco Aim Investment Services, Inc.); and Vice President, The Invesco Funds
Formerly: Chief Compliance Officer, Invesco Distributors, Inc. (formerly known as Invesco Aim Distributors, Inc.) and Van Kampen Investor Services Inc.; Senior Vice President, Invesco Management Group, Inc.; Senior Vice President and Chief Compliance Officer, Invesco Advisers, Inc. and The Invesco Funds; Vice President and Chief Compliance Officer, Invesco Aim Capital Management, Inc. and Invesco Distributors, Inc.; Vice President, Invesco Investment Services, Inc. and Fund Management Company | | N/A | | N/A |
| | | | | | | | | |
Invesco Van Kampen V.I. Comstock Fund
Trustees and Officers—(continued)
The address of each trustee and officer is AIM Variable Insurance Funds (Invesco Variable Insurance Funds) (the “Trust”), 11 Greenway Plaza, Suite 2500, Houston, Texas 77046-1173. The trustees serve for the life of the Trust, subject to their earlier death, incapacitation, resignation, retirement or removal as more specifically provided in the Trust’s organizational documents. Each officer serves for a one year term or until their successors are elected and qualified. Column two below includes length of time served with predecessor entities, if any.
| | | | | | | | | |
| | | | | | | Number of Funds
| | |
Name, Year of Birth and
| | Trustee and/
| | Principal Occupation(s)
| | in Fund Complex
| | Other Directorship(s)
|
| Position(s) Held with the Trust | | or Officer Since | | During Past 5 Years | | Overseen by Trustee | | Held by Trustee |
Other Officers—(continued) | | | | | | |
| | | | | | | | | |
| | | | | | | | | |
| | | | | | | | | |
Sheri Morris — 1964
Vice President, Treasurer and Principal Financial Officer | | 1999 | | Vice President, Treasurer and Principal Financial Officer, The Invesco Funds; Vice President, Invesco Advisers, Inc. (formerly known as Invesco Institutional (N.A.), Inc.) (registered investment adviser).
Formerly: Treasurer, PowerShares Exchange-Traded Fund Trust, PowerShares Exchange-Traded Fund Trust II, PowerShares India Exchange-Traded Fund Trust and PowerShares Actively Managed Exchange-Traded Fund Trust, Vice President, Invesco Advisers, Inc., Invesco Aim Capital Management, Inc. and Invesco Aim Private Asset Management, Inc.; Assistant Vice President and Assistant Treasurer, The Invesco Funds and Assistant Vice President, Invesco Advisers, Inc., Invesco Aim Capital Management, Inc. and Invesco Aim Private Asset Management, Inc. | | N/A | | N/A |
| | | | | | | | | |
| | | | | | | | | |
| | | | | | | | | |
Karen Dunn Kelley — 1960
Vice President | | 1993 | | Head of Invesco’s World Wide Fixed Income and Cash Management Group; Senior Vice President, Invesco Management Group, Inc. (formerly known as Invesco Aim Management Group, Inc.) and Invesco Advisers, Inc. (formerly known as Invesco Institutional (N.A.), Inc.) (registered investment adviser); Executive Vice President, Invesco Distributors, Inc. (formerly known as Invesco Aim Distributors, Inc.); Director, Invesco Mortgage Capital Inc.; Vice President, The Invesco Funds (other than AIM Treasurer’s Series Trust (Invesco Treasurer’s Series Trust) and Short-Term Investments Trust); and President and Principal Executive Officer, The Invesco Funds (AIM Treasurer’s Series Trust (Invesco Treasurer’s Series Trust) and Short-Term Investments Trust only).
Formerly: Senior Vice President, Van Kampen Investments Inc.; Vice President, Invesco Advisers, Inc. (formerly known as Invesco Institutional (N.A.), Inc.); Director of Cash Management and Senior Vice President, Invesco Advisers, Inc. and Invesco Aim Capital Management, Inc.; President and Principal Executive Officer, Tax-Free Investments Trust; Director and President, Fund Management Company; Chief Cash Management Officer, Director of Cash Management, Senior Vice President, and Managing Director, Invesco Aim Capital Management, Inc.; Director of Cash Management, Senior Vice President, and Vice President, Invesco Advisers, Inc. and The Invesco Funds (AIM Treasurer’s Series Trust (Invesco Treasurer’s Series Trust), Short-Term Investments Trust and Tax-Free Investments Trust only) | | N/A | | N/A |
| | | | | | | | | |
| | | | | | | | | |
| | | | | | | | | |
Yinka Akinsola — 1977
Anti-Money Laundering Compliance Officer | | 2011 | | Anti-Money Laundering Compliance Officer, Invesco Advisers, Inc. (formerly known as Invesco Institutional (N.A.), Inc.) (registered investment adviser); Invesco Distributors, Inc. (formerly known as Invesco Aim Distributors, Inc.), Invesco Investment Services, Inc. (formerly known as Invesco Aim Investment Services, Inc.), Invesco Management Group, Inc., The Invesco Funds, Invesco Van Kampen Closed-End Funds, Van Kampen Exchange Corp. and Van Kampen Funds Inc. | | N/A | | N/A |
| | | | | | | | | |
| | | | | | | | | |
| | | | | | | | | |
Todd L. Spillane — 1958
Chief Compliance Officer | | 2006 | | Senior Vice President, Invesco Management Group, Inc. (formerly known as Invesco Aim Management Group, Inc.) and Van Kampen Exchange Corp.; Senior Vice President and Chief Compliance Officer, Invesco Advisers, Inc. (registered investment adviser) (formerly known as Invesco Institutional (N.A.), Inc.); Chief Compliance Officer, The Invesco Funds, INVESCO Private Capital Investments, Inc. (holding company) and Invesco Private Capital, Inc. (registered investment adviser); Vice President, Invesco Distributors, Inc. (formerly known as Invesco Aim Distributors, Inc.) and Invesco Investment Services, Inc. (formerly known as Invesco Aim Investment Services, Inc.).
Formerly: Chief Compliance Officer, Invesco Van Kampen Closed-End Funds PowerShares Exchange-Traded Fund Trust, PowerShares Exchange-Traded Fund Trust II, PowerShares India Exchange-Traded Fund Trust, and PowerShares Actively Managed Exchange-Traded Fund Trust; Senior Vice President, Van Kampen Investments Inc.; Senior Vice President and Chief Compliance Officer, Invesco Advisers, Inc. and Invesco Aim Capital Management, Inc.; Chief Compliance Officer, Invesco Global Asset Management (N.A.), Inc., Invesco Senior Secured Management, Inc. (registered investment adviser) and Van Kampen Investor Services Inc.; Vice President, Invesco Aim Capital Management, Inc. and Fund Management Company | | N/A | | N/A |
| | | | | | | | | |
The Statement of Additional Information of the Trust includes additional information about the Fund’s Trustees and is available upon request, without charge, by calling 1.800.959.4246. Please refer to the Fund’s prospectus for information on the Fund’s sub-advisers.
| | | | | | | |
Office of the Fund
11 Greenway Plaza, Suite 2500
Houston, TX 77046-1173 | | Investment Adviser
Invesco Advisers, Inc.
1555 Peachtree Street, N.E.
Atlanta, GA 30309 | | Distributor
Invesco Distributors, Inc.
11 Greenway Plaza, Suite 2500
Houston, TX 77046-1173 | | Auditors
PricewaterhouseCoopers LLP
1201 Louisiana Street, Suite 2900
Houston, TX 77002-5678 |
| | | | | | | |
| | | | | | | |
Counsel to the Fund
Stradley Ronon Stevens & Young, LLP
2600 One Commerce Square
Philadelphia, PA 19103 | | Counsel to the Independent Trustees
Kramer, Levin, Naftalis & Frankel LLP
1177 Avenue of the Americas
New York, NY 10036-2714 | | Transfer Agent
Invesco Investment Services, Inc.
11 Greenway Plaza, Suite 2500
Houston, TX77046-1173 | | Custodian
State Street Bank and Trust Company
225 Franklin
Boston, MA 02110-2801 |
Invesco Van Kampen V.I. Comstock Fund
Invesco Van Kampen V.I. Equity and Income FundAnnual Report to Shareholders § December 31, 2011
The Fund provides a complete list of its holdings four times in each fiscal year, at the quarter-ends. For the second and fourth quarters, the lists appear in the Fund’s semiannual and annual reports to shareholders. For the first and third quarters, the Fund files the lists with the Securities and Exchange Commission (SEC) on Form N-Q. The Fund’s Form N-Q filings are available on the SEC website, sec.gov. Copies of the Fund’s Forms N-Q may be reviewed and copied at the SEC Public Reference Room in Washington, D.C. You can obtain information on the operation of the Public Reference Room, including information about duplicating fee charges, by calling 202 551 8090 or 800 732 0330, or by electronic request at the following email address: publicinfo@sec.gov. The SEC file numbers for the Fund are 811-07452 and 033-57340. The Fund’s most recent portfolio holdings, as filed on Form N-Q, have also been made available to insurance companies issuing variable annuity contracts and variable life insurance policies (“variable products”) that invest in the Fund.
A description of the policies and procedures that the Fund uses to determine how to vote proxies relating to portfolio securities is available without charge, upon request, from our Client Services department at 800 959 4246 or at invesco.com/proxyguidelines. The information is also available on the SEC website, sec.gov.
Information regarding how the Fund voted proxies related to its portfolio securities during the 12 months ended June 30, 2011, is available at invesco.com/proxysearch. The information is also available on the SEC website, sec.gov.
Invesco Advisers, Inc. is an investment adviser; it provides investment advisory services to individual and institutional clients and does not sell securities. Invesco Distributors, Inc. is the U.S. distributor for Invesco Ltd.’s retail mutual funds, exchange-traded funds and institutional money market funds. Both are wholly owned, indirect subsidiaries of Invesco Ltd.
This report must be accompanied or preceded by a currently effective Fund prospectus and variable product prospectus, which contain more complete information, including sales charges and expenses. Investors should read each carefully before investing.
Invesco Distributors, Inc.
VK-VIEQI-AR-1
| | | | | | | | | |
|
| | | | | | | |
NOT FDIC INSURED | | | MAY LOSE VALUE | | | NO BANK GUARANTEE |
Management’s Discussion of Fund Performance
Performance summary
For the 12 months ended December 31, 2011, Invesco Van Kampen V.I. Equity and Income Fund underperformed the Russell 1000 Value Index, the Fund’s style-specific benchmark. Because the Fund uses a bottom-up stock selection approach, stock selection in various sectors was the primary reason the Fund underperformed its benchmark.
Your Fund’s long-term performance appears later in this report.
Fund vs. Indexes
Total returns, 12/31/10 to 12/31/11, excluding variable product issuer charges. If variable product issuer charges were included, returns would be lower.
| | | | | |
|
| Series I Shares | | | -1.26 | % |
| |
| Series II Shares | | | -1.30 | |
| |
Russell 1000 Value Index▼ (Broad Market Index) | | | 0.39 | |
| |
Barclays Capital U.S. Government/Credit Index▼ (Style-Specific Index) | | | 8.74 | |
| |
Source(s): ▼Lipper Inc.
How we invest
We describe our investment philosophy as “value with a catalyst.” We believe that undervalued companies that are experiencing positive changes (i.e., “catalysts”) have the potential to generate long-term stock price growth for shareholders. We generally seek to identify companies that are out of favor with investors, under-earning relative to their potential and attractively valued. For these companies, we attempt to identify catalysts that may improve the financial results and/or correct the undervaluation. Examples of catalysts typically include improving operational efficiency, changing industry dynamics and/or a change in management.
We initially identify potential investments through a series of quantitative screens including, but not limited to, return on capital and enterprise value to sales metrics. We then conduct fundamental research on the most attractive opportunities. The research process includes a thorough review of a company’s financial statements, an evaluation of its competitive position and stability, and meetings with its executives. During the research process, we also value the company under various scenarios to determine if the investment is an attractive opportunity relative to its risks. This
is also where we typically identify the positive catalyst, a prerequisite for potential investment. Finally, we generally set a price target for a stock based on normalized earnings and historical valuation multiples.
In short, our objective is to exploit negative sentiment toward a company’s stock by analyzing the company’s operations in the context of a cyclical environment and identifying one or more catalysts that may improve the company’s financial performance. Improved financial performance, in turn, has the potential to drive the company’s stock price higher.
We typically sell an investment when it reaches our estimate of fair value or when we identify a more attractive investment opportunity.
The Fund also invests in convertible securities, investment grade corporate bonds and U.S. government issued bonds. The fixed income portion of the portfolio has the potential to reduce volatility compared to an equity-only portfolio and provide some downside protection during periods of stock market volatility.
Market conditions and your Fund
The fiscal year began with equity markets fueled on the second round of “quantitative easing” by the U.S. Federal Reserve, and markets rose through the first quarter
of 2011. However, with the spring came increased volatility and significant macroeconomic distortions due to civil unrest in Egypt and Libya, flooding in Australia and a devastating earthquake and tsunami in Japan. Corporate earnings remained strong with largely positive surprises, but were often overshadowed by investor concerns about continuing high unemployment and soft housing data. Although markets stabilized and were generally in positive territory through the summer, major equity indexes sold off precipitously in August as the U.S. government struggled to raise the nation’s debt ceiling. Despite an eventual agreement between the White House and Congress, credit rating agency Standard & Poor’s announced the first-ever downgrade to long-term U.S. government debt. Uncertainty created by the downgrade combined with the continuing saga surrounding the debt crisis in the euro-zone reignited fears of a global recession. Despite evidence of sustained, but muted, growth, these macroeconomic factors continued to weigh on markets through the end of the reporting period.
Results were mixed among the sectors of the Russell 1000 Value Index, with cyclical industries such as financials, materials and information technology (IT) posting negative returns, while defensive sectors such as health care and consumer staples fared better, posting double digit positive returns.
The Fund’s material underweight exposure to the financials sector was the largest relative contributor to performance versus the Russell 1000 Value Index, as financials was the worst performing sector in the benchmark for the reporting period. In general, we focused on what we believed were lower risk financial companies with stronger balance sheets and less credit risk, given the systemic risk in most financial stocks.
Strong stock selection in the materials sector was another driver of relative performance versus the style-specific benchmark. Having little exposure to holdings
Portfolio Composition
By security type
| | | | | |
|
| Common Stocks & Other Equity Interests | | | 62.5 | % |
| |
| Bonds and Notes | | | 18.2 | |
| |
| U.S. Treasury Securities | | | 8.0 | |
| |
| Preferred Stocks | | | 1.6 | |
| |
| U.S. Government Sponsored Agency | | | | |
| Securities | | | 0.8 | |
| |
Money Market Funds Plus | | | | |
Other Assets Less Liabilities | | | 8.9 | |
Top 10 Equity Holdings*
| | | | | | | | | |
|
| | 1. | | | General Electric | | | 2.9 | % |
| |
| | 2. | | | JPMorgan Chase & Co. | | | 2.7 | |
| |
| | 3. | | | Marsh & McLennan Cos., Inc. | | | 2.1 | |
| |
| | 4. | | | Pfizer Inc. | | | 1.9 | |
| |
| | 5. | | | Anadarko Petroleum Corp. | | | 1.8 | |
| |
| | 6. | | | Procter & Gamble Co. | | | 1.8 | |
| |
| | 7. | | | eBay Inc. | | | 1.6 | |
| |
| | 8. | | | Royal Dutch Shell PLC | | | 1.5 | |
| |
| | 9. | | | Viacom Inc.-Class B | | | 1.5 | |
| |
| | 10. | | | UnitedHealth Group, Inc. | | | 1.5 | |
| | | | | |
|
Total Net Assets
| | $920.8 million | |
| |
| Total Number of Holdings* | | | 378 | |
The Fund’s holdings are subject to change, and there is no assurance that the Fund will continue to hold any particular security.
*Excluding money market fund holdings.
Invesco Van Kampen V.I. Equity and Income Fund
such as Dow Chemical and LyondellBasell Industries and no exposure to companies such as Alcoa and United States Steel provided the largest boost to relative returns in this sector. Dow Chemical and LyondellBasell were no longer held at the end of the reporting period.
In the telecommunication services sector, stock selection versus the Russell 1000 Value Index helped with relative Fund performance. A top relative contributor for the Fund was Vodafone Group. Additionally, our lack of exposure to Sprint Nextel benefited relative Fund performance as this company underperformed the Fund’s style-specific benchmark and the telecommunications sector, posting a negative double-digit return for the fiscal year.
Stock selection in the consumer staples sector was the largest detractor from Fund performance during the reporting period. Avon was clearly a detractor in this sector, as the stock was not held in the Russell 1000 Value Index and performed poorly for the year. Avon’s sales declined in emerging markets, notably Brazil, and profits from sales in Europe were affected by slowing economies. In December, Avon announced it will be searching for a replacement CEO in 2012.
Stock selection in the energy sector also negatively affected relative Fund performance. More specifically, holdings in exploration and production and oil and gas equipment service companies were the largest detractors, as investors shunned highly cyclical areas of the market. Baker Hughes, Schlumberger and Hess all performed poorly, with stock prices producing double-digit losses for the reporting period. Additionally, not owning Chevron, a relatively large weight in the Russell 1000 Value Index, also detracted from Fund performance, as this stock performed very well for the reporting period.
Stock selection in the IT sector detracted from Fund performance for the reporting period. The Fund was overweight in this sector versus the Russell 1000 Value Index and was adversely affected by exposure to stocks in the hardware and equipment industry. Notably affecting the Fund was Hewlett Packard, as the stock sold off significantly on the announcement that the company was selling its PC business to purchase an enterprise software company. Hewlett Packard also replaced its CEO for the third time in two years, creating uncertainty in investors’ minds about management stability. Cisco Systems
was also a large detractor in the IT sector; however, the Fund exited this position during the early part of 2011.
Finally, an underweight exposure to the utilities sector also detracted from relative Fund performance. Lack of exposure to the multi-utilities industry was one of the largest detractors in this sector.
Within fixed income, the positive contribution of investment grade corporate, U.S. Treasury and agency bonds was offset by the Fund’s allocation to convertible securities. Convertible bonds were a large detractor from relative Fund performance, as they became more closely correlated with equities than bonds and underperformed the Russell 1000 Value Index for the reporting period.
Currency forward contracts were used during the reporting period for the sole purpose of hedging currency exposure of the U.S. dollar denominated American Depositary Receipts (ADRs) in the Fund. An ADR is a negotiable security that represents the underlying securities of a non-U.S. company that trades in the U.S. financial markets, priced in U.S. dollars. The use of currency forward contracts had a slight positive effect on relative Fund performance versus the Russell 1000 Value Index for the reporting period.
Equity markets experienced an increase in market volatility during the reporting period. We believe that market volatility, and the market correction that began in the third quarter of 2011, created opportunities to invest in companies with attractive valuations and strong fundamentals. We believe that ultimately those valuations and fundamentals could be reflected in those companies’ stock prices. Thank you for your continued investment in Invesco Van Kampen V.I. Equity and Income Fund.
The views and opinions expressed in management’s discussion of Fund performance are those of Invesco Advisers, Inc. These views and opinions are subject to change at any time based on factors such as market and economic conditions. These views and opinions may not be relied upon as investment advice or recommendations, or as an offer for a particular security. The information is not a complete analysis of every aspect of any market, country, industry, security or the Fund. Statements of fact are from sources considered reliable, but Invesco Advisers, Inc. makes no representation or warranty as to their completeness or accuracy. Although historical performance is no guarantee of future results, these insights may help you understand our investment management philosophy.
See important Fund and, if applicable, index disclosures later in this report.
Thomas Bastian
Chartered Financial Analyst, portfolio manager, is lead manager of Invesco Van Kampen V.I. Equity and Income Fund. Mr. Bastian joined Invesco in 2010. He earned a B.A. in accounting from St. John’s University and an M.B.A. in finance from the University of Michigan.
Chuck Burge
Portfolio manager, is manager of Invesco Van Kampen V.I. Equity and Income Fund. Mr. Burge joined Invesco in 2002. He earned a B.S. in economics from Texas A&M University and an M.B.A. in finance and accounting from Rice University.
Mark Laskin
Chartered Financial Analyst, portfolio manager, is manager of Invesco Van Kampen V.I. Equity and Income Fund. Mr. Laskin joined Invesco in 2010. He earned a B.A. in history from Swarthmore College and an M.B.A. and M.A. from the Wharton School and Lauder Institute, respectively, of the University of Pennsylvania.
Mary Jayne Maly
Chartered Financial Analyst, portfolio manager, is manager of Invesco Van Kampen V.I. Equity and Income Fund. Ms. Maly joined Invesco in 2010. She earned a B.A. from the University of Pittsburgh and an M.B.A. from the American Graduate School of International Management.
Sergio Marcheli
Portfolio manager, is manager of Invesco Van Kampen V.I. Equity and Income Fund. Mr. Marcheli joined Invesco in 2010. He earned a B.B.A. from the University of Houston and an M.B.A. from the University of St. Thomas.
James Roeder
Chartered Financial Analyst, portfolio manager, is manager of Invesco Van Kampen V.I. Equity and Income Fund. Mr. Roeder joined Invesco in 2010. He earned a B.S. in accounting from Clemson University and an M.B.A. in economics and finance from the University of Chicago Booth School of Business.
Invesco Van Kampen V.I. Equity and Income Fund
Your Fund’s Long-Term Performance
Results of a $10,000 Investment – Oldest Share Class(es) since Inception
Fund and index data from 4/30/03
Past performance cannot guarantee comparable future results.
Average Annual Total Returns
As of 12/31/11
| | | | | |
|
Series I Shares | | | | |
| |
| Inception | | | 6.40 | % |
| |
| 5 Years | | | 1.62 | |
| |
| 1 Year | | | -1.26 | |
| |
| |
Series II Shares | | | | |
| |
| Inception (4/30/03) | | | 6.39 | % |
| |
| 5 Years | | | 1.60 | |
| |
| 1 Year | | | -1.30 | |
Effective June 1, 2010, Class II shares of the predecessor fund, Universal Institutional Funds Equity and Income Portfolio, advised by Morgan Stanley Investment Management Inc. were reorganized into Series II shares of Invesco Van Kampen V.I. Equity and Income Fund. Returns shown above for Series II shares are blended returns of the predecessor fund and Invesco Van Kampen V.I. Equity and Income Fund. Share class returns will differ from the predecessor fund because of different expenses.
Series I shares incepted on June 1, 2010. Series I shares performance shown prior to that date is that of the predecessor fund’s Class II shares and includes the 12b-1 fees applicable to the predecessor fund’s Class II shares. Class II shares performance reflects any applicable fee waivers or expense reimbursements. The inception date of the predecessor fund’s Class II shares is April 30, 2003.
The performance data quoted represent past performance and cannot guarantee comparable future results; current performance may be lower or higher. Please contact your variable product issuer or financial adviser for the most recent month-end variable product performance. Performance figures reflect Fund expenses, reinvested distributions and changes in net asset value. Investment return and principal value will fluctuate so that you may have a gain or loss when you sell shares.
The net annual Fund operating expense ratio set forth in the most recent Fund prospectus as of the date of this report for Series I and Series II shares was 0.70% and 0.75%, respectively.1,2 The total annual Fund operating expense ratio set forth in the most recent Fund prospectus as of the date of this report for Series I and Series II shares was 0.71% and 0.96%, respectively. The expense ratios presented above may vary from the expense ratios presented in other sections of this report that are based on expenses incurred during the period covered by this report.
Invesco Van Kampen V.I. Equity and Income Fund, a series portfolio of AIM Variable Insurance Funds (Invesco Variable Insurance Funds), is currently offered through insurance companies issuing variable products. You cannot purchase shares of the Fund directly. Performance figures given represent
the Fund and are not intended to reflect actual variable product values. They do not reflect sales charges, expenses and fees assessed in connection with a variable product. Sales charges, expenses and fees, which are determined by the variable product issuers, will vary and will lower the total return.
The most recent month-end performance data at the Fund level, excluding variable product charges, is available at 800 451 4246. As mentioned above, for the most recent month-end performance including variable product charges, please contact your variable product issuer or financial adviser.
Had the adviser not waived fees and/ or reimbursed expenses in the past, performance would have been lower.
| 1 | | Total annual Fund operating expenses after any contractual fee waivers and/or expense reimbursements by the adviser in effect through at least June 30, 2012. See current prospectus for more information. |
| 2 | | Total annual Fund operating expenses after any contractual fee waivers by the distributor in effect through at least June 30, 2012. See current prospectus for more information. |
Invesco Van Kampen V.I. Equity and Income Fund
Invesco Van Kampen V.I. Equity and Income Fund’s investment objectives are both capital appreciation and current income.
| n | | Unless otherwise stated, information presented in this report is as of December 31, 2011, and is based on total net assets. |
| n | | Unless otherwise noted, all data provided by Invesco. |
| n | | To access your Fund’s reports/prospectus, visit invesco.com/fundreports. |
Principal risks of investing
in the Fund
Market risk. Market risk is the possibility that the market values of securities owned by the Fund will decline. Market risk may affect a single issuer, industry, sector of the economy or the market as a whole. The securities of small- and medium-sized companies are subject to more abrupt or erratic market movements and may have lower trading volumes or more erratic trading than securities of larger companies or the market averages in general. Investments in debt securities generally are affected by changes in interest rates and the creditworthiness of the issuer. The prices of such securities tend to fall as interest rates rise, and such declines tend to be greater among securities with longer maturities. The value of a convertible security tends to decline as interest rates rise and, because of the conversion feature, tends to vary with fluctuations in the market value of the underlying equity security.
Income risk. The ability of the Fund’s equity securities to generate income generally depends on the earnings and the continuing declaration of dividends by the issuers of such securities. The interest income on debt securities generally is affected by prevailing interest rates, which can vary widely over the short- and long-term. If dividends are reduced or discontinued or interest rates drop, distributions to shareholders from the Fund may drop as well.
Call risk. If interest rates fall, it is possible that issuers of callable securities held by the Fund will call or prepay their securities before their maturity dates. In this event, the proceeds from the called securities would most likely be reinvested by the Fund in securities bearing the new, lower interest rates, resulting in a possible decline in the Fund’s income and distributions to shareholders and termination of any conversion option on convertible securities.
Credit risk. Credit risk refers to an issuer’s ability to make timely payments of interest and principal. Because the Fund generally invests only in investment grade-quality debt securities, it is subject to a lower level of credit risk than a fund investing in lower-quality securities.
Developing markets securities risk. Securities issued by foreign companies and governments located in developing countries may be affected more negatively by inflation, devaluation of their currencies, higher transaction costs, delays in settlement, adverse political developments, the introduction of capital controls, withholding taxes, nationalization of private assets, expropriation, social unrest, war or lack of timely information than those in developed countries.
Foreign risk. The risks of investing in securities of foreign issuers can include fluctuations in foreign currencies, foreign currency exchange controls, political and economic instability, differences in financial reporting, differences in securities regulation and trading, and foreign taxation issues. The Fund may also invest in issuers in developing or emerging market countries, which are subject to greater risks than investments in securities of issuers in developed countries.
Futures risk. A decision as to whether, when and how to use futures involves the exercise of skill and judgment and even a well-conceived futures transaction may be unsuccessful because of market behavior or unexpected events.
Options risk. A decision as to whether, when and how to use options involves the exercise of skill and judgment and even a well-conceived option transaction may be unsuccessful because of market behavior or unexpected events. The prices of options can be highly volatile and the use of options can lower total returns.
Investing in real estate investment trusts (REITs) risk. Investing in REITs makes the Fund more susceptible to risks associated with the ownership of real estate and with the real estate industry in general and may be involve duplication of management fees and certain other expenses. In addition, REITs depend upon specialized management skills, may be less diversified, may have lower trading volume, and may be subject to more abrupt or erratic price movements than the overall securities markets.
Derivatives risk. Risks of derivatives include the possible imperfect correlation between the value of the instruments and the underlying assets; risks of default by the other party to certain transactions; risks that the transactions may result in
losses that partially or completely offset gains in portfolio positions; and risks that the transactions may not be liquid.
Swaps risk. A swap contract is an agreement between two parties pursuant to which the parties exchange payments at specified dates on the basis of a specified notional amount, with the payments calculated by reference to specified securities, indexes, reference rates, currencies or other instruments. Swaps are subject to credit risk and counterparty risk.
Value investing style risk. The Fund emphasizes a value style of investing, which focuses on undervalued companies with characteristics for improved valuations. This style of investing is subject to the risk that the valuations never improve or that the returns on value equity securities are less than returns on other styles of investing or the overall stock market. Value stocks also may decline in price, even though in theory they are already underpriced.
About indexes used in this report
The Russell 1000® Value Index is an unmanaged index considered representative of large-cap value stocks. The Russell 1000 Value Index is a trademark/service mark of the Frank Russell Co. Russell® is a trademark of the Frank Russell Co.
The Barclays Capital U.S. Government/Credit Index includes treasuries and agencies that represent the government portion of the index, and includes publicly issued U.S. corporate and foreign debentures and secured notes that meet specified maturity, liquidity and quality requirements to represent the credit interests.
The Fund is not managed to track the performance of any particular index, including the index(es) defined here, and consequently, the performance of the Fund may deviate significantly from the performance of the index(es).
A direct investment cannot be made in an index. Unless otherwise indicated, index results include reinvested dividends, and they do not reflect sales charges. Performance of the peer group, if applicable, reflects fund expenses; performance of a market index does not.
Invesco Van Kampen V.I. Equity and Income Fund
Other information
The Chartered Financial Analyst® (CFA®) designation is globally recognized and attests to a charterholder’s success in a rigorous and comprehensive study program in the field of investment management and research analysis.
Industry classifications used in this report are generally according to the Global Industry Classification Standard, which was developed by and is the exclusive property and a service mark of MSCI Inc. and Standard & Poor’s.
The returns shown in management’s discussion of Fund performance are based on net asset values calculated for shareholder transactions. Generally accepted accounting principles require adjustments to be made to the net assets of the Fund at period end for financial reporting purposes, and as such, the net asset values for shareholder transactions and the returns based on those net asset values may differ from the net asset values and returns reported in the Financial Highlights. Additionally, the returns and net asset values shown throughout this report are at the Fund level only and do not include variable product issuer charges. If such charges were included, the total returns would be lower.
Invesco Van Kampen V.I. Equity and Income Fund
Schedule of Investments(a)
December 31, 2011
| | | | | | | | | |
| | | Shares | | Value |
| |
Common Stocks & Other Equity Interests–62.50%
|
Agricultural Products–0.67%
| | | | |
| Archer-Daniels-Midland Co. | | | 215,796 | | | $ | 6,171,766 | |
| |
Asset Management & Custody Banks–1.07%
| | | | |
| Northern Trust Corp. | | | 115,089 | | | | 4,564,430 | |
| |
| State Street Corp. | | | 131,377 | | | | 5,295,807 | |
| |
| | | | | | | | 9,860,237 | |
| |
Cable & Satellite–2.21%
| | | | |
| Comcast Corp.–Class A | | | 518,577 | | | | 12,295,460 | |
| |
| Time Warner Cable Inc. | | | 127,282 | | | | 8,091,317 | |
| |
| | | | | | | | 20,386,777 | |
| |
Computer Hardware–1.44%
| | | | |
Dell Inc.(b) | | | 400,172 | | | | 5,854,517 | |
| |
| Hewlett-Packard Co. | | | 289,283 | | | | 7,451,930 | |
| |
| | | | | | | | 13,306,447 | |
| |
Consumer Electronics–0.14%
| | | | |
| Sony Corp.–ADR (Japan) | | | 71,357 | | | | 1,287,280 | |
| |
Data Processing & Outsourced Services–0.64%
| | | | |
| Western Union Co. | | | 325,380 | | | | 5,941,439 | |
| |
Diversified Banks–1.64%
| | | | |
| Comerica Inc. | | | 149,859 | | | | 3,866,362 | |
| |
| U.S. Bancorp | | | 167,298 | | | | 4,525,411 | |
| |
| Wells Fargo & Co. | | | 242,623 | | | | 6,686,690 | |
| |
| | | | | | | | 15,078,463 | |
| |
Diversified Chemicals–0.66%
| | | | |
| PPG Industries, Inc. | | | 72,328 | | | | 6,038,665 | |
| |
Diversified Support Services–0.47%
| | | | |
| Cintas Corp. | | | 123,645 | | | | 4,304,083 | |
| |
Drug Retail–0.68%
| | | | |
| Walgreen Co. | | | 188,108 | | | | 6,218,851 | |
| |
Electric Utilities–2.75%
| | | | |
| American Electric Power Co., Inc. | | | 254,353 | | | | 10,507,322 | |
| |
| Edison International | | | 132,147 | | | | 5,470,886 | |
| |
| Entergy Corp. | | | 53,584 | | | | 3,914,311 | |
| |
| FirstEnergy Corp. | | | 121,673 | | | | 5,390,114 | |
| |
| | | | | | | | 25,282,633 | |
| |
Food Distributors–0.91%
| | | | |
| Sysco Corp. | | | 285,033 | | | | 8,360,018 | |
| |
Health Care Distributors–0.48%
| | | | |
| Cardinal Health, Inc. | | | 109,487 | | | | 4,446,267 | |
| |
Health Care Equipment–0.93%
| | | | |
| Medtronic, Inc. | | | 223,139 | | | | 8,535,067 | |
| |
Health Care Facilities–0.21%
| | | | |
HCA Holdings, Inc.(b) | | | 89,652 | | | | 1,975,034 | |
| |
Home Improvement Retail–1.18%
| | | | |
| Home Depot, Inc. (The) | | | 258,998 | | | | 10,888,276 | |
| |
Household Products–2.18%
| | | | |
Energizer Holdings, Inc.(b) | | | 47,224 | | | | 3,658,915 | |
| |
| Procter & Gamble Co. (The) | | | 245,759 | | | | 16,394,583 | |
| |
| | | | | | | | 20,053,498 | |
| |
Industrial Conglomerates–4.34%
| | | | |
| General Electric Co. | | | 1,477,074 | | | | 26,454,395 | |
| |
| Tyco International Ltd. | | | 288,353 | | | | 13,468,969 | |
| |
| | | | | | | | 39,923,364 | |
| |
Industrial Machinery–0.73%
| | | | |
| Ingersoll-Rand PLC (Ireland) | | | 219,302 | | | | 6,682,132 | |
| |
Insurance Brokers–2.13%
| | | | |
| Marsh & McLennan Cos., Inc. | | | 619,849 | | | | 19,599,625 | |
| |
Integrated Oil & Gas–4.10%
| | | | |
| Exxon Mobil Corp. | | | 93,455 | | | | 7,921,246 | |
| |
| Hess Corp. | | | 171,205 | | | | 9,724,444 | |
| |
| Occidental Petroleum Corp. | | | 68,383 | | | | 6,407,487 | |
| |
| Royal Dutch Shell PLC–ADR (United Kingdom) | | | 187,757 | | | | 13,723,159 | |
| |
| | | | | | | | 37,776,336 | |
| |
Integrated Telecommunication Services–0.88%
| | | | |
| Verizon Communications Inc. | | | 202,718 | | | | 8,133,046 | |
| |
Internet Software & Services–1.87%
| | | | |
eBay Inc.(b) | | | 469,785 | | | | 14,248,579 | |
| |
Yahoo! Inc.(b) | | | 187,133 | | | | 3,018,455 | |
| |
| | | | | | | | 17,267,034 | |
| |
Investment Banking & Brokerage–0.61%
| | | | |
| Charles Schwab Corp. (The) | | | 495,623 | | | | 5,580,715 | |
| |
Investment Companies–Exchange Traded Funds–0.15%
| | | | |
| SPDR S&P Homebuilders ETF | | | 82,592 | | | | 1,412,323 | |
| |
IT Consulting & Other Services–0.64%
| | | | |
Amdocs Ltd.(b) | | | 207,808 | | | | 5,928,762 | |
| |
| | | | | | | | | |
| | | | | | | | | |
See accompanying Notes to Financial Statements which are an integral part of the financial statements.
Invesco Van Kampen V.I. Equity and Income Fund
| | | | | | | | | |
| | | Shares | | Value |
| |
Managed Health Care–1.80%
| | | | |
| CIGNA Corp. | | | 71,988 | | | $ | 3,023,496 | |
| |
| UnitedHealth Group Inc. | | | 266,918 | | | | 13,527,404 | |
| |
| | | | | | | | 16,550,900 | |
| |
Movies & Entertainment–2.66%
| | | | |
| Time Warner Inc. | | | 301,108 | | | | 10,882,043 | |
| |
| Viacom Inc.–Class B | | | 299,346 | | | | 13,593,302 | |
| |
| | | | | | | | 24,475,345 | |
| |
Oil & Gas Equipment & Services–1.54%
| | | | |
| Baker Hughes Inc. | | | 105,276 | | | | 5,120,625 | |
| |
Cameron International Corp.(b) | | | 74,098 | | | | 3,644,880 | |
| |
| Schlumberger Ltd. | | | 79,539 | | | | 5,433,309 | |
| |
| | | | | | | | 14,198,814 | |
| |
Oil & Gas Exploration & Production–2.37%
| | | | |
| Anadarko Petroleum Corp. | | | 217,251 | | | | 16,582,769 | |
| |
| Devon Energy Corp. | | | 84,601 | | | | 5,245,262 | |
| |
| | | | | | | | 21,828,031 | |
| |
Oil & Gas Refining & Marketing–0.01%
| | | | |
| Sunoco, Inc. | | | 1,334 | | | | 54,721 | |
| |
Oil & Gas Storage & Transportation–0.61%
| | | | |
| Williams Cos., Inc. (The) | | | 169,797 | | | | 5,606,697 | |
| |
Other Diversified Financial Services–3.71%
| | | | |
| Citigroup Inc. | | | 348,005 | | | | 9,156,012 | |
| |
| JPMorgan Chase & Co. | | | 753,109 | | | | 25,040,874 | |
| |
| | | | | | | | 34,196,886 | |
| |
Packaged Foods & Meats–1.69%
| | | | |
| Kraft Foods Inc.–Class A | | | 173,198 | | | | 6,470,677 | |
| |
| Unilever N.V.–New York Shares (Netherlands) | | | 264,130 | | | | 9,078,148 | |
| |
| | | | | | | | 15,548,825 | |
| |
Personal Products–0.99%
| | | | |
| Avon Products, Inc. | | | 521,769 | | | | 9,115,304 | |
| |
Pharmaceuticals–5.25%
| | | | |
| Abbott Laboratories | | | 57,885 | | | | 3,254,874 | |
| |
| Bristol-Myers Squibb Co. | | | 353,648 | | | | 12,462,556 | |
| |
| Eli Lilly & Co. | | | 50,476 | | | | 2,097,783 | |
| |
Hospira, Inc.(b) | | | 31,839 | | | | 966,950 | |
| |
| Merck & Co., Inc. | | | 321,435 | | | | 12,118,099 | |
| |
| Pfizer Inc. | | | 807,785 | | | | 17,480,467 | |
| |
| | | | | | | | 48,380,729 | |
| |
Property & Casualty Insurance–0.57%
| | | | |
| Chubb Corp. (The) | | | 76,179 | | | | 5,273,110 | |
| |
Regional Banks–2.30%
| | | | |
| BB&T Corp. | | | 209,695 | | | | 5,278,023 | |
| |
| Fifth Third Bancorp | | | 360,090 | | | | 4,580,345 | |
| |
| PNC Financial Services Group, Inc. | | | 195,984 | | | | 11,302,397 | |
| |
| | | | | | | | 21,160,765 | |
| |
Semiconductor Equipment–0.54%
| | | | |
| Applied Materials, Inc. | | | 460,650 | | | | 4,933,562 | |
| |
Semiconductors–1.03%
| | | | |
| Intel Corp. | | | 224,165 | | | | 5,436,001 | |
| |
| STMicroelectronics N.V. (Switzerland) | | | 434,233 | | | | 2,564,736 | |
| |
| STMicroelectronics N.V.–New York Shares (Netherlands) | | | 243,394 | | | | 1,443,327 | |
| |
| | | | | | | | 9,444,064 | |
| |
Soft Drinks–1.05%
| | | | |
Coca-Cola Co. (The) | | | 93,297 | | | | 6,527,991 | |
| |
| PepsiCo, Inc. | | | 47,669 | | | | 3,162,838 | |
| |
| | | | | | | | 9,690,829 | |
| |
Systems Software–1.42%
| | | | |
| Microsoft Corp. | | | 504,402 | | | | 13,094,276 | |
| |
Wireless Telecommunication Services–1.25%
| | | | |
| Vodafone Group PLC–ADR (United Kingdom) | | | 409,880 | | | | 11,488,936 | |
| |
| Total Common Stocks & Other Equity Interests (Cost $529,535,817) | | | | | | | 575,479,932 | |
| |
| | | | | | | | | |
| | | Principal
| | |
| | | Amount | | |
Bonds and Notes–18.18%
|
Advertising–0.38%
| | | | |
Interpublic Group of Cos., Inc. (The), Sr. Unsec. Conv. Global Notes,
4.25%, 03/15/12(c) | | $ | 1,805,000 | | | | 1,834,331 | |
| |
4.75%, 03/15/13(c) | | | 1,445,000 | | | | 1,593,113 | |
| |
| WPP Finance (United Kingdom), Sr. Unsec. Gtd. Global Notes, 8.00%, 09/15/14 | | | 100,000 | | | | 112,107 | |
| |
| | | | | | | | 3,539,551 | |
| |
Aerospace & Defense–0.02%
| | | | |
| Raytheon Co., Sr. Unsec. Notes, 1.63%, 10/15/15 | | | 185,000 | | | | 185,491 | |
| |
Agricultural Products–0.03%
| | | | |
| Corn Products International, Inc., Sr. Unsec. Notes, 6.63%, 04/15/37 | | | 255,000 | | | | 304,225 | |
| |
Airlines–0.06%
| | | | |
Continental Airlines, Inc., Series 2010-1, Class A, Sec. Pass Through Ctfs., 4.75%, 01/12/21 | | | 315,000 | | | | 322,481 | |
| |
Delta Air Lines, Inc., Series 2010-1, Class A, Sec. Pass Through Ctfs., 6.20%, 07/02/18 | | | 235,816 | | | | 252,471 | |
| |
| | | | | | | | 574,952 | |
| |
| | | | | | | | | |
| | | | | | | | | |
See accompanying Notes to Financial Statements which are an integral part of the financial statements.
Invesco Van Kampen V.I. Equity and Income Fund
| | | | | | | | | |
| | | Principal
| | |
| | | Amount | | Value |
| |
Alternative Carriers–0.36%
| | | | |
TW Telecom Inc., Sr. Unsec. Conv. Deb., 2.38%, 04/01/13(c) | | $ | 2,794,000 | | | $ | 3,303,905 | |
| |
Application Software–0.12%
| | | | |
| Adobe Systems, Inc., Sr. Unsec. Global Notes, 4.75%, 02/01/20 | | | 185,000 | | | | 200,437 | |
| |
| Cadence Design Systems, Inc., Series B, Sr. Unsec. Conv. Global Notes, 1.50%, 12/15/13 | | | 901,000 | | | | 893,116 | |
| |
| | | | | | | | 1,093,553 | |
| |
Asset Management & Custody Banks–0.30%
| | | | |
Affiliated Managers Group, Inc., Sr. Unsec. Conv. Notes, 3.95%, 08/15/13(c) | | | 2,511,000 | | | | 2,736,990 | |
| |
Automobile Manufacturers–0.10%
| | | | |
Daimler Finance North America LLC,
Sr. Unsec. Gtd. Global Notes, 7.30%, 01/15/12 | | | 190,000 | | | | 190,331 | |
| |
Sr. Unsec. Gtd. Notes, 1.88%, 09/15/14(d) | | | 700,000 | | | | 694,548 | |
| |
| | | | | | | | 884,879 | |
| |
Automotive Retail–0.12%
| | | | |
| Advance Auto Parts, Inc., Sr. Unsec. Gtd. Notes, 5.75%, 05/01/20 | | | 585,000 | | | | 644,128 | |
| |
AutoZone, Inc.,
Sr. Unsec. Global Notes, 6.50%, 01/15/14 | | | 395,000 | | | | 434,775 | |
| |
Sr. Unsec. Notes, 5.88%, 10/15/12 | | | 60,000 | | | | 62,157 | |
| |
| | | | | | | | 1,141,060 | |
| |
Biotechnology–1.11%
| | | | |
| Amylin Pharmaceuticals Inc., Sr. Unsec. Conv. Global Notes, 3.00%, 06/15/14 | | | 2,736,000 | | | | 2,448,720 | |
| |
| Dendreon Corp., Sr. Unsec. Conv. Notes, 2.88%, 01/15/16 | | | 762,000 | | | | 538,163 | |
| |
| Gilead Sciences, Inc., Series D, Sr. Unsec. Conv. Notes, 1.63%, 05/01/16 | | | 6,360,000 | | | | 7,274,250 | |
| |
| | | | | | | | 10,261,133 | |
| |
Brewers–0.09%
| | | | |
Anheuser-Busch InBev Worldwide, Inc., Sr. Unsec. Gtd. Global Notes,
3.63%, 04/15/15 | | | 395,000 | | | | 421,510 | |
| |
| 5.38%, 01/15/20 | | | 50,000 | | | | 58,983 | |
| |
FBG Financial Ltd. (Australia), Sr. Unsec. Gtd. Notes, 5.13%, 06/15/15(d) | | | 325,000 | | | | 357,383 | |
| |
| | | | | | | | 837,876 | |
| |
Broadcasting–0.01%
| | | | |
COX Communications Inc.,
Sr. Unsec. Global Notes, 5.45%, 12/15/14 | | | 20,000 | | | | 22,254 | |
| |
Sr. Unsec. Notes, 8.38%, 03/01/39(d) | | | 80,000 | | | | 106,767 | |
| |
| | | | | | | | 129,021 | |
| |
Cable & Satellite–0.34%
| | | | |
| Comcast Corp., Sr. Unsec. Gtd. Global Notes, 5.70%, 05/15/18 | | | 445,000 | | | | 512,994 | |
| |
| DIRECTV Holdings LLC/ DIRECTV Financing Co., Inc., Sr. Unsec. Gtd. Global Notes, 7.63%, 05/15/16 | | | 1,050,000 | | | | 1,113,656 | |
| |
NBC Universal Media LLC, Sr. Unsec. Global Notes,
2.10%, 04/01/14 | | | 230,000 | | | | 233,150 | |
| |
| 5.15%, 04/30/20 | | | 175,000 | | | | 196,164 | |
| |
| 5.95%, 04/01/41 | | | 215,000 | | | | 257,007 | |
| |
Time Warner Cable, Inc.,
Sr. Unsec. Gtd. Global Notes, 8.75%, 02/14/19 | | | 215,000 | | | | 276,103 | |
| |
Sr. Unsec. Gtd. Notes, 5.88%, 11/15/40 | | | 470,000 | | | | 514,278 | |
| |
| | | | | | | | 3,103,352 | |
| |
Casinos & Gaming–1.09%
| | | | |
| International Game Technology, Sr. Unsec. Conv. Notes, 3.25%, 05/01/14 | | | 4,320,000 | | | | 5,135,400 | |
| |
| MGM Resorts International, Sr. Unsec. Gtd. Conv. Notes, 4.25%, 04/15/15 | | | 5,130,000 | | | | 4,879,913 | |
| |
| | | | | | | | 10,015,313 | |
| |
Communications Equipment–1.10%
| | | | |
Alcatel-Lucent USA, Inc., Series B, Sr. Unsec. Gtd. Conv. Notes, 2.88%, 06/15/13(c) | | | 5,506,000 | | | | 4,859,045 | |
| |
Ciena Corp., Sr. Unsec. Conv. Notes, 4.00%, 03/15/15(d) | | | 2,460,000 | | | | 2,429,250 | |
| |
JDS Uniphase Corp., Sr. Unsec. Conv. Notes,
1.00%, 05/15/13(c)(d) | | | 1,100,000 | | | | 1,081,256 | |
| |
1.00%, 05/15/13(c) | | | 1,624,000 | | | | 1,603,700 | |
| |
| Juniper Networks, Inc., Sr. Unsec. Notes, 4.60%, 03/15/21 | | | 120,000 | | | | 128,080 | |
| |
| | | | | | | | 10,101,331 | |
| |
Computer & Electronics Retail–0.04%
| | | | |
| Best Buy Co., Inc., Sr. Unsec. Notes, 5.50%, 03/15/21 | | | 420,000 | | | | 403,302 | |
| |
Computer Hardware–0.05%
| | | | |
| Hewlett-Packard Co., Sr. Unsec. Global Notes, 2.63%, 12/09/14 | | | 420,000 | | | | 424,222 | |
| |
Computer Storage & Peripherals–0.84%
| | | | |
| SanDisk Corp., Sr. Unsec. Conv. Notes, 1.00%, 05/15/13 | | | 7,906,000 | | | | 7,737,998 | |
| |
Construction Materials–0.28%
| | | | |
| Cemex S.A.B. de C.V. (Mexico), Unsec. Sub. Conv. Notes, 4.88%, 03/15/15 | | | 3,900,000 | | | | 2,564,250 | |
| |
| | | | | | | | | |
| | | | | | | | | |
See accompanying Notes to Financial Statements which are an integral part of the financial statements.
Invesco Van Kampen V.I. Equity and Income Fund
| | | | | | | | | |
| | | Principal
| | |
| | | Amount | | Value |
| |
Consumer Finance–0.01%
| | | | |
| American Express Credit Corp., Series C, Sr. Unsec. Medium-Term Global Notes, 7.30%, 08/20/13 | | $ | 35,000 | | | $ | 37,964 | |
| |
| Capital One Financial Corp., Sr. Unsec. Notes, 6.75%, 09/15/17 | | | 50,000 | | | | 56,318 | |
| |
| | | | | | | | 94,282 | |
| |
Department Stores–0.04%
| | | | |
| Macy’s Retail Holdings, Inc., Sr. Unsec. Gtd. Notes, 5.35%, 03/15/12 | | | 400,000 | | | | 403,000 | |
| |
Diversified Banks–1.42%
| | | | |
Abbey National Treasury Services PLC (United Kingdom),
Sr. Unsec. Gtd. Global Notes, | | | | | | | | |
| 2.88%, 04/25/14 | | | 155,000 | | | | 144,547 | |
| |
| 4.00%, 04/27/16 | | | 230,000 | | | | 207,226 | |
| |
Sr. Unsec. Gtd. Medium-Term Euro Notes, 3.88%, 11/10/14(d) | | | 310,000 | | | | 292,495 | |
| |
| Ally Financial, Inc., Gtd. Notes, 2.20%, 12/19/12 | | | 550,000 | | | | 560,710 | |
| |
| Bank of Nova Scotia (Canada), Sr. Unsec. Global Notes, 2.38%, 12/17/13 | | | 395,000 | | | | 406,003 | |
| |
Barclays Bank PLC (United Kingdom),
Sr. Unsec. Global Notes, | | | | | | | | |
| 5.13%, 01/08/20 | | | 60,000 | | | | 61,774 | |
| |
| 6.75%, 05/22/19 | | | 510,000 | | | | 566,606 | |
| |
Unsec. Sub. Global Notes, 5.14%, 10/14/20 | | | 275,000 | | | | 238,242 | |
| |
BPCE S.A. (France), Sr. Unsec. Notes, 2.38%, 10/04/13(d) | | | 390,000 | | | | 378,147 | |
| |
| Citibank N.A., Sr. Unsec. Gtd. Notes, 1.75%, 12/28/12 | | | 1,500,000 | | | | 1,522,451 | |
| |
Commonwealth Bank of Australia (Australia),
Sr. Unsec. Notes, 5.00%, 10/15/19(d) | | | 320,000 | | | | 338,171 | |
| |
Credit Suisse AG (Switzerland),
Sub. Global Notes, 5.40%, 01/14/20 | | | 560,000 | | | | 526,200 | |
| |
Unsec. Sub. Global Notes, 6.00%, 02/15/18 | | | 75,000 | | | | 74,201 | |
| |
Danske Bank A/S (Denmark), Sr. Unsec. Notes, 3.88%, 04/14/16(d) | | | 565,000 | | | | 525,699 | |
| |
HBOS PLC (United Kingdom), Unsec. Sub. Medium-Term Global Notes, 6.75%, 05/21/18(d) | | | 325,000 | | | | 258,773 | |
| |
HSBC Bank PLC (United Kingdom), Sr. Unsec. Notes, 4.13%, 08/12/20(d) | | | 565,000 | | | | 564,744 | |
| |
| HSBC Finance Corp., Sr. Unsec. Global Notes, 7.00%, 05/15/12 | | | 470,000 | | | | 478,033 | |
| |
| Korea Development Bank (The) (South Korea), Sr. Unsec. Global Notes, 4.38%, 08/10/15 | | | 200,000 | | | | 206,067 | |
| |
Lloyds TSB Bank PLC (United Kingdom),
Sr. Unsec. Gtd. Global Notes, 4.88%, 01/21/16 | | | 665,000 | | | | 643,796 | |
| |
Sr. Unsec. Gtd. Medium-Term Notes, 5.80%, 01/13/20(d) | | | 185,000 | | | | 176,200 | |
| |
National Australia Bank Ltd. (Australia), Sr. Unsec. Bonds, 3.75%, 03/02/15(d) | | | 190,000 | | | | 194,940 | |
| |
Nordea Bank A.B. (Sweden), Sr. Unsec. Notes, 4.88%, 01/27/20(d) | | | 245,000 | | | | 256,382 | |
| |
Rabobank Nederland N.V. (Netherlands), Sr. Unsec. Medium-Term Global Notes, 4.75%, 01/15/20(d) | | | 490,000 | | | | 527,878 | |
| |
| Royal Bank of Scotland PLC (The) (United Kingdom), Sr. Unsec. Gtd. Global Notes, 4.88%, 03/16/15 | | | 445,000 | | | | 425,148 | |
| |
Santander U.S. Debt S.A. Unipersonal (Spain), Sr. Unsec. Gtd. Notes, 3.72%, 01/20/15(d) | | | 200,000 | | | | 183,475 | |
| |
Societe Generale S.A. (France), Sr. Unsec. Notes, 2.50%, 01/15/14(d) | | | 705,000 | | | | 651,692 | |
| |
Standard Chartered Bank (United Kingdom), Unsec. Sub. Notes, 6.40%, 09/26/17(d) | | | 100,000 | | | | 102,821 | |
| |
Standard Chartered PLC (United Kingdom), Sr. Unsec. Notes,
3.85%, 04/27/15(d) | | | 255,000 | | | | 257,479 | |
| |
5.50%, 11/18/14(d) | | | 100,000 | | | | 107,826 | |
| |
| U.S. Bancorp., Sr. Unsec. Rate Notes, 2.00%, 06/14/13 | | | 530,000 | | | | 538,711 | |
| |
| U.S. Bank N.A., Sub. Variable Rate Notes, 3.78%, 04/29/20 | | | 450,000 | | | | 463,612 | |
| |
Wells Fargo & Co.,
Sr. Unsec. Global Notes, 3.63%, 04/15/15 | | | 50,000 | | | | 52,423 | |
| |
Sr. Unsec. Notes, 5.63%, 12/11/17 | | | 580,000 | | | | 659,111 | |
| |
| Westpac Banking Corp. (Australia), Sr. Unsec. Global Notes, 2.10%, 08/02/13 | | | 440,000 | | | | 442,767 | |
| |
| | | | | | | | 13,034,350 | |
| |
Diversified Capital Markets–0.05%
| | | | |
| Credit Suisse AG (Switzerland), Sr. Unsec. Medium-Term Global Notes, 5.30%, 08/13/19 | | | 170,000 | | | | 175,294 | |
| |
| UBS AG (Switzerland), Sr. Unsec. Global Notes, 5.88%, 12/20/17 | | | 250,000 | | | | 259,490 | |
| |
| | | | | | | | 434,784 | |
| |
Diversified Metals & Mining–0.11%
| | | | |
Anglo American Capital PLC (United Kingdom), Sr. Unsec. Gtd. Notes, 9.38%, 04/08/19(d) | | | 200,000 | | | | 254,773 | |
| |
| Freeport-McMoRan Copper & Gold Inc., Sr. Unsec. Notes, 8.38%, 04/01/17 | | | 350,000 | | | | 370,562 | |
| |
Rio Tinto Finance USA Ltd. (Australia),
Sr. Unsec. Gtd. Global Notes, 9.00%, 05/01/19 | | | 295,000 | | | | 402,586 | |
| |
Southern Copper Corp., Sr. Unsec. Global Notes,
5.38%, 04/16/20 | | | 5,000 | | | | 5,157 | |
| |
| 6.75%, 04/16/40 | | | 10,000 | | | | 9,997 | |
| |
| | | | | | | | 1,043,075 | |
| |
Diversified Real Estate Activities–0.00%
| | | | |
| Brookfield Asset Management, Inc. (Canada), Sr. Unsec. Notes, 7.13%, 06/15/12 | | | 20,000 | | | | 20,462 | |
| |
Diversified REIT’s–0.13%
| | | | |
Dexus Diversified Trust/Dexus Office Trust (Australia), Sr. Unsec. Gtd. Notes, 5.60%, 03/15/21(d) | | | 1,155,000 | | | | 1,177,935 | |
| |
| | | | | | | | | |
| | | | | | | | | |
See accompanying Notes to Financial Statements which are an integral part of the financial statements.
Invesco Van Kampen V.I. Equity and Income Fund
| | | | | | | | | |
| | | Principal
| | |
| | | Amount | | Value |
| |
Diversified Support Services–0.06%
| | | | |
| Cintas Corp. No. 2, Sr. Unsec. Gtd. Notes, 2.85%, 06/01/16 | | $ | 520,000 | | | $ | 534,577 | |
| |
Drug Retail–0.05%
| | | | |
CVS Caremark Corp.,
Sec. Global Pass Through Ctfs., 6.04%, 12/10/28 | | | 379,293 | | | | 399,230 | |
| |
Sec. Pass Through Ctfs., 8.35%, 07/10/31(d) | | | 33,497 | | | | 41,843 | |
| |
| | | | | | | | 441,073 | |
| |
Electric Utilities–0.16%
| | | | |
Electricite de France S.A. (France), Sr. Unsec. Notes, 4.60%, 01/27/20(d) | | | 150,000 | | | | 155,315 | |
| |
Enel Finance International N.V. (Luxembourg), Sr. Unsec. Gtd. Notes, 5.13%, 10/07/19(d) | | | 425,000 | | | | 382,067 | |
| |
Iberdola Finance Ireland Ltd. (Ireland), Unsec. Gtd. Unsub. Notes, 3.80%, 09/11/14(d) | | | 200,000 | | | | 199,928 | |
| |
| Louisville Gas & Electric Co., Sec. First Mortgage Global Bonds, 1.63%, 11/15/15 | | | 405,000 | | | | 407,753 | |
| |
| Ohio Power Co., Series M, Sr. Unsec. Notes, 5.38%, 10/01/21 | | | 200,000 | | | | 229,252 | |
| |
| PPL Electric Utilities Corp., Sec. First Mortgage Bonds, 6.25%, 05/15/39 | | | 50,000 | | | | 67,631 | |
| |
| Virginia Electric & Power Co., Sr. Unsec. Notes, 5.00%, 06/30/19 | | | 15,000 | | | | 17,335 | |
| |
| | | | | | | | 1,459,281 | |
| |
Electronic Components–0.01%
| | | | |
Corning, Inc., Sr. Unsec. Notes,
6.63%, 05/15/19 | | | 35,000 | | | | 42,447 | |
| |
| 7.25%, 08/15/36 | | | 60,000 | | | | 71,924 | |
| |
| | | | | | | | 114,371 | |
| |
Environmental & Facilities Services–0.05%
| | | | |
| Waste Management, Inc., Sr. Unsec. Gtd. Notes, 5.00%, 03/15/14 | | | 395,000 | | | | 425,113 | |
| |
Food Retail–0.08%
| | | | |
| Delhaize Group S.A. (Belgium), Sr. Unsec. Gtd. Bonds, 5.88%, 02/01/14 | | | 180,000 | | | | 194,915 | |
| |
| Safeway, Inc., Sr. Unsec. Global Notes, 3.95%, 08/15/20 | | | 500,000 | | | | 497,064 | |
| |
| | | | | | | | 691,979 | |
| |
Gold–0.11%
| | | | |
| Barrick Gold Corp. (Canada), Sr. Unsec. Global Notes, 2.90%, 05/30/16 | | | 425,000 | | | | 438,876 | |
| |
Gold Fields Orogen Holding BVI Ltd. (Mali), Sr. Unsec. Gtd. Notes, 4.88%, 10/07/20(d) | | | 665,000 | | | | 594,058 | |
| |
| | | | | | | | 1,032,934 | |
| |
Health Care Equipment–0.51%
| | | | |
| Boston Scientific Corp., Sr. Unsec. Notes, 4.50%, 01/15/15 | | | 220,000 | | | | 231,485 | |
| |
| CareFusion Corp., Sr. Unsec. Global Notes, 4.13%, 08/01/12 | | | 330,000 | | | | 335,205 | |
| |
| NuVasive Inc., Sr. Unsec. Conv. Notes, 2.75%, 07/01/17 | | | 1,104,000 | | | | 810,060 | |
| |
| Teleflex Inc., Sr. Unsec. Sub. Conv. Notes, 3.88%, 08/01/17 | | | 2,736,000 | | | | 3,303,720 | |
| |
| | | | | | | | 4,680,470 | |
| |
Health Care Facilities–0.46%
| | | | |
| Lifepoint Hospitals Inc., Sr. Unsec. Sub. Conv. Notes, 3.50%, 05/15/14 | | | 4,141,000 | | | | 4,254,878 | |
| |
Health Care Services–0.48%
| | | | |
Express Scripts, Inc.,
Sr. Unsec. Gtd. Global Notes, | | | | | | | | |
| 5.25%, 06/15/12 | | | 925,000 | | | | 942,389 | |
| |
| 6.25%, 06/15/14 | | | 70,000 | | | | 76,339 | |
| |
Sr. Unsec. Gtd. Notes, 3.13%, 05/15/16 | | | 300,000 | | | | 302,529 | |
| |
| Medco Health Solutions Inc., Sr. Unsec. Notes, 2.75%, 09/15/15 | | | 220,000 | | | | 221,225 | |
| |
Omnicare, Inc.,
Sr. Unsec. Gtd. Sub. Conv. Notes, 3.75%, 12/15/25 | | | 971,000 | | | | 1,354,545 | |
| |
Series OCR, Sr. Unsec. Gtd. Conv. Deb., 3.25%, 12/15/15(c) | | | 1,625,000 | | | | 1,499,062 | |
| |
| | | | | | | | 4,396,089 | |
| |
Hotels, Resorts & Cruise Lines–0.41%
| | | | |
Gaylord Entertainment Co., Sr. Unsec. Gtd. Conv. Notes, 3.75%, 10/01/14(d) | | | 2,778,000 | | | | 3,104,415 | |
| |
Hyatt Hotels Corp., Sr. Unsec. Notes, 5.75%, 08/15/15(d) | | | 70,000 | | | | 75,369 | |
| |
Wyndham Worldwide Corp., Sr. Unsec. Notes,
5.63%, 03/01/21 | | | 580,000 | | | | 600,300 | |
| |
| 7.38%, 03/01/20 | | | 20,000 | | | | 22,813 | |
| |
| | | | | | | | 3,802,897 | |
| |
Housewares & Specialties–0.07%
| | | | |
Tupperware Brands Corp., Sr. Unsec. Gtd. Notes, 4.75%, 06/01/21(d) | | | 605,000 | | | | 610,689 | |
| |
Hypermarkets & Super Centers–0.01%
| | | | |
| Wal-Mart Stores, Inc., Sr. Unsec. Global Notes, 6.50%, 08/15/37 | | | 50,000 | | | | 69,367 | |
| |
| | | | | | | | | |
| | | | | | | | | |
See accompanying Notes to Financial Statements which are an integral part of the financial statements.
Invesco Van Kampen V.I. Equity and Income Fund
| | | | | | | | | |
| | | Principal
| | |
| | | Amount | | Value |
| |
Industrial Conglomerates–0.54%
| | | | |
| General Electric Capital Corp., | | | | | | | | |
Sr. Unsec. Medium-Term Global Notes, 4.65%, 10/17/21 | | $ | 430,000 | | | $ | 449,629 | |
| |
Series G, Sr. Gtd. Medium-Term Global Notes, 2.63%, 12/28/12 | | | 3,450,000 | | | | 3,533,236 | |
| |
Sr. Unsec. Gtd. Medium-Term Global Notes, 2.20%, 06/08/12 | | | 80,000 | | | | 80,702 | |
| |
Sr. Unsec. Medium-Term Notes, 6.00%, 08/07/19 | | | 300,000 | | | | 344,440 | |
| |
| General Electric Co., Sr. Unsec. Global Notes, 5.25%, 12/06/17 | | | 485,000 | | | | 558,485 | |
| |
| Koninklije Philips Electronics N.V. (Netherlands), Sr. Unsec. Global Notes, 5.75%, 03/11/18 | | | 25,000 | | | | 28,688 | |
| |
| | | | | | | | 4,995,180 | |
| |
Industrial Machinery–0.11%
| | | | |
| Pentair, Inc., Sr. Unsec. Gtd. Notes, 5.00%, 05/15/21 | | | 950,000 | | | | 1,009,993 | |
| |
Integrated Oil & Gas–0.04%
| | | | |
| Hess Corp., Sr. Unsec. Global Notes, 5.60%, 02/15/41 | | | 195,000 | | | | 220,973 | |
| |
| Shell International Finance B.V. (Netherlands), Sr. Unsec. Gtd. Global Notes, 3.10%, 06/28/15 | | | 115,000 | | | | 123,360 | |
| |
| | | | | | | | 344,333 | |
| |
Integrated Telecommunication Services–0.25%
| | | | |
| AT&T Corp., Sr. Unsec. Gtd. Global Notes, 8.00%, 11/15/31 | | | 4,000 | | | | 5,666 | |
| |
AT&T, Inc., Sr. Unsec. Global Notes,
2.50%, 08/15/15 | | | 20,000 | | | | 20,742 | |
| |
| 5.35%, 09/01/40 | | | 101,000 | | | | 113,674 | |
| |
| 6.15%, 09/15/34 | | | 140,000 | | | | 167,305 | |
| |
| Deutsche Telekom International Finance B.V. (Netherlands), Sr. Unsec. Gtd. Global Bonds, 8.75%, 06/15/30 | | | 155,000 | | | | 216,626 | |
| |
| Telecom Italia Capital S.A. (Luxembourg), Sr. Unsec. Gtd. Global Notes, 7.00%, 06/04/18 | | | 520,000 | | | | 482,505 | |
| |
Verizon Communications, Inc., Sr. Unsec. Global Notes,
3.00%, 04/01/16 | | | 230,000 | | | | 242,576 | |
| |
| 4.75%, 11/01/41 | | | 210,000 | | | | 227,965 | |
| |
| 6.35%, 04/01/19 | | | 260,000 | | | | 321,226 | |
| |
| 8.95%, 03/01/39 | | | 300,000 | | | | 482,854 | |
| |
| Windstream Georgia Communications Corp., Sr. Unsec. Notes, 6.50%, 11/15/13 | | | 39,000 | | | | 39,993 | |
| |
| | | | | | | | 2,321,132 | |
| |
Internet Retail–0.06%
| | | | |
| Expedia Inc., Sr. Unsec. Gtd. Global Notes, 5.95%, 08/15/20 | | | 505,000 | | | | 510,786 | |
| |
Investment Banking & Brokerage–0.84%
| | | | |
| Charles Schwab Corp. (The), Sr. Unsec. Notes, 4.45%, 07/22/20 | | | 510,000 | | | | 544,997 | |
| |
Goldman Sachs Group, Inc. (The), Series C,
Exchangeable Basket-Linked Medium-Term Notes, 1.00%, 03/15/17(d)(k) | | | 3,328,000 | | | | 2,948,874 | |
| |
Sr. Unsec. Global Notes,
3.70%, 08/01/15 | | | 65,000 | | | | 63,684 | |
| |
| 5.25%, 07/27/21 | | | 400,000 | | | | 391,965 | |
| |
| 6.15%, 04/01/18 | | | 905,000 | | | | 931,142 | |
| |
Unsec. Sub. Global Notes, 6.75%, 10/01/37 | | | 385,000 | | | | 362,038 | |
| |
| Jefferies Group, Inc., Sr. Unsec. Notes, 6.88%, 04/15/21 | | | 440,000 | | | | 399,300 | |
| |
Macquarie Group Ltd. (Australia), Sr. Unsec. Notes, 6.00%, 01/14/20(d) | | | 50,000 | | | | 47,199 | |
| |
Morgan Stanley,
Sr. Unsec. Global Notes, | | | | | | | | |
| 3.80%, 04/29/16 | | | 700,000 | | | | 646,385 | |
| |
| 4.00%, 07/24/15 | | | 610,000 | | | | 573,433 | |
| |
Sr. Unsec. Notes,
3.45%, 11/02/15 | | | 715,000 | | | | 657,672 | |
| |
| 5.75%, 01/25/21 | | | 220,000 | | | | 204,901 | |
| |
| | | | | | | | 7,771,590 | |
| |
Life & Health Insurance–0.17%
| | | | |
| Aegon N.V. (Netherlands), Sr. Unsec. Global Bonds, 4.63%, 12/01/15 | | | 275,000 | | | | 284,948 | |
| |
| MetLife, Inc., Sr. Unsec. Global Notes, 4.75%, 02/08/21 | | | 410,000 | | | | 443,701 | |
| |
Pacific LifeCorp., Sr. Unsec. Notes, 6.00%, 02/10/20(d) | | | 215,000 | | | | 230,948 | |
| |
Prudential Financial, Inc.,
Series D,
Sr. Unsec. Disc. Medium-Term Notes, 4.75%, 09/17/15 | | | 255,000 | | | | 269,990 | |
| |
Sr. Unsec. Medium-Term Notes,
3.88%, 01/14/15 | | | 50,000 | | | | 51,788 | |
| |
| 6.63%, 12/01/37 | | | 110,000 | | | | 119,988 | |
| |
| 7.38%, 06/15/19 | | | 105,000 | | | | 125,094 | |
| |
| | | | | | | | 1,526,457 | |
| |
Life Sciences Tools & Services–0.34%
| | | | |
Life Technologies Corp., Sr. Unsec. Conv. Notes, 1.50%, 02/15/12(c) | | | 3,143,000 | | | | 3,158,715 | |
| |
Managed Health Care–0.12%
| | | | |
| Aetna, Inc., Sr. Unsec. Global Notes, 3.95%, 09/01/20 | | | 605,000 | | | | 632,818 | |
| |
| WellPoint, Inc., Sr. Unsec. Notes, 4.35%, 08/15/20 | | | 400,000 | | | | 434,855 | |
| |
| | | | | | | | 1,067,673 | |
| |
Mortgage Backed Securities–0.01%
| | | | |
| U.S. Bank N.A., Sr. Unsec. Medium-Term Notes, 5.92%, 05/25/12 | | | 59,456 | | | | 60,645 | |
| |
| | | | | | | | | |
| | | | | | | | | |
See accompanying Notes to Financial Statements which are an integral part of the financial statements.
Invesco Van Kampen V.I. Equity and Income Fund
| | | | | | | | | |
| | | Principal
| | |
| | | Amount | | Value |
| |
Movies & Entertainment–0.34%
| | | | |
Liberty Media LLC, Sr. Unsec. Conv. Notes, 3.13%, 03/30/13(c) | | $ | 2,627,200 | | | $ | 2,952,316 | |
| |
| Time Warner, Inc., Sr. Unsec. Gtd. Notes, 5.88%, 11/15/16 | | | 130,000 | | | | 150,378 | |
| |
| | | | | | | | 3,102,694 | |
| |
Multi-Line Insurance–0.04%
| | | | |
| CNA Financial Corp., Sr. Unsec. Global Bonds, 5.88%, 08/15/20 | | | 325,000 | | | | 337,091 | |
| |
Liberty Mutual Group Inc., Sr. Unsec. Notes, 5.75%, 03/15/14(d) | | | 45,000 | | | | 47,103 | |
| |
| | | | | | | | 384,194 | |
| |
Multi-Utilities–0.02%
| | | | |
| Nisource Finance Corp., Sr. Unsec. Gtd. Bonds, 6.80%, 01/15/19 | | | 115,000 | | | | 134,656 | |
| |
Office Electronics–0.00%
| | | | |
| Xerox Corp., Sr. Unsec. Notes, 4.25%, 02/15/15 | | | 40,000 | | | | 42,273 | |
| |
Office REIT’s–0.04%
| | | | |
| Digital Realty Trust L.P., Sr. Unsec. Gtd. Global Notes, 4.50%, 07/15/15 | | | 335,000 | | | | 341,918 | |
| |
Oil & Gas Equipment & Services–0.13%
| | | | |
Helix Energy Solutions Group, Inc., Sr. Unsec. Conv. Notes, 3.25%, 12/15/12(c) | | | 1,208,000 | | | | 1,217,060 | |
| |
Oil & Gas Exploration & Production–0.05%
| | | | |
| Petrobras International Finance Co. (Brazil), Sr. Unsec. Gtd. Global Notes, 6.88%, 01/20/40 | | | 15,000 | | | | 17,224 | |
| |
| Petroleos Mexicanos (Mexico), Sr. Unsec. Gtd. Global Notes, 5.50%, 01/21/21 | | | 395,000 | | | | 429,088 | |
| |
| | | | | | | | 446,312 | |
| |
Oil & Gas Storage & Transportation–0.10%
| | | | |
Enterprise Products Operating LLC,
Sr. Unsec. Gtd. Global Notes, 5.25%, 01/31/20 | | | 115,000 | | | | 127,305 | |
| |
Sr. Unsec. Gtd. Notes, 6.45%, 09/01/40 | | | 25,000 | | | | 29,337 | |
| |
Series N, Sr. Unsec. Gtd. Notes, 6.50%, 01/31/19 | | | 245,000 | | | | 286,338 | |
| |
Spectra Energy Capital LLC, Sr. Unsec. Gtd. Notes,
5.65%, 03/01/20 | | | 50,000 | | | | 55,500 | |
| |
| 7.50%, 09/15/38 | | | 120,000 | | | | 154,583 | |
| |
| Texas Eastern Transmission L.P., Sr. Unsec. Notes, 7.00%, 07/15/32 | | | 185,000 | | | | 235,307 | |
| |
| | | | | | | | 888,370 | |
| |
Other Diversified Financial Services–0.92%
| | | | |
Bank of America Corp.,
Sr. Unsec. Global Notes, 5.75%, 12/01/17 | | | 975,000 | | | | 933,724 | |
| |
Series L, Sr. Unsec. Medium-Term Global Notes, 5.65%, 05/01/18 | | | 350,000 | | | | 334,327 | |
| |
| Bear Stearns Cos., LLC (The), Sr. Unsec. Global Notes, 7.25%, 02/01/18 | | | 340,000 | | | | 398,692 | |
| |
| Citigroup Funding, Inc., Unsec. Gtd. Unsub. Global Notes, 2.25%, 12/10/12 | | | 3,450,000 | | | | 3,515,459 | |
| |
| Citigroup, Inc., | | | | | | | | |
Sr. Unsec. Global Notes,
6.01%, 01/15/15 | | | 65,000 | | | | 68,179 | |
| |
| 6.13%, 11/21/17 | | | 495,000 | | | | 529,320 | |
| |
| 8.50%, 05/22/19 | | | 455,000 | | | | 540,276 | |
| |
Sr. Unsec. Notes, 4.75%, 05/19/15 | | | 75,000 | | | | 76,362 | |
| |
ERAC USA Finance LLC, Sr. Unsec. Gtd. Notes, 2.75%, 07/01/13(d) | | | 340,000 | | | | 344,228 | |
| |
| General Electric Capital Corp., Sr. Unsec. Global Notes, 5.90%, 05/13/14 | | | 75,000 | | | | 82,330 | |
| |
| JPMorgan Chase & Co., | | | | | | | | |
Sr. Unsec. Global Notes,
4.40%, 07/22/20 | | | 400,000 | | | | 401,681 | |
| |
| 4.75%, 05/01/13 | | | 65,000 | | | | 67,993 | |
| |
Sr. Unsec. Notes, 6.00%, 01/15/18 | | | 615,000 | | | | 688,460 | |
| |
Unsec. Sub. Global Notes, 5.13%, 09/15/14 | | | 70,000 | | | | 73,885 | |
| |
| Merrill Lynch & Co., Inc., Sr. Unsec. Medium-Term Notes, 6.88%, 04/25/18 | | | 410,000 | | | | 405,104 | |
| |
Twin Reefs Pass-Through Trust, Sec. Floating Rate Pass Through Ctfs., 1.39% (Acquired 12/07/04; Cost $90,000)(d)(e)(f)(g) | | | 90,000 | | | | 0 | |
| |
| | | | | | | | 8,460,020 | |
| |
Packaged Foods & Meats–0.13%
| | | | |
Grupo Bimbo S.A.B. de C.V. (Mexico), Sr. Unsec. Gtd. Notes, 4.88%, 06/30/20(d) | | | 270,000 | | | | 284,700 | |
| |
| Kraft Foods, Inc., | | | | | | | | |
| Sr. Unsec. Global Notes, | | | | | | | | |
| 5.38%, 02/10/20 | | | 215,000 | | | | 248,385 | |
| |
| 7.00%, 08/11/37 | | | 305,000 | | | | 407,565 | |
| |
Sr. Unsec. Notes, 6.88%, 01/26/39 | | | 200,000 | | | | 264,618 | |
| |
| | | | | | | | 1,205,268 | |
| |
Paper Products–0.03%
| | | | |
| International Paper Co., Sr. Unsec. Global Notes, 6.00%, 11/15/41 | | | 285,000 | | | | 310,744 | |
| |
Pharmaceuticals–0.74%
| | | | |
| Endo Pharmaceuticals Holdings Inc., Sr. Unsec. Sub. Conv. Notes, 1.75%, 04/15/15 | | | 2,398,000 | | | | 3,150,372 | |
| |
GlaxoSmithKline Capital Inc., Sr. Unsec. Gtd. Global Bonds,
5.65%, 05/15/18 | | | 75,000 | | | | 90,569 | |
| |
| 6.38%, 05/15/38 | | | 70,000 | | | | 93,530 | |
| |
| Merck & Co. Inc., Sr. Unsec. Global Notes, 5.00%, 06/30/19 | | | 280,000 | | | | 330,848 | |
| |
| Pfizer Inc., Sr. Unsec. Global Notes, 6.20%, 03/15/19 | | | 650,000 | | | | 805,464 | |
| |
| Salix Pharmaceuticals Ltd., Sr. Unsec. Conv. Notes, 2.75%, 05/15/15 | | | 1,835,000 | | | | 2,383,206 | |
| |
| | | | | | | | 6,853,989 | |
| |
| | | | | | | | | |
| | | | | | | | | |
See accompanying Notes to Financial Statements which are an integral part of the financial statements.
Invesco Van Kampen V.I. Equity and Income Fund
| | | | | | | | | |
| | | Principal
| | |
| | | Amount | | Value |
| |
Property & Casualty Insurance–0.03%
| | | | |
| CNA Financial Corp., Sr. Unsec. Notes, 7.35%, 11/15/19 | | $ | 25,000 | | | $ | 27,905 | |
| |
| Travelers Cos., Inc. (The), Sr. Unsec. Notes, 5.35%, 11/01/40 | | | 205,000 | | | | 238,775 | |
| |
| | | | | | | | 266,680 | |
| |
Railroads–0.07%
| | | | |
CSX Corp.,
Sr. Unsec. Global Notes, 6.15%, 05/01/37 | | | 80,000 | | | | 96,529 | |
| |
Sr. Unsec. Notes, 5.50%, 04/15/41 | | | 380,000 | | | | 429,980 | |
| |
| Union Pacific Corp., Sr. Unsec. Notes, 6.13%, 02/15/20 | | | 110,000 | | | | 134,886 | |
| |
| | | | | | | | 661,395 | |
| |
Regional Banks–0.18%
| | | | |
| Key Bank NA, Sr. Unsec. Gtd. Global Notes, 3.20%, 06/15/12 | | | 500,000 | | | | 506,563 | |
| |
Nationwide Building Society (United Kingdom), Sr. Unsec. Notes, 6.25%, 02/25/20(d) | | | 485,000 | | | | 482,075 | |
| |
| PNC Funding Corp., | | | | | | | | |
Sr. Unsec. Gtd. Global Notes,
3.63%, 02/08/15 | | | 40,000 | | | | 42,192 | |
| |
| 5.13%, 02/08/20 | | | 360,000 | | | | 407,861 | |
| |
Sr. Unsec. Gtd. Notes, 6.70%, 06/10/19 | | | 185,000 | | | | 225,186 | |
| |
| | | | | | | | 1,663,877 | |
| |
Restaurants–0.04%
| | | | |
Yum! Brands, Inc.,
Sr. Unsec. Global Bonds, 6.25%, 03/15/18 | | | 110,000 | | | | 128,989 | |
| |
Sr. Unsec. Notes, 5.30%, 09/15/19 | | | 175,000 | | | | 196,836 | |
| |
| | | | | | | | 325,825 | |
| |
Retail REIT’s–0.03%
| | | | |
WEA Finance LLC, Sr. Unsec. Gtd. Notes, 7.13%, 04/15/18(d) | | | 270,000 | | | | 301,543 | |
| |
Semiconductor Equipment–0.18%
| | | | |
Novellus Systems Inc., Sr. Unsec. Conv. Notes, 2.63%, 05/15/41(d) | | | 1,399,000 | | | | 1,682,298 | |
| |
Semiconductors–0.74%
| | | | |
Linear Technology Corp.,
Sr. Unsec. Conv. Notes, 3.00%, 05/01/14(c)(d) | | | 1,193,000 | | | | 1,224,316 | |
| |
Series A, Sr. Unsec. Conv. Global Notes, 3.00%, 05/01/14(c) | | | 1,481,000 | | | | 1,519,877 | |
| |
Micron Technology Inc., Series A, Sr. Unsec. Conv. Notes, 1.50%, 08/01/18(c)(d) | | | 2,106,000 | | | | 1,900,665 | |
| |
Xilinx Inc., Jr. Unsec. Conv. Sub. Notes,
3.13%, 03/15/37 | | | 635,000 | | | | 723,900 | |
| |
3.13%, 03/15/37(d) | | | 1,302,000 | | | | 1,484,280 | |
| |
| | | | | | | | 6,853,038 | |
| |
Sovereign Debt–0.05%
| | | | |
| Brazilian Government International Bond (Brazil), Sr. Unsec. Global Bonds, 6.00%, 01/17/17 | | | 100,000 | | | | 117,600 | |
| |
| Peruvian Government International Bond (Peru), Sr. Unsec. Global Notes, 7.13%, 03/30/19 | | | 10,000 | | | | 12,587 | |
| |
| Republic of Italy (Italy), Sr. Unsec. Global Notes, 6.88%, 09/27/23 | | | 320,000 | | | | 309,077 | |
| |
| | | | | | | | 439,264 | |
| |
Specialized REIT’s–0.05%
| | | | |
| Senior Housing Properties Trust, Sr. Unsec. Notes, 4.30%, 01/15/16 | | | 495,000 | | | | 486,028 | |
| |
Steel–0.18%
| | | | |
ArcelorMittal (Luxembourg),
Sr. Unsec. Global Bonds, 9.85%, 06/01/19 | | | 446,000 | | | | 494,472 | |
| |
Sr. Unsec. Global Notes,
3.75%, 08/05/15 | | | 585,000 | | | | 556,374 | |
| |
| 5.50%, 03/01/21 | | | 85,000 | | | | 78,226 | |
| |
| 6.13%, 06/01/18 | | | 15,000 | | | | 15,270 | |
| |
| 6.75%, 03/01/41 | | | 85,000 | | | | 76,538 | |
| |
| 7.00%, 10/15/39 | | | 40,000 | | | | 37,133 | |
| |
Vale Overseas Ltd. (Brazil), Sr. Unsec. Gtd. Global Notes,
5.63%, 09/15/19 | | | 185,000 | | | | 203,722 | |
| |
| 4.63%, 09/15/20 | | | 20,000 | | | | 20,750 | |
| |
| 6.88%, 11/10/39 | | | 185,000 | | | | 213,470 | |
| |
| | | | | | | | 1,695,955 | |
| |
Systems Software–0.24%
| | | | |
| Symantec Corp., Class B, Sr. Unsec. Conv. Global Notes, 1.00%, 06/15/13 | | | 1,970,000 | | | | 2,203,938 | |
| |
Technology Distributors–0.01%
| | | | |
| Avnet Inc., Sr. Unsec. Notes, 5.88%, 06/15/20 | | | 50,000 | | | | 53,017 | |
| |
Thrifts & Mortgage Finance–0.19%
| | | | |
| MGIC Investment Corp., Sr. Unsec. Conv. Notes, 5.00%, 05/01/17 | | | 2,943,000 | | | | 1,784,194 | |
| |
Tobacco–0.00%
| | | | |
| Altria Group, Inc., Sr. Unsec. Gtd. Global Notes, 4.13%, 09/11/15 | | | 35,000 | | | | 38,000 | |
| |
Trading Companies & Distributors–0.00%
| | | | |
| GATX Corp., Sr. Unsec. Notes, 4.75%, 10/01/12 | | | 20,000 | | | | 20,375 | |
| |
Trucking–0.03%
| | | | |
| Ryder System, Inc., Sr. Unsec. Medium-Term Notes, 3.15%, 03/02/15 | | | 280,000 | | | | 287,684 | |
| |
| | | | | | | | | |
| | | | | | | | | |
See accompanying Notes to Financial Statements which are an integral part of the financial statements.
Invesco Van Kampen V.I. Equity and Income Fund
| | | | | | | | | |
| | | Principal
| | |
| | | Amount | | Value |
| |
Wireless Telecommunication Services–0.48%
| | | | |
| America Movil S.A.B. de C.V. (Mexico), Unsec. Gtd. Unsub. Global Notes, 2.38%, 09/08/16 | | $ | 255,000 | | | $ | 252,125 | |
| |
American Tower Corp.,
Sr. Unsec. Global Notes, 4.63%, 04/01/15 | | | 170,000 | | | | 178,108 | |
| |
Sr. Unsec. Notes, 4.50%, 01/15/18 | | | 320,000 | | | | 326,569 | |
| |
Crown Castle Towers LLC, Sr. Sec. Gtd. Notes, 3.21%, 08/15/15(d) | | | 370,000 | | | | 375,550 | |
| |
| SBA Communications Corp., Sr. Unsec. Conv. Notes, 1.88%, 05/01/13 | | | 2,909,000 | | | | 3,298,078 | |
| |
| | | | | | | | 4,430,430 | |
| |
| Total Bonds and Notes (Cost $162,727,020) | | | | | | | 167,411,553 | |
| |
U.S. Treasury Securities–8.01%
|
U.S. Treasury Bills–0.12%
| | | | |
0.75%, 05/31/12(h) | | | 800,000 | | | | 802,258 | |
| |
0.00%, 11/15/12(h)(i) | | | 340,000 | | | | 339,744 | |
| |
| | | | | | | | 1,142,002 | |
| |
U.S. Treasury Notes–5.18%
| | | | |
| 0.88%, 02/29/12 | | | 500,000 | | | | 500,625 | |
| |
| 1.00%, 04/30/12 | | | 400,000 | | | | 401,254 | |
| |
| 1.38%, 09/15/12 | | | 1,700,000 | | | | 1,714,941 | |
| |
| 1.50%, 12/31/13 | | | 1,085,000 | | | | 1,111,955 | |
| |
| 1.75%, 03/31/14 | | | 2,300,000 | | | | 2,375,469 | |
| |
| 2.63%, 07/31/14 | | | 1,100,000 | | | | 1,164,625 | |
| |
| 2.38%, 10/31/14 | | | 15,720,000 | | | | 16,606,706 | |
| |
| 2.13%, 11/30/14 | | | 5,250,000 | | | | 5,514,961 | |
| |
| 2.25%, 01/31/15 | | | 6,000,000 | | | | 6,338,438 | |
| |
| 2.50%, 03/31/15 | | | 275,000 | | | | 293,262 | |
| |
| 2.13%, 05/31/15 | | | 680,000 | | | | 717,931 | |
| |
| 2.25%, 03/31/16 | | | 2,000,000 | | | | 2,133,750 | |
| |
| 2.63%, 04/30/16 | | | 2,000,000 | | | | 2,163,750 | |
| |
| 4.00%, 08/15/18 | | | 3,055,000 | | | | 3,598,217 | |
| |
| 3.63%, 08/15/19 | | | 1,525,000 | | | | 1,766,379 | |
| |
| 3.38%, 11/15/19 | | | 300,000 | | | | 342,047 | |
| |
| 3.63%, 02/15/20 | | | 46,000 | | | | 53,353 | |
| |
| 2.63%, 11/15/20 | | | 600,000 | | | | 646,125 | |
| |
| 2.13%, 08/15/21 | | | 175,000 | | | | 179,457 | |
| |
| 3.88%, 08/15/40 | | | 20,000 | | | | 23,956 | |
| |
| | | | | | | | 47,647,201 | |
| |
U.S. Treasury Bonds–2.71%
| | | | |
| 8.13%, 08/15/21 | | | 2,700,000 | | | | 4,229,297 | |
| |
| 6.63%, 02/15/27 | | | 2,500,000 | | | | 3,847,656 | |
| |
| 5.38%, 02/15/31 | | | 8,995,000 | | | | 12,824,903 | |
| |
| 4.25%, 05/15/39 | | | 805,000 | | | | 1,023,356 | |
| |
| 4.50%, 08/15/39 | | | 40,000 | | | | 52,856 | |
| |
| 4.63%, 02/15/40 | | | 250,000 | | | | 336,914 | |
| |
| 4.38%, 05/15/40 | | | 80,000 | | | | 103,850 | |
| |
| 4.25%, 11/15/40 | | | 2,000,000 | | | | 2,548,750 | |
| |
| | | | | | | | 24,967,582 | |
| |
| Total U.S. Treasury Securities (Cost $66,209,634) | | | 73,756,785 | |
| |
| | | | | | | | | |
| | | Shares | | |
Preferred Stocks–1.60%
|
Health Care Facilities–0.17%
| | | | |
| HealthSouth Corp., Series A, $65.00 Conv. Pfd. | | | 1,785 | | | | 1,566,784 | |
| |
Health Care Services–0.13%
| | | | |
| Omnicare Capital Trust II, Series B, $2.00 Conv. Pfd. | | | 26,407 | | | | 1,196,765 | |
| |
Multi-Utilities–0.23%
| | | | |
| CenterPoint Energy, Inc., $1.88 Conv. Pfd. | | | 62,215 | | | | 2,134,752 | |
| |
Oil & Gas Storage & Transportation–0.48%
| | | | |
| El Paso Energy Captial Trust I, $2.38 Conv. Pfd | | | 95,499 | | | | 4,396,774 | |
| |
Regional Banks–0.35%
| | | | |
| KeyCorp, Series A, $7.75 Conv. Pfd. | | | 30,290 | | | | 3,199,836 | |
| |
Research & Consulting Services–0.05%
| | | | |
| Nielsen Holdings N.V. (Netherlands), $3.13 Conv. Pfd. | | | 7,510 | | | | 436,049 | |
| |
Trucking–0.19%
| | | | |
2010 Swift Mandatory Common Exchange Security Trust, $0.66 Conv. Pfd.(d) | | | 199,220 | | | | 1,756,363 | |
| |
| Total Preferred Stocks (Cost $12,665,371) | | | | | | | 14,687,323 | |
| |
| | | | | | | | | |
| | | Principal
| | |
| | | Amount | | |
U.S. Government Sponsored Agency Securities–0.81%
|
Federal Home Loan Mortgage Corp. (FHLMC)–0.59%
| | | | |
Sr. Unsec. Global Bonds, 6.75%, 03/15/31 | | $ | 750,000 | | | | 1,130,493 | |
| |
| Sr. Unsec. Global Notes, | | | | | | | | |
| 3.00%, 07/28/14 | | | 1,020,000 | | | | 1,084,621 | |
| |
| 5.00%, 04/18/17 | | | 1,500,000 | | | | 1,786,575 | |
| |
| 5.50%, 08/23/17 | | | 140,000 | | | | 171,535 | |
| |
Unsec. Global Notes, 4.88%, 06/13/18 | | | 1,000,000 | | | | 1,207,614 | |
| |
| | | | | | | | 5,380,838 | |
| |
| | | | | | | | | |
| | | | | | | | | |
See accompanying Notes to Financial Statements which are an integral part of the financial statements.
Invesco Van Kampen V.I. Equity and Income Fund
| | | | | | | | | |
| | | Principal
| | |
| | | Amount | | Value |
| |
Federal National Mortgage Association (FNMA)–0.22%
| | | | |
Sr. Unsec. Global Notes, 4.38%, 10/15/15 | | $ | 1,700,000 | | | $ | 1,922,832 | |
| |
Unsec. Global Notes, 2.63%, 11/20/14 | | | 130,000 | | | | 137,619 | |
| |
| | | | | | | | 2,060,451 | |
| |
| Total U.S. Government Sponsored Agency Securities (Cost $6,725,898) | | | | | | | 7,441,289 | |
| |
Municipal Obligation–0.03%
|
| Texas (State of) Transportation Commission; Series 2010 B, Taxable First Tier Build America RB, 5.03%, 04/01/26 (Cost $240,000) | | | 240,000 | | | | 280,277 | |
| |
Asset-Backed Securities–0.00%
|
Countrywide Asset-Backed Ctfs., Series 2007-4, Class A1B, Pass Through Ctfs., 5.81%, 09/25/37 (Cost $20,717) | | | 21,140 | | | | 20,763 | |
| |
U.S. Government Sponsored Mortgage-Backed Securities–0.00%
|
Federal Home Loan Mortgage Corp. (FHLMC)–0.00%
| | | | |
Pass Through Ctfs.,
6.50%, 02/01/26 | | | 6,267 | | | | 7,093 | |
| |
| 5.50%, 02/01/37 | | | 589 | | | | 640 | |
| |
| | | | | | | | 7,733 | |
| |
Federal National Mortgage Association (FNMA)–0.00%
| | | | |
Pass Through Ctfs.,
6.00%, 01/01/17 | | | 1,483 | | | | 1,604 | |
| |
| 5.50%, 03/01/21 | | | 600 | | | | 652 | |
| |
| 8.00%, 08/01/21 | | | 5,019 | | | | 5,672 | |
| |
| 9.50%, 04/01/30 | | | 11,520 | | | | 13,791 | |
| |
| | | | | | | | 21,719 | |
| |
| Total U.S. Government Sponsored Mortgage-Backed Securities (Cost $27,082) | | | | | | | 29,452 | |
| |
| | | | | | | | | |
| | | Shares | | |
Money Market Funds–8.42%
|
Liquid Assets Portfolio–Institutional Class(j) | | | 38,771,398 | | | | 38,771,398 | |
| |
Premier Portfolio–Institutional Class(j) | | | 38,771,397 | | | | 38,771,397 | |
| |
| Total Money Market Funds (Cost $77,542,795) | | | | | | | 77,542,795 | |
| |
| TOTAL INVESTMENTS–99.55% (Cost $855,694,334) | | | | | | | 916,650,169 | |
| |
| OTHER ASSETS LESS LIABILITIES–0.45% | | | | | | | 4,119,123 | |
| |
| NET ASSETS–100.00% | | | | | | $ | 920,769,292 | |
| |
Investment Abbreviations:
| | | |
| ADR | | – American Depositary Receipt |
| Ctfs. | | – Certificates |
| Deb. | | – Debentures |
| ETF | | – Exchange-Traded Fund |
| Gtd. | | – Guaranteed |
| Jr. | | – Junior |
| Pfd. | | – Preferred |
| RB | | – Revenue Bonds |
| REIT | | – Real Estate Investment Trust |
| Sec. | | – Secured |
| SPDR | | – Standard & Poor’s Depositary Receipt |
| Sr. | | – Senior |
| Sub. | | – Subordinated |
| Unsec. | | – Unsecured |
| Unsub. | | – Unsubordinated |
Notes to Schedule of Investments:
| | |
| (a) | | Industry and/or sector classifications used in this report are generally according to the Global Industry Classification Standard, which was developed by and is the exclusive property and a service mark of MSCI Inc. and Standard & Poor’s. |
| (b) | | Non-income producing security. |
| (c) | | Security has an irrevocable call by the issuer or mandatory put by the holder. Maturity date reflects such call or put. |
| (d) | | Security purchased or received in a transaction exempt from registration under the Securities Act of 1933, as amended. The security may be resold pursuant to an exemption from registration under the 1933 Act, typically to qualified institutional buyers. The aggregate value of these securities at December 31, 2011 was $27,291,795, which represented 2.96% of the Fund’s Net Assets. |
| (e) | | Interest or dividend rate is redetermined periodically. Rate shown is the rate in effect on December 31, 2011. |
| (f) | | Perpetual bond with no specified maturity date. |
| (g) | | Defaulted security. Currently, the issuer is partially or fully in default with respect to interest payments. The value of this security at December 31, 2011 represented 0.00% of the Fund’s Net Assets. |
| (h) | | Security traded on a discount basis. The interest rate shown represents the discount rate at the time of purchase by the Fund. |
| (i) | | All or a portion of the value was pledged as collateral to cover margin requirements for open future contracts. See Note 1K and Note 4. |
| (j) | | The money market fund and the Fund are affiliated by having the same investment adviser. |
| (k) | | Exchangeable for a basket of four common stocks and one ordinary share. |
See accompanying Notes to Financial Statements which are an integral part of the financial statements.
Invesco Van Kampen V.I. Equity and Income Fund
Statement of Assets and Liabilities
December 31, 2011
| | | | | |
Assets:
|
| Investments, at value (Cost $778,151,539) | | $ | 839,107,374 | |
| |
| Investments in affiliated money market funds, at value and cost | | | 77,542,795 | |
| |
| Total investments, at value (Cost $855,694,334) | | | 916,650,169 | |
| |
| Receivable for: | | | | |
| Investments sold | | | 689,048 | |
| |
| Fund shares sold | | | 470,500 | |
| |
| Dividends and interest | | | 3,489,270 | |
| |
| Foreign currency contracts outstanding | | | 804,281 | |
| |
| Investment for trustee deferred compensation and retirement plans | | | 43,682 | |
| |
| Other assets | | | 353 | |
| |
| Total assets | | | 922,147,303 | |
| |
Liabilities:
|
| Payable for: | | | | |
| Investments purchased | | | 197,787 | |
| |
| Fund shares reacquired | | | 207,869 | |
| |
| Variation margin | | | 35,312 | |
| |
| Accrued fees to affiliates | | | 786,293 | |
| |
| Accrued other operating expenses | | | 71,355 | |
| |
| Trustee deferred compensation and retirement plans | | | 79,395 | |
| |
| Total liabilities | | | 1,378,011 | |
| |
| Net assets applicable to shares outstanding | | $ | 920,769,292 | |
| |
Net assets consist of:
|
| Shares of beneficial interest | | $ | 903,438,850 | |
| |
| Undistributed net investment income | | | 14,245,911 | |
| |
| Undistributed net realized gain (loss) | | | (58,357,895 | ) |
| |
| Unrealized appreciation | | | 61,442,426 | |
| |
| | | $ | 920,769,292 | |
| |
Net Assets:
|
| Series I | | $ | 56,052,931 | |
| |
| Series II | | $ | 864,716,361 | |
| |
Shares outstanding, $0.001 par value per share, with an unlimited number of shares authorized:
|
| Series I | | | 4,107,283 | |
| |
| Series II | | | 63,423,964 | |
| |
| Series I: | | | | |
| Net asset value per share | | $ | 13.65 | |
| |
| Series II: | | | | |
| Net asset value per share | | $ | 13.63 | |
| |
Statement of Operations
For the year ended December 31, 2011
| | | | | |
Investment income:
|
| Dividends (net of foreign withholding taxes of $173,888) | | $ | 14,689,144 | |
| |
| Dividends from affiliated money market funds | | | 52,874 | |
| |
| Interest | | | 7,380,724 | |
| |
| Total investment income | | | 22,122,742 | |
| |
Expenses:
|
| Advisory fees | | | 3,489,069 | |
| |
| Administrative services fees | | | 2,285,988 | |
| |
| Custodian fees | | | 47,443 | |
| |
| Distribution fees — Series II | | | 2,124,156 | |
| |
| Transfer agent fees | | | 22,602 | |
| |
| Trustees’ and officers’ fees and benefits | | | 53,807 | |
| |
| Other | | | 25,988 | |
| |
| Total expenses | | | 8,049,053 | |
| |
| Less: Fees waived | | | (1,770,715 | ) |
| |
| Net expenses | | | 6,278,338 | |
| |
| Net investment income | | | 15,844,404 | |
| |
Realized and unrealized gain (loss) from:
|
| Net realized gain (loss) from: | | | | |
| Investment securities | | | 6,739,566 | |
| |
| Foreign currencies | | | (3,790 | ) |
| |
| Foreign currency contracts | | | 969,174 | |
| |
| Futures contracts | | | (1,646,373 | ) |
| |
| | | | 6,058,577 | |
| |
| Change in net unrealized appreciation (depreciation) of: | | | | |
| Investment securities | | | (41,894,394 | ) |
| |
| Foreign currencies | | | (6 | ) |
| |
| Foreign currency contracts | | | 804,281 | |
| |
| Futures contracts | | | (911,720 | ) |
| |
| | | | (42,001,839 | ) |
| |
| Net realized and unrealized gain (loss) | | | (35,943,262 | ) |
| |
| Net increase (decrease) in net assets resulting from operations | | $ | (20,098,858 | ) |
| |
See accompanying Notes to Financial Statements which are an integral part of the financial statements.
Invesco Van Kampen V.I. Equity and Income Fund
Statement of Changes in Net Assets
For the years ended December 31, 2011 and 2010
| | | | | | | | | |
| | | 2011 | | 2010 |
| |
Operations:
|
| Net investment income | | $ | 15,844,404 | | | $ | 12,050,632 | |
| |
| Net realized gain | | | 6,058,577 | | | | 23,430,319 | |
| |
| Change in net unrealized appreciation (depreciation) | | | (42,001,839 | ) | | | 48,708,386 | |
| |
| Net increase (decrease) in net assets resulting from operations | | �� | (20,098,858 | ) | | | 84,189,337 | |
| |
Distributions to shareholders from net investment income:
|
| Series I | | | (166,703 | ) | | | — | |
| |
| Series II | | | (14,481,929 | ) | | | (13,994,794 | ) |
| |
| Total distributions from net investment income | | | (14,648,632 | ) | | | (13,994,794 | ) |
| |
Share transactions–net:
|
| Series I | | | 61,606,856 | | | | 44,483 | |
| |
| Series II | | | 93,450,310 | | | | 57,438,806 | |
| |
| Net increase in net assets resulting from share transactions | | | 155,057,166 | | | | 57,483,289 | |
| |
| Net increase in net assets | | | 120,309,676 | | | | 127,677,832 | |
| |
Net assets:
|
| Beginning of year | | | 800,459,616 | | | | 672,781,784 | |
| |
| End of year (includes undistributed net investment income of $14,245,911 and $12,043,490, respectively) | | $ | 920,769,292 | | | $ | 800,459,616 | |
| |
Notes to Financial Statements
December 31, 2011
NOTE 1—Significant Accounting Policies
Invesco Van Kampen V.I. Equity and Income Fund (the “Fund”) is a series portfolio of AIM Variable Insurance Funds (Invesco Variable Insurance Funds) (the “Trust”). The Trust is a Delaware statutory trust registered under the Investment Company Act of 1940, as amended (the “1940 Act”), as an open-end series management investment company consisting of twenty-eight separate portfolios, (each constituting a “Fund”). The assets, liabilities and operations of each portfolio are accounted for separately. Information presented in these financial statements pertains only to the Fund. Matters affecting each Fund or class will be voted on exclusively by the shareholders of such Fund or class. Current Securities and Exchange Commission (“SEC”) guidance, however, requires participating insurance companies offering separate accounts to vote shares proportionally in accordance with the instructions of the contract owners whose investments are funded by shares of each Fund or class.
The Fund’s investment objectives are both capital appreciation and current income.
The Fund currently offers two classes of shares, Series I and Series II, both of which are offered to insurance company separate accounts funding variable annuity contracts and variable life insurance policies (“variable products”).
The following is a summary of the significant accounting policies followed by the Fund in the preparation of its financial statements.
| | |
| A. | | Security Valuations — Securities, including restricted securities, are valued according to the following policy. |
| | Debt obligations (including convertible bonds) and unlisted equities are fair valued using an evaluated quote provided by an independent pricing service. Evaluated quotes provided by the pricing service may be determined without exclusive reliance on quoted prices, and may reflect appropriate factors such as institution-size trading in similar groups of securities, developments related to specific securities, dividend rate, yield, quality, type of issue, coupon rate, maturity, individual trading characteristics and other market data. Debt securities are subject to interest rate and credit risks. In addition, all debt securities involve some risk of default with respect to interest and/or principal payments. |
| | A security listed or traded on an exchange (except convertible bonds) is valued at its last sales price or official closing price as of the close of the customary trading session on the exchange where the security is principally traded, or lacking any sales or official closing price on a particular day, the security may be valued at the closing bid price on that day. Securities traded in the over-the-counter market are valued based on prices furnished by independent pricing services or market makers. When such securities are valued by an independent pricing service they may be considered fair valued. Futures contracts are valued at the final settlement price set by an exchange on which they are principally traded. Listed options are valued at the mean between the last bid and ask prices from the exchange on which they are principally traded. Options not listed on an exchange are valued by an independent source at the mean between the last bid and ask prices. For purposes of determining net asset value per share, futures and option contracts generally are valued 15 minutes after the close of the customary trading session of the New York Stock Exchange (“NYSE”). |
Invesco Van Kampen V.I. Equity and Income Fund
| | |
| | Investments in open-end and closed-end registered investment companies that do not trade on an exchange are valued at the end of day net asset value per share. Investments in open-end and closed-end registered investment companies that trade on an exchange are valued at the last sales price or official closing price as of the close of the customary trading session on the exchange where the security is principally traded. |
| | Swap agreements are fair valued using an evaluated quote provided by an independent pricing service. Evaluated quotes provided by the pricing service are valued based on a model which may include end of day net present values, spreads, ratings, industry, and company performance. |
| | Foreign securities (including foreign exchange contracts) are converted into U.S. dollar amounts using the applicable exchange rates as of the close of the NYSE. If market quotations are available and reliable for foreign exchange traded equity securities, the securities will be valued at the market quotations. Because trading hours for certain foreign securities end before the close of the NYSE, closing market quotations may become unreliable. If between the time trading ends on a particular security and the close of the customary trading session on the NYSE, events occur that are significant and make the closing price unreliable, the Fund may fair value the security. If the event is likely to have affected the closing price of the security, the security will be valued at fair value in good faith using procedures approved by the Board of Trustees. Adjustments to closing prices to reflect fair value may also be based on a screening process of an independent pricing service to indicate the degree of certainty, based on historical data, that the closing price in the principal market where a foreign security trade is not the current value as of the close of the NYSE. Foreign securities meeting the approved degree of certainty that the price is not reflective of current value will be priced at the indication of fair value from the independent pricing service. Multiple factors may be considered by the independent pricing service in determining adjustments to reflect fair value and may include information relating to sector indices, American Depositary Receipts and domestic and foreign index futures. Foreign securities may have additional risks including exchange rate changes, potential for sharply devalued currencies and high inflation, political and economic upheaval, the relative lack of issuer information, relatively low market liquidity and the potential lack of strict financial and accounting controls and standards. |
| | Securities for which market prices are not provided by any of the above methods may be valued based upon quotes furnished by independent sources. The last bid price may be used to value equity securities. The mean between the last bid and asked prices is used to value debt obligations, including Corporate Loans. |
| | Securities for which market quotations are not readily available or are unreliable are valued at fair value as determined in good faith by or under the supervision of the Trust’s officers following procedures approved by the Board of Trustees. Issuer specific events, market trends, bid/ask quotes of brokers and information providers and other market data may be reviewed in the course of making a good faith determination of a security’s fair value. |
| | Valuations change in response to many factors including the historical and prospective earnings of the issuer, the value of the issuer’s assets, general economic conditions, interest rates, investor perceptions and market liquidity. Because of the inherent uncertainties of valuation, the values reflected in the financial statements may materially differ from the value received upon actual sale of those investments. |
| B. | | Securities Transactions and Investment Income — Securities transactions are accounted for on a trade date basis. Realized gains or losses on sales are computed on the basis of specific identification of the securities sold. Interest income is recorded on the accrual basis from settlement date. Paydown gains and losses on mortgage and asset-backed securities are recorded as adjustments to interest income. Dividend income (net of withholding tax, if any) is recorded on the ex-dividend date. Bond premiums and discounts are amortized and/or accreted for financial reporting purposes. |
| | The Fund may periodically participate in litigation related to Fund investments. As such, the Fund may receive proceeds from litigation settlements. Any proceeds received are included in the Statement of Operations as realized gain (loss) for investments no longer held and as unrealized gain (loss) for investments still held. |
| | Brokerage commissions and mark ups are considered transaction costs and are recorded as an increase to the cost basis of securities purchased and/or a reduction of proceeds on a sale of securities. Such transaction costs are included in the determination of net realized and unrealized gain (loss) from investment securities reported in the Statement of Operations and the Statement of Changes in Net Assets and the net realized and unrealized gains (losses) on securities per share in the Financial Highlights. Transaction costs are included in the calculation of the Fund’s net asset value and, accordingly, they reduce the Fund’s total returns. These transaction costs are not considered operating expenses and are not reflected in net investment income reported in the Statement of Operations and Statement of Changes in Net Assets, or the net investment income per share and ratios of expenses and net investment income reported in the Financial Highlights, nor are they limited by any expense limitation arrangements between the Fund and the investment adviser. |
| | The Fund allocates income and realized and unrealized capital gains and losses to a class based on the relative net assets of each class. |
| C. | | Country Determination — For the purposes of making investment selection decisions and presentation in the Schedule of Investments, the investment adviser may determine the country in which an issuer is located and/or credit risk exposure based on various factors. These factors include the laws of the country under which the issuer is organized, where the issuer maintains a principal office, the country in which the issuer derives 50% or more of its total revenues and the country that has the primary market for the issuer’s securities, as well as other criteria. Among the other criteria that may be evaluated for making this determination are the country in which the issuer maintains 50% or more of its assets, the type of security, financial guarantees and enhancements, the nature of the collateral and the sponsor organization. Country of issuer and/or credit risk exposure has been determined to be the United States of America, unless otherwise noted. |
| D. | | Distributions — Distributions from income and net realized capital gain, if any, are generally paid to separate accounts of participating insurance companies annually and recorded on ex-dividend date. |
| E. | | Federal Income Taxes — The Fund intends to comply with the requirements of Subchapter M of the Internal Revenue Code necessary to qualify as a regulated investment company and to distribute substantially all of the Fund’s taxable earnings to shareholders. As such, the Fund will not be subject to federal income taxes on otherwise taxable income (including net realized capital gain) that is distributed to shareholders. Therefore, no provision for federal income taxes is recorded in the financial statements. |
| | The Fund files tax returns in the U.S. Federal jurisdiction and certain other jurisdictions. Generally, the Fund is subject to examinations by such taxing authorities for up to three years after the filing of the return for the tax period. |
| F. | | Expenses — Fees provided for under the Rule 12b-1 plan of a particular class of the Fund and which are directly attributable to that class are charged to the operations of such class. All other expenses are allocated among the classes based on relative net assets. |
| G. | | Accounting Estimates — The preparation of financial statements in conformity with accounting principles generally accepted in the United States of America (“GAAP”) requires management to make estimates and assumptions that affect the reported amounts of assets and liabilities at the date of the |
Invesco Van Kampen V.I. Equity and Income Fund
| | |
| | financial statements and the reported amounts of revenues and expenses during the reporting period including estimates and assumptions related to taxation. Actual results could differ from those estimates by a significant amount. In addition, the Fund monitors for material events or transactions that may occur or become known after the period-end date and before the date the financial statements are released to print. |
| H. | | Indemnifications — Under the Trust’s organizational documents, each Trustee, officer, employee or other agent of the Trust is indemnified against certain liabilities that may arise out of performance of their duties to the Fund. Additionally, in the normal course of business, the Fund enters into contracts, including the Fund’s servicing agreements that contain a variety of indemnification clauses. The Fund’s maximum exposure under these arrangements is unknown as this would involve future claims that may be made against the Fund that have not yet occurred. The risk of material loss as a result of such indemnification claims is considered remote. |
| I. | | Foreign Currency Translations — Foreign currency is valued at the close of the NYSE based on quotations posted by banks and major currency dealers. Portfolio securities and other assets and liabilities denominated in foreign currencies are translated into U.S. dollar amounts at date of valuation. Purchases and sales of portfolio securities (net of foreign taxes withheld on disposition) and income items denominated in foreign currencies are translated into U.S. dollar amounts on the respective dates of such transactions. The Fund does not separately account for the portion of the results of operations resulting from changes in foreign exchange rates on investments and the fluctuations arising from changes in market prices of securities held. The combined results of changes in foreign exchange rates and the fluctuation of market prices on investments (net of estimated foreign tax withholding) are included with the net realized and unrealized gain or loss from investments in the Statement of Operations. Reported net realized foreign currency gains or losses arise from (1) sales of foreign currencies, (2) currency gains or losses realized between the trade and settlement dates on securities transactions, and (3) the difference between the amounts of dividends, interest, and foreign withholding taxes recorded on the Fund’s books and the U.S. dollar equivalent of the amounts actually received or paid. Net unrealized foreign currency gains and losses arise from changes in the fair values of assets and liabilities, other than investments in securities at fiscal period end, resulting from changes in exchange rates. |
| | The Fund may invest in foreign securities which may be subject to foreign taxes on income, gains on investments or currency repatriation, a portion of which may be recoverable. |
| J. | | Foreign Currency Contracts — The Fund may enter into foreign currency contracts to manage or minimize currency or exchange rate risk. The Fund may also enter into foreign currency contracts for the purchase or sale of a security denominated in a foreign currency in order to “lock in” the U.S. dollar price of that security. A foreign currency contract is an obligation to purchase or sell a specific currency for an agreed-upon price at a future date. The use of foreign currency contracts does not eliminate fluctuations in the price of the underlying securities the Fund owns or intends to acquire but establishes a rate of exchange in advance. Fluctuations in the value of these contracts are measured by the difference in the contract date and reporting date exchange rates and are recorded as unrealized appreciation (depreciation) until the contracts are closed. When the contracts are closed, realized gains (losses) are recorded. Realized and unrealized gains (losses) on the contracts are included in the Statement of Operations. The primary risks associated with foreign currency contracts include failure of the counterparty to meet the terms of the contract and the value of the foreign currency changing unfavorably. These risks may be in excess of the amounts reflected in the Statement of Assets and Liabilities. |
| K. | | Futures Contracts — The Fund may enter into futures contracts to manage exposure to interest rate, equity and market price movements and/or currency risks. A futures contract is an agreement between two parties to purchase or sell a specified underlying security, currency or commodity (or delivery of a cash settlement price, in the case of an index future) for a fixed price at a future date. The Fund currently invests only in exchange-traded futures and they are standardized as to maturity date and underlying financial instrument. Initial margin deposits required upon entering into futures contracts are satisfied by the segregation of specific securities or cash as collateral at the futures commission merchant (broker). During the period the futures contracts are open, changes in the value of the contracts are recognized as unrealized gains or losses by recalculating the value of the contracts on a daily basis. Subsequent or variation margin payments are received or made depending upon whether unrealized gains or losses are incurred. These amounts are reflected as receivables or payables on the Statement of Assets and Liabilities. When the contracts are closed or expire, the Fund recognizes a realized gain or loss equal to the difference between the proceeds from, or cost of, the closing transaction and the Fund’s basis in the contract. The net realized gain (loss) and the change in unrealized gain (loss) on futures contracts held during the period is included on the Statement of Operations. The primary risks associated with futures contracts are market risk and the absence of a liquid secondary market. If the Fund were unable to liquidate a futures contract and/or enter into an offsetting closing transaction, the Fund would continue to be subject to market risk with respect to the value of the contracts and continue to be required to maintain the margin deposits on the futures contracts. Futures contracts have minimal counterparty risk since the exchange’s clearinghouse, as counterparty to all exchange-traded futures, guarantees the futures against default. Risks may exceed amounts recognized in the Statement of Assets and Liabilities. |
| L. | | Collateral — To the extent the Fund has pledged or segregated a security as collateral and that security is subsequently sold, it is the Fund’s practice to replace such collateral no later than the next business day. |
NOTE 2—Advisory Fees and Other Fees Paid to Affiliates
The Trust has entered into a master investment advisory agreement with Invesco Advisers, Inc. (the “Adviser” or “Invesco”). Under the terms of the investment advisory agreement, the Fund pays an advisory fee to the Adviser based on the annual rate of the Fund’s average daily net assets as follows:
| | | | | |
| Average Daily Net Assets | | Rate |
| |
| First $150 million | | | 0 | .50% |
| |
| Next $100 million | | | 0 | .45% |
| |
| Next $100 million | | | 0 | .40% |
| |
| Over $350 million | | | 0 | .35% |
| |
Invesco Van Kampen V.I. Equity and Income Fund
Under the terms of a master sub-advisory agreement between the Adviser and each of Invesco Asset Management Deutschland GmbH, Invesco Asset Management Limited, Invesco Asset Management (Japan) Limited, Invesco Australia Limited, Invesco Hong Kong Limited, Invesco Senior Secured Management, Inc. and Invesco Canada Ltd. (collectively, the “Affiliated Sub-Advisers”) the Adviser, not the Fund, may pay 40% of the fees paid to the Adviser to any such Affiliated Sub-Adviser(s) that provide discretionary investment management services to the Fund based on the percentage of assets allocated to such Sub-Adviser(s).
The Adviser has contractually agreed, through at least June 30, 2012, to waive advisory fees and/or reimburse expenses of all shares to the extent necessary to limit total annual fund operating expenses after fee waiver and/or expense reimbursement (excluding certain items discussed below) of Series I shares to 0.70% and Series II shares to 0.75% (after 12b-1 fee waivers) of average daily net assets. In determining the Adviser’s obligation to waive advisory fees and/or reimburse expenses, the following expenses are not taken into account, and could cause the total annual fund operating expenses after fee waiver and/or expense reimbursement to exceed the numbers reflected above: (1) interest; (2) taxes; (3) dividend expense on short sales; (4) extraordinary or non-routine items, including litigation expenses; and (5) expenses that the Fund has incurred but did not actually pay because of an expense offset arrangement. Unless the Board of the Trustees and Invesco mutually agree to amend or continue the fee waiver agreement, it will terminate on June 30, 2012.
Further, the Adviser has contractually agreed, through at least June 30, 2012, to waive the advisory fee payable by the Fund in an amount equal to 100% of the net advisory fees the Adviser receives from the affiliated money market funds on investments by the Fund of uninvested cash in such affiliated money market funds.
For the year ended December 31, 2011, the Adviser waived advisory fees of $71,390.
The Trust has entered into a master administrative services agreement with Invesco pursuant to which the Fund has agreed to pay Invesco a fee for costs incurred in providing accounting services and fund administrative services to the Fund and to reimburse Invesco for administrative services fees paid to insurance companies that have agreed to provide services to the participants of separate accounts. These administrative services provided by the insurance companies may include, among other things: the printing of prospectuses, financial reports and proxy statements and the delivery of the same to existing participants; the maintenance of master accounts; the facilitation of purchases and redemptions requested by the participants; and the servicing of participants’ accounts. Pursuant to such agreement, for the year ended December 31, 2011, Invesco was paid $214,639 for accounting and fund administrative services and reimbursed $2,071,349 for services provided by insurance companies.
The Trust has entered into a transfer agency and service agreement with Invesco Investment Services, Inc. (“IIS”) pursuant to which the Fund has agreed to pay IIS a fee for providing transfer agency and shareholder services to the Fund and reimburse IIS for certain expenses incurred by IIS in the course of providing such services. For the year ended December 31, 2011, expenses incurred under the agreement are shown in the Statement of Operations as transfer agent fees.
The Trust has entered into a master distribution agreement with Invesco Distributors, Inc. (“IDI”) to serve as the distributor for the Fund. The Trust has adopted a plan pursuant to Rule 12b-1 under the 1940 Act with respect to the Fund’s Series II shares (the “Plan”). The Fund, pursuant to the Plan, pays IDI compensation at the annual rate of 0.25% of the Fund’s average daily net assets of Series II shares. Of the Plan payments, up to 0.25% of the average daily net assets of the Series II shares may be paid to insurance companies who furnish continuing personal shareholder services to customers who purchase and own Series II shares of the Fund. IDI has contractually agreed to waive 0.20% of Rule 12b-1 plan fees on Series II shares through at least June 30, 2012. 12b-1 fees before fee waivers incurred under the Plan are detailed in the Statement of Operations as distribution fees. For the year ended December 31, 2011, 12b-1 fees incurred for Series II shares were $424,831 after fee waivers of $1,699,325.
Certain officers and trustees of the Trust are officers and directors of the Adviser, IIS and/or IDI.
NOTE 3—Additional Valuation Information
GAAP defines fair value as the price that would be received to sell an asset or paid to transfer a liability in an orderly transaction between market participants at the measurement date, under current market conditions. GAAP establishes a hierarchy that prioritizes the inputs to valuation methods giving the highest priority to readily available unadjusted quoted prices in an active market for identical assets (Level 1) and the lowest priority to significant unobservable inputs (Level 3) generally when market prices are not readily available or are unreliable. Based on the valuation inputs, the securities or other investments are tiered into one of three levels. Changes in valuation methods may result in transfers in or out of an investment’s assigned level:
| | |
| | Level 1 — | Prices are determined using quoted prices in an active market for identical assets. |
| | Level 2 — | Prices are determined using other significant observable inputs. Observable inputs are inputs that other market participants may use in pricing a security. These may include quoted prices for similar securities, interest rates, prepayment speeds, credit risk, yield curves, loss severities, default rates, discount rates, volatilities and others. |
| | Level 3 — | Prices are determined using significant unobservable inputs. In situations where quoted prices or observable inputs are unavailable (for example, when there is little or no market activity for an investment at the end of the period), unobservable inputs may be used. Unobservable inputs reflect the Fund’s own assumptions about the factors market participants would use in determining fair value of the securities or instruments and would be based on the best available information. |
The following is a summary of the tiered valuation input levels, as of December 31, 2011. The level assigned to the securities valuations may not be an indication of the risk or liquidity associated with investing in those securities. Because of the inherent uncertainties of valuation, the values reflected in the financial statements may materially differ from the value received upon actual sale of those investments.
Invesco Van Kampen V.I. Equity and Income Fund
During the year ended December 31, 2011, there were no significant transfers between investment levels.
| | | | | | | | | | | | | | | | | |
| | | Level 1 | | Level 2 | | Level 3 | | Total |
| |
| Equity Securities | | $ | 659,251,366 | | | $ | 8,458,684 | | | $ | — | | | $ | 667,710,050 | |
| |
| U.S. Treasury Securities | | | — | | | | 73,756,785 | | | | — | | | | 73,756,785 | |
| |
| U.S. Government Sponsored Securities | | | — | | | | 7,470,741 | | | | — | | | | 7,470,741 | |
| |
| Corporate Debt Securities | | | — | | | | 166,972,289 | | | | 0 | | | | 166,972,289 | |
| |
| Asset Backed Securities | | | — | | | | 20,763 | | | | — | | | | 20,763 | |
| |
| Municipal Obligations | | | — | | | | 280,277 | | | | — | | | | 280,277 | |
| |
| Foreign Government Debt Securities | | | — | | | | 439,264 | | | | — | | | | 439,264 | |
| |
| | | $ | 659,251,366 | | | $ | 257,398,803 | | | $ | 0 | | | $ | 916,650,169 | |
| |
| Foreign Currency Contracts* | | | — | | | | 804,281 | | | | — | | | | 804,281 | |
| |
| Futures* | | | (317,689 | ) | | | — | | | | — | | | | (317,689 | ) |
| |
| Total Investments | | $ | 658,933,677 | | | $ | 258,203,084 | | | $ | 0 | | | $ | 917,136,761 | |
| |
| |
| * | Unrealized appreciation (depreciation). |
NOTE 4—Derivative Investments
Value of Derivative Instruments at Period-End
The table below summarizes the value of the Fund’s derivative instruments, detailed by primary risk exposure, held as of December 31, 2011:
| | | | | | | | | |
| | | Value |
| Risk Exposure/Derivative Type | | Assets | | Liabilities |
| |
| Currency risk | | | | | | | | |
Foreign currency contracts(a) | | $ | 804,281 | | | $ | — | |
| |
| Interest rate risk | | | | | | | | |
Futures contracts(b) | | $ | 3,862 | | | $ | (321,551 | ) |
| |
| | |
| (a) | | Values are disclosed on the Statement of Assets and Liabilities under Foreign currency contracts outstanding. |
| (b) | | Includes cumulative appreciation (depreciation) of futures contracts. Only current day’s variation margin receivable (payable) is reported within the Statement of Assets and Liabilities. |
Effect of Derivative Instruments for the year ended December 31, 2011
The table below summarizes the gains (losses) on derivative instruments, detailed by primary risk exposure, recognized in earnings during the period:
| | | | | | | | | |
| | | Location of Gain (Loss) on Statement of Operations |
| | | | | Foreign Currency
|
| | | Futures* | | Contracts* |
| |
| Realized Gain (Loss) | | | | | | | | |
| Currency risk | | $ | — | | | $ | 969,174 | |
| |
| Interest rate risk | | | (1,646,373 | ) | | | — | |
| |
| Change in Unrealized Appreciation (Depreciation) | | | | | | | | |
| Currency risk | | | — | | | | 804,281 | |
| |
| Interest rate risk | | | (911,720 | ) | | | — | |
| |
| Total | | $ | (2,558,093 | ) | | $ | 1,773,455 | |
| |
| |
| * | The average notional value of futures and foreign currency contracts outstanding during the period was $32,750,930 and $17,000,118, respectively. |
| | | | | | | | | | | | | | | | | | | | | | | |
| Open Foreign Currency Contracts |
Settlement
| | | | Contract to | | Notional
| | Unrealized
|
| Date | | Counterparty | | Deliver | | Receive | | Value | | Appreciation |
| |
| 1/12/12 | | Bank of New York | | EUR | | | 10,794,240 | | | USD | | | 14,519,548 | | | $ | 13,972,458 | | | $ | 547,090 | |
| |
| 1/12/12 | | State Street CA | | EUR | | | 3,783,362 | | | USD | | | 5,089,833 | | | | 4,897,322 | | | | 192,511 | |
| |
| 1/12/12 | | State Street CA | | GBP | | | 5,403,528 | | | USD | | | 8,457,467 | | | | 8,392,787 | | | | 64,680 | |
| |
| Total open foreign currency contracts | | | | | | | | | | | | | | | | | | | | $ | 804,281 | |
| |
| | | |
| Currency Abbreviations: |
| EUR | | – Euro |
| GBP | | – British Pound Sterling |
| USD | | – U.S. Dollar |
Invesco Van Kampen V.I. Equity and Income Fund
| | | | | | | | | | | | | | | | | |
| Open Futures Contracts |
| | | | | | | | | Unrealized
|
| | | Number of
| | Expiration
| | Notional
| | Appreciation
|
| Long Contracts | | Contracts | | Month | | Value | | (Depreciation) |
| |
| U.S. Treasury 2 Year Notes | | | 36 | | | | March-2012 | | | $ | 7,939,688 | | | $ | 3,862 | |
| |
| | | | | | | | | | | | | | | | | |
| | | | | | | | | | | | | | | | | |
| Short Contracts | | | | | | | | |
| |
| U.S. Treasury 5 Year Notes | | | 78 | | | | March-2012 | | | | (9,614,109 | ) | | | (45,867 | ) |
| |
| U.S. Treasury 10 Year Notes | | | 39 | | | | March-2012 | | | | (5,113,875 | ) | | | (68,027 | ) |
| |
| U.S. Treasury Long Bond | | | 44 | | | | March-2012 | | | | (6,371,750 | ) | | | (207,657 | ) |
| |
| Subtotal | | | | | | | | | | $ | (21,099,734 | ) | | $ | (321,551 | ) |
| |
| Total | | | | | | | | | | | | | | $ | (317,689 | ) |
| |
NOTE 5—Security Transactions with Affiliated Funds
The Fund is permitted to purchase or sell securities from or to certain other Invesco Funds under specified conditions outlined in procedures adopted by the Board of Trustees of the Trust. The procedures have been designed to ensure that any purchase or sale of securities by the Fund from or to another fund or portfolio that is or could be considered an affiliate by virtue of having a common investment adviser (or affiliated investment advisers), common Trustees and/or common officers complies with Rule 17a-7 of the 1940 Act. Further, as defined under the procedures, each transaction is effected at the current market price. Pursuant to these procedures, for the year ended December 31, 2011, the Fund engaged in securities purchases of $1,284,704.
NOTE 6—Trustees’ and Officers’ Fees and Benefits
“Trustees’ and Officers’ Fees and Benefits” include amounts accrued by the Fund to pay remuneration to certain Trustees and Officers of the Fund. Trustees have the option to defer compensation payable by the Fund, and “Trustees’ and Officers’ Fees and Benefits” also include amounts accrued by the Fund to fund such deferred compensation amounts. Those Trustees who defer compensation have the option to select various Invesco Funds in which their deferral accounts shall be deemed to be invested. Finally, certain current Trustees are eligible to participate in a retirement plan that provides for benefits to be paid upon retirement to Trustees over a period of time based on the number of years of service. The Fund may have certain former Trustees who also participate in a retirement plan and receive benefits under such plan. “Trustees’ and Officers’ Fees and Benefits” include amounts accrued by the Fund to fund such retirement benefits. Obligations under the deferred compensation and retirement plans represent unsecured claims against the general assets of the Fund.
During the year ended December 31, 2011, the Fund paid legal fees of $2,143 for services rendered by Kramer, Levin, Naftalis & Frankel LLP as counsel to the Independent Trustees. A partner of that firm is a Trustee of the Trust.
NOTE 7—Cash Balances
The Fund is permitted to temporarily carry a negative or overdrawn balance in its account with State Street Bank and Trust Company, the custodian bank. To compensate the custodian bank for such overdrafts, the overdrawn Fund may either (1) leave funds as a compensating balance in the account so the custodian bank can be compensated by earning the additional interest; or (2) compensate by paying the custodian bank at a rate agreed upon by the custodian bank and Invesco, not to exceed the contractually agreed upon rate.
NOTE 8—Distributions to Shareholders and Tax Components of Net Assets
Tax Character of Distributions to Shareholders Paid During the Years Ended December 31, 2011 and 2010:
| | | | | | | | | |
| | | 2011 | | 2010 |
| |
| Ordinary income | | $ | 14,648,632 | | | $ | 13,994,794 | |
| |
Tax Components of Net Assets at Period-End:
| | | | | |
| | | 2011 |
| |
| Undistributed ordinary income | | $ | 17,916,603 | |
| |
| Net unrealized appreciation — investments | | | 54,942,677 | |
| |
| Temporary book/tax differences | | | (79,248 | ) |
| |
| Capital loss carryforward | | | (55,449,590 | ) |
| |
| Shares of beneficial interest | | | 903,438,850 | |
| |
| Total net assets | | $ | 920,769,292 | |
| |
The difference between book-basis and tax-basis unrealized appreciation (depreciation) is due to differences in the timing of recognition of gains and losses on investments for tax and book purposes. The Fund’s net unrealized appreciation difference is attributable primarily to wash sales, straddles and hybrid securities.
Invesco Van Kampen V.I. Equity and Income Fund
The temporary book/tax differences are a result of timing differences between book and tax recognition of income and/or expenses. The Fund’s temporary book/tax differences are the result of the trustee deferral of compensation and retirement plan benefits.
Capital loss carryforward is calculated and reported as of a specific date. Results of transactions and other activity after that date may affect the amount of capital loss carryforward actually available for the Fund to utilize. The Regulated Investment Company Modernization Act of 2010 (the “Act”) eliminated the eight-year carryover period for capital losses that arise in taxable years beginning after its enactment date of December 22, 2010. Consequently, these capital losses can be carried forward for an unlimited period. However, capital losses with an expiration period may not be used to offset capital gains until all net capital losses without an expiration date have been utilized. Additionally, post-enactment capital loss carryovers will retain their character as either short-term or long-term capital losses instead of as short-term capital losses as under prior law. The ability to utilize capital loss carryforward in the future may be limited under the Internal Revenue Code and related regulations based on the results of future transactions. Under these limitation rules, the Fund is limited to utilizing $49,270,013 of capital loss carryforward in the fiscal year ending December 31, 2012.
The Fund utilized $5,015,717 of capital loss carryforward in the current period to offset net realized capital gain for federal income tax purposes. The Fund has a capital loss carryforward as of December 31, 2011, which expires as follows:
| | | | | | | | | | | | | |
| Capital Loss Carryforward* |
| Expiration | | Short-Term | | Long-Term | | Total |
| |
| December 31, 2015 | | $ | 1,901,861 | | | $ | — | | | $ | 1,901,861 | |
| |
| December 31, 2016 | | | 6,050,182 | | | | — | | | | 6,050,182 | |
| |
| December 31, 2017 | | | 47,497,547 | | | | — | | | | 47,497,547 | |
| |
| | | $ | 55,449,590 | | | $ | — | | | $ | 55,449,590 | |
| |
| |
| * | Capital loss carryforward as of the date listed above is reduced for limitations, if any, to the extent required by the Internal Revenue Code. |
To the extent that unrealized gains as of May 2, 2011, the date of reorganization of Invesco V.I. Basic Balanced Fund, Invesco V.I. Income Builder Fund and Invesco V.I. Select Dimensions Balanced Fund into the Fund and realized on securities held in each fund at such date of reorganization, the capital loss carryforward may be further limited for up to five years from the date of the reorganization.
NOTE 9—Investment Securities
The aggregate amount of investment securities (other than short-term securities, U.S. Treasury obligations and money market funds, if any) purchased and sold by the Fund during the year ended December 31, 2011 was $256,744,600 and $219,440,159, respectively. Cost of investments on a tax basis includes the adjustments for financial reporting purposes as of the most recently completed Federal income tax reporting period-end.
| | | | | |
| Unrealized Appreciation (Depreciation) of Investment Securities on a Tax Basis |
| |
| Aggregate unrealized appreciation of investment securities | | $ | 91,692,362 | |
| |
| Aggregate unrealized (depreciation) of investment securities | | | (36,749,685 | ) |
| |
| Net unrealized appreciation of investment securities | | $ | 54,942,677 | |
| |
| Cost of investments for tax purposes is $861,707,492. |
NOTE 10—Reclassification of Permanent Differences
Primarily as a result of differing book/tax treatment of income from hybrid securities and return of capital on December 31, 2011, undistributed net investment income was increased by $1,052,406, undistributed net realized gain (loss) was decreased by $826,480 and shares of beneficial interest decreased by $225,926.
Further, as a result of tax deferrals acquired in the reorganization of Invesco V.I. Basic Balanced Fund, Invesco V.I. Income Builder Fund and Invesco V.I. Select Dimensions Fund into the Fund, undistributed net investment income was decreased by $45,757, undistributed net realized gain (loss) was decreased by $11,030,852 and shares of beneficial interest increased by $11,076,609. These reclassifications had no effect on the net assets of the Fund.
Invesco Van Kampen V.I. Equity and Income Fund
NOTE 11—Share Information
| | | | | | | | | | | | | | | | | |
| | | Summary of Share Activity |
| |
| | | Year ended December 31, |
| | | 2011(a) | | 2010 |
| | | Shares | | Amount | | Shares | | Amount |
| |
| Sold: | | | | | | | | | | | | | | | | |
Series I(b) | | | 166,964 | | | $ | 2,254,649 | | | | 3,269 | | | $ | 44,487 | |
| |
| Series II | | | 10,464,491 | | | | 146,470,102 | | | | 9,140,570 | | | | 119,604,678 | |
| |
| Issued as reinvestment of dividends: | | | | | | | | | | | | | | | | |
| Series I | | | 13,178 | | | | 166,498 | | | | — | | | | — | |
| |
| Series II | | | 1,025,856 | | | | 14,481,929 | | | | 1,110,698 | | | | 13,994,794 | |
| |
Issued in connection with acquistions:(c) | | | | | | | | | | | | | | | | |
| Series I | | | 4,636,112 | | | | 68,904,153 | | | | — | | | | — | |
| |
| Series II | | | 2,097,600 | | | | 31,153,983 | | | | — | | | | — | |
| |
| Reacquired: | | | | | | | | | | | | | | | | |
| Series I | | | (712,240 | ) | | | (9,718,444 | ) | | | — | | | | (4 | ) |
| |
| Series II | | | (7,121,326 | ) | | | (98,655,704 | ) | | | (5,846,609 | ) | | | (76,160,666 | ) |
| |
| Net increase in share activity | | | 10,570,635 | | | $ | 155,057,166 | | | | 4,407,928 | | | $ | 57,483,289 | |
| |
| | |
| (a) | | There are entities that are record owners of more than 5% of the outstanding shares of the Fund and in the aggregate own 77% of the outstanding shares of the Fund. The Fund and the Fund’s principal underwriter or adviser, are parties to participation agreements with these entities whereby these entities sell units of interest in separate accounts funding variable products that are invested in the Fund. The Fund, Invesco and/or Invesco affiliates may make payments to these entities, which are considered to be related to the Fund, for providing services to the Fund, Invesco and/or Invesco affiliates including but not limited to services such as, securities brokerage, third party record keeping and account servicing and administrative services. The Fund has no knowledge as to whether all or any portion of the shares owned of record by these entities are also owned beneficially. |
| (b) | | Commencement date of June 1, 2010. |
| (c) | | As of the opening of business on May 2, 2011, the Fund acquired all the net assets of Invesco V.I. Basic Balanced Fund, Invesco V.I. Income Builder Fund and Invesco V.I. Select Dimensions Balanced Fund (the “Target Funds”) pursuant to a plan of reorganization approved by the Trustees of the Fund on November 10, 2010 and by the shareholders of the Target Funds on April 1, 2011. The acquisition was accomplished by a tax-free exchange of 6,733,712 shares of the Fund for 3,229,995, 2,847,069 and 2,619,937 shares outstanding of Invesco V.I. Basic Balanced Fund, Invesco V.I. Income Builder Fund and Invesco V.I. Select Dimensions Balanced Fund, respectively, as of the close of business on April 29, 2011. Each class of the Target Funds was exchanged for the like class of shares of the Fund based on the relative net asset value of the Target Funds to the net asset value of the Fund on the close of business, April 29, 2011. Invesco V.I. Basic Balanced Fund, Invesco V.I. Income Builder Fund and Invesco V.I. Select Dimensions Balanced Fund’s net assets at that date of $31,074,477, $31,415,511 and 37,568,148 including $4,748,360, 4,098,925 and 3,365,752 of unrealized appreciation, were combined with those of the Fund, respectively. The net assets of the Fund immediately before the acquisition were $883,038,141 and $983,096,277 immediately after the acquisition. |
| | The pro forma results of operations for the year ended December 31, 2011 assuming the reorganization had been completed on January 1, 2011, the beginning of the annual reporting period are as follows: |
| | | | | |
| Net investment income | | $ | 16,266,072 | |
| Net realized/unrealized gains (losses) | | | (29,988,355 | ) |
| | | | | |
| Change in net assets resulting from operations | | | (13,722,283 | ) |
| | |
| | The combined investment portfolios have been managed as a single integrated portfolio since the acquisition was completed, it is not practicable to separate the amounts of revenue and earnings of the Target Funds that have been included in the Fund’s Statement of Operations since May 2, 2011. |
Invesco Van Kampen V.I. Equity and Income Fund
NOTE 12—Financial Highlights
The following schedule presents financial highlights for a share of the Fund outstanding throughout the periods indicated.
| | | | | | | | | | | | | | | | | | | | | | | | | | | | | | | | | | | | | | | | | | | | | | | | | | | | | | | | | | | | | |
| | | | | | | | | | | | | | | | | | | | | | | Ratio of
| | Ratio of
| | | | | | |
| | | | | | | | | | | | | | | | | | | | | | | expenses
| | expenses
| | | | | | |
| | | | | | | | | | | | | | | | | | | | | | | to average
| | to average
| | | | Ratio of
| | |
| | | | | | | Net gains
| | | | | | | | | | | | | | | | net assets
| | net assets
| | | | rebate from
| | |
| | | | | | | (losses) on
| | | | | | | | | | | | | | | | with fee
| | without
| | Ratio of net
| | Morgan
| | |
| | | Net asset
| | | | securities
| | | | Dividends
| | Distributions
| | | | | | | | | | waivers
| | fee waivers
| | investment
| | Stanley
| | |
| | | value,
| | Net
| | (both
| | Total from
| | from net
| | from net
| | | | Net asset
| | | | Net assets,
| | and/or
| | and/or
| | income to
| | Affiliates to
| | |
| | | beginning
| | investment
| | realized and
| | investment
| | investment
| | realized
| | Total
| | value, end
| | Total
| | end of period
| | expenses
| | expenses
| | average
| | average net
| | Portfolio
|
| | | of period | | income(a) | | unrealized) | | operations | | income | | gains | | distributions | | of period | | return(b) | | (000s omitted) | | absorbed | | absorbed | | net assets | | assets | | turnover(c) |
| |
| Series I |
| Year ended 12/31/11 | | $ | 14.06 | | | $ | 0.25 | | | $ | (0.41 | ) | | $ | (0.16 | ) | | $ | (0.25 | ) | | $ | — | | | $ | (0.25 | ) | | $ | 13.65 | | | | (1.19 | )% | | $ | 56,053 | | | | 0.66 | %(d) | | | 0.67 | %(d) | | | 1.83 | %(d) | | | — | % | | | 28 | % |
| Year ended 12/31/10(e) | | | 12.27 | | | | 0.13 | | | | 1.66 | | | | 1.79 | | | | — | | | | — | | | | — | | | | 14.06 | | | | 14.59 | | | | 46 | | | | 0.69 | (j) | | | 0.70 | (j) | | | 1.73 | (j) | | | — | | | | 34 | |
| |
| Series II |
| Year ended 12/31/11 | | | 14.05 | | | | 0.25 | | | | (0.42 | ) | | | (0.17 | ) | | | (0.25 | ) | | | — | | | | (0.25 | ) | | | 13.63 | | | | (1.30 | ) | | | 864,716 | | | | 0.71 | (d) | | | 0.92 | (d) | | | 1.78 | (d) | | | — | | | | 28 | |
| Year ended 12/31/10 | | | 12.80 | | | | 0.22 | | | | 1.29 | | | | 1.51 | | | | (0.26 | ) | | | — | | | | (0.26 | ) | | | 14.05 | | | | 12.03 | | | | 800,414 | | | | 0.74 | | | | 0.98 | | | | 1.68 | | | | — | | | | 34 | |
| Year ended 12/31/09 | | | 10.77 | | | | 0.24 | | | | 2.11 | | | | 2.35 | | | | (0.32 | ) | | | — | | | | (0.32 | ) | | | 12.80 | | | | 22.49 | | | | 672,782 | | | | 0.74 | (f) | | | 1.04 | (f) | | | 2.09 | (f)(g) | | | 0.01 | | | | 81 | |
| Year ended 12/31/08 | | | 14.74 | | | | 0.32 | | | | (3.56 | ) | | | (3.24 | ) | | | (0.31 | ) | | | (0.42 | ) | | | (0.73 | ) | | | 10.77 | | | | (22.68 | )(h) | | | 517,124 | | | | 0.75 | (f) | | | 1.05 | (f) | | | 2.50 | (f)(g) | | | 0.01 | | | | 95 | |
| Year ended 12/31/07 | | | 14.89 | | | | 0.35 | | | | 0.17 | | | | 0.52 | | | | (0.28 | ) | | | (0.39 | ) | | | (0.67 | ) | | | 14.74 | | | | 3.36 | | | | 711,897 | | | | 0.74 | (f) | | | 1.04 | (f) | | | 2.31 | (f)(g) | | | 0.00 | (i) | | | 70 | |
| |
| | |
| (a) | | Calculate using average shares outstanding. |
| (b) | | Includes adjustments in accordance with accounting principles generally accepted in the United States of America and as such, the net asset value for financial reporting purposes and the returns based upon those net asset values may differ from the net asset value and returns for shareholder transactions. Total returns are not annualized for periods less than one year, if applicable and do not reflect charges assessed in connection with a variable product, which if included would reduce total returns. |
| (c) | | Portfolio turnover is calculated at the fund level and is not annualized for periods less than one year, if applicable. For the period ending December 31, 2011, the portfolio turnover calculation excludes the value of securities purchased of $84,964,454 and sold of $24,142,395 in effect to realign the Fund’s portfolio holdings after the reorganization of Invesco V.I. Basic Balanced Fund, Invesco V.I. Income Builder Fund and Invesco V.I. Select Dimensions Balanced Fund into the Fund. |
| (d) | | Ratios are based on average daily net assets (000’s omitted) of $40,072 and $849,662 for Series I and Series II shares, respectively. |
| (e) | | Commencement date of June 1, 2010. |
| (f) | | The ratios reflect the rebate of certain Fund expenses in connection with the investments in Morgan Stanley affiliates during the period. The effect of the rebate is disclosed in the above table as “Ratio of Rebate from Morgan Stanley Affiliates to Average Net Assets”. |
| (g) | | Ratio of net investment income to average net assets without fee waivers and/or expenses absorbed was 1.79%, 2.20% and 2.01% for the years ended December 31, 2009 through December 31, 2007, respectively. |
| (h) | | The Adviser reimbursed the Fund for losses incurred on derivative transactions which breached an investment guideline of the Fund during the period. The impact of this reimbursement is reflected in the total return shown above. Without this reimbursement, the total return for Series II would have been (22.68)%. |
| (i) | | Amount is less than 0.005%. |
| (j) | | Annualized. |
Invesco Van Kampen V.I. Equity and Income Fund
Report of Independent Registered Public Accounting Firm
To the Board of Trustees of AIM Variable Insurance Funds (Invesco Variable Insurance Funds)
and Shareholders of Invesco Van Kampen V.I. Equity and Income Fund:
In our opinion, the accompanying statement of assets and liabilities, including the schedule of investments, and the related statements of operations and of changes in net assets and the financial highlights present fairly, in all material respects, the financial position of Invesco Van Kampen V.I. Equity and Income Fund (one of the funds constituting AIM Variable Insurance Funds (Invesco Variable Insurance Funds), hereafter referred to as the “Fund”) at December 31, 2011, the results of its operations for the year then ended, and the changes in its net assets and the financial highlights for each of the two years in the period then ended, in conformity with accounting principles generally accepted in the United States of America. These financial statements and financial highlights (hereafter referred to as “financial statements”) are the responsibility of the Fund’s management; our responsibility is to express an opinion on these financial statements based on our audits. We conducted our audits of these financial statements in accordance with the standards of the Public Company Accounting Oversight Board (United States). Those standards require that we plan and perform the audits to obtain reasonable assurance about whether the financial statements are free of material misstatement. An audit includes examining, on a test basis, evidence supporting the amounts and disclosures in the financial statements, assessing the accounting principles used and significant estimates made by management, and evaluating the overall financial statement presentation. We believe that our audits, which included confirmation of securities at December 31, 2011 by correspondence with the custodian and brokers, provide a reasonable basis for our opinion. The financial highlights of the Fund for the periods ended December 31, 2009 and prior were audited by other independent auditors whose report dated February 19, 2010 expressed an unqualified opinion on those financial statements.
PRICEWATERHOUSECOOPERS LLP
February 14, 2012
Houston, Texas
Invesco Van Kampen V.I. Equity and Income Fund
Calculating your ongoing Fund expenses
Example
As a shareholder of the Fund, you incur ongoing costs, including management fees; distribution and/or service fees (12b-1); and other Fund expenses. This example is intended to help you understand your ongoing costs (in dollars) of investing in the Fund and to compare these costs with ongoing costs of investing in other mutual funds. The example is based on an investment of $1,000 invested at the beginning of the period and held for the entire period July 1, 2011 through December 31, 2011.
The actual and hypothetical expenses in the examples below do not represent the effect of any fees or other expenses assessed in connection with a variable product; if they did, the expenses shown would be higher while the ending account values shown would be lower.
Actual expenses
The table below provides information about actual account values and actual expenses. You may use the information in this table, together with the amount you invested, to estimate the expenses that you paid over the period. Simply divide your account value by $1,000 (for example, an $8,600 account value divided by $1,000 = 8.6), then multiply the result by the number in the table under the heading entitled “Actual Expenses Paid During Period” to estimate the expenses you paid on your account during this period.
Hypothetical example for comparison purposes
The table below also provides information about hypothetical account values and hypothetical expenses based on the Fund’s actual expense ratio and an assumed rate of return of 5% per year before expenses, which is not the Fund’s actual return.
The hypothetical account values and expenses may not be used to estimate the actual ending account balance or expenses you paid for the period. You may use this information to compare the ongoing costs of investing in the Fund and other funds. To do so, compare this 5% hypothetical example with the 5% hypothetical examples that appear in the shareholder reports of the other funds.
Please note that the expenses shown in the table are meant to highlight your ongoing costs. Therefore, the hypothetical information is useful in comparing ongoing costs, and will not help you determine the relative total costs of owning different funds.
| | | | | | | | | | | | | | | | | | | | | | | | | | | | | | | |
| | | | | | | | | | HYPOTHETICAL
| | | |
| | | | | | | | | | (5% annual return before
| | | |
| | | | | | | ACTUAL | | | expenses) | | | |
| | | | Beginning
| | | Ending
| | | Expenses
| | | Ending
| | | Expenses
| | | Annualized
|
| | | | Account Value
| | | Account Value
| | | Paid During
| | | Account Value
| | | Paid During
| | | Expense
|
| Class | | | (07/01/11) | | | (12/31/11)1 | | | Period2 | | | (12/31/11) | | | Period2 | | | Ratio |
| Series I | | | $ | 1,000.00 | | | | $ | 948.10 | | | | $ | 3.09 | | | | $ | 1,022.03 | | | | $ | 3.21 | | | | | 0.63 | % |
| | | | | | | | | | | | | | | | | | | | | | | | | | | | | | | |
| Series II | | | | 1,000.00 | | | | | 948.10 | | | | | 3.34 | | | | | 1,021.78 | | | | | 3.47 | | | | | 0.68 | |
| | | | | | | | | | | | | | | | | | | | | | | | | | | | | | | |
| |
| 1 | The actual ending account value is based on the actual total return of the Fund for the period July 1, 2011 through December 31, 2011, after actual expenses and will differ from the hypothetical ending account value which is based on the Fund’s expense ratio and a hypothetical annual return of 5% before expenses. |
| 2 | Expenses are equal to the Fund’s annualized expense ratio as indicated above multiplied by the average account value over the period, multiplied by 184/365 to reflect the most recent fiscal half year. |
Invesco Van Kampen V.I. Equity and Income Fund
Form 1099-DIV, Form 1042-S and other year-end tax information provide shareholders with actual calendar year amounts that should be included in their tax returns. Shareholders should consult their tax advisors.
The following distribution information is being provided as required by the Internal Revenue Code or to meet a specific state’s requirement.
The Fund designates the following amounts or, if subsequently determined to be different, the maximum amount allowable for its fiscal year ended December 31, 2011:
| | | | | |
Federal and State Income Tax | | |
| |
| Corporate Dividends Received Deduction* | | | 58.92% | |
| U.S. Treasury Obligations* | | | 8.67% | |
| | |
| | * | The above percentages are based on ordinary income dividends paid to shareholders during the Fund’s fiscal year. |
Invesco Van Kampen V.I. Equity and Income Fund
Trustees and Officers
The address of each trustee and officer is AIM Variable Insurance Funds (Invesco Variable Insurance Funds) (the “Trust”), 11 Greenway Plaza, Suite 2500, Houston, Texas 77046-1173. The trustees serve for the life of the Trust, subject to their earlier death, incapacitation, resignation, retirement or removal as more specifically provided in the Trust’s organizational documents. Each officer serves for a one year term or until their successors are elected and qualified. Column two below includes length of time served with predecessor entities, if any.
| | | | | | | | | |
| | | | | | | Number of Funds
| | |
Name, Year of Birth and
| | Trustee and/
| | Principal Occupation(s)
| | in Fund Complex
| | Other Directorship(s)
|
| Position(s) Held with the Trust | | or Officer Since | | During Past 5 Years | | Overseen by Trustee | | Held by Trustee |
| | | | | | | | | |
| | | | | | | | | |
| | | | | | | | | |
| Interested Persons | | | | | | | | |
| | | | | | | | | |
| | | | | | | | | |
| | | | | | | | | |
Martin L. Flanagan1 — 1960
Trustee | | 2007 | | Executive Director, Chief Executive Officer and President, Invesco Ltd. (ultimate parent of Invesco and a global investment management firm); Advisor to the Board, Invesco Advisers, Inc. (formerly known as Invesco Institutional (N.A.), Inc.); Trustee, The Invesco Funds; Vice Chair, Investment Company Institute; and Member of Executive Board, SMU Cox School of Business
Formerly: Chairman, Invesco Advisers, Inc. (registered investment adviser); Director, Chairman, Chief Executive Officer and President, IVZ Inc. (holding company), INVESCO Group Services, Inc. (service provider) and Invesco North American Holdings, Inc. (holding company); Director, Chief Executive Officer and President, Invesco Holding Company Limited (parent of Invesco and a global investment management firm); Director, Invesco Ltd.; Chairman, Investment Company Institute and President, Co-Chief Executive Officer, Co-President, Chief Operating Officer and Chief Financial Officer, Franklin Resources, Inc. (global investment management organization) | | 140 | | None |
| | | | | | | | | |
| | | | | | | | | |
| | | | | | | | | |
Philip A. Taylor2 — 1954
Trustee, President and Principal Executive Officer | | 2006 | | Head of North American Retail and Senior Managing Director, Invesco Ltd.; Director, Co-Chairman, Co-President and Co-Chief Executive Officer, Invesco Advisers, Inc. (formerly known as Invesco Institutional (N.A.), Inc.) (registered investment adviser); Director, Chairman, Chief Executive Officer and President, Invesco Management Group, Inc. (formerly Invesco Aim Management Group, Inc.) (financial services holding company); Director and President, INVESCO Funds Group, Inc. (registered investment adviser and registered transfer agent); Director and Chairman, Invesco Investment Services, Inc. (formerly known as Invesco Aim Investment Services, Inc.) (registered transfer agent) and IVZ Distributors, Inc. (formerly known as INVESCO Distributors, Inc.) (registered broker dealer); Director, President and Chairman, Invesco Inc. (holding company) and Invesco Canada Holdings Inc. (holding company); Chief Executive Officer, Invesco Corporate Class Inc. (corporate mutual fund company) and Invesco Canada Fund Inc. (corporate mutual fund company); Director, Chairman and Chief Executive Officer, Invesco Canada Ltd. (formerly known as Invesco Trimark Ltd./Invesco Trimark Ltèe) (registered investment adviser and registered transfer agent); Trustee, President and Principal Executive Officer, The Invesco Funds (other than AIM Treasurer’s Series Trust (Invesco Treasurer’s Series Trust) and Short-Term Investments Trust); Trustee and Executive Vice President, The Invesco Funds (AIM Treasurer’s Series Trust (Invesco Treasurer’s Series Trust) and Short-Term Investments Trust only); Director, Invesco Investment Advisers LLC (formerly known as Van Kampen Asset Management); Director, Chief Executive Officer and President, Van Kampen Exchange Corp. | | 140 | | None |
| | | | | | | | | |
| | | | | | | | | |
| | | | | Formerly: Director and Chairman, Van Kampen Investor Services Inc.: Director, Chief Executive Officer and President, 1371 Preferred Inc. (holding company); and Van Kampen Investments Inc.; Director and President, AIM GP Canada Inc. (general partner for limited partnerships); and Van Kampen Advisors, Inc.; Director and Chief Executive Officer, Invesco Trimark Dealer Inc. (registered broker dealer); Director, Invesco Distributors, Inc. (formerly known as Invesco Aim Distributors, Inc.) (registered broker dealer); Manager, Invesco PowerShares Capital Management LLC; Director, Chief Executive Officer and President, Invesco Advisers, Inc.; Director, Chairman, Chief Executive Officer and President, Invesco Aim Capital Management, Inc.; President, Invesco Trimark Dealer Inc. and Invesco Trimark Ltd./Invesco Trimark Ltèe; Director and President, AIM Trimark Corporate Class Inc. and AIM Trimark Canada Fund Inc.; Senior Managing Director, Invesco Holding Company Limited; Trustee and Executive Vice President, Tax-Free Investments Trust; Director and Chairman, Fund Management Company (former registered broker dealer); President and Principal Executive Officer, The Invesco Funds (AIM Treasurer’s Series Trust (Invesco Treasurer’s Series Trust), Short-Term Investments Trust and Tax-Free Investments Trust only); President, AIM Trimark Global Fund Inc. and AIM Trimark Canada Fund Inc. | | | | |
| | | | | | | | | |
| | | | | | | | | |
| | | | | | | | | |
Wayne W. Whalen3 — 1939
Trustee | | 2010 | | Of Counsel, and prior to 2010, partner in the law firm of Skadden, Arps, Slate, Meagher & Flom LLP, legal counsel to funds in the Fund Complex | | 158 | | Director of the Abraham Lincoln Presidential Library Foundation |
| | | | | | | | | |
| | | | | | | | | |
| | | | | | | | | |
| Independent Trustees | | | | | | | | |
| | | | | | | | | |
| | | | | | | | | |
| | | | | | | | | |
Bruce L. Crockett — 1944
Trustee and Chair | | 1993 | | Chairman, Crockett Technology Associates (technology consulting company) | | 140 | | ACE Limited (insurance company); and Investment Company Institute |
| | | | | Formerly: Director, Captaris (unified messaging provider); Director, President and Chief Executive Officer COMSAT Corporation; and Chairman, Board of Governors of INTELSAT (international communications company) | | | | |
| | | | | | | | | |
| |
| 1 | Mr. Flanagan is considered an interested person of the Trust because he is an officer of the adviser to the Trust, and an officer and a director of Invesco Ltd., ultimate parent of the adviser to the Trust. |
| 2 | Mr. Taylor is considered an interested person of the Trust because he is an officer and a director of the adviser to, and a director of the principal underwriter of, the Trust. |
| 3 | Mr. Whalen is considered an “interested person” (within the meaning of Section 2(a)(19) of the 1940 Act) of certain Funds in the Fund Complex by reason of he and his firm currently providing legal services as legal counsel to such Funds in the Fund Complex. |
Invesco Van Kampen V.I. Equity and Income Fund
Trustees and Officers—(continued)
The address of each trustee and officer is AIM Variable Insurance Funds (Invesco Variable Insurance Funds) (the “Trust”), 11 Greenway Plaza, Suite 2500, Houston, Texas 77046-1173. The trustees serve for the life of the Trust, subject to their earlier death, incapacitation, resignation, retirement or removal as more specifically provided in the Trust’s organizational documents. Each officer serves for a one year term or until their successors are elected and qualified. Column two below includes length of time served with predecessor entities, if any.
| | | | | | | | | |
| | | | | | | Number of Funds
| | |
Name, Year of Birth and
| | Trustee and/
| | Principal Occupation(s)
| | in Fund Complex
| | Other Directorship(s)
|
| Position(s) Held with the Trust | | or Officer Since | | During Past 5 Years | | Overseen by Trustee | | Held by Trustee |
Independent Trustees—(continued) | | | | | | |
| | | | | | | | | |
| | | | | | | | | |
| | | | | | | | | |
David C. Arch — 1945
Trustee | | 2010 | | Chairman and Chief Executive Officer of Blistex Inc., a consumer health care products manufacturer. | | 158 | | Member of the Heartland Alliance Advisory Board, a nonprofit organization serving human needs based in Chicago. Board member of the Illinois Manufacturers’ Association. Member of the Board of Visitors, Institute for the Humanities, University of Michigan |
| | | | | | | | | |
| | | | | | | | | |
| | | | | | | | | |
Frank S. Bayley — 1939
Trustee | | 2001 | | Retired
Formerly: Director, Badgley Funds, Inc. (registered investment company) (2 portfolios) and Partner, law firm of Baker & McKenzie
Formerly: Director, Badgley Funds, Inc. (registered investment company) (2 portfolios) and Partner, law firm of Baker & McKenzie | | 140 | | Director and Chairman, C.D. Stimson Company (a real estate investment company) |
| | | | | | | | | |
| | | | | | | | | |
| | | | | | | | | |
James T. Bunch — 1942
Trustee | | 2004 | | Managing Member, Grumman Hill Group LLC (family office private equity management)
Formerly: Founder, Green, Manning & Bunch Ltd. (investment banking firm)(1988-2010); Executive Committee, United States Golf Association; and Director, Policy Studies, Inc. and Van Gilder Insurance Corporation | | 140 | | Vice Chairman, Board of Governors, Western Golf Association/Evans Scholars Foundation and Director, Denver Film Society |
| | | | | | | | | |
| | | | | | | | | |
| | | | | | | | | |
Rodney F. Dammeyer — 1940
Trustee | | 2010 | | President of CAC, LLC, a private company offering capital investment and management advisory services.
Formerly: Prior to January 2004, Director of TeleTech Holdings Inc.; Prior to 2002, Director of Arris Group, Inc.; Prior to 2001, Managing Partner at Equity Group Corporate Investments. Prior to 1995, Vice Chairman of Anixter International. Prior to 1985, experience includes Senior Vice President and Chief Financial Officer of Household International, Inc., Executive Vice President and Chief Financial Officer of Northwest Industries, Inc. and Partner of Arthur Andersen & Co. | | 158 | | Director of Quidel Corporation and Stericycle, Inc. Prior to May 2008, Trustee of The Scripps Research Institute. Prior to February 2008, Director of Ventana Medical Systems, Inc. Prior to April 2007, Director of GATX Corporation. Prior to April 2004, Director of TheraSense, Inc. |
| | | | | | | | | |
| | | | | | | | | |
| | | | | | | | | |
Albert R. Dowden — 1941
Trustee | | 2000 | | Director of a number of public and private business corporations, including the Boss Group, Ltd. (private investment and management); Reich & Tang Funds (5 portfolios) (registered investment company); and Homeowners of America Holding Corporation/ Homeowners of America Insurance Company (property casualty company)
Formerly: Director, Continental Energy Services, LLC (oil and gas pipeline service); Director, CompuDyne Corporation (provider of product and services to the public security market) and Director, Annuity and Life Re (Holdings), Ltd. (reinsurance company); Director, President and Chief Executive Officer, Volvo Group North America, Inc.; Senior Vice President, AB Volvo; Director of various public and private corporations; Chairman, DHJ Media, Inc.; Director Magellan Insurance Company; and Director, The Hertz Corporation, Genmar Corporation (boat manufacturer), National Media Corporation; Advisory Board of Rotary Power International (designer, manufacturer, and seller of rotary power engines); and Chairman, Cortland Trust, Inc. (registered investment company) | | 140 | | Board of Nature’s Sunshine Products, Inc. |
| | | | | | | | | |
| | | | | | | | | |
| | | | | | | | | |
Jack M. Fields — 1952
Trustee | | 1997 | | Chief Executive Officer, Twenty First Century Group, Inc. (government affairs company); and Owner and Chief Executive Officer, Dos Angelos Ranch, L.P. (cattle, hunting, corporate entertainment), Discovery Global Education Fund (non-profit) and Cross Timbers Quail Research Ranch (non-profit)
Formerly: Chief Executive Officer, Texana Timber LP (sustainable forestry company) and member of the U.S. House of Representatives | | 140 | | Administaff |
| | | | | | | | | |
| | | | | | | | | |
| | | | | | | | | |
Carl Frischling — 1937
Trustee | | 1993 | | Partner, law firm of Kramer Levin Naftalis and Frankel LLP | | 140 | | Director, Reich & Tang Funds (16 portfolios) |
| | | | | | | | | |
Invesco Van Kampen V.I. Equity and Income Fund
Trustees and Officers—(continued)
The address of each trustee and officer is AIM Variable Insurance Funds (Invesco Variable Insurance Funds) (the “Trust”), 11 Greenway Plaza, Suite 2500, Houston, Texas 77046-1173. The trustees serve for the life of the Trust, subject to their earlier death, incapacitation, resignation, retirement or removal as more specifically provided in the Trust’s organizational documents. Each officer serves for a one year term or until their successors are elected and qualified. Column two below includes length of time served with predecessor entities, if any.
| | | | | | | | | |
| | | | | | | Number of Funds
| | |
Name, Year of Birth and
| | Trustee and/
| | Principal Occupation(s)
| | in Fund Complex
| | Other Directorship(s)
|
| Position(s) Held with the Trust | | or Officer Since | | During Past 5 Years | | Overseen by Trustee | | Held by Trustee |
Independent Trustees—(continued) | | | | | | |
| | | | | | | | | |
| | | | | | | | | |
| | | | | | | | | |
Prema Mathai-Davis — 1950
Trustee | | 1998 | | Retired
Formerly: Chief Executive Officer, YWCA of the U.S.A. | | 140 | | None |
| | | | | | | | | |
| | | | | | | | | |
| | | | | | | | | |
Larry Soll — 1942
Trustee | | 2004 | | Retired
Formerly, Chairman, Chief Executive Officer and President, Synergen Corp. (a biotechnology company) | | 140 | | None |
| | | | | | | | | |
| | | | | | | | | |
| | | | | | | | | |
Hugo F. Sonnenschein — 1940
Trustee | | 2010 | | President Emeritus and Honorary Trustee of the University of Chicago and the Adam Smith Distinguished Service Professor in the Department of Economics at the University of Chicago. Prior to July 2000, President of the University of Chicago. | | 158 | | Trustee of the University of Rochester and a member of its investment committee. Member of the National Academy of Sciences, the American Philosophical Society and a fellow of the American Academy of Arts and Sciences |
| | | | | | | | | |
| | | | | | | | | |
| | | | | | | | | |
| Raymond Stickel, Jr. — 1944 Trustee | | 2005 | | Retired
Formerly: Director, Mainstay VP Series Funds, Inc. (25 portfolios) and Partner, Deloitte & Touche | | 140 | | None |
| | | | | | | | | |
| | | | | | | | | |
| | | | | | | | | |
| Other Officers | | | | | | | | |
| | | | | | | | | |
| | | | | | | | | |
| | | | | | | | | |
Russell C. Burk — 1958
Senior Vice President and Senior Officer | | 2005 | | Senior Vice President and Senior Officer, The Invesco Funds | | N/A | | N/A |
| | | | | | | | | |
| | | | | | | | | |
| | | | | | | | | |
John M. Zerr — 1962
Senior Vice President, Chief Legal Officer and Secretary | | 2006 | | Director, Senior Vice President, Secretary and General Counsel, Invesco Management Group, Inc. (formerly known as Invesco Aim Management Group, Inc.) and Van Kampen Exchange Corp.; Senior Vice President, Invesco Advisers, Inc. (formerly known as Invesco Institutional (N.A.), Inc.) (registered investment adviser); Senior Vice President and Secretary, Invesco Distributors, Inc. (formerly known as Invesco Aim Distributors, Inc.); Director, Vice President and Secretary, Invesco Investment Services, Inc. (formerly known as Invesco Aim Investment Services, Inc.) and IVZ Distributors, Inc. (formerly known as INVESCO Distributors, Inc.); Director and Vice President, INVESCO Funds Group, Inc.; Senior Vice President, Chief Legal Officer and Secretary, The Invesco Funds; Manager, Invesco PowerShares Capital Management LLC; Director, Secretary and General Counsel, Invesco Investment Advisers LLC (formerly known as Van Kampen Asset Management); Secretary and General Counsel, Van Kampen Funds Inc. and Chief Legal Officer, PowerShares Exchange-Traded Fund Trust, PowerShares Exchange-Traded Fund Trust II, PowerShares India Exchange-Traded Fund Trust and PowerShares Actively Managed Exchange-Traded Fund Trust
Formerly: Director and Secretary, Van Kampen Advisors Inc.; Director Vice President, Secretary and General Counsel Van Kampen Investor Services Inc.; Director, Invesco Distributors, Inc. (formerly known as Invesco Aim Distributors, Inc.); Director, Senior Vice President, General Counsel and Secretary, Invesco Advisers, Inc.; and Van Kampen Investments Inc.; Director, Vice President and Secretary, Fund Management Company; Director, Senior Vice President, Secretary, General Counsel and Vice President, Invesco Aim Capital Management, Inc.; Chief Operating Officer and General Counsel, Liberty Ridge Capital, Inc. (an investment adviser); Vice President and Secretary, PBHG Funds (an investment company) and PBHG Insurance Series Fund (an investment company); Chief Operating Officer, General Counsel and Secretary, Old Mutual Investment Partners (a broker-dealer); General Counsel and Secretary, Old Mutual Fund Services (an administrator) and Old Mutual Shareholder Services (a shareholder servicing center); Executive Vice President, General Counsel and Secretary, Old Mutual Capital, Inc. (an investment adviser); and Vice President and Secretary, Old Mutual Advisors Funds (an investment company) | | N/A | | N/A |
| | | | | | | | | |
| | | | | | | | | |
| | | | | | | | | |
Lisa O. Brinkley — 1959
Vice President | | 2004 | | Global Compliance Director, Invesco Ltd.; Chief Compliance Officer, Invesco Investment Services, Inc.(formerly known as Invesco Aim Investment Services, Inc.); and Vice President, The Invesco Funds
Formerly: Chief Compliance Officer, Invesco Distributors, Inc. (formerly known as Invesco Aim Distributors, Inc.) and Van Kampen Investor Services Inc.; Senior Vice President, Invesco Management Group, Inc.; Senior Vice President and Chief Compliance Officer, Invesco Advisers, Inc. and The Invesco Funds; Vice President and Chief Compliance Officer, Invesco Aim Capital Management, Inc. and Invesco Distributors, Inc.; Vice President, Invesco Investment Services, Inc. and Fund Management Company | | N/A | | N/A |
| | | | | | | | | |
Invesco Van Kampen V.I. Equity and Income Fund
Trustees and Officers—(continued)
The address of each trustee and officer is AIM Variable Insurance Funds (Invesco Variable Insurance Funds) (the “Trust”), 11 Greenway Plaza, Suite 2500, Houston, Texas 77046-1173. The trustees serve for the life of the Trust, subject to their earlier death, incapacitation, resignation, retirement or removal as more specifically provided in the Trust’s organizational documents. Each officer serves for a one year term or until their successors are elected and qualified. Column two below includes length of time served with predecessor entities, if any.
| | | | | | | | | |
| | | | | | | Number of Funds
| | |
Name, Year of Birth and
| | Trustee and/
| | Principal Occupation(s)
| | in Fund Complex
| | Other Directorship(s)
|
| Position(s) Held with the Trust | | or Officer Since | | During Past 5 Years | | Overseen by Trustee | | Held by Trustee |
Other Officers—(continued) | | | | | | |
| | | | | | | | | |
| | | | | | | | | |
| | | | | | | | | |
Sheri Morris — 1964
Vice President, Treasurer and Principal Financial Officer | | 1999 | | Vice President, Treasurer and Principal Financial Officer, The Invesco Funds; Vice President, Invesco Advisers, Inc. (formerly known as Invesco Institutional (N.A.), Inc.) (registered investment adviser).
Formerly: Treasurer, PowerShares Exchange-Traded Fund Trust, PowerShares Exchange-Traded Fund Trust II, PowerShares India Exchange-Traded Fund Trust and PowerShares Actively Managed Exchange-Traded Fund Trust, Vice President, Invesco Advisers, Inc., Invesco Aim Capital Management, Inc. and Invesco Aim Private Asset Management, Inc.; Assistant Vice President and Assistant Treasurer, The Invesco Funds and Assistant Vice President, Invesco Advisers, Inc., Invesco Aim Capital Management, Inc. and Invesco Aim Private Asset Management, Inc. | | N/A | | N/A |
| | | | | | | | | |
| | | | | | | | | |
| | | | | | | | | |
Karen Dunn Kelley — 1960
Vice President | | 1993 | | Head of Invesco’s World Wide Fixed Income and Cash Management Group; Senior Vice President, Invesco Management Group, Inc. (formerly known as Invesco Aim Management Group, Inc.) and Invesco Advisers, Inc. (formerly known as Invesco Institutional (N.A.), Inc.) (registered investment adviser); Executive Vice President, Invesco Distributors, Inc. (formerly known as Invesco Aim Distributors, Inc.); Director, Invesco Mortgage Capital Inc.; Vice President, The Invesco Funds (other than AIM Treasurer’s Series Trust (Invesco Treasurer’s Series Trust) and Short-Term Investments Trust); and President and Principal Executive Officer, The Invesco Funds (AIM Treasurer’s Series Trust (Invesco Treasurer’s Series Trust) and Short-Term Investments Trust only).
Formerly: Senior Vice President, Van Kampen Investments Inc.; Vice President, Invesco Advisers, Inc. (formerly known as Invesco Institutional (N.A.), Inc.); Director of Cash Management and Senior Vice President, Invesco Advisers, Inc. and Invesco Aim Capital Management, Inc.; President and Principal Executive Officer, Tax-Free Investments Trust; Director and President, Fund Management Company; Chief Cash Management Officer, Director of Cash Management, Senior Vice President, and Managing Director, Invesco Aim Capital Management, Inc.; Director of Cash Management, Senior Vice President, and Vice President, Invesco Advisers, Inc. and The Invesco Funds (AIM Treasurer’s Series Trust (Invesco Treasurer’s Series Trust), Short-Term Investments Trust and Tax-Free Investments Trust only) | | N/A | | N/A |
| | | | | | | | | |
| | | | | | | | | |
| | | | | | | | | |
Yinka Akinsola — 1977
Anti-Money Laundering Compliance Officer | | 2011 | | Anti-Money Laundering Compliance Officer, Invesco Advisers, Inc. (formerly known as Invesco Institutional (N.A.), Inc.) (registered investment adviser); Invesco Distributors, Inc. (formerly known as Invesco Aim Distributors, Inc.), Invesco Investment Services, Inc. (formerly known as Invesco Aim Investment Services, Inc.), Invesco Management Group, Inc., The Invesco Funds, Invesco Van Kampen Closed-End Funds, Van Kampen Exchange Corp. and Van Kampen Funds Inc. | | N/A | | N/A |
| | | | | | | | | |
| | | | | | | | | |
| | | | | | | | | |
Todd L. Spillane — 1958
Chief Compliance Officer | | 2006 | | Senior Vice President, Invesco Management Group, Inc. (formerly known as Invesco Aim Management Group, Inc.) and Van Kampen Exchange Corp.; Senior Vice President and Chief Compliance Officer, Invesco Advisers, Inc. (registered investment adviser) (formerly known as Invesco Institutional (N.A.), Inc.); Chief Compliance Officer, The Invesco Funds, INVESCO Private Capital Investments, Inc. (holding company) and Invesco Private Capital, Inc. (registered investment adviser); Vice President, Invesco Distributors, Inc. (formerly known as Invesco Aim Distributors, Inc.) and Invesco Investment Services, Inc. (formerly known as Invesco Aim Investment Services, Inc.).
Formerly: Chief Compliance Officer, Invesco Van Kampen Closed-End Funds PowerShares Exchange-Traded Fund Trust, PowerShares Exchange-Traded Fund Trust II, PowerShares India Exchange-Traded Fund Trust, and PowerShares Actively Managed Exchange-Traded Fund Trust; Senior Vice President, Van Kampen Investments Inc.; Senior Vice President and Chief Compliance Officer, Invesco Advisers, Inc. and Invesco Aim Capital Management, Inc.; Chief Compliance Officer, Invesco Global Asset Management (N.A.), Inc., Invesco Senior Secured Management, Inc. (registered investment adviser) and Van Kampen Investor Services Inc.; Vice President, Invesco Aim Capital Management, Inc. and Fund Management Company | | N/A | | N/A |
| | | | | | | | | |
The Statement of Additional Information of the Trust includes additional information about the Fund’s Trustees and is available upon request, without charge, by calling 1.800.959.4246. Please refer to the Fund’s prospectus for information on the Fund’s sub-advisers.
| | | | | | | |
Office of the Fund
11 Greenway Plaza, Suite 2500
Houston, TX 77046-1173 | | Investment Adviser
Invesco Advisers, Inc.
1555 Peachtree Street, N.E.
Atlanta, GA 30309 | | Distributor
Invesco Distributors, Inc.
11 Greenway Plaza, Suite 2500
Houston, TX 77046-1173 | | Auditors
PricewaterhouseCoopers LLP
1201 Louisiana Street, Suite 2900
Houston, TX 77002-5678 |
| | | | | | | |
| | | | | | | |
Counsel to the Fund
Stradley Ronon Stevens & Young, LLP
2600 One Commerce Square
Philadelphia, PA 19103 | | Counsel to the Independent Trustees
Kramer, Levin, Naftalis & Frankel LLP
1177 Avenue of the Americas
New York, NY 10036-2714 | | Transfer Agent
Invesco Investment Services, Inc.
11 Greenway Plaza, Suite 2500
Houston, TX77046-1173 | | Custodian
State Street Bank and Trust Company
225 Franklin
Boston, MA 02110-2801 |
Invesco Van Kampen V.I. Equity and Income Fund
Invesco Van Kampen V.I. Global Value
Equity Fund
Annual Report to Shareholders § December 31, 2011
The Fund provides a complete list of its holdings four times in each fiscal year, at the quarter-ends. For the second and fourth quarters, the lists appear in the Fund’s semiannual and annual reports to shareholders. For the first and third quarters, the Fund files the lists with the Securities and Exchange Commission (SEC) on Form N-Q. The Fund’s Form N-Q filings are available on the SEC website, sec.gov. Copies of the Fund’s Forms N-Q may be reviewed and copied at the SEC Public Reference Room in Washington, D.C. You can obtain information on the operation of the Public Reference Room, including information about duplicating fee charges, by calling 202 551 8090 or 800 732 0330, or by electronic request at the following email address: publicinfo@sec.gov. The SEC file numbers for the Fund are 811-07452 and 033-57340. The Fund’s most recent portfolio holdings, as filed on Form N-Q, have also been made available to insurance companies issuing variable annuity contracts and variable life insurance policies (“variable products”) that invest in the Fund.
A description of the policies and procedures that the Fund uses to determine how to vote proxies relating to portfolio securities is available without charge, upon request, from our Client Services department at 800 959 4246 or at invesco.com/proxyguidelines. The information is also available on the SEC website, sec.gov.
Information regarding how the Fund voted proxies related to its portfolio securities during the 12 months ended June 30, 2011, is available at invesco.com/proxysearch. The information is also available on the SEC website, sec.gov.
Invesco Advisers, Inc. is an investment adviser; it provides investment advisory services to individual and institutional clients and does not sell securities. Invesco Distributors, Inc. is the U.S. distributor for Invesco Ltd.’s retail mutual funds, exchange-traded funds and institutional money market funds. Both are wholly owned, indirect subsidiaries of Invesco Ltd.
This report must be accompanied or preceded by a currently effective Fund prospectus and variable product prospectus, which contain more complete information, including sales charges and expenses. Investors should read each carefully before investing.
Invesco Distributors, Inc.
VK-VIGVE-AR-1
| | | | | |
| |
| NOT FDIC INSURED | | MAY LOSE VALUE | | NO BANK GUARANTEE |
Management’s Discussion of Fund Performance
Performance summary
For the year ended December 31, 2011, Invesco Van Kampen V.I. Global Value Equity Fund underperformed the MSCI World Index and the Lipper VUF Global Core Funds Index. Stock selection during the volatile year was a hindrance to the Fund’s performance. Stock selection in the energy, health care, consumer staples and utilities sectors contributed to performance, while holdings in the financials, industrials, materials, information technology and consumer discretionary sectors detracted from performance during the reporting period.
Your Fund’s long-term performance appears later in this report.
Fund vs. Indexes
Total returns, 12/31/10 to 12/31/11, excluding variable product issuer charges.
If variable product issuer charges were included, returns would be lower.
| | | | | |
| Series I Shares | | | -10.89 | % |
| |
| Series II Shares | | | -11.12 | |
| |
MSCI World Index▼(Broad Market / Style-Specific Index) | | | -5.54 | |
| |
Lipper VUF Global Core Funds Index▼(Peer Group Index) | | | -7.88 | |
| |
| | |
| Source: ▼ Lipper Inc. |
| As noted in the Fund’s latest semiannual report, the Fund has adopted a three-tier benchmark structure to compare its performance to broad market, style-specific and peer group market measures. |
How we invest
The Fund invests primarily in stocks of mid- and large-cap global companies with records of stable earnings and strong balance sheets that are offering attractive valuations relative to the broad market and their peers. We take a bottom-up, research driven approach. We begin with a universe of global equities with greater than $1 billion in market capitalization and up to 10 years of financial statement information from both developed and emerging markets. We make adjustments to each company’s financial history for inflation rates and select accounting conventions to create a comparable basis for analysis. We then rank the universe using a proprietary three-factor valuation ranking model that combines a company’s implied return, price/book ratio and price/earnings ratio. Attractively ranked companies are then subjected to rigorous fundamental research focused on evaluating the
potential sustainability of company profitability. The most attractive stocks from the valuation screen, which have also passed rigorous fundamental research, are candidates for inclusion in the portfolio. At the portfolio level, we seek to achieve appropriate diversification relative to the MSCI World Index and we take a long-term investment horizon in evaluating companies, which results in relatively low rates of portfolio turnover.
We strive to maintain a consistent investment discipline through varying market conditions and an appropriate level of overall portfolio diversification. Individual holdings are selected based on their own merits, however, and not on projections of country or sector performance.
Our sell discipline is a replication of the security selection process in that we look to trim or liquidate positions in the portfolio based on valuation, fundamentals or portfolio design considerations.
Market conditions and your Fund
Global equity markets faced headwinds in 2011. Notably, several southern European economies, including Greece, Spain, Portugal and Italy, faced solvency concerns amid massive fiscal deficits. Although the U.S. economy continued to grow in 2011, investors remained concerned about high unemployment and a still-weak housing market. The reporting period ended with a market upswing, as European leaders took steps to address the Greek sovereign debt issue and stabilize the region’s banking system.
Market volatility was a common theme for the reporting period. The sovereign debt crisis intensified in the eurozone, and global growth slowed, prompting concerns of a global recession. Market volatility increased drastically due to civil unrest in the Middle East and northern Africa and a devastating earthquake and tsunami in Japan. Renewed credit problems overseas and the market correction that occurred during the summer months created a more uncertain environment which prompted many investors to favor relative safety over risk.
In emerging market countries, investors grew risk-averse on news of potential defaults in Europe as well as slowing growth and accounting concerns in China. This led to a relatively indiscriminate correction in almost all emerging market countries. Unease about potential overheating in emerging market economies, coupled with the potential of a double-dip recession in developed economies, fostered uncertainty about the pace and vigor of a global economic recovery.
The Fund stayed true to its process by adhering to its quality orientation in stock selection. Our stock selection in the energy, health care and consumer staples sectors made the largest contribution to
Portfolio Composition
By country
| | | | | |
| United States | | | 39.8 | % |
| |
| Japan | | | 12.9 | |
| |
| United Kingdom | | | 10.4 | |
| |
| Switzerland | | | 5.8 | |
| |
| France | | | 4.5 | |
| |
| Germany | | | 3.3 | |
| |
| Australia | | | 2.7 | |
| |
| Spain | | | 2.6 | |
| |
| Norway | | | 2.5 | |
| |
| South Korea | | | 2.2 | |
| |
| Canada | | | 2.0 | |
| |
| Countries Each With | | | | |
| Less Than 2% of Portfolio | | | 9.4 | |
| |
Money Market Funds Plus Other Assets Less Liabilities | | | 1.9 | |
Top 10 Equity Holdings*
| | | | | | | | | |
| | 1. | | | Imperial Tobacco Group PLC | | | 2.8 | % |
| |
| | 2. | | | Royal Dutch Shell PLC-Class A | | | 2.7 | |
| |
| | 3. | | | Chevron Corp. | | | 2.7 | |
| |
| | 4. | | | ACE Ltd. | | | 2.6 | |
| |
| | 5. | | | Western Digital Corp. | | | 2.4 | |
| |
| | 6. | | | Coach, Inc. | | | 2.2 | |
| |
| | 7. | | | WellPoint Inc. | | | 2.1 | |
| |
| | 8. | | | Cisco Systems, Inc. | | | 2.1 | |
| |
| | 9. | | | ConocoPhillips | | | 2.0 | |
| |
| | 10. | | | General Dynamics Corp. | | | 2.0 | |
Top Five Industries
| | | | | |
| 1. Integrated Oil & Gas | | | 11.9 | % |
| |
| 2. Diversified Banks | | | 7.8 | |
| |
| 3. Pharmaceuticals | | | 6.3 | |
| |
| 4. Integrated Telecommunication Services | | | 5.0 | |
| |
| 5. Property & Casualty Insurance | | | 4.0 | |
| | |
| Total Net Assets | | $99.9 million |
| | | |
| Total Number of Holdings* | | 108 |
The Fund’s holdings are subject to change, and there is no assurance that the Fund will continue to hold any particular security.
*Excluding money market fund holdings.
Invesco Van Kampen V.I. Global Value Equity Fund
the Fund’s relative performance. In the energy sector, oil and gas distributors Chevron and Royal Dutch Shell contributed to Fund performance. During the reporting period, Chevron completed its acquisition of Atlas Energy, a provider of natural gas gathering, processing and treating services.
Holdings in several sectors, including financials and industrials, detracted from Fund performance for the year.
In the financials sector, both Bank of America and French bank BNP Paribas hindered Fund performance. Fitch Ratings cut by one notch its long-term ratings on Bank of America and BNP Paribas at the end of the year. Fitch said that the financial market challenges the banks face “result from both economic developments as well as a myriad of regulatory changes.” Within the industrials sector, Fund holdings BHP Billiton and Yara International struggled, delivering negative performance for the year.
From a geographic perspective, the Fund’s exposure to the U.K., Australia, Italy and Canada contributed to performance during the year. Conversely, our stock selection in the U.S., Hong Kong, Germany and Spain hurt Fund performance versus the style-specific benchmark. Additionally, exposure to non-benchmark areas such as emerging markets was a negative for the Fund during the reporting period.
Shifts in sector and country weights, which were driven by our bottom-up stock selection approach, were relatively minor during the year. The Fund remained overweight in the energy and telecommunication services sectors relative to its style-specific index. The Fund remained underweight relative to the index in the industrials, information technology and utilities sectors.
From a geographic perspective, the Fund maintained overweight exposure to Japan and significantly underweight exposure to the U.S., positions that were in place throughout 2011. The Fund’s underweight exposure to the U.S. was a detractor relative to the style-specific index during the year.
At the end of the reporting period, many of the issues that plagued markets in 2011 remained unresolved and seemed likely to continue to contribute to high levels of volatility. In Europe, the sovereign debt crisis showed no signs of abating and appeared to have pushed economies in the region back into recession. While economic data remained more resilient in the U.S., overall growth clearly slowed across developed and emerging markets. That
said, corporate balance sheets were generally healthy and market valuations were attractive from a historical context. The Fund continued to find investment opportunities in this market environment, and our approach to building a diversified portfolio with above-average profitability characteristics and discounted valuations may position us favorably for the long term.
We caution investors against making investment decisions based on short-term performance.
We welcome any new investors who joined the Fund during the year, and we thank all of our shareholders for your continued investment in Invesco Van Kampen V.I. Global Value Equity Fund.
The views and opinions expressed in management’s discussion of Fund performance are those of Invesco Advisers, Inc. These views and opinions are subject to change at any time based on factors such as market and economic conditions. These views and opinions may not be relied upon as investment advice or recommendations, or as an offer for a particular security. The information is not a complete analysis of every aspect of any market, country, industry, security or the Fund. Statements of fact are from sources considered reliable, but Invesco Advisers, Inc. makes no representation or warranty as to their completeness or accuracy. Although historical performance is no guarantee of future results, these insights may help you understand our investment management philosophy.
See important Fund and, if applicable, index disclosures later in this report.
Ingrid Baker
Chartered Financial Analyst, portfolio manager, is manager of Invesco Van Kampen V.I. Global Value Equity Fund. She joined Invesco in 1999. Ms. Baker earned a B.A. in international politics from Oberlin College and an M.B.A. in finance from the University of Navarra.
W. Lindsay Davidson
Portfolio manager, is manager of Invesco Van Kampen V.I. Global Value Equity Fund. He joined Invesco in 1984. Mr. Davidson earned a degree in economics from Edinburgh University.
E. Sargent McGowan
Chartered Financial Analyst, portfolio manager, is manager of Invesco Van Kampen V.I. Global Value Equity Fund. He joined Invesco in 2002. Mr. McGowan earned a B.S. in commerce from the University of Virginia and an M.B.A. in investment management from the University of North Carolina.
Anuja Singha
Chartered Financial Analyst, portfolio manager, is manager of Invesco Van Kampen V.I. Global Value Equity Fund. She joined Invesco in 1998. Ms. Singha earned a B.A. in economics from Mills College and a Ph.D. in economics from Emory University.
Stephen Thomas
Chartered Financial Analyst, portfolio manager, is manager of Invesco Van Kampen V.I. Global Value Equity Fund. He joined Invesco in 2000. Mr. Thomas earned a B.B.A. in banking/finance and an M.B.A. from the University of Mississippi.
Invesco Van Kampen V.I. Global Value Equity Fund
Your Fund’s Long-Term Performance
Results of a $10,000 Investment – Oldest Share Class(es)
Fund and index data from 12/31/01*
| | |
| * | During the reporting period, Invesco changed its policy regarding growth of $10,000 charts. For funds older than 10 years, we previously showed performance since inception. Going forward, we will show performance for the most recent 10 years, since this more accurately reflects the experience of the typical shareholder. As a result, charts now may include benchmarks that did not appear previously, because the funds’ inception pre-dated the benchmarks’ inception. Also, all charts will now be presented using a linear format. |
Past performance cannot guarantee comparable future results.
As noted earlier in this report, the Fund has adopted a three-tier benchmark structure to compare its performance to broad market, style-specific and peer
group market measures. These additional benchmarks will now be included in the chart above.
| | | | |
| |
| Average Annual Total Returns |
| As of 12/31/11 |
| | | | | |
Series I Shares | | | | |
| |
| Inception (1/2/97) | | | 3.52 | % |
| |
| 10 Years | | | 1.35 | |
| |
| 5 Years | | | -6.05 | |
| |
| 1 Year | | | -10.89 | |
| |
| | | | | |
Series II Shares | | | | |
| |
| 10 Years | | | 1.09 | % |
| |
| 5 Years | | | -6.28 | |
| |
| 1 Year | | | -11.12 | |
Effective June 1, 2010, Class I shares of the predecessor fund, Universal Funds Global Value Equity Portfolio, advised by Morgan Stanley Investment Management Inc. were reorganized into Series I shares of Invesco Van Kampen V.I. Global Value Equity Fund. Returns shown above for Series I shares are blended returns of the predecessor fund and Invesco Van Kampen V.I. Global Value Equity Fund. Share class returns will differ from the predecessor fund because of different expenses.
Series II shares incepted on June 1, 2010. Series II shares performance shown prior to that date is that of the predecessor fund’s Class I shares restated to reflect the higher 12b-1 fees applicable to Series II shares. Class I
shares performance reflects any applicable fee waivers or expense reimbursements. The inception date of the predecessor fund’s Class I shares is January 2, 1997.
The performance data quoted represent past performance and cannot guarantee comparable future results; current performance may be lower or higher. Please contact your variable product issuer or financial adviser for the most recent month-end variable product performance. Performance figures reflect Fund expenses, reinvested distributions and changes in net asset value. Investment return and principal value will fluctuate so that you may have a gain or loss when you sell shares.
The net annual Fund operating expense ratio set forth in the most recent Fund prospectus as of the date of this report for Series I and Series II shares was 0.94% and 1.19%, respectively.1 The total annual Fund operating expense ratio set forth in the most recent Fund prospectus as of the date of this report for Series I and Series II shares was 1.10% and 1.35%, respectively. The expense ratios presented above may vary from the expense ratios presented in other sections of this report that are based on expenses
incurred during the period covered by this report.
Invesco Van Kampen V.I. Global Value Equity Fund, a series portfolio of AIM Variable Insurance Funds (Invesco Variable Insurance Funds), is currently offered through insurance companies issuing variable products. You cannot purchase shares of the Fund directly. Performance figures given represent the Fund and are not intended to reflect actual variable product values. They do not reflect sales charges, expenses and fees assessed in connection with a variable product. Sales charges, expenses and fees, which are determined by the variable product issuers, will vary and will lower the total return.
The most recent month-end performance data at the Fund level, excluding variable product charges, is available at 800 451 4246. As mentioned above, for the most recent month-end performance including variable product charges, please contact your variable product issuer or financial adviser.
| 1 | | Total annual Fund operating expenses after any contractual fee waivers and/or expense reimbursements by the adviser in effect through at least June 30, 2012. See current prospectus for more information. |
Invesco Van Kampen V.I. Global Value Equity Fund
Invesco Van Kampen V.I. Global Value Equity Fund’s investment objective is long-term capital appreciation by investing primarily in equity securities of issuers throughout the world, including U.S. issuers.
| n | | Unless otherwise stated, information presented in this report is as of December 31, 2011, and is based on total net assets. |
| |
| n | | Unless otherwise noted, all data provided by Invesco. |
| |
| n | | To access your Fund’s reports/prospectus, visit invesco.com/fundreports. |
Principal risks of investing in the Fund
Depositary receipts risk. Depositary receipts involve many of the same risks as those associated with direct investment in foreign securities. In addition, the underlying issuers of certain depositary receipts, particularly unsponsored or unregistered depositary receipts, are under no obligation to distribute shareholder communications to the holders of such receipts or to pass through to them any voting rights with respect to the deposited securities.
Equity securities risk. In general, prices of equity securities are more volatile than those of fixed income securities. Investing in securities of small- and mid-sized companies involves greater risks than is customarily associated with investing in larger, more established companies.
Value investing risk. Value stocks can react differently to issuer, political, market and economic developments than the market as a whole and other types of stocks. Value stocks can continue to be undervalued for long periods of time and may not ever realize their full value.
Foreign and emerging markets risks. Investing in the securities of foreign issuers, particularly those located in emerging market or developing countries, entails the risk that news and events unique to a country or region will affect those markets and their issuers. In addition, the Fund’s investments in foreign issuers generally will be denominated in foreign currencies. As a result, changes in the value of a country’s currency compared to the U.S. dollar may affect the value of the Fund’s investments.
Futures risk. A decision as to whether, when and how to use futures involves the exercise of skill and judgment and even a well conceived futures transaction may be unsuccessful because of market behavior or unexpected events.
Options risk. A decision as to whether, when and how to use options involves the exercise of skill and judgment and even a well conceived option transaction may be unsuccessful because of market behavior or unexpected events. The prices of options can be highly volatile and the use of options can lower total returns.
Investing in real estate investment trusts (REITs) risks. Investing in REITs makes the Fund more susceptible to risks associated with the ownership of real estate and with the real estate industry in general. In addition, REITs depend upon specialized management skills, may not be diversified, may have less trading volume, and may be subject to more abrupt or erratic price movements than the overall securities markets. REITs must comply with certain requirements of the federal income tax law to maintain their federal income tax status. Investments in REITs may involve duplication of management fees and certain other expenses.
Derivatives risk. Derivative transactions involve risks different from direct investments in underlying securities. Risks of derivatives include the possible imperfect correlation between the value of the instruments and the underlying assets; risks of default by the other party to certain transactions; risks that the transactions may result in losses that partially or completely offset gains in portfolio positions; and risks that the transactions may not be liquid.
Small and mid-capitalization risk. Stocks of small and mid-sized companies tend to be more vulnerable to adverse developments in the above factors and may have little or no operating history or track record of success, and limited product lines, markets, management and financial resources. The securities of small and mid-sized companies may be more volatile due to less market interest and less publicly available information about the issuer. They also may be illiquid or restricted as to resale, or may trade less frequently and in smaller volumes, all of which may cause difficulty when establishing or closing a position at a desirable price.
Swaps risk. A swap contract is an agreement between two parties pursuant to which the parties exchange payments at specified dates on the basis of a specified notional amount, with the payments calculated by reference to specified securities, indexes, reference rates, currencies or other instruments. Swaps are subject to credit risk and counterparty risk.
About indexes used in this report
The MSCI World IndexSM is an unmanaged index considered representative of stocks of developed countries.
The Lipper VUF Global Core Funds Index is an unmanaged index considered representative of global core variable insurance underlying funds tracked by Lipper.
The Fund is not managed to track the performance of any particular index, including the index(es) defined here, and consequently, the performance of the Fund may deviate significantly from the performance of the index(es).
A direct investment cannot be made in an index. Unless otherwise indicated, index results include reinvested dividends, and they do not reflect sales charges. Performance of the peer group, if applicable, reflects fund expenses; performance of a market index does not.
Other information
The Chartered Financial Analyst® (CFA®) designation is globally recognized and attests to a charterholder’s success in a rigorous and comprehensive study program in the field of investment management and research analysis.
Industry classifications used in this report are generally according to the Global Industry Classification Standard, which was developed by and is the exclusive property and a service mark of MSCI Inc. and Standard & Poor’s.
The returns shown in management’s discussion of Fund performance are based on net asset values calculated for shareholder transactions. Generally accepted accounting principles require adjustments to be made to the net assets of the Fund at period end for financial reporting purposes, and as such, the net asset values for shareholder transactions and the returns based on those net asset values may differ from the net asset values and returns reported in the Financial Highlights. Additionally, the returns and net asset values shown throughout this report are at the Fund level only and do not include variable product issuer charges. If such charges were included, the total returns would be lower.
Invesco Van Kampen V.I. Global Value Equity Fund
Schedule of Investments
December 31, 2011
| | | | | | | | | |
| | | Shares | | Value |
| |
Common Stocks & Other Equity Interests–96.28%
|
Australia–2.69%
| | | | |
| Australia & New Zealand Banking Group Ltd. | | | 44,352 | | | $ | 929,442 | |
| |
| Macquarie Group Ltd. | | | 25,005 | | | | 608,432 | |
| |
| Telstra Corp. Ltd. | | | 337,238 | | | | 1,148,607 | |
| |
| | | | | | | | 2,686,481 | |
| |
Brazil–1.17%
| | | | |
Banco Santander Brasil S.A.(a) | | | 26,900 | | | | 215,569 | |
| |
Companhia Energetica de Minas Gerais–ADR(b) | | | 13,468 | | | | 239,596 | |
| |
| PDG Realty S.A. Empreendimentos e Participacoes | | | 63,600 | | | | 201,007 | |
| |
| Petroleo Brasileiro S.A.–ADR | | | 11,631 | | | | 289,030 | |
| |
| Vale S.A.–ADR | | | 10,171 | | | | 218,168 | |
| |
| | | | | | | | 1,163,370 | |
| |
Canada–2.05%
| | | | |
| Nexen Inc. | | | 56,101 | | | | 892,616 | |
| |
| Toronto-Dominion Bank (The) | | | 15,397 | | | | 1,152,961 | |
| |
| | | | | | | | 2,045,577 | |
| |
China–1.14%
| | | | |
| China Construction Bank Corp.–Class H | | | 359,000 | | | | 250,532 | |
| |
| China Dongxiang Group Co. | | | 586,000 | | | | 99,596 | |
| |
| China Minsheng Banking Corp., Ltd.–Class H | | | 321,500 | | | | 278,590 | |
| |
| CNOOC Ltd. | | | 133,000 | | | | 232,552 | |
| |
| KWG Property Holding Ltd. | | | 232,500 | | | | 78,432 | |
| |
| Renhe Commercial Holdings Co., Ltd. | | | 1,780,000 | | | | 203,234 | |
| |
| | | | | | | | 1,142,936 | |
| |
France–4.53%
| | | | |
| BNP Paribas S.A. | | | 30,424 | | | | 1,195,116 | |
| |
| Bouygues S.A. | | | 27,633 | | | | 867,033 | |
| |
| Sanofi | | | 17,235 | | | | 1,261,151 | |
| |
| Total S.A. | | | 23,515 | | | | 1,200,275 | |
| |
| | | | | | | | 4,523,575 | |
| |
Germany–1.89%
| | | | |
| Deutsche Lufthansa AG–Registered Shares | | | 83,955 | | | | 998,069 | |
| |
| Salzgitter AG | | | 17,687 | | | | 884,329 | |
| |
| | | | | | | | 1,882,398 | |
| |
Hong Kong–1.23%
| | | | |
| Cheung Kong (Holdings) Ltd. | | | 73,000 | | | | 864,963 | |
| |
| China Mobile Ltd. | | | 37,500 | | | | 365,621 | |
| |
| | | | | | | | 1,230,584 | |
| |
Indonesia–0.13%
| | | | |
| Telekomunikasi Indonesia Tbk PT | | | 162,000 | | | | 125,935 | |
| |
Ireland–0.23%
| | | | |
| Dragon Oil PLC | | | 32,319 | | | | 229,810 | |
| |
Italy–1.09%
| | | | |
| Eni S.p.A. | | | 52,597 | | | | 1,086,462 | |
| |
Japan–12.90%
| | | | |
| Asahi Group Holdings, Ltd. | | | 87,000 | | | | 1,910,970 | |
| |
| FUJIFILM Holdings Corp. | | | 32,400 | | | | 766,611 | |
| |
| Mitsubishi Corp. | | | 58,300 | | | | 1,178,275 | |
| |
| Mitsubishi UFJ Financial Group, Inc. | | | 289,200 | | | | 1,227,332 | |
| |
| Nippon Telegraph & Telephone Corp. | | | 34,600 | | | | 1,757,896 | |
| |
| Nippon Yusen Kabushiki Kaisha | | | 324,000 | | | | 829,581 | |
| |
| Nissan Motor Co., Ltd. | | | 202,000 | | | | 1,813,769 | |
| |
| Seven & I Holdings Co., Ltd. | | | 37,900 | | | | 1,056,609 | |
| |
| Sumitomo Chemical Co., Ltd. | | | 256,000 | | | | 934,962 | |
| |
| Yamada Denki Co., Ltd. | | | 20,610 | | | | 1,403,644 | |
| |
| | | | | | | | 12,879,649 | |
| |
Mexico–0.22%
| | | | |
| America Movil S.A.B. de C.V.–Series L | | | 196,300 | | | | 222,064 | |
| |
Netherlands–1.17%
| | | | |
| Unilever N.V. | | | 34,138 | | | | 1,172,395 | |
| |
Norway–2.54%
| | | | |
| Statoil A.S.A. | | | 43,065 | | | | 1,103,049 | |
| |
| Yara International A.S.A. | | | 35,760 | | | | 1,435,064 | |
| |
| | | | | | | | 2,538,113 | |
| |
Poland–0.15%
| | | | |
| KGHM Polska Miedz S.A. | | | 4,805 | | | | 152,918 | |
| |
Russia–0.66%
| | | | |
| Gazprom OAO–ADR | | | 16,444 | | | | 175,293 | |
| |
JSFC Sistema, REGS-GDR(c) | | | 8,733 | | | | 146,152 | |
| |
Magnitogorsk Iron & Steel Works, REGS-GDR(c) | | | 23,624 | | | | 114,978 | |
| |
Rosneft Oil Co., REGS-GDR(c) | | | 33,417 | | | | 220,552 | |
| |
| | | | | | | | 656,975 | |
| |
South Africa–1.02%
| | | | |
| Sasol Ltd. | | | 5,329 | | | | 254,419 | |
| |
| Standard Bank Group Ltd. | | | 18,953 | | | | 231,298 | |
| |
| Steinhoff International Holdings Ltd. | | | 91,913 | | | | 260,890 | |
| |
| Tiger Brands Ltd. | | | 8,870 | | | | 275,128 | |
| |
| | | | | | | | 1,021,735 | |
| |
South Korea–2.16%
| | | | |
| Dongbu Insurance Co., Ltd. | | | 5,255 | | | | 243,496 | |
| |
| Hyundai Mipo Dockyard Co., Ltd. | | | 2,097 | | | | 204,655 | |
| |
See accompanying Notes to Financial Statements which are an integral part of the financial statements.
Invesco Van Kampen V.I. Global Value Equity Fund
| | | | | | | | | |
| | | Shares | | Value |
| |
South Korea–(continued)
| | | | |
| | | | | | | | | |
| Hyundai Mobis | | | 1,332 | | | $ | 337,493 | |
| |
| KT&G Corp. | | | 3,631 | | | | 256,465 | |
| |
| POSCO | | | 787 | | | | 260,660 | |
| |
| Samsung Electronics Co., Ltd. | | | 493 | | | | 452,596 | |
| |
| Shinhan Financial Group Co., Ltd. | | | 5,974 | | | | 206,054 | |
| |
| SK Telecom Co., Ltd.–ADR | | | 14,460 | | | | 196,801 | |
| |
| | | | | | | | 2,158,220 | |
| |
Spain–2.59%
| | | | |
| Banco Santander S.A. | | | 110,078 | | | | 831,709 | |
| |
| Iberdrola S.A. | | | 150,431 | | | | 938,127 | |
| |
| Telefonica S.A. | | | 47,355 | | | | 817,273 | |
| |
| | | | | | | | 2,587,109 | |
| |
Switzerland–5.77%
| | | | |
| ACE Ltd. | | | 37,608 | | | | 2,637,073 | |
| |
Holcim Ltd., Registered Shares(d) | | | 16,925 | | | | 905,538 | |
| |
| Swisscom AG, Registered Shares | | | 3,046 | | | | 1,151,745 | |
| |
| Zurich Financial Services AG | | | 4,719 | | | | 1,065,736 | |
| |
| | | | | | | | 5,760,092 | |
| |
Taiwan–0.70%
| | | | |
| AU Optronics Corp.–ADR | | | 24,386 | | | | 105,348 | |
| |
| Coretronic Corp | | | 121,000 | | | | 81,921 | |
| |
| HTC Corp. | | | 9,038 | | | | 148,350 | |
| |
| Powertech Technology Inc. | | | 107,300 | | | | 227,152 | |
| |
| Wistron Corp. | | | 105,000 | | | | 132,988 | |
| |
| | | | | | | | 695,759 | |
| |
Thailand–0.38%
| | | | |
| Bangkok Bank Public Co., Ltd.–NVDR | | | 53,200 | | | | 258,670 | |
| |
| PTT PCL/Foreign | | | 11,500 | | | | 115,837 | |
| |
| | | | | | | | 374,507 | |
| |
Turkey–0.11%
| | | | |
Asya Katilim Bankasi A.S.(d) | | | 135,217 | | | | 113,305 | |
| |
United Kingdom–10.36%
| | | | |
| Barclays PLC | | | 316,574 | �� | | | 857,810 | |
| |
| BHP Billiton PLC | | | 57,205 | | | | 1,663,726 | |
| |
| Eurasian Natural Resources Corp. | | | 20,801 | | | | 203,971 | |
| |
| GlaxoSmithKline PLC | | | 48,133 | | | | 1,097,841 | |
| |
| Imperial Tobacco Group PLC | | | 73,644 | | | | 2,785,606 | |
| |
| National Grid PLC | | | 105,852 | | | | 1,027,691 | |
| |
| Royal Dutch Shell PLC–Class A | | | 73,704 | | | | 2,710,252 | |
| |
| | | | | | | | 10,346,897 | |
| |
United States–39.40%
| | | | |
| 3M Co. | | | 14,664 | | | | 1,198,489 | |
| |
| Apache Corp. | | | 10,211 | | | | 924,912 | |
| |
| Archer-Daniels-Midland Co. | | | 67,111 | | | | 1,919,375 | |
| |
| Bank of America Corp. | | | 109,812 | | | | 610,555 | |
| |
| Bank of New York Mellon Corp. (The) | | | 39,586 | | | | 788,157 | |
| |
| Best Buy Co., Inc. | | | 42,688 | | | | 997,619 | |
| |
| Chevron Corp. | | | 25,283 | | | | 2,690,111 | |
| |
| Cisco Systems, Inc. | | | 112,933 | | | | 2,041,829 | |
| |
| Coach, Inc. | | | 35,530 | | | | 2,168,751 | |
| |
| ConocoPhillips | | | 27,899 | | | | 2,033,000 | |
| |
| Corning Inc. | | | 99,964 | | | | 1,297,533 | |
| |
| CVS Caremark Corp. | | | 38,006 | | | | 1,549,885 | |
| |
| Energen Corp. | | | 24,337 | | | | 1,216,850 | |
| |
GameStop Corp.–Class A(b)(d) | | | 51,826 | | | | 1,250,561 | |
| |
| General Dynamics Corp. | | | 29,787 | | | | 1,978,155 | |
| |
Gilead Sciences, Inc.(d) | | | 28,184 | | | | 1,153,570 | |
| |
| Johnson & Johnson | | | 30,012 | | | | 1,968,187 | |
| |
| Merck & Co., Inc. | | | 52,150 | | | | 1,966,055 | |
| |
| Microsoft Corp. | | | 41,446 | | | | 1,075,938 | |
| |
| Oracle Corp. | | | 64,016 | | | | 1,642,010 | |
| |
| PNC Financial Services Group, Inc. | | | 18,778 | | | | 1,082,927 | |
| |
| Stryker Corp. | | | 19,765 | | | | 982,518 | |
| |
| Valero Energy Corp. | | | 53,810 | | | | 1,132,700 | |
| |
| W. R. Berkley Corp. | | | 32,768 | | | | 1,126,892 | |
| |
| WellPoint Inc. | | | 32,318 | | | | 2,141,068 | |
| |
Western Digital Corp.(d) | | | 77,968 | | | | 2,413,110 | |
| |
| | | | | | | | 39,350,757 | |
| |
| Total Common Stocks & Other Equity Interests (Cost $94,933,671) | | | | | | | 96,147,623 | |
| |
Preferred Stocks–1.46%
|
Germany–1.46%
| | | | |
| Porsche Automobil Holding SE -1.04% Pfd. (Cost $1,396,754) | | | 27,165 | | | | 1,453,852 | |
| |
Investment Companies–Exchange Traded Funds–0.40%
|
United States–0.40%
| | | | |
| WisdomTree India Earnings Fund (Cost $604,796) | | | 25,900 | | | | 404,040 | |
| |
Money Market Funds–2.13%
|
Liquid Assets Portfolio–Institutional Class(e) | | | 1,065,039 | | | | 1,065,039 | |
| |
Premier Portfolio–Institutional Class(e) | | | 1,065,039 | | | | 1,065,039 | |
| |
| Total Money Market Funds (Cost $2,130,078) | | | | | | | 2,130,078 | |
| |
| TOTAL INVESTMENTS (excluding investments purchased with cash collateral from securities on loan)–100.27% (Cost $99,065,299) | | | | | | | 100,135,593 | |
| |
| | | | | | | | | |
| | | | | | | | | |
See accompanying Notes to Financial Statements which are an integral part of the financial statements.
Invesco Van Kampen V.I. Global Value Equity Fund
| | | | | | | | | |
| | | Shares | | Value |
| |
Investments Purchased with Cash Collateral from Securities on Loan
|
Investments Purchased with Cash Collateral from Securities on Loan–1.14%
| | | | |
Liquid Assets Portfolio–Institutional Class (Cost $1,135,670)(e)(f) | | | 1,135,670 | | | $ | 1,135,670 | |
| |
| TOTAL INVESTMENTS–101.41% (Cost $100,200,969) | | | | | | | 101,271,263 | |
| |
| OTHER ASSETS LESS LIABILITIES–(1.41%) | | | | | | | (1,403,995 | ) |
| |
| NET ASSETS–100.00% | | | | | | $ | 99,867,268 | |
| |
Investment Abbreviations:
| | | |
| ADR | | – American Depositary Receipt |
| GDR | | – Global Depositary Receipt |
| NVDR | | – Non-Voting Depositary Receipt |
| Pfd. | | – Preferred |
| REGS | | – Regulation S |
Notes to Schedule of Investments:
| | |
| (a) | | Each unit represents one ordinary share and two preferred shares. |
| (b) | | All or a portion of this security was out on loan at December 31, 2011. |
| (c) | | Security purchased or received in a transaction exempt from registration under the Securities Act of 1933, as amended. The Security may be resold pursuant to an exemption from registration under the 1933 Act, typically to qualified institutional buyers. The value of at December 31, 2011 was $391,682 which represented less than 1% of the Fund’s Net Assets. |
| (d) | | Non-income producing security. |
| (e) | | The money market fund and the Fund are affiliated by having the same investment adviser. |
| (f) | | The security has been segregated to satisfy the commitment to return the cash collateral received in securities lending transactions upon the borrower’s return of the securities loaned. See Note 1I. |
See accompanying Notes to Financial Statements which are an integral part of the financial statements.
Invesco Van Kampen V.I. Global Value Equity Fund
Statement of Assets and Liabilities
December 31, 2011
| | | | | |
Assets:
|
| Investments, at value (Cost $96,935,221)* | | $ | 98,005,515 | |
| |
| Investments in affiliated money market funds, at value and cost | | | 3,265,748 | |
| |
| Total investments, at value (Cost $100,200,969) | | | 101,271,263 | |
| |
| Foreign currencies, at value (Cost $54,952) | | | 54,644 | |
| |
| Receivable for: | | | | |
| Fund shares sold | | | 17,224 | |
| |
| Dividends | | | 167,653 | |
| |
| Investment for trustee deferred compensation and retirement plans | | | 8,248 | |
| |
| Total assets | | | 101,519,032 | |
| |
Liabilities:
|
| Payable for: | | | | |
| Fund shares reacquired | | | 97,256 | |
| |
| Collateral upon return of securities loaned | | | 1,135,670 | |
| |
| Accrued fees to affiliates | | | 284,448 | |
| |
| Accrued other operating expenses | | | 122,685 | |
| |
| Trustee deferred compensation and retirement plans | | | 11,705 | |
| |
| Total liabilities | | | 1,651,764 | |
| |
| Net assets applicable to shares outstanding | | $ | 99,867,268 | |
| |
Net assets consist of:
|
| Shares of beneficial interest | | $ | 128,008,316 | |
| |
| Undistributed net investment income | | | 2,339,630 | |
| |
| Undistributed net realized gain (loss) | | | (31,550,782 | ) |
| |
| Unrealized appreciation | | | 1,070,104 | |
| |
| | | $ | 99,867,268 | |
| |
Net Assets:
|
| Series I | | $ | 78,124,895 | |
| |
| Series II | | $ | 21,742,373 | |
| |
Shares outstanding, $0.001 par value per share, with an unlimited number of shares authorized:
|
| Series I | | | 11,493,506 | |
| |
| Series II | | | 3,202,864 | |
| |
| Series I: | | | | |
| Net asset value per share | | $ | 6.80 | |
| |
| Series II: | | | | |
| Net asset value per share | | $ | 6.79 | |
| |
| |
| * | At December 31, 2011, securities with an aggregate value of $1,101,691 were on loan to brokers. |
Statement of Operations
For the year ended December 31, 2011
| | | | | |
Investment income:
|
| Dividends (net of foreign withholding taxes of $191,230) | | $ | 3,235,084 | |
| |
| Dividends from affiliated money market funds (includes securities lending income of $68,362) | | | 69,749 | |
| |
| Total investment income | | | 3,304,833 | |
| |
Expenses:
|
| Advisory fees | | | 602,725 | |
| |
| Administrative services fees | | | 236,330 | |
| |
| Custodian fees | | | 76,282 | |
| |
| Distribution fees — Series II | | | 38,286 | |
| |
| Transfer agent fees | | | 9,695 | |
| |
| Trustees’ and officers’ fees and benefits | | | 18,071 | |
| |
| Other | | | (46,399 | ) |
| |
| Total expenses | | | 934,990 | |
| |
| Less: Fees waived | | | (23,206 | ) |
| |
| Net expenses | | | 911,784 | |
| |
| Net investment income | | | 2,393,049 | |
| |
Realized and unrealized gain (loss) from:
|
| Net realized gain (loss) from: | | | | |
| Investment securities (net of tax on sale of foreign investments of $3,422) | | | (326,114 | ) |
| |
| Foreign currencies (net of foreign taxes of $12,112) | | | (29,347 | ) |
| |
| | | | (355,461 | ) |
| |
| Change in net unrealized appreciation (depreciation) of: | | | | |
| Investment securities (net of change in estimated tax on foreign investments held of $3,160) | | | (21,928,120 | ) |
| |
| Foreign currencies | | | (8,800 | ) |
| |
| | | | (21,936,920 | ) |
| |
| Net realized and unrealized gain (loss) | | | (22,292,381 | ) |
| |
| Net increase (decrease) in net assets resulting from operations | | $ | (19,899,332 | ) |
| |
See accompanying Notes to Financial Statements which are an integral part of the financial statements.
Invesco Van Kampen V.I. Global Value Equity Fund
Statement of Changes in Net Assets
For the years ended December 31, 2011 and December 31, 2010
| | | | | | | | | |
| | | 2011 | | 2010 |
| |
Operations:
|
| Net investment income | | $ | 2,393,049 | | | $ | 875,486 | |
| |
| Net realized gain (loss) | | | (355,461 | ) | | | 2,174,772 | |
| |
| Change in net unrealized appreciation (depreciation) | | | (21,936,920 | ) | | | 1,296,804 | |
| |
| Net increase (decrease) in net assets resulting from operations | | | (19,899,332 | ) | | | 4,347,062 | |
| |
Distributions to shareholders from net investment income:
|
| Series I | | | (1,439,970 | ) | | | (823,810 | ) |
| |
| Series II | | | (353 | ) | | | — | |
| |
| Total distributions from net investment income | | | (1,440,323 | ) | | | (823,810 | ) |
| |
Share transactions–net:
|
| Series I | | | 49,857,625 | | | | (4,776,026 | ) |
| |
| Series II | | | 26,620,164 | | | | 10,000 | |
| |
| Net increase (decrease) in net assets resulting from share transactions | | | 76,477,789 | | | | (4,766,026 | ) |
| |
| Net increase (decrease) in net assets | | | 55,138,134 | | | | (1,242,774 | ) |
| |
Net assets:
|
| Beginning of year | | | 44,729,134 | | | | 45,971,908 | |
| |
| End of year (includes undistributed net investment income of $2,339,630 and $1,425,720, respectively) | | $ | 99,867,268 | | | $ | 44,729,134 | |
| |
Notes to Financial Statements
December 31, 2011
NOTE 1—Significant Accounting Policies
Invesco Van Kampen V.I. Global Value Equity Fund (the “Fund”) is a series portfolio of AIM Variable Insurance Funds (Invesco Variable Insurance Funds) (the “Trust”). The Trust is a Delaware statutory trust registered under the Investment Company Act of 1940, as amended (the “1940 Act”), as an open-end series management investment company consisting of twenty-eight separate portfolios, (each constituting a “Fund”). The assets, liabilities and operations of each portfolio are accounted for separately. Information presented in these financial statements pertains only to the Fund. Matters affecting each Fund or class will be voted on exclusively by the shareholders of such Fund or class. Current Securities and Exchange Commission (“SEC”) guidance, however, requires participating insurance companies offering separate accounts to vote shares proportionally in accordance with the instructions of the contract owners whose investments are funded by shares of each Fund or class.
The Fund’s investment objective is long-term capital appreciation by investing primarily in equity securities of issuers throughout the world, including U.S. issuers.
The Fund currently offers two classes of shares, Series I and Series II, both of which are offered to insurance company separate accounts funding variable annuity contracts and variable life insurance policies (“variable products”).
The following is a summary of the significant accounting policies followed by the Fund in the preparation of its financial statements.
| | |
| A. | | Security Valuations — Securities, including restricted securities, are valued according to the following policy. |
| | A security listed or traded on an exchange (except convertible bonds) is valued at its last sales price or official closing price as of the close of the customary trading session on the exchange where the security is principally traded, or lacking any sales or official closing price on a particular day, the security may be valued at the closing bid price on that day. Securities traded in the over-the-counter market are valued based on prices furnished by independent pricing services or market makers. When such securities are valued by an independent pricing service they may be considered fair valued. Futures contracts are valued at the final settlement price set by an exchange on which they are principally traded. Listed options are valued at the mean between the last bid and ask prices from the exchange on which they are principally traded. Options not listed on an exchange are valued by an independent source at the mean between the last bid and ask prices. For purposes of determining net asset value per share, futures and option contracts generally are valued 15 minutes after the close of the customary trading session of the New York Stock Exchange (“NYSE”). |
| | Investments in open-end and closed-end registered investment companies that do not trade on an exchange are valued at the end of day net asset value per share. Investments in open-end and closed-end registered investment companies that trade on an exchange are valued at the last sales price or official closing price as of the close of the customary trading session on the exchange where the security is principally traded. |
Invesco Van Kampen V.I. Global Value Equity Fund
| | |
| | Debt obligations (including convertible bonds) and unlisted equities are fair valued using an evaluated quote provided by an independent pricing service. Evaluated quotes provided by the pricing service may be determined without exclusive reliance on quoted prices, and may reflect appropriate factors such as institution-size trading in similar groups of securities, developments related to specific securities, dividend rate, yield, quality, type of issue, coupon rate, maturity, individual trading characteristics and other market data. Debt securities are subject to interest rate and credit risks. In addition, all debt securities involve some risk of default with respect to interest and/or principal payments. |
| | Foreign securities (including foreign exchange contracts) are converted into U.S. dollar amounts using the applicable exchange rates as of the close of the NYSE. If market quotations are available and reliable for foreign exchange traded equity securities, the securities will be valued at the market quotations. Because trading hours for certain foreign securities end before the close of the NYSE, closing market quotations may become unreliable. If between the time trading ends on a particular security and the close of the customary trading session on the NYSE, events occur that are significant and make the closing price unreliable, the Fund may fair value the security. If the event is likely to have affected the closing price of the security, the security will be valued at fair value in good faith using procedures approved by the Board of Trustees. Adjustments to closing prices to reflect fair value may also be based on a screening process of an independent pricing service to indicate the degree of certainty, based on historical data, that the closing price in the principal market where a foreign security trade is not the current value as of the close of the NYSE. Foreign securities meeting the approved degree of certainty that the price is not reflective of current value will be priced at the indication of fair value from the independent pricing service. Multiple factors may be considered by the independent pricing service in determining adjustments to reflect fair value and may include information relating to sector indices, American Depositary Receipts and domestic and foreign index futures. Foreign securities may have additional risks including exchange rate changes, potential for sharply devalued currencies and high inflation, political and economic upheaval, the relative lack of issuer information, relatively low market liquidity and the potential lack of strict financial and accounting controls and standards. |
| | Securities for which market prices are not provided by any of the above methods may be valued based upon quotes furnished by independent sources. The last bid price may be used to value equity securities. The mean between the last bid and asked prices is used to value debt obligations, including Corporate Loans. |
| | Securities for which market quotations are not readily available or are unreliable are valued at fair value as determined in good faith by or under the supervision of the Trust’s officers following procedures approved by the Board of Trustees. Issuer specific events, market trends, bid/ask quotes of brokers and information providers and other market data may be reviewed in the course of making a good faith determination of a security’s fair value. |
| | Valuations change in response to many factors including the historical and prospective earnings of the issuer, the value of the issuer’s assets, general economic conditions, interest rates, investor perceptions and market liquidity. Because of the inherent uncertainties of valuation, the values reflected in the financial statements may materially differ from the value received upon actual sale of those investments. |
| B. | | Securities Transactions and Investment Income — Securities transactions are accounted for on a trade date basis. Realized gains or losses on sales are computed on the basis of specific identification of the securities sold. Interest income is recorded on the accrual basis from settlement date. Dividend income (net of withholding tax, if any) is recorded on the ex-dividend date. |
| | The Fund may periodically participate in litigation related to Fund investments. As such, the Fund may receive proceeds from litigation settlements. Any proceeds received are included in the Statement of Operations as realized gain (loss) for investments no longer held and as unrealized gain (loss) for investments still held. |
| | Brokerage commissions and mark ups are considered transaction costs and are recorded as an increase to the cost basis of securities purchased and/or a reduction of proceeds on a sale of securities. Such transaction costs are included in the determination of net realized and unrealized gain (loss) from investment securities reported in the Statement of Operations and the Statement of Changes in Net Assets and the net realized and unrealized gains (losses) on securities per share in the Financial Highlights. Transaction costs are included in the calculation of the Fund’s net asset value and, accordingly, they reduce the Fund’s total returns. These transaction costs are not considered operating expenses and are not reflected in net investment income reported in the Statement of Operations and Statement of Changes in Net Assets, or the net investment income per share and ratios of expenses and net investment income reported in the Financial Highlights, nor are they limited by any expense limitation arrangements between the Fund and the investment adviser. |
| | The Fund allocates income and realized and unrealized capital gains and losses to a class based on the relative net assets of each class. |
| C. | | Country Determination — For the purposes of making investment selection decisions and presentation in the Schedule of Investments, the investment adviser may determine the country in which an issuer is located and/or credit risk exposure based on various factors. These factors include the laws of the country under which the issuer is organized, where the issuer maintains a principal office, the country in which the issuer derives 50% or more of its total revenues and the country that has the primary market for the issuer’s securities, as well as other criteria. Among the other criteria that may be evaluated for making this determination are the country in which the issuer maintains 50% or more of its assets, the type of security, financial guarantees and enhancements, the nature of the collateral and the sponsor organization. Country of issuer and/or credit risk exposure has been determined to be the United States of America, unless otherwise noted. |
| D. | | Distributions — Distributions from income and net realized capital gain, if any, are generally paid to separate accounts of participating insurance companies annually and recorded on ex-dividend date. |
| E. | | Federal Income Taxes — The Fund intends to comply with the requirements of Subchapter M of the Internal Revenue Code necessary to qualify as a regulated investment company and to distribute substantially all of the Fund’s taxable earnings to shareholders. As such, the Fund will not be subject to federal income taxes on otherwise taxable income (including net realized capital gain) that is distributed to shareholders. Therefore, no provision for federal income taxes is recorded in the financial statements. |
| | The Fund files tax returns in the U.S. Federal jurisdiction and certain other jurisdictions. Generally, the Fund is subject to examinations by such taxing authorities for up to three years after the filing of the return for the tax period. |
| F. | | Expenses — Fees provided for under the Rule 12b-1 plan of a particular class of the Fund and which are directly attributable to that class are charged to the operations of such class. All other expenses are allocated among the classes based on relative net assets. |
Invesco Van Kampen V.I. Global Value Equity Fund
| | |
| G. | | Accounting Estimates — The preparation of financial statements in conformity with accounting principles generally accepted in the United States of America (“GAAP”) requires management to make estimates and assumptions that affect the reported amounts of assets and liabilities at the date of the financial statements and the reported amounts of revenues and expenses during the reporting period including estimates and assumptions related to taxation. Actual results could differ from those estimates by a significant amount. In addition, the Fund monitors for material events or transactions that may occur or become known after the period-end date and before the date the financial statements are released to print. |
| H. | | Indemnifications — Under the Trust’s organizational documents, each Trustee, officer, employee or other agent of the Trust is indemnified against certain liabilities that may arise out of performance of their duties to the Fund. Additionally, in the normal course of business, the Fund enters into contracts, including the Fund’s servicing agreements that contain a variety of indemnification clauses. The Fund’s maximum exposure under these arrangements is unknown as this would involve future claims that may be made against the Fund that have not yet occurred. The risk of material loss as a result of such indemnification claims is considered remote. |
| I. | | Securities Lending — The Fund may lend portfolio securities having a market value up to one-third of the Fund’s total assets. Such loans are secured by collateral equal to no less than the market value of the loaned securities determined daily by the securities lending provider. Such collateral will be cash or debt securities issued or guaranteed by the U.S. Government or any of its sponsored agencies. Cash collateral received in connection with these loans is invested in short-term money market instruments or affiliated money market funds and is shown as such on the Schedule of Investments. It is the Fund’s policy to obtain additional collateral from or return excess collateral to the borrower by the end of the next business day, following the valuation date of the securities loaned. Therefore, the value of the collateral held may be temporarily less than the value of the securities on loan. Lending securities entails a risk of loss to the Fund if and to the extent that the market value of the securities loaned were to increase and the borrower did not increase the collateral accordingly, and the borrower fails to return the securities. Upon the failure of the borrower to return the securities, collateral may be liquidated and the securities may be purchased on the open market to replace the loaned securities. The Fund could experience delays and costs in gaining access to the collateral. The Fund bears the risk of any deficiency in the amount of the collateral available for return to the borrower due to any loss on the collateral invested. Dividends received on cash collateral investments for securities lending transactions, which are net of compensation to counterparties, is included in Dividends from affiliated money market funds on the Statement of Operations. The aggregate value of securities out on loan is shown as a footnote on the Statement of Assets and Liabilities, if any. |
| J. | | Foreign Currency Translations — Foreign currency is valued at the close of the NYSE based on quotations posted by banks and major currency dealers. Portfolio securities and other assets and liabilities denominated in foreign currencies are translated into U.S. dollar amounts at date of valuation. Purchases and sales of portfolio securities (net of foreign taxes withheld on disposition) and income items denominated in foreign currencies are translated into U.S. dollar amounts on the respective dates of such transactions. The Fund does not separately account for the portion of the results of operations resulting from changes in foreign exchange rates on investments and the fluctuations arising from changes in market prices of securities held. The combined results of changes in foreign exchange rates and the fluctuation of market prices on investments (net of estimated foreign tax withholding) are included with the net realized and unrealized gain or loss from investments in the Statement of Operations. Reported net realized foreign currency gains or losses arise from (1) sales of foreign currencies, (2) currency gains or losses realized between the trade and settlement dates on securities transactions, and (3) the difference between the amounts of dividends, interest, and foreign withholding taxes recorded on the Fund’s books and the U.S. dollar equivalent of the amounts actually received or paid. Net unrealized foreign currency gains and losses arise from changes in the fair values of assets and liabilities, other than investments in securities at fiscal period end, resulting from changes in exchange rates. |
| | The Fund may invest in foreign securities which may be subject to foreign taxes on income, gains on investments or currency repatriation, a portion of which may be recoverable. |
| K. | | Foreign Currency Contracts — The Fund may enter into foreign currency contracts to manage or minimize currency or exchange rate risk. The Fund may also enter into foreign currency contracts for the purchase or sale of a security denominated in a foreign currency in order to “lock in” the U.S. dollar price of that security. A foreign currency contract is an obligation to purchase or sell a specific currency for an agreed-upon price at a future date. The use of foreign currency contracts does not eliminate fluctuations in the price of the underlying securities the Fund owns or intends to acquire but establishes a rate of exchange in advance. Fluctuations in the value of these contracts are measured by the difference in the contract date and reporting date exchange rates and are recorded as unrealized appreciation (depreciation) until the contracts are closed. When the contracts are closed, realized gains (losses) are recorded. Realized and unrealized gains (losses) on the contracts are included in the Statement of Operations. The primary risks associated with foreign currency contracts include failure of the counterparty to meet the terms of the contract and the value of the foreign currency changing unfavorably. These risks may be in excess of the amounts reflected in the Statement of Assets and Liabilities. |
NOTE 2—Advisory Fees and Other Fees Paid to Affiliates
The Trust has entered into a master investment advisory agreement with Invesco Advisers, Inc. (the “Adviser” or “Invesco”). Under the terms of the investment advisory agreement, the Fund pays an advisory fee to the Adviser based on the annual rate of the Fund’s average daily net assets as follows:
| | | | | |
| Average Daily Net Assets | | Rate |
| |
| First $1 billion | | | 0 | .67% |
| |
| Next $500 million | | | 0 | .645% |
| |
| Next $1 billion | | | 0 | .62% |
| |
| Next $1 billion | | | 0 | .595% |
| |
| Next $1 billion | | | 0 | .57% |
| |
| Over $4.5 billion | | | 0 | .545% |
| |
Invesco Van Kampen V.I. Global Value Equity Fund
Under the terms of a master sub-advisory agreement between the Adviser and each of Invesco Asset Management Deutschland GmbH, Invesco Asset Management Limited, Invesco Asset Management (Japan) Limited, Invesco Australia Limited, Invesco Hong Kong Limited, Invesco Senior Secured Management, Inc. and Invesco Canada Ltd. (collectively, the “Affiliated Sub-Advisers”) the Adviser, not the Fund, may pay 40% of the fees paid to the Adviser to any such Affiliated Sub-Adviser(s) that provide discretionary investment management services to the Fund based on the percentage of assets allocated to such Sub-Adviser(s).
Effective May 2, 2011, the Adviser has contractually agreed, through at least June 30, 2012, to waive advisory fees and/or reimburse expenses of all shares to the extent necessary to limit total annual fund operating expenses after fee waiver and/or expense reimbursement (excluding certain items discussed below) of Series I shares to 0.94% and Series II shares to 1.19% of average daily net assets. Prior to May 2, 2011, the Adviser contractually agreed to waive advisory fees and/or reimburse expenses of all shares to the extent necessary to limit total annual Fund operating expenses after fee waiver and/or expense reimbursement to (excluding certain items discussed below) on Series I shares to 1.15% and Series II shares to 1.40%. In determining the Adviser’s obligation to waive advisory fees and/or reimburse expenses, the following expenses are not taken into account, and could cause the total annual fund operating expenses after fee waiver and/or expense reimbursement to exceed the numbers reflected above: (1) interest; (2) taxes; (3) dividend expense on short sales; (4) extraordinary or non-routine items, including litigation expenses; and (5) expenses that the Fund has incurred but did not actually pay because of an expense offset arrangement. Unless the Board of the Trustees and Invesco mutually agree to amend or continue the fee waiver agreement, it will terminate on June 30, 2012.
Further, the Adviser has contractually agreed, through at least June 30, 2012, to waive the advisory fee payable by the Fund in an amount equal to 100% of the net advisory fees the Adviser receives from the affiliated money market funds on investments by the Fund of uninvested cash in such affiliated money market funds.
For the year ended December 31, 2011, the Adviser waived advisory fees of $23,206.
The Trust has entered into a master administrative services agreement with Invesco pursuant to which the Fund has agreed to pay Invesco a fee for costs incurred in providing accounting services and fund administrative services to the Fund and to reimburse Invesco for administrative services fees paid to insurance companies that have agreed to provide services to the participants of separate accounts. These administrative services provided by the insurance companies may include, among other things: the printing of prospectuses, financial reports and proxy statements and the delivery of the same to existing participants; the maintenance of master accounts; the facilitation of purchases and redemptions requested by the participants; and the servicing of participants’ accounts. Pursuant to such agreement, for the year ended December 31, 2011, Invesco was paid $50,000 for accounting and fund administrative services and reimbursed $186,330 for services provided by insurance companies.
The Trust has entered into a transfer agency and service agreement with Invesco Investment Services, Inc. (“IIS”) pursuant to which the Fund has agreed to pay IIS a fee for providing transfer agency and shareholder services to the Fund and reimburse IIS for certain expenses incurred by IIS in the course of providing such services. For the year ended December 31, 2011, expenses incurred under the agreement are shown in the Statement of Operations as transfer agent fees.
The Trust has entered into a master distribution agreement with Invesco Distributors, Inc. (“IDI”) to serve as the distributor for the Fund. The Trust has adopted a plan pursuant to Rule 12b-1 under the 1940 Act with respect to the Fund’s Series II shares (the “Plan”). The Fund, pursuant to the Plan, pays IDI compensation at the annual rate of 0.25% of the Fund’s average daily net assets of Series II shares. Of the Plan payments, up to 0.25% of the average daily net assets of the Series II shares may be paid to insurance companies who furnish continuing personal shareholder services to customers who purchase and own Series II shares of the Fund. For the year ended December 31, 2011, expenses incurred under the Plan are detailed in the Statement of Operations as distribution fees.
Certain officers and trustees of the Trust are officers and directors of the Adviser, Invesco Ltd., IIS and/or IDI.
NOTE 3—Additional Valuation Information
GAAP defines fair value as the price that would be received to sell an asset or paid to transfer a liability in an orderly transaction between market participants at the measurement date, under current market conditions. GAAP establishes a hierarchy that prioritizes the inputs to valuation methods giving the highest priority to readily available unadjusted quoted prices in an active market for identical assets (Level 1) and the lowest priority to significant unobservable inputs (Level 3) generally when market prices are not readily available or are unreliable. Based on the valuation inputs, the securities or other investments are tiered into one of three levels. Changes in valuation methods may result in transfers in or out of an investment’s assigned level:
| | |
| | Level 1 — | Prices are determined using quoted prices in an active market for identical assets. |
| | Level 2 — | Prices are determined using other significant observable inputs. Observable inputs are inputs that other market participants may use in pricing a security. These may include quoted prices for similar securities, interest rates, prepayment speeds, credit risk, yield curves, loss severities, default rates, discount rates, volatilities and others. |
| | Level 3 — | Prices are determined using significant unobservable inputs. In situations where quoted prices or observable inputs are unavailable (for example, when there is little or no market activity for an investment at the end of the period), unobservable inputs may be used. Unobservable inputs reflect the Fund’s own assumptions about the factors market participants would use in determining fair value of the securities or instruments and would be based on the best available information. |
Invesco Van Kampen V.I. Global Value Equity Fund
The following is a summary of the tiered valuation input levels, as of December 31, 2011. The level assigned to the securities valuations may not be an indication of the risk or liquidity associated with investing in those securities. Because of the inherent uncertainties of valuation, the values reflected in the financial statements may materially differ from the value received upon actual sale of those investments.
| | | | | | | | | | | | | | | | | |
| | | Level 1* | | Level 2* | | Level 3 | | Total |
| |
| Australia | | $ | 1,757,039 | | | $ | 929,442 | | | $ | — | | | $ | 2,686,481 | |
| |
| Brazil | | | 1,163,370 | | | | — | | | | — | | | | 1,163,370 | |
| |
| Canada | | | 2,045,577 | | | | — | | | | — | | | | 2,045,577 | |
| |
| China | | | 939,702 | | | | 203,234 | | | | — | | | | 1,142,936 | |
| |
| France | | | 1,195,116 | | | | 3,328,459 | | | | — | | | | 4,523,575 | |
| |
| Germany | | | 3,336,250 | | | | — | | | | — | | | | 3,336,250 | |
| |
| Hong Kong | | | — | | | | 1,230,584 | | | | — | | | | 1,230,584 | |
| |
| Indonesia | | | 125,935 | | | | — | | | | — | | | | 125,935 | |
| |
| Ireland | | | 229,810 | | | | — | | | | — | | | | 229,810 | |
| |
| Italy | | | — | | | | 1,086,462 | | | | — | | | | 1,086,462 | |
| |
| Japan | | | 7,314,041 | | | | 5,565,608 | | | | — | | | | 12,879,649 | |
| |
| Mexico | | | 222,064 | | | | — | | | | — | | | | 222,064 | |
| |
| Netherlands | | | — | | | | 1,172,395 | | | | — | | | | 1,172,395 | |
| |
| Norway | | | 1,435,064 | | | | 1,103,049 | | | | — | | | | 2,538,113 | |
| |
| Poland | | | — | | | | 152,918 | | | | — | | | | 152,918 | |
| |
| Russia | | | 510,823 | | | | 146,152 | | | | — | | | | 656,975 | |
| |
| South Africa | | | 254,420 | | | | 767,315 | | | | — | | | | 1,021,735 | |
| |
| South Korea | | | 1,692,905 | | | | 465,315 | | | | — | | | | 2,158,220 | |
| |
| Spain | | | — | | | | 2,587,109 | | | | — | | | | 2,587,109 | |
| |
| Switzerland | | | 3,542,611 | | | | 2,217,481 | | | | — | | | | 5,760,092 | |
| |
| Taiwan | | | 695,759 | | | | — | | | | — | | | | 695,759 | |
| |
| Thailand | | | 374,507 | | | | — | | | | — | | | | 374,507 | |
| |
| Turkey | | | — | | | | 113,305 | | | | — | | | | 113,305 | |
| |
| United Kingdom | | | 3,813,297 | | | | 6,533,600 | | | | — | | | | 10,346,897 | |
| |
| United States | | | 43,020,545 | | | | — | | | | — | | | | 43,020,545 | |
| |
| Total Investments | | $ | 73,668,835 | | | $ | 27,602,428 | | | $ | — | | | $ | 101,271,263 | |
| |
| |
| * | Transfers occurred between Level 1 and Level 2 due to foreign fair value adjustments. |
NOTE 4—Trustees’ and Officers’ Fees and Benefits
“Trustees’ and Officers’ Fees and Benefits” include amounts accrued by the Fund to pay remuneration to certain Trustees and Officers of the Fund. Trustees have the option to defer compensation payable by the Fund, and “Trustees’ and Officers’ Fees and Benefits” also include amounts accrued by the Fund to fund such deferred compensation amounts. Those Trustees who defer compensation have the option to select various Invesco Funds in which their deferral accounts shall be deemed to be invested. Finally, certain current Trustees are eligible to participate in a retirement plan that provides for benefits to be paid upon retirement to Trustees over a period of time based on the number of years of service. The Fund may have certain former Trustees who also participate in a retirement plan and receive benefits under such plan. “Trustees’ and Officers’ Fees and Benefits” include amounts accrued by the Fund to fund such retirement benefits. Obligations under the deferred compensation and retirement plans represent unsecured claims against the general assets of the Fund.
During the year ended December 31, 2011, the Fund paid legal fees of $1,196 for services rendered by Kramer, Levin, Naftalis & Frankel LLP as counsel to the Independent Trustees. A partner of that firm is a Trustee of the Trust.
NOTE 5—Cash Balances
The Fund is permitted to temporarily carry a negative or overdrawn balance in its account with State Street Bank and Trust Company, the custodian bank. To compensate the custodian bank for such overdrafts, the overdrawn Fund may either (1) leave funds as a compensating balance in the account so the custodian bank can be compensated by earning the additional interest; or (2) compensate by paying the custodian bank at a rate agreed upon by the custodian bank and Invesco, not to exceed the contractually agreed upon rate.
Invesco Van Kampen V.I. Global Value Equity Fund
NOTE 6—Distributions to Shareholders and Tax Components of Net Assets
Tax Character of Distributions to Shareholders Paid During the Years Ended December 31, 2011 and 2010:
| | | | | | | | | |
| | | 2011 | | 2010 |
| |
| Ordinary income | | $ | 1,440,323 | | | $ | 823,810 | |
| |
Tax Components of Net Assets at Period-End:
| | | | | |
| | | 2011 |
| |
| Undistributed ordinary income | | $ | 2,354,286 | |
| |
| Net unrealized appreciation — investments | | | 990,807 | |
| |
| Net unrealized appreciation (depreciation) — other investments | | | (190 | ) |
| |
| Temporary book/tax differences | | | (14,655 | ) |
| |
| Capital loss carryforward | | | (31,471,296 | ) |
| |
| Shares of beneficial interest | | | 128,008,316 | |
| |
| Total net assets | | $ | 99,867,268 | |
| |
The difference between book-basis and tax-basis unrealized appreciation (depreciation) is due to differences in the timing of recognition of gains and losses on investments for tax and book purposes. The Fund’s net unrealized appreciation (depreciation) difference is attributable primarily to wash sales.
The temporary book/tax differences are a result of timing differences between book and tax recognition of income and/or expenses. The Fund’s temporary book/tax differences are the result of the trustee deferral of compensation and retirement plan benefits.
Capital loss carryforward is calculated and reported as of a specific date. Results of transactions and other activity after that date may affect the amount of capital loss carryforward actually available for the Fund to utilize. The Regulated Investment Company Modernization Act of 2010 (the “Act”) eliminated the eight-year carryover period for capital losses that arise in taxable years beginning after its enactment date of December 22, 2010. Consequently, these capital losses can be carried forward for an unlimited period. However, capital losses with an expiration period may not be used to offset capital gains until all net capital losses without an expiration date have been utilized. Additionally, post-enactment capital loss carryovers will retain their character as either short-term or long-term capital losses instead of as short-term capital losses as under prior law. The ability to utilize capital loss carryforward in the future may be limited under the Internal Revenue Code and related regulations based on the results of future transactions. Under these limitation rules, the Fund is limited to utilizing $15,638,149 of capital loss carryforward in the fiscal year ending December 31, 2012.
The Fund has a capital loss carryforward as of December 31, 2011, which expires as follows:
| | | | | | | | | | | | | |
| Capital Loss Carryforward* |
| Expiration | | Short-Term | | Long-Term | | Total |
| |
| December 31, 2016 | | $ | 13,246,047 | | | $ | — | | | $ | 13,246,047 | |
| |
| December 31, 2017 | | | 17,917,975 | | | | — | | | | 17,917,975 | |
| |
| Not subject to expiration | | | — | | | | 307,274 | | | | 307,274 | |
| |
| | | $ | 31,164,022 | | | $ | 307,274 | | | $ | 31,471,296 | |
| |
| |
| * | Capital loss carryforward as of the date listed above is reduced for limitations, if any, to the extent required by the Internal Revenue Code. To the extent that unrealized gains as of May 2, 2011, the date of reorganization of Invesco V.I. Global Dividend Growth Fund into the Fund and realized on securities held in each fund at such date of reorganization, the capital loss carryforward may be further limited for up to five years from the date of the reorganization. |
Invesco Van Kampen V.I. Global Value Equity Fund
NOTE 7—Investment Securities
The aggregate amount of investment securities (other than short-term securities, U.S. Treasury obligations and money market funds, if any) purchased and sold by the Fund during the year ended December 31, 2011 was $27,125,171 and $27,431,464, respectively. Cost of investments on a tax basis includes the adjustments for financial reporting purposes as of the most recently completed Federal income tax reporting period-end.
| | | | | |
| Unrealized Appreciation (Depreciation) of Investment Securities on a Tax Basis |
| |
| Aggregate unrealized appreciation of investment securities | | $ | 11,052,308 | |
| |
| Aggregate unrealized (depreciation) of investment securities | | | (10,061,501 | ) |
| |
| Net unrealized appreciation of investment securities | | $ | 990,807 | |
| |
| Cost of investments for tax purposes is $100,280,456. |
NOTE 8—Reclassification of Permanent Differences
Primarily as a result of differing book/tax treatment of foreign currency transactions, on December 31, 2011, undistributed net investment income (loss) was decreased by $32,767, undistributed net realized gain (loss) was increased by $32,772 and shares of beneficial interest decreased by $5. Further, as a result of tax deferrals acquired in the reorganization of Invesco V.I. Global Dividend Growth Fund into the Fund, undistributed net investment income (loss) was decreased by $6,049, undistributed net realized gain was decreased by $10,338,548 and shares of beneficial interest increased by $10,344,597. These reclassifications had no effect on the net assets of the Fund.
NOTE 9—Share Information
| | | | | | | | | | | | | | | | | |
| | | Summary of Share Activity |
| |
| | | Year ended December 31, |
| | | 2011(a) | | 2010 |
| | | Shares | | Amount | | Shares | | Amount |
| |
| Sold: | | | | | | | | | | | | | | | | |
| Series I | | | 882,041 | | | $ | 6,843,913 | | | | 424,256 | | | $ | 3,147,637 | |
| |
Series II(b) | | | 282,903 | | | | 1,950,278 | | | | 1,534 | | | | 10,000 | |
| |
| Issued as reinvestment of dividends: | | | | | | | | | | | | | | | | |
| Series I | | | 180,447 | | | | 1,439,970 | | | | 123,510 | | | | 823,810 | |
| |
Issued in connection with acquisitions:(c) | | | | | | | | | | | | | | | | |
| Series I | | | 7,111,889 | | | | 58,977,691 | | | | — | | | | — | |
| |
Series II(b) | | | 3,419,989 | | | | 28,363,525 | | | | — | | | | — | |
| |
| Reacquired: | | | | | | | | | | | | | | | | |
| Series I | | | (2,359,534 | ) | | | (17,403,949 | ) | | | (1,215,233 | ) | | | (8,747,473 | ) |
| |
Series II(b) | | | (501,562 | ) | | | (3,693,639 | ) | | | — | | | | — | |
| |
| Net increase (decrease) in share activity | | | 9,016,173 | | | $ | 76,477,789 | | | | (665,933 | ) | | $ | (4,766,026 | ) |
| |
| | |
| (a) | | There are entities that are record owners of more than 5% of the outstanding shares of the Fund and in the aggregate own 87% of the outstanding shares of the Fund. The Fund and the Fund’s principal underwriter or adviser, are parties to participation agreements with these entities whereby these entities sell units of interest in separate accounts funding variable products that are invested in the Fund. The Fund, Invesco and/or Invesco affiliates may make payments to these entities, which are considered to be related to the Fund, for providing services to the Fund, Invesco and/or Invesco affiliates including but not limited to services such as, securities brokerage, third party record keeping and account servicing and administrative services. The Fund has no knowledge as to whether all or any portion of the shares owned of record by these entities are also owned beneficially. |
| (b) | | Commencement date of June 1, 2010. |
| (c) | | As of the opening of business on May 2, 2011 the Fund acquired all the net assets of Invesco V.I. Global Dividend Growth Fund (the “Target Fund”) pursuant to a plan of reorganization approved by the Trustees of the Fund on November 10, 2010 and by the shareholders of Invesco V.I. Global Dividend Growth Fund on April 1, 2011. The acquisition was accomplished by a tax-free exchange of 10,531,878 shares of the Fund for 8,939,065 shares outstanding of Invesco V.I. Global Dividend Growth Fund as of the close of business on April 29, 2011. Each class of Invesco V.I. Global Dividend Growth Fund was exchanged for the like class of shares of the Fund based on the relative net asset value of Invesco V.I. Global Dividend Growth Fund to the net asset value of the Fund at the close of business on April 29, 2011. Invesco V.I. Global Dividend Growth Fund’s net assets at that date of $87,341,216, including $17,111,954 of unrealized appreciation, were combined with those of the Fund. The net assets of the Fund immediately before the acquisition were $48,932,340. The net assets immediately after the acquisition were $136,273,556. |
| | The pro forma results of operations for the year ended December 31, 2011 assuming the reorganization had been completed on January 1, 2011, the beginning of the annual reporting period are as follows: |
| | | | | |
| Net investment income | | $ | 2,803,054 | |
| Net realized/unrealized gains (losses) | | | (15,663,166 | ) |
| | | | | |
| Change in net assets resulting from operations | | $ | (12,860,112 | ) |
| | |
| | The combined investment portfolios have been managed as a single integrated portfolio since the acquisition was completed, it is not practicable to separate the amounts of revenue and earnings of the Target Fund that have been included in the Fund’s Statement of Operations since May 2, 2011. |
Invesco Van Kampen V.I. Global Value Equity Fund
NOTE 10—Financial Highlights
The following schedule presents financial highlights for a share of the Fund outstanding throughout the periods indicated.
| | | | | | | | | | | | | | | | | | | | | | | | | | | | | | | | | | | | | | | | | | | | | | | | | | | | | | | | | |
| | | | | | | | | | | | | | | | | | | | | | | Ratio of
| | Ratio of
| | | | |
| | | | | | | Net gains
| | | | | | | | | | | | | | | | expenses
| | expenses
| | | | |
| | | | | | | (losses) on
| | | | | | | | | | | | | | | | to average
| | to average net
| | Ratio of net
| | |
| | | Net asset
| | | | securities
| | | | Dividends
| | Distributions
| | | | | | | | | | net assets
| | assets without
| | investment
| | |
| | | value,
| | Net
| | (both
| | Total from
| | from net
| | from net
| | | | Net asset
| | | | Net assets,
| | with fee waivers
| | fee waivers
| | income
| | |
| | | beginning
| | investment
| | realized and
| | investment
| | investment
| | realized
| | Total
| | value, end
| | Total
| | end of period
| | and/or expenses
| | and/or expenses
| | to average
| | Portfolio
|
| | | of period | | income(a) | | unrealized) | | operations | | income | | gains | | Distributions | | of period | | Return(b) | | (000s omitted) | | absorbed | | absorbed | | net assets | | turnover(c) |
| |
| Series I |
| Year ended 12/31/11 | | $ | 7.87 | | | $ | 0.20 | | | $ | (1.02 | ) | | $ | (0.82 | ) | | $ | (0.25 | ) | | $ | — | | | $ | (0.25 | ) | | $ | 6.80 | | | | (10.89 | )% | | $ | 78,125 | | | | 0.97 | %(d) | | | 1.00 | %(d) | | | 2.70 | %(d) | | | 62 | % |
| Year ended 12/31/10 | | | 7.24 | | | | 0.15 | | | | 0.62 | | | | 0.77 | | | | (0.14 | ) | | | — | | | | (0.14 | ) | | | 7.87 | | | | 10.95 | | | | 44,717 | | | | 1.12 | | | | 1.15 | | | | 2.04 | | | | 130 | |
| Year ended 12/31/09 | | | 6.75 | | | | 0.22 | | | | 0.77 | | | | 0.99 | | | | (0.50 | ) | | | — | | | | (0.50 | ) | | | 7.24 | | | | 15.99 | | | | 45,972 | | | | 1.15 | (e) | | | 1.20 | (e) | | | 3.33 | (e)(f) | | | 79 | |
| Year ended 12/31/08 | | | 16.46 | | | | 0.30 | | | | (5.71 | ) | | | (5.41 | ) | | | (0.35 | ) | | | (3.95 | ) | | | (4.30 | ) | | | 6.75 | | | | (40.15 | ) | | | 48,610 | | | | 1.11 | (e) | | | 1.11 | (e) | | | 2.69 | (e) | | | 93 | |
| Year ended 12/31/07 | | | 16.99 | | | | 0.25 | | | | 0.94 | | | | 1.19 | | | | (0.33 | ) | | | (1.39 | ) | | | (1.72 | ) | | | 16.46 | | | | 6.64 | | | | 107,470 | | | | 1.00 | (e) | | | 1.00 | (e) | | | 1.47 | (e) | | | 36 | |
| |
| Series II |
| Year ended 12/31/11 | | | 7.86 | | | | 0.18 | | | | (1.02 | ) | | | (0.84 | ) | | | (0.23 | ) | | | — | | | | (0.23 | ) | | | 6.79 | | | | (11.12 | ) | | | 21,742 | | | | 1.22 | (d) | | | 1.25 | (d) | | | 2.45 | (d) | | | 62 | |
| Year ended 12/31/10(g) | | | 6.52 | | | | 0.07 | | | | 1.27 | | | | 1.34 | | | | — | | | | — | | | | — | | | | 7.86 | | | | 20.55 | | | | 12 | | | | 1.40 | (h) | | | 1.45 | (h) | | | 1.76 | (h) | | | 130 | |
| |
| | |
| (a) | | Calculated using average shares outstanding. |
| (b) | | Includes adjustments in accordance with accounting principles generally accepted in the United States of America and as such, the net asset value for financial reporting purposes and the returns based upon those net asset values may differ from the net asset value and returns for shareholder transactions. Total returns are not annualized for periods less than one year, if applicable, and do not reflect charges assessed in connection with a variable product, which if included would reduce total returns. |
| (c) | | Portfolio turnover is calculated at the fund level and is not annualized for periods less than one year, if applicable. For the Period ended June 30, 2011, the portfolio turnover calculation excluded the value of securities purchased of $68,458,544 and sold of $8,561,566 in effect to realign the Fund’s portfolio holdings after the reorganization of Invesco V.I. Dividend Growth Fund into the Fund. |
| (d) | | Ratios are based on average daily net assets (000’s) of $74,644 and $15,315 for Series I and Series II, respectively. |
| (e) | | The ratios reflect the rebate of certain Fund expenses in connection with investments in a Morgan Stanley affiliate during the period. The effect of the rebate on the ratios was less than 0.005% for the years ended December 31, 2009. 2008 and 2007, respectively. |
| (f) | | Ratio of net investment income to average net assets without fee waivers and/or expense absorbed was 3.28% for the year ended December 31, 2009. |
| (g) | | Commencement date of June 1, 2010. |
| (h) | | Annualized. |
Invesco Van Kampen V.I. Global Value Equity Fund
Report of Independent Registered Public Accounting Firm
To the Board of Trustees of AIM Variable Insurance Funds (Invesco Variable Insurance Funds) and
Shareholders of Invesco Van Kampen V.I. Global Value Equity Fund:
In our opinion, the accompanying statement of assets and liabilities, including the schedule of investments, and the related statements of operations and of changes in net assets and the financial highlights present fairly, in all material respects, the financial position of Invesco Van Kampen V.I. Global Value Equity Fund (one of the funds constituting AIM Variable Insurance Funds (Invesco Variable Insurance Funds), hereafter referred to as the “Fund”) at December 31, 2011, the results of its operations for the year then ended, and the changes in its net assets and the financial highlights for each of the two years in the period then ended, in conformity with accounting principles generally accepted in the United States of America. These financial statements and financial highlights (hereafter referred to as “financial statements”) are the responsibility of the Fund’s management; our responsibility is to express an opinion on these financial statements based on our audits. We conducted our audits of these financial statements in accordance with the standards of the Public Company Accounting Oversight Board (United States). Those standards require that we plan and perform the audits to obtain reasonable assurance about whether the financial statements are free of material misstatement. An audit includes examining, on a test basis, evidence supporting the amounts and disclosures in the financial statements, assessing the accounting principles used and significant estimates made by management, and evaluating the overall financial statement presentation. We believe that our audits, which included confirmation of securities at December 31, 2011 by correspondence with the custodian, provide a reasonable basis for our opinion. The financial highlights of the Fund for the periods ended December 31, 2009 and prior were audited by other independent auditors whose report dated February 19, 2010 expressed an unqualified opinion on those financial statements.
PRICEWATERHOUSECOOPERS LLP
February 14, 2012
Houston, Texas
Invesco Van Kampen V.I. Global Value Equity Fund
Calculating your ongoing Fund expenses
Example
As a shareholder of the Fund, you incur ongoing costs, including management fees; distribution and/or service fees (12b-1); and other Fund expenses. This example is intended to help you understand your ongoing costs (in dollars) of investing in the Fund and to compare these costs with ongoing costs of investing in other mutual funds. The example is based on an investment of $1,000 invested at the beginning of the period and held for the entire period July 1, 2011 through December 31, 2011.
The actual and hypothetical expenses in the examples below do not represent the effect of any fees or other expenses assessed in connection with a variable product; if they did, the expenses shown would be higher while the ending account values shown would be lower.
Actual expenses
The table below provides information about actual account values and actual expenses. You may use the information in this table, together with the amount you invested, to estimate the expenses that you paid over the period. Simply divide your account value by $1,000 (for example, an $8,600 account value divided by $1,000 = 8.6), then multiply the result by the number in the table under the heading entitled “Actual Expenses Paid During Period” to estimate the expenses you paid on your account during this period.
Hypothetical example for comparison purposes
The table below also provides information about hypothetical account values and hypothetical expenses based on the Fund’s actual expense ratio and an assumed rate of return of 5% per year before expenses, which is not the Fund’s actual return.
The hypothetical account values and expenses may not be used to estimate the actual ending account balance or expenses you paid for the period. You may use this information to compare the ongoing costs of investing in the Fund and other funds. To do so, compare this 5% hypothetical example with the 5% hypothetical examples that appear in the shareholder reports of the other funds.
Please note that the expenses shown in the table are meant to highlight your ongoing costs. Therefore, the hypothetical information is useful in comparing ongoing costs, and will not help you determine the relative total costs of owning different funds.
| | | | | | | | | | | | | | | | | | | | | | | | | | | | | | | |
| | | | | | | | | | HYPOTHETICAL
| | | |
| | | | | | | | | | (5% annual return before
| | | |
| | | | | | | ACTUAL | | | expenses) | | | |
| | | | Beginning
| | | Ending
| | | Expenses
| | | Ending
| | | Expenses
| | | Annualized
|
| | | | Account Value
| | | Account Value
| | | Paid During
| | | Account Value
| | | Paid During
| | | Expense
|
| Class | | | (07/01/11) | | | (12/31/11)1 | | | Period2 | | | (12/31/11) | | | Period2 | | | Ratio |
| Series I | | | $ | 1,000.00 | | | | $ | 856.40 | | | | $ | 4.35 | | | | $ | 1,020.52 | | | | $ | 4.74 | | | | | 0.93 | % |
| | | | | | | | | | | | | | | | | | | | | | | | | | | | | | | |
| Series II | | | | 1,000.00 | | | | | 855.20 | | | | | 5.52 | | | | | 1,019.26 | | | | | 6.01 | | | | | 1.18 | |
| | | | | | | | | | | | | | | | | | | | | | | | | | | | | | | |
| |
| 1 | The actual ending account value is based on the actual total return of the Fund for the period July 1, 2011 through December 31, 2011, after actual expenses and will differ from the hypothetical ending account value which is based on the Fund’s expense ratio and a hypothetical annual return of 5% before expenses. |
| 2 | Expenses are equal to the Fund’s annualized expense ratio as indicated above multiplied by the average account value over the period, multiplied by 184/365 to reflect the most recent fiscal half year. |
Invesco Van Kampen V.I. Global Value Equity Fund
Form 1099-DIV, Form 1042-S and other year-end tax information provide shareholders with actual calendar year amounts that should be included in their tax returns. Shareholders should consult their tax advisors.
The following distribution information is being provided as required by the Internal Revenue Code or to meet a specific state’s requirement.
The Fund designates the following amounts or, if subsequently determined to be different, the maximum amount allowable for its fiscal year ended December 31, 2011:
| | | | | |
Federal and State Income Tax | | |
| |
| Corporate Dividends Received Deduction* | | | 55% | |
| | |
| | * | The above percentages are based on ordinary income dividends paid to shareholders during the Fund’s fiscal year. |
Invesco Van Kampen V.I. Global Value Equity Fund
Trustees and Officers
The address of each trustee and officer is AIM Variable Insurance Funds (Invesco Variable Insurance Funds) (the “Trust”), 11 Greenway Plaza, Suite 2500, Houston, Texas 77046-1173. The trustees serve for the life of the Trust, subject to their earlier death, incapacitation, resignation, retirement or removal as more specifically provided in the Trust’s organizational documents. Each officer serves for a one year term or until their successors are elected and qualified. Column two below includes length of time served with predecessor entities, if any.
| | | | | | | | | |
| | | | | | | Number of Funds
| | |
Name, Year of Birth and
| | Trustee and/
| | Principal Occupation(s)
| | in Fund Complex
| | Other Directorship(s)
|
| Position(s) Held with the Trust | | or Officer Since | | During Past 5 Years | | Overseen by Trustee | | Held by Trustee |
| | | | | | | | | |
| | | | | | | | | |
| | | | | | | | | |
| Interested Persons | | | | | | | | |
| | | | | | | | | |
| | | | | | | | | |
| | | | | | | | | |
Martin L. Flanagan1 — 1960
Trustee | | 2007 | | Executive Director, Chief Executive Officer and President, Invesco Ltd. (ultimate parent of Invesco and a global investment management firm); Advisor to the Board, Invesco Advisers, Inc. (formerly known as Invesco Institutional (N.A.), Inc.); Trustee, The Invesco Funds; Vice Chair, Investment Company Institute; and Member of Executive Board, SMU Cox School of Business
Formerly: Chairman, Invesco Advisers, Inc. (registered investment adviser); Director, Chairman, Chief Executive Officer and President, IVZ Inc. (holding company), INVESCO Group Services, Inc. (service provider) and Invesco North American Holdings, Inc. (holding company); Director, Chief Executive Officer and President, Invesco Holding Company Limited (parent of Invesco and a global investment management firm); Director, Invesco Ltd.; Chairman, Investment Company Institute and President, Co-Chief Executive Officer, Co-President, Chief Operating Officer and Chief Financial Officer, Franklin Resources, Inc. (global investment management organization) | | 140 | | None |
| | | | | | | | | |
| | | | | | | | | |
| | | | | | | | | |
Philip A. Taylor2 — 1954
Trustee, President and Principal Executive Officer | | 2006 | | Head of North American Retail and Senior Managing Director, Invesco Ltd.; Director, Co-Chairman, Co-President and Co-Chief Executive Officer, Invesco Advisers, Inc. (formerly known as Invesco Institutional (N.A.), Inc.) (registered investment adviser); Director, Chairman, Chief Executive Officer and President, Invesco Management Group, Inc. (formerly Invesco Aim Management Group, Inc.) (financial services holding company); Director and President, INVESCO Funds Group, Inc. (registered investment adviser and registered transfer agent); Director and Chairman, Invesco Investment Services, Inc. (formerly known as Invesco Aim Investment Services, Inc.) (registered transfer agent) and IVZ Distributors, Inc. (formerly known as INVESCO Distributors, Inc.) (registered broker dealer); Director, President and Chairman, Invesco Inc. (holding company) and Invesco Canada Holdings Inc. (holding company); Chief Executive Officer, Invesco Corporate Class Inc. (corporate mutual fund company) and Invesco Canada Fund Inc. (corporate mutual fund company); Director, Chairman and Chief Executive Officer, Invesco Canada Ltd. (formerly known as Invesco Trimark Ltd./Invesco Trimark Ltèe) (registered investment adviser and registered transfer agent); Trustee, President and Principal Executive Officer, The Invesco Funds (other than AIM Treasurer’s Series Trust (Invesco Treasurer’s Series Trust) and Short-Term Investments Trust); Trustee and Executive Vice President, The Invesco Funds (AIM Treasurer’s Series Trust (Invesco Treasurer’s Series Trust) and Short-Term Investments Trust only); Director, Invesco Investment Advisers LLC (formerly known as Van Kampen Asset Management); Director, Chief Executive Officer and President, Van Kampen Exchange Corp. | | 140 | | None |
| | | | | | | | | |
| | | | | | | | | |
| | | | | Formerly: Director and Chairman, Van Kampen Investor Services Inc.: Director, Chief Executive Officer and President, 1371 Preferred Inc. (holding company); and Van Kampen Investments Inc.; Director and President, AIM GP Canada Inc. (general partner for limited partnerships); and Van Kampen Advisors, Inc.; Director and Chief Executive Officer, Invesco Trimark Dealer Inc. (registered broker dealer); Director, Invesco Distributors, Inc. (formerly known as Invesco Aim Distributors, Inc.) (registered broker dealer); Manager, Invesco PowerShares Capital Management LLC; Director, Chief Executive Officer and President, Invesco Advisers, Inc.; Director, Chairman, Chief Executive Officer and President, Invesco Aim Capital Management, Inc.; President, Invesco Trimark Dealer Inc. and Invesco Trimark Ltd./Invesco Trimark Ltèe; Director and President, AIM Trimark Corporate Class Inc. and AIM Trimark Canada Fund Inc.; Senior Managing Director, Invesco Holding Company Limited; Trustee and Executive Vice President, Tax-Free Investments Trust; Director and Chairman, Fund Management Company (former registered broker dealer); President and Principal Executive Officer, The Invesco Funds (AIM Treasurer’s Series Trust (Invesco Treasurer’s Series Trust), Short-Term Investments Trust and Tax-Free Investments Trust only); President, AIM Trimark Global Fund Inc. and AIM Trimark Canada Fund Inc. | | | | |
| | | | | | | | | |
| | | | | | | | | |
| | | | | | | | | |
Wayne W. Whalen3 — 1939
Trustee | | 2010 | | Of Counsel, and prior to 2010, partner in the law firm of Skadden, Arps, Slate, Meagher & Flom LLP, legal counsel to funds in the Fund Complex | | 158 | | Director of the Abraham Lincoln Presidential Library Foundation |
| | | | | | | | | |
| | | | | | | | | |
| | | | | | | | | |
| Independent Trustees | | | | | | | | |
| | | | | | | | | |
| | | | | | | | | |
| | | | | | | | | |
Bruce L. Crockett — 1944
Trustee and Chair | | 1993 | | Chairman, Crockett Technology Associates (technology consulting company) | | 140 | | ACE Limited (insurance company); and Investment Company Institute |
| | | | | Formerly: Director, Captaris (unified messaging provider); Director, President and Chief Executive Officer COMSAT Corporation; and Chairman, Board of Governors of INTELSAT (international communications company) | | | | |
| | | | | | | | | |
| |
| 1 | Mr. Flanagan is considered an interested person of the Trust because he is an officer of the adviser to the Trust, and an officer and a director of Invesco Ltd., ultimate parent of the adviser to the Trust. |
| 2 | Mr. Taylor is considered an interested person of the Trust because he is an officer and a director of the adviser to, and a director of the principal underwriter of, the Trust. |
| 3 | Mr. Whalen is considered an “interested person” (within the meaning of Section 2(a)(19) of the 1940 Act) of certain Funds in the Fund Complex by reason of he and his firm currently providing legal services as legal counsel to such Funds in the Fund Complex. |
Invesco Van Kampen V.I. Global Value Equity Fund
Trustees and Officers—(continued)
The address of each trustee and officer is AIM Variable Insurance Funds (Invesco Variable Insurance Funds) (the “Trust”), 11 Greenway Plaza, Suite 2500, Houston, Texas 77046-1173. The trustees serve for the life of the Trust, subject to their earlier death, incapacitation, resignation, retirement or removal as more specifically provided in the Trust’s organizational documents. Each officer serves for a one year term or until their successors are elected and qualified. Column two below includes length of time served with predecessor entities, if any.
| | | | | | | | | |
| | | | | | | Number of Funds
| | |
Name, Year of Birth and
| | Trustee and/
| | Principal Occupation(s)
| | in Fund Complex
| | Other Directorship(s)
|
| Position(s) Held with the Trust | | or Officer Since | | During Past 5 Years | | Overseen by Trustee | | Held by Trustee |
| | | | | | | | | |
| | | | | | | | | |
| | | | | | | |
Independent Trustees—(continued) | | | | | | |
| | | | | | | | | |
| | | | | | | | | |
| | | | | | | | | |
David C. Arch — 1945
Trustee | | 2010 | | Chairman and Chief Executive Officer of Blistex Inc., a consumer health care products manufacturer. | | 158 | | Member of the Heartland Alliance Advisory Board, a nonprofit organization serving human needs based in Chicago. Board member of the Illinois Manufacturers’ Association. Member of the Board of Visitors, Institute for the Humanities, University of Michigan |
| | | | | | | | | |
| | | | | | | | | |
| | | | | | | | | |
Frank S. Bayley — 1939
Trustee | | 2001 | | Retired
Formerly: Director, Badgley Funds, Inc. (registered investment company) (2 portfolios) and Partner, law firm of Baker & McKenzie
Formerly: Director, Badgley Funds, Inc. (registered investment company) (2 portfolios) and Partner, law firm of Baker & McKenzie | | 140 | | Director and Chairman, C.D. Stimson Company (a real estate investment company) |
| | | | | | | | | |
| | | | | | | | | |
| | | | | | | | | |
James T. Bunch — 1942
Trustee | | 2004 | | Managing Member, Grumman Hill Group LLC (family office private equity management)
Formerly: Founder, Green, Manning & Bunch Ltd. (investment banking firm)(1988-2010); Executive Committee, United States Golf Association; and Director, Policy Studies, Inc. and Van Gilder Insurance Corporation | | 140 | | Vice Chairman, Board of Governors, Western Golf Association/Evans Scholars Foundation and Director, Denver Film Society |
| | | | | | | | | |
| | | | | | | | | |
| | | | | | | | | |
Rodney F. Dammeyer — 1940
Trustee | | 2010 | | President of CAC, LLC, a private company offering capital investment and management advisory services.
Formerly: Prior to January 2004, Director of TeleTech Holdings Inc.; Prior to 2002, Director of Arris Group, Inc.; Prior to 2001, Managing Partner at Equity Group Corporate Investments. Prior to 1995, Vice Chairman of Anixter International. Prior to 1985, experience includes Senior Vice President and Chief Financial Officer of Household International, Inc., Executive Vice President and Chief Financial Officer of Northwest Industries, Inc. and Partner of Arthur Andersen & Co. | | 158 | | Director of Quidel Corporation and Stericycle, Inc. Prior to May 2008, Trustee of The Scripps Research Institute. Prior to February 2008, Director of Ventana Medical Systems, Inc. Prior to April 2007, Director of GATX Corporation. Prior to April 2004, Director of TheraSense, Inc. |
| | | | | | | | | |
| | | | | | | | | |
| | | | | | | | | |
Albert R. Dowden — 1941
Trustee | | 2000 | | Director of a number of public and private business corporations, including the Boss Group, Ltd. (private investment and management); Reich & Tang Funds (5 portfolios) (registered investment company); and Homeowners of America Holding Corporation/ Homeowners of America Insurance Company (property casualty company)
Formerly: Director, Continental Energy Services, LLC (oil and gas pipeline service); Director, CompuDyne Corporation (provider of product and services to the public security market) and Director, Annuity and Life Re (Holdings), Ltd. (reinsurance company); Director, President and Chief Executive Officer, Volvo Group North America, Inc.; Senior Vice President, AB Volvo; Director of various public and private corporations; Chairman, DHJ Media, Inc.; Director Magellan Insurance Company; and Director, The Hertz Corporation, Genmar Corporation (boat manufacturer), National Media Corporation; Advisory Board of Rotary Power International (designer, manufacturer, and seller of rotary power engines); and Chairman, Cortland Trust, Inc. (registered investment company) | | 140 | | Board of Nature’s Sunshine Products, Inc. |
| | | | | | | | | |
| | | | | | | | | |
| | | | | | | | | |
Jack M. Fields — 1952
Trustee | | 1997 | | Chief Executive Officer, Twenty First Century Group, Inc. (government affairs company); and Owner and Chief Executive Officer, Dos Angelos Ranch, L.P. (cattle, hunting, corporate entertainment), Discovery Global Education Fund (non-profit) and Cross Timbers Quail Research Ranch (non-profit)
Formerly: Chief Executive Officer, Texana Timber LP (sustainable forestry company) and member of the U.S. House of Representatives | | 140 | | Administaff |
| | | | | | | | | |
| | | | | | | | | |
| | | | | | | | | |
Carl Frischling — 1937
Trustee | | 1993 | | Partner, law firm of Kramer Levin Naftalis and Frankel LLP | | 140 | | Director, Reich & Tang Funds (16 portfolios) |
| | | | | | | | | |
| | | | | | | | | |
Invesco Van Kampen V.I. Global Value Equity Fund
Trustees and Officers—(continued)
The address of each trustee and officer is AIM Variable Insurance Funds (Invesco Variable Insurance Funds) (the “Trust”), 11 Greenway Plaza, Suite 2500, Houston, Texas 77046-1173. The trustees serve for the life of the Trust, subject to their earlier death, incapacitation, resignation, retirement or removal as more specifically provided in the Trust’s organizational documents. Each officer serves for a one year term or until their successors are elected and qualified. Column two below includes length of time served with predecessor entities, if any.
| | | | | | | | | |
| | | | | | | Number of Funds
| | |
Name, Year of Birth and
| | Trustee and/
| | Principal Occupation(s)
| | in Fund Complex
| | Other Directorship(s)
|
| Position(s) Held with the Trust | | or Officer Since | | During Past 5 Years | | Overseen by Trustee | | Held by Trustee |
Independent Trustees—(continued) | | | | | | |
| | | | | | | | | |
| | | | | | | | | |
| | | | | | | | | |
Prema Mathai-Davis — 1950
Trustee | | 1998 | | Retired
Formerly: Chief Executive Officer, YWCA of the U.S.A. | | 140 | | None |
| | | | | | | | | |
| | | | | | | | | |
| | | | | | | | | |
Larry Soll — 1942
Trustee | | 2004 | | Retired
Formerly, Chairman, Chief Executive Officer and President, Synergen Corp. (a biotechnology company) | | 140 | | None |
| | | | | | | | | |
| | | | | | | | | |
| | | | | | | | | |
Hugo F. Sonnenschein — 1940
Trustee | | 2010 | | President Emeritus and Honorary Trustee of the University of Chicago and the Adam Smith Distinguished Service Professor in the Department of Economics at the University of Chicago. Prior to July 2000, President of the University of Chicago. | | 158 | | Trustee of the University of Rochester and a member of its investment committee. Member of the National Academy of Sciences, the American Philosophical Society and a fellow of the American Academy of Arts and Sciences |
| | | | | | | | | |
| | | | | | | | | |
| | | | | | | | | |
| Raymond Stickel, Jr. — 1944 Trustee | | 2005 | | Retired
Formerly: Director, Mainstay VP Series Funds, Inc. (25 portfolios) and Partner, Deloitte & Touche | | 140 | | None |
| | | | | | | | | |
| | | | | | | | | |
| | | | | | | | | |
| Other Officers | | | | | | | | |
| | | | | | | | | |
| | | | | | | | | |
| | | | | | | | | |
Russell C. Burk — 1958
Senior Vice President and Senior Officer | | 2005 | | Senior Vice President and Senior Officer, The Invesco Funds | | N/A | | N/A |
| | | | | | | | | |
| | | | | | | | | |
| | | | | | | | | |
John M. Zerr — 1962
Senior Vice President, Chief Legal Officer and Secretary | | 2006 | | Director, Senior Vice President, Secretary and General Counsel, Invesco Management Group, Inc. (formerly known as Invesco Aim Management Group, Inc.) and Van Kampen Exchange Corp.; Senior Vice President, Invesco Advisers, Inc. (formerly known as Invesco Institutional (N.A.), Inc.) (registered investment adviser); Senior Vice President and Secretary, Invesco Distributors, Inc. (formerly known as Invesco Aim Distributors, Inc.); Director, Vice President and Secretary, Invesco Investment Services, Inc. (formerly known as Invesco Aim Investment Services, Inc.) and IVZ Distributors, Inc. (formerly known as INVESCO Distributors, Inc.); Director and Vice President, INVESCO Funds Group, Inc.; Senior Vice President, Chief Legal Officer and Secretary, The Invesco Funds; Manager, Invesco PowerShares Capital Management LLC; Director, Secretary and General Counsel, Invesco Investment Advisers LLC (formerly known as Van Kampen Asset Management); Secretary and General Counsel, Van Kampen Funds Inc. and Chief Legal Officer, PowerShares Exchange-Traded Fund Trust, PowerShares Exchange-Traded Fund Trust II, PowerShares India Exchange-Traded Fund Trust and PowerShares Actively Managed Exchange-Traded Fund Trust
Formerly: Director and Secretary, Van Kampen Advisors Inc.; Director Vice President, Secretary and General Counsel Van Kampen Investor Services Inc.; Director, Invesco Distributors, Inc. (formerly known as Invesco Aim Distributors, Inc.); Director, Senior Vice President, General Counsel and Secretary, Invesco Advisers, Inc.; and Van Kampen Investments Inc.; Director, Vice President and Secretary, Fund Management Company; Director, Senior Vice President, Secretary, General Counsel and Vice President, Invesco Aim Capital Management, Inc.; Chief Operating Officer and General Counsel, Liberty Ridge Capital, Inc. (an investment adviser); Vice President and Secretary, PBHG Funds (an investment company) and PBHG Insurance Series Fund (an investment company); Chief Operating Officer, General Counsel and Secretary, Old Mutual Investment Partners (a broker-dealer); General Counsel and Secretary, Old Mutual Fund Services (an administrator) and Old Mutual Shareholder Services (a shareholder servicing center); Executive Vice President, General Counsel and Secretary, Old Mutual Capital, Inc. (an investment adviser); and Vice President and Secretary, Old Mutual Advisors Funds (an investment company) | | N/A | | N/A |
| | | | | | | | | |
| | | | | | | | | |
| | | | | | | | | |
Lisa O. Brinkley — 1959
Vice President | | 2004 | | Global Compliance Director, Invesco Ltd.; Chief Compliance Officer, Invesco Investment Services, Inc.(formerly known as Invesco Aim Investment Services, Inc.); and Vice President, The Invesco Funds
Formerly: Chief Compliance Officer, Invesco Distributors, Inc. (formerly known as Invesco Aim Distributors, Inc.) and Van Kampen Investor Services Inc.; Senior Vice President, Invesco Management Group, Inc.; Senior Vice President and Chief Compliance Officer, Invesco Advisers, Inc. and The Invesco Funds; Vice President and Chief Compliance Officer, Invesco Aim Capital Management, Inc. and Invesco Distributors, Inc.; Vice President, Invesco Investment Services, Inc. and Fund Management Company | | N/A | | N/A |
| | | | | | | | | |
Invesco Van Kampen V.I. Global Value Equity Fund
Trustees and Officers—(continued)
The address of each trustee and officer is AIM Variable Insurance Funds (Invesco Variable Insurance Funds) (the “Trust”), 11 Greenway Plaza, Suite 2500, Houston, Texas 77046-1173. The trustees serve for the life of the Trust, subject to their earlier death, incapacitation, resignation, retirement or removal as more specifically provided in the Trust’s organizational documents. Each officer serves for a one year term or until their successors are elected and qualified. Column two below includes length of time served with predecessor entities, if any.
| | | | | | | | | |
| | | | | | | Number of Funds
| | |
Name, Year of Birth and
| | Trustee and/
| | Principal Occupation(s)
| | in Fund Complex
| | Other Directorship(s)
|
| Position(s) Held with the Trust | | or Officer Since | | During Past 5 Years | | Overseen by Trustee | | Held by Trustee |
Other Officers—(continued) | | | | | | |
| | | | | | | | | |
| | | | | | | | | |
| | | | | | | | | |
Sheri Morris — 1964
Vice President, Treasurer and Principal Financial Officer | | 1999 | | Vice President, Treasurer and Principal Financial Officer, The Invesco Funds; Vice President, Invesco Advisers, Inc. (formerly known as Invesco Institutional (N.A.), Inc.) (registered investment adviser).
Formerly: Treasurer, PowerShares Exchange-Traded Fund Trust, PowerShares Exchange-Traded Fund Trust II, PowerShares India Exchange-Traded Fund Trust and PowerShares Actively Managed Exchange-Traded Fund Trust, Vice President, Invesco Advisers, Inc., Invesco Aim Capital Management, Inc. and Invesco Aim Private Asset Management, Inc.; Assistant Vice President and Assistant Treasurer, The Invesco Funds and Assistant Vice President, Invesco Advisers, Inc., Invesco Aim Capital Management, Inc. and Invesco Aim Private Asset Management, Inc. | | N/A | | N/A |
| | | | | | | | | |
| | | | | | | | | |
| | | | | | | | | |
Karen Dunn Kelley — 1960
Vice President | | 1993 | | Head of Invesco’s World Wide Fixed Income and Cash Management Group; Senior Vice President, Invesco Management Group, Inc. (formerly known as Invesco Aim Management Group, Inc.) and Invesco Advisers, Inc. (formerly known as Invesco Institutional (N.A.), Inc.) (registered investment adviser); Executive Vice President, Invesco Distributors, Inc. (formerly known as Invesco Aim Distributors, Inc.); Director, Invesco Mortgage Capital Inc.; Vice President, The Invesco Funds (other than AIM Treasurer’s Series Trust (Invesco Treasurer’s Series Trust) and Short-Term Investments Trust); and President and Principal Executive Officer, The Invesco Funds (AIM Treasurer’s Series Trust (Invesco Treasurer’s Series Trust) and Short-Term Investments Trust only).
Formerly: Senior Vice President, Van Kampen Investments Inc.; Vice President, Invesco Advisers, Inc. (formerly known as Invesco Institutional (N.A.), Inc.); Director of Cash Management and Senior Vice President, Invesco Advisers, Inc. and Invesco Aim Capital Management, Inc.; President and Principal Executive Officer, Tax-Free Investments Trust; Director and President, Fund Management Company; Chief Cash Management Officer, Director of Cash Management, Senior Vice President, and Managing Director, Invesco Aim Capital Management, Inc.; Director of Cash Management, Senior Vice President, and Vice President, Invesco Advisers, Inc. and The Invesco Funds (AIM Treasurer’s Series Trust (Invesco Treasurer’s Series Trust), Short-Term Investments Trust and Tax-Free Investments Trust only) | | N/A | | N/A |
| | | | | | | | | |
| | | | | | | | | |
| | | | | | | | | |
Yinka Akinsola — 1977
Anti-Money Laundering Compliance Officer | | 2011 | | Anti-Money Laundering Compliance Officer, Invesco Advisers, Inc. (formerly known as Invesco Institutional (N.A.), Inc.) (registered investment adviser); Invesco Distributors, Inc. (formerly known as Invesco Aim Distributors, Inc.), Invesco Investment Services, Inc. (formerly known as Invesco Aim Investment Services, Inc.), Invesco Management Group, Inc., The Invesco Funds, Invesco Van Kampen Closed-End Funds, Van Kampen Exchange Corp. and Van Kampen Funds Inc. | | N/A | | N/A |
| | | | | | | | | |
| | | | | | | | | |
| | | | | | | | | |
Todd L. Spillane — 1958
Chief Compliance Officer | | 2006 | | Senior Vice President, Invesco Management Group, Inc. (formerly known as Invesco Aim Management Group, Inc.) and Van Kampen Exchange Corp.; Senior Vice President and Chief Compliance Officer, Invesco Advisers, Inc. (registered investment adviser) (formerly known as Invesco Institutional (N.A.), Inc.); Chief Compliance Officer, The Invesco Funds, INVESCO Private Capital Investments, Inc. (holding company) and Invesco Private Capital, Inc. (registered investment adviser); Vice President, Invesco Distributors, Inc. (formerly known as Invesco Aim Distributors, Inc.) and Invesco Investment Services, Inc. (formerly known as Invesco Aim Investment Services, Inc.).
Formerly: Chief Compliance Officer, Invesco Van Kampen Closed-End Funds PowerShares Exchange-Traded Fund Trust, PowerShares Exchange-Traded Fund Trust II, PowerShares India Exchange-Traded Fund Trust, and PowerShares Actively Managed Exchange-Traded Fund Trust; Senior Vice President, Van Kampen Investments Inc.; Senior Vice President and Chief Compliance Officer, Invesco Advisers, Inc. and Invesco Aim Capital Management, Inc.; Chief Compliance Officer, Invesco Global Asset Management (N.A.), Inc., Invesco Senior Secured Management, Inc. (registered investment adviser) and Van Kampen Investor Services Inc.; Vice President, Invesco Aim Capital Management, Inc. and Fund Management Company | | N/A | | N/A |
| | | | | | | | | |
The Statement of Additional Information of the Trust includes additional information about the Fund’s Trustees and is available upon request, without charge, by calling 1.800.959.4246. Please refer to the Fund’s prospectus for information on the Fund’s sub-advisers.
| | | | | | | |
Office of the Fund
11 Greenway Plaza, Suite 2500
Houston, TX 77046-1173 | | Investment Adviser
Invesco Advisers, Inc.
1555 Peachtree Street, N.E.
Atlanta, GA 30309 | | Distributor
Invesco Distributors, Inc.
11 Greenway Plaza, Suite 2500
Houston, TX 77046-1173 | | Auditors
PricewaterhouseCoopers LLP
1201 Louisiana Street, Suite 2900
Houston, TX 77002-5678 |
| | | | | | | |
| | | | | | | |
Counsel to the Fund
Stradley Ronon Stevens & Young, LLP
2600 One Commerce Square
Philadelphia, PA 19103 | | Counsel to the Independent Trustees
Kramer, Levin, Naftalis & Frankel LLP
1177 Avenue of the Americas
New York, NY 10036-2714 | | Transfer Agent
Invesco Investment Services, Inc.
11 Greenway Plaza, Suite 2500
Houston, TX77046-1173 | | Custodian
State Street Bank and Trust Company
225 Franklin
Boston, MA 02110-2801 |
Invesco Van Kampen V.I. Global Value Equity Fund
Invesco Van Kampen V.I. Growth and
Income FundAnnual Report to Shareholders § December 31, 2011The Fund provides a complete list of its holdings four times in each fiscal year, at the quarter-ends. For the second and fourth quarters, the lists appear in the Fund’s semiannual and annual reports to shareholders. For the first and third quarters, the Fund files the lists with the Securities and Exchange Commission (SEC) on Form N-Q. The Fund’s Form N-Q filings are available on the SEC website, sec.gov. Copies of the Fund’s Forms N-Q may be reviewed and copied at the SEC Public Reference Room in Washington, D.C. You can obtain information on the operation of the Public Reference Room, including information about duplicating fee charges, by calling 202 551 8090 or 800 732 0330, or by electronic request at the following email address: publicinfo@sec.gov. The SEC file numbers for the Fund are 811-07452 and 033-57340. The Fund’s most recent portfolio holdings, as filed on Form N-Q, have also been made available to insurance companies issuing variable annuity contracts and variable life insurance policies (“variable products”) that invest in the Fund.
A description of the policies and procedures that the Fund uses to determine how to vote proxies relating to portfolio securities is available without charge, upon request, from our Client Services department at 800 959 4246 or at invesco.com/proxyguidelines. The information is also available on the SEC website, sec.gov.
Information regarding how the Fund voted proxies related to its portfolio securities during the 12 months ended June 30, 2011, is available at invesco.com/proxysearch. The information is also available on the SEC website, sec.gov.
Invesco Advisers, Inc. is an investment adviser; it provides investment advisory services to individual and institutional clients and does not sell securities. Invesco Distributors, Inc. is the U.S. distributor for Invesco Ltd.’s retail mutual funds, exchange-traded funds and institutional money market funds. Both are wholly owned, indirect subsidiaries of Invesco Ltd.
This report must be accompanied or preceded by a currently effective Fund prospectus and variable product prospectus, which contain more complete information, including sales charges and expenses. Investors should read each carefully before investing.
Invesco Distributors, Inc.
VK-VIGRI-AR-1
| | | | | |
| |
| NOT FDIC INSURED | | MAY LOSE VALUE | | NO BANK GUARANTEE |
Management’s Discussion of Fund Performance
Performance summary
For the year ended December 31, 2011, Invesco Van Kampen V.I. Growth and Income Fund underperformed the Russell 1000 Value Index, the Fund’s style-specific benchmark. As the Fund uses a bottom-up stock selection approach, stock selection in various sectors was the primary reason the Fund underperformed its style-specific benchmark.
Your Fund’s long-term performance appears later in this report.
Fund vs. Indexes
Total returns, 12/31/10 to 12/31/11, excluding variable product issuer charges. If variable product issuer charges were included, returns would be lower.
| | | | | |
|
| Series I Shares | | | -2.01 | % |
| |
| Series II Shares | | | -2.26 | |
| |
S&P 500 Index▼(Broad Market Index) | | | 2.09 | |
| |
Russell 1000 Value Index▼(Style-Specific Index) | | | 0.39 | |
| |
Lipper VUF Large-Cap Value Funds Index▼(Peer Group Index) | | | -1.70 | |
| |
Source(s): ▼Lipper Inc.
As noted in the Fund’s latest semiannual report, the Fund has adopted a three-tier benchmark structure to compare its performance to broad market, style-specific and peer group market measures.
How we invest
We call our investment philosophy “value with a catalyst.” We believe undervalued companies that are experiencing positive changes (i.e., “catalysts”) have the potential to generate long-term stock price growth for shareholders. We generally seek to identify companies that are out of favor with investors, under-earning relative to their potential and attractively valued. For these companies, we attempt to identify catalysts that may improve the financial results and/or correct the undervaluation. Examples of catalysts typically include improved operational efficiency, changing industry dynamics and/or a change in management.
We initially identify potential investments through a series of quantitative screens including, but not limited to, return on capital and enterprise value to sales metrics. We then conduct fundamental research on the most attractive opportunities. The research process includes a thorough review of a company’s financial
statements, an evaluation of its competitive position and stability and meetings with its executives. During the research process, we also value the company under various scenarios to determine if the investment is an attractive opportunity relative to its risks. This is also when we typically identify the positive catalyst, a prerequisite for potential investment. Finally, we generally set a price target for a stock based on normalized earnings and historical valuation multiples.
In short, our goal is to exploit negative sentiment toward a company’s stock by analyzing the company’s operations in the context of a cyclical environment and identifying one or more catalysts that may improve the company’s financial performance. Improved financial performance, in turn, has the potential to drive the company’s stock price higher.
We typically sell an investment when it reaches our estimate of fair value or when we identify a more attractive investment opportunity.
Market conditions and your Fund
The year began with equity markets fueled on the second round of “quantitative easing” by the U.S. Federal Reserve. Markets rose through the first quarter of 2011. However, with the spring came increased volatility and significant macroeconomic distortions due to civil unrest in Egypt and Libya, flooding in Australia and a devastating earthquake and tsunami in Japan. Corporate earnings remained strong with largely positive surprises, but were often overshadowed by investor concerns about continuing high unemployment and soft housing data.
Although markets stabilized and were generally in positive territory through the summer, major equity indexes sold off precipitously in August as the U.S. government struggled to raise the nation’s debt ceiling. Despite an eventual agreement between the White House and Congress, credit rating agency Standard & Poor’s announced the first-ever downgrade to long-term U.S. government debt. Uncertainty created by the downgrade, combined with the continuing saga surrounding the debt crisis in the eurozone, reignited fears of a global recession. Despite evidence of sustained, but muted, economic growth, these macroeconomic factors continued to weigh on markets through the end of the reporting period.
Results were mixed among the sectors of the Russell 1000 Value Index, with cyclical sectors such as financials, materials and information technology (IT) posting negative returns, while defensive sectors such as health care and consumer staples fared better, posting double-digit positive returns.
The Fund’s underweight exposure to the financials sector was the largest relative contributor to performance versus the Russell 1000 Value Index, as the financials sector was the worst performing sector in
Portfolio Composition
By sector
| | | | | |
|
| Financials | | | 18.1 | % |
| |
| Energy | | | 13.0 | |
| |
| Health Care | | | 12.7 | |
| |
| Consumer Staples | | | 12.2 | |
| |
| Information Technology | | | 11.4 | |
| |
| Consumer Discretionary | | | 9.4 | |
| |
| Industrials | | | 8.3 | |
| |
| Utilities | | | 4.0 | |
| |
| Telecommunication Services | | | 3.3 | |
| |
| Materials | | | 1.0 | |
| |
Money Market Funds Plus
Other Assets Less Liabilities | | | 6.6 | |
Top 10 Equity Holdings*
| | | | | | | | | |
|
| | 1. | | | General Electric Co. | | | 4.3 | % |
| |
| | 2. | | | JPMorgan Chase & Co. | | | 4.1 | |
| |
| | 3. | | | Marsh & McLennan Cos., Inc. | | | 3.0 | |
| |
| | 4. | | | Pfizer, Inc. | | | 2.8 | |
| |
| | 5. | | | Anadarko Petroleum Corp. | | | 2.7 | |
| |
| | 6. | | | Procter & Gamble Co. (The) | | | 2.7 | |
| |
| | 7. | | | Royal Dutch Shell PLC-ADR | | | 2.4 | |
| |
| | 8. | | | eBay Inc. | | | 2.3 | |
| |
| | 9. | | | Tyco International Ltd. | | | 2.2 | |
| |
| | 10. | | | Viacom Inc.-Class B | | | 2.1 | |
Top Five Industries*
| | | | | | | | | |
|
| | 1. | | | Pharmaceuticals | | | 7.7 | % |
| |
| | 2. | | | Industrial Conglomerates | | | 6.5 | |
| |
| | 3. | | | Integrated Oil & Gas | | | 6.3 | |
| |
| | 4. | | | Other Diversified Financial Services | | | 5.6 | |
| |
| | 5. | | | Electric Utilities | | | 4.0 | |
| | | | | |
|
| Total Net Assets | | $1.9 billion | |
| | | | | |
| Total Number of Holdings* | | | 74 | |
The Fund’s holdings are subject to change, and there is no assurance that the Fund will continue to hold any particular security.
*Excluding money market fund holdings.
Invesco Van Kampen V.I. Growth and Income Fund
the index for the reporting period. In general, we focused on what we believed were lower risk financial companies with stronger balance sheets and less credit risk given the systemic risk in most financial stocks.
Strong stock selection in the materials sector was another driver of relative performance versus the style-specific benchmark. The Fund’s small exposure to Dow Chemical and LyondellBasell and its lack of exposure to Alcoa and US Steel – all of which performed poorly for the year – provided the greatest boost to relative Fund performance within this sector. We sold our positions in both Dow Chemical and LyondellBasell before the close of the reporting period.
Also, stock selection in the health care sector was a contributor to Fund performance relative to the style-specific index. Bristol-Myers Squibb, a pharmaceutical company, and UnitedHealth Group, a health care services company, performed extremely well over the reporting period, adding to the Fund’s relative returns.
Stock selection in the consumer staples sector was the largest detractor from Fund performance during the reporting period. Fund holding Avon Products was a detractor in this sector, as the stock, which was not held in the Russell 1000 Value Index, performed poorly for the year. Avon’s sales declined in emerging markets, notably Brazil, and European profits were hurt by the slowing economy. In December, Avon announced that it would begin a search for a replacement chief executive officer in 2012.
Stock selection in the energy sector also negatively affected the Fund’s relative performance. More specifically, holdings in the exploration and production and oil and gas equipment service industries were the largest detractors, as investors shunned highly cyclical areas of the market. Baker Hughes, Schlumberger and Hess performed poorly during the year, with their stock prices producing double-digit losses.
Stock selection in the IT sector detracted from Fund performance during the reporting period. The Fund was overweight the IT sector versus the Russell 1000 Value Index and was adversely affected by our exposure to stocks in the hardware and equipment industry. Notably hindering Fund performance was Hewlett-Packard. The stock sold off significantly on the announcement the company was selling its PC business to purchase an enterprise software company.
The company also replaced its chief executive officer, the third such change in two years. This created uncertainty in investors’ minds about management stability. Cisco Systems was also a large detractor in the IT sector; however, we sold our position during the early part of 2011.
Finally, stock selection and underweight exposure to the utilities sector also detracted from the Fund’s relative performance. Lack of exposure to multi-utilities stocks was one of the largest detractors from Fund performance within this sector.
We used currency forward contracts during the reporting period for the purpose of hedging currency exposure of U.S. dollar-denominated American Depositary Receipts (ADRs) in the Fund. An ADR is a negotiable security that represents the underlying securities of a non-U.S. company that trades in the U.S. financial markets, priced in U.S. dollars. The use of currency forward contracts had a slight positive impact on the Fund’s performance relative to the Russell 1000 Value Index for the reporting period.
Equity markets experienced an increase in market volatility during the period covered by this report. We believe that market volatility and the market correction that began in the third quarter of 2011 created opportunities to invest in companies with attractive valuations and strong fundamentals. We believe that ultimately those valuations and fundamentals will be reflected in those companies’ stock prices.
Thank you for your investment in Invesco Van Kampen V.I. Growth and Income Fund and for sharing our long-term investment horizon.
The views and opinions expressed in management’s discussion of Fund performance are those of Invesco Advisers, Inc. These views and opinions are subject to change at any time based on factors such as market and economic conditions. These views and opinions may not be relied upon as investment advice or recommendations, or as an offer for a particular security. The information is not a complete analysis of every aspect of any market, country, industry, security or the Fund. Statements of fact are from sources considered reliable, but Invesco Advisers, Inc. makes no representation or warranty as to their completeness or accuracy. Although historical performance is no guarantee of future results, these insights may help you understand our investment management philosophy.
See important Fund and, if applicable, index disclosures later in this report.
Thomas Bastian
Chartered Financial Analyst, portfolio manager, is lead manager of Invesco Van Kampen V.I. Growth and Income Fund. He joined Invesco in 2010. Mr. Bastian earned a B.A. in accounting from St. John’s University and an M.B.A. in finance from the University of Michigan.
Mark Laskin
Chartered Financial Analyst, portfolio manager, is manager of Invesco Van Kampen V.I. Growth and Income Fund. He joined Invesco in 2010. Mr. Laskin earned a B.A. in history from Swarthmore College and an M.B.A. and an M.A. from the Wharton School and the Lauder Institute, respectively, of the University of Pennsylvania.
Mary Jayne Maly
Chartered Financial Analyst, portfolio manager, is manager of Invesco Van Kampen V.I. Growth and Income Fund. She joined Invesco in 2010. Ms. Maly earned a B.A. from the University of Pittsburgh and an M.B.A. from the American Graduate School of International Management.
Sergio Marcheli
Portfolio manager, is manager of Invesco Van Kampen V.I. Growth and Income Fund. He joined Invesco in 2010. Mr. Marcheli earned a B.B.A. from the University of Houston and an M.B.A. from the University of St. Thomas.
James Roeder
Chartered Financial Analyst, portfolio manager, is manager of Invesco Van Kampen V.I. Growth and Income Fund. He joined Invesco in 2010. Mr. Roeder earned a B.S. in accounting from Clemson University and an M.B.A. in economics and finance from the University of Chicago Booth School of Business.
Invesco Van Kampen V.I. Growth and Income Fund
Your Fund’s Long-Term Performance
Results of a $10,000 Investment – Oldest Share Class(es)
Fund and index data from 12/31/01*
| | |
| 1 | | Source: Lipper Inc. |
| |
| * | | During the reporting period, Invesco changed its policy regarding growth of $10,000 charts. For funds older than 10 years, we previously showed performance since inception. Going forward, we will show performance for the most recent 10 years, since this more accurately reflects the experience of the typical shareholder. As a result, charts now may include benchmarks that did not appear previously, because the funds’ inception pre-dated the benchmarks’ inception. Also, all charts will now be presented using a linear format. |
Past performance cannot guarantee comparable future results.
As noted earlier in this report, the Fund has adopted a three-tier benchmark structure to compare its performance to broad market, style-specific and peer
group market measures. These additional benchmarks will now be included in the chart above.
Average Annual Total Returns
As of 12/31/11
| | | | | | | | | |
|
| Series I Shares | | | | |
| |
| Inception (12/23/96) | | | 7.29 | % |
| |
| | 10 Years | | | 4.37 | |
| |
| | 5 Years | | | -0.85 | |
| |
| | 1 Year | | | -2.01 | |
| |
| | | | | | | | | |
| Series II Shares | | | | |
| |
| Inception (9/18/00) | | | 3.50 | % |
| |
| | 10 Years | | | 4.10 | |
| |
| | 5 Years | | | -1.11 | |
| |
| | 1 Year | | | -2.26 | |
Effective June 1, 2010, Class I and Class II shares of the predecessor fund, Van Kampen Life Investment Trust Growth and Income Portfolio, advised by Van Kampen Asset Management were reorganized into Series I and Series II shares, respectively, of Invesco Van Kampen V.I. Growth and Income Fund. Returns shown above for Series I and Series II shares are blended returns of the predecessor fund and Invesco Van Kampen V.I. Growth and Income Fund. Share class returns will differ from the predecessor fund because of different expenses.
The performance data quoted represent past performance and cannot guarantee comparable future results; current performance may be lower or higher. Please contact your variable product issuer or financial adviser for the most recent month-end variable product performance. Performance figures reflect Fund expenses, reinvested distributions and changes in net asset value. Investment return and principal value will fluctuate so that you may have a gain or loss when you sell shares.
The net annual Fund operating expense ratio set forth in the most recent Fund prospectus as of the date of this report for Series I and Series II shares was 0.62% and 0.87%, respectively.1 The total annual Fund operating expense ratio set forth in the most recent Fund prospectus as of the date of this report for Series I and Series II shares was 0.85% and 1.10%, respectively. The expense ratios presented above may vary from the expense ratios presented in other sections of this report that are based on expenses incurred during the period covered by this report.
Invesco Van Kampen V.I. Growth and Income Fund, a series portfolio of AIM Variable Insurance Funds (Invesco Variable Insurance Funds), is currently offered through insurance companies issuing variable products. You cannot purchase shares of the Fund directly. Performance figures given represent the Fund and are not intended to reflect actual variable product values. They do not reflect sales charges, expenses and fees assessed in connection with a variable product. Sales charges, expenses and fees, which are determined by the variable product issuers, will vary and will lower the total return.
The most recent month-end performance data at the Fund level, excluding variable product charges, is available at 800 451 4246. As mentioned above, for the most recent month-end performance including variable product charges, please contact your variable product issuer or financial adviser.
| | |
| 1 | | Total annual Fund operating expenses after any contractual fee waivers and/or expense reimbursements by the adviser in effect through at least June 30, 2012. See current prospectus for more information. |
Invesco Van Kampen V.I. Growth and Income Fund
Invesco Van Kampen V.I. Growth and Income Fund’s investment objective is to seek long-term growth of capital and income.
| n | | Unless otherwise stated, information presented in this report is as of December 31, 2011, and is based on total net assets. |
| |
| n | | Unless otherwise noted, all data provided by Invesco. |
| |
| n | | To access your Fund’s reports/prospectus, visit invesco.com/fundreports. |
Principal risks of investing
in the Fund
Market risk. Market risk is the possibility that the market values of securities owned by the Fund will decline. Market risk may affect a single issuer, industry, sector of the economy or the market as a whole. Investments in equity securities generally are affected by changes in the stock markets, which fluctuate substantially over time, sometimes suddenly and sharply. The ability of the Fund’s equity securities holdings to generate income is dependent on the earnings and the continuing declaration of dividends by the issuers of such securities. The values of income-producing equity securities may or may not move in tandem with overall changes in the stock market. The Fund’s investments in fixed income or debt securities generally are affected by changes in interest rates and the credit-worthiness of the issuer. The market prices of such securities tend to fall as interest rates rise, and such declines may be greater among securities with longer maturities. The values of convertible securities tend to decline as interest rates rise and, because of the conversion feature, tend to vary with fluctuations in the market value of the underlying equity security.
Foreign risks. Risks of investing in securities of foreign issuers, including emerging market issuers, can include fluctuations in foreign currencies, foreign currency exchange controls, political and economic instability, differences in financial reporting, differences in securities regulation and trading, and foreign taxation issues.
Futures risk. A decision as to whether, when and how to use futures involves the exercise of skill and judgment and even a well conceived futures transaction may be unsuccessful because of market behavior or unexpected events.
Options risk. A decision as to whether, when and how to use options involves the exercise of skill and judgment and even a well conceived option transaction may be unsuccessful because of market behavior or unexpected events. The prices of options can be highly volatile and the use of options can lower total returns.
Real estate investment trusts (REITs) risk. Investing in REITs makes the Fund more susceptible to risks associated with the ownership of real estate and with the real estate industry in general and may involve duplication of management fees and certain other expenses. REITs may be less diversified than other pools of securities, may have lower trading volume, and may be subject to more abrupt or erratic price movements than the overall securities markets.
Derivative instruments risk. Risks of derivatives include imperfect correlation between the value of the instruments and the underlying assets; risks of default by the other party to certain transactions; risks that the transactions may result in losses that partially or completely offset gains in portfolio positions; and risks that the instruments may not be liquid.
About indexes used in this report
The S&P 500® Index is an unmanaged index considered representative of the U.S. stock market.
The Russell 1000® Value Index is an unmanaged index considered representative of large-cap value stocks. The Russell 1000 Value Index is a trademark/service mark of the Frank Russell Co. Russell® is a trademark of the Frank Russell Co.
The Lipper VUF Large-Cap Value Funds Index is an unmanaged index considered representative of large-cap value variable insurance underlying funds tracked by Lipper.
The Fund is not managed to track the performance of any particular index, including the index(es) defined here, and consequently, the performance of the Fund may deviate significantly from the performance of the index(es).
A direct investment cannot be made in an index. Unless otherwise indicated, index results include reinvested dividends, and they do not reflect sales charges. Performance of the peer group, if applicable, reflects fund expenses; performance of a market index does not.
Other information
The Chartered Financial Analyst® (CFA®) designation is globally recognized and attests to a charterholder’s success in a rigorous and comprehensive study program in the field of investment management and research analysis.
Industry classifications used in this report are generally according to the Global Industry Classification Standard, which was developed by and is the exclusive property and a service mark of MSCI Inc. and Standard & Poor’s.
The returns shown in management’s discussion of Fund performance are based on net asset values calculated for shareholder transactions. Generally accepted accounting principles require adjustments to be made to the net assets of the Fund at period end for financial reporting purposes, and as such, the net asset values for shareholder transactions and the returns based on those net asset values may differ from the net asset values and returns reported in the Financial Highlights. Additionally, the returns and net asset values shown throughout this report are at the Fund level only and do not include variable product issuer charges. If such charges were included, the total returns would be lower.
Invesco Van Kampen V.I. Growth and Income Fund
Schedule of Investments(a)
December 31, 2011
| | | | | | | | | |
| | | Shares | | Value |
| |
Common Stocks & Other Equity Interests–93.45%
|
Agricultural Products–1.02%
| | | | |
| Archer-Daniels-Midland Co. | | | 671,770 | | | $ | 19,212,622 | |
| |
Asset Management & Custody Banks–1.61%
| | | | |
| Northern Trust Corp. | | | 351,520 | | | | 13,941,283 | |
| |
| State Street Corp. | | | 406,228 | | | | 16,375,051 | |
| |
| | | | | | | | 30,316,334 | |
| |
Cable & Satellite–3.43%
| | | | |
| Comcast Corp.–Class A | | | 1,614,356 | | | | 38,276,381 | |
| |
| Time Warner Cable Inc. | | | 412,596 | | | | 26,228,728 | |
| |
| | | | | | | | 64,505,109 | |
| |
Computer Hardware–2.17%
| | | | |
Dell Inc.(b) | | | 1,234,443 | | | | 18,059,901 | |
| |
| Hewlett-Packard Co. | | | 885,573 | | | | 22,812,361 | |
| |
| | | | | | | | 40,872,262 | |
| |
Consumer Electronics–0.20%
| | | | |
| Sony Corp.–ADR (Japan) | | | 209,430 | | | | 3,778,117 | |
| |
Data Processing & Outsourced Services–0.97%
| | | | |
| Western Union Co. | | | 1,003,723 | | | | 18,327,982 | |
| |
Diversified Banks–2.46%
| | | | |
| Comerica Inc. | | | 457,427 | | | | 11,801,617 | |
| |
| U.S. Bancorp | | | 510,122 | | | | 13,798,800 | |
| |
Wells Fargo & Co.(b) | | | 753,551 | | | | 20,767,865 | |
| |
| | | | | | | | 46,368,282 | |
| |
Diversified Chemicals–0.99%
| | | | |
| PPG Industries, Inc. | | | 223,767 | | | | 18,682,307 | |
| |
Diversified Support Services–0.71%
| | | | |
| Cintas Corp. | | | 381,421 | | | | 13,277,265 | |
| |
Drug Retail–1.01%
| | | | |
| Walgreen Co. | | | 572,388 | | | | 18,923,147 | |
| |
Electric Utilities–4.00%
| | | | |
| American Electric Power Co., Inc. | | | 726,817 | | | | 30,024,810 | |
| |
| Edison International | | | 407,626 | | | | 16,875,716 | |
| |
| Entergy Corp. | | | 158,252 | | | | 11,560,309 | |
| |
| FirstEnergy Corp. | | | 380,807 | | | | 16,869,750 | |
| |
| | | | | | | | 75,330,585 | |
| |
Food Distributors–1.37%
| | | | |
| Sysco Corp. | | | 881,333 | | | | 25,849,497 | |
| |
Health Care Distributors–0.77%
| | | | |
| Cardinal Health, Inc. | | | 354,756 | | | | 14,406,641 | |
| |
Health Care Equipment–1.33%
| | | | |
| Medtronic, Inc. | | | 654,161 | | | | 25,021,658 | |
| |
Health Care Facilities–0.30%
| | | | |
HCA Holdings, Inc.(b) | | | 256,182 | | | | 5,643,689 | |
| |
Home Improvement Retail–1.81%
| | | | |
| Home Depot, Inc. (The) | | | 809,701 | | | | 34,039,830 | |
| |
Household Products–3.24%
| | | | |
Energizer Holdings, Inc.(b) | | | 143,314 | | | | 11,103,969 | |
| |
| Procter & Gamble Co. (The) | | | 748,599 | | | | 49,939,039 | |
| |
| | | | | | | | 61,043,008 | |
| |
Industrial Conglomerates–6.53%
| | | | |
| General Electric Co. | | | 4,563,232 | | | | 81,727,485 | |
| |
| Tyco International Ltd. | | | 878,342 | | | | 41,027,355 | |
| |
| | | | | | | | 122,754,840 | |
| |
Industrial Machinery–1.10%
| | | | |
| Ingersoll-Rand PLC (Ireland) | | | 677,504 | | | | 20,643,547 | |
| |
Insurance Brokers–2.98%
| | | | |
| Marsh & McLennan Cos., Inc. | | | 1,772,101 | | | | 56,033,834 | |
| |
Integrated Oil & Gas–6.28%
| | | | |
| Exxon Mobil Corp. | | | 289,478 | | | | 24,536,155 | |
| |
| Hess Corp. | | | 525,099 | | | | 29,825,623 | |
| |
| Occidental Petroleum Corp. | | | 208,889 | | | | 19,572,900 | |
| |
| Royal Dutch Shell PLC–ADR (United Kingdom) | | | 605,246 | | | | 44,237,430 | |
| |
| | | | | | | | 118,172,108 | |
| |
Integrated Telecommunication Services–1.36%
| | | | |
| Verizon Communications Inc. | | | 635,803 | | | | 25,508,416 | |
| |
Internet Software & Services–2.79%
| | | | |
eBay Inc.(b) | | | 1,436,532 | | | | 43,570,015 | |
| |
Yahoo! Inc.(b) | | | 554,591 | | | | 8,945,553 | |
| |
| | | | | | | | 52,515,568 | |
| |
Investment Banking & Brokerage–0.87%
| | | | |
| Charles Schwab Corp. (The) | | | 1,454,010 | | | | 16,372,153 | |
| |
Investment Companies–Exchange Traded Funds–0.22%
| | | | |
| SPDR S&P Homebuilders-ETF | | | 243,616 | | | | 4,165,834 | |
| |
IT Consulting & Other Services–0.99%
| | | | |
Amdocs Ltd.(b) | | | 652,275 | | | | 18,609,406 | |
| |
| | | | | | | | | |
| | | | | | | | | |
See accompanying Notes to Financial Statements which are an integral part of the financial statements.
Invesco Van Kampen V.I. Growth and Income Fund
| | | | | | | | | |
| | | Shares | | Value |
| |
Managed Health Care–2.55%
| | | | |
| Cigna Corp. | | | 220,112 | | | $ | 9,244,704 | |
| |
| UnitedHealth Group Inc. | | | 762,722 | | | | 38,654,751 | |
| |
| | | | | | | | 47,899,455 | |
| |
Movies & Entertainment–3.93%
| | | | |
| Time Warner Inc. | | | 929,598 | | | | 33,595,672 | |
| |
| Viacom Inc.–Class B | | | 887,011 | | | | 40,279,169 | |
| |
| | | | | | | | 73,874,841 | |
| |
Oil & Gas Equipment & Services–2.24%
| | | | |
| Baker Hughes Inc. | | | 310,333 | | | | 15,094,597 | |
| |
Cameron International Corp.(b) | | | 227,162 | | | | 11,174,099 | |
| |
| Schlumberger Ltd. | | | 233,296 | | | | 15,936,450 | |
| |
| | | | | | | | 42,205,146 | |
| |
Oil & Gas Exploration & Production–3.58%
| | | | |
| Anadarko Petroleum Corp. | | | 660,245 | | | | 50,396,501 | |
| |
| Devon Energy Corp. | | | 274,149 | | | | 16,997,238 | |
| |
| | | | | | | | 67,393,739 | |
| |
Oil & Gas Refining & Marketing–0.01%
| | | | |
| Sunoco, Inc. | | | 5,074 | | | | 208,135 | |
| |
Oil & Gas Storage & Transportation–0.91%
| | | | |
| Williams Cos., Inc. (The) | | | 519,967 | | | | 17,169,310 | |
| |
Other Diversified Financial Services–5.63%
| | | | |
| Citigroup Inc. | | | 1,069,243 | | | | 28,131,784 | |
| |
| JPMorgan Chase & Co. | | | 2,338,977 | | | | 77,770,985 | |
| |
| | | | | | | | 105,902,769 | |
| |
Packaged Foods & Meats–2.55%
| | | | |
| Kraft Foods Inc.–Class A | | | 534,697 | | | | 19,976,280 | |
| |
| Unilever N.V.–New York Shares (Netherlands) | | | 812,155 | | | | 27,913,767 | |
| |
| | | | | | | | 47,890,047 | |
| |
Personal Products–1.47%
| | | | |
| Avon Products, Inc. | | | 1,587,502 | | | | 27,733,660 | |
| |
Pharmaceuticals–7.74%
| | | | |
| Abbott Laboratories | | | 165,762 | | | | 9,320,797 | |
| |
| Bristol-Myers Squibb Co. | | | 1,081,321 | | | | 38,105,752 | |
| |
| Eli Lilly & Co. | | | 154,257 | | | | 6,410,921 | |
| |
Hospira, Inc.(b) | | | 97,185 | | | | 2,951,509 | |
| |
| Merck & Co., Inc. | | | 942,330 | | | | 35,525,841 | |
| |
| Pfizer Inc. | | | 2,466,472 | | | | 53,374,454 | |
| |
| | | | | | | | 145,689,274 | |
| |
Property & Casualty Insurance–0.85%
| | | | |
| Chubb Corp. (The) | | | 231,213 | | | | 16,004,564 | |
| |
Regional Banks–3.51%
| | | | |
| BB&T Corp. | | | 651,121 | | | | 16,388,716 | |
| |
| Fifth Third Bancorp | | | 1,118,388 | | | | 14,225,895 | |
| |
| PNC Financial Services Group, Inc. | | | 614,676 | | | | 35,448,365 | |
| |
| | | | | | | | 66,062,976 | |
| |
Semiconductor Equipment–0.81%
| | | | |
| Applied Materials, Inc. | | | 1,429,825 | | | | 15,313,426 | |
| |
Semiconductors–1.54%
| | | | |
| Intel Corp. | | | 696,089 | | | | 16,880,158 | |
| |
| STMicroelectronics N.V. (Switzerland) | | | 1,322,706 | | | | 7,812,377 | |
| |
| STMicroelectronics N.V.–New York Shares (Netherlands) | | | 716,645 | | | | 4,249,705 | |
| |
| | | | | | | | 28,942,240 | |
| |
Soft Drinks–1.57%
| | | | |
Coca-Cola Co. (The) | | | 284,186 | | | | 19,884,494 | |
| |
| PepsiCo, Inc. | | | 145,577 | | | | 9,659,034 | |
| |
| | | | | | | | 29,543,528 | |
| |
Systems Software–2.13%
| | | | |
| Microsoft Corp. | | | 1,540,799 | | | | 39,999,142 | |
| |
Wireless Telecommunication Services–1.92%
| | | | |
| Vodafone Group PLC–ADR (United Kingdom) | | | 1,285,541 | | | | 36,033,714 | |
| |
| Total Common Stocks & Other Equity Interests (Cost $1,669,715,869) | | | | | | | 1,758,240,007 | |
| |
Money Market Funds–7.13%
|
Liquid Assets Portfolio–Institutional Class(c) | | | 67,085,087 | | | | 67,085,087 | |
| |
Premier Portfolio–Institutional Class(c) | | | 67,085,087 | | | | 67,085,087 | |
| |
| Total Money Market Funds (Cost $134,170,174) | | | | | | | 134,170,174 | |
| |
| TOTAL INVESTMENTS–100.58% (Cost $1,803,886,043) | | | | | | | 1,892,410,181 | |
| |
| OTHER ASSETS LESS LIABILITIES–(0.58)% | | | | | | | (10,963,928 | ) |
| |
| NET ASSETS–100.00% | | | | | | $ | 1,881,446,253 | |
| |
Investment Abbreviations:
| | | |
| ADR | | – American Depositary Receipt |
| ETF | | – Exchange-Traded Fund |
| SPDR | | – Standard & Poor’s Depositary Receipt |
Notes to Schedule of Investments:
| | |
| (a) | | Industry and/or sector classifications used in this report are generally according to the Global Industry Classification Standard, which was developed by and is the exclusive property and a service mark of MSCI Inc. and Standard & Poor’s. |
| (b) | | Non-income producing security. |
| (c) | | The money market fund and the Fund are affiliated by having the same investment adviser. |
See accompanying Notes to Financial Statements which are an integral part of the financial statements.
Invesco Van Kampen V.I. Growth and Income Fund
Statement of Assets and Liabilities
December 31, 2011
| | | | | |
Assets:
|
| Investments, at value (Cost $1,669,715,869) | | $ | 1,758,240,007 | |
| |
| Investments in affiliated money market funds, at value and cost | | | 134,170,174 | |
| |
| Total investments, at value (Cost $1,803,886,043) | | | 1,892,410,181 | |
| |
| Cash | | | 114,626 | |
| |
| Receivable for: | | | | |
| Investments sold | | | 1,140,395 | |
| |
| Fund shares sold | | | 625,225 | |
| |
| Dividends | | | 4,101,090 | |
| |
| Fund expenses absorbed | | | 8,503 | |
| |
| Foreign currency contracts outstanding | | | 2,441,845 | |
| |
| Investment for trustee deferred compensation and retirement plans | | | 11,803 | |
| |
| Total assets | | | 1,900,853,668 | |
| |
Liabilities:
|
| Payable for: | | | | |
| Investments purchased | | | 515,754 | |
| |
| Fund shares reacquired | | | 16,166,933 | |
| |
| Accrued fees to affiliates | | | 2,604,002 | |
| |
| Accrued other operating expenses | | | 52,701 | |
| |
| Trustee deferred compensation and retirement plans | | | 68,025 | |
| |
| Total liabilities | | | 19,407,415 | |
| |
| Net assets applicable to shares outstanding | | $ | 1,881,446,253 | |
| |
Net assets consist of:
|
| Shares of beneficial interest | | $ | 1,827,183,566 | |
| |
| Undistributed net investment income | | | 26,708,695 | |
| |
| Undistributed net realized gain (loss) | | | (63,411,991 | ) |
| |
| Unrealized appreciation | | | 90,965,983 | |
| |
| | | $ | 1,881,446,253 | |
| |
Net Assets:
|
| Series I | | $ | 156,616,652 | |
| |
| Series II | | $ | 1,724,829,601 | |
| |
Shares outstanding, $0.001 par value per share, with an unlimited number of shares authorized:
|
| Series I | | | 8,812,645 | |
| |
| Series II | | | 97,221,988 | |
| |
| Series I: | | | | |
| Net asset value per share | | $ | 17.77 | |
| |
| Series II: | | | | |
| Net asset value per share | | $ | 17.74 | |
| |
Statement of Operations
For the year ended December 31, 2011
| | | | | |
Investment income:
|
| Dividends (net of foreign withholding taxes of $553,356) | | $ | 42,437,110 | |
| |
| Dividends from affiliated money market funds | | | 103,736 | |
| |
| Total investment income | | | 42,540,846 | |
| |
Expenses:
|
| Advisory fees | | | 10,585,454 | |
| |
| Administrative services fees | | | 4,851,261 | |
| |
| Custodian fees | | | 91,208 | |
| |
| Distribution fees — Series II | | | 4,332,503 | |
| |
| Transfer agent fees | | | 29,576 | |
| |
| Trustees’ and officers’ fees and benefits | | | 99,737 | |
| |
| Other | | | 66,679 | |
| |
| Total expenses | | | 20,056,418 | |
| |
| Less: Fees waived | | | (4,238,695 | ) |
| |
| Net expenses | | | 15,817,723 | |
| |
| Net investment income | | | 26,723,123 | |
| |
Realized and unrealized gain (loss) from:
|
| Net realized gain (loss) from: | | | | |
| Investment securities | | | 40,577,416 | |
| |
| Foreign currencies | | | (33,344 | ) |
| |
| Foreign currency contracts | | | 3,006,115 | |
| |
| | | | 43,550,187 | |
| |
| Change in net unrealized appreciation (depreciation) of: | | | | |
| Investment securities | | | (110,207,371 | ) |
| |
| Foreign currency contracts | | | 2,441,845 | |
| |
| | | | (107,765,526 | ) |
| |
| Net realized and unrealized gain (loss) | | | (64,215,339 | ) |
| |
| Net increase (decrease) in net assets resulting from operations | | $ | (37,492,216 | ) |
| |
See accompanying Notes to Financial Statements which are an integral part of the financial statements.
Invesco Van Kampen V.I. Growth and Income Fund
Statement of Changes in Net Assets
For the years ended December 31, 2011 and 2010
| | | | | | | | | |
| | | 2011 | | 2010 |
| |
Operations:
|
| Net investment income | | $ | 26,723,123 | | | $ | 20,300,526 | |
| |
| Net realized gain | | | 43,550,187 | | | | 91,837,578 | |
| |
| Change in net unrealized appreciation (depreciation) | | | (107,765,526 | ) | | | 96,268,684 | |
| |
| Net increase (decrease) in net assets resulting from operations | | | (37,492,216 | ) | | | 208,406,788 | |
| |
Distributions to shareholders from net investment income:
|
| Series I | | | (1,800,201 | ) | | | (156,262 | ) |
| |
| Series II | | | (18,264,703 | ) | | | (1,556,159 | ) |
| |
| Total distributions from net investment income | | | (20,064,904 | ) | | | (1,712,421 | ) |
| |
Share transactions–net:
|
| Series I | | | 6,256,808 | | | | (16,505,227 | ) |
| |
| Series II | | | 52,879,530 | | | | 21,333,686 | |
| |
| Net increase in net assets resulting from share transactions | | | 59,136,338 | | | | 4,828,459 | |
| |
| Net increase in net assets | | | 1,579,218 | | | | 211,522,826 | |
| |
Net assets:
|
| Beginning of year | | | 1,879,867,035 | | | | 1,668,344,209 | |
| |
| End of year (includes undistributed net investment income of $26,708,695 and $19,988,664, respectively) | | $ | 1,881,446,253 | | | $ | 1,879,867,035 | |
| |
Notes to Financial Statements
December 31, 2011
NOTE 1—Significant Accounting Policies
Invesco Van Kampen V.I. Growth and Income Fund (the “Fund”) is a series portfolio of AIM Variable Insurance Funds (Invesco Variable Insurance Funds) (the “Trust”). The Trust is a Delaware statutory trust registered under the Investment Company Act of 1940, as amended (the “1940 Act”), as an open-end series management investment company consisting of twenty-eight separate portfolios, (each constituting a “Fund”). The assets, liabilities and operations of each portfolio are accounted for separately. Information presented in these financial statements pertains only to the Fund. Matters affecting each Fund or class will be voted on exclusively by the shareholders of such Fund or class. Current Securities and Exchange Commission (“SEC”) guidance, however, requires participating insurance companies offering separate accounts to vote shares proportionally in accordance with the instructions of the contract owners whose investments are funded by shares of each Fund or class.
The Fund’s investment objectives is to seek long-term growth of capital and income.
The Fund currently offers two classes of shares, Series I and Series II, both of which are offered to insurance company separate accounts funding variable annuity contracts and variable life insurance policies (“variable products”).
The following is a summary of the significant accounting policies followed by the Fund in the preparation of its financial statements.
| | |
| A. | | Security Valuations — Securities, including restricted securities, are valued according to the following policy. |
| | A security listed or traded on an exchange (except convertible bonds) is valued at its last sales price or official closing price as of the close of the customary trading session on the exchange where the security is principally traded, or lacking any sales or official closing price on a particular day, the security may be valued at the closing bid price on that day. Securities traded in the over-the-counter market are valued based on prices furnished by independent pricing services or market makers. When such securities are valued by an independent pricing service they may be considered fair valued. Futures contracts are valued at the final settlement price set by an exchange on which they are principally traded. Listed options are valued at the mean between the last bid and ask prices from the exchange on which they are principally traded. Options not listed on an exchange are valued by an independent source at the mean between the last bid and ask prices. For purposes of determining net asset value per share, futures and option contracts generally are valued 15 minutes after the close of the customary trading session of the New York Stock Exchange (“NYSE”). |
| | Investments in open-end and closed-end registered investment companies that do not trade on an exchange are valued at the end of day net asset value per share. Investments in open-end and closed-end registered investment companies that trade on an exchange are valued at the last sales price or official closing price as of the close of the customary trading session on the exchange where the security is principally traded. |
| | Debt obligations (including convertible bonds) and unlisted equities are fair valued using an evaluated quote provided by an independent pricing service. Evaluated quotes provided by the pricing service may be determined without exclusive reliance on quoted prices, and may reflect appropriate factors such as |
Invesco Van Kampen V.I. Growth and Income Fund
| | |
| | institution-size trading in similar groups of securities, developments related to specific securities, dividend rate, yield, quality, type of issue, coupon rate, maturity, individual trading characteristics and other market data. Debt securities are subject to interest rate and credit risks. In addition, all debt securities involve some risk of default with respect to interest and/or principal payments. |
| | Foreign securities (including foreign exchange contracts) are converted into U.S. dollar amounts using the applicable exchange rates as of the close of the NYSE. If market quotations are available and reliable for foreign exchange traded equity securities, the securities will be valued at the market quotations. Because trading hours for certain foreign securities end before the close of the NYSE, closing market quotations may become unreliable. If between the time trading ends on a particular security and the close of the customary trading session on the NYSE, events occur that are significant and make the closing price unreliable, the Fund may fair value the security. If the event is likely to have affected the closing price of the security, the security will be valued at fair value in good faith using procedures approved by the Board of Trustees. Adjustments to closing prices to reflect fair value may also be based on a screening process of an independent pricing service to indicate the degree of certainty, based on historical data, that the closing price in the principal market where a foreign security trade is not the current value as of the close of the NYSE. Foreign securities meeting the approved degree of certainty that the price is not reflective of current value will be priced at the indication of fair value from the independent pricing service. Multiple factors may be considered by the independent pricing service in determining adjustments to reflect fair value and may include information relating to sector indices, American Depositary Receipts and domestic and foreign index futures. Foreign securities may have additional risks including exchange rate changes, potential for sharply devalued currencies and high inflation, political and economic upheaval, the relative lack of issuer information, relatively low market liquidity and the potential lack of strict financial and accounting controls and standards. |
| | Securities for which market prices are not provided by any of the above methods may be valued based upon quotes furnished by independent sources. The last bid price may be used to value equity securities. The mean between the last bid and asked prices is used to value debt obligations, including Corporate Loans. |
| | Securities for which market quotations are not readily available or are unreliable are valued at fair value as determined in good faith by or under the supervision of the Trust’s officers following procedures approved by the Board of Trustees. Issuer specific events, market trends, bid/ask quotes of brokers and information providers and other market data may be reviewed in the course of making a good faith determination of a security’s fair value. |
| | Valuations change in response to many factors including the historical and prospective earnings of the issuer, the value of the issuer’s assets, general economic conditions, interest rates, investor perceptions and market liquidity. Because of the inherent uncertainties of valuation, the values reflected in the financial statements may materially differ from the value received upon actual sale of those investments. |
| B. | | Securities Transactions and Investment Income — Securities transactions are accounted for on a trade date basis. Realized gains or losses on sales are computed on the basis of specific identification of the securities sold. Interest income is recorded on the accrual basis from settlement date. Paydown gains and losses on mortgage and asset-backed securities are recorded as adjustments to interest income. Dividend income (net of withholding tax, if any) is recorded on the ex-dividend date. Bond premiums and discounts are amortized and/or accreted for financial reporting purposes. |
| | The Fund may periodically participate in litigation related to Fund investments. As such, the Fund may receive proceeds from litigation settlements. Any proceeds received are included in the Statement of Operations as realized gain (loss) for investments no longer held and as unrealized gain (loss) for investments still held. |
| | Brokerage commissions and mark ups are considered transaction costs and are recorded as an increase to the cost basis of securities purchased and/or a reduction of proceeds on a sale of securities. Such transaction costs are included in the determination of net realized and unrealized gain (loss) from investment securities reported in the Statement of Operations and the Statement of Changes in Net Assets and the net realized and unrealized gains (losses) on securities per share in the Financial Highlights. Transaction costs are included in the calculation of the Fund’s net asset value and, accordingly, they reduce the Fund’s total returns. These transaction costs are not considered operating expenses and are not reflected in net investment income reported in the Statement of Operations and Statement of Changes in Net Assets, or the net investment income per share and ratios of expenses and net investment income reported in the Financial Highlights, nor are they limited by any expense limitation arrangements between the Fund and the investment adviser. |
| | The Fund allocates income and realized and unrealized capital gains and losses to a class based on the relative net assets of each class. |
| C. | | Country Determination — For the purposes of making investment selection decisions and presentation in the Schedule of Investments, the investment adviser may determine the country in which an issuer is located and/or credit risk exposure based on various factors. These factors include the laws of the country under which the issuer is organized, where the issuer maintains a principal office, the country in which the issuer derives 50% or more of its total revenues and the country that has the primary market for the issuer’s securities, as well as other criteria. Among the other criteria that may be evaluated for making this determination are the country in which the issuer maintains 50% or more of its assets, the type of security, financial guarantees and enhancements, the nature of the collateral and the sponsor organization. Country of issuer and/or credit risk exposure has been determined to be the United States of America, unless otherwise noted. |
| D. | | Distributions — Distributions from income and net realized capital gain, if any, are generally paid to separate accounts of participating insurance companies annually and recorded on ex-dividend date. |
| E. | | Federal Income Taxes — The Fund intends to comply with the requirements of Subchapter M of the Internal Revenue Code necessary to qualify as a regulated investment company and to distribute substantially all of the Fund’s taxable earnings to shareholders. As such, the Fund will not be subject to federal income taxes on otherwise taxable income (including net realized capital gain) that is distributed to shareholders. Therefore, no provision for federal income taxes is recorded in the financial statements. |
| | The Fund files tax returns in the U.S. Federal jurisdiction and certain other jurisdictions. Generally, the Fund is subject to examinations by such taxing authorities for up to three years after the filing of the return for the tax period. |
| F. | | Expenses — Fees provided for under the Rule 12b-1 plan of a particular class of the Fund and which are directly attributable to that class are charged to the operations of such class. All other expenses are allocated among the classes based on relative net assets. |
| G. | | Accounting Estimates — The preparation of financial statements in conformity with accounting principles generally accepted in the United States of America (“GAAP”) requires management to make estimates and assumptions that affect the reported amounts of assets and liabilities at the date of the |
Invesco Van Kampen V.I. Growth and Income Fund
| | |
| | financial statements and the reported amounts of revenues and expenses during the reporting period including estimates and assumptions related to taxation. Actual results could differ from those estimates by a significant amount. In addition, the Fund monitors for material events or transactions that may occur or become known after the period-end date and before the date the financial statements are released to print. |
| H. | | Indemnifications — Under the Trust’s organizational documents, each Trustee, officer, employee or other agent of the Trust is indemnified against certain liabilities that may arise out of performance of their duties to the Fund. Additionally, in the normal course of business, the Fund enters into contracts, including the Fund’s servicing agreements that contain a variety of indemnification clauses. The Fund’s maximum exposure under these arrangements is unknown as this would involve future claims that may be made against the Fund that have not yet occurred. The risk of material loss as a result of such indemnification claims is considered remote. |
| I. | | Foreign Currency Translations — Foreign currency is valued at the close of the NYSE based on quotations posted by banks and major currency dealers. Portfolio securities and other assets and liabilities denominated in foreign currencies are translated into U.S. dollar amounts at date of valuation. Purchases and sales of portfolio securities (net of foreign taxes withheld on disposition) and income items denominated in foreign currencies are translated into U.S. dollar amounts on the respective dates of such transactions. The Fund does not separately account for the portion of the results of operations resulting from changes in foreign exchange rates on investments and the fluctuations arising from changes in market prices of securities held. The combined results of changes in foreign exchange rates and the fluctuation of market prices on investments (net of estimated foreign tax withholding) are included with the net realized and unrealized gain or loss from investments in the Statement of Operations. Reported net realized foreign currency gains or losses arise from (1) sales of foreign currencies, (2) currency gains or losses realized between the trade and settlement dates on securities transactions, and (3) the difference between the amounts of dividends, interest, and foreign withholding taxes recorded on the Fund’s books and the U.S. dollar equivalent of the amounts actually received or paid. Net unrealized foreign currency gains and losses arise from changes in the fair values of assets and liabilities, other than investments in securities at fiscal period end, resulting from changes in exchange rates. |
| | The Fund may invest in foreign securities which may be subject to foreign taxes on income, gains on investments or currency repatriation, a portion of which may be recoverable. |
| J. | | Foreign Currency Contracts — The Fund may enter into foreign currency contracts to manage or minimize currency or exchange rate risk. The Fund may also enter into foreign currency contracts for the purchase or sale of a security denominated in a foreign currency in order to “lock in” the U.S. dollar price of that security. A foreign currency contract is an obligation to purchase or sell a specific currency for an agreed-upon price at a future date. The use of foreign currency contracts does not eliminate fluctuations in the price of the underlying securities the Fund owns or intends to acquire but establishes a rate of exchange in advance. Fluctuations in the value of these contracts are measured by the difference in the contract date and reporting date exchange rates and are recorded as unrealized appreciation (depreciation) until the contracts are closed. When the contracts are closed, realized gains (losses) are recorded. Realized and unrealized gains (losses) on the contracts are included in the Statement of Operations. The primary risks associated with foreign currency contracts include failure of the counterparty to meet the terms of the contract and the value of the foreign currency changing unfavorably. These risks may be in excess of the amounts reflected in the Statement of Assets and Liabilities. |
NOTE 2—Advisory Fees and Other Fees Paid to Affiliates
The Trust has entered into a master investment advisory agreement with Invesco Advisers, Inc. (the “Adviser” or “Invesco”). Under the terms of the investment advisory agreement, the Fund pays an advisory fee to the Adviser based on the annual rate of the Fund’s average daily net assets as follows:
| | | | | |
| Average Daily Net Assets | | Rate |
| |
| First $500 million | | | 0 | .60% |
| |
| Over $500 million | | | 0 | .55% |
| |
Under the terms of a master sub-advisory agreement between the Adviser and each of Invesco Asset Management Deutschland GmbH, Invesco Asset Management Limited, Invesco Asset Management (Japan) Limited, Invesco Australia Limited, Invesco Hong Kong Limited, Invesco Senior Secured Management, Inc. and Invesco Canada Ltd. (collectively, the “Affiliated Sub-Advisers”) the Adviser, not the Fund, may pay 40% of the fees paid to the Adviser to any such Affiliated Sub-Adviser(s) that provide discretionary investment management services to the Fund based on the percentage of assets allocated to such Sub-Adviser(s).
The Adviser has contractually agreed, through at least June 30, 2012, to waive advisory fees and/or reimburse expenses of all shares to the extent necessary to limit total annual fund operating expenses after fee waiver and/or expense reimbursement (excluding certain items discussed below) of Series I shares to 0.62% and Series II shares to 0.87% of average daily net assets. In determining the Adviser’s obligation to waive advisory fees and/or reimburse expenses, the following expenses are not taken into account, and could cause the total annual fund operating expenses after fee waiver and/or expense reimbursement to exceed the numbers reflected above: (1) interest; (2) taxes; (3) dividend expense on short sales; (4) extraordinary or non-routine items, including litigation expenses; and (5) expenses that the Fund has incurred but did not actually pay because of an expense offset arrangement. Unless the Board of the Trustees and Invesco mutually agree to amend or continue the fee waiver agreement, it will terminate on June 30, 2012.
Further, the Adviser has contractually agreed, through at least June 30, 2012, to waive the advisory fee payable by the Fund in an amount equal to 100% of the net advisory fees the Adviser receives from the affiliated money market funds on investments by the Fund of uninvested cash in such affiliated money market funds.
For the year ended December 31, 2011, the Adviser waived advisory fees of $4,238,695.
The Trust has entered into a master administrative services agreement with Invesco pursuant to which the Fund has agreed to pay Invesco a fee for costs incurred in providing accounting services and fund administrative services to the Fund and to reimburse Invesco for administrative services fees paid to insurance companies that have agreed to provide services to the participants of separate accounts. These administrative services provided by the insurance companies may include, among other things: the printing of prospectuses, financial reports and proxy statements and the delivery of the same to existing
Invesco Van Kampen V.I. Growth and Income Fund
participants; the maintenance of master accounts; the facilitation of purchases and redemptions requested by the participants; and the servicing of participants’ accounts. Pursuant to such agreement, for the year ended December 31, 2011, Invesco was paid $404,293 for accounting and fund administrative services and reimbursed $4,446,968 for services provided by insurance companies.
The Trust has entered into a transfer agency and service agreement with Invesco Investment Services, Inc. (“IIS”) pursuant to which the Fund has agreed to pay IIS a fee for providing transfer agency and shareholder services to the Fund and reimburse IIS for certain expenses incurred by IIS in the course of providing such services. For the year ended December 31, 2011, expenses incurred under the agreement are shown in the Statement of Operations as transfer agent fees.
The Trust has entered into a master distribution agreement with Invesco Distributors, Inc. (“IDI”) to serve as the distributor for the Fund. The Trust has adopted a plan pursuant to Rule 12b-1 under the 1940 Act with respect to the Fund’s Series II shares (the “Plan”). The Fund, pursuant to the Plan, pays IDI compensation at the annual rate of 0.25% of the Fund’s average daily net assets of Series II shares. Of the Plan payments, up to 0.25% of the average daily net assets of the Series II shares may be paid to insurance companies who furnish continuing personal shareholder services to customers who purchase and own Series II shares of the Fund. For the year ended December 31, 2011, expenses incurred under the Plan are detailed in the Statement of Operations as distribution fees.
Certain officers and trustees of the Trust are officers and directors of the Adviser, IIS and/or IDI.
NOTE 3—Additional Valuation Information
GAAP defines fair value as the price that would be received to sell an asset or paid to transfer a liability in an orderly transaction between market participants at the measurement date, under current market conditions. GAAP establishes a hierarchy that prioritizes the inputs to valuation methods giving the highest priority to readily available unadjusted quoted prices in an active market for identical assets (Level 1) and the lowest priority to significant unobservable inputs (Level 3) generally when market prices are not readily available or are unreliable. Based on the valuation inputs, the securities or other investments are tiered into one of three levels. Changes in valuation methods may result in transfers in or out of an investment’s assigned level:
| | |
| | Level 1 — | Prices are determined using quoted prices in an active market for identical assets. |
| | Level 2 — | Prices are determined using other significant observable inputs. Observable inputs are inputs that other market participants may use in pricing a security. These may include quoted prices for similar securities, interest rates, prepayment speeds, credit risk, yield curves, loss severities, default rates, discount rates, volatilities and others. |
| | Level 3 — | Prices are determined using significant unobservable inputs. In situations where quoted prices or observable inputs are unavailable (for example, when there is little or no market activity for an investment at the end of the period), unobservable inputs may be used. Unobservable inputs reflect the Fund’s own assumptions about the factors market participants would use in determining fair value of the securities or instruments and would be based on the best available information. |
The following is a summary of the tiered valuation input levels, as of December 31, 2011. The level assigned to the securities valuations may not be an indication of the risk or liquidity associated with investing in those securities. Because of the inherent uncertainties of valuation, the values reflected in the financial statements may materially differ from the value received upon actual sale of those investments.
During the year ended December 31, 2011, there were no significant transfers between investment levels.
| | | | | | | | | | | | | | | | | |
| | | Level 1 | | Level 2 | | Level 3 | | Total |
| |
| Equity Securities | | $ | 1,884,597,804 | | | $ | 7,812,377 | | | $ | — | | | $ | 1,892,410,181 | |
| |
NOTE 4—Derivative Investments
Value of Derivative Instruments at Period-End
The Table below summarizes the value of the Fund’s derivative instruments, detailed by primary risk exposure, held as of December 31, 2011:
| | | | | | | | | |
| | | Value |
| Risk Exposure/Derivative Type | | Assets | | Liabilities |
| |
| Currency risk | | | | | | | | |
Foreign currency contracts(a) | | $ | 2,441,845 | | | $ | — | |
| |
| | |
| (a) | | Values are disclosed on the Statement of Assets and Liabilities under the foreign currency contracts outstanding. |
Effect of Derivative Instruments for the year ended December 31, 2011
The table below summarizes the gains on derivative instruments, detailed by primary risk exposure, recognized in earnings during the period:
| | | | | |
| | | Location of Gain on
|
| | | Statement of Operations |
| | | Foreign Currency
|
| | | Contracts* |
| |
| Realized Gain | | | | |
| Currency risk | | $ | 3,006,115 | |
| |
| Change in Unrealized Appreciation | | | | |
| Currency risk | | | 2,441,845 | |
| |
| Total | | $ | 5,447,960 | |
| |
| |
| * | The average notional value of foreign currency contracts outstanding during the period was $46,351,977. |
Invesco Van Kampen V.I. Growth and Income Fund
| | | | | | | | | | | | | | | | | | | | | | | |
| Open Foreign Currency Contracts |
Settlement
| | | | Contract to | | Notional
| | Unrealized
|
| Date | | Counterparty | | Deliver | | Receive | | Value | | Appreciation |
| |
| 01/12/12 | | State Street Bank | | | EUR | | | 11,474,439 | | | USD | | | 15,436,792 | | $ | 14,852,932 | | | $ | 583,860 | |
| |
| 01/12/12 | | Bank of New York | | | EUR | | | 32,737,509 | | | USD | | | 44,035,878 | | | 42,376,627 | | | | 1,659,251 | |
| |
| 01/12/12 | | State Street Bank | | | GBP | | | 16,602,625 | | | USD | | | 25,986,014 | | | 25,787,280 | | | | 198,734 | |
| |
| Total open foreign currency contracts | | | | | | | | | | | | $ | 2,441,845 | |
| |
| | | |
| Currency Abbreviations: |
| EUR | | – Euro |
| GBP | | – British Pound |
| USD | | – U.S. Dollar |
NOTE 5—Security Transactions with Affiliated Funds
The Fund is permitted to purchase or sell securities from or to certain other Invesco Funds under specified conditions outlined in procedures adopted by the Board of Trustees of the Trust. The procedures have been designed to ensure that any purchase or sale of securities by the Fund from or to another fund or portfolio that is or could be considered an affiliate by virtue of having a common investment adviser (or affiliated investment advisers), common Trustees and/or common officers complies with Rule 17a-7 of the 1940 Act. Further, as defined under the procedures, each transaction is effected at the current market price. Pursuant to these procedures, for the year ended December 31, 2011, the Fund engaged in securities purchases of $2,123,372.
NOTE 6—Trustees’ and Officers’ Fees and Benefits
“Trustees’ and Officers’ Fees and Benefits” include amounts accrued by the Fund to pay remuneration to certain Trustees and Officers of the Fund. Trustees have the option to defer compensation payable by the Fund, and “Trustees’ and Officers’ Fees and Benefits” also include amounts accrued by the Fund to fund such deferred compensation amounts. Those Trustees who defer compensation have the option to select various Invesco Funds in which their deferral accounts shall be deemed to be invested. Finally, certain current Trustees are eligible to participate in a retirement plan that provides for benefits to be paid upon retirement to Trustees over a period of time based on the number of years of service. The Fund may have certain former Trustees who also participate in a retirement plan and receive benefits under such plan. “Trustees’ and Officers’ Fees and Benefits” include amounts accrued by the Fund to fund such retirement benefits. Obligations under the deferred compensation and retirement plans represent unsecured claims against the general assets of the Fund.
During the year ended December 31, 2011, the Fund paid legal fees of $3,440 for services rendered by Kramer, Levin, Naftalis & Frankel LLP as counsel to the Independent Trustees. A partner of that firm is a Trustee of the Trust.
NOTE 7—Cash Balances
The Fund is permitted to temporarily carry a negative or overdrawn balance in its account with State Street Bank and Trust Company, the custodian bank. To compensate the custodian bank for such overdrafts, the overdrawn Fund may either (1) leave funds as a compensating balance in the account so the custodian bank can be compensated by earning the additional interest; or (2) compensate by paying the custodian bank at a rate agreed upon by the custodian bank and Invesco, not to exceed the contractually agreed upon rate.
NOTE 8—Distributions to Shareholders and Tax Components of Net Assets
Tax Character of Distributions to Shareholders Paid During the Years Ended December 31, 2011 and 2010:
| | | | | | | | | |
| | | 2011 | | 2010 |
| |
| Ordinary income | | $ | 20,064,904 | | | $ | 1,712,421 | |
| |
Tax Components of Net Assets at Period-End:
| | | | | |
| | | 2011 |
| |
| Undistributed ordinary income | | $ | 26,776,342 | |
| |
| Net unrealized appreciation — investments | | | 86,546,320 | |
| |
| Temporary book/tax differences | | | (67,648 | ) |
| |
| Capital loss carryforward | | | (58,992,327 | ) |
| |
| Shares of beneficial interest | | | 1,827,183,566 | |
| |
| Total net assets | | $ | 1,881,446,253 | |
| |
The difference between book-basis and tax-basis unrealized appreciation (depreciation) is due to differences in the timing of recognition of gains and losses on investments for tax and book purposes. The Fund’s net unrealized appreciation difference is attributable primarily to wash sales.
The temporary book/tax differences are a result of timing differences between book and tax recognition of income and/or expenses. The Fund’s temporary book/tax differences are the result of the trustee deferral of compensation and retirement plan benefits.
Invesco Van Kampen V.I. Growth and Income Fund
Capital loss carryforward is calculated and reported as of a specific date. Results of transactions and other activity after that date may affect the amount of capital loss carryforward actually available for the Fund to utilize. The Regulated Investment Company Modernization Act of 2010 (the “Act”) eliminated the eight-year carryover period for capital losses that arise in taxable years beginning after its enactment date of December 22, 2010. Consequently, these capital losses can be carried forward for an unlimited period. However, capital losses with an expiration period may not be used to offset capital gains until all net capital losses without an expiration date have been utilized. Additionally, post-enactment capital loss carryovers will retain their character as either short-term or long-term capital losses instead of as short-term capital losses as under prior law. The ability to utilize capital loss carryforward in the future may be limited under the Internal Revenue Code and related regulations based on the results of future transactions.
The Fund utilized $45,672,294 of capital loss carryforward in the current period to offset net realized capital gain for federal income tax purposes. The Fund has a capital loss carryforward as of December 31, 2011, which expires as follows:
| | | | | | | | | | | | | |
| Capital Loss Carryforward* |
| Expiration | | Short-Term | | Long-Term | | Total |
| |
| December 31, 2017 | | $ | 58,992,327 | | | $ | — | | | $ | 58,992,327 | |
| |
| |
| * | Capital loss carryforward as of the date listed above is reduced for limitations, if any, to the extent required by the Internal Revenue Code. |
NOTE 9—Investment Securities
The aggregate amount of investment securities (other than short-term securities, U.S. Treasury obligations and money market funds, if any) purchased and sold by the Fund during the year ended December 31, 2011 was $514,112,228 and $503,763,751, respectively. Cost of investments on a tax basis includes the adjustments for financial reporting purposes as of the most recently completed Federal income tax reporting period-end.
| | | | | |
| Unrealized Appreciation (Depreciation) of Investment Securities on a Tax Basis |
| |
| Aggregate unrealized appreciation of investment securities | | $ | 175,434,116 | |
| |
| Aggregate unrealized (depreciation) of investment securities | | | (88,887,796 | ) |
| |
| Net unrealized appreciation of investment securities | | $ | 86,546,320 | |
| |
| Cost of investments for tax purposes is $1,805,863,861. |
NOTE 10—Reclassification of Permanent Differences
Primarily as a result of differing book/tax treatment of foreign currency transactions, litigation settlements and convertible preferred securities, on December 31, 2011, undistributed net investment income was increased by $61,812, undistributed net realized gain (loss) was decreased by $61,812. This reclassification had no effect on the net assets of the Fund.
NOTE 11—Share Information
| | | | | | | | | | | | | | | | | |
| | | Summary of Share Activity |
| |
| | | Years ended October 31, |
| | | 2011(a) | | 2010 |
| | | Shares | | Amount | | Shares | | Amount |
| |
| Sold: | | | | | | | | | | | | | | | | |
| Series I | | | 2,123,242 | | | $ | 37,996,201 | | | | 836,015 | | | $ | 13,995,298 | |
| |
| Series II | | | 11,601,479 | | | | 208,213,439 | | | | 10,759,774 | | | | 177,127,218 | |
| |
| Issued as reinvestment of dividends: | | | | | | | | | | | | | | | | |
| Series I | | | 112,865 | | | | 1,800,201 | | | | 9,138 | | | | 156,262 | |
| |
| Series II | | | 1,146,560 | | | | 18,264,703 | | | | 91,003 | | | | 1,556,159 | |
| |
| Reacquired: | | | | | | | | | | | | | | | | |
| Series I | | | (1,820,667 | ) | | | (33,539,594 | ) | | | (1,831,877 | ) | | | (30,656,787 | ) |
| |
| Series II | | | (9,473,533 | ) | | | (173,598,612 | ) | | | (9,338,871 | ) | | | (157,349,691 | ) |
| |
| Net increase (decrease) in share activity | | | 3,689,946 | | | $ | 59,136,338 | | | | (525,182 | ) | | $ | 4,828,459 | |
| |
| | |
| (a) | | There are entities that are record owners of more than 5% of the outstanding shares of the Fund and in the aggregate own 77% of the outstanding shares of the Fund. The Fund and the Fund’s principal underwriter or adviser, are parties to participation agreements with these entities whereby these entities sell units of interest in separate accounts funding variable products that are invested in the Fund. The Fund, Invesco and/or Invesco affiliates may make payments to these entities, which are considered to be related to the Fund, for providing services to the Fund, Invesco and/or Invesco affiliates including but not limited to services such as, securities brokerage, third party record keeping and account servicing and administrative services. The Fund has no knowledge as to whether all or any portion of the shares owned of record by these entities are also owned beneficially. |
Invesco Van Kampen V.I. Growth and Income Fund
NOTE 12— Financial Highlights
The following schedule presents financial highlights for a share of the Fund outstanding throughout the periods indicated.
| | | | | | | | | | | | | | | | | | | | | | | | | | | | | | | | | | | | | | | | | | | | | | | | | | | | | | | | | |
| | | | | | | | | | | | | | | | | | | | | | | Ratio of
| | Ratio of
| | | | |
| | | | | | | Net gains
| | | | | | | | | | | | | | | | expenses
| | expenses
| | | | |
| | | | | | | (losses) on
| | | | | | | | | | | | | | | | to average
| | to average net
| | Ratio of net
| | |
| | | Net asset
| | | | securities
| | | | Dividends
| | Distributions
| | | | | | | | | | net assets
| | assets without
| | investment
| | |
| | | value,
| | Net
| | (both
| | Total from
| | from net
| | from net
| | | | Net asset
| | | | Net assets,
| | with fee waivers
| | fee waivers
| | income
| | |
| | | beginning
| | investment
| | realized and
| | investment
| | investment
| | realized
| | Total
| | value, end
| | Total
| | end of period
| | and/or expenses
| | and/or expenses
| | to average
| | Portfolio
|
| | | of period | | income(a) | | unrealized) | | operations | | income | | gains | | distributions | | of period | | return | | (000s omitted) | | absorbed | | absorbed | | net assets | | turnover(b) |
| |
| Series I(c) |
| Year ended 12/31/11 | | $ | 18.40 | | | $ | 0.30 | | | $ | (0.70 | ) | | $ | (0.40 | ) | | $ | (0.23 | ) | | $ | — | | | $ | (0.23 | ) | | $ | 17.77 | | | | (2.01 | )%(d) | | $ | 156,617 | | | | 0.61 | %(e) | | | 0.84 | %(e) | | | 1.65 | %(e) | | | 28 | % |
| Year ended 12/31/10 | | | 16.37 | | | | 0.24 | | | | 1.81 | | | | 2.05 | | | | (0.02 | ) | | | — | | | | (0.02 | ) | | | 18.40 | | | | 12.51 | (d) | | | 154,488 | | | | 0.61 | | | | 0.74 | | | | 1.42 | | | | 30 | |
| Year ended 12/31/09 | | | 13.74 | | | | 0.24 | | | | 2.98 | | | | 3.22 | | | | (0.59 | ) | | | — | | | | (0.59 | ) | | | 16.37 | | | | 24.37 | | | | 153,653 | | | | 0.62 | | | | — | | | | 1.72 | | | | 55 | |
| Year ended 12/31/08 | | | 21.36 | | | | 0.36 | | | | (6.95 | ) | | | (6.59 | ) | | | (0.38 | ) | | | (0.65 | ) | | | (1.03 | ) | | | 13.74 | | | | (32.03 | ) | | | 146,013 | | | | 0.61 | | | | — | | | | 2.06 | | | | 50 | |
| Year ended 12/31/07 | | | 22.00 | | | | 0.39 | | | | 0.16 | | | | 0.55 | | | | (0.36 | ) | | | (0.83 | ) | | | (1.19 | ) | | | 21.36 | | | | 2.80 | | | | 263,473 | | | | 0.60 | | | | — | | | | 1.80 | | | | 28 | |
| |
| Series II(c) |
| Year ended 12/31/11 | | | 18.37 | | | | 0.25 | | | | (0.69 | ) | | | (0.44 | ) | | | (0.19 | ) | | | — | | | | (0.19 | ) | | | 17.74 | | | | (2.26 | )(d) | | | 1,724,830 | | | | 0.86 | (e) | | | 1.09 | (e) | | | 1.40 | (e) | | | 28 | |
| Year ended 12/31/10 | | | 16.39 | | | | 0.20 | | | | 1.80 | | | | 2.00 | | | | (0.02 | ) | | | — | | | | (0.02 | ) | | | 18.37 | | | | 12.19 | (d) | | | 1,725,378 | | | | 0.86 | | | | 0.99 | | | | 1.17 | | | | 30 | |
| Year ended 12/31/09 | | | 13.71 | | | | 0.20 | | | | 2.99 | | | | 3.19 | | | | (0.51 | ) | | | — | | | | (0.51 | ) | | | 16.39 | | | | 24.11 | (f) | | | 1,514,691 | | | | 0.87 | | | | — | | | | 1.45 | | | | 55 | |
| Year ended 12/31/08 | | | 21.31 | | | | 0.32 | | | | (6.94 | ) | | | (6.62 | ) | | | (0.33 | ) | | | (0.65 | ) | | | (0.98 | ) | | | 13.71 | | | | (32.21 | )(f) | | | 1,236,160 | | | | 0.86 | | | | — | | | | 1.82 | | | | 50 | |
| Year ended 12/31/07 | | | 21.96 | | | | 0.34 | | | | 0.15 | | | | 0.49 | | | | (0.31 | ) | | | (0.83 | ) | | | (1.14 | ) | | | 21.31 | | | | 2.52 | (f) | | | 1,843,682 | | | | 0.85 | | | | — | | | | 1.54 | | | | 28 | |
| |
| | |
| (a) | | Calculated using average shares outstanding. |
| (b) | | Portfolio turnover is calculated at the fund level and is not annualized for periods less than one year, if applicable. |
| (c) | | On June 1, 2010, the Class I and Class II shares of the predecessor fund were reorganized into Series I and Series II shares, respectively of the Fund. |
| (d) | | Includes adjustments in accordance with accounting principles generally accepted in the United States of America and as such, the net asset value for financial reporting purposes and the returns based upon those net asset values may differ from the net asset value and returns for shareholder transactions. Total returns are not annualized for periods less than one year, if applicable, and do not reflect charges assessed in connection with variable product, which included would reduce total returns. |
| (e) | | Ratios are based on average daily net assets (000’s omitted) of $146,172 and 1,733,001 for Series I and Series II, respectively. |
| (f) | | These returns include combined Rule 12b-1 fees and service fees of up to 0.25%. |
Invesco Van Kampen V.I. Growth and Income Fund
Report of Independent Registered Public Accounting Firm
To the Board of Trustees of AIM Variable Insurance Funds (Invesco Variable Insurance Funds)
and Shareholders of Invesco Van Kampen V.I. Growth and Income Fund:
In our opinion, the accompanying statement of assets and liabilities, including the schedule of investments, and the related statements of operations and of changes in net assets and the financial highlights present fairly, in all material respects, the financial position of Invesco Van Kampen V.I. Growth and Income Fund (one of the funds constituting AIM Variable Insurance Funds (Invesco Variable Insurance Funds), hereafter referred to as the “Fund”) at December 31, 2011, the results of its operations for the year then ended, and the changes in its net assets and the financial highlights for each of the two years in the period then ended, in conformity with accounting principles generally accepted in the United States of America. These financial statements and financial highlights (hereafter referred to as “financial statements”) are the responsibility of the Fund’s management; our responsibility is to express an opinion on these financial statements based on our audits. We conducted our audits of these financial statements in accordance with the standards of the Public Company Accounting Oversight Board (United States). Those standards require that we plan and perform the audits to obtain reasonable assurance about whether the financial statements are free of material misstatement. An audit includes examining, on a test basis, evidence supporting the amounts and disclosures in the financial statements, assessing the accounting principles used and significant estimates made by management, and evaluating the overall financial statement presentation. We believe that our audits, which included confirmation of securities at December 31, 2011 by correspondence with the custodian and brokers, provide a reasonable basis for our opinion. The financial highlights of the Fund for the periods ended December 31, 2009 and prior were audited by other independent auditors whose report dated February 19, 2010 expressed an unqualified opinion on those financial statements.
PRICEWATERHOUSECOOPERS LLP
February 14, 2012
Houston, Texas
Invesco Van Kampen V.I. Growth and Income Fund
Calculating your ongoing Fund expenses
Example
As a shareholder of the Fund, you incur ongoing costs, including management fees; distribution and/or service fees (12b-1); and other Fund expenses. This example is intended to help you understand your ongoing costs (in dollars) of investing in the Fund and to compare these costs with ongoing costs of investing in other mutual funds. The example is based on an investment of $1,000 invested at the beginning of the period and held for the entire period July 1, 2011 through December 31, 2011.
The actual and hypothetical expenses in the examples below do not represent the effect of any fees or other expenses assessed in connection with a variable product; if they did, the expenses shown would be higher while the ending account values shown would be lower.
Actual expenses
The table below provides information about actual account values and actual expenses. You may use the information in this table, together with the amount you invested, to estimate the expenses that you paid over the period. Simply divide your account value by $1,000 (for example, an $8,600 account value divided by $1,000 = 8.6), then multiply the result by the number in the table under the heading entitled “Actual Expenses Paid During Period” to estimate the expenses you paid on your account during this period.
Hypothetical example for comparison purposes
The table below also provides information about hypothetical account values and hypothetical expenses based on the Fund’s actual expense ratio and an assumed rate of return of 5% per year before expenses, which is not the Fund’s actual return.
The hypothetical account values and expenses may not be used to estimate the actual ending account balance or expenses you paid for the period. You may use this information to compare the ongoing costs of investing in the Fund and other funds. To do so, compare this 5% hypothetical example with the 5% hypothetical examples that appear in the shareholder reports of the other funds.
Please note that the expenses shown in the table are meant to highlight your ongoing costs. Therefore, the hypothetical information is useful in comparing ongoing costs, and will not help you determine the relative total costs of owning different funds.
| | | | | | | | | | | | | | | | | | | | | | | | | | | | | | | |
| | | | | | | | | | HYPOTHETICAL
| | | |
| | | | | | | | | | (5% annual return before
| | | |
| | | | | | | ACTUAL | | | expenses) | | | |
| | | | Beginning
| | | Ending
| | | Expenses
| | | Ending
| | | Expenses
| | | Annualized
|
| | | | Account Value
| | | Account Value
| | | Paid During
| | | Account Value
| | | Paid During
| | | Expense
|
| Class | | | (07/01/11) | | | (12/31/11)1 | | | Period2 | | | (12/31/11) | | | Period2 | | | Ratio |
| Series I | | | $ | 1,000.00 | | | | $ | 936.60 | | | | $ | 2.98 | | | | $ | 1,022.13 | | | | $ | 3.11 | | | | | 0.61 | % |
| | | | | | | | | | | | | | | | | | | | | | | | | | | | | | | |
| Series II | | | | 1,000.00 | | | | | 935.60 | | | | | 4.20 | | | | | 1,020.87 | | | | | 4.38 | | | | | 0.86 | |
| | | | | | | | | | | | | | | | | | | | | | | | | | | | | | | |
| |
| 1 | The actual ending account value is based on the actual total return of the Fund for the period July 1, 2011 through December 31, 2011, after actual expenses and will differ from the hypothetical ending account value which is based on the Fund’s expense ratio and a hypothetical annual return of 5% before expenses. |
| 2 | Expenses are equal to the Fund’s annualized expense ratio as indicated above multiplied by the average account value over the period, multiplied by 184/365 to reflect the most recent fiscal half year. |
Invesco Van Kampen V.I. Growth and Income Fund
Form 1099-DIV, Form 1042-S and other year–end tax information provide shareholders with actual calendar year amounts that should be included in their tax returns. Shareholders should consult their tax advisors.
The following distribution information is being provided as required by the Internal Revenue Code or to meet a specific state’s requirement.
The Fund designates the following amounts or, if subsequently determined to be different, the maximum amount allowable for its fiscal year ended December 31, 2011:
| | | | | |
Federal and State Income Tax | | |
| |
| Corporate Dividends Received Deduction* | | | 100% | |
| | |
| | * | The above percentages are based on ordinary income dividends paid to shareholders during the Fund’s fiscal year. |
Invesco Van Kampen V.I. Growth and Income Fund
Trustees and Officers
The address of each trustee and officer is AIM Variable Insurance Funds (Invesco Variable Insurance Funds) (the “Trust”), 11 Greenway Plaza, Suite 2500, Houston, Texas 77046-1173. The trustees serve for the life of the Trust, subject to their earlier death, incapacitation, resignation, retirement or removal as more specifically provided in the Trust’s organizational documents. Each officer serves for a one year term or until their successors are elected and qualified. Column two below includes length of time served with predecessor entities, if any.
| | | | | | | | | |
| | | | | | | Number of Funds
| | |
Name, Year of Birth and
| | Trustee and/
| | Principal Occupation(s)
| | in Fund Complex
| | Other Directorship(s)
|
| Position(s) Held with the Trust | | or Officer Since | | During Past 5 Years | | Overseen by Trustee | | Held by Trustee |
| | | | | | | | | |
| | | | | | | | | |
| | | | | | | | | |
| Interested Persons | | | | | | | | |
| | | | | | | | | |
| | | | | | | | | |
| | | | | | | | | |
Martin L. Flanagan1 — 1960
Trustee | | 2007 | | Executive Director, Chief Executive Officer and President, Invesco Ltd. (ultimate parent of Invesco and a global investment management firm); Advisor to the Board, Invesco Advisers, Inc. (formerly known as Invesco Institutional (N.A.), Inc.); Trustee, The Invesco Funds; Vice Chair, Investment Company Institute; and Member of Executive Board, SMU Cox School of Business
Formerly: Chairman, Invesco Advisers, Inc. (registered investment adviser); Director, Chairman, Chief Executive Officer and President, IVZ Inc. (holding company), INVESCO Group Services, Inc. (service provider) and Invesco North American Holdings, Inc. (holding company); Director, Chief Executive Officer and President, Invesco Holding Company Limited (parent of Invesco and a global investment management firm); Director, Invesco Ltd.; Chairman, Investment Company Institute and President, Co-Chief Executive Officer, Co-President, Chief Operating Officer and Chief Financial Officer, Franklin Resources, Inc. (global investment management organization) | | 140 | | None |
| | | | | | | | | |
| | | | | | | | | |
| | | | | | | | | |
Philip A. Taylor2 — 1954
Trustee, President and Principal Executive Officer | | 2006 | | Head of North American Retail and Senior Managing Director, Invesco Ltd.; Director, Co-Chairman, Co-President and Co-Chief Executive Officer, Invesco Advisers, Inc. (formerly known as Invesco Institutional (N.A.), Inc.) (registered investment adviser); Director, Chairman, Chief Executive Officer and President, Invesco Management Group, Inc. (formerly Invesco Aim Management Group, Inc.) (financial services holding company); Director and President, INVESCO Funds Group, Inc. (registered investment adviser and registered transfer agent); Director and Chairman, Invesco Investment Services, Inc. (formerly known as Invesco Aim Investment Services, Inc.) (registered transfer agent) and IVZ Distributors, Inc. (formerly known as INVESCO Distributors, Inc.) (registered broker dealer); Director, President and Chairman, Invesco Inc. (holding company) and Invesco Canada Holdings Inc. (holding company); Chief Executive Officer, Invesco Corporate Class Inc. (corporate mutual fund company) and Invesco Canada Fund Inc. (corporate mutual fund company); Director, Chairman and Chief Executive Officer, Invesco Canada Ltd. (formerly known as Invesco Trimark Ltd./Invesco Trimark Ltèe) (registered investment adviser and registered transfer agent); Trustee, President and Principal Executive Officer, The Invesco Funds (other than AIM Treasurer’s Series Trust (Invesco Treasurer’s Series Trust) and Short-Term Investments Trust); Trustee and Executive Vice President, The Invesco Funds (AIM Treasurer’s Series Trust (Invesco Treasurer’s Series Trust) and Short-Term Investments Trust only); Director, Invesco Investment Advisers LLC (formerly known as Van Kampen Asset Management); Director, Chief Executive Officer and President, Van Kampen Exchange Corp. | | 140 | | None |
| | | | | | | | | |
| | | | | | | | | |
| | | | | Formerly: Director and Chairman, Van Kampen Investor Services Inc.: Director, Chief Executive Officer and President, 1371 Preferred Inc. (holding company); and Van Kampen Investments Inc.; Director and President, AIM GP Canada Inc. (general partner for limited partnerships); and Van Kampen Advisors, Inc.; Director and Chief Executive Officer, Invesco Trimark Dealer Inc. (registered broker dealer); Director, Invesco Distributors, Inc. (formerly known as Invesco Aim Distributors, Inc.) (registered broker dealer); Manager, Invesco PowerShares Capital Management LLC; Director, Chief Executive Officer and President, Invesco Advisers, Inc.; Director, Chairman, Chief Executive Officer and President, Invesco Aim Capital Management, Inc.; President, Invesco Trimark Dealer Inc. and Invesco Trimark Ltd./Invesco Trimark Ltèe; Director and President, AIM Trimark Corporate Class Inc. and AIM Trimark Canada Fund Inc.; Senior Managing Director, Invesco Holding Company Limited; Trustee and Executive Vice President, Tax-Free Investments Trust; Director and Chairman, Fund Management Company (former registered broker dealer); President and Principal Executive Officer, The Invesco Funds (AIM Treasurer���s Series Trust (Invesco Treasurer’s Series Trust), Short-Term Investments Trust and Tax-Free Investments Trust only); President, AIM Trimark Global Fund Inc. and AIM Trimark Canada Fund Inc. | | | | |
| | | | | | | | | |
| | | | | | | | | |
| | | | | | | | | |
Wayne W. Whalen3 — 1939
Trustee | | 2010 | | Of Counsel, and prior to 2010, partner in the law firm of Skadden, Arps, Slate, Meagher & Flom LLP, legal counsel to funds in the Fund Complex | | 158 | | Director of the Abraham Lincoln Presidential Library Foundation |
| | | | | | | | | |
| | | | | | | | | |
| | | | | | | | | |
| Independent Trustees | | | | | | | | |
| | | | | | | | | |
| | | | | | | | | |
| | | | | | | | | |
Bruce L. Crockett — 1944
Trustee and Chair | | 1993 | | Chairman, Crockett Technology Associates (technology consulting company) | | 140 | | ACE Limited (insurance company); and Investment Company Institute |
| | | | | Formerly: Director, Captaris (unified messaging provider); Director, President and Chief Executive Officer COMSAT Corporation; and Chairman, Board of Governors of INTELSAT (international communications company) | | | | |
| | | | | | | | | |
| |
| 1 | Mr. Flanagan is considered an interested person of the Trust because he is an officer of the adviser to the Trust, and an officer and a director of Invesco Ltd., ultimate parent of the adviser to the Trust. |
| 2 | Mr. Taylor is considered an interested person of the Trust because he is an officer and a director of the adviser to, and a director of the principal underwriter of, the Trust. |
| 3 | Mr. Whalen is considered an “interested person” (within the meaning of Section 2(a)(19) of the 1940 Act) of certain Funds in the Fund Complex by reason of he and his firm currently providing legal services as legal counsel to such Funds in the Fund Complex. |
Invesco Van Kampen V.I. Growth and Income Fund
Trustees and Officers—(continued)
The address of each trustee and officer is AIM Variable Insurance Funds (Invesco Variable Insurance Funds) (the “Trust”), 11 Greenway Plaza, Suite 2500, Houston, Texas 77046-1173. The trustees serve for the life of the Trust, subject to their earlier death, incapacitation, resignation, retirement or removal as more specifically provided in the Trust’s organizational documents. Each officer serves for a one year term or until their successors are elected and qualified. Column two below includes length of time served with predecessor entities, if any.
| | | | | | | | | |
| | | | | | | Number of Funds
| | |
Name, Year of Birth and
| | Trustee and/
| | Principal Occupation(s)
| | in Fund Complex
| | Other Directorship(s)
|
| Position(s) Held with the Trust | | or Officer Since | | During Past 5 Years | | Overseen by Trustee | | Held by Trustee |
| | | | | | | | | |
| | | | | | | | | |
| | | | | | | |
Independent Trustees—(continued) | | | | | | |
| | | | | | | | | |
| | | | | | | | | |
| | | | | | | | | |
David C. Arch — 1945
Trustee | | 2010 | | Chairman and Chief Executive Officer of Blistex Inc., a consumer health care products manufacturer. | | 158 | | Member of the Heartland Alliance Advisory Board, a nonprofit organization serving human needs based in Chicago. Board member of the Illinois Manufacturers’ Association. Member of the Board of Visitors, Institute for the Humanities, University of Michigan |
| | | | | | | | | |
| | | | | | | | | |
| | | | | | | | | |
Frank S. Bayley — 1939
Trustee | | 2001 | | Retired
Formerly: Director, Badgley Funds, Inc. (registered investment company) (2 portfolios) and Partner, law firm of Baker & McKenzie
Formerly: Director, Badgley Funds, Inc. (registered investment company) (2 portfolios) and Partner, law firm of Baker & McKenzie | | 140 | | Director and Chairman, C.D. Stimson Company (a real estate investment company) |
| | | | | | | | | |
| | | | | | | | | |
| | | | | | | | | |
James T. Bunch — 1942
Trustee | | 2004 | | Managing Member, Grumman Hill Group LLC (family office private equity management)
Formerly: Founder, Green, Manning & Bunch Ltd. (investment banking firm)(1988-2010); Executive Committee, United States Golf Association; and Director, Policy Studies, Inc. and Van Gilder Insurance Corporation | | 140 | | Vice Chairman, Board of Governors, Western Golf Association/Evans Scholars Foundation and Director, Denver Film Society |
| | | | | | | | | |
| | | | | | | | | |
| | | | | | | | | |
Rodney F. Dammeyer — 1940
Trustee | | 2010 | | President of CAC, LLC, a private company offering capital investment and management advisory services.
Formerly: Prior to January 2004, Director of TeleTech Holdings Inc.; Prior to 2002, Director of Arris Group, Inc.; Prior to 2001, Managing Partner at Equity Group Corporate Investments. Prior to 1995, Vice Chairman of Anixter International. Prior to 1985, experience includes Senior Vice President and Chief Financial Officer of Household International, Inc., Executive Vice President and Chief Financial Officer of Northwest Industries, Inc. and Partner of Arthur Andersen & Co. | | 158 | | Director of Quidel Corporation and Stericycle, Inc. Prior to May 2008, Trustee of The Scripps Research Institute. Prior to February 2008, Director of Ventana Medical Systems, Inc. Prior to April 2007, Director of GATX Corporation. Prior to April 2004, Director of TheraSense, Inc. |
| | | | | | | | | |
| | | | | | | | | |
| | | | | | | | | |
Albert R. Dowden — 1941
Trustee | | 2000 | | Director of a number of public and private business corporations, including the Boss Group, Ltd. (private investment and management); Reich & Tang Funds (5 portfolios) (registered investment company); and Homeowners of America Holding Corporation/ Homeowners of America Insurance Company (property casualty company)
Formerly: Director, Continental Energy Services, LLC (oil and gas pipeline service); Director, CompuDyne Corporation (provider of product and services to the public security market) and Director, Annuity and Life Re (Holdings), Ltd. (reinsurance company); Director, President and Chief Executive Officer, Volvo Group North America, Inc.; Senior Vice President, AB Volvo; Director of various public and private corporations; Chairman, DHJ Media, Inc.; Director Magellan Insurance Company; and Director, The Hertz Corporation, Genmar Corporation (boat manufacturer), National Media Corporation; Advisory Board of Rotary Power International (designer, manufacturer, and seller of rotary power engines); and Chairman, Cortland Trust, Inc. (registered investment company) | | 140 | | Board of Nature’s Sunshine Products, Inc. |
| | | | | | | | | |
| | | | | | | | | |
| | | | | | | | | |
Jack M. Fields — 1952
Trustee | | 1997 | | Chief Executive Officer, Twenty First Century Group, Inc. (government affairs company); and Owner and Chief Executive Officer, Dos Angelos Ranch, L.P. (cattle, hunting, corporate entertainment), Discovery Global Education Fund (non-profit) and Cross Timbers Quail Research Ranch (non-profit)
Formerly: Chief Executive Officer, Texana Timber LP (sustainable forestry company) and member of the U.S. House of Representatives | | 140 | | Administaff |
| | | | | | | | | |
| | | | | | | | | |
| | | | | | | | | |
Carl Frischling — 1937
Trustee | | 1993 | | Partner, law firm of Kramer Levin Naftalis and Frankel LLP | | 140 | | Director, Reich & Tang Funds (16 portfolios) |
| | | | | | | | | |
| | | | | | | | | |
Invesco Van Kampen V.I. Growth and Income Fund
Trustees and Officers—(continued)
The address of each trustee and officer is AIM Variable Insurance Funds (Invesco Variable Insurance Funds) (the “Trust”), 11 Greenway Plaza, Suite 2500, Houston, Texas 77046-1173. The trustees serve for the life of the Trust, subject to their earlier death, incapacitation, resignation, retirement or removal as more specifically provided in the Trust’s organizational documents. Each officer serves for a one year term or until their successors are elected and qualified. Column two below includes length of time served with predecessor entities, if any.
| | | | | | | | | |
| | | | | | | Number of Funds
| | |
Name, Year of Birth and
| | Trustee and/
| | Principal Occupation(s)
| | in Fund Complex
| | Other Directorship(s)
|
| Position(s) Held with the Trust | | or Officer Since | | During Past 5 Years | | Overseen by Trustee | | Held by Trustee |
Independent Trustees—(continued) | | | | | | |
| | | | | | | | | |
| | | | | | | | | |
| | | | | | | | | |
Prema Mathai-Davis — 1950
Trustee | | 1998 | | Retired
Formerly: Chief Executive Officer, YWCA of the U.S.A. | | 140 | | None |
| | | | | | | | | |
| | | | | | | | | |
| | | | | | | | | |
Larry Soll — 1942
Trustee | | 2004 | | Retired
Formerly, Chairman, Chief Executive Officer and President, Synergen Corp. (a biotechnology company) | | 140 | | None |
| | | | | | | | | |
| | | | | | | | | |
| | | | | | | | | |
Hugo F. Sonnenschein — 1940
Trustee | | 2010 | | President Emeritus and Honorary Trustee of the University of Chicago and the Adam Smith Distinguished Service Professor in the Department of Economics at the University of Chicago. Prior to July 2000, President of the University of Chicago. | | 158 | | Trustee of the University of Rochester and a member of its investment committee. Member of the National Academy of Sciences, the American Philosophical Society and a fellow of the American Academy of Arts and Sciences |
| | | | | | | | | |
| | | | | | | | | |
| | | | | | | | | |
| Raymond Stickel, Jr. — 1944 Trustee | | 2005 | | Retired
Formerly: Director, Mainstay VP Series Funds, Inc. (25 portfolios) and Partner, Deloitte & Touche | | 140 | | None |
| | | | | | | | | |
| | | | | | | | | |
| | | | | | | | | |
| Other Officers | | | | | | | | |
| | | | | | | | | |
| | | | | | | | | |
| | | | | | | | | |
Russell C. Burk — 1958
Senior Vice President and Senior Officer | | 2005 | | Senior Vice President and Senior Officer, The Invesco Funds | | N/A | | N/A |
| | | | | | | | | |
| | | | | | | | | |
| | | | | | | | | |
John M. Zerr — 1962
Senior Vice President, Chief Legal Officer and Secretary | | 2006 | | Director, Senior Vice President, Secretary and General Counsel, Invesco Management Group, Inc. (formerly known as Invesco Aim Management Group, Inc.) and Van Kampen Exchange Corp.; Senior Vice President, Invesco Advisers, Inc. (formerly known as Invesco Institutional (N.A.), Inc.) (registered investment adviser); Senior Vice President and Secretary, Invesco Distributors, Inc. (formerly known as Invesco Aim Distributors, Inc.); Director, Vice President and Secretary, Invesco Investment Services, Inc. (formerly known as Invesco Aim Investment Services, Inc.) and IVZ Distributors, Inc. (formerly known as INVESCO Distributors, Inc.); Director and Vice President, INVESCO Funds Group, Inc.; Senior Vice President, Chief Legal Officer and Secretary, The Invesco Funds; Manager, Invesco PowerShares Capital Management LLC; Director, Secretary and General Counsel, Invesco Investment Advisers LLC (formerly known as Van Kampen Asset Management); Secretary and General Counsel, Van Kampen Funds Inc. and Chief Legal Officer, PowerShares Exchange-Traded Fund Trust, PowerShares Exchange-Traded Fund Trust II, PowerShares India Exchange-Traded Fund Trust and PowerShares Actively Managed Exchange-Traded Fund Trust
Formerly: Director and Secretary, Van Kampen Advisors Inc.; Director Vice President, Secretary and General Counsel Van Kampen Investor Services Inc.; Director, Invesco Distributors, Inc. (formerly known as Invesco Aim Distributors, Inc.); Director, Senior Vice President, General Counsel and Secretary, Invesco Advisers, Inc.; and Van Kampen Investments Inc.; Director, Vice President and Secretary, Fund Management Company; Director, Senior Vice President, Secretary, General Counsel and Vice President, Invesco Aim Capital Management, Inc.; Chief Operating Officer and General Counsel, Liberty Ridge Capital, Inc. (an investment adviser); Vice President and Secretary, PBHG Funds (an investment company) and PBHG Insurance Series Fund (an investment company); Chief Operating Officer, General Counsel and Secretary, Old Mutual Investment Partners (a broker-dealer); General Counsel and Secretary, Old Mutual Fund Services (an administrator) and Old Mutual Shareholder Services (a shareholder servicing center); Executive Vice President, General Counsel and Secretary, Old Mutual Capital, Inc. (an investment adviser); and Vice President and Secretary, Old Mutual Advisors Funds (an investment company) | | N/A | | N/A |
| | | | | | | | | |
| | | | | | | | | |
| | | | | | | | | |
Lisa O. Brinkley — 1959
Vice President | | 2004 | | Global Compliance Director, Invesco Ltd.; Chief Compliance Officer, Invesco Investment Services, Inc.(formerly known as Invesco Aim Investment Services, Inc.); and Vice President, The Invesco Funds
Formerly: Chief Compliance Officer, Invesco Distributors, Inc. (formerly known as Invesco Aim Distributors, Inc.) and Van Kampen Investor Services Inc.; Senior Vice President, Invesco Management Group, Inc.; Senior Vice President and Chief Compliance Officer, Invesco Advisers, Inc. and The Invesco Funds; Vice President and Chief Compliance Officer, Invesco Aim Capital Management, Inc. and Invesco Distributors, Inc.; Vice President, Invesco Investment Services, Inc. and Fund Management Company | | N/A | | N/A |
| | | | | | | | | |
Invesco Van Kampen V.I. Growth and Income Fund
Trustees and Officers—(continued)
The address of each trustee and officer is AIM Variable Insurance Funds (Invesco Variable Insurance Funds) (the “Trust”), 11 Greenway Plaza, Suite 2500, Houston, Texas 77046-1173. The trustees serve for the life of the Trust, subject to their earlier death, incapacitation, resignation, retirement or removal as more specifically provided in the Trust’s organizational documents. Each officer serves for a one year term or until their successors are elected and qualified. Column two below includes length of time served with predecessor entities, if any.
| | | | | | | | | |
| | | | | | | Number of Funds
| | |
Name, Year of Birth and
| | Trustee and/
| | Principal Occupation(s)
| | in Fund Complex
| | Other Directorship(s)
|
| Position(s) Held with the Trust | | or Officer Since | | During Past 5 Years | | Overseen by Trustee | | Held by Trustee |
Other Officers—(continued) | | | | | | |
| | | | | | | | | |
| | | | | | | | | |
| | | | | | | | | |
Sheri Morris — 1964
Vice President, Treasurer and Principal Financial Officer | | 1999 | | Vice President, Treasurer and Principal Financial Officer, The Invesco Funds; Vice President, Invesco Advisers, Inc. (formerly known as Invesco Institutional (N.A.), Inc.) (registered investment adviser).
Formerly: Treasurer, PowerShares Exchange-Traded Fund Trust, PowerShares Exchange-Traded Fund Trust II, PowerShares India Exchange-Traded Fund Trust and PowerShares Actively Managed Exchange-Traded Fund Trust, Vice President, Invesco Advisers, Inc., Invesco Aim Capital Management, Inc. and Invesco Aim Private Asset Management, Inc.; Assistant Vice President and Assistant Treasurer, The Invesco Funds and Assistant Vice President, Invesco Advisers, Inc., Invesco Aim Capital Management, Inc. and Invesco Aim Private Asset Management, Inc. | | N/A | | N/A |
| | | | | | | | | |
| | | | | | | | | |
| | | | | | | | | |
Karen Dunn Kelley — 1960
Vice President | | 1993 | | Head of Invesco’s World Wide Fixed Income and Cash Management Group; Senior Vice President, Invesco Management Group, Inc. (formerly known as Invesco Aim Management Group, Inc.) and Invesco Advisers, Inc. (formerly known as Invesco Institutional (N.A.), Inc.) (registered investment adviser); Executive Vice President, Invesco Distributors, Inc. (formerly known as Invesco Aim Distributors, Inc.); Director, Invesco Mortgage Capital Inc.; Vice President, The Invesco Funds (other than AIM Treasurer’s Series Trust (Invesco Treasurer’s Series Trust) and Short-Term Investments Trust); and President and Principal Executive Officer, The Invesco Funds (AIM Treasurer’s Series Trust (Invesco Treasurer’s Series Trust) and Short-Term Investments Trust only).
Formerly: Senior Vice President, Van Kampen Investments Inc.; Vice President, Invesco Advisers, Inc. (formerly known as Invesco Institutional (N.A.), Inc.); Director of Cash Management and Senior Vice President, Invesco Advisers, Inc. and Invesco Aim Capital Management, Inc.; President and Principal Executive Officer, Tax-Free Investments Trust; Director and President, Fund Management Company; Chief Cash Management Officer, Director of Cash Management, Senior Vice President, and Managing Director, Invesco Aim Capital Management, Inc.; Director of Cash Management, Senior Vice President, and Vice President, Invesco Advisers, Inc. and The Invesco Funds (AIM Treasurer’s Series Trust (Invesco Treasurer’s Series Trust), Short-Term Investments Trust and Tax-Free Investments Trust only) | | N/A | | N/A |
| | | | | | | | | |
| | | | | | | | | |
| | | | | | | | | |
Yinka Akinsola — 1977
Anti-Money Laundering Compliance Officer | | 2011 | | Anti-Money Laundering Compliance Officer, Invesco Advisers, Inc. (formerly known as Invesco Institutional (N.A.), Inc.) (registered investment adviser); Invesco Distributors, Inc. (formerly known as Invesco Aim Distributors, Inc.), Invesco Investment Services, Inc. (formerly known as Invesco Aim Investment Services, Inc.), Invesco Management Group, Inc., The Invesco Funds, Invesco Van Kampen Closed-End Funds, Van Kampen Exchange Corp. and Van Kampen Funds Inc. | | N/A | | N/A |
| | | | | | | | | |
| | | | | | | | | |
| | | | | | | | | |
Todd L. Spillane — 1958
Chief Compliance Officer | | 2006 | | Senior Vice President, Invesco Management Group, Inc. (formerly known as Invesco Aim Management Group, Inc.) and Van Kampen Exchange Corp.; Senior Vice President and Chief Compliance Officer, Invesco Advisers, Inc. (registered investment adviser) (formerly known as Invesco Institutional (N.A.), Inc.); Chief Compliance Officer, The Invesco Funds, INVESCO Private Capital Investments, Inc. (holding company) and Invesco Private Capital, Inc. (registered investment adviser); Vice President, Invesco Distributors, Inc. (formerly known as Invesco Aim Distributors, Inc.) and Invesco Investment Services, Inc. (formerly known as Invesco Aim Investment Services, Inc.).
Formerly: Chief Compliance Officer, Invesco Van Kampen Closed-End Funds PowerShares Exchange-Traded Fund Trust, PowerShares Exchange-Traded Fund Trust II, PowerShares India Exchange-Traded Fund Trust, and PowerShares Actively Managed Exchange-Traded Fund Trust; Senior Vice President, Van Kampen Investments Inc.; Senior Vice President and Chief Compliance Officer, Invesco Advisers, Inc. and Invesco Aim Capital Management, Inc.; Chief Compliance Officer, Invesco Global Asset Management (N.A.), Inc., Invesco Senior Secured Management, Inc. (registered investment adviser) and Van Kampen Investor Services Inc.; Vice President, Invesco Aim Capital Management, Inc. and Fund Management Company | | N/A | | N/A |
| | | | | | | | | |
The Statement of Additional Information of the Trust includes additional information about the Fund’s Trustees and is available upon request, without charge, by calling 1.800.959.4246. Please refer to the Fund’s prospectus for information on the Fund’s sub-advisers.
| | | | | | | |
Office of the Fund
11 Greenway Plaza, Suite 2500
Houston, TX 77046-1173 | | Investment Adviser
Invesco Advisers, Inc.
1555 Peachtree Street, N.E.
Atlanta, GA 30309 | | Distributor
Invesco Distributors, Inc.
11 Greenway Plaza, Suite 2500
Houston, TX 77046-1173 | | Auditors
PricewaterhouseCoopers LLP
1201 Louisiana Street, Suite 2900
Houston, TX 77002-5678 |
| | | | | | | |
| | | | | | | |
Counsel to the Fund
Stradley Ronon Stevens & Young, LLP
2600 One Commerce Square
Philadelphia, PA 19103 | | Counsel to the Independent Trustees
Kramer, Levin, Naftalis & Frankel LLP
1177 Avenue of the Americas
New York, NY 10036-2714 | | Transfer Agent
Invesco Investment Services, Inc.
11 Greenway Plaza, Suite 2500
Houston, TX77046-1173 | | Custodian
State Street Bank and Trust Company
225 Franklin
Boston, MA 02110-2801 |
Invesco Van Kampen V.I. Growth and Income Fund
Invesco Van Kampen V.I. Mid Cap Growth Fund
Annual Report to Shareholders § December 31, 2011
The Fund provides a complete list of its holdings four times in each fiscal year, at the quarter-ends. For the second and fourth quarters, the lists appear in the Fund’s semiannual and annual reports to shareholders. For the first and third quarters, the Fund files the lists with the Securities and Exchange Commission (SEC) on Form N-Q. The Fund’s Form N-Q filings are available on the SEC website, sec.gov. Copies of the Fund’s Forms N-Q may be reviewed and copied at the SEC Public Reference Room in Washington, D.C. You can obtain information on the operation of the Public Reference Room, including information about duplicating fee charges, by calling 202 551 8090 or 800 732 0330, or by electronic request at the following email address: publicinfo@sec.gov. The SEC file numbers for the Fund are 811-07452 and 033-57340. The Fund’s most recent portfolio holdings, as filed on Form N-Q, have also been made available to insurance companies issuing variable annuity contracts and variable life insurance policies (“variable products”) that invest in the Fund.
A description of the policies and procedures that the Fund uses to determine how to vote proxies relating to portfolio securities is available without charge, upon request, from our Client Services department at 800 959 4246 or at invesco.com/proxyguidelines. The information is also available on the SEC website, sec.gov.
Information regarding how the Fund voted proxies related to its portfolio securities during the 12 months ended June 30, 2011, is available at invesco.com/proxysearch. The information is also available on the SEC website, sec.gov.
Invesco Advisers, Inc. is an investment adviser; it provides investment advisory services to individual and institutional clients and does not sell securities. Invesco Distributors, Inc. is the U.S. distributor for Invesco Ltd.’s retail mutual funds, exchange-traded funds and institutional money market funds. Both are wholly owned, indirect subsidiaries of Invesco Ltd.
This report must be accompanied or preceded by a currently effective Fund prospectus and variable product prospectus, which contain more complete information, including sales charges and expenses. Investors should read each carefully before investing.
Invesco Distributors, Inc.
VK-VIMCG-AR-1
| | | | | |
|
| | | | | |
NOT FDIC INSURED | | MAY LOSE VALUE | | NO BANK GUARANTEE |
Management’s Discussion of Fund Performance
Performance summary
On March 22, 2011, James Leach joined the Fund as lead portfolio manager. On the same date, Paul Rasplicka left the Fund. Additional information about your Fund’s manager appears later in this report.
For the year ended December 31, 2011, Invesco Van Kampen V.I. Mid Cap Growth Fund produced negative returns and underperformed its style-specific benchmark, the Russell Midcap Growth Index. The Fund’s underperformance was driven in large part by stock selection in several sectors.
The Fund also underperformed the broad U.S. stock market as represented by the S&P 500 Index, because mid-cap stocks generally underperformed large-cap stocks.
Your Fund’s long-term performance appears later in this report.
Fund vs. Indexes
Total returns, 12/31/10 to 12/31/11, excluding variable product issuer charges.
If variable product issuer charges were included, returns would be lower.
| | | | | |
|
| Series I Shares | | | -8.89 | % |
| |
| Series II Shares | | | -9.36 | |
| |
S&P 500 Index▼ (Broad Market Index) | | | 2.09 | |
| |
Russell Midcap Growth Index▼ (Style-Specific Index) | | | -1.65 | |
| |
Lipper VUF Mid-Cap Growth Funds Index▼ (Peer Group Index) | | | -4.69 | |
Source(s): ▼Lipper Inc.
As noted in the Fund’s latest semiannual report, the Fund has adopted a three-tier benchmark structure to compare its performance to broad market, style-specific and peer group market measures.
How we invest
We believe a growth investment strategy is an essential component of a diversified portfolio.
Our investment process emphasizes rigorous bottom-up analysis of individual companies. We seek to invest in companies with strong or improving fundamentals, attractive valuations relative to growth prospects and earnings expectations that appear fair to conservative.
To narrow our investment universe, we utilize a holistic approach that emphasizes fundamental research and, to a lesser extent, includes quantitative analysis. At the end of this distillation process, we have a set of stocks to analyze in greater depth.
Our fundamental analysis focuses on identifying companies with strong drivers of growth. To accomplish this goal, we
conduct rigorous bottom-up analysis in order to develop higher conviction in each company’s prospects for growth. Through our analysis, we develop a mosaic of each company through detailed discussions with company management teams, competitors, distributors, suppliers, Wall Street analysts and customers. We also utilize a variety of valuation techniques based on the company in question, the industry in which the company operates, the stage of the business cycle and other factors that best reflect a company’s value.
Risk management plays an important role in portfolio construction, as our target portfolio attempts to maximize the relationship between risk and return. We seek to accomplish this goal by investing in companies with attractive fundamental prospects for growth, and we divide the
portfolio between stable growth stocks and catalyst-driven stocks.
We consider selling a stock for any of the following reasons:
| n | | The price target set at purchase has been reached. |
| |
| n | | There is a deterioration in a company’s fundamentals. |
| |
| n | | The catalysts for growth are no longer present or are reflected in the stock price. |
| |
| n | | We identify a more attractive investment opportunity. |
Market conditions and your Fund
The fiscal year began with equity markets fueled on the second round of “quantitative easing” by the U.S. Federal Reserve. Markets rose through the first quarter of 2011. However, with the spring came increased volatility and significant macroeconomic distortions due to civil unrest in Egypt and Libya, flooding in Australia and a devastating earthquake and tsunami in Japan. Corporate earnings remained strong with largely positive surprises, but often were overshadowed by investor concerns about continuing high unemployment and soft housing data.
Although markets stabilized and were generally in positive territory through the summer, major equity indexes sold off precipitously in August as the U.S. government struggled to raise the nation’s debt ceiling. Despite an eventual agreement between the White House and Congress, credit rating agency Standard & Poor’s announced the first-ever downgrade to long-term U.S. government debt. Uncertainty created by the downgrade, combined with the continuing saga surrounding the debt crisis in the eurozone, reignited fears of a global recession. Despite evidence of sustained, but muted, economic growth, these macroeconomic factors continued to weigh
Portfolio Composition
By sector
| | | | | |
|
| Consumer Discretionary | | | 21.7 | % |
| |
| Information Technology | | | 18.2 | |
| |
| Industrials | | | 16.5 | |
| |
| Health Care | | | 16.3 | |
| |
| Energy | | | 9.0 | |
| |
| Materials | | | 5.7 | |
| |
| Consumer Staples | | | 3.2 | |
| |
| Telecommunication Services | | | 2.9 | |
| |
| Financials | | | 2.7 | |
| |
Money Market Funds Plus
Other Assets Less Liabilities | | | 3.8 | |
Top 10 Equity Holdings*
| | | | | | | | |
|
| | 1. | | Cameron International Corp. | | | 2.4 | % |
| |
| | 2. | | Kansas City Southern | | | 2.4 | |
| |
| | 3. | | DaVita, Inc. | | | 2.2 | |
| |
| | 4. | | Amphenol Corp.-Class A | | | 2.1 | |
| |
| | 5. | | Aetna Inc. | | | 2.0 | |
| |
| | 6. | | Whiting Petroleum Corp. | | | 2.0 | |
| |
| | 7. | | PetSmart, Inc. | | | 2.0 | |
| |
| | 8. | | Church & Dwight Co., Inc. | | | 2.0 | |
| |
| | 9. | | Airgas, Inc. | | | 2.0 | |
| |
| | 10. | | Discovery Communications, Inc.- Class A | | | 1.9 | |
Top Five Industries*
| | | | | | | | |
|
| | 1. | | Semiconductors | | | 5.1 | % |
| | | | |
| | 2. | | Specialty Stores | | | 5.0 | |
| | | | |
| | 3. | | Health Care Services | | | 4.9 | |
| | | | |
| | 4. | | Oil & Gas Equipment & Services | | | 4.3 | |
| | | | |
| | 5. | | Oil & Gas Exploration & Production | | | 4.1 | |
| | | | | |
|
| Total Net Assets | | $65.1 million |
| | | | | |
| Total Number of Holdings* | | | | 70 |
The Fund’s holdings are subject to change, and there is no assurance that the Fund will continue to hold any particular security.
*Excluding money market fund holdings.
Invesco Van Kampen V.I. Mid Cap Growth Fund
on markets through the end of the reporting period.
In this environment, the Fund produced negative absolute returns and underperformed the Russell Midcap Growth Index for the year. The Fund underperformed the index by the widest margin in the consumer discretionary, industrials, consumer staples, health care and telecommunication services sectors. Some of this underperformance was offset by outperformance in other sectors, including financials, information technology and energy.
The Fund underperformed most significantly in the consumer discretionary sector, primarily driven by stock selection. Within this sector, Abercrombie & Fitch declined during the reporting period, given its exposure to Europe and the region’s ongoing austerity and debt concerns. Internet-based publishing and production service Shutterfly also detracted from performance as management cut its earnings outlook for late 2011. We sold both Abercrombie & Fitch and Shutterfly during the reporting period. Hotel operator Starwood Hotels also detracted from Fund performance. The company’s revenues tend to be correlated to economic growth, and sentiment turned mostly negative during the reporting period. The negative impact of these stocks offset the contribution from ULTA Salon, Cosmetics & Fragrance, which was the Fund’s strongest contributor.
Another area of weakness for the Fund was the industrials sector, where stock selection and overweight exposure to the underperforming sector detracted from Fund performance. Underperforming holdings included construction equipment manufacturer Terex and commercial truck and engine maker Navistar International. Both companies were affected by wavering sentiment on the prospects for global growth. Construction and engineering services firm Foster Wheeler did not win an expected contract and was hurt as energy prices declined later in the reporting period. We sold Terex and Foster Wheeler during the reporting period.
As investors sought safety during the reporting period by rotating into the defensive consumer staples sector, returns for that sector were significantly higher than most others. The Fund’s underweight position in this sector was a detractor from performance.
Some of this underperformance was offset by outperformance in other sectors. The Fund outperformed the Russell Midcap Growth Index by the widest
margin in the financials sector, due to stock selection and an underweight position. One holding that made a positive contribution to Fund performance was commercial real estate brokerage firm CB Richard Ellis; investors reacted positively to news of increasing property sales and leasing in the U.S. and abroad.
Discover Financial Services and Moody’s also contributed to performance, with Moody’s benefiting from the significant tailwind of new debt issuance during the reporting period. We sold our holdings in CB Richard Ellis and Moody’s during the reporting period.
Outperformance in the information technology sector came from strong stock selection. Data warehousing solution provider Teradata, middleware provider TIBCO Software and semiconductor capital equipment designer KLA-Tencor all contributed to Fund performance for the year. We sold all three of these stocks before the close of the year because we identified promising new opportunities.
As we’ve discussed, the stock market experienced significant volatility during the fiscal year. We would like to caution investors against making investment decisions based on short-term performance. We thank you for your commitment to Invesco Van Kampen V.I. Mid Cap Growth Fund.
The views and opinions expressed in management’s discussion of Fund performance are those of Invesco Advisers, Inc. These views and opinions are subject to change at any time based on factors such as market and economic conditions. These views and opinions may not be relied upon as investment advice or recommendations, or as an offer for a particular security. The information is not a complete analysis of every aspect of any market, country, industry, security or the Fund. Statements of fact are from sources considered reliable, but Invesco Advisers, Inc. makes no representation or warranty as to their completeness or accuracy. Although historical performance is no guarantee of future results, these insights may help you understand our investment management philosophy.
See important Fund and, if applicable, index disclosures later in this report.
James Leach
Chartered Financial Analyst, portfolio manager, is manager of Invesco Van Kampen V.I. Mid Cap Growth Fund. He joined Invesco in 2011. Mr. Leach earned a B.S. in mechanical engineering from the University of California and an M.B.A. from the Stern School of Business at New York University.
Invesco Van Kampen V.I. Mid Cap Growth Fund
Your Fund’s Long-Term Performance
Results of a $10,000 Investment – Oldest Share Class(es)
Fund and index data from 12/31/01*
| |
| |
| * | During the reporting period, Invesco changed its policy regarding growth of $10,000 charts. For funds older than 10 years, we previously showed performance since inception. Going forward, we will show performance for the most recent 10 years, since this more accurately reflects the experience of the typical shareholder. As a result, charts now may include benchmarks that did not appear previously, because the funds’ inception pre-dated the benchmarks’ inception. Also, all charts will now be presented using a linear format. |
Past performance cannot guarantee comparable future results.
As noted earlier in this report, the Fund
has adopted a three-tier benchmark structure to compare its performance to broad market, style-specific and peer
group market measures. These additional benchmarks will now be included in the chart above.
Average Annual Total Returns
As of 12/31/11
| | | | | |
|
Series I Shares | | | | |
| |
| 10 Years | | | 3.55 | % |
| |
| 5 Years | | | 2.49 | |
| |
| 1 Year | | | -8.89 | |
| |
| | | | | |
Series II Shares | | | | |
| |
| Inception (9/25/00) | | | -3.74 | % |
| |
| 10 Years | | | 3.52 | |
| |
| 5 Years | | | 2.44 | |
| |
| 1 Year | | | -9.36 | |
Effective June 1, 2010, Class II shares of the predecessor fund, Van Kampen Life Investment Trust Mid Cap Growth Portfolio, advised by Van Kampen Asset Management were reorganized into Series II shares, respectively, of Invesco Van Kampen V.I. Mid Cap Growth Fund. Returns shown above for Series II shares are blended returns of the predecessor fund and Invesco Van Kampen V.I. Mid Cap Growth Fund. Share class returns will differ from the predecessor fund because of different expenses.
Series I shares incepted on June 1, 2010. Series I shares performance shown prior to that date is that of the predecessor fund’s Class II shares and includes the 12b-1 fees applicable to the predecessor fund’s Class II shares. Class II shares performance reflects
any applicable fee waivers or expense reimbursements. The inception date of the predecessor fund’s Class II shares is September 25, 2000.
The performance data quoted represent past performance and cannot guarantee comparable future results; current performance may be lower or higher. Please contact your variable product issuer or financial adviser for the most recent month-end variable product performance. Performance figures reflect Fund expenses, reinvested distributions and changes in net asset value. Investment return and principal value will fluctuate so that you may have a gain or loss when you sell shares.
The net annual Fund operating expense ratio set forth in the most recent Fund prospectus as of the date of this report for Series I and Series II shares was 1.01% and 1.26%, respectively.1 The total annual Fund operating expense ratio set forth in the most recent Fund prospectus as of the date of this report for Series I and Series II shares was 1.21% and 1.46%, respectively. The expense ratios presented above may vary from the expense ratios presented in other sections of this report that are based on expenses incurred during the period covered by this report.
Invesco Van Kampen V.I. Mid Cap Growth Fund, a series portfolio of AIM Variable Insurance Funds (Invesco Variable Insurance Funds), is currently offered through insurance companies issuing variable products. You cannot purchase shares of the Fund directly. Performance figures given represent the Fund and are not intended to reflect actual variable product values. They do not reflect sales charges, expenses and fees assessed in connection with a variable product. Sales charges, expenses and fees, which are determined by the variable product issuers, will vary and will lower the total return.
The most recent month-end performance data at the Fund level, excluding variable product charges, is available at 800 451 4246. As mentioned above, for the most recent month-end performance including variable product charges, please contact your variable product issuer or financial adviser.
Had the adviser not waived fees and/or expenses in the past, performance would have been lower.
| | |
| 1 | | Total annual Fund operating expenses after any contractual fee waivers and/or expense reimbursements by the adviser in effect through at least June 30, 2012. See current prospectus for more information. |
Invesco Van Kampen V.I. Mid Cap Growth Fund
Invesco Van Kampen V.I. Mid Cap Growth Fund’s investment objective is to seek capital growth.
| n | | Unless otherwise stated, information presented in this report is as of December 31, 2011, and is based on total net assets. |
| |
| n | | Unless otherwise noted, all data provided by Invesco. |
| |
| n | | To access your Fund’s reports/prospectus, visit invesco.com/fundreports. |
Principal risks of investing in the Fund
Active trading risk. The Fund engages in frequent trading of portfolio securities. Active trading results in added expenses and may result in a lower return.
Market risk. Market risk is the possibility that the market values of securities owned by the Fund will decline. Investments in common stocks and other equity securities generally are affected by changes in the stock markets, which fluctuate substantially over time, sometimes suddenly and sharply. Convertible securities have risks associated with both common stocks and debt securities. Investments in debt securities are generally affected by changes in the interest rates and creditworthiness of the issuer. The price of such securities tend to fall as interest rates rise, and such declines tend to be greater for securities with longer maturities. The creditworthiness of the issuer may affect the issuer’s ability to make timely payments of interest and principal.
Medium-sized company risks. Medium-sized companies often have less predictable earnings and more limited product lines, markets, distribution channels or financial resources. The market movements of equity securities of medium-sized companies may be more abrupt and volatile than the market movements of equity securities of larger, more established companies or the stock market in general. Historically, medium-sized companies have sometimes gone through extended periods when they did not perform as well as larger companies. In addition, equity securities of medium-sized companies generally are less liquid than larger companies. This means that the Fund could have greater difficulty selling such securities at the time and price that the Fund would like.
Growth investing risk. Investments in growth-oriented equity securities may have above-average volatility of price movement. The returns on growth securities may or may not move in tandem with the returns on other styles of investing or the overall stock markets. Different types of stocks tend to shift in and out of favor depending on market and economic
conditions. Thus, the value of the Fund’s investments will vary and at times may be lower or higher than that of other types of investments.
Foreign risks. The risks of investing in securities of foreign issuers, including emerging market issuers, can include fluctuations in foreign currencies, foreign currency exchange controls, political and economic instability, differences in securities regulation and trading, and foreign taxation issues.
Futures risk. A decision as to whether, when and how to use futures involves the exercise of skill and judgment and even a well conceived futures transaction may be unsuccessful because of market behavior or unexpected events.
Options risk. A decision as to whether, when and how to use options involves the exercise of skill and judgment and even a well conceived option transaction may be unsuccessful because of market behavior or unexpected events. The prices of options can be highly volatile and the use of options can lower total returns.
Real estate investment trusts (REITS) risk. Investing in real estate investment trusts (REITs) makes the Fund more susceptible to risks associated with the ownership of real estate and with the real estate industry in general and may involve duplication of management fees and other expenses. REITs may be less diversified than other pools of securities, may have lower trading volumes and may be subject to more abrupt or erratic price movements than the overall securities markets.
Derivatives risks. Risks of derivatives include the possible imperfect correlation between the value of the instruments and the underlying assets; risks of default by the other party to the transaction; risks that the transactions may result in losses that partially or completely offset gains in portfolio positions; and risks that the instruments may not be liquid.
About indexes used in this report
The S&P 500® Index is an unmanaged index considered representative of the U.S. stock market.
The Russell Midcap® Growth Index is an unmanaged index considered
representative of mid-cap growth stocks. The Russell Midcap Growth Index is a trademark/service mark of the Frank Russell Co. Russell® is a trademark of the Frank Russell Co.
The Lipper VUF Mid-Cap Growth Funds Index is an unmanaged index considered representative of mid-cap growth variable insurance underlying funds tracked by Lipper.
The Fund is not managed to track the performance of any particular index, including the index(es) defined here, and consequently, the performance of the Fund may deviate significantly from the performance of the index(es).
A direct investment cannot be made in an index. Unless otherwise indicated, index results include reinvested dividends, and they do not reflect sales charges. Performance of the peer group, if applicable, reflects fund expenses; performance of a market index does not.
Other information
The Chartered Financial Analyst® (CFA®) designation is globally recognized and attests to a charterholder’s success in a rigorous and comprehensive study program in the field of investment management and research analysis.
Industry classifications used in this report are generally according to the Global Industry Classification Standard, which was developed by and is the exclusive property and a service mark of MSCI Inc. and Standard & Poor’s.
The returns shown in management’s discussion of Fund performance are based on net asset values calculated for shareholder transactions. Generally accepted accounting principles require adjustments to be made to the net assets of the Fund at period end for financial reporting purposes, and as such, the net asset values for shareholder transactions and the returns based on those net asset values may differ from the net asset values and returns reported in the Financial Highlights. Additionally, the returns and net asset values shown throughout this report are at the Fund level only and do not include variable product issuer charges. If such charges were included, the total returns would be lower.
Invesco Van Kampen V.I. Mid Cap Growth Fund
Schedule of Investments(a)
December 31, 2011
| | | | | | | | | |
| | | Shares | | Value |
| |
Common Stocks–96.22%
|
Aerospace & Defense–1.07%
| | | | |
| Triumph Group, Inc. | | | 11,910 | | | $ | 696,139 | |
| |
Air Freight & Logistics–1.56%
| | | | |
| C.H. Robinson Worldwide, Inc. | | | 14,586 | | | | 1,017,811 | |
| |
Apparel, Accessories & Luxury Goods–2.83%
| | | | |
| Coach, Inc. | | | 17,833 | | | | 1,088,526 | |
| |
Michael Kors Holdings Ltd.(b) | | | 27,587 | | | | 751,746 | |
| |
| | | | | | | | 1,840,272 | |
| |
Application Software–0.86%
| | | | |
Citrix Systems, Inc.(b) | | | 9,172 | | | | 556,924 | |
| |
Asset Management & Custody Banks–1.21%
| | | | |
Affiliated Managers Group, Inc.(b) | | | 8,186 | | | | 785,447 | |
| |
Auto Parts & Equipment–3.05%
| | | | |
BorgWarner, Inc.(b)(c) | | | 11,625 | | | | 740,977 | |
| |
| Gentex Corp. | | | 42,137 | | | | 1,246,834 | |
| |
| | | | | | | | 1,987,811 | |
| |
Automobile Manufacturers–1.11%
| | | | |
Tesla Motors, Inc.(b)(c) | | | 25,302 | | | | 722,625 | |
| |
Biotechnology–2.53%
| | | | |
BioMarin Pharmaceutical Inc.(b) | | | 27,007 | | | | 928,501 | |
| |
United Therapeutics Corp.(b) | | | 15,192 | | | | 717,822 | |
| |
| | | | | | | | 1,646,323 | |
| |
Broadcasting–1.92%
| | | | |
Discovery Communications, Inc.–Class A(b) | | | 30,457 | | | | 1,247,823 | |
| |
Communications Equipment–2.53%
| | | | |
F5 Networks, Inc.(b) | | | 6,156 | | | | 653,275 | |
| |
Juniper Networks, Inc.(b) | | | 29,511 | | | | 602,319 | |
| |
Sycamore Networks, Inc.(b) | | | 21,940 | | | | 392,726 | |
| |
| | | | | | | | 1,648,320 | |
| |
Computer Storage & Peripherals–1.56%
| | | | |
NetApp, Inc.(b) | | | 10,570 | | | | 383,374 | |
| |
Western Digital Corp.(b) | | | 20,421 | | | | 632,030 | |
| |
| | | | | | | | 1,015,404 | |
| |
Construction & Engineering–1.14%
| | | | |
MasTec Inc.(b) | | | 42,665 | | | | 741,091 | |
| |
Construction & Farm Machinery & Heavy Trucks–2.52%
| | | | |
AGCO Corp.(b) | | | 20,476 | | | | 879,854 | |
| |
Navistar International Corp.(b) | | | 20,037 | | | | 759,001 | |
| |
| | | | | | | | 1,638,855 | |
| |
Consumer Finance–1.55%
| | | | |
| Discover Financial Services | | | 42,170 | | | | 1,012,080 | |
| |
Electrical Components & Equipment–1.54%
| | | | |
| Cooper Industries PLC (Ireland) | | | 18,491 | | | | 1,001,288 | |
| |
Electronic Components–2.09%
| | | | |
| Amphenol Corp.–Class A | | | 29,980 | | | | 1,360,792 | |
| |
Fertilizers & Agricultural Chemicals–1.33%
| | | | |
Intrepid Potash, Inc.(b) | | | 38,308 | | | | 866,910 | |
| |
Footwear–1.05%
| | | | |
Deckers Outdoor Corp.(b) | | | 9,055 | | | | 684,286 | |
| |
General Merchandise Stores–1.63%
| | | | |
Dollar Tree, Inc.(b) | | | 12,746 | | | | 1,059,320 | |
| |
Health Care Equipment–1.32%
| | | | |
CareFusion Corp.(b) | | | 33,836 | | | | 859,773 | |
| |
Health Care Facilities–2.97%
| | | | |
Brookdale Senior Living Inc.(b) | | | 46,019 | | | | 800,270 | |
| |
| Universal Health Services, Inc.–Class B | | | 29,132 | | | | 1,132,070 | |
| |
| | | | | | | | 1,932,340 | |
| |
Health Care Services–4.87%
| | | | |
DaVita, Inc.(b) | | | 19,267 | | | | 1,460,631 | |
| |
Express Scripts, Inc.(b) | | | 22,101 | | | | 987,694 | |
| |
HMS Holdings Corp.(b) | | | 22,478 | | | | 718,846 | |
| |
| | | | | | | | 3,167,171 | |
| |
Health Care Technology–1.44%
| | | | |
Allscripts Healthcare Solutions, Inc.(b) | | | 49,556 | | | | 938,591 | |
| |
Hotels, Resorts & Cruise Lines–1.43%
| | | | |
| Starwood Hotels & Resorts Worldwide, Inc. | | | 19,345 | | | | 927,980 | |
| |
Household Products–1.97%
| | | | |
| Church & Dwight Co., Inc. | | | 28,004 | | | | 1,281,463 | |
| |
Human Resource & Employment Services–1.27%
| | | | |
| Robert Half International, Inc. | | | 29,104 | | | | 828,300 | |
| |
Industrial Gases–1.95%
| | | | |
| Airgas, Inc. | | | 16,243 | | | | 1,268,253 | |
| |
Industrial Machinery–3.37%
| | | | |
| Flowserve Corp. | | | 9,777 | | | | 971,052 | |
| |
| Gardner Denver Inc. | | | 15,860 | | | | 1,222,171 | |
| |
| | | | | | | | 2,193,223 | |
| |
Internet Software & Services–1.62%
| | | | |
Equinix, Inc.(b) | | | 10,418 | | | | 1,056,385 | |
| |
| | | | | | | | | |
See accompanying Notes to Financial Statements which are an integral part of the financial statements.
Invesco Van Kampen V.I. Mid Cap Growth Fund
| | | | | | | | | |
| | | Shares | | Value |
| |
IT Consulting & Other Services–1.56%
| | | | |
Cognizant Technology Solutions Corp.–Class A(b) | | | 12,522 | | | $ | 805,290 | |
| |
Gartner, Inc.(b) | | | 6,082 | | | | 211,471 | |
| |
| | | | | | | | 1,016,761 | |
| |
Managed Health Care–3.16%
| | | | |
| Aetna Inc. | | | 31,014 | | | | 1,308,481 | |
| |
| Cigna Corp. | | | 17,810 | | | | 748,020 | |
| |
| | | | | | | | 2,056,501 | |
| |
Movies & Entertainment–1.26%
| | | | |
| Cinemark Holdings, Inc. | | | 44,189 | | | | 817,055 | |
| |
Oil & Gas Drilling–0.57%
| | | | |
| Patterson-UTI Energy, Inc. | | | 18,614 | | | | 371,908 | |
| |
Oil & Gas Equipment & Services–4.31%
| | | | |
Cameron International Corp.(b) | | | 32,169 | | | | 1,582,393 | |
| |
Key Energy Services, Inc.(b) | | | 36,548 | | | | 565,398 | |
| |
Weatherford International Ltd.(b) | | | 44,743 | | | | 655,037 | |
| |
| | | | | | | | 2,802,828 | |
| |
Oil & Gas Exploration & Production–4.11%
| | | | |
| Cabot Oil & Gas Corp. | | | 15,170 | | | | 1,151,403 | |
| |
Sanchez Energy Corp.(b) | | | 13,020 | | | | 224,725 | |
| |
Whiting Petroleum Corp.(b) | | | 27,868 | | | | 1,301,157 | |
| |
| | | | | | | | 2,677,285 | |
| |
Packaged Foods & Meats–1.29%
| | | | |
| H.J. Heinz Co. | | | 15,546 | | | | 840,106 | |
| |
Railroads–2.39%
| | | | |
Kansas City Southern(b) | | | 22,883 | | | | 1,556,273 | |
| |
Restaurants–1.70%
| | | | |
Panera Bread Co.–Class A(b) | | | 7,806 | | | | 1,104,159 | |
| |
Semiconductor Equipment–0.78%
| | | | |
Lam Research Corp.(b) | | | 13,753 | | | | 509,136 | |
| |
Semiconductors–5.13%
| | | | |
| Altera Corp. | | | 30,043 | | | | 1,114,595 | |
| |
| Avago Technologies Ltd. (Singapore) | | | 22,319 | | | | 644,127 | |
| |
| Linear Technology Corp. | | | 29,543 | | | | 887,176 | |
| |
LSI Corp.(b) | | | 116,642 | | | | 694,020 | |
| |
| | | | | | | | 3,339,918 | |
| |
Specialized Consumer Services–0.72%
| | | | |
Coinstar, Inc.(b)(c) | | | 10,337 | | | | 471,781 | |
| |
Specialty Chemicals–2.41%
| | | | |
| Albemarle Corp. | | | 17,502 | | | | 901,528 | |
| |
| LyondellBasell Industries N.V.–Class A (Netherlands) | | | 20,583 | | | | 668,742 | |
| |
| | | | | | | | 1,570,270 | |
| |
Specialty Stores–4.98%
| | | | |
| Dick’s Sporting Goods, Inc. | | | 25,591 | | | | 943,796 | |
| |
| PetSmart, Inc. | | | 25,111 | | | | 1,287,943 | |
| |
Ulta Salon, Cosmetics & Fragrance, Inc.(b) | | | 15,513 | | | | 1,007,104 | |
| |
| | | | | | | | 3,238,843 | |
| |
Systems Software–0.94%
| | | | |
Check Point Software Technologies Ltd. (Israel)(b) | | | 11,686 | | | | 613,982 | |
| |
Technology Distributors–1.13%
| | | | |
Avnet, Inc.(b) | | | 23,599 | | | | 733,693 | |
| |
Trucking–1.63%
| | | | |
| J.B. Hunt Transport Services, Inc. | | | 23,573 | | | | 1,062,435 | |
| |
Wireless Telecommunication Services–2.86%
| | | | |
NII Holdings Inc.(b) | | | 31,905 | | | | 679,576 | |
| |
SBA Communications Corp.–Class A(b) | | | 27,555 | | | | 1,183,763 | |
| |
| | | | | | | | 1,863,339 | |
| |
| Total Common Stocks (Cost $59,451,173) | | | | | | | 62,629,273 | |
| |
Money Market Funds–3.73%
|
Liquid Assets Portfolio–Institutional Class(d) | | | 1,214,100 | | | | 1,214,100 | |
| |
Premier Portfolio–Institutional Class(d) | | | 1,214,100 | | | | 1,214,100 | |
| |
| Total Money Market Funds (Cost $2,428,200) | | | | | | | 2,428,200 | |
| |
| TOTAL INVESTMENTS (excluding investments purchased with cash collateral from securities on loan)–99.95% (Cost $61,879,373) | | | | | | | 65,057,473 | |
| |
Investments Purchased with Cash Collateral from Securities on Loan
|
Money Market Funds–2.29%
|
Liquid Assets Portfolio–Institutional Class (Cost $1,491,048)(d)(e) | | | 1,491,048 | | | | 1,491,048 | |
| |
| TOTAL INVESTMENTS–102.24% (Cost $63,370,421) | | | | | | | 66,548,521 | |
| |
| OTHER ASSETS LESS LIABILITIES–(2.24%) | | | | | | | (1,457,828 | ) |
| |
| NET ASSETS–100.00% | | | | | | $ | 65,090,693 | |
| |
Notes to Schedule of Investments:
| | |
| (a) | | Industry and/or sector classifications used in this report are generally according to the Global Industry Classification Standard, which was developed by and is the exclusive property and a service mark of MSCI Inc. and Standard & Poor’s. |
| (b) | | Non-income producing security. |
| (c) | | All or a portion of this security was out on loan at December 31, 2011. |
| (d) | | The money market fund and the Fund are affiliated by having the same investment adviser. |
| (e) | | The security has been segregated to satisfy the commitment to return the cash collateral received in securities lending transactions upon the borrower’s return of the securities loaned. See Note 1I. |
See accompanying Notes to Financial Statements which are an integral part of the financial statements.
Invesco Van Kampen V.I. Mid Cap Growth Fund
Statement of Assets and Liabilities
December 31, 2011
| | | | | |
Assets:
|
| Investments, at value (Cost $59,451,173)* | | $ | 62,629,273 | |
| |
| Investments in affiliated money market funds, at value and cost | | | 3,919,248 | |
| |
| Total investments, at value (Cost $63,370,421) | | | 66,548,521 | |
| |
| Receivable for: | | | | |
| Investments sold | | | 226,581 | |
| |
| Fund shares sold | | | 1,366 | |
| |
| Dividends | | | 37,708 | |
| |
| Investment for trustee deferred compensation and retirement plans | | | 5,284 | |
| |
| Total assets | | | 66,819,460 | |
| |
Liabilities:
|
| Payable for: | | | | |
| Fund shares reacquired | | | 16,706 | |
| |
| Collateral upon return of securities loaned | | | 1,491,048 | |
| |
| Accrued fees to affiliates | | | 179,860 | |
| |
| Accrued other operating expenses | | | 33,632 | |
| |
| Trustee deferred compensation and retirement plans | | | 7,521 | |
| |
| Total liabilities | | | 1,728,767 | |
| |
| Net assets applicable to shares outstanding | | $ | 65,090,693 | |
| |
Net assets consist of:
|
| Shares of beneficial interest | | $ | 58,617,879 | |
| |
| Undistributed net investment income (loss) | | | (7,352 | ) |
| |
| Undistributed net realized gain | | | 3,302,066 | |
| |
| Unrealized appreciation | | | 3,178,100 | |
| |
| | | $ | 65,090,693 | |
| |
Net Assets:
|
| Series I | | $ | 11,181 | |
| |
| Series II | | $ | 65,079,512 | |
| |
Shares outstanding, $0.001 par value per share, with an unlimited number of shares authorized:
|
| Series I | | | 3,030 | |
| |
| Series II | | | 17,676,344 | |
| |
| Series I: | | | | |
| Net asset value per share | | $ | 3.69 | |
| |
| Series II: | | | | |
| Net asset value per share | | $ | 3.68 | |
| |
| |
| * | At December 31, 2011, securities with an aggregate value of $1,451,441 were on loan to brokers. |
Statement of Operations
For the year ended December 31, 2011
| | | | | |
Investment income:
|
| Dividends (net of foreign withholding taxes of $15,723) | | $ | 463,128 | |
| |
| Dividends from affiliated money market funds (includes securities lending income of $10,710) | | | 13,361 | |
| |
| Total investment income | | | 476,489 | |
| |
Expenses:
|
| Advisory fees | | | 558,633 | |
| |
| Administrative services fees | | | 199,727 | |
| |
| Custodian fees | | | 13,547 | |
| |
| Distribution fees — Series II | | | 186,180 | |
| |
| Transfer agent fees | | | 7,102 | |
| |
| Trustees’ and officers’ fees and benefits | | | 20,013 | |
| |
| Other | | | 53,344 | |
| |
| Total expenses | | | 1,038,546 | |
| |
| Less: Fees waived | | | (103,642 | ) |
| |
| Net expenses | | | 934,904 | |
| |
| Net investment income (loss) | | | (458,415 | ) |
| |
Realized and unrealized gain (loss) from:
|
| Net realized gain from investment securities (includes net gains from securities sold to affiliates of $417,192) | | | 5,213,870 | |
| |
| Change in net unrealized appreciation (depreciation) of investment securities | | | (11,146,604 | ) |
| |
| Net realized and unrealized gain (loss) | | | (5,932,734 | ) |
| |
| Net increase (decrease) in net assets resulting from operations | | $ | (6,391,149 | ) |
| |
See accompanying Notes to Financial Statements which are an integral part of the financial statements.
Invesco Van Kampen V.I. Mid Cap Growth Fund
Statement of Changes in Net Assets
For the years ended December 31, 2011 and 2010
| | | | | | | | | |
| | | 2011 | | 2010 |
| |
Operations:
|
| Net investment income (loss) | | $ | (458,415 | ) | | $ | (330,427 | ) |
| |
| Net realized gain | | | 5,213,870 | | | | 3,962,128 | |
| |
| Change in net unrealized appreciation (depreciation) | | | (11,146,604 | ) | | | 12,689,878 | |
| |
| Net increase (decrease) in net assets resulting from operations | | | (6,391,149 | ) | | | 16,321,579 | |
| |
Share transactions–net:
|
| Series I | | | — | | | | 10,000 | |
| |
| Series II | | | (7,991,842 | ) | | | 17,691,401 | |
| |
| Net increase (decrease) in net assets resulting from share transactions | | | (7,991,842 | ) | | | 17,701,401 | |
| |
| Net increase (decrease) in net assets | | | (14,382,991 | ) | | | 34,022,980 | |
| |
Net assets:
|
| Beginning of year | | | 79,473,684 | | | | 45,450,704 | |
| |
| End of year (includes undistributed net investment income (loss) of $(7,352) and $(1,308), respectively) | | $ | 65,090,693 | | | $ | 79,473,684 | |
| |
Notes to Financial Statements
December 31, 2011
NOTE 1—Significant Accounting Policies
Invesco Van Kampen V.I. Mid Cap Growth Fund (the “Fund”) is a series portfolio of AIM Variable Insurance Funds (Invesco Variable Insurance Funds) (the “Trust”). The Trust is a Delaware statutory trust registered under the Investment Company Act of 1940, as amended (the “1940 Act”), as an open-end series management investment company consisting of twenty-eight separate portfolios, (each constituting a “Fund”). The assets, liabilities and operations of each portfolio are accounted for separately. Information presented in these financial statements pertains only to the Fund. Matters affecting each Fund or class will be voted on exclusively by the shareholders of such Fund or class. Current Securities and Exchange Commission (“SEC”) guidance, however, requires participating insurance companies offering separate accounts to vote shares proportionally in accordance with the instructions of the contract owners whose investments are funded by shares of each Fund or class.
The Fund’s investment objective is to seek capital growth.
The Fund currently offers two classes of shares, Series I and Series II, both of which are offered to insurance company separate accounts funding variable annuity contracts and variable life insurance policies (“variable products”).
The following is a summary of the significant accounting policies followed by the Fund in the preparation of its financial statements.
| | |
| A. | | Security Valuations — Securities, including restricted securities, are valued according to the following policy. |
| | A security listed or traded on an exchange (except convertible bonds) is valued at its last sales price or official closing price as of the close of the customary trading session on the exchange where the security is principally traded, or lacking any sales or official closing price on a particular day, the security may be valued at the closing bid price on that day. Securities traded in the over-the-counter market are valued based on prices furnished by independent pricing services or market makers. When such securities are valued by an independent pricing service they may be considered fair valued. Futures contracts are valued at the final settlement price set by an exchange on which they are principally traded. Listed options are valued at the mean between the last bid and ask prices from the exchange on which they are principally traded. Options not listed on an exchange are valued by an independent source at the mean between the last bid and ask prices. For purposes of determining net asset value per share, futures and option contracts generally are valued 15 minutes after the close of the customary trading session of the New York Stock Exchange (“NYSE”). |
| | Investments in open-end and closed-end registered investment companies that do not trade on an exchange are valued at the end of day net asset value per share. Investments in open-end and closed-end registered investment companies that trade on an exchange are valued at the last sales price or official closing price as of the close of the customary trading session on the exchange where the security is principally traded. |
| | Debt obligations (including convertible bonds) and unlisted equities are fair valued using an evaluated quote provided by an independent pricing service. Evaluated quotes provided by the pricing service may be determined without exclusive reliance on quoted prices, and may reflect appropriate factors such as institution-size trading in similar groups of securities, developments related to specific securities, dividend rate, yield, quality, type of issue, coupon rate, maturity, individual trading characteristics and other market data. Debt securities are subject to interest rate and credit risks. In addition, all debt securities involve some risk of default with respect to interest and/or principal payments. |
| | Foreign securities (including foreign exchange contracts) are converted into U.S. dollar amounts using the applicable exchange rates as of the close of the NYSE. If market quotations are available and reliable for foreign exchange traded equity securities, the securities will be valued at the market |
Invesco Van Kampen V.I. Mid Cap Growth Fund
| | |
| | quotations. Because trading hours for certain foreign securities end before the close of the NYSE, closing market quotations may become unreliable. If between the time trading ends on a particular security and the close of the customary trading session on the NYSE, events occur that are significant and make the closing price unreliable, the Fund may fair value the security. If the event is likely to have affected the closing price of the security, the security will be valued at fair value in good faith using procedures approved by the Board of Trustees. Adjustments to closing prices to reflect fair value may also be based on a screening process of an independent pricing service to indicate the degree of certainty, based on historical data, that the closing price in the principal market where a foreign security trade is not the current value as of the close of the NYSE. Foreign securities meeting the approved degree of certainty that the price is not reflective of current value will be priced at the indication of fair value from the independent pricing service. Multiple factors may be considered by the independent pricing service in determining adjustments to reflect fair value and may include information relating to sector indices, American Depositary Receipts and domestic and foreign index futures. Foreign securities may have additional risks including exchange rate changes, potential for sharply devalued currencies and high inflation, political and economic upheaval, the relative lack of issuer information, relatively low market liquidity and the potential lack of strict financial and accounting controls and standards. |
| | Securities for which market prices are not provided by any of the above methods may be valued based upon quotes furnished by independent sources. The last bid price may be used to value equity securities. The mean between the last bid and asked prices is used to value debt obligations, including Corporate Loans. |
| | Securities for which market quotations are not readily available or are unreliable are valued at fair value as determined in good faith by or under the supervision of the Trust’s officers following procedures approved by the Board of Trustees. Issuer specific events, market trends, bid/ask quotes of brokers and information providers and other market data may be reviewed in the course of making a good faith determination of a security’s fair value. |
| | Valuations change in response to many factors including the historical and prospective earnings of the issuer, the value of the issuer’s assets, general economic conditions, interest rates, investor perceptions and market liquidity. Because of the inherent uncertainties of valuation, the values reflected in the financial statements may materially differ from the value received upon actual sale of those investments. |
| B. | | Securities Transactions and Investment Income — Securities transactions are accounted for on a trade date basis. Realized gains or losses on sales are computed on the basis of specific identification of the securities sold. Interest income is recorded on the accrual basis from settlement date. Dividend income (net of withholding tax, if any) is recorded on the ex-dividend date. |
| | The Fund may periodically participate in litigation related to Fund investments. As such, the Fund may receive proceeds from litigation settlements. Any proceeds received are included in the Statement of Operations as realized gain (loss) for investments no longer held and as unrealized gain (loss) for investments still held. |
| | Brokerage commissions and mark ups are considered transaction costs and are recorded as an increase to the cost basis of securities purchased and/or a reduction of proceeds on a sale of securities. Such transaction costs are included in the determination of net realized and unrealized gain (loss) from investment securities reported in the Statement of Operations and the Statement of Changes in Net Assets and the net realized and unrealized gains (losses) on securities per share in the Financial Highlights. Transaction costs are included in the calculation of the Fund’s net asset value and, accordingly, they reduce the Fund’s total returns. These transaction costs are not considered operating expenses and are not reflected in net investment income reported in the Statement of Operations and Statement of Changes in Net Assets, or the net investment income per share and ratios of expenses and net investment income reported in the Financial Highlights, nor are they limited by any expense limitation arrangements between the Fund and the investment adviser. |
| | The Fund allocates income and realized and unrealized capital gains and losses to a class based on the relative net assets of each class. |
| C. | | Country Determination — For the purposes of making investment selection decisions and presentation in the Schedule of Investments, the investment adviser may determine the country in which an issuer is located and/or credit risk exposure based on various factors. These factors include the laws of the country under which the issuer is organized, where the issuer maintains a principal office, the country in which the issuer derives 50% or more of its total revenues and the country that has the primary market for the issuer’s securities, as well as other criteria. Among the other criteria that may be evaluated for making this determination are the country in which the issuer maintains 50% or more of its assets, the type of security, financial guarantees and enhancements, the nature of the collateral and the sponsor organization. Country of issuer and/or credit risk exposure has been determined to be the United States of America, unless otherwise noted. |
| D. | | Distributions — Distributions from income and net realized capital gain, if any, are generally paid to separate accounts of participating insurance companies annually and recorded on ex-dividend date. |
| E. | | Federal Income Taxes — The Fund intends to comply with the requirements of Subchapter M of the Internal Revenue Code necessary to qualify as a regulated investment company and to distribute substantially all of the Fund’s taxable earnings to shareholders. As such, the Fund will not be subject to federal income taxes on otherwise taxable income (including net realized capital gain) that is distributed to shareholders. Therefore, no provision for federal income taxes is recorded in the financial statements. |
| | The Fund files tax returns in the U.S. Federal jurisdiction and certain other jurisdictions. Generally, the Fund is subject to examinations by such taxing authorities for up to three years after the filing of the return for the tax period. |
| F. | | Expenses — Fees provided for under the Rule 12b-1 plan of a particular class of the Fund and which are directly attributable to that class are charged to the operations of such class. All other expenses are allocated among the classes based on relative net assets. |
| G. | | Accounting Estimates — The preparation of financial statements in conformity with accounting principles generally accepted in the United States of America (“GAAP”) requires management to make estimates and assumptions that affect the reported amounts of assets and liabilities at the date of the financial statements and the reported amounts of revenues and expenses during the reporting period including estimates and assumptions related to taxation. Actual results could differ from those estimates by a significant amount. In addition, the Fund monitors for material events or transactions that may occur or become known after the period-end date and before the date the financial statements are released to print. |
| H. | | Indemnifications — Under the Trust’s organizational documents, each Trustee, officer, employee or other agent of the Trust is indemnified against certain liabilities that may arise out of performance of their duties to the Fund. Additionally, in the normal course of business, the Fund enters into contracts, including the Fund’s servicing agreements that contain a variety of indemnification clauses. The Fund’s maximum exposure under these |
Invesco Van Kampen V.I. Mid Cap Growth Fund
| | |
| | arrangements is unknown as this would involve future claims that may be made against the Fund that have not yet occurred. The risk of material loss as a result of such indemnification claims is considered remote. |
| I. | | Securities Lending — The Fund may lend portfolio securities having a market value up to one-third of the Fund’s total assets. Such loans are secured by collateral equal to no less than the market value of the loaned securities determined daily by the securities lending provider. Such collateral will be cash or debt securities issued or guaranteed by the U.S. Government or any of its sponsored agencies. Cash collateral received in connection with these loans is invested in short-term money market instruments or affiliated money market funds and is shown as such on the Schedule of Investments. It is the Fund’s policy to obtain additional collateral from or return excess collateral to the borrower by the end of the next business day, following the valuation date of the securities loaned. Therefore, the value of the collateral held may be temporarily less than the value of the securities on loan. Lending securities entails a risk of loss to the Fund if and to the extent that the market value of the securities loaned were to increase and the borrower did not increase the collateral accordingly, and the borrower fails to return the securities. Upon the failure of the borrower to return the securities, collateral may be liquidated and the securities may be purchased on the open market to replace the loaned securities. The Fund could experience delays and costs in gaining access to the collateral. The Fund bears the risk of any deficiency in the amount of the collateral available for return to the borrower due to any loss on the collateral invested. Dividends received on cash collateral investments for securities lending transactions, which are net of compensation to counterparties, is included in Dividends from affiliated money market funds on the Statement of Operations. The aggregate value of securities out on loan is shown as a footnote on the Statement of Assets and Liabilities, if any. |
NOTE 2—Advisory Fees and Other Fees Paid to Affiliates
The Trust has entered into a master investment advisory agreement with Invesco Advisers, Inc. (the “Adviser” or “Invesco”). Under the terms of the investment advisory agreement, the Fund pays an advisory fee to the Adviser based on the annual rate of the Fund’s average daily net assets as follows:
| | | | | |
| Average Net Assets | | Rate |
| |
| First $500 million | | | 0 | .75% |
| |
| Next $500 million | | | 0 | .70% |
| |
| Over $1 billion | | | 0 | .65% |
| |
Under the terms of a master sub-advisory agreement between the Adviser and each of Invesco Asset Management Deutschland GmbH, Invesco Asset Management Limited, Invesco Asset Management (Japan) Limited, Invesco Australia Limited, Invesco Hong Kong Limited, Invesco Senior Secured Management, Inc. and Invesco Canada Ltd. (collectively, the “Affiliated Sub-Advisers”) the Adviser, not the Fund, may pay 40% of the fees paid to the Adviser to any such Affiliated Sub-Adviser(s) that provide discretionary investment management services to the Fund based on the percentage of assets allocated to such Sub-Adviser(s).
The Adviser has contractually agreed, through at least June 30, 2012, to waive advisory fees and/or reimburse expenses of all shares to the extent necessary to limit total annual fund operating expenses after fee waiver and/or expense reimbursement (excluding certain items discussed below) of Series I shares to 1.01% and Series II shares to 1.26% of average daily net assets. In determining the Adviser’s obligation to waive advisory fees and/or reimburse expenses, the following expenses are not taken into account, and could cause the total annual fund operating expenses after fee waiver and/or expense reimbursement to exceed the numbers reflected above: (1) interest; (2) taxes; (3) dividend expense on short sales; (4) extraordinary items or non-routine items, including litigation expenses; and (5) expenses that the Fund has incurred but did not actually pay because of an expense offset arrangement. Unless the Board of the Trustees and Invesco mutually agree to amend or continue the fee waiver agreement, it will terminate on June 30, 2012.
Further, the Adviser has contractually agreed, through at least June 30, 2012, to waive the advisory fee payable by the Fund in an amount equal to 100% of the net advisory fees the Adviser receives from the affiliated money market funds on investments by the Fund of uninvested cash (excluding investments of cash collateral from securities lending) in such affiliated money market funds.
For the year ended December 31, 2011, the Adviser waived advisory fees of $103,642.
The Trust has entered into a master administrative services agreement with Invesco pursuant to which the Fund has agreed to pay Invesco a fee for costs incurred in providing accounting services and fund administrative services to the Fund and to reimburse Invesco for administrative services fees paid to insurance companies that have agreed to provide services to the participants of separate accounts. These administrative services provided by the insurance companies may include, among other things: the printing of prospectuses, financial reports and proxy statements and the delivery of the same to existing participants; the maintenance of master accounts; the facilitation of purchases and redemptions requested by the participants; and the servicing of participants’ accounts. Pursuant to such agreement, for the year ended December 31, 2011, Invesco was paid $50,000 for accounting and fund administrative services and reimbursed $149,727 for services provided by insurance companies.
The Trust has entered into a transfer agency and service agreement with Invesco Investment Services, Inc. (“IIS”) pursuant to which the Fund has agreed to pay IIS a fee for providing transfer agency and shareholder services to the Fund and reimburse IIS for certain expenses incurred by IIS in the course of providing such services. For the year ended December 31, 2011, expenses incurred under the agreement are shown in the Statement of Operations as transfer agent fees.
The Trust has entered into a master distribution agreement with Invesco Distributors, Inc. (“IDI”) to serve as the distributor for the Fund. The Trust has adopted a plan pursuant to Rule 12b-1 under the 1940 Act with respect to the Fund’s Series II shares (the “Plan”). The Fund, pursuant to the Plan, pays IDI compensation at the annual rate of 0.25% of the Fund’s average daily net assets of Series II shares. Of the Plan payments, up to 0.25% of the average daily net assets of the Series II shares may be paid to insurance companies who furnish continuing personal shareholder services to customers who purchase and own Series II shares of the Fund. For the year ended December 31, 2011, expenses incurred under the Plan are detailed in the Statement of Operations as distribution fees.
Certain officers and trustees of the Trust are officers and directors of the Adviser, Invesco Ltd., IIS and/or IDI.
Invesco Van Kampen V.I. Mid Cap Growth Fund
NOTE 3—Additional Valuation Information
GAAP defines fair value as the price that would be received to sell an asset or paid to transfer a liability in an orderly transaction between market participants at the measurement date, under current market conditions. GAAP establishes a hierarchy that prioritizes the inputs to valuation methods giving the highest priority to readily available unadjusted quoted prices in an active market for identical assets (Level 1) and the lowest priority to significant unobservable inputs (Level 3) generally when market prices are not readily available or are unreliable. Based on the valuation inputs, the securities or other investments are tiered into one of three levels. Changes in valuation methods may result in transfers in or out of an investment’s assigned level:
| | |
| | Level 1 — | Prices are determined using quoted prices in an active market for identical assets. |
| | Level 2 — | Prices are determined using other significant observable inputs. Observable inputs are inputs that other market participants may use in pricing a security. These may include quoted prices for similar securities, interest rates, prepayment speeds, credit risk, yield curves, loss severities, default rates, discount rates, volatilities and others. |
| | Level 3 — | Prices are determined using significant unobservable inputs. In situations where quoted prices or observable inputs are unavailable (for example, when there is little or no market activity for an investment at the end of the period), unobservable inputs may be used. Unobservable inputs reflect the Fund’s own assumptions about the factors market participants would use in determining fair value of the securities or instruments and would be based on the best available information. |
The following is a summary of the tiered valuation input levels, as of December 31, 2011. The level assigned to the securities valuations may not be an indication of the risk or liquidity associated with investing in those securities. Because of the inherent uncertainties of valuation, the values reflected in the financial statements may materially differ from the value received upon actual sale of those investments.
During the year ended December 31, 2011, there were no significant transfers between investment levels.
| | | | | | | | | | | | | | | | | |
| | | Level 1 | | Level 2 | | Level 3 | | Total |
| |
| Equity Securities | | $ | 66,548,521 | | | $ | — | | | $ | — | | | $ | 66,548,521 | |
| |
NOTE 4—Security Transactions with Affiliated Funds
The Fund is permitted to purchase or sell securities from or to certain other Invesco Funds under specified conditions outlined in procedures adopted by the Board of Trustees of the Trust. The procedures have been designed to ensure that any purchase or sale of securities by the Fund from or to another fund or portfolio that is or could be considered an affiliate by virtue of having a common investment adviser (or affiliated investment advisers), common Trustees and/or common officers complies with Rule 17a-7 of the 1940 Act. Further, as defined under the procedures, each transaction is effected at the current market price. Pursuant to these procedures, for the year ended December 31, 2011, the Fund engaged in securities purchases of $1,769,828 and securities sales of $2,403,007, which resulted in net realized gains of $417,192.
NOTE 5—Trustees’ and Officers’ Fees and Benefits
“Trustees’ and Officers’ Fees and Benefits” include amounts accrued by the Fund to pay remuneration to certain Trustees and Officers of the Fund. Trustees have the option to defer compensation payable by the Fund, and “Trustees’ and Officers’ Fees and Benefits” also include amounts accrued by the Fund to fund such deferred compensation amounts. Those Trustees who defer compensation have the option to select various Invesco Funds in which their deferral accounts shall be deemed to be invested. Finally, certain current Trustees are eligible to participate in a retirement plan that provides for benefits to be paid upon retirement to Trustees over a period of time based on the number of years of service. The Fund may have certain former Trustees who also participate in a retirement plan and receive benefits under such plan. “Trustees’ and Officers’ Fees and Benefits” include amounts accrued by the Fund to fund such retirement benefits. Obligations under the deferred compensation and retirement plans represent unsecured claims against the general assets of the Fund.
During the year ended December 31, 2011, the Fund paid legal fees of $1,215 for services rendered by Kramer, Levin, Naftalis & Frankel LLP as counsel to the Independent Trustees. A partner of that firm is a Trustee of the Trust.
NOTE 6—Cash Balances
The Fund is permitted to temporarily carry a negative or overdrawn balance in its account with State Street Bank and Trust Company, the custodian bank. To compensate the custodian bank for such overdrafts, the overdrawn Fund may either (1) leave funds as a compensating balance in the account so the custodian bank can be compensated by earning the additional interest; or (2) compensate by paying the custodian bank at a rate agreed upon by the custodian bank and Invesco, not to exceed the contractually agreed upon rate.
Invesco Van Kampen V.I. Mid Cap Growth Fund
NOTE 7—Distributions to Shareholders and Tax Components of Net Assets
There were no ordinary or long-term capital gain distributions paid during the years ended December 31, 2011 and 2010.
Tax Components of Net Assets at Period-End:
| | | | | |
| | | 2011 |
| |
| Undistributed long-term gain | | | 3,397,791 | |
| |
| Net unrealized appreciation — investments | | | 3,082,375 | |
| |
| Temporary book/tax differences | | | (7,352 | ) |
| |
| Shares of beneficial interest | | | 58,617,879 | |
| |
| Total net assets | | $ | 65,090,693 | |
| |
The difference between book-basis and tax-basis unrealized appreciation (depreciation) is due to differences in the timing of recognition of gains and losses on investments for tax and book purposes. The Fund’s net unrealized appreciation difference is attributable primarily to wash sales.
The temporary book/tax differences are a result of timing differences between book and tax recognition of income and/or expenses. The Fund’s temporary book/tax differences are the result of the trustee deferral of compensation and retirement plan benefits.
Capital loss carryforward is calculated and reported as of a specific date. Results of transactions and other activity after that date may affect the amount of capital loss carryforward actually available for the Fund to utilize. The Regulated Investment Company Modernization Act of 2010 (the “Act”) eliminated the eight-year carryover period for capital losses that arise in taxable years beginning after its enactment date of December 22, 2010. Consequently, these capital losses can be carried forward for an unlimited period. However, capital losses with an expiration period may not be used to offset capital gains until all net capital losses without an expiration date have been utilized. Additionally, post-enactment capital loss carryovers will retain their character as either short-term or long-term capital losses instead of as short-term capital losses as under prior law. The ability to utilize capital loss carryforward in the future may be limited under the Internal Revenue Code and related regulations based on the results of future transactions.
The Fund utilized $1,624,949 of capital loss carryforward in the current period to offset net realized capital gain for federal income tax purposes. The Fund does not have a capital loss carryover at period end.
NOTE 8—Investment Securities
The aggregate amount of investment securities (other than short-term securities, U.S. Treasury obligations and money market funds, if any) purchased and sold by the Fund during the year ended December 31, 2011 was $99,815,988 and $108,970,697, respectively. Cost of investments on a tax basis includes the adjustments for financial reporting purposes as of the most recently completed Federal income tax reporting period-end.
| | | | | |
| Unrealized Appreciation (Depreciation) of Investment Securities on a Tax Basis |
| |
| Aggregate unrealized appreciation of investment securities | | | 6,268,189 | |
| |
| Aggregate unrealized (depreciation) of investment securities | | | (3,185,814 | ) |
| |
| Net unrealized appreciation of investment securities | | | 3,082,375 | |
| |
| Cost of investments for tax purposes is 63,466,146 |
NOTE 9—Reclassification of Permanent Differences
Primarily as a result of differing book/tax treatment of expired capital loss carryover and net operating losses, on December 31, 2011, undistributed net investment income (loss) was increased by $452,371, undistributed net realized gain was increased by $351,608 and shares of beneficial interest decreased by $803,979. This reclassification had no effect on the net assets of the Fund.
Invesco Van Kampen V.I. Mid Cap Growth Fund
NOTE 10—Share Information
| | | | | | | | | | | | | | | | | |
| | | Summary of Share Activity |
| |
| | | Years ended December 31, |
| | | 2011(a) | | 2010 |
| | | Shares | | Amount | | Shares | | Amount |
| |
| Sold: | | | | | | | | | | | | | | | | |
| Series I | | | — | | | $ | — | | | | 3,030 | | | $ | 10,000 | |
| |
| Series II | | | 1,834,465 | | | | 7,278,754 | | | | 8,162,383 | | | | 27,538,493 | |
| |
| Reacquired: | | | | | | | | | | | | | | | | |
| Series I | | | — | | | | — | | | | — | | | | — | |
| |
| Series II | | | (3,749,212 | ) | | | (15,270,596 | ) | | | (2,832,428 | ) | | | (9,847,092 | ) |
| |
| Net increase (decrease) in share activity | | | (1,914,747 | ) | | $ | (7,991,842 | ) | | | 5,332,985 | | | $ | 17,701,401 | |
| |
| | |
| (a) | | There are entities that are record owners of more than 5% of the outstanding shares of the Fund and in the aggregate own 88% of the outstanding shares of the Fund. The Fund and the Fund’s principal underwriter or adviser, are parties to participation agreements with these entities whereby these entities sell units of interest in separate accounts funding variable products that are invested in the Fund. The Fund, Invesco and/or Invesco affiliates may make payments to these entities, which are considered to be related to the Fund, for providing services to the Fund, Invesco and/or Invesco affiliates including but not limited to services such as, securities brokerage, third party record keeping and account servicing and administrative services. The Fund has no knowledge as to whether all or any portion of the shares owned of record by these entities are also owned beneficially. |
NOTE 11—Financial Highlights
The following schedule presents financial highlights for a share of the Fund outstanding throughout the periods indicated.
| | | | | | | | | | | | | | | | | | | | | | | | | | | | | | | | | | | | | | | | | | | | | | | | | |
| | | | | | | | | | | | | | | | | | | Ratio of
| | Ratio of
| | | | |
| | | | | | | Net gains
| | | | | | | | | | | | expenses
| | expenses
| | | | |
| | | | | | | (losses) on
| | | | | | | | | | | | to average
| | to average net
| | Ratio of net
| | |
| | | Net asset
| | Net
| | securities
| | | | Distributions
| | | | | | | | net assets
| | assets without
| | investment
| | |
| | | value,
| | investment
| | (both
| | Total from
| | from net
| | Net asset
| | | | Net assets,
| | with fee waivers
| | fee waivers
| | income (loss)
| | |
| | | beginning
| | income
| | realized and
| | investment
| | realized
| | value, end
| | Total
| | end of period
| | and/or expenses
| | and/or expenses
| | to average
| | Portfolio
|
| | | of period | | (loss)(a) | | unrealized) | | operations | | gains | | of period | | Return(b) | | (000s omitted) | | absorbed | | absorbed | | net assets | | turnover(c) |
| |
| Series I |
| Year ended 12/31/11 | | $ | 4.05 | | | $ | (0.01 | ) | | $ | (0.35 | ) | | $ | (0.36 | ) | | $ | — | | | $ | 3.69 | | | | (8.89 | )% | | $ | 11 | | | | 1.00 | %(d) | | | 1.14 | %(d) | | | (0.36 | )%(d) | | | 137 | % |
| Year ended 12/31/10(e) | | | 3.30 | | | | (0.00 | )(f) | | | 0.75 | | | | 0.75 | | | | — | | | | 4.05 | | | | 22.73 | | | | 12 | | | | 1.01 | (g) | | | 1.12 | (g) | | | (0.18 | )(g) | | | 105 | |
| |
| Series II |
| Year ended 12/31/11 | | | 4.06 | | | | (0.02 | ) | | | (0.36 | ) | | | (0.38 | ) | | | — | | | | 3.68 | | | | (9.36 | ) | | | 65,080 | | | | 1.25 | (d) | | | 1.39 | (d) | | | (0.61 | )(d) | | | 137 | |
| Year ended 12/31/10 | | | 3.19 | | | | (0.02 | ) | | | 0.89 | | | | 0.87 | | | | — | | | | 4.06 | | | | 27.27 | | | | 79,461 | | | | 1.26 | | | | 1.37 | | | | (0.53 | ) | | | 105 | |
| Year ended 12/31/09 | | | 2.04 | | | | (0.01 | ) | | | 1.16 | | | | 1.15 | | | | — | | | | 3.19 | | | | 56.37 | | | | 45,451 | | | | 1.26 | | | | 1.52 | | | | (0.36 | ) | | | 42 | |
| Year ended 12/31/08 | | | 5.72 | | | | (0.02 | ) | | | (2.01 | ) | | | (2.03 | ) | | | (1.65 | ) | | | 2.04 | | | | (46.83 | ) | | | 22,603 | | | | 1.26 | | | | 1.61 | | | | (0.66 | ) | | | 42 | |
| Year ended 12/31/07 | | | 5.24 | | | | (0.02 | ) | | | 0.88 | | | | 0.86 | | | | (0.38 | ) | | | 5.72 | | | | 17.60 | | | | 43,316 | | | | 1.26 | | | | 1.39 | | | | (0.37 | ) | | | 201 | |
| |
| | |
| (a) | | Calculated using average shares outstanding. |
| (b) | | Includes adjustments in accordance with accounting principles generally accepted in the United States of America and as such, the net asset value for financial reporting purposes and the returns based upon those net asset values may differ from the net asset value and returns for shareholder transactions. Total returns do not reflect charges assessed in connection with a variable product, which if included would reduce total returns and is not annualized for periods less than one year, if applicable. |
| (c) | | Portfolio turnover is calculated at the fund level and is not annualized for periods less than one year, if applicable. |
| (d) | | Ratios are based on average daily net assets (000’s) of $12 and $74,472 for Series I and Series II shares, respectively. |
| (e) | | Commencement date of June 1, 2010. |
| (f) | | Amount is less than $0.01 per share. |
| (g) | | Annualized. |
NOTE 12—Proposed Reorganization
The Board of Trustees of the Fund unanimously approved an Agreement and Plan of Reorganization (the “Agreement”) pursuant to which the Fund would acquire all of the assets and liabilities of Invesco V.I. Capital Development Fund (the “Target Fund”) in exchange for shares of the Fund.
The Agreement requires approval of the Target Fund’s shareholders and will be submitted to the shareholders for their consideration at a meeting to be held in or around April 2012. Upon closing of the reorganization, shareholders of the Target Fund will receive a corresponding class of shares of the Fund in exchange for their shares of the Target Fund and the Target Fund will liquidate and cease operations.
Invesco Van Kampen V.I. Mid Cap Growth Fund
Report of Independent Registered Public Accounting Firm
To the Board of Trustees of AIM Variable Insurance Funds (Invesco Variable Insurance Funds)
and Shareholders of Invesco Van Kampen V.I. Mid Cap Growth Fund:
In our opinion, the accompanying statement of assets and liabilities, including the schedule of investments, and the related statements of operations and of changes in net assets and the financial highlights present fairly, in all material respects, the financial position of Invesco Van Kampen V.I. Mid Cap Growth Fund (one of the funds constituting AIM Variable Insurance Funds (Invesco Variable Insurance Funds), hereafter referred to as the “Fund”) at December 31, 2011, the results of its operations for the year then ended, and the changes in its net assets and the financial highlights for each of the two years in the period then ended, in conformity with accounting principles generally accepted in the United States of America. These financial statements and financial highlights (hereafter referred to as “financial statements”) are the responsibility of the Fund’s management; our responsibility is to express an opinion on these financial statements based on our audits. We conducted our audits of these financial statements in accordance with the standards of the Public Company Accounting Oversight Board (United States). Those standards require that we plan and perform the audits to obtain reasonable assurance about whether the financial statements are free of material misstatement. An audit includes examining, on a test basis, evidence supporting the amounts and disclosures in the financial statements, assessing the accounting principles used and significant estimates made by management, and evaluating the overall financial statement presentation. We believe that our audits, which included confirmation of securities at December 31, 2011 by correspondence with the custodian and brokers, provide a reasonable basis for our opinion. The financial highlights of the Fund for the periods ended December 31, 2009 and prior were audited by other independent auditors whose report dated February 19, 2010 expressed an unqualified opinion on those financial statements.
PRICEWATERHOUSECOOPERS LLP
February 14, 2012
Houston, Texas
Invesco Van Kampen V.I. Mid Cap Growth Fund
Calculating your ongoing Fund expenses
Example
As a shareholder of the Fund, you incur ongoing costs, including management fees; distribution and/or service fees (12b-1); and other Fund expenses. This example is intended to help you understand your ongoing costs (in dollars) of investing in the Fund and to compare these costs with ongoing costs of investing in other mutual funds. The example is based on an investment of $1,000 invested at the beginning of the period and held for the entire period July 1, 2011 through December 31, 2011.
The actual and hypothetical expenses in the examples below do not represent the effect of any fees or other expenses assessed in connection with a variable product; if they did, the expenses shown would be higher while the ending account values shown would be lower.
Actual expenses
The table below provides information about actual account values and actual expenses. You may use the information in this table, together with the amount you invested, to estimate the expenses that you paid over the period. Simply divide your account value by $1,000 (for example, an $8,600 account value divided by $1,000 = 8.6), then multiply the result by the number in the table under the heading entitled “Actual Expenses Paid During Period” to estimate the expenses you paid on your account during this period.
Hypothetical example for comparison purposes
The table below also provides information about hypothetical account values and hypothetical expenses based on the Fund’s actual expense ratio and an assumed rate of return of 5% per year before expenses, which is not the Fund’s actual return.
The hypothetical account values and expenses may not be used to estimate the actual ending account balance or expenses you paid for the period. You may use this information to compare the ongoing costs of investing in the Fund and other funds. To do so, compare this 5% hypothetical example with the 5% hypothetical examples that appear in the shareholder reports of the other funds.
Please note that the expenses shown in the table are meant to highlight your ongoing costs. Therefore, the hypothetical information is useful in comparing ongoing costs, and will not help you determine the relative total costs of owning different funds.
| | | | | | | | | | | | | | | | | | | | | | | | | | | | | | | |
| | | | | | | | | | | | | HYPOTHETICAL
| | | |
| | | | | | | ACTUAL | | | (5% annual return before expenses) | | | |
| | | | Beginning
| | | Ending
| | | Expenses
| | | Ending
| | | Expenses
| | | Annualized
|
| | | | Account Value
| | | Account Value
| | | Paid During
| | | Account Value
| | | Paid During
| | | Expense
|
| Class | | | (07/01/11) | | | (12/31/11)1 | | | Period2 | | | (12/31/11) | | | Period2 | | | Ratio |
| Series I | | | $ | 1,000.00 | | | | $ | 850.20 | | | | $ | 4.71 | | | | $ | 1,020.11 | | | | $ | 5.14 | | | | | 1.01 | % |
| | | | | | | | | | | | | | | | | | | | | | | | | | | | | | | |
| Series II | | | | 1,000.00 | | | | | 847.90 | | | | | 5.87 | | | | | 1,018.85 | | | | | 6.41 | | | | | 1.26 | |
| | | | | | | | | | | | | | | | | | | | | | | | | | | | | | | |
| |
| 1 | The actual ending account value is based on the actual total return of the Fund for the period July 1, 2011 through December 31, 2011, after actual expenses and will differ from the hypothetical ending account value which is based on the Fund’s expense ratio and a hypothetical annual return of 5% before expenses. |
| 2 | Expenses are equal to the Fund’s annualized expense ratio as indicated above multiplied by the average account value over the period, multiplied by 184/365 to reflect the most recent fiscal half year. |
Invesco Van Kampen V.I. Mid Cap Growth Fund
The address of each trustee and officer is AIM Variable Insurance Funds (Invesco Variable Insurance Funds) (the “Trust”), 11 Greenway Plaza, Suite 2500, Houston, Texas 77046-1173. The trustees serve for the life of the Trust, subject to their earlier death, incapacitation, resignation, retirement or removal as more specifically provided in the Trust’s organizational documents. Each officer serves for a one year term or until their successors are elected and qualified. Column two below includes length of time served with predecessor entities, if any.
| | | | | | | | | |
| | | | | | | Number of Funds
| | |
Name, Year of Birth and
| | Trustee and/
| | Principal Occupation(s)
| | in Fund Complex
| | Other Directorship(s)
|
| Position(s) Held with the Trust | | or Officer Since | | During Past 5 Years | | Overseen by Trustee | | Held by Trustee |
| | | | | | | | | |
| | | | | | | | | |
| | | | | | | | | |
| Interested Persons | | | | | | | | |
| | | | | | | | | |
| | | | | | | | | |
| | | | | | | | | |
Martin L. Flanagan1 — 1960
Trustee | | 2007 | | Executive Director, Chief Executive Officer and President, Invesco Ltd. (ultimate parent of Invesco and a global investment management firm); Advisor to the Board, Invesco Advisers, Inc. (formerly known as Invesco Institutional (N.A.), Inc.); Trustee, The Invesco Funds; Vice Chair, Investment Company Institute; and Member of Executive Board, SMU Cox School of Business
Formerly: Chairman, Invesco Advisers, Inc. (registered investment adviser); Director, Chairman, Chief Executive Officer and President, IVZ Inc. (holding company), INVESCO Group Services, Inc. (service provider) and Invesco North American Holdings, Inc. (holding company); Director, Chief Executive Officer and President, Invesco Holding Company Limited (parent of Invesco and a global investment management firm); Director, Invesco Ltd.; Chairman, Investment Company Institute and President, Co-Chief Executive Officer, Co-President, Chief Operating Officer and Chief Financial Officer, Franklin Resources, Inc. (global investment management organization) | | 140 | | None |
| | | | | | | | | |
| | | | | | | | | |
| | | | | | | | | |
Philip A. Taylor2 — 1954
Trustee, President and Principal Executive Officer | | 2006 | | Head of North American Retail and Senior Managing Director, Invesco Ltd.; Director, Co-Chairman, Co-President and Co-Chief Executive Officer, Invesco Advisers, Inc. (formerly known as Invesco Institutional (N.A.), Inc.) (registered investment adviser); Director, Chairman, Chief Executive Officer and President, Invesco Management Group, Inc. (formerly Invesco Aim Management Group, Inc.) (financial services holding company); Director and President, INVESCO Funds Group, Inc. (registered investment adviser and registered transfer agent); Director and Chairman, Invesco Investment Services, Inc. (formerly known as Invesco Aim Investment Services, Inc.) (registered transfer agent) and IVZ Distributors, Inc. (formerly known as INVESCO Distributors, Inc.) (registered broker dealer); Director, President and Chairman, Invesco Inc. (holding company) and Invesco Canada Holdings Inc. (holding company); Chief Executive Officer, Invesco Corporate Class Inc. (corporate mutual fund company) and Invesco Canada Fund Inc. (corporate mutual fund company); Director, Chairman and Chief Executive Officer, Invesco Canada Ltd. (formerly known as Invesco Trimark Ltd./Invesco Trimark Ltèe) (registered investment adviser and registered transfer agent); Trustee, President and Principal Executive Officer, The Invesco Funds (other than AIM Treasurer’s Series Trust (Invesco Treasurer’s Series Trust) and Short-Term Investments Trust); Trustee and Executive Vice President, The Invesco Funds (AIM Treasurer’s Series Trust (Invesco Treasurer’s Series Trust) and Short-Term Investments Trust only); Director, Invesco Investment Advisers LLC (formerly known as Van Kampen Asset Management); Director, Chief Executive Officer and President, Van Kampen Exchange Corp. | | 140 | | None |
| | | | | | | | | |
| | | | | | | | | |
| | | | | Formerly: Director and Chairman, Van Kampen Investor Services Inc.: Director, Chief Executive Officer and President, 1371 Preferred Inc. (holding company); and Van Kampen Investments Inc.; Director and President, AIM GP Canada Inc. (general partner for limited partnerships); and Van Kampen Advisors, Inc.; Director and Chief Executive Officer, Invesco Trimark Dealer Inc. (registered broker dealer); Director, Invesco Distributors, Inc. (formerly known as Invesco Aim Distributors, Inc.) (registered broker dealer); Manager, Invesco PowerShares Capital Management LLC; Director, Chief Executive Officer and President, Invesco Advisers, Inc.; Director, Chairman, Chief Executive Officer and President, Invesco Aim Capital Management, Inc.; President, Invesco Trimark Dealer Inc. and Invesco Trimark Ltd./Invesco Trimark Ltèe; Director and President, AIM Trimark Corporate Class Inc. and AIM Trimark Canada Fund Inc.; Senior Managing Director, Invesco Holding Company Limited; Trustee and Executive Vice President, Tax-Free Investments Trust; Director and Chairman, Fund Management Company (former registered broker dealer); President and Principal Executive Officer, The Invesco Funds (AIM Treasurer’s Series Trust (Invesco Treasurer’s Series Trust), Short-Term Investments Trust and Tax-Free Investments Trust only); President, AIM Trimark Global Fund Inc. and AIM Trimark Canada Fund Inc. | | | | |
| | | | | | | | | |
| | | | | | | | | |
| | | | | | | | | |
Wayne W. Whalen3 — 1939
Trustee | | 2010 | | Of Counsel, and prior to 2010, partner in the law firm of Skadden, Arps, Slate, Meagher & Flom LLP, legal counsel to funds in the Fund Complex | | 158 | | Director of the Abraham Lincoln Presidential Library Foundation |
| | | | | | | | | |
| | | | | | | | | |
| | | | | | | | | |
| Independent Trustees | | | | | | | | |
| | | | | | | | | |
| | | | | | | | | |
| | | | | | | | | |
Bruce L. Crockett — 1944
Trustee and Chair | | 1993 | | Chairman, Crockett Technology Associates (technology consulting company) | | 140 | | ACE Limited (insurance company); and Investment Company Institute |
| | | | | Formerly: Director, Captaris (unified messaging provider); Director, President and Chief Executive Officer COMSAT Corporation; and Chairman, Board of Governors of INTELSAT (international communications company) | | | | |
| | | | | | | | | |
| |
| 1 | Mr. Flanagan is considered an interested person of the Trust because he is an officer of the adviser to the Trust, and an officer and a director of Invesco Ltd., ultimate parent of the adviser to the Trust. |
| 2 | Mr. Taylor is considered an interested person of the Trust because he is an officer and a director of the adviser to, and a director of the principal underwriter of, the Trust. |
| 3 | Mr. Whalen is considered an “interested person” (within the meaning of Section 2(a)(19) of the 1940 Act) of certain Funds in the Fund Complex by reason of he and his firm currently providing legal services as legal counsel to such Funds in the Fund Complex. |
Invesco Van Kampen V.I. Mid Cap Growth Fund
Trustees and Officers—(continued)
The address of each trustee and officer is AIM Variable Insurance Funds (Invesco Variable Insurance Funds) (the “Trust”), 11 Greenway Plaza, Suite 2500, Houston, Texas 77046-1173. The trustees serve for the life of the Trust, subject to their earlier death, incapacitation, resignation, retirement or removal as more specifically provided in the Trust’s organizational documents. Each officer serves for a one year term or until their successors are elected and qualified. Column two below includes length of time served with predecessor entities, if any.
| | | | | | | | | |
| | | | | | | Number of Funds
| | |
Name, Year of Birth and
| | Trustee and/
| | Principal Occupation(s)
| | in Fund Complex
| | Other Directorship(s)
|
| Position(s) Held with the Trust | | or Officer Since | | During Past 5 Years | | Overseen by Trustee | | Held by Trustee |
| | | | | | | | | |
| | | | | | | | | |
| | | | | | | |
Independent Trustees—(continued) | | | | | | |
| | | | | | | | | |
| | | | | | | | | |
| | | | | | | | | |
David C. Arch — 1945
Trustee | | 2010 | | Chairman and Chief Executive Officer of Blistex Inc., a consumer health care products manufacturer. | | 158 | | Member of the Heartland Alliance Advisory Board, a nonprofit organization serving human needs based in Chicago. Board member of the Illinois Manufacturers’ Association. Member of the Board of Visitors, Institute for the Humanities, University of Michigan |
| | | | | | | | | |
| | | | | | | | | |
| | | | | | | | | |
Frank S. Bayley — 1939
Trustee | | 2001 | | Retired
Formerly: Director, Badgley Funds, Inc. (registered investment company) (2 portfolios) and Partner, law firm of Baker & McKenzie
Formerly: Director, Badgley Funds, Inc. (registered investment company) (2 portfolios) and Partner, law firm of Baker & McKenzie | | 140 | | Director and Chairman, C.D. Stimson Company (a real estate investment company) |
| | | | | | | | | |
| | | | | | | | | |
| | | | | | | | | |
James T. Bunch — 1942
Trustee | | 2004 | | Managing Member, Grumman Hill Group LLC (family office private equity management)
Formerly: Founder, Green, Manning & Bunch Ltd. (investment banking firm)(1988-2010); Executive Committee, United States Golf Association; and Director, Policy Studies, Inc. and Van Gilder Insurance Corporation | | 140 | | Vice Chairman, Board of Governors, Western Golf Association/Evans Scholars Foundation and Director, Denver Film Society |
| | | | | | | | | |
| | | | | | | | | |
| | | | | | | | | |
Rodney F. Dammeyer — 1940
Trustee | | 2010 | | President of CAC, LLC, a private company offering capital investment and management advisory services.
Formerly: Prior to January 2004, Director of TeleTech Holdings Inc.; Prior to 2002, Director of Arris Group, Inc.; Prior to 2001, Managing Partner at Equity Group Corporate Investments. Prior to 1995, Vice Chairman of Anixter International. Prior to 1985, experience includes Senior Vice President and Chief Financial Officer of Household International, Inc., Executive Vice President and Chief Financial Officer of Northwest Industries, Inc. and Partner of Arthur Andersen & Co. | | 158 | | Director of Quidel Corporation and Stericycle, Inc. Prior to May 2008, Trustee of The Scripps Research Institute. Prior to February 2008, Director of Ventana Medical Systems, Inc. Prior to April 2007, Director of GATX Corporation. Prior to April 2004, Director of TheraSense, Inc. |
| | | | | | | | | |
| | | | | | | | | |
| | | | | | | | | |
Albert R. Dowden — 1941
Trustee | | 2000 | | Director of a number of public and private business corporations, including the Boss Group, Ltd. (private investment and management); Reich & Tang Funds (5 portfolios) (registered investment company); and Homeowners of America Holding Corporation/ Homeowners of America Insurance Company (property casualty company)
Formerly: Director, Continental Energy Services, LLC (oil and gas pipeline service); Director, CompuDyne Corporation (provider of product and services to the public security market) and Director, Annuity and Life Re (Holdings), Ltd. (reinsurance company); Director, President and Chief Executive Officer, Volvo Group North America, Inc.; Senior Vice President, AB Volvo; Director of various public and private corporations; Chairman, DHJ Media, Inc.; Director Magellan Insurance Company; and Director, The Hertz Corporation, Genmar Corporation (boat manufacturer), National Media Corporation; Advisory Board of Rotary Power International (designer, manufacturer, and seller of rotary power engines); and Chairman, Cortland Trust, Inc. (registered investment company) | | 140 | | Board of Nature’s Sunshine Products, Inc. |
| | | | | | | | | |
| | | | | | | | | |
| | | | | | | | | |
Jack M. Fields — 1952
Trustee | | 1997 | | Chief Executive Officer, Twenty First Century Group, Inc. (government affairs company); and Owner and Chief Executive Officer, Dos Angelos Ranch, L.P. (cattle, hunting, corporate entertainment), Discovery Global Education Fund (non-profit) and Cross Timbers Quail Research Ranch (non-profit)
Formerly: Chief Executive Officer, Texana Timber LP (sustainable forestry company) and member of the U.S. House of Representatives | | 140 | | Administaff |
| | | | | | | | | |
| | | | | | | | | |
| | | | | | | | | |
Carl Frischling — 1937
Trustee | | 1993 | | Partner, law firm of Kramer Levin Naftalis and Frankel LLP | | 140 | | Director, Reich & Tang Funds (16 portfolios) |
| | | | | | | | | |
| | | | | | | | | |
Invesco Van Kampen V.I. Mid Cap Growth Fund
Trustees and Officers—(continued)
The address of each trustee and officer is AIM Variable Insurance Funds (Invesco Variable Insurance Funds) (the “Trust”), 11 Greenway Plaza, Suite 2500, Houston, Texas 77046-1173. The trustees serve for the life of the Trust, subject to their earlier death, incapacitation, resignation, retirement or removal as more specifically provided in the Trust’s organizational documents. Each officer serves for a one year term or until their successors are elected and qualified. Column two below includes length of time served with predecessor entities, if any.
| | | | | | | | | |
| | | | | | | Number of Funds
| | |
Name, Year of Birth and
| | Trustee and/
| | Principal Occupation(s)
| | in Fund Complex
| | Other Directorship(s)
|
| Position(s) Held with the Trust | | or Officer Since | | During Past 5 Years | | Overseen by Trustee | | Held by Trustee |
| | | Independent Trustees—(continued) | | | | |
| | | | | | | | | |
| | | | | | | | | |
| | | | | | | | | |
Prema Mathai-Davis — 1950
Trustee | | 1998 | | Retired
Formerly: Chief Executive Officer, YWCA of the U.S.A. | | 140 | | None |
| | | | | | | | | |
| | | | | | | | | |
| | | | | | | | | |
Larry Soll — 1942
Trustee | | 2004 | | Retired
Formerly, Chairman, Chief Executive Officer and President, Synergen Corp. (a biotechnology company) | | 140 | | None |
| | | | | | | | | |
| | | | | | | | | |
| | | | | | | | | |
Hugo F. Sonnenschein — 1940
Trustee | | 2010 | | President Emeritus and Honorary Trustee of the University of Chicago and the Adam Smith Distinguished Service Professor in the Department of Economics at the University of Chicago. Prior to July 2000, President of the University of Chicago. | | 158 | | Trustee of the University of Rochester and a member of its investment committee. Member of the National Academy of Sciences, the American Philosophical Society and a fellow of the American Academy of Arts and Sciences |
| | | | | | | | | |
| | | | | | | | | |
| | | | | | | | | |
| Raymond Stickel, Jr. — 1944 Trustee | | 2005 | | Retired
Formerly: Director, Mainstay VP Series Funds, Inc. (25 portfolios) and Partner, Deloitte & Touche | | 140 | | None |
| | | | | | | | | |
| | | | | | | | | |
| | | | | | | | | |
| Other Officers | | | | | | | | |
| | | | | | | | | |
| | | | | | | | | |
| | | | | | | | | |
Russell C. Burk — 1958
Senior Vice President and Senior Officer | | 2005 | | Senior Vice President and Senior Officer, The Invesco Funds | | N/A | | N/A |
| | | | | | | | | |
| | | | | | | | | |
| | | | | | | | | |
John M. Zerr — 1962
Senior Vice President, Chief Legal Officer and Secretary | | 2006 | | Director, Senior Vice President, Secretary and General Counsel, Invesco Management Group, Inc. (formerly known as Invesco Aim Management Group, Inc.) and Van Kampen Exchange Corp.; Senior Vice President, Invesco Advisers, Inc. (formerly known as Invesco Institutional (N.A.), Inc.) (registered investment adviser); Senior Vice President and Secretary, Invesco Distributors, Inc. (formerly known as Invesco Aim Distributors, Inc.); Director, Vice President and Secretary, Invesco Investment Services, Inc. (formerly known as Invesco Aim Investment Services, Inc.) and IVZ Distributors, Inc. (formerly known as INVESCO Distributors, Inc.); Director and Vice President, INVESCO Funds Group, Inc.; Senior Vice President, Chief Legal Officer and Secretary, The Invesco Funds; Manager, Invesco PowerShares Capital Management LLC; Director, Secretary and General Counsel, Invesco Investment Advisers LLC (formerly known as Van Kampen Asset Management); Secretary and General Counsel, Van Kampen Funds Inc. and Chief Legal Officer, PowerShares Exchange-Traded Fund Trust, PowerShares Exchange-Traded Fund Trust II, PowerShares India Exchange-Traded Fund Trust and PowerShares Actively Managed Exchange-Traded Fund Trust
Formerly: Director and Secretary, Van Kampen Advisors Inc.; Director Vice President, Secretary and General Counsel Van Kampen Investor Services Inc.; Director, Invesco Distributors, Inc. (formerly known as Invesco Aim Distributors, Inc.); Director, Senior Vice President, General Counsel and Secretary, Invesco Advisers, Inc.; and Van Kampen Investments Inc.; Director, Vice President and Secretary, Fund Management Company; Director, Senior Vice President, Secretary, General Counsel and Vice President, Invesco Aim Capital Management, Inc.; Chief Operating Officer and General Counsel, Liberty Ridge Capital, Inc. (an investment adviser); Vice President and Secretary, PBHG Funds (an investment company) and PBHG Insurance Series Fund (an investment company); Chief Operating Officer, General Counsel and Secretary, Old Mutual Investment Partners (a broker-dealer); General Counsel and Secretary, Old Mutual Fund Services (an administrator) and Old Mutual Shareholder Services (a shareholder servicing center); Executive Vice President, General Counsel and Secretary, Old Mutual Capital, Inc. (an investment adviser); and Vice President and Secretary, Old Mutual Advisors Funds (an investment company) | | N/A | | N/A |
| | | | | | | | | |
| | | | | | | | | |
| | | | | | | | | |
Lisa O. Brinkley — 1959
Vice President | | 2004 | | Global Compliance Director, Invesco Ltd.; Chief Compliance Officer, Invesco Investment Services, Inc.(formerly known as Invesco Aim Investment Services, Inc.); and Vice President, The Invesco Funds
Formerly: Chief Compliance Officer, Invesco Distributors, Inc. (formerly known as Invesco Aim Distributors, Inc.) and Van Kampen Investor Services Inc.; Senior Vice President, Invesco Management Group, Inc.; Senior Vice President and Chief Compliance Officer, Invesco Advisers, Inc. and The Invesco Funds; Vice President and Chief Compliance Officer, Invesco Aim Capital Management, Inc. and Invesco Distributors, Inc.; Vice President, Invesco Investment Services, Inc. and Fund Management Company | | N/A | | N/A |
| | | | | | | | | |
Invesco Van Kampen V.I. Mid Cap Growth Fund
Trustees and Officers—(continued)
The address of each trustee and officer is AIM Variable Insurance Funds (Invesco Variable Insurance Funds) (the “Trust”), 11 Greenway Plaza, Suite 2500, Houston, Texas 77046-1173. The trustees serve for the life of the Trust, subject to their earlier death, incapacitation, resignation, retirement or removal as more specifically provided in the Trust’s organizational documents. Each officer serves for a one year term or until their successors are elected and qualified. Column two below includes length of time served with predecessor entities, if any.
| | | | | | | | | |
| | | | | | | Number of Funds
| | |
Name, Year of Birth and
| | Trustee and/
| | Principal Occupation(s)
| | in Fund Complex
| | Other Directorship(s)
|
| Position(s) Held with the Trust | | or Officer Since | | During Past 5 Years | | Overseen by Trustee | | Held by Trustee |
| | | Other Officers—(continued) | | | | |
| | | | | | | | | |
| | | | | | | | | |
| | | | | | | | | |
Sheri Morris — 1964
Vice President, Treasurer and Principal Financial Officer | | 1999 | | Vice President, Treasurer and Principal Financial Officer, The Invesco Funds; Vice President, Invesco Advisers, Inc. (formerly known as Invesco Institutional (N.A.), Inc.) (registered investment adviser).
Formerly: Treasurer, PowerShares Exchange-Traded Fund Trust, PowerShares Exchange-Traded Fund Trust II, PowerShares India Exchange-Traded Fund Trust and PowerShares Actively Managed Exchange-Traded Fund Trust, Vice President, Invesco Advisers, Inc., Invesco Aim Capital Management, Inc. and Invesco Aim Private Asset Management, Inc.; Assistant Vice President and Assistant Treasurer, The Invesco Funds and Assistant Vice President, Invesco Advisers, Inc., Invesco Aim Capital Management, Inc. and Invesco Aim Private Asset Management, Inc. | | N/A | | N/A |
| | | | | | | | | |
| | | | | | | | | |
| | | | | | | | | |
Karen Dunn Kelley — 1960
Vice President | | 1993 | | Head of Invesco’s World Wide Fixed Income and Cash Management Group; Senior Vice President, Invesco Management Group, Inc. (formerly known as Invesco Aim Management Group, Inc.) and Invesco Advisers, Inc. (formerly known as Invesco Institutional (N.A.), Inc.) (registered investment adviser); Executive Vice President, Invesco Distributors, Inc. (formerly known as Invesco Aim Distributors, Inc.); Director, Invesco Mortgage Capital Inc.; Vice President, The Invesco Funds (other than AIM Treasurer’s Series Trust (Invesco Treasurer’s Series Trust) and Short-Term Investments Trust); and President and Principal Executive Officer, The Invesco Funds (AIM Treasurer’s Series Trust (Invesco Treasurer’s Series Trust) and Short-Term Investments Trust only).
Formerly: Senior Vice President, Van Kampen Investments Inc.; Vice President, Invesco Advisers, Inc. (formerly known as Invesco Institutional (N.A.), Inc.); Director of Cash Management and Senior Vice President, Invesco Advisers, Inc. and Invesco Aim Capital Management, Inc.; President and Principal Executive Officer, Tax-Free Investments Trust; Director and President, Fund Management Company; Chief Cash Management Officer, Director of Cash Management, Senior Vice President, and Managing Director, Invesco Aim Capital Management, Inc.; Director of Cash Management, Senior Vice President, and Vice President, Invesco Advisers, Inc. and The Invesco Funds (AIM Treasurer’s Series Trust (Invesco Treasurer’s Series Trust), Short-Term Investments Trust and Tax-Free Investments Trust only) | | N/A | | N/A |
| | | | | | | | | |
| | | | | | | | | |
| | | | | | | | | |
Yinka Akinsola — 1977
Anti-Money Laundering Compliance Officer | | 2011 | | Anti-Money Laundering Compliance Officer, Invesco Advisers, Inc. (formerly known as Invesco Institutional (N.A.), Inc.) (registered investment adviser); Invesco Distributors, Inc. (formerly known as Invesco Aim Distributors, Inc.), Invesco Investment Services, Inc. (formerly known as Invesco Aim Investment Services, Inc.), Invesco Management Group, Inc., The Invesco Funds, Invesco Van Kampen Closed-End Funds, Van Kampen Exchange Corp. and Van Kampen Funds Inc. | | N/A | | N/A |
| | | | | | | | | |
| | | | | | | | | |
| | | | | | | | | |
Todd L. Spillane — 1958
Chief Compliance Officer | | 2006 | | Senior Vice President, Invesco Management Group, Inc. (formerly known as Invesco Aim Management Group, Inc.) and Van Kampen Exchange Corp.; Senior Vice President and Chief Compliance Officer, Invesco Advisers, Inc. (registered investment adviser) (formerly known as Invesco Institutional (N.A.), Inc.); Chief Compliance Officer, The Invesco Funds, INVESCO Private Capital Investments, Inc. (holding company) and Invesco Private Capital, Inc. (registered investment adviser); Vice President, Invesco Distributors, Inc. (formerly known as Invesco Aim Distributors, Inc.) and Invesco Investment Services, Inc. (formerly known as Invesco Aim Investment Services, Inc.).
Formerly: Chief Compliance Officer, Invesco Van Kampen Closed-End Funds PowerShares Exchange-Traded Fund Trust, PowerShares Exchange-Traded Fund Trust II, PowerShares India Exchange-Traded Fund Trust, and PowerShares Actively Managed Exchange-Traded Fund Trust; Senior Vice President, Van Kampen Investments Inc.; Senior Vice President and Chief Compliance Officer, Invesco Advisers, Inc. and Invesco Aim Capital Management, Inc.; Chief Compliance Officer, Invesco Global Asset Management (N.A.), Inc., Invesco Senior Secured Management, Inc. (registered investment adviser) and Van Kampen Investor Services Inc.; Vice President, Invesco Aim Capital Management, Inc. and Fund Management Company | | N/A | | N/A |
| | | | | | | | | |
The Statement of Additional Information of the Trust includes additional information about the Fund’s Trustees and is available upon request, without charge, by calling 1.800.959.4246. Please refer to the Fund’s prospectus for information on the Fund’s sub-advisers.
| | | | | | | |
Office of the Fund
11 Greenway Plaza, Suite 2500
Houston, TX 77046-1173 | | Investment Adviser
Invesco Advisers, Inc.
1555 Peachtree Street, N.E.
Atlanta, GA 30309 | | Distributor
Invesco Distributors, Inc.
11 Greenway Plaza, Suite 2500
Houston, TX 77046-1173 | | Auditors
PricewaterhouseCoopers LLP
1201 Louisiana Street, Suite 2900
Houston, TX 77002-5678 |
| | | | | | | |
| | | | | | | |
Counsel to the Fund
Stradley Ronon Stevens & Young, LLP
2600 One Commerce Square
Philadelphia, PA 19103 | | Counsel to the Independent Trustees
Kramer, Levin, Naftalis & Frankel LLP
1177 Avenue of the Americas
New York, NY 10036-2714 | | Transfer Agent
Invesco Investment Services, Inc.
11 Greenway Plaza, Suite 2500
Houston, TX77046-1173 | | Custodian
State Street Bank and Trust Company
225 Franklin
Boston, MA 02110-2801 |
Invesco Van Kampen V.I. Mid Cap Growth Fund
Invesco Van Kampen V.I. Mid Cap Value FundAnnual Report to Shareholders § December 31, 2011The Fund provides a complete list of its holdings four times in each fiscal year, at the quarter-ends. For the second and fourth quarters, the lists appear in the Fund’s semiannual and annual reports to shareholders. For the first and third quarters, the Fund files the lists with the Securities and Exchange Commission (SEC) on Form N-Q. The Fund’s Form N-Q filings are available on the SEC website, sec.gov. Copies of the Fund’s Forms N-Q may be reviewed and copied at the SEC Public Reference Room in Washington, D.C. You can obtain information on the operation of the Public Reference Room, including information about duplicating fee charges, by calling 202 551 8090 or 800 732 0330, or by electronic request at the following email address: publicinfo@sec.gov. The SEC file numbers for the Fund are 811-07452 and 033-57340. The Fund’s most recent portfolio holdings, as filed on Form N-Q, have also been made available to insurance companies issuing variable annuity contracts and variable life insurance policies (“variable products”) that invest in the Fund.
A description of the policies and procedures that the Fund uses to determine how to vote proxies relating to portfolio securities is available without charge, upon request, from our Client Services department at 800 959 4246 or at invesco.com/proxyguidelines. The information is also available on the SEC website, sec.gov.
Information regarding how the Fund voted proxies related to its portfolio securities during the 12 months ended June 30, 2011, is available at invesco.com/proxysearch. The information is also available on the SEC website, sec.gov.
Invesco Advisers, Inc. is an investment adviser; it provides investment advisory services to individual and institutional clients and does not sell securities. Invesco Distributors, Inc. is the U.S. distributor for Invesco Ltd.’s retail mutual funds, exchange-traded funds and institutional money market funds. Both are wholly owned, indirect subsidiaries of Invesco Ltd.
This report must be accompanied or preceded by a currently effective Fund prospectus and variable product prospectus, which contain more complete information, including sales charges and expenses. Investors should read each carefully before investing.
Invesco Distributors, Inc.
VK-VIMCV-AR-1
| | | | | | | | | |
|
| | | | | | | |
NOT FDIC INSURED | | | MAY LOSE VALUE | | | NO BANK GUARANTEE |
Management’s Discussion of Fund Performance
Performance summary
For the fiscal year ended December 31, 2011, Invesco Van Kampen V.I. Mid Cap Value Fund outperformed the Russell Midcap Value Index, the Fund’s style-specific benchmark. As the Fund uses a bottom-up stock selection approach, stock selection in various sectors was the primary reason the Fund outperformed its benchmark.
Your Fund’s long-term performance appears later in this report.
Fund vs. Indexes
Total returns, 12/31/10 to 12/31/11, excluding variable product issuer charges. If variable product issuer charges were included, returns would be lower.
| | | | | |
|
| Series I Shares | | | 0.92 | % |
| |
| Series II Shares | | | 0.83 | |
| |
S&P 500 Index▼ (Broad Market Index) | | | 2.09 | |
| |
Russell Midcap Value Index▼ (Style-Specific Index) | | | -1.38 | |
| |
Lipper VUF Mid-Cap Value Funds Index▼ (Peer Group Index) | | | -5.56 | |
| |
Source(s): ▼Lipper Inc.
As noted in the Fund’s latest semiannual report, the Fund has adopted a three-tier benchmark structure to compare its performance to broad market, style-specific and peer group market measures.
How we invest
We call our investment philosophy “value with a catalyst.” We believe undervalued companies that are experiencing positive changes (i.e., “catalysts”) have the potential to generate long-term stock price growth for shareholders. We generally seek to identify companies that are out of favor with investors, under-earning relative to their potential and attractively valued. For these companies, we attempt to identify catalysts that may improve the financial results and/or correct the under-valuation. Examples of catalysts typically include improved operational efficiency, changing industry dynamics and/or a change in management.
We initially identify potential investments through a series of quantitative screens including, but not limited to, return on capital and enterprise value to sales metrics. We then conduct fundamental research on the most attractive opportunities. The research process includes a thorough review of a company’s financial statements, an evaluation of its competitive position and stability and meetings with its executives. During the
research process, we also value the company under various scenarios to determine if the investment is an attractive opportunity relative to its risks. This is also where we typically identify the positive catalyst, a prerequisite for potential investment. Finally, we generally set a price target for a stock based on normalized earnings and historical valuation multiples.
In short, our goal is to exploit negative sentiment toward a company’s stock by analyzing the company’s operations in the context of a cyclical environment and identifying one or more catalysts that may improve the company’s financial performance. Improved financial performance, in turn, has the potential to drive the company’s stock price higher.
We typically sell an investment when it reaches our estimate of fair value or when we identify a more attractive investment opportunity.
Market conditions and your Fund
The fiscal year began with equity markets fueled on the second round of “quantitative easing” by the U.S. Federal Reserve,
and markets rose through the first quarter of 2011. However, with the spring came increased volatility and significant macroeconomic distortions due to civil unrest in Egypt and Libya, flooding in Australia and a devastating earthquake and tsunami in Japan. Corporate earnings remained strong with largely positive surprises, but were often overshadowed by investor concerns about continuing high unemployment and soft housing data.
Although markets stabilized and were generally in positive territory through the summer, major equity indexes sold off precipitously in August as the U.S. government struggled to raise the nation’s debt ceiling. Despite an eventual agreement between the White House and Congress, credit rating agency Standard & Poor’s announced the first-ever downgrade to long-term U.S. government debt. Uncertainty created by the downgrade, combined with the continuing saga surrounding the debt crisis in the eurozone, reignited fears of a global recession. Despite evidence of sustained, but muted, growth, these macroeconomic factors continued to weigh on markets through the end of the reporting period.
Results were mixed among the sectors of the Russell Midcap Value Index, with cyclical sectors such as telecommunication services, financials, materials and information technology (IT) posting negative returns, while defensive sectors such as utilities and consumer staples fared better, posting double-digit positive returns.
The largest contributor to relative Fund performance versus the Russell Midcap Value Index were holdings in the energy sector. Although the Fund was underweight in this sector, stock selection drove relative performance. El Paso was a top performer as investors welcomed the news that the company will spin off its exploration and production business, while retaining its core pipeline business.
Portfolio Composition
By sector
| | | | | |
|
| Financials | | | 18.2 | % |
| |
| Consumer Discretionary | | | 13.3 | |
| |
| Information Technology | | | 10.4 | |
| |
| Energy | | | 9.6 | |
| |
| Consumer Staples | | | 9.3 | |
| |
| Materials | | | 8.0 | |
| |
| Utilities | | | 7.9 | |
| |
| Health Care | | | 6.1 | |
| |
| Industrials | | | 6.1 | |
| |
| Telecommunication Services | | | 3.3 | |
| |
Money Market Funds Plus | | | | |
Other Assets Less Liabilities | | | 7.8 | |
Top 10 Equity Holdings*
| | | | | | | | | |
|
| | 1. Edison International | | | 3.7 | % |
| |
| | 2. Fidelity National Information
Services, Inc. | | | 3.4 | |
| |
| | 3. Newell Rubbermaid Inc. | | | 3.4 | |
| |
| | 4. Safeway Inc. | | | 3.3 | |
| |
| | 5. tw telecom inc. | | | 3.3 | |
| |
| | 6. Williams Cos., Inc. (The) | | | 3.2 | |
| |
| | 7. W.R. Grace & Co. | | | 3.2 | |
| |
| | 8. ConAgra Foods, Inc. | | | 3.1 | |
| |
| | 9. Harley-Davidson, Inc. | | | 3.0 | |
| |
| | 10. Marsh & McLennan Cos., Inc. | | | 2.9 | |
| | | | | |
|
| Total Net Assets | | $292.9 million |
| | | | | |
| Total Number of Holdings* | | | 42 |
The Fund’s holdings are subject to change, and there is no assurance that the Fund will continue to hold any particular security.
* Excluding money market fund holdings.
Invesco Van Kampen V.I. Mid Cap Value Fund
Additionally, in October, Kinder Morgan (not a Fund holding) announced it would be acquiring El Paso at a significant premium. Another top performer in the energy sector was The Williams Companies, with its stock price benefiting from strong financials.
Select holdings in the materials sector also contributed to relative Fund performance, and stock selection helped drive returns. Cyclical stocks performed well in the materials sector, and the economy show signs of strengthening. W.R. Grace & Co., a chemical supplier for refineries, was a top performer due to positive earnings revisions. Valspar, a paint and coatings manufacturer, was also a top performer within this sector.
In general, financials stocks performed poorly toward the end of the reporting period. The Fund had an underweight exposure to the financials sector relative to the Russell Midcap Value Index. Our financials stocks did not depreciate as much as those of the index, thereby acting as a contributor to relative Fund performance.
Finally, strong stock selection in the industrials sector helped relative Fund performance. Notably, Goodrich (no longer held by the Fund) was the largest contributor within this sector. The company’s stock rallied on news of a takeover by United Technologies (not a Fund holding), posting double-digit gains for the reporting period.
In terms of detractors, an underweight exposure to the utilities sector was the largest detractor from overall relative Fund performance for the reporting period. Utilities stocks were the top performing sector of the Russell Midcap Value Index for 2011, posting returns of over 20%.1
Weak stock selection in the consumer staples sector also negatively affected relative Fund performance. Avon, the sector’s largest detractor, performed poorly during the reporting period on concerns of its exposure to consumers outside of the U.S., coupled with growing fear of the European debt crisis.
Stock selection in the consumer discretionary sector also dampened Fund performance versus the style-specific benchmark. Staples, an office supplies distributor, continued to post disappointing earnings and revenues as sales lagged due to high unemployment and a lack of hiring. Whirlpool (no longer a Fund holding as of the end of the reporting period) also detracted from relative Fund performance due to weak demand from consumers.
Equity markets experienced an increase in market volatility during the period covered by this report. We believe that market volatility, and the market correction that began in the third quarter of 2011, created opportunities to invest in companies with attractive valuations and strong fundamentals. We believe that ultimately those valuations and fundamentals will be reflected in those companies’ stock prices.
Thank you for investing in Invesco Van Kampen V.I. Mid Cap Value Fund.
1 Source: Lipper Inc.
The views and opinions expressed in management’s discussion of Fund performance are those of Invesco Advisers, Inc. These views and opinions are subject to change at any time based on factors such as market and economic conditions. These views and opinions may not be relied upon as investment advice or recommendations, or as an offer for a particular security. The information is not a complete analysis of every aspect of any market, country, industry, security or the Fund. Statements of fact are from sources considered reliable, but Invesco Advisers, Inc. makes no representation or warranty as to their completeness or accuracy. Although historical performance is no guarantee of future results, these insights may help you understand our investment management philosophy.
See important Fund and, if applicable, index disclosures later in this report.
Thomas Copper
Chartered Financial Analyst, portfolio manager, is co-lead manager of Invesco Van Kampen V.I. Mid Cap Value Fund. He joined Invesco in 2010. Mr. Copper earned a B.A. in economics and political science from Tulane University and an M.B.A. from Baylor University.
John Mazanec
Portfolio manager, is co-lead manager of Invesco Van Kampen V.I. Mid Cap Value Fund. He joined Invesco in 2010. Mr. Mazanec earned a B.S. from DePauw University and an M.B.A. from Harvard University.
Sergio Marcheli
Portfolio manager, is manager of Invesco Van Kampen V.I. Mid Cap Value Fund. He joined Invesco in 2010. Mr. Marcheli earned a B.B.A. from the University of Houston and an M.B.A. from the University of St. Thomas.
Invesco Van Kampen V.I. Mid Cap Value Fund
Your Fund’s Long-Term Performance
Results of a $10,000 Investment – Oldest Share Class(es) since Inception
Fund and index data from 12/31/01*
|
| * | During the reporting period, Invesco changed its policy regarding growth of $10,000 charts. For funds older than 10 years, we previously showed performance since inception. Going forward, we will show performance for the most recent 10 years, since this more accurately reflects the experience of the typical shareholder. As a result, charts now may include benchmarks that did not appear previously, because the funds’ inception pre-dated the benchmarks’ inception. Also, all charts will now be presented using a linear format. |
Past performance cannot guarantee comparable future results.
As noted earlier in this report, the Fund
has adopted a three-tier benchmark structure to compare its performance to broad market, style-specific and peer
group market measures. These additional benchmarks will now be included in the chart above.
Average Annual Total Returns
As of 12/31/11
| | | | | | | | | |
|
| Series I Shares | | | | |
| |
| Inception (1/2/97) | | | 8.96 | % |
| |
| | 10 | | | Years | | | 5.58 | |
| |
| | 5 | | | Years | | | 1.69 | |
| |
| | 1 | | | Year | | | 0.92 | |
| |
| | | | | | | | | |
| Series II Shares | | | | |
| |
| Inception (5/5/03) | | | 9.65 | % |
| |
| | 5 | | | Years | | | 1.59 | |
| |
| | 1 | | | Year | | | 0.83 | |
Effective June 1, 2010, Class I and Class II shares of the predecessor fund, Universal Institutional Funds Mid Cap Value Portfolio, advised by Morgan Stanley Investment Management Inc., were reorganized into Series I and Series II shares, respectively, of Invesco Van Kampen V.I. Mid Cap Value Fund. Returns shown above for Series I and Series II shares are blended returns of the predecessor fund and Invesco Van Kampen V.I. Mid Cap Value Fund. Share class returns will differ from the predecessor fund because of different expenses.
The performance data quoted represent past performance and cannot guarantee comparable future results;
current performance may be lower or higher. Please contact your variable product issuer or financial adviser for the most recent month-end variable product performance. Performance figures reflect Fund expenses, reinvested distributions and changes in net asset value. Investment return and principal value will fluctuate so that you may have a gain or loss when you sell shares.
The net annual Fund operating expense ratio set forth in the most recent Fund prospectus as of the date of this report for Series I and Series II shares was 1.04% and 1.14%, respectively.1 The total annual Fund operating expense ratio set forth in the most recent Fund prospectus as of the date of this report for Series I and Series II shares was 1.04% and 1.29%, respectively. The expense ratios presented above may vary from the expense ratios presented in other sections of this report that are based on expenses incurred during the period covered by this report.
Invesco Van Kampen V.I. Mid Cap Value Fund, a series portfolio of AIM Variable Insurance Funds (Invesco Variable Insurance Funds), is currently offered through insurance companies
issuing variable products. You cannot purchase shares of the Fund directly. Performance figures given represent the Fund and are not intended to reflect actual variable product values. They do not reflect sales charges, expenses and fees assessed in connection with a variable product. Sales charges, expenses and fees, which are determined by the variable product issuers, will vary and will lower the total return.
The most recent month-end performance data at the Fund level, excluding variable product charges, is available at 800 451 4246. As mentioned above, for the most recent month-end performance including variable product charges, please contact your variable product issuer or financial adviser.
| | |
| 1 | | Total annual Fund operating expenses after any contractual fee waivers by the distributor in effect through at least June 30, 2012. See current prospectus for more information. |
Invesco Van Kampen V.I. Mid Cap Value Fund
Invesco Van Kampen V.I. Mid Cap Value Fund’s investment objective is to provide above-average total return over a market cycle of three to five years by investing in common stocks and other equity securities.
| n | | Unless otherwise stated, information presented in this report is as of December 31, 2011, and is based on total net assets. |
| |
| n | | Unless otherwise noted, all data provided by Invesco. |
| |
| n | | To access your Fund’s reports/prospectus, visit invesco.com/fundreports. |
Principal risks of investing in the Fund
Market risk. Market risk is the possibility that the market values of securities owned by the Fund will decline. Investments in common stocks and other equity securities generally are affected by changes in the stock markets, which fluctuate substantially over time, sometimes suddenly and sharply. Convertible securities have risks associated with both common stocks and debt securities. Investments in debt securities generally are affected by changes in interest rates and the creditworthiness of the issuer. The prices of such securities tend to fall as interest rates rise, and such declines tend to be greater among securities with longer maturities. The value of a convertible security tends to decline as interest rates rise and, because of the conversion feature, tends to vary with fluctuations in the market value of the underlying equity security.
Medium capitalization companies risk. Investing in securities of medium capitalization companies may involve greater risk than is customarily associated with investing in more established companies. Often, medium capitalization companies and the industries in which they are focused are still evolving. Medium-sized companies often have less predictable earnings and more limited product lines, markets, distribution channels or financial resources. The market movements of equity securities of medium-sized companies may be more abrupt and volatile than the market movements of equity securities of larger, more established companies or the stock market in general.
Value investing style risk. The Fund emphasizes a value style of investing, which focuses on undervalued companies with characteristics for improved valuations. This style of investing is subject to the risk that the valuations never improve or that the returns on “value” equity securities are less than returns on other styles of investing or the overall stock market. Value stocks also may decline in price, even though in theory they are already underpriced.
Foreign securities risk. The risks of investing in securities of foreign issuers, including emerging market issuers, can include fluctuations in foreign currencies, foreign currency exchange controls, political and economic instability, differences in securities regulation and trading, and foreign taxation issues.
Investing in real estate investment trusts (REITs) risk. Investing in REITs makes the Fund more susceptible to risks associated with the ownership of real estate and with the real estate industry in general and may involve duplication of management fees and other expenses. REITs may be less diversified than other pools of securities, may have lower trading volumes and may be subject to more abrupt or erratic price movements than the overall securities markets.
Derivatives risk. A derivative instrument often has risks similar to its underlying instrument and may have additional risks, including imperfect correlation between the value of the derivative and the underlying instrument, risks of default by the other party to certain transactions, magnification of losses incurred due to changes in the market value of the securities, instruments, indices or interest rates to which they relate, and risks that the transactions may not be liquid. Certain derivative transactions may give rise to a form of leverage. Leverage magnifies the potential for gain and the risk of loss.
Depositary receipts risk. Depositary receipts involve many of the same risks as those associated with direct investment in foreign securities. In addition, the underlying issuers of certain depositary receipts, particularly unsponsored or unregistered depositary receipts, are under no obligation to distribute shareholder communications to the holders of such receipts or to pass through to them any voting rights with respect to the deposited securities.
Futures risk. A decision as to whether, when and how to use futures involves the exercise of skill and judgment and even a well-conceived futures transaction may be unsuccessful because of market behavior or unexpected events.
Options risk. A decision as to whether, when and how to use options involves the exercise of skill and judgment and even a well-conceived option transaction may be unsuccessful because of market behavior or unexpected events. The prices of options can be highly volatile and the use of options can lower total returns.
Swaps risk. A swap contract is an agreement between two parties pursuant to which the parties exchange payments at specified dates on the basis of a specified notional amount, with the payments calculated by reference to specified securities, indexes, reference rates, currencies or other instruments. Swaps are subject to credit risk and counterparty risk.
About indexes used in this report
The S&P 500® Index is an unmanaged index considered representative of the U.S. stock market.
The Russell Midcap® Value Index is an unmanaged index considered representative of mid-cap value stocks. The Russell Midcap Value Index is a trademark/service mark of the Frank Russell Co. Russell® is a trademark of the Frank Russell Co.
The Lipper VUF Mid-Cap Value Funds Index is an unmanaged index considered representative of mid-cap value variable insurance underlying funds tracked by Lipper.
The Fund is not managed to track the performance of any particular index, including the index(es) defined here, and consequently, the performance of the Fund may deviate significantly from the performance of the index(es).
A direct investment cannot be made in an index. Unless otherwise indicated, index results include reinvested dividends, and they do not reflect sales charges. Performance of the peer group, if applicable, reflects fund expenses; performance of a market index does not.
Invesco Van Kampen V.I. Mid Cap Value Fund
Other information
The Chartered Financial Analyst® (CFA®) designation is globally recognized and attests to a charterholder’s success in a rigorous and comprehensive study program in the field of investment management and research analysis.
Industry classifications used in this report are generally according to the Global Industry Classification Standard, which was developed by and is the exclusive property and a service mark of MSCI Inc. and Standard & Poor’s.
The returns shown in management’s discussion of Fund performance are based on net asset values calculated for shareholder transactions. Generally accepted accounting principles require adjustments to be made to the net assets of the Fund at period end for financial reporting purposes, and as such, the net asset values for shareholder transactions and the returns based on those net asset values may differ from the net asset values and returns reported in the Financial Highlights. Additionally, the returns and net asset values shown throughout this report are at the Fund level only and do not include variable product issuer charges. If such charges were included, the total returns would be lower.
Invesco Van Kampen V.I. Mid Cap Value Fund
Schedule of Investments(a)
December 31, 2011
| | | | | | | | | |
| | | Shares | | Value |
| |
Common Stocks & Other Equity Interests–91.32%
|
Alternative Carriers–3.28%
| | | | |
tw telecom inc.(b) | | | 495,045 | | | $ | 9,593,972 | |
| |
Asset Management & Custody Banks–2.17%
| | | | |
| Northern Trust Corp. | | | 160,123 | | | | 6,350,478 | |
| |
Computer Hardware–2.11%
| | | | |
| Diebold, Inc. | | | 205,863 | | | | 6,190,300 | |
| |
Data Processing & Outsourced Services–3.40%
| | | | |
| Fidelity National Information Services, Inc. | | | 374,080 | | | | 9,946,787 | |
| |
Diversified Banks–1.81%
| | | | |
| Comerica Inc. | | | 205,527 | | | | 5,302,597 | |
| |
Electric Utilities–4.16%
| | | | |
| Edison International | | | 258,118 | | | | 10,686,085 | |
| |
| Great Plains Energy Inc. | | | 68,307 | | | | 1,487,727 | |
| |
| | | | | | | | 12,173,812 | |
| |
Electronic Manufacturing Services–1.27%
| | | | |
Flextronics International Ltd. (Singapore)(b) | | | 655,408 | | | | 3,709,609 | |
| |
Food Distributors–1.77%
| | | | |
| Sysco Corp. | | | 176,752 | | | | 5,184,136 | |
| |
Food Retail–3.28%
| | | | |
| Safeway Inc. | | | 456,214 | | | | 9,598,743 | |
| |
Health Care Facilities–4.50%
| | | | |
Brookdale Senior Living Inc.(b) | | | 387,091 | | | | 6,731,512 | |
| |
HealthSouth Corp.(b) | | | 365,546 | | | | 6,459,198 | |
| |
| | | | | | | | 13,190,710 | |
| |
Heavy Electrical Equipment–2.41%
| | | | |
Babcock & Wilcox Co. (The)(b) | | | 292,388 | | | | 7,058,246 | |
| |
Home Furnishings–2.80%
| | | | |
Mohawk Industries, Inc.(b) | | | 136,956 | | | | 8,196,817 | |
| |
Housewares & Specialties–3.35%
| | | | |
| Newell Rubbermaid Inc. | | | 608,194 | | | | 9,822,333 | |
| |
Industrial Machinery–2.89%
| | | | |
| Snap-on Inc. | | | 167,291 | | | | 8,468,270 | |
| |
Insurance Brokers–5.32%
| | | | |
| Marsh & McLennan Cos., Inc. | | | 272,137 | | | | 8,604,972 | |
| |
| Willis Group Holdings PLC (Ireland) | | | 179,928 | | | | 6,981,206 | |
| |
| | | | | | | | 15,586,178 | |
| |
Integrated Oil & Gas–2.01%
| | | | |
| Murphy Oil Corp. | | | 105,714 | | | | 5,892,498 | |
| |
Investment Banking & Brokerage–0.43%
| | | | |
| Charles Schwab Corp. (The) | | | 112,431 | | | | 1,265,973 | |
| |
Life Sciences Tools & Services–0.78%
| | | | |
| PerkinElmer, Inc. | | | 114,238 | | | | 2,284,760 | |
| |
Motorcycle Manufacturers–2.95%
| | | | |
| Harley-Davidson, Inc. | | | 221,987 | | | | 8,628,635 | |
| |
Multi-Utilities–3.74%
| | | | |
| CenterPoint Energy, Inc. | | | 280,861 | | | | 5,642,497 | |
| |
| Wisconsin Energy Corp. | | | 151,776 | | | | 5,306,089 | |
| |
| | | | | | | | 10,948,586 | |
| |
Office Electronics–2.82%
| | | | |
Zebra Technologies Corp.–Class A(b) | | | 231,015 | | | | 8,265,717 | |
| |
Oil & Gas Exploration & Production–2.25%
| | | | |
| Pioneer Natural Resources Co. | | | 73,593 | | | | 6,585,102 | |
| |
Oil & Gas Storage & Transportation–5.35%
| | | | |
| El Paso Corp. | | | 232,922 | | | | 6,188,737 | |
| |
| Williams Cos., Inc. (The) | | | 287,083 | | | | 9,479,481 | |
| |
| | | | | | | | 15,668,218 | |
| |
Packaged Foods & Meats–3.07%
| | | | |
| ConAgra Foods, Inc. | | | 340,048 | | | | 8,977,267 | |
| |
Paper Packaging–2.15%
| | | | |
| Sonoco Products Co. | | | 190,876 | | | | 6,291,273 | |
| |
Personal Products–1.18%
| | | | |
| Avon Products, Inc. | | | 197,665 | | | | 3,453,208 | |
| |
Property & Casualty Insurance–2.80%
| | | | |
| ACE Ltd. (Switzerland) | | | 116,775 | | | | 8,188,263 | |
| |
Regional Banks–4.12%
| | | | |
| BB&T Corp. | | | 247,764 | | | | 6,236,220 | |
| |
| Wintrust Financial Corp. | | | 208,255 | | | | 5,841,553 | |
| |
| | | | | | | | 12,077,773 | |
| |
Restaurants–2.20%
| | | | |
| Darden Restaurants, Inc. | | | 141,424 | | | | 6,446,106 | |
| |
Retail REIT’s–1.57%
| | | | |
| Weingarten Realty Investors | | | 210,500 | | | | 4,593,110 | |
| |
Specialty Chemicals–5.80%
| | | | |
| Valspar Corp. (The) | | | 197,730 | | | | 7,705,538 | |
| |
W.R. Grace & Co.(b) | | | 202,332 | | | | 9,291,086 | |
| |
| | | | | | | | 16,996,624 | |
| |
| | | | | | | | | |
| | | | | | | | | |
See accompanying Notes to Financial Statements which are an integral part of the financial statements.
Invesco Van Kampen V.I. Mid Cap Value Fund
| | | | | | | | | |
| | | Shares | | Value |
| |
Specialty Stores–2.04%
| | | | |
| Staples, Inc. | | | 429,616 | | | $ | 5,967,366 | |
| |
Systems Software–0.75%
| | | | |
BMC Software, Inc.(b) | | | 67,285 | | | | 2,205,602 | |
| |
Trucking–0.79%
| | | | |
Swift Transportation Co.(b) | | | 280,319 | | | | 2,309,829 | |
| |
| Total Common Stocks & Other Equity Interests (Cost $246,162,461) | | | | | | | 267,418,898 | |
| |
Preferred Stocks–0.85%
|
Health Care Facilities–0.85%
| | | | |
| HealthSouth Corp., Series A, $65.00 Conv. Pfd. (Cost $2,375,148) | | | 2,851 | | | | 2,502,465 | |
| |
Money Market Funds–8.54%
|
Liquid Assets Portfolio–Institutional Class(c) | | | 12,499,280 | | | | 12,499,280 | |
| |
Premier Portfolio–Institutional Class(c) | | | 12,499,279 | | | | 12,499,279 | |
| |
| Total Money Market Funds (Cost $24,998,559) | | | | | | | 24,998,559 | |
| |
| TOTAL INVESTMENTS–100.71% (Cost $273,536,168) | | | | | | | 294,919,922 | |
| |
| OTHER ASSETS LESS LIABILITIES–(0.71)% | | | | | | | (2,068,529 | ) |
| |
| NET ASSETS–100.00% | | | | | | $ | 292,851,393 | |
| |
Investment Abbreviations:
| | | |
| Conv. | | – Convertible |
| Pfd. | | – Preferred |
| REIT | | – Real Estate Investment Trust |
Notes to Schedule of Investments:
| | |
| (a) | | Industry and/or sector classifications used in this report are generally according to the Global Industry Classification Standard, which was developed by and is the exclusive property and a service mark of MSCI Inc. and Standard & Poor’s. |
| (b) | | Non-income producing security. |
| (c) | | The money market fund and the Fund are affiliated by having the same investment adviser. |
See accompanying Notes to Financial Statements which are an integral part of the financial statements.
Invesco Van Kampen V.I. Mid Cap Value Fund
Statement of Assets and Liabilities
December 31, 2011
| | | | | |
Assets:
|
| Investments, at value (Cost $248,537,609) | | $ | 269,921,363 | |
| |
| Investments in affiliated money market funds, at value and cost | | | 24,998,559 | |
| |
| Total investments, at value (Cost $273,536,168) | | | 294,919,922 | |
| |
| Receivable for: | | | | |
| Fund shares sold | | | 261,091 | |
| |
| Dividends | | | 394,942 | |
| |
| Fund expenses absorbed | | | 58,650 | |
| |
| Investment for trustee deferred compensation and retirement plans | | | 6,340 | |
| |
| Total assets | | | 295,640,945 | |
| |
Liabilities:
|
| Payable for: | | | | |
| Investments purchased | | | 436,695 | |
| |
| Fund shares reacquired | | | 1,743,404 | |
| |
| Accrued fees to affiliates | | | 559,173 | |
| |
| Accrued other operating expenses | | | 34,730 | |
| |
| Trustee deferred compensation and retirement plans | | | 15,550 | |
| |
| Total liabilities | | | 2,789,552 | |
| |
| Net assets applicable to shares outstanding | | $ | 292,851,393 | |
| |
Net assets consist of:
|
| Shares of beneficial interest | | $ | 304,720,060 | |
| |
| Undistributed net investment income | | | 2,221,986 | |
| |
| Undistributed net realized gain (loss) | | | (35,474,407 | ) |
| |
| Unrealized appreciation | | | 21,383,754 | |
| |
| | | $ | 292,851,393 | |
| |
Net Assets:
|
| Series I | | $ | 129,657,839 | |
| |
| Series II | | $ | 163,193,554 | |
| |
Shares outstanding, $0.001 par value per share, with an unlimited number of shares authorized:
|
| Series I | | | 10,122,503 | |
| |
| Series II | | | 12,813,562 | |
| |
| Series I: | | | | |
| Net asset value per share | | $ | 12.81 | |
| |
| Series II: | | | | |
| Net asset value per share | | $ | 12.74 | |
| |
Statement of Operations
For the year ended December 31, 2011
| | | | | |
Investment income:
|
| Dividends | | $ | 5,316,000 | |
| |
| Dividends from affiliated money market funds (includes securities lending income of $840) | | | 21,453 | |
| |
| Total investment income | | | 5,337,453 | |
| |
Expenses:
|
| Advisory fees | | | 2,188,533 | |
| |
| Administrative services fees | | | 627,203 | |
| |
| Custodian fees | | | 11,444 | |
| |
| Distribution fees — Series II | | | 395,145 | |
| |
| Transfer agent fees | | | 17,349 | |
| |
| Trustees’ and officers’ fees and benefits | | | 29,463 | |
| |
| Other | | | 61,201 | |
| |
| Total expenses | | | 3,330,338 | |
| |
| Less: Fees waived | | | (263,131 | ) |
| |
| Net expenses | | | 3,067,207 | |
| |
| Net investment income | | | 2,270,246 | |
| |
Realized and unrealized gain (loss) from:
|
| Net realized gain from: | | | | |
| Investment securities (includes net gains from securities sold to affiliates of $242,971) | | | 18,429,421 | |
| |
| Option contracts written | | | 235,366 | |
| |
| | | | 18,664,787 | |
| |
| Change in net unrealized appreciation (depreciation) of: | | | | |
| Investment securities | | | (17,445,006 | ) |
| |
| Option contracts written | | | 24,255 | |
| |
| | | | (17,420,751 | ) |
| |
| Net realized and unrealized gain | | | 1,244,036 | |
| |
| Net increase in net assets resulting from operations | | $ | 3,514,282 | |
| |
See accompanying Notes to Financial Statements which are an integral part of the financial statements.
Invesco Van Kampen V.I. Mid Cap Value Fund
Statement of Changes in Net Assets
For the years ended December 31, 2011 and 2010
| | | | | | | | | |
| | | 2011 | | 2010 |
| |
Operations:
|
| Net investment income | | $ | 2,270,246 | | | $ | 1,977,012 | |
| |
| Net realized gain | | | 18,664,787 | | | | 15,581,654 | |
| |
| Change in net unrealized appreciation (depreciation) | | | (17,420,751 | ) | | | 42,000,250 | |
| |
| Net increase in net assets resulting from operations | | | 3,514,282 | | | | 59,558,916 | |
| |
Distributions to shareholders from net investment income:
|
| Series I | | | (979,194 | ) | | | (1,468,515 | ) |
| |
| Series II | | | (992,806 | ) | | | (1,117,364 | ) |
| |
| Total distributions from net investment income | | | (1,972,000 | ) | | | (2,585,879 | ) |
| |
Share transactions–net:
|
| Series I | | | (33,633,456 | ) | | | (26,790,802 | ) |
| |
| Series II | | | 10,486,103 | | | | 4,375,683 | |
| |
| Net increase (decrease) in net assets resulting from share transactions | | | (23,147,353 | ) | | | (22,415,119 | ) |
| |
| Net increase (decrease) in net assets | | | (21,605,071 | ) | | | 34,557,918 | |
| |
Net assets:
|
| Beginning of year | | | 314,456,464 | | | | 279,898,546 | |
| |
| End of year (includes undistributed net investment income of $2,221,986 and $1,955,705, respectively) | | $ | 292,851,393 | | | $ | 314,456,464 | |
| |
Notes to Financial Statements
December 31, 2011
NOTE 1—Significant Accounting Policies
Invesco Van Kampen V.I. Mid Cap Value Fund (the “Fund”) is a series portfolio of AIM Variable Insurance Funds (Invesco Variable Insurance Funds) (the “Trust”). The Trust is a Delaware statutory trust registered under the Investment Company Act of 1940, as amended (the “1940 Act”), as an open-end series management investment company consisting of twenty-eight separate portfolios, (each constituting a “Fund”). The assets, liabilities and operations of each portfolio are accounted for separately. Information presented in these financial statements pertains only to the Fund. Matters affecting each Fund or class will be voted on exclusively by the shareholders of such Fund or class. Current Securities and Exchange Commission (“SEC”) guidance, however, requires participating insurance companies offering separate accounts to vote shares proportionally in accordance with the instructions of the contract owners whose investments are funded by shares of each Fund or class.
The Fund’s investment objective is above-average total return over a market cycle of three to five years by investing in common stocks and other equity securities.
The Fund currently offers two classes of shares, Series I and Series II, both of which are offered to insurance company separate accounts funding variable annuity contracts and variable life insurance policies (“variable products”).
The following is a summary of the significant accounting policies followed by the Fund in the preparation of its financial statements.
| | |
| A. | | Security Valuations — Securities, including restricted securities, are valued according to the following policy. |
| | A security listed or traded on an exchange (except convertible bonds) is valued at its last sales price or official closing price as of the close of the customary trading session on the exchange where the security is principally traded, or lacking any sales or official closing price on a particular day, the security may be valued at the closing bid price on that day. Securities traded in the over-the-counter market are valued based on prices furnished by independent pricing services or market makers. When such securities are valued by an independent pricing service they may be considered fair valued. Futures contracts are valued at the final settlement price set by an exchange on which they are principally traded. Listed options are valued at the mean between the last bid and ask prices from the exchange on which they are principally traded. Options not listed on an exchange are valued by an independent source at the mean between the last bid and ask prices. For purposes of determining net asset value per share, futures and option contracts generally are valued 15 minutes after the close of the customary trading session of the New York Stock Exchange (“NYSE”). |
| | Investments in open-end and closed-end registered investment companies that do not trade on an exchange are valued at the end of day net asset value per share. Investments in open-end and closed-end registered investment companies that trade on an exchange are valued at the last sales price or official closing price as of the close of the customary trading session on the exchange where the security is principally traded. |
Invesco Van Kampen V.I. Mid Cap Value Fund
| | |
| | Debt obligations (including convertible bonds) and unlisted equities are fair valued using an evaluated quote provided by an independent pricing service. Evaluated quotes provided by the pricing service may be determined without exclusive reliance on quoted prices, and may reflect appropriate factors such as institution-size trading in similar groups of securities, developments related to specific securities, dividend rate, yield, quality, type of issue, coupon rate, maturity, individual trading characteristics and other market data. Debt securities are subject to interest rate and credit risks. In addition, all debt securities involve some risk of default with respect to interest and/or principal payments. |
| | Foreign securities (including foreign exchange contracts) are converted into U.S. dollar amounts using the applicable exchange rates as of the close of the NYSE. If market quotations are available and reliable for foreign exchange traded equity securities, the securities will be valued at the market quotations. Because trading hours for certain foreign securities end before the close of the NYSE, closing market quotations may become unreliable. If between the time trading ends on a particular security and the close of the customary trading session on the NYSE, events occur that are significant and make the closing price unreliable, the Fund may fair value the security. If the event is likely to have affected the closing price of the security, the security will be valued at fair value in good faith using procedures approved by the Board of Trustees. Adjustments to closing prices to reflect fair value may also be based on a screening process of an independent pricing service to indicate the degree of certainty, based on historical data, that the closing price in the principal market where a foreign security trade is not the current value as of the close of the NYSE. Foreign securities meeting the approved degree of certainty that the price is not reflective of current value will be priced at the indication of fair value from the independent pricing service. Multiple factors may be considered by the independent pricing service in determining adjustments to reflect fair value and may include information relating to sector indices, American Depositary Receipts and domestic and foreign index futures. Foreign securities may have additional risks including exchange rate changes, potential for sharply devalued currencies and high inflation, political and economic upheaval, the relative lack of issuer information, relatively low market liquidity and the potential lack of strict financial and accounting controls and standards. |
| | Securities for which market prices are not provided by any of the above methods may be valued based upon quotes furnished by independent sources. The last bid price may be used to value equity securities. The mean between the last bid and asked prices is used to value debt obligations, including Corporate Loans. |
| | Securities for which market quotations are not readily available or are unreliable are valued at fair value as determined in good faith by or under the supervision of the Trust’s officers following procedures approved by the Board of Trustees. Issuer specific events, market trends, bid/ask quotes of brokers and information providers and other market data may be reviewed in the course of making a good faith determination of a security’s fair value. |
| | Valuations change in response to many factors including the historical and prospective earnings of the issuer, the value of the issuer’s assets, general economic conditions, interest rates, investor perceptions and market liquidity. Because of the inherent uncertainties of valuation, the values reflected in the financial statements may materially differ from the value received upon actual sale of those investments. |
| B. | | Securities Transactions and Investment Income — Securities transactions are accounted for on a trade date basis. Realized gains or losses on sales are computed on the basis of specific identification of the securities sold. Interest income is recorded on the accrual basis from settlement date. Dividend income (net of withholding tax, if any) is recorded on the ex-dividend date. |
| | The Fund may periodically participate in litigation related to Fund investments. As such, the Fund may receive proceeds from litigation settlements. Any proceeds received are included in the Statement of Operations as realized gain (loss) for investments no longer held and as unrealized gain (loss) for investments still held. |
| | Brokerage commissions and mark ups are considered transaction costs and are recorded as an increase to the cost basis of securities purchased and/or a reduction of proceeds on a sale of securities. Such transaction costs are included in the determination of net realized and unrealized gain (loss) from investment securities reported in the Statement of Operations and the Statement of Changes in Net Assets and the net realized and unrealized gains (losses) on securities per share in the Financial Highlights. Transaction costs are included in the calculation of the Fund’s net asset value and, accordingly, they reduce the Fund’s total returns. These transaction costs are not considered operating expenses and are not reflected in net investment income reported in the Statement of Operations and Statement of Changes in Net Assets, or the net investment income per share and ratios of expenses and net investment income reported in the Financial Highlights, nor are they limited by any expense limitation arrangements between the Fund and the investment adviser. |
| | The Fund allocates income and realized and unrealized capital gains and losses to a class based on the relative net assets of each class. |
| C. | | Country Determination — For the purposes of making investment selection decisions and presentation in the Schedule of Investments, the investment adviser may determine the country in which an issuer is located and/or credit risk exposure based on various factors. These factors include the laws of the country under which the issuer is organized, where the issuer maintains a principal office, the country in which the issuer derives 50% or more of its total revenues and the country that has the primary market for the issuer’s securities, as well as other criteria. Among the other criteria that may be evaluated for making this determination are the country in which the issuer maintains 50% or more of its assets, the type of security, financial guarantees and enhancements, the nature of the collateral and the sponsor organization. Country of issuer and/or credit risk exposure has been determined to be the United States of America, unless otherwise noted. |
| D. | | Distributions — Distributions from income and net realized capital gain, if any, are generally paid to separate accounts of participating insurance companies annually and recorded on ex-dividend date. |
| E. | | Federal Income Taxes — The Fund intends to comply with the requirements of Subchapter M of the Internal Revenue Code necessary to qualify as a regulated investment company and to distribute substantially all of the Fund’s taxable earnings to shareholders. As such, the Fund will not be subject to federal income taxes on otherwise taxable income (including net realized capital gain) that is distributed to shareholders. Therefore, no provision for federal income taxes is recorded in the financial statements. |
| | The Fund files tax returns in the U.S. Federal jurisdiction and certain other jurisdictions. Generally, the Fund is subject to examinations by such taxing authorities for up to three years after the filing of the return for the tax period. |
| F. | | Expenses — Fees provided for under the Rule 12b-1 plan of a particular class of the Fund and which are directly attributable to that class are charged to the operations of such class. All other expenses are allocated among the classes based on relative net assets. |
Invesco Van Kampen V.I. Mid Cap Value Fund
| | |
| G. | | Accounting Estimates — The preparation of financial statements in conformity with accounting principles generally accepted in the United States of America (“GAAP”) requires management to make estimates and assumptions that affect the reported amounts of assets and liabilities at the date of the financial statements and the reported amounts of revenues and expenses during the reporting period including estimates and assumptions related to taxation. Actual results could differ from those estimates by a significant amount. In addition, the Fund monitors for material events or transactions that may occur or become known after the period-end date and before the date the financial statements are released to print. |
| H. | | Indemnifications — Under the Trust’s organizational documents, each Trustee, officer, employee or other agent of the Trust is indemnified against certain liabilities that may arise out of performance of their duties to the Fund. Additionally, in the normal course of business, the Fund enters into contracts, including the Fund’s servicing agreements that contain a variety of indemnification clauses. The Fund’s maximum exposure under these arrangements is unknown as this would involve future claims that may be made against the Fund that have not yet occurred. The risk of material loss as a result of such indemnification claims is considered remote. |
| I. | | Securities Lending — The Fund may lend portfolio securities having a market value up to one-third of the Fund’s total assets. Such loans are secured by collateral equal to no less than the market value of the loaned securities determined daily by the securities lending provider. Such collateral will be cash or debt securities issued or guaranteed by the U.S. Government or any of its sponsored agencies. Cash collateral received in connection with these loans is invested in short-term money market instruments or affiliated money market funds and is shown as such on the Schedule of Investments. It is the Fund’s policy to obtain additional collateral from or return excess collateral to the borrower by the end of the next business day, following the valuation date of the securities loaned. Therefore, the value of the collateral held may be temporarily less than the value of the securities on loan. Lending securities entails a risk of loss to the Fund if and to the extent that the market value of the securities loaned were to increase and the borrower did not increase the collateral accordingly, and the borrower fails to return the securities. Upon the failure of the borrower to return the securities, collateral may be liquidated and the securities may be purchased on the open market to replace the loaned securities. The Fund could experience delays and costs in gaining access to the collateral. The Fund bears the risk of any deficiency in the amount of the collateral available for return to the borrower due to any loss on the collateral invested. Dividends received on cash collateral investments for securities lending transactions, which are net of compensation to counterparties, is included in Dividends from affiliated money market funds on the Statement of Operations. The aggregate value of securities out on loan is shown as a footnote on the Statement of Assets and Liabilities, if any. |
| J. | | Call Options Written and Purchased — The Fund may write and/or buy call options. A call option gives the purchaser of such option the right to buy, and the writer the obligation to sell, the underlying security at the stated exercise price during the option period. Options written by the Fund normally will have expiration dates between three and nine months from the date written. The exercise price of a call option may be below, equal to, or above the current market value of the underlying security at the time the option is written. |
| | When the Fund writes a call option, an amount equal to the premium received by the Fund is recorded as an asset and an equivalent liability in the Statement of Assets and Liabilities. The amount of the liability is subsequently “marked-to-market” to reflect the current market value of the option written. If a written call option expires on the stipulated expiration date, or if the Fund enters into a closing purchase transaction, the Fund realizes a gain (or a loss if the closing purchase transaction exceeds the premium received when the option was written) without regard to any unrealized gain or loss on the underlying security, and the liability related to such option is extinguished. If a written option is exercised, the Fund realizes a gain or a loss from the sale of the underlying security and the proceeds of the sale are increased by the premium originally received. Realized and unrealized gains and losses on these contracts are included in the Statement of Operation. A risk in writing a covered call option is that the Fund gives up the opportunity for profit if the market price of the security increases and the option is exercised. |
| | When the Fund buys a call option, an amount equal to the premium paid by the Fund is recorded as an investment on the Statement of Assets and Liabilities. The amount of the investment is subsequently “marked-to-market” to reflect the current value of the option purchased. Realized and unrealized gains and losses on these contracts are included in the Statement of Operations. A risk in buying an option is that the Fund pays a premium whether or not the option is exercised. In addition, there can be no assurance that a liquid secondary market will exist for any option purchased. |
| K. | | Put Options Purchased — The Fund may purchase put options including options on securities indexes and/or futures contracts. By purchasing a put option, the Fund obtains the right (but not the obligation) to sell the option’s underlying instrument at a fixed strike price. In return for this right, the Fund pays an option premium. The option’s underlying instrument may be a security, securities index, or a futures contract. Put options may be used by the Fund to hedge securities it owns by locking in a minimum price at which the Fund can sell. If security prices fall, the put option could be exercised to offset all or a portion of the Fund’s resulting losses. At the same time, because the maximum the Fund has at risk is the cost of the option, purchasing put options does not eliminate the potential for the Fund to profit from an increase in the value of the securities hedged. Realized and unrealized gains and losses on these contracts are included in the Statement of Operations. A risk in buying an option is that the Fund pays a premium whether or not the option is exercised. In addition, there can be no assurance that a liquid secondary market will exist for any option purchased. |
NOTE 2—Advisory Fees and Other Fees Paid to Affiliates
The Trust has entered into a master investment advisory agreement with Invesco Advisers, Inc. (the “Adviser” or “Invesco”). Under the terms of the investment advisory agreement, the Fund pays an advisory fee to the Adviser based on the annual rate of the Fund’s average daily net assets as follows:
| | | | | |
| Average Daily Net Assets | | Rate |
| |
| First $1 billion | | | 0 | .72% |
| |
| Over $1 billion | | | 0 | .65% |
| |
Under the terms of a master sub-advisory agreement between the Adviser and each of Invesco Asset Management Deutschland GmbH, Invesco Asset Management Limited, Invesco Asset Management (Japan) Limited, Invesco Australia Limited, Invesco Hong Kong Limited, Invesco Senior Secured Management, Inc. and Invesco Canada Ltd. (collectively, the “Affiliated Sub-Advisers”) the Adviser, not the Fund, may pay 40% of the fees paid to the Adviser to any such
Invesco Van Kampen V.I. Mid Cap Value Fund
Affiliated Sub-Adviser(s) that provide discretionary investment management services to the Fund based on the percentage of assets allocated to such Sub-Adviser(s).
The Adviser has contractually agreed, through at least June 30, 2012, to waive advisory fees and/or reimburse expenses of all shares to the extent necessary to limit total annual fund operating expenses after fee waiver and/or expense reimbursement (excluding certain items discussed below) of Series I shares to 1.18% and Series II shares to 1.28% (after 12b-1 fee waivers) of average daily net assets. In determining the Adviser’s obligation to waive advisory fees and/or reimburse expenses, the following expenses are not taken into account, and could cause the total annual fund operating expenses after fee waiver and/or expense reimbursement to exceed the numbers reflected above: (1) interest; (2) taxes; (3) dividend expense on short sales; (4) extraordinary or non-routine items, including litigation expenses; and (5) expenses that the Fund has incurred but did not actually pay because of an expense offset arrangement. Unless the Board of the Trustees and Invesco mutually agree to amend or continue the fee waiver agreement, it will terminate on June 30, 2012.
Further, the Adviser has contractually agreed, through at least June 30, 2012, to waive the advisory fee payable by the Fund in an amount equal to 100% of the net advisory fees the Adviser receives from the affiliated money market funds on investments by the Fund of uninvested cash in such affiliated money market funds.
For the year ended December 31, 2011, the Adviser waived advisory fees of $26,056.
The Trust has entered into a master administrative services agreement with Invesco pursuant to which the Fund has agreed to pay Invesco a fee for costs incurred in providing accounting services and fund administrative services to the Fund and to reimburse Invesco for administrative services fees paid to insurance companies that have agreed to provide services to the participants of separate accounts. These administrative services provided by the insurance companies may include, among other things: the printing of prospectuses, financial reports and proxy statements and the delivery of the same to existing participants; the maintenance of master accounts; the facilitation of purchases and redemptions requested by the participants; and the servicing of participants’ accounts. Pursuant to such agreement, for the year ended December 31, 2011, Invesco was paid $79,911 for accounting and fund administrative services and reimbursed $547,292 for services provided by insurance companies.
The Trust has entered into a transfer agency and service agreement with Invesco Investment Services, Inc. (“IIS”) pursuant to which the Fund has agreed to pay IIS a fee for providing transfer agency and shareholder services to the Fund and reimburse IIS for certain expenses incurred by IIS in the course of providing such services. For the year ended December 31, 2011, expenses incurred under the agreement are shown in the Statement of Operations as transfer agent fees.
The Trust has entered into a master distribution agreement with IDI to serve as the distributor for the Fund. The Trust has adopted a plan pursuant to Rule 12b-1 under the 1940 Act with respect to the Fund’s Series II shares (the “Plan”). The Fund, pursuant to the Plan, pays IDI compensation at the annual rate of 0.25% of the Fund’s average daily net assets of Series II shares. Of the Plan payments, up to 0.25% of the average daily net assets of the Series II shares may be paid to insurance companies who furnish continuing personal shareholder services to customers who purchase and own Series II shares of the Fund. IDI has contractually agreed to waiver 0.15% of Rule 12b-1 plan fees on Series II shares through at least June 30, 2012. 12b-1 fees before fee waivers incurred under the Plan are detailed in the Statement of Operations of distribution fees. For the year ended December 31, 2011, 12b-1 fees incurred for Series II shares were $158,070 after fee waivers of $237,075.
Certain officers and trustees of the Trust are officers and directors of the Adviser, IIS and/or IDI.
NOTE 3—Additional Valuation Information
GAAP defines fair value as the price that would be received to sell an asset or paid to transfer a liability in an orderly transaction between market participants at the measurement date, under current market conditions. GAAP establishes a hierarchy that prioritizes the inputs to valuation methods giving the highest priority to readily available unadjusted quoted prices in an active market for identical assets (Level 1) and the lowest priority to significant unobservable inputs (Level 3) generally when market prices are not readily available or are unreliable. Based on the valuation inputs, the securities or other investments are tiered into one of three levels. Changes in valuation methods may result in transfers in or out of an investment’s assigned level:
| | |
| | Level 1 — | Prices are determined using quoted prices in an active market for identical assets. |
| | Level 2 — | Prices are determined using other significant observable inputs. Observable inputs are inputs that other market participants may use in pricing a security. These may include quoted prices for similar securities, interest rates, prepayment speeds, credit risk, yield curves, loss severities, default rates, discount rates, volatilities and others. |
| | Level 3 — | Prices are determined using significant unobservable inputs. In situations where quoted prices or observable inputs are unavailable (for example, when there is little or no market activity for an investment at the end of the period), unobservable inputs may be used. Unobservable inputs reflect the Fund’s own assumptions about the factors market participants would use in determining fair value of the securities or instruments and would be based on the best available information. |
The following is a summary of the tiered valuation input levels, as of December 31, 2011. The level assigned to the securities valuations may not be an indication of the risk or liquidity associated with investing in those securities. Because of the inherent uncertainties of valuation, the values reflected in the financial statements may materially differ from the value received upon actual sale of those investments.
During the year ended December 31, 2011, there were no significant transfers between investment levels.
| | | | | | | | | | | | | | | | | |
| | | Level 1 | | Level 2 | | Level 3 | | Total |
| |
| Equity Securities | | $ | 292,417,457 | | | $ | 2,502,465 | | | $ | — | | | $ | 294,919,922 | |
| |
Invesco Van Kampen V.I. Mid Cap Value Fund
NOTE 4—Derivative Investments
Effect of Derivative Instruments for the year ended December 31, 2011
The table below summarizes the gains on derivative instruments, detailed by primary risk exposure, recognized in earnings during the period:
| | | | | |
| | | Location of Gain on
|
| | | Statement of Operations |
| | | Options* |
| |
| Realized Gain | | | | |
| Equity Risk | | $ | 235,366 | |
| |
| Change in Unrealized Appreciation | | | | |
| Equity Risk | | | 24,255 | |
| |
| Total | | $ | 259,621 | |
| |
| |
| * | The average notional value of options outstanding during the period was $136,257. |
| | | | | | | | | |
| Transactions During the Period |
| | | Call Option Contracts |
| | | Number of
| | Premiums
|
| | | Contracts | | Received |
| |
| Beginning of period | | | 215 | | | $ | 67,120 | |
| |
| Written | | | 4,525 | | | | 763,280 | |
| |
| Closed | | | (3,825 | ) | | | (665,848 | ) |
| |
| Expired | | | (915 | ) | | | (164,552 | ) |
| |
| End of period | | | — | | | $ | — | |
| |
NOTE 5—Security Transactions with Affiliated Funds
The Fund is permitted to purchase or sell securities from or to certain other Invesco Funds under specified conditions outlined in procedures adopted by the Board of Trustees of the Trust. The procedures have been designed to ensure that any purchase or sale of securities by the Fund from or to another fund or portfolio that is or could be considered an affiliate by virtue of having a common investment adviser (or affiliated investment advisers), common Trustees and/or common officers complies with Rule 17a-7 of the 1940 Act. Further, as defined under the procedures, each transaction is effected at the current market price. Pursuant to these procedures, for the year ended December 31, 2011, the Fund engaged in securities purchases of $343,989 and securities sales of $1,335,213, which resulted in net realized gains of $242,971.
NOTE 6—Trustees’ and Officers’ Fees and Benefits
“Trustees’ and Officers’ Fees and Benefits” include amounts accrued by the Fund to pay remuneration to certain Trustees and Officers of the Fund. Trustees have the option to defer compensation payable by the Fund, and “Trustees’ and Officers’ Fees and Benefits” also include amounts accrued by the Fund to fund such deferred compensation amounts. Those Trustees who defer compensation have the option to select various Invesco Funds in which their deferral accounts shall be deemed to be invested. Finally, certain current Trustees are eligible to participate in a retirement plan that provides for benefits to be paid upon retirement to Trustees over a period of time based on the number of years of service. The Fund may have certain former Trustees who also participate in a retirement plan and receive benefits under such plan. “Trustees’ and Officers’ Fees and Benefits” include amounts accrued by the Fund to fund such retirement benefits. Obligations under the deferred compensation and retirement plans represent unsecured claims against the general assets of the Fund.
During the year ended December 31, 2011, the Fund paid legal fees of $1,506 for services rendered by Kramer, Levin, Naftalis & Frankel LLP as counsel to the Independent Trustees. A partner of that firm is a Trustee of the Trust.
NOTE 7—Cash Balances
The Fund is permitted to temporarily carry a negative or overdrawn balance in its account with State Street Bank and Trust Company, the custodian bank. To compensate the custodian bank for such overdrafts, the overdrawn Fund may either (1) leave funds as a compensating balance in the account so the custodian bank can be compensated by earning the additional interest; or (2) compensate by paying the custodian bank at a rate agreed upon by the custodian bank and Invesco, not to exceed the contractually agreed upon rate.
NOTE 8—Distributions to Shareholders and Tax Components of Net Assets
Tax Character of Distributions to Shareholders Paid During the Years Ended December 31, 2011 and 2010:
| | | | | | | | | |
| | | 2011 | | 2010 |
| |
| Ordinary income | | $ | 1,972,000 | | | $ | 2,585,879 | |
| |
Invesco Van Kampen V.I. Mid Cap Value Fund
Tax Components of Net Assets at Period-End:
| | | | | |
| | | 2011 |
| |
| Undistributed ordinary income | | $ | 2,237,334 | |
| |
| Net unrealized appreciation — investments | | | 20,407,991 | |
| |
| Temporary book/tax differences | | | (15,348 | ) |
| |
| Capital loss carryforward | | | (34,498,644 | ) |
| |
| Shares of beneficial interest | | | 304,720,060 | |
| |
| Total net assets | | $ | 292,851,393 | |
| |
The difference between book-basis and tax-basis unrealized appreciation is due to differences in the timing of recognition of gains and losses on investments for tax and book purposes. The Fund’s net unrealized appreciation difference is attributable primarily to wash sales and straddle loss deferrals.
The temporary book/tax differences are a result of timing differences between book and tax recognition of income and/or expenses. The Fund’s temporary book/tax differences are the result of the trustee deferral of compensation and retirement plan benefits.
Capital loss carryforward is calculated and reported as of a specific date. Results of transactions and other activity after that date may affect the amount of capital loss carryforward actually available for the Fund to utilize. The Regulated Investment Company Modernization Act of 2010 (the “Act”) eliminated the eight-year carryover period for capital losses that arise in taxable years beginning after its enactment date of December 22, 2010. Consequently, these capital losses can be carried forward for an unlimited period. However, capital losses with an expiration period may not be used to offset capital gains until all net capital losses without an expiration date have been utilized. Additionally, post-enactment capital loss carryovers will retain their character as either short-term or long-term capital losses instead of as short-term capital losses as under prior law. The ability to utilize capital loss carryforward in the future may be limited under the Internal Revenue Code and related regulations based on the results of future transactions.
The Fund utilized $18,721,035 of capital loss carryforward in the current period to offset net realized capital gain for federal income tax purposes. The Fund has a capital loss carryforward as of December 31, 2011, which expires as follows:
| | | | | | | | | | | | | |
| Capital Loss Carryforward |
| Expiration | | Short-Term | | Long-Term | | Total |
| |
| December 31, 2017 | | $ | 34,498,644 | | | $ | — | | | $ | 34,498,644 | |
| |
| |
| * | Capital loss carryforward as of the date listed above is reduced for limitations, if any, to the extent required by the Internal Revenue Code. |
NOTE 9—Investment Securities
The aggregate amount of investment securities (other than short-term securities, U.S. Treasury obligations and money market funds, if any) purchased and sold by the Fund during the year ended December 31, 2011 was $87,718,714 and $117,801,486, respectively. Cost of investments on a tax basis includes the adjustments for financial reporting purposes as of the most recently completed Federal income tax reporting period-end.
| | | | | |
| Unrealized Appreciation (Depreciation) of Investment Securities on a Tax Basis |
| |
| Aggregate unrealized appreciation of investment securities | | $ | 38,283,654 | |
| |
| Aggregate unrealized (depreciation) of investment securities | | | (17,875,663 | ) |
| |
| Net unrealized appreciation of investment securities | | $ | 20,407,991 | |
| |
| Cost of investments for tax purposes is $274,511,931. |
NOTE 10—Reclassification of Permanent Differences
Primarily as a result of differing book/tax treatment of real estate investment trust distributions, on December 31, 2011, undistributed net investment income was decreased by $31,965 and undistributed net realized gain (loss) was increased by $31,965. The reclassification had no effect on the net assets of the Fund.
Invesco Van Kampen V.I. Mid Cap Value Fund
NOTE 11—Share Information
| | | | | | | | | | | | | | | | | |
| | | Summary of Share Activity |
| |
| | | Years ended December 31, |
| | | 2011(a) | | 2010 |
| | | Shares | | Amount | | Shares | | Amount |
| |
| Sold: | | | | | | | | | | | | | | | | |
| Series I | | | 487,789 | | | $ | 6,244,179 | | | | 735,988 | | | $ | 8,422,816 | |
| |
| Series II | | | 3,734,030 | | | | 47,368,062 | | | | 2,861,100 | | | | 32,148,812 | |
| |
| Issued as reinvestment of dividends: | | | | | | | | | | | | | | | | |
| Series I | | | 89,752 | | | | 979,194 | | | | 130,767 | | | | 1,468,515 | |
| |
| Series II | | | 91,503 | | | | 992,806 | | | | 100,033 | | | | 1,117,364 | |
| |
| Reacquired: | | | | | | | | | | | | | | | | |
| Series I | | | (3,155,419 | ) | | | (40,856,829 | ) | | | (3,211,388 | ) | | | (36,682,133 | ) |
| |
| Series II | | | (2,959,998 | ) | | | (37,874,765 | ) | | | (2,538,804 | ) | | | (28,890,493 | ) |
| |
| Net increase (decrease) in share activity | | | (1,712,343 | ) | | $ | (23,147,353 | ) | | | (1,922,304 | ) | | $ | (22,415,119 | ) |
| |
| | |
| (a) | | There are entities that are record owners of more than 5% of the outstanding shares of the Fund and in the aggregate own 75% of the outstanding shares of the Fund. The Fund and the Fund’s principal underwriter or adviser, are parties to participation agreements with these entities whereby these entities sell units of interest in separate accounts funding variable products that are invested in the Fund. The Fund, Invesco and/or Invesco affiliates may make payments to these entities, which are considered to be related to the Fund, for providing services to the Fund, Invesco and/or Invesco affiliates including, but not limited to, services such as, securities brokerage, third party record keeping and account servicing and administrative services. The Fund has no knowledge as to whether all or any portion of the shares owned of record by these entities are also owned beneficially. |
NOTE 12—Financial Highlights
The following schedule presents financial highlights for a share of the Fund outstanding throughout the periods indicated.
| | | | | | | | | | | | | | | | | | | | | | | | | | | | | | | | | | | | | | | | | | | | | | | | | | | | | | | | | |
| | | | | | | | | | | | | | | | | | | | | | | Ratio of
| | Ratio of
| | | | |
| | | | | | | Net gains
| | | | | | | | | | | | | | | | expenses
| | expenses
| | | | |
| | | | | | | (losses)
| | | | | | | | | | | | | | | | to average
| | to average net
| | Ratio of net
| | |
| | | Net asset
| | | | on securities
| | | | Dividends
| | Distributions
| | | | | | | | | | net assets
| | assets without
| | investment
| | |
| | | value,
| | Net
| | (both
| | Total from
| | from net
| | from net
| | | | Net asset
| | | | Net assets,
| | with fee waivers
| | fee waivers
| | income
| | |
| | | beginning
| | investment
| | realized and
| | investment
| | investment
| | realized
| | Total
| | value, end
| | Total
| | end of period
| | and/or expenses
| | and/or expenses
| | to average
| | Portfolio
|
| | | of period | | income(a) | | unrealized) | | operations | | income | | gains | | Distributions | | of period | | Return(b) | | (000s omitted) | | absorbed | | absorbed | | net assets | | turnover(c) |
| |
| Series I |
| Year ended 12/31/11 | | $ | 12.79 | | | $ | 0.10 | | | $ | 0.01 | | | $ | 0.11 | | | $ | (0.09 | ) | | $ | — | | | $ | (0.09 | ) | | $ | 12.81 | | | | 1.00 | % | | $ | 129,658 | | | | 0.96 | %(d) | | | 0.97 | %(d) | | | 0.80 | %(d) | | | 30 | % |
| Year ended 12/31/10 | | | 10.56 | | | | 0.08 | | | | 2.25 | | | | 2.33 | | | | (0.10 | ) | | | — | | | | (0.10 | ) | | | 12.79 | | | | 22.24 | | | | 162,472 | | | | 1.02 | | | | 1.03 | | | | 0.72 | | | | 40 | |
| Year ended 12/31/09 | | | 7.69 | | | | 0.10 | | | | 2.88 | | | | 2.98 | | | | (0.11 | ) | | | — | | | | (0.11 | ) | | | 10.56 | | | | 39.21 | | | | 158,853 | | | | 1.02 | | | | 1.02 | | | | 1.12 | | | | 64 | |
| Year ended 12/31/08 | | | 19.11 | | | | 0.13 | | | | (6.43 | ) | | | (6.30 | ) | | | (0.14 | ) | | | (4.98 | ) | | | (5.12 | ) | | | 7.69 | | | | (41.29 | ) | | | 138,914 | | | | 1.01 | | | | 1.01 | | | | 0.95 | | | | 53 | |
| Year ended 12/31/07 | | | 19.74 | | | | 0.13 | | | | 1.53 | | | | 1.66 | | | | (0.14 | ) | | | (2.15 | ) | | | (2.29 | ) | | | 19.11 | | | | 7.84 | | | | 302,575 | | | | 1.01 | | | | 1.01 | | | | 0.62 | | | | 68 | |
| |
| Series II |
| Year ended 12/31/11 | | | 12.72 | | | | 0.09 | | | | 0.01 | | | | 0.10 | | | | (0.08 | ) | | | — | | | | (0.08 | ) | | | 12.74 | | | | 0.91 | | | | 163,194 | | | | 1.06 | (d) | | | 1.22 | (d) | | | 0.70 | (d) | | | 30 | |
| Year ended 12/31/10 | | | 10.50 | | | | 0.07 | | | | 2.25 | | | | 2.32 | | | | (0.10 | ) | | | — | | | | (0.10 | ) | | | 12.72 | | | | 22.18 | | | | 151,985 | | | | 1.12 | | | | 1.32 | | | | 0.62 | | | | 40 | |
| Year ended 12/31/09 | | | 7.64 | | | | 0.09 | | | | 2.87 | | | | 2.96 | | | | (0.10 | ) | | | — | | | | (0.10 | ) | | | 10.50 | | | | 39.16 | | | | 121,046 | | | | 1.12 | | | | 1.37 | | | | 1.01 | | | | 64 | |
| Year ended 12/31/08 | | | 19.04 | | | | 0.11 | | | | (6.41 | ) | | | (6.30 | ) | | | (0.12 | ) | | | (4.98 | ) | | | (5.10 | ) | | | 7.64 | | | | (41.42 | ) | | | 85,258 | | | | 1.11 | | | | 1.36 | | | | 0.89 | | | | 53 | |
| Year ended 12/31/07 | | | 19.68 | | | | 0.11 | | | | 1.52 | | | | 1.63 | | | | (0.12 | ) | | | (2.15 | ) | | | (2.27 | ) | | | 19.04 | | | | 7.74 | | | | 134,886 | | | | 1.11 | | | | 1.36 | | | | 0.54 | | | | 68 | |
| |
| | |
| (a) | | Calculated using average shares outstanding. |
| (b) | | Includes adjustments in accordance with accounting principles generally accepted in the United States of America and as such, the net asset value for financial reporting purposes and the returns based upon those net asset values may differ from the net asset value and returns for shareholder transactions. Total returns are not annualized for periods less than one year, if applicable and do not reflect charges assessed in connection with a variable product, which if included would reduce total returns. |
| (c) | | Portfolio turnover is calculated at the fund level and is not annualized for periods less than one year, if applicable. |
| (d) | | Ratios are based on average daily net assets (000’s omitted) of $145,913 and $158,050 for Series I and Series II shares, respectively. |
Invesco Van Kampen V.I. Mid Cap Value Fund
Report of Independent Registered Public Accounting Firm
To the Board of Trustees of AIM Variable Insurance Funds (Invesco Variable Insurance Funds)
and Shareholders of Invesco Van Kampen V.I. Mid Cap Value Fund:
In our opinion, the accompanying statement of assets and liabilities, including the schedule of investments, and the related statements of operations and of changes in net assets and the financial highlights present fairly, in all material respects, the financial position of Invesco Van Kampen V.I. Mid Cap Value Fund (one of the funds constituting AIM Variable Insurance Funds (Invesco Variable Insurance Funds), hereafter referred to as the “Fund”) at December 31, 2011, the results of its operations for the year then ended, and the changes in its net assets and the financial highlights for each of the two years in the period then ended, in conformity with accounting principles generally accepted in the United States of America. These financial statements and financial highlights (hereafter referred to as “financial statements”) are the responsibility of the Fund’s management; our responsibility is to express an opinion on these financial statements based on our audits. We conducted our audits of these financial statements in accordance with the standards of the Public Company Accounting Oversight Board (United States). Those standards require that we plan and perform the audits to obtain reasonable assurance about whether the financial statements are free of material misstatement. An audit includes examining, on a test basis, evidence supporting the amounts and disclosures in the financial statements, assessing the accounting principles used and significant estimates made by management, and evaluating the overall financial statement presentation. We believe that our audits, which included confirmation of securities at December 31, 2011 by correspondence with the custodian and brokers, provide a reasonable basis for our opinion. The financial highlights of the Fund for the periods ended December 31, 2009 and prior were audited by other independent auditors whose report dated February 19, 2010 expressed an unqualified opinion on those financial statements.
PRICEWATERHOUSECOOPERS LLP
February 14, 2012
Houston, Texas
Invesco Van Kampen V.I. Mid Cap Value Fund
Calculating your ongoing Fund expenses
Example
As a shareholder of the Fund, you incur ongoing costs, including management fees; distribution and/or service fees (12b-1); and other Fund expenses. This example is intended to help you understand your ongoing costs (in dollars) of investing in the Fund and to compare these costs with ongoing costs of investing in other mutual funds. The example is based on an investment of $1,000 invested at the beginning of the period and held for the entire period July 1, 2011 through December 31, 2011.
The actual and hypothetical expenses in the examples below do not represent the effect of any fees or other expenses assessed in connection with a variable product; if they did, the expenses shown would be higher while the ending account values shown would be lower.
Actual expenses
The table below provides information about actual account values and actual expenses. You may use the information in this table, together with the amount you invested, to estimate the expenses that you paid over the period. Simply divide your account value by $1,000 (for example, an $8,600 account value divided by $1,000 = 8.6), then multiply the result by the number in the table under the heading entitled “Actual Expenses Paid During Period” to estimate the expenses you paid on your account during this period.
Hypothetical example for comparison purposes
The table below also provides information about hypothetical account values and hypothetical expenses based on the Fund’s actual expense ratio and an assumed rate of return of 5% per year before expenses, which is not the Fund’s actual return.
The hypothetical account values and expenses may not be used to estimate the actual ending account balance or expenses you paid for the period. You may use this information to compare the ongoing costs of investing in the Fund and other funds. To do so, compare this 5% hypothetical example with the 5% hypothetical examples that appear in the shareholder reports of the other funds.
Please note that the expenses shown in the table are meant to highlight your ongoing costs. Therefore, the hypothetical information is useful in comparing ongoing costs, and will not help you determine the relative total costs of owning different funds.
| | | | | | | | | | | | | | | | | | | | | | | | | | | | | | | |
| | | | | | | | | | Hypothetical
| | | |
| | | | | | | Actual | | | (5% annual return before expenses) | | | |
| | | | Beginning
| | | Ending
| | | Expenses
| | | Ending
| | | Expenses
| | | Annualized
|
| | | | Account Value
| | | Account Value
| | | Paid During
| | | Account Value
| | | Paid During
| | | Expense
|
| Class | | | (07/01/11) | | | (12/31/11)1 | | | Period2 | | | (12/31/11) | | | Period2 | | | Ratio |
| Series I | | | $ | 1,000.00 | | | | $ | 940.10 | | | | $ | 4.30 | | | | $ | 1,020.77 | | | | $ | 4.48 | | | | | 0.88 | % |
| | | | | | | | | | | | | | | | | | | | | | | | | | | | | | | |
| Series II | | | | 1,000.00 | | | | | 940.30 | | | | | 4.79 | | | | | 1,020.27 | | | | | 4.99 | | | | | 0.98 | |
| | | | | | | | | | | | | | | | | | | | | | | | | | | | | | | |
| |
| 1 | The actual ending account value is based on the actual total return of the Fund for the period July 1, 2011 through December 31, 2011, after actual expenses and will differ from the hypothetical ending account value which is based on the Fund’s expense ratio and a hypothetical annual return of 5% before expenses. |
| 2 | Expenses are equal to the Fund’s annualized expense ratio as indicated above multiplied by the average account value over the period, multiplied by 184/365 to reflect the most recent fiscal half year. |
Invesco Van Kampen V.I. Mid Cap Value Fund
Form 1099-DIV, Form 1042-S and other year-end tax information provide shareholders with actual calendar year amounts that should be included in their tax returns. Shareholders should consult their tax advisors.
The following distribution information is being provided as required by the Internal Revenue Code or to meet a specific state’s requirement.
The Fund designates the following amounts or, if subsequently determined to be different, the maximum amount allowable for its fiscal year ended December 31, 2011:
| | | | | |
Federal and State Income Tax | | |
| |
| Corporate Dividends Received Deduction* | | | 100% | |
| | |
| | * | The above percentages are based on ordinary income dividends paid to shareholders during the Fund’s fiscal year. |
Invesco Van Kampen V.I. Mid Cap Value Fund
Trustees and Officers
The address of each trustee and officer is AIM Variable Insurance Funds (Invesco Variable Insurance Funds) (the “Trust”), 11 Greenway Plaza, Suite 2500, Houston, Texas 77046-1173. The trustees serve for the life of the Trust, subject to their earlier death, incapacitation, resignation, retirement or removal as more specifically provided in the Trust’s organizational documents. Each officer serves for a one year term or until their successors are elected and qualified. Column two below includes length of time served with predecessor entities, if any.
| | | | | | | | | |
| | | | | | | Number of Funds
| | |
Name, Year of Birth and
| | Trustee and/
| | Principal Occupation(s)
| | in Fund Complex
| | Other Directorship(s)
|
| Position(s) Held with the Trust | | or Officer Since | | During Past 5 Years | | Overseen by Trustee | | Held by Trustee |
| | | | | | | | | |
| | | | | | | | | |
| | | | | | | | | |
| Interested Persons | | | | | | | | |
| | | | | | | | | |
| | | | | | | | | |
| | | | | | | | | |
Martin L. Flanagan1 — 1960
Trustee | | 2007 | | Executive Director, Chief Executive Officer and President, Invesco Ltd. (ultimate parent of Invesco and a global investment management firm); Advisor to the Board, Invesco Advisers, Inc. (formerly known as Invesco Institutional (N.A.), Inc.); Trustee, The Invesco Funds; Vice Chair, Investment Company Institute; and Member of Executive Board, SMU Cox School of Business
Formerly: Chairman, Invesco Advisers, Inc. (registered investment adviser); Director, Chairman, Chief Executive Officer and President, IVZ Inc. (holding company), INVESCO Group Services, Inc. (service provider) and Invesco North American Holdings, Inc. (holding company); Director, Chief Executive Officer and President, Invesco Holding Company Limited (parent of Invesco and a global investment management firm); Director, Invesco Ltd.; Chairman, Investment Company Institute and President, Co-Chief Executive Officer, Co-President, Chief Operating Officer and Chief Financial Officer, Franklin Resources, Inc. (global investment management organization) | | 140 | | None |
| | | | | | | | | |
| | | | | | | | | |
| | | | | | | | | |
Philip A. Taylor2 — 1954
Trustee, President and Principal Executive Officer | | 2006 | | Head of North American Retail and Senior Managing Director, Invesco Ltd.; Director, Co-Chairman, Co-President and Co-Chief Executive Officer, Invesco Advisers, Inc. (formerly known as Invesco Institutional (N.A.), Inc.) (registered investment adviser); Director, Chairman, Chief Executive Officer and President, Invesco Management Group, Inc. (formerly Invesco Aim Management Group, Inc.) (financial services holding company); Director and President, INVESCO Funds Group, Inc. (registered investment adviser and registered transfer agent); Director and Chairman, Invesco Investment Services, Inc. (formerly known as Invesco Aim Investment Services, Inc.) (registered transfer agent) and IVZ Distributors, Inc. (formerly known as INVESCO Distributors, Inc.) (registered broker dealer); Director, President and Chairman, Invesco Inc. (holding company) and Invesco Canada Holdings Inc. (holding company); Chief Executive Officer, Invesco Corporate Class Inc. (corporate mutual fund company) and Invesco Canada Fund Inc. (corporate mutual fund company); Director, Chairman and Chief Executive Officer, Invesco Canada Ltd. (formerly known as Invesco Trimark Ltd./Invesco Trimark Ltèe) (registered investment adviser and registered transfer agent); Trustee, President and Principal Executive Officer, The Invesco Funds (other than AIM Treasurer’s Series Trust (Invesco Treasurer’s Series Trust) and Short-Term Investments Trust); Trustee and Executive Vice President, The Invesco Funds (AIM Treasurer’s Series Trust (Invesco Treasurer’s Series Trust) and Short-Term Investments Trust only); Director, Invesco Investment Advisers LLC (formerly known as Van Kampen Asset Management); Director, Chief Executive Officer and President, Van Kampen Exchange Corp. | | 140 | | None |
| | | | | | | | | |
| | | | | | | | | |
| | | | | Formerly: Director and Chairman, Van Kampen Investor Services Inc.: Director, Chief Executive Officer and President, 1371 Preferred Inc. (holding company); and Van Kampen Investments Inc.; Director and President, AIM GP Canada Inc. (general partner for limited partnerships); and Van Kampen Advisors, Inc.; Director and Chief Executive Officer, Invesco Trimark Dealer Inc. (registered broker dealer); Director, Invesco Distributors, Inc. (formerly known as Invesco Aim Distributors, Inc.) (registered broker dealer); Manager, Invesco PowerShares Capital Management LLC; Director, Chief Executive Officer and President, Invesco Advisers, Inc.; Director, Chairman, Chief Executive Officer and President, Invesco Aim Capital Management, Inc.; President, Invesco Trimark Dealer Inc. and Invesco Trimark Ltd./Invesco Trimark Ltèe; Director and President, AIM Trimark Corporate Class Inc. and AIM Trimark Canada Fund Inc.; Senior Managing Director, Invesco Holding Company Limited; Trustee and Executive Vice President, Tax-Free Investments Trust; Director and Chairman, Fund Management Company (former registered broker dealer); President and Principal Executive Officer, The Invesco Funds (AIM Treasurer’s Series Trust (Invesco Treasurer’s Series Trust), Short-Term Investments Trust and Tax-Free Investments Trust only); President, AIM Trimark Global Fund Inc. and AIM Trimark Canada Fund Inc. | | | | |
| | | | | | | | | |
| | | | | | | | | |
| | | | | | | | | |
Wayne W. Whalen3 — 1939
Trustee | | 2010 | | Of Counsel, and prior to 2010, partner in the law firm of Skadden, Arps, Slate, Meagher & Flom LLP, legal counsel to funds in the Fund Complex | | 158 | | Director of the Abraham Lincoln Presidential Library Foundation |
| | | | | | | | | |
| | | | | | | | | |
| | | | | | | | | |
| Independent Trustees | | | | | | | | |
| | | | | | | | | |
| | | | | | | | | |
| | | | | | | | | |
Bruce L. Crockett — 1944
Trustee and Chair | | 1993 | | Chairman, Crockett Technology Associates (technology consulting company) | | 140 | | ACE Limited (insurance company); and Investment Company Institute |
| | | | | Formerly: Director, Captaris (unified messaging provider); Director, President and Chief Executive Officer COMSAT Corporation; and Chairman, Board of Governors of INTELSAT (international communications company) | | | | |
| | | | | | | | | |
| |
| 1 | Mr. Flanagan is considered an interested person of the Trust because he is an officer of the adviser to the Trust, and an officer and a director of Invesco Ltd., ultimate parent of the adviser to the Trust. |
| 2 | Mr. Taylor is considered an interested person of the Trust because he is an officer and a director of the adviser to, and a director of the principal underwriter of, the Trust. |
| 3 | Mr. Whalen is considered an “interested person” (within the meaning of Section 2(a)(19) of the 1940 Act) of certain Funds in the Fund Complex by reason of he and his firm currently providing legal services as legal counsel to such Funds in the Fund Complex. |
Invesco Van Kampen V.I. Mid Cap Value Fund
Trustees and Officers—(continued)
The address of each trustee and officer is AIM Variable Insurance Funds (Invesco Variable Insurance Funds) (the “Trust”), 11 Greenway Plaza, Suite 2500, Houston, Texas 77046-1173. The trustees serve for the life of the Trust, subject to their earlier death, incapacitation, resignation, retirement or removal as more specifically provided in the Trust’s organizational documents. Each officer serves for a one year term or until their successors are elected and qualified. Column two below includes length of time served with predecessor entities, if any.
| | | | | | | | | |
| | | | | | | Number of Funds
| | |
Name, Year of Birth and
| | Trustee and/
| | Principal Occupation(s)
| | in Fund Complex
| | Other Directorship(s)
|
| Position(s) Held with the Trust | | or Officer Since | | During Past 5 Years | | Overseen by Trustee | | Held by Trustee |
| | | | | | | | | |
| | | | | | | | | |
| | | | | | | |
Independent Trustees—(continued) | | | | | | |
| | | | | | | | | |
| | | | | | | | | |
| | | | | | | | | |
David C. Arch — 1945
Trustee | | 2010 | | Chairman and Chief Executive Officer of Blistex Inc., a consumer health care products manufacturer. | | 158 | | Member of the Heartland Alliance Advisory Board, a nonprofit organization serving human needs based in Chicago. Board member of the Illinois Manufacturers’ Association. Member of the Board of Visitors, Institute for the Humanities, University of Michigan |
| | | | | | | | | |
| | | | | | | | | |
| | | | | | | | | |
Frank S. Bayley — 1939
Trustee | | 2001 | | Retired
Formerly: Director, Badgley Funds, Inc. (registered investment company) (2 portfolios) and Partner, law firm of Baker & McKenzie
Formerly: Director, Badgley Funds, Inc. (registered investment company) (2 portfolios) and Partner, law firm of Baker & McKenzie | | 140 | | Director and Chairman, C.D. Stimson Company (a real estate investment company) |
| | | | | | | | | |
| | | | | | | | | |
| | | | | | | | | |
James T. Bunch — 1942
Trustee | | 2004 | | Managing Member, Grumman Hill Group LLC (family office private equity management)
Formerly: Founder, Green, Manning & Bunch Ltd. (investment banking firm)(1988-2010); Executive Committee, United States Golf Association; and Director, Policy Studies, Inc. and Van Gilder Insurance Corporation | | 140 | | Vice Chairman, Board of Governors, Western Golf Association/Evans Scholars Foundation and Director, Denver Film Society |
| | | | | | | | | |
| | | | | | | | | |
| | | | | | | | | |
Rodney F. Dammeyer — 1940
Trustee | | 2010 | | President of CAC, LLC, a private company offering capital investment and management advisory services.
Formerly: Prior to January 2004, Director of TeleTech Holdings Inc.; Prior to 2002, Director of Arris Group, Inc.; Prior to 2001, Managing Partner at Equity Group Corporate Investments. Prior to 1995, Vice Chairman of Anixter International. Prior to 1985, experience includes Senior Vice President and Chief Financial Officer of Household International, Inc., Executive Vice President and Chief Financial Officer of Northwest Industries, Inc. and Partner of Arthur Andersen & Co. | | 158 | | Director of Quidel Corporation and Stericycle, Inc. Prior to May 2008, Trustee of The Scripps Research Institute. Prior to February 2008, Director of Ventana Medical Systems, Inc. Prior to April 2007, Director of GATX Corporation. Prior to April 2004, Director of TheraSense, Inc. |
| | | | | | | | | |
| | | | | | | | | |
| | | | | | | | | |
Albert R. Dowden — 1941
Trustee | | 2000 | | Director of a number of public and private business corporations, including the Boss Group, Ltd. (private investment and management); Reich & Tang Funds (5 portfolios) (registered investment company); and Homeowners of America Holding Corporation/ Homeowners of America Insurance Company (property casualty company)
Formerly: Director, Continental Energy Services, LLC (oil and gas pipeline service); Director, CompuDyne Corporation (provider of product and services to the public security market) and Director, Annuity and Life Re (Holdings), Ltd. (reinsurance company); Director, President and Chief Executive Officer, Volvo Group North America, Inc.; Senior Vice President, AB Volvo; Director of various public and private corporations; Chairman, DHJ Media, Inc.; Director Magellan Insurance Company; and Director, The Hertz Corporation, Genmar Corporation (boat manufacturer), National Media Corporation; Advisory Board of Rotary Power International (designer, manufacturer, and seller of rotary power engines); and Chairman, Cortland Trust, Inc. (registered investment company) | | 140 | | Board of Nature’s Sunshine Products, Inc. |
| | | | | | | | | |
| | | | | | | | | |
| | | | | | | | | |
Jack M. Fields — 1952
Trustee | | 1997 | | Chief Executive Officer, Twenty First Century Group, Inc. (government affairs company); and Owner and Chief Executive Officer, Dos Angelos Ranch, L.P. (cattle, hunting, corporate entertainment), Discovery Global Education Fund (non-profit) and Cross Timbers Quail Research Ranch (non-profit)
Formerly: Chief Executive Officer, Texana Timber LP (sustainable forestry company) and member of the U.S. House of Representatives | | 140 | | Administaff |
| | | | | | | | | |
| | | | | | | | | |
| | | | | | | | | |
Carl Frischling — 1937
Trustee | | 1993 | | Partner, law firm of Kramer Levin Naftalis and Frankel LLP | | 140 | | Director, Reich & Tang Funds (16 portfolios) |
| | | | | | | | | |
| | | | | | | | | |
Invesco Van Kampen V.I. Mid Cap Value Fund
Trustees and Officers—(continued)
The address of each trustee and officer is AIM Variable Insurance Funds (Invesco Variable Insurance Funds) (the “Trust”), 11 Greenway Plaza, Suite 2500, Houston, Texas 77046-1173. The trustees serve for the life of the Trust, subject to their earlier death, incapacitation, resignation, retirement or removal as more specifically provided in the Trust’s organizational documents. Each officer serves for a one year term or until their successors are elected and qualified. Column two below includes length of time served with predecessor entities, if any.
| | | | | | | | | |
| | | | | | | Number of Funds
| | |
Name, Year of Birth and
| | Trustee and/
| | Principal Occupation(s)
| | in Fund Complex
| | Other Directorship(s)
|
| Position(s) Held with the Trust | | or Officer Since | | During Past 5 Years | | Overseen by Trustee | | Held by Trustee |
| | | Independent Trustees—(continued) | | | | |
| | | | | | | | | |
| | | | | | | | | |
| | | | | | | | | |
Prema Mathai-Davis — 1950
Trustee | | 1998 | | Retired
Formerly: Chief Executive Officer, YWCA of the U.S.A. | | 140 | | None |
| | | | | | | | | |
| | | | | | | | | |
| | | | | | | | | |
Larry Soll — 1942
Trustee | | 2004 | | Retired
Formerly, Chairman, Chief Executive Officer and President, Synergen Corp. (a biotechnology company) | | 140 | | None |
| | | | | | | | | |
| | | | | | | | | |
| | | | | | | | | |
Hugo F. Sonnenschein — 1940
Trustee | | 2010 | | President Emeritus and Honorary Trustee of the University of Chicago and the Adam Smith Distinguished Service Professor in the Department of Economics at the University of Chicago. Prior to July 2000, President of the University of Chicago. | | 158 | | Trustee of the University of Rochester and a member of its investment committee. Member of the National Academy of Sciences, the American Philosophical Society and a fellow of the American Academy of Arts and Sciences |
| | | | | | | | | |
| | | | | | | | | |
| | | | | | | | | |
| Raymond Stickel, Jr. — 1944 Trustee | | 2005 | | Retired
Formerly: Director, Mainstay VP Series Funds, Inc. (25 portfolios) and Partner, Deloitte & Touche | | 140 | | None |
| | | | | | | | | |
| | | | | | | | | |
| | | | | | | | | |
| Other Officers | | | | | | | | |
| | | | | | | | | |
| | | | | | | | | |
| | | | | | | | | |
Russell C. Burk — 1958
Senior Vice President and Senior Officer | | 2005 | | Senior Vice President and Senior Officer, The Invesco Funds | | N/A | | N/A |
| | | | | | | | | |
| | | | | | | | | |
| | | | | | | | | |
John M. Zerr — 1962
Senior Vice President, Chief Legal Officer and Secretary | | 2006 | | Director, Senior Vice President, Secretary and General Counsel, Invesco Management Group, Inc. (formerly known as Invesco Aim Management Group, Inc.) and Van Kampen Exchange Corp.; Senior Vice President, Invesco Advisers, Inc. (formerly known as Invesco Institutional (N.A.), Inc.) (registered investment adviser); Senior Vice President and Secretary, Invesco Distributors, Inc. (formerly known as Invesco Aim Distributors, Inc.); Director, Vice President and Secretary, Invesco Investment Services, Inc. (formerly known as Invesco Aim Investment Services, Inc.) and IVZ Distributors, Inc. (formerly known as INVESCO Distributors, Inc.); Director and Vice President, INVESCO Funds Group, Inc.; Senior Vice President, Chief Legal Officer and Secretary, The Invesco Funds; Manager, Invesco PowerShares Capital Management LLC; Director, Secretary and General Counsel, Invesco Investment Advisers LLC (formerly known as Van Kampen Asset Management); Secretary and General Counsel, Van Kampen Funds Inc. and Chief Legal Officer, PowerShares Exchange-Traded Fund Trust, PowerShares Exchange-Traded Fund Trust II, PowerShares India Exchange-Traded Fund Trust and PowerShares Actively Managed Exchange-Traded Fund Trust
Formerly: Director and Secretary, Van Kampen Advisors Inc.; Director Vice President, Secretary and General Counsel Van Kampen Investor Services Inc.; Director, Invesco Distributors, Inc. (formerly known as Invesco Aim Distributors, Inc.); Director, Senior Vice President, General Counsel and Secretary, Invesco Advisers, Inc.; and Van Kampen Investments Inc.; Director, Vice President and Secretary, Fund Management Company; Director, Senior Vice President, Secretary, General Counsel and Vice President, Invesco Aim Capital Management, Inc.; Chief Operating Officer and General Counsel, Liberty Ridge Capital, Inc. (an investment adviser); Vice President and Secretary, PBHG Funds (an investment company) and PBHG Insurance Series Fund (an investment company); Chief Operating Officer, General Counsel and Secretary, Old Mutual Investment Partners (a broker-dealer); General Counsel and Secretary, Old Mutual Fund Services (an administrator) and Old Mutual Shareholder Services (a shareholder servicing center); Executive Vice President, General Counsel and Secretary, Old Mutual Capital, Inc. (an investment adviser); and Vice President and Secretary, Old Mutual Advisors Funds (an investment company) | | N/A | | N/A |
| | | | | | | | | |
| | | | | | | | | |
| | | | | | | | | |
Lisa O. Brinkley — 1959
Vice President | | 2004 | | Global Compliance Director, Invesco Ltd.; Chief Compliance Officer, Invesco Investment Services, Inc.(formerly known as Invesco Aim Investment Services, Inc.); and Vice President, The Invesco Funds
Formerly: Chief Compliance Officer, Invesco Distributors, Inc. (formerly known as Invesco Aim Distributors, Inc.) and Van Kampen Investor Services Inc.; Senior Vice President, Invesco Management Group, Inc.; Senior Vice President and Chief Compliance Officer, Invesco Advisers, Inc. and The Invesco Funds; Vice President and Chief Compliance Officer, Invesco Aim Capital Management, Inc. and Invesco Distributors, Inc.; Vice President, Invesco Investment Services, Inc. and Fund Management Company | | N/A | | N/A |
| | | | | | | | | |
Invesco Van Kampen V.I. Mid Cap Value Fund
Trustees and Officers—(continued)
The address of each trustee and officer is AIM Variable Insurance Funds (Invesco Variable Insurance Funds) (the “Trust”), 11 Greenway Plaza, Suite 2500, Houston, Texas 77046-1173. The trustees serve for the life of the Trust, subject to their earlier death, incapacitation, resignation, retirement or removal as more specifically provided in the Trust’s organizational documents. Each officer serves for a one year term or until their successors are elected and qualified. Column two below includes length of time served with predecessor entities, if any.
| | | | | | | | | |
| | | | | | | Number of Funds
| | |
Name, Year of Birth and
| | Trustee and/
| | Principal Occupation(s)
| | in Fund Complex
| | Other Directorship(s)
|
| Position(s) Held with the Trust | | or Officer Since | | During Past 5 Years | | Overseen by Trustee | | Held by Trustee |
| | | Other Officers—(continued) | | | | |
| | | | | | | | | |
| | | | | | | | | |
| | | | | | | | | |
Sheri Morris — 1964
Vice President, Treasurer and Principal Financial Officer | | 1999 | | Vice President, Treasurer and Principal Financial Officer, The Invesco Funds; Vice President, Invesco Advisers, Inc. (formerly known as Invesco Institutional (N.A.), Inc.) (registered investment adviser).
Formerly: Treasurer, PowerShares Exchange-Traded Fund Trust, PowerShares Exchange-Traded Fund Trust II, PowerShares India Exchange-Traded Fund Trust and PowerShares Actively Managed Exchange-Traded Fund Trust, Vice President, Invesco Advisers, Inc., Invesco Aim Capital Management, Inc. and Invesco Aim Private Asset Management, Inc.; Assistant Vice President and Assistant Treasurer, The Invesco Funds and Assistant Vice President, Invesco Advisers, Inc., Invesco Aim Capital Management, Inc. and Invesco Aim Private Asset Management, Inc. | | N/A | | N/A |
| | | | | | | | | |
| | | | | | | | | |
| | | | | | | | | |
Karen Dunn Kelley — 1960
Vice President | | 1993 | | Head of Invesco’s World Wide Fixed Income and Cash Management Group; Senior Vice President, Invesco Management Group, Inc. (formerly known as Invesco Aim Management Group, Inc.) and Invesco Advisers, Inc. (formerly known as Invesco Institutional (N.A.), Inc.) (registered investment adviser); Executive Vice President, Invesco Distributors, Inc. (formerly known as Invesco Aim Distributors, Inc.); Director, Invesco Mortgage Capital Inc.; Vice President, The Invesco Funds (other than AIM Treasurer’s Series Trust (Invesco Treasurer’s Series Trust) and Short-Term Investments Trust); and President and Principal Executive Officer, The Invesco Funds (AIM Treasurer’s Series Trust (Invesco Treasurer’s Series Trust) and Short-Term Investments Trust only).
Formerly: Senior Vice President, Van Kampen Investments Inc.; Vice President, Invesco Advisers, Inc. (formerly known as Invesco Institutional (N.A.), Inc.); Director of Cash Management and Senior Vice President, Invesco Advisers, Inc. and Invesco Aim Capital Management, Inc.; President and Principal Executive Officer, Tax-Free Investments Trust; Director and President, Fund Management Company; Chief Cash Management Officer, Director of Cash Management, Senior Vice President, and Managing Director, Invesco Aim Capital Management, Inc.; Director of Cash Management, Senior Vice President, and Vice President, Invesco Advisers, Inc. and The Invesco Funds (AIM Treasurer’s Series Trust (Invesco Treasurer’s Series Trust), Short-Term Investments Trust and Tax-Free Investments Trust only) | | N/A | | N/A |
| | | | | | | | | |
| | | | | | | | | |
| | | | | | | | | |
Yinka Akinsola — 1977
Anti-Money Laundering Compliance Officer | | 2011 | | Anti-Money Laundering Compliance Officer, Invesco Advisers, Inc. (formerly known as Invesco Institutional (N.A.), Inc.) (registered investment adviser); Invesco Distributors, Inc. (formerly known as Invesco Aim Distributors, Inc.), Invesco Investment Services, Inc. (formerly known as Invesco Aim Investment Services, Inc.), Invesco Management Group, Inc., The Invesco Funds, Invesco Van Kampen Closed-End Funds, Van Kampen Exchange Corp. and Van Kampen Funds Inc. | | N/A | | N/A |
| | | | | | | | | |
| | | | | | | | | |
| | | | | | | | | |
Todd L. Spillane — 1958
Chief Compliance Officer | | 2006 | | Senior Vice President, Invesco Management Group, Inc. (formerly known as Invesco Aim Management Group, Inc.) and Van Kampen Exchange Corp.; Senior Vice President and Chief Compliance Officer, Invesco Advisers, Inc. (registered investment adviser) (formerly known as Invesco Institutional (N.A.), Inc.); Chief Compliance Officer, The Invesco Funds, INVESCO Private Capital Investments, Inc. (holding company) and Invesco Private Capital, Inc. (registered investment adviser); Vice President, Invesco Distributors, Inc. (formerly known as Invesco Aim Distributors, Inc.) and Invesco Investment Services, Inc. (formerly known as Invesco Aim Investment Services, Inc.).
Formerly: Chief Compliance Officer, Invesco Van Kampen Closed-End Funds PowerShares Exchange-Traded Fund Trust, PowerShares Exchange-Traded Fund Trust II, PowerShares India Exchange-Traded Fund Trust, and PowerShares Actively Managed Exchange-Traded Fund Trust; Senior Vice President, Van Kampen Investments Inc.; Senior Vice President and Chief Compliance Officer, Invesco Advisers, Inc. and Invesco Aim Capital Management, Inc.; Chief Compliance Officer, Invesco Global Asset Management (N.A.), Inc., Invesco Senior Secured Management, Inc. (registered investment adviser) and Van Kampen Investor Services Inc.; Vice President, Invesco Aim Capital Management, Inc. and Fund Management Company | | N/A | | N/A |
| | | | | | | | | |
The Statement of Additional Information of the Trust includes additional information about the Fund’s Trustees and is available upon request, without charge, by calling 1.800.959.4246. Please refer to the Fund’s prospectus for information on the Fund’s sub-advisers.
| | | | | | | |
Office of the Fund
11 Greenway Plaza, Suite 2500
Houston, TX 77046-1173 | | Investment Adviser
Invesco Advisers, Inc.
1555 Peachtree Street, N.E.
Atlanta, GA 30309 | | Distributor
Invesco Distributors, Inc.
11 Greenway Plaza, Suite 2500
Houston, TX 77046-1173 | | Auditors
PricewaterhouseCoopers LLP
1201 Louisiana Street, Suite 2900
Houston, TX 77002-5678 |
| | | | | | | |
| | | | | | | |
Counsel to the Fund
Stradley Ronon Stevens & Young, LLP
2600 One Commerce Square
Philadelphia, PA 19103 | | Counsel to the Independent Trustees
Kramer, Levin, Naftalis & Frankel LLP
1177 Avenue of the Americas
New York, NY 10036-2714 | | Transfer Agent
Invesco Investment Services, Inc.
11 Greenway Plaza, Suite 2500
Houston, TX77046-1173 | | Custodian
State Street Bank and Trust Company
225 Franklin
Boston, MA 02110-2801 |
Invesco Van Kampen V.I. Mid Cap Value Fund
ITEM 2. CODE OF ETHICS.
| | | As of the end of the period covered by this report, the Registrant had adopted a code of ethics (the “Code”) that applies to the Registrant’s principal executive officer (“PEO”) and principal financial officer (“PFO”). There were no amendments to the Code during the period covered by the report. The Registrant did not grant any waivers, including implicit waivers, from any provisions of the Code to the PEO or PFO during the period covered by this report. |
ITEM 3. AUDIT COMMITTEE FINANCIAL EXPERT.
| | | The Board of Trustees has determined that the Registrant has at least one audit committee financial expert serving on its Audit Committee. The Audit Committee financial expert is Raymond Stickel, Jr. Mr. Stickel is “independent” within the meaning of that term as used in Form N-CSR. |
ITEM 4. PRINCIPAL ACCOUNTANT FEES AND SERVICES.
Fees Billed by PWC Related to the Registrant
PWC billed the Registrant aggregate fees for services rendered to the Registrant for the last two fiscal years as follows:
| | | | | | | | | | | | | |
| | | | | | | Percentage of Fees | | | | | | Percentage of Fees |
| | | | | | | Billed Applicable to | | | | | | Billed Applicable to |
| | | | | | | Non-Audit Services | | | | | | Non-Audit Services |
| | | | | | | Provided for fiscal | | | | | | Provided for fiscal |
| | | Fees Billed for | | | year end 2011 | | Fees Billed for | | | year end 2010 |
| | | Services Rendered to | | | Pursuant to Waiver of | | Services Rendered to | | | Pursuant to Waiver of |
| | | the Registrant for | | | Pre-Approval | | the Registrant for | | | Pre-Approval |
| | | fiscal year end 2011 | | | Requirement(1) | | fiscal year end 2010 | | | Requirement(1) |
| Audit Fees | | $ | 665,525 | | | N/A | | $ | 972,550 | | | N/A |
Audit-Related Fees(2) | | $ | 42,500 | | | 0% | | $ | 0 | | | 0% |
Tax Fees(3) | | $ | 162,500 | | | 0% | | $ | 99,500 | | | 0% |
| All Other Fees | | $ | 0 | | | 0% | | $ | 0 | | | 0% |
| | | | | | | | | | | |
| Total Fees | | $ | 870,525 | | | 0% | | $ | 1,072,050 | | | 0% |
PWC billed the Registrant aggregate non-audit fees of $205,000 for the fiscal year ended 2011, and $99,500 for the fiscal year ended 2010, for non-audit services rendered to the Registrant.
| | |
| (1) | | With respect to the provision of non-audit services, the pre-approval requirement is waived pursuant to a de minimis exception if (i) such services were not recognized as non-audit services by the Registrant at the time of engagement, (ii) the aggregate amount of all such services provided is no more than 5% of the aggregate audit and non-audit fees paid by the Registrant to PWC during a fiscal year; and (iii) such services are promptly brought to the attention of the Registrant’s Audit Committee and approved by the Registrant’s Audit Committee prior to the completion of the audit. |
| |
| (2) | | Audit-Related fees for the fiscal year end December 31, 2011 includes fees billed for agreed upon procedures related to fund mergers. |
| |
| (3) | | Tax fees for the fiscal year end December 31, 2011 includes fees billed for reviewing tax returns. Tax fees for the fiscal year end December 31, 2010 includes fees billed for reviewing tax returns. |
Fees Billed by PWC Related to Invesco and Invesco Affiliates
PWC billed Invesco Advisers, Inc. (“Invesco”), the Registrant’s adviser, and any entity controlling, controlled by or under common control with Invesco that provides ongoing services to the Registrant (“Invesco Affiliates”) aggregate fees for pre-approved non-audit services rendered to Invesco and Invesco Affiliates for the last two fiscal years as follows:
| | | | | | | | | | | | | |
| | | Fees Billed for Non- | | | | | Fees Billed for Non- | | | |
| | | Audit Services | | | | | Audit Services | | | |
| | | Rendered to Invesco | | | Percentage of Fees | | Rendered to Invesco | | | Percentage of Fees |
| | | and Invesco Affiliates | | | Billed Applicable to | | and Invesco Affiliates | | | Billed Applicable to |
| | | for fiscal year end | | | Non-Audit Services | | for fiscal year end | | | Non-Audit Services |
| | | 2011 That Were | | | Provided for fiscal year | | 2010 That Were | | | Provided for fiscal year |
| | | Required | | | end 2011 Pursuant to | | Required | | | end 2010 Pursuant to |
| | | to be Pre-Approved | | | Waiver of Pre- | | to be Pre-Approved | | | Waiver of Pre- |
| | | by the Registrant’s | | | Approval | | by the Registrant’s | | | Approval |
| | | Audit Committee | | | Requirement(1) | | Audit Committee | | | Requirement(1) |
| Audit-Related Fees | | $ | 0 | | | 0% | | $ | 0 | | | 0% |
| Tax Fees | | $ | 0 | | | 0% | | $ | 0 | | | 0% |
| All Other Fees | | $ | 0 | | | 0% | | $ | 0 | | | 0% |
| | | | | | | | | | | |
Total Fees(2) | | $ | 0 | | | 0% | | $ | 0 | | | 0% |
| | |
| (1) | | With respect to the provision of non-audit services, the pre-approval requirement is waived pursuant to a de minimis exception if (i) such services were not recognized as non-audit services by the Registrant at the time of engagement, (ii) the aggregate amount of all such services provided is no more than 5% of the aggregate audit and non-audit fees paid by the Registrant, Invesco and Invesco Affiliates to PWC during a fiscal year; and (iii) such services are promptly brought to the attention of the Registrant’s Audit Committee and approved by the Registrant’s Audit Committee prior to the completion of the audit. |
| |
| (2) | | Including the fees for services not required to be pre-approved by the registrant’s audit committee, PWC billed Invesco and Invesco Affiliates aggregate non-audit fees of $0 for the fiscal year ended 2011, and $0 for the fiscal year ended 2010, for non-audit services rendered to Invesco and Invesco Affiliates. |
| |
| | | The Audit Committee also has considered whether the provision of non-audit services that were rendered to Invesco and Invesco Affiliates that were not required to be pre-approved pursuant to SEC regulations, if any, is compatible with maintaining PWC’s independence. |
PRE-APPROVAL OF AUDIT AND NON-AUDIT SERVICES
POLICIES AND PROCEDURES
As adopted by the Audit Committees of
the Invesco Funds (the “Funds”)
Last Amended May 4, 2010
Statement of Principles
Under the Sarbanes-Oxley Act of 2002 and rules adopted by the Securities and Exchange Commission (“SEC”) (“Rules”), the Audit Committees of the Funds’ (the “Audit Committees”) Board of Trustees (the “Board”) are responsible for the appointment, compensation and oversight of the work of independent accountants (an “Auditor”). As part of this responsibility and to assure that the Auditor’s independence is not impaired, the Audit Committees pre-approve the audit and non-audit services provided to the Funds by each Auditor, as well as all non-audit services provided by the Auditor to the Funds’ investment adviser and to affiliates of the adviser that provide ongoing services to the Funds (“Service Affiliates”) if the services directly impact the Funds’ operations or financial reporting. The SEC Rules also specify the types of services that an Auditor may not provide to its audit client. The following policies and procedures comply with the requirements for pre-approval and provide a mechanism by which management of the Funds may request and secure pre-approval of audit and non-audit services in an orderly manner with minimal disruption to normal business operations.
Proposed services either may be pre-approved without consideration of specific case-by-case services by the Audit Committees (“general pre-approval”) or require the specific pre-approval of the Audit Committees (“specific pre-approval”). As set forth in these policies and procedures, unless a type of service has received general pre-approval, it will require specific pre-approval by the Audit Committees. Additionally, any fees exceeding 110% of estimated pre-approved fee levels provided at the time the service was pre-approved will also require specific approval by the Audit Committees before payment is made. The Audit Committees will also consider the impact of additional fees on the Auditor’s independence when determining whether to approve any additional fees for previously pre-approved services.
The Audit Committees will annually review and generally pre-approve the services that may be provided by each Auditor without obtaining specific pre-approval from the Audit Committee generally on an annual basis. The term of any general pre-approval runs from the date of such pre-approval through September 30th of the following year, unless the Audit Committees consider a different period and state otherwise. The Audit Committees will add to or subtract from the list of general pre-approved services from time to time, based on subsequent determinations.
The purpose of these policies and procedures is to set forth the guidelines to assist the Audit Committees in fulfilling their responsibilities.
Delegation
The Audit Committees may from time to time delegate pre-approval authority to one or more of its members who are Independent Trustees. All decisions to pre-approve a service by a delegated member shall be reported to the Audit Committees at the next quarterly meeting.
Audit Services
The annual audit services engagement terms will be subject to specific pre-approval of the Audit Committees. Audit services include the annual financial statement audit and other procedures such as tax provision work that is required to be performed by the independent auditor to be able to form an opinion on the Funds’ financial statements. The Audit Committees will obtain, review and consider sufficient information concerning the proposed Auditor to make a reasonable evaluation of the Auditor’s qualifications and independence.
In addition to the annual Audit services engagement, the Audit Committees may grant either general or specific pre-approval of other audit services, which are those services that only the independent auditor reasonably can provide. Other Audit services may include services such as issuing consents for the
inclusion of audited financial statements with SEC registration statements, periodic reports and other documents filed with the SEC or other documents issued in connection with securities offerings.
Non-Audit Services
The Audit Committees may provide either general or specific pre-approval of any non-audit services to the Funds and its Service Affiliates if the Audit Committees believe that the provision of the service will not impair the independence of the Auditor, is consistent with the SEC’s Rules on auditor independence, and otherwise conforms to the Audit Committees’ general principles and policies as set forth herein.
Audit-Related Services
“Audit-related services” are assurance and related services that are reasonably related to the performance of the audit or review of the Fund’s financial statements or that are traditionally performed by the independent auditor. Audit-related services include, among others, accounting consultations related to accounting, financial reporting or disclosure matters not classified as “Audit services”; assistance with understanding and implementing new accounting and financial reporting guidance from rulemaking authorities; and agreed-upon procedures related to mergers, compliance with ratings agency requirements and interfund lending activities.
Tax Services
“Tax services” include, but are not limited to, the review and signing of the Funds’ federal tax returns, the review of required distributions by the Funds and consultations regarding tax matters such as the tax treatment of new investments or the impact of new regulations. The Audit Committees will scrutinize carefully the retention of the Auditor in connection with a transaction initially recommended by the Auditor, the major business purpose of which may be tax avoidance or the tax treatment of which may not be supported in the Internal Revenue Code and related regulations. The Audit Committees will consult with the Funds’ Treasurer (or his or her designee) and may consult with outside counsel or advisors as necessary to ensure the consistency of Tax services rendered by the Auditor with the foregoing policy.
No Auditor shall represent any Fund or any Service Affiliate before a tax court, district court or federal court of claims.
Under rules adopted by the Public Company Accounting Oversight Board and approved by the SEC, in connection with seeking Audit Committees’ pre-approval of permissible Tax services, the Auditor shall:
| | 1. | | Describe in writing to the Audit Committees, which writing may be in the form of the proposed engagement letter: |
| | a. | | The scope of the service, the fee structure for the engagement, and any side letter or amendment to the engagement letter, or any other agreement between the Auditor and the Fund, relating to the service; and |
| |
| | b. | | Any compensation arrangement or other agreement, such as a referral agreement, a referral fee or fee-sharing arrangement, between the Auditor and any person (other than the Fund) with respect to the promoting, marketing, or recommending of a transaction covered by the service; |
| | 2. | | Discuss with the Audit Committees the potential effects of the services on the independence of the Auditor; and |
| |
| | 3. | | Document the substance of its discussion with the Audit Committees. |
All Other Auditor Services
The Audit Committees may pre-approve non-audit services classified as “All other services” that are not categorically prohibited by the SEC, as listed in Exhibit 1 to this policy.
Pre-Approval Fee Levels or Established Amounts
Pre-approval of estimated fees or established amounts for services to be provided by the Auditor under general or specific pre-approval policies will be set periodically by the Audit Committees. Any proposed fees exceeding 110% of the maximum estimated pre-approved fees or established amounts for pre-approved audit and non-audit services will be reported to the Audit Committees at the quarterly Audit Committees meeting and will require specific approval by the Audit Committees before payment is made. The Audit Committees will always factor in the overall relationship of fees for audit and non-audit services in determining whether to pre-approve any such services and in determining whether to approve any additional fees exceeding 110% of the maximum pre-approved fees or established amounts for previously pre-approved services.
Procedures
Generally on an annual basis, Invesco Advisers, Inc. (“Invesco”) will submit to the Audit Committees for general pre-approval, a list of non-audit services that the Funds or Service Affiliates of the Funds may request from the Auditor. The list will describe the non-audit services in reasonable detail and will include an estimated range of fees and such other information as the Audit Committee may request.
Each request for services to be provided by the Auditor under the general pre-approval of the Audit Committees will be submitted to the Funds’ Treasurer (or his or her designee) and must include a detailed description of the services to be rendered. The Treasurer or his or her designee will ensure that such services are included within the list of services that have received the general pre-approval of the Audit Committees. The Audit Committees will be informed at the next quarterly scheduled Audit Committees meeting of any such services for which the Auditor rendered an invoice and whether such services and fees had been pre-approved and if so, by what means.
Each request to provide services that require specific approval by the Audit Committees shall be submitted to the Audit Committees jointly by the Fund’s Treasurer or his or her designee and the Auditor, and must include a joint statement that, in their view, such request is consistent with the policies and procedures and the SEC Rules.
Each request to provide tax services under either the general or specific pre-approval of the Audit Committees will describe in writing: (i) the scope of the service, the fee structure for the engagement, and any side letter or amendment to the engagement letter, or any other agreement between the Auditor and the audit client, relating to the service; and (ii) any compensation arrangement or other agreement between the Auditor and any person (other than the audit client) with respect to the promoting, marketing, or recommending of a transaction covered by the service. The Auditor will discuss with the Audit Committees the potential effects of the services on the Auditor’s independence and will document the substance of the discussion.
Non-audit services pursuant to the de minimis exception provided by the SEC Rules will be promptly brought to the attention of the Audit Committees for approval, including documentation that each of the conditions for this exception, as set forth in the SEC Rules, has been satisfied.
On at least an annual basis, the Auditor will prepare a summary of all the services provided to any entity in the investment company complex as defined in section 2-01(f)(14) of Regulation S-X in sufficient detail as to the nature of the engagement and the fees associated with those services.
The Audit Committees have designated the Funds’ Treasurer to monitor the performance of all services provided by the Auditor and to ensure such services are in compliance with these policies and procedures. The Funds’ Treasurer will report to the Audit Committees on a periodic basis as to the results of such monitoring. Both the Funds’ Treasurer and management of Invesco will immediately report to the chairman of the Audit Committees any breach of these policies and procedures that comes to the attention of the Funds’ Treasurer or senior management of Invesco.
Exhibit 1 to Pre-Approval of Audit and Non-Audit Services Policies and Procedures
Conditionally Prohibited Non-Audit Services (not prohibited if the Fund can reasonably conclude that the results of the service would not be subject to audit procedures in connection with the audit of the Fund’s financial statements)
| | • | | Bookkeeping or other services related to the accounting records or financial statements of the audit client |
| |
| | • | | Financial information systems design and implementation |
| |
| | • | | Appraisal or valuation services, fairness opinions, or contribution-in-kind reports |
| |
| | • | | Actuarial services |
| |
| | • | | Internal audit outsourcing services |
Categorically Prohibited Non-Audit Services
| | • | | Management functions |
| |
| | • | | Human resources |
| |
| | • | | Broker-dealer, investment adviser, or investment banking services |
| |
| | • | | Legal services |
| |
| | • | | Expert services unrelated to the audit |
| |
| | • | | Any service or product provided for a contingent fee or a commission |
| |
| | • | | Services related to marketing, planning, or opining in favor of the tax treatment of confidential transactions or aggressive tax position transactions, a significant purpose of which is tax avoidance |
| |
| | • | | Tax services for persons in financial reporting oversight roles at the Fund |
| |
| | • | | Any other service that the Public Company Oversight Board determines by regulation is impermissible. |
ITEM 5. AUDIT COMMITTEE OF LISTED REGISTRANTS.
ITEM 6. SCHEDULE OF INVESTMENTS.
| | | Investments in securities of unaffiliated issuers is included as part of the reports to stockholders filed under Item 1 of this Form. |
ITEM 7. DISCLOSURE OF PROXY VOTING POLICIES AND PROCEDURES FOR CLOSED-END MANAGEMENT INVESTMENT COMPANIES.
ITEM 8. PORTFOLIO MANAGERS OF CLOSED-END MANAGEMENT COMPANIES.
ITEM 9. PURCHASES OF EQUITY SECURITIES BY CLOSED-END MANAGEMENT INVESTMENT COMPANY AND AFFILIATED PURCHASERS.
ITEM 10. SUBMISSION OF MATTERS TO A VOTE OF SECURITY HOLDERS.
ITEM 11. CONTROLS AND PROCEDURES.
| (a) | | As of February 21, 2012, an evaluation was performed under the supervision and with the participation of the officers of the Registrant, including the PEO and PFO, to assess the effectiveness of the Registrant’s disclosure controls and procedures, as that term is defined in Rule 30a-3(c) under the Investment Company Act of 1940 (the “Act”), as amended. Based on that evaluation, the Registrant’s officers, including the PEO and PFO, concluded that, as of February 21, 2012, the Registrant’s disclosure controls and procedures were reasonably designed to ensure: (1) that information required to be disclosed by the Registrant on Form N-CSR is recorded, processed, summarized and reported within the time periods specified by the rules and forms of the Securities and Exchange Commission; and (2) that material information relating to the Registrant is made known to the PEO and PFO as appropriate to allow timely decisions regarding required disclosure. |
| |
| (b) | | There have been no changes in the Registrant’s internal control over financial reporting (as defined in Rule 30a-3(d) under the Act) that occurred during the second fiscal quarter of the period covered by this report that have materially affected, or are reasonably likely to materially affect, the Registrant’s internal control over financial reporting. |
ITEM 12. EXHIBITS.
| | | |
|
| 12(a) (1) | | Code of Ethics. |
| | | |
| 12(a) (2) | | Certifications of principal executive officer and principal financial officer as required by Rule 30a-2(a) under the Investment Company Act of 1940. |
| | | |
| 12(a) (3) | | Not applicable. |
| | | |
| 12(b) | | Certifications of principal executive officer and principal financial officer as required by Rule 30a-2(b) under the Investment Company Act of 1940. |
SIGNATURES
Pursuant to the requirements of the Securities Exchange Act of 1934 and the Investment Company Act of 1940, the Registrant has duly caused this report to be signed on its behalf by the undersigned, thereunto duly authorized.
Registrant: AIM Variable Insurance Funds (Invesco Variable Insurance Funds)
| | | | | |
|
| By: | | /s/ PHILIP A. TAYLOR Philip A. Taylor | | |
| | | Principal Executive Officer | | |
| | | | | |
| Date: | | February 27, 2012 | | |
Pursuant to the requirements of the Securities and Exchange Act of 1934 and the Investment Company Act of 1940, this report has been signed below by the following persons on behalf of the Registrant and in the capacities and on the dates indicated.
| | | | | |
|
| By: | | /s/ PHILIP A. TAYLOR Philip A. Taylor | | |
| | | Principal Executive Officer | | |
| | | | | |
| Date: | | February 27, 2012 | | |
| | | | | |
| By: | | /s/ Sheri Morris Sheri Morris | | |
| | | Principal Financial Officer | | |
| | | | | |
| Date: | | February 27, 2012 | | |
EXHIBIT INDEX
| | | |
| 12(a) (1) | | Not applicable. |
| | | |
| 12(a) (2) | | Certifications of principal executive officer and Principal financial officer as required by Rule 30a-2(a) under the Investment Company Act of 1940. |
| | | |
| 12(a) (3) | | Not applicable. |
| | | |
| 12(b) | | Certifications of principal executive officer and Principal financial officer as required by Rule 30a-2(b) under the Investment Company Act of 1940. |