UNITED STATES
SECURITIES AND EXCHANGE COMMISSION
Washington, D.C. 20549
FORMN-CSR
CERTIFIED SHAREHOLDER REPORT OF REGISTERED
MANAGEMENT INVESTMENT COMPANIES
Investment Company Act file number811-07452
AIM Variable Insurance Funds (Invesco Variable Insurance Funds)
(Exact name of registrant as specified in charter)
11 Greenway Plaza, Suite 1000 Houston, Texas 77046
(Address of principal executive offices) (Zip code)
Sheri Morris 11 Greenway Plaza, Suite 1000 Houston, Texas 77046
(Name and address of agent for service)
Registrant’s telephone number, including area code: (713)626-1919
Date of fiscal year end: 12/31
Date of reporting period: 06/30/19
Item 1. Reports to Stockholders.
| Semiannual Report to Shareholders | June 30, 2019 |
Invesco V.I. American Franchise Fund
Beginning on January 1, 2021, as permitted by regulations adopted by the Securities and Exchange Commission, the insurance company that offers your variable annuity or variable life insurance contract may no longer send you paper copies of the Fund’s shareholder reports by mail, unless you specifically request paper copies of the reports from the insurance company or your financial intermediary. Instead of delivering paper copies of the report, the insurance company may choose to make the reports available on a website, and will notify you by mail each time a report is posted and provide you with a website link to access the report. Instructions for requesting paper copies will be provided by your insurance company.
If the insurance company offers electronic delivery, you may elect to receive shareholder reports and other communications about the Fund electronically by following the instructions provided by the insurance company or by contacting your financial intermediary. If you already elected to receive shareholder reports electronically, you will not be affected by this change and you need not take any action.
You may elect to receive all future reports in paper free of charge from the insurance company. You can inform the insurance company or your financial intermediary that you wish to continue receiving paper copies of your shareholder reports by following the instructions provided by the insurance company or by contacting your financial intermediary. Your election to receive reports in paper will apply to all portfolio companies available under your contract with the insurance company.
The Fund provides a complete list of its holdings four times in each fiscal year, at the quarter-ends. For the second and fourth quarters, the lists appear in the Fund’s semiannual and annual reports to shareholders. For the first and third quarters, the Fund files the lists with the Securities and Exchange Commission (SEC) on Form N-Q (or any successor Form). The Fund’s Form N-Q (or any successor Form) filings are available on the SEC website, sec.gov. The SEC file numbers for the Fund are 811-07452 and 033-57340. The Fund’s most recent portfolio holdings, as filed on Form N-Q (or any successor Form), have also been made available to insurance companies issuing variable annuity contracts and variable life insurance policies (“variable products”) that invest in the Fund.
A description of the policies and procedures that the Fund uses to determine how to vote proxies relating to portfolio securities is available without charge, upon request, from our Client Services department at 800 959 4246 or at invesco.com/proxyguidelines. The information is also available on the SEC website, sec.gov.
Information regarding how the Fund voted proxies related to its portfolio securities during the most recent 12-month period ended June 30 is available at invesco.com/proxysearch. The information is also available on the SEC website, sec.gov.
Invesco Advisers, Inc. is an investment adviser; it provides investment advisory services to individual and institutional clients and does not sell securities. Invesco Distributors, Inc. is the US distributor for Invesco Ltd.’s retail mutual funds, exchange-traded funds and institutional money market funds. Both are wholly owned, indirect subsidiaries of Invesco Ltd.
This report must be accompanied or preceded by a currently effective Fund prospectus and variable product prospectus, which contain more complete information, including sales charges and expenses. Investors should read each carefully before investing.
NOT FDIC INSURED | MAY LOSE VALUE | NO BANK GUARANTEE
| Invesco Distributors, Inc. | VK-VIAMFR-SAR-1 |
Performance summary
Fund vs. Indexes
Cumulative total returns, December 31, 2018 to June 30, 2019, excluding variable product issuer charges. If variable product issuer charges were included, returns would be lower.
| Series I Shares | 22.75% |
| Series II Shares | 22.62 |
| S&P 500 Index▼ (Broad Market Index) | 18.54 |
Russell 1000 Growth Index■
(Style-Specific Index) | 21.49 |
Lipper VUF Large-Cap Growth Funds Index♦
(Peer Group Index) | 21.33 |
| Source(s):▼FactSet Research Systems Inc.;■ RIMES Technologies Corp.;♦ Lipper Inc. |
TheS&P 500® Index is an unmanaged index considered representative of the US stock market.
TheRussell 1000® Growth Index is an unmanaged index considered representative of large-cap growth stocks. The Russell 1000 Growth Index is a trademark/ service mark of the Frank Russell Co. Russell® is a trademark of the Frank Russell Co.
The Lipper VUF Large-Cap Growth Funds Index is an unmanaged index considered representative of large-cap growth variable insurance underlying funds tracked by Lipper.
The Fund is not managed to track the performance of any particular index, including the indexes described here, and consequently, the performance of the Fund may deviate significantly from the performance of the indexes.
A direct investment cannot be made in an index. Unless otherwise indicated, index results include reinvested dividends, and they do not reflect sales charges. Performance of the peer group, if applicable, reflects fund expenses; performance of a market index does not.
| Average Annual Total Returns |
| As of 6/30/19 |
| Series I Shares | |
| Inception (7/3/95) | 9.62% |
| 10 Years | 15.26 |
| 5 Years | 10.93 |
| 1 Year | 7.32 |
| Series II Shares | |
| Inception (9/18/00) | 2.58% |
| 10 Years | 14.97 |
| 5 Years | 10.66 |
| 1 Year | 7.07 |
Effective June 1, 2010, Class I and Class II shares of the predecessor fund, Van Kampen Life Investment Trust Capital Growth Portfolio, advised by Van Kampen Asset Management were reorganized into Series I and Series II shares, respectively, of Invesco Van Kampen V.I. Capital Growth Fund (renamed Invesco V.I. American Franchise Fund on April 29, 2013). Returns shown above, prior to June 1, 2010, for Series I and Series II shares are blended returns of the predecessor fund and Invesco V.I. American Franchise Fund. Share class returns will differ from the predecessor fund because of different expenses.
The performance data quoted represent past performance and cannot guarantee comparable future results; current performance may be lower or higher. Please contact your variable product issuer or financial adviser for the most recent month-end variable product performance. Performance figures reflect Fund expenses, rein-
vested distributions and changes in net asset value. Performance figures do not reflect deduction of taxes a shareholder would pay on Fund distributions or sale of Fund shares. Investment return and principal value will fluctuate so that you may have a gain or loss when you sell shares.
The total annual Fund operating expense ratio set forth in the most recent Fund prospectus as of the date of this report for Series I and Series II shares was 0.88% and 1.13%, respectively. The expense ratios presented above may vary from the expense ratios presented in other sections of this report that are based on expenses incurred during the period covered by this report.
Invesco V.I. American Franchise Fund, a series portfolio of AIM Variable Insurance Funds (Invesco Variable Insurance Funds), is currently offered through insurance companies issuing variable products. You cannot pur-
chase shares of the Fund directly. Performance figures given represent the Fund and are not intended to reflect actual variable product values. They do not reflect sales charges, expenses and fees assessed in connection with a variable product. Sales charges, expenses and fees, which are determined by the variable product issuers, will vary and will lower the total return.
The most recent month-end performance at the Fund level, excluding variable product charges, is available at 800 451 4246. As mentioned above, for the most recent month-end performance including variable product charges, please contact your variable product issuer or financial adviser.
Fund performance reflects any applicable fee waivers and/or expense reimbursements. Had the adviser not waived fees and/or reimbursed expenses currently or in the past, returns would have been lower. See current prospectus for more information.
Invesco V.I. American Franchise Fund
Schedule of Investments(a)
June 30, 2019
(Unaudited)
| | Shares | Value |
| Common Stocks & Other Equity Interests–100.12% |
| Aerospace & Defense–3.28% |
| Airbus S.E. (France) | 65,131 | $9,235,245 |
| Boeing Co. (The) | 6,841 | 2,490,192 |
| L3Harris Technologies, Inc.(b) | 32,476 | 6,142,186 |
| Lockheed Martin Corp. | 6,850 | 2,490,249 |
| | | | 20,357,872 |
| Agricultural & Farm Machinery–0.59% |
| Deere & Co. | 22,151 | 3,670,642 |
| Application Software–4.09% |
| Adobe, Inc.(b) | 27,377 | 8,066,633 |
| salesforce.com, inc.(b) | 113,899 | 17,281,895 |
| | | | 25,348,528 |
| Asset Management & Custody Banks–1.11% |
| Apollo Global Management LLC, Class A | 54,386 | 1,865,440 |
| KKR & Co., Inc., Class A | 140,263 | 3,544,446 |
| Legg Mason, Inc. | 38,753 | 1,483,465 |
| | | | 6,893,351 |
| Biotechnology–0.43% |
| Alexion Pharmaceuticals, Inc.(b) | 5,039 | 660,008 |
| Alnylam Pharmaceuticals, Inc.(b) | 17,139 | 1,243,606 |
| Bluebird Bio, Inc.(b) | 1,833 | 233,158 |
| Moderna, Inc.(b) | 9,971 | 145,975 |
| Sage Therapeutics, Inc.(b) | 2,188 | 400,601 |
| | | | 2,683,348 |
| Commodity Chemicals–0.50% |
| LyondellBasell Industries N.V., Class A | 36,332 | 3,129,275 |
| Consumer Electronics–1.10% |
| Sony Corp. (Japan) | 129,900 | 6,787,137 |
| Data Processing & Outsourced Services–8.88% |
| First Data Corp., Class A(b) | 125,292 | 3,391,654 |
| Mastercard, Inc., Class A | 56,949 | 15,064,719 |
| PayPal Holdings, Inc.(b) | 102,812 | 11,767,862 |
| Visa, Inc., Class A | 142,928 | 24,805,154 |
| | | | 55,029,389 |
| Distillers & Vintners–0.68% |
| Constellation Brands, Inc., Class A | 21,432 | 4,220,818 |
| Diversified Support Services–1.40% |
| Cintas Corp. | 36,455 | 8,650,407 |
| Environmental & Facilities Services–1.52% |
| Republic Services, Inc. | 28,601 | 2,477,991 |
| Waste Management, Inc. | 60,416 | 6,970,194 |
| | | | 9,448,185 |
| | Shares | Value |
| Financial Exchanges & Data–2.00% |
| London Stock Exchange Group PLC (United Kingdom) | 74,993 | $5,225,032 |
| S&P Global, Inc. | 31,379 | 7,147,823 |
| | | | 12,372,855 |
| Health Care Equipment–4.76% |
| Abbott Laboratories | 78,221 | 6,578,386 |
| Boston Scientific Corp.(b) | 135,118 | 5,807,372 |
| Intuitive Surgical, Inc.(b) | 10,905 | 5,720,218 |
| Stryker Corp. | 15,092 | 3,102,613 |
| Teleflex, Inc. | 24,976 | 8,270,802 |
| | | | 29,479,391 |
| Home Improvement Retail–3.78% |
| Home Depot, Inc. (The) | 14,976 | 3,114,559 |
| Lowe’s Cos., Inc. | 200,998 | 20,282,708 |
| | | | 23,397,267 |
| Hotels, Resorts & Cruise Lines–2.68% |
| Norwegian Cruise Line Holdings Ltd.(b) | 58,869 | 3,157,144 |
| Royal Caribbean Cruises Ltd. | 111,080 | 13,464,007 |
| | | | 16,621,151 |
| Industrial Conglomerates–0.40% |
| Roper Technologies, Inc. | 6,753 | 2,473,354 |
| Industrial Gases–0.74% |
| Air Products and Chemicals, Inc. | 20,220 | 4,577,201 |
| Industrial Machinery–0.34% |
| Stanley Black & Decker, Inc. | 14,387 | 2,080,504 |
| Interactive Home Entertainment–6.51% |
| Activision Blizzard, Inc. | 273,367 | 12,902,922 |
| Electronic Arts, Inc.(b) | 71,442 | 7,234,217 |
| Nintendo Co., Ltd. (Japan) | 45,400 | 16,690,404 |
| Take-Two Interactive Software, Inc.(b) | 30,928 | 3,511,256 |
| | | | 40,338,799 |
| Interactive Media & Services–10.72% |
| Alphabet, Inc., Class A(b) | 30,743 | 33,288,520 |
| Facebook, Inc., Class A(b) | 171,906 | 33,177,858 |
| | | | 66,466,378 |
| Internet & Direct Marketing Retail–12.66% |
| Alibaba Group Holding Ltd., ADR (China)(b) | 101,445 | 17,189,855 |
| Amazon.com, Inc.(b) | 29,454 | 55,774,978 |
| Booking Holdings, Inc.(b) | 2,939 | 5,509,773 |
| | | | 78,474,606 |
| Investment Banking & Brokerage–0.48% |
| Goldman Sachs Group, Inc. (The) | 14,646 | 2,996,572 |
See accompanying Notes to Financial Statements which are an integral part of the financial statements.
Invesco V.I. American Franchise Fund
| | Shares | Value |
| Life Sciences Tools & Services–4.94% |
| Avantor, Inc.(b) | 106,715 | $2,037,189 |
| Illumina, Inc.(b) | 34,919 | 12,855,430 |
| IQVIA Holdings, Inc.(b) | 46,655 | 7,506,790 |
| Thermo Fisher Scientific, Inc. | 27,900 | 8,193,672 |
| | | | 30,593,081 |
| Managed Health Care–2.24% |
| Anthem, Inc. | 10,997 | 3,103,464 |
| UnitedHealth Group, Inc. | 44,233 | 10,793,294 |
| | | | 13,896,758 |
| Movies & Entertainment–1.93% |
| Netflix, Inc.(b) | 25,071 | 9,209,080 |
| Vivendi S.A. (France) | 99,975 | 2,755,487 |
| | | | 11,964,567 |
| Oil & Gas Exploration & Production–0.11% |
| Noble Energy, Inc. | 30,994 | 694,266 |
| Oil & Gas Refining & Marketing–1.45% |
| Marathon Petroleum Corp. | 160,973 | 8,995,171 |
| Packaged Foods & Meats–1.29% |
| Tyson Foods, Inc., Class A | 98,730 | 7,971,460 |
| Pharmaceuticals–1.60% |
| Zoetis, Inc. | 87,528 | 9,933,553 |
| Railroads–1.25% |
| Canadian Pacific Railway Ltd. (Canada)(c) | 14,559 | 3,424,859 |
| Union Pacific Corp. | 25,418 | 4,298,438 |
| | | | 7,723,297 |
| Semiconductor Equipment–1.96% |
| Applied Materials, Inc. | 138,539 | 6,221,787 |
| ASML Holding N.V., New York Shares (Netherlands) | 28,367 | 5,898,350 |
| | | | 12,120,137 |
| Semiconductors–2.13% |
| Broadcom, Inc. | 10,659 | 3,068,300 |
| NVIDIA Corp. | 18,329 | 3,010,171 |
| QUALCOMM, Inc. | 93,782 | 7,133,997 |
| | | | 13,212,468 |
| | Shares | Value |
| Specialty Chemicals–0.55% |
| Sherwin-Williams Co. (The) | 7,400 | $3,391,346 |
| Systems Software–6.81% |
| Microsoft Corp. | 212,888 | 28,518,477 |
| Palo Alto Networks, Inc.(b) | 38,587 | 7,862,487 |
| ServiceNow, Inc.(b) | 21,290 | 5,845,595 |
| | | | 42,226,559 |
| Technology Hardware, Storage & Peripherals–2.26% |
| Apple, Inc. | 70,899 | 14,032,330 |
| Tobacco–2.02% |
| Altria Group, Inc. | 29,599 | 1,401,512 |
| Philip Morris International, Inc. | 141,256 | 11,092,834 |
| | | | 12,494,346 |
| Trucking–0.93% |
| Lyft, Inc., Class A(b)(c) | 49,984 | 3,284,449 |
| Uber Technologies, Inc.(b) | 53,224 | 2,468,529 |
| | | | 5,752,978 |
| Total Common Stocks & Other Equity Interests (Cost $333,554,528) | 620,499,347 |
| TOTAL INVESTMENTS IN SECURITIES (excluding investments purchased with cash collateral from securities on loan)-100.12% (Cost $333,554,528) | | | 620,499,347 |
| Investments Purchased with Cash Collateral from Securities on Loan |
| Money Market Funds–0.93% |
| Invesco Government & Agency Portfolio, Institutional Class, 2.26%(d)(e) | 4,325,807 | 4,325,807 |
| Invesco Liquid Assets Portfolio, Institutional Class, 2.40%(d)(e) | 1,441,359 | 1,441,936 |
| Total Investments Purchased with Cash Collateral from Securities on Loan (Cost $5,767,694) | 5,767,743 |
| TOTAL INVESTMENTS IN SECURITIES–101.05% (Cost $339,322,222) | 626,267,090 |
| OTHER ASSETS LESS LIABILITIES–(1.05)% | (6,503,447) |
| NET ASSETS–100.00% | $619,763,643 |
Investment Abbreviations:
| ADR | – American Depositary Receipt |
Notes to Schedule of Investments:
| (a) | Industry and/or sector classifications used in this report are generally according to the Global Industry Classification Standard, which was developed by and is the exclusive property and a service mark of MSCI Inc. and Standard & Poor’s. |
| (b) | Non-income producing security. |
| (c) | All or a portion of this security was out on loan at June 30, 2019. |
| (d) | The security has been segregated to satisfy the commitment to return the cash collateral received in securities lending transactions upon the borrower’s return of the securities loaned. See Note 1I. |
| (e) | The money market fund and the Fund are affiliated by having the same investment adviser. The rate shown is the 7-day SEC standardized yield as of June 30, 2019. |
See accompanying Notes to Financial Statements which are an integral part of the financial statements.
Invesco V.I. American Franchise Fund
Portfolio Composition
By sector, based on Total Investments
as of June 30, 2019
| Information Technology | 25.87% |
| Consumer Discretionary | 20.00 |
| Communication Services | 18.96 |
| Health Care | 13.83 |
| Industrials | 9.60 |
| Consumer Staples | 3.94 |
| Financials | 3.56 |
| Security types each less than 2% portfolio | 4.24 |
See accompanying Notes to Financial Statements which are an integral part of the financial statements.
Invesco V.I. American Franchise Fund
Statement of Assets and Liabilities
June 30, 2019
(Unaudited)
| Assets: | |
Investments in securities, at value
(Cost $333,554,528)* | $620,499,347 |
| Investments in affiliated money market funds, at value (Cost $5,767,694) | 5,767,743 |
| Cash | 971,744 |
| Foreign currencies, at value (Cost $257,735) | 257,740 |
| Receivable for: | |
| Fund shares sold | 3,933 |
| Dividends | 398,542 |
| Investments sold | 3,983,260 |
| Investment for trustee deferred compensation and retirement plans | 350,285 |
| Total assets | 632,232,594 |
| Liabilities: | |
| Payable for: | |
| Investments purchased | 5,339,554 |
| Fund shares reacquired | 614,008 |
| Collateral upon return of securities loaned | 5,767,694 |
| Accrued fees to affiliates | 335,974 |
| Accrued trustees’ and officers’ fees and benefits | 599 |
| Accrued other operating expenses | 38,501 |
| Trustee deferred compensation and retirement plans | 372,621 |
| Total liabilities | 12,468,951 |
| Net assets applicable to shares outstanding | $619,763,643 |
| Net assets consist of: | |
| Shares of beneficial interest | $226,948,045 |
| Distributable earnings | 392,815,598 |
| | $619,763,643 |
| Net Assets: |
| Series I | $467,609,990 |
| Series II | $152,153,653 |
| Shares outstanding, no par value, with an unlimited number of shares authorized: |
| Series I | 6,665,607 |
| Series II | 2,260,300 |
| Series I: | |
| Net asset value per share | $70.15 |
| Series II: | |
| Net asset value per share | $67.32 |
| * | At June 30, 2019, securities with an aggregate value of $5,645,375 were on loan to brokers. |
Statement of Operations
For the six months ended June 30, 2019
(Unaudited)
| Investment income: | |
| Dividends (net of foreign withholding taxes of $72,608) | $3,161,695 |
| Dividends from affiliated money market funds (includes securities lending income of $19,057) | 51,453 |
| Total investment income | 3,213,148 |
| Expenses: | |
| Advisory fees | 2,013,872 |
| Administrative services fees | 488,444 |
| Custodian fees | 8,941 |
| Distribution fees - Series II | 183,963 |
| Transfer agent fees | 32,401 |
| Trustees’ and officers’ fees and benefits | 15,785 |
| Reports to shareholders | 3,409 |
| Professional services fees | 18,789 |
| Other | 5,347 |
| Total expenses | 2,770,951 |
| Less: Fees waived | (1,935) |
| Net expenses | 2,769,016 |
| Net investment income | 444,132 |
| Realized and unrealized gain (loss) from: | |
| Net realized gain (loss) from: | |
| Investment securities | 26,747,108 |
| Foreign currencies | (4,296) |
| | 26,742,812 |
| Change in net unrealized appreciation (depreciation) of: | |
| Investment securities | 92,803,604 |
| Foreign currencies | (173) |
| | 92,803,431 |
| Net realized and unrealized gain | 119,546,243 |
| Net increase in net assets resulting from operations | $119,990,375 |
See accompanying Notes to Financial Statements which are an integral part of the financial statements.
Invesco V.I. American Franchise Fund
Statement of Changes in Net Assets
For the six months ended June 30, 2019 and the year ended December 31, 2018
(Unaudited)
| | June 30,
2019 | December 31,
2018 |
| Operations: | | |
| Net investment income (loss) | $444,132 | $(419,319) |
| Net realized gain | 26,742,812 | 85,166,075 |
| Change in net unrealized appreciation (depreciation) | 92,803,431 | (97,421,166) |
| Net increase (decrease) in net assets resulting from operations | 119,990,375 | (12,674,410) |
| Distributions to shareholders from distributable earnings: | | |
| Series I | — | (29,906,066) |
| Series II | — | (10,129,348) |
| Total distributions from distributable earnings | — | (40,035,414) |
| Share transactions–net: | | |
| Series I | (28,056,306) | (46,845,225) |
| Series II | (10,577,808) | (24,264,904) |
| Net increase (decrease) in net assets resulting from share transactions | (38,634,114) | (71,110,129) |
| Net increase (decrease) in net assets | 81,356,261 | (123,819,953) |
| Net assets: | | |
| Beginning of period | 538,407,382 | 662,227,335 |
| End of period | $619,763,643 | $538,407,382 |
See accompanying Notes to Financial Statements which are an integral part of the financial statements.
Invesco V.I. American Franchise Fund
Financial Highlights
June 30, 2019
(Unaudited)
The following schedule presents financial highlights for a share of the Fund outstanding throughout the periods indicated.
| | Net asset
value,
beginning
of period | Net
investment
income
(loss)(a) | Net gains
(losses)
on securities
(both
realized and
unrealized) | Total from
investment
operations | Dividends
from net
investment
income | Distributions
from net
realized
gains | Total
distributions | Net asset
value, end
of period | Total
return(b) | Net assets,
end of period
(000’s omitted) | Ratio of
expenses
to average
net assets
with fee waivers
and/or expenses
absorbed | Ratio of
expenses
to average net
assets without
fee waivers
and/or expenses
absorbed | Ratio of net
investment
income
(loss)
to average
net assets | Portfolio
turnover(c) |
| Series I |
| Six months ended 06/30/19 | $57.15 | $0.07 | $12.93 | $13.00 | $— | $— | $— | $70.15 | 22.75% | $467,610 | 0.87%(d) | 0.87%(d) | 0.21%(d) | 22% |
| Year ended 12/31/18 | 62.97 | (0.00) | (1.50) | (1.50) | — | (4.32) | (4.32) | 57.15 | (3.62) | 405,192 | 0.88 | 0.88 | (0.00) | 42 |
| Year ended 12/31/17 | 53.58 | (0.04) | 14.50 | 14.46 | (0.05) | (5.02) | (5.07) | 62.97 | 27.34 | 491,271 | 0.89 | 0.89 | (0.06) | 45 |
| Year ended 12/31/16 | 57.30 | 0.07 | 1.33 | 1.40 | — | (5.12) | (5.12) | 53.58 | 2.27 | 420,824 | 0.93 | 0.93 | 0.12 | 59 |
| Year ended 12/31/15 | 54.88 | (0.03) | 2.76 | 2.73 | — | (0.31) | (0.31) | 57.30 | 5.01 | 479,298 | 0.96 | 0.96 | (0.05) | 68 |
| Year ended 12/31/14 | 50.63 | (0.09) | 4.36 | 4.27 | (0.02) | — | (0.02) | 54.88 | 8.44 | 541,929 | 0.92 | 0.95 | (0.17) | 64 |
| Series II |
| Six months ended 06/30/19 | 54.90 | (0.01) | 12.43 | 12.42 | — | — | — | 67.32 | 22.62 | 152,154 | 1.12(d) | 1.12(d) | (0.04)(d) | 22 |
| Year ended 12/31/18 | 60.79 | (0.16) | (1.41) | (1.57) | — | (4.32) | (4.32) | 54.90 | (3.88) | 133,216 | 1.13 | 1.13 | (0.25) | 42 |
| Year ended 12/31/17 | 51.95 | (0.19) | 14.05 | 13.86 | — | (5.02) | (5.02) | 60.79 | 27.03 | 170,956 | 1.14 | 1.14 | (0.31) | 45 |
| Year ended 12/31/16 | 55.85 | (0.06) | 1.28 | 1.22 | — | (5.12) | (5.12) | 51.95 | 2.00 | 151,599 | 1.18 | 1.18 | (0.13) | 59 |
| Year ended 12/31/15 | 53.63 | (0.16) | 2.69 | 2.53 | — | (0.31) | (0.31) | 55.85 | 4.75 | 175,919 | 1.21 | 1.21 | (0.30) | 68 |
| Year ended 12/31/14 | 49.58 | (0.22) | 4.27 | 4.05 | — | — | — | 53.63 | 8.17 | 199,141 | 1.17 | 1.20 | (0.42) | 64 |
| (a) | Calculated using average shares outstanding. |
| (b) | Includes adjustments in accordance with accounting principles generally accepted in the United States of America and as such, the net asset value for financial reporting purposes and the returns based upon those net asset values may differ from the net asset value and returns for shareholder transactions. Total returns are not annualized for periods less than one year, if applicable, and do not reflect charges assessed in connection with a variable product, which if included would reduce total returns. |
| (c) | Portfolio turnover is calculated at the fund level and is not annualized for periods less than one year, if applicable. |
| (d) | Ratios are annualized and based on average daily net assets (000’s omitted) of $452,171 and $148,390 for Series I and Series II shares, respectively. |
See accompanying Notes to Financial Statements which are an integral part of the financial statements.
Invesco V.I. American Franchise Fund
Notes to Financial Statements
June 30, 2019
(Unaudited)
NOTE 1—Significant Accounting Policies
Invesco V.I. American Franchise Fund (the “Fund”) is a series portfolio of AIM Variable Insurance Funds (Invesco Variable Insurance Funds) (the “Trust”). The Trust is a Delaware statutory trust registered under the Investment Company Act of 1940, as amended (the “1940 Act”), as an open-end series management investment company. Information presented in these financial statements pertains only to the Fund. Matters affecting the Fund or each class will be voted on exclusively by the shareholders of the Fund or each class. Current Securities and Exchange Commission (“SEC”) guidance, however, requires participating insurance companies offering separate accounts to vote shares proportionally in accordance with the instructions of the contract owners whose investments are funded by shares of each Fund or class.
The Fund’s investment objective is to seek capital growth.
The Fund currently offers two classes of shares, Series I and Series II, both of which are offered to insurance company separate accounts funding variable annuity contracts and variable life insurance policies (“variable products”).
The Fund is an investment company and accordingly follows the investment company accounting and reporting guidance in accordance with Financial Accounting Standards Board Accounting Standards Codification Topic 946,Financial Services – Investment Companies.
The following is a summary of the significant accounting policies followed by the Fund in the preparation of its financial statements.
| A. | Security Valuations — Securities, including restricted securities, are valued according to the following policy. |
A security listed or traded on an exchange (except convertible securities) is valued at its last sales price or official closing price as of the close of the customary trading session on the exchange where the security is principally traded, or lacking any sales or official closing price on a particular day, the security may be valued at the closing bid price on that day. Securities traded in the over-the-counter market are valued based on prices furnished by independent pricing services or market makers. When such securities are valued by an independent pricing service they may be considered fair valued. Futures contracts are valued at the final settlement price set by an exchange on which they are principally traded. Listed options are valued at the mean between the last bid and asked prices from the exchange on which they are principally traded. Options not listed on an exchange are valued by an independent source at the mean between the last bid and asked prices. For purposes of determining net asset value (“NAV”) per share, futures and option contracts generally are valued 15 minutes after the close of the customary trading session of the New York Stock Exchange (“NYSE”).
Investments in open-end and closed-end registered investment companies that do not trade on an exchange are valued at the end-of-day net asset value per share. Investments in open-end and closed-end registered investment companies that trade on an exchange are valued at the last sales price or official closing price as of the close of the customary trading session on the exchange where the security is principally traded.
Debt obligations (including convertible securities) and unlisted equities are fair valued using an evaluated quote provided by an independent pricing service. Evaluated quotes provided by the pricing service may be determined without exclusive reliance on quoted prices, and may reflect appropriate factors such as institution-size trading in similar groups of securities, developments related to specific securities, dividend rate (for unlisted equities), yield (for debt obligations), quality, type of issue, coupon rate (for debt obligations), maturity (for debt obligations), individual trading characteristics and other market data. Pricing services generally value debt obligations assuming orderly transactions of institutional round lot size, but a fund may hold or transact in the same securities in smaller, odd lot sizes. Odd lots often trade at lower prices than institutional round lots. Debt obligations are subject to interest rate and credit risks. In addition, all debt obligations involve some risk of default with respect to interest and/or principal payments.
Foreign securities’ (including foreign exchange contracts) prices are converted into U.S. dollar amounts using the applicable exchange rates as of the close of the NYSE. If market quotations are available and reliable for foreign exchange-traded equity securities, the securities will be valued at the market quotations. Because trading hours for certain foreign securities end before the close of the NYSE, closing market quotations may become unreliable. If between the time trading ends on a particular security and the close of the customary trading session on the NYSE, events occur that the investment adviser determines are significant and make the closing price unreliable, the Fund may fair value the security. If the event is likely to have affected the closing price of the security, the security will be valued at fair value in good faith using procedures approved by the Board of Trustees. Adjustments to closing prices to reflect fair value may also be based on a screening process of an independent pricing service to indicate the degree of certainty, based on historical data, that the closing price in the principal market where a foreign security trades is not the current value as of the close of the NYSE. Foreign securities’ prices meeting the approved degree of certainty that the price is not reflective of current value will be priced at the indication of fair value from the independent pricing service. Multiple factors may be considered by the independent pricing service in determining adjustments to reflect fair value and may include information relating to sector indices, American Depositary Receipts and domestic and foreign index futures. Foreign securities may have additional risks including exchange rate changes, potential for sharply devalued currencies and high inflation, political and economic upheaval, the relative lack of issuer information, relatively low market liquidity and the potential lack of strict financial and accounting controls and standards.
Securities for which market prices are not provided by any of the above methods may be valued based upon quotes furnished by independent sources. The last bid price may be used to value equity securities. The mean between the last bid and asked prices is used to value debt obligations, including corporate loans.
Securities for which market quotations are not readily available or became unreliable are valued at fair value as determined in good faith by or under the supervision of the Trust’s officers following procedures approved by the Board of Trustees. Issuer specific events, market trends, bid/asked quotes of brokers and information providers and other market data may be reviewed in the course of making a good faith determination of a security’s fair value.
The Fund may invest in securities that are subject to interest rate risk, meaning the risk that the prices will generally fall as interest rates rise and, conversely, the prices will generally rise as interest rates fall. Specific securities differ in their sensitivity to changes in interest rates depending on their individual characteristics. Changes in interest rates may result in increased market volatility, which may affect the value and/or liquidity of certain Fund investments.
Invesco V.I. American Franchise Fund
Valuations change in response to many factors including the historical and prospective earnings of the issuer, the value of the issuer’s assets, general economic conditions, interest rates, investor perceptions and market liquidity. Because of the inherent uncertainties of valuation, the values reflected in the financial statements may materially differ from the value received upon actual sale of those investments.
| B. | Securities Transactions and Investment Income — Securities transactions are accounted for on a trade date basis. Realized gains or losses on sales are computed on the basis of specific identification of the securities sold. Interest income (net of withholding tax, if any) is recorded on the accrual basis from settlement date. Dividend income (net of withholding tax, if any) is recorded on the ex-dividend date. |
The Fund may periodically participate in litigation related to Fund investments. As such, the Fund may receive proceeds from litigation settlements. Any proceeds received are included in the Statement of Operations as realized gain (loss) for investments no longer held and as unrealized gain (loss) for investments still held.
Brokerage commissions and mark ups are considered transaction costs and are recorded as an increase to the cost basis of securities purchased and/or a reduction of proceeds on a sale of securities. Such transaction costs are included in the determination of net realized and unrealized gain (loss) from investment securities reported in the Statement of Operations and the Statement of Changes in Net Assets and the net realized and unrealized gains (losses) on securities per share in the Financial Highlights. Transaction costs are included in the calculation of the Fund’s net asset value and, accordingly, they reduce the Fund’s total returns. These transaction costs are not considered operating expenses and are not reflected in net investment income reported in the Statement of Operations and the Statement of Changes in Net Assets, or the net investment income per share and the ratios of expenses and net investment income reported in the Financial Highlights, nor are they limited by any expense limitation arrangements between the Fund and the investment adviser.
The Fund allocates income and realized and unrealized capital gains and losses to a class based on the relative net assets of each class.
| C. | Country Determination — For the purposes of making investment selection decisions and presentation in the Schedule of Investments, the investment adviser may determine the country in which an issuer is located and/or credit risk exposure based on various factors. These factors include the laws of the country under which the issuer is organized, where the issuer maintains a principal office, the country in which the issuer derives 50% or more of its total revenues and the country that has the primary market for the issuer’s securities, as well as other criteria. Among the other criteria that may be evaluated for making this determination are the country in which the issuer maintains 50% or more of its assets, the type of security, financial guarantees and enhancements, the nature of the collateral and the sponsor organization. Country of issuer and/or credit risk exposure has been determined to be the United States of America, unless otherwise noted. |
| D. | Distributions– Distributions from net investment income and net realized capital gain, if any, are generally declared and paid to separate accounts of participating insurance companies annually and recorded on the ex-dividend date. |
| E. | Federal Income Taxes –The Fund intends to comply with the requirements of Subchapter M of the Internal Revenue Code of 1986, as amended (the “Internal Revenue Code”), necessary to qualify as a regulated investment company and to distribute substantially all of the Fund’s taxable earnings to shareholders. As such, the Fund will not be subject to federal income taxes on otherwise taxable income (including net realized capital gain) that is distributed to shareholders. Therefore, no provision for federal income taxes is recorded in the financial statements. |
The Fund recognizes the tax benefits of uncertain tax positions only when the position is more likely than not to be sustained. Management has analyzed the Fund’s uncertain tax positions and concluded that no liability for unrecognized tax benefits should be recorded related to uncertain tax positions. Management is not aware of any tax positions for which it is reasonably possible that the total amounts of unrecognized tax benefits will change materially in the next 12 months.
The Fund files tax returns in the U.S. Federal jurisdiction and certain other jurisdictions. Generally, the Fund is subject to examinations by such taxing authorities for up to three years after the filing of the return for the tax period.
| F. | Expenses– Fees provided for under the Rule 12b-1 plan of a particular class of the Fund and which are directly attributable to that class are charged to the operations of such class. All other expenses are allocated among the classes based on relative net assets. |
| G. | Accounting Estimates – The preparation of financial statements in conformity with accounting principles generally accepted in the United States of America (“GAAP”) requires management to make estimates and assumptions that affect the reported amounts of assets and liabilities at the date of the financial statements and the reported amounts of revenues and expenses during the reporting period including estimates and assumptions related to taxation. Actual results could differ from those estimates by a significant amount. In addition, the Fund monitors for material events or transactions that may occur or become known after the period-end date and before the date the financial statements are released to print. |
| H. | Indemnifications – Under the Trust’s organizational documents, each Trustee, officer, employee or other agent of the Trust is indemnified against certain liabilities that may arise out of the performance of their duties to the Fund. Additionally, in the normal course of business, the Fund enters into contracts, including the Fund’s servicing agreements, that contain a variety of indemnification clauses. The Fund’s maximum exposure under these arrangements is unknown as this would involve future claims that may be made against the Fund that have not yet occurred. The risk of material loss as a result of such indemnification claims is considered remote. |
| I. | Securities Lending– The Fund may lend portfolio securities having a market value up to one-third of the Fund’s total assets. Such loans are secured by collateral equal to no less than the market value of the loaned securities determined daily by the securities lending provider. Such collateral will be cash or debt securities issued or guaranteed by the U.S. Government or any of its sponsored agencies. Cash collateral received in connection with these loans is invested in short-term money market instruments or affiliated money market funds and is shown as such on the Schedule of Investments. The Fund bears the risk of loss with respect to the investment of collateral. It is the Fund’s policy to obtain additional collateral from or return excess collateral to the borrower by the end of the next business day, following the valuation date of the securities loaned. Therefore, the value of the collateral held may be temporarily less than the value of the securities on loan. When loaning securities, the Fund retains certain benefits of owning the securities, including the economic equivalent of dividends or interest generated by the security. Lending securities entails a risk of loss to the Fund if, and to the extent that, the market value of the securities loaned were to increase and the borrower did not increase the collateral accordingly, and the borrower failed to return the securities. The securities loaned are subject to termination at the option of the borrower or the Fund. Upon termination, the borrower will return to the Fund the securities loaned and the Fund will return the collateral. Upon the failure of the borrower to return the securities, collateral may be liquidated and the securities may be purchased on the open market to replace the loaned securities. The Fund could experience delays and costs in gaining access to the collateral and the securities may lose value during the delay which could result in potential losses to the Fund. Some of these losses may be indemnified by the lending agent. The Fund bears the risk of any deficiency in the amount of the collateral available for return to the borrower due to any loss on the |
Invesco V.I. American Franchise Fund
| | collateral invested. Dividends received on cash collateral investments for securities lending transactions, which are net of compensation to counterparties, are included inDividends from affiliated money market funds on the Statement of Operations. The aggregate value of securities out on loan, if any, is shown as a footnote on the Statement of Assets and Liabilities. |
| J. | Foreign Currency Translations— Foreign currency is valued at the close of the NYSE based on quotations posted by banks and major currency dealers. Portfolio securities and other assets and liabilities denominated in foreign currencies are translated into U.S. dollar amounts at the date of valuation. Purchases and sales of portfolio securities (net of foreign taxes withheld on disposition) and income items denominated in foreign currencies are translated into U.S. dollar amounts on the respective dates of such transactions. The Fund does not separately account for the portion of the results of operations resulting from changes in foreign exchange rates on investments and the fluctuations arising from changes in market prices of securities held. The combined results of changes in foreign exchange rates and the fluctuation of market prices on investments (net of estimated foreign tax withholding) are included with the net realized and unrealized gain or loss from investments in the Statement of Operations. Reported net realized foreign currency gains or losses arise from (1) sales of foreign currencies, (2) currency gains or losses realized between the trade and settlement dates on securities transactions, and (3) the difference between the amounts of dividends, interest, and foreign withholding taxes recorded on the Fund’s books and the U.S. dollar equivalent of the amounts actually received or paid. Net unrealized foreign currency gains and losses arise from changes in the fair values of assets and liabilities, other than investments in securities at fiscal period end, resulting from changes in exchange rates. |
The Fund may invest in foreign securities, which may be subject to foreign taxes on income, gains on investments or currency repatriation, a portion of which may be recoverable. Foreign taxes, if any, are recorded based on the tax regulations and rates that exist in the foreign markets in which the Fund invests and are shown in the Statement of Operations.
| K. | Forward Foreign Currency Contracts— The Fund may engage in foreign currency transactions either on a spot (i.e. for prompt delivery and settlement) basis, or through forward foreign currency contracts, to manage or minimize currency or exchange rate risk. |
The Fund may also enter into forward foreign currency contracts for the purchase or sale of a security denominated in a foreign currency in order to “lock in” the U.S. dollar price of that security, or the Fund may also enter into forward foreign currency contracts that do not provide for physical settlement of the two currencies, but instead are settled by a single cash payment calculated as the difference between the agreed upon exchange rate and the spot rate at settlement based upon an agreed upon notional amount (non-deliverable forwards). The Fund will set aside liquid assets in an amount equal to the daily mark-to-market obligation for forward foreign currency contracts.
A forward foreign currency contract is an obligation between two parties (“Counterparties”) to purchase or sell a specific currency for an agreed-upon price at a future date. The use of forward foreign currency contracts does not eliminate fluctuations in the price of the underlying securities the Fund owns or intends to acquire but establishes a rate of exchange in advance. Fluctuations in the value of these contracts are measured by the difference in the contract date and reporting date exchange rates and are recorded as unrealized appreciation (depreciation) until the contracts are closed. When the contracts are closed, realized gains (losses) are recorded. Realized and unrealized gains (losses) on the contracts are included in the Statement of Operations. The primary risks associated with forward foreign currency contracts include failure of the Counterparty to meet the terms of the contract and the value of the foreign currency changing unfavorably. These risks may be in excess of the amounts reflected in the Statement of Assets and Liabilities.
NOTE 2—Advisory Fees and Other Fees Paid to Affiliates
The Trust has entered into a master investment advisory agreement with Invesco Advisers, Inc. (the "Adviser" or "Invesco"). Under the terms of the investment advisory agreement, the Fund accrues daily and pays monthly an advisory fee to the Adviser based on the annual rate of the Fund’s average daily net assets as follows:
| Average Daily Net Assets | Rate |
| First $250 million | 0.695% |
| Next $250 million | 0.67% |
| Next $500 million | 0.645% |
| Next $550 million | 0.62% |
| Next $3.45 billion | 0.60% |
| Next $250 million | 0.595% |
| Next $2.25 billion | 0.57% |
| Next $2.5 billion | 0.545% |
| Over $10 billion | 0.52% |
For the six months ended June 30, 2019, the effective advisory fees incurred by the Fund was 0.68%.
Under the terms of a master sub-advisory agreement between the Adviser and each of Invesco Asset Management Deutschland GmbH, Invesco Asset Management Limited, Invesco Asset Management (Japan) Limited, Invesco Hong Kong Limited, Invesco Senior Secured Management, Inc. and Invesco Canada Ltd. and separate sub-advisory agreements with Invesco Capital Management LLC and Invesco Asset Management (India) Private Limited (collectively, the "Affiliated Sub-Advisers") the Adviser, not the Fund, will pay 40% of the fees paid to the Adviser to any such Affiliated Sub-Adviser(s) that provide(s) discretionary investment management services to the Fund based on the percentage of assets allocated to such Affiliated Sub-Adviser(s).
The Adviser has contractually agreed, through at least June 30, 2020, to waive advisory fees and/or reimburse expenses of all shares to the extent necessary to limit total annual fund operating expenses after fee waiver and/or expense reimbursement (excluding certain items discussed below) of Series I shares to 2.00% and Series II shares to 2.25% of average daily net assets (the “expense limits”). In determining the Adviser’s obligation to waive advisory fees and/or reimburse expenses, the following expenses are not taken into account, and could cause the total annual fund operating expenses after fee waiver and/or expense reimbursement to exceed the numbers reflected above: (1) interest; (2) taxes; (3) dividend expense on short sales; (4) extraordinary or non-routine items, including litigation expenses; and (5) expenses that the Fund has incurred but did not actually pay because of an expense offset arrangement. Unless Invesco continues the fee waiver agreement, it will terminate on June 30, 2020.
Invesco V.I. American Franchise Fund
During its term, the fee waiver agreement cannot be terminated or amended to increase the expense limits or reduce the advisory fee waiver without approval of the Board of Trustees. The Adviser did not waive fees and/or reimburse expenses during the period under these expense limits.
Further, the Adviser has contractually agreed, through at least June 30, 2021, to waive the advisory fee payable by the Fund in an amount equal to 100% of the net advisory fees the Adviser receives from the affiliated money market funds on investments by the Fund of uninvested cash (excluding investments of cash collateral from securities lending) in such affiliated money market funds.
For the six months ended June 30, 2019, the Adviser waived advisory fees of $1,935.
The Trust has entered into a master administrative services agreement with Invesco pursuant to which the Fund has agreed to pay Invesco a fee for costs incurred in providing accounting services and fund administrative services to the Fund and to reimburse Invesco for fees paid to insurance companies that have agreed to provide certain administrative services to the Fund. These administrative services provided by the insurance companies may include, among other things: maintenance of master accounts with the Fund; tracking, recording and transmitting net purchase and redemption orders for Fund shares; maintaining and preserving records related to the purchase, redemption and other account activity of variable product owners; distributing copies of Fund documents such as prospectuses, proxy materials and periodic reports, to variable product owners, and responding to inquiries from variable product owners about the Fund. Pursuant to such agreement, for the six months ended June 30, 2019, Invesco was paid $42,042 for accounting and fund administrative services and was reimbursed $446,402 for fees paid to insurance companies. Also, Invesco has entered into a sub-administration agreement whereby State Street Bank and Trust Company (“SSB”) serves as custodian and fund accountant and provides certain administrative services to the Fund.
The Trust has entered into a transfer agency and service agreement with Invesco Investment Services, Inc. (“IIS”) pursuant to which the Fund has agreed to pay IIS a fee for providing transfer agency and shareholder services to the Fund and reimburse IIS for certain expenses incurred by IIS in the course of providing such services. For the six months ended June 30, 2019, expenses incurred under the agreement are shown in the Statement of Operations asTransfer agent fees.
The Trust has entered into a master distribution agreement with Invesco Distributors, Inc. (“IDI”) to serve as the distributor for the Fund. The Trust has adopted a plan pursuant to Rule 12b-1 under the 1940 Act with respect to the Fund’s Series II shares (the “Plan”). The Fund, pursuant to the Plan, pays IDI compensation at the annual rate of 0.25% of the Fund’s average daily net assets of Series II shares. The fees are accrued daily and paid monthly. Of the Plan payments, up to 0.25% of the average daily net assets of the Series II shares may be paid to insurance companies who furnish continuing personal shareholder services to customers who purchase and own Series II shares of the Fund. For the six months ended June 30, 2019, expenses incurred under the Plan are detailed in the Statement of Operations asDistribution fees.
For the six months ended June 30, 2019, the Fund incurred $1,318 in brokerage commissions with Invesco Capital Markets, Inc., an affiliate of the Adviser and IDI, for portfolio transactions executed on behalf of the Fund.
Certain officers and trustees of the Trust are officers and directors of the Adviser, IIS and/or IDI.
NOTE 3—Additional Valuation Information
GAAP defines fair value as the price that would be received to sell an asset or paid to transfer a liability in an orderly transaction between market participants at the measurement date, under current market conditions. GAAP establishes a hierarchy that prioritizes the inputs to valuation methods, giving the highest priority to readily available unadjusted quoted prices in an active market for identical assets (Level 1) and the lowest priority to significant unobservable inputs (Level 3), generally when market prices are not readily available or are unreliable. Based on the valuation inputs, the securities or other investments are tiered into one of three levels. Changes in valuation methods may result in transfers in or out of an investment’s assigned level:
Level 1 – Prices are determined using quoted prices in an active market for identical assets.
Level 2 – Prices are determined using other significant observable inputs. Observable inputs are inputs that other market participants may use in pricing a security. These may include quoted prices for similar securities, interest rates, prepayment speeds, credit risk, yield curves, loss severities, default rates, discount rates, volatilities and others.
Level 3 – Prices are determined using significant unobservable inputs. In situations where quoted prices or observable inputs are unavailable (for example, when there is little or no market activity for an investment at the end of the period), unobservable inputs may be used. Unobservable inputs reflect the Fund’s own assumptions about the factors market participants would use in determining fair value of the securities or instruments and would be based on the best available information.
The following is a summary of the tiered valuation input levels, as of June 30, 2019. The level assigned to the securities valuations may not be an indication of the risk or liquidity associated with investing in those securities. Because of the inherent uncertainties of valuation, the values reflected in the financial statements may materially differ from the value received upon actual sale of those investments.
| | Level 1 | Level 2 | Level 3 | Total |
| Investments in Securities | | | | |
| Common Stocks & Other Equity Interests | $579,806,042 | $40,693,305 | $— | $620,499,347 |
| Money Market Funds | 5,767,743 | — | — | 5,767,743 |
| Total Investments | $585,573,785 | $40,693,305 | $— | $626,267,090 |
NOTE 4—Security Transactions with Affiliated Funds
The Fund is permitted to purchase or sell securities from or to certain other Invesco Funds under specified conditions outlined in procedures adopted by the Board of Trustees of the Trust. The procedures have been designed to ensure that any purchase or sale of securities by the Fund from or to another fund or portfolio that is or could be considered an affiliate by virtue of having a common investment adviser (or affiliated investment advisers), common Trustees and/or common officers complies with Rule 17a-7 of the 1940 Act. Further, as defined under the procedures, each transaction is effected at the current market price. Pursuant to these procedures, for the six-month period ended June 30, 2019, the Fund engaged in securities purchases of $1,897,310.
Invesco V.I. American Franchise Fund
NOTE 5—Trustees’ and Officers’ Fees and Benefits
Trustees’ and Officers’ Fees and Benefits include amounts accrued by the Fund to pay remuneration to certain Trustees and Officers of the Fund. Trustees have the option to defer compensation payable by the Fund, and Trustees’ and Officers’ Fees and Benefits also include amounts accrued by the Fund to fund such deferred compensation amounts. Those Trustees who defer compensation have the option to select various Invesco Funds in which their deferral accounts shall be deemed to be invested. Finally, certain current Trustees were eligible to participate in a retirement plan that provided for benefits to be paid upon retirement to Trustees over a period of time based on the number of years of service. The Fund may have certain former Trustees who also participate in a retirement plan and receive benefits under such plan.Trustees’ and Officers’ Fees and Benefits include amounts accrued by the Fund to fund such retirement benefits. Obligations under the deferred compensation and retirement plans represent unsecured claims against the general assets of the Fund.
NOTE 6—Cash Balances
The Fund is permitted to temporarily carry a negative or overdrawn balance in its account with State Street Bank and Trust Company, the custodian bank. Such balances, if any at period-end, are shown in the Statement of Assets and Liabilities under the payable caption Amount due custodian. To compensate the custodian bank for such overdrafts, the overdrawn Fund may either (1) leave funds as a compensating balance in the account so the custodian bank can be compensated by earning the additional interest; or (2) compensate by paying the custodian bank at a rate agreed upon by the custodian bank and Invesco, not to exceed the contractually agreed upon rate.
NOTE 7—Tax Information
The amount and character of income and gains to be distributed are determined in accordance with income tax regulations, which may differ from GAAP. Reclassifications are made to the Fund’s capital accounts to reflect income and gains available for distribution (or available capital loss carryforward) under income tax regulations. The tax character of distributions paid during the year and the tax components of net assets will be reported at the Fund’s fiscal year-end.
Capital loss carryforward is calculated and reported as of a specific date. Results of transactions and other activity after that date may affect the amount of capital loss carryforward actually available for the Fund to utilize. Capital losses generated in years beginning after December 22, 2010 can be carried forward for an unlimited period, whereas previous losses expire in eight tax years. Capital losses with an expiration period may not be used to offset capital gains until all net capital losses without an expiration date have been utilized. Capital loss carryforwards with no expiration date will retain their character as either short-term or long-term capital losses instead of as short-term capital losses as under prior law. The ability to utilize capital loss carryforwards in the future may be limited under the Internal Revenue Code and related regulations based on the results of future transactions.
The Fund did not have a capital loss carryforward as of December 31, 2018.
NOTE 8—Investment Transactions
The aggregate amount of investment securities (other than short-term securities, U.S. Treasury obligations and money market funds, if any) purchased and sold by the Fund during the six months ended June 30, 2019 was $128,219,373 and $158,435,828, respectively. Cost of investments, including any derivatives, on a tax basis includes the adjustments for financial reporting purposes as of the most recently completed federal income tax reporting period-end.
| Unrealized Appreciation (Depreciation) of Investments on a Tax Basis |
| Aggregate unrealized appreciation of investments | $286,952,634 |
| Aggregate unrealized (depreciation) of investments | (3,294,351) |
| Net unrealized appreciation of investments | $283,658,283 |
Cost of investments for tax purposes is $342,608,807.
NOTE 9—Share Information
| | Summary of Share Activity |
| | Six months ended
June 30, 2019(a) | | Year ended
December 31, 2018 |
| | Shares | Amount | | Shares | Amount |
| Sold: | | | | | |
| Series I | 135,168 | $8,760,276 | | 309,111 | $20,899,475 |
| Series II | 67,983 | 4,232,422 | | 172,561 | 11,056,980 |
| Issued as reinvestment of dividends: | | | | | |
| Series I | — | — | | 428,393 | 29,906,066 |
| Series II | — | — | | 150,914 | 10,129,348 |
Invesco V.I. American Franchise Fund
| | Summary of Share Activity |
| | Six months ended
June 30, 2019(a) | | Year ended
December 31, 2018 |
| | Shares | Amount | | Shares | Amount |
| Reacquired: | | | | | |
| Series I | (560,076) | (36,816,582) | | (1,448,513) | (97,650,766) |
| Series II | (234,091) | (14,810,230) | | (709,185) | (45,451,232) |
| Net increase (decrease) in share activity | (591,016) | $(38,634,114) | | (1,096,719) | $(71,110,129) |
| (a) | There are entities that are record owners of more than 5% of the outstanding shares of the Fund and in the aggregate own 28% of the outstanding shares of the Fund. The Fund and the Fund’s principal underwriter or adviser, are parties to participation agreements with these entities whereby these entities sell units of interest in separate accounts funding variable products that are invested in the Fund. The Fund, Invesco and/or Invesco affiliates may make payments to these entities, which are considered to be related to the Fund, for providing services to the Fund, Invesco and/or Invesco affiliates including but not limited to services such as, securities brokerage, third party record keeping and account servicing and administrative services. The Fund has no knowledge as to whether all or any portion of the shares owned of record by these entities are also owned beneficially. |
Invesco V.I. American Franchise Fund
Calculating your ongoing Fund expenses
Example
As a shareholder of the Fund, you incur ongoing costs, including management fees; distribution and/or service fees (12b-1); and other Fund expenses. This example is intended to help you understand your ongoing costs (in dollars) of investing in the Fund and to compare these costs with ongoing costs of investing in other mutual funds. The example is based on an investment of $1,000 invested at the beginning of the period and held for the entire period January 1, 2019 through June 30, 2019.
The actual and hypothetical expenses in the examples below do not represent the effect of any fees or other expenses assessed in connection with a variable product; if they did, the expenses shown would be higher while the ending account values shown would be lower.
Actual expenses
The table below provides information about actual account values and actual expenses. You may use the information in this table, together with the amount you invested, to estimate the expenses that you paid over the period. Simply divide your account value by $1,000 (for example, an $8,600 account value divided by $1,000 = 8.6), then multiply the result by the number in the table under the heading entitled “Actual Expenses Paid During Period” to estimate the expenses you paid on your account during this period.
Hypothetical example for comparison purposes
The table below also provides information about hypothetical account values and hypothetical expenses based on the Fund’s actual expense ratio and an assumed rate of return of 5% per year before expenses, which is not the Fund’s actual return.
The hypothetical account values and expenses may not be used to estimate the actual ending account balance or expenses you paid for the period. You may use this information to compare the ongoing costs of investing in the Fund and other funds. To do so, compare this 5% hypothetical example with the 5% hypothetical examples that appear in the shareholder reports of the other funds.
Please note that the expenses shown in the table are meant to highlight your ongoing costs. Therefore, the hypothetical information is useful in comparing ongoing costs, and will not help you determine the relative total costs of owning different funds.
| | Beginning
Account Value (01/01/19) | ACTUAL | HYPOTHETICAL
(5% annual return before
expenses) | Annualized
Expense
Ratio |
Ending
Account Value
(06/30/19)1 | Expenses
Paid During
Period2 | Ending
Account Value
(06/30/19) | Expenses
Paid During
Period |
| Series I | $1,000.00 | $1,227.50 | $4.80 | $1,020.48 | $4.36 | 0.87% |
| Series II | 1,000.00 | 1,226.20 | 6.18 | 1,019.24 | 5.61 | 1.12 |
| 1 | The actual ending account value is based on the actual total return of the Fund for the period January 1, 2019 through June 30, 2019, after actual expenses and will differ from the hypothetical ending account value which is based on the Fund’s expense ratio and a hypothetical annual return of 5% before expenses. |
| 2 | Expenses are equal to the Fund’s annualized expense ratio as indicated above multiplied by the average account value over the period, multiplied by 181/365 to reflect the most recent fiscal half year. |
Invesco V.I. American Franchise Fund
Invesco V.I. American Franchise Fund
Approval of Investment Advisory andSub-Advisory Contracts
At meetings held on June 10, 2019, the Board of Trustees (the Board or the Trustees) of AIM Variable Insurance Funds (Invesco Variable Insurance Funds) as a whole, and the independent Trustees, who comprise over 75% of the Board, voting separately, approved the continuance of the Invesco V.I. American Franchise Fund’s (the Fund) Master Investment Advisory Agreement with Invesco Advisers, Inc. (Invesco Advisers and the investment advisory agreement) and the Master IntergroupSub-Advisory Contract for Mutual Funds with Invesco Asset Management Deutschland GmbH, Invesco Asset Management Limited, Invesco Asset Management (Japan) Limited, Invesco Hong Kong Limited, Invesco Senior Secured Management, Inc. and Invesco Canada Ltd. and separatesub-advisory contracts with Invesco Capital Management LLC and Invesco Asset Management (India) Private Limited (collectively, the AffiliatedSub-Advisers and thesub-advisory contracts) for another year, effective July 1, 2019. After evaluating the factors discussed below, among others, the Board approved the renewal of the Fund’s investment advisory agreement and thesub-advisory contracts and determined that the compensation payable by the Fund to Invesco Advisers and by Invesco Advisers to the AffiliatedSub-Advisers is fair and reasonable.
The Board’s Evaluation Process
The Board’s Investments Committee has established threeSub-Committees, which meet throughout the year to review the performance of funds advised by Invesco Advisers (the Invesco Funds). As part of a regularly scheduled basis ofin-person Board meetings, theSub-Committees meet with portfolio managers for their assigned Invesco Funds and other members of management to review detailed information about investment performance and portfolio attributes of these funds. The Board took into account evaluations and reports that it received from the Investments Committee andSub-Committees, as well as the information provided to such committees and the Board throughout the year, in considering whether to approve each Invesco Fund’s investment advisory agreement andsub-advisory contracts.
As part of the contract renewal process, the Board reviews and considers information provided in response to detailed requests for information submitted to management by the independent Trustees with assistance from legal counsel to the independent Trustees. The Board receives comparative investment performance and fee data regarding the Invesco Funds prepared by Invesco Advisers and Broadridge Financial Solutions, Inc. (Broadridge), an independent mutual fund data provider. The Board also receives an independent written evaluation from the Senior Officer, an officer of the Invesco Funds who reports directly to the
independent Trustees. The Senior Officer’s evaluation is prepared as part of his responsibility to manage the process by which the Invesco Funds’ proposed management fees are negotiated during the annual contract renewal process to ensure they are negotiated in a manner that is at arms’ length and reasonable. In addition to meetings with Invesco Advisers and fund counsel throughout the year, the independent Trustees also discuss the continuance of the investment advisory agreement andsub-advisory contracts in separate sessions with the Senior Officer and with independent legal counsel.
The discussion below is a summary of the Senior Officer’s independent written evaluation with respect to the Fund’s investment advisory agreement, as well as a discussion of the material factors and related conclusions that formed the basis for the Board’s approval of the Fund’s investment advisory agreement andsub-advisory contracts. The Trustees’ review and conclusions are based on the comprehensive consideration of all information presented to them during the course of the year and in prior years and are not the result of any single determinative factor. Moreover, one Trustee may have weighed a particular piece of information or factor differently than another Trustee. This information is current as of June 10, 2019.
Factors and Conclusions and Summary of Independent Written Fee Evaluation
| A. | Nature, Extent and Quality of Services Provided by Invesco Advisers and the AffiliatedSub-Advisers |
The Board reviewed the nature, extent and quality of the advisory services provided to the Fund by Invesco Advisers under the Fund’s investment advisory agreement, and the credentials and experience of the officers and employees of Invesco Advisers who provide these services, including the Fund’s portfolio manager(s). The Board’s review included consideration of Invesco Advisers’ investment process oversight and structure, credit analysis and investment risk management. The Board also considerednon-advisory services that Invesco Advisers and its affiliates provide to the Invesco Funds such as various back office support functions, third party oversight, internal audit, valuation, portfolio trading and legal and compliance. The Board also received and reviewed information about Invesco Advisers’ role as administrator of the Invesco Funds’ liquidity risk management program. The Board also reviewed and considered the benefits to shareholders of investing in a fund that is part of the Invesco family of funds under the umbrella of Invesco Ltd., Invesco Advisers’ parent company, and noted Invesco Ltd.’s depth and experience in conducting an investment management business, as well as its commitment of financial and other resources to
such business. The Board reviewed and considered information about the resources that Invesco Advisers intends to continue to commit to managing the Invesco family of funds following Invesco Ltd.’s acquisition of OppenheimerFunds, Inc. and its subsidiaries. The Board concluded that the nature, extent and quality of the services provided to the Fund by Invesco Advisers are appropriate and satisfactory.
The Board reviewed the services that may be provided by the AffiliatedSub-Advisers under thesub-advisory contracts and the credentials and experience of the officers and employees of the AffiliatedSub-Advisers who provide these services. The Board noted the AffiliatedSub-Advisers’ expertise with respect to certain asset classes and that the AffiliatedSub-Advisers have offices and personnel that are located in financial centers around the world. As a result, the Board noted that the AffiliatedSub-Advisers can provide research and investment analysis on the markets and economies of various countries in which the Fund may invest, make recommendations regarding securities and assist with security trades. The Board concluded that thesub-advisory contracts may benefit the Fund and its shareholders by permitting Invesco Advisers to use the resources and talents of the AffiliatedSub-Advisers in managing the Fund. The Board concluded that the nature, extent and quality of the services that may be provided by the AffiliatedSub-Advisers are appropriate and satisfactory.
| B. | Fund Investment Performance |
The Board considered Fund investment performance as a relevant factor in considering whether to approve the investment advisory agreement. The Board did not view Fund investment performance as a relevant factor in considering whether to approve thesub-advisory contracts for the Fund, as no AffiliatedSub-Adviser currently manages assets of the Fund.
The Board compared the Fund’s investment performance over multiple time periods ending December 31, 2018 to the performance of funds in the Broadridge performance universe and against the Lipper Variable Underlying FundsLarge-Cap Growth Funds Index. The Board noted that performance of Series I shares of the Fund was in the fifth quintile of its performance universe for the one, three and five year periods (the first quintile being the best performing funds and the fifth quintile being the worst performing funds). The Board noted that performance of Series I shares of the Fund was below the performance of the Index for the one, three and five year periods. The Board noted that the Fund’s security selection in and underweight and overweight exposure to certain sectors detracted from the Fund’s performance.
Invesco V.I. American Franchise Fund
The Trustees also reviewed more recent Fund performance and this review did not change their conclusions.
| C. | Advisory andSub-Advisory Fees and Fund Expenses |
The Board compared the Fund’s contractual management fee rate to the contractual management fee rates of funds in the Fund’s Broadridge expense group. The Board noted that the contractual management fee rate for Series I shares of the Fund was below the median contractual management fee rate of funds in its expense group. The Board noted that the term “contractual management fee” for funds in the expense group may include both advisory and certainnon-portfolio management administrative services fees, but that Broadridge does not provide information on a fund by fund basis as to what is included. The Board also reviewed the methodology used by Broadridge in providing expense group information, which includes using each fund’s contractual management fee schedule (including any applicable breakpoints) as reported in the most recent prospectus or statement of additional information for each fund in the expense group. The Board also considered comparative information regarding the Fund’s total expense ratio and its various components.
The Board noted that Invesco Advisers has contractually agreed to waive fees and/or limit expenses of the Fund for the term disclosed in the Fund’s registration statement in an amount necessary to limit total annual operating expenses to a specified percentage of average daily net assets for each class of the Fund.
The Board also considered the fees charged by Invesco Advisers and the AffiliatedSub-Advisers to other similarly managed client accounts. The Board noted that Invesco Advisers or the AffiliatedSub-Advisers may charge lower fees to large institutional clients. Invesco Advisers reviewed with the Board differences in the scope of services it provides to the Invesco Funds relative to certain other types of client accounts, including management of cash flows as a result of redemptions and purchases, necessary infrastructure such as officers, office space, technology, legal and distribution, oversight of service providers, costs and business risks associated with launching new funds and sponsoring and maintaining the product line, preparation of annual registration statement updates and financial information and compliance with federal and state laws and regulations.
The Board also considered the services that may be provided by the AffiliatedSub-Advisers pursuant to thesub-advisory contracts, as well as the fees payable by Invesco Advisers to the AffiliatedSub-Advisers pursuant to thesub-advisory contracts.
| D. | Economies of Scale and Breakpoints |
The Board considered the extent to which there may be economies of scale in the provision of advisory services to the Fund. The Board considered Invesco’s reinvestment in its
business, including investments in business infrastructure and cybersecurity. The Board also considered that the Fund benefits from economies of scale through contractual breakpoints in the Fund’s advisory fee schedule, which generally operate to reduce the Fund’s expense ratio as it grows in size. The Board noted that the Fund shares directly in economies of scale through lower fees charged by third party service providers based on the combined size of the Invesco Funds. The Board noted that the Fund may also benefit from economies of scale through initial fee setting, fee waivers and expense reimbursements.
| E. | Profitability and Financial Resources |
The Board reviewed information from Invesco Advisers concerning the costs of the advisory and other services that Invesco Advisers and its affiliates provide to the Fund and the Invesco Funds and the profitability of Invesco Advisers and its affiliates in providing these services. The Board considered the methodology used for calculating profitability and noted the periodic review of such methodology by an independent consultant. The Board noted that Invesco Advisers continues to operate at a net profit from services Invesco Advisers and its affiliates provide to the Invesco Funds and the Fund. The Board did not deem the level of profits realized by Invesco Advisers and its affiliates from providing services to the Fund to be excessive given the nature, extent and quality of the services provided. The Board received information from Invesco Advisers demonstrating that Invesco Advisers and the AffiliatedSub-Advisers are financially sound and have the resources necessary to perform their obligations under the investment advisory agreement andsub-advisory contracts.
| F. | Collateral Benefits to Invesco Advisers and its Affiliates |
The Board considered various other benefits received by Invesco Advisers and its affiliates from the relationship with the Fund, including the fees received for providing administrative, transfer agency and distribution services to the Fund. The Board considered comparative information regarding fees charged for these services, including information provided by Broadridge and other independent sources. The Board considered the performance of Invesco Advisers and its affiliates in providing these services and the organizational structure employed to provide these services. The Board also considered that these services are provided to the Fund pursuant to written contracts that are reviewed and approved on an annual basis by the Board; and that the services are required for the operation of the Fund.
The Board considered the benefits realized by Invesco Advisers and the AffiliatedSub-Advisers as a result of portfolio brokerage transactions executed through “soft dollar” arrangements. The Board noted that soft dollar arrangements may result in the Fund bearing costs to purchase research that may be used by Invesco Advisers or the AffiliatedSub-Advisers with other clients and may reduce Invesco Advisers’
or the AffiliatedSub-Advisers’ expenses. The Board also considered that it receives periodic reports from Invesco representing that these arrangements are consistent with regulatory requirements. The Board did not deem the soft dollar arrangements to be inappropriate.
The Board considered that the Fund’s uninvested cash and cash collateral from any securities lending arrangements may be invested in money market funds advised by Invesco Advisers pursuant to procedures approved by the Board. The Board considered information regarding the returns of the affiliated money market funds relative to comparable overnight investments, as well as the costs to the Fund of such investments. The Board noted that Invesco Advisers receives advisory fees from these affiliated money market funds attributable to such investments, although Invesco Advisers has contractually agreed to waive through varying periods the advisory fees payable by the Invesco Funds with respect to certain investments in the affiliated money market funds. The waiver is in an amount equal to 100% of the net advisory fee Invesco Advisers receives from the affiliated money market funds with respect to the Fund’s investment in the affiliated money market funds of uninvested cash, but not cash collateral. The Board concluded that the amount of advisory fees received by Invesco Advisers from the Fund’s investment of cash collateral from any securities lending arrangements in the affiliated money market funds is fair and reasonable.
The Board also considered that an affiliated broker may receive commissions for executing certain trades for the Fund. Invesco Advisers and the AffiliatedSub-Advisers may use the affiliated broker to, among other things, control order routing and minimize information leakage, and the Board was advised that such trades are executed in compliance with rules under the federal securities laws and consistent with best execution obligations.
Invesco V.I. American Franchise Fund
| Semiannual Report to Shareholders | June 30, 2019 |
Invesco V.I. American Value Fund
Beginning on January 1, 2021, as permitted by regulations adopted by the Securities and Exchange Commission, the insurance company that offers your variable annuity or variable life insurance contract may no longer send you paper copies of the Fund’s shareholder reports by mail, unless you specifically request paper copies of the reports from the insurance company or your financial intermediary. Instead of delivering paper copies of the report, the insurance company may choose to make the reports available on a website, and will notify you by mail each time a report is posted and provide you with a website link to access the report. Instructions for requesting paper copies will be provided by your insurance company.
If the insurance company offers electronic delivery, you may elect to receive shareholder reports and other communications about the Fund electronically by following the instructions provided by the insurance company or by contacting your financial intermediary. If you already elected to receive shareholder reports electronically, you will not be affected by this change and you need not take any action.
You may elect to receive all future reports in paper free of charge from the insurance company. You can inform the insurance company or your financial intermediary that you wish to continue receiving paper copies of your shareholder reports by following the instructions provided by the insurance company or by contacting your financial intermediary. Your election to receive reports in paper will apply to all portfolio companies available under your contract with the insurance company.
The Fund provides a complete list of its holdings four times in each fiscal year, at the quarter-ends. For the second and fourth quarters, the lists appear in the Fund’s semiannual and annual reports to shareholders. For the first and third quarters, the Fund files the lists with the Securities and Exchange Commission (SEC) on Form N-Q (or any successor Form). The Fund’s Form N-Q (or any successor Form) filings are available on the SEC website, sec.gov. The SEC file numbers for the Fund are 811-07452 and 033-57340. The Fund’s most recent portfolio holdings, as filed on Form N-Q (or any successor Form), have also been made available to insurance companies issuing variable annuity contracts and variable life insurance policies (“variable products”) that invest in the Fund.
A description of the policies and procedures that the Fund uses to determine how to vote proxies relating to portfolio securities is available without charge, upon request, from our Client Services department at 800 959 4246 or at invesco.com/proxyguidelines. The information is also available on the SEC website, sec.gov.
Information regarding how the Fund voted proxies related to its portfolio securities during the most recent 12-month period ended June 30 is available at invesco.com/proxysearch. The information is also available on the SEC website, sec.gov.
Invesco Advisers, Inc. is an investment adviser; it provides investment advisory services to individual and institutional clients and does not sell securities. Invesco Distributors, Inc. is the US distributor for Invesco Ltd.’s retail mutual funds, exchange-traded funds and institutional money market funds. Both are wholly owned, indirect subsidiaries of Invesco Ltd.
This report must be accompanied or preceded by a currently effective Fund prospectus and variable product prospectus, which contain more complete information, including sales charges and expenses. Investors should read each carefully before investing.
NOT FDIC INSURED | MAY LOSE VALUE | NO BANK GUARANTEE
| Invesco Distributors, Inc. | VK-VIAMVA-SAR-1 |
Performance summary
Fund vs. Indexes
Cumulative total returns, December 31, 2018 to June 30, 2019, excluding variable product issuer charges. If variable product issuer charges were included, returns would be lower.
| Series I Shares | 16.23% |
| Series II Shares | 16.05 |
| S&P 500 Index▼ (Broad Market Index) | 18.54 |
Russell Midcap Value Index■
(Style-Specific Index) | 18.02 |
Lipper VUF Mid-Cap Value Funds Index♦
(Peer Group Index) | 16.27 |
| Source(s):▼FactSet Research Systems Inc.;■ RIMES Technologies Corp.;♦ Lipper Inc. |
TheS&P 500®Index is an unmanaged index considered representative of the US stock market.
TheRussell Midcap® Value Index is an unmanaged index considered representative of mid-cap value stocks. The Russell Midcap Value Index is a trademark/service mark of the Frank Russell Co. Russell® is a trademark of the Frank Russell Co.
TheLipper VUF Mid-Cap Value Funds Index is an unmanaged index considered representative of mid-cap value variable insurance underlying funds tracked by Lipper.
The Fund is not managed to track the performance of any particular index, including the indexes described here, and consequently, the performance of the Fund may deviate significantly from the performance of the indexes.
A direct investment cannot be made in an index. Unless otherwise indicated, index results include reinvested dividends, and they do not reflect sales charges. Performance of the peer group, if applicable, reflects fund expenses; performance of a market index does not.
| Average Annual Total Returns |
| As of 6/30/19 |
| Series I Shares | |
| Inception (1/2/97) | 9.26% |
| 10 Years | 12.40 |
| 5 Years | 3.62 |
| 1 Year | –3.51 |
| Series II Shares | |
| Inception (5/5/03) | 9.63% |
| 10 Years | 12.17 |
| 5 Years | 3.36 |
| 1 Year | –3.80 |
Effective June 1, 2010, Class I and Class II shares of the predecessor fund, The Universal Institutional Funds, Inc. U.S. Mid Cap Value Portfolio, advised by Morgan Stanley Investment Management Inc. were reorganized into Series I and Series II shares, respectively, of Invesco Van Kampen V.I. Mid Cap Value Fund (renamed Invesco V.I. American Value Fund on April 29, 2013). Returns shown above, prior to June 1, 2010, for Series I and Series II shares are blended returns of the predecessor fund and Invesco V.I. American Value Fund. Share class returns will differ from the predecessor fund because of different expenses.
The performance data quoted represent past performance and cannot guarantee comparable future results; current performance may be lower or higher. Please contact your variable product issuer or financial adviser for the most recent month-end variable product performance. Performance figures reflect Fund expenses, rein-
vested distributions and changes in net asset value. Performance figures do not reflect deduction of taxes a shareholder would pay on Fund distributions or sale of Fund shares. Investment return and principal value will fluctuate so that you may have a gain or loss when you sell shares.
The total annual Fund operating expense ratio set forth in the most recent Fund prospectus as of the date of this report for Series I and Series II shares was 0.93% and 1.18%, respectively. The expense ratios presented above may vary from the expense ratios presented in other sections of this report that are based on expenses incurred during the period covered by this report.
Invesco V.I. American Value Fund, a series portfolio of AIM Variable Insurance Funds (Invesco Variable Insurance Funds), is currently offered through insurance companies issuing variable products. You cannot pur-
chase shares of the Fund directly. Performance figures given represent the Fund and are not intended to reflect actual variable product values. They do not reflect sales charges, expenses and fees assessed in connection with a variable product. Sales charges, expenses and fees, which are determined by the variable product issuers, will vary and will lower the total return.
The most recent month-end performance at the Fund level, excluding variable product charges, is available at 800 451 4246. As mentioned above, for the most recent month-end performance including variable product charges, please contact your variable product issuer or financial adviser.
Fund performance reflects any applicable fee waivers and/or expense reimbursements. Had the adviser not waived fees and/or reimbursed expenses currently or in the past, returns would have been lower. See current prospectus for more information.
Invesco V.I. American Value Fund
Schedule of Investments(a)
June 30, 2019
(Unaudited)
| | Shares | Value |
| Common Stocks & Other Equity Interests–96.92% |
| Aerospace & Defense–2.48% |
| Textron, Inc. | 130,971 | $6,946,702 |
| Apparel, Accessories & Luxury Goods–2.08% |
| Tapestry, Inc. | 183,747 | 5,830,292 |
| Automotive Retail–1.52% |
| Advance Auto Parts, Inc. | 27,619 | 4,257,193 |
| Biotechnology–1.10% |
| Myriad Genetics, Inc.(b) | 110,836 | 3,079,024 |
| Building Products–2.56% |
| Johnson Controls International PLC | 173,659 | 7,173,853 |
| Communications Equipment–1.82% |
| Ciena Corp.(b) | 123,682 | 5,087,041 |
| Consumer Finance–2.00% |
| Santander Consumer USA Holdings, Inc. | 234,355 | 5,615,146 |
| Copper–1.70% |
| Freeport-McMoRan, Inc. | 411,293 | 4,775,112 |
| Distributors–1.78% |
| LKQ Corp.(b) | 187,090 | 4,978,465 |
| Diversified Chemicals–2.00% |
| Eastman Chemical Co. | 72,199 | 5,619,248 |
| Diversified REITs–2.56% |
| Liberty Property Trust | 143,152 | 7,163,326 |
| Electric Utilities–4.37% |
| Evergy, Inc. | 77,911 | 4,686,347 |
| FirstEnergy Corp. | 176,632 | 7,561,616 |
| | | | 12,247,963 |
| Electronic Equipment & Instruments–2.71% |
| Keysight Technologies, Inc.(b) | 84,547 | 7,593,166 |
| Food Distributors–0.88% |
| Performance Food Group Co.(b) | 61,787 | 2,473,334 |
| Food Retail–1.70% |
| Kroger Co. (The) | 219,474 | 4,764,780 |
| Health Care Facilities–2.60% |
| Encompass Health Corp. | 115,124 | 7,294,257 |
| Health Care Services–2.22% |
| DaVita, Inc.(b) | 110,716 | 6,228,882 |
| Hotels, Resorts & Cruise Lines–6.00% |
| Norwegian Cruise Line Holdings Ltd.(b) | 101,233 | 5,429,126 |
| | Shares | Value |
| Hotels, Resorts & Cruise Lines–(continued) |
| Royal Caribbean Cruises Ltd. | 47,417 | $5,747,415 |
| Wyndham Hotels & Resorts, Inc. | 100,991 | 5,629,238 |
| | | | 16,805,779 |
| Industrial Machinery–2.00% |
| Kennametal, Inc. | 151,365 | 5,598,991 |
| Insurance Brokers–6.05% |
| Arthur J. Gallagher & Co. | 96,241 | 8,429,749 |
| Willis Towers Watson PLC | 44,527 | 8,528,702 |
| | | | 16,958,451 |
| Interactive Home Entertainment–1.88% |
| Take-Two Interactive Software, Inc.(b) | 46,474 | 5,276,193 |
| Investment Banking & Brokerage–2.08% |
| Stifel Financial Corp. | 98,865 | 5,838,967 |
| IT Consulting & Other Services–1.88% |
| DXC Technology Co. | 95,685 | 5,277,028 |
| Life & Health Insurance–1.97% |
| Athene Holding Ltd., Class A(b) | 128,470 | 5,531,918 |
| Managed Health Care–2.87% |
| Centene Corp.(b) | 153,238 | 8,035,801 |
| Marine–2.11% |
| Kirby Corp.(b) | 74,748 | 5,905,092 |
| Office REITs–2.27% |
| Hudson Pacific Properties, Inc. | 191,616 | 6,375,064 |
| Oil & Gas Equipment & Services–2.05% |
| TechnipFMC PLC (United Kingdom) | 221,799 | 5,753,466 |
| Oil & Gas Exploration & Production–5.31% |
| Devon Energy Corp. | 173,489 | 4,947,906 |
| Marathon Oil Corp. | 343,083 | 4,875,209 |
| Noble Energy, Inc. | 225,482 | 5,050,797 |
| | | | 14,873,912 |
| Other Diversified Financial Services–2.61% |
| Voya Financial, Inc. | 132,393 | 7,321,333 |
| Regional Banks–11.08% |
| Chemical Financial Corp. | 130,438 | 5,362,306 |
| Comerica, Inc. | 84,025 | 6,103,576 |
| KeyCorp | 367,932 | 6,530,793 |
| Wintrust Financial Corp. | 76,627 | 5,606,031 |
| Zions Bancorp. N.A. | 161,912 | 7,444,714 |
| | | | 31,047,420 |
See accompanying Notes to Financial Statements which are an integral part of the financial statements.
Invesco V.I. American Value Fund
| | Shares | Value |
| Semiconductor Equipment–2.15% |
| KLA-Tencor Corp. | 50,987 | $6,026,663 |
| Specialized REIT–1.65% |
| Life Storage, Inc. | 48,735 | 4,633,724 |
| Specialty Chemicals–2.41% |
| W.R. Grace & Co. | 88,905 | 6,766,560 |
| Systems Software–1.76% |
| Teradata Corp.(b) | 137,778 | 4,939,341 |
| Trucking–2.71% |
| Knight-Swift Transportation Holdings, Inc. | 231,729 | 7,609,980 |
| Total Common Stocks & Other Equity Interests (Cost $230,046,372) | 271,703,467 |
| | Shares | Value |
| Money Market Funds–2.71% |
| Invesco Government & Agency Portfolio, Institutional Class, 2.26%(c) | 2,652,296 | $2,652,296 |
| Invesco Liquid Assets Portfolio, Institutional Class, 2.40%(c) | 1,894,171 | 1,894,929 |
| Invesco Treasury Portfolio, Institutional Class, 2.22%(c) | 3,031,195 | 3,031,195 |
| Total Money Market Funds (Cost $7,578,194) | 7,578,420 |
| TOTAL INVESTMENTS IN SECURITIES–99.63% (Cost $237,624,566) | 279,281,887 |
| OTHER ASSETS LESS LIABILITIES–0.37% | 1,047,034 |
| NET ASSETS–100.00% | $280,328,921 |
Investment Abbreviations:
| REIT | – Real Estate Investment Trust |
Notes to Schedule of Investments:
| (a) | Industry and/or sector classifications used in this report are generally according to the Global Industry Classification Standard, which was developed by and is the exclusive property and a service mark of MSCI Inc. and Standard & Poor’s. |
| (b) | Non-income producing security. |
| (c) | The money market fund and the Fund are affiliated by having the same investment adviser. The rate shown is the 7-day SEC standardized yield as of June 30, 2019. |
Portfolio Composition
By sector, based on Net Assets
as of June 30, 2019
| Financials | 25.79% |
| Industrials | 11.86 |
| Consumer Discretionary | 11.38 |
| Information Technology | 10.32 |
| Health Care | 8.79 |
| Energy | 7.36 |
| Real Estate | 6.48 |
| Materials | 6.11 |
| Utilities | 4.37 |
| Consumer Staples | 2.58 |
| Communication Services | 1.88 |
| Money Market Funds Plus Other Assets Less Liabilities | 3.08 |
See accompanying Notes to Financial Statements which are an integral part of the financial statements.
Invesco V.I. American Value Fund
Statement of Assets and Liabilities
June 30, 2019
(Unaudited)
| Assets: | |
Investments in securities, at value
(Cost $230,046,372) | $271,703,467 |
| Investments in affiliated money market funds, at value (Cost $7,578,194) | 7,578,420 |
| Cash | 1,275 |
| Receivable for: | |
| Dividends | 405,984 |
| Fund shares sold | 1,042,053 |
| Investment for trustee deferred compensation and retirement plans | 58,717 |
| Total assets | 280,789,916 |
| Liabilities: | |
| Payable for: | |
| Fund shares reacquired | 123,872 |
| Accrued fees to affiliates | 238,323 |
| Accrued trustees’ and officers’ fees and benefits | 479 |
| Accrued other operating expenses | 31,633 |
| Trustee deferred compensation and retirement plans | 66,688 |
| Total liabilities | 460,995 |
| Net assets applicable to shares outstanding | $280,328,921 |
| Net assets consist of: | |
| Shares of beneficial interest | $220,066,917 |
| Distributable earnings | 60,262,004 |
| | $280,328,921 |
| Net Assets: |
| Series I | $82,991,208 |
| Series II | $197,337,713 |
| Shares outstanding, no par value, with an unlimited number of shares authorized: |
| Series I | 5,151,731 |
| Series II | 12,399,843 |
| Series I: | |
| Net asset value per share | $16.11 |
| Series II: | |
| Net asset value per share | $15.91 |
Statement of Operations
For the six months ended June 30, 2019
(Unaudited)
| Investment income: | |
| Total investment income | 2,447,268 |
| Expenses: | |
| Advisory fees | 1,016,503 |
| Administrative services fees | 231,491 |
| Custodian fees | 2,252 |
| Distribution fees - Series II | 247,791 |
| Transfer agent fees | 9,702 |
| Trustees’ and officers’ fees and benefits | 13,485 |
| Reports to shareholders | 4,484 |
| Professional services fees | 20,046 |
| Other | 2,811 |
| Total expenses | 1,548,565 |
| Less: Fees waived | (3,751) |
| Net expenses | 1,544,814 |
| Net investment income | 902,454 |
| Realized and unrealized gain (loss) from: | |
| Net realized gain (loss) from Investment securities | (1,134,212) |
| Change in net unrealized appreciation of Investment securities | 38,194,936 |
| Net realized and unrealized gain | 37,060,724 |
| Net increase in net assets resulting from operations | $37,963,178 |
See accompanying Notes to Financial Statements which are an integral part of the financial statements.
Invesco V.I. American Value Fund
Statement of Changes in Net Assets
For the six months ended June 30, 2019 and the year ended December 31, 2018
(Unaudited)
| | June 30,
2019 | December 31,
2018 |
| Operations: | | |
| Net investment income | $902,454 | $1,196,936 |
| Net realized gain (loss) | (1,134,212) | 23,028,494 |
| Change in net unrealized appreciation (depreciation) | 38,194,936 | (59,304,127) |
| Net increase (decrease) in net assets resulting from operations | 37,963,178 | (35,078,697) |
| Distributions to shareholders from distributable earnings: | | |
| Series I | — | (13,858,867) |
| Series II | — | (33,748,480) |
| Total distributions from distributable earnings | — | (47,607,347) |
| Share transactions–net: | | |
| Series I | (6,979,599) | (2,498,966) |
| Series II | 2,819,227 | (67,396,523) |
| Net increase (decrease) in net assets resulting from share transactions | (4,160,372) | (69,895,489) |
| Net increase (decrease) in net assets | 33,802,806 | (152,581,533) |
| Net assets: | | |
| Beginning of period | 246,526,115 | 399,107,648 |
| End of period | $280,328,921 | $246,526,115 |
See accompanying Notes to Financial Statements which are an integral part of the financial statements.
Invesco V.I. American Value Fund
Financial Highlights
June 30, 2019
(Unaudited)
The following schedule presents financial highlights for a share of the Fund outstanding throughout the periods indicated.
| | Net asset
value,
beginning
of period | Net
investment
income(a) | Net gains
(losses)
on securities
(both
realized and
unrealized) | Total from
investment
operations | Dividends
from net
investment
income | Distributions
from net
realized
gains | Total
distributions | Net asset
value, end
of period | Total
return(b) | Net assets,
end of period
(000’s omitted) | Ratio of
expenses
to average
net assets
with fee waivers
and/or expenses
absorbed | Ratio of
expenses
to average net
assets without
fee waivers
and/or expenses
absorbed | Ratio of net
investment
income
to average
net assets | Portfolio
turnover(c) |
| Series I |
| Six months ended 06/30/19 | $13.86 | $0.06 | $2.19 | $2.25 | $— | $— | $— | $16.11 | 16.23% | $82,991 | 0.92%(d) | 0.92%(d) | 0.81%(d) | 34% |
| Year ended 12/31/18 | 18.38 | 0.10 | (1.87) | (1.77) | (0.09) | (2.66) | (2.75) | 13.86 | (12.65) | 77,491 | 0.93 | 0.93 | 0.52 | 39 |
| Year ended 12/31/17 | 17.06 | 0.08 | 1.59 | 1.67 | (0.14) | (0.21) | (0.35) | 18.38 | 9.96 | 104,510 | 0.94 | 0.94 | 0.48 | 56 |
| Year ended 12/31/16 | 15.69 | 0.13 | 2.23 | 2.36 | (0.06) | (0.93) | (0.99) | 17.06 | 15.49 | 116,762 | 0.97 | 0.97 | 0.84 | 50 |
| Year ended 12/31/15 | 19.92 | 0.06 | (1.82) | (1.76) | (0.06) | (2.41) | (2.47) | 15.69 | (9.13) | 125,686 | 0.99 | 0.99 | 0.33 | 26 |
| Year ended 12/31/14 | 19.89 | 0.07 | 1.78 | 1.85 | (0.10) | (1.72) | (1.82) | 19.92 | 9.75 | 152,938 | 0.99 | 1.00 | 0.32 | 48 |
| Series II |
| Six months ended 06/30/19 | 13.71 | 0.04 | 2.16 | 2.20 | — | — | — | 15.91 | 16.05 | 197,338 | 1.17(d) | 1.17(d) | 0.56(d) | 34 |
| Year ended 12/31/18 | 18.19 | 0.05 | (1.83) | (1.78) | (0.04) | (2.66) | (2.70) | 13.71 | (12.82) | 169,036 | 1.18 | 1.18 | 0.27 | 39 |
| Year ended 12/31/17 | 16.90 | 0.04 | 1.56 | 1.60 | (0.10) | (0.21) | (0.31) | 18.19 | 9.62 | 294,598 | 1.19 | 1.19 | 0.23 | 56 |
| Year ended 12/31/16 | 15.55 | 0.09 | 2.21 | 2.30 | (0.02) | (0.93) | (0.95) | 16.90 | 15.22 | 284,043 | 1.22 | 1.22 | 0.59 | 50 |
| Year ended 12/31/15 | 19.75 | 0.02 | (1.80) | (1.78) | (0.01) | (2.41) | (2.42) | 15.55 | (9.36) | 210,354 | 1.24 | 1.24 | 0.08 | 26 |
| Year ended 12/31/14 | 19.73 | 0.01 | 1.77 | 1.78 | (0.04) | (1.72) | (1.76) | 19.75 | 9.48 | 270,908 | 1.24 | 1.25 | 0.07 | 48 |
| (a) | Calculated using average shares outstanding. |
| (b) | Includes adjustments in accordance with accounting principles generally accepted in the United States of America and as such, the net asset value for financial reporting purposes and the returns based upon those net asset values may differ from the net asset value and returns for shareholder transactions. Total returns are not annualized for periods less than one year, if applicable, and do not reflect charges assessed in connection with a variable product, which if included would reduce total returns. |
| (c) | Portfolio turnover is calculated at the fund level and is not annualized for periods less than one year, if applicable. |
| (d) | Ratios are annualized and based on average daily net assets (000’s omitted) of $84,827 and $199,875 for Series I and Series II shares, respectively. |
See accompanying Notes to Financial Statements which are an integral part of the financial statements.
Invesco V.I. American Value Fund
Notes to Financial Statements
June 30, 2019
(Unaudited)
NOTE 1—Significant Accounting Policies
Invesco V.I. American Value Fund (the “Fund”) is a series portfolio of AIM Variable Insurance Funds (Invesco Variable Insurance Funds) (the “Trust”). The Trust is a Delaware statutory trust registered under the Investment Company Act of 1940, as amended (the “1940 Act”), as an open-end series management investment company. Information presented in these financial statements pertains only to the Fund. Matters affecting the Fund or each class will be voted on exclusively by the shareholders of the Fund or each class. Current Securities and Exchange Commission (“SEC”) guidance, however, requires participating insurance companies offering separate accounts to vote shares proportionally in accordance with the instructions of the contract owners whose investments are funded by shares of each Fund or class.
The Fund’s investment objective is to provide above-average total return over a market cycle of three to five years by investing in common stocks and other equity securities.
The Fund currently offers two classes of shares, Series I and Series II, both of which are offered to insurance company separate accounts funding variable annuity contracts and variable life insurance policies (“variable products”).
The Fund is an investment company and accordingly follows the investment company accounting and reporting guidance in accordance with Financial Accounting Standards Board Accounting Standards Codification Topic 946,Financial Services – Investment Companies.
The following is a summary of the significant accounting policies followed by the Fund in the preparation of its financial statements.
| A. | Security Valuations — Securities, including restricted securities, are valued according to the following policy. |
A security listed or traded on an exchange (except convertible securities) is valued at its last sales price or official closing price as of the close of the customary trading session on the exchange where the security is principally traded, or lacking any sales or official closing price on a particular day, the security may be valued at the closing bid price on that day. Securities traded in the over-the-counter market are valued based on prices furnished by independent pricing services or market makers. When such securities are valued by an independent pricing service they may be considered fair valued. Futures contracts are valued at the final settlement price set by an exchange on which they are principally traded. Listed options are valued at the mean between the last bid and asked prices from the exchange on which they are principally traded. Options not listed on an exchange are valued by an independent source at the mean between the last bid and asked prices. For purposes of determining net asset value (“NAV”) per share, futures and option contracts generally are valued 15 minutes after the close of the customary trading session of the New York Stock Exchange (“NYSE”).
Investments in open-end and closed-end registered investment companies that do not trade on an exchange are valued at the end-of-day net asset value per share. Investments in open-end and closed-end registered investment companies that trade on an exchange are valued at the last sales price or official closing price as of the close of the customary trading session on the exchange where the security is principally traded.
Debt obligations (including convertible securities) and unlisted equities are fair valued using an evaluated quote provided by an independent pricing service. Evaluated quotes provided by the pricing service may be determined without exclusive reliance on quoted prices, and may reflect appropriate factors such as institution-size trading in similar groups of securities, developments related to specific securities, dividend rate (for unlisted equities), yield (for debt obligations), quality, type of issue, coupon rate (for debt obligations), maturity (for debt obligations), individual trading characteristics and other market data. Pricing services generally value debt obligations assuming orderly transactions of institutional round lot size, but a fund may hold or transact in the same securities in smaller, odd lot sizes. Odd lots often trade at lower prices than institutional round lots. Debt obligations are subject to interest rate and credit risks. In addition, all debt obligations involve some risk of default with respect to interest and/or principal payments.
Foreign securities’ (including foreign exchange contracts) prices are converted into U.S. dollar amounts using the applicable exchange rates as of the close of the NYSE. If market quotations are available and reliable for foreign exchange-traded equity securities, the securities will be valued at the market quotations. Because trading hours for certain foreign securities end before the close of the NYSE, closing market quotations may become unreliable. If between the time trading ends on a particular security and the close of the customary trading session on the NYSE, events occur that the investment adviser determines are significant and make the closing price unreliable, the Fund may fair value the security. If the event is likely to have affected the closing price of the security, the security will be valued at fair value in good faith using procedures approved by the Board of Trustees. Adjustments to closing prices to reflect fair value may also be based on a screening process of an independent pricing service to indicate the degree of certainty, based on historical data, that the closing price in the principal market where a foreign security trades is not the current value as of the close of the NYSE. Foreign securities’ prices meeting the approved degree of certainty that the price is not reflective of current value will be priced at the indication of fair value from the independent pricing service. Multiple factors may be considered by the independent pricing service in determining adjustments to reflect fair value and may include information relating to sector indices, American Depositary Receipts and domestic and foreign index futures. Foreign securities may have additional risks including exchange rate changes, potential for sharply devalued currencies and high inflation, political and economic upheaval, the relative lack of issuer information, relatively low market liquidity and the potential lack of strict financial and accounting controls and standards.
Securities for which market prices are not provided by any of the above methods may be valued based upon quotes furnished by independent sources. The last bid price may be used to value equity securities. The mean between the last bid and asked prices is used to value debt obligations, including corporate loans.
Securities for which market quotations are not readily available or became unreliable are valued at fair value as determined in good faith by or under the supervision of the Trust’s officers following procedures approved by the Board of Trustees. Issuer specific events, market trends, bid/asked quotes of brokers and information providers and other market data may be reviewed in the course of making a good faith determination of a security’s fair value.
The Fund may invest in securities that are subject to interest rate risk, meaning the risk that the prices will generally fall as interest rates rise and, conversely, the prices will generally rise as interest rates fall. Specific securities differ in their sensitivity to changes in interest rates depending on their individual characteristics. Changes in interest rates may result in increased market volatility, which may affect the value and/or liquidity of certain Fund investments.
Invesco V.I. American Value Fund
Valuations change in response to many factors including the historical and prospective earnings of the issuer, the value of the issuer’s assets, general economic conditions, interest rates, investor perceptions and market liquidity. Because of the inherent uncertainties of valuation, the values reflected in the financial statements may materially differ from the value received upon actual sale of those investments.
| B. | Securities Transactions and Investment Income – Securities transactions are accounted for on a trade date basis. Realized gains or losses on sales are computed on the basis of specific identification of the securities sold. Interest income (net of withholding tax, if any) is recorded on the accrual basis from settlement date. Dividend income (net of withholding tax, if any) is recorded on the ex-dividend date. |
The Fund may periodically participate in litigation related to Fund investments. As such, the Fund may receive proceeds from litigation settlements. Any proceeds received are included in the Statement of Operations as realized gain (loss) for investments no longer held and as unrealized gain (loss) for investments still held.
Brokerage commissions and mark ups are considered transaction costs and are recorded as an increase to the cost basis of securities purchased and/or a reduction of proceeds on a sale of securities. Such transaction costs are included in the determination of net realized and unrealized gain (loss) from investment securities reported in the Statement of Operations and the Statement of Changes in Net Assets and the net realized and unrealized gains (losses) on securities per share in the Financial Highlights. Transaction costs are included in the calculation of the Fund’s net asset value and, accordingly, they reduce the Fund’s total returns. These transaction costs are not considered operating expenses and are not reflected in net investment income reported in the Statement of Operations and the Statement of Changes in Net Assets, or the net investment income per share and the ratios of expenses and net investment income reported in the Financial Highlights, nor are they limited by any expense limitation arrangements between the Fund and the investment adviser.
The Fund allocates income and realized and unrealized capital gains and losses to a class based on the relative net assets of each class.
The Fund recharacterizes distributions received from REIT investments based on information provided by the REIT into the following categories: ordinary income, long-term and short-term capital gains, and return of capital. If information is not available on a timely basis from the REIT, the recharacterization will be based on available information which may include the previous year’s allocation. If new or additional information becomes available from the REIT at a later date, a recharacterization will be made in the following year. The Fund records as dividend income the amount recharacterized as ordinary income and as realized gain the amount recharacterized as capital gain in the Statement of Operations, and the amount recharacterized as return of capital as a reduction of the cost of the related investment. These recharacterizations are reflected in the accompanying financial statements.
| C. | Country Determination — For the purposes of making investment selection decisions and presentation in the Schedule of Investments, the investment adviser may determine the country in which an issuer is located and/or credit risk exposure based on various factors. These factors include the laws of the country under which the issuer is organized, where the issuer maintains a principal office, the country in which the issuer derives 50% or more of its total revenues and the country that has the primary market for the issuer’s securities, as well as other criteria. Among the other criteria that may be evaluated for making this determination are the country in which the issuer maintains 50% or more of its assets, the type of security, financial guarantees and enhancements, the nature of the collateral and the sponsor organization. Country of issuer and/or credit risk exposure has been determined to be the United States of America, unless otherwise noted. |
| D. | Distributions– Distributions from net investment income and net realized capital gain, if any, are generally declared and paid to separate accounts of participating insurance companies annually and recorded on the ex-dividend date. |
| E. | Federal Income Taxes –The Fund intends to comply with the requirements of Subchapter M of the Internal Revenue Code of 1986, as amended (the “Internal Revenue Code”), necessary to qualify as a regulated investment company and to distribute substantially all of the Fund’s taxable earnings to shareholders. As such, the Fund will not be subject to federal income taxes on otherwise taxable income (including net realized capital gain) that is distributed to shareholders. Therefore, no provision for federal income taxes is recorded in the financial statements. |
The Fund recognizes the tax benefits of uncertain tax positions only when the position is more likely than not to be sustained. Management has analyzed the Fund’s uncertain tax positions and concluded that no liability for unrecognized tax benefits should be recorded related to uncertain tax positions. Management is not aware of any tax positions for which it is reasonably possible that the total amounts of unrecognized tax benefits will change materially in the next 12 months.
The Fund files tax returns in the U.S. Federal jurisdiction and certain other jurisdictions. Generally, the Fund is subject to examinations by such taxing authorities for up to three years after the filing of the return for the tax period.
| F. | Expenses– Fees provided for under the Rule 12b-1 plan of a particular class of the Fund and which are directly attributable to that class are charged to the operations of such class. All other expenses are allocated among the classes based on relative net assets. |
| G. | Accounting Estimates – The preparation of financial statements in conformity with accounting principles generally accepted in the United States of America (“GAAP”) requires management to make estimates and assumptions that affect the reported amounts of assets and liabilities at the date of the financial statements and the reported amounts of revenues and expenses during the reporting period including estimates and assumptions related to taxation. Actual results could differ from those estimates by a significant amount. In addition, the Fund monitors for material events or transactions that may occur or become known after the period-end date and before the date the financial statements are released to print. |
| H. | Indemnifications – Under the Trust’s organizational documents, each Trustee, officer, employee or other agent of the Trust is indemnified against certain liabilities that may arise out of the performance of their duties to the Fund. Additionally, in the normal course of business, the Fund enters into contracts, including the Fund’s servicing agreements, that contain a variety of indemnification clauses. The Fund’s maximum exposure under these arrangements is unknown as this would involve future claims that may be made against the Fund that have not yet occurred. The risk of material loss as a result of such indemnification claims is considered remote. |
Invesco V.I. American Value Fund
NOTE 2—Advisory Fees and Other Fees Paid to Affiliates
The Trust has entered into a master investment advisory agreement with Invesco Advisers, Inc. (the "Adviser" or "Invesco"). Under the terms of the investment advisory agreement, the Fund accrues daily and pays monthly an advisory fee to the Adviser based on the annual rate of the Fund’s average daily net assets as follows:
| Average Daily Net Assets | Rate |
| First $1 billion | 0.72% |
| Over $1 billion | 0.65% |
For the six months ended June 30, 2019, the effective advisory fees incurred by the Fund was 0.72%.
Under the terms of a master sub-advisory agreement between the Adviser and each of Invesco Asset Management Deutschland GmbH, Invesco Asset Management Limited, Invesco Asset Management (Japan) Limited, Invesco Hong Kong Limited, Invesco Senior Secured Management, Inc. and Invesco Canada Ltd. and separate sub-advisory agreements with Invesco Capital Management LLC and Invesco Asset Management (India) Private Limited (collectively, the "Affiliated Sub-Advisers") the Adviser, not the Fund, will pay 40% of the fees paid to the Adviser to any such Affiliated Sub-Adviser(s) that provide(s) discretionary investment management services to the Fund based on the percentage of assets allocated to such Affiliated Sub-Adviser(s).
The Adviser has contractually agreed, through at least June 30, 2020, to waive advisory fees and/or reimburse expenses of all shares to the extent necessary to limit total annual fund operating expenses after fee waiver and/or expense reimbursement (excluding certain items discussed below) of Series I shares to 2.00% and Series II shares to 2.25% of average daily net assets (the “expense limits”). In determining the Adviser’s obligation to waive advisory fees and/or reimburse expenses, the following expenses are not taken into account, and could cause the total annual fund operating expenses after fee waiver and/or expense reimbursement to exceed the numbers reflected above: (1) interest; (2) taxes; (3) dividend expense on short sales; (4) extraordinary or non-routine items, including litigation expenses; and (5) expenses that the Fund has incurred but did not actually pay because of an expense offset arrangement. Unless Invesco continues the fee waiver agreement, it will terminate on June 30, 2020. During its term, the fee waiver agreement cannot be terminated or amended to increase the expense limits or reduce the advisory fee waiver without approval of the Board of Trustees. The Adviser did not waive fees and/or reimburse expenses during the period under these expense limits.
Further, the Adviser has contractually agreed, through at least June 30, 2021, to waive the advisory fee payable by the Fund in an amount equal to 100% of the net advisory fees the Adviser receives from the affiliated money market funds on investments by the Fund of uninvested cash in such affiliated money market funds.
For the six months ended June 30, 2019, the Adviser waived advisory fees of $3,751.
The Trust has entered into a master administrative services agreement with Invesco pursuant to which the Fund has agreed to pay Invesco a fee for costs incurred in providing accounting services and fund administrative services to the Fund and to reimburse Invesco for fees paid to insurance companies that have agreed to provide certain administrative services to the Fund. These administrative services provided by the insurance companies may include, among other things: maintenance of master accounts with the Fund; tracking, recording and transmitting net purchase and redemption orders for Fund shares; maintaining and preserving records related to the purchase, redemption and other account activity of variable product owners; distributing copies of Fund documents such as prospectuses, proxy materials and periodic reports, to variable product owners, and responding to inquiries from variable product owners about the Fund. Pursuant to such agreement, for the six months ended June 30, 2019, Invesco was paid $19,934 for accounting and fund administrative services and was reimbursed $211,557 for fees paid to insurance companies. Also, Invesco has entered into a sub-administration agreement whereby State Street Bank and Trust Company (“SSB”) serves as custodian and fund accountant and provides certain administrative services to the Fund.
The Trust has entered into a transfer agency and service agreement with Invesco Investment Services, Inc. (“IIS”) pursuant to which the Fund has agreed to pay IIS a fee for providing transfer agency and shareholder services to the Fund and reimburse IIS for certain expenses incurred by IIS in the course of providing such services. For the six months ended June 30, 2019, expenses incurred under the agreement are shown in the Statement of Operations asTransfer agent fees.
The Trust has entered into a master distribution agreement with Invesco Distributors, Inc. (“IDI”) to serve as the distributor for the Fund. The Trust has adopted a plan pursuant to Rule 12b-1 under the 1940 Act with respect to the Fund’s Series II shares (the “Plan”). The Fund, pursuant to the Plan, pays IDI compensation at the annual rate of 0.25% of the Fund’s average daily net assets of Series II shares. The fees are accrued daily and paid monthly. Of the Plan payments, up to 0.25% of the average daily net assets of the Series II shares may be paid to insurance companies who furnish continuing personal shareholder services to customers who purchase and own Series II shares of the Fund. For the six months ended June 30, 2019, expenses incurred under the Plan are detailed in the Statement of Operations asDistribution fees.
For the six months ended June 30, 2019, the Fund incurred $7,190 in brokerage commissions with Invesco Capital Markets, Inc., an affiliate of the Adviser and IDI, for portfolio transactions executed on behalf of the Fund.
Certain officers and trustees of the Trust are officers and directors of the Adviser, IIS and/or IDI.
NOTE 3—Additional Valuation Information
GAAP defines fair value as the price that would be received to sell an asset or paid to transfer a liability in an orderly transaction between market participants at the measurement date, under current market conditions. GAAP establishes a hierarchy that prioritizes the inputs to valuation methods, giving the highest priority to readily available unadjusted quoted prices in an active market for identical assets (Level 1) and the lowest priority to significant unobservable inputs (Level 3), generally when market prices are not readily available or are unreliable. Based on the valuation inputs, the securities or other investments are tiered into one of three levels. Changes in valuation methods may result in transfers in or out of an investment’s assigned level:
Level 1 — Prices are determined using quoted prices in an active market for identical assets.
Level 2 — Prices are determined using other significant observable inputs. Observable inputs are inputs that other market participants may use in pricing a security. These may include quoted prices for similar securities, interest rates, prepayment speeds, credit risk, yield curves, loss severities, default rates, discount rates, volatilities and others.
Invesco V.I. American Value Fund
Level 3 — Prices are determined using significant unobservable inputs. In situations where quoted prices or observable inputs are unavailable (for example, when there is little or no market activity for an investment at the end of the period), unobservable inputs may be used. Unobservable inputs reflect the Fund’s own assumptions about the factors market participants would use in determining fair value of the securities or instruments and would be based on the best available information.
As of June 30, 2019, all of the securities in this Fund were valued based on Level 1 inputs (see the Schedule of Investments for security categories). The level assigned to the securities valuations may not be an indication of the risk or liquidity associated with investing in those securities. Because of the inherent uncertainties of valuation, the values reflected in the financial statements may materially differ from the value received upon actual sale of those investments.
NOTE 4—Trustees’ and Officers’ Fees and Benefits
Trustees’ and Officers’ Fees and Benefits include amounts accrued by the Fund to pay remuneration to certain Trustees and Officers of the Fund. Trustees have the option to defer compensation payable by the Fund, and Trustees’ and Officers’ Fees and Benefits also include amounts accrued by the Fund to fund such deferred compensation amounts. Those Trustees who defer compensation have the option to select various Invesco Funds in which their deferral accounts shall be deemed to be invested. Finally, certain current Trustees were eligible to participate in a retirement plan that provided for benefits to be paid upon retirement to Trustees over a period of time based on the number of years of service. The Fund may have certain former Trustees who also participate in a retirement plan and receive benefits under such plan.Trustees’ and Officers’ Fees and Benefits include amounts accrued by the Fund to fund such retirement benefits. Obligations under the deferred compensation and retirement plans represent unsecured claims against the general assets of the Fund.
NOTE 5—Cash Balances
The Fund is permitted to temporarily carry a negative or overdrawn balance in its account with State Street Bank and Trust Company, the custodian bank. Such balances, if any at period-end, are shown in the Statement of Assets and Liabilities under the payable caption Amount due custodian. To compensate the custodian bank for such overdrafts, the overdrawn Fund may either (1) leave funds as a compensating balance in the account so the custodian bank can be compensated by earning the additional interest; or (2) compensate by paying the custodian bank at a rate agreed upon by the custodian bank and Invesco, not to exceed the contractually agreed upon rate.
NOTE 6—Tax Information
The amount and character of income and gains to be distributed are determined in accordance with income tax regulations, which may differ from GAAP. Reclassifications are made to the Fund’s capital accounts to reflect income and gains available for distribution (or available capital loss carryforward) under income tax regulations. The tax character of distributions paid during the year and the tax components of net assets will be reported at the Fund’s fiscal year-end.
Capital loss carryforward is calculated and reported as of a specific date. Results of transactions and other activity after that date may affect the amount of capital loss carryforward actually available for the Fund to utilize. Capital losses generated in years beginning after December 22, 2010 can be carried forward for an unlimited period, whereas previous losses expire in eight tax years. Capital losses with an expiration period may not be used to offset capital gains until all net capital losses without an expiration date have been utilized. Capital loss carryforwards with no expiration date will retain their character as either short-term or long-term capital losses instead of as short-term capital losses as under prior law. The ability to utilize capital loss carryforwards in the future may be limited under the Internal Revenue Code and related regulations based on the results of future transactions.
The Fund did not have a capital loss carryforward as of December 31, 2018.
NOTE 7—Investment Transactions
The aggregate amount of investment securities (other than short-term securities, U.S. Treasury obligations and money market funds, if any) purchased and sold by the Fund during the six months ended June 30, 2019 was $93,332,424 and $97,646,496, respectively. Cost of investments, including any derivatives, on a tax basis includes the adjustments for financial reporting purposes as of the most recently completed federal income tax reporting period-end.
| Unrealized Appreciation (Depreciation) of Investments on a Tax Basis |
| Aggregate unrealized appreciation of investments | $50,740,150 |
| Aggregate unrealized (depreciation) of investments | (12,481,992) |
| Net unrealized appreciation of investments | $38,258,158 |
Cost of investments for tax purposes is $241,023,729.
NOTE 8—Share Information
| | Summary of Share Activity |
| | Six months ended
June 30, 2019(a) | | Year ended
December 31, 2018 |
| | Shares | Amount | | Shares | Amount |
| Sold: | | | | | |
| Series I | 79,215 | $1,228,276 | | 237,067 | $3,989,332 |
| Series II | 2,975,843 | 47,477,516 | | 1,290,855 | 23,139,466 |
Invesco V.I. American Value Fund
| | Summary of Share Activity |
| | Six months ended
June 30, 2019(a) | | Year ended
December 31, 2018 |
| | Shares | Amount | | Shares | Amount |
| Issued as reinvestment of dividends: | | | | | |
| Series I | — | — | | 796,944 | 13,858,867 |
| Series II | — | — | | 1,959,842 | 33,748,480 |
| Reacquired: | | | | | |
| Series I | (516,484) | (8,207,875) | | (1,132,589) | (20,347,165) |
| Series II | (2,901,813) | (44,658,289) | | (7,116,736) | (124,284,469) |
| Net increase (decrease) in share activity | (363,239) | $(4,160,372) | | (3,964,617) | $(69,895,489) |
| (a) | There are entities that are record owners of more than 5% of the outstanding shares of the Fund and in the aggregate own 65% of the outstanding shares of the Fund. The Fund and the Fund’s principal underwriter or adviser, are parties to participation agreements with these entities whereby these entities sell units of interest in separate accounts funding variable products that are invested in the Fund. The Fund, Invesco and/or Invesco affiliates may make payments to these entities, which are considered to be related to the Fund, for providing services to the Fund, Invesco and/or Invesco affiliates including but not limited to services such as, securities brokerage, third party record keeping and account servicing and administrative services. The Fund has no knowledge as to whether all or any portion of the shares owned of record by these entities are also owned beneficially. |
Invesco V.I. American Value Fund
Calculating your ongoing Fund expenses
Example
As a shareholder of the Fund, you incur ongoing costs, including management fees; distribution and/or service fees (12b-1); and other Fund expenses. This example is intended to help you understand your ongoing costs (in dollars) of investing in the Fund and to compare these costs with ongoing costs of investing in other mutual funds. The example is based on an investment of $1,000 invested at the beginning of the period and held for the entire period January 1, 2019 through June 30, 2019.
The actual and hypothetical expenses in the examples below do not represent the effect of any fees or other expenses assessed in connection with a variable product; if they did, the expenses shown would be higher while the ending account values shown would be lower.
Actual expenses
The table below provides information about actual account values and actual expenses. You may use the information in this table, together with the amount you invested, to estimate the expenses that you paid over the period. Simply divide your account value by $1,000 (for example, an $8,600 account value divided by $1,000 = 8.6), then multiply the result by the number in the table under the heading entitled “Actual Expenses Paid During Period” to estimate the expenses you paid on your account during this period.
Hypothetical example for comparison purposes
The table below also provides information about hypothetical account values and hypothetical expenses based on the Fund’s actual expense ratio and an assumed rate of return of 5% per year before expenses, which is not the Fund’s actual return.
The hypothetical account values and expenses may not be used to estimate the actual ending account balance or expenses you paid for the period. You may use this information to compare the ongoing costs of investing in the Fund and other funds. To do so, compare this 5% hypothetical example with the 5% hypothetical examples that appear in the shareholder reports of the other funds.
Please note that the expenses shown in the table are meant to highlight your ongoing costs. Therefore, the hypothetical information is useful in comparing ongoing costs, and will not help you determine the relative total costs of owning different funds.
| | Beginning
Account Value (01/01/19) | ACTUAL | HYPOTHETICAL
(5% annual return before
expenses) | Annualized
Expense
Ratio |
Ending
Account Value
(06/30/19)1 | Expenses
Paid During
Period2 | Ending
Account Value
(06/30/19) | Expenses
Paid During
Period2 |
| Series I | $1,000.00 | $1,162.30 | $4.93 | $1,020.23 | $4.61 | 0.92% |
| Series II | 1,000.00 | 1,160.50 | 6.27 | 1,018.99 | 5.86 | 1.17 |
| 1 | The actual ending account value is based on the actual total return of the Fund for the period January 1, 2019 through June 30, 2019, after actual expenses and will differ from the hypothetical ending account value which is based on the Fund’s expense ratio and a hypothetical annual return of 5% before expenses. |
| 2 | Expenses are equal to the Fund’s annualized expense ratio as indicated above multiplied by the average account value over the period, multiplied by 181/365 to reflect the most recent fiscal half year. |
Invesco V.I. American Value Fund
Invesco V.I. American Value Fund
Approval of Investment Advisory andSub-Advisory Contracts
At meetings held on June 10, 2019, the Board of Trustees (the Board or the Trustees) of AIM Variable Insurance Funds (Invesco Variable Insurance Funds) as a whole, and the independent Trustees, who comprise over 75% of the Board, voting separately, approved the continuance of the Invesco V.I. American Value Fund’s (the Fund) Master Investment Advisory Agreement with Invesco Advisers, Inc. (Invesco Advisers and the investment advisory agreement) and the Master IntergroupSub-Advisory Contract for Mutual Funds with Invesco Asset Management Deutschland GmbH, Invesco Asset Management Limited, Invesco Asset Management (Japan) Limited, Invesco Hong Kong Limited, Invesco Senior Secured Management, Inc. and Invesco Canada Ltd. and separatesub-advisory contracts with Invesco Capital Management LLC and Invesco Asset Management (India) Private Limited (collectively, the AffiliatedSub-Advisers and thesub-advisory contracts) for another year, effective July 1, 2019. After evaluating the factors discussed below, among others, the Board approved the renewal of the Fund’s investment advisory agreement and thesub-advisory contracts and determined that the compensation payable by the Fund to Invesco Advisers and by Invesco Advisers to the AffiliatedSub-Advisers is fair and reasonable.
The Board’s Evaluation Process
The Board’s Investments Committee has established threeSub-Committees, which meet throughout the year to review the performance of funds advised by Invesco Advisers (the Invesco Funds). As part of a regularly scheduled basis ofin-person Board meetings, theSub-Committees meet with portfolio managers for their assigned Invesco Funds and other members of management to review detailed information about investment performance and portfolio attributes of these funds. The Board took into account evaluations and reports that it received from the Investments Committee andSub-Committees, as well as the information provided to such committees and the Board throughout the year, in considering whether to approve each Invesco Fund’s investment advisory agreement andsub-advisory contracts.
As part of the contract renewal process, the Board reviews and considers information provided in response to detailed requests for information submitted to management by the independent Trustees with assistance from legal counsel to the independent Trustees. The Board receives comparative investment performance and fee data regarding the Invesco Funds prepared by Invesco Advisers and Broadridge Financial Solutions, Inc. (Broadridge), an independent mutual fund data provider. The Board also receives an independent written evaluation from the Senior Officer, an officer of the Invesco Funds who reports directly to the
independent Trustees. The Senior Officer’s evaluation is prepared as part of his responsibility to manage the process by which the Invesco Funds’ proposed management fees are negotiated during the annual contract renewal process to ensure they are negotiated in a manner that is at arms’ length and reasonable. In addition to meetings with Invesco Advisers and fund counsel throughout the year, the independent Trustees also discuss the continuance of the investment advisory agreement andsub-advisory contracts in separate sessions with the Senior Officer and with independent legal counsel.
The discussion below is a summary of the Senior Officer’s independent written evaluation with respect to the Fund’s investment advisory agreement, as well as a discussion of the material factors and related conclusions that formed the basis for the Board’s approval of the Fund’s investment advisory agreement andsub-advisory contracts. The Trustees’ review and conclusions are based on the comprehensive consideration of all information presented to them during the course of the year and in prior years and are not the result of any single determinative factor. Moreover, one Trustee may have weighed a particular piece of information or factor differently than another Trustee. This information is current as of June 10, 2019.
Factors and Conclusions and Summary of Independent Written Fee Evaluation
| A. | Nature, Extent and Quality of Services Provided by Invesco Advisers and the AffiliatedSub-Advisers |
The Board reviewed the nature, extent and quality of the advisory services provided to the Fund by Invesco Advisers under the Fund’s investment advisory agreement, and the credentials and experience of the officers and employees of Invesco Advisers who provide these services, including the Fund’s portfolio manager(s). The Board’s review included consideration of Invesco Advisers’ investment process oversight and structure, credit analysis and investment risk management. The Board also considerednon-advisory services that Invesco Advisers and its affiliates provide to the Invesco Funds such as various back office support functions, third party oversight, internal audit, valuation, portfolio trading and legal and compliance. The Board also received and reviewed information about Invesco Advisers’ role as administrator of the Invesco Funds’ liquidity risk management program. The Board also reviewed and considered the benefits to shareholders of investing in a fund that is part of the Invesco family of funds under the umbrella of Invesco Ltd., Invesco Advisers’ parent company, and noted Invesco Ltd.’s depth and experience in conducting an investment management business, as well as its
commitment of financial and other resources to such business. The Board reviewed and considered information about the resources that Invesco Advisers intends to continue to commit to managing the Invesco family of funds following Invesco Ltd.’s acquisition of OppenheimerFunds, Inc. and its subsidiaries. The Board concluded that the nature, extent and quality of the services provided to the Fund by Invesco Advisers are appropriate and satisfactory.
The Board reviewed the services that may be provided by the AffiliatedSub-Advisers under thesub-advisory contracts and the credentials and experience of the officers and employees of the AffiliatedSub-Advisers who provide these services. The Board noted the AffiliatedSub-Advisers’ expertise with respect to certain asset classes and that the AffiliatedSub-Advisers have offices and personnel that are located in financial centers around the world. As a result, the Board noted that the AffiliatedSub-Advisers can provide research and investment analysis on the markets and economies of various countries in which the Fund may invest, make recommendations regarding securities and assist with security trades. The Board concluded that thesub-advisory contracts may benefit the Fund and its shareholders by permitting Invesco Advisers to use the resources and talents of the AffiliatedSub-Advisers in managing the Fund. The Board concluded that the nature, extent and quality of the services that may be provided by the AffiliatedSub-Advisers are appropriate and satisfactory.
| B. | Fund Investment Performance |
The Board considered Fund investment performance as a relevant factor in considering whether to approve the investment advisory agreement. The Board did not view Fund investment performance as a relevant factor in considering whether to approve thesub-advisory contracts for the Fund, as no AffiliatedSub-Adviser currently manages assets of the Fund.
The Board compared the Fund’s investment performance over multiple time periods ending December 31, 2018 to the performance of funds in the Broadridge performance universe and against the Lipper Variable Underlying FundsMid-Cap Value Funds Index. The Board noted that performance of Series I shares of the Fund was in the second quintile of its performance universe for the one year period and the fifth quintile for the three and five year periods (the first quintile being the best performing funds and the fifth quintile being the worst performing funds). The Board noted that performance of Series I shares of the Fund was above the performance of the Index for the one year period and below the performance of the Index for the three and five year periods. The Board noted that the Fund’s overweight and
Invesco V.I. American Value Fund
underweight exposure to certain defensive sectors and stock selection in various sectors detracted from Fund performance.The Trustees also reviewed more recent Fund performance and this review did not change their conclusions.
| C. | Advisory and Sub-Advisory Fees and Fund Expenses |
The Board compared the Fund’s contractual management fee rate to the contractual management fee rates of funds in the Fund’s Broadridge expense group. The Board noted that the contractual management fee rate for Series I shares of the Fund was below the median contractual management fee rate of funds in its expense group. The Board noted that the term “contractual management fee” for funds in the expense group may include both advisory and certainnon-portfolio management administrative services fees, but that Broadridge does not provide information on a fund by fund basis as to what is included. The Board also reviewed the methodology used by Broadridge in providing expense group information, which includes using each fund’s contractual managementfee schedule (including any applicable breakpoints) as reported in the most recent prospectus or statement of additional information for each fund in the expense group. The Board also considered comparative information regarding the Fund’s total expense ratio and its various components.
The Board noted that Invesco Advisers has contractually agreed to waive fees and/or limit expenses of the Fund for the term disclosed in the Fund’s registration statement in an amount necessary to limit total annual operating expenses to a specified percentage of average daily net assets for each class of the Fund.
The Board noted that Invesco Advisers and the AffiliatedSub-Advisers do not manage other similarly managed mutual funds or client accounts.
The Board also considered the services that may be provided by the AffiliatedSub-Advisers pursuant to thesub-advisory contracts, as well as the fees payable by Invesco Advisers to the AffiliatedSub-Advisers pursuant to thesub-advisory contracts.
| D. | Economies of Scale and Breakpoints |
The Board considered the extent to which there may be economies of scale in the provision of advisory services to the Fund. The Board considered Invesco’s reinvestment in its business, including investments in business infrastructure and cybersecurity. The Board also considered that the Fund may benefit from economies of scale through contractual breakpoints in the Fund’s advisory fee schedule, which generally operate to reduce the Fund’s expense ratio as it grows in size. The Board noted that the Fund shares directly in economies of scale through lower fees charged by third party service providers based on the combined size of the Invesco Funds. The Board noted that the Fund may also benefit from
economies of scale through initial fee setting, fee waivers and expense reimbursements.
| E. | Profitability and Financial Resources |
The Board reviewed information from Invesco Advisers concerning the costs of the advisory and other services that Invesco Advisers and its affiliates provide to the Fund and the Invesco Funds and the profitability of Invesco Advisers and its affiliates in providing these services. The Board considered the methodology used for calculating profitability and noted the periodic review of such methodology by an independent consultant. The Board noted that Invesco Advisers continues to operate at a net profit from services Invesco Advisers and its affiliates provide to the Invesco Funds and the Fund. The Board did not deem the level of profits realized by Invesco Advisers and its affiliates from providing services to the Fund to be excessive given the nature, extent and quality of the services provided. The Board received information from Invesco Advisers demonstrating that Invesco Advisers and the AffiliatedSub-Advisers are financially sound and have the resources necessary to perform their obligations under the investment advisory agreement andsub-advisory contracts.
| F. | Collateral Benefits to Invesco Advisers and its Affiliates |
The Board considered various other benefits received by Invesco Advisers and its affiliates from the relationship with the Fund, including the fees received for providing administrative, transfer agency and distribution services to the Fund. The Board considered comparative information regarding fees charged for these services, including information provided by Broadridge and other independent sources. The Board considered the performance of Invesco Advisers and its affiliates in providing these services and the organizational structure employed to provide these services. The Board also considered that these services are provided to the Fund pursuant to written contracts that are reviewed and approved on an annual basis by the Board; and that the services are required for the operation of the Fund.
The Board considered the benefits realized by Invesco Advisers and the AffiliatedSub-Advisers as a result of portfolio brokerage transactions executed through “soft dollar” arrangements. The Board noted that soft dollar arrangements may result in the Fund bearing costs to purchase research that may be used by Invesco Advisers or the AffiliatedSub-Advisers with other clients and may reduce Invesco Advisers’ or the AffiliatedSub-Advisers’ expenses. The Board also considered that it receives periodic reports from Invesco representing that these arrangements are consistent with regulatory requirements. The Board did not deem the soft dollar arrangements to be inappropriate.
The Board considered that the Fund’s uninvested cash and cash collateral from any securities lending arrangements may be invested in money market funds advised by Invesco Advisers pursuant to procedures approved by the Board. The Board considered
information regarding the returns of the affiliated money market funds relative to comparable overnight investments, as well as the costs to the Fund of such investments. The Board noted that Invesco Advisers receives advisory fees from these affiliated money market funds attributable to such investments, although Invesco Advisers has contractually agreed to waive through varying periods the advisory fees payable by the Invesco Funds with respect to certain investments in the affiliated money market funds. The waiver is in an amount equal to 100% of the net advisory fee Invesco Advisers receives from the affiliated money market funds with respect to the Fund’s investment in the affiliated money market funds of uninvested cash, but not cash collateral. The Board concluded that the amount of advisory fees received by Invesco Advisers from the Fund’s investment of cash collateral from any securities lending arrangements in the affiliated money market funds is fair and reasonable.
The Board also considered that an affiliated broker may receive commissions for executing certain trades for the Fund. Invesco Advisers and the AffiliatedSub-Advisers may use the affiliated broker to, among other things, control order routing and minimize information leakage, and the Board was advised that such trades are executed in compliance with rules under the federal securities laws and consistent with best execution obligations.
Invesco V.I. American Value Fund
| Semiannual Report to Shareholders | June 30, 2019 |
Invesco V.I. Balanced-Risk Allocation Fund
Beginning on January 1, 2021, as permitted by regulations adopted by the Securities and Exchange Commission, the insurance company that offers your variable annuity or variable life insurance contract may no longer send you paper copies of the Fund’s shareholder reports by mail, unless you specifically request paper copies of the reports from the insurance company or your financial intermediary. Instead of delivering paper copies of the report, the insurance company may choose to make the reports available on a website, and will notify you by mail each time a report is posted and provide you with a website link to access the report. Instructions for requesting paper copies will be provided by your insurance company.
If the insurance company offers electronic delivery, you may elect to receive shareholder reports and other communications about the Fund electronically by following the instructions provided by the insurance company or by contacting your financial intermediary. If you already elected to receive shareholder reports electronically, you will not be affected by this change and you need not take any action.
You may elect to receive all future reports in paper free of charge from the insurance company. You can inform the insurance company or your financial intermediary that you wish to continue receiving paper copies of your shareholder reports by following the instructions provided by the insurance company or by contacting your financial intermediary. Your election to receive reports in paper will apply to all portfolio companies available under your contract with the insurance company.
The Fund provides a complete list of its holdings four times in each fiscal year, at the quarter-ends. For the second and fourth quarters, the lists appear in the Fund’s semiannual and annual reports to shareholders. For the first and third quarters, the Fund files the lists with the Securities and Exchange Commission (SEC) on Form N-Q (or any successor Form). The Fund’s Form N-Q (or any successor Form) filings are available on the SEC website, sec.gov. The SEC file numbers for the Fund are 811-07452 and 033-57340. The Fund’s most recent portfolio holdings, as filed on Form N-Q (or any successor Form), have also been made available to insurance companies issuing variable annuity contracts and variable life insurance policies (“variable products”) that invest in the Fund.
A description of the policies and procedures that the Fund uses to determine how to vote proxies relating to portfolio securities is available without charge, upon request, from our Client Services department at 800 959 4246 or at invesco.com/proxyguidelines. The information is also available on the SEC website, sec.gov.
Information regarding how the Fund voted proxies related to its portfolio securities during the most recent 12-month period ended June 30 is available at invesco.com/proxysearch. The information is also available on the SEC website, sec.gov.
Invesco Advisers, Inc. is an investment adviser; it provides investment advisory services to individual and institutional clients and does not sell securities. Invesco Distributors, Inc. is the US distributor for Invesco Ltd.’s retail mutual funds, exchange-traded funds and institutional money market funds. Both are wholly owned, indirect subsidiaries of Invesco Ltd.
This report must be accompanied or preceded by a currently effective Fund prospectus and variable product prospectus, which contain more complete information, including sales charges and expenses. Investors should read each carefully before investing.
NOT FDIC INSURED | MAY LOSE VALUE | NO BANK GUARANTEE
| Invesco Distributors, Inc. | VIIBRA-SAR-1 |
Performance summary
Fund vs. Indexes
Cumulative total returns, December 31, 2018 to June 30, 2019, excluding variable product issuer charges. If variable product issuer charges were included, returns would be lower.
| Series I Shares | 10.77% |
| Series II Shares | 10.60 |
| MSCI World Index▼ (Broad Market Index) | 16.98 |
Custom Invesco V.I. Balanced-Risk Allocation Index■
(Style-Specific Index) | 12.60 |
Lipper VUF Absolute Return Funds Classification Average♦
(Peer Group) | 4.11 |
| Source(s):▼RIMES Technologies Corp.;■ Invesco, FactSet Research Systems Inc., RIMES Technologies Corp.;♦ Lipper Inc. |
TheMSCI World IndexSM is an unmanaged index considered representative of stocks of developed countries. The index is computed using the net return, which withholds applicable taxes for non-resident investors.
TheCustom Invesco V.I. Balanced-Risk Allocation Index is composed of the MSCI World Index and Bloomberg Barclays U.S. Aggregate Bond Index. Prior to May 2, 2011, the index comprised the MSCI World Index, the J.P. Morgan GBI Global Index and FTSE U.S. 3-Month Treasury Bill Index.
TheLipper VUF Absolute Return Funds Classification Average represents an average of all variable insurance underlying funds in the Lipper Absolute Return Funds classification.
The Bloomberg Barclays U.S. Aggregate Bond Indexis considered representative of the US investment-grade, fixed-rate bond market.
TheJ.P. Morgan GBI Global Index tracks the performance of fixed-rate issuances from high-income, developed market countries.
TheFTSE U.S. 3-Month Treasury Bill Index is considered representative of three-month US Treasury bills.
The Fund is not managed to track the performance of any particular index, including the indexes described here, and consequently, the performance of the Fund may deviate significantly from the performance of the indexes.
A direct investment cannot be made in an index. Unless otherwise indicated, index results include reinvested dividends, and they do not reflect sales charges. Performance of the peer group, if applicable, reflects fund expenses; performance of a market index does not.
| Average Annual Total Returns |
| As of 6/30/19 |
| Series I Shares | |
| Inception (1/23/09) | 8.20% |
| 10 Years | 7.51 |
| 5 Years | 3.94 |
| 1 Year | 3.89 |
| Series II Shares | |
| Inception (1/23/09) | 7.92% |
| 10 Years | 7.24 |
| 5 Years | 3.69 |
| 1 Year | 3.64 |
The returns shown above include the returns of Invesco Van Kampen V.I. Global Tactical Asset Allocation Fund (the first predecessor fund) for the period June 1, 2010, to May 2, 2011, the date the first predecessor fund was reorganized into the Fund, and the returns of Van Kampen Life Investment Trust Global Tactical Asset Allocation Portfolio (the second predecessor fund) for the period prior to June 1, 2010, the date the second predecessor fund was reorganized into the first predecessor fund. The second predecessor fund was advised by Van Kampen Asset Management. Returns shown above for Series I and Series II shares are blended returns of the predecessor funds and Invesco V.I. Balanced-Risk Allocation Fund. Share class returns
will differ from the predecessor funds because of different expenses.
The performance data quoted represent past performance and cannot guarantee comparable future results; current performance may be lower or higher. Please contact your variable product issuer or financial adviser for the most recent month-end variable product performance. Performance figures reflect Fund expenses, reinvested distributions and changes in net asset value. Performance figures do not reflect deduction of taxes a shareholder would pay on Fund distributions or sale of Fund shares. Investment return and principal value will fluctuate so that you may have a gain or loss when you sell shares.
The net annual Fund operating expense ratio set forth in the most re-
cent Fund prospectus as of the date of this report for Series I and Series II shares was 0.80% and 1.05%, respectively.1,2,3 The total annual Fund operating expense ratio set forth in the most recent Fund prospectus as of the date of this report for Series I and Series II shares was 1.26% and 1.51%, respectively.1 The expense ratios presented above may vary from the expense ratios presented in other sections of this report that are based on expenses incurred during the period covered by this report.
Invesco V.I. Balanced-Risk Allocation Fund, a series portfolio of AIM Variable Insurance Funds (Invesco Variable Insurance Funds), is currently offered through insurance companies issuing variable products. You cannot purchase shares of the Fund directly.
Invesco V.I. Balanced-Risk Allocation Fund
Performance figures given represent the Fund and are not intended to reflect actual variable product values. They do not reflect sales charges, expenses and fees assessed in connection with a variable product. Sales charges, expenses and fees, which are determined by the variable product issuers, will vary and will lower the total return.
The most recent month-end performance at the Fund level, excluding variable product charges, is available at 800 451 4246. As mentioned above, for the most recent month-end performance including variable product charges, please contact your variable product issuer or financial adviser.
Fund performance reflects any applicable fee waivers and/or expense reimbursements. Had the adviser not waived fees and/or reimbursed expenses currently or in the past, returns would have been lower. See current prospectus for more information.
| 1 | The expense ratio includes acquired fund fees and expenses of the underlying funds in which the Fund invests of 0.16%. |
| 2 | Total annual Fund operating expenses after any contractual fee waivers and/or expense reimbursements by the adviser in effect through at least April 30, 2020. See current prospectus for more information. |
| 3 | Total annual Fund operating expenses after any contractual fee waivers and/or expense reimbursements by the adviser in effect through at least June 30, 2021. See current prospectus for more information. |
Invesco V.I. Balanced-Risk Allocation Fund
Consolidated Schedule of Investments
June 30, 2019
(Unaudited)
| | Interest
Rate | Maturity
Date | Principal
Amount
(000) | Value |
| U.S. Treasury Securities–11.51%(a) | | |
| U.S. Treasury Bills–11.51% |
| U.S. Treasury Bills | 2.59% | 07/11/2019 | | $ 46,000 | $ 45,968,554 |
| U.S. Treasury Bills(b) | 2.38% | 11/07/2019 | | 13,000 | 12,904,621 |
| U.S. Treasury Bills(b) | 2.17% | 11/29/2019 | | 48,000 | 47,587,468 |
| U.S. Treasury Bills | 1.52% | 12/05/2019 | | 13,200 | 13,083,859 |
| Total U.S. Treasury Securities (Cost $119,493,693) | 119,544,502 |
| | | Expiration
Date | | |
| Commodity-Linked Securities–1.90% |
| Canadian Imperial Bank of Commerce EMTN, U.S. Federal Funds Effective Rate minus 0.03% (linked to the Canadian Imperial Bank of Commerce Custom 7 Agriculture Commodity Index, multiplied by 2)(c) | | 08/23/2019 | | 8,540 | 7,381,873 |
| Cargill, Inc., Commodity-Linked Notes, one mo. USD LIBOR minus 0.10% (linked to the Monthly Rebalance Commodity Excess Return Index, multiplied by 2)(c) | | 03/20/2020 | | 12,950 | 12,363,811 |
| Total Commodity-Linked Securities (Cost $21,490,000) | 19,745,684 |
| | | | Shares | |
| Money Market Funds–86.38%(d) |
| Invesco Government & Agency Portfolio, Institutional Class, 2.26% | | | | 310,606,811 | 310,606,811 |
| Invesco Government Money Market Fund, Cash Reserve Shares, 1.88% | | | | 28,755,279 | 28,755,279 |
| Invesco Premier U.S. Government Money Portfolio, Institutional Class, 2.25% | | | | 98,777,767 | 98,777,767 |
| Invesco Treasury Obligations Portfolio, Institutional Class, 2.17% | | | | 171,324,067 | 171,324,067 |
| Invesco Treasury Portfolio, Institutional Class, 2.22% | | | | 191,494,007 | 191,494,007 |
| Invesco V.I. Government Money Market Fund, Series I, 2.06% | | | | 16,640,310 | 16,640,310 |
| STIC (Global Series) PLC-U.S. Dollar Liquidity Portfolio, Institutional Class (Ireland), 2.42% | | | | 79,878,249 | 79,878,249 |
| Total Money Market Funds (Cost $897,476,490) | 897,476,490 |
| TOTAL INVESTMENTS IN SECURITIES–99.79% (Cost $1,038,460,183) | 1,036,766,676 |
| OTHER ASSETS LESS LIABILITIES–0.21% | 2,169,462 |
| NET ASSETS–100.00% | $1,038,936,138 |
Investment Abbreviations:
| EMTN | – European Medium-Term Notes |
| LIBOR | – London Interbank Offered Rate |
| USD | – U.S. Dollar |
Notes to Consolidated Schedule of Investments:
| (a) | Security traded on a discount basis. The interest rate shown represents the discount rate at the time of purchase by the Fund. |
| (b) | All or a portion of the value was pledged as collateral to cover margin requirements for futures contracts. See Note 1L. |
| (c) | Security purchased or received in a transaction exempt from registration under the Securities Act of 1933, as amended (the “1933 Act”). The security may be resold pursuant to an exemption from registration under the 1933 Act, typically to qualified institutional buyers. The aggregate value of these securities at June 30, 2019 was $19,745,684, which represented 1.90% of the Fund’s Net Assets. |
| (d) | The money market fund and the Fund are affiliated by having the same investment adviser. The rate shown is the 7-day SEC standardized yield as of June 30, 2019. |
See accompanying Notes to Consolidated Financial Statements which are an integral part of the financial statements.
Invesco V.I. Balanced-Risk Allocation Fund
| Open Futures Contracts |
| Long Futures Contracts | Number of
Contracts | Expiration
Month | Notional
Value | Value | Unrealized
Appreciation
(Depreciation) |
| Commodity Risk |
| Brent Crude | 297 | August-2019 | $19,111,950 | $1,110,212 | $1,110,212 |
| Gasoline Reformulated Blendstock Oxygenate Blending | 284 | July-2019 | 22,622,645 | 1,820,274 | 1,820,274 |
| New York Harbor Ultra-Low Sulfur Diesel | 60 | November-2019 | 4,942,980 | 242,591 | 242,591 |
| Silver | 206 | September-2019 | 15,801,230 | (75,724) | (75,724) |
| WTI Crude | 169 | December-2019 | 9,752,990 | 699,506 | 699,506 |
| Subtotal | 3,796,859 | 3,796,859 |
| Equity Risk |
| E-Mini Russell 2000 Index | 585 | September-2019 | 45,837,675 | 990,502 | 990,502 |
| E-Mini S&P 500 Index | 350 | September-2019 | 51,523,500 | 994,896 | 994,896 |
| EURO STOXX 50 Index | 1,625 | September-2019 | 64,044,324 | 1,799,350 | 1,799,350 |
| FTSE 100 Index | 805 | September-2019 | 75,333,965 | 594,868 | 594,868 |
| Hang Seng Index | 273 | July-2019 | 49,809,036 | 521,425 | 521,425 |
| Tokyo Stock Price Index | 568 | September-2019 | 81,711,079 | 726,845 | 726,845 |
| Subtotal | 5,627,886 | 5,627,886 |
| Interest Rate Risk |
| Australia 10 Year Bonds | 2,720 | September-2019 | 274,310,835 | 2,433,249 | 2,433,249 |
| Canada 10 Year Bonds | 2,314 | September-2019 | 252,560,055 | 2,761,747 | 2,761,747 |
| Long Gilt | 762 | September-2019 | 126,091,490 | 1,174,131 | 1,174,131 |
| U.S. Treasury Long Bonds | 717 | September-2019 | 111,560,719 | 3,479,417 | 3,479,417 |
| Subtotal | 9,848,544 | 9,848,544 |
| Total Futures Contracts | $19,273,289 | $19,273,289 |
| Open Over-The-Counter Total Return Swap Agreements(a)(b) |
| Counterparty | Pay/
Receive | Reference Entity(c) | Fixed
Rate | Payment
Frequency | Number of
Contracts | Maturity Date | Notional Value | Upfront
Payments
Paid
(Received) | Value | Unrealized
Appreciation
(Depreciation) |
| Commodity Risk | | | | | | | | | | | |
| Barclays Bank PLC | Receive | Barclays Commodity Strategy 1452 Excess Return Index | 0.33% | Monthly | 23,700 | October—2019 | $ | 11,083,258 | $— | $288,019 | $288,019 |
| Canadian Imperial Bank of Commerce | Receive | Canadian Imperial Bank of Commerce Dynamic Roll LME Copper Excess Return Index 2 | 0.30 | Monthly | 267,000 | April—2020 | | 19,498,503 | — | 396,415 | 396,415 |
| Cargill, Inc. | Receive | Monthly Rebalance Commodity Excess Return Index | 0.47 | Monthly | 37,600 | February—2020 | | 26,259,776 | — | 0 | 0 |
| Cargill, Inc. | Receive | Single Commodity Index Excess Return | 0.12 | Monthly | 5,950 | January—2020 | | 5,592,725 | — | 0 | 0 |
| Goldman Sachs International | Receive | Goldman Sachs Commodity Strategy 1103 | 0.40 | Monthly | 362,000 | February—2020 | | 25,896,311 | — | 369,296 | 369,296 |
| JPMorgan Chase Bank, N.A. | Receive | J.P. Morgan Contag Beta Gas Oil Excess Return Index | 0.25 | Monthly | 20,500 | April—2020 | | 5,067,489 | — | 129,880 | 129,880 |
| Merrill Lynch International | Receive | Merrill Lynch Gold Excess Return Index | 0.14 | Monthly | 111,700 | June—2020 | | 19,269,691 | — | 0 | 0 |
| Merrill Lynch International | Receive | MLCX Natural Gas Annual Excess Return Index | 0.25 | Monthly | 53,000 | November—2019 | | 2,181,077 | — | 0 | 0 |
| Morgan Stanley Capital Services LLC | Receive | S&P GSCI Aluminum Dynamic Roll Index Excess Return | 0.38 | Monthly | 76,500 | October—2019 | | 6,582,618 | — | 148,466 | 148,466 |
| Subtotal — Appreciation | | | | | — | 1,332,076 | 1,332,076 |
See accompanying Notes to Consolidated Financial Statements which are an integral part of the financial statements.
Invesco V.I. Balanced-Risk Allocation Fund
| Open Over-The-Counter Total Return Swap Agreements(a)(b)—(continued) |
| Counterparty | Pay/
Receive | Reference Entity(c) | Fixed
Rate | Payment
Frequency | Number of
Contracts | Maturity Date | Notional Value | Upfront
Payments
Paid
(Received) | Value | Unrealized
Appreciation
(Depreciation) |
| Commodity Risk | | | | | | | | | | | |
| Barclays Bank PLC | Receive | Barclays Commodity Strategy 1737 Excess Return Index | 0.45% | Monthly | 24,000 | February—2020 | $ | 5,665,502 | $— | $(83,451) | $(83,451) |
| JPMorgan Chase Bank, N.A. | Receive | S&P GSCI Gold Index Excess Return | 0.09 | Monthly | 140,000 | October—2019 | | 15,459,794 | — | (49,056) | (49,056) |
| Subtotal — Depreciation | | | | | — | (132,507) | (132,507) |
| Total — Total Return Swap Agreements | | | | | $— | $1,199,569 | $1,199,569 |
| (a) | Open Over-The-Counter Total Return Swap Agreements are collateralized by cash held with the swap Counterparties in the amount of $5,694,596. |
| (b) | The Fund receives or pays payments based on any positive or negative return on the Reference Entity, respectively. |
| (c) | The table below includes additional information regarding the underlying components of certain reference entities that are not publicly available. |
| Reference Entity Components |
| Reference Entity | Underlying Components | Percentage |
| Canadian Imperial Bank of Commerce Custom 7 Agriculture | | |
| Commodity Index | | |
| | Long Futures Contracts | |
| | Coffee ‘C’ | 4.46% |
| | Corn | 4.59 |
| | Cotton No. 2 | 19.85 |
| | Lean Hogs | 0.63 |
| | Live Cattle | 3.22 |
| | Soybean Meal | 19.16 |
| | Soybean Oil | 4.73 |
| | Soybeans | 18.83 |
| | Sugar No. 11 | 19.54 |
| | Wheat | 4.99 |
| | Total | 100.00% |
| Monthly Rebalance Commodity Excess Return Index | | |
| | Long Futures Contracts | |
| | Coffee ’C’ | 4.46% |
| | Corn | 4.59 |
| | Cotton No. 2 | 19.85 |
| | Lean Hogs | 0.63 |
| | Live Cattle | 3.22 |
| | Soybean Meal | 19.16 |
| | Soybean Oil | 4.73 |
| | Soybeans | 18.83 |
| | Sugar No.11 | 19.54 |
| | Wheat | 4.99 |
| | Total | 100.00% |
| Barclays Commodity Strategy 1452 Excess Return Index | | |
| | Long Futures Contracts | |
| | Copper | 100.00% |
| Canadian Imperial Bank of Commerce Dynamic Roll LME Copper Excess Return Index 2 | | |
| | Long Futures Contracts | |
| | Gold | 100.00% |
See accompanying Notes to Consolidated Financial Statements which are an integral part of the financial statements.
Invesco V.I. Balanced-Risk Allocation Fund
| Reference Entity Components—(continued) |
| Reference Entity | Underlying Components | Percentage |
| Single Commodity Index Excess Return | | |
| | Long Futures Contracts | |
| | Copper | 100.00% |
| Goldman Sachs Commodity Strategy 1103 | | |
| | Long Futures Contracts | |
| | Coffee ’C’ | 4.46% |
| | Corn | 4.59 |
| | Cotton No. 2 | 19.85 |
| | Lean Hogs | 0.63 |
| | Live Cattle | 3.22 |
| | Soybean Meal | 19.16 |
| | Soybean Oil | 4.73 |
| | Soybeans | 18.83 |
| | Sugar No. 11 | 19.54 |
| | Wheat | 4.99 |
| | Total | 100.00% |
| J.P. Morgan Contag Beta Gas Oil Excess Return Index | | |
| | Long Futures Contracts | |
| | Gas Oil | 100.00% |
| Merrill Lynch Gold Excess Return Index | | |
| | Long Futures Contracts | |
| | Gold | 100.00% |
| MLCX Natural Gas Annual Excess Return Index | | |
| | Long Futures Contracts | |
| | Natural Gas | 100.00% |
| S&P GSCI Aluminum Dynamic Roll Index Excess Return | | |
| | Long Futures Contracts | |
| | Aluminum | 100.00% |
| Barclays Commodity Strategy 1737 Excess Return Index | | |
| | Long Futures Contracts | |
| | Coffee ’C’ | 4.46% |
| | Corn | 4.59 |
| | Cotton No. 2 | 19.85 |
| | Lean Hogs | 0.63 |
| | Live Cattle | 3.22 |
| | Soybean Meal | 19.16 |
| | Soybean Oil | 4.73 |
| | Soybeans | 18.83 |
| | Sugar No. 11 | 19.54 |
| | Wheat | 4.99 |
| | Total | 100.00% |
| S&P GSCI Gold Index Excess Return | | |
| | Long Futures Contracts | |
| | Gold | 100.00% |
See accompanying Notes to Consolidated Financial Statements which are an integral part of the financial statements.
Invesco V.I. Balanced-Risk Allocation Fund
Target Risk Allocation and Notional Asset Weights as of June 30, 2019
By asset class
| Asset Class | Target Risk
Allocation* | Notional Asset
Weights** |
| Equities | 31.74% | 34.32% |
| Fixed Income | 50.00 | 73.57 |
| Commodities | 18.26 | 24.56 |
| * | Reflects the risk that each asset class is expected to contribute to the overall risk of the Fund as measured by standard deviation and estimates of risk based on historical data. Standard deviation measures the annualized fluctuations (volatility) of monthly returns. |
| ** | Proprietary models determine the Notional Asset Weights necessary to achieve the Target Risk Allocations. Total Notional Asset Weight greater than 100% is achieved through derivatives and other instruments that create leverage. |
See accompanying Notes to Consolidated Financial Statements which are an integral part of the financial statements.
Invesco V.I. Balanced-Risk Allocation Fund
Consolidated Statement of Assets and Liabilities
June 30, 2019
(Unaudited)
| Assets: | |
Investments in securities, at value
(Cost $140,983,693) | $139,290,186 |
| Investments in affiliated money market funds, at value (Cost $897,476,490) | 897,476,490 |
| Other investments: | |
| Variation margin receivable — futures contracts | 1,223,685 |
| Swaps receivable — OTC | 1,304,595 |
| Unrealized appreciation on swap agreements — OTC | 1,332,076 |
| Deposits with brokers: | |
| Cash collateral — OTC Derivatives | 5,694,596 |
| Foreign currencies, at value (Cost $1,438) | 1,409 |
| Receivable for: | |
| Fund shares sold | 44,355 |
| Dividends | 1,612,291 |
| Investment for trustee deferred compensation and retirement plans | 104,510 |
| Other assets | 420 |
| Total assets | 1,048,084,613 |
| Liabilities: | |
| Other investments: | |
| Swaps payable — OTC | 170,704 |
| Unrealized depreciation on swap agreements—OTC | 132,507 |
| Payable for: | |
| Fund shares reacquired | 555,488 |
| Amount due custodian | 7,117,380 |
| Accrued fees to affiliates | 994,354 |
| Accrued trustees’ and officers’ fees and benefits | 728 |
| Accrued other operating expenses | 60,884 |
| Trustee deferred compensation and retirement plans | 116,430 |
| Total liabilities | 9,148,475 |
| Net assets applicable to shares outstanding | $1,038,936,138 |
| Net assets consist of: | |
| Shares of beneficial interest | $966,793,072 |
| Distributable earnings | 72,143,066 |
| | $1,038,936,138 |
| Net Assets: |
| Series I | $42,790,551 |
| Series II | $996,145,587 |
| Shares outstanding, no par value, with an unlimited number of shares authorized: |
| Series I | 4,079,770 |
| Series II | 96,415,808 |
| Series I: | |
| Net asset value per share | $10.49 |
| Series II: | |
| Net asset value per share | $10.33 |
Consolidated Statement of Operations
For the six months ended June 30, 2019
(Unaudited)
| Investment income: | |
| Dividends from affiliated money market funds | $10,037,183 |
| Interest | 1,342,969 |
| Total investment income | 11,380,152 |
| Expenses: | |
| Advisory fees | 4,713,246 |
| Administrative services fees | 842,552 |
| Custodian fees | 27,002 |
| Distribution fees - Series II | 1,232,998 |
| Transfer agent fees | 12,000 |
| Trustees’ and officers’ fees and benefits | 19,261 |
| Reports to shareholders | 5,349 |
| Professional services fees | 38,756 |
| Other | 7,280 |
| Total expenses | 6,898,444 |
| Less: Fees waived | (2,350,492) |
| Net expenses | 4,547,952 |
| Net investment income | 6,832,200 |
| Realized and unrealized gain (loss) from: | |
| Net realized gain (loss) from: | |
| Investment securities | (1,217,982) |
| Foreign currencies | 548 |
| Futures contracts | 78,422,581 |
| Swap agreements | (3,516,662) |
| | 73,688,485 |
| Change in net unrealized appreciation (depreciation) of: | |
| Investment securities | 648,454 |
| Foreign currencies | (169,408) |
| Futures contracts | 18,232,247 |
| Swap agreements | 5,234,454 |
| | 23,945,747 |
| Net realized and unrealized gain | 97,634,232 |
| Net increase in net assets resulting from operations | $104,466,432 |
See accompanying Notes to Consolidated Financial Statements which are an integral part of the financial statements.
Invesco V.I. Balanced-Risk Allocation Fund
Consolidated Statement of Changes in Net Assets
For the six months ended June 30, 2019 and the year ended December 31, 2018
(Unaudited)
| | June 30,
2019 | December 31,
2018 |
| Operations: | | |
| Net investment income | $6,832,200 | $8,716,217 |
| Net realized gain (loss) | 73,688,485 | (62,901,126) |
| Change in net unrealized appreciation (depreciation) | 23,945,747 | (21,238,796) |
| Net increase (decrease) in net assets resulting from operations | 104,466,432 | (75,423,705) |
| Distributions to shareholders from distributable earnings: | | |
| Series I | — | (3,802,380) |
| Series II | — | (107,564,085) |
| Total distributions from distributable earnings | — | (111,366,465) |
| Return of capital: | | |
| Series I | — | (318,341) |
| Series II | — | (2,637,420) |
| Total return of capital | — | (2,955,761) |
| Share transactions–net: | | |
| Series I | 1,240,881 | 4,812,203 |
| Series II | (72,550,676) | (6,703,716) |
| Net increase (decrease) in net assets resulting from share transactions | (71,309,795) | (1,891,513) |
| Net increase (decrease) in net assets | 33,156,637 | (191,637,444) |
| Net assets: | | |
| Beginning of period | 1,005,779,501 | 1,197,416,945 |
| End of period | $1,038,936,138 | $1,005,779,501 |
See accompanying Notes to Consolidated Financial Statements which are an integral part of the financial statements.
Invesco V.I. Balanced-Risk Allocation Fund
Consolidated Financial Highlights
June 30, 2019
(Unaudited)
The following schedule presents financial highlights for a share of the Fund outstanding throughout the periods indicated.
| | Net asset
value,
beginning
of period | Net
investment
income
(loss)(a) | Net gains
(losses)
on securities
(both
realized and
unrealized) | Total from
investment
operations | Dividends
from net
investment
income | Return of
capital | Distributions
from net
realized
gains | Total
distributions | Net asset
value, end
of period | Total
return(b) | Net assets,
end of period
(000’s omitted) | Ratio of
expenses
to average
net assets
with fee waivers
and/or expenses
absorbed | Ratio of
expenses
to average net
assets without
fee waivers
and/or expenses
absorbed | Ratio of net
investment
income
(loss)
to average
net assets | Portfolio
turnover(c) |
| Series I |
| Six months ended 06/30/19 | $9.47 | $0.08 | $0.94 | $1.02 | $— | $- | $— | $— | $10.49 | 10.77% | $42,791 | 0.64%(d)(e) | 1.10%(d) | 1.57%(d) | 61% |
| Year ended 12/31/18 | 11.31 | 0.11 | (0.79) | (0.68) | (0.14) | (0.03) | (0.99) | (1.16) | 9.47 | (6.46) | 37,450 | 0.65(e) | 1.10 | 1.03 | 199 |
| Year ended 12/31/17 | 11.35 | 0.01 | 1.08 | 1.09 | (0.48) | - | (0.65) | (1.13) | 11.31 | 10.06 | 39,340 | 0.68(e) | 1.11 | 0.10 | 52 |
| Year ended 12/31/16 | 10.20 | (0.04) | 1.24 | 1.20 | (0.05) | - | — | (0.05) | 11.35 | 11.74 | 34,714 | 0.67(e) | 1.12 | (0.33) | 120 |
| Year ended 12/31/15 | 12.30 | (0.07) | (0.44) | (0.51) | (0.52) | - | (1.07) | (1.59) | 10.20 | (4.10) | 26,854 | 0.69 | 1.15 | (0.61) | 44 |
| Year ended 12/31/14 | 12.30 | (0.08) | 0.80 | 0.72 | — | - | (0.72) | (0.72) | 12.30 | 5.91 | 11,397 | 0.69(e) | 1.11 | (0.65) | 60 |
| Series II |
| Six months ended 06/30/19 | 9.34 | 0.07 | 0.92 | 0.99 | — | - | — | — | 10.33 | 10.60 | 996,146 | 0.89(d)(e) | 1.35(d) | 1.32(d) | 61 |
| Year ended 12/31/18 | 11.17 | 0.08 | (0.78) | (0.70) | (0.11) | (0.03) | (0.99) | (1.13) | 9.34 | (6.71) | 968,329 | 0.90(e) | 1.35 | 0.78 | 199 |
| Year ended 12/31/17 | 11.22 | (0.02) | 1.07 | 1.05 | (0.45) | - | (0.65) | (1.10) | 11.17 | 9.83 | 1,158,077 | 0.93(e) | 1.36 | (0.15) | 52 |
| Year ended 12/31/16 | 10.08 | (0.06) | 1.22 | 1.16 | (0.02) | - | — | (0.02) | 11.22 | 11.51 | 1,113,539 | 0.92(e) | 1.37 | (0.58) | 120 |
| Year ended 12/31/15 | 12.17 | (0.10) | (0.44) | (0.54) | (0.48) | - | (1.07) | (1.55) | 10.08 | (4.40) | 939,354 | 0.94 | 1.40 | (0.86) | 44 |
| Year ended 12/31/14 | 12.21 | (0.12) | 0.80 | 0.68 | — | - | (0.72) | (0.72) | 12.17 | 5.62 | 1,002,835 | 0.94(e) | 1.36 | (0.90) | 60 |
| (a) | Calculated using average shares outstanding. |
| (b) | Includes adjustments in accordance with accounting principles generally accepted in the United States of America and as such, the net asset value for financial reporting purposes and the returns based upon those net asset values may differ from the net asset value and returns for shareholder transactions. Total returns are not annualized for periods less than one year, if applicable, and do not reflect charges assessed in connection with a variable product, which if included would reduce total returns. |
| (c) | Portfolio turnover is calculated at the fund level and is not annualized for periods less than one year, if applicable. |
| (d) | Ratios are annualized and based on average daily net assets (000’s omitted) of $40,654 and $995,588 for Series I and Series II shares, respectively. |
| (e) | In addition to the fees and expenses which the Fund bears directly; the Fund indirectly bears a pro rata share of the fees and expenses of the underlying funds in which the Fund invests. Because the underlying funds have varied expenses and fee levels and the Fund may own different proportions at different times, the amount of fees and expenses incurred indirectly by the Fund will vary. Estimated underlying fund expenses are not expenses that are incurred directly by your Fund. They are expenses that are incurred directly by the underlying funds and are deducted from the value of the funds your Fund invests in. The effect of the estimated underlying fund expenses that you bear indirectly is included in your Fund’s total return. Estimated acquired fund fees from underlying funds were 0.16%, 0.16%, 0.15%, 0.12% and 0.09% for the six months ended June 30, 2019 and the years ended December 31, 2018, 2017, 2016 and 2014, respectively. |
See accompanying Notes to Consolidated Financial Statements which are an integral part of the financial statements.
Invesco V.I. Balanced-Risk Allocation Fund
Notes to Consolidated Financial Statements
June 30, 2019
(Unaudited)
NOTE 1—Significant Accounting Policies
Invesco V.I. Balanced-Risk Allocation Fund (the “Fund”) is a series portfolio of AIM Variable Insurance Funds (Invesco Variable Insurance Funds) (the “Trust”). The Trust is a Delaware statutory trust registered under the Investment Company Act of 1940, as amended (the “1940 Act”), as an open-end series management investment company. Information presented in these consolidated financial statements pertains only to the Fund. Matters affecting the Fund or each class will be voted on exclusively by the shareholders of the Fund or each class. Current Securities and Exchange Commission (“SEC”) guidance, however, requires participating insurance companies offering separate accounts to vote shares proportionally in accordance with the instructions of the contract owners whose investments are funded by shares of each Fund or class.
The Fund will seek to gain exposure to the commodity markets primarily through investments in the Invesco Cayman Commodity Fund IV Ltd. (the “Subsidiary”), a wholly-owned subsidiary of the Fund organized under the laws of the Cayman Islands. The Subsidiary was organized by the Fund to invest in commodity-linked derivatives and other securities that may provide leveraged and non-leveraged exposure to commodities. The Fund may invest up to 25% of its total assets in the Subsidiary.
The Fund’s investment objective is total return with a low to moderate correlation to traditional financial market indices.
The Fund currently offers two classes of shares, Series I and Series II, both of which are offered to insurance company separate accounts funding variable annuity contracts and variable life insurance policies (“variable products”).
The Fund is an investment company and accordingly follows the investment company accounting and reporting guidance in accordance with Financial Accounting Standards Board Accounting Standards Codification Topic 946,Financial Services – Investment Companies.
The following is a summary of the significant accounting policies followed by the Fund in the preparation of its consolidated financial statements.
| A. | Security Valuations – Securities, including restricted securities, are valued according to the following policy. |
Debt obligations (including convertible securities) and unlisted equities are fair valued using an evaluated quote provided by an independent pricing service. Evaluated quotes provided by the pricing service may be determined without exclusive reliance on quoted prices, and may reflect appropriate factors such as institution-size trading in similar groups of securities, developments related to specific securities, dividend rate (for unlisted equities), yield (for debt obligations), quality, type of issue, coupon rate (for debt obligations), maturity (for debt obligations), individual trading characteristics and other market data. Pricing services generally value debt obligations assuming orderly transactions of institutional round lot size, but a fund may hold or transact in the same securities in smaller, odd lot sizes. Odd lots often trade at lower prices than institutional round lots. Debt obligations are subject to interest rate and credit risks. In addition, all debt obligations involve some risk of default with respect to interest and/or principal payments.
A security listed or traded on an exchange (except convertible securities) is valued at its last sales price or official closing price as of the close of the customary trading session on the exchange where the security is principally traded, or lacking any sales or official closing price on a particular day, the security may be valued at the closing bid price on that day. Securities traded in the over-the-counter market are valued based on prices furnished by independent pricing services or market makers. When such securities are valued by an independent pricing service they may be considered fair valued. Futures contracts are valued at the final settlement price set by an exchange on which they are principally traded. Listed options are valued at the mean between the last bid and asked prices from the exchange on which they are principally traded. Options not listed on an exchange are valued by an independent source at the mean between the last bid and asked prices. For purposes of determining net asset value ("NAV") per share, futures and option contracts generally are valued 15 minutes after the close of the customary trading session of the New York Stock Exchange (“NYSE”).
Investments in open-end and closed-end registered investment companies that do not trade on an exchange are valued at the end-of-day net asset value per share. Investments in open-end and closed-end registered investment companies that trade on an exchange are valued at the last sales price or official closing price as of the close of the customary trading session on the exchange where the security is principally traded.
Swap agreements are fair valued using an evaluated quote, if available, provided by an independent pricing service. Evaluated quotes provided by the pricing service are valued based on a model which may include end-of-day net present values, spreads, ratings, industry, company performance and returns of referenced assets. Centrally cleared swap agreements are valued at the daily settlement price determined by the relevant exchange or clearinghouse.
Foreign securities’ (including foreign exchange contracts) prices are converted into U.S. dollar amounts using the applicable exchange rates as of the close of the NYSE. If market quotations are available and reliable for foreign exchange-traded equity securities, the securities will be valued at the market quotations. Because trading hours for certain foreign securities end before the close of the NYSE, closing market quotations may become unreliable. If between the time trading ends on a particular security and the close of the customary trading session on the NYSE, events occur that the investment adviser determines are significant and make the closing price unreliable, the Fund may fair value the security. If the event is likely to have affected the closing price of the security, the security will be valued at fair value in good faith using procedures approved by the Board of Trustees. Adjustments to closing prices to reflect fair value may also be based on a screening process of an independent pricing service to indicate the degree of certainty, based on historical data, that the closing price in the principal market where a foreign security trades is not the current value as of the close of the NYSE. Foreign securities’ prices meeting the approved degree of certainty that the price is not reflective of current value will be priced at the indication of fair value from the independent pricing service. Multiple factors may be considered by the independent pricing service in determining adjustments to reflect fair value and may include information relating to sector indices, American Depositary Receipts and domestic and foreign index futures. Foreign securities may have additional risks including exchange rate changes, potential for sharply devalued currencies and high inflation, political and economic upheaval, the relative lack of issuer information, relatively low market liquidity and the potential lack of strict financial and accounting controls and standards.
Securities for which market prices are not provided by any of the above methods may be valued based upon quotes furnished by independent sources. The last bid price may be used to value equity securities. The mean between the last bid and asked prices is used to value debt obligations, including corporate loans.
Invesco V.I. Balanced-Risk Allocation Fund
Securities for which market quotations are not readily available or became unreliable are valued at fair value as determined in good faith by or under the supervision of the Trust’s officers following procedures approved by the Board of Trustees. Issuer specific events, market trends, bid/asked quotes of brokers and information providers and other market data may be reviewed in the course of making a good faith determination of a security’s fair value.
The Fund may invest in securities that are subject to interest rate risk, meaning the risk that the prices will generally fall as interest rates rise and, conversely, the prices will generally rise as interest rates fall. Specific securities differ in their sensitivity to changes in interest rates depending on their individual characteristics. Changes in interest rates may result in increased market volatility, which may affect the value and/or liquidity of certain Fund investments.
Valuations change in response to many factors including the historical and prospective earnings of the issuer, the value of the issuer’s assets, general economic conditions, interest rates, investor perceptions and market liquidity. Because of the inherent uncertainties of valuation, the values reflected in the consolidated financial statements may materially differ from the value received upon actual sale of those investments.
| B. | Securities Transactions and Investment Income — Securities transactions are accounted for on a trade date basis. Realized gains or losses on sales are computed on the basis of specific identification of the securities sold. Interest income (net of withholding tax, if any) is recorded on the accrual basis from settlement date. Bond premiums and discounts are amortized and/or accreted over the lives of the respective securities. Pay-in-kind interest income and non-cash dividend income received in the form of securities in-lieu of cash are recorded at the fair value of the securities received. Dividend income (net of withholding tax, if any) is recorded on the ex-dividend date. |
The Fund may periodically participate in litigation related to Fund investments. As such, the Fund may receive proceeds from litigation settlements. Any proceeds received are included in the Consolidated Statement of Operations as realized gain (loss) for investments no longer held and as unrealized gain (loss) for investments still held.
Brokerage commissions and mark ups are considered transaction costs and are recorded as an increase to the cost basis of securities purchased and/or a reduction of proceeds on a sale of securities. Such transaction costs are included in the determination of net realized and unrealized gain (loss) from investment securities reported in the Consolidated Statement of Operations and the Consolidated Statement of Changes in Net Assets and the net realized and unrealized gains (losses) on securities per share in the Financial Highlights. Transaction costs are included in the calculation of the Fund’s net asset value and, accordingly, they reduce the Fund’s total returns. These transaction costs are not considered operating expenses and are not reflected in net investment income reported in the Consolidated Statement of Operations and the Consolidated Statement of Changes in Net Assets, or the net investment income per share and the ratios of expenses and net investment income reported in the Financial Highlights, nor are they limited by any expense limitation arrangements between the Fund and the investment adviser.
The Fund allocates income and realized and unrealized capital gains and losses to a class based on the relative net assets of each class.
| C. | Country Determination — For the purposes of making investment selection decisions and presentation in the Consolidated Schedule of Investments, the investment adviser may determine the country in which an issuer is located and/or credit risk exposure based on various factors. These factors include the laws of the country under which the issuer is organized, where the issuer maintains a principal office, the country in which the issuer derives 50% or more of its total revenues and the country that has the primary market for the issuer’s securities, as well as other criteria. Among the other criteria that may be evaluated for making this determination are the country in which the issuer maintains 50% or more of its assets, the type of security, financial guarantees and enhancements, the nature of the collateral and the sponsor organization. Country of issuer and/or credit risk exposure has been determined to be the United States of America, unless otherwise noted. |
| D. | Distributions– Distributions from net investment income and net realized capital gain, if any, are generally declared and paid to separate accounts of participating insurance companies annually and recorded on the ex-dividend date. |
| E. | Federal Income Taxes – The Fund intends to comply with the requirements of Subchapter M of the Internal Revenue Code of 1986, as amended (the “Internal Revenue Code”), necessary to qualify as a regulated investment company and to distribute substantially all of the Fund’s taxable earnings to shareholders. As such, the Fund will not be subject to federal income taxes on otherwise taxable income (including net realized capital gain) that is distributed to shareholders. Therefore, no provision for federal income taxes is recorded in the consolidated financial statements. |
The Fund recognizes the tax benefits of uncertain tax positions only when the position is more likely than not to be sustained. Management has analyzed the Fund’s uncertain tax positions and concluded that no liability for unrecognized tax benefits should be recorded related to uncertain tax positions. Management is not aware of any tax positions for which it is reasonably possible that the total amounts of unrecognized tax benefits will change materially in the next 12 months.
The Subsidiary is classified as a controlled foreign corporation under Subchapter N of the Internal Revenue Code. Therefore, the Fund is required to increase its taxable income by its share of the Subsidiary’s income. Net investment losses of the Subsidiary cannot be deducted by the Fund in the current period nor carried forward to offset taxable income in future periods.
The Fund files tax returns in the U.S. Federal jurisdiction and certain other jurisdictions. Generally the Fund is subject to examinations by such taxing authorities for up to three years after the filing of the return for the tax period.
| F. | Expenses– Fees provided for under the Rule 12b-1 plan of a particular class of the Fund and which are directly attributable to that class are charged to the operations of such class. All other expenses are allocated among the classes based on relative net assets. |
| G. | Accounting Estimates – The financial statements are prepared on a consolidated basis in conformity with accounting principles generally accepted in the United States of America (“GAAP”), which requires management to make estimates and assumptions that affect the reported amounts of assets and liabilities at the date of the financial statements and the reported amounts of revenues and expenses during the reporting period including estimates and assumptions related to taxation. Actual results could differ from those estimates by a significant amount. The accompanying financial statements reflect the financial position of the Fund and its Subsidiary and the results of operations on a consolidated basis. All inter-company accounts and transactions have been eliminated in consolidation. |
In addition, the Fund monitors for material events or transactions that may occur or become known after the period-end date and before the date the consolidated financial statements are released to print.
| H. | Indemnifications– Under the Trust’s organizational documents, each Trustee, officer, employee or other agent of the Trust, and under the Subsidiary’s organizational documents, the directors and officers of the Subsidiary, are indemnified against certain liabilities that may arise out of the performance of their duties to the Fund and/or the Subsidiary, respectively. Additionally, in the normal course of business, the Fund enters |
Invesco V.I. Balanced-Risk Allocation Fund
| | into contracts, including the Fund’s servicing agreements, that contain a variety of indemnification clauses. The Fund’s maximum exposure under these arrangements is unknown as this would involve future claims that may be made against the Fund that have not yet occurred. The risk of material loss as a result of such indemnification claims is considered remote. |
| I. | Structured Securities — The Fund may invest in structured securities. Structured securities are a type of derivative security whose value is determined by reference to changes in the value of underlying securities, currencies, interest rates, commodities, indices or other financial indicators (“reference instruments”). Most structured securities are fixed-income securities that have maturities of three years or less. Structured securities may be positively or negatively indexed (i.e., their principal value or interest rates may increase or decrease if the underlying reference instrument appreciates) and may have return characteristics similar to direct investments in the underlying reference instrument. |
Structured securities may entail a greater degree of market risk than other types of debt securities because the investor bears the risk of the reference instruments. In addition to the credit risk of structured securities and the normal risks of price changes in response to changes in interest rates, the principal amount of structured notes or indexed securities may decrease as a result of changes in the value of the underlying reference instruments. Changes in the daily value of structured securities are recorded as unrealized gains (losses) in the Consolidated Statement of Operations. When the structured securities mature or are sold, the Fund recognizes a realized gain (loss) on the Consolidated Statement of Operations.
| J. | Foreign Currency Translations— Foreign currency is valued at the close of the NYSE based on quotations posted by banks and major currency dealers. Portfolio securities and other assets and liabilities denominated in foreign currencies are translated into U.S. dollar amounts at the date of valuation. Purchases and sales of portfolio securities (net of foreign taxes withheld on disposition) and income items denominated in foreign currencies are translated into U.S. dollar amounts on the respective dates of such transactions. The Fund does not separately account for the portion of the results of operations resulting from changes in foreign exchange rates on investments and the fluctuations arising from changes in market prices of securities held. The combined results of changes in foreign exchange rates and the fluctuation of market prices on investments (net of estimated foreign tax withholding) are included with the net realized and unrealized gain or loss from investments in the Consolidated Statement of Operations. Reported net realized foreign currency gains or losses arise from (1) sales of foreign currencies, (2) currency gains or losses realized between the trade and settlement dates on securities transactions, and (3) the difference between the amounts of dividends, interest, and foreign withholding taxes recorded on the Fund’s books and the U.S. dollar equivalent of the amounts actually received or paid. Net unrealized foreign currency gains and losses arise from changes in the fair values of assets and liabilities, other than investments in securities at fiscal period end, resulting from changes in exchange rates. |
The Fund may invest in foreign securities, which may be subject to foreign taxes on income, gains on investments or currency repatriation, a portion of which may be recoverable. Foreign taxes, if any, are recorded based on the tax regulations and rates that exist in the foreign markets in which the Fund invests and are shown in the Consolidated Statement of Operations.
| K. | Forward Foreign Currency Contracts— The Fund may engage in foreign currency transactions either on a spot (i.e. for prompt delivery and settlement) basis, or through forward foreign currency contracts, to manage or minimize currency or exchange rate risk. |
The Fund may also enter into forward foreign currency contracts for the purchase or sale of a security denominated in a foreign currency in order to “lock in” the U.S. dollar price of that security, or the Fund may also enter into forward foreign currency contracts that do not provide for physical settlement of the two currencies, but instead are settled by a single cash payment calculated as the difference between the agreed upon exchange rate and the spot rate at settlement based upon an agreed upon notional amount (non-deliverable forwards). The Fund will set aside liquid assets in an amount equal to the daily mark-to-market obligation for forward foreign currency contracts.
A forward foreign currency contract is an obligation between two parties (“Counterparties”) to purchase or sell a specific currency for an agreed-upon price at a future date. The use of forward foreign currency contracts does not eliminate fluctuations in the price of the underlying securities the Fund owns or intends to acquire but establishes a rate of exchange in advance. Fluctuations in the value of these contracts are measured by the difference in the contract date and reporting date exchange rates and are recorded as unrealized appreciation (depreciation) until the contracts are closed. When the contracts are closed, realized gains (losses) are recorded. Realized and unrealized gains (losses) on the contracts are included in the Consolidated Statement of Operations. The primary risks associated with forward foreign currency contracts include failure of the Counterparty to meet the terms of the contract and the value of the foreign currency changing unfavorably. These risks may be in excess of the amounts reflected in the Consolidated Statement of Assets and Liabilities.
| L. | Futures Contracts— The Fund may enter into futures contracts to equitize the Fund’s cash holdings or to manage exposure to interest rate, equity, commodity and market price movements and/or currency risks. A futures contract is an agreement between Counterparties to purchase or sell a specified underlying security, currency or commodity (or delivery of a cash settlement price, in the case of an index future) for a fixed price at a future date. The Fund currently invests only in exchange-traded futures and they are standardized as to maturity date and underlying financial instrument. Initial margin deposits required upon entering into futures contracts are satisfied by the segregation of specific securities or cash as collateral at the futures commission merchant (broker). During the period the futures contracts are open, changes in the value of the contracts are recognized as unrealized gains or losses by recalculating the value of the contracts on a daily basis. Subsequent or variation margin payments are received or made depending upon whether unrealized gains or losses are incurred. These amounts are reflected as receivables or payables on the Consolidated Statement of Assets and Liabilities. When the contracts are closed or expire, the Fund recognizes a realized gain or loss equal to the difference between the proceeds from, or cost of, the closing transaction and the Fund’s basis in the contract. The net realized gain (loss) and the change in unrealized gain (loss) on futures contracts held during the period is included on the Consolidated Statement of Operations. The primary risks associated with futures contracts are market risk and the absence of a liquid secondary market. If the Fund were unable to liquidate a futures contract and/or enter into an offsetting closing transaction, the Fund would continue to be subject to market risk with respect to the value of the contracts and continue to be required to maintain the margin deposits on the futures contracts. Futures contracts have minimal Counterparty risk since the exchange’s clearinghouse, as Counterparty to all exchange-traded futures, guarantees the futures against default. Risks may exceed amounts recognized in the Consolidated Statement of Assets and Liabilities. |
| M. | Swap Agreements — The Fund may enter into various swap transactions, including interest rate, total return, index, currency and credit default swap contracts (“CDS”) for investment purposes or to manage interest rate, currency, commodity or credit risk. Such transactions are agreements between Counterparties. These agreements may contain among other conditions, events of default and termination events, and various covenants and representations such as provisions that require the Fund to maintain a pre-determined level of net assets, and/or provide |
Invesco V.I. Balanced-Risk Allocation Fund
| | limits regarding the decline of the Fund’s NAV over specific periods of time. If the Fund were to trigger such provisions and have open derivative positions at that time, the Counterparty may be able to terminate such agreement and request immediate payment in an amount equal to the net liability positions, if any. |
Interest rate, total return, index, and currency swap agreements are two-party contracts entered into primarily to exchange the returns (or differentials in rates of returns) earned or realized on particular predetermined investments or instruments. The gross returns to be exchanged or “swapped” between the parties are calculated with respect to a notional amount, i.e., the return on or increase in value of a particular dollar amount invested at a particular interest rate or return of an underlying asset, in a particular foreign currency, or in a “basket” of securities representing a particular index.
An interest rate swap is an agreement between Counterparties pursuant to which the parties exchange a floating rate payment for a fixed rate payment based on a specified notional amount.
A total return swap is an agreement in which one party makes payments based on a set rate, either fixed or variable, while the other party makes payments based on the return of an underlying asset, which includes both the income generated and capital gains, if any. The unrealized appreciation (depreciation) on total return swaps includes dividends on the underlying securities and financing rate payable from the Counterparty. At the maturity date, a net cash flow is exchanged where the total return is equivalent to the return of the underlying reference less a financing rate, if any. As a receiver, the Fund would receive payments based on any positive total return and would owe payments in the event of a negative total return. As the payer, the Fund would owe payments on any net positive total return, and would receive payment in the event of a negative total return.
Changes in the value of swap agreements are recognized as unrealized gains (losses) in the Consolidated Statement of Operations by “marking to market” on a daily basis to reflect the value of the swap agreement at the end of each trading day. Payments received or paid at the beginning of the agreement are reflected as such on the Consolidated Statement of Assets and Liabilities and may be referred to as upfront payments. The Fund accrues for the fixed payment stream and amortizes upfront payments, if any, on swap agreements on a daily basis with the net amount, recorded as a component of realized gain (loss) on the Consolidated Statement of Operations. A liquidation payment received or made at the termination of a swap agreement is recorded as realized gain (loss) on the Consolidated Statement of Operations. The Fund segregates cash or liquid securities having a value at least equal to the amount of the potential obligation of a Fund under any swap transaction. Cash held as collateral is recorded as deposits with brokers on the Consolidated Statement of Assets and Liabilities. Entering into these agreements involves, to varying degrees, lack of liquidity and elements of credit, market, and Counterparty risk in excess of amounts recognized on the Consolidated Statement of Assets and Liabilities. Such risks involve the possibility that a swap is difficult to sell or liquidate; the Counterparty does not honor its obligations under the agreement and unfavorable interest rates and market fluctuations. It is possible that developments in the swaps market, including potential government regulation, could adversely affect the Fund’s ability to terminate existing swap agreements or to realize amounts to be received under such agreements. A short position in a security poses more risk than holding the same security long. As there is no limit on how much the price of the security can increase, the Fund’s exposure is unlimited.
| N. | Other Risks – The Fund will seek to gain exposure to commodity markets primarily through an investment in the Subsidiary and through investments in exchange-traded funds and commodity-linked derivatives. The Subsidiary, unlike the Fund, may invest without limitation in commodities, commodity-linked derivatives and other securities, such as exchange-traded and commodity-linked notes, that may provide leveraged and non-leveraged exposure to commodity markets. The Fund is indirectly exposed to the risks associated with the Subsidiary’s investments. |
| O. | Leverage Risk — Leverage exists when the Fund can lose more than it originally invests because it purchases or sells an instrument or enters into a transaction without investing an amount equal to the full economic exposure of the instrument or transaction. |
| P. | Collateral—To the extent the Fund has designated or segregated a security as collateral and that security is subsequently sold, it is the Fund’s practice to replace such collateral no later than the next business day. |
NOTE 2—Advisory Fees and Other Fees Paid to Affiliates
The Trust has entered into a master investment advisory agreement with Invesco Advisers, Inc. (the "Adviser" or "Invesco"). Under the terms of the investment advisory agreement, the Fund accrues daily and pays monthly an advisory fee to the Adviser less the amount paid by the Subsidiary to the Adviser based on the annual rate of the Fund’s average daily net assets as follows:
| Average Daily Net Assets | Rate |
| First $250 million | 0.95% |
| Next $250 million | 0.925% |
| Next $500 million | 0.90% |
| Next $1.5 billion | 0.875% |
| Next $2.5 billion | 0.85% |
| Next $2.5 billion | 0.825% |
| Next $2.5 billion | 0.80% |
| Over $10 billion | 0.775% |
For the six months ended June 30, 2019, the effective advisory fees incurred by the Fund was 0.92%.
The Subsidiary has entered into a separate contract with the Adviser whereby the Adviser provides investment advisory and other services to the Subsidiary. In consideration of these services, the Subsidiary pays an advisory fee to the Adviser based on the annual rate of the Subsidiary’s average daily net assets as set forth in the table above.
Under the terms of a master sub-advisory agreement between the Adviser and each of Invesco Asset Management Deutschland GmbH, Invesco Asset Management Limited, Invesco Asset Management (Japan) Limited, Invesco Hong Kong Limited, Invesco Senior Secured Management, Inc. and Invesco Canada Ltd. and separate sub-advisory agreements with Invesco Capital Management LLC and Invesco Asset Management (India) Private Limited (collectively, the "Affiliated Sub-Advisers") the Adviser, not the Fund, will pay 40% of the fees paid to the Adviser to any such Affiliated Sub-Adviser(s)
Invesco V.I. Balanced-Risk Allocation Fund
that provide(s) discretionary investment management services to the Fund based on the percentage of assets allocated to such Affiliated Sub-Adviser(s).
The Adviser has contractually agreed, through at least April 30, 2020, to waive advisory fees and/or reimburse expenses of all shares to the extent necessary to limit total annual fund operating expenses after fee waiver and/or expense reimbursement (including prior fiscal year-end Acquired Fund Fees and Expenses of 0.16% and excluding certain items discussed below) of Series I shares to 0.80% and Series II shares to 1.05% of average daily net assets (the “expense limits”). In determining the Adviser’s obligation to waive advisory fees and/or reimburse expenses, the following expenses are not taken into account, and could cause the total annual fund operating expenses after fee waiver and/or expense reimbursement to exceed the numbers reflected above: (1) interest; (2) taxes; (3) dividend expense on short sales; (4) extraordinary or non-routine items, including litigation expenses; and (5) expenses that the Fund has incurred but did not actually pay because of an expense offset arrangement. Acquired Fund Fees and Expenses are not operating expenses of the Fund directly, but are fees and expenses, including management fees, of the investment companies in which the Fund invests. As a result, the total annual fund operating expenses after expense reimbursement may exceed the expense limits above. Unless Invesco continues the fee waiver agreement, it will terminate on April 30, 2020. During its term, the fee waiver agreement cannot be terminated or amended to increase the expense limits or reduce the advisory fee waiver without approval of the Board of Trustees. The Adviser did not waive fees and/or reimburse expenses during the period under these expense limits.
Further, the Adviser has contractually agreed, through at least June 30, 2021, to waive the advisory fee payable by the Fund in an amount equal to 100% of the net advisory fees the Adviser receives from the affiliated money market funds on investments by the Fund of uninvested cash in such affiliated money market funds.
For the six months ended June 30, 2019, the Adviser waived advisory fees of $2,350,492.
The Trust has entered into a master administrative services agreement with Invesco pursuant to which the Fund has agreed to pay Invesco a fee for costs incurred in providing accounting services and fund administrative services to the Fund and to reimburse Invesco for fees paid to insurance companies that have agreed to provide certain administrative services to the Fund. These administrative services provided by the insurance companies may include, among other things: maintenance of master accounts with the Fund; tracking, recording and transmitting net purchase and redemption orders for Fund shares; maintaining and preserving records related to the purchase, redemption and other account activity of variable product owners; distributing copies of Fund documents such as prospectuses, proxy materials and periodic reports, to variable product owners, and responding to inquiries from variable product owners about the Fund. Pursuant to such agreement, for the six months ended June 30, 2019, Invesco was paid $72,547 for accounting and fund administrative services and was reimbursed $770,005 for fees paid to insurance companies. Also, Invesco has entered into a sub-administration agreement whereby State Street Bank and Trust Company (“SSB”) serves as custodian and fund accountant and provides certain administrative services to the Fund.
The Trust has entered into a transfer agency and service agreement with Invesco Investment Services, Inc. (“IIS”) pursuant to which the Fund has agreed to pay IIS a fee for providing transfer agency and shareholder services to the Fund and reimburse IIS for certain expenses incurred by IIS in the course of providing such services. For the six months ended June 30, 2019, expenses incurred under the agreement are shown in the Consolidated Statement of Operations asTransfer agent fees.
The Trust has entered into a master distribution agreement with Invesco Distributors, Inc. (“IDI”) to serve as the distributor for the Fund. The Trust has adopted a plan pursuant to Rule 12b-1 under the 1940 Act with respect to the Fund’s Series II shares (the “Plan”). The Fund, pursuant to the Plan, pays IDI compensation at the annual rate of 0.25% of the Fund’s average daily net assets of Series II shares. The fees are accrued daily and paid monthly. Of the Plan payments, up to 0.25% of the average daily net assets of the Series II shares may be paid to insurance companies who furnish continuing personal shareholder services to customers who purchase and own Series II shares of the Fund. For the six months ended June 30, 2019, expenses incurred under the Plan are detailed in the Consolidated Statement of Operations asDistribution fees.
Certain officers and trustees of the Trust are officers and directors of the Adviser, IIS and/or IDI.
NOTE 3—Additional Valuation Information
GAAP defines fair value as the price that would be received to sell an asset or paid to transfer a liability in an orderly transaction between market participants at the measurement date, under current market conditions. GAAP establishes a hierarchy that prioritizes the inputs to valuation methods, giving the highest priority to readily available unadjusted quoted prices in an active market for identical assets (Level 1) and the lowest priority to significant unobservable inputs (Level 3), generally when market prices are not readily available or are unreliable. Based on the valuation inputs, the securities or other investments are tiered into one of three levels. Changes in valuation methods may result in transfers in or out of an investment’s assigned level:
Level 1 – Prices are determined using quoted prices in an active market for identical assets.
Level 2 – Prices are determined using other significant observable inputs. Observable inputs are inputs that other market participants may use in pricing a security. These may include quoted prices for similar securities, interest rates, prepayment speeds, credit risk, yield curves, loss severities, default rates, discount rates, volatilities and others.
Level 3 – Prices are determined using significant unobservable inputs. In situations where quoted prices or observable inputs are unavailable (for example, when there is little or no market activity for an investment at the end of the period), unobservable inputs may be used. Unobservable inputs reflect the Fund’s own assumptions about the factors market participants would use in determining fair value of the securities or instruments and would be based on the best available information.
Invesco V.I. Balanced-Risk Allocation Fund
The following is a summary of the tiered valuation input levels, as of June 30, 2019. The level assigned to the securities valuations may not be an indication of the risk or liquidity associated with investing in those securities. Because of the inherent uncertainties of valuation, the values reflected in the consolidated financial statements may materially differ from the value received upon actual sale of those investments.
| | Level 1 | Level 2 | Level 3 | Total |
| Investments in Securities | | | | |
| U.S. Treasury Securities | $— | $119,544,502 | $— | $119,544,502 |
| Commodity-Linked Securities | — | 19,745,684 | — | 19,745,684 |
| Money Market Funds | 897,476,490 | — | — | 897,476,490 |
| Total Investments in Securities | 897,476,490 | 139,290,186 | — | 1,036,766,676 |
| Other Investments - Assets* | | | | |
| Futures Contracts | 19,349,013 | — | — | 19,349,013 |
| Swap Agreements | — | 1,332,076 | — | 1,332,076 |
| | 19,349,013 | 1,332,076 | — | 20,681,089 |
| Other Investments - Liabilities* | | | | |
| Futures Contracts | (75,724) | — | — | (75,724) |
| Swap Agreements | — | (132,507) | — | (132,507) |
| | (75,724) | (132,507) | — | (208,231) |
| Total Other Investments | 19,273,289 | 1,199,569 | — | 20,472,858 |
| Total Investments | $916,749,779 | $140,489,755 | $— | $1,057,239,534 |
| * | Unrealized appreciation (depreciation). |
NOTE 4—Derivative Investments
The Fund may enter into an International Swaps and Derivatives Association Master Agreement (“ISDA Master Agreement”) under which a fund may trade OTC derivatives. An OTC transaction entered into under an ISDA Master Agreement typically involves a collateral posting arrangement, payment netting provisions and close-out netting provisions. These netting provisions allow for reduction of credit risk through netting of contractual obligations. The enforceability of the netting provisions of the ISDA Master Agreement depends on the governing law of the ISDA Master Agreement, among other factors.
For financial reporting purposes, the Fund does not offset OTC derivative assets or liabilities that are subject to ISDA Master Agreements in the Consolidated Statement of Assets and Liabilities.
Value of Derivative Investments at Period-End
The table below summarizes the value of the Fund’s derivative investments, detailed by primary risk exposure, held as of June 30, 2019:
| | Value |
| Derivative Assets | Commodity
Risk | Equity
Risk | Interest
Rate Risk | Total |
| Unrealized appreciation on futures contracts — Exchange-Traded(a) | $3,872,583 | $5,627,886 | $9,848,544 | $19,349,013 |
| Unrealized appreciation on swap agreements — OTC | 1,332,076 | - | - | 1,332,076 |
| Total Derivative Assets | 5,204,659 | 5,627,886 | 9,848,544 | 20,681,089 |
| Derivatives not subject to master netting agreements | (3,872,583) | (5,627,886) | (9,848,544) | (19,349,013) |
| Total Derivative Assets subject to master netting agreements | $1,332,076 | $- | $- | $1,332,076 |
| | Value |
| Derivative Liabilities | Commodity
Risk | Equity
Risk | Interest
Rate Risk | Total |
| Unrealized depreciation on futures contracts — Exchange-Traded(a) | $(75,724) | $- | $- | $(75,724) |
| Unrealized depreciation on swap agreements — OTC | (132,507) | - | - | (132,507) |
| Total Derivative Liabilities | (208,231) | - | - | (208,231) |
| Derivatives not subject to master netting agreements | 75,724 | - | - | 75,724 |
| Total Derivative Liabilities subject to master netting agreements | $(132,507) | $- | $- | $(132,507) |
| (a) | The daily variation margin receivable at period-end is recorded in the Consolidated Statement of Assets and Liabilities. |
Invesco V.I. Balanced-Risk Allocation Fund
Offsetting Assets and Liabilities
The table below reflects the Fund’s exposure to Counterparties subject to either an ISDA Master Agreement or other agreement for OTC derivative transactions as of June 30, 2019.
| | Financial
Derivative
Assets | | Financial
Derivative
Liabilities | | Collateral
(Received)/Pledged | |
| Counterparty | Swap
Agreements | | Swap
Agreements | Net Value of
Derivatives | Non-Cash | Cash | Net
Amount |
| Subsidiary | | | | | | | |
| Barclays Bank PLC | $ 288,019 | | $(85,864) | $202,155 | $– | $– | $202,155 |
| Canadian Imperial Bank of Commerce | 396,415 | | (3,250) | 393,165 | – | – | 393,165 |
| Cargill, Inc. | 419,965 | | (10,768) | 409,197 | – | (320,000) | 89,197 |
| Goldman Sachs International | 369,296 | | (6,896) | 362,400 | – | – | 362,400 |
| JPMorgan Chase Bank, N.A. | 129,880 | | (49,573) | 80,307 | – | – | 80,307 |
| Merrill Lynch International | 884,630 | | (145,887) | 738,743 | – | – | 738,743 |
| Morgan Stanley Capital Services LLC | 148,466 | | (973) | 147,493 | – | – | 147,493 |
| Total | $ 2,636,671 | | $ (303,211) | $ 2,333,460 | $– | $ (320,000) | $ 2,013,460 |
Effect of Derivative Investments for the six months ended June 30, 2019
The table below summarizes the gains (losses) on derivative investments, detailed by primary risk exposure, recognized in earnings during the period:
| | Location of Gain (Loss) on
Consolidated Statement of Operations |
| | Commodity
Risk | Equity
Risk | Interest
Rate Risk | Total |
| Realized Gain (Loss): | | | | |
| Futures contracts | $833,951 | $23,943,434 | $53,645,196 | $78,422,581 |
| Swap agreements | (3,516,662) | - | - | (3,516,662) |
| Change in Net Unrealized Appreciation (Depreciation): | | | | |
| Futures contracts | 9,418,724 | 15,523,043 | (6,709,520) | 18,232,247 |
| Swap agreements | 5,237,479 | (3,025) | - | 5,234,454 |
| Total | $11,973,492 | $39,463,452 | $46,935,676 | $98,372,620 |
The table below summarizes the average notional value of derivatives held during the period.
| | Futures
Contracts | Swap
Agreements |
| Average notional value | $1,298,067,258 | $155,925,363 |
NOTE 5—Trustees’ and Officers’ Fees and Benefits
Trustees’ and Officers’ Fees and Benefits include amounts accrued by the Fund to pay remuneration to certain Trustees and Officers of the Fund. Trustees have the option to defer compensation payable by the Fund, and Trustees’ and Officers’ Fees and Benefits also include amounts accrued by the Fund to fund such deferred compensation amounts. Those Trustees who defer compensation have the option to select various Invesco Funds in which their deferral accounts shall be deemed to be invested. Finally, certain current Trustees were eligible to participate in a retirement plan that provided for benefits to be paid upon retirement to Trustees over a period of time based on the number of years of service. The Fund may have certain former Trustees who also participate in a retirement plan and receive benefits under such plan.Trustees’ and Officers’ Fees and Benefits include amounts accrued by the Fund to fund such retirement benefits. Obligations under the deferred compensation and retirement plans represent unsecured claims against the general assets of the Fund.
NOTE 6—Cash Balances
The Fund is permitted to temporarily carry a negative or overdrawn balance in its account with SSB, the custodian bank. Such balances, if any at period-end, are shown in the Consolidated Statement of Assets and Liabilities under the payable captionAmount due custodian. To compensate the custodian bank for such overdrafts, the overdrawn Fund may either (1) leave funds as a compensating balance in the account so the custodian bank can be compensated by earning the additional interest; or (2) compensate by paying the custodian bank at a rate agreed upon by the custodian bank and Invesco, not to exceed the contractually agreed upon rate.
NOTE 7—Tax Information
The amount and character of income and gains to be distributed are determined in accordance with income tax regulations, which may differ from GAAP. Reclassifications are made to the Fund’s capital accounts to reflect income and gains available for distribution (or available capital loss
Invesco V.I. Balanced-Risk Allocation Fund
carryforward) under income tax regulations. The tax character of distributions paid during the year and the tax components of net assets will be reported at the Fund’s fiscal year-end.
Capital loss carryforward is calculated and reported as of a specific date. Results of transactions and other activity after that date may affect the amount of capital loss carryforward actually available for the Fund to utilize. Capital losses generated in years beginning after December 22, 2010 can be carried forward for an unlimited period, whereas previous losses expire in eight tax years. Capital losses with an expiration period may not be used to offset capital gains until all net capital losses without an expiration date have been utilized. Capital loss carryforwards with no expiration date will retain their character as either short-term or long-term capital losses instead of as short-term capital losses as under prior law. The ability to utilize capital loss carryforwards in the future may be limited under the Internal Revenue Code and related regulations based on the results of future transactions.
The Fund had a capital loss carryforward as of December 31, 2018, as follows:
| Capital Loss Carryforward |
| Expiration | Short-Term | Long-Term | Total |
| Not subject to expiration | $24,253,552 | $12,006,748 | $36,260,300 |
NOTE 8—Investment Transactions
The aggregate amount of investment securities (other than short-term securities, U.S. Treasury obligations and money market funds, if any) purchased and sold by the Fund during the six months ended June 30, 2019 was $12,950,000 and $12,231,309, respectively. Cost of investments, including any derivatives, on a tax basis includes the adjustments for financial reporting purposes as of the most recently completed federal income tax reporting period-end.
| Unrealized Appreciation (Depreciation) of Investments on a Tax Basis |
| Aggregate unrealized appreciation of investments | $30,047,710 |
| Aggregate unrealized (depreciation) of investments | (1,952,547) |
| Net unrealized appreciation of investments | $28,095,163 |
Cost of investments for tax purposes is $1,029,144,371.
NOTE 9—Share Information
| | Summary of Share Activity |
| | Six months ended
June 30, 2019(a) | | Year ended
December 31, 2018 |
| | Shares | Amount | | Shares | Amount |
| Sold: | | | | | |
| Series I | 284,790 | $2,866,010 | | 438,450 | $4,686,758 |
| Series II | 2,244,104 | 22,132,226 | | 7,359,729 | 79,190,918 |
| Issued as reinvestment of dividends: | | | | | |
| Series I | — | — | | 415,814 | 4,120,721 |
| Series II | — | — | | 11,268,048 | 110,201,505 |
| Reacquired: | | | | | |
| Series I | (160,870) | (1,625,129) | | (376,740) | (3,995,276) |
| Series II | (9,536,656) | (94,682,902) | | (18,613,654) | (196,096,139) |
| Net increase (decrease) in share activity | (7,168,632) | $(71,309,795) | | 491,647 | $(1,891,513) |
| (a) | There are entities that are record owners of more than 5% of the outstanding shares of the Fund and in the aggregate own 82% of the outstanding shares of the Fund. The Fund and the Fund’s principal underwriter or adviser, are parties to participation agreements with these entities whereby these entities sell units of interest in separate accounts funding variable products that are invested in the Fund. The Fund, Invesco and/or Invesco affiliates may make payments to these entities, which are considered to be related to the Fund, for providing services to the Fund, Invesco and/or Invesco affiliates including but not limited to services such as, securities brokerage, third party record keeping and account servicing and administrative services. The Fund has no knowledge as to whether all or any portion of the shares owned of record by these entities are also owned beneficially. |
Invesco V.I. Balanced-Risk Allocation Fund
Calculating your ongoing Fund expenses
Example
As a shareholder of the Fund, you incur ongoing costs, including management fees; distribution and/or service fees (12b-1); and other Fund expenses. This example is intended to help you understand your ongoing costs (in dollars) of investing in the Fund and to compare these costs with ongoing costs of investing in other mutual funds. The example is based on an investment of $1,000 invested at the beginning of the period and held for the entire period January 1, 2019 through June 30, 2019.
The actual and hypothetical expenses in the examples below do not represent the effect of any fees or other expenses assessed in connection with a variable product; if they did, the expenses shown would be higher while the ending account values shown would be lower.
Actual expenses
The table below provides information about actual account values and actual expenses. You may use the information in this table, together with the amount you invested, to estimate the expenses that you paid over the period. Simply divide your account value by $1,000 (for example, an $8,600 account value divided by $1,000 = 8.6), then multiply the result by the number in the table under the heading entitled “Actual Expenses Paid During Period” to estimate the expenses you paid on your account during this period.
Hypothetical example for comparison purposes
The table below also provides information about hypothetical account values and hypothetical expenses based on the Fund’s actual expense ratio and an assumed rate of return of 5% per year before expenses, which is not the Fund’s actual return.
The hypothetical account values and expenses may not be used to estimate the actual ending account balance or expenses you paid for the period. You may use this information to compare the ongoing costs of investing in the Fund and other funds. To do so, compare this 5% hypothetical example with the 5% hypothetical examples that appear in the shareholder reports of the other funds.
Please note that the expenses shown in the table are meant to highlight your ongoing costs. Therefore, the hypothetical information is useful in comparing ongoing costs, and will not help you determine the relative total costs of owning different funds.
| | Beginning
Account Value (01/01/19) | ACTUAL | HYPOTHETICAL
(5% annual return before
expenses) | Annualized
Expense
Ratio |
Ending
Account Value
(06/30/19)1 | Expenses
Paid During
Period2 | Ending
Account Value
(06/30/19) | Expenses
Paid During
Period2 |
| Series I | $1,000.00 | $1,107.70 | $3.34 | $1,021.62 | $3.21 | 0.64% |
| Series II | 1,000.00 | 1,106.00 | 4.65 | 1,020.38 | 4.46 | 0.89 |
| 1 | The actual ending account value is based on the actual total return of the Fund for the period January 1, 2019 through June 30, 2019, after actual expenses and will differ from the hypothetical ending account value which is based on the Fund’s expense ratio and a hypothetical annual return of 5% before expenses. |
| 2 | Expenses are equal to the Fund’s annualized expense ratio as indicated above multiplied by the average account value over the period, multiplied by 181/365 to reflect the most recent fiscal half year. |
Invesco V.I. Balanced-Risk Allocation Fund
Approval of Investment Advisory and Sub-Advisory Contracts
At meetings held on June 10, 2019, the Board of Trustees (the Board or the Trustees) of AIM Variable Insurance Funds (Invesco Variable Insurance Funds) as a whole, and the independent Trustees, who comprise over 75% of the Board, voting separately, approved the continuance of the Invesco V.I. Balanced-Risk Allocation Fund’s (the Fund) Master Investment Advisory Agreement with Invesco Advisers, Inc. (Invesco Advisers and the investment advisory agreement) and the Master IntergroupSub-Advisory Contract for Mutual Funds with Invesco Asset Management Deutschland GmbH, Invesco Asset Management Limited, Invesco Asset Management (Japan) Limited, Invesco Hong Kong Limited, Invesco Senior Secured Management, Inc. and Invesco Canada Ltd. and separatesub-advisory contracts with Invesco Capital Management LLC and Invesco Asset Management (India) Private Limited (collectively, the AffiliatedSub-Advisers and thesub-advisory contracts) for another year, effective July 1, 2019. After evaluating the factors discussed below, among others, the Board approved the renewal of the Fund’s investment advisory agreement and thesub-advisory contracts and determined that the compensation payable by the Fund to Invesco Advisers and by Invesco Advisers to the AffiliatedSub-Advisers is fair and reasonable.
The Board’s Evaluation Process
The Board’s Investments Committee has established threeSub-Committees, which meet throughout the year to review the performance of funds advised by Invesco Advisers (the Invesco Funds). As part of a regularly scheduled basis ofin-person Board meetings, theSub-Committees meet with portfolio managers for their assigned Invesco Funds and other members of management to review detailed information about investment performance and portfolio attributes of these funds. The Board took into account evaluations and reports that it received from the Investments Committee andSub-Committees, as well as the information provided to such committees and the Board throughout the year, in considering whether to approve each Invesco Fund’s investment advisory agreement andsub-advisory contracts.
As part of the contract renewal process, the Board reviews and considers information provided in response to detailed requests for information submitted to management by the independent Trustees with assistance from legal counsel to the independent Trustees. The Board receives comparative investment performance and fee data regarding the Invesco Funds prepared by Invesco Advisers and Broadridge Financial Solutions, Inc. (Broadridge), an independent mutual fund data provider. The Board also receives an independent written evaluation from the Senior Officer, an officer of the Invesco Funds who reports directly to the
independent Trustees. The Senior Officer’s evaluation is prepared as part of his responsibility to manage the process by which the Invesco Funds’ proposed management fees are negotiated during the annual contract renewal process to ensure they are negotiated in a manner that is at arms’ length and reasonable. In addition to meetings with Invesco Advisers and fund counsel throughout the year, the independent Trustees also discuss the continuance of the investment advisory agreement andsub-advisory contracts in separate sessions with the Senior Officer and with independent legal counsel.
The discussion below is a summary of the Senior Officer’s independent written evaluation with respect to the Fund’s investment advisory agreement as well as a discussion of the material factors and related conclusions that formed the basis for the Board’s approval of the Fund’s investment advisory agreement andsub-advisory contracts. The Trustees’ review and conclusions are based on the comprehensive consideration of all information presented to them during the course of the year and in prior years and are not the result of any single determinative factor. Moreover, one Trustee may have weighed a particular piece of information or factor differently than another Trustee. This information is current as of June 10, 2019.
Factors and Conclusions and Summary of Independent Written Fee Evaluation
| A. | Nature, Extent and Quality of Services Provided by Invesco Advisers and the AffiliatedSub-Advisers |
The Board reviewed the nature, extent and quality of the advisory services provided to the Fund by Invesco Advisers under the Fund’s investment advisory agreement, and the credentials and experience of the officers and employees of Invesco Advisers who provide these services, including the Fund’s portfolio manager(s). The Board’s review included consideration of Invesco Advisers’ investment process oversight and structure, credit analysis and investment risk management. The Board also considerednon-advisory services that Invesco Advisers and its affiliates provide to the Invesco Funds such as various back office support functions, third party oversight, internal audit, valuation, portfolio trading and legal and compliance. The Board also received and reviewed information about Invesco Advisers’ role as administrator of the Invesco Funds’ liquidity risk management program. The Board also reviewed and considered the benefits to shareholders of investing in a fund that is part of the Invesco family of funds under the umbrella of Invesco Ltd., Invesco Advisers’ parent company, and noted Invesco Ltd.’s depth and experience in conducting an investment management business, as well as its
commitment of financial and other resources to such business. The Board reviewed and considered information about the resources that Invesco Advisers intends to continue to commit to managing the Invesco family of funds following Invesco Ltd.’s acquisition of OppenheimerFunds, Inc. and its subsidiaries. The Board concluded that the nature, extent and quality of the services provided to the Fund by Invesco Advisers are appropriate and satisfactory.
The Board reviewed the services that may be provided by the AffiliatedSub-Advisers under thesub-advisory contracts and the credentials and experience of the officers and employees of the AffiliatedSub-Advisers who provide these services. The Board noted the AffiliatedSub-Advisers’ expertise with respect to certain asset classes and that the AffiliatedSub-Advisers have offices and personnel that are located in financial centers around the world. As a result, the Board noted that the AffiliatedSub-Advisers can provide research and investment analysis on the markets and economies of various countries in which the Fund may invest, make recommendations regarding securities and assist with security trades. The Board concluded that thesub-advisory contracts may benefit the Fund and its shareholders by permitting Invesco Advisers to use the resources and talents of the AffiliatedSub-Advisers in managing the Fund. The Board concluded that the nature, extent and quality of the services that may be provided by the AffiliatedSub-Advisers are appropriate and satisfactory.
| B. | Fund Investment Performance |
The Board considered Fund investment performance as a relevant factor in considering whether to approve the investment advisory agreement. The Board did not view Fund investment performance as a relevant factor in considering whether to approve thesub-advisory contracts for the Fund, as no AffiliatedSub-Adviser currently manages assets of the Fund.
The Board compared the Fund’s investment performance over multiple time periods ending December 31, 2018 to the performance of funds in the Broadridge performance universe and against the Lipper Variable Underlying Funds Alternative Other Funds Index. The Board noted that performance of Series I shares of the Fund was in the fourth quintile of its performance universe for the one year period, the second quintile for the three year period and the first quintile for the five year period (the first quintile being the best performing funds and the fifth quintile being the worst performing funds). The Board noted that performance of Series I shares of the Fund was below the performance of the Index for the one year period and above the performance of the Index for the three and five year periods. The
Invesco V.I. Balanced-Risk Allocation Fund
Board noted that the Fund’s asset allocation, including its equity positioning and exposure to certain segments of the fixed income market, detracted from the Fund’s performance. The Trustees also reviewed more recent Fund performance and this review did not change their conclusions.
| C. | Advisory andSub-Advisory Fees and Fund Expenses |
The Board compared the Fund’s contractual management fee rate to the contractual management fee rates of funds in the Fund’s Broadridge expense group. The Board noted that the contractual management fee rate for Series I shares of the Fund was above the median contractual management fee rate of funds in its expense group. The Board noted that the term “contractual management fee” for funds in the expense group may include both advisory and certainnon-portfolio management administrative services fees, but that Broadridge does not provide information on a fund by fund basis as to what is included. The Board also reviewed the methodology used by Broadridge in providing expense group information, which includes using each fund’s contractual management fee schedule (including any applicable breakpoints) as reported in the most recent prospectus or statement of additional information for each fund in the expense group. The Board also considered comparative information regarding the Fund’s total expense ratio and its various components. The Board noted that there were only four funds (including the Fund) in the expense group.
The Board noted that Invesco Advisers has contractually agreed to waive fees and/or limit expenses of the Fund for the term disclosed in the Fund’s registration statement in an amount necessary to limit total annual operating expenses to a specified percentage of average daily net assets for each class of the Fund.
The Board also considered the fees charged by Invesco Advisers and the AffiliatedSub-Advisers to other similarly managed client accounts. The Board noted that Invesco Advisers or the AffiliatedSub-Advisers may charge lower fees to large institutional clients. Invesco Advisers reviewed with the Board differences in the scope of services it provides to the Invesco Funds relative to certain other types of client accounts, including management of cash flows as a result of redemptions and purchases, necessary infrastructure such as officers, office space, technology, legal and distribution, oversight of service providers, costs and business risks associated with launching new funds and sponsoring and maintaining the product line, preparation of annual registration statement updates and financial information and compliance with federal and state laws and regulations.
The Board also compared the Fund’s effective advisory fee rate (the advisory fee rate after advisory fee waivers and before other expense limitations/waivers) to the effective advisory fee rates of other similarly managed third-party
mutual funds advised orsub-advised by Invesco Advisers and its affiliates, based on asset balances as of December 31, 2018.
The Board also considered the services that may be provided by the AffiliatedSub-Advisers pursuant to thesub-advisory contracts, as well as the fees payable by Invesco Advisers to the AffiliatedSub-Advisers pursuant to thesub-advisory contracts.
| D. | Economies of Scale and Breakpoints |
The Board considered the extent to which there may be economies of scale in the provision of advisory services to the Fund. The Board considered Invesco’s reinvestment in its business, including investments in business infrastructure and cybersecurity. The Board also considered that the Fund benefits from economies of scale through contractual breakpoints in the Fund’s advisory fee schedule, which generally operate to reduce the Fund’s expense ratio as it grows in size. The Board noted that the Fund shares directly in economies of scale through lower fees charged by third party service providers based on the combined size of the Invesco Funds. The Board noted that the Fund may also benefit from economies of scale through initial fee setting, fee waivers and expense reimbursements.
| E. | Profitability and Financial Resources |
The Board reviewed information from Invesco Advisers concerning the costs of the advisory and other services that Invesco Advisers and its affiliates provide to the Fund and the Invesco Funds and the profitability of Invesco Advisers and its affiliates in providing these services. The Board considered the methodology used for calculating profitability and noted the periodic review of such methodology by an independent consultant. The Board noted that Invesco Advisers continues to operate at a net profit from services Invesco Advisers and its affiliates provide to the Invesco Funds and the Fund. The Board did not deem the level of profits realized by Invesco Advisers and its affiliates from providing services to the Fund to be excessive given the nature, extent and quality of the services provided. The Board received information from Invesco Advisers demonstrating that Invesco Advisers and the Affiliated Sub-Advisers are financially sound and have the resources necessary to perform their obligations under the investment advisory agreement andsub-advisory contracts.
| F. | Collateral Benefits to Invesco Advisers and its Affiliates |
The Board considered various other benefits received by Invesco Advisers and its affiliates from the relationship with the Fund, including the fees received for providing administrative, transfer agency and distribution services to the Fund. The Board considered comparative information regarding fees charged for these services, including information provided by Broadridge and other independent sources. The Board considered the performance of Invesco Advisers and its affiliates in providing these services and the organizational structure employed to provide these services. The Board
also considered that these services are provided to the Fund pursuant to written contracts that are reviewed and approved on an annual basis by the Board; and that the services are required for the operation of the Fund.
The Board considered the benefits that may be realized by Invesco Advisers and the AffiliatedSub-Advisers as a result of portfolio brokerage transactions executed through “soft dollar” arrangements. Invesco Advisers noted that the Fund does not execute brokerage transaction through “soft dollar” arrangements to any significant degree.
The Board considered that the Fund’s uninvested cash and cash collateral from any securities lending arrangements may be invested in money market funds advised by Invesco Advisers pursuant to procedures approved by the Board. Invesco Advisers noted that the Fund does not engage in securities lending arrangements to any significant degree.
The Board also considered that an affiliated broker may receive commissions for executing certain trades for the Fund. Invesco Advisers and the AffiliatedSub-Advisers may use the affiliated broker to, among other things, control order routing and minimize information leakage, and the Board was advised that such trades are executed in compliance with rules under the federal securities laws and consistent with best execution obligations.
Invesco V.I. Balanced-Risk Allocation Fund
| Semiannual Report to Shareholders | June 30, 2019 |
Invesco V.I. Comstock Fund
Beginning on January 1, 2021, as permitted by regulations adopted by the Securities and Exchange Commission, the insurance company that offers your variable annuity or variable life insurance contract may no longer send you paper copies of the Fund’s shareholder reports by mail, unless you specifically request paper copies of the reports from the insurance company or your financial intermediary. Instead of delivering paper copies of the report, the insurance company may choose to make the reports available on a website, and will notify you by mail each time a report is posted and provide you with a website link to access the report. Instructions for requesting paper copies will be provided by your insurance company.
If the insurance company offers electronic delivery, you may elect to receive shareholder reports and other communications about the Fund electronically by following the instructions provided by the insurance company or by contacting your financial intermediary. If you already elected to receive shareholder reports electronically, you will not be affected by this change and you need not take any action.
You may elect to receive all future reports in paper free of charge from the insurance company. You can inform the insurance company or your financial intermediary that you wish to continue receiving paper copies of your shareholder reports by following the instructions provided by the insurance company or by contacting your financial intermediary. Your election to receive reports in paper will apply to all portfolio companies available under your contract with the insurance company.
The Fund provides a complete list of its holdings four times in each fiscal year, at the quarter-ends. For the second and fourth quarters, the lists appear in the Fund’s semiannual and annual reports to shareholders. For the first and third quarters, the Fund files the lists with the Securities and Exchange Commission (SEC) on Form N-Q (or any successor Form). The Fund’s Form N-Q (or any successor Form) filings are available on the SEC website, sec.gov. The SEC file numbers for the Fund are 811-07452 and 033-57340. The Fund’s most recent portfolio holdings, as filed on Form N-Q (or any successor Form), have also been made available to insurance companies issuing variable annuity contracts and variable life insurance policies (“variable products”) that invest in the Fund.
A description of the policies and procedures that the Fund uses to determine how to vote proxies relating to portfolio securities is available without charge, upon request, from our Client Services department at 800 959 4246 or at invesco.com/proxyguidelines. The information is also available on the SEC website, sec.gov.
Information regarding how the Fund voted proxies related to its portfolio securities during the most recent 12-month period ended June 30 is available at invesco.com/proxysearch. The information is also available on the SEC website, sec.gov.
Invesco Advisers, Inc. is an investment adviser; it provides investment advisory services to individual and institutional clients and does not sell securities. Invesco Distributors, Inc. is the US distributor for Invesco Ltd.’s retail mutual funds, exchange-traded funds and institutional money market funds. Both are wholly owned, indirect subsidiaries of Invesco Ltd.
This report must be accompanied or preceded by a currently effective Fund prospectus and variable product prospectus, which contain more complete information, including sales charges and expenses. Investors should read each carefully before investing.
NOT FDIC INSURED | MAY LOSE VALUE | NO BANK GUARANTEE
| Invesco Distributors, Inc. | VK-VICOM-SAR-1 |
Performance summary
Fund vs. Indexes
Cumulative total returns, December 31, 2018 to June 30, 2019, excluding variable product issuer charges. If variable product issuer charges were included, returns would be lower.
| Series I Shares | 14.95% |
| Series II Shares | 14.76 |
| S&P 500 Index▼ (Broad Market Index) | 18.54 |
Russell 1000 Value Index■
(Style-Specific Index) | 16.24 |
Lipper VUF Large-Cap Value Funds Index♦
(Peer Group Index) | 15.89 |
| Source(s):▼FactSet Research Systems Inc.;■ RIMES Technologies Corp.;♦ Lipper Inc. |
TheS&P 500® Index is an unmanaged index considered representative of the US stock market.
TheRussell 1000® Value Index is an unmanaged index considered representative of large-cap value stocks. The Russell 1000 Value Index is a trademark/service mark of the Frank Russell Co. Russell® is a trademark of the Frank Russell Co.
TheLipper VUF Large-Cap Value Funds Index is an unmanaged index considered representative of large-cap value variable insurance underlying funds tracked by Lipper.
The Fund is not managed to track the performance of any particular index, including the indexes described here, and consequently, the performance of the Fund may deviate significantly from the performance of the indexes.
A direct investment cannot be made in an index. Unless otherwise indicated, index results include reinvested dividends, and they do not reflect sales charges. Performance of the peer group, if applicable, reflects fund expenses; performance of a market index does not.
| Average Annual Total Returns |
| As of 6/30/19 |
| Series I Shares | |
| Inception (4/30/99) | 6.96% |
| 10 Years | 12.71 |
| 5 Years | 6.13 |
| 1 Year | 0.87 |
| Series II Shares | |
| Inception (9/18/00) | 6.97% |
| 10 Years | 12.42 |
| 5 Years | 5.87 |
| 1 Year | 0.61 |
Effective June 1, 2010, Class I and Class II shares of the predecessor fund, Van Kampen Life Investment Trust Comstock Portfolio, advised by Van Kampen Asset Management were reorganized into Series I and Series II shares, respectively, of Invesco Van Kampen V.I. Comstock Fund (renamed Invesco V.I. Comstock Fund on April 29, 2013). Returns shown above, prior to June 1, 2010, for Series I and Series II shares are blended returns of the predecessor fund and Invesco V.I. Comstock Fund. Share class returns will differ from the predecessor fund because of different expenses.
The performance data quoted represent past performance and cannot guarantee comparable future results; current performance may be lower or higher. Please contact your variable product issuer or financial adviser for the most recent month-end variable product performance. Performance
figures reflect Fund expenses, reinvested distributions and changes in net asset value. Investment return and principal value will fluctuate so that you may have a gain or loss when you sell shares.
The total annual Fund operating expense ratio set forth in the most recent Fund prospectus as of the date of this report for Series I and Series II shares was 0.76% and 1.01%, respectively. The expense ratios presented above may vary from the expense ratios presented in other sections of this report that are based on expenses incurred during the period covered by this report.
Invesco V.I. Comstock Fund, a series portfolio of AIM Variable Insurance Funds (Invesco Variable Insurance Funds), is currently offered through insurance companies issuing variable products. You cannot purchase shares of the Fund directly. Performance fig-
ures given represent the Fund and are not intended to reflect actual variable product values. They do not reflect sales charges, expenses and fees assessed in connection with a variable product. Sales charges, expenses and fees, which are determined by the variable product issuers, will vary and will lower the total return.
The most recent month-end performance at the Fund level, excluding variable product charges, is available at 800 451 4246. As mentioned above, for the most recent month-end performance including variable product charges, please contact your variable product issuer or financial adviser.
Fund performance reflects any applicable fee waivers and/or expense reimbursements. Had the adviser not waived fees and/or reimbursed expenses currently or in the past, returns would have been lower. See current prospectus for more information.
Invesco V.I. Comstock Fund
Schedule of Investments(a)
June 30, 2019
(Unaudited)
| | Shares | Value |
| Common Stocks & Other Equity Interests–93.12% |
| Aerospace & Defense–1.48% |
| Arconic, Inc. | 251,095 | $6,483,273 |
| Textron, Inc. | 265,850 | 14,100,684 |
| | | | 20,583,957 |
| Agricultural Products–1.17% |
| Archer-Daniels-Midland Co. | 333,913 | 13,623,651 |
| Bunge Ltd. | 47,596 | 2,651,573 |
| | | | 16,275,224 |
| Apparel Retail–0.44% |
| Gap, Inc. (The) | 337,632 | 6,067,247 |
| Asset Management & Custody Banks–2.41% |
| Bank of New York Mellon Corp. (The) | 380,937 | 16,818,369 |
| State Street Corp. | 295,835 | 16,584,510 |
| | | | 33,402,879 |
| Automobile Manufacturers–2.04% |
| General Motors Co. | 734,332 | 28,293,812 |
| Automotive Retail–0.30% |
| Advance Auto Parts, Inc. | 26,850 | 4,138,659 |
| Biotechnology–1.22% |
| Gilead Sciences, Inc. | 250,864 | 16,948,372 |
| Broadcasting–0.72% |
| CBS Corp., Class B | 200,188 | 9,989,381 |
| Building Products–2.01% |
| Johnson Controls International PLC | 674,516 | 27,864,256 |
| Cable & Satellite–2.28% |
| Charter Communications, Inc., Class A(b) | 41,791 | 16,514,967 |
| Comcast Corp., Class A | 359,107 | 15,183,044 |
| | | | 31,698,011 |
| Communications Equipment–2.12% |
| Cisco Systems, Inc. | 538,314 | 29,461,925 |
| Construction Machinery & Heavy Trucks–0.55% |
| Caterpillar, Inc. | 55,577 | 7,574,589 |
| Consumer Finance–0.77% |
| Ally Financial, Inc. | 343,015 | 10,630,035 |
| Diversified Banks–14.31% |
| Bank of America Corp. | 2,174,655 | 63,064,995 |
| Citigroup, Inc. | 1,004,939 | 70,375,878 |
| JPMorgan Chase & Co. | 411,674 | 46,025,153 |
| Wells Fargo & Co. | 403,993 | 19,116,949 |
| | | | 198,582,975 |
| | Shares | Value |
| Electric Utilities–0.41% |
| PG&E Corp.(b) | 250,869 | $5,749,918 |
| Electrical Components & Equipment–2.40% |
| Eaton Corp. PLC | 224,948 | 18,733,670 |
| Emerson Electric Co. | 218,660 | 14,588,995 |
| | | | 33,322,665 |
| Fertilizers & Agricultural Chemicals–0.74% |
| CF Industries Holdings, Inc. | 220,346 | 10,292,362 |
| Health Care Distributors–1.57% |
| Cardinal Health, Inc. | 221,277 | 10,422,147 |
| McKesson Corp. | 84,380 | 11,339,828 |
| | | | 21,761,975 |
| Health Care Equipment–0.74% |
| Medtronic PLC | 105,680 | 10,292,175 |
| Health Care Services–0.77% |
| CVS Health Corp. | 196,877 | 10,727,828 |
| Hotels, Resorts & Cruise Lines–1.74% |
| Carnival Corp. | 518,028 | 24,114,203 |
| Household Products–2.30% |
| Kimberly-Clark Corp. | 131,311 | 17,501,130 |
| Reckitt Benckiser Group PLC (United Kingdom) | 182,569 | 14,427,942 |
| | | | 31,929,072 |
| Independent Power Producers & Energy Traders–0.46% |
| Vistra Energy Corp. | 283,411 | 6,416,425 |
| Industrial Conglomerates–0.49% |
| General Electric Co. | 642,840 | 6,749,820 |
| Industrial Machinery–0.84% |
| Ingersoll-Rand PLC | 92,394 | 11,703,548 |
| Integrated Oil & Gas–9.18% |
| BP PLC, ADR (United Kingdom) | 654,684 | 27,300,323 |
| Chevron Corp. | 236,856 | 29,474,361 |
| Exxon Mobil Corp. | 45,988 | 3,524,060 |
| Occidental Petroleum Corp. | 125,968 | 6,333,671 |
| Royal Dutch Shell PLC, Class A, ADR (United Kingdom) | 498,219 | 32,419,110 |
| Suncor Energy, Inc. (Canada) | 911,023 | 28,387,477 |
| | | | 127,439,002 |
| Integrated Telecommunication Services–1.13% |
| AT&T, Inc. | 467,722 | 15,673,364 |
| Internet & Direct Marketing Retail–1.87% |
| Altaba, Inc.(b) | 77,280 | 5,360,914 |
See accompanying Notes to Financial Statements which are an integral part of the financial statements.
Invesco V.I. Comstock Fund
| | Shares | Value |
| Internet & Direct Marketing Retail–(continued) |
| eBay, Inc. | 521,740 | $20,608,730 |
| | | | 25,969,644 |
| Investment Banking & Brokerage–2.81% |
| Goldman Sachs Group, Inc. (The) | 73,906 | 15,121,167 |
| Morgan Stanley | 544,575 | 23,857,831 |
| | | | 38,978,998 |
| IT Consulting & Other Services–0.97% |
| Cognizant Technology Solutions Corp., Class A | 211,805 | 13,426,319 |
| Life & Health Insurance–1.29% |
| MetLife, Inc. | 361,399 | 17,950,688 |
| Managed Health Care–1.88% |
| Anthem, Inc. | 92,520 | 26,110,069 |
| Multi-line Insurance–2.29% |
| American International Group, Inc. | 597,061 | 31,811,410 |
| Oil & Gas Equipment & Services–0.47% |
| Halliburton Co. | 288,004 | 6,549,211 |
| Oil & Gas Exploration & Production–7.12% |
| Canadian Natural Resources Ltd. (Canada) | 481,096 | 12,972,013 |
| Devon Energy Corp. | 674,509 | 19,236,997 |
| Encana Corp. (Canada) | 2,039,764 | 10,463,989 |
| Hess Corp. | 351,174 | 22,324,131 |
| Marathon Oil Corp. | 1,541,869 | 21,909,959 |
| Noble Energy, Inc. | 531,733 | 11,910,819 |
| | | | 98,817,908 |
| Packaged Foods & Meats–0.81% |
| Danone S.A. (France) | 132,155 | 11,208,114 |
| Paper Packaging–1.36% |
| International Paper Co. | 435,151 | 18,850,741 |
| Pharmaceuticals–5.10% |
| Allergan PLC | 87,540 | 14,656,822 |
| Bristol-Myers Squibb Co. | 314,754 | 14,274,094 |
| Mylan N.V.(b) | 425,918 | 8,109,479 |
| Novartis AG (Switzerland) | 142,739 | 13,055,909 |
| Pfizer, Inc. | 31,614 | 1,369,518 |
| | Shares | Value |
| Pharmaceuticals–(continued) |
| Sanofi, ADR (France) | 444,813 | $19,247,059 |
| | | | 70,712,881 |
| Property & Casualty Insurance–1.04% |
| Allstate Corp. (The) | 141,663 | 14,405,711 |
| Regional Banks–3.39% |
| Citizens Financial Group, Inc. | 451,619 | 15,969,248 |
| Fifth Third Bancorp | 619,144 | 17,274,118 |
| PNC Financial Services Group, Inc. (The) | 100,134 | 13,746,395 |
| | | | 46,989,761 |
| Semiconductors–2.96% |
| Intel Corp. | 429,714 | 20,570,409 |
| QUALCOMM, Inc. | 270,071 | 20,544,301 |
| | | | 41,114,710 |
| Systems Software–1.79% |
| Microsoft Corp. | 185,975 | 24,913,211 |
| Tobacco–2.89% |
| Altria Group, Inc. | 328,329 | 15,546,378 |
| Philip Morris International, Inc. | 312,673 | 24,554,211 |
| | | | 40,100,589 |
| Wireless Telecommunication Services–0.49% |
| Vodafone Group PLC (United Kingdom) | 4,121,522 | 6,760,588 |
| Total Common Stocks & Other Equity Interests (Cost $1,142,603,967) | 1,292,354,232 |
| Money Market Funds–6.35% |
| Invesco Government & Agency Portfolio, Institutional Class, 2.26%(c) | 30,859,100 | 30,859,100 |
| Invesco Liquid Assets Portfolio, Institutional Class, 2.40%(c) | 22,034,841 | 22,043,655 |
| Invesco Treasury Portfolio, Institutional Class, 2.22%(c) | 35,267,543 | 35,267,543 |
| Total Money Market Funds (Cost $88,168,432) | 88,170,298 |
| TOTAL INVESTMENTS IN SECURITIES–99.47% (Cost $1,230,772,399) | 1,380,524,530 |
| OTHER ASSETS LESS LIABILITIES–0.53% | 7,306,014 |
| NET ASSETS–100.00% | $1,387,830,544 |
Investment Abbreviations:
| ADR | – American Depositary Receipt |
Notes to Schedule of Investments:
| (a) | Industry and/or sector classifications used in this report are generally according to the Global Industry Classification Standard, which was developed by and is the exclusive property and a service mark of MSCI Inc. and Standard & Poor’s. |
| (b) | Non-income producing security. |
| (c) | The money market fund and the Fund are affiliated by having the same investment adviser. The rate shown is the 7-day SEC standardized yield as of June 30, 2019. |
See accompanying Notes to Financial Statements which are an integral part of the financial statements.
Invesco V.I. Comstock Fund
| Open Forward Foreign Currency Contracts |
Settlement
Date | Counterparty | Contract to | Unrealized
Appreciation
(Depreciation) |
| Deliver | Receive |
| Currency Risk | | | | | | |
| 07/12/2019 | Goldman Sachs International | USD | 671,337 | CAD | 890,201 | $8,606 |
| Subtotal—Appreciation | 8,606 |
| Currency Risk | | | | | | |
| 07/12/2019 | Canadian Imperial Bank of Commerce | CHF | 6,144,914 | USD | 6,176,998 | (123,766) |
| 07/12/2019 | Canadian Imperial Bank of Commerce | GBP | 19,439,479 | USD | 24,598,138 | (101,647) |
| 07/12/2019 | Goldman Sachs International | CAD | 27,665,977 | USD | 20,552,385 | (579,122) |
| 07/12/2019 | Goldman Sachs International | EUR | 1,123,923 | USD | 1,274,781 | (4,310) |
| 07/12/2019 | Royal Bank of Canada | CAD | 888,546 | USD | 664,041 | (14,638) |
| 07/12/2019 | Royal Bank of Canada | CHF | 255,503 | USD | 256,039 | (5,944) |
| 07/12/2019 | Royal Bank of Canada | EUR | 26,884,075 | USD | 30,206,517 | (389,165) |
| Subtotal—Depreciation | (1,218,592) |
| Total Forward Foreign Currency Contracts | $(1,209,986) |
| Abbreviations: |
| CAD | – Canadian Dollar |
| CHF | – Swiss Franc |
| EUR | – Euro |
| GBP | – British Pound Sterling |
| USD | – U.S. Dollar |
Portfolio Composition
By sector, based on Net Assets
as of June 30, 2019
| Financials | 28.31% |
| Energy | 16.77 |
| Health Care | 11.28 |
| Information Technology | 7.84 |
| Industrials | 7.77 |
| Consumer Staples | 7.17 |
| Consumer Discretionary | 6.39 |
| Communication Services | 4.62 |
| Materials | 2.10 |
| Utilities | 0.87 |
| Money Market Funds Plus Other Assets Less Liabilities | 6.88 |
See accompanying Notes to Financial Statements which are an integral part of the financial statements.
Invesco V.I. Comstock Fund
Statement of Assets and Liabilities
June 30, 2019
(Unaudited)
| Assets: | |
Investments in securities, at value
(Cost $1,142,603,967) | $1,292,354,232 |
| Investments in affiliated money market funds, at value (Cost $88,168,432) | 88,170,298 |
| Other investments: | |
| Unrealized appreciation on forward foreign currency contracts outstanding | 8,606 |
| Cash | 83,602 |
| Foreign currencies, at value (Cost $599) | 603 |
| Receivable for: | |
| Fund shares sold | 1,672,484 |
| Dividends | 2,355,622 |
| Investments sold | 7,589,453 |
| Investment for trustee deferred compensation and retirement plans | 208,242 |
| Total assets | 1,392,443,142 |
| Liabilities: | |
| Other investments: | |
| Unrealized depreciation on forward foreign currency contracts outstanding | 1,218,592 |
| Payable for: | |
| Investments purchased | 1,386,953 |
| Fund shares reacquired | 455,561 |
| Accrued fees to affiliates | 1,283,280 |
| Accrued trustees’ and officers’ fees and benefits | 251 |
| Accrued other operating expenses | 37,233 |
| Trustee deferred compensation and retirement plans | 230,728 |
| Total liabilities | 4,612,598 |
| Net assets applicable to shares outstanding | $1,387,830,544 |
| Net assets consist of: | |
| Shares of beneficial interest | $998,723,710 |
| Distributable earnings | 389,106,834 |
| | $1,387,830,544 |
| Net Assets: |
| Series I | $191,347,525 |
| Series II | $1,196,483,019 |
| Shares outstanding, no par value, with an unlimited number of shares authorized: |
| Series I | 10,326,194 |
| Series II | 64,915,353 |
| Series I: | |
| Net asset value per share | $18.53 |
| Series II: | |
| Net asset value per share | $18.43 |
Statement of Operations
For the six months ended June 30, 2019
(Unaudited)
| Investment income: | |
| Dividends (net of foreign withholding taxes of $497,214) | $19,369,200 |
| Dividends from affiliated money market funds | 919,083 |
| Total investment income | 20,288,283 |
| Expenses: | |
| Advisory fees | 3,932,971 |
| Administrative services fees | 1,121,286 |
| Custodian fees | 15,517 |
| Distribution fees - Series II | 1,483,112 |
| Transfer agent fees | 17,200 |
| Trustees’ and officers’ fees and benefits | 21,485 |
| Reports to shareholders | 5,605 |
| Professional services fees | 24,566 |
| Other | 11,219 |
| Total expenses | 6,632,961 |
| Less: Fees waived | (43,594) |
| Net expenses | 6,589,367 |
| Net investment income | 13,698,916 |
| Realized and unrealized gain (loss) from: | |
| Net realized gain from: | |
| Investment securities | 37,107,170 |
| Foreign currencies | 238,382 |
| Forward foreign currency contracts | 1,184,017 |
| | 38,529,569 |
| Change in net unrealized appreciation (depreciation) of: | |
| Investment securities | 137,598,915 |
| Foreign currencies | 7,857 |
| Forward foreign currency contracts | (993,790) |
| | 136,612,982 |
| Net realized and unrealized gain | 175,142,551 |
| Net increase in net assets resulting from operations | $188,841,467 |
See accompanying Notes to Financial Statements which are an integral part of the financial statements.
Invesco V.I. Comstock Fund
Statement of Changes in Net Assets
For the six months ended June 30, 2019 and the year ended December 31, 2018
(Unaudited)
| | June 30,
2019 | December 31,
2018 |
| Operations: | | |
| Net investment income | $13,698,916 | $23,660,844 |
| Net realized gain | 38,529,569 | 169,575,951 |
| Change in net unrealized appreciation (depreciation) | 136,612,982 | (378,547,863) |
| Net increase (decrease) in net assets resulting from operations | 188,841,467 | (185,311,068) |
| Distributions to shareholders from distributable earnings: | | |
| Series I | — | (29,013,356) |
| Series II | — | (151,533,451) |
| Total distributions from distributable earnings | — | (180,546,807) |
| Share transactions–net: | | |
| Series I | (51,953,278) | 1,540,438 |
| Series II | (61,807,901) | (236,864,144) |
| Net increase (decrease) in net assets resulting from share transactions | (113,761,179) | (235,323,706) |
| Net increase (decrease) in net assets | 75,080,288 | (601,181,581) |
| Net assets: | | |
| Beginning of period | 1,312,750,256 | 1,913,931,837 |
| End of period | $1,387,830,544 | $1,312,750,256 |
See accompanying Notes to Financial Statements which are an integral part of the financial statements.
Invesco V.I. Comstock Fund
Financial Highlights
June 30, 2019
(Unaudited)
The following schedule presents financial highlights for a share of the Fund outstanding throughout the periods indicated.
| | Net asset
value,
beginning
of period | Net
investment
income(a) | Net gains
(losses)
on securities
(both
realized and
unrealized) | Total from
investment
operations | Dividends
from net
investment
income | Distributions
from net
realized
gains | Total
distributions | Net asset
value, end
of period | Total
return(b) | Net assets,
end of period
(000’s omitted) | Ratio of
expenses
to average
net assets
with fee waivers
and/or expenses
absorbed | Ratio of
expenses
to average net
assets without
fee waivers
and/or expenses
absorbed | Ratio of net
investment
income
to average
net assets | Portfolio
turnover(c) |
| Series I |
| Six months ended 06/30/19 | $16.12 | $0.19 | $2.22 | $2.41 | $— | $— | $— | $18.53 | 14.95% | $191,348 | 0.73%(d) | 0.74%(d) | 2.20%(d) | 10% |
| Year ended 12/31/18 | 20.62 | 0.33 | (2.41) | (2.08) | (0.36) | (2.06) | (2.42) | 16.12 | (12.16) | 214,084 | 0.75 | 0.75 | 1.63 | 19 |
| Year ended 12/31/17 | 18.69 | 0.28 | 2.94 | 3.22 | (0.44) | (0.85) | (1.29) | 20.62 | 17.85 | 270,651 | 0.75 | 0.75 | 1.47 | 13 |
| Year ended 12/31/16 | 17.57 | 0.38 | 2.47 | 2.85 | (0.29) | (1.44) | (1.73) | 18.69 | 17.30 | 256,080 | 0.77 | 0.78 | 2.20 | 21 |
| Year ended 12/31/15 | 19.16 | 0.28 | (1.45) | (1.17) | (0.37) | (0.05) | (0.42) | 17.57 | (5.98) | 332,411 | 0.78 | 0.83 | 1.52 | 16 |
| Year ended 12/31/14 | 17.75 | 0.32 | 1.34 | 1.66 | (0.25) | — | (0.25) | 19.16 | 9.39 | 338,159 | 0.78 | 0.83 | 1.73 | 19 |
| Series II |
| Six months ended 06/30/19 | 16.06 | 0.17 | 2.20 | 2.37 | — | — | — | 18.43 | 14.76 | 1,196,483 | 0.98(d) | 0.99(d) | 1.95(d) | 10 |
| Year ended 12/31/18 | 20.54 | 0.28 | (2.40) | (2.12) | (0.30) | (2.06) | (2.36) | 16.06 | (12.37) | 1,098,666 | 1.00 | 1.00 | 1.38 | 19 |
| Year ended 12/31/17 | 18.62 | 0.23 | 2.93 | 3.16 | (0.39) | (0.85) | (1.24) | 20.54 | 17.58 | 1,643,281 | 1.00 | 1.00 | 1.22 | 13 |
| Year ended 12/31/16 | 17.51 | 0.34 | 2.45 | 2.79 | (0.24) | (1.44) | (1.68) | 18.62 | 16.99 | 1,679,769 | 1.02 | 1.03 | 1.95 | 21 |
| Year ended 12/31/15 | 19.08 | 0.24 | (1.44) | (1.20) | (0.32) | (0.05) | (0.37) | 17.51 | (6.19) | 1,549,679 | 1.03 | 1.08 | 1.27 | 16 |
| Year ended 12/31/14 | 17.68 | 0.27 | 1.33 | 1.60 | (0.20) | — | (0.20) | 19.08 | 9.10 | 1,840,794 | 1.03 | 1.08 | 1.48 | 19 |
| (a) | Calculated using average shares outstanding. |
| (b) | Includes adjustments in accordance with accounting principles generally accepted in the United States of America and as such, the net asset value for financial reporting purposes and the returns based upon those net asset values may differ from the net asset value and returns for shareholder transactions. Total returns are not annualized for periods less than one year, if applicable, and do not reflect charges assessed in connection with a variable product, which if included would reduce total returns. |
| (c) | Portfolio turnover is calculated at the fund level and is not annualized for periods less than one year, if applicable. |
| (d) | Ratios are annualized and based on average daily net assets (000’s omitted) of $200,247 and $1,196,323 for Series I and Series II shares, respectively. |
See accompanying Notes to Financial Statements which are an integral part of the financial statements.
Invesco V.I. Comstock Fund
Notes to Financial Statements
June 30, 2019
(Unaudited)
NOTE 1—Significant Accounting Policies
Invesco V.I. Comstock Fund (the “Fund”) is a series portfolio of AIM Variable Insurance Funds (Invesco Variable Insurance Funds) (the “Trust”). The Trust is a Delaware statutory trust registered under the Investment Company Act of 1940, as amended (the “1940 Act”), as an open-end series management investment company. Information presented in these financial statements pertains only to the Fund. Matters affecting the Fund or each class will be voted on exclusively by the shareholders of the Fund or each class. Current Securities and Exchange Commission (“SEC”) guidance, however, requires participating insurance companies offering separate accounts to vote shares proportionally in accordance with the instructions of the contract owners whose investments are funded by shares of each Fund or class.
The Fund’s investment objective is to seek capital growth and income through investments in equity securities, including common stocks, preferred stocks and securities convertible into common and preferred stocks.
The Fund currently offers two classes of shares, Series I and Series II, both of which are offered to insurance company separate accounts funding variable annuity contracts and variable life insurance policies (“variable products”).
The Fund is an investment company and accordingly follows the investment company accounting and reporting guidance in accordance with Financial Accounting Standards Board Accounting Standards Codification Topic 946,Financial Services – Investment Companies.
The following is a summary of the significant accounting policies followed by the Fund in the preparation of its financial statements.
| A. | Security Valuations — Securities, including restricted securities, are valued according to the following policy. |
A security listed or traded on an exchange (except convertible securities) is valued at its last sales price or official closing price as of the close of the customary trading session on the exchange where the security is principally traded, or lacking any sales or official closing price on a particular day, the security may be valued at the closing bid price on that day. Securities traded in the over-the-counter market are valued based on prices furnished by independent pricing services or market makers. When such securities are valued by an independent pricing service they may be considered fair valued. Futures contracts are valued at the final settlement price set by an exchange on which they are principally traded. Listed options are valued at the mean between the last bid and asked prices from the exchange on which they are principally traded. Options not listed on an exchange are valued by an independent source at the mean between the last bid and asked prices. For purposes of determining net asset value (“NAV”) per share, futures and option contracts generally are valued 15 minutes after the close of the customary trading session of the New York Stock Exchange (“NYSE”).
Investments in open-end and closed-end registered investment companies that do not trade on an exchange are valued at the end-of-day net asset value per share. Investments in open-end and closed-end registered investment companies that trade on an exchange are valued at the last sales price or official closing price as of the close of the customary trading session on the exchange where the security is principally traded.
Debt obligations (including convertible securities) and unlisted equities are fair valued using an evaluated quote provided by an independent pricing service. Evaluated quotes provided by the pricing service may be determined without exclusive reliance on quoted prices, and may reflect appropriate factors such as institution-size trading in similar groups of securities, developments related to specific securities, dividend rate (for unlisted equities), yield (for debt obligations), quality, type of issue, coupon rate (for debt obligations), maturity (for debt obligations), individual trading characteristics and other market data. Pricing services generally value debt obligations assuming orderly transactions of institutional round lot size, but a fund may hold or transact in the same securities in smaller, odd lot sizes. Odd lots often trade at lower prices than institutional round lots. Debt obligations are subject to interest rate and credit risks. In addition, all debt obligations involve some risk of default with respect to interest and/or principal payments.
Foreign securities’ (including foreign exchange contracts) prices are converted into U.S. dollar amounts using the applicable exchange rates as of the close of the NYSE. If market quotations are available and reliable for foreign exchange-traded equity securities, the securities will be valued at the market quotations. Because trading hours for certain foreign securities end before the close of the NYSE, closing market quotations may become unreliable. If between the time trading ends on a particular security and the close of the customary trading session on the NYSE, events occur that the investment adviser determines are significant and make the closing price unreliable, the Fund may fair value the security. If the event is likely to have affected the closing price of the security, the security will be valued at fair value in good faith using procedures approved by the Board of Trustees. Adjustments to closing prices to reflect fair value may also be based on a screening process of an independent pricing service to indicate the degree of certainty, based on historical data, that the closing price in the principal market where a foreign security trades is not the current value as of the close of the NYSE. Foreign securities’ prices meeting the approved degree of certainty that the price is not reflective of current value will be priced at the indication of fair value from the independent pricing service. Multiple factors may be considered by the independent pricing service in determining adjustments to reflect fair value and may include information relating to sector indices, American Depositary Receipts and domestic and foreign index futures. Foreign securities may have additional risks including exchange rate changes, potential for sharply devalued currencies and high inflation, political and economic upheaval, the relative lack of issuer information, relatively low market liquidity and the potential lack of strict financial and accounting controls and standards.
Securities for which market prices are not provided by any of the above methods may be valued based upon quotes furnished by independent sources. The last bid price may be used to value equity securities. The mean between the last bid and asked prices is used to value debt obligations, including corporate loans.
Securities for which market quotations are not readily available or became unreliable are valued at fair value as determined in good faith by or under the supervision of the Trust’s officers following procedures approved by the Board of Trustees. Issuer specific events, market trends, bid/asked quotes of brokers and information providers and other market data may be reviewed in the course of making a good faith determination of a security’s fair value.
The Fund may invest in securities that are subject to interest rate risk, meaning the risk that the prices will generally fall as interest rates rise and, conversely, the prices will generally rise as interest rates fall. Specific securities differ in their sensitivity to changes in interest rates depending on their individual characteristics. Changes in interest rates may result in increased market volatility, which may affect the value and/or liquidity of certain Fund investments.
Invesco V.I. Comstock Fund
Valuations change in response to many factors including the historical and prospective earnings of the issuer, the value of the issuer’s assets, general economic conditions, interest rates, investor perceptions and market liquidity. Because of the inherent uncertainties of valuation, the values reflected in the financial statements may materially differ from the value received upon actual sale of those investments.
| B. | Securities Transactions and Investment Income — Securities transactions are accounted for on a trade date basis. Realized gains or losses on sales are computed on the basis of specific identification of the securities sold. Interest income (net of withholding tax, if any) is recorded on the accrual basis from settlement date. Dividend income (net of withholding tax, if any) is recorded on the ex-dividend date. |
The Fund may periodically participate in litigation related to Fund investments. As such, the Fund may receive proceeds from litigation settlements. Any proceeds received are included in the Statement of Operations as realized gain (loss) for investments no longer held and as unrealized gain (loss) for investments still held.
Brokerage commissions and mark ups are considered transaction costs and are recorded as an increase to the cost basis of securities purchased and/or a reduction of proceeds on a sale of securities. Such transaction costs are included in the determination of net realized and unrealized gain (loss) from investment securities reported in the Statement of Operations and the Statement of Changes in Net Assets and the net realized and unrealized gains (losses) on securities per share in the Financial Highlights. Transaction costs are included in the calculation of the Fund’s net asset value and, accordingly, they reduce the Fund’s total returns. These transaction costs are not considered operating expenses and are not reflected in net investment income reported in the Statement of Operations and the Statement of Changes in Net Assets, or the net investment income per share and the ratios of expenses and net investment income reported in the Financial Highlights, nor are they limited by any expense limitation arrangements between the Fund and the investment adviser.
The Fund allocates income and realized and unrealized capital gains and losses to a class based on the relative net assets of each class.
| C. | Country Determination — For the purposes of making investment selection decisions and presentation in the Schedule of Investments, the investment adviser may determine the country in which an issuer is located and/or credit risk exposure based on various factors. These factors include the laws of the country under which the issuer is organized, where the issuer maintains a principal office, the country in which the issuer derives 50% or more of its total revenues and the country that has the primary market for the issuer’s securities, as well as other criteria. Among the other criteria that may be evaluated for making this determination are the country in which the issuer maintains 50% or more of its assets, the type of security, financial guarantees and enhancements, the nature of the collateral and the sponsor organization. Country of issuer and/or credit risk exposure has been determined to be the United States of America, unless otherwise noted. |
| D. | Distributions– Distributions from net investment income and net realized capital gain, if any, are generally declared and paid to separate accounts of participating insurance companies annually and recorded on the ex-dividend date. |
| E. | Federal Income Taxes –The Fund intends to comply with the requirements of Subchapter M of the Internal Revenue Code of 1986, as amended (the “Internal Revenue Code”), necessary to qualify as a regulated investment company and to distribute substantially all of the Fund’s taxable earnings to shareholders. As such, the Fund will not be subject to federal income taxes on otherwise taxable income (including net realized capital gain) that is distributed to shareholders. Therefore, no provision for federal income taxes is recorded in the financial statements. |
The Fund recognizes the tax benefits of uncertain tax positions only when the position is more likely than not to be sustained. Management has analyzed the Fund’s uncertain tax positions and concluded that no liability for unrecognized tax benefits should be recorded related to uncertain tax positions. Management is not aware of any tax positions for which it is reasonably possible that the total amounts of unrecognized tax benefits will change materially in the next 12 months.
The Fund files tax returns in the U.S. Federal jurisdiction and certain other jurisdictions. Generally, the Fund is subject to examinations by such taxing authorities for up to three years after the filing of the return for the tax period.
| F. | Expenses– Fees provided for under the Rule 12b-1 plan of a particular class of the Fund and which are directly attributable to that class are charged to the operations of such class. All other expenses are allocated among the classes based on relative net assets. |
| G. | Accounting Estimates – The preparation of financial statements in conformity with accounting principles generally accepted in the United States of America (“GAAP”) requires management to make estimates and assumptions that affect the reported amounts of assets and liabilities at the date of the financial statements and the reported amounts of revenues and expenses during the reporting period including estimates and assumptions related to taxation. Actual results could differ from those estimates by a significant amount. In addition, the Fund monitors for material events or transactions that may occur or become known after the period-end date and before the date the financial statements are released to print. |
| H. | Indemnifications – Under the Trust’s organizational documents, each Trustee, officer, employee or other agent of the Trust is indemnified against certain liabilities that may arise out of the performance of their duties to the Fund. Additionally, in the normal course of business, the Fund enters into contracts, including the Fund’s servicing agreements, that contain a variety of indemnification clauses. The Fund’s maximum exposure under these arrangements is unknown as this would involve future claims that may be made against the Fund that have not yet occurred. The risk of material loss as a result of such indemnification claims is considered remote. |
| I. | Foreign Currency Translations— Foreign currency is valued at the close of the NYSE based on quotations posted by banks and major currency dealers. Portfolio securities and other assets and liabilities denominated in foreign currencies are translated into U.S. dollar amounts at the date of valuation. Purchases and sales of portfolio securities (net of foreign taxes withheld on disposition) and income items denominated in foreign currencies are translated into U.S. dollar amounts on the respective dates of such transactions. The Fund does not separately account for the portion of the results of operations resulting from changes in foreign exchange rates on investments and the fluctuations arising from changes in market prices of securities held. The combined results of changes in foreign exchange rates and the fluctuation of market prices on investments (net of estimated foreign tax withholding) are included with the net realized and unrealized gain or loss from investments in the Statement of Operations. Reported net realized foreign currency gains or losses arise from (1) sales of foreign currencies, (2) currency gains or losses realized between the trade and settlement dates on securities transactions, and (3) the difference between the amounts of dividends, interest, and foreign withholding taxes recorded on the Fund’s books and the U.S. dollar equivalent of the amounts actually received or paid. Net unrealized foreign currency gains and losses arise from changes in the fair values of assets and liabilities, other than investments in securities at fiscal period end, resulting from changes in exchange rates. |
The Fund may invest in foreign securities, which may be subject to foreign taxes on income, gains on investments or currency repatriation, a portion of which may be recoverable. Foreign taxes, if any, are recorded based on the tax regulations and rates that exist in the foreign markets in which the Fund invests and are shown in the Statement of Operations.
Invesco V.I. Comstock Fund
| J. | Forward Foreign Currency Contracts— The Fund may engage in foreign currency transactions either on a spot (i.e. for prompt delivery and settlement) basis, or through forward foreign currency contracts, to manage or minimize currency or exchange rate risk. |
The Fund may also enter into forward foreign currency contracts for the purchase or sale of a security denominated in a foreign currency in order to “lock in” the U.S. dollar price of that security, or the Fund may also enter into forward foreign currency contracts that do not provide for physical settlement of the two currencies, but instead are settled by a single cash payment calculated as the difference between the agreed upon exchange rate and the spot rate at settlement based upon an agreed upon notional amount (non-deliverable forwards). The Fund will set aside liquid assets in an amount equal to the daily mark-to-market obligation for forward foreign currency contracts.
A forward foreign currency contract is an obligation between two parties (“Counterparties”) to purchase or sell a specific currency for an agreed-upon price at a future date. The use of forward foreign currency contracts does not eliminate fluctuations in the price of the underlying securities the Fund owns or intends to acquire but establishes a rate of exchange in advance. Fluctuations in the value of these contracts are measured by the difference in the contract date and reporting date exchange rates and are recorded as unrealized appreciation (depreciation) until the contracts are closed. When the contracts are closed, realized gains (losses) are recorded. Realized and unrealized gains (losses) on the contracts are included in the Statement of Operations. The primary risks associated with forward foreign currency contracts include failure of the Counterparty to meet the terms of the contract and the value of the foreign currency changing unfavorably. These risks may be in excess of the amounts reflected in the Statement of Assets and Liabilities.
NOTE 2—Advisory Fees and Other Fees Paid to Affiliates
The Trust has entered into a master investment advisory agreement with Invesco Advisers, Inc. (the "Adviser" or "Invesco"). Under the terms of the investment advisory agreement, the Fund accrues daily and pays monthly an advisory fee to the Adviser based on the annual rate of the Fund’s average daily net assets as follows:
| Average Daily Net Assets | Rate |
| First $500 million | 0.60% |
| Next $500 million | 0.55% |
For the six months ended June 30, 2019, the effective advisory fees incurred by the Fund was 0.57%.
Under the terms of a master sub-advisory agreement between the Adviser and each of Invesco Asset Management Deutschland GmbH, Invesco Asset Management Limited, Invesco Asset Management (Japan) Limited, Invesco Hong Kong Limited, Invesco Senior Secured Management, Inc. and Invesco Canada Ltd. and separate sub-advisory agreements with Invesco Capital Management LLC and Invesco Asset Management (India) Private Limited (collectively, the "Affiliated Sub-Advisers") the Adviser, not the Fund, will pay 40% of the fees paid to the Adviser to any such Affiliated Sub-Adviser(s) that provide(s) discretionary investment management services to the Fund based on the percentage of assets allocated to such Affiliated Sub-Adviser(s).
The Adviser has contractually agreed, through at least April 30, 2020, to waive advisory fees and/or reimburse expenses of all shares to the extent necessary to limit total annual fund operating expenses after fee waiver and/or expense reimbursement (excluding certain items discussed below) of Series I shares to 0.78% and Series II shares to 1.03% of average daily net assets (the “expense limits”). In determining the Adviser’s obligation to waive advisory fees and/or reimburse expenses, the following expenses are not taken into account, and could cause the total annual fund operating expenses after fee waiver and/or expense reimbursement to exceed the numbers reflected above: (1) interest; (2) taxes; (3) dividend expense on short sales; (4) extraordinary or non-routine items, including litigation expenses; and (5) expenses that the Fund has incurred but did not actually pay because of an expense offset arrangement. Unless Invesco continues the fee waiver agreement, it will terminate on April 30, 2020. During its term, the fee waiver agreement cannot be terminated or amended to increase the expense limits or reduce the advisory fee waiver without approval of the Board of Trustees. The Adviser did not waive fees and/or reimburse expenses during the period under these expense limits.
Further, the Adviser has contractually agreed, through at least June 30, 2021, to waive the advisory fee payable by the Fund in an amount equal to 100% of the net advisory fees the Adviser receives from the affiliated money market funds on investments by the Fund of uninvested cash in such affiliated money market funds.
For the six months ended June 30, 2019, the Adviser waived advisory fees of $43,594.
The Trust has entered into a master administrative services agreement with Invesco pursuant to which the Fund has agreed to pay Invesco a fee for costs incurred in providing accounting services and fund administrative services to the Fund and to reimburse Invesco for fees paid to insurance companies that have agreed to provide certain administrative services to the Fund. These administrative services provided by the insurance companies may include, among other things: maintenance of master accounts with the Fund; tracking, recording and transmitting net purchase and redemption orders for Fund shares; maintaining and preserving records related to the purchase, redemption and other account activity of variable product owners; distributing copies of Fund documents such as prospectuses, proxy materials and periodic reports, to variable product owners, and responding to inquiries from variable product owners about the Fund. Pursuant to such agreement, for the six months ended June 30, 2019, Invesco was paid $97,774 for accounting and fund administrative services and was reimbursed $1,023,512 for fees paid to insurance companies. Also, Invesco has entered into a sub-administration agreement whereby State Street Bank and Trust Company (“SSB”) serves as custodian and fund accountant and provides certain administrative services to the Fund.
The Trust has entered into a transfer agency and service agreement with Invesco Investment Services, Inc. (“IIS”) pursuant to which the Fund has agreed to pay IIS a fee for providing transfer agency and shareholder services to the Fund and reimburse IIS for certain expenses incurred by IIS in the course of providing such services. IIS may make payments to intermediaries that provide omnibus account services, sub-accounting services and/or networking services. All fees payable by IIS to intermediaries that provide omnibus account services or sub-accounting services are charged back to the Fund, subject to certain limitations approved by the Trust’s Board of Trustees. For the six months ended June 30, 2019, expenses incurred under the agreement are shown in the Statement of Operations asTransfer agent fees.
The Trust has entered into a master distribution agreement with Invesco Distributors, Inc. (“IDI”) to serve as the distributor for the Fund. The Trust has adopted a plan pursuant to Rule 12b-1 under the 1940 Act with respect to the Fund’s Series II shares (the “Plan”). The Fund, pursuant to the Plan, pays IDI compensation at the annual rate of 0.25% of the Fund’s average daily net assets of Series II shares. The fees are accrued daily and paid monthly. Of the Plan payments, up to 0.25% of the average daily net assets of the Series II shares may be paid to insurance companies who furnish
Invesco V.I. Comstock Fund
continuing personal shareholder services to customers who purchase and own Series II shares of the Fund. For the six months ended June 30, 2019, expenses incurred under the Plan are detailed in the Statement of Operations asDistribution fees.
For the six months ended June 30, 2019, the Fund incurred $4,958 in brokerage commissions with Invesco Capital Markets, Inc., an affiliate of the Adviser and IDI, for portfolio transactions executed on behalf of the Fund.
Certain officers and trustees of the Trust are officers and directors of the Adviser, IIS and/or IDI.
NOTE 3—Additional Valuation Information
GAAP defines fair value as the price that would be received to sell an asset or paid to transfer a liability in an orderly transaction between market participants at the measurement date, under current market conditions. GAAP establishes a hierarchy that prioritizes the inputs to valuation methods, giving the highest priority to readily available unadjusted quoted prices in an active market for identical assets (Level 1) and the lowest priority to significant unobservable inputs (Level 3), generally when market prices are not readily available or are unreliable. Based on the valuation inputs, the securities or other investments are tiered into one of three levels. Changes in valuation methods may result in transfers in or out of an investment’s assigned level:
Level 1 – Prices are determined using quoted prices in an active market for identical assets.
Level 2 – Prices are determined using other significant observable inputs. Observable inputs are inputs that other market participants may use in pricing a security. These may include quoted prices for similar securities, interest rates, prepayment speeds, credit risk, yield curves, loss severities, default rates, discount rates, volatilities and others.
Level 3 – Prices are determined using significant unobservable inputs. In situations where quoted prices or observable inputs are unavailable (for example, when there is little or no market activity for an investment at the end of the period), unobservable inputs may be used. Unobservable inputs reflect the Fund’s own assumptions about the factors market participants would use in determining fair value of the securities or instruments and would be based on the best available information.
The following is a summary of the tiered valuation input levels, as of June 30, 2019. The level assigned to the securities valuations may not be an indication of the risk or liquidity associated with investing in those securities. Because of the inherent uncertainties of valuation, the values reflected in the financial statements may materially differ from the value received upon actual sale of those investments.
| | Level 1 | Level 2 | Level 3 | Total |
| Investments in Securities | | | | |
| Common Stocks & Other Equity Interests | $1,246,901,679 | $45,452,553 | $— | $1,292,354,232 |
| Money Market Funds | 88,170,298 | — | — | 88,170,298 |
| Total Investments in Securities | 1,335,071,977 | 45,452,553 | — | 1,380,524,530 |
| Other Investments - Assets* | | | | |
| Forward Foreign Currency Contracts | — | 8,606 | — | 8,606 |
| Other Investments - Liabilities* | | | | |
| Forward Foreign Currency Contracts | — | (1,218,592) | — | (1,218,592) |
| Total Other Investments | — | (1,209,986) | — | (1,209,986) |
| Total Investments | $1,335,071,977 | $44,242,567 | $— | $1,379,314,544 |
| * | Unrealized appreciation (depreciation). |
NOTE 4—Derivative Investments
The Fund may enter into an International Swaps and Derivatives Association Master Agreement (“ISDA Master Agreement”) under which a fund may trade OTC derivatives. An OTC transaction entered into under an ISDA Master Agreement typically involves a collateral posting arrangement, payment netting provisions and close-out netting provisions. These netting provisions allow for reduction of credit risk through netting of contractual obligations. The enforceability of the netting provisions of the ISDA Master Agreement depends on the governing law of the ISDA Master Agreement, among other factors.
For financial reporting purposes, the Fund does not offset OTC derivative assets or liabilities that are subject to ISDA Master Agreements in the Statement of Assets and Liabilities.
Value of Derivative Investments at Period-End
The table below summarizes the value of the Fund’s derivative investments, detailed by primary risk exposure, held as of June 30, 2019:
| | Value |
| Derivative Assets | Currency
Risk |
| Unrealized appreciation on forward foreign currency contracts outstanding | $8,606 |
| Derivatives not subject to master netting agreements | - |
| Total Derivative Assets subject to master netting agreements | $8,606 |
Invesco V.I. Comstock Fund
| | Value |
| Derivative Liabilities | Currency
Risk |
| Unrealized depreciation on forward foreign currency contracts outstanding | $(1,218,592) |
| Derivatives not subject to master netting agreements | - |
| Total Derivative Liabilities subject to master netting agreements | $(1,218,592) |
Offsetting Assets and Liabilities
The table below reflects the Fund’s exposure to Counterparties subject to either an ISDA Master Agreement or other agreement for OTC derivative transactions as of June 30, 2019.
| | Financial
Derivative
Assets | | Financial
Derivative
Liabilities | | Collateral
(Received)/Pledged | | |
| Counterparty | Forward Foreign
Currency Contracts | | Forward Foreign
Currency Contracts | Net Value of
Derivatives | Non-Cash | Cash | | Net
Amount |
| Canadian Imperial Bank of Commerce | $– | | $(225,413) | $(225,413) | $– | $– | | $(225,413) |
| Goldman Sachs International | 8,606 | | (583,432) | (574,826) | – | – | | (574,826) |
| Royal Bank of Canada | – | | (409,747) | (409,747) | – | – | | (409,747) |
| Total | $8,606 | | $(1,218,592) | $(1,209,986) | $– | $– | | $(1,209,986) |
Effect of Derivative Investments for the six months ended June 30, 2019
The table below summarizes the gains (losses) on derivative investments, detailed by primary risk exposure, recognized in earnings during the period:
| | Location of Gain (Loss) on
Statement of Operations |
| | Currency
Risk |
| Realized Gain: | |
| Forward foreign currency contracts | $1,184,017 |
| Change in Net Unrealized Appreciation (Depreciation): | |
| Forward foreign currency contracts | (993,790) |
| Total | $190,227 |
The table below summarizes the average notional value of derivatives held during the period.
| | Forward
Foreign Currency
Contracts |
| Average notional value | $88,236,603 |
NOTE 5—Trustees’ and Officers’ Fees and Benefits
Trustees’ and Officers’ Fees and Benefits include amounts accrued by the Fund to pay remuneration to certain Trustees and Officers of the Fund. Trustees have the option to defer compensation payable by the Fund, and Trustees’ and Officers’ Fees and Benefits also include amounts accrued by the Fund to fund such deferred compensation amounts. Those Trustees who defer compensation have the option to select various Invesco Funds in which their deferral accounts shall be deemed to be invested. Finally, certain current Trustees were eligible to participate in a retirement plan that provided for benefits to be paid upon retirement to Trustees over a period of time based on the number of years of service. The Fund may have certain former Trustees who also participate in a retirement plan and receive benefits under such plan.Trustees’ and Officers’ Fees and Benefits include amounts accrued by the Fund to fund such retirement benefits. Obligations under the deferred compensation and retirement plans represent unsecured claims against the general assets of the Fund.
NOTE 6—Cash Balances
The Fund is permitted to temporarily carry a negative or overdrawn balance in its account with State Street Bank and Trust Company, the custodian bank. Such balances, if any at period-end, are shown in the Statement of Assets and Liabilities under the payable caption Amount due custodian. To compensate the custodian bank for such overdrafts, the overdrawn Fund may either (1) leave funds as a compensating balance in the account so the custodian bank can be compensated by earning the additional interest; or (2) compensate by paying the custodian bank at a rate agreed upon by the custodian bank and Invesco, not to exceed the contractually agreed upon rate.
NOTE 7—Tax Information
The amount and character of income and gains to be distributed are determined in accordance with income tax regulations, which may differ from GAAP. Reclassifications are made to the Fund’s capital accounts to reflect income and gains available for distribution (or available capital loss
Invesco V.I. Comstock Fund
carryforward) under income tax regulations. The tax character of distributions paid during the year and the tax components of net assets will be reported at the Fund’s fiscal year-end.
Capital loss carryforward is calculated and reported as of a specific date. Results of transactions and other activity after that date may affect the amount of capital loss carryforward actually available for the Fund to utilize. Capital losses generated in years beginning after December 22, 2010 can be carried forward for an unlimited period, whereas previous losses expire in eight tax years. Capital losses with an expiration period may not be used to offset capital gains until all net capital losses without an expiration date have been utilized. Capital loss carryforwards with no expiration date will retain their character as either short-term or long-term capital losses instead of as short-term capital losses as under prior law. The ability to utilize capital loss carryforwards in the future may be limited under the Internal Revenue Code and related regulations based on the results of future transactions.
The Fund did not have a capital loss carryforward as of December 31, 2018.
NOTE 8—Investment Transactions
The aggregate amount of investment securities (other than short-term securities, U.S. Treasury obligations and money market funds, if any) purchased and sold by the Fund during the six months ended June 30, 2019 was $130,904,574 and $235,921,851, respectively. Cost of investments, including any derivatives, on a tax basis includes the adjustments for financial reporting purposes as of the most recently completed federal income tax reporting period-end.
| Unrealized Appreciation (Depreciation) of Investments on a Tax Basis |
| Aggregate unrealized appreciation of investments | $249,614,670 |
| Aggregate unrealized (depreciation) of investments | (105,552,584) |
| Net unrealized appreciation of investments | $144,062,086 |
Cost of investments for tax purposes is $1,235,252,458.
NOTE 9—Share Information
| | Summary of Share Activity |
| | Six months ended
June 30, 2019(a) | | Year ended
December 31, 2018 |
| | Shares | Amount | | Shares | Amount |
| Sold: | | | | | |
| Series I | 169,700 | $2,990,113 | | 899,651 | $17,343,797 |
| Series II | 2,794,955 | 51,090,041 | | 3,163,658 | 57,343,771 |
| Issued as reinvestment of dividends: | | | | | |
| Series I | — | — | | 1,479,518 | 29,013,356 |
| Series II | — | — | | 7,755,038 | 151,533,451 |
| Reacquired: | | | | | |
| Series I | (3,122,292) | (54,943,391) | | (2,224,115) | (44,816,715) |
| Series II | (6,308,558) | (112,897,942) | | (22,497,477) | (445,741,366) |
| Net increase (decrease) in share activity | (6,466,195) | $(113,761,179) | | (11,423,727) | $(235,323,706) |
| (a) | There are entities that are record owners of more than 5% of the outstanding shares of the Fund and in the aggregate own 65% of the outstanding shares of the Fund. The Fund and the Fund’s principal underwriter or adviser, are parties to participation agreements with these entities whereby these entities sell units of interest in separate accounts funding variable products that are invested in the Fund. The Fund, Invesco and/or Invesco affiliates may make payments to these entities, which are considered to be related to the Fund, for providing services to the Fund, Invesco and/or Invesco affiliates including but not limited to services such as, securities brokerage, third party record keeping and account servicing and administrative services. The Fund has no knowledge as to whether all or any portion of the shares owned of record by these entities are also owned beneficially. |
Invesco V.I. Comstock Fund
Calculating your ongoing Fund expenses
Example
As a shareholder of the Fund, you incur ongoing costs, including management fees; distribution and/or service fees (12b-1); and other Fund expenses. This example is intended to help you understand your ongoing costs (in dollars) of investing in the Fund and to compare these costs with ongoing costs of investing in other mutual funds. The example is based on an investment of $1,000 invested at the beginning of the period and held for the entire period January 1, 2019 through June 30, 2019.
The actual and hypothetical expenses in the examples below do not represent the effect of any fees or other expenses assessed in connection with a variable product; if they did, the expenses shown would be higher while the ending account values shown would be lower.
Actual expenses
The table below provides information about actual account values and actual expenses. You may use the information in this table, together with the amount you invested, to estimate the expenses that you paid over the period. Simply divide your account value by $1,000 (for example, an $8,600 account value divided by $1,000 = 8.6), then multiply the result by the number in the table under the heading entitled “Actual Expenses Paid During Period” to estimate the expenses you paid on your account during this period.
Hypothetical example for comparison purposes
The table below also provides information about hypothetical account values and hypothetical expenses based on the Fund’s actual expense ratio and an assumed rate of return of 5% per year before expenses, which is not the Fund’s actual return.
The hypothetical account values and expenses may not be used to estimate the actual ending account balance or expenses you paid for the period. You may use this information to compare the ongoing costs of investing in the Fund and other funds. To do so, compare this 5% hypothetical example with the 5% hypothetical examples that appear in the shareholder reports of the other funds.
Please note that the expenses shown in the table are meant to highlight your ongoing costs. Therefore, the hypothetical information is useful in comparing ongoing costs, and will not help you determine the relative total costs of owning different funds.
| | Beginning
Account Value (01/01/19) | ACTUAL | HYPOTHETICAL
(5% annual return before
expenses) | Annualized
Expense
Ratio |
Ending
Account Value
(06/30/19)1 | Expenses
Paid During
Period2 | Ending
Account Value
(06/30/19) | Expenses
Paid During
Period2 |
| Series I | $1,000.00 | $1,149.50 | $3.89 | $1,021.17 | $3.66 | 0.73% |
| Series II | 1,000.00 | 1,147.60 | 5.22 | 1,019.93 | 4.91 | 0.98 |
| 1 | The actual ending account value is based on the actual total return of the Fund for the period January 1, 2019 through June 30, 2019, after actual expenses and will differ from the hypothetical ending account value which is based on the Fund’s expense ratio and a hypothetical annual return of 5% before expenses. |
| 2 | Expenses are equal to the Fund’s annualized expense ratio as indicated above multiplied by the average account value over the period, multiplied by 181/365 to reflect the most recent fiscal half year. |
Invesco V.I. Comstock Fund
Approval of Investment Advisory and Sub-Advisory Contracts
At meetings held on June 10, 2019, the Board of Trustees (the Board or the Trustees) of AIM Variable Insurance Funds (Invesco Variable Insurance Funds) as a whole, and the independent Trustees, who comprise over 75% of the Board, voting separately, approved the continuance of the Invesco V.I. Comstock Fund’s (the Fund) Master Investment Advisory Agreement with Invesco Advisers, Inc. (Invesco Advisers and the investment advisory agreement) and the Master IntergroupSub-Advisory Contract for Mutual Funds with Invesco Asset Management Deutschland GmbH, Invesco Asset Management Limited, Invesco Asset Management (Japan) Limited, Invesco Hong Kong Limited, Invesco Senior Secured Management, Inc. and Invesco Canada Ltd. and separatesub-advisory contracts with Invesco Capital Management LLC and Invesco Asset Management (India) Private Limited (collectively, the AffiliatedSub-Advisers and thesub-advisory contracts) for another year, effective July 1, 2019. After evaluating the factors discussed below, among others, the Board approved the renewal of the Fund’s investment advisory agreement and thesub-advisory contracts and determined that the compensation payable by the Fund to Invesco Advisers and by Invesco Advisers to the AffiliatedSub-Advisers is fair and reasonable.
The Board’s Evaluation Process
The Board’s Investments Committee has established three Sub-Committees, which meet throughout the year to review the performance of funds advised by Invesco Advisers (the Invesco Funds). As part of a regularly scheduled basis ofin-person Board meetings, theSub-Committees meet with portfolio managers for their assigned Invesco Funds and other members of management to review detailed information about investment performance and portfolio attributes of these funds. The Board took into account evaluations and reports that it received from the Investments Committee andSub-Committees, as well as the information provided to such committees and the Board throughout the year, in considering whether to approve each Invesco Fund’s investment advisory agreement andsub-advisory contracts.
As part of the contract renewal process, the Board reviews and considers information provided in response to detailed requests for information submitted to management by the independent Trustees with assistance from legal counsel to the independent Trustees. The Board receives comparative investment performance and fee data regarding the Invesco Funds prepared by Invesco Advisers and Broadridge Financial Solutions, Inc. (Broadridge), an independent mutual fund data provider. The Board also receives an independent written evaluation from the Senior Officer, an officer of the Invesco Funds who reports directly to the
independent Trustees. The Senior Officer’s evaluation is prepared as part of his responsibility to manage the process by which the Invesco Funds’ proposed management fees are negotiated during the annual contract renewal process to ensure they are negotiated in a manner that is at arms’ length and reasonable. In addition to meetings with Invesco Advisers and fund counsel throughout the year, the independent Trustees also discuss the continuance of the investment advisory agreement andsub-advisory contracts in separate sessions with the Senior Officer and with independent legal counsel.
The discussion below is a summary of the Senior Officer’s independent written evaluation with respect to the Fund’s investment advisory agreement, as well as a discussion of the material factors and related conclusions that formed the basis for the Board’s approval of the Fund’s investment advisory agreement andsub-advisory contracts. The Trustees’ review and conclusions are based on the comprehensive consideration of all information presented to them during the course of the year and in prior years and are not the result of any single determinative factor. Moreover, one Trustee may have weighed a particular piece of information or factor differently than another Trustee. This information is current as of June 10, 2019.
Factors and Conclusions and Summary of Independent Written Fee Evaluation
| A. | Nature, Extent and Quality of Services Provided by Invesco Advisers and the AffiliatedSub-Advisers |
The Board reviewed the nature, extent and quality of the advisory services provided to the Fund by Invesco Advisers under the Fund’s investment advisory agreement, and the credentials and experience of the officers and employees of Invesco Advisers who provide these services, including the Fund’s portfolio manager(s). The Board’s review included consideration of Invesco Advisers’ investment process oversight and structure, credit analysis and investment risk management. The Board also considerednon-advisory services that Invesco Advisers and its affiliates provide to the Invesco Funds such as various back office support functions, third party oversight, internal audit, valuation, portfolio trading and legal and compliance. The Board also received and reviewed information about Invesco Advisers’ role as administrator of the Invesco Funds’ liquidity risk management program. The Board also reviewed and considered the benefits to shareholders of investing in a fund that is part of the Invesco family of funds under the umbrella of Invesco Ltd., Invesco Advisers’ parent company, and noted Invesco Ltd.’s depth and experience in conducting an investment management business, as well as its
commitment of financial and other resources to such business. The Board reviewed and considered information about the resources that Invesco Advisers intends to continue to commit to managing the Invesco family of funds following Invesco Ltd.’s acquisition of OppenheimerFunds, Inc. and its subsidiaries. The Board concluded that the nature, extent and quality of the services provided to the Fund by Invesco Advisers are appropriate and satisfactory.
The Board reviewed the services that may be provided by the AffiliatedSub-Advisers under thesub-advisory contracts and the credentials and experience of the officers and employees of the AffiliatedSub-Advisers who provide these services. The Board noted the AffiliatedSub-Advisers’ expertise with respect to certain asset classes and that the AffiliatedSub-Advisers have offices and personnel that are located in financial centers around the world. As a result, the Board noted that the AffiliatedSub-Advisers can provide research and investment analysis on the markets and economies of various countries in which the Fund may invest, make recommendations regarding securities and assist with security trades. The Board concluded that thesub-advisory contracts may benefit the Fund and its shareholders by permitting Invesco Advisers to use the resources and talents of the AffiliatedSub-Advisers in managing the Fund. The Board concluded that the nature, extent and quality of the services that may be provided by the AffiliatedSub-Advisers are appropriate and satisfactory.
| B. | Fund Investment Performance |
The Board considered Fund investment performance as a relevant factor in considering whether to approve the investment advisory agreement.The Board did not view Fund investment performance as a relevant factor in considering whether to approve thesub-advisory contracts for the Fund, as no AffiliatedSub-Adviser currently manages assets of the Fund.
The Board compared the Fund’s investment performance over multiple time periods ending December 31, 2018 to the performance of funds in the Broadridge performance universe and against the Lipper Variable Underlying FundsLarge-Cap Value Funds Index. The Board noted that performance of Series I shares of the Fund was in the fifth quintile of its performance universe for the one year period, second quintile for the three year period and fourth quintile for the five year period (the first quintile being the best performing funds and the fifth quintile being the worst performing funds). The Board noted that performance of Series I shares of the Fund was below the performance of the Index for the one and five year periods and above the performance of the Index for the three year period. The Board noted that the
Invesco V.I. Comstock Fund
Fund’s overweight and underweight exposure to and stock selection in certain sectors detracted from Fund performance.The Trustees also reviewed more recent Fund performance and this review did not change their conclusions.
| C. | Advisory andSub-Advisory Fees and Fund Expenses |
The Board compared the Fund’s contractual management fee rate to the contractual management fee rates of funds in the Fund’s Broadridge expense group. The Board noted that the contractual management fee rate for Series I shares of the Fund was below the median contractual management fee rate of funds in its expense group. The Board noted that the term “contractual management fee” for funds in the expense group may include both advisory and certainnon-portfolio management administrative services fees, but that Broadridge does not provide information on a fund by fund basis as to what is included. The Board also reviewed the methodology used by Broadridge in providing expense group information, which includes using each fund’s contractual management fee schedule (including any applicable breakpoints) as reported in the most recent prospectus or statement of additional information for each fund in the expense group. The Board also considered comparative information regarding the Fund’s total expense ratio and its various components.
The Board noted that Invesco Advisers has contractually agreed to waive fees and/or limit expenses of the Fund for the term disclosed in the Fund’s registration statement in an amount necessary to limit total annual operating expenses to a specified percentage of average daily net assets for each class of the Fund.
The Board also considered the fees charged by Invesco Advisers and the AffiliatedSub-Advisers to other similarly managed client accounts. The Board noted that Invesco Advisers or the AffiliatedSub-Advisers may charge lower fees to large institutional clients. Invesco Advisers reviewed with the Board differences in the scope of services it provides to the Invesco Funds relative to certain other types of client accounts, including management of cash flows as a result of redemptions and purchases, necessary infrastructure such as officers, office space, technology, legal and distribution, oversight of service providers, costs and business risks associated with launching new funds and sponsoring and maintaining the product line, preparation of annual registration statement updates and financial information and compliance with federal and state laws and regulations.
The Board also compared the Fund’s effective advisory fee rate (the advisory fee rate after advisory fee waivers and before other expense limitations/waivers) to the effective advisory fee rates of other similarly managed third-party mutual funds advised orsub-advised by Invesco Advisers and its affiliates, based on asset balances as of December 31, 2018.
The Board also considered the services that may be provided by the AffiliatedSub-Advisers pursuant to thesub-advisory contracts, as well as the fees payable by Invesco Advisers to the AffiliatedSub-Advisers pursuant to thesub-advisory contracts.
| D. | Economies of Scale and Breakpoints |
The Board considered the extent to which there may be economies of scale in the provision of advisory services to the Fund. The Board considered Invesco’s reinvestment in its business, including investments in business infrastructure and cybersecurity. The Board also considered that the Fund benefits from economies of scale through contractual breakpoints in the Fund’s advisory fee schedule, which generally operate to reduce the Fund’s expense ratio as it grows in size. The Board noted that the Fund shares directly in economies of scale through lower fees charged by third party service providers based on the combined size of the Invesco Funds. The Board noted that the Fund may also benefit from economies of scale through initial fee setting, fee waivers and expense reimbursements.
| E. | Profitability and Financial Resources |
The Board reviewed information from Invesco Advisers concerning the costs of the advisory and other services that Invesco Advisers and its affiliates provide to the Fund and the Invesco Funds and the profitability of Invesco Advisers and its affiliates in providing these services. The Board considered the methodology used for calculating profitability and noted the periodic review of such methodology by an independent consultant. The Board noted that Invesco Advisers continues to operate at a net profit from services Invesco Advisers and its affiliates provide to the Invesco Funds and the Fund. The Board did not deem the level of profits realized by Invesco Advisers and its affiliates from providing services to the Fund to be excessive given the nature, extent and quality of the services provided. The Board received information from Invesco Advisers demonstrating that Invesco Advisers and the AffiliatedSub-Advisers are financially sound and have the resources necessary to perform their obligations under the investment advisory agreement andsub-advisory contracts.
| F. | Collateral Benefits to Invesco Advisers and its Affiliates |
The Board considered various other benefits received by Invesco Advisers and its affiliates from the relationship with the Fund, including the fees received for providing administrative, transfer agency and distribution services to the Fund. The Board considered comparative information regarding fees charged for these services, including information provided by Broadridge and other independent sources. The Board considered the performance of Invesco Advisers and its affiliates in providing these services and the organizational structure employed to provide these services. The Board also considered that these services are provided to the Fund pursuant to written contracts that are reviewed and approved on an annual basis
by the Board; and that the services are required for the operation of the Fund.
The Board considered the benefits realized by Invesco Advisers and the AffiliatedSub-Advisers as a result of portfolio brokerage transactions executed through “soft dollar” arrangements. The Board noted that soft dollar arrangements may result in the Fund bearing costs to purchase research that may be used by Invesco Advisers or the AffiliatedSub-Advisers with other clients and may reduce Invesco Advisers’ or the AffiliatedSub-Advisers’ expenses. The Board also considered that it receives periodic reports from Invesco representing that these arrangements are consistent with regulatory requirements. The Board did not deem the soft dollar arrangements to be inappropriate.
The Board considered that the Fund’s uninvested cash and cash collateral from any securities lending arrangements may be invested in money market funds advised by Invesco Advisers pursuant to procedures approved by the Board. The Board considered information regarding the returns of the affiliated money market funds relative to comparable overnight investments, as well as the costs to the Fund of such investments. The Board noted that Invesco Advisers receives advisory fees from these affiliated money market funds attributable to such investments, although Invesco Advisers has contractually agreed to waive through varying periods the advisory fees payable by the Invesco Funds with respect to certain investments in the affiliated money market funds. The waiver is in an amount equal to 100% of the net advisory fee Invesco Advisers receives from the affiliated money market funds with respect to the Fund’s investment in the affiliated money market funds of uninvested cash, but not cash collateral. The Board concluded that the amount of advisory fees received by Invesco Advisers from the Fund’s investment of cash collateral from any securities lending arrangements in the affiliated money market funds is fair and reasonable.
The Board also considered that an affiliated broker may receive commissions for executing certain trades for the Fund. Invesco Advisers and the AffiliatedSub-Advisers may use the affiliated broker to, among other things, control order routing and minimize information leakage, and the Board was advised that such trades are executed in compliance with rules under the federal securities laws and consistent with best execution obligations.
Invesco V.I. Comstock Fund
| Semiannual Report to Shareholders | June 30, 2019 |
Invesco V.I. Core Equity Fund
Beginning on January 1, 2021, as permitted by regulations adopted by the Securities and Exchange Commission, the insurance company that offers your variable annuity or variable life insurance contract may no longer send you paper copies of the Fund’s shareholder reports by mail, unless you specifically request paper copies of the reports from the insurance company or your financial intermediary. Instead of delivering paper copies of the report, the insurance company may choose to make the reports available on a website, and will notify you by mail each time a report is posted and provide you with a website link to access the report. Instructions for requesting paper copies will be provided by your insurance company.
If the insurance company offers electronic delivery, you may elect to receive shareholder reports and other communications about the Fund electronically by following the instructions provided by the insurance company or by contacting your financial intermediary. If you already elected to receive shareholder reports electronically, you will not be affected by this change and you need not take any action.
You may elect to receive all future reports in paper free of charge from the insurance company. You can inform the insurance company or your financial intermediary that you wish to continue receiving paper copies of your shareholder reports by following the instructions provided by the insurance company or by contacting your financial intermediary. Your election to receive reports in paper will apply to all portfolio companies available under your contract with the insurance company.
The Fund provides a complete list of its holdings four times in each fiscal year, at the quarter-ends. For the second and fourth quarters, the lists appear in the Fund’s semiannual and annual reports to shareholders. For the first and third quarters, the Fund files the lists with the Securities and Exchange Commission (SEC) on Form N-Q (or any successor Form). The Fund’s Form N-Q (or any successor Form) filings are available on the SEC website, sec.gov. The SEC file numbers for the Fund are 811-07452 and 033-57340. The Fund’s most recent portfolio holdings, as filed on Form N-Q (or any successor Form), have also been made available to insurance companies issuing variable annuity contracts and variable life insurance policies (“variable products”) that invest in the Fund.
A description of the policies and procedures that the Fund uses to determine how to vote proxies relating to portfolio securities is available without charge, upon request, from our Client Services department at 800 959 4246 or at invesco.com/proxyguidelines. The information is also available on the SEC website, sec.gov.
Information regarding how the Fund voted proxies related to its portfolio securities during the most recent 12-month period ended June 30 is available at invesco.com/proxysearch. The information is also available on the SEC website, sec.gov.
Invesco Advisers, Inc. is an investment adviser; it provides investment advisory services to individual and institutional clients and does not sell securities. Invesco Distributors, Inc. is the US distributor for Invesco Ltd.’s retail mutual funds, exchange-traded funds and institutional money market funds. Both are wholly owned, indirect subsidiaries of Invesco Ltd.
This report must be accompanied or preceded by a currently effective Fund prospectus and variable product prospectus, which contain more complete information, including sales charges and expenses. Investors should read each carefully before investing.
NOT FDIC INSURED | MAY LOSE VALUE | NO BANK GUARANTEE
| Invesco Distributors, Inc. | VICEQ-SAR-1 |
Performance summary
Fund vs. Indexes
Cumulative total returns, December 31, 2018 to June 30, 2019, excluding variable product issuer charges. If variable product issuer charges were included, returns would be lower.
| Series I Shares | 17.71% |
| Series II Shares | 17.58 |
| S&P 500 Index▼ (Broad Market Index) | 18.54 |
Russell 1000 Index■
(Style-Specific Index) | 18.84 |
Lipper VUF Large-Cap Core Funds Index♦
(Peer Group Index) | 17.04 |
| Source(s):▼FactSet Research Systems Inc.;■ RIMES Technologies Corp.;♦ Lipper Inc. |
The S&P 500®Indexis an unmanaged index considered representative of the US stock market.
TheRussell 1000® Index is an unmanaged index considered representative of large-cap stocks. The Russell 1000 Index is a trademark/service mark of the Frank Russell Co. Russell® is a trademark of the Frank Russell Co.
TheLipper VUF Large-Cap Core Funds Index is an unmanaged index considered representative of large-cap core variable insurance underlying funds tracked by Lipper.
The Fund is not managed to track the performance of any particular index, including the indexes described here, and consequently, the performance of the Fund may deviate significantly from the performance of the indexes.
A direct investment cannot be made in an index. Unless otherwise indicated, index results include reinvested dividends, and they do not reflect sales charges. Performance of the peer group, if applicable, reflects fund expenses; performance of a market index does not.
| Average Annual Total Returns |
| As of 6/30/19 |
| Series I Shares | |
| Inception (5/2/94) | 7.91% |
| 10 Years | 10.21 |
| 5 Years | 4.57 |
| 1 Year | 7.03 |
| Series II Shares | |
| Inception (10/24/01) | 6.49% |
| 10 Years | 9.94 |
| 5 Years | 4.32 |
| 1 Year | 6.78 |
The performance of the Fund’s Series I and Series II share classes will differ primarily due to different class expenses.
The performance data quoted represent past performance and cannot guarantee comparable future results; current performance may be lower or higher. Please contact your variable product issuer or financial adviser for the most recent month-end variable product performance. Performance figures reflect Fund expenses, reinvested distributions and changes in net asset value. Investment return and principal value will fluctuate so that you may have a gain or loss when you sell shares.
The net annual Fund operating expense ratio set forth in the most recent Fund prospectus as of the date of this report for Series I and Series II shares was 0.80% and 1.05%, respectively.1 The total annual Fund operat-
ing expense ratio set forth in the most recent Fund prospectus as of the date of this report for Series I and Series II shares was 0.81% and 1.06%, respectively. The expense ratios presented above may vary from the expense ratios presented in other sections of this report that are based on expenses incurred during the period covered by this report.
Invesco V.I. Core Equity Fund, a series portfolio of AIM Variable Insurance Funds (Invesco Variable Insurance Funds), is currently offered through insurance companies issuing variable products. You cannot purchase shares of the Fund directly. Performance figures given represent the Fund and are not intended to reflect actual variable product values. They do not reflect sales charges, expenses and fees assessed in connection with a variable product. Sales charges, expenses and fees, which are determined by the vari-
able product issuers, will vary and will lower the total return.
The most recent month-end performance at the Fund level, excluding variable product charges, is available at 800 451 4246. As mentioned above, for the most recent month-end performance including variable product charges, please contact your variable product issuer or financial adviser.
Fund performance reflects any applicable fee waivers and/or expense reimbursements. Had the adviser not waived fees and/or reimbursed expenses currently or in the past, returns would have been lower. See current prospectus for more information.
| 1 | Total annual Fund operating expenses after any contractual fee waivers and/or expense reimbursements by the adviser in effect through at least June 30, 2021. See current prospectus for more information. |
Invesco V.I. Core Equity Fund
Schedule of Investments(a)
June 30, 2019
(Unaudited)
| | Shares | Value |
| Common Stocks & Other Equity Interests–95.36% |
| Aerospace & Defense–3.10% |
| Northrop Grumman Corp. | 45,386 | $14,664,670 |
| United Technologies Corp. | 94,313 | 12,279,553 |
| | | | 26,944,223 |
| Airlines–1.21% |
| Delta Air Lines, Inc. | 184,905 | 10,493,359 |
| Application Software–1.93% |
| salesforce.com, inc.(b) | 110,280 | 16,732,784 |
| Asset Management & Custody Banks–1.37% |
| BlackRock, Inc. | 25,381 | 11,911,303 |
| Auto Parts & Equipment–1.24% |
| Aptiv PLC | 132,725 | 10,728,162 |
| Biotechnology–1.53% |
| BioMarin Pharmaceutical, Inc.(b) | 54,144 | 4,637,434 |
| Vertex Pharmaceuticals, Inc.(b) | 47,109 | 8,638,848 |
| | | | 13,276,282 |
| Cable & Satellite–2.87% |
| Comcast Corp., Class A | 588,895 | 24,898,481 |
| Consumer Finance–2.58% |
| American Express Co. | 181,381 | 22,389,671 |
| Data Processing & Outsourced Services–3.38% |
| Mastercard, Inc., Class A | 110,956 | 29,351,191 |
| Diversified Banks–4.29% |
| JPMorgan Chase & Co. | 35,749 | 3,996,738 |
| Toronto-Dominion Bank (The) (Canada) | 213,829 | 12,494,517 |
| U.S. Bancorp | 396,500 | 20,776,600 |
| | | | 37,267,855 |
| Financial Exchanges & Data–1.68% |
| Moody’s Corp. | 74,743 | 14,598,055 |
| General Merchandise Stores–2.07% |
| Dollar General Corp. | 132,594 | 17,921,405 |
| Health Care Equipment–3.42% |
| Medtronic PLC | 195,566 | 19,046,173 |
| Zimmer Biomet Holdings, Inc. | 90,526 | 10,658,531 |
| | | | 29,704,704 |
| Health Care Facilities–1.92% |
| HCA Healthcare, Inc. | 123,068 | 16,635,102 |
| Home Improvement Retail–1.32% |
| Home Depot, Inc. (The) | 55,197 | 11,479,320 |
| | Shares | Value |
| Household Products–1.04% |
| Reckitt Benckiser Group PLC (United Kingdom) | 114,030 | $9,011,487 |
| Industrial Conglomerates–2.57% |
| Honeywell International, Inc. | 71,497 | 12,482,661 |
| Siemens AG (Germany) | 82,933 | 9,857,804 |
| | | | 22,340,465 |
| Industrial Machinery–1.70% |
| Stanley Black & Decker, Inc. | 102,261 | 14,787,963 |
| Insurance Brokers–2.29% |
| Marsh & McLennan Cos., Inc. | 199,271 | 19,877,282 |
| Integrated Oil & Gas–3.55% |
| Chevron Corp. | 134,014 | 16,676,702 |
| Suncor Energy, Inc. (Canada) | 453,397 | 14,127,851 |
| | | | 30,804,553 |
| Integrated Telecommunication Services–2.24% |
| Verizon Communications, Inc. | 340,772 | 19,468,304 |
| Interactive Home Entertainment–1.65% |
| Activision Blizzard, Inc. | 304,146 | 14,355,691 |
| Interactive Media & Services–7.73% |
| Alphabet, Inc., Class C(b) | 35,377 | 38,239,353 |
| Facebook, Inc., Class A(b) | 149,550 | 28,863,150 |
| | | | 67,102,503 |
| Internet & Direct Marketing Retail–6.53% |
| Alibaba Group Holding Ltd., ADR (China)(b) | 54,938 | 9,309,244 |
| Amazon.com, Inc.(b) | 17,714 | 33,543,762 |
| Booking Holdings, Inc.(b) | 7,358 | 13,794,116 |
| | | | 56,647,122 |
| IT Consulting & Other Services–2.37% |
| Cognizant Technology Solutions Corp., Class A | 171,389 | 10,864,349 |
| EPAM Systems, Inc.(b) | 56,023 | 9,697,581 |
| | | | 20,561,930 |
| Life Sciences Tools & Services–2.14% |
| Thermo Fisher Scientific, Inc. | 63,200 | 18,560,576 |
| Managed Health Care–2.45% |
| UnitedHealth Group, Inc. | 87,075 | 21,247,171 |
| Multi-Sector Holdings–0.15% |
| Berkshire Hathaway, Inc., Class B(b) | 6,200 | 1,321,654 |
| Multi-Utilities–2.28% |
| WEC Energy Group, Inc. | 237,069 | 19,764,443 |
See accompanying Notes to Financial Statements which are an integral part of the financial statements.
Invesco V.I. Core Equity Fund
| | Shares | Value |
| Oil & Gas Exploration & Production–0.32% |
| Concho Resources, Inc. | 26,953 | $2,781,011 |
| Oil & Gas Storage & Transportation–0.06% |
| Magellan Midstream Partners, L.P. | 8,160 | 522,240 |
| Pharmaceuticals–3.92% |
| Allergan PLC | 77,624 | 12,996,586 |
| Novo Nordisk A/S, Class B (Denmark) | 187,204 | 9,549,235 |
| Pfizer, Inc. | 264,560 | 11,460,739 |
| | | | 34,006,560 |
| Property & Casualty Insurance–3.42% |
| Chubb Ltd. | 85,335 | 12,568,992 |
| Progressive Corp. (The) | 213,729 | 17,083,359 |
| | | | 29,652,351 |
| Railroads–1.69% |
| Norfolk Southern Corp. | 73,485 | 14,647,765 |
| Regional Banks–1.82% |
| PNC Financial Services Group, Inc. (The) | 114,995 | 15,786,514 |
| Semiconductors–3.49% |
| Analog Devices, Inc. | 93,073 | 10,505,149 |
| QUALCOMM, Inc. | 104,655 | 7,961,106 |
| | Shares | Value |
| Semiconductors–(continued) |
| Texas Instruments, Inc. | 102,714 | $11,787,459 |
| | | | 30,253,714 |
| Soft Drinks–2.58% |
| PepsiCo, Inc. | 171,013 | 22,424,935 |
| Systems Software–5.46% |
| Microsoft Corp. | 353,937 | 47,413,400 |
| Total Common Stocks & Other Equity Interests (Cost $619,361,277) | 827,671,531 |
| Money Market Funds–2.53% |
| Invesco Government & Agency Portfolio, Institutional Class, 2.26%(c) | 7,701,535 | 7,701,535 |
| Invesco Liquid Assets Portfolio, Institutional Class, 2.40%(c) | 5,496,210 | 5,498,409 |
| Invesco Treasury Portfolio, Institutional Class, 2.22%(c) | 8,801,754 | 8,801,754 |
| Total Money Market Funds (Cost $22,001,381) | 22,001,698 |
| TOTAL INVESTMENTS IN SECURITIES–97.89% (Cost $641,362,658) | 849,673,229 |
| OTHER ASSETS LESS LIABILITIES–2.11% | 18,272,010 |
| NET ASSETS–100.00% | $867,945,239 |
Investment Abbreviations:
| ADR | – American Depositary Receipt |
Notes to Schedule of Investments:
| (a) | Industry and/or sector classifications used in this report are generally according to the Global Industry Classification Standard, which was developed by and is the exclusive property and a service mark of MSCI Inc. and Standard & Poor’s. |
| (b) | Non-income producing security. |
| (c) | The money market fund and the Fund are affiliated by having the same investment adviser. The rate shown is the 7-day SEC standardized yield as of June 30, 2019. |
Portfolio Composition
By sector, based on Net Assets
as of June 30, 2019
| Financials | 17.60% |
| Information Technology | 16.63 |
| Health Care | 15.38 |
| Communication Services | 14.49 |
| Consumer Discretionary | 11.16 |
| Industrials | 10.27 |
| Energy | 3.93 |
| Consumer Staples | 3.62 |
| Utilities | 2.28 |
| Money Market Funds Plus Other Assets Less Liabilities | 4.64 |
See accompanying Notes to Financial Statements which are an integral part of the financial statements.
Invesco V.I. Core Equity Fund
Statement of Assets and Liabilities
June 30, 2019
(Unaudited)
| Assets: | |
Investments in securities, at value
(Cost $619,361,277) | $827,671,531 |
| Investments in affiliated money market funds, at value (Cost $22,001,381) | 22,001,698 |
| Foreign currencies, at value (Cost $1,280) | 1,346 |
| Receivable for: | |
| Fund shares sold | 2,485 |
| Dividends | 531,573 |
| Investments sold | 55,868,040 |
| Investment for trustee deferred compensation and retirement plans | 433,060 |
| Total assets | 906,509,733 |
| Liabilities: | |
| Payable for: | |
| Investments purchased | 37,111,691 |
| Fund shares reacquired | 571,397 |
| Accrued fees to affiliates | 353,346 |
| Accrued trustees’ and officers’ fees and benefits | 209 |
| Accrued other operating expenses | 57,211 |
| Trustee deferred compensation and retirement plans | 470,640 |
| Total liabilities | 38,564,494 |
| Net assets applicable to shares outstanding | $867,945,239 |
| Net assets consist of: | |
| Shares of beneficial interest | $513,543,346 |
| Distributable earnings | 354,401,893 |
| | $867,945,239 |
| Net Assets: |
| Series I | $845,984,055 |
| Series II | $21,961,184 |
| Shares outstanding, no par value, with an unlimited number of shares authorized: |
| Series I | 23,232,911 |
| Series II | 609,334 |
| Series I: | |
| Net asset value per share | $36.41 |
| Series II: | |
| Net asset value per share | $36.04 |
Statement of Operations
For the six months ended June 30, 2019
(Unaudited)
| Investment income: | |
| Dividends (net of foreign withholding taxes of $179,723) | $8,698,698 |
| Dividends from affiliated money market funds | 235,305 |
| Total investment income | 8,934,003 |
| Expenses: | |
| Advisory fees | 2,855,031 |
| Administrative services fees | 691,821 |
| Distribution fees - Series II | 27,232 |
| Transfer agent fees | 37,749 |
| Trustees’ and officers’ fees and benefits | 18,116 |
| Reports to shareholders | 6,050 |
| Professional services fees | 31,157 |
| Other | 5,993 |
| Total expenses | 3,673,149 |
| Less: Fees waived | (11,850) |
| Net expenses | 3,661,299 |
| Net investment income | 5,272,704 |
| Realized and unrealized gain (loss) from: | |
| Net realized gain (loss) from: | |
| Investment securities (includes net gains (losses) from securities sold to affiliates of $(86,403)) | 43,753,582 |
| Foreign currencies | (6,024) |
| | 43,747,558 |
| Change in net unrealized appreciation (depreciation) of: | |
| Investment securities | 100,538,056 |
| Foreign currencies | (838) |
| | 100,537,218 |
| Net realized and unrealized gain | 144,284,776 |
| Net increase in net assets resulting from operations | $149,557,480 |
See accompanying Notes to Financial Statements which are an integral part of the financial statements.
Invesco V.I. Core Equity Fund
Statement of Changes in Net Assets
For the six months ended June 30, 2019 and the year ended December 31, 2018
(Unaudited)
| | June 30,
2019 | December 31,
2018 |
| Operations: | | |
| Net investment income | $5,272,704 | $7,271,862 |
| Net realized gain | 43,747,558 | 96,380,296 |
| Change in net unrealized appreciation (depreciation) | 100,537,218 | (197,550,328) |
| Net increase (decrease) in net assets resulting from operations | 149,557,480 | (93,898,170) |
| Distributions to shareholders from distributable earnings: | | |
| Series I | — | (72,928,447) |
| Series II | — | (1,504,788) |
| Total distributions from distributable earnings | — | (74,433,235) |
| Share transactions–net: | | |
| Series I | (158,907,395) | (35,235,681) |
| Series II | (1,735,632) | (162,186,906) |
| Net increase (decrease) in net assets resulting from share transactions | (160,643,027) | (197,422,587) |
| Net increase (decrease) in net assets | (11,085,547) | (365,753,992) |
| Net assets: | | |
| Beginning of period | 879,030,786 | 1,244,784,778 |
| End of period | $867,945,239 | $879,030,786 |
See accompanying Notes to Financial Statements which are an integral part of the financial statements.
Invesco V.I. Core Equity Fund
Financial Highlights
June 30, 2019
(Unaudited)
The following schedule presents financial highlights for a share of the Fund outstanding throughout the periods indicated.
| | Net asset
value,
beginning
of period | Net
investment
income(a) | Net gains
(losses)
on securities
(both
realized and
unrealized) | Total from
investment
operations | Dividends
from net
investment
income | Distributions
from net
realized
gains | Total
distributions | Net asset
value, end
of period | Total
return(b) | Net assets,
end of period
(000’s omitted) | Ratio of
expenses
to average
net assets
with fee waivers
and/or expenses
absorbed | Ratio of
expenses
to average net
assets without
fee waivers
and/or expenses
absorbed | Ratio of net
investment
income
to average
net assets | Portfolio
turnover(c) |
| Series I |
| Six months ended 06/30/19 | $30.94 | $0.20 | $5.27 | $5.47 | $— | $— | $— | $36.41 | 17.68% | $845,984 | 0.78%(d) | 0.78%(d) | 1.14%(d) | 18% |
| Year ended 12/31/18 | 36.72 | 0.25 | (3.29) | (3.04) | (0.34) | (2.40) | (2.74) | 30.94 | (9.40) | 858,828 | 0.79 | 0.80 | 0.70 | 46 |
| Year ended 12/31/17 | 34.58 | 0.27 | 4.21 | 4.48 | (0.39) | (1.95) | (2.34) | 36.72 | 13.17 | 1,054,802 | 0.79 | 0.80 | 0.74 | 30 |
| Year ended 12/31/16 | 33.84 | 0.39 | 3.07 | 3.46 | (0.28) | (2.44) | (2.72) | 34.58 | 10.26 | 1,033,700 | 0.84 | 0.85 | 1.11 | 38 |
| Year ended 12/31/15 | 41.00 | 0.32 | (2.79) | (2.47) | (0.46) | (4.23) | (4.69) | 33.84 | (5.75) | 921,516 | 0.89 | 0.90 | 0.81 | 45 |
| Year ended 12/31/14 | 38.43 | 0.40 | 2.72 | 3.12 | (0.35) | (0.20) | (0.55) | 41.00 | 8.12 | 1,096,219 | 0.88 | 0.90 | 1.01 | 35 |
| Series II |
| Six months ended 06/30/19 | 30.66 | 0.15 | 5.23 | 5.38 | — | — | — | 36.04 | 17.55 | 21,961 | 1.03(d) | 1.03(d) | 0.89(d) | 18 |
| Year ended 12/31/18 | 36.18 | 0.16 | (3.28) | (3.12) | — | (2.40) | (2.40) | 30.66 | (9.61) | 20,203 | 1.04 | 1.05 | 0.45 | 46 |
| Year ended 12/31/17 | 34.11 | 0.18 | 4.14 | 4.32 | (0.30) | (1.95) | (2.25) | 36.18 | 12.87 | 189,982 | 1.04 | 1.05 | 0.49 | 30 |
| Year ended 12/31/16 | 33.40 | 0.30 | 3.03 | 3.33 | (0.18) | (2.44) | (2.62) | 34.11 | 10.02 | 179,596 | 1.09 | 1.10 | 0.86 | 38 |
| Year ended 12/31/15 | 40.53 | 0.22 | (2.75) | (2.53) | (0.37) | (4.23) | (4.60) | 33.40 | (5.98) | 178,126 | 1.14 | 1.15 | 0.56 | 45 |
| Year ended 12/31/14 | 38.03 | 0.30 | 2.67 | 2.97 | (0.27) | (0.20) | (0.47) | 40.53 | 7.82 | 185,406 | 1.13 | 1.15 | 0.76 | 35 |
| (a) | Calculated using average shares outstanding. |
| (b) | Includes adjustments in accordance with accounting principles generally accepted in the United States of America and as such, the net asset value for financial reporting purposes and the returns based upon those net asset values may differ from the net asset value and returns for shareholder transactions. Total returns are not annualized for periods less than one year, if applicable, and do not reflect charges assessed in connection with a variable product, which if included would reduce total returns. |
| (c) | Portfolio turnover is calculated at the fund level and is not annualized for periods less than one year, if applicable. |
| (d) | Ratios are annualized and based on average daily net assets (000’s omitted) of $916,764 and $21,966 for Series I and Series II shares, respectively. |
See accompanying Notes to Financial Statements which are an integral part of the financial statements.
Invesco V.I. Core Equity Fund
Notes to Financial Statements
June 30, 2019
(Unaudited)
NOTE 1—Significant Accounting Policies
Invesco V.I. Core Equity Fund (the “Fund”) is a series portfolio of AIM Variable Insurance Funds (Invesco Variable Insurance Funds) (the “Trust”). The Trust is a Delaware statutory trust registered under the Investment Company Act of 1940, as amended (the “1940 Act”), as an open-end series management investment company. Information presented in these financial statements pertains only to the Fund. Matters affecting the Fund or each class will be voted on exclusively by the shareholders of the Fund or each class. Current Securities and Exchange Commission (“SEC”) guidance, however, requires participating insurance companies offering separate accounts to vote shares proportionally in accordance with the instructions of the contract owners whose investments are funded by shares of each Fund or class.
The Fund’s investment objective is long-term growth of capital.
The Fund currently offers two classes of shares, Series I and Series II, both of which are offered to insurance company separate accounts funding variable annuity contracts and variable life insurance policies (“variable products”).
The Fund is an investment company and accordingly follows the investment company accounting and reporting guidance in accordance with Financial Accounting Standards Board Accounting Standards Codification Topic 946,Financial Services – Investment Companies.
The following is a summary of the significant accounting policies followed by the Fund in the preparation of its financial statements.
| A. | Security Valuations — Securities, including restricted securities, are valued according to the following policy. |
A security listed or traded on an exchange (except convertible securities) is valued at its last sales price or official closing price as of the close of the customary trading session on the exchange where the security is principally traded, or lacking any sales or official closing price on a particular day, the security may be valued at the closing bid price on that day. Securities traded in the over-the-counter market are valued based on prices furnished by independent pricing services or market makers. When such securities are valued by an independent pricing service they may be considered fair valued. Futures contracts are valued at the final settlement price set by an exchange on which they are principally traded. Listed options are valued at the mean between the last bid and asked prices from the exchange on which they are principally traded. Options not listed on an exchange are valued by an independent source at the mean between the last bid and asked prices. For purposes of determining net asset value (“NAV”) per share, futures and option contracts generally are valued 15 minutes after the close of the customary trading session of the New York Stock Exchange (“NYSE”).
Investments in open-end and closed-end registered investment companies that do not trade on an exchange are valued at the end-of-day net asset value per share. Investments in open-end and closed-end registered investment companies that trade on an exchange are valued at the last sales price or official closing price as of the close of the customary trading session on the exchange where the security is principally traded.
Debt obligations (including convertible securities) and unlisted equities are fair valued using an evaluated quote provided by an independent pricing service. Evaluated quotes provided by the pricing service may be determined without exclusive reliance on quoted prices, and may reflect appropriate factors such as institution-size trading in similar groups of securities, developments related to specific securities, dividend rate (for unlisted equities), yield (for debt obligations), quality, type of issue, coupon rate (for debt obligations), maturity (for debt obligations), individual trading characteristics and other market data. Pricing services generally value debt obligations assuming orderly transactions of institutional round lot size, but a fund may hold or transact in the same securities in smaller, odd lot sizes. Odd lots often trade at lower prices than institutional round lots. Debt obligations are subject to interest rate and credit risks. In addition, all debt obligations involve some risk of default with respect to interest and/or principal payments.
Foreign securities’ (including foreign exchange contracts) prices are converted into U.S. dollar amounts using the applicable exchange rates as of the close of the NYSE. If market quotations are available and reliable for foreign exchange-traded equity securities, the securities will be valued at the market quotations. Because trading hours for certain foreign securities end before the close of the NYSE, closing market quotations may become unreliable. If between the time trading ends on a particular security and the close of the customary trading session on the NYSE, events occur that the investment adviser determines are significant and make the closing price unreliable, the Fund may fair value the security. If the event is likely to have affected the closing price of the security, the security will be valued at fair value in good faith using procedures approved by the Board of Trustees. Adjustments to closing prices to reflect fair value may also be based on a screening process of an independent pricing service to indicate the degree of certainty, based on historical data, that the closing price in the principal market where a foreign security trades is not the current value as of the close of the NYSE. Foreign securities’ prices meeting the approved degree of certainty that the price is not reflective of current value will be priced at the indication of fair value from the independent pricing service. Multiple factors may be considered by the independent pricing service in determining adjustments to reflect fair value and may include information relating to sector indices, American Depositary Receipts and domestic and foreign index futures. Foreign securities may have additional risks including exchange rate changes, potential for sharply devalued currencies and high inflation, political and economic upheaval, the relative lack of issuer information, relatively low market liquidity and the potential lack of strict financial and accounting controls and standards.
Securities for which market prices are not provided by any of the above methods may be valued based upon quotes furnished by independent sources. The last bid price may be used to value equity securities. The mean between the last bid and asked prices is used to value debt obligations, including corporate loans.
Securities for which market quotations are not readily available or became unreliable are valued at fair value as determined in good faith by or under the supervision of the Trust’s officers following procedures approved by the Board of Trustees. Issuer specific events, market trends, bid/asked quotes of brokers and information providers and other market data may be reviewed in the course of making a good faith determination of a security’s fair value.
The Fund may invest in securities that are subject to interest rate risk, meaning the risk that the prices will generally fall as interest rates rise and, conversely, the prices will generally rise as interest rates fall. Specific securities differ in their sensitivity to changes in interest rates depending on their individual characteristics. Changes in interest rates may result in increased market volatility, which may affect the value and/or liquidity of certain Fund investments.
Invesco V.I. Core Equity Fund
Valuations change in response to many factors including the historical and prospective earnings of the issuer, the value of the issuer’s assets, general economic conditions, interest rates, investor perceptions and market liquidity. Because of the inherent uncertainties of valuation, the values reflected in the financial statements may materially differ from the value received upon actual sale of those investments.
| B. | Securities Transactions and Investment Income — Securities transactions are accounted for on a trade date basis. Realized gains or losses on sales are computed on the basis of specific identification of the securities sold. Interest income (net of withholding tax, if any) is recorded on the accrual basis from settlement date. Dividend income (net of withholding tax, if any) is recorded on the ex-dividend date. |
The Fund may periodically participate in litigation related to Fund investments. As such, the Fund may receive proceeds from litigation settlements. Any proceeds received are included in the Statement of Operations as realized gain (loss) for investments no longer held and as unrealized gain (loss) for investments still held.
Brokerage commissions and mark ups are considered transaction costs and are recorded as an increase to the cost basis of securities purchased and/or a reduction of proceeds on a sale of securities. Such transaction costs are included in the determination of net realized and unrealized gain (loss) from investment securities reported in the Statement of Operations and the Statement of Changes in Net Assets and the net realized and unrealized gains (losses) on securities per share in the Financial Highlights. Transaction costs are included in the calculation of the Fund’s net asset value and, accordingly, they reduce the Fund’s total returns. These transaction costs are not considered operating expenses and are not reflected in net investment income reported in the Statement of Operations and the Statement of Changes in Net Assets, or the net investment income per share and the ratios of expenses and net investment income reported in the Financial Highlights, nor are they limited by any expense limitation arrangements between the Fund and the investment adviser.
The Fund allocates income and realized and unrealized capital gains and losses to a class based on the relative net assets of each class.
| C. | Country Determination — For the purposes of making investment selection decisions and presentation in the Schedule of Investments, the investment adviser may determine the country in which an issuer is located and/or credit risk exposure based on various factors. These factors include the laws of the country under which the issuer is organized, where the issuer maintains a principal office, the country in which the issuer derives 50% or more of its total revenues and the country that has the primary market for the issuer’s securities, as well as other criteria. Among the other criteria that may be evaluated for making this determination are the country in which the issuer maintains 50% or more of its assets, the type of security, financial guarantees and enhancements, the nature of the collateral and the sponsor organization. Country of issuer and/or credit risk exposure has been determined to be the United States of America, unless otherwise noted. |
| D. | Distributions– Distributions from net investment income and net realized capital gain, if any, are generally declared and paid to separate accounts of participating insurance companies annually and recorded on the ex-dividend date. |
| E. | Federal Income Taxes –The Fund intends to comply with the requirements of Subchapter M of the Internal Revenue Code of 1986, as amended (the “Internal Revenue Code”), necessary to qualify as a regulated investment company and to distribute substantially all of the Fund’s taxable earnings to shareholders. As such, the Fund will not be subject to federal income taxes on otherwise taxable income (including net realized capital gain) that is distributed to shareholders. Therefore, no provision for federal income taxes is recorded in the financial statements. |
The Fund recognizes the tax benefits of uncertain tax positions only when the position is more likely than not to be sustained. Management has analyzed the Fund’s uncertain tax positions and concluded that no liability for unrecognized tax benefits should be recorded related to uncertain tax positions. Management is not aware of any tax positions for which it is reasonably possible that the total amounts of unrecognized tax benefits will change materially in the next 12 months.
The Fund files tax returns in the U.S. Federal jurisdiction and certain other jurisdictions. Generally, the Fund is subject to examinations by such taxing authorities for up to three years after the filing of the return for the tax period.
| F. | Expenses– Fees provided for under the Rule 12b-1 plan of a particular class of the Fund and which are directly attributable to that class are charged to the operations of such class. All other expenses are allocated among the classes based on relative net assets. |
| G. | Accounting Estimates – The preparation of financial statements in conformity with accounting principles generally accepted in the United States of America (“GAAP”) requires management to make estimates and assumptions that affect the reported amounts of assets and liabilities at the date of the financial statements and the reported amounts of revenues and expenses during the reporting period including estimates and assumptions related to taxation. Actual results could differ from those estimates by a significant amount. In addition, the Fund monitors for material events or transactions that may occur or become known after the period-end date and before the date the financial statements are released to print. |
| H. | Indemnifications – Under the Trust’s organizational documents, each Trustee, officer, employee or other agent of the Trust is indemnified against certain liabilities that may arise out of the performance of their duties to the Fund. Additionally, in the normal course of business, the Fund enters into contracts, including the Fund’s servicing agreements, that contain a variety of indemnification clauses. The Fund’s maximum exposure under these arrangements is unknown as this would involve future claims that may be made against the Fund that have not yet occurred. The risk of material loss as a result of such indemnification claims is considered remote. |
| I. | Foreign Currency Translations— Foreign currency is valued at the close of the NYSE based on quotations posted by banks and major currency dealers. Portfolio securities and other assets and liabilities denominated in foreign currencies are translated into U.S. dollar amounts at the date of valuation. Purchases and sales of portfolio securities (net of foreign taxes withheld on disposition) and income items denominated in foreign currencies are translated into U.S. dollar amounts on the respective dates of such transactions. The Fund does not separately account for the portion of the results of operations resulting from changes in foreign exchange rates on investments and the fluctuations arising from changes in market prices of securities held. The combined results of changes in foreign exchange rates and the fluctuation of market prices on investments (net of estimated foreign tax withholding) are included with the net realized and unrealized gain or loss from investments in the Statement of Operations. Reported net realized foreign currency gains or losses arise from (1) sales of foreign currencies, (2) currency gains or losses realized between the trade and settlement dates on securities transactions, and (3) the difference between the amounts of dividends, interest, and foreign withholding taxes recorded on the Fund’s books and the U.S. dollar equivalent of the amounts actually received or paid. Net unrealized foreign currency gains and losses arise from changes in the fair values of assets and liabilities, other than investments in securities at fiscal period end, resulting from changes in exchange rates. |
The Fund may invest in foreign securities, which may be subject to foreign taxes on income, gains on investments or currency repatriation, a portion of which may be recoverable. Foreign taxes, if any, are recorded based on the tax regulations and rates that exist in the foreign markets in which the Fund invests and are shown in the Statement of Operations.
Invesco V.I. Core Equity Fund
| J. | Forward Foreign Currency Contracts— The Fund may engage in foreign currency transactions either on a spot (i.e. for prompt delivery and settlement) basis, or through forward foreign currency contracts, to manage or minimize currency or exchange rate risk. |
The Fund may also enter into forward foreign currency contracts for the purchase or sale of a security denominated in a foreign currency in order to “lock in” the U.S. dollar price of that security, or the Fund may also enter into forward foreign currency contracts that do not provide for physical settlement of the two currencies, but instead are settled by a single cash payment calculated as the difference between the agreed upon exchange rate and the spot rate at settlement based upon an agreed upon notional amount (non-deliverable forwards). The Fund will set aside liquid assets in an amount equal to the daily mark-to-market obligation for forward foreign currency contracts.
A forward foreign currency contract is an obligation between two parties (“Counterparties”) to purchase or sell a specific currency for an agreed-upon price at a future date. The use of forward foreign currency contracts does not eliminate fluctuations in the price of the underlying securities the Fund owns or intends to acquire but establishes a rate of exchange in advance. Fluctuations in the value of these contracts are measured by the difference in the contract date and reporting date exchange rates and are recorded as unrealized appreciation (depreciation) until the contracts are closed. When the contracts are closed, realized gains (losses) are recorded. Realized and unrealized gains (losses) on the contracts are included in the Statement of Operations. The primary risks associated with forward foreign currency contracts include failure of the Counterparty to meet the terms of the contract and the value of the foreign currency changing unfavorably. These risks may be in excess of the amounts reflected in the Statement of Assets and Liabilities.
NOTE 2—Advisory Fees and Other Fees Paid to Affiliates
The Trust has entered into a master investment advisory agreement with Invesco Advisers, Inc. (the "Adviser" or "Invesco"). Under the terms of the investment advisory agreement, the Fund accrues daily and pays monthly an advisory fee to the Adviser based on the annual rate of the Fund’s average daily net assets as follows:
| Average Daily Net Assets | Rate |
| First $250 million | 0.65% |
| Over $250 million | 0.60% |
For the six months ended June 30, 2019, the effective advisory fees incurred by the Fund was 0.61%.
Under the terms of a master sub-advisory agreement between the Adviser and each of Invesco Asset Management Deutschland GmbH, Invesco Asset Management Limited, Invesco Asset Management (Japan) Limited, Invesco Hong Kong Limited, Invesco Senior Secured Management, Inc. and Invesco Canada Ltd. and separate sub-advisory agreements with Invesco Capital Management LLC and Invesco Asset Management (India) Private Limited (collectively, the "Affiliated Sub-Advisers") the Adviser, not the Fund, will pay 40% of the fees paid to the Adviser to any such Affiliated Sub-Adviser(s) that provide(s) discretionary investment management services to the Fund based on the percentage of assets allocated to such Affiliated Sub-Adviser(s).
The Adviser has contractually agreed, through at least June 30, 2020, to waive advisory fees and/or reimburse expenses of all shares to the extent necessary to limit total annual fund operating expenses after fee waiver and/or expense reimbursement (excluding certain items discussed below) of Series I shares to 2.00% and Series II shares to 2.25% of average daily net assets (the “expense limits”). In determining the Adviser’s obligation to waive advisory fees and/or reimburse expenses, the following expenses are not taken into account, and could cause the total annual fund operating expenses after fee waiver and/or expense reimbursement to exceed the numbers reflected above: (1) interest; (2) taxes; (3) dividend expense on short sales; (4) extraordinary or non-routine items, including litigation expenses; and (5) expenses that the Fund has incurred but did not actually pay because of an expense offset arrangement. Unless Invesco continues the fee waiver agreement, it will terminate on June 30, 2020. During its term, the fee waiver agreement cannot be terminated or amended to increase the expense limits or reduce the advisory fee waiver without approval of the Board of Trustees. The Adviser did not waive fees and/or reimburse expenses during the period under these expense limits.
Further, the Adviser has contractually agreed, through at least June 30, 2021, to waive the advisory fee payable by the Fund in an amount equal to 100% of the net advisory fees the Adviser receives from the affiliated money market funds on investments by the Fund of uninvested cash in such affiliated money market funds.
For the six months ended June 30, 2019, the Adviser waived advisory fees of $11,850.
The Trust has entered into a master administrative services agreement with Invesco pursuant to which the Fund has agreed to pay Invesco a fee for costs incurred in providing accounting services and fund administrative services to the Fund and to reimburse Invesco for fees paid to insurance companies that have agreed to provide certain administrative services to the Fund. These administrative services provided by the insurance companies may include, among other things: maintenance of master accounts with the Fund; tracking, recording and transmitting net purchase and redemption orders for Fund shares; maintaining and preserving records related to the purchase, redemption and other account activity of variable product owners; distributing copies of Fund documents such as prospectuses, proxy materials and periodic reports, to variable product owners, and responding to inquiries from variable product owners about the Fund. Pursuant to such agreement, for the six months ended June 30, 2019, Invesco was paid $65,725 for accounting and fund administrative services and was reimbursed $626,096 for fees paid to insurance companies. Also, Invesco has entered into a sub-administration agreement whereby State Street Bank and Trust Company (“SSB”) serves as custodian and fund accountant and provides certain administrative services to the Fund.
The Trust has entered into a transfer agency and service agreement with Invesco Investment Services, Inc. (“IIS”) pursuant to which the Fund has agreed to pay IIS a fee for providing transfer agency and shareholder services to the Fund and reimburse IIS for certain expenses incurred by IIS in the course of providing such services. For the six months ended June 30, 2019, expenses incurred under the agreement are shown in the Statement of Operations asTransfer agent fees.
The Trust has entered into a master distribution agreement with Invesco Distributors, Inc. (“IDI”) to serve as the distributor for the Fund. The Trust has adopted a plan pursuant to Rule 12b-1 under the 1940 Act with respect to the Fund’s Series II shares (the “Plan”). The Fund, pursuant to the Plan, pays IDI compensation at the annual rate of 0.25% of the Fund’s average daily net assets of Series II shares. The fees are accrued daily and paid monthly. Of the Plan payments, up to 0.25% of the average daily net assets of the Series II shares may be paid to insurance companies who furnish continuing personal shareholder services to customers who purchase and own Series II shares of the Fund. For the six months ended June 30, 2019, expenses incurred under the Plan are detailed in the Statement of Operations asDistribution fees.
Invesco V.I. Core Equity Fund
For the six-month period ended June 30, 2019, the Fund incurred $964 in brokerage commissions with Invesco Capital Markets, Inc., an affiliate of the Adviser and IDI, for portfolio transactions executed on behalf of the Fund.
Certain officers and trustees of the Trust are officers and directors of the Adviser, IIS and/or IDI.
NOTE 3—Additional Valuation Information
GAAP defines fair value as the price that would be received to sell an asset or paid to transfer a liability in an orderly transaction between market participants at the measurement date, under current market conditions. GAAP establishes a hierarchy that prioritizes the inputs to valuation methods, giving the highest priority to readily available unadjusted quoted prices in an active market for identical assets (Level 1) and the lowest priority to significant unobservable inputs (Level 3), generally when market prices are not readily available or are unreliable. Based on the valuation inputs, the securities or other investments are tiered into one of three levels. Changes in valuation methods may result in transfers in or out of an investment’s assigned level:
Level 1 – Prices are determined using quoted prices in an active market for identical assets.
Level 2 – Prices are determined using other significant observable inputs. Observable inputs are inputs that other market participants may use in pricing a security. These may include quoted prices for similar securities, interest rates, prepayment speeds, credit risk, yield curves, loss severities, default rates, discount rates, volatilities and others.
Level 3 – Prices are determined using significant unobservable inputs. In situations where quoted prices or observable inputs are unavailable (for example, when there is little or no market activity for an investment at the end of the period), unobservable inputs may be used. Unobservable inputs reflect the Fund’s own assumptions about the factors market participants would use in determining fair value of the securities or instruments and would be based on the best available information.
The following is a summary of the tiered valuation input levels, as of June 30, 2019. The level assigned to the securities valuations may not be an indication of the risk or liquidity associated with investing in those securities. Because of the inherent uncertainties of valuation, the values reflected in the financial statements may materially differ from the value received upon actual sale of those investments.
| | Level 1 | Level 2 | Level 3 | Total |
| Investments in Securities | | | | |
| Common Stocks & Other Equity Interests | $799,253,005 | $28,418,526 | $— | $827,671,531 |
| Money Market Funds | 22,001,698 | — | — | 22,001,698 |
| Total Investments | $821,254,703 | $28,418,526 | $— | $849,673,229 |
NOTE 4—Security Transactions with Affiliated Funds
The Fund is permitted to purchase or sell securities from or to certain other Invesco Funds under specified conditions outlined in procedures adopted by the Board of Trustees of the Trust. The procedures have been designed to ensure that any purchase or sale of securities by the Fund from or to another fund or portfolio that is or could be considered an affiliate by virtue of having a common investment adviser (or affiliated investment advisers), common Trustees and/or common officers complies with Rule 17a-7 of the 1940 Act. Further, as defined under the procedures, each transaction is effected at the current market price. Pursuant to these procedures, for the six months ended June 30, 2019, the Fund engaged in securities purchases of $28,314,302 and securities sales of $4,109,204, which resulted in net realized gains (losses) of $(86,403).
NOTE 5—Trustees’ and Officers’ Fees and Benefits
Trustees’ and Officers’ Fees and Benefits include amounts accrued by the Fund to pay remuneration to certain Trustees and Officers of the Fund. Trustees have the option to defer compensation payable by the Fund, and Trustees’ and Officers’ Fees and Benefits also include amounts accrued by the Fund to fund such deferred compensation amounts. Those Trustees who defer compensation have the option to select various Invesco Funds in which their deferral accounts shall be deemed to be invested. Finally, certain current Trustees were eligible to participate in a retirement plan that provided for benefits to be paid upon retirement to Trustees over a period of time based on the number of years of service. The Fund may have certain former Trustees who also participate in a retirement plan and receive benefits under such plan.Trustees’ and Officers’ Fees and Benefits include amounts accrued by the Fund to fund such retirement benefits. Obligations under the deferred compensation and retirement plans represent unsecured claims against the general assets of the Fund.
NOTE 6—Cash Balances
The Fund is permitted to temporarily carry a negative or overdrawn balance in its account with State Street Bank and Trust Company, the custodian bank. Such balances, if any at period-end, are shown in the Statement of Assets and Liabilities under the payable caption Amount due custodian. To compensate the custodian bank for such overdrafts, the overdrawn Fund may either (1) leave funds as a compensating balance in the account so the custodian bank can be compensated by earning the additional interest; or (2) compensate by paying the custodian bank at a rate agreed upon by the custodian bank and Invesco, not to exceed the contractually agreed upon rate.
NOTE 7—Tax Information
The amount and character of income and gains to be distributed are determined in accordance with income tax regulations, which may differ from GAAP. Reclassifications are made to the Fund’s capital accounts to reflect income and gains available for distribution (or available capital loss carryforward) under income tax regulations. The tax character of distributions paid during the year and the tax components of net assets will be reported at the Fund’s fiscal year-end.
Invesco V.I. Core Equity Fund
Capital loss carryforward is calculated and reported as of a specific date. Results of transactions and other activity after that date may affect the amount of capital loss carryforward actually available for the Fund to utilize. The ability to utilize capital loss carryforwards in the future may be limited under the Internal Revenue Code and related regulations based on the results of future transactions.
The Fund did not have a capital loss carryforward as of December 31, 2018.
NOTE 8—Investment Transactions
The aggregate amount of investment securities (other than short-term securities, U.S. Treasury obligations and money market funds, if any) purchased and sold by the Fund during the six months ended June 30, 2019 was $162,270,039 and $335,780,586, respectively. Cost of investments, including any derivatives, on a tax basis includes the adjustments for financial reporting purposes as of the most recently completed federal income tax reporting period-end.
| Unrealized Appreciation (Depreciation) of Investments on a Tax Basis |
| Aggregate unrealized appreciation of investments | $222,847,934 |
| Aggregate unrealized (depreciation) of investments | (17,551,858) |
| Net unrealized appreciation of investments | $205,296,076 |
Cost of investments for tax purposes is $644,377,153.
NOTE 9—Share Information
| | Summary of Share Activity |
| | Six months ended
June 30, 2019(a) | | Year ended
December 31, 2018 |
| | Shares | Amount | | Shares | Amount |
| Sold: | | | | | |
| Series I | 297,983 | $10,035,623 | | 1,686,758 | $61,083,116 |
| Series II | 26,625 | 915,511 | | 96,316 | 3,437,247 |
| Issued as reinvestment of dividends: | | | | | |
| Series I | — | — | | 2,005,181 | 72,928,448 |
| Series II | — | — | | 41,719 | 1,504,788 |
| Reacquired: | | | | | |
| Series I | (4,824,179) | (168,943,018) | | (4,659,767) | (169,247,245) |
| Series II | (76,211) | (2,651,143) | | (4,730,829) | (167,128,941) |
| Net increase (decrease) in share activity | (4,575,782) | $(160,643,027) | | (5,560,622) | $(197,422,587) |
| (a) | There are entities that are record owners of more than 5% of the outstanding shares of the Fund and in the aggregate own 56% of the outstanding shares of the Fund. The Fund and the Fund’s principal underwriter or adviser, are parties to participation agreements with these entities whereby these entities sell units of interest in separate accounts funding variable products that are invested in the Fund. The Fund, Invesco and/or Invesco affiliates may make payments to these entities, which are considered to be related to the Fund, for providing services to the Fund, Invesco and/or Invesco affiliates including but not limited to services such as, securities brokerage, third party record keeping and account servicing and administrative services. The Fund has no knowledge as to whether all or any portion of the shares owned of record by these entities are also owned beneficially. |
Invesco V.I. Core Equity Fund
Calculating your ongoing Fund expenses
Example
As a shareholder of the Fund, you incur ongoing costs, including management fees; distribution and/or service fees (12b-1); and other Fund expenses. This example is intended to help you understand your ongoing costs (in dollars) of investing in the Fund and to compare these costs with ongoing costs of investing in other mutual funds. The example is based on an investment of $1,000 invested at the beginning of the period and held for the entire period January 1, 2019 through June 30, 2019.
The actual and hypothetical expenses in the examples below do not represent the effect of any fees or other expenses assessed in connection with a variable product; if they did, the expenses shown would be higher while the ending account values shown would be lower.
Actual expenses
The table below provides information about actual account values and actual expenses. You may use the information in this table, together with the amount you invested, to estimate the expenses that you paid over the period. Simply divide your account value by $1,000 (for example, an $8,600 account value divided by $1,000 = 8.6), then multiply the result by the number in the table under the heading entitled “Actual Expenses Paid During Period” to estimate the expenses you paid on your account during this period.
Hypothetical example for comparison purposes
The table below also provides information about hypothetical account values and hypothetical expenses based on the Fund’s actual expense ratio and an assumed rate of return of 5% per year before expenses, which is not the Fund’s actual return.
The hypothetical account values and expenses may not be used to estimate the actual ending account balance or expenses you paid for the period. You may use this information to compare the ongoing costs of investing in the Fund and other funds. To do so, compare this 5% hypothetical example with the 5% hypothetical examples that appear in the shareholder reports of the other funds.
Please note that the expenses shown in the table are meant to highlight your ongoing costs. Therefore, the hypothetical information is useful in comparing ongoing costs, and will not help you determine the relative total costs of owning different funds.
| | Beginning
Account Value (01/01/19) | ACTUAL | HYPOTHETICAL
(5% annual return before
expenses) | Annualized
Expense
Ratio |
Ending
Account Value
(06/30/19)1 | Expenses
Paid During
Period2 | Ending
Account Value
(06/30/19) | Expenses
Paid During
Period2 |
| Series I | $1,000.00 | $1,177.10 | $4.21 | $1,020.93 | $3.91 | 0.78% |
| Series II | 1,000.00 | 1,175.80 | 5.56 | 1,019.69 | 5.16 | 1.03 |
| 1 | The actual ending account value is based on the actual total return of the Fund for the period January 1, 2019 through June 30, 2019, after actual expenses and will differ from the hypothetical ending account value which is based on the Fund’s expense ratio and a hypothetical annual return of 5% before expenses. |
| 2 | Expenses are equal to the Fund’s annualized expense ratio as indicated above multiplied by the average account value over the period, multiplied by 181/365 to reflect the most recent fiscal half year. |
Invesco V.I. Core Equity Fund
Approval of Investment Advisory andSub-Advisory Contracts
At meetings held on June 10, 2019, the Board of Trustees (the Board or the Trustees) of AIM Variable Insurance Funds (Invesco Variable Insurance Funds) as a whole, and the independent Trustees, who comprise over 75% of the Board, voting separately, approved the continuance of the Invesco V.I. Core Equity Fund’s (the Fund) Master Investment Advisory Agreement with Invesco Advisers, Inc. (Invesco Advisers and the investment advisory agreement) and the Master IntergroupSub-Advisory Contract for Mutual Funds with Invesco Asset Management Deutschland GmbH, Invesco Asset Management Limited, Invesco Asset Management (Japan) Limited, Invesco Hong Kong Limited, Invesco Senior Secured Management, Inc. and Invesco Canada Ltd. and separatesub-advisory contracts with Invesco Capital Management LLC and Invesco Asset Management (India) Private Limited (collectively, the AffiliatedSub-Advisers and thesub-advisory contracts) for another year, effective July 1, 2019. After evaluating the factors discussed below, among others, the Board approved the renewal of the Fund’s investment advisory agreement and thesub-advisory contracts and determined that the compensation payable by the Fund to Invesco Advisers and by Invesco Advisers to the AffiliatedSub-Advisers is fair and reasonable.
The Board’s Evaluation Process
The Board’s Investments Committee has established threeSub-Committees, which meet throughout the year to review the performance of funds advised by Invesco Advisers (the Invesco Funds). As part of a regularly scheduled basis ofin-person Board meetings, theSub-Committees meet with portfolio managers for their assigned Invesco Funds and other members of management to review detailed information about investment performance and portfolio attributes of these funds. The Board took into account evaluations and reports that it received from the Investments Committee andSub-Committees, as well as the information provided to such committees and the Board throughout the year, in considering whether to approve each Invesco Fund’s investment advisory agreement andsub-advisory contracts.
As part of the contract renewal process, the Board reviews and considers information provided in response to detailed requests for information submitted to management by the independent Trustees with assistance from legal counsel to the independent Trustees. The Board receives comparative investment performance and fee data regarding the Invesco Funds prepared by Invesco Advisers and Broadridge Financial Solutions, Inc. (Broadridge), an independent mutual fund data provider. The Board also receives an independent written evaluation from the Senior Officer, an officer of the Invesco Funds who reports directly to the
independent Trustees. The Senior Officer’s evaluation is prepared as part of his responsibility to manage the process by which the Invesco Funds’ proposed management fees are negotiated during the annual contract renewal process to ensure they are negotiated in a manner that is at arms’ length and reasonable. In addition to meetings with Invesco Advisers and fund counsel throughout the year, the independent Trustees also discuss the continuance of the investment advisory agreement andsub-advisory contracts in separate sessions with the Senior Officer and with independent legal counsel.
The discussion below is a summary of the Senior Officer’s independent written evaluation with respect to the Fund’s investment advisory agreement, as well as a discussion of the material factors and related conclusions that formed the basis for the Board’s approval of the Fund’s investment advisory agreement andsub-advisory contracts. The Trustees’ review and conclusions are based on the comprehensive consideration of all information presented to them during the course of the year and in prior years and are not the result of any single determinative factor. Moreover, one Trustee may have weighed a particular piece of information or factor differently than another Trustee. This information is current as of June 10, 2019.
Factors and Conclusions and Summary of Independent Written Fee Evaluation
| A. | Nature, Extent and Quality of Services Provided by Invesco Advisers and the AffiliatedSub-Advisers |
The Board reviewed the nature, extent and quality of the advisory services provided to the Fund by Invesco Advisers under the Fund’s investment advisory agreement, and the credentials and experience of the officers and employees of Invesco Advisers who provide these services, including the Fund’s portfolio manager(s). The Board’s review included consideration of Invesco Advisers’ investment process oversight and structure, credit analysis and investment risk management. The Board also considerednon-advisory services that Invesco Advisers and its affiliates provide to the Invesco Funds such as various back office support functions, third party oversight, internal audit, valuation, portfolio trading and legal and compliance. The Board also received and reviewed information about Invesco Advisers’ role as administrator of the Invesco Funds’ liquidity risk management program. The Board also reviewed and considered the benefits to shareholders of investing in a fund that is part of the Invesco family of funds under the umbrella of Invesco Ltd., Invesco Advisers’ parent company, and noted Invesco Ltd.’s depth and experience in conducting an investment management business, as well as its
commitment of financial and other resources to such business. The Board reviewed and considered information about the resources that Invesco Advisers intends to continue to commit to managing the Invesco family of funds following Invesco Ltd.’s acquisition of OppenheimerFunds, Inc. and its subsidiaries. The Board concluded that the nature, extent and quality of the services provided to the Fund by Invesco Advisers are appropriate and satisfactory.
The Board reviewed the services that may be provided by the AffiliatedSub-Advisers under thesub-advisory contracts and the credentials and experience of the officers and employees of the AffiliatedSub-Advisers who provide these services. The Board noted the AffiliatedSub-Advisers’ expertise with respect to certain asset classes and that the AffiliatedSub-Advisers have offices and personnel that are located in financial centers around the world. As a result, the Board noted that the AffiliatedSub-Advisers can provide research and investment analysis on the markets and economies of various countries in which the Fund may invest, make recommendations regarding securities and assist with security trades. The Board concluded that thesub-advisory contracts may benefit the Fund and its shareholders by permitting Invesco Advisers to use the resources and talents of the AffiliatedSub-Advisers in managing the Fund. The Board concluded that the nature, extent and quality of the services that may be provided by the AffiliatedSub-Advisers are appropriate and satisfactory.
| B. | Fund Investment Performance |
The Board considered Fund investment performance as a relevant factor in considering whether to approve the investment advisory agreement. The Board did not view Fund investment performance as a relevant factor in considering whether to approve thesub-advisory contracts for the Fund, as no AffiliatedSub-Adviser currently manages assets of the Fund.
The Board compared the Fund’s investment performance over multiple time periods ending December 31, 2018 to the performance of funds in the Broadridge performance universe and against the Lipper Variable Underlying FundsLarge-Cap Core Funds Index. The Board noted that performance of Series I shares of the Fund was in the fifth quintile of its performance universe for the one, three and five year periods (the first quintile being the best performing funds and the fifth quintile being the worst performing funds). The Board noted that performance of Series I shares of the Fund was below the performance of the Index for the one, three and five year periods. The Board noted that the Fund’s high quality bias and underweight and overweight exposures to certain securities and sectors detracted from
Invesco V.I. Core Equity Fund
Fund performance. The Trustees also reviewed more recent Fund performance and this review did not change their conclusions.
| C. | Advisory and Sub-Advisory Fees and Fund Expenses |
The Board compared the Fund’s contractual management fee rate to the contractual management fee rates of funds in the Fund’s Broadridge expense group. The Board noted that the contractual management fee rate for Series I shares of the Fund was below the median contractual management fee rate of funds in its expense group. The Board noted that the term “contractual management fee” for funds in the expense group may include both advisory and certainnon-portfolio management administrative services fees, but that Broadridge does not provide information on a fund by fund basis as to what is included. The Board also reviewed the methodology used by Broadridge in providing expense group information, which includes using each fund’s contractual management fee schedule (including any applicable breakpoints) as reported in the most recent prospectus or statement of additional information for each fund in the expense group. The Board also considered comparative information regarding the Fund’s total expense ratio and its various components.
The Board noted that Invesco Advisers has contractually agreed to waive fees and/or limit expenses of the Fund for the term disclosed in the Fund’s registration statement in an amount necessary to limit total annual operating expenses to a specified percentage of average daily net assets for each class of the Fund.
The Board also considered the fees charged by Invesco Advisers and the AffiliatedSub-Advisers to other similarly managed client accounts. The Board noted that Invesco Advisers or the AffiliatedSub-Advisers may charge lower fees to large institutional clients. Invesco Advisers reviewed with the Board differences in the scope of services it provides to the Invesco Funds relative to certain other types of client accounts, including management of cash flows as a result of redemptions and purchases, necessary infrastructure such as officers, office space, technology, legal and distribution, oversight of service providers, costs and business risks associated with launching new funds and sponsoring and maintaining the product line, preparation of annual registration statement updates and financial information and compliance with federal and state laws and regulations.
The Board also considered the services that may be provided by the AffiliatedSub-Advisers pursuant to thesub-advisory contracts, as well as the fees payable by Invesco Advisers to the AffiliatedSub-Advisers pursuant to thesub-advisory contracts.
| D. | Economies of Scale and Breakpoints |
The Board considered the extent to which there may be economies of scale in the provision of advisory services to the Fund. The Board considered Invesco’s reinvestment in its
business, including investments in business infrastructure and cybersecurity. The Board also considered that the Fund benefits from economies of scale through contractual breakpoints in the Fund’s advisory fee schedule, which generally operate to reduce the Fund’s expense ratio as it grows in size. The Board noted that the Fund shares directly in economies of scale through lower fees charged by third party service providers based on the combined size of the Invesco Funds. The Board noted that the Fund may also benefit from economies of scale through initial fee setting, fee waivers and expense reimbursements.
| E. | Profitability and Financial Resources |
The Board reviewed information from Invesco Advisers concerning the costs of the advisory and other services that Invesco Advisers and its affiliates provide to the Fund and the Invesco Funds and the profitability of Invesco Advisers and its affiliates in providing these services. The Board considered the methodology used for calculating profitability and noted the periodic review of such methodology by an independent consultant. The Board noted that Invesco Advisers continues to operate at a net profit from services Invesco Advisers and its affiliates provide to the Invesco Funds and the Fund. The Board did not deem the level of profits realized by Invesco Advisers and its affiliates from providing services to the Fund to be excessive given the nature, extent and quality of the services provided. The Board received information from Invesco Advisers demonstrating that Invesco Advisers and the AffiliatedSub-Advisers are financially sound and have the resources necessary to perform their obligations under the investment advisory agreement andsub-advisory contracts.
| F. | Collateral Benefits to Invesco Advisers and its Affiliates |
The Board considered various other benefits received by Invesco Advisers and its affiliates from the relationship with the Fund, including the fees received for providing administrative, transfer agency and distribution services to the Fund. The Board considered comparative information regarding fees charged for these services, including information provided by Broadridge and other independent sources. The Board considered the performance of Invesco Advisers and its affiliates in providing these services and the organizational structure employed to provide these services. The Board also considered that these services are provided to the Fund pursuant to written contracts that are reviewed and approved on an annual basis by the Board; and that the services are required for the operation of the Fund.
The Board considered the benefits realized by Invesco Advisers and the AffiliatedSub-Advisers as a result of portfolio brokerage transactions executed through “soft dollar” arrangements. The Board noted that soft dollar arrangements may result in the Fund bearing costs to purchase research that may be used by Invesco Advisers or the AffiliatedSub-Advisers with other clients and may reduce Invesco Advisers’
or the AffiliatedSub-Advisers’ expenses. The Board also considered that it receives periodic reports from Invesco representing that these arrangements are consistent with regulatory requirements. The Board did not deem the soft dollar arrangements to be inappropriate.
The Board considered that the Fund’s uninvested cash and cash collateral from any securities lending arrangements may be invested in money market funds advised by Invesco Advisers pursuant to procedures approved by the Board. The Board considered information regarding the returns of the affiliated money market funds relative to comparable overnight investments, as well as the costs to the Fund of such investments. The Board noted that Invesco Advisers receives advisory fees from these affiliated money market funds attributable to such investments, although Invesco Advisers has contractually agreed to waive through varying periods the advisory fees payable by the Invesco Funds with respect to certain investments in the affiliated money market funds. The waiver is in an amount equal to 100% of the net advisory fee Invesco Advisers receives from the affiliated money market funds with respect to the Fund’s investment in the affiliated money market funds of uninvested cash, but not cash collateral. The Board concluded that the amount of advisory fees received by Invesco Advisers from the Fund’s investment of cash collateral from any securities lending arrangements in the affiliated money market funds is fair and reasonable.
The Board also considered that an affiliated broker may receive commissions for executing certain trades for the Fund. Invesco Advisers and the AffiliatedSub-Advisers may use the affiliated broker to, among other things, control order routing and minimize information leakage, and the Board was advised that such trades are executed in compliance with rules under the federal securities laws and consistent with best execution obligations.
Invesco V.I. Core Equity Fund
| Semiannual Report to Shareholders | June 30, 2019 |
Invesco V.I. Core Plus Bond Fund
Beginning on January 1, 2021, as permitted by regulations adopted by the Securities and Exchange Commission, the insurance company that offers your variable annuity or variable life insurance contract may no longer send you paper copies of the Fund’s shareholder reports by mail, unless you specifically request paper copies of the reports from the insurance company or your financial intermediary. Instead of delivering paper copies of the report, the insurance company may choose to make the reports available on a website, and will notify you by mail each time a report is posted and provide you with a website link to access the report. Instructions for requesting paper copies will be provided by your insurance company.
If the insurance company offers electronic delivery, you may elect to receive shareholder reports and other communications about the Fund electronically by following the instructions provided by the insurance company or by contacting your financial intermediary. If you already elected to receive shareholder reports electronically, you will not be affected by this change and you need not take any action.
You may elect to receive all future reports in paper free of charge from the insurance company. You can inform the insurance company or your financial intermediary that you wish to continue receiving paper copies of your shareholder reports by following the instructions provided by the insurance company or by contacting your financial intermediary. Your election to receive reports in paper will apply to all portfolio companies available under your contract with the insurance company.
The Fund provides a complete list of its holdings four times in each fiscal year, at the quarter-ends. For the second and fourth quarters, the lists appear in the Fund’s semiannual and annual reports to shareholders. For the first and third quarters, the Fund files the lists with the Securities and Exchange Commission (SEC) on Form N-Q (or any successor Form). The Fund’s Form N-Q (or any successor Form) filings are available on the SEC website, sec.gov. The SEC file numbers for the Fund are 811-07452 and 033-57340. The Fund’s most recent portfolio holdings, as filed on Form N-Q (or any successor Form), have also been made available to insurance companies issuing variable annuity contracts and variable life insurance policies (“variable products”) that invest in the Fund.
A description of the policies and procedures that the Fund uses to determine how to vote proxies relating to portfolio securities is available without charge, upon request, from our Client Services department at 800 959 4246 or at invesco.com/proxyguidelines. The information is also available on the SEC website, sec.gov.
Information regarding how the Fund voted proxies related to its portfolio securities during the most recent 12-month period ended June 30 is available at invesco.com/proxysearch. The information is also available on the SEC website, sec.gov.
Invesco Advisers, Inc. is an investment adviser; it provides investment advisory services to individual and institutional clients and does not sell securities. Invesco Distributors, Inc. is the US distributor for Invesco Ltd.’s retail mutual funds, exchange-traded funds and institutional money market funds. Both are wholly owned, indirect subsidiaries of Invesco Ltd.
This report must be accompanied or preceded by a currently effective Fund prospectus and variable product prospectus, which contain more complete information, including sales charges and expenses. Investors should read each carefully before investing.
NOT FDIC INSURED | MAY LOSE VALUE | NO BANK GUARANTEE
| Invesco Distributors, Inc. | VICPB-SAR-1 |
Performance summary
Fund vs. Indexes
Cumulative total returns, December 31, 2018 to June 30, 2019, excluding variable product issuer charges. If variable product issuer charges were included, returns would be lower.
| Series I Shares | 7.83% |
| Series II Shares | 7.71 |
| Bloomberg Barclays U.S. Aggregate Bond Index▼ (Broad Market/Style-Specific Index) | 6.11 |
Lipper VUF Core Plus Bond Funds Index■
(Peer Group Index) | 6.77 |
| Source(s):▼FactSet Research Systems Inc.;■ Lipper Inc. |
The Bloomberg Barclays U.S. Aggregate Bond Index is an unmanaged index considered representative of the US investment grade, fixed-rate bond market.
TheLipper VUF Core Plus Bond Funds Index is an unmanaged index considered representative of core plus bond variable insurance underlying funds tracked by Lipper.
The Fund is not managed to track the performance of any particular index, including the indexes described here, and consequently, the performance of the Fund may deviate significantly from the performance of the indexes.
A direct investment cannot be made in an index. Unless otherwise indicated, index results include reinvested dividends, and they do not reflect sales charges. Performance of the peer group, if applicable, reflects fund expenses; performance of a market index does not.
| Average Annual Total Returns |
| As of 6/30/19 | |
| Series I Shares | |
| Inception (5/5/93) | 4.40% |
| 10 Years | 6.24 |
| 5 Years | 3.78 |
| 1 Year | 7.99 |
| Series II Shares | |
| Inception (3/14/02) | 3.97% |
| 10 Years | 5.96 |
| 5 Years | 3.49 |
| 1 Year | 7.75 |
The performance of the Fund’s Series I and Series II share classes will differ primarily due to different class expenses.
The performance data quoted represent past performance and cannot guarantee comparable future results; current performance may be lower or higher. Please contact your variable product issuer or financial adviser for the most recent month-end variable product performance. Performance figures reflect Fund expenses, reinvested distributions and changes in net asset value. Performance figures do not reflect deduction of taxes a shareholder would pay on Fund distributions or sale of Fund shares. Investment return and principal value will fluctuate so that you may have a gain or loss when you sell shares.
The net annual Fund operating expense ratio set forth in the most recent Fund prospectus as of the date of this report for Series I and Series II shares was 0.62% and 0.87%, respectively.1,2The total annual Fund operat-
ing expense ratio set forth in the most recent Fund prospectus as of the date of this report for Series I and Series II shares was 1.54% and 1.79%, respectively. The expense ratios presented above may vary from the expense ratios presented in other sections of this report that are based on expenses incurred during the period covered by this report.
Invesco V.I. Core Plus Bond Fund, a series portfolio of AIM Variable Insurance Funds (Invesco Variable Insurance Funds), is currently offered through insurance companies issuing variable products. You cannot purchase shares of the Fund directly. Performance figures given represent the Fund and are not intended to reflect actual variable product values. They do not reflect sales charges, expenses and fees assessed in connection with a variable product. Sales charges, expenses and fees, which are determined by the variable product issuers, will vary and will lower the total return.
The most recent month-end performance at the Fund level, excluding variable product charges, is available at 800 451 4246. As mentioned above, for the most recent month-end performance including variable product charges, please contact your variable product issuer or financial adviser.
Fund performance reflects any applicable fee waivers and/or expense reimbursements. Had the adviser not waived fees and/or reimbursed expenses currently or in the past, returns would have been lower. See current prospectus for more information.
| 1 | Total annual Fund operating expenses after any contractual fee waivers and/or expense reimbursements by the adviser in effect through at least April 30, 2020. See current prospectus for more information. |
| 2 | Total annual Fund operating expenses after any contractual fee waivers and/or expense reimbursements by the adviser in effect through at least June 30, 2021. See current prospectus for more information. |
Invesco V.I. Core Plus Bond Fund
Schedule of Investments(a)
June 30, 2019
(Unaudited)
| | Principal
Amount | Value |
| U.S. Dollar Denominated Bonds & Notes–44.09% |
| Aerospace & Defense–0.04% |
| Moog, Inc., 5.25%, 12/01/2022(b) | | $2,000 | $2,040 |
| TransDigm, Inc., | | |
| 6.50%, 07/15/2024 | | 2,000 | 2,032 |
| 6.38%, 06/15/2026 | | 3,000 | 3,049 |
| Triumph Group, Inc., 7.75%, 08/15/2025 | | 2,000 | 1,940 |
| | | | 9,061 |
| Agricultural & Farm Machinery–0.02% |
| Titan International, Inc., 6.50%, 11/30/2023 | | 5,000 | 4,363 |
| Agricultural Products–0.22% |
| Cargill, Inc., 3.25%, 05/23/2029(b) | | 46,000 | 47,762 |
| Air Freight & Logistics–0.01% |
| XPO Logistics, Inc., 6.50%, 06/15/2022(b) | | 2,000 | 2,045 |
| Airlines–2.41% |
| American Airlines Group, Inc., 5.00%, 06/01/2022(b) | | 18,000 | 18,568 |
| American Airlines Pass Through Trust, | | |
| Series 2016-1, Class AA, 3.58%, 01/15/2028 | | 28,180 | 29,284 |
| Series 2016-3, Class B, 3.75%, 10/15/2025 | | 30,360 | 30,592 |
| Series 2017-1, Class B, 4.95%, 02/15/2025 | | 29,961 | 31,385 |
| Series 2017-2, Class A, 3.60%, 10/15/2029 | | 43,510 | 43,634 |
| Series 2017-2, Class B, 3.70%, 10/15/2025 | | 32,360 | 32,263 |
| Delta Air Lines Pass Through Trust, 2019-1 Class A, 3.40%, 04/25/2024 | | 10,000 | 10,381 |
| Delta Air Lines, Inc., | | |
| 2.88%, 03/13/2020 | | 27,000 | 27,037 |
| 3.63%, 03/15/2022 | | 45,000 | 45,782 |
| 3.80%, 04/19/2023 | | 24,000 | 24,650 |
| LATAM Airlines Group S.A. Pass Through Trust (Chile), Series 2015-1, Class A, 4.20%, 11/15/2027 | | 94,971 | 96,366 |
| United Airlines Pass Through Trust, | | |
| Series 2014-2, Class B, 4.63%, 09/03/2022 | | 33,627 | 34,646 |
| Series 2018-1, Class A, 3.70%, 03/01/2030 | | 45,199 | 45,819 |
| Series 2018-1, Class AA, 3.50%, 03/01/2030 | | 56,990 | 58,310 |
| US Airways Pass Through Trust, Series 2012-1, Class B, 8.00%, 04/01/2021 | | 644 | 650 |
| | | | 529,367 |
| | Principal
Amount | Value |
| Alternative Carriers–0.05% |
| CenturyLink, Inc., | | |
| Series S, 6.45%, 06/15/2021 | | $2,000 | $2,120 |
| Series Y, 7.50%, 04/01/2024 | | 1,000 | 1,109 |
| Level 3 Financing, Inc., | | |
| 5.38%, 05/01/2025 | | 5,000 | 5,175 |
| 5.25%, 03/15/2026 | | 2,000 | 2,075 |
| | | | 10,479 |
| Apparel Retail–0.03% |
| L Brands, Inc., | | |
| 5.63%, 02/15/2022 | | 2,000 | 2,098 |
| 6.88%, 11/01/2035 | | 2,000 | 1,789 |
| Michaels Stores, Inc., 8.00%, 07/15/2027(b) | | 2,000 | 1,998 |
| | | | 5,885 |
| Apparel, Accessories & Luxury Goods–0.01% |
| Hanesbrands, Inc., 4.88%, 05/15/2026(b) | | 3,000 | 3,127 |
| Asset Management & Custody Banks–0.01% |
| Prime Security Services Borrower LLC/Prime Finance, Inc., 9.25%, 05/15/2023(b) | | 2,000 | 2,104 |
| Auto Parts & Equipment–0.03% |
| Dana, Inc., 5.50%, 12/15/2024 | | 3,000 | 3,090 |
| Delphi Technologies PLC, 5.00%, 10/01/2025(b) | | 1,000 | 893 |
| Flexi-Van Leasing, Inc., 10.00%, 02/15/2023(b) | | 4,000 | 3,730 |
| | | | 7,713 |
| Automobile Manufacturers–0.48% |
| American Honda Finance Corp., 2.40%, 06/27/2024 | | 31,000 | 30,965 |
| Hyundai Capital America, 4.30%, 02/01/2024(b) | | 68,000 | 71,148 |
| J.B. Poindexter & Co., Inc., 7.13%, 04/15/2026(b) | | 4,000 | 4,100 |
| | | | 106,213 |
| Automotive Retail–0.04% |
| Lithia Motors, Inc., 5.25%, 08/01/2025(b) | | 2,000 | 2,068 |
| Murphy Oil USA, Inc., 5.63%, 05/01/2027 | | 2,000 | 2,090 |
| Penske Automotive Group, Inc., 5.50%, 05/15/2026 | | 4,000 | 4,185 |
| | | | 8,343 |
| Brewers–0.23% |
| Anheuser-Busch InBev Worldwide, Inc. (Belgium), 4.75%, 01/23/2029 | | 45,000 | 51,015 |
See accompanying Notes to Financial Statements which are an integral part of the financial statements.
Invesco V.I. Core Plus Bond Fund
| | Principal
Amount | Value |
| Broadcasting–0.03% |
| Gray Television, Inc., 7.00%, 05/15/2027(b) | | $2,000 | $2,175 |
| Nexstar Broadcasting, Inc., 5.63%, 08/01/2024(b) | | 2,000 | 2,077 |
| Tribune Media Co., 5.88%, 07/15/2022 | | 3,000 | 3,067 |
| | | | 7,319 |
| Building Products–0.03% |
| Standard Industries, Inc., | | |
| 6.00%, 10/15/2025(b) | | 3,000 | 3,199 |
| 5.00%, 02/15/2027(b) | | 3,000 | 3,045 |
| | | | 6,244 |
| Cable & Satellite–0.91% |
| CCO Holdings LLC/CCO Holdings Capital Corp., | | |
| 5.75%, 09/01/2023 | | 2,000 | 2,049 |
| 5.75%, 02/15/2026(b) | | 11,000 | 11,564 |
| Charter Communications Operating, LLC/Charter Communications Operating Capital Corp., 5.38%, 04/01/2038 | | 25,000 | 26,792 |
| Comcast Corp., | | |
| 3.95%, 10/15/2025 | | 20,000 | 21,582 |
| 4.60%, 10/15/2038 | | 30,000 | 34,378 |
| 4.95%, 10/15/2058 | | 31,000 | 37,836 |
| CSC Holdings, LLC, 6.75%, 11/15/2021 | | 5,000 | 5,363 |
| Discovery Communications LLC, 5.20%, 09/20/2047 | | 15,000 | 15,841 |
| DISH DBS Corp., 5.88%, 11/15/2024 | | 8,000 | 7,600 |
| Hughes Satellite Systems Corp., | | |
| 7.63%, 06/15/2021 | | 5,000 | 5,362 |
| 5.25%, 08/01/2026 | | 2,000 | 2,063 |
| Sirius XM Radio, Inc., | | |
| 6.00%, 07/15/2024(b) | | 2,000 | 2,063 |
| 4.63%, 07/15/2024(b) | | 28,000 | 28,722 |
| | | | 201,215 |
| Casinos & Gaming–0.07% |
| Boyd Gaming Corp., | | |
| 6.88%, 05/15/2023 | | 3,000 | 3,109 |
| 6.00%, 08/15/2026 | | 2,000 | 2,110 |
| MGM Resorts International, 7.75%, 03/15/2022 | | 5,000 | 5,587 |
| Scientific Games International, Inc., 10.00%, 12/01/2022 | | 2,000 | 2,105 |
| Wynn Las Vegas LLC/Wynn Las Vegas Capital Corp., 5.50%, 03/01/2025(b) | | 2,000 | 2,071 |
| | | | 14,982 |
| Coal & Consumable Fuels–0.03% |
| SunCoke Energy Partners L.P./SunCoke Energy Partners Finance Corp., 7.50%, 06/15/2025(b) | | 6,000 | 5,880 |
| Commodity Chemicals–0.01% |
| Nufarm Australia Ltd./Nufarm Americas, Inc. (Australia), 5.75%, 04/30/2026(b) | | 2,000 | 1,910 |
| | Principal
Amount | Value |
| Communications Equipment–0.03% |
| CommScope Technologies LLC, 6.00%, 06/15/2025(b) | | $6,000 | $5,653 |
| Construction & Engineering–0.02% |
| William Lyon Homes, Inc., | | |
| 6.00%, 09/01/2023 | | 2,000 | 2,040 |
| 6.63%, 07/15/2027(b) | | 2,000 | 2,000 |
| | | | 4,040 |
| Consumer Finance–0.20% |
| Ally Financial, Inc., | | |
| 8.00%, 03/15/2020 | | 2,000 | 2,073 |
| 5.13%, 09/30/2024 | | 3,000 | 3,247 |
| 4.63%, 03/30/2025 | | 2,000 | 2,117 |
| Credit Acceptance Corp., 6.63%, 03/15/2026(b) | | 23,000 | 24,236 |
| Navient Corp., | | |
| 8.00%, 03/25/2020 | | 2,000 | 2,075 |
| 7.25%, 01/25/2022 | | 2,000 | 2,165 |
| 7.25%, 09/25/2023 | | 7,000 | 7,499 |
| | | | 43,412 |
| Copper–0.15% |
| Freeport-McMoRan, Inc., 5.40%, 11/14/2034 | | 9,000 | 8,617 |
| Southern Copper Corp. (Peru), 5.88%, 04/23/2045 | | 18,000 | 21,254 |
| Taseko Mines Ltd. (Canada), 8.75%, 06/15/2022(b) | | 3,000 | 2,903 |
| | | | 32,774 |
| Data Processing & Outsourced Services–0.37% |
| First Data Corp., 5.75%, 01/15/2024(b) | | 6,000 | 6,180 |
| Fiserv, Inc., 4.40%, 07/01/2049 | | 30,000 | 31,538 |
| Mastercard, Inc., 2.95%, 06/01/2029 | | 42,000 | 43,397 |
| | | | 81,115 |
| Distillers & Vintners–0.10% |
| Constellation Brands, Inc., 3.22% (3 mo. USD LIBOR + 0.70%), 11/15/2021(c) | | 22,000 | 22,012 |
| Diversified Banks–5.22% |
| Bank of America Corp., | | |
| Series FF, 5.88%(d) | | 20,000 | 20,894 |
| Series Z, 6.50%(d) | | 85,000 | 94,272 |
| BBVA Bancomer S.A. (Mexico), 6.75%, 09/30/2022(b) | | 150,000 | 163,620 |
| BNP Paribas S.A. (France), 4.38%, 03/01/2033(b)(c) | | 58,000 | 59,774 |
| Citigroup, Inc., | | |
| 2.88%, 07/24/2023(c) | | 20,000 | 20,257 |
| 3.67%, 07/24/2028(c) | | 75,000 | 78,298 |
| Series Q, 5.95%(d) | | 25,000 | 25,713 |
| Series T, 6.25%(d) | | 30,000 | 32,974 |
| Corp. Andina de Fomento (Supranational), 4.38%, 06/15/2022 | | 50,000 | 52,736 |
See accompanying Notes to Financial Statements which are an integral part of the financial statements.
Invesco V.I. Core Plus Bond Fund
| | Principal
Amount | Value |
| Diversified Banks–(continued) |
| HSBC Holdings PLC (United Kingdom), | | |
| 6.00%(d) | | $200,000 | $204,804 |
| 4.00%, 03/30/2022 | | 45,000 | 46,929 |
| JPMorgan Chase & Co., | | |
| 2.30%, 08/15/2021 | | 65,000 | 65,005 |
| 3.48%, (3 mo. USD LIBOR + 0.89%), 07/23/2024(c) | | 65,000 | 65,237 |
| 3.63%, 12/01/2027 | | 35,000 | 36,083 |
| 3.78%, 02/01/2028(c) | | 35,000 | 37,117 |
| Series I, 6.05% (3 mo. USD LIBOR + 3.47%)(d) | | 50,000 | 49,967 |
| Series V, 5.64%(d) | | 40,000 | 39,922 |
| Series W, 3.52% (3 mo. USD LIBOR + 1.00%), 05/15/2047(c) | | 65,000 | 50,611 |
| Royal Bank of Scotland Group PLC (The) (United Kingdom), 6.00%, 12/19/2023 | | 5,000 | 5,447 |
| | | | 1,149,660 |
| Diversified Chemicals–2.38% |
| Chemours Co. (The), | | |
| 6.63%, 05/15/2023 | | 5,000 | 5,191 |
| 7.00%, 05/15/2025 | | 2,000 | 2,095 |
| Dow Chemical Co. (The), | | |
| 3.15%, 05/15/2024(b) | | 23,000 | 23,462 |
| 3.63%, 05/15/2026(b) | | 24,000 | 24,893 |
| 4.80%, 05/15/2049(b) | | 24,000 | 25,891 |
| Sasol Financing USA LLC (South Africa), | | |
| 5.88%, 03/27/2024 | | 200,000 | 216,776 |
| 6.50%, 09/27/2028 | | 200,000 | 224,574 |
| Trinseo Materials Operating S.C.A./Trinseo Materials Finance, Inc., 5.38%, 09/01/2025(b) | | 2,000 | 1,935 |
| | | | 524,817 |
| Diversified Metals & Mining–0.22% |
| Hudbay Minerals, Inc. (Canada), 7.63%, 01/15/2025(b) | | 4,000 | 4,150 |
| Teck Resources Ltd. (Canada), 6.13%, 10/01/2035 | | 38,000 | 43,320 |
| | | | 47,470 |
| Diversified REITs–2.00% |
| CyrusOne L.P./CyrusOne Finance Corp., 5.00%, 03/15/2024 | | 2,000 | 2,060 |
| STORE Capital Corp., 4.63%, 03/15/2029 | | 25,000 | 26,670 |
| Trust F/1401 (Mexico), | | |
| 5.25%, 01/30/2026(b) | | 200,000 | 210,352 |
| 4.87%, 01/15/2030(b) | | 200,000 | 201,700 |
| | | | 440,782 |
| Drug Retail–0.67% |
| CVS Pass Through Trust, 5.77%, 01/10/2033(b) | | 131,993 | 147,271 |
| | Principal
Amount | Value |
| Electric Utilities–0.28% |
| AEP Transmission Co., LLC., 3.80%, 06/15/2049 | | $13,000 | $13,438 |
| NextEra Energy Operating Partners L.P., 4.25%, 07/15/2024(b) | | 18,000 | 18,113 |
| Southern Co. (The), Series B, 5.50%, 03/15/2057(c) | | 29,000 | 29,724 |
| | | | 61,275 |
| Electronic Equipment & Instruments–0.03% |
| Itron, Inc., 5.00%, 01/15/2026(b) | | 6,000 | 6,150 |
| Environmental & Facilities Services–0.05% |
| Core & Main L.P., 6.13%, 08/15/2025(b) | | 5,000 | 5,075 |
| GFL Environmental, Inc. (Canada), 7.00%, 06/01/2026(b) | | 4,000 | 4,105 |
| Waste Pro USA, Inc., 5.50%, 02/15/2026(b) | | 2,000 | 2,055 |
| | | | 11,235 |
| Financial Exchanges & Data–1.41% |
| Moody’s Corp., | | |
| 5.50%, 09/01/2020 | | 110,000 | 113,904 |
| 4.88%, 02/15/2024 | | 138,000 | 151,558 |
| 5.25%, 07/15/2044 | | 35,000 | 41,546 |
| MSCI, Inc., 5.75%, 08/15/2025(b) | | 3,000 | 3,165 |
| | | | 310,173 |
| Food Distributors–0.02% |
| US Foods, Inc., 5.88%, 06/15/2024(b) | | 4,000 | 4,125 |
| Food Retail–0.03% |
| Albertsons Cos. LLC/Safeway, Inc./New Albertson’s, Inc./Albertson’s LLC, 6.63%, 06/15/2024 | | 6,000 | 6,248 |
| Forest Products–0.01% |
| Norbord, Inc. (Canada), 5.75%, 07/15/2027(b) | | 2,000 | 2,025 |
| Gas Utilities–0.05% |
| AmeriGas Partners, L.P./AmeriGas Finance Corp., | | |
| 5.63%, 05/20/2024 | | 4,000 | 4,280 |
| 5.88%, 08/20/2026 | | 2,000 | 2,130 |
| Ferrellgas L.P./Ferrellgas Finance Corp., | | |
| 6.50%, 05/01/2021 | | 2,000 | 1,825 |
| 6.75%, 06/15/2023 | | 2,000 | 1,765 |
| Suburban Propane Partners, L.P./Suburban Energy Finance Corp., 5.50%, 06/01/2024 | | 2,000 | 2,020 |
| | | | 12,020 |
| Health Care Equipment–0.18% |
| Hill-Rom Holdings, Inc., 5.00%, 02/15/2025(b) | | 2,000 | 2,070 |
See accompanying Notes to Financial Statements which are an integral part of the financial statements.
Invesco V.I. Core Plus Bond Fund
| | Principal
Amount | Value |
| Health Care Equipment–(continued) |
| Zimmer Biomet Holdings, Inc., 3.17% (3 mo. USD LIBOR + 0.75%), 03/19/2021(c) | | $38,000 | $37,972 |
| | | | 40,042 |
| Health Care Facilities–0.22% |
| Acadia Healthcare Co., Inc., 6.50%, 03/01/2024 | | 2,000 | 2,095 |
| HCA, Inc., | | |
| 5.88%, 02/15/2026 | | 10,000 | 11,075 |
| 5.38%, 09/01/2026 | | 2,000 | 2,160 |
| 4.13%, 06/15/2029 | | 25,000 | 25,632 |
| 5.50%, 06/15/2047 | | 4,000 | 4,275 |
| Tenet Healthcare Corp., | | |
| 8.13%, 04/01/2022 | | 2,000 | 2,108 |
| 6.75%, 06/15/2023 | | 2,000 | 2,015 |
| | | | 49,360 |
| Health Care REITs–0.64% |
| HCP, Inc., 4.00%, 12/01/2022 | | 71,000 | 74,339 |
| MPT Operating Partnership L.P./MPT Finance Corp., 5.00%, 10/15/2027 | | 4,000 | 4,130 |
| Physicians Realty L.P., 4.30%, 03/15/2027 | | 20,000 | 20,657 |
| Senior Housing Properties Trust, 6.75%, 12/15/2021 | | 40,000 | 42,385 |
| | | | 141,511 |
| Health Care Services–0.68% |
| AMN Healthcare, Inc., 5.13%, 10/01/2024(b) | | 2,000 | 2,045 |
| Cigna Corp., | | |
| 3.40%, 09/17/2021(b) | | 36,000 | 36,703 |
| 3.49%, (3 mo. USD LIBOR + 0.89%), 07/15/2023(b)(c) | | 43,000 | 42,993 |
| Cigna Holding Co., 4.50%, 03/15/2021 | | ��45,000 | 46,259 |
| Eagle Holding Co. II, LLC, 8.38% PIK Rate, 7.63% Cash Rate, 05/15/2022(b)(e) | | 2,000 | 2,015 |
| Envision Healthcare Corp., 8.75%, 10/15/2026(b) | | 2,000 | 1,395 |
| Hadrian Merger Sub, Inc., 8.50%, 05/01/2026(b) | | 6,000 | 5,685 |
| MEDNAX, Inc., 6.25%, 01/15/2027(b) | | 5,000 | 4,931 |
| MPH Acquisition Holdings LLC, 7.13%, 06/01/2024(b) | | 4,000 | 3,771 |
| Surgery Center Holdings, Inc., | | |
| 6.75%, 07/01/2025(b) | | 2,000 | 1,740 |
| 10.00%, 04/15/2027(b) | | 2,000 | 2,000 |
| | | | 149,537 |
| Home Improvement Retail–0.76% |
| Lowe’s Cos., Inc., | | |
| 3.65%, 04/05/2029 | | 108,000 | 112,924 |
| 4.55%, 04/05/2049 | | 50,000 | 53,966 |
| | | | 166,890 |
| | Principal
Amount | Value |
| Homebuilding–0.84% |
| Beazer Homes USA, Inc., | | |
| 8.75%, 03/15/2022 | | $3,000 | $3,131 |
| 6.75%, 03/15/2025 | | 3,000 | 2,884 |
| KB Home, 8.00%, 03/15/2020 | | 2,000 | 2,070 |
| Lennar Corp., | | |
| 8.38%, 01/15/2021 | | 2,000 | 2,160 |
| 5.25%, 06/01/2026 | | 5,000 | 5,344 |
| MDC Holdings, Inc., 6.00%, 01/15/2043 | | 174,000 | 163,560 |
| Meritage Homes Corp., 7.15%, 04/15/2020 | | 2,000 | 2,068 |
| Taylor Morrison Communities, Inc./Taylor Morrison Holdings II, Inc., 5.88%, 04/15/2023(b) | | 3,000 | 3,165 |
| | | | 184,382 |
| Hotels, Resorts & Cruise Lines–0.20% |
| Hilton Domestic Operating Co., Inc., 4.88%, 01/15/2030(b) | | 43,000 | 44,469 |
| Household Products–0.18% |
| Reynolds Group Issuer, Inc./LLC, | | |
| 5.75%, 10/15/2020 | | 35,857 | 35,991 |
| 7.00%, 07/15/2024(b) | | 2,000 | 2,072 |
| Spectrum Brands, Inc., 5.75%, 07/15/2025 | | 2,000 | 2,088 |
| | | | 40,151 |
| Independent Power Producers & Energy Traders–0.05% |
| AES Corp. (The), 5.50%, 04/15/2025 | | 5,000 | 5,206 |
| NRG Energy, Inc., 6.63%, 01/15/2027 | | 5,000 | 5,450 |
| | | | 10,656 |
| Industrial Conglomerates–0.58% |
| General Electric Co., 5.55%, 01/05/2026 | | 115,000 | 128,484 |
| Industrial Machinery–0.05% |
| Cleaver-Brooks, Inc., 7.88%, 03/01/2023(b) | | 8,000 | 7,692 |
| EnPro Industries, Inc., 5.75%, 10/15/2026 | | 2,000 | 2,050 |
| Mueller Industries, Inc., 6.00%, 03/01/2027 | | 2,000 | 2,015 |
| | | | 11,757 |
| Integrated Oil & Gas–1.18% |
| Parsley Energy, LLC/Parsley Finance Corp., 5.63%, 10/15/2027(b) | | 2,000 | 2,100 |
| Petrobras Global Finance B.V. (Brazil), | | |
| 5.75%, 02/01/2029 | | 14,000 | 14,629 |
| 6.90%, 03/19/2049 | | 20,000 | 21,340 |
| Petroleos Mexicanos (Mexico), 6.63%, 06/15/2035 | | 23,000 | 21,361 |
| Saudi Arabian Oil Co. (Saudi Arabia), 2.88%, 04/16/2024(b) | | 200,000 | 201,342 |
| | | | 260,772 |
See accompanying Notes to Financial Statements which are an integral part of the financial statements.
Invesco V.I. Core Plus Bond Fund
| | Principal
Amount | Value |
| Integrated Telecommunication Services–1.08% |
| AT&T, Inc., | | |
| 5.15%, 02/15/2050 | | $141,000 | $155,414 |
| 5.70%, 03/01/2057 | | 35,000 | 41,215 |
| Cincinnati Bell, Inc., 7.00%, 07/15/2024(b) | | 2,000 | 1,775 |
| Frontier Communications Corp., 8.00%, 04/01/2027(b) | | 3,000 | 3,128 |
| Telecom Italia Capital S.A. (Italy), 7.20%, 07/18/2036 | | 5,000 | 5,537 |
| Verizon Communications, Inc., 4.81%, 03/15/2039 | | 27,000 | 31,121 |
| | | | 238,190 |
| Interactive Media & Services–0.16% |
| Match Group, Inc., 5.63%, 02/15/2029(b) | | 33,000 | 34,939 |
| Internet & Direct Marketing Retail–0.25% |
| QVC, Inc., 5.45%, 08/15/2034 | | 55,000 | 54,212 |
| Investment Banking & Brokerage–1.32% |
| Cantor Fitzgerald, L.P., 6.50%, 06/17/2022(b) | | 34,000 | 36,574 |
| Goldman Sachs Group, Inc. (The), | | |
| 3.27%, 09/29/2025(c) | | 50,000 | 51,180 |
| Series L, 6.43% (3 mo. USD LIBOR + 3.88%)(d) | | 40,000 | 40,002 |
| Series P, 5.00%(d) | | 40,000 | 38,461 |
| Jefferies Group LLC/Jefferies Group Capital Finance, Inc., 4.15%, 01/23/2030 | | 49,000 | 46,991 |
| Morgan Stanley, 3.59%, 07/22/2028(c) | | 75,000 | 78,121 |
| | | | 291,329 |
| Leisure Facilities–0.01% |
| Six Flags Entertainment Corp., 4.88%, 07/31/2024(b) | | 2,000 | 2,035 |
| Life & Health Insurance–1.80% |
| American Equity Investment Life Holding Co., 5.00%, 06/15/2027 | | 40,000 | 41,046 |
| Athene Holding Ltd., 4.13%, 01/12/2028 | | 77,000 | 77,666 |
| MetLife, Inc., Series C, 5.25%(d) | | 65,000 | 65,528 |
| Nationwide Financial Services, Inc., 5.38%, 03/25/2021(b) | | 165,000 | 171,816 |
| Pacific Life Insurance Co., 4.30%, 10/24/2067(b)(c) | | 40,000 | 39,233 |
| | | | 395,289 |
| Managed Health Care–0.23% |
| Centene Corp., 5.38%, 06/01/2026(b) | | 4,000 | 4,215 |
| Molina Healthcare, Inc., 4.88%, 06/15/2025(b) | | 1,000 | 1,019 |
| UnitedHealth Group, Inc., 3.75%, 07/15/2025 | | 35,000 | 37,429 |
| | Principal
Amount | Value |
| Managed Health Care–(continued) |
| WellCare Health Plans, Inc., | | |
| 5.25%, 04/01/2025 | | $5,000 | $5,231 |
| 5.38%, 08/15/2026(b) | | 2,000 | 2,125 |
| | | | 50,019 |
| Metal & Glass Containers–0.05% |
| Ball Corp., 5.25%, 07/01/2025 | | 3,000 | 3,255 |
| Berry Global, Inc., 6.00%, 10/15/2022 | | 2,000 | 2,045 |
| Flex Acquisition Co., Inc., 7.88%, 07/15/2026(b) | | 4,000 | 3,700 |
| OI European Group B.V., 4.00%, 03/15/2023(b) | | 2,000 | 2,015 |
| | | | 11,015 |
| Movies & Entertainment–0.13% |
| Netflix, Inc., | | |
| 5.75%, 03/01/2024 | | 3,000 | 3,259 |
| 5.88%, 11/15/2028 | | 2,000 | 2,219 |
| 5.38%, 11/15/2029(b) | | 21,000 | 22,358 |
| | | | 27,836 |
| Multi-line Insurance–0.95% |
| AIG Global Funding, 2.70%, 12/15/2021(b) | | 42,000 | 42,354 |
| American Financial Group, Inc., 3.50%, 08/15/2026 | | 20,000 | 20,130 |
| Fairfax Financial Holdings Ltd. (Canada), 4.85%, 04/17/2028 | | 35,000 | 36,918 |
| Nationwide Mutual Insurance Co., 4.95%, 04/22/2044(b) | | 100,000 | 110,274 |
| | | | 209,676 |
| Multi-Utilities–0.39% |
| CenterPoint Energy, Inc., Series A, 6.13%(d) | | 83,000 | 86,053 |
| Office REITs–0.19% |
| Alexandria Real Estate Equities, Inc., 3.95%, 01/15/2027 | | 40,000 | 41,981 |
| Office Services & Supplies–0.41% |
| Pitney Bowes, Inc., | | |
| 3.88%, 10/01/2021 | | 55,000 | 54,175 |
| 4.95%, 04/01/2023 | | 39,000 | 37,026 |
| | | | 91,201 |
| Oil & Gas Drilling–0.06% |
| Ensco Rowan plc, 7.75%, 02/01/2026 | | 6,000 | 4,500 |
| Ensign Drilling, Inc. (Canada), 9.25%, 04/15/2024(b) | | 2,000 | 1,975 |
| Noble Holding International Ltd., 7.75%, 01/15/2024 | | 4,000 | 3,070 |
| Precision Drilling Corp. (Canada), | | |
| 6.50%, 12/15/2021 | | 944 | 951 |
| 5.25%, 11/15/2024 | | 2,000 | 1,860 |
| Transocean, Inc., 7.50%, 04/15/2031 | | 2,000 | 1,710 |
| | | | 14,066 |
See accompanying Notes to Financial Statements which are an integral part of the financial statements.
Invesco V.I. Core Plus Bond Fund
| | Principal
Amount | Value |
| Oil & Gas Equipment & Services–0.02% |
| Archrock Partners, L.P./Archrock Partners Finance Corp., 6.00%, 10/01/2022 | | $2,000 | $2,035 |
| Calfrac Holdings L.P. (Canada), 8.50%, 06/15/2026(b) | | 2,000 | 1,410 |
| SESI, L.L.C., 7.13%, 12/15/2021 | | 2,000 | 1,415 |
| | | | 4,860 |
| Oil & Gas Exploration & Production–0.60% |
| Antero Resources Corp., 5.00%, 03/01/2025 | | 2,000 | 1,855 |
| Ascent Resources Utica Holdings, LLC/ARU Finance Corp., 10.00%, 04/01/2022(b) | | 4,000 | 4,255 |
| Brazos Valley Longhorn LLC/Brazos Valley Longhorn Finance Corp., 6.88%, 02/01/2025 | | 3,000 | 2,835 |
| Callon Petroleum Co., 6.13%, 10/01/2024 | | 2,000 | 2,030 |
| Centennial Resource Production, LLC, 6.88%, 04/01/2027(b) | | 2,000 | 2,030 |
| Continental Resources, Inc., 5.00%, 09/15/2022 | | 56,000 | 56,497 |
| Enterprise Products Operating LLC, Series D, 4.88%, 08/16/2077(c) | | 28,000 | 26,422 |
| EP Energy LLC/Everest Acquisition Finance, Inc., 8.00%, 11/29/2024(b) | | 2,000 | 1,380 |
| Gulfport Energy Corp., 6.00%, 10/15/2024 | | 4,000 | 3,110 |
| Jagged Peak Energy LLC, 5.88%, 05/01/2026 | | 6,000 | 5,940 |
| Newfield Exploration Co., 5.63%, 07/01/2024 | | 3,000 | 3,326 |
| Oasis Petroleum, Inc., 6.88%, 01/15/2023 | | 2,000 | 2,005 |
| QEP Resources, Inc., | | |
| 6.88%, 03/01/2021 | | 2,000 | 2,065 |
| 5.25%, 05/01/2023 | | 2,000 | 1,935 |
| 5.63%, 03/01/2026 | | 2,000 | 1,890 |
| Range Resources Corp., 5.88%, 07/01/2022 | | 2,000 | 1,990 |
| SM Energy Co., 6.13%, 11/15/2022 | | 4,000 | 3,990 |
| Southwestern Energy Co., | | |
| 7.50%, 04/01/2026 | | 2,000 | 1,905 |
| 7.75%, 10/01/2027 | | 3,000 | 2,887 |
| Whiting Petroleum Corp., 6.25%, 04/01/2023 | | 2,000 | 2,005 |
| WPX Energy, Inc., 5.25%, 09/15/2024 | | 2,000 | 2,055 |
| | | | 132,407 |
| Oil & Gas Refining & Marketing–0.24% |
| NuStar Logistics, L.P., 6.00%, 06/01/2026 | | 5,000 | 5,187 |
| Parkland Fuel Corp. (Canada), | | |
| 6.00%, 04/01/2026(b) | | 4,000 | 4,105 |
| 5.88%, 07/15/2027(b) | | 40,000 | 40,650 |
| | Principal
Amount | Value |
| Oil & Gas Refining & Marketing–(continued) |
| Sunoco L.P. /Sunoco Finance Corp., 4.88%, 01/15/2023 | | $2,000 | $2,048 |
| | | | 51,990 |
| Oil & Gas Storage & Transportation–1.11% |
| Antero Midstream Partners L.P./Antero Midstream Finance Corp., 5.38%, 09/15/2024 | | 2,000 | 1,998 |
| Buckeye Partners, L.P., 5.60%, 10/15/2044 | | 23,000 | 18,966 |
| Energy Transfer Operating, L.P., | | |
| 5.88%, 01/15/2024 | | 2,000 | 2,224 |
| Series A, 6.25%(d) | | 2,000 | 1,863 |
| Holly Energy Partners L.P./Holly Energy Finance Corp., 6.00%, 08/01/2024(b) | | 2,000 | 2,090 |
| Plains All American Pipeline, L.P., Series B, 6.13%(d) | | 67,000 | 63,919 |
| SemGroup Corp./Rose Rock Finance Corp., 5.63%, 11/15/2023 | | 2,000 | �� 1,920 |
| Targa Resources Partners L.P./Targa Resources Partners Finance Corp., | | |
| 5.25%, 05/01/2023 | | 57,000 | 57,932 |
| 5.13%, 02/01/2025 | | 2,000 | 2,075 |
| 5.88%, 04/15/2026 | | 2,000 | 2,128 |
| Williams Cos., Inc. (The), | | |
| 4.13%, 11/15/2020 | | 83,000 | 84,514 |
| 4.55%, 06/24/2024 | | 4,000 | 4,310 |
| | | | 243,939 |
| Other Diversified Financial Services–0.93% |
| Carlyle Finance LLC, 5.65%, 09/15/2048(b) | | 52,000 | 56,500 |
| Carlyle Holdings II Finance LLC, 5.63%, 03/30/2043(b) | | 64,000 | 69,716 |
| Football Trust V, 5.35%, 10/05/2020(b) | | 65,868 | 68,282 |
| Lions Gate Capital Holdings LLC, 6.38%, 02/01/2024(b) | | 3,000 | 3,161 |
| LPL Holdings, Inc., 5.75%, 09/15/2025(b) | | 2,000 | 2,053 |
| Tempo Acquisition LLC/Tempo Acquisition Finance Corp., 6.75%, 06/01/2025(b) | | 3,000 | 3,105 |
| VFH Parent LLC/Orchestra Co-Issuer, Inc., 6.75%, 06/15/2022(b) | | 2,000 | 2,073 |
| | | | 204,890 |
| Packaged Foods & Meats–0.04% |
| B&G Foods, Inc., 5.25%, 04/01/2025 | | 2,000 | 2,028 |
| JBS USA Lux S.A./JBS USA Finance, Inc., 5.75%, 06/15/2025(b) | | 2,000 | 2,087 |
| Lamb Weston Holdings, Inc., 4.63%, 11/01/2024(b) | | 4,000 | 4,165 |
| | | | 8,280 |
| Paper Products–0.04% |
| Mercer International, Inc. (Canada), 6.50%, 02/01/2024 | | 4,000 | 4,155 |
See accompanying Notes to Financial Statements which are an integral part of the financial statements.
Invesco V.I. Core Plus Bond Fund
| | Principal
Amount | Value |
| Paper Products–(continued) |
| Schweitzer-Mauduit International, Inc., 6.88%, 10/01/2026(b) | | $4,000 | $4,100 |
| | | | 8,255 |
| Pharmaceuticals–0.46% |
| Bausch Health Cos., Inc., 5.50%, 11/01/2025(b) | | 4,000 | 4,185 |
| Bristol-Myers Squibb Co., 3.40%, 07/26/2029(b) | | 62,000 | 64,901 |
| GlaxoSmithKline Capital PLC (United Kingdom), 2.88%, 06/01/2022 | | 27,000 | 27,497 |
| HLF Financing S.a.r.l. LLC/Herbalife International, Inc., 7.25%, 08/15/2026(b) | | 2,000 | 2,012 |
| Teva Pharmaceutical Finance IV, B.V. (Israel), 3.65%, 11/10/2021 | | 2,000 | 1,939 |
| | | | 100,534 |
| Property & Casualty Insurance–0.29% |
| Allstate Corp. (The), 4.20%, 12/15/2046 | | 20,000 | 22,387 |
| W.R. Berkley Corp., 7.38%, 09/15/2019 | | 40,000 | 40,372 |
| | | | 62,759 |
| Publishing–0.03% |
| Meredith Corp., 6.88%, 02/01/2026 | | 6,000 | 6,397 |
| Railroads–0.01% |
| Kenan Advantage Group, Inc. (The), 7.88%, 07/31/2023(b) | | 2,000 | 1,810 |
| Regional Banks–0.60% |
| CIT Group, Inc., 5.00%, 08/01/2023 | | 2,000 | 2,143 |
| Fifth Third Bancorp, 4.30%, 01/16/2024 | | 55,000 | 58,747 |
| First Niagara Financial Group, Inc., 7.25%, 12/15/2021 | | 35,000 | 38,866 |
| Synovus Financial Corp., 3.13%, 11/01/2022 | | 33,000 | 33,190 |
| | | | 132,946 |
| Reinsurance–0.15% |
| Reinsurance Group of America, Inc., 4.70%, 09/15/2023 | | 30,000 | 32,477 |
| Residential REITs–0.11% |
| Spirit Realty L.P., 4.00%, 07/15/2029 | | 25,000 | 25,334 |
| Restaurants–0.54% |
| 1011778 BC ULC/New Red Finance, Inc. (Canada), 5.00%, 10/15/2025(b) | | 4,000 | 4,041 |
| Aramark Services, Inc., 5.00%, 04/01/2025(b) | | 2,000 | 2,035 |
| IRB Holding Corp., 6.75%, 02/15/2026(b) | | 24,000 | 23,940 |
| Starbucks Corp., | | |
| 3.55%, 08/15/2029 | | 29,000 | 30,359 |
| 4.45%, 08/15/2049 | | 54,000 | 59,151 |
| | | | 119,526 |
| | Principal
Amount | Value |
| Retail REITs–0.12% |
| Regency Centers, L.P., 4.13%, 03/15/2028 | | $25,000 | $26,729 |
| Security & Alarm Services–0.01% |
| Brink’s Co. (The), 4.63%, 10/15/2027(b) | | 2,000 | 2,003 |
| Semiconductor Equipment–0.15% |
| Lam Research Corp., | | |
| 4.00%, 03/15/2029 | | 15,000 | 15,980 |
| 4.88%, 03/15/2049 | | 15,000 | 16,631 |
| | | | 32,611 |
| Semiconductors–0.34% |
| Analog Devices, Inc., 3.13%, 12/05/2023 | | 30,000 | 30,713 |
| Micron Technology, Inc., | | |
| 5.50%, 02/01/2025 | | 2,000 | 2,067 |
| 4.98%, 02/06/2026 | | 25,000 | 26,390 |
| 5.33%, 02/06/2029 | | 15,000 | 15,890 |
| | | | 75,060 |
| Soft Drinks–0.18% |
| Keurig Dr Pepper, Inc., 3.55%, 05/25/2021 | | 39,000 | 39,836 |
| Sovereign Debt–1.42% |
| Argentine Republic Government International Bond (Argentina), 7.13%, 06/28/2117 | | 1,000 | 750 |
| Chile Government International Bond (Chile), 3.50%, 01/25/2050 | | 200,000 | 204,200 |
| Hungary Government International Bond (Hungary), 5.38%, 03/25/2024 | | 28,000 | 31,633 |
| Mexico Government International Bond (Mexico), 4.00%, 10/02/2023 | | 14,000 | 14,620 |
| Peruvian Government International Bond (Peru), 2.84%, 06/20/2030 | | 40,000 | 40,240 |
| Uruguay Government International Bond (Uruguay), 4.38%, 10/27/2027 | | 20,000 | 21,663 |
| | | | 313,106 |
| Specialized Consumer Services–0.02% |
| ServiceMaster Co., LLC (The), | | |
| 5.13%, 11/15/2024(b) | | 2,000 | 2,062 |
| 7.45%, 08/15/2027 | | 3,000 | 3,229 |
| | | | 5,291 |
| Specialized Finance–0.06% |
| Park Aerospace Holdings Ltd. (Ireland), 5.25%, 08/15/2022(b) | | 13,000 | 13,755 |
| Specialized REITs–0.36% |
| Crown Castle International Corp., 3.80%, 02/15/2028 | | 57,000 | 59,220 |
| Equinix, Inc., 5.88%, 01/15/2026 | | 5,000 | 5,306 |
| GLP Capital L.P./GLP Financing II, Inc., 5.38%, 04/15/2026 | | 2,000 | 2,168 |
See accompanying Notes to Financial Statements which are an integral part of the financial statements.
Invesco V.I. Core Plus Bond Fund
| | Principal
Amount | Value |
| Specialized REITs–(continued) |
| Iron Mountain US Holdings, Inc., 5.38%, 06/01/2026(b) | | $2,000 | $2,018 |
| Iron Mountain, Inc., | | |
| 6.00%, 08/15/2023 | | 2,000 | 2,060 |
| 5.25%, 03/15/2028(b) | | 2,000 | 2,013 |
| Rayonier A.M. Products, Inc., 5.50%, 06/01/2024(b) | | 4,000 | 3,440 |
| SBA Communications Corp., 4.88%, 09/01/2024 | | 2,000 | 2,067 |
| | | | 78,292 |
| Specialty Chemicals–0.04% |
| Ashland LLC, 4.75%, 08/15/2022 | | 2,000 | 2,097 |
| Element Solutions Inc., 5.88%, 12/01/2025(b) | | 2,000 | 2,093 |
| GCP Applied Technologies, Inc., 5.50%, 04/15/2026(b) | | 4,000 | 4,080 |
| | | | 8,270 |
| Steel–0.11% |
| ArcelorMittal (Luxembourg), 7.00%, 10/15/2039 | | 2,000 | 2,375 |
| Cleveland-Cliffs, Inc., 5.75%, 03/01/2025 | | 2,000 | 1,995 |
| Steel Dynamics, Inc., 5.13%, 10/01/2021 | | 15,000 | 15,175 |
| United States Steel Corp., 6.88%, 08/15/2025 | | 4,000 | 3,780 |
| | | | 23,325 |
| Systems Software–0.33% |
| Microsoft Corp., 4.25%, 02/06/2047 | | 24,000 | 28,488 |
| VMware, Inc., 2.30%, 08/21/2020 | | 45,000 | 44,881 |
| | | | 73,369 |
| Technology Distributors–0.17% |
| Avnet, Inc., 4.63%, 04/15/2026 | | 35,000 | 36,622 |
| Technology Hardware, Storage & Peripherals–0.99% |
| Apple, Inc., 4.25%, 02/09/2047 | | 20,000 | 22,445 |
| Dell International LLC, 4.90%, 10/01/2026(b) | | 20,000 | 20,871 |
| Dell International LLC/EMC Corp., | | |
| 7.13%, 06/15/2024(b) | | 4,000 | 4,223 |
| 4.00%, 07/15/2024(b) | | 40,000 | 41,055 |
| 6.02%, 06/15/2026(b) | | 62,000 | 68,426 |
| 8.35%, 07/15/2046(b) | | 49,000 | 62,001 |
| | | | 219,021 |
| Tobacco–0.14% |
| Altria Group, Inc., 4.40%, 02/14/2026 | | 28,000 | 29,955 |
| Trading Companies & Distributors–1.28% |
| Air Lease Corp., | | |
| 3.88%, 04/01/2021 | | 85,000 | 86,849 |
| 3.38%, 06/01/2021 | | 60,000 | 60,937 |
| 3.00%, 09/15/2023 | | 64,000 | 64,164 |
| | Principal
Amount | Value |
| Trading Companies & Distributors–(continued) |
| Aircastle Ltd., | | |
| 5.50%, 02/15/2022 | | $2,000 | $2,120 |
| 5.00%, 04/01/2023 | | 2,000 | 2,117 |
| BMC East, LLC, 5.50%, 10/01/2024(b) | | 4,000 | 4,070 |
| Herc Holdings, Inc., 5.50%, 07/15/2027(b) | | 60,000 | 60,525 |
| | | | 280,782 |
| Trucking–0.54% |
| Aviation Capital Group LLC, | | |
| 3.25%, (3 mo. USD LIBOR + 0.67%), 07/30/2021(b)(c) | | 22,000 | 21,932 |
| 4.13%, 08/01/2025(b) | | 31,000 | 32,289 |
| Avis Budget Car Rental LLC/Avis Budget Finance, Inc., | | |
| 5.25%, 03/15/2025(b) | | 2,000 | 2,017 |
| 5.75%, 07/15/2027(b) | | 25,000 | 25,250 |
| Avolon Holdings Funding Ltd. (Ireland), 4.38%, 05/01/2026(b) | | 15,000 | 15,457 |
| DAE Funding LLC (United Arab Emirates), 4.00%, 08/01/2020(b) | | 12,000 | 12,030 |
| United Rentals North America, Inc., | | |
| 6.50%, 12/15/2026 | | 6,000 | 6,510 |
| 5.50%, 05/15/2027 | | 2,000 | 2,110 |
| 5.25%, 01/15/2030 | | 2,000 | 2,060 |
| | | | 119,655 |
| Wireless Telecommunication Services–2.17% |
| Rogers Communications, Inc. (Canada), 4.35%, 05/01/2049 | | 30,000 | 32,454 |
| Sprint Communications, Inc., 7.00%, 03/01/2020(b) | | 4,000 | 4,110 |
| Sprint Spectrum Co. LLC/Sprint Spectrum Co. II LLC/Sprint Spectrum Co. III LLC, | | |
| 4.74%, 03/20/2025(b) | | 200,000 | 208,000 |
| 5.15%, 03/20/2028(b) | | 209,000 | 215,792 |
| T-Mobile USA, Inc., | | |
| 6.38%, 03/01/2025 | | 6,000 | 6,246 |
| 6.50%, 01/15/2026 | | 10,000 | 10,836 |
| | | | 477,438 |
| Total U.S. Dollar Denominated Bonds & Notes (Cost $9,355,268) | 9,704,660 |
| U.S. Government Sponsored Agency Mortgage-Backed Securities–20.17% |
| Collateralized Mortgage Obligations–2.53% |
| Freddie Mac Multifamily Structured Pass Through Ctfs. | | |
| Series K731, Class A2, 3.60%, 02/25/2025(f) | | 79,000 | 84,347 |
| Series K062, Class A1, 3.03%, 09/25/2026 | | 25,562 | 26,489 |
See accompanying Notes to Financial Statements which are an integral part of the financial statements.
Invesco V.I. Core Plus Bond Fund
| | Principal
Amount | Value |
| Collateralized Mortgage Obligations–(continued) |
| Series K087, Class A1 | | |
| 3.59%, 10/25/2027 | | $86,757 | $92,543 |
| 3.77%, 12/25/2028 | | 72,100 | 79,703 |
| Series K071, Class A2, 3.29%, 11/25/2027 | | 50,000 | 53,225 |
| 4.03%, 10/25/2028(f) | | 23,000 | 25,744 |
| 4.06%, 10/25/2028(f) | | 23,000 | 25,811 |
| 3.63%, 01/25/2029(f) | | 39,000 | 42,445 |
| 3.76%, 01/25/2029(f) | | 92,000 | 101,278 |
| Freddie Mac Whole Loan Securities Trust, 3.50%, 05/25/2047 | | 24,466 | 24,743 |
| | | | 556,328 |
| Federal Home Loan Mortgage Corp. (FHLMC)–1.85% |
| 6.50%, 07/01/2031 to 08/01/2032 | | 1,198 | 1,330 |
| 3.21%, 02/25/2026 | | 181,000 | 190,512 |
| 3.42%, 02/25/2029 | | 200,000 | 215,608 |
| | | | 407,450 |
| Federal National Mortgage Association (FNMA)–13.16% |
| 7.50%, 04/01/2029 | | 948 | 1,015 |
| 3.50%, 12/01/2030 | | 40,774 | 42,447 |
| 6.50%, 09/01/2031 | | 693 | 800 |
| 7.00%, 09/01/2032 | | 4,806 | 5,095 |
| 4.50%, 12/01/2048 | | 63,973 | 67,449 |
| TBA, | | |
| 2.50%, 07/01/2034(g) | | 291,000 | 292,910 |
| 3.00%, 07/01/2034 to 07/01/2049(g) | | 829,000 | 839,987 |
| 3.50%, 07/01/2034 to 08/01/2049(g) | | 1,145,000 | 1,171,664 |
| 4.00%, 07/01/2049(g) | | 460,000 | 475,354 |
| | | | 2,896,721 |
| Government National Mortgage Association (GNMA)–2.63% |
| TBA, | | |
| 3.00%, 07/19/2018(g) | | 345,000 | 352,399 |
| 4.00%, 07/01/2049(g) | | 212,000 | 219,776 |
| 7.50%, 06/15/2023 | | 745 | 756 |
| 8.50%, 11/15/2024 | | 797 | 800 |
| 7.00%, 07/15/2031 to 08/15/2031 | | 821 | 934 |
| 6.50%, 11/15/2031 to 03/15/2032 | | 2,067 | 2,269 |
| 6.00%, 11/15/2032 | | 1,127 | 1,279 |
| | | | 578,213 |
| Total U.S. Government Sponsored Agency Mortgage-Backed Securities (Cost $4,389,608) | 4,438,712 |
|
| Asset-Backed Securities–14.64% |
| Adjustable Rate Mortgage Trust, Series 2004-2, Class 6A1, 4.67%, 02/25/2035(f) | | 11,654 | 11,820 |
| Angel Oak Mortgage Trust I LLC, | | |
| Series 2018-3, Class A1, 3.65%, 09/25/2048(b)(f) | | 44,920 | 45,552 |
| Series 2019-2, Class A1, 3.63%, 03/25/2049(b)(f) | | 112,369 | 114,131 |
| | Principal
Amount | Value |
|
| Angel Oak Mortgage Trust, LLC, Series 2017-3, Class A1, 2.71%, 11/25/2047(b)(f) | | $19,165 | $19,211 |
| Banc of America Commercial Mortgage Trust, Series 2015-UBS7, Class AS, 3.99%, 09/15/2048(f) | | 70,000 | 74,766 |
| CGDBB Commercial Mortgage Trust, | | |
| Series 2017-BIOC, Class A, 3.18% (1 mo. USD LIBOR + 0.79%), 07/15/2032(b)(c) | | 100,000 | 100,073 |
| Series 2017-BIOC, Class C, 3.44% (1 mo. USD LIBOR + 1.05%), 07/15/2032(b)(c) | | 100,000 | 100,074 |
| Series 2017-BIOC, Class D, 3.99% (1 mo. USD LIBOR + 1.60%), 07/15/2032(b)(c) | | 100,000 | 100,268 |
| Chase Mortgage Finance Corp., | | |
| Series 2016-1, Class M3, 3.75%, 04/25/2045(b)(f) | | 61,714 | 62,651 |
| Series 2016-2, Class M3, 3.75%, 12/25/2045(b)(f) | | 68,607 | 70,023 |
| Commercial Mortgage Trust, | | |
Series 2015-CR23, Class CMB–
Class CMB, 3.81%, 05/10/2048(b)(f) | | 150,000 | 151,076 |
| Series 2015-CR25, Class B, 4.70%, 08/10/2048(f) | | 72,000 | 77,085 |
| Series 2016-GCT, Class B, 3.09%, 08/10/2029(b) | | 100,000 | 100,406 |
| Credit Suisse First Boston Mortgage Securities Corp., Series 2004-AR5, Class 3A1, 4.57%, 06/25/2034(f) | | 21,070 | 21,601 |
| CSWF, Series 2018-TOP, Class B, 3.69% (1 mo. USD LIBOR + 1.30%), 08/15/2035(b)(c) | | 100,000 | 100,271 |
| DB Master Finance LLC, | | |
| Series 2019-1A, Class A23, 4.35%, 05/20/2049(b) | | 50,000 | 51,796 |
| Series 2019-1A, Class A2II, 4.02%, 05/20/2049(b) | | 50,000 | 51,583 |
| GMACM Mortgage Loan Trust, Series 2006-AR1, Class 1A1, 4.21%, 04/19/2036(f) | | 58,243 | 53,472 |
| Golub Capital Partners CLO 41 B Ltd., Series 2019-41A, Class A, 3.96% (3 mo. USD LIBOR + 1.37%), 04/20/2029(b)(c) | | 146,000 | 146,137 |
| Hertz Vehicle Financing II L.P., Series 2019-2A, Class A, 3.42%, 05/25/2025(b) | | 100,000 | 102,266 |
| HMH Trust, Series 2017-NSS, Class A, 3.06%, 07/05/2031(b) | | 100,000 | 101,368 |
| Homeward Opportunities Fund I Trust, Series 2019-1, Class A1, 3.45%, 01/25/2059(b)(f) | | 95,085 | 96,572 |
| Invitation Homes Trust, Series 2017-SFR2, Class C, 3.84% (1 mo. USD LIBOR + 1.45%), 12/17/2036(b)(c) | | 100,000 | 100,273 |
| JOL Air Ltd., Series 2019-1, Class A, 3.97%, 04/15/2044(b) | | 246,000 | 250,261 |
See accompanying Notes to Financial Statements which are an integral part of the financial statements.
Invesco V.I. Core Plus Bond Fund
| | Principal
Amount | Value |
|
| Merrill Lynch Mortgage Investors Trust, Series 2005-3, Class 3A, 4.46% (1 mo. USD LIBOR + 0.25%), 11/25/2035(c) | | $15,953 | $16,398 |
| Morgan Stanley Capital I Trust, | | |
| Series 2017-CLS, Class A, 3.09% (1 mo. USD LIBOR + 0.70%), 11/15/2034(b)(c) | | 99,000 | 98,987 |
| Series 2017-CLS, Class B, 3.24% (1 mo. USD LIBOR + 0.85%), 11/15/2034(b)(c) | | 49,000 | 48,944 |
| Series 2017-CLS, Class C, 3.39% (1 mo. USD LIBOR + 1.00%), 11/15/2034(b)(c) | | 33,000 | 32,914 |
| Series 2019-L2, Class A4, 4.07%, 03/15/2052 | | 80,000 | 88,582 |
| MVW Owner Trust, Series 2019-1A, Class A, 2.89%, 11/20/2036(b) | | 100,000 | 101,378 |
| Starwood Mortgage Residential Trust, Series 2019-IMC1, Class A1, 3.47%, 02/25/2049(b)(f) | | 94,356 | 95,901 |
| Starwood Waypoint Homes Trust, Series 2017-1, Class D, 4.34% (1 mo. USD LIBOR + 1.95%), 01/17/2035(b)(c) | | 100,000 | 100,165 |
| Structured Adjustable Rate Mortgage Loan Trust, Series 2004-12, Class 3A2, 4.56%, 09/25/2034(f) | | 14,021 | 14,394 |
| Structured Asset Securities Corp., Series 2003-34A, Class 5A5, 4.59%, 11/25/2033(f) | | 67,325 | 68,788 |
| Thornburg Mortgage Securities Trust, Series 2005-1, Class A3, 4.62%, 04/25/2045(f) | | 47,889 | 49,154 |
| Towd Point Mortgage Trust, Series 2017-2, Class A1, 2.75%, 04/25/2057(b)(f) | | 59,948 | 60,119 |
| UBS Commercial Mortgage Trust, Series 2019-C16, 3.60%, 04/15/2052 | | 80,000 | 85,336 |
| Verus Securitization Trust, Series 2019-INV1, Class A1, 3.40%, 12/25/2059(b)(f) | | 96,249 | 97,551 |
| Wells Fargo Mortgage Backed Securities Trust, Series 2004-Z, Class 2A1, 4.97%, 12/25/2034(f) | | 16,599 | 17,078 |
| Wendy’s Funding LLC, Series 2018-1A, Class A2II, 3.88%, 03/15/2048(b) | | 59,100 | 59,427 |
| WFRBS Commercial Mortgage Trust, Series 2012-C6, Class B, 4.70%, 04/15/2045 | | 80,000 | 83,961 |
| Total Asset-Backed Securities (Cost $3,176,373) | 3,221,813 |
| U.S. Treasury Securities–6.24% |
| U.S. Treasury Bills–0.16% |
| 2.03%, 12/19/2019(h)(i) | | 35,000 | 34,661 |
| U.S. Treasury Bonds–2.24% |
| 3.00%, 02/15/2049 | | 450,100 | 493,721 |
| | Principal
Amount | Value |
| U.S. Treasury Notes–3.84% |
| 1.75%, 06/15/2022 | | $250,200 | $250,488 |
| 2.00%, 05/31/2024 | | 23,900 | 24,171 |
| 2.13%, 05/31/2026 | | 322,500 | 327,716 |
| 2.38%, 05/15/2029 | | 234,100 | 241,813 |
| | | | 844,188 |
| Total U.S. Treasury Securities (Cost $1,340,650) | 1,372,570 |
| | Shares | |
| Preferred Stocks–0.69% |
| Diversified Banks–0.07% |
| Wells Fargo & Co., Class A, Series L, $75.00 Conv. Pfd. | 11 | 15,006 |
| Investment Banking & Brokerage–0.62% |
| Morgan Stanley, 6.88%, Series F, Pfd. | 5,000 | 137,200 |
| Total Preferred Stocks (Cost $138,976) | 152,206 |
| | Principal
Amount | |
| Non-U.S. Dollar Denominated Bonds & Notes–0.56%(j) |
| Movies & Entertainment–0.56% |
Netflix, Inc., 3.88%, 11/15/2029
(Cost $111,565)(b) | EUR | 100,000 | 123,462 |
| Variable Rate Senior Loan Interests–0.12%(k) |
| Technology Distributors–0.12% |
Refinitiv US Holdings, Inc., Term Loan B, 6.08% (3 mo. USD LIBOR + 3.75%), 10/01/2025
(Cost $25,960)(c) | | $26,025 | 25,281 |
| | Shares | |
| Common Stocks & Other Equity Interests–0.00% |
| Diversified Support Services–0.00% |
| ACC Claims Holdings, LLC(l)(m) | 73,980 | 444 |
| Other Diversified Financial Services–0.00% |
| Adelphia Recovery Trust, Series ACC-1(n) | 87,412 | 35 |
| Total Common Stocks & Other Equity Interests (Cost $22,181) | 479 |
| Money Market Funds–28.91% |
| Invesco Government & Agency Portfolio, Institutional Class, 2.26%(o) | 2,225,490 | 2,225,490 |
| Invesco Liquid Assets Portfolio, Institutional Class, 2.40%(o) | 1,593,988 | 1,594,625 |
| Invesco Treasury Portfolio, Institutional Class, 2.22%(o) | 2,543,418 | 2,543,418 |
| Total Money Market Funds (Cost $6,363,279) | 6,363,533 |
| TOTAL INVESTMENTS IN SECURITIES–115.42% (Cost $24,923,860) | 25,402,716 |
| OTHER ASSETS LESS LIABILITIES–(15.42)% | (3,392,864) |
| NET ASSETS–100.00% | $22,009,852 |
See accompanying Notes to Financial Statements which are an integral part of the financial statements.
Invesco V.I. Core Plus Bond Fund
Investment Abbreviations:
| CLO | – Collateralized Loan Obligation |
| Conv. | – Convertible |
| Ctfs. | – Certificates |
| EUR | – Euro |
| LIBOR | – London Interbank Offered Rate |
| Pfd. | – Preferred |
| PIK | – Pay-in-Kind |
| REIT | – Real Estate Investment Trust |
| TBA | – To Be Announced |
| USD | – U.S. Dollar |
Notes to Schedule of Investments:
| (a) | Industry and/or sector classifications used in this report are generally according to the Global Industry Classification Standard, which was developed by and is the exclusive property and a service mark of MSCI Inc. and Standard & Poor’s. |
| (b) | Security purchased or received in a transaction exempt from registration under the Securities Act of 1933, as amended (the “1933 Act”). The security may be resold pursuant to an exemption from registration under the 1933 Act, typically to qualified institutional buyers. The aggregate value of these securities at June 30, 2019 was $5,903,283, which represented 26.82% of the Fund’s Net Assets. |
| (c) | Interest or dividend rate is redetermined periodically. Rate shown is the rate in effect on June 30, 2019. |
| (d) | Perpetual bond with no specified maturity date. |
| (e) | All or a portion of this security is Pay-in-Kind. Pay-in-Kind securities pay interest income in the form of securities. |
| (f) | Interest rate is redetermined periodically based on the cash flows generated by the pool of assets backing the security, less any applicable fees. The rate shown is the rate in effect on June 30, 2019. |
| (g) | Security purchased on a forward commitment basis. This security is subject to dollar roll transactions. See Note 1M. |
| (h) | Security traded on a discount basis. The interest rate shown represents the discount rate at the time of purchase by the Fund. |
| (i) | All or a portion of the value was pledged as collateral to cover margin requirements for open futures contracts. See Note 1L. |
| (j) | Foreign denominated security. Principal amount is denominated in the currency indicated. |
| (k) | Variable rate senior loan interests are, at present, not readily marketable, not registered under the 1933 Act and may be subject to contractual and legal restrictions on sale. Variable rate senior loan interests in the Fund’s portfolio generally have variable rates which adjust to a base, such as the London Interbank Offered Rate (“LIBOR”), on set dates, typically every 30 days, but not greater than one year, and/or have interest rates that float at margin above a widely recognized base lending rate such as the Prime Rate of a designated U.S. bank. |
| (l) | Non-income producing security. |
| (m) | Security valued using significant unobservable inputs (Level 3). See Note 3. |
| (n) | Non-income producing security acquired as part of the Adelphia Communications bankruptcy reorganization. |
| (o) | The money market fund and the Fund are affiliated by having the same investment adviser. The rate shown is the 7-day SEC standardized yield as of June 30, 2019. |
| Open Futures Contracts |
| Long Futures Contracts | Number of
Contracts | Expiration
Month | Notional
Value | Value | Unrealized
Appreciation
(Depreciation) |
| Interest Rate Risk |
| U.S. Treasury 2 Year Notes | 4 | September-2019 | $860,719 | $4,866 | $4,866 |
| U.S. Treasury 5 Year Notes | 11 | September-2019 | 1,299,719 | 14,489 | 14,489 |
| U.S. Treasury 10 Year Notes | 11 | September-2019 | 1,407,656 | 5,646 | 5,646 |
| U.S. Treasury Ultra Bonds | 5 | September-2019 | 887,813 | 29,832 | 29,832 |
| U.S. Treasury Long Bonds | 3 | September-2019 | 466,781 | 13,048 | 13,048 |
| Subtotal—Long Futures Contracts | 67,881 | 67,881 |
| Short Futures Contracts | | | | | |
| Interest Rate Risk |
| U.S. Treasury 10 Year Ultra Bonds | 9 | September-2019 | (1,243,125) | (26,218) | (26,218) |
| Total Futures Contracts | $41,663 | $41,663 |
See accompanying Notes to Financial Statements which are an integral part of the financial statements.
Invesco V.I. Core Plus Bond Fund
| Open Forward Foreign Currency Contracts |
Settlement
Date | Counterparty | Contract to | Unrealized
Appreciation
(Depreciation) |
| Deliver | Receive |
| Currency Risk | | | | | | |
| 08/30/2019 | Goldman Sachs International | EUR | 145,145 | USD | 163,256 | $(2,560) |
| Abbreviations: |
| EUR | – Euro |
| USD | – U.S. Dollar |
Portfolio Composition
By security type, based on Net Assets
as of June 30, 2019
| U.S. Dollar Denominated Bonds & Notes | 44.09% |
| U.S. Government Sponsored Agency Mortgage-Backed Securities | 20.17 |
| Asset-Backed Securities | 14.64 |
| U.S. Treasury Securities | 6.24 |
| Security Types Each Less Than 1% of Portfolio | 1.37 |
| Money Market Funds Plus Other Assets Less Liabilities | 13.49 |
See accompanying Notes to Financial Statements which are an integral part of the financial statements.
Invesco V.I. Core Plus Bond Fund
Statement of Assets and Liabilities
June 30, 2019
(Unaudited)
| Assets: | |
Investments in securities, at value
(Cost $18,560,581) | $19,039,183 |
| Investments in affiliated money market funds, at value (Cost $6,363,279) | 6,363,533 |
| Foreign currencies, at value (Cost $1,735) | 1,763 |
| Receivable for: | |
| Dividends | 14,555 |
| Fund shares sold | 20,262 |
| Interest | 131,116 |
| Investments sold | 1,234,230 |
| Investment for trustee deferred compensation and retirement plans | 58,375 |
| Total assets | 26,863,017 |
| Liabilities: | |
| Other investments: | |
| Variation margin payable - futures contracts | 1,815 |
| Unrealized depreciation on forward foreign currency contracts outstanding | 2,560 |
| Payable for: | |
| Investments purchased | 4,715,736 |
| Fund shares reacquired | 1,444 |
| Accrued fees to affiliates | 29,521 |
| Accrued trustees’ and officers’ fees and benefits | 406 |
| Accrued other operating expenses | 41,195 |
| Trustee deferred compensation and retirement plans | 60,488 |
| Total liabilities | 4,853,165 |
| Net assets applicable to shares outstanding | $22,009,852 |
| Net assets consist of: | |
| Shares of beneficial interest | $20,715,798 |
| Distributable earnings | 1,294,054 |
| | $22,009,852 |
| Net Assets: |
| Series I | $21,884,704 |
| Series II | $125,148 |
| Shares outstanding, no par value, with an unlimited number of shares authorized: |
| Series I | 3,382,918 |
| Series II | 19,454 |
| Series I: | |
| Net asset value per share | $6.47 |
| Series II: | |
| Net asset value per share | $6.43 |
Statement of Operations
For the six months ended June 30, 2019
(Unaudited)
| Investment income: | |
| Interest | $311,887 |
| Dividends from affiliated money market funds | 53,953 |
| Dividends | 4,765 |
| Total investment income | 370,605 |
| Expenses: | |
| Advisory fees | 42,302 |
| Administrative services fees | 15,426 |
| Custodian fees | 4,407 |
| Distribution fees - Series II | 150 |
| Transfer agent fees | 4,684 |
| Trustees’ and officers’ fees and benefits | 11,457 |
| Reports to shareholders | 5,125 |
| Professional services fees | 25,058 |
| Other | 1,249 |
| Total expenses | 109,858 |
| Less: Fees waived and expenses reimbursed | (54,641) |
| Net expenses | 55,217 |
| Net investment income | 315,388 |
| Realized and unrealized gain (loss) from: | |
| Net realized gain (loss) from: | |
| Investment securities | 183,870 |
| Foreign currencies | (2,371) |
| Forward foreign currency contracts | 5,110 |
| Futures contracts | 47,976 |
| | 234,585 |
| Change in net unrealized appreciation (depreciation) of: | |
| Investment securities | 859,909 |
| Foreign currencies | (357) |
| Forward foreign currency contracts | (1,717) |
| Futures contracts | 18,361 |
| | 876,196 |
| Net realized and unrealized gain | 1,110,781 |
| Net increase in net assets resulting from operations | $1,426,169 |
See accompanying Notes to Financial Statements which are an integral part of the financial statements.
Invesco V.I. Core Plus Bond Fund
Statement of Changes in Net Assets
For the six months ended June 30, 2019 and the year ended December 31, 2018
(Unaudited)
| | June 30,
2019 | December 31,
2018 |
| Operations: | | |
| Net investment income | $315,388 | $640,454 |
| Net realized gain (loss) | 234,585 | (337,527) |
| Change in net unrealized appreciation (depreciation) | 876,196 | (756,125) |
| Net increase (decrease) in net assets resulting from operations | 1,426,169 | (453,198) |
| Distributions to shareholders from distributable earnings: | | |
| Series I | — | (636,171) |
| Series II | — | (4,086) |
| Total distributions from distributable earnings | — | (640,257) |
| Share transactions–net: | | |
| Series I | 3,448,480 | (2,220,996) |
| Series II | (995) | 1,722 |
| Net increase (decrease) in net assets resulting from share transactions | 3,447,485 | (2,219,274) |
| Net increase (decrease) in net assets | 4,873,654 | (3,312,729) |
| Net assets: | | |
| Beginning of period | 17,136,198 | 20,448,927 |
| End of period | $22,009,852 | $17,136,198 |
See accompanying Notes to Financial Statements which are an integral part of the financial statements.
Invesco V.I. Core Plus Bond Fund
Financial Highlights
June 30, 2019
(Unaudited)
The following schedule presents financial highlights for a share of the Fund outstanding throughout the periods indicated.
| | Net asset
value,
beginning
of period | Net
investment
income(a) | Net gains
(losses)
on securities
(both
realized and
unrealized) | Total from
investment
operations | Dividends
from net
investment
income | Net asset
value, end
of period | Total
return(b) | Net assets,
end of period
(000’s omitted) | Ratio of
expenses
to average
net assets
with fee waivers
and/or expenses
absorbed | Ratio of
expenses
to average net
assets without
fee waivers
and/or expenses
absorbed | Ratio of net
investment
income
to average
net assets | Portfolio
turnover(c) |
| Series I |
| Six months ended 06/30/19 | $6.00 | $0.10 | $0.37 | $0.47 | $— | $6.47 | 7.83% | $21,885 | 0.59%(d) | 1.17%(d) | 3.35%(d) | 237% |
| Year ended 12/31/18 | 6.38 | 0.22 | (0.37) | (0.15) | (0.23) | 6.00 | (2.37) | 17,019 | 0.59 | 1.78 | 3.57 | 339 |
| Year ended 12/31/17 | 6.21 | 0.22 | 0.17 | 0.39 | (0.22) | 6.38 | 6.34 | 20,326 | 0.60 | 1.58 | 3.46 | 407 |
| Year ended 12/31/16 | 6.07 | 0.23 | 0.18 | 0.41 | (0.27) | 6.21 | 6.66 | 15,485 | 0.55 | 1.68 | 3.71 | 474 |
| Year ended 12/31/15 | 6.39 | 0.24 | (0.26) | (0.02) | (0.30) | 6.07 | (0.37) | 15,587 | 0.65 | 1.73 | 3.81 | 416 |
| Year ended 12/31/14 | 6.23 | 0.26 | 0.24 | 0.50 | (0.34) | 6.39 | 8.03 | 17,821 | 0.75 | 1.77 | 4.04 | 255 |
| Series II |
| Six months ended 06/30/19 | 5.97 | 0.10 | 0.36 | 0.46 | — | 6.43 | 7.71 | 125 | 0.84(d) | 1.42(d) | 3.10(d) | 237 |
| Year ended 12/31/18 | 6.35 | 0.20 | (0.37) | (0.17) | (0.21) | 5.97 | (2.64) | 117 | 0.84 | 2.03 | 3.32 | 339 |
| Year ended 12/31/17 | 6.19 | 0.20 | 0.16 | 0.36 | (0.20) | 6.35 | 5.89 | 123 | 0.85 | 1.83 | 3.21 | 407 |
| Year ended 12/31/16 | 6.04 | 0.22 | 0.18 | 0.40 | (0.25) | 6.19 | 6.52 | 126 | 0.80 | 1.93 | 3.46 | 474 |
| Year ended 12/31/15 | 6.36 | 0.22 | (0.26) | (0.04) | (0.28) | 6.04 | (0.64) | 156 | 0.90 | 1.98 | 3.56 | 416 |
| Year ended 12/31/14 | 6.19 | 0.24 | 0.24 | 0.48 | (0.31) | 6.36 | 7.85 | 161 | 1.00 | 2.02 | 3.79 | 255 |
| (a) | Calculated using average shares outstanding. |
| (b) | Includes adjustments in accordance with accounting principles generally accepted in the United States of America and as such, the net asset value for financial reporting purposes and the returns based upon those net asset values may differ from the net asset value and returns for shareholder transactions. Total returns are not annualized for periods less than one year, if applicable, and do not reflect charges assessed in connection with a variable product, which if included would reduce total returns. |
| (c) | Portfolio turnover is calculated at the fund level and is not annualized for periods less than one year, if applicable. |
| (d) | Ratios are annualized and based on average daily net assets (000’s omitted) of $18,836 and $121 for Series I and Series II shares, respectively. |
See accompanying Notes to Financial Statements which are an integral part of the financial statements.
Invesco V.I. Core Plus Bond Fund
Notes to Financial Statements
June 30, 2019
(Unaudited)
NOTE 1—Significant Accounting Policies
Invesco V.I. Core Plus Bond Fund (the “Fund”) is a series portfolio of AIM Variable Insurance Funds (Invesco Variable Insurance Funds) (the “Trust”). The Trust is a Delaware statutory trust registered under the Investment Company Act of 1940, as amended (the “1940 Act”), as an open-end series management investment company. Information presented in these financial statements pertains only to the Fund. Matters affecting the Fund or each class will be voted on exclusively by the shareholders of the Fund or each class. Current Securities and Exchange Commission (“SEC”) guidance, however, requires participating insurance companies offering separate accounts to vote shares proportionally in accordance with the instructions of the contract owners whose investments are funded by shares of each Fund or class.
The Fund’s investment objective is total return, comprised of current income and capital appreciation.
The Fund currently offers two classes of shares, Series I and Series II, both of which are offered to insurance company separate accounts funding variable annuity contracts and variable life insurance policies (“variable products”).
The Fund is an investment company and accordingly follows the investment company accounting and reporting guidance in accordance with Financial Accounting Standards Board Accounting Standards Codification Topic 946,Financial Services – Investment Companies.
The following is a summary of the significant accounting policies followed by the Fund in the preparation of its financial statements.
| A. | Security Valuations – Securities, including restricted securities, are valued according to the following policy. |
Debt obligations (including convertible securities) and unlisted equities are fair valued using an evaluated quote provided by an independent pricing service. Evaluated quotes provided by the pricing service may be determined without exclusive reliance on quoted prices, and may reflect appropriate factors such as institution-size trading in similar groups of securities, developments related to specific securities, dividend rate (for unlisted equities), yield (for debt obligations), quality, type of issue, coupon rate (for debt obligations), maturity (for debt obligations), individual trading characteristics and other market data. Pricing services generally value debt obligations assuming orderly transactions of institutional round lot size, but a fund may hold or transact in the same securities in smaller, odd lot sizes. Odd lots often trade at lower prices than institutional round lots. Debt obligations are subject to interest rate and credit risks. In addition, all debt obligations involve some risk of default with respect to interest and/or principal payments.
A security listed or traded on an exchange (except convertible securities) is valued at its last sales price or official closing price as of the close of the customary trading session on the exchange where the security is principally traded, or lacking any sales or official closing price on a particular day, the security may be valued at the closing bid price on that day. Securities traded in the over-the-counter market are valued based on prices furnished by independent pricing services or market makers. When such securities are valued by an independent pricing service they may be considered fair valued. Futures contracts are valued at the final settlement price set by an exchange on which they are principally traded. Listed options are valued at the mean between the last bid and asked prices from the exchange on which they are principally traded. Options not listed on an exchange are valued by an independent source at the mean between the last bid and asked prices. For purposes of determining net asset value ("NAV") per share, futures and option contracts generally are valued 15 minutes after the close of the customary trading session of the New York Stock Exchange (“NYSE”).
Investments in open-end and closed-end registered investment companies that do not trade on an exchange are valued at the end-of-day net asset value per share. Investments in open-end and closed-end registered investment companies that trade on an exchange are valued at the last sales price or official closing price as of the close of the customary trading session on the exchange where the security is principally traded.
Swap agreements are fair valued using an evaluated quote, if available, provided by an independent pricing service. Evaluated quotes provided by the pricing service are valued based on a model which may include end-of-day net present values, spreads, ratings, industry, company performance and returns of referenced assets. Centrally cleared swap agreements are valued at the daily settlement price determined by the relevant exchange or clearinghouse.
Foreign securities’ (including foreign exchange contracts) prices are converted into U.S. dollar amounts using the applicable exchange rates as of the close of the NYSE. If market quotations are available and reliable for foreign exchange-traded equity securities, the securities will be valued at the market quotations. Because trading hours for certain foreign securities end before the close of the NYSE, closing market quotations may become unreliable. If between the time trading ends on a particular security and the close of the customary trading session on the NYSE, events occur that the investment adviser determines are significant and make the closing price unreliable, the Fund may fair value the security. If the event is likely to have affected the closing price of the security, the security will be valued at fair value in good faith using procedures approved by the Board of Trustees. Adjustments to closing prices to reflect fair value may also be based on a screening process of an independent pricing service to indicate the degree of certainty, based on historical data, that the closing price in the principal market where a foreign security trades is not the current value as of the close of the NYSE. Foreign securities’ prices meeting the approved degree of certainty that the price is not reflective of current value will be priced at the indication of fair value from the independent pricing service. Multiple factors may be considered by the independent pricing service in determining adjustments to reflect fair value and may include information relating to sector indices, American Depositary Receipts and domestic and foreign index futures. Foreign securities may have additional risks including exchange rate changes, potential for sharply devalued currencies and high inflation, political and economic upheaval, the relative lack of issuer information, relatively low market liquidity and the potential lack of strict financial and accounting controls and standards.
Securities for which market prices are not provided by any of the above methods may be valued based upon quotes furnished by independent sources. The last bid price may be used to value equity securities. The mean between the last bid and asked prices is used to value debt obligations, including corporate loans.
Securities for which market quotations are not readily available or became unreliable are valued at fair value as determined in good faith by or under the supervision of the Trust’s officers following procedures approved by the Board of Trustees. Issuer specific events, market trends, bid/asked quotes of brokers and information providers and other market data may be reviewed in the course of making a good faith determination of a security’s fair value.
Invesco V.I. Core Plus Bond Fund
The Fund may invest in securities that are subject to interest rate risk, meaning the risk that the prices will generally fall as interest rates rise and, conversely, the prices will generally rise as interest rates fall. Specific securities differ in their sensitivity to changes in interest rates depending on their individual characteristics. Changes in interest rates may result in increased market volatility, which may affect the value and/or liquidity of certain Fund investments.
Valuations change in response to many factors including the historical and prospective earnings of the issuer, the value of the issuer’s assets, general economic conditions, interest rates, investor perceptions and market liquidity. Because of the inherent uncertainties of valuation, the values reflected in the financial statements may materially differ from the value received upon actual sale of those investments.
| B. | Securities Transactions and Investment Income – Securities transactions are accounted for on a trade date basis. Realized gains or losses on sales are computed on the basis of specific identification of the securities sold. Interest income (net of withholding tax, if any) is recorded on the accrual basis from settlement date. Bond premiums and discounts are amortized and/or accreted over the lives of the respective securities. Pay-in-kind interest income and non-cash dividend income received in the form of securities in-lieu of cash are recorded at the fair value of the securities received. Dividend income (net of withholding tax, if any) is recorded on the ex-dividend date. |
The Fund may periodically participate in litigation related to Fund investments. As such, the Fund may receive proceeds from litigation settlements. Any proceeds received are included in the Statement of Operations as realized gain (loss) for investments no longer held and as unrealized gain (loss) for investments still held.
Brokerage commissions and mark ups are considered transaction costs and are recorded as an increase to the cost basis of securities purchased and/or a reduction of proceeds on a sale of securities. Such transaction costs are included in the determination of net realized and unrealized gain (loss) from investment securities reported in the Statement of Operations and the Statement of Changes in Net Assets and the net realized and unrealized gains (losses) on securities per share in the Financial Highlights. Transaction costs are included in the calculation of the Fund’s net asset value and, accordingly, they reduce the Fund’s total returns. These transaction costs are not considered operating expenses and are not reflected in net investment income reported in the Statement of Operations and the Statement of Changes in Net Assets, or the net investment income per share and the ratios of expenses and net investment income reported in the Financial Highlights, nor are they limited by any expense limitation arrangements between the Fund and the investment adviser.
The Fund allocates income and realized and unrealized capital gains and losses to a class based on the relative net assets of each class.
| C. | Country Determination — For the purposes of making investment selection decisions and presentation in the Schedule of Investments, the investment adviser may determine the country in which an issuer is located and/or credit risk exposure based on various factors. These factors include the laws of the country under which the issuer is organized, where the issuer maintains a principal office, the country in which the issuer derives 50% or more of its total revenues and the country that has the primary market for the issuer’s securities, as well as other criteria. Among the other criteria that may be evaluated for making this determination are the country in which the issuer maintains 50% or more of its assets, the type of security, financial guarantees and enhancements, the nature of the collateral and the sponsor organization. Country of issuer and/or credit risk exposure has been determined to be the United States of America, unless otherwise noted. |
| D. | Distributions– Distributions from net investment income and net realized capital gain, if any, are generally declared and paid to separate accounts of participating insurance companies annually and recorded on the ex-dividend date. |
| E. | Federal Income Taxes –The Fund intends to comply with the requirements of Subchapter M of the Internal Revenue Code of 1986, as amended (the “Internal Revenue Code”), necessary to qualify as a regulated investment company and to distribute substantially all of the Fund’s taxable earnings to shareholders. As such, the Fund will not be subject to federal income taxes on otherwise taxable income (including net realized capital gain) that is distributed to shareholders. Therefore, no provision for federal income taxes is recorded in the financial statements. |
The Fund recognizes the tax benefits of uncertain tax positions only when the position is more likely than not to be sustained. Management has analyzed the Fund’s uncertain tax positions and concluded that no liability for unrecognized tax benefits should be recorded related to uncertain tax positions. Management is not aware of any tax positions for which it is reasonably possible that the total amounts of unrecognized tax benefits will change materially in the next 12 months.
The Fund files tax returns in the U.S. Federal jurisdiction and certain other jurisdictions. Generally, the Fund is subject to examinations by such taxing authorities for up to three years after the filing of the return for the tax period.
| F. | Expenses– Fees provided for under the Rule 12b-1 plan of a particular class of the Fund and which are directly attributable to that class are charged to the operations of such class. All other expenses are allocated among the classes based on relative net assets. |
| G. | Accounting Estimates – The preparation of financial statements in conformity with accounting principles generally accepted in the United States of America (“GAAP”) requires management to make estimates and assumptions that affect the reported amounts of assets and liabilities at the date of the financial statements and the reported amounts of revenues and expenses during the reporting period including estimates and assumptions related to taxation. Actual results could differ from those estimates by a significant amount. In addition, the Fund monitors for material events or transactions that may occur or become known after the period-end date and before the date the financial statements are released to print. |
| H. | Indemnifications – Under the Trust’s organizational documents, each Trustee, officer, employee or other agent of the Trust is indemnified against certain liabilities that may arise out of the performance of their duties to the Fund. Additionally, in the normal course of business, the Fund enters into contracts, including the Fund’s servicing agreements, that contain a variety of indemnification clauses. The Fund’s maximum exposure under these arrangements is unknown as this would involve future claims that may be made against the Fund that have not yet occurred. The risk of material loss as a result of such indemnification claims is considered remote. |
| I. | Lower-Rated Securities – The Fund may invest in lower-quality debt securities, i.e., “junk bonds”. Investments in lower-rated securities or unrated securities of comparable quality tend to be more sensitive to economic conditions than higher rated securities. Junk bonds involve a greater risk of default by the issuer because such securities are generally unsecured and are often subordinated to other creditors’ claims. |
| J. | Foreign Currency Translations— Foreign currency is valued at the close of the NYSE based on quotations posted by banks and major currency dealers. Portfolio securities and other assets and liabilities denominated in foreign currencies are translated into U.S. dollar amounts at the date of valuation. Purchases and sales of portfolio securities (net of foreign taxes withheld on disposition) and income items denominated in foreign currencies are translated into U.S. dollar amounts on the respective dates of such transactions. The Fund does not separately account for the portion of the results of operations resulting from changes in foreign exchange rates on investments and the fluctuations arising from changes in market prices of securities held. The combined results of changes in foreign exchange rates and the fluctuation of market prices on |
Invesco V.I. Core Plus Bond Fund
| | investments (net of estimated foreign tax withholding) are included with the net realized and unrealized gain or loss from investments in the Statement of Operations. Reported net realized foreign currency gains or losses arise from (1) sales of foreign currencies, (2) currency gains or losses realized between the trade and settlement dates on securities transactions, and (3) the difference between the amounts of dividends, interest, and foreign withholding taxes recorded on the Fund’s books and the U.S. dollar equivalent of the amounts actually received or paid. Net unrealized foreign currency gains and losses arise from changes in the fair values of assets and liabilities, other than investments in securities at fiscal period end, resulting from changes in exchange rates. |
The Fund may invest in foreign securities, which may be subject to foreign taxes on income, gains on investments or currency repatriation, a portion of which may be recoverable. Foreign taxes, if any, are recorded based on the tax regulations and rates that exist in the foreign markets in which the Fund invests and are shown in the Statement of Operations.
| K. | Forward Foreign Currency Contracts— The Fund may engage in foreign currency transactions either on a spot (i.e. for prompt delivery and settlement) basis, or through forward foreign currency contracts, to manage or minimize currency or exchange rate risk. |
The Fund may also enter into forward foreign currency contracts for the purchase or sale of a security denominated in a foreign currency in order to “lock in” the U.S. dollar price of that security, or the Fund may also enter into forward foreign currency contracts that do not provide for physical settlement of the two currencies, but instead are settled by a single cash payment calculated as the difference between the agreed upon exchange rate and the spot rate at settlement based upon an agreed upon notional amount (non-deliverable forwards). The Fund will set aside liquid assets in an amount equal to the daily mark-to-market obligation for forward foreign currency contracts.
A forward foreign currency contract is an obligation between two parties (“Counterparties”) to purchase or sell a specific currency for an agreed-upon price at a future date. The use of forward foreign currency contracts does not eliminate fluctuations in the price of the underlying securities the Fund owns or intends to acquire but establishes a rate of exchange in advance. Fluctuations in the value of these contracts are measured by the difference in the contract date and reporting date exchange rates and are recorded as unrealized appreciation (depreciation) until the contracts are closed. When the contracts are closed, realized gains (losses) are recorded. Realized and unrealized gains (losses) on the contracts are included in the Statement of Operations. The primary risks associated with forward foreign currency contracts include failure of the Counterparty to meet the terms of the contract and the value of the foreign currency changing unfavorably. These risks may be in excess of the amounts reflected in the Statement of Assets and Liabilities.
| L. | Futures Contracts — The Fund may enter into futures contracts to manage exposure to interest rate, equity and market price movements and/or currency risks. A futures contract is an agreement between Counterparties to purchase or sell a specified underlying security, currency or commodity (or delivery of a cash settlement price, in the case of an index future) for a fixed price at a future date. The Fund currently invests only in exchange-traded futures and they are standardized as to maturity date and underlying financial instrument. Initial margin deposits required upon entering into futures contracts are satisfied by the segregation of specific securities or cash as collateral at the futures commission merchant (broker). During the period the futures contracts are open, changes in the value of the contracts are recognized as unrealized gains or losses by recalculating the value of the contracts on a daily basis. Subsequent or variation margin payments are received or made depending upon whether unrealized gains or losses are incurred. These amounts are reflected as receivables or payables on the Statement of Assets and Liabilities. When the contracts are closed or expire, the Fund recognizes a realized gain or loss equal to the difference between the proceeds from, or cost of, the closing transaction and the Fund’s basis in the contract. The net realized gain (loss) and the change in unrealized gain (loss) on futures contracts held during the period is included on the Statement of Operations. The primary risks associated with futures contracts are market risk and the absence of a liquid secondary market. If the Fund were unable to liquidate a futures contract and/or enter into an offsetting closing transaction, the Fund would continue to be subject to market risk with respect to the value of the contracts and continue to be required to maintain the margin deposits on the futures contracts. Futures contracts have minimal Counterparty risk since the exchange’s clearinghouse, as Counterparty to all exchange-traded futures, guarantees the futures against default. Risks may exceed amounts recognized in the Statement of Assets and Liabilities. |
| M. | Dollar Rolls and Forward Commitment Transactions - The Fund may enter into dollar roll transactions to enhance the Fund’s performance. The Fund executes its dollar roll transactions in theto be announced (“TBA”) market whereby the Fund makes a forward commitment to purchase a security and, instead of accepting delivery, the position is offset by the sale of the security with a simultaneous agreement to repurchase at a future date. |
The Fund accounts for dollar roll transactions as purchases and sales and realizes gains and losses on these transactions. These transactions increase the Fund’s portfolio turnover rate. The Fund will segregate liquid assets in an amount equal to its dollar roll commitments.
Dollar roll transactions involve the risk that a Counterparty to the transaction may fail to complete the transaction. If this occurs, the Fund may lose the opportunity to purchase or sell the security at the agreed upon price. Dollar roll transactions also involve the risk that the value of the securities retained by the Fund may decline below the price of the securities that the Fund has sold but is obligated to purchase under the agreement. Dollar roll transactions covered in this manner are not treated as senior securities for purposes of a Fund’s fundamental investment limitation on senior securities and borrowings.
| N. | Leverage Risk — Leverage exists when the Fund can lose more than it originally invests because it purchases or sells an instrument or enters into a transaction without investing an amount equal to the full economic exposure of the instrument or transaction. |
| O. | Collateral—To the extent the Fund has designated or segregated a security as collateral and that security is subsequently sold, it is the Fund’s practice to replace such collateral no later than the next business day. |
Invesco V.I. Core Plus Bond Fund
NOTE 2—Advisory Fees and Other Fees Paid to Affiliates
The Trust has entered into a master investment advisory agreement with Invesco Advisers, Inc. (the "Adviser" or "Invesco"). Under the terms of the investment advisory agreement, the Fund accrues daily and pays monthly an advisory fee to the Adviser based on the annual rate of the Fund’s average daily net assets as follows:
| Average Daily Net Assets | Rate |
| First $500 million | 0.45% |
| Next $500 million | 0.425% |
| Next $1.5 billion | 0.40% |
| Next $2.5 billion | 0.375% |
| Over $5 billion | 0.35% |
For the six months ended June 30, 2019, the effective advisory fees incurred by the Fund was 0.45%.
Under the terms of a master sub-advisory agreement between the Adviser and each of Invesco Asset Management Deutschland GmbH, Invesco Asset Management Limited, Invesco Asset Management (Japan) Limited, Invesco Hong Kong Limited, Invesco Senior Secured Management, Inc. and Invesco Canada Ltd. and separate sub-advisory agreements with Invesco Capital Management LLC and Invesco Asset Management (India) Private Limited (collectively, the "Affiliated Sub-Advisers") the Adviser, not the Fund, will pay 40% of the fees paid to the Adviser to any such Affiliated Sub-Adviser(s) that provide(s) discretionary investment management services to the Fund based on the percentage of assets allocated to such Affiliated Sub-Adviser(s).
The Adviser has contractually agreed, through at least April 30, 2020, to waive advisory fees and/or reimburse expenses of all shares to the extent necessary to limit total annual fund operating expenses after fee waiver and/or expense reimbursement (excluding certain items discussed below) of Series I shares to 0.61% and Series II shares to 0.86% of average daily net assets (the “expense limits”). In determining the Adviser’s obligation to waive advisory fees and/or reimburse expenses, the following expenses are not taken into account, and could cause the total annual fund operating expenses after fee waiver and/or expense reimbursement to exceed the numbers reflected above: (1) interest; (2) taxes; (3) dividend expense on short sales; (4) extraordinary or non-routine items, including litigation expenses; and (5) expenses that the Fund has incurred but did not actually pay because of an expense offset arrangement. Unless Invesco continues the fee waiver agreement, it will terminate on April 30, 2020. During its term, the fee waiver agreement cannot be terminated or amended to increase the expense limits or reduce the advisory fee waiver without approval of the Board of Trustees. To the extent that the annualized expense ratio does not exceed the expense limits, the Adviser will retain its ability to be reimbursed for such fee waivers or reimbursements prior to the end of each fiscal year.
Further, the Adviser has contractually agreed, through at least June 30, 2021, to waive the advisory fee payable by the Fund in an amount equal to 100% of the net advisory fees the Adviser receives from the affiliated money market funds on investments by the Fund of uninvested cash in such affiliated money market funds.
For the six months ended June 30, 2019, the Adviser waived advisory fees of $42,302 and reimbursed Fund expenses of $12,339.
The Trust has entered into a master administrative services agreement with Invesco pursuant to which the Fund has agreed to pay Invesco a fee for costs incurred in providing accounting services and fund administrative services to the Fund and to reimburse Invesco for fees paid to insurance companies that have agreed to provide certain administrative services to the Fund. These administrative services provided by the insurance companies may include, among other things: maintenance of master accounts with the Fund; tracking, recording and transmitting net purchase and redemption orders for Fund shares; maintaining and preserving records related to the purchase, redemption and other account activity of variable product owners; distributing copies of Fund documents such as prospectuses, proxy materials and periodic reports, to variable product owners, and responding to inquiries from variable product owners about the Fund. Pursuant to such agreement, for the six months ended June 30, 2019, Invesco was paid $1,327 for accounting and fund administrative services and was reimbursed $14,099 for fees paid to insurance companies. Also, Invesco has entered into a sub-administration agreement whereby State Street Bank and Trust Company (“SSB”) serves as custodian and fund accountant and provides certain administrative services to the Fund.
The Trust has entered into a transfer agency and service agreement with Invesco Investment Services, Inc. (“IIS”) pursuant to which the Fund has agreed to pay IIS a fee for providing transfer agency and shareholder services to the Fund and reimburse IIS for certain expenses incurred by IIS in the course of providing such services. IIS may make payments to intermediaries that provide omnibus account services, sub-accounting services and/or networking services. All fees payable by IIS to intermediaries that provide omnibus account services or sub-accounting services are charged back to the Fund, subject to certain limitations approved by the Trust’s Board of Trustees. For the six months ended June 30, 2019, expenses incurred under the agreement are shown in the Statement of Operations asTransfer agent fees.
The Trust has entered into a master distribution agreement with Invesco Distributors, Inc. (“IDI”) to serve as the distributor for the Fund. The Trust has adopted a plan pursuant to Rule 12b-1 under the 1940 Act with respect to the Fund’s Series II shares (the “Plan”). The Fund, pursuant to the Plan, pays IDI compensation at the annual rate of 0.25% of the Fund’s average daily net assets of Series II shares. The fees are accrued daily and paid monthly. Of the Plan payments, up to 0.25% of the average daily net assets of the Series II shares may be paid to insurance companies who furnish continuing personal shareholder services to customers who purchase and own Series II shares of the Fund. For the six months ended June 30, 2019, expenses incurred under the Plan are detailed in the Statement of Operations asDistribution fees.
Certain officers and trustees of the Trust are officers and directors of the Adviser, IIS and/or IDI.
NOTE 3—Additional Valuation Information
GAAP defines fair value as the price that would be received to sell an asset or paid to transfer a liability in an orderly transaction between market participants at the measurement date, under current market conditions. GAAP establishes a hierarchy that prioritizes the inputs to valuation methods, giving the highest priority to readily available unadjusted quoted prices in an active market for identical assets (Level 1) and the lowest priority to
Invesco V.I. Core Plus Bond Fund
significant unobservable inputs (Level 3), generally when market prices are not readily available or are unreliable. Based on the valuation inputs, the securities or other investments are tiered into one of three levels. Changes in valuation methods may result in transfers in or out of an investment’s assigned level:
Level 1 – Prices are determined using quoted prices in an active market for identical assets.
Level 2 – Prices are determined using other significant observable inputs. Observable inputs are inputs that other market participants may use in pricing a security. These may include quoted prices for similar securities, interest rates, prepayment speeds, credit risk, yield curves, loss severities, default rates, discount rates, volatilities and others.
Level 3 – Prices are determined using significant unobservable inputs. In situations where quoted prices or observable inputs are unavailable (for example, when there is little or no market activity for an investment at the end of the period), unobservable inputs may be used. Unobservable inputs reflect the Fund’s own assumptions about the factors market participants would use in determining fair value of the securities or instruments and would be based on the best available information.
The following is a summary of the tiered valuation input levels, as of June 30, 2019. The level assigned to the securities valuations may not be an indication of the risk or liquidity associated with investing in those securities. Because of the inherent uncertainties of valuation, the values reflected in the financial statements may materially differ from the value received upon actual sale of those investments.
| | Level 1 | Level 2 | Level 3 | Total |
| Investments in Securities | | | | |
| U.S. Dollar Denominated Bonds & Notes | $— | $9,704,660 | $— | $9,704,660 |
| U.S. Government Sponsored Agency Mortgage-Backed Securities | — | 4,438,712 | — | 4,438,712 |
| Asset-Backed Securities | — | 3,221,813 | — | 3,221,813 |
| U.S. Treasury Securities | — | 1,372,570 | — | 1,372,570 |
| Preferred Stocks | 152,206 | — | — | 152,206 |
| Non-U.S. Dollar Denominated Bonds & Notes | — | 123,462 | — | 123,462 |
| Variable Rate Senior Loan Interests | — | 25,281 | — | 25,281 |
| Common Stocks & Other Equity Interests | 35 | — | 444 | 479 |
| Money Market Funds | 6,363,533 | — | — | 6,363,533 |
| Total Investments in Securities | 6,515,774 | 18,886,498 | 444 | 25,402,716 |
| Other Investments - Assets* | | | | |
| Futures Contracts | 67,881 | — | — | 67,881 |
| Other Investments - Liabilities* | | | | |
| Futures Contracts | (26,218) | — | — | (26,218) |
| Forward Foreign Currency Contracts | — | (2,560) | — | (2,560) |
| | (26,218) | (2,560) | — | (28,778) |
| Total Other Investments | 41,663 | (2,560) | — | 39,103 |
| Total Investments | $6,557,437 | $18,883,938 | $444 | $25,441,819 |
| * | Unrealized appreciation (depreciation). |
NOTE 4—Derivative Investments
The Fund may enter into an International Swaps and Derivatives Association Master Agreement (“ISDA Master Agreement”) under which a fund may trade OTC derivatives. An OTC transaction entered into under an ISDA Master Agreement typically involves a collateral posting arrangement, payment netting provisions and close-out netting provisions. These netting provisions allow for reduction of credit risk through netting of contractual obligations. The enforceability of the netting provisions of the ISDA Master Agreement depends on the governing law of the ISDA Master Agreement, among other factors.
For financial reporting purposes, the Fund does not offset OTC derivative assets or liabilities that are subject to ISDA Master Agreements in the Statement of Assets and Liabilities.
Value of Derivative Investments at Period-End
The table below summarizes the value of the Fund’s derivative investments, detailed by primary risk exposure, held as of June 30, 2019:
| | Value |
| Derivative Assets | Currency
Risk | Interest
Rate Risk | Total |
| Unrealized appreciation on futures contracts — Exchange-Traded(a) | $- | $67,881 | $67,881 |
| Derivatives not subject to master netting agreements | - | (67,881) | (67,881) |
| Total Derivative Assets subject to master netting agreements | $- | $- | $- |
Invesco V.I. Core Plus Bond Fund
| | Value |
| Derivative Liabilities | Currency
Risk | Interest
Rate Risk | Total |
| Unrealized depreciation on futures contracts — Exchange-Traded(a) | $- | $(26,218) | $(26,218) |
| Unrealized depreciation on forward foreign currency contracts outstanding | (2,560) | - | (2,560) |
| Total Derivative Liabilities | (2,560) | (26,218) | (28,778) |
| Derivatives not subject to master netting agreements | - | 26,218 | 26,218 |
| Total Derivative Liabilities subject to master netting agreements | $(2,560) | $- | $(2,560) |
| (a) | The daily variation margin receivable (payable) at period-end is recorded in the Statement of Assets and Liabilities. |
Offsetting Assets and Liabilities
The table below reflects the Fund’s exposure to Counterparties subject to either an ISDA Master Agreement or other agreement for OTC derivative transactions as of June 30, 2019.
| | Financial
Derivative
Assets | | Financial
Derivative
Liabilities | | Net Value of
Derivatives | | Collateral
(Received)/Pledged | | | | | | |
| Counterparty | Forward Foreign
Currency Contracts | | Forward Foreign
Currency Contracts | | Net Value of
Derivatives | | Non-Cash | Cash | Net
Amount | | | | |
| Goldman Sachs International | $– | | $(2,560) | | $(2,560) | | $– | $– | $(2,560) | | | | |
Effect of Derivative Investments for the six months ended June 30, 2019
The table below summarizes the gains (losses) on derivative investments, detailed by primary risk exposure, recognized in earnings during the period:
| | Location of Gain (Loss) on
Statement of Operations |
| | Currency
Risk | Interest
Rate Risk | Total |
| Realized Gain: | | | |
| Forward foreign currency contracts | $5,110 | $- | $5,110 |
| Futures contracts | - | 47,976 | 47,976 |
| Change in Net Unrealized Appreciation (Depreciation): | | | |
| Forward foreign currency contracts | (1,717) | - | (1,717) |
| Futures contracts | - | 18,361 | 18,361 |
| Total | $3,393 | $66,337 | $69,730 |
The table below summarizes the average notional value of derivatives held during the period.
| | Forward
Foreign Currency
Contracts | Futures
Contracts |
| Average notional value | $165,943 | $4,433,801 |
NOTE 5—Trustees’ and Officers’ Fees and Benefits
Trustees’ and Officers’ Fees and Benefits include amounts accrued by the Fund to pay remuneration to certain Trustees and Officers of the Fund. Trustees have the option to defer compensation payable by the Fund, and Trustees’ and Officers’ Fees and Benefits also include amounts accrued by the Fund to fund such deferred compensation amounts. Those Trustees who defer compensation have the option to select various Invesco Funds in which their deferral accounts shall be deemed to be invested. Finally, certain current Trustees were eligible to participate in a retirement plan that provided for benefits to be paid upon retirement to Trustees over a period of time based on the number of years of service. The Fund may have certain former Trustees who also participate in a retirement plan and receive benefits under such plan.Trustees’ and Officers’ Fees and Benefits include amounts accrued by the Fund to fund such retirement benefits. Obligations under the deferred compensation and retirement plans represent unsecured claims against the general assets of the Fund.
NOTE 6—Cash Balances
The Fund may borrow for leveraging in an amount up to 5% of the Fund’s total assets (excluding the amount borrowed) at the time the borrowing is made. In doing so, the Fund is permitted to temporarily carry a negative or overdrawn balance in its account with SSB, the custodian bank. Such balances, if any at period end, are shown in the Statement of Assets and Liabilities under the payable captionAmount due custodian. To compensate the custodian bank for such overdrafts, the overdrawn Fund may either (1) leave funds as a compensating balance in the account so the custodian bank can be compensated by earning the additional interest; or (2) compensate by paying the custodian bank at a rate agreed upon by the custodian bank and Invesco, not to exceed the contractually agreed upon rate. The Fund may not purchase additional securities when any borrowings from banks exceed 5% of the Fund’s total assets.
Invesco V.I. Core Plus Bond Fund
NOTE 7—Tax Information
The amount and character of income and gains to be distributed are determined in accordance with income tax regulations, which may differ from GAAP. Reclassifications are made to the Fund’s capital accounts to reflect income and gains available for distribution (or available capital loss carryforward) under income tax regulations. The tax character of distributions paid during the year and the tax components of net assets will be reported at the Fund’s fiscal year-end.
Capital loss carryforward is calculated and reported as of a specific date. Results of transactions and other activity after that date may affect the amount of capital loss carryforward actually available for the Fund to utilize. The ability to utilize capital loss carryforwards in the future may be limited under the Internal Revenue Code and related regulations based on the results of future transactions.
The Fund had a capital loss carryforward as of December 31, 2018, as follows:
| Capital Loss Carryforward* |
| Expiration | Short-Term | Long-Term | Total |
| Not subject to expiration | $303,213 | $61,338 | $364,551 |
| * | Capital loss carryforwards as of the date listed above is reduced for limitations, if any, to the extent required by the Internal Revenue Code and may be further limited depending upon a variety of factors, including the realization of net unrealized gains or losses as of the date of any reorganization. |
NOTE 8—Investment Transactions
The aggregate amount of investment securities (other than short-term securities, U.S. Treasury obligations and money market funds, if any) purchased and sold by the Fund during the six months ended June 30, 2019 was $43,063,835 and $42,347,808, respectively. During the same period, purchases and sales of U.S. Treasury obligations were $5,204,594 and $5,281,205, respectively. Cost of investments, including any derivatives, on a tax basis includes the adjustments for financial reporting purposes as of the most recently completed federal income tax reporting period-end.
| Unrealized Appreciation (Depreciation) of Investments on a Tax Basis |
| Aggregate unrealized appreciation of investments | $599,942 |
| Aggregate unrealized (depreciation) of investments | (104,950) |
| Net unrealized appreciation of investments | $494,992 |
Cost of investments for tax purposes is $24,946,827.
NOTE 9—Share Information
| | Summary of Share Activity |
| | Six months ended
June 30, 2019(a) | | Year ended
December 31, 2018 |
| | Shares | Amount | | Shares | Amount |
| Sold: | | | | | |
| Series I | 823,154 | $5,165,535 | | 395,009 | $2,447,919 |
| Series II | 9 | 57 | | 3 | 19 |
| Issued as reinvestment of dividends: | | | | | |
| Series I | — | — | | 105,501 | 636,171 |
| Series II | — | — | | 625 | 3,758 |
| Reacquired: | | | | | |
| Series I | (276,671) | (1,717,055) | | (851,917) | (5,305,086) |
| Series II | (170) | (1,052) | | (335) | (2,055) |
| Net increase (decrease) in share activity | 546,322 | $3,447,485 | | (351,114) | $(2,219,274) |
| (a) | There are entities that are record owners of more than 5% of the outstanding shares of the Fund and in the aggregate own 87% of the outstanding shares of the Fund. The Fund and the Fund’s principal underwriter or adviser, are parties to participation agreements with these entities whereby these entities sell units of interest in separate accounts funding variable products that are invested in the Fund. The Fund, Invesco and/or Invesco affiliates may make payments to these entities, which are considered to be related to the Fund, for providing services to the Fund, Invesco and/or Invesco affiliates including but not limited to services such as, securities brokerage, third party record keeping and account servicing and administrative services. The Fund has no knowledge as to whether all or any portion of the shares owned of record by these entities are also owned beneficially. |
Invesco V.I. Core Plus Bond Fund
Calculating your ongoing Fund expenses
Example
As a shareholder of the Fund, you incur ongoing costs, including management fees; distribution and/or service fees (12b-1); and other Fund expenses. This example is intended to help you understand your ongoing costs (in dollars) of investing in the Fund and to compare these costs with ongoing costs of investing in other mutual funds. The example is based on an investment of $1,000 invested at the beginning of the period and held for the entire period January 1, 2019 through June 30, 2019.
The actual and hypothetical expenses in the examples below do not represent the effect of any fees or other expenses assessed in connection with a variable product; if they did, the expenses shown would be higher while the ending account values shown would be lower.
Actual expenses
The table below provides information about actual account values and actual expenses. You may use the information in this table, together with the amount you invested, to estimate the expenses that you paid over the period. Simply divide your account value by $1,000 (for example, an $8,600 account value divided by $1,000 = 8.6), then multiply the result by the number in the table under the heading entitled “Actual Expenses Paid During Period” to estimate the expenses you paid on your account during this period.
Hypothetical example for comparison purposes
The table below also provides information about hypothetical account values and hypothetical expenses based on the Fund’s actual expense ratio and an assumed rate of return of 5% per year before expenses, which is not the Fund’s actual return.
The hypothetical account values and expenses may not be used to estimate the actual ending account balance or expenses you paid for the period. You may use this information to compare the ongoing costs of investing in the Fund and other funds. To do so, compare this 5% hypothetical example with the 5% hypothetical examples that appear in the shareholder reports of the other funds.
Please note that the expenses shown in the table are meant to highlight your ongoing costs. Therefore, the hypothetical information is useful in comparing ongoing costs, and will not help you determine the relative total costs of owning different funds.
| | Beginning
Account Value (01/01/19) | ACTUAL | HYPOTHETICAL
(5% annual return before
expenses) | Annualized
Expense
Ratio |
Ending
Account Value
(06/30/19)1 | Expenses
Paid During
Period2 | Ending
Account Value
(06/30/19) | Expenses
Paid During
Period2 |
| Series I | $1,000.00 | $1,078.30 | $3.04 | $1,021.87 | $2.96 | 0.59% |
| Series II | 1,000.00 | 1,077.10 | 4.33 | 1,020.63 | 4.21 | 0.84 |
| 1 | The actual ending account value is based on the actual total return of the Fund for the period January 1, 2019 through June 30, 2019, after actual expenses and will differ from the hypothetical ending account value which is based on the Fund’s expense ratio and a hypothetical annual return of 5% before expenses. |
| 2 | Expenses are equal to the Fund’s annualized expense ratio as indicated above multiplied by the average account value over the period, multiplied by 181/365 to reflect the most recent fiscal half year. |
Invesco V.I. Core Plus Bond Fund
Approval of Investment Advisory andSub-Advisory Contracts
At meetings held on June 10, 2019, the Board of Trustees (the Board or the Trustees) of AIM Variable Insurance Funds (Invesco Variable Insurance Funds) as a whole, and the independent Trustees, who comprise over 75% of the Board, voting separately, approved the continuance of the Invesco V.I. Core Plus Bond Fund’s (the Fund) Master Investment Advisory Agreement with Invesco Advisers, Inc. (Invesco Advisers and the investment advisory agreement) and the Master IntergroupSub-Advisory Contract for Mutual Funds with Invesco Asset Management Deutschland GmbH, Invesco Asset Management Limited, Invesco Asset Management (Japan) Limited, Invesco Hong Kong Limited, Invesco Senior Secured Management, Inc. and Invesco Canada Ltd. and separatesub-advisory contracts with Invesco Capital Management LLC and Invesco Asset Management (India) Private Limited (collectively, the AffiliatedSub-Advisers and thesub-advisory contracts) for another year, effective July 1, 2019. After evaluating the factors discussed below, among others, the Board approved the renewal of the Fund’s investment advisory agreement and thesub-advisory contracts and determined that the compensation payable by the Fund to Invesco Advisers and by Invesco Advisers to the AffiliatedSub-Advisers is fair and reasonable.
The Board’s Evaluation Process
The Board’s Investments Committee has established threeSub-Committees, which meet throughout the year to review the performance of funds advised by Invesco Advisers (the Invesco Funds). As part of a regularly scheduled basis ofin-person Board meetings, theSub-Committees meet with portfolio managers for their assigned Invesco Funds and other members of management to review detailed information about investment performance and portfolio attributes of these funds. The Board took into account evaluations and reports that it received from the Investments Committee andSub-Committees, as well as the information provided to such committees and the Board throughout the year, in considering whether to approve each Invesco Fund’s investment advisory agreement andsub-advisory contracts.
As part of the contract renewal process, the Board reviews and considers information provided in response to detailed requests for information submitted to management by the independent Trustees with assistance from legal counsel to the independent Trustees. The Board receives comparative investment performance and fee data regarding the Invesco Funds prepared by Invesco Advisers and Broadridge Financial Solutions, Inc. (Broadridge), an independent mutual fund data provider. The Board also receives an independent written evaluation from the Senior Officer, an officer of the Invesco Funds who reports directly to the
independent Trustees. The Senior Officer’s evaluation is prepared as part of his responsibility to manage the process by which the Invesco Funds’ proposed management fees are negotiated during the annual contract renewal process to ensure they are negotiated in a manner that is at arms’ length and reasonable. In addition to meetings with Invesco Advisers and fund counsel throughout the year, the independent Trustees also discuss the continuance of the investment advisory agreement andsub-advisory contracts in separate sessions with the Senior Officer and with independent legal counsel.
The discussion below is a summary of the Senior Officer’s independent written evaluation with respect to the Fund’s investment advisory agreement, as well as a discussion of the material factors and related conclusions that formed the basis for the Board’s approval of the Fund’s investment advisory agreement andsub-advisory contracts. The Trustees’ review and conclusions are based on the comprehensive consideration of all information presented to them during the course of the year and in prior years and are not the result of any single determinative factor. Moreover, one Trustee may have weighed a particular piece of information or factor differently than another Trustee. This information is current as of June 10, 2019.
Factors and Conclusions and Summary of Independent Written Fee Evaluation
| A. | Nature, Extent and Quality of Services Provided by Invesco Advisers and the AffiliatedSub-Advisers |
The Board reviewed the nature, extent and quality of the advisory services provided to the Fund by Invesco Advisers under the Fund’s investment advisory agreement, and the credentials and experience of the officers and employees of Invesco Advisers who provide these services, including the Fund’s portfolio manager(s). The Board’s review included consideration of Invesco Advisers’ investment process oversight and structure, credit analysis and investment risk management. The Board also considerednon-advisory services that Invesco Advisers and its affiliates provide to the Invesco Funds such as various back office support functions, third party oversight, internal audit, valuation, portfolio trading and legal and compliance. The Board also received and reviewed information about Invesco Advisers’ role as administrator of the Invesco Funds’ liquidity risk management program. The Board also reviewed and considered the benefits to shareholders of investing in a fund that is part of the Invesco family of funds under the umbrella of Invesco Ltd., Invesco Advisers’ parent company, and noted Invesco Ltd.’s depth and experience in conducting an investment management business, as well as its
commitment of financial and other resources to such business. The Board reviewed and considered information about the resources that Invesco Advisers intends to continue to commit to managing the Invesco family of funds following Invesco Ltd.’s acquisition of OppenheimerFunds, Inc. and its subsidiaries. The Board concluded that the nature, extent and quality of the services provided to the Fund by Invesco Advisers are appropriate and satisfactory.
The Board reviewed the services that may be provided by the AffiliatedSub-Advisers under thesub-advisory contracts and the credentials and experience of the officers and employees of the AffiliatedSub-Advisers who provide these services. The Board noted the AffiliatedSub-Advisers’ expertise with respect to certain asset classes and that the AffiliatedSub-Advisers have offices and personnel that are located in financial centers around the world. As a result, the Board noted that the AffiliatedSub-Advisers can provide research and investment analysis on the markets and economies of various countries in which the Fund may invest, make recommendations regarding securities and assist with security trades. The Board concluded that thesub-advisory contracts may benefit the Fund and its shareholders by permitting Invesco Advisers to use the resources and talents of the AffiliatedSub-Advisers in managing the Fund. The Board concluded that the nature, extent and quality of the services that may be provided by the AffiliatedSub-Advisers are appropriate and satisfactory.
| B. | Fund Investment Performance |
The Board considered Fund investment performance as a relevant factor in considering whether to approve the investment advisory agreement. The Board did not view Fund investment performance as a relevant factor in considering whether to approve thesub-advisory contracts for the Fund, as no AffiliatedSub-Adviser currently manages assets of the Fund.
The Board compared the Fund’s investment performance over multiple time periods ending December 31, 2018 to the performance of funds in the Broadridge performance universe and against the Lipper Variable Underlying Funds Core Plus Bond Funds Index. The Board noted that performance of Series I shares of the Fund was in the fifth quintile of its performance universe for the one year period and the first quintile for the three and five year periods (the first quintile being the best performing funds and the fifth quintile being the worst performing funds). The Board noted that performance of Series I shares of the Fund was below the perfomance of the Index for the one year period and above the performance of the Index for the three and five year periods. The Board noted that the Fund’s overweight exposure to high
Invesco V.I. Core Plus Bond Fund
yield and investment grade credit as well as emerging markets negatively impacted Fund performance. The Trustees also reviewed more recent Fund performance and this review did not change their conclusions.
| C. | Advisory andSub-Advisory Fees and Fund Expenses |
The Board compared the Fund’s contractual management fee rate to the contractual management fee rates of funds in the Fund’s Broadridge expense group. The Board noted that the contractual management fee rate for Series I shares of the Fund was the same as the median contractual management fee rate of funds in its expense group. The Board noted that the term “contractual management fee” for funds in the expense group may include both advisory and certainnon-portfolio management administrative services fees, but that Broadridge does not provide information on a fund by fund basis as to what is included. The Board also reviewed the methodology used by Broadridge in providing expense group information, which includes using each fund’s contractual management fee schedule (including any applicable breakpoints) as reported in the most recent prospectus or statement of additional information for each fund in the expense group. The Board also considered comparative information regarding the Fund’s total expense ratio and its various components.
The Board noted that Invesco Advisers has contractually agreed to waive fees and/or limit expenses of the Fund for the term disclosed in the Fund’s registration statement in an amount necessary to limit total annual operating expenses to a specified percentage of average daily net assets for each class of the Fund.
The Board also considered the fees charged by Invesco Advisers and the AffiliatedSub-Advisers to other similarly managed client accounts. The Board noted that Invesco Advisers or the AffiliatedSub-Advisers may charge lower fees to large institutional clients. Invesco Advisers reviewed with the Board differences in the scope of services it provides to the Invesco Funds relative to certain other types of client accounts, including management of cash flows as a result of redemptions and purchases, necessary infrastructure such as officers, office space, technology, legal and distribution, oversight of service providers, costs and business risks associated with launching new funds and sponsoring and maintaining the product line, preparation of annual registration statement updates and financial information and compliance with federal and state laws and regulations.
The Board also considered the services that may be provided by the AffiliatedSub-Advisers pursuant to thesub-advisory contracts, as well as the fees payable by Invesco Advisers to the AffiliatedSub-Advisers pursuant to thesub-advisory contracts.
| D. | Economies of Scale and Breakpoints |
The Board considered the extent to which there may be economies of scale in the provision of
advisory services to the Fund. The Board considered Invesco’s reinvestment in its business, including investments in business infrastructure and cybersecurity. The Board also considered that the Fund may benefit from economies of scale through contractual breakpoints in the Fund’s advisory fee schedule, which generally operate to reduce the Fund’s expense ratio as it grows in size. The Board noted that the Fund shares directly in economies of scale through lower fees charged by third party service providers based on the combined size of the Invesco Funds. The Board noted that the Fund may also benefit from economies of scale through initial fee setting, fee waivers and expense reimbursements.
| E. | Profitability and Financial Resources |
The Board reviewed information from Invesco Advisers concerning the costs of the advisory and other services that Invesco Advisers and its affiliates provide to the Fund and the Invesco Funds and the profitability of Invesco Advisers and its affiliates in providing these services. The Board considered the methodology used for calculating profitability and noted the periodic review of such methodology by an independent consultant. The Board noted that Invesco Advisers continues to operate at a net profit from services Invesco Advisers and its affiliates provide to the Invesco Funds. The Board received information from Invesco Advisers demonstrating that Invesco Advisers and the AffiliatedSub-Advisers are financially sound and have the resources necessary to perform their obligations under the investment advisory agreement andsub-advisory contracts.
| F. | Collateral Benefits to Invesco Advisers and its Affiliates |
The Board considered various other benefits received by Invesco Advisers and its affiliates from the relationship with the Fund, including the fees received for providing administrative, transfer agency and distribution services to the Fund. The Board considered comparative information regarding fees charged for these services, including information provided by Broadridge and other independent sources. The Board considered the performance of Invesco Advisers and its affiliates in providing these services and the organizational structure employed to provide these services. The Board also considered that these services are provided to the Fund pursuant to written contracts that are reviewed and approved on an annual basis by the Board; and that the services are required for the operation of the Fund.
The Board considered the benefits realized by Invesco Advisers and the AffiliatedSub-Advisers as a result of portfolio brokerage transactions executed through “soft dollar” arrangements. Invesco Advisers noted that the Fund does not execute brokerage transactions through “soft dollar” arrangements to any significant degree.
The Board considered that the Fund’s uninvested cash and cash collateral from any securities lending arrangements may be invested in money market funds advised by Invesco Advisers pursuant to procedures
approved by the Board. The Board considered information regarding the returns of the affiliated money market funds relative to comparable overnight investments, as well as the costs to the Fund of such investments. The Board noted that Invesco Advisers receives advisory fees from these affiliated money market funds attributable to such investments, although Invesco Advisers has contractually agreed to waive through varying periods the advisory fees payable by the Invesco Funds with respect to certain investments in the affiliated money market funds. The waiver is in an amount equal to 100% of the net advisory fee Invesco Advisers receives from the affiliated money market funds with respect to the Fund’s investment in the affiliated money market funds of uninvested cash, but not cash collateral. The Board concluded that the amount of advisory fees received by Invesco Advisers from the Fund’s investment of cash collateral from any securities lending arrangements in the affiliated money market funds is fair and reasonable.
Invesco V.I. Core Plus Bond Fund
| Semiannual Report to Shareholders | June 30, 2019 |
Invesco V.I. Diversified Dividend Fund
Beginning on January 1, 2021, as permitted by regulations adopted by the Securities and Exchange Commission, the insurance company that offers your variable annuity or variable life insurance contract may no longer send you paper copies of the Fund’s shareholder reports by mail, unless you specifically request paper copies of the reports from the insurance company or your financial intermediary. Instead of delivering paper copies of the report, the insurance company may choose to make the reports available on a website, and will notify you by mail each time a report is posted and provide you with a website link to access the report. Instructions for requesting paper copies will be provided by your insurance company.
If the insurance company offers electronic delivery, you may elect to receive shareholder reports and other communications about the Fund electronically by following the instructions provided by the insurance company or by contacting your financial intermediary. If you already elected to receive shareholder reports electronically, you will not be affected by this change and you need not take any action.
You may elect to receive all future reports in paper free of charge from the insurance company. You can inform the insurance company or your financial intermediary that you wish to continue receiving paper copies of your shareholder reports by following the instructions provided by the insurance company or by contacting your financial intermediary. Your election to receive reports in paper will apply to all portfolio companies available under your contract with the insurance company.
The Fund provides a complete list of its holdings four times in each fiscal year, at the quarter-ends. For the second and fourth quarters, the lists appear in the Fund’s semiannual and annual reports to shareholders. For the first and third quarters, the Fund files the lists with the Securities and Exchange Commission (SEC) on Form N-Q (or any successor Form). The Fund’s Form N-Q (or any successor Form) filings are available on the SEC website, sec.gov. The SEC file numbers for the Fund are 811-07452 and 033-57340. The Fund’s most recent portfolio holdings, as filed on Form N-Q (or any successor Form), have also been made available to insurance companies issuing variable annuity contracts and variable life insurance policies (“variable products”) that invest in the Fund.
A description of the policies and procedures that the Fund uses to determine how to vote proxies relating to portfolio securities is available without charge, upon request, from our Client Services department at 800 959 4246 or at invesco.com/proxyguidelines. The information is also available on the SEC website, sec.gov.
Information regarding how the Fund voted proxies related to its portfolio securities during the most recent 12-month period ended June 30 is available at invesco.com/proxysearch. The information is also available on the SEC website, sec.gov.
Invesco Advisers, Inc. is an investment adviser; it provides investment advisory services to individual and institutional clients and does not sell securities. Invesco Distributors, Inc. is the US distributor for Invesco Ltd.’s retail mutual funds, exchange-traded funds and institutional money market funds. Both are wholly owned, indirect subsidiaries of Invesco Ltd.
This report must be accompanied or preceded by a currently effective Fund prospectus and variable product prospectus, which contain more complete information, including sales charges and expenses. Investors should read each carefully before investing.
NOT FDIC INSURED | MAY LOSE VALUE | NO BANK GUARANTEE
| Invesco Distributors, Inc. | VIDDI-SAR-1 |
Performance summary
Fund vs. Indexes
Cumulative total returns, December 31, 2018 to June 30, 2019, excluding variable product issuer charges. If variable product issuer charges were included, returns would be lower.
| Series I Shares | 15.23% |
| Series II Shares | 15.04 |
| S&P 500 Index▼ (Broad Market Index) | 18.54 |
Russell 1000 Value Index■
(Style-Specific Index) | 16.24 |
Lipper Large-Cap Value Funds Index♦
(Peer Group Index) | 15.89 |
| Source(s):▼FactSet Research Systems Inc.;■ RIMES Technologies Corp.;♦ Lipper Inc. |
TheS&P 500® Index is an unmanaged index considered representative of the US stock market.
TheRussell 1000®Value Index is an unmanaged index considered representative of large-cap value stocks. The Russell 1000 Value Index is a trademark/service mark of the Frank Russell Co. Russell® is a trademark of the Frank Russell Co.
TheLipper VUF Large-Cap Value Funds Index is an unmanaged index considered representative of large-cap value variable insurance underlying funds tracked by Lipper.
The Fund is not managed to track the performance of any particular index, including the indexes described here, and consequently, the performance of the Fund may deviate significantly from the performance of the indexes.
A direct investment cannot be made in an index. Unless otherwise indicated, index results include reinvested dividends, and they do not reflect sales charges. Performance of the peer group, if applicable, reflects fund expenses; performance of a market index does not.
| Average Annual Total Returns |
| As of 6/30/19 |
| Series I Shares | |
| Inception (3/1/90) | 8.04% |
| 10 Years | 12.35 |
| 5 Years | 7.17 |
| 1 Year | 8.83 |
| Series II Shares | |
| Inception (6/5/00) | 5.59% |
| 10 Years | 12.07 |
| 5 Years | 6.90 |
| 1 Year | 8.54 |
Effective June 1, 2010, Class X and Class Y shares of the predecessor fund, Morgan Stanley Variable Investment Dividend Growth Portfolio, advised by Morgan Stanley Investment Advisors Inc. were reorganized into Series I and Series II shares, respectively, of Invesco V.I. Dividend Growth Fund (renamed Invesco V.I. Diversified Dividend Fund on April 30, 2012). Returns shown above, prior to June 1, 2010, for Series I and Series II shares are blended returns of the predecessor fund and Invesco V.I. Dividend Growth Fund. Share class returns will differ from the predecessor fund because of different expenses.
The performance data quoted represent past performance and cannot guarantee comparable future results; current performance may be lower or higher. Please contact your variable product issuer or financial adviser for the most recent month-end variable product performance. Performance figures reflect Fund expenses, reinvested distributions and changes in net asset value. Performance figures do not reflect deduction of taxes a share-
holder would pay on Fund distributions or sale of Fund shares. Investment return and principal value will fluctuate so that you may have a gain or loss when you sell shares.
The net annual Fund operating expense ratio set forth in the most recent Fund prospectus as of the date of this report for Series I and Series II shares was 0.65% and 0.90%, respectively.1 The total annual Fund operating expense ratio set forth in the most recent Fund prospectus as of the date of this report for Series I and Series II shares was 0.66% and 0.91%, respectively. The expense ratios presented above may vary from the expense ratios presented in other sections of this report that are based on expenses incurred during the period covered by this report.
Invesco V.I. Diversified Dividend Fund, a series portfolio of AIM Variable Insurance Funds (Invesco Variable Insurance Funds), is currently offered through insurance companies issuing variable products. You cannot purchase shares of the Fund directly. Performance figures given represent the
Fund and are not intended to reflect actual variable product values. They do not reflect sales charges, expenses and fees assessed in connection with a variable product. Sales charges, expenses and fees, which are determined by the variable product issuers, will vary and will lower the total return.
The most recent month-end performance at the Fund level, excluding variable product charges, is available at 800 451 4246. As mentioned above, for the most recent month-end performance including variable product charges, please contact your variable product issuer or financial adviser.
Fund performance reflects any applicable fee waivers and/or expense reimbursements. Had the adviser not waived fees and/or reimbursed expenses currently or in the past, returns would have been lower. See current prospectus for more information.
| 1 | Total annual Fund operating expenses after any contractual fee waivers and/or expense reimbursements by the adviser in effect through at least June 30, 2021. See current prospectus for more information. |
Invesco V.I. Diversified Dividend Fund
Schedule of Investments(a)
June 30, 2019
(Unaudited)
| | Shares | Value |
| Common Stocks & Other Equity Interests–94.46% |
| Aerospace & Defense–1.62% |
| General Dynamics Corp. | 31,435 | $5,715,512 |
| Raytheon Co. | 12,741 | 2,215,405 |
| | | | 7,930,917 |
| Air Freight & Logistics–1.04% |
| United Parcel Service, Inc., Class B | 49,143 | 5,074,998 |
| Apparel Retail–1.30% |
| TJX Cos., Inc. (The) | 120,274 | 6,360,089 |
| Apparel, Accessories & Luxury Goods–0.50% |
| Columbia Sportswear Co. | 24,655 | 2,469,445 |
| Asset Management & Custody Banks–0.63% |
| Federated Investors, Inc., Class B | 94,053 | 3,056,723 |
| Brewers–3.21% |
| Anheuser-Busch InBev S.A./N.V. (Belgium) | 67,964 | 6,019,230 |
| Heineken N.V. (Netherlands) | 86,894 | 9,699,119 |
| | | | 15,718,349 |
| Construction Machinery & Heavy Trucks–0.98% |
| Cummins, Inc. | 28,072 | 4,809,856 |
| Consumer Finance–1.55% |
| American Express Co. | 61,230 | 7,558,231 |
| Data Processing & Outsourced Services–1.25% |
| Automatic Data Processing, Inc. | 36,955 | 6,109,770 |
| Diversified Chemicals–0.40% |
| BASF S.E. (Germany) | 27,135 | 1,971,234 |
| Electric Utilities–11.59% |
| American Electric Power Co., Inc. | 92,439 | 8,135,556 |
| Duke Energy Corp. | 69,452 | 6,128,444 |
| Entergy Corp. | 140,559 | 14,467,738 |
| Exelon Corp. | 240,555 | 11,532,207 |
| PPL Corp. | 357,376 | 11,082,230 |
| SSE PLC (United Kingdom) | 373,820 | 5,332,240 |
| | | | 56,678,415 |
| Electrical Components & Equipment–1.71% |
| ABB Ltd. (Switzerland) | 274,667 | 5,515,542 |
| Emerson Electric Co. | 42,746 | 2,852,013 |
| | | | 8,367,555 |
| Fertilizers & Agricultural Chemicals–0.65% |
| Nutrien Ltd. (Canada) | 59,146 | 3,163,818 |
| Food Distributors–1.20% |
| Sysco Corp. | 82,831 | 5,857,808 |
| | Shares | Value |
| General Merchandise Stores–1.24% |
| Target Corp. | 69,763 | $6,042,173 |
| Health Care Equipment–0.42% |
| Stryker Corp. | 10,099 | 2,076,152 |
| Household Products–4.83% |
| Kimberly-Clark Corp. | 76,127 | 10,146,206 |
| Procter & Gamble Co. (The) | 122,815 | 13,466,665 |
| | | | 23,612,871 |
| Industrial Conglomerates–1.19% |
| Siemens AG (Germany) | 48,932 | 5,816,286 |
| Industrial Machinery–2.68% |
| Flowserve Corp. | 200,499 | 10,564,292 |
| Pentair PLC | 68,862 | 2,561,667 |
| | | | 13,125,959 |
| Integrated Oil & Gas–3.76% |
| Royal Dutch Shell PLC, Class B (United Kingdom) | 74,972 | 2,445,478 |
| Suncor Energy, Inc. (Canada) | 206,133 | 6,430,096 |
| TOTAL S.A. (France) | 170,097 | 9,517,115 |
| | | | 18,392,689 |
| Integrated Telecommunication Services–4.76% |
| AT&T, Inc. | 383,187 | 12,840,596 |
| BT Group PLC (United Kingdom) | 1,937,140 | 4,842,084 |
| Deutsche Telekom AG (Germany) | 321,885 | 5,570,378 |
| | | | 23,253,058 |
| Motorcycle Manufacturers–1.20% |
| Harley-Davidson, Inc. | 163,355 | 5,853,010 |
| Multi-line Insurance–3.11% |
| Hartford Financial Services Group, Inc. (The) | 272,803 | 15,200,583 |
| Multi-Utilities–6.02% |
| Consolidated Edison, Inc. | 98,943 | 8,675,322 |
| Dominion Energy, Inc. | 149,099 | 11,528,335 |
| Sempra Energy | 67,254 | 9,243,390 |
| | | | 29,447,047 |
| Oil & Gas Equipment & Services–0.80% |
| Baker Hughes, a GE Co., Class A | 159,238 | 3,922,032 |
| Oil & Gas Exploration & Production–1.38% |
| ConocoPhillips | 110,420 | 6,735,620 |
| Packaged Foods & Meats–9.55% |
| Campbell Soup Co. | 210,280 | 8,425,919 |
| Danone S.A. (France) | 48,693 | 4,129,671 |
| General Mills, Inc. | 293,216 | 15,399,704 |
See accompanying Notes to Financial Statements which are an integral part of the financial statements.
Invesco V.I. Diversified Dividend Fund
| | Shares | Value |
| Packaged Foods & Meats–(continued) |
| Kraft Heinz Co. (The) | 96,897 | $3,007,683 |
| Mondelez International, Inc., Class A | 172,453 | 9,295,217 |
| Nestle S.A. (Switzerland) | 62,165 | 6,435,864 |
| | | | 46,694,058 |
| Paper Packaging–2.35% |
| Avery Dennison Corp. | 22,193 | 2,567,286 |
| International Paper Co. | 115,671 | 5,010,868 |
| Sonoco Products Co. | 60,035 | 3,922,687 |
| | | | 11,500,841 |
| Personal Products–1.50% |
| L’Oreal S.A. (France) | 25,719 | 7,325,929 |
| Pharmaceuticals–6.82% |
| Bayer AG (Germany) | 92,013 | 6,391,161 |
| Bristol-Myers Squibb Co. | 129,512 | 5,873,369 |
| Eli Lilly and Co. | 65,710 | 7,280,011 |
| Johnson & Johnson | 39,719 | 5,532,062 |
| Merck & Co., Inc. | 98,880 | 8,291,088 |
| | | | 33,367,691 |
| Property & Casualty Insurance–1.88% |
| Travelers Cos., Inc. (The) | 61,524 | 9,199,068 |
| Regional Banks–7.38% |
| Comerica, Inc. | 15,912 | 1,155,848 |
| Cullen/Frost Bankers, Inc. | 36,029 | 3,374,476 |
| Fifth Third Bancorp | 160,460 | 4,476,834 |
| KeyCorp | 140,104 | 2,486,846 |
| M&T Bank Corp. | 62,475 | 10,625,123 |
| PNC Financial Services Group, Inc. (The) | 44,775 | 6,146,712 |
| | Shares | Value |
| Regional Banks–(continued) |
| Zions Bancorp. N.A. | 170,617 | $7,844,970 |
| | | | 36,110,809 |
| Restaurants–0.46% |
| Darden Restaurants, Inc. | 18,338 | 2,232,285 |
| Soft Drinks–2.82% |
| Coca-Cola Co. (The) | 270,768 | 13,787,507 |
| Specialized REIT–1.39% |
| Weyerhaeuser Co. | 257,195 | 6,774,516 |
| Tobacco–1.29% |
| Altria Group, Inc. | 60,755 | 2,876,749 |
| Philip Morris International, Inc. | 43,605 | 3,424,301 |
| | | | 6,301,050 |
| Total Common Stocks & Other Equity Interests (Cost $363,891,783) | 461,898,442 |
| Money Market Funds–5.70% |
| Invesco Government & Agency Portfolio, Institutional Class, 2.26%(b) | 10,871,009 | 10,871,009 |
| Invesco Liquid Assets Portfolio, Institutional Class, 2.40%(b) | 7,819,479 | 7,822,607 |
| Invesco Treasury Portfolio, Institutional Class, 2.22%(b) | 9,147,944 | 9,147,944 |
| Total Money Market Funds (Cost $27,839,617) | 27,841,560 |
| TOTAL INVESTMENTS IN SECURITIES–100.16% (Cost $391,731,400) | 489,740,002 |
| OTHER ASSETS LESS LIABILITIES–(0.16)% | (769,312) |
| NET ASSETS–100.00% | $488,970,690 |
Investment Abbreviations:
| REIT | – Real Estate Investment Trust |
Notes to Schedule of Investments:
| (a) | Industry and/or sector classifications used in this report are generally according to the Global Industry Classification Standard, which was developed by and is the exclusive property and a service mark of MSCI Inc. and Standard & Poor’s. |
| (b) | The money market fund and the Fund are affiliated by having the same investment adviser. The rate shown is the 7-day SEC standardized yield as of June 30, 2019. |
| Open Forward Foreign Currency Contracts |
Settlement
Date | Counterparty | Contract to | Unrealized
Appreciation
(Depreciation) |
| Deliver | Receive |
| Currency Risk | | | | | | |
| 07/19/2019 | JP Morgan Chase Bank N.A. | EUR | 108,210 | USD | 121,303 | $(1,917) |
| 07/19/2019 | State Street Bank & Trust Co. | EUR | 20,833,125 | USD | 23,350,496 | (372,443) |
| Total Forward Foreign Currency Contracts | $(374,360) |
| Abbreviations: |
| EUR | – Euro |
| USD | – U.S. Dollar |
See accompanying Notes to Financial Statements which are an integral part of the financial statements.
Invesco V.I. Diversified Dividend Fund
Portfolio Composition
By sector, based on Net Assets
as of June 30, 2019
| Consumer Staples | 24.40% |
| Utilities | 17.61 |
| Financials | 14.55 |
| Industrials | 9.22 |
| Health Care | 7.24 |
| Energy | 5.94 |
| Communication Services | 4.76 |
| Consumer Discretionary | 4.70 |
| Materials | 3.40 |
| Other Sectors, Each Less than 2% of Net Assets | 2.64 |
| Money Market Funds Plus Other Assets Less Liabilities | 5.54 |
See accompanying Notes to Financial Statements which are an integral part of the financial statements.
Invesco V.I. Diversified Dividend Fund
Statement of Assets and Liabilities
June 30, 2019
(Unaudited)
| Assets: | |
Investments in securities, at value
(Cost $363,891,783) | $461,898,442 |
| Investments in affiliated money market funds, at value (Cost $27,839,617) | 27,841,560 |
| Cash | 23,998 |
| Foreign currencies, at value (Cost $203,214) | 203,560 |
| Receivable for: | |
| Fund shares sold | 61,255 |
| Investments sold | 715,415 |
| Dividends | 1,072,947 |
| Investment for trustee deferred compensation and retirement plans | 88,395 |
| Total assets | 491,905,572 |
| Liabilities: | |
| Other investments: | |
| Unrealized depreciation on forward foreign currency contracts outstanding | 374,360 |
| Payable for: | |
| Investments purchased | 1,406,226 |
| Fund shares reacquired | 669,136 |
| Accrued fees to affiliates | 318,250 |
| Accrued trustees’ and officers’ fees and benefits | 594 |
| Accrued other operating expenses | 42,305 |
| Trustee deferred compensation and retirement plans | 124,011 |
| Total liabilities | 2,934,882 |
| Net assets applicable to shares outstanding | $488,970,690 |
| Net assets consist of: | |
| Shares of beneficial interest | $307,116,947 |
| Distributable earnings | 181,853,743 |
| | $488,970,690 |
| Net Assets: |
| Series I | $262,870,014 |
| Series II | $226,100,676 |
| Shares outstanding, no par value, with an unlimited number of shares authorized: |
| Series I | 9,626,553 |
| Series II | 8,349,216 |
| Series I: | |
| Net asset value per share | $27.31 |
| Series II: | |
| Net asset value per share | $27.08 |
Statement of Operations
For the six months ended June 30, 2019
(Unaudited)
| Investment income: | |
| Dividends (net of foreign withholding taxes of $306,490) | $9,262,254 |
| Dividends from affiliated money market funds | 394,878 |
| Total investment income | 9,657,132 |
| Expenses: | |
| Advisory fees | 1,323,805 |
| Administrative services fees | 386,696 |
| Custodian fees | 23,865 |
| Distribution fees - Series II | 273,840 |
| Transfer agent fees | 18,762 |
| Trustees’ and officers’ fees and benefits | 16,342 |
| Reports to shareholders | 5,883 |
| Professional services fees | 33,559 |
| Other | 8,440 |
| Total expenses | 2,091,192 |
| Less: Fees waived | (19,613) |
| Net expenses | 2,071,579 |
| Net investment income | 7,585,553 |
| Realized and unrealized gain (loss) from: | |
| Net realized gain from: | |
| Investment securities | 37,979,589 |
| Foreign currencies | 91,095 |
| Forward foreign currency contracts | 693,268 |
| | 38,763,952 |
| Change in net unrealized appreciation (depreciation) of: | |
| Investment securities | 31,477,513 |
| Foreign currencies | 1,524 |
| Forward foreign currency contracts | (119,023) |
| | 31,360,014 |
| Net realized and unrealized gain | 70,123,966 |
| Net increase in net assets resulting from operations | $77,709,519 |
See accompanying Notes to Financial Statements which are an integral part of the financial statements.
Invesco V.I. Diversified Dividend Fund
Statement of Changes in Net Assets
For the six months ended June 30, 2019 and the year ended December 31, 2018
(Unaudited)
| | June 30,
2019 | December 31,
2018 |
| Operations: | | |
| Net investment income | $7,585,553 | $14,230,667 |
| Net realized gain | 38,763,952 | 25,484,538 |
| Change in net unrealized appreciation (depreciation) | 31,360,014 | (85,816,560) |
| Net increase (decrease) in net assets resulting from operations | 77,709,519 | (46,101,355) |
| Distributions to shareholders from distributable earnings: | | |
| Series I | — | (22,064,854) |
| Series II | — | (12,822,377) |
| Total distributions from distributable earnings | — | (34,887,231) |
| Share transactions–net: | | |
| Series I | (121,875,800) | (48,998,234) |
| Series II | (9,212,651) | (7,380,757) |
| Net increase (decrease) in net assets resulting from share transactions | (131,088,451) | (56,378,991) |
| Net increase (decrease) in net assets | (53,378,932) | (137,367,577) |
| Net assets: | | |
| Beginning of period | 542,349,622 | 679,717,199 |
| End of period | $488,970,690 | $542,349,622 |
See accompanying Notes to Financial Statements which are an integral part of the financial statements.
Invesco V.I. Diversified Dividend Fund
Financial Highlights
June 30, 2019
(Unaudited)
The following schedule presents financial highlights for a share of the Fund outstanding throughout the periods indicated.
| | Net asset
value,
beginning
of period | Net
investment
income(a) | Net gains
(losses)
on securities
(both
realized and
unrealized) | Total from
investment
operations | Dividends
from net
investment
income | Distributions
from net
realized
gains | Total
distributions | Net asset
value, end
of period | Total
return(b) | Net assets,
end of period
(000’s omitted) | Ratio of
expenses
to average
net assets
with fee waivers
and/or expenses
absorbed | Ratio of
expenses
to average net
assets without
fee waivers
and/or expenses
absorbed | Ratio of net
investment
income
to average
net assets | Portfolio
turnover(c) |
| Series I |
| Six months ended 06/30/19 | $23.70 | $0.36 | $3.25 | $3.61 | $— | $— | $— | $27.31 | 15.23% | $262,870 | 0.64%(d) | 0.65%(d) | 2.83%(d) | 3% |
| Year ended 12/31/18 | 27.18 | 0.63 | (2.53) | (1.90) | (0.65) | (0.93) | (1.58) | 23.70 | (7.57) | 337,461 | 0.64 | 0.65 | 2.38 | 10 |
| Year ended 12/31/17 | 26.38 | 0.56 | 1.65 | 2.21 | (0.46) | (0.95) | (1.41) | 27.18 | 8.58 | 437,104 | 0.64 | 0.65 | 2.06 | 16 |
| Year ended 12/31/16 | 23.27 | 0.50 | 2.93 | 3.43 | (0.32) | — | (0.32) | 26.38 | 14.81 | 439,857 | 0.66 | 0.68 | 2.02 | 14 |
| Year ended 12/31/15 | 23.21 | 0.43 | 0.04 | 0.47 | (0.41) | — | (0.41) | 23.27 | 2.07 | 333,573 | 0.70 | 0.71 | 1.84 | 15 |
| Year ended 12/31/14 | 20.93 | 0.40 | 2.26 | 2.66 | (0.38) | — | (0.38) | 23.21 | 12.83 | 330,370 | 0.72 | 0.73 | 1.80 | 6 |
| Series II |
| Six months ended 06/30/19 | 23.54 | 0.33 | 3.21 | 3.54 | — | — | — | 27.08 | 15.04 | 226,101 | 0.89(d) | 0.90(d) | 2.58(d) | 3 |
| Year ended 12/31/18 | 27.00 | 0.56 | (2.51) | (1.95) | (0.58) | (0.93) | (1.51) | 23.54 | (7.78) | 204,889 | 0.89 | 0.90 | 2.13 | 10 |
| Year ended 12/31/17 | 26.23 | 0.49 | 1.64 | 2.13 | (0.41) | (0.95) | (1.36) | 27.00 | 8.31 | 242,614 | 0.89 | 0.90 | 1.81 | 16 |
| Year ended 12/31/16 | 23.16 | 0.43 | 2.92 | 3.35 | (0.28) | — | (0.28) | 26.23 | 14.54 | 215,614 | 0.91 | 0.93 | 1.77 | 14 |
| Year ended 12/31/15 | 23.11 | 0.37 | 0.04 | 0.41 | (0.36) | — | (0.36) | 23.16 | 1.82 | 132,477 | 0.95 | 0.96 | 1.59 | 15 |
| Year ended 12/31/14 | 20.85 | 0.34 | 2.25 | 2.59 | (0.33) | — | (0.33) | 23.11 | 12.54 | 105,813 | 0.97 | 0.98 | 1.55 | 6 |
| (a) | Calculated using average shares outstanding. |
| (b) | Includes adjustments in accordance with accounting principles generally accepted in the United States of America and as such, the net asset value for financial reporting purposes and the returns based upon those net asset values may differ from the net asset value and returns for shareholder transactions. Total returns are not annualized for periods less than one year, if applicable, and do not reflect charges assessed in connection with a variable product, which if included would reduce total returns. |
| (c) | Portfolio turnover is calculated at the fund level and is not annualized for periods less than one year, if applicable. |
| (d) | Ratios are annualized and based on average daily net assets (000’s omitted) of $340,315 and $220,888 for Series I and Series II shares, respectively. |
See accompanying Notes to Financial Statements which are an integral part of the financial statements.
Invesco V.I. Diversified Dividend Fund
Notes to Financial Statements
June 30, 2019
(Unaudited)
NOTE 1—Significant Accounting Policies
Invesco V.I. Diversified Dividend Fund (the “Fund”) is a series portfolio of AIM Variable Insurance Funds (Invesco Variable Insurance Funds) (the “Trust”). The Trust is a Delaware statutory trust registered under the Investment Company Act of 1940, as amended (the “1940 Act”), as an open-end series management investment company. Information presented in these financial statements pertains only to the Fund. Matters affecting the Fund or each class will be voted on exclusively by the shareholders of the Fund or each class. Current Securities and Exchange Commission (“SEC”) guidance, however, requires participating insurance companies offering separate accounts to vote shares proportionally in accordance with the instructions of the contract owners whose investments are funded by shares of each Fund or class.
The Fund’s investment objective is to provide reasonable current income and long-term growth of income and capital.
The Fund currently offers two classes of shares, Series I and Series II, both of which are offered to insurance company separate accounts funding variable annuity contracts and variable life insurance policies (“variable products”).
The Fund is an investment company and accordingly follows the investment company accounting and reporting guidance in accordance with Financial Accounting Standards Board Accounting Standards Codification Topic 946,Financial Services – Investment Companies.
The following is a summary of the significant accounting policies followed by the Fund in the preparation of its financial statements.
| A. | Security Valuations — Securities, including restricted securities, are valued according to the following policy. |
A security listed or traded on an exchange (except convertible securities) is valued at its last sales price or official closing price as of the close of the customary trading session on the exchange where the security is principally traded, or lacking any sales or official closing price on a particular day, the security may be valued at the closing bid price on that day. Securities traded in the over-the-counter market are valued based on prices furnished by independent pricing services or market makers. When such securities are valued by an independent pricing service they may be considered fair valued. Futures contracts are valued at the final settlement price set by an exchange on which they are principally traded. Listed options are valued at the mean between the last bid and asked prices from the exchange on which they are principally traded. Options not listed on an exchange are valued by an independent source at the mean between the last bid and asked prices. For purposes of determining net asset value (“NAV”) per share, futures and option contracts generally are valued 15 minutes after the close of the customary trading session of the New York Stock Exchange (“NYSE”).
Investments in open-end and closed-end registered investment companies that do not trade on an exchange are valued at the end-of-day net asset value per share. Investments in open-end and closed-end registered investment companies that trade on an exchange are valued at the last sales price or official closing price as of the close of the customary trading session on the exchange where the security is principally traded.
Debt obligations (including convertible securities) and unlisted equities are fair valued using an evaluated quote provided by an independent pricing service. Evaluated quotes provided by the pricing service may be determined without exclusive reliance on quoted prices, and may reflect appropriate factors such as institution-size trading in similar groups of securities, developments related to specific securities, dividend rate (for unlisted equities), yield (for debt obligations), quality, type of issue, coupon rate (for debt obligations), maturity (for debt obligations), individual trading characteristics and other market data. Pricing services generally value debt obligations assuming orderly transactions of institutional round lot size, but a fund may hold or transact in the same securities in smaller, odd lot sizes. Odd lots often trade at lower prices than institutional round lots. Debt obligations are subject to interest rate and credit risks. In addition, all debt obligations involve some risk of default with respect to interest and/or principal payments.
Foreign securities’ (including foreign exchange contracts) prices are converted into U.S. dollar amounts using the applicable exchange rates as of the close of the NYSE. If market quotations are available and reliable for foreign exchange-traded equity securities, the securities will be valued at the market quotations. Because trading hours for certain foreign securities end before the close of the NYSE, closing market quotations may become unreliable. If between the time trading ends on a particular security and the close of the customary trading session on the NYSE, events occur that the investment adviser determines are significant and make the closing price unreliable, the Fund may fair value the security. If the event is likely to have affected the closing price of the security, the security will be valued at fair value in good faith using procedures approved by the Board of Trustees. Adjustments to closing prices to reflect fair value may also be based on a screening process of an independent pricing service to indicate the degree of certainty, based on historical data, that the closing price in the principal market where a foreign security trades is not the current value as of the close of the NYSE. Foreign securities’ prices meeting the approved degree of certainty that the price is not reflective of current value will be priced at the indication of fair value from the independent pricing service. Multiple factors may be considered by the independent pricing service in determining adjustments to reflect fair value and may include information relating to sector indices, American Depositary Receipts and domestic and foreign index futures. Foreign securities may have additional risks including exchange rate changes, potential for sharply devalued currencies and high inflation, political and economic upheaval, the relative lack of issuer information, relatively low market liquidity and the potential lack of strict financial and accounting controls and standards.
Securities for which market prices are not provided by any of the above methods may be valued based upon quotes furnished by independent sources. The last bid price may be used to value equity securities. The mean between the last bid and asked prices is used to value debt obligations, including corporate loans.
Securities for which market quotations are not readily available or became unreliable are valued at fair value as determined in good faith by or under the supervision of the Trust’s officers following procedures approved by the Board of Trustees. Issuer specific events, market trends, bid/asked quotes of brokers and information providers and other market data may be reviewed in the course of making a good faith determination of a security’s fair value.
The Fund may invest in securities that are subject to interest rate risk, meaning the risk that the prices will generally fall as interest rates rise and, conversely, the prices will generally rise as interest rates fall. Specific securities differ in their sensitivity to changes in interest rates depending on their individual characteristics. Changes in interest rates may result in increased market volatility, which may affect the value and/or liquidity of certain Fund investments.
Invesco V.I. Diversified Dividend Fund
Valuations change in response to many factors including the historical and prospective earnings of the issuer, the value of the issuer’s assets, general economic conditions, interest rates, investor perceptions and market liquidity. Because of the inherent uncertainties of valuation, the values reflected in the financial statements may materially differ from the value received upon actual sale of those investments.
| B. | Securities Transactions and Investment Income — Securities transactions are accounted for on a trade date basis. Realized gains or losses on sales are computed on the basis of specific identification of the securities sold. Interest income (net of withholding tax, if any) is recorded on the accrual basis from settlement date. Dividend income (net of withholding tax, if any) is recorded on the ex-dividend date. |
The Fund may periodically participate in litigation related to Fund investments. As such, the Fund may receive proceeds from litigation settlements. Any proceeds received are included in the Statement of Operations as realized gain (loss) for investments no longer held and as unrealized gain (loss) for investments still held.
Brokerage commissions and mark ups are considered transaction costs and are recorded as an increase to the cost basis of securities purchased and/or a reduction of proceeds on a sale of securities. Such transaction costs are included in the determination of net realized and unrealized gain (loss) from investment securities reported in the Statement of Operations and the Statement of Changes in Net Assets and the net realized and unrealized gains (losses) on securities per share in the Financial Highlights. Transaction costs are included in the calculation of the Fund’s net asset value and, accordingly, they reduce the Fund’s total returns. These transaction costs are not considered operating expenses and are not reflected in net investment income reported in the Statement of Operations and the Statement of Changes in Net Assets, or the net investment income per share and the ratios of expenses and net investment income reported in the Financial Highlights, nor are they limited by any expense limitation arrangements between the Fund and the investment adviser.
The Fund allocates income and realized and unrealized capital gains and losses to a class based on the relative net assets of each class.
| C. | Country Determination — For the purposes of making investment selection decisions and presentation in the Schedule of Investments, the investment adviser may determine the country in which an issuer is located and/or credit risk exposure based on various factors. These factors include the laws of the country under which the issuer is organized, where the issuer maintains a principal office, the country in which the issuer derives 50% or more of its total revenues and the country that has the primary market for the issuer’s securities, as well as other criteria. Among the other criteria that may be evaluated for making this determination are the country in which the issuer maintains 50% or more of its assets, the type of security, financial guarantees and enhancements, the nature of the collateral and the sponsor organization. Country of issuer and/or credit risk exposure has been determined to be the United States of America, unless otherwise noted. |
| D. | Distributions– Distributions from net investment income and net realized capital gain, if any, are generally declared and paid to separate accounts of participating insurance companies annually and recorded on the ex-dividend date. |
| E. | Federal Income Taxes –The Fund intends to comply with the requirements of Subchapter M of the Internal Revenue Code of 1986, as amended (the “Internal Revenue Code”), necessary to qualify as a regulated investment company and to distribute substantially all of the Fund’s taxable earnings to shareholders. As such, the Fund will not be subject to federal income taxes on otherwise taxable income (including net realized capital gain) that is distributed to shareholders. Therefore, no provision for federal income taxes is recorded in the financial statements. |
The Fund recognizes the tax benefits of uncertain tax positions only when the position is more likely than not to be sustained. Management has analyzed the Fund’s uncertain tax positions and concluded that no liability for unrecognized tax benefits should be recorded related to uncertain tax positions. Management is not aware of any tax positions for which it is reasonably possible that the total amounts of unrecognized tax benefits will change materially in the next 12 months.
The Fund files tax returns in the U.S. Federal jurisdiction and certain other jurisdictions. Generally, the Fund is subject to examinations by such taxing authorities for up to three years after the filing of the return for the tax period.
| F. | Expenses– Fees provided for under the Rule 12b-1 plan of a particular class of the Fund and which are directly attributable to that class are charged to the operations of such class. All other expenses are allocated among the classes based on relative net assets. |
| G. | Accounting Estimates – The preparation of financial statements in conformity with accounting principles generally accepted in the United States of America (“GAAP”) requires management to make estimates and assumptions that affect the reported amounts of assets and liabilities at the date of the financial statements and the reported amounts of revenues and expenses during the reporting period including estimates and assumptions related to taxation. Actual results could differ from those estimates by a significant amount. In addition, the Fund monitors for material events or transactions that may occur or become known after the period-end date and before the date the financial statements are released to print. |
| H. | Indemnifications – Under the Trust’s organizational documents, each Trustee, officer, employee or other agent of the Trust is indemnified against certain liabilities that may arise out of the performance of their duties to the Fund. Additionally, in the normal course of business, the Fund enters into contracts, including the Fund’s servicing agreements, that contain a variety of indemnification clauses. The Fund’s maximum exposure under these arrangements is unknown as this would involve future claims that may be made against the Fund that have not yet occurred. The risk of material loss as a result of such indemnification claims is considered remote. |
| I. | Foreign Currency Translations— Foreign currency is valued at the close of the NYSE based on quotations posted by banks and major currency dealers. Portfolio securities and other assets and liabilities denominated in foreign currencies are translated into U.S. dollar amounts at the date of valuation. Purchases and sales of portfolio securities (net of foreign taxes withheld on disposition) and income items denominated in foreign currencies are translated into U.S. dollar amounts on the respective dates of such transactions. The Fund does not separately account for the portion of the results of operations resulting from changes in foreign exchange rates on investments and the fluctuations arising from changes in market prices of securities held. The combined results of changes in foreign exchange rates and the fluctuation of market prices on investments (net of estimated foreign tax withholding) are included with the net realized and unrealized gain or loss from investments in the Statement of Operations. Reported net realized foreign currency gains or losses arise from (1) sales of foreign currencies, (2) currency gains or losses realized between the trade and settlement dates on securities transactions, and (3) the difference between the amounts of dividends, interest, and foreign withholding taxes recorded on the Fund’s books and the U.S. dollar equivalent of the amounts actually received or paid. Net unrealized foreign currency gains and losses arise from changes in the fair values of assets and liabilities, other than investments in securities at fiscal period end, resulting from changes in exchange rates. |
The Fund may invest in foreign securities, which may be subject to foreign taxes on income, gains on investments or currency repatriation, a portion of which may be recoverable. Foreign taxes, if any, are recorded based on the tax regulations and rates that exist in the foreign markets in which the Fund invests and are shown in the Statement of Operations.
Invesco V.I. Diversified Dividend Fund
| J. | Forward Foreign Currency Contracts— The Fund may engage in foreign currency transactions either on a spot (i.e. for prompt delivery and settlement) basis, or through forward foreign currency contracts, to manage or minimize currency or exchange rate risk. |
The Fund may also enter into forward foreign currency contracts for the purchase or sale of a security denominated in a foreign currency in order to “lock in” the U.S. dollar price of that security, or the Fund may also enter into forward foreign currency contracts that do not provide for physical settlement of the two currencies, but instead are settled by a single cash payment calculated as the difference between the agreed upon exchange rate and the spot rate at settlement based upon an agreed upon notional amount (non-deliverable forwards). The Fund will set aside liquid assets in an amount equal to the daily mark-to-market obligation for forward foreign currency contracts.
A forward foreign currency contract is an obligation between two parties (“Counterparties”) to purchase or sell a specific currency for an agreed-upon price at a future date. The use of forward foreign currency contracts does not eliminate fluctuations in the price of the underlying securities the Fund owns or intends to acquire but establishes a rate of exchange in advance. Fluctuations in the value of these contracts are measured by the difference in the contract date and reporting date exchange rates and are recorded as unrealized appreciation (depreciation) until the contracts are closed. When the contracts are closed, realized gains (losses) are recorded. Realized and unrealized gains (losses) on the contracts are included in the Statement of Operations. The primary risks associated with forward foreign currency contracts include failure of the Counterparty to meet the terms of the contract and the value of the foreign currency changing unfavorably. These risks may be in excess of the amounts reflected in the Statement of Assets and Liabilities.
NOTE 2—Advisory Fees and Other Fees Paid to Affiliates
The Trust has entered into a master investment advisory agreement with Invesco Advisers, Inc. (the "Adviser" or "Invesco"). Under the terms of the investment advisory agreement, the Fund accrues daily and pays monthly an advisory fee to the Adviser based on the annual rate of the Fund’s average daily net assets as follows:
| Average Daily Net Assets | Rate |
| First $250 million | 0.545% |
| Next $750 million | 0.42% |
| Next $1 billion | 0.395% |
| Over $2 billion | 0.37% |
For the six months ended June 30, 2019, the effective advisory fees incurred by the Fund was 0.48%.
Under the terms of a master sub-advisory agreement between the Adviser and each of Invesco Asset Management Deutschland GmbH, Invesco Asset Management Limited, Invesco Asset Management (Japan) Limited, Invesco Hong Kong Limited, Invesco Senior Secured Management, Inc. and Invesco Canada Ltd. and separate sub-advisory agreements with Invesco Capital Management LLC and Invesco Asset Management (India) Private Limited (collectively, the "Affiliated Sub-Advisers") the Adviser, not the Fund, will pay 40% of the fees paid to the Adviser to any such Affiliated Sub-Adviser(s) that provide(s) discretionary investment management services to the Fund based on the percentage of assets allocated to such Affiliated Sub-Adviser(s).
The Adviser has contractually agreed, through at least June 30, 2020, to waive advisory fees and/or reimburse expenses of all shares to the extent necessary to limit total annual fund operating expenses after fee waiver and/or expense reimbursement (excluding certain items discussed below) of Series I shares to 2.00% and Series II shares to 2.25% of average daily net assets (the “expense limits”). In determining the Adviser’s obligation to waive advisory fees and/or reimburse expenses, the following expenses are not taken into account, and could cause the total annual fund operating expenses after fee waiver and/or expense reimbursement to exceed the numbers reflected above: (1) interest; (2) taxes; (3) dividend expense on short sales; (4) extraordinary or non-routine items, including litigation expenses; and (5) expenses that the Fund has incurred but did not actually pay because of an expense offset arrangement. Unless Invesco continues the fee waiver agreement, it will terminate on June 30, 2020. During its term, the fee waiver agreement cannot be terminated or amended to increase the expense limits or reduce the advisory fee waiver without approval of the Board of Trustees. The Adviser did not waive fees and/or reimburse expenses during the period under these expense limits.
Further, the Adviser has contractually agreed, through at least June 30, 2021, to waive the advisory fee payable by the Fund in an amount equal to 100% of the net advisory fees the Adviser receives from the affiliated money market funds on investments by the Fund of uninvested cash in such affiliated money market funds.
For the six months ended June 30, 2019, the Adviser waived advisory fees of $19,613.
The Trust has entered into a master administrative services agreement with Invesco pursuant to which the Fund has agreed to pay Invesco a fee for costs incurred in providing accounting services and fund administrative services to the Fund and to reimburse Invesco for fees paid to insurance companies that have agreed to provide certain administrative services to the Fund. These administrative services provided by the insurance companies may include, among other things: maintenance of master accounts with the Fund; tracking, recording and transmitting net purchase and redemption orders for Fund shares; maintaining and preserving records related to the purchase, redemption and other account activity of variable product owners; distributing copies of Fund documents such as prospectuses, proxy materials and periodic reports, to variable product owners, and responding to inquiries from variable product owners about the Fund. Pursuant to such agreement, for the six months ended June 30, 2019, Invesco was paid $39,288 for accounting and fund administrative services and was reimbursed $347,408 for fees paid to insurance companies. Also, Invesco has entered into a sub-administration agreement whereby State Street Bank and Trust Company (“SSB”) serves as custodian and fund accountant and provides certain administrative services to the Fund.
The Trust has entered into a transfer agency and service agreement with Invesco Investment Services, Inc. (“IIS”) pursuant to which the Fund has agreed to pay IIS a fee for providing transfer agency and shareholder services to the Fund and reimburse IIS for certain expenses incurred by IIS in the course of providing such services. For the six months ended June 30, 2019, expenses incurred under the agreement are shown in the Statement of Operations asTransfer agent fees.
The Trust has entered into a master distribution agreement with Invesco Distributors, Inc. (“IDI”) to serve as the distributor for the Fund. The Trust has adopted a plan pursuant to Rule 12b-1 under the 1940 Act with respect to the Fund’s Series II shares (the “Plan”). The Fund, pursuant to the Plan, pays IDI compensation at the annual rate of 0.25% of the Fund’s average daily net assets of Series II shares. The fees are accrued daily and paid monthly. Of the Plan payments, up to 0.25% of the average daily net assets of the Series II shares may be paid to insurance companies who furnish
Invesco V.I. Diversified Dividend Fund
continuing personal shareholder services to customers who purchase and own Series II shares of the Fund. For the six months ended June 30, 2019, expenses incurred under the Plan are detailed in the Statement of Operations asDistribution fees.
For the six-month period ended June 30, 2019, the Fund incurred $226 in brokerage commissions with Invesco Capital Markets, Inc., an affiliate of the Adviser and IDI, for portfolio transactions executed on behalf of the Fund.
Certain officers and trustees of the Trust are officers and directors of the Adviser, IIS and/or IDI.
NOTE 3—Additional Valuation Information
GAAP defines fair value as the price that would be received to sell an asset or paid to transfer a liability in an orderly transaction between market participants at the measurement date, under current market conditions. GAAP establishes a hierarchy that prioritizes the inputs to valuation methods, giving the highest priority to readily available unadjusted quoted prices in an active market for identical assets (Level 1) and the lowest priority to significant unobservable inputs (Level 3), generally when market prices are not readily available or are unreliable. Based on the valuation inputs, the securities or other investments are tiered into one of three levels. Changes in valuation methods may result in transfers in or out of an investment’s assigned level:
Level 1 – Prices are determined using quoted prices in an active market for identical assets.
Level 2 – Prices are determined using other significant observable inputs. Observable inputs are inputs that other market participants may use in pricing a security. These may include quoted prices for similar securities, interest rates, prepayment speeds, credit risk, yield curves, loss severities, default rates, discount rates, volatilities and others.
Level 3 – Prices are determined using significant unobservable inputs. In situations where quoted prices or observable inputs are unavailable (for example, when there is little or no market activity for an investment at the end of the period), unobservable inputs may be used. Unobservable inputs reflect the Fund’s own assumptions about the factors market participants would use in determining fair value of the securities or instruments and would be based on the best available information.
The following is a summary of the tiered valuation input levels, as of June 30, 2019. The level assigned to the securities valuations may not be an indication of the risk or liquidity associated with investing in those securities. Because of the inherent uncertainties of valuation, the values reflected in the financial statements may materially differ from the value received upon actual sale of those investments.
| | Level 1 | Level 2 | Level 3 | Total |
| Investments in Securities | | | | |
| Common Stocks & Other Equity Interests | $380,887,111 | $81,011,331 | $— | $461,898,442 |
| Money Market Funds | 27,841,560 | — | — | 27,841,560 |
| Total Investments in Securities | 408,728,671 | 81,011,331 | — | 489,740,002 |
| Other Investments - Liabilities* | | | | |
| Forward Foreign Currency Contracts | — | (374,360) | — | (374,360) |
| Total Investments | $408,728,671 | $80,636,971 | $— | $489,365,642 |
| * | Unrealized appreciation (depreciation). |
NOTE 4—Derivative Investments
The Fund may enter into an International Swaps and Derivatives Association Master Agreement (“ISDA Master Agreement”) under which a fund may trade OTC derivatives. An OTC transaction entered into under an ISDA Master Agreement typically involves a collateral posting arrangement, payment netting provisions and close-out netting provisions. These netting provisions allow for reduction of credit risk through netting of contractual obligations. The enforceability of the netting provisions of the ISDA Master Agreement depends on the governing law of the ISDA Master Agreement, among other factors.
For financial reporting purposes, the Fund does not offset OTC derivative assets or liabilities that are subject to ISDA Master Agreements in the Statement of Assets and Liabilities.
Value of Derivative Investments at Period-End
The table below summarizes the value of the Fund’s derivative investments, detailed by primary risk exposure, held as of June 30, 2019:
| | Value |
| Derivative Liabilities | Currency
Risk |
| Unrealized depreciation on forward foreign currency contracts outstanding | $(374,360) |
| Derivatives not subject to master netting agreements | - |
| Total Derivative Liabilities subject to master netting agreements | $(374,360) |
Invesco V.I. Diversified Dividend Fund
Offsetting Assets and Liabilities
The table below reflects the Fund’s exposure to Counterparties subject to either an ISDA Master Agreement or other agreement for OTC derivative transactions as of June 30, 2019.
| | Financial
Derivative
Liabilities | | Collateral
(Received)/Pledged | |
| Counterparty | Forward Foreign
Currency Contracts | Net Value of
Derivatives | Non-Cash | Cash | Net
Amount |
| JP Morgan Chase Bank N.A. | $(1,917) | $(1,917) | $– | $– | $(1,917) |
| State Street Bank & Trust Co. | (372,443) | (372,443) | – | – | (372,443) |
| Total | $(374,360) | $(374,360) | $– | $– | $(374,360) |
Effect of Derivative Investments for the six months ended June 30, 2019
The table below summarizes the gains (losses) on derivative investments, detailed by primary risk exposure, recognized in earnings during the period:
| | Location of Gain (Loss) on
Statement of Operations |
| | Currency
Risk |
| Realized Gain: | |
| Forward foreign currency contracts | $693,268 |
| Change in Net Unrealized Appreciation (Depreciation): | |
| Forward foreign currency contracts | (119,023) |
| Total | $574,245 |
The table below summarizes the average notional value of derivatives held during the period.
| | Forward
Foreign Currency
Contracts |
| Average notional value | $25,964,356 |
NOTE 5—Trustees’ and Officers’ Fees and Benefits
Trustees’ and Officers’ Fees and Benefits include amounts accrued by the Fund to pay remuneration to certain Trustees and Officers of the Fund. Trustees have the option to defer compensation payable by the Fund, and Trustees’ and Officers’ Fees and Benefits also include amounts accrued by the Fund to fund such deferred compensation amounts. Those Trustees who defer compensation have the option to select various Invesco Funds in which their deferral accounts shall be deemed to be invested. Finally, certain current Trustees were eligible to participate in a retirement plan that provided for benefits to be paid upon retirement to Trustees over a period of time based on the number of years of service. The Fund may have certain former Trustees who also participate in a retirement plan and receive benefits under such plan.Trustees’ and Officers’ Fees and Benefits include amounts accrued by the Fund to fund such retirement benefits. Obligations under the deferred compensation and retirement plans represent unsecured claims against the general assets of the Fund.
NOTE 6—Cash Balances
The Fund is permitted to temporarily carry a negative or overdrawn balance in its account with SSB, the custodian bank. Such balances, if any at period-end, are shown in the Statement of Assets and Liabilities under the payable captionAmount due custodian. To compensate the custodian bank for such overdrafts, the overdrawn Fund may either (1) leave funds as a compensating balance in the account so the custodian bank can be compensated by earning the additional interest; or (2) compensate by paying the custodian bank at a rate agreed upon by the custodian bank and Invesco, not to exceed the contractually agreed upon rate.
NOTE 7—Tax Information
The amount and character of income and gains to be distributed are determined in accordance with income tax regulations, which may differ from GAAP. Reclassifications are made to the Fund’s capital accounts to reflect income and gains available for distribution (or available capital loss carryforward) under income tax regulations. The tax character of distributions paid during the year and the tax components of net assets will be reported at the Fund’s fiscal year-end.
Capital loss carryforward is calculated and reported as of a specific date. Results of transactions and other activity after that date may affect the amount of capital loss carryforward actually available for the Fund to utilize. Capital losses generated in years beginning after December 22, 2010 can be carried forward for an unlimited period, whereas previous losses expire in eight tax years. Capital losses with an expiration period may not be used to offset capital gains until all net capital losses without an expiration date have been utilized. Capital loss carryforwards with no expiration date will retain their character as either short-term or long-term capital losses instead of as short-term capital losses as under prior law. The ability to utilize capital loss carryforwards in the future may be limited under the Internal Revenue Code and related regulations based on the results of future transactions.
Invesco V.I. Diversified Dividend Fund
The Fund did not have a capital loss carryforward as of December 31, 2018.
On May 24, 2019, a total of 3,660,162 Series I shares of the Fund valued at $97,177,295 were redeemed by significant shareholders and settled through a redemption-in-kind transaction, of which $6,188,994 consisted of cash, which resulted in a realized gain of $32,928,541 to the Fund for book purposes. From a federal income tax perspective, the realized gains are not recognized.
NOTE 8—Investment Transactions
The aggregate amount of investment securities (other than short-term securities, U.S. Treasury obligations and money market funds, if any) purchased and sold by the Fund during the six months ended June 30, 2019 was $16,214,558 and $38,225,758, respectively. Cost of investments, including any derivatives, on a tax basis includes the adjustments for financial reporting purposes as of the most recently completed federal income tax reporting period-end.
| Unrealized Appreciation (Depreciation) of Investments on a Tax Basis |
| Aggregate unrealized appreciation of investments | $117,054,399 |
| Aggregate unrealized (depreciation) of investments | (19,964,463) |
| Net unrealized appreciation of investments | $97,089,936 |
Cost of investments for tax purposes is $392,275,706.
NOTE 9—Share Information
| | Summary of Share Activity |
| | Six months ended
June 30, 2019(a) | | Year ended
December 31, 2018 |
| | Shares | Amount | | Shares | Amount |
| Sold: | | | | | |
| Series I | 271,523 | $7,033,751 | | 1,113,850 | $29,225,680 |
| Series II | 272,369 | 7,049,901 | | 628,883 | 16,528,837 |
| Issued as reinvestment of dividends: | | | | | |
| Series I | — | — | | 836,424 | 22,064,855 |
| Series II | — | — | | 489,217 | 12,822,377 |
| Reacquired: | | | | | |
| Series I | (4,880,934) | (128,909,551) | | (3,794,255) | (100,288,769) |
| Series II | (627,486) | (16,262,552) | | (1,398,007) | (36,731,971) |
| Net increase (decrease) in share activity | (4,964,528) | $(131,088,451) | | (2,123,888) | $(56,378,991) |
| (a) | There are entities that are record owners of more than 5% of the outstanding shares of the Fund and in the aggregate own 68% of the outstanding shares of the Fund. The Fund and the Fund’s principal underwriter or adviser, are parties to participation agreements with these entities whereby these entities sell units of interest in separate accounts funding variable products that are invested in the Fund. The Fund, Invesco and/or Invesco affiliates may make payments to these entities, which are considered to be related to the Fund, for providing services to the Fund, Invesco and/or Invesco affiliates including but not limited to services such as, securities brokerage, third party record keeping and account servicing and administrative services. The Fund has no knowledge as to whether all or any portion of the shares owned of record by these entities are also owned beneficially. |
Invesco V.I. Diversified Dividend Fund
Calculating your ongoing Fund expenses
Example
As a shareholder of the Fund, you incur ongoing costs, including management fees; distribution and/or service fees (12b-1); and other Fund expenses. This example is intended to help you understand your ongoing costs (in dollars) of investing in the Fund and to compare these costs with ongoing costs of investing in other mutual funds. The example is based on an investment of $1,000 invested at the beginning of the period and held for the entire period January 1, 2019 through June 30, 2019.
The actual and hypothetical expenses in the examples below do not represent the effect of any fees or other expenses assessed in connection with a variable product; if they did, the expenses shown would be higher while the ending account values shown would be lower.
Actual expenses
The table below provides information about actual account values and actual expenses. You may use the information in this table, together with the amount you invested, to estimate the expenses that you paid over the period. Simply divide your account value by $1,000 (for example, an $8,600 account value divided by $1,000 = 8.6), then multiply the result by the number in the table under the heading entitled “Actual Expenses Paid During Period” to estimate the expenses you paid on your account during this period.
Hypothetical example for comparison purposes
The table below also provides information about hypothetical account values and hypothetical expenses based on the Fund’s actual expense ratio and an assumed rate of return of 5% per year before expenses, which is not the Fund’s actual return.
The hypothetical account values and expenses may not be used to estimate the actual ending account balance or expenses you paid for the period. You may use this information to compare the ongoing costs of investing in the Fund and other funds. To do so, compare this 5% hypothetical example with the 5% hypothetical examples that appear in the shareholder reports of the other funds.
Please note that the expenses shown in the table are meant to highlight your ongoing costs. Therefore, the hypothetical information is useful in comparing ongoing costs, and will not help you determine the relative total costs of owning different funds.
| | Beginning
Account Value (01/01/19) | ACTUAL | HYPOTHETICAL
(5% annual return before
expenses) | Annualized
Expense
Ratio |
Ending
Account Value
(06/30/19)1 | Expenses
Paid During
Period2 | Ending
Account Value
(06/30/19) | Expenses
Paid During
Period2 |
| Series I | $1,000.00 | $1,152.30 | $3.42 | $1,021.62 | $3.21 | 0.64% |
| Series II | 1,000.00 | 1,150.40 | 4.75 | 1,020.38 | 4.46 | 0.89 |
| 1 | The actual ending account value is based on the actual total return of the Fund for the period January 1, 2019 through June 30, 2019, after actual expenses and will differ from the hypothetical ending account value which is based on the Fund’s expense ratio and a hypothetical annual return of 5% before expenses. |
| 2 | Expenses are equal to the Fund’s annualized expense ratio as indicated above multiplied by the average account value over the period, multiplied by 181/365 to reflect the most recent fiscal half year. |
Invesco V.I. Diversified Dividend Fund
Approval of Investment Advisory andSub-Advisory Contracts
At meetings held on June 10, 2019, the Board of Trustees (the Board or the Trustees) of AIM Variable Insurance Funds (Invesco Variable Insurance Funds) as a whole, and the independent Trustees, who comprise over 75% of the Board, voting separately, approved the continuance of the Invesco V.I. Diversified Dividend Fund’s (the Fund) Master Investment Advisory Agreement with Invesco Advisers, Inc. (Invesco Advisers and the investment advisory agreement) and the Master IntergroupSub-Advisory Contract for Mutual Funds with Invesco Asset Management Deutschland GmbH, Invesco Asset Management Limited, Invesco Asset Management (Japan) Limited, Invesco Hong Kong Limited, Invesco Senior Secured Management, Inc. and Invesco Canada Ltd. and separatesub-advisory contracts with Invesco Capital Management LLC and Invesco Asset Management (India) Private Limited (collectively, the AffiliatedSub-Advisers and thesub-advisory contracts) for another year, effective July 1, 2019. After evaluating the factors discussed below, among others, the Board approved the renewal of the Fund’s investment advisory agreement and thesub-advisory contracts and determined that the compensation payable by the Fund to Invesco Advisers and by Invesco Advisers to the AffiliatedSub-Advisers is fair and reasonable.
The Board’s Evaluation Process
The Board’s Investments Committee has established threeSub-Committees, which meet throughout the year to review the performance of funds advised by Invesco Advisers (the Invesco Funds). As part of a regularly scheduled basis ofin-person Board meetings, theSub-Committees meet with portfolio managers for their assigned Invesco Funds and other members of management to review detailed information about investment performance and portfolio attributes of these funds. The Board took into account evaluations and reports that it received from the Investments Committee andSub-Committees, as well as the information provided to such committees and the Board throughout the year, in considering whether to approve each Invesco Fund’s investment advisory agreement andsub-advisory contracts.
As part of the contract renewal process, the Board reviews and considers information provided in response to detailed requests for information submitted to management by the independent Trustees with assistance from legal counsel to the independent Trustees. The Board receives comparative investment performance and fee data regarding the Invesco Funds prepared by Invesco Advisers and Broadridge Financial Solutions, Inc. (Broadridge), an independent mutual fund data provider. The Board also receives an independent written evaluation from the Senior Officer, an officer of the Invesco Funds who reports directly to the
independent Trustees. The Senior Officer’s evaluation is prepared as part of his responsibility to manage the process by which the Invesco Funds’ proposed management fees are negotiated during the annual contract renewal process to ensure they are negotiated in a manner that is at arms’ length and reasonable. In addition to meetings with Invesco Advisers and fund counsel throughout the year, the independent Trustees also discuss the continuance of the investment advisory agreement andsub-advisory contracts in separate sessions with the Senior Officer and with independent legal counsel.
The discussion below is a summary of the Senior Officer’s independent written evaluation with respect to the Fund’s investment advisory agreement, as well as a discussion of the material factors and related conclusions that formed the basis for the Board’s approval of the Fund’s investment advisory agreement andsub-advisory contracts. The Trustees’ review and conclusions are based on the comprehensive consideration of all information presented to them during the course of the year and in prior years and are not the result of any single determinative factor. Moreover, one Trustee may have weighed a particular piece of information or factor differently than another Trustee. This information is current as of June 10, 2019.
Factors and Conclusions and Summary of Independent Written Fee Evaluation
| A. | Nature, Extent and Quality of Services Provided by Invesco Advisers and the AffiliatedSub-Advisers |
The Board reviewed the nature, extent and quality of the advisory services provided to the Fund by Invesco Advisers under the Fund’s investment advisory agreement, and the credentials and experience of the officers and employees of Invesco Advisers who provide these services, including the Fund’s portfolio manager(s). The Board’s review included consideration of Invesco Advisers’ investment process oversight and structure, credit analysis and investment risk management. The Board also considerednon-advisory services that Invesco Advisers and its affiliates provide to the Invesco Funds such as various back office support functions, third party oversight, internal audit, valuation, portfolio trading and legal and compliance. The Board also received and reviewed information about Invesco Advisers’ role as administrator of the Invesco Funds’ liquidity risk management program. The Board also reviewed and considered the benefits to shareholders of investing in a fund that is part of the Invesco family of funds under the umbrella of Invesco Ltd., Invesco Advisers’ parent company, and noted Invesco Ltd.’s depth and experience in conducting an investment management business, as well as its
commitment of financial and other resources to such business. The Board reviewed and considered information about the resources that Invesco Advisers intends to continue to commit to managing the Invesco family of funds following Invesco Ltd.’s acquisition of OppenheimerFunds, Inc. and its subsidiaries. The Board concluded that the nature, extent and quality of the services provided to the Fund by Invesco Advisers are appropriate and satisfactory.
The Board reviewed the services that may be provided by the AffiliatedSub-Advisers under thesub-advisory contracts and the credentials and experience of the officers and employees of the AffiliatedSub-Advisers who provide these services. The Board noted the AffiliatedSub-Advisers’ expertise with respect to certain asset classes and that the AffiliatedSub-Advisers have offices and personnel that are located in financial centers around the world. As a result, the Board noted that the AffiliatedSub-Advisers can provide research and investment analysis on the markets and economies of various countries in which the Fund may invest, make recommendations regarding securities and assist with security trades. The Board concluded that thesub-advisory contracts may benefit the Fund and its shareholders by permitting Invesco Advisers to use the resources and talents of the AffiliatedSub-Advisers in managing the Fund. The Board concluded that the nature, extent and quality of the services that may be provided by the AffiliatedSub-Advisers are appropriate and satisfactory.
| B. | Fund Investment Performance |
The Board considered Fund investment performance as a relevant factor in considering whether to approve the investment advisory agreement. The Board did not view Fund investment performance as a relevant factor in considering whether to approve thesub-advisory contracts for the Fund, as no AffiliatedSub-Adviser currently manages assets of the Fund.
The Board compared the Fund’s investment performance over multiple time periods ending December 31, 2018 to the performance of funds in the Broadridge performance universe and against the Lipper Variable Underlying FundsLarge-Cap Value Funds Index. The Board noted that performance of Series I shares of the Fund was in the first quintile of its performance universe for the one year period, the fifth quintile for the three year period and the second quintile for the five year period (the first quintile being the best performing funds and the fifth quintile being the worst performing funds). The Board noted that performance of Series I shares of the Fund was above the performance of the Index for the one and five year periods and below the performance of the Index for the three year period. The Board noted that the
Invesco V.I. Diversified Dividend Fund
Fund’s overweight exposure to certain defensive sectors and underweight exposure to certain cyclically-oriented sectors negatively impacted performance. The Trustees also reviewed more recent Fund performance and this review did not change their conclusions.
| C. | Advisory andSub-Advisory Fees and Fund Expenses |
The Board compared the Fund’s contractual management fee rate to the contractual management fee rates of funds in the Fund’s Broadridge expense group. The Board noted that the contractual management fee rate for Series I shares of the Fund was below the median contractual management fee rate of funds in its expense group. The Board noted that the term “contractual management fee” for funds in the expense group may include both advisory and certainnon-portfolio management administrative services fees, but that Broadridge does not provide information on a fund by fund basis as to what is included. The Board also reviewed the methodology used by Broadridge in providing expense group information, which includes using each fund’s contractual management fee schedule (including any applicable breakpoints) as reported in the most recent prospectus or statement of additional information for each fund in the expense group. The Board also considered comparative information regarding the Fund’s total expense ratio and its various components.
The Board noted that Invesco Advisers has contractually agreed to waive fees and/or limit expenses of the Fund for the term disclosed in the Fund’s registration statement in an amount necessary to limit total annual operating expenses to a specified percentage of average daily net assets for each class of the Fund.
The Board also considered the fees charged by Invesco Advisers and the AffiliatedSub-Advisers to other similarly managed client accounts. The Board noted that Invesco Advisers or the AffiliatedSub-Advisers may charge lower fees to large institutional clients. Invesco Advisers reviewed with the Board differences in the scope of services it provides to the Invesco Funds relative to certain other types of client accounts, including management of cash flows as a result of redemptions and purchases, necessary infrastructure such as officers, office space, technology, legal and distribution, oversight of service providers, costs and business risks associated with launching new funds and sponsoring and maintaining the product line, preparation of annual registration statement updates and financial information and compliance with federal and state laws and regulations.
The Board also compared the Fund’s effective advisory fee rate (the advisory fee rate after advisory fee waivers and before other expense limitations/waivers) to the effective advisory fee rates of other similarly managed third-party mutual funds advised orsub-advised by Invesco Advisers and its affiliates, based on asset balances as of December 31, 2018.
The Board also considered the services that may be provided by the AffiliatedSub-Advisers pursuant to thesub-advisory contracts, as well as the fees payable by Invesco Advisers to the AffiliatedSub-Advisers pursuant to thesub-advisory contracts.
| D. | Economies of Scale and Breakpoints |
The Board considered the extent to which there may be economies of scale in the provision of advisory services to the Fund. The Board considered Invesco’s reinvestment in its business, including investments in business infrastructure and cybersecurity. The Board also considered that the Fund benefits from economies of scale through contractual breakpoints in the Fund’s advisory fee schedule, which generally operate to reduce the Fund’s expense ratio as it grows in size. The Board noted that the Fund shares directly in economies of scale through lower fees charged by third party service providers based on the combined size of the Invesco Funds. The Board noted that the Fund may also benefit from economies of scale through initial fee setting, fee waivers and expense reimbursements.
| E. | Profitability and Financial Resources |
The Board reviewed information from Invesco Advisers concerning the costs of the advisory and other services that Invesco Advisers and its affiliates provide to the Fund and the Invesco Funds and the profitability of Invesco Advisers and its affiliates in providing these services. The Board considered the methodology used for calculating profitability and noted the periodic review of such methodology by an independent consultant. The Board noted that Invesco Advisers continues to operate at a net profit from services Invesco Advisers and its affiliates provide to the Invesco Funds. The Board received information from Invesco Advisers demonstrating that Invesco Advisers and the AffiliatedSub-Advisers are financially sound and have the resources necessary to perform their obligations under the investment advisory agreement andsub-advisory contracts.
| F. | Collateral Benefits to Invesco Advisers and its Affiliates |
The Board considered various other benefits received by Invesco Advisers and its affiliates from the relationship with the Fund, including the fees received for providing administrative, transfer agency and distribution services to the Fund. The Board considered comparative information regarding fees charged for these services, including information provided by Broadridge and other independent sources. The Board considered the performance of Invesco Advisers and its affiliates in providing these services and the organizational structure employed to provide these services. The Board also considered that these services are provided to the Fund pursuant to written contracts that are reviewed and approved on an annual basis by the Board; and that the services are required for the operation of the Fund.
The Board considered the benefits realized by Invesco Advisers and the AffiliatedSub-Advisers as a result of portfolio brokerage transactions
executed through “soft dollar” arrangements. The Board noted that soft dollar arrangements may result in the Fund bearing costs to purchase research that may be used by Invesco Advisers or the AffiliatedSub-Advisers with other clients and may reduce Invesco Advisers’ or the AffiliatedSub-Advisers’ expenses. The Board also considered that it receives periodic reports from Invesco representing that these arrangements are consistent with regulatory requirements. The Board did not deem the soft dollar arrangements to be inappropriate.
The Board considered that the Fund’s uninvested cash and cash collateral from any securities lending arrangements may be invested in money market funds advised by Invesco Advisers pursuant to procedures approved by the Board. The Board considered information regarding the returns of the affiliated money market funds relative to comparable overnight investments, as well as the costs to the Fund of such investments. The Board noted that Invesco Advisers receives advisory fees from these affiliated money market funds attributable to such investments, although Invesco Advisers has contractually agreed to waive through varying periods the advisory fees payable by the Invesco Funds with respect to certain investments in the affiliated money market funds. The waiver is in an amount equal to 100% of the net advisory fee Invesco Advisers receives from the affiliated money market funds with respect to the Fund’s investment in the affiliated money market funds of uninvested cash, but not cash collateral. The Board concluded that the amount of advisory fees received by Invesco Advisers from the Fund’s investment of cash collateral from any securities lending arrangements in the affiliated money market funds is fair and reasonable.
The Board also considered that an affiliated broker may receive commissions for executing certain trades for the Fund. Invesco Advisers and the AffiliatedSub-Advisers may use the affiliated broker to, among other things, control order routing and minimize information leakage, and the Board was advised that such trades are executed in compliance with rules under the federal securities laws and consistent with best execution obligations.
Invesco V.I. Diversified Dividend Fund
| Semiannual Report to Shareholders | June 30, 2019 |
Invesco V.I. Equally-Weighted S&P 500 Fund
Beginning on January 1, 2021, as permitted by regulations adopted by the Securities and Exchange Commission, the insurance company that offers your variable annuity or variable life insurance contract may no longer send you paper copies of the Fund’s shareholder reports by mail, unless you specifically request paper copies of the reports from the insurance company or your financial intermediary. Instead of delivering paper copies of the report, the insurance company may choose to make the reports available on a website, and will notify you by mail each time a report is posted and provide you with a website link to access the report. Instructions for requesting paper copies will be provided by your insurance company.
If the insurance company offers electronic delivery, you may elect to receive shareholder reports and other communications about the Fund electronically by following the instructions provided by the insurance company or by contacting your financial intermediary. If you already elected to receive shareholder reports electronically, you will not be affected by this change and you need not take any action.
You may elect to receive all future reports in paper free of charge from the insurance company. You can inform the insurance company or your financial intermediary that you wish to continue receiving paper copies of your shareholder reports by following the instructions provided by the insurance company or by contacting your financial intermediary. Your election to receive reports in paper will apply to all portfolio companies available under your contract with the insurance company.
The Fund provides a complete list of its holdings four times in each fiscal year, at the quarter-ends. For the second and fourth quarters, the lists appear in the Fund’s semiannual and annual reports to shareholders. For the first and third quarters, the Fund files the lists with the Securities and Exchange Commission (SEC) on Form N-Q (or any successor Form). The Fund’s Form N-Q (or any successor Form) filings are available on the SEC website, sec.gov. The SEC file numbers for the Fund are 811-07452 and 033-57340. The Fund’s most recent portfolio holdings, as filed on Form N-Q (or any successor Form), have also been made available to insurance companies issuing variable annuity contracts and variable life insurance policies (“variable products”) that invest in the Fund.
A description of the policies and procedures that the Fund uses to determine how to vote proxies relating to portfolio securities is available without charge, upon request, from our Client Services department at 800 959 4246 or at invesco.com/proxyguidelines. The information is also available on the SEC website, sec.gov.
Information regarding how the Fund voted proxies related to its portfolio securities during the most recent 12-month period ended June 30 is available at invesco.com/proxysearch. The information is also available on the SEC website, sec.gov.
Invesco Advisers, Inc. is an investment adviser; it provides investment advisory services to individual and institutional clients and does not sell securities. Invesco Distributors, Inc. is the US distributor for Invesco Ltd.’s retail mutual funds, exchange-traded funds and institutional money market funds. Both are wholly owned, indirect subsidiaries of Invesco Ltd.
This report must be accompanied or preceded by a currently effective Fund prospectus and variable product prospectus, which contain more complete information, including sales charges and expenses. Investors should read each carefully before investing.
NOT FDIC INSURED | MAY LOSE VALUE | NO BANK GUARANTEE
| Invesco Distributors, Inc. | MS-VIEWSP-SAR-1 |
Performance summary
Fund vs. Indexes
Cumulative total returns, December 31, 2018 to June 30, 2019, excluding variable product issuer charges. If variable product issuer charges were included, returns would be lower.
| Series I Shares | 18.93% |
| Series II Shares | 18.74 |
| S&P 500 Index▼ (Broad Market Index) | 18.54 |
| S&P 500 Equal Weight Index▼ (Style-Specific Index) | 19.19 |
Lipper VUF Multi-Cap Core Funds Index■
(Peer Group Index) | 16.21 |
| Source(s):▼FactSet Research Systems Inc.;■ Lipper Inc. |
TheS&P 500® Index is an unmanaged index considered representative of the US stock market.
TheS&P 500® Equal Weight Index is the equally weighted version of the S&P 500 Index, which is considered representative of the US stock market.
TheLipper VUF Multi-Cap Core Funds Indexis an unmanaged index considered representative of multi-cap core variable insurance underlying funds tracked by Lipper.
A direct investment cannot be made in an index. Unless otherwise indicated, index results include reinvested dividends, and they do not reflect sales charges. Performance of the peer group, if applicable, reflects fund expenses; performance of a market index does not.
| Average Annual Total Returns |
| As of 6/30/19 |
| Series I Shares | |
| Inception (11/9/94) | 10.66% |
| 10 Years | 15.07 |
| 5 Years | 8.71 |
| 1 Year | 7.83 |
| Series II Shares | |
| Inception (7/24/00) | 8.69% |
| 10 Years | 14.79 |
| 5 Years | 8.44 |
| 1 Year | 7.55 |
Effective June 1, 2010, Class X and Class Y shares of the predecessor fund, Morgan Stanley V.I. Select Dimensions Equally-Weighted S&P 500 Fund, advised by Morgan Stanley Investment Advisors Inc. were reorganized into Series I and Series II shares, respectively, of Invesco V.I. Select Dimensions Equally-Weighted S&P 500 Fund (renamed Invesco V.I. Equally-Weighted S&P 500 Fund on April 30, 2012). Returns shown above, prior to June 1, 2010, for Series I and Series II shares are blended returns of the predecessor fund and Invesco V.I. Equally-Weighted S&P 500 Fund. Share class returns will differ from the predecessor fund because of different expenses.
The performance data quoted represent past performance and cannot guarantee comparable future results; current performance may be lower or higher. Please contact your variable product issuer or financial adviser for the most recent month-end variable product performance. Performance
figures reflect Fund expenses, reinvested distributions and changes in net asset value. Performance figures do not reflect deduction of taxes a shareholder would pay on Fund distributions or sale of Fund shares. Investment return and principal value will fluctuate so that you may have a gain or loss when you sell shares.
The total annual Fund operating expense ratio set forth in the most recent Fund prospectus as of the date of this report for Series I and Series II shares was 0.31% and 0.56%, respectively. The expense ratios presented above may vary from the expense ratios presented in other sections of this report that are based on expenses incurred during the period covered by this report.
Invesco V.I. Equally-Weighted S& P 500 Fund, a series portfolio of AIM Variable Insurance Funds (Invesco Variable Insurance Funds), is currently offered through insurance companies issuing variable products. You cannot
purchase shares of the Fund directly. Performance figures given represent the Fund and are not intended to reflect actual variable product values. They do not reflect sales charges, expenses and fees assessed in connection with a variable product. Sales charges, expenses and fees, which are determined by the variable product issuers, will vary and will lower the total return.
The most recent month-end performance at the Fund level, excluding variable product charges, is available at 800 451 4246. As mentioned above, for the most recent month-end performance including variable product charges, please contact your variable product issuer or financial adviser.
Fund performance reflects any applicable fee waivers and/or expense reimbursements. Had the adviser not waived fees and/or reimbursed expenses currently or in the past, returns would have been lower. See current prospectus for more information.
Invesco V.I. Equally-Weighted S&P 500 Fund
Schedule of Investments(a)
June 30, 2019
(Unaudited)
| | Shares | Value |
| Common Stocks & Other Equity Interests–98.37% |
| Advertising–0.40% |
| Interpublic Group of Cos., Inc. (The) | 20,305 | $458,690 |
| Omnicom Group, Inc. | 5,646 | 462,690 |
| | | | 921,380 |
| Aerospace & Defense–2.21% |
| Arconic, Inc. | 19,501 | 503,516 |
| Boeing Co. (The) | 1,290 | 469,573 |
| General Dynamics Corp. | 2,616 | 475,641 |
| Huntington Ingalls Industries, Inc. | 2,085 | 468,583 |
| L3Harris Technologies, Inc.(b) | 2,350 | 444,455 |
| Lockheed Martin Corp. | 1,279 | 464,968 |
| Northrop Grumman Corp. | 1,447 | 467,540 |
| Raytheon Co. | 2,526 | 439,221 |
| Textron, Inc. | 9,062 | 480,648 |
| TransDigm Group, Inc.(b) | 947 | 458,159 |
| United Technologies Corp. | 3,587 | 467,027 |
| | | | 5,139,331 |
| Agricultural & Farm Machinery–0.21% |
| Deere & Co. | 2,957 | 490,004 |
| Agricultural Products–0.19% |
| Archer-Daniels-Midland Co. | 10,986 | 448,229 |
| Air Freight & Logistics–0.78% |
| C.H. Robinson Worldwide, Inc. | 5,353 | 451,526 |
| Expeditors International of Washington, Inc. | 6,058 | 459,560 |
| FedEx Corp. | 2,722 | 446,925 |
| United Parcel Service, Inc., Class B | 4,409 | 455,317 |
| | | | 1,813,328 |
| Airlines–0.96% |
| Alaska Air Group, Inc. | 7,099 | 453,697 |
| American Airlines Group, Inc. | 13,713 | 447,181 |
| Delta Air Lines, Inc. | 8,003 | 454,170 |
| Southwest Airlines Co. | 8,647 | 439,095 |
| United Airlines Holdings, Inc.(b) | 5,136 | 449,657 |
| | | | 2,243,800 |
| Alternative Carriers–0.20% |
| CenturyLink, Inc. | 40,374 | 474,798 |
| Apparel Retail–0.98% |
| Foot Locker, Inc. | 10,392 | 435,633 |
| Gap, Inc. (The) | 24,651 | 442,978 |
| L Brands, Inc. | 19,908 | 519,599 |
| Ross Stores, Inc. | 4,438 | 439,894 |
| TJX Cos., Inc. (The) | 8,401 | 444,245 |
| | | | 2,282,349 |
| | Shares | Value |
| Apparel, Accessories & Luxury Goods–1.38% |
| Capri Holdings Ltd.(b) | 13,373 | $463,776 |
| Hanesbrands, Inc. | 27,014 | 465,181 |
| PVH Corp. | 5,089 | 481,623 |
| Ralph Lauren Corp. | 3,996 | 453,906 |
| Tapestry, Inc. | 15,171 | 481,376 |
| Under Armour, Inc., Class A(b) | 8,697 | 220,469 |
| Under Armour, Inc., Class C(b) | 8,918 | 197,979 |
| VF Corp. | 5,135 | 448,542 |
| | | | 3,212,852 |
| Application Software–1.59% |
| Adobe, Inc.(b) | 1,633 | 481,163 |
| ANSYS, Inc.(b) | 2,272 | 465,351 |
| Autodesk, Inc.(b) | 2,831 | 461,170 |
| Cadence Design Systems, Inc.(b) | 6,617 | 468,550 |
| Citrix Systems, Inc. | 4,629 | 454,290 |
| Intuit, Inc. | 1,757 | 459,157 |
| salesforce.com, inc.(b) | 2,987 | 453,218 |
| Synopsys, Inc.(b) | 3,590 | 461,997 |
| | | | 3,704,896 |
| Asset Management & Custody Banks–1.76% |
| Affiliated Managers Group, Inc. | 5,071 | 467,242 |
| Ameriprise Financial, Inc. | 2,918 | 423,577 |
| Bank of New York Mellon Corp. (The) | 10,072 | 444,679 |
| BlackRock, Inc. | 1,002 | 470,239 |
| Franklin Resources, Inc. | 13,433 | 467,468 |
| Invesco Ltd.(c) | 21,713 | 444,248 |
| Northern Trust Corp. | 5,140 | 462,600 |
| State Street Corp. | 8,094 | 453,750 |
| T. Rowe Price Group, Inc. | 4,229 | 463,963 |
| | | | 4,097,766 |
| Auto Parts & Equipment–0.40% |
| Aptiv PLC | 5,949 | 480,858 |
| BorgWarner, Inc. | 10,943 | 459,387 |
| | | | 940,245 |
| Automobile Manufacturers–0.40% |
| Ford Motor Co. | 44,906 | 459,388 |
| General Motors Co. | 12,567 | 484,207 |
| | | | 943,595 |
| Automotive Retail–0.77% |
| Advance Auto Parts, Inc. | 2,952 | 455,021 |
| AutoZone, Inc.(b) | 400 | 439,788 |
| CarMax, Inc.(b) | 5,363 | 465,670 |
| O’Reilly Automotive, Inc.(b) | 1,154 | 426,195 |
| | | | 1,786,674 |
See accompanying Notes to Financial Statements which are an integral part of the financial statements.
Invesco V.I. Equally-Weighted S&P 500 Fund
| | Shares | Value |
| Biotechnology–1.78% |
| AbbVie, Inc. | 5,694 | $414,068 |
| Alexion Pharmaceuticals, Inc.(b) | 3,799 | 497,593 |
| Amgen, Inc. | 2,544 | 468,808 |
| Biogen, Inc.(b) | 1,967 | 460,022 |
| Celgene Corp.(b) | 4,643 | 429,199 |
| Gilead Sciences, Inc. | 6,724 | 454,274 |
| Incyte Corp.(b) | 5,766 | 489,879 |
| Regeneron Pharmaceuticals, Inc.(b) | 1,467 | 459,171 |
| Vertex Pharmaceuticals, Inc.(b) | 2,631 | 482,473 |
| | | | 4,155,487 |
| Brewers–0.20% |
| Molson Coors Brewing Co., Class B | 8,298 | 464,688 |
| Broadcasting–0.60% |
| CBS Corp., Class B | 9,148 | 456,485 |
| Discovery, Inc., Class A(b) | 4,944 | 151,781 |
| Discovery, Inc., Class C(b) | 11,350 | 322,908 |
| Fox Corp., Class A | 8,730 | 319,867 |
| Fox Corp., Class B | 4,017 | 146,741 |
| | | | 1,397,782 |
| Building Products–1.00% |
| A.O. Smith Corp. | 9,842 | 464,149 |
| Allegion PLC | 4,226 | 467,184 |
| Fortune Brands Home & Security, Inc. | 8,297 | 474,008 |
| Johnson Controls International PLC | 11,217 | 463,374 |
| Masco Corp. | 11,704 | 459,265 |
| | | | 2,327,980 |
| Cable & Satellite–0.58% |
| Charter Communications, Inc., Class A(b) | 1,142 | 451,296 |
| Comcast Corp., Class A | 10,591 | 447,787 |
| DISH Network Corp., Class A(b) | 11,938 | 458,539 |
| | | | 1,357,622 |
| Casinos & Gaming–0.40% |
| MGM Resorts International | 16,184 | 462,377 |
| Wynn Resorts, Ltd. | 3,876 | 480,585 |
| | | | 942,962 |
| Commodity Chemicals–0.38% |
| Dow, Inc. | 8,761 | 432,005 |
| LyondellBasell Industries N.V., Class A | 5,180 | 446,153 |
| | | | 878,158 |
| Communications Equipment–1.00% |
| Arista Networks, Inc.(b) | 1,897 | 492,499 |
| Cisco Systems, Inc. | 8,184 | 447,910 |
| F5 Networks, Inc.(b) | 3,272 | 476,501 |
| Juniper Networks, Inc. | 16,798 | 447,331 |
| Motorola Solutions, Inc. | 2,793 | 465,677 |
| | | | 2,329,918 |
| | Shares | Value |
| Computer & Electronics Retail–0.20% |
| Best Buy Co., Inc. | 6,787 | $473,257 |
| Construction & Engineering–0.40% |
| Jacobs Engineering Group, Inc. | 5,722 | 482,879 |
| Quanta Services, Inc. | 11,862 | 453,010 |
| | | | 935,889 |
| Construction Machinery & Heavy Trucks–0.81% |
| Caterpillar, Inc. | 3,522 | 480,013 |
| Cummins, Inc. | 2,734 | 468,444 |
| PACCAR, Inc. | 6,410 | 459,341 |
| Wabtec Corp. | 6,590 | 472,898 |
| | | | 1,880,696 |
| Construction Materials–0.40% |
| Martin Marietta Materials, Inc. | 2,000 | 460,220 |
| Vulcan Materials Co. | 3,379 | 463,970 |
| | | | 924,190 |
| Consumer Electronics–0.19% |
| Garmin Ltd. | 5,615 | 448,077 |
| Consumer Finance–0.78% |
| American Express Co. | 3,673 | 453,395 |
| Capital One Financial Corp. | 4,947 | 448,891 |
| Discover Financial Services | 5,785 | 448,858 |
| Synchrony Financial | 13,200 | 457,644 |
| | | | 1,808,788 |
| Copper–0.21% |
| Freeport-McMoRan, Inc. | 42,081 | 488,560 |
| Data Processing & Outsourced Services–2.69% |
| Alliance Data Systems Corp. | 3,205 | 449,117 |
| Automatic Data Processing, Inc. | 2,706 | 447,383 |
| Broadridge Financial Solutions, Inc. | 3,443 | 439,602 |
| Fidelity National Information Services, Inc. | 3,691 | 452,812 |
| Fiserv, Inc.(b) | 5,023 | 457,897 |
| FleetCor Technologies, Inc.(b) | 1,643 | 461,436 |
| Global Payments, Inc. | 2,821 | 451,727 |
| Jack Henry & Associates, Inc. | 3,235 | 433,231 |
| Mastercard, Inc., Class A | 1,722 | 455,521 |
| Paychex, Inc. | 5,169 | 425,357 |
| PayPal Holdings, Inc.(b) | 3,857 | 441,472 |
| Total System Services, Inc. | 3,521 | 451,639 |
| Visa, Inc., Class A | 2,640 | 458,172 |
| Western Union Co. (The) | 22,307 | 443,686 |
| | | | 6,269,052 |
| Department Stores–0.57% |
| Kohl’s Corp. | 9,381 | 446,066 |
| Macy’s, Inc. | 20,786 | 446,068 |
| Nordstrom, Inc. | 13,742 | 437,820 |
| | | | 1,329,954 |
See accompanying Notes to Financial Statements which are an integral part of the financial statements.
Invesco V.I. Equally-Weighted S&P 500 Fund
| | Shares | Value |
| Distillers & Vintners–0.39% |
| Brown-Forman Corp., Class B | 7,965 | $441,500 |
| Constellation Brands, Inc., Class A | 2,387 | 470,096 |
| | | | 911,596 |
| Distributors–0.39% |
| Genuine Parts Co. | 4,353 | 450,884 |
| LKQ Corp.(b) | 17,078 | 454,445 |
| | | | 905,329 |
| Diversified Banks–0.98% |
| Bank of America Corp. | 15,982 | 463,478 |
| Citigroup, Inc. | 6,641 | 465,069 |
| JPMorgan Chase & Co. | 4,080 | 456,144 |
| U.S. Bancorp | 8,482 | 444,457 |
| Wells Fargo & Co. | 9,830 | 465,156 |
| | | | 2,294,304 |
| Diversified Chemicals–0.21% |
| Eastman Chemical Co. | 6,216 | 483,791 |
| Diversified Support Services–0.39% |
| Cintas Corp. | 1,895 | 449,665 |
| Copart, Inc.(b) | 6,071 | 453,746 |
| | | | 903,411 |
| Drug Retail–0.20% |
| Walgreens Boots Alliance, Inc. | 8,524 | 466,007 |
| Electric Utilities–2.68% |
| Alliant Energy Corp. | 8,963 | 439,904 |
| American Electric Power Co., Inc. | 4,947 | 435,385 |
| Duke Energy Corp. | 5,099 | 449,936 |
| Edison International | 7,539 | 508,204 |
| Entergy Corp. | 4,391 | 451,966 |
| Evergy, Inc. | 7,386 | 444,268 |
| Eversource Energy | 5,788 | 438,499 |
| Exelon Corp. | 8,846 | 424,077 |
| FirstEnergy Corp. | 10,192 | 436,319 |
| NextEra Energy, Inc. | 2,164 | 443,317 |
| Pinnacle West Capital Corp. | 4,596 | 432,438 |
| PPL Corp. | 14,249 | 441,861 |
| Southern Co. (The) | 8,052 | 445,115 |
| Xcel Energy, Inc. | 7,465 | 444,093 |
| | | | 6,235,382 |
| Electrical Components & Equipment–0.82% |
| AMETEK, Inc. | 5,272 | 478,909 |
| Eaton Corp. PLC | 5,717 | 476,112 |
| Emerson Electric Co. | 7,139 | 476,314 |
| Rockwell Automation, Inc. | 2,862 | 468,881 |
| | | | 1,900,216 |
| Electronic Components–0.40% |
| Amphenol Corp., Class A | 4,751 | 455,811 |
| | Shares | Value |
| Electronic Components–(continued) |
| Corning, Inc. | 14,498 | $481,768 |
| | | | 937,579 |
| Electronic Equipment & Instruments–0.41% |
| FLIR Systems, Inc. | 8,766 | 474,241 |
| Keysight Technologies, Inc.(b) | 5,345 | 480,034 |
| | | | 954,275 |
| Electronic Manufacturing Services–0.43% |
| IPG Photonics Corp.(b) | 3,396 | 523,833 |
| TE Connectivity Ltd. | 4,942 | 473,345 |
| | | | 997,178 |
| Environmental & Facilities Services–0.57% |
| Republic Services, Inc. | 5,151 | 446,283 |
| Rollins, Inc. | 11,903 | 426,960 |
| Waste Management, Inc. | 3,911 | 451,212 |
| | | | 1,324,455 |
| Fertilizers & Agricultural Chemicals–0.84% |
| CF Industries Holdings, Inc. | 9,742 | 455,049 |
| Corteva, Inc.(b) | 17,791 | 526,080 |
| FMC Corp. | 5,607 | 465,101 |
| Mosaic Co. (The) | 20,042 | 501,651 |
| | | | 1,947,881 |
| Financial Exchanges & Data–1.54% |
| Cboe Global Markets, Inc. | 4,159 | 430,997 |
| CME Group, Inc. | 2,273 | 441,212 |
| Intercontinental Exchange, Inc. | 5,276 | 453,419 |
| MarketAxess Holdings, Inc. | 1,405 | 451,595 |
| Moody’s Corp. | 2,329 | 454,877 |
| MSCI, Inc. | 1,900 | 453,701 |
| Nasdaq, Inc. | 4,681 | 450,172 |
| S&P Global, Inc. | 1,992 | 453,758 |
| | | | 3,589,731 |
| Food Distributors–0.19% |
| Sysco Corp. | 6,202 | 438,605 |
| Food Retail–0.17% |
| Kroger Co. (The) | 18,473 | 401,049 |
| Footwear–0.19% |
| NIKE, Inc., Class B | 5,370 | 450,811 |
| Gas Utilities–0.19% |
| Atmos Energy Corp. | 4,268 | 450,530 |
| General Merchandise Stores–0.57% |
| Dollar General Corp. | 3,302 | 446,298 |
| Dollar Tree, Inc.(b) | 4,062 | 436,218 |
| Target Corp. | 5,104 | 442,058 |
| | | | 1,324,574 |
See accompanying Notes to Financial Statements which are an integral part of the financial statements.
Invesco V.I. Equally-Weighted S&P 500 Fund
| | Shares | Value |
| Gold–0.21% |
| Newmont Goldcorp Corp. | 12,473 | $479,836 |
| Health Care Distributors–0.78% |
| AmerisourceBergen Corp. | 5,268 | 449,149 |
| Cardinal Health, Inc. | 10,148 | 477,971 |
| Henry Schein, Inc.(b) | 6,287 | 439,461 |
| McKesson Corp. | 3,366 | 452,357 |
| | | | 1,818,938 |
| Health Care Equipment–3.18% |
| Abbott Laboratories | 5,449 | 458,261 |
| ABIOMED, Inc.(b) | 1,785 | 464,975 |
| Baxter International, Inc. | 5,749 | 470,843 |
| Becton, Dickinson and Co. | 1,913 | 482,095 |
| Boston Scientific Corp.(b) | 11,086 | 476,476 |
| Danaher Corp. | 3,209 | 458,630 |
| Edwards Lifesciences Corp.(b) | 2,435 | 449,842 |
| Hologic, Inc.(b) | 9,367 | 449,803 |
| IDEXX Laboratories, Inc.(b) | 1,673 | 460,627 |
| Intuitive Surgical, Inc.(b) | 902 | 473,144 |
| Medtronic PLC | 4,596 | 447,605 |
| ResMed, Inc. | 3,794 | 462,982 |
| Stryker Corp. | 2,291 | 470,984 |
| Teleflex, Inc. | 1,398 | 462,948 |
| Varian Medical Systems, Inc.(b) | 3,424 | 466,109 |
| Zimmer Biomet Holdings, Inc. | 3,815 | 449,178 |
| | | | 7,404,502 |
| Health Care Facilities–0.41% |
| HCA Healthcare, Inc. | 3,538 | 478,231 |
| Universal Health Services, Inc., Class B | 3,650 | 475,924 |
| | | | 954,155 |
| Health Care REITs–0.58% |
| HCP, Inc. | 13,952 | 446,185 |
| Ventas, Inc. | 6,712 | 458,765 |
| Welltower, Inc. | 5,445 | 443,931 |
| | | | 1,348,881 |
| Health Care Services–1.00% |
| Cigna Corp. | 2,828 | 445,551 |
| CVS Health Corp. | 8,272 | 450,741 |
| DaVita, Inc.(b) | 9,168 | 515,792 |
| Laboratory Corp. of America Holdings(b) | 2,692 | 465,447 |
| Quest Diagnostics, Inc. | 4,435 | 451,527 |
| | | | 2,329,058 |
| Health Care Supplies–0.57% |
| Align Technology, Inc.(b) | 1,465 | 400,970 |
| Cooper Cos., Inc. (The) | 1,386 | 466,930 |
| DENTSPLY SIRONA, Inc. | 7,893 | 460,635 |
| | | | 1,328,535 |
| Health Care Technology–0.20% |
| Cerner Corp. | 6,204 | 454,753 |
| | Shares | Value |
| Home Furnishings–0.38% |
| Leggett & Platt, Inc. | 11,986 | $459,903 |
| Mohawk Industries, Inc.(b) | 2,942 | 433,857 |
| | | | 893,760 |
| Home Improvement Retail–0.39% |
| Home Depot, Inc. (The) | 2,177 | 452,751 |
| Lowe’s Cos., Inc. | 4,497 | 453,792 |
| | | | 906,543 |
| Homebuilding–0.54% |
| D.R. Horton, Inc. | 9,750 | 420,518 |
| Lennar Corp., Class A | 8,368 | 405,513 |
| PulteGroup, Inc. | 13,642 | 431,360 |
| | | | 1,257,391 |
| Hotel & Resort REITs–0.19% |
| Host Hotels & Resorts, Inc. | 24,476 | 445,953 |
| Hotels, Resorts & Cruise Lines–0.95% |
| Carnival Corp. | 8,435 | 392,649 |
| Hilton Worldwide Holdings, Inc. | 4,796 | 468,761 |
| Marriott International, Inc., Class A | 3,352 | 470,252 |
| Norwegian Cruise Line Holdings Ltd.(b) | 8,255 | 442,716 |
| Royal Caribbean Cruises Ltd. | 3,603 | 436,720 |
| | | | 2,211,098 |
| Household Appliances–0.20% |
| Whirlpool Corp. | 3,302 | 470,073 |
| Household Products–0.93% |
| Church & Dwight Co., Inc. | 5,807 | 424,260 |
| Clorox Co. (The) | 2,855 | 437,129 |
| Colgate-Palmolive Co. | 6,109 | 437,832 |
| Kimberly-Clark Corp. | 3,255 | 433,826 |
| Procter & Gamble Co. (The) | 4,029 | 441,780 |
| | | | 2,174,827 |
| Housewares & Specialties–0.20% |
| Newell Brands, Inc. | 30,907 | 476,586 |
| Human Resource & Employment Services–0.19% |
| Robert Half International, Inc. | 7,966 | 454,142 |
| Hypermarkets & Super Centers–0.39% |
| Costco Wholesale Corp. | 1,722 | 455,056 |
| Walmart, Inc. | 4,108 | 453,893 |
| | | | 908,949 |
| Independent Power Producers & Energy Traders–0.38% |
| AES Corp. (The) | 26,222 | 439,481 |
| NRG Energy, Inc. | 12,885 | 452,521 |
| | | | 892,002 |
| Industrial Conglomerates–0.78% |
| 3M Co. | 2,687 | 465,765 |
| General Electric Co. | 43,809 | 459,995 |
See accompanying Notes to Financial Statements which are an integral part of the financial statements.
Invesco V.I. Equally-Weighted S&P 500 Fund
| | Shares | Value |
| Industrial Conglomerates–(continued) |
| Honeywell International, Inc. | 2,592 | $452,537 |
| Roper Technologies, Inc. | 1,228 | 449,767 |
| | | | 1,828,064 |
| Industrial Gases–0.39% |
| Air Products and Chemicals, Inc. | 2,043 | 462,474 |
| Linde PLC (United Kingdom) | 2,210 | 443,768 |
| | | | 906,242 |
| Industrial Machinery–1.99% |
| Dover Corp. | 4,664 | 467,333 |
| Flowserve Corp. | 9,191 | 484,274 |
| Fortive Corp. | 5,794 | 472,327 |
| Illinois Tool Works, Inc. | 3,006 | 453,335 |
| Ingersoll-Rand PLC | 3,594 | 455,252 |
| Parker-Hannifin Corp. | 2,728 | 463,787 |
| Pentair PLC | 12,581 | 468,013 |
| Snap-on, Inc. | 2,737 | 453,357 |
| Stanley Black & Decker, Inc. | 3,166 | 457,835 |
| Xylem, Inc. | 5,526 | 462,194 |
| | | | 4,637,707 |
| Industrial REITs–0.38% |
| Duke Realty Corp. | 14,114 | 446,144 |
| Prologis, Inc. | 5,603 | 448,800 |
| | | | 894,944 |
| Insurance Brokers–0.78% |
| Aon PLC | 2,348 | 453,117 |
| Arthur J. Gallagher & Co. | 5,109 | 447,497 |
| Marsh & McLennan Cos., Inc. | 4,564 | 455,259 |
| Willis Towers Watson PLC | 2,353 | 450,694 |
| | | | 1,806,567 |
| Integrated Oil & Gas–0.59% |
| Chevron Corp. | 3,709 | 461,548 |
| Exxon Mobil Corp. | 6,027 | 461,849 |
| Occidental Petroleum Corp. | 9,088 | 456,945 |
| | | | 1,380,342 |
| Integrated Telecommunication Services–0.39% |
| AT&T, Inc. | 13,852 | 464,180 |
| Verizon Communications, Inc. | 7,689 | 439,273 |
| | | | 903,453 |
| Interactive Home Entertainment–0.61% |
| Activision Blizzard, Inc. | 9,823 | 463,646 |
| Electronic Arts, Inc.(b) | 4,832 | 489,288 |
| Take-Two Interactive Software, Inc.(b) | 4,060 | 460,932 |
| | | | 1,413,866 |
| Interactive Media & Services–0.78% |
| Alphabet, Inc., Class A(b) | 203 | 219,809 |
| Alphabet, Inc., Class C(b) | 209 | 225,910 |
| Facebook, Inc., Class A(b) | 2,470 | 476,710 |
| | Shares | Value |
| Interactive Media & Services–(continued) |
| TripAdvisor, Inc.(b) | 9,838 | $455,401 |
| Twitter, Inc.(b) | 12,397 | 432,655 |
| | | | 1,810,485 |
| Internet & Direct Marketing Retail–0.79% |
| Amazon.com, Inc.(b)(d) | 239 | 452,578 |
| Booking Holdings, Inc.(b) | 252 | 472,427 |
| eBay, Inc. | 11,517 | 454,921 |
| Expedia Group, Inc. | 3,533 | 469,995 |
| | | | 1,849,921 |
| Internet Services & Infrastructure–0.39% |
| Akamai Technologies, Inc.(b) | 5,699 | 456,718 |
| VeriSign, Inc.(b) | 2,183 | 456,596 |
| | | | 913,314 |
| Investment Banking & Brokerage–0.98% |
| Charles Schwab Corp. (The) | 10,927 | 439,156 |
| E*TRADE Financial Corp. | 9,890 | 441,094 |
| Goldman Sachs Group, Inc. (The) | 2,337 | 478,150 |
| Morgan Stanley | 10,433 | 457,070 |
| Raymond James Financial, Inc. | 5,427 | 458,853 |
| | | | 2,274,323 |
| IT Consulting & Other Services–0.99% |
| Accenture PLC, Class A | 2,422 | 447,513 |
| Cognizant Technology Solutions Corp., Class A | 7,270 | 460,845 |
| DXC Technology Co. | 8,664 | 477,820 |
| Gartner, Inc.(b) | 2,825 | 454,656 |
| International Business Machines Corp. | 3,315 | 457,138 |
| | | | 2,297,972 |
| Leisure Products–0.19% |
| Hasbro, Inc. | 4,170 | 440,686 |
| Life & Health Insurance–1.37% |
| Aflac, Inc. | 8,141 | 446,208 |
| Lincoln National Corp. | 7,059 | 454,953 |
| MetLife, Inc. | 9,181 | 456,020 |
| Principal Financial Group, Inc. | 8,015 | 464,229 |
| Prudential Financial, Inc. | 4,515 | 456,015 |
| Torchmark Corp. | 5,025 | 449,537 |
| Unum Group | 13,559 | 454,904 |
| | | | 3,181,866 |
| Life Sciences Tools & Services–1.44% |
| Agilent Technologies, Inc. | 6,404 | 478,187 |
| Illumina, Inc.(b) | 1,302 | 479,331 |
| IQVIA Holdings, Inc.(b) | 3,171 | 510,214 |
| Mettler-Toledo International, Inc.(b) | 566 | 475,440 |
| PerkinElmer, Inc. | 4,821 | 464,455 |
| Thermo Fisher Scientific, Inc. | 1,570 | 461,078 |
| Waters Corp.(b) | 2,204 | 474,389 |
| | | | 3,343,094 |
See accompanying Notes to Financial Statements which are an integral part of the financial statements.
Invesco V.I. Equally-Weighted S&P 500 Fund
| | Shares | Value |
| Managed Health Care–0.96% |
| Anthem, Inc. | 1,570 | $443,070 |
| Centene Corp.(b) | 8,368 | 438,818 |
| Humana, Inc. | 1,779 | 471,969 |
| UnitedHealth Group, Inc. | 1,819 | 443,854 |
| WellCare Health Plans, Inc.(b) | 1,560 | 444,709 |
| | | | 2,242,420 |
| Metal & Glass Containers–0.21% |
| Ball Corp. | 6,851 | 479,501 |
| Motorcycle Manufacturers–0.20% |
| Harley-Davidson, Inc. | 12,937 | 463,533 |
| Movies & Entertainment–0.59% |
| Netflix, Inc.(b) | 1,318 | 484,128 |
| Viacom, Inc., Class B | 15,248 | 455,458 |
| Walt Disney Co. (The) | 3,163 | 441,681 |
| | | | 1,381,267 |
| Multi-line Insurance–0.58% |
| American International Group, Inc. | 8,405 | 447,818 |
| Assurant, Inc. | 4,216 | 448,498 |
| Hartford Financial Services Group, Inc. (The) | 8,155 | 454,397 |
| | | | 1,350,713 |
| Multi-Sector Holdings–0.41% |
| Berkshire Hathaway, Inc., Class B(b) | 2,183 | 465,350 |
| Jefferies Financial Group, Inc. | 24,925 | 479,308 |
| | | | 944,658 |
| Multi-Utilities–1.90% |
| Ameren Corp. | 5,842 | 438,793 |
| CenterPoint Energy, Inc. | 15,130 | 433,172 |
| CMS Energy Corp. | 7,627 | 441,680 |
| Consolidated Edison, Inc. | 5,047 | 442,521 |
| Dominion Energy, Inc. | 5,846 | 452,013 |
| DTE Energy Co. | 3,459 | 442,337 |
| NiSource, Inc. | 15,588 | 448,934 |
| Public Service Enterprise Group, Inc. | 7,328 | 431,033 |
| Sempra Energy | 3,253 | 447,092 |
| WEC Energy Group, Inc. | 5,314 | 443,028 |
| | | | 4,420,603 |
| Office REITs–0.73% |
| Alexandria Real Estate Equities, Inc. | 2,962 | 417,908 |
| Boston Properties, Inc. | 3,314 | 427,506 |
| SL Green Realty Corp. | 5,118 | 411,334 |
| Vornado Realty Trust | 6,769 | 433,893 |
| | | | 1,690,641 |
| Oil & Gas Drilling–0.20% |
| Helmerich & Payne, Inc. | 9,259 | 468,691 |
| Oil & Gas Equipment & Services–1.06% |
| Baker Hughes, a GE Co., Class A | 20,232 | 498,314 |
| | Shares | Value |
| Oil & Gas Equipment & Services–(continued) |
| Halliburton Co. | 20,961 | $476,653 |
| National Oilwell Varco, Inc. | 22,407 | 498,108 |
| Schlumberger Ltd. | 12,473 | 495,677 |
| TechnipFMC PLC (United Kingdom) | 19,707 | 511,199 |
| | | | 2,479,951 |
| Oil & Gas Exploration & Production–2.68% |
| Anadarko Petroleum Corp. | 6,417 | 452,783 |
| Apache Corp. | 16,302 | 472,269 |
| Cabot Oil & Gas Corp. | 18,853 | 432,865 |
| Cimarex Energy Co. | 8,207 | 486,921 |
| Concho Resources, Inc. | 4,555 | 469,985 |
| ConocoPhillips | 7,618 | 464,698 |
| Devon Energy Corp. | 17,390 | 495,963 |
| Diamondback Energy, Inc. | 4,518 | 492,326 |
| EOG Resources, Inc. | 5,261 | 490,115 |
| Hess Corp. | 7,845 | 498,707 |
| Marathon Oil Corp. | 34,526 | 490,614 |
| Noble Energy, Inc. | 22,714 | 508,794 |
| Pioneer Natural Resources Co. | 3,165 | 486,967 |
| | | | 6,243,007 |
| Oil & Gas Refining & Marketing–0.87% |
| HollyFrontier Corp. | 11,119 | 514,587 |
| Marathon Petroleum Corp. | 9,344 | 522,143 |
| Phillips 66 | 5,235 | 489,682 |
| Valero Energy Corp. | 5,837 | 499,705 |
| | | | 2,026,117 |
| Oil & Gas Storage & Transportation–0.60% |
| Kinder Morgan, Inc. | 21,872 | 456,688 |
| ONEOK, Inc. | 6,952 | 478,367 |
| Williams Cos., Inc. (The) | 16,604 | 465,576 |
| | | | 1,400,631 |
| Packaged Foods & Meats–2.24% |
| Campbell Soup Co. | 10,604 | 424,902 |
| Conagra Brands, Inc. | 14,998 | 397,747 |
| General Mills, Inc. | 8,390 | 440,643 |
| Hershey Co. (The) | 3,239 | 434,123 |
| Hormel Foods Corp. | 10,816 | 438,481 |
| JM Smucker Co. (The) | 3,634 | 418,600 |
| Kellogg Co. | 7,909 | 423,685 |
| Kraft Heinz Co. (The) | 14,786 | 458,957 |
| Lamb Weston Holdings, Inc. | 7,261 | 460,057 |
| McCormick & Co., Inc. | 2,860 | 443,329 |
| Mondelez International, Inc., Class A | 8,140 | 438,746 |
| Tyson Foods, Inc., Class A | 5,470 | 441,648 |
| | | | 5,220,918 |
| Paper Packaging–1.17% |
| Amcor PLC (United Kingdom)(b) | 41,003 | 471,124 |
| Avery Dennison Corp. | 4,080 | 471,974 |
| International Paper Co. | 10,424 | 451,568 |
See accompanying Notes to Financial Statements which are an integral part of the financial statements.
Invesco V.I. Equally-Weighted S&P 500 Fund
| | Shares | Value |
| Paper Packaging–(continued) |
| Packaging Corp. of America | 4,701 | $448,099 |
| Sealed Air Corp. | 10,111 | 432,549 |
| Westrock Co. | 12,431 | 453,359 |
| | | | 2,728,673 |
| Personal Products–0.39% |
| Coty, Inc., Class A | 33,001 | 442,213 |
| Estee Lauder Cos., Inc. (The), Class A | 2,532 | 463,635 |
| | | | 905,848 |
| Pharmaceuticals–2.06% |
| Allergan PLC | 3,865 | 647,117 |
| Bristol-Myers Squibb Co. | 9,422 | 427,288 |
| Eli Lilly and Co. | 4,010 | 444,268 |
| Johnson & Johnson | 3,199 | 445,557 |
| Merck & Co., Inc. | 5,407 | 453,377 |
| Mylan N.V.(b) | 26,331 | 501,342 |
| Nektar Therapeutics(b) | 13,417 | 477,377 |
| Perrigo Co. PLC | 10,378 | 494,200 |
| Pfizer, Inc. | 10,453 | 452,824 |
| Zoetis, Inc. | 4,044 | 458,953 |
| | | | 4,802,303 |
| Property & Casualty Insurance–1.15% |
| Allstate Corp. (The) | 4,387 | 446,114 |
| Chubb Ltd. | 2,982 | 439,219 |
| Cincinnati Financial Corp. | 4,327 | 448,580 |
| Loews Corp. | 8,369 | 457,533 |
| Progressive Corp. (The) | 5,467 | 436,978 |
| Travelers Cos., Inc. (The) | 2,985 | 446,317 |
| | | | 2,674,741 |
| Publishing–0.22% |
| News Corp., Class A | 28,450 | 383,791 |
| News Corp., Class B | 9,138 | 127,566 |
| | | | 511,357 |
| Railroads–0.78% |
| CSX Corp. | 5,806 | 449,210 |
| Kansas City Southern | 3,833 | 466,936 |
| Norfolk Southern Corp. | 2,300 | 458,459 |
| Union Pacific Corp. | 2,682 | 453,553 |
| | | | 1,828,158 |
| Real Estate Services–0.20% |
| CBRE Group, Inc., Class A(b) | 9,042 | 463,855 |
| Regional Banks–2.74% |
| BB&T Corp. | 8,952 | 439,812 |
| Citizens Financial Group, Inc. | 12,815 | 453,138 |
| Comerica, Inc. | 6,383 | 463,661 |
| Fifth Third Bancorp | 16,361 | 456,472 |
| First Republic Bank | 4,650 | 454,073 |
| Huntington Bancshares, Inc. | 33,544 | 463,578 |
| KeyCorp | 26,131 | 463,825 |
| | Shares | Value |
| Regional Banks–(continued) |
| M&T Bank Corp. | 2,668 | $453,747 |
| People’s United Financial, Inc. | 27,427 | 460,225 |
| PNC Financial Services Group, Inc. (The) | 3,314 | 454,946 |
| Regions Financial Corp. | 30,716 | 458,897 |
| SunTrust Banks, Inc. | 6,940 | 436,179 |
| SVB Financial Group(b) | 2,053 | 461,083 |
| Zions Bancorp. N.A. | 9,985 | 459,110 |
| | | | 6,378,746 |
| Reinsurance–0.19% |
| Everest Re Group, Ltd. | 1,784 | 440,969 |
| Research & Consulting Services–0.79% |
| Equifax, Inc. | 3,394 | 459,004 |
| IHS Markit Ltd.(b) | 7,554 | 481,341 |
| Nielsen Holdings PLC | 19,434 | 439,208 |
| Verisk Analytics, Inc. | 3,073 | 450,072 |
| | | | 1,829,625 |
| Residential REITs–1.13% |
| Apartment Investment & Management Co., Class A | 8,731 | 437,598 |
| AvalonBay Communities, Inc. | 2,145 | 435,821 |
| Equity Residential | 5,725 | 434,642 |
| Essex Property Trust, Inc. | 1,497 | 437,019 |
| Mid-America Apartment Communities, Inc. | 3,804 | 447,959 |
| UDR, Inc. | 9,613 | 431,528 |
| | | | 2,624,567 |
| Restaurants–0.97% |
| Chipotle Mexican Grill, Inc.(b) | 604 | 442,660 |
| Darden Restaurants, Inc. | 3,744 | 455,757 |
| McDonald’s Corp. | 2,182 | 453,114 |
| Starbucks Corp. | 5,319 | 445,892 |
| Yum! Brands, Inc. | 4,081 | 451,644 |
| | | | 2,249,067 |
| Retail REITs–1.12% |
| Federal Realty Investment Trust | 3,365 | 433,277 |
| Kimco Realty Corp. | 23,927 | 442,171 |
| Macerich Co. (The) | 12,978 | 434,633 |
| Realty Income Corp. | 6,086 | 419,752 |
| Regency Centers Corp. | 6,507 | 434,277 |
| Simon Property Group, Inc. | 2,749 | 439,180 |
| | | | 2,603,290 |
| Semiconductor Equipment–0.62% |
| Applied Materials, Inc. | 10,869 | 488,127 |
| KLA-Tencor Corp. | 4,084 | 482,729 |
| Lam Research Corp. | 2,534 | 475,986 |
| | | | 1,446,842 |
| Semiconductors–2.71% |
| Advanced Micro Devices, Inc.(b) | 14,761 | 448,292 |
| Analog Devices, Inc. | 4,307 | 486,131 |
See accompanying Notes to Financial Statements which are an integral part of the financial statements.
Invesco V.I. Equally-Weighted S&P 500 Fund
| | Shares | Value |
| Semiconductors–(continued) |
| Broadcom, Inc. | 1,689 | $486,196 |
| Intel Corp. | 9,702 | 464,435 |
| Maxim Integrated Products, Inc. | 7,995 | 478,261 |
| Microchip Technology, Inc. | 5,386 | 466,966 |
| Micron Technology, Inc.(b) | 13,721 | 529,493 |
| NVIDIA Corp. | 3,098 | 508,785 |
| Qorvo, Inc.(b) | 7,286 | 485,320 |
| QUALCOMM, Inc. | 6,521 | 496,052 |
| Skyworks Solutions, Inc. | 6,241 | 482,242 |
| Texas Instruments, Inc. | 4,175 | 479,123 |
| Xilinx, Inc. | 4,250 | 501,160 |
| | | | 6,312,456 |
| Soft Drinks–0.58% |
| Coca-Cola Co. (The) | 8,733 | 444,684 |
| Monster Beverage Corp.(b) | 7,306 | 466,342 |
| PepsiCo, Inc. | 3,376 | 442,695 |
| | | | 1,353,721 |
| Specialized Consumer Services–0.20% |
| H&R Block, Inc. | 15,620 | 457,666 |
| Specialized REITs–1.71% |
| American Tower Corp. | 2,120 | 433,434 |
| Crown Castle International Corp. | 3,361 | 438,106 |
| Digital Realty Trust, Inc. | 3,741 | 440,652 |
| Equinix, Inc. | 878 | 442,767 |
| Extra Space Storage, Inc. | 4,146 | 439,890 |
| Iron Mountain, Inc. | 14,123 | 442,050 |
| Public Storage | 1,841 | 438,471 |
| SBA Communications Corp.(b) | 1,977 | 444,509 |
| Weyerhaeuser Co. | 17,399 | 458,290 |
| | | | 3,978,169 |
| Specialty Chemicals–1.34% |
| Albemarle Corp. | 6,322 | 445,132 |
| Celanese Corp. | 4,300 | 463,540 |
| DuPont de Nemours, Inc. | 5,969 | 448,093 |
| Ecolab, Inc. | 2,252 | 444,635 |
| International Flavors & Fragrances, Inc.(e) | 3,012 | 437,011 |
| PPG Industries, Inc. | 3,835 | 447,583 |
| Sherwin-Williams Co. (The) | 945 | 433,084 |
| | | | 3,119,078 |
| Specialty Stores–0.58% |
| Tiffany & Co. | 4,923 | 460,990 |
| Tractor Supply Co. | 4,221 | 459,245 |
| Ulta Beauty, Inc.(b) | 1,263 | 438,122 |
| | | | 1,358,357 |
| Steel–0.20% |
| Nucor Corp. | 8,667 | 477,552 |
| Systems Software–1.01% |
| Fortinet, Inc.(b) | 5,919 | 454,757 |
| | Shares | Value |
| Systems Software–(continued) |
| Microsoft Corp. | 3,383 | $453,187 |
| Oracle Corp. | 8,410 | 479,118 |
| Red Hat, Inc.(b) | 2,419 | 454,191 |
| Symantec Corp. | 23,148 | 503,700 |
| | | | 2,344,953 |
| Technology Hardware, Storage & Peripherals–1.45% |
| Apple, Inc. | 2,324 | 459,966 |
| Hewlett Packard Enterprise Co. | 31,671 | 473,482 |
| HP, Inc. | 22,508 | 467,941 |
| NetApp, Inc. | 7,348 | 453,372 |
| Seagate Technology PLC | 10,125 | 477,090 |
| Western Digital Corp. | 12,335 | 586,529 |
| Xerox Corp. | 13,020 | 461,038 |
| | | | 3,379,418 |
| Tobacco–0.37% |
| Altria Group, Inc. | 8,811 | 417,201 |
| Philip Morris International, Inc. | 5,804 | 455,788 |
| | | | 872,989 |
| Trading Companies & Distributors–0.59% |
| Fastenal Co. | 14,159 | 461,442 |
| United Rentals, Inc.(b) | 3,647 | 483,701 |
| W.W. Grainger, Inc. | 1,644 | 440,970 |
| | | | 1,386,113 |
| Trucking–0.19% |
| J.B. Hunt Transport Services, Inc. | 4,932 | 450,834 |
| Water Utilities–0.19% |
| American Water Works Co., Inc. | 3,789 | 439,524 |
| Total Common Stocks & Other Equity Interests (Cost $149,303,714) | 229,153,361 |
| Money Market Funds–1.60% |
| Invesco Government & Agency Portfolio, Institutional Class, 2.26%(f) | 1,397,516 | 1,397,516 |
| Invesco Liquid Assets Portfolio, Institutional Class, 2.40%(f) | 1,064,346 | 1,064,771 |
| Invesco Treasury Portfolio, Institutional Class, 2.22%(f) | 1,259,526 | 1,259,526 |
| Total Money Market Funds (Cost $3,721,641) | 3,721,813 |
| TOTAL INVESTMENTS IN SECURITIES (excluding investments purchased with cash collateral from securities on loan)-99.97% (Cost $153,025,355) | | | 232,875,174 |
| Investments Purchased with Cash Collateral from Securities on Loan |
| Money Market Funds–0.17% |
| Invesco Government & Agency Portfolio, Institutional Class, 2.26%(f)(g) | 297,772 | 297,772 |
See accompanying Notes to Financial Statements which are an integral part of the financial statements.
Invesco V.I. Equally-Weighted S&P 500 Fund
| | Shares | Value |
| Money Market Funds–(continued) |
| Invesco Liquid Assets Portfolio, Institutional Class, 2.40%(f)(g) | 99,218 | $99,258 |
| Total Investments Purchased with Cash Collateral from Securities on Loan (Cost $397,030) | 397,030 |
| TOTAL INVESTMENTS IN SECURITIES–100.14% (Cost $153,422,385) | 233,272,204 |
| OTHER ASSETS LESS LIABILITIES–(0.14)% | (320,312) |
| NET ASSETS–100.00% | $232,951,892 |
Investment Abbreviations:
| REIT | – Real Estate Investment Trust |
Notes to Schedule of Investments:
| (a) | Industry and/or sector classifications used in this report are generally according to the Global Industry Classification Standard, which was developed by and is the exclusive property and a service mark of MSCI Inc. and Standard & Poor’s. |
| (b) | Non-income producing security. |
| (c) | The Fund’s Adviser is a subsidiary of Invesco Ltd. and therefore, Invesco Ltd. is considered to be affiliated with the Fund. The value of this security as of June 30, 2019 represented less than 1% of the Fund’s Net Assets. See Note 5. |
| (d) | All or a portion of the value was pledged as collateral to cover margin requirements for open futures contracts. See Note 1J. |
| (e) | All or a portion of this security was out on loan at June 30, 2019. |
| (f) | The money market fund and the Fund are affiliated by having the same investment adviser. The rate shown is the 7-day SEC standardized yield as of June 30, 2019. |
| (g) | The security has been segregated to satisfy the commitment to return the cash collateral received in securities lending transactions upon the borrower’s return of the securities loaned. See Note 1I. |
| Open Futures Contracts |
| Long Futures Contracts | Number of
Contracts | Expiration
Month | Notional
Value | Value | Unrealized
Appreciation |
| Equity Risk |
| E-Mini S&P 500 Index | 27 | September-2019 | $3,974,670 | $43,032 | $43,032 |
Portfolio Composition
By sector, based on Net Assets
as of June 30, 2019
| Information Technology | 13.69% |
| Industrials | 13.46 |
| Financials | 13.26 |
| Health Care | 12.38 |
| Consumer Discretionary | 12.03 |
| Consumer Staples | 6.24 |
| Real Estate | 6.04 |
| Energy | 6.00 |
| Materials | 5.56 |
| Utilities | 5.34 |
| Communication Services | 4.37 |
| Money Market Funds Plus Other Assets Less Liabilities | 1.63 |
See accompanying Notes to Financial Statements which are an integral part of the financial statements.
Invesco V.I. Equally-Weighted S&P 500 Fund
Statement of Assets and Liabilities
June 30, 2019
(Unaudited)
| Assets: | |
Investments in securities, at value
(Cost $148,872,425)* | $228,709,113 |
Investments in affiliates, at value
(Cost $4,549,960) | 4,563,091 |
| Other investments: | |
| Variation margin receivable — futures contracts | 17,559 |
| Cash | 8,289 |
| Receivable for: | |
| Fund shares sold | 38,831 |
| Dividends | 280,143 |
| Investments sold | 444,974 |
| Investment for trustee deferred compensation and retirement plans | 36,787 |
| Total assets | 234,098,787 |
| Liabilities: | |
| Payable for: | |
| Investments purchased | 451,595 |
| Fund shares reacquired | 21,249 |
| Collateral upon return of securities loaned | 397,030 |
| Accrued fees to affiliates | 192,021 |
| Accrued trustees’ and officers’ fees and benefits | 465 |
| Accrued other operating expenses | 45,084 |
| Trustee deferred compensation and retirement plans | 39,451 |
| Total liabilities | 1,146,895 |
| Net assets applicable to shares outstanding | $232,951,892 |
| Net assets consist of: | |
| Shares of beneficial interest | $142,706,670 |
| Distributable earnings | 90,245,222 |
| | $232,951,892 |
| Net Assets: |
| Series I | $27,920,594 |
| Series II | $205,031,298 |
| Shares outstanding, no par value, with an unlimited number of shares authorized: |
| Series I | 1,319,128 |
| Series II | 9,987,688 |
| Series I: | |
| Net asset value per share | $21.17 |
| Series II: | |
| Net asset value per share | $20.53 |
| * | At June 30, 2019, securities with an aggregate value of $389,075 were on loan to brokers. |
Statement of Operations
For the six months ended June 30, 2019
(Unaudited)
| Investment income: | |
| Dividends | $2,237,676 |
| Dividends from affiliates (includes securities lending income of $568) | 68,112 |
| Total investment income | 2,305,788 |
| Expenses: | |
| Advisory fees | 136,731 |
| Administrative services fees | 159,110 |
| Custodian fees | 16,947 |
| Distribution fees - Series II | 226,866 |
| Transfer agent fees | 2,821 |
| Trustees’ and officers’ fees and benefits | 13,163 |
| Licensing fees | 22,789 |
| Reports to shareholders | 7,052 |
| Professional services fees | 29,802 |
| Other | 20,417 |
| Total expenses | 635,698 |
| Less: Fees waived | (2,713) |
| Net expenses | 632,985 |
| Net investment income | 1,672,803 |
| Realized and unrealized gain from: | |
| Net realized gain from: | |
| Investment securities | 1,794,895 |
| Futures contracts | 724,349 |
| | 2,519,244 |
| Change in net unrealized appreciation of: | |
| Investment securities | 38,538,953 |
| Futures contracts | 38,450 |
| | 38,577,403 |
| Net realized and unrealized gain | 41,096,647 |
| Net increase in net assets resulting from operations | $42,769,450 |
See accompanying Notes to Financial Statements which are an integral part of the financial statements.
Invesco V.I. Equally-Weighted S&P 500 Fund
Statement of Changes in Net Assets
For the six months ended June 30, 2019 and the year ended December 31, 2018
(Unaudited)
| | June 30,
2019 | December 31,
2018 |
| Operations: | | |
| Net investment income | $1,672,803 | $3,868,575 |
| Net realized gain | 2,519,244 | 4,032,717 |
| Change in net unrealized appreciation (depreciation) | 38,577,403 | (31,117,348) |
| Net increase (decrease) in net assets resulting from operations | 42,769,450 | (23,216,056) |
| Distributions to shareholders from distributable earnings: | | |
| Series I | — | (3,643,484) |
| Series II | — | (4,379,437) |
| Total distributions from distributable earnings | — | (8,022,921) |
| Share transactions–net: | | |
| Series I | (94,754,639) | (5,211,678) |
| Series II | 25,610,569 | 50,915,126 |
| Net increase (decrease) in net assets resulting from share transactions | (69,144,070) | 45,703,448 |
| Net increase (decrease) in net assets | (26,374,620) | 14,464,471 |
| Net assets: | | |
| Beginning of period | 259,326,512 | 244,862,041 |
| End of period | $232,951,892 | $259,326,512 |
See accompanying Notes to Financial Statements which are an integral part of the financial statements.
Invesco V.I. Equally-Weighted S&P 500 Fund
Financial Highlights
June 30, 2019
(Unaudited)
The following schedule presents financial highlights for a share of the Fund outstanding throughout the periods indicated.
| | Net asset
value,
beginning
of period | Net
investment
income(a) | Net gains
(losses)
on securities
(both
realized and
unrealized) | Total from
investment
operations | Dividends
from net
investment
income | Distributions
from net
realized
gains | Total
distributions | Net asset
value, end
of period | Total
return(b) | Net assets,
end of period
(000’s omitted) | Ratio of
expenses
to average
net assets
with fee waivers
and/or expenses
absorbed | Ratio of
expenses
to average net
assets without
fee waivers
and/or expenses
absorbed | Ratio of net
investment
income
to average
net assets | Portfolio
turnover(c) |
| Series I |
| Six months ended 06/30/19 | $17.80 | $0.16 | $3.21 | $3.37 | $— | $— | $— | $21.17 | 18.93% | $27,921 | 0.36%(d) | 0.36%(d) | 1.66%(d) | 19% |
| Year ended 12/31/18 | 19.88 | 0.32 | (1.80) | (1.48) | (0.23) | (0.37) | (0.60) | 17.80 | (7.87) | 109,414 | 0.31 | 0.31 | 1.61 | 24 |
| Year ended 12/31/17 | 17.24 | 0.29 | 2.87 | 3.16 | (0.15) | (0.37) | (0.52) | 19.88 | 18.58 | 127,462 | 0.32 | 0.32 | 1.55 | 22 |
| Year ended 12/31/16 | 15.81 | 0.26 | 1.96 | 2.22 | (0.10) | (0.69) | (0.79) | 17.24 | 14.24 | 114,202 | 0.39 | 0.39 | 1.56 | 22 |
| Year ended 12/31/15 | 19.98 | 0.26 | (0.94) | (0.68) | (0.28) | (3.21) | (3.49) | 15.81 | (2.68) | 27,974 | 0.55 | 0.55 | 1.38 | 25 |
| Year ended 12/31/14 | 21.18 | 0.29 | 2.41 | 2.70 | (0.33) | (3.57) | (3.90) | 19.98 | 13.88 | 33,878 | 0.59 | 0.59 | 1.34 | 18 |
| Series II |
| Six months ended 06/30/19 | 17.29 | 0.14 | 3.10 | 3.24 | — | — | — | 20.53 | 18.74 | 205,031 | 0.61(d) | 0.61(d) | 1.41(d) | 19 |
| Year ended 12/31/18 | 19.35 | 0.26 | (1.74) | (1.48) | (0.21) | (0.37) | (0.58) | 17.29 | (8.11) | 149,913 | 0.56 | 0.56 | 1.36 | 24 |
| Year ended 12/31/17 | 16.82 | 0.24 | 2.79 | 3.03 | (0.13) | (0.37) | (0.50) | 19.35 | 18.26 | 117,400 | 0.57 | 0.57 | 1.30 | 22 |
| Year ended 12/31/16 | 15.44 | 0.21 | 1.93 | 2.14 | (0.07) | (0.69) | (0.76) | 16.82 | 14.01 | 48,936 | 0.64 | 0.64 | 1.31 | 22 |
| Year ended 12/31/15 | 19.60 | 0.21 | (0.92) | (0.71) | (0.24) | (3.21) | (3.45) | 15.44 | (2.92) | 38,643 | 0.80 | 0.80 | 1.13 | 25 |
| Year ended 12/31/14 | 20.84 | 0.23 | 2.37 | 2.60 | (0.27) | (3.57) | (3.84) | 19.60 | 13.61 | 37,205 | 0.84 | 0.84 | 1.09 | 18 |
| (a) | Calculated using average shares outstanding. |
| (b) | Includes adjustments in accordance with accounting principles generally accepted in the United States of America and as such, the net asset value for financial reporting purposes and the returns based upon those net asset values may differ from the net asset value and returns for shareholder transactions. Total returns are not annualized for periods less than one year, if applicable, and do not reflect charges assessed in connection with a variable product, which if included would reduce total returns. |
| (c) | Portfolio turnover is calculated at the fund level and is not annualized for periods less than one year, if applicable. |
| (d) | Ratios are annualized and based on average daily net assets (000’s omitted) of $46,778 and $182,997 for Series I and Series II shares, respectively. |
See accompanying Notes to Financial Statements which are an integral part of the financial statements.
Invesco V.I. Equally-Weighted S&P 500 Fund
Notes to Financial Statements
June 30, 2019
(Unaudited)
NOTE 1—Significant Accounting Policies
Invesco V.I. Equally-Weighted S& P 500 Fund (the “Fund”) is a series portfolio of AIM Variable Insurance Funds (Invesco Variable Insurance Funds) (the “Trust”). The Trust is a Delaware statutory trust registered under the Investment Company Act of 1940, as amended (the “1940 Act”), as an open-end series management investment company. Information presented in these financial statements pertains only to the Fund. Matters affecting the Fund or each class will be voted on exclusively by the shareholders of the Fund or each class. Current Securities and Exchange Commission (“SEC”) guidance, however, requires participating insurance companies offering separate accounts to vote shares proportionally in accordance with the instructions of the contract owners whose investments are funded by shares of each Fund or class.
The Fund’s investment objective is to achieve a high level of total return on its assets through a combination of capital appreciation and current income.
The Fund currently offers two classes of shares, Series I and Series II, both of which are offered to insurance company separate accounts funding variable annuity contracts and variable life insurance policies (“variable products”).
The Fund is an investment company and accordingly follows the investment company accounting and reporting guidance in accordance with Financial Accounting Standards Board Accounting Standards Codification Topic 946,Financial Services – Investment Companies.
The following is a summary of the significant accounting policies followed by the Fund in the preparation of its financial statements.
| A. | Security Valuations — Securities, including restricted securities, are valued according to the following policy. |
A security listed or traded on an exchange (except convertible securities) is valued at its last sales price or official closing price as of the close of the customary trading session on the exchange where the security is principally traded, or lacking any sales or official closing price on a particular day, the security may be valued at the closing bid price on that day. Securities traded in the over-the-counter market are valued based on prices furnished by independent pricing services or market makers. When such securities are valued by an independent pricing service they may be considered fair valued. Futures contracts are valued at the final settlement price set by an exchange on which they are principally traded. Listed options are valued at the mean between the last bid and asked prices from the exchange on which they are principally traded. Options not listed on an exchange are valued by an independent source at the mean between the last bid and asked prices. For purposes of determining net asset value (“NAV”) per share, futures and option contracts generally are valued 15 minutes after the close of the customary trading session of the New York Stock Exchange (“NYSE”).
Investments in open-end and closed-end registered investment companies that do not trade on an exchange are valued at the end-of-day net asset value per share. Investments in open-end and closed-end registered investment companies that trade on an exchange are valued at the last sales price or official closing price as of the close of the customary trading session on the exchange where the security is principally traded.
Debt obligations (including convertible securities) and unlisted equities are fair valued using an evaluated quote provided by an independent pricing service. Evaluated quotes provided by the pricing service may be determined without exclusive reliance on quoted prices, and may reflect appropriate factors such as institution-size trading in similar groups of securities, developments related to specific securities, dividend rate (for unlisted equities), yield (for debt obligations), quality, type of issue, coupon rate (for debt obligations), maturity (for debt obligations), individual trading characteristics and other market data. Pricing services generally value debt obligations assuming orderly transactions of institutional round lot size, but a fund may hold or transact in the same securities in smaller, odd lot sizes. Odd lots often trade at lower prices than institutional round lots. Debt obligations are subject to interest rate and credit risks. In addition, all debt obligations involve some risk of default with respect to interest and/or principal payments.
Foreign securities’ (including foreign exchange contracts) prices are converted into U.S. dollar amounts using the applicable exchange rates as of the close of the NYSE. If market quotations are available and reliable for foreign exchange-traded equity securities, the securities will be valued at the market quotations. Because trading hours for certain foreign securities end before the close of the NYSE, closing market quotations may become unreliable. If between the time trading ends on a particular security and the close of the customary trading session on the NYSE, events occur that the investment adviser determines are significant and make the closing price unreliable, the Fund may fair value the security. If the event is likely to have affected the closing price of the security, the security will be valued at fair value in good faith using procedures approved by the Board of Trustees. Adjustments to closing prices to reflect fair value may also be based on a screening process of an independent pricing service to indicate the degree of certainty, based on historical data, that the closing price in the principal market where a foreign security trades is not the current value as of the close of the NYSE. Foreign securities’ prices meeting the approved degree of certainty that the price is not reflective of current value will be priced at the indication of fair value from the independent pricing service. Multiple factors may be considered by the independent pricing service in determining adjustments to reflect fair value and may include information relating to sector indices, American Depositary Receipts and domestic and foreign index futures. Foreign securities may have additional risks including exchange rate changes, potential for sharply devalued currencies and high inflation, political and economic upheaval, the relative lack of issuer information, relatively low market liquidity and the potential lack of strict financial and accounting controls and standards.
Securities for which market prices are not provided by any of the above methods may be valued based upon quotes furnished by independent sources. The last bid price may be used to value equity securities. The mean between the last bid and asked prices is used to value debt obligations, including corporate loans.
Securities for which market quotations are not readily available or became unreliable are valued at fair value as determined in good faith by or under the supervision of the Trust’s officers following procedures approved by the Board of Trustees. Issuer specific events, market trends, bid/asked quotes of brokers and information providers and other market data may be reviewed in the course of making a good faith determination of a security’s fair value.
The Fund may invest in securities that are subject to interest rate risk, meaning the risk that the prices will generally fall as interest rates rise and, conversely, the prices will generally rise as interest rates fall. Specific securities differ in their sensitivity to changes in interest rates depending on their individual characteristics. Changes in interest rates may result in increased market volatility, which may affect the value and/or liquidity of certain Fund investments.
Invesco V.I. Equally-Weighted S&P 500 Fund
Valuations change in response to many factors including the historical and prospective earnings of the issuer, the value of the issuer’s assets, general economic conditions, interest rates, investor perceptions and market liquidity. Because of the inherent uncertainties of valuation, the values reflected in the financial statements may materially differ from the value received upon actual sale of those investments.
| B. | Securities Transactions and Investment Income – Securities transactions are accounted for on a trade date basis. Realized gains or losses on sales are computed on the basis of specific identification of the securities sold. Interest income (net of withholding tax, if any) is recorded on the accrual basis from settlement date. Dividend income (net of withholding tax, if any) is recorded on the ex-dividend date. |
The Fund may periodically participate in litigation related to Fund investments. As such, the Fund may receive proceeds from litigation settlements. Any proceeds received are included in the Statement of Operations as realized gain (loss) for investments no longer held and as unrealized gain (loss) for investments still held.
Brokerage commissions and mark ups are considered transaction costs and are recorded as an increase to the cost basis of securities purchased and/or a reduction of proceeds on a sale of securities. Such transaction costs are included in the determination of net realized and unrealized gain (loss) from investment securities reported in the Statement of Operations and the Statement of Changes in Net Assets and the net realized and unrealized gains (losses) on securities per share in the Financial Highlights. Transaction costs are included in the calculation of the Fund’s net asset value and, accordingly, they reduce the Fund’s total returns. These transaction costs are not considered operating expenses and are not reflected in net investment income reported in the Statement of Operations and the Statement of Changes in Net Assets, or the net investment income per share and the ratios of expenses and net investment income reported in the Financial Highlights, nor are they limited by any expense limitation arrangements between the Fund and the investment adviser.
The Fund allocates income and realized and unrealized capital gains and losses to a class based on the relative net assets of each class.
The Fund recharacterizes distributions received from REIT investments based on information provided by the REIT into the following categories: ordinary income, long-term and short-term capital gains, and return of capital. If information is not available on a timely basis from the REIT, the recharacterization will be based on available information which may include the previous year’s allocation. If new or additional information becomes available from the REIT at a later date, a recharacterization will be made in the following year. The Fund records as dividend income the amount recharacterized as ordinary income and as realized gain the amount recharacterized as capital gain in the Statement of Operations, and the amount recharacterized as return of capital as a reduction of the cost of the related investment. These recharacterizations are reflected in the accompanying financial statements.
| C. | Country Determination — For the purposes of making investment selection decisions and presentation in the Schedule of Investments, the investment adviser may determine the country in which an issuer is located and/or credit risk exposure based on various factors. These factors include the laws of the country under which the issuer is organized, where the issuer maintains a principal office, the country in which the issuer derives 50% or more of its total revenues and the country that has the primary market for the issuer’s securities, as well as other criteria. Among the other criteria that may be evaluated for making this determination are the country in which the issuer maintains 50% or more of its assets, the type of security, financial guarantees and enhancements, the nature of the collateral and the sponsor organization. Country of issuer and/or credit risk exposure has been determined to be the United States of America, unless otherwise noted. |
| D. | Distributions– Distributions from net investment income and net realized capital gain, if any, are generally declared and paid to separate accounts of participating insurance companies annually and recorded on the ex-dividend date. |
| E. | Federal Income Taxes –The Fund intends to comply with the requirements of Subchapter M of the Internal Revenue Code of 1986, as amended (the “Internal Revenue Code”), necessary to qualify as a regulated investment company and to distribute substantially all of the Fund’s taxable earnings to shareholders. As such, the Fund will not be subject to federal income taxes on otherwise taxable income (including net realized capital gain) that is distributed to shareholders. Therefore, no provision for federal income taxes is recorded in the financial statements. |
The Fund recognizes the tax benefits of uncertain tax positions only when the position is more likely than not to be sustained. Management has analyzed the Fund’s uncertain tax positions and concluded that no liability for unrecognized tax benefits should be recorded related to uncertain tax positions. Management is not aware of any tax positions for which it is reasonably possible that the total amounts of unrecognized tax benefits will change materially in the next 12 months.
The Fund files tax returns in the U.S. Federal jurisdiction and certain other jurisdictions. Generally, the Fund is subject to examinations by such taxing authorities for up to three years after the filing of the return for the tax period.
| F. | Expenses– Fees provided for under the Rule 12b-1 plan of a particular class of the Fund and which are directly attributable to that class are charged to the operations of such class. All other expenses are allocated among the classes based on relative net assets. |
| G. | Accounting Estimates – The preparation of financial statements in conformity with accounting principles generally accepted in the United States of America (“GAAP”) requires management to make estimates and assumptions that affect the reported amounts of assets and liabilities at the date of the financial statements and the reported amounts of revenues and expenses during the reporting period including estimates and assumptions related to taxation. Actual results could differ from those estimates by a significant amount. In addition, the Fund monitors for material events or transactions that may occur or become known after the period-end date and before the date the financial statements are released to print. |
| H. | Indemnifications – Under the Trust’s organizational documents, each Trustee, officer, employee or other agent of the Trust is indemnified against certain liabilities that may arise out of the performance of their duties to the Fund. Additionally, in the normal course of business, the Fund enters into contracts, including the Fund’s servicing agreements, that contain a variety of indemnification clauses. The Fund’s maximum exposure under these arrangements is unknown as this would involve future claims that may be made against the Fund that have not yet occurred. The risk of material loss as a result of such indemnification claims is considered remote. |
| I. | Securities Lending – The Fund may lend portfolio securities having a market value up to one-third of the Fund’s total assets. Such loans are secured by collateral equal to no less than the market value of the loaned securities determined daily by the securities lending provider. Such collateral will be cash or debt securities issued or guaranteed by the U.S. Government or any of its sponsored agencies. Cash collateral received in connection with these loans is invested in short-term money market instruments or affiliated money market funds and is shown as such on the Schedule of Investments. The Fund bears the risk of loss with respect to the investment of collateral. It is the Fund’s policy to obtain additional collateral from or return excess collateral to the borrower by the end of the next business day, following the valuation date of the securities loaned. Therefore, the value of the collateral held may be temporarily less than the value of the securities on loan. When loaning securities, the Fund retains certain benefits of owning the securities, including the economic equivalent of dividends or interest generated by the security. |
Invesco V.I. Equally-Weighted S&P 500 Fund
| | Lending securities entails a risk of loss to the Fund if, and to the extent that, the market value of the securities loaned were to increase and the borrower did not increase the collateral accordingly, and the borrower failed to return the securities. The securities loaned are subject to termination at the option of the borrower or the Fund. Upon termination, the borrower will return to the Fund the securities loaned and the Fund will return the collateral. Upon the failure of the borrower to return the securities, collateral may be liquidated and the securities may be purchased on the open market to replace the loaned securities. The Fund could experience delays and costs in gaining access to the collateral and the securities may lose value during the delay which could result in potential losses to the Fund. Some of these losses may be indemnified by the lending agent. The Fund bears the risk of any deficiency in the amount of the collateral available for return to the borrower due to any loss on the collateral invested. Dividends received on cash collateral investments for securities lending transactions, which are net of compensation to counterparties, are included inDividends from affiliates on the Statement of Operations. The aggregate value of securities out on loan, if any, is shown as a footnote on the Statement of Assets and Liabilities. |
| J. | Futures Contracts — The Fund may enter into futures contracts to manage exposure to interest rate, equity and market price movements and/or currency risks. A futures contract is an agreement between two parties ("Counterparties") to purchase or sell a specified underlying security, currency or commodity (or delivery of a cash settlement price, in the case of an index future) for a fixed price at a future date. The Fund currently invests only in exchange-traded futures and they are standardized as to maturity date and underlying financial instrument. Initial margin deposits required upon entering into futures contracts are satisfied by the segregation of specific securities or cash as collateral at the futures commission merchant (broker). During the period the futures contracts are open, changes in the value of the contracts are recognized as unrealized gains or losses by recalculating the value of the contracts on a daily basis. Subsequent or variation margin payments are received or made depending upon whether unrealized gains or losses are incurred. These amounts are reflected as receivables or payables on the Statement of Assets and Liabilities. When the contracts are closed or expire, the Fund recognizes a realized gain or loss equal to the difference between the proceeds from, or cost of, the closing transaction and the Fund’s basis in the contract. The net realized gain (loss) and the change in unrealized gain (loss) on futures contracts held during the period is included on the Statement of Operations. The primary risks associated with futures contracts are market risk and the absence of a liquid secondary market. If the Fund were unable to liquidate a futures contract and/or enter into an offsetting closing transaction, the Fund would continue to be subject to market risk with respect to the value of the contracts and continue to be required to maintain the margin deposits on the futures contracts. Futures contracts have minimal Counterparty risk since the exchange’s clearinghouse, as Counterparty to all exchange-traded futures, guarantees the futures against default. Risks may exceed amounts recognized in the Statement of Assets and Liabilities. |
| K. | Collateral—To the extent the Fund has designated or segregated a security as collateral and that security is subsequently sold, it is the Fund’s practice to replace such collateral no later than the next business day. This practice does not apply to securities pledged as collateral for securities lending transactions. |
NOTE 2—Advisory Fees and Other Fees Paid to Affiliates
The Trust has entered into a master investment advisory agreement with Invesco Advisers, Inc. (the "Adviser" or "Invesco"). Under the terms of the investment advisory agreement, the Fund accrues daily and pays monthly an advisory fee to the Adviser based on the annual rate of the Fund’s average daily net assets as follows:
| Average Daily Net Assets | Rate |
| First $2 billion | 0.12% |
| Over $2 billion | 0.10% |
For the six months ended June 30, 2019, the effective advisory fees incurred by the Fund was 0.12%.
Under the terms of a master sub-advisory agreement between the Adviser and each of Invesco Asset Management Deutschland GmbH, Invesco Asset Management Limited, Invesco Asset Management (Japan) Limited, Invesco Hong Kong Limited, Invesco Senior Secured Management, Inc. and Invesco Canada Ltd. and separate sub-advisory agreements with Invesco Capital Management LLC and Invesco Asset Management (India) Private Limited (collectively, the "Affiliated Sub-Advisers") the Adviser, not the Fund, will pay 40% of the fees paid to the Adviser to any such Affiliated Sub-Adviser(s) that provide(s) discretionary investment management services to the Fund based on the percentage of assets allocated to such Affiliated Sub-Adviser(s).
The Adviser has contractually agreed, through at least June 30, 2020, to waive advisory fees and/or reimburse expenses of all shares to the extent necessary to limit total annual fund operating expenses after fee waiver and/or expense reimbursement (excluding certain items discussed below) of Series I shares to 2.00% and Series II shares to 2.25% of average daily net assets (the “expense limits”). In determining the Adviser’s obligation to waive advisory fees and/or reimburse expenses, the following expenses are not taken into account, and could cause the total annual fund operating expenses after fee waiver and/or expense reimbursement to exceed the numbers reflected above: (1) interest; (2) taxes; (3) dividend expense on short sales; (4) extraordinary or non-routine items, including litigation expenses; and (5) expenses that the Fund has incurred but did not actually pay because of an expense offset arrangement. Unless Invesco continues the fee waiver agreement, it will terminate on June 30, 2020. During its term, the fee waiver agreement cannot be terminated or amended to increase the expense limits or reduce the advisory fee waiver without approval of the Board of Trustees. The Adviser did not waive fees and/or reimburse expenses during the period under these expense limits.
Further, the Adviser has contractually agreed, through at least June 30, 2021, to waive the advisory fee payable by the Fund in an amount equal to 100% of the net advisory fees the Adviser receives from the affiliated money market funds on investments by the Fund of uninvested cash (excluding investments of cash collateral from securities lending) in such affiliated money market funds.
For the six months ended June 30, 2019, the Adviser waived advisory fees of $2,713.
The Trust has entered into a master administrative services agreement with Invesco pursuant to which the Fund has agreed to pay Invesco a fee for costs incurred in providing accounting services and fund administrative services to the Fund and to reimburse Invesco for fees paid to insurance companies that have agreed to provide certain administrative services to the Fund. These administrative services provided by the insurance companies may include, among other things: maintenance of master accounts with the Fund; tracking, recording and transmitting net purchase and redemption orders for Fund shares; maintaining and preserving records related to the purchase, redemption and other account activity of variable product owners; distributing copies of Fund documents such as prospectuses, proxy materials and periodic reports, to variable product owners, and responding to
Invesco V.I. Equally-Weighted S&P 500 Fund
inquiries from variable product owners about the Fund. Pursuant to such agreement, for the six months ended June 30, 2019, Invesco was paid $16,083 for accounting and fund administrative services and was reimbursed $143,027 for fees paid to insurance companies. Also, Invesco has entered into a sub-administration agreement whereby State Street Bank and Trust Company (“SSB”) serves as custodian and fund accountant and provides certain administrative services to the Fund.
The Trust has entered into a transfer agency and service agreement with Invesco Investment Services, Inc. (“IIS”) pursuant to which the Fund has agreed to pay IIS a fee for providing transfer agency and shareholder services to the Fund and reimburse IIS for certain expenses incurred by IIS in the course of providing such services. For the six months ended June 30, 2019, expenses incurred under the agreement are shown in the Statement of Operations asTransfer agent fees.
The Trust has entered into a master distribution agreement with Invesco Distributors, Inc. (“IDI”) to serve as the distributor for the Fund. The Trust has adopted a plan pursuant to Rule 12b-1 under the 1940 Act with respect to the Fund’s Series II shares (the “Plan”). The Fund, pursuant to the Plan, pays IDI compensation at the annual rate of 0.25% of the Fund’s average daily net assets of Series II shares. The fees are accrued daily and paid monthly. Of the Plan payments, up to 0.25% of the average daily net assets of the Series II shares may be paid to insurance companies who furnish continuing personal shareholder services to customers who purchase and own Series II shares of the Fund. For the six months ended June 30, 2019, expenses incurred under the Plan are detailed in the Statement of Operations asDistribution fees.
Certain officers and trustees of the Trust are officers and directors of the Adviser, IIS and/or IDI.
NOTE 3—Additional Valuation Information
GAAP defines fair value as the price that would be received to sell an asset or paid to transfer a liability in an orderly transaction between market participants at the measurement date, under current market conditions. GAAP establishes a hierarchy that prioritizes the inputs to valuation methods, giving the highest priority to readily available unadjusted quoted prices in an active market for identical assets (Level 1) and the lowest priority to significant unobservable inputs (Level 3), generally when market prices are not readily available or are unreliable. Based on the valuation inputs, the securities or other investments are tiered into one of three levels. Changes in valuation methods may result in transfers in or out of an investment’s assigned level:
Level 1 – Prices are determined using quoted prices in an active market for identical assets.
Level 2 – Prices are determined using other significant observable inputs. Observable inputs are inputs that other market participants may use in pricing a security. These may include quoted prices for similar securities, interest rates, prepayment speeds, credit risk, yield curves, loss severities, default rates, discount rates, volatilities and others.
Level 3 – Prices are determined using significant unobservable inputs. In situations where quoted prices or observable inputs are unavailable (for example, when there is little or no market activity for an investment at the end of the period), unobservable inputs may be used. Unobservable inputs reflect the Fund’s own assumptions about the factors market participants would use in determining fair value of the securities or instruments and would be based on the best available information.
The following is a summary of the tiered valuation input levels, as of June 30, 2019. The level assigned to the securities valuations may not be an indication of the risk or liquidity associated with investing in those securities. Because of the inherent uncertainties of valuation, the values reflected in the financial statements may materially differ from the value received upon actual sale of those investments.
| | Level 1 | Level 2 | Level 3 | Total |
| Investments in Securities | | | | |
| Common Stocks & Other Equity Interests | $229,153,361 | $— | $— | $229,153,361 |
| Money Market Funds | 4,118,843 | — | — | 4,118,843 |
| Total Investments in Securities | 233,272,204 | — | — | 233,272,204 |
| Other Investments - Assets* | | | | |
| Futures Contracts | 43,032 | — | — | 43,032 |
| Total Investments | $233,315,236 | $— | $— | $233,315,236 |
| * | Unrealized appreciation. |
NOTE 4—Derivative Investments
The Fund may enter into an International Swaps and Derivatives Association Master Agreement (“ISDA Master Agreement”) under which a fund may trade OTC derivatives. An OTC transaction entered into under an ISDA Master Agreement typically involves a collateral posting arrangement, payment netting provisions and close-out netting provisions. These netting provisions allow for reduction of credit risk through netting of contractual obligations. The enforceability of the netting provisions of the ISDA Master Agreement depends on the governing law of the ISDA Master Agreement, among other factors.
For financial reporting purposes, the Fund does not offset OTC derivative assets or liabilities that are subject to ISDA Master Agreements in the Statement of Assets and Liabilities.
Invesco V.I. Equally-Weighted S&P 500 Fund
Value of Derivative Investments at Period-End
The table below summarizes the value of the Fund’s derivative investments, detailed by primary risk exposure, held as of June 30, 2019:
| | Value |
| Derivative Assets | Equity
Risk |
| Unrealized appreciation on futures contracts — Exchange-Traded(a) | $43,032 |
| Derivatives not subject to master netting agreements | (43,032) |
| Total Derivative Assets subject to master netting agreements | $- |
| (a) | The daily variation margin receivable at period-end is recorded in the Statement of Assets and Liabilities. |
Effect of Derivative Investments for the six months ended June 30, 2019
The table below summarizes the gains (losses) on derivative investments, detailed by primary risk exposure, recognized in earnings during the period:
| | Location of Gain on
Statement of Operations |
| | Equity
Risk |
| Realized Gain: | |
| Futures contracts | $724,349 |
| Change in Net Unrealized Appreciation: | |
| Futures contracts | 38,450 |
| Total | $762,799 |
The table below summarizes the average notional value of derivatives held during the period.
| | Futures
Contracts |
| Average notional value | $5,063,092 |
NOTE 5—Investments in Affiliates
| | Value
12/31/18 | Purchases
at Cost | Proceeds
from Sales | Change in
Unrealized
Appreciation | Realized
Gain (loss) | Value
06/30/19 | Dividend
Income |
| Invesco Ltd. | $524,213 | $43,508 | $(216,034) | $221,606 | $(129,045) | $444,248 | $13,386 |
NOTE 6—Trustees’ and Officers’ Fees and Benefits
Trustees’ and Officers’ Fees and Benefits include amounts accrued by the Fund to pay remuneration to certain Trustees and Officers of the Fund. Trustees have the option to defer compensation payable by the Fund, and Trustees’ and Officers’ Fees and Benefits also include amounts accrued by the Fund to fund such deferred compensation amounts. Those Trustees who defer compensation have the option to select various Invesco Funds in which their deferral accounts shall be deemed to be invested. Finally, certain current Trustees were eligible to participate in a retirement plan that provided for benefits to be paid upon retirement to Trustees over a period of time based on the number of years of service. The Fund may have certain former Trustees who also participate in a retirement plan and receive benefits under such plan.Trustees’ and Officers’ Fees and Benefits include amounts accrued by the Fund to fund such retirement benefits. Obligations under the deferred compensation and retirement plans represent unsecured claims against the general assets of the Fund.
NOTE 7—Cash Balances
The Fund is permitted to temporarily carry a negative or overdrawn balance in its account with SSB, the custodian bank. Such balances, if any at period-end, are shown in the Statement of Assets and Liabilities under the payable captionAmount due custodian. To compensate the custodian bank for such overdrafts, the overdrawn Fund may either (1) leave funds as a compensating balance in the account so the custodian bank can be compensated by earning the additional interest; or (2) compensate by paying the custodian bank at a rate agreed upon by the custodian bank and Invesco, not to exceed the contractually agreed upon rate.
NOTE 8—Tax Information
The amount and character of income and gains to be distributed are determined in accordance with income tax regulations, which may differ from GAAP. Reclassifications are made to the Fund’s capital accounts to reflect income and gains available for distribution (or available capital loss carryforward) under income tax regulations. The tax character of distributions paid during the year and the tax components of net assets will be reported at the Fund’s fiscal year-end.
Capital loss carryforward is calculated and reported as of a specific date. Results of transactions and other activity after that date may affect the amount of capital loss carryforward actually available for the Fund to utilize. Capital losses generated in years beginning after December 22, 2010 can be carried forward for an unlimited period, whereas previous losses expire in eight tax years. Capital losses with an expiration period may not be used to offset capital gains until all net capital losses without an expiration date have been utilized. Capital loss carryforwards with no expiration date
Invesco V.I. Equally-Weighted S&P 500 Fund
will retain their character as either short-term or long-term capital losses instead of as short-term capital losses as under prior law. The ability to utilize capital loss carryforwards in the future may be limited under the Internal Revenue Code and related regulations based on the results of future transactions.
The Fund did not have a capital loss carryforward as of December 31, 2018.
NOTE 9—Investment Transactions
The aggregate amount of investment securities (other than short-term securities, U.S. Treasury obligations and money market funds, if any) purchased and sold by the Fund during the six months ended June 30, 2019 was $42,311,831 and $107,904,251, respectively. Cost of investments, including any derivatives, on a tax basis includes the adjustments for financial reporting purposes as of the most recently completed federal income tax reporting period-end.
| Unrealized Appreciation (Depreciation) of Investments on a Tax Basis |
| Aggregate unrealized appreciation of investments | $80,647,070 |
| Aggregate unrealized (depreciation) of investments | (2,780,027) |
| Net unrealized appreciation of investments | $77,867,043 |
Cost of investments for tax purposes is $155,448,193.
NOTE 10—Share Information
| | Summary of Share Activity |
| | Six months ended
June 30, 2019(a) | | Year ended
December 31, 2018 |
| | Shares | Amount | | Shares | Amount |
| Sold: | | | | | |
| Series I | 146,512 | $2,931,280 | | 424,677 | $8,542,209 |
| Series II | 1,688,446 | 32,964,865 | | 3,056,048 | 59,434,939 |
| Issued as reinvestment of dividends: | | | | | |
| Series I | — | — | | 174,246 | 3,643,484 |
| Series II | — | — | | 215,418 | 4,379,437 |
| Reacquired: | | | | | |
| Series I | (4,975,019) | (97,685,919) | | (863,544) | (17,397,371) |
| Series II | (372,862) | (7,354,296) | | (667,704) | (12,899,250) |
| Net increase (decrease) in share activity | (3,512,923) | $(69,144,070) | | 2,339,141 | $45,703,448 |
| (a) | There are entities that are record owners of more than 5% of the outstanding shares of the Fund and in the aggregate own 88% of the outstanding shares of the Fund. The Fund and the Fund’s principal underwriter or adviser, are parties to participation agreements with these entities whereby these entities sell units of interest in separate accounts funding variable products that are invested in the Fund. The Fund, Invesco and/or Invesco affiliates may make payments to these entities, which are considered to be related to the Fund, for providing services to the Fund, Invesco and/or Invesco affiliates including but not limited to services such as, securities brokerage, third party record keeping and account servicing and administrative services. The Fund has no knowledge as to whether all or any portion of the shares owned of record by these entities are also owned beneficially. |
Invesco V.I. Equally-Weighted S&P 500 Fund
Calculating your ongoing Fund expenses
Example
As a shareholder of the Fund, you incur ongoing costs, including management fees; distribution and/or service fees (12b-1); and other Fund expenses. This example is intended to help you understand your ongoing costs (in dollars) of investing in the Fund and to compare these costs with ongoing costs of investing in other mutual funds. The example is based on an investment of $1,000 invested at the beginning of the period and held for the entire period January 1, 2019 through June 30, 2019.
The actual and hypothetical expenses in the examples below do not represent the effect of any fees or other expenses assessed in connection with a variable product; if they did, the expenses shown would be higher while the ending account values shown would be lower.
Actual expenses
The table below provides information about actual account values and actual expenses. You may use the information in this table, together with the amount you invested, to estimate the expenses that you paid over the period. Simply divide your account value by $1,000 (for example, an $8,600 account value divided by $1,000 = 8.6), then multiply the result by the number in the table under the heading entitled “Actual Expenses Paid During Period” to estimate the expenses you paid on your account during this period.
Hypothetical example for comparison purposes
The table below also provides information about hypothetical account values and hypothetical expenses based on the Fund’s actual expense ratio and an assumed rate of return of 5% per year before expenses, which is not the Fund’s actual return.
The hypothetical account values and expenses may not be used to estimate the actual ending account balance or expenses you paid for the period. You may use this information to compare the ongoing costs of investing in the Fund and other funds. To do so, compare this 5% hypothetical example with the 5% hypothetical examples that appear in the shareholder reports of the other funds.
Please note that the expenses shown in the table are meant to highlight your ongoing costs. Therefore, the hypothetical information is useful in comparing ongoing costs, and will not help you determine the relative total costs of owning different funds.
| | Beginning
Account Value (01/01/19) | ACTUAL | HYPOTHETICAL
(5% annual return before
expenses) | Annualized
Expense
Ratio |
Ending
Account Value
(06/30/19)1 | Expenses
Paid During
Period2 | Ending
Account Value
(06/30/19) | Expenses
Paid During
Period2 |
| Series I | $1,000.00 | $1,189.30 | $1.95 | $1,023.01 | $1.81 | 0.36% |
| Series II | 1,000.00 | 1,187.40 | 3.31 | 1,021.77 | 3.06 | 0.61 |
| 1 | The actual ending account value is based on the actual total return of the Fund for the period January 1, 2019 through June 30, 2019, after actual expenses and will differ from the hypothetical ending account value which is based on the Fund’s expense ratio and a hypothetical annual return of 5% before expenses. |
| 2 | Expenses are equal to the Fund’s annualized expense ratio as indicated above multiplied by the average account value over the period, multiplied by 181/365 to reflect the most recent fiscal half year. |
Invesco V.I. Equally-Weighted S&P 500 Fund
Approval of Investment Advisory andSub-Advisory Contracts
At meetings held on June 10, 2019, the Board of Trustees (the Board or the Trustees) of AIM Variable Insurance Funds (Invesco Variable Insurance Funds) as a whole, and the independent Trustees, who comprise over 75% of the Board, voting separately, approved the continuance of the Invesco V.I. Equally-Weighted S&P 500 Fund’s (the Fund) Master Investment Advisory Agreement with Invesco Advisers, Inc. (Invesco Advisers and the investment advisory agreement) and the Master IntergroupSub-Advisory Contract for Mutual Funds with Invesco Asset Management Deutschland GmbH, Invesco Asset Management Limited, Invesco Asset Management (Japan) Limited, Invesco Hong Kong Limited, Invesco Senior Secured Management, Inc. and Invesco Canada Ltd. and separatesub-advisory contracts with Invesco Capital Management LLC and Invesco Asset Management (India) Private Limited (collectively, the AffiliatedSub-Advisers and thesub-advisory contracts) for another year, effective July 1, 2019. After evaluating the factors discussed below, among others, the Board approved the renewal of the Fund’s investment advisory agreement and thesub-advisory contracts and determined that the compensation payable by the Fund to Invesco Advisers and by Invesco Advisers to the AffiliatedSub-Advisers is fair and reasonable.
The Board’s Evaluation Process
The Board’s Investments Committee has established threeSub-Committees, which meet throughout the year to review the performance of funds advised by Invesco Advisers (the Invesco Funds). As part of a regularly scheduled basis ofin-person Board meetings, theSub-Committees meet with portfolio managers for their assigned Invesco Funds and other members of management to review detailed information about investment performance and portfolio attributes of these funds. The Board took into account evaluations and reports that it received from the Investments Committee andSub-Committees, as well as the information provided to such committees and the Board throughout the year, in considering whether to approve each Invesco Fund’s investment advisory agreement andsub-advisory contracts.
As part of the contract renewal process, the Board reviews and considers information provided in response to detailed requests for information submitted to management by the independent Trustees with assistance from legal counsel to the independent Trustees. The Board receives comparative investment performance and fee data regarding the Invesco Funds prepared by Invesco Advisers and Broadridge Financial Solutions, Inc. (Broadridge), an independent mutual fund data provider. The Board also receives an independent written evaluation from the Senior Officer, an officer of the Invesco Funds who reports directly to the
independent Trustees. The Senior Officer’s evaluation is prepared as part of his responsibility to manage the process by which the Invesco Funds’ proposed management fees are negotiated during the annual contract renewal process to ensure they are negotiated in a manner that is at arms’ length and reasonable. In addition to meetings with Invesco Advisers and fund counsel throughout the year, the independent Trustees also discuss the continuance of the investment advisory agreement andsub-advisory contracts in separate sessions with the Senior Officer and with independent legal counsel.
The discussion below is a summary of the Senior Officer’s independent written evaluation with respect to the Fund’s investment advisory agreement, as well as a discussion of the material factors and related conclusions that formed the basis for the Board’s approval of the Fund’s investment advisory agreement andsub-advisory contracts. The Trustees’ review and conclusions are based on the comprehensive consideration of all information presented to them during the course of the year and in prior years and are not the result of any single determinative factor. Moreover, one Trustee may have weighed a particular piece of information or factor differently than another Trustee. This information is current as of June 10, 2019.
Factors and Conclusions and Summary of Independent Written Fee Evaluation
| A. | Nature, Extent and Quality of Services Provided by Invesco Advisers and the AffiliatedSub-Advisers |
The Board reviewed the nature, extent and quality of the advisory services provided to the Fund by Invesco Advisers under the Fund’s investment advisory agreement, and the credentials and experience of the officers and employees of Invesco Advisers who provide these services, including the Fund’s portfolio manager(s). The Board’s review included consideration of Invesco Advisers’ investment process oversight and structure, credit analysis and investment risk management. The Board also considerednon-advisory services that Invesco Advisers and its affiliates provide to the Invesco Funds such as various back office support functions, third party oversight, internal audit, valuation, portfolio trading and legal and compliance. The Board also received and reviewed information about Invesco Advisers’ role as administrator of the Invesco Funds’ liquidity risk management program. The Board also reviewed and considered the benefits to shareholders of investing in a fund that is part of the Invesco family of funds under the umbrella of Invesco Ltd., Invesco Advisers’ parent company, and noted Invesco Ltd.’s depth and experience in conducting an investment management business, as well as its
commitment of financial and other resources to such business. The Board reviewed and considered information about the resources that Invesco Advisers intends to continue to commit to managing the Invesco family of funds following Invesco Ltd.’s acquisition of OppenheimerFunds, Inc. and its subsidiaries. The Board concluded that the nature, extent and quality of the services provided to the Fund by Invesco Advisers are appropriate and satisfactory.
The Board reviewed the services that may be provided by the AffiliatedSub-Advisers under thesub-advisory contracts and the credentials and experience of the officers and employees of the AffiliatedSub-Advisers who provide these services. The Board noted the AffiliatedSub-Advisers’ expertise with respect to certain asset classes and that the AffiliatedSub-Advisers have offices and personnel that are located in financial centers around the world. As a result, the Board noted that the AffiliatedSub-Advisers can provide research and investment analysis on the markets and economies of various countries in which the Fund may invest, make recommendations regarding securities and assist with security trades. The Board concluded that thesub-advisory contracts may benefit the Fund and its shareholders by permitting Invesco Advisers to use the resources and talents of the AffiliatedSub-Advisers in managing the Fund. The Board concluded that the nature, extent and quality of the services that may be provided by the AffiliatedSub-Advisers are appropriate and satisfactory.
| B. | Fund Investment Performance |
The Board considered Fund investment performance as a relevant factor in considering whether to approve the investment advisory agreement. The Board did not view Fund investment performance as a relevant factor in considering whether to approve thesub-advisory contracts for the Fund, as no AffiliatedSub-Adviser currently manages assets of the Fund.
The Board compared the Fund’s investment performance over multiple time periods ending December 31, 2018 to the performance of funds in the Broadridge performance universe and against the Lipper Variable Underlying FundsMulti-Cap Core Funds Index. The Board noted that performance of Series I shares of the Fund was in the fourth quintile of its performance universe for the one year period, the third quintile for the three year period and the second quintile for the five year period (the first quintile being the best performing funds and the fifth quintile being the worst performing funds). The Board noted that performance of Series I shares of the Fund was reasonably comparable to the performance of the Index for the one year period, and above the performance of the Index for the three and five year periods.
Invesco V.I. Equally-Weighted S&P 500 Fund
The Board noted that the Fund is passively managed and discussed reasons for differences in the Fund’s performance versus its peers. The Board noted that underweight exposure to certain sectors and capitalization sizes driven by the Fund’s equally-weighted investment process detracted from the Fund’s performance. The Trustees also reviewed more recent Fund performance and this review did not change their conclusions.
| C. | Advisory andSub-Advisory Fees and Fund Expenses |
The Board compared the Fund’s contractual management fee rate to the contractual management fee rates of funds in the Fund’s Broadridge expense group. The Board noted that the contractual management fee rate for Series I shares of the Fund was below the median contractual management fee rate of funds in its expense group. The Board noted that the term “contractual management fee” for funds in the expense group may include both advisory and certainnon-portfolio management administrative services fees, but that Broadridge does not provide information on a fund by fund basis as to what is included. The Board also reviewed the methodology used by Broadridge in providing expense group information, which includes using each fund’s contractual management fee schedule (including any applicable breakpoints) as reported in the most recent prospectus or statement of additional information for each fund in the expense group. The Board also considered comparative information regarding the Fund’s total expense ratio and its various components. The Board noted that there were only three funds (including the Fund) in the expense group.
The Board noted that Invesco Advisers has contractually agreed to waive fees and/or limit expenses of the Fund for the term disclosed in the Fund’s registration statement in an amount necessary to limit total annual operating expenses to a specified percentage of average daily net assets for each class of the Fund.
The Board also considered the fees charged by Invesco Advisers and the AffiliatedSub-Advisers to other similarly managed client accounts. The Board noted that Invesco Advisers or the AffiliatedSub-Advisers may charge lower fees to large institutional clients. Invesco Advisers reviewed with the Board differences in the scope of services it provides to the Invesco Funds relative to certain other types of client accounts, including management of cash flows as a result of redemptions and purchases, necessary infrastructure such as officers, office space, technology, legal and distribution, oversight of service providers, costs and business risks associated with launching new funds and sponsoring and maintaining the product line, preparation of annual registration statement updates and financial information and compliance with federal and state laws and regulations.
The Board also considered the services that may be provided by the AffiliatedSub-Advisers
pursuant to thesub-advisory contracts, as well as the fees payable by Invesco Advisers to the AffiliatedSub-Advisers pursuant to thesub-advisory contracts.
| D. | Economies of Scale and Breakpoints |
The Board considered the extent to which there may be economies of scale in the provision of advisory services to the Fund. The Board considered Invesco’s reinvestment in its business, including investments in business infrastructure and cybersecurity. The Board also considered that the Fund may benefit from economies of scale through contractual breakpoints in the Fund’s advisory fee schedule, which generally operate to reduce the Fund’s expense ratio as it grows in size. The Board noted that the Fund shares directly in economies of scale through lower fees charged by third party service providers based on the combined size of the Invesco Funds. The Board noted that the Fund may also benefit from economies of scale through initial fee setting, fee waivers and expense reimbursements.
| E. | Profitability and Financial Resources |
The Board reviewed information from Invesco Advisers concerning the costs of the advisory and other services that Invesco Advisers and its affiliates provide to the Fund and the Invesco Funds and the profitability of Invesco Advisers and its affiliates in providing these services. The Board considered the methodology used for calculating profitability and noted the periodic review of such methodology by an independent consultant. The Board noted that Invesco Advisers continues to operate at a net profit from services Invesco Advisers and its affiliates provide to the Invesco Funds and the Fund. The Board did not deem the level of profits realized by Invesco Advisers and its affiliates from providing services to the Fund to be excessive given the nature, extent and quality of the services provided. The Board received information from Invesco Advisers demonstrating that Invesco Advisers and the AffiliatedSub-Advisers are financially sound and have the resources necessary to perform their obligations under the investment advisory agreement andsub-advisory contracts.
| F. | Collateral Benefits to Invesco Advisers and its Affiliates |
The Board considered various other benefits received by Invesco Advisers and its affiliates from the relationship with the Fund, including the fees received for providing administrative, transfer agency and distribution services to the Fund. The Board considered comparative information regarding fees charged for these services, including information provided by Broadridge and other independent sources. The Board considered the performance of Invesco Advisers and its affiliates in providing these services and the organizational structure employed to provide these services. The Board also considered that these services are provided to the Fund pursuant to written contracts that are reviewed and approved on an annual basis by the Board; and that the services are required for the operation of the Fund.
The Board considered the benefits realized by Invesco Advisers and the AffiliatedSub-Advisers as a result of portfolio brokerage transactions executed through “soft dollar” arrangements. The Board noted that soft dollar arrangements may result in the Fund bearing costs to purchase research that may be used by Invesco Advisers or the AffiliatedSub-Advisers with other clients and may reduce Invesco Advisers’ or the AffiliatedSub-Advisers’ expenses. The Board also considered that it receives periodic reports from Invesco representing that these arrangements are consistent with regulatory requirements. The Board did not deem the soft dollar arrangements to be inappropriate.
The Board considered that the Fund’s uninvested cash and cash collateral from any securities lending arrangements may be invested in money market funds advised by Invesco Advisers pursuant to procedures approved by the Board. The Board considered information regarding the returns of the affiliated money market funds relative to comparable overnight investments, as well as the costs to the Fund of such investments. The Board noted that Invesco Advisers receives advisory fees from these affiliated money market funds attributable to such investments, although Invesco Advisers has contractually agreed to waive through varying periods the advisory fees payable by the Invesco Funds with respect to certain investments in the affiliated money market funds. The waiver is in an amount equal to 100% of the net advisory fee Invesco Advisers receives from the affiliated money market funds with respect to the Fund’s investment in the affiliated money market funds of uninvested cash, but not cash collateral. The Board concluded that the amount of advisory fees received by Invesco Advisers from the Fund’s investment of cash collateral from any securities lending arrangements in the affiliated money market funds is fair and reasonable.
The Board also considered that an affiliated broker may receive commissions for executing certain trades for the Fund. Invesco Advisers and the AffiliatedSub-Advisers may use the affiliated broker to, among other things, control order routing and minimize information leakage, and the Board was advised that such trades are executed in compliance with rules under the federal securities laws and consistent with best execution obligations.
Invesco V.I. Equally-Weighted S&P 500 Fund
| Semiannual Report to Shareholders | June 30, 2019 |
Invesco V.I. Equity and Income Fund
Beginning on January 1, 2021, as permitted by regulations adopted by the Securities and Exchange Commission, the insurance company that offers your variable annuity or variable life insurance contract may no longer send you paper copies of the Fund’s shareholder reports by mail, unless you specifically request paper copies of the reports from the insurance company or your financial intermediary. Instead of delivering paper copies of the report, the insurance company may choose to make the reports available on a website, and will notify you by mail each time a report is posted and provide you with a website link to access the report. Instructions for requesting paper copies will be provided by your insurance company.
If the insurance company offers electronic delivery, you may elect to receive shareholder reports and other communications about the Fund electronically by following the instructions provided by the insurance company or by contacting your financial intermediary. If you already elected to receive shareholder reports electronically, you will not be affected by this change and you need not take any action.
You may elect to receive all future reports in paper free of charge from the insurance company. You can inform the insurance company or your financial intermediary that you wish to continue receiving paper copies of your shareholder reports by following the instructions provided by the insurance company or by contacting your financial intermediary. Your election to receive reports in paper will apply to all portfolio companies available under your contract with the insurance company.
The Fund provides a complete list of its holdings four times in each fiscal year, at the quarter-ends. For the second and fourth quarters, the lists appear in the Fund’s semiannual and annual reports to shareholders. For the first and third quarters, the Fund files the lists with the Securities and Exchange Commission (SEC) on Form N-Q (or any successor Form). The Fund’s Form N-Q (or any successor Form) filings are available on the SEC website, sec.gov. The SEC file numbers for the Fund are 811-07452 and 033-57340. The Fund’s most recent portfolio holdings, as filed on Form N-Q (or any successor Form), have also been made available to insurance companies issuing variable annuity contracts and variable life insurance policies (“variable products”) that invest in the Fund.
A description of the policies and procedures that the Fund uses to determine how to vote proxies relating to portfolio securities is available without charge, upon request, from our Client Services department at 800 959 4246 or at invesco.com/proxyguidelines. The information is also available on the SEC website, sec.gov.
Information regarding how the Fund voted proxies related to its portfolio securities during the most recent 12-month period ended June 30 is available at invesco.com/proxysearch. The information is also available on the SEC website, sec.gov.
Invesco Advisers, Inc. is an investment adviser; it provides investment advisory services to individual and institutional clients and does not sell securities. Invesco Distributors, Inc. is the US distributor for Invesco Ltd.’s retail mutual funds, exchange-traded funds and institutional money market funds. Both are wholly owned, indirect subsidiaries of Invesco Ltd.
This report must be accompanied or preceded by a currently effective Fund prospectus and variable product prospectus, which contain more complete information, including sales charges and expenses. Investors should read each carefully before investing.
NOT FDIC INSURED | MAY LOSE VALUE | NO BANK GUARANTEE
| Invesco Distributors, Inc. | VK-VIEQI-SAR-1 |
Performance summary
Fund vs. Indexes
Cumulative total returns, December 31, 2018 to June 30, 2019, excluding variable product issuer charges. If variable product issuer charges were included, returns would be lower.
| Series I Shares | 13.34% |
| Series II Shares | 13.15 |
| Russell 1000 Value Index▼ (Broad Market Index) | 16.24 |
Bloomberg Barclays U.S. Government/Credit Index■
(Style-Specific Index) | 6.90 |
Lipper VUF Mixed-Asset Target Allocation Growth Funds Index♦
(Peer Group Index) | 13.11 |
| Source(s):▼RIMES Technologies Corp.;■ FactSet Research Systems Inc.;♦ Lipper Inc. |
TheRussell 1000® Value Index is an unmanaged index considered representative of large-cap value stocks. The Russell 1000 Value Index is a trademark/service mark of the Frank Russell Co. Russell® is a trademark of the Frank Russell Co.
TheBloomberg Barclays U.S. Government/Credit Index is a broad-based benchmark that includes investment grade, US dollar-denominated, fixed-rate Treasuries, government-related and corporate securities.
TheLipper VUF Mixed-Asset Target Allocation Growth Funds Index is an unmanaged index considered representative of mixed-asset target allocation growth variable insurance underlying funds tracked by Lipper.
The Fund is not managed to track the performance of any particular index, including the indexes described here, and consequently, the performance of the Fund may deviate significantly from the performance of the indexes.
A direct investment cannot be made in an index. Unless otherwise indicated, index results include reinvested dividends, and they do not reflect sales charges. Performance of the peer group, if applicable, reflects fund expenses; performance of a market index does not.
| Average Annual Total Returns |
| As of 6/30/19 |
| Series I Shares | |
| 10 Years | 10.08 |
| 5 Years | 5.64 |
| 1 Year | 3.71 |
| Series II Shares | |
| Inception (4/30/03) | 7.68% |
| 10 Years | 9.87 |
| 5 Years | 5.38 |
| 1 Year | 3.40 |
Effective June 1, 2010, Class II shares of the predecessor fund, Universal Institutional Funds Equity and Income Portfolio, advised by Morgan Stanley Investment Management Inc. were reorganized into Series II shares of Invesco Van Kampen V.I. Equity and Income Fund (renamed Invesco V.I. Equity and Income Fund on April 29, 2013). Returns shown above, prior to June 1, 2010, for Series II shares are blended returns of the predecessor fund and Invesco V.I. Equity and Income Fund. Share class returns will differ from the predecessor fund because of different expenses.
Series I shares incepted on June 1, 2010. Series I shares performance shown prior to that date is that of the predecessor fund’s Class II shares and includes the 12b-1 fees applicable to the predecessor fund’s Class II shares.
The performance data quoted represent past performance and cannot guarantee comparable future results; current performance may be lower or higher. Please contact your variable
product issuer or financial adviser for the most recent month-end variable product performance. Performance figures reflect Fund expenses, reinvested distributions and changes in net asset value. Investment return and principal value will fluctuate so that you may have a gain or loss when you sell shares.
The net annual Fund operating expense ratio set forth in the most recent Fund prospectus as of the date of this report for Series I and Series II shares was 0.55% and 0.80%, respectively.1 The total annual Fund operating expense ratio set forth in the most recent Fund prospectus as of the date of this report for Series I and Series II shares was 0.56% and 0.81%, respectively. The expense ratios presented above may vary from the expense ratios presented in other sections of this report that are based on expenses incurred during the period covered by this report.
Invesco V.I. Equity and Income Fund, a series portfolio of AIM Variable Insur-
ance Funds (Invesco Variable Insurance Funds), is currently offered through insurance companies issuing variable products. You cannot purchase shares of the Fund directly. Performance figures given represent the Fund and are not intended to reflect actual variable product values. They do not reflect sales charges, expenses and fees assessed in connection with a variable product. Sales charges, expenses and fees, which are determined by the variable product issuers, will vary and will lower the total return.
The most recent month-end performance at the Fund level, excluding variable product charges, is available at 800 451 4246. As mentioned above, for the most recent month-end performance including variable product charges, please contact your variable product issuer or financial adviser.
Fund performance reflects any applicable fee waivers and/or expense reimbursements. Had the adviser not waived fees and/or reimbursed expenses currently or in the past, returns
Invesco V.I. Equity and Income Fund
would have been lower. See current prospectus for more information.
| 1 | Total annual Fund operating expenses after any contractual fee waivers and/or expense reimbursements by the adviser in effect through at least June 30, 2021. See current prospectus for more information. |
Invesco V.I. Equity and Income Fund
Schedule of Investments(a)
June 30, 2019
(Unaudited)
| | Shares | Value |
| Common Stocks & Other Equity Interests–60.09% |
| Aerospace & Defense–1.38% |
| General Dynamics Corp. | 95,327 | $17,332,355 |
| Apparel, Accessories & Luxury Goods–0.86% |
| Capri Holdings Ltd.(b) | 309,539 | 10,734,813 |
| Asset Management & Custody Banks–0.26% |
| State Street Corp. | 58,755 | 3,293,805 |
| Automobile Manufacturers–1.71% |
| General Motors Co. | 555,589 | 21,406,844 |
| Biotechnology–0.55% |
| Celgene Corp.(b) | 74,177 | 6,856,922 |
| Broadcasting–0.53% |
| CBS Corp., Class B | 133,187 | 6,646,031 |
| Building Products–1.17% |
| Johnson Controls International PLC | 354,835 | 14,658,234 |
| Cable & Satellite–2.08% |
| Charter Communications, Inc., Class A(b) | 44,119 | 17,434,946 |
| Comcast Corp., Class A | 204,606 | 8,650,742 |
| | | | 26,085,688 |
| Commodity Chemicals–0.45% |
| Dow, Inc. | 114,081 | 5,625,334 |
| Communications Equipment–1.18% |
| Cisco Systems, Inc. | 270,474 | 14,803,042 |
| Diversified Banks–8.77% |
| Bank of America Corp. | 1,121,830 | 32,533,070 |
| Citigroup, Inc. | 576,167 | 40,348,975 |
| JPMorgan Chase & Co. | 219,224 | 24,509,243 |
| Wells Fargo & Co. | 267,925 | 12,678,211 |
| | | | 110,069,499 |
| Electric Utilities–0.73% |
| Duke Energy Corp. | 57,128 | 5,040,975 |
| FirstEnergy Corp. | 97,565 | 4,176,757 |
| | | | 9,217,732 |
| Fertilizers & Agricultural Chemicals–1.01% |
| Corteva, Inc.(b) | 238,497 | 7,052,357 |
| Nutrien Ltd. (Canada) | 106,057 | 5,669,807 |
| | | | 12,722,164 |
| Food Distributors–0.88% |
| US Foods Holding Corp.(b) | 307,820 | 11,007,643 |
| | Shares | Value |
| Health Care Distributors–0.92% |
| McKesson Corp. | 86,312 | $11,599,470 |
| Health Care Equipment–1.55% |
| Medtronic PLC | 84,113 | 8,191,765 |
| Zimmer Biomet Holdings, Inc. | 96,144 | 11,319,995 |
| | | | 19,511,760 |
| Health Care Services–0.90% |
| CVS Health Corp. | 207,163 | 11,288,312 |
| Health Care Supplies–0.41% |
| Alcon, Inc. (Switzerland)(b) | 84,016 | 5,196,243 |
| Home Improvement Retail–0.57% |
| Kingfisher PLC (United Kingdom) | 2,600,730 | 7,104,838 |
| Hotels, Resorts & Cruise Lines–1.21% |
| Carnival Corp. | 327,368 | 15,238,980 |
| Industrial Machinery–0.88% |
| Ingersoll-Rand PLC | 86,988 | 11,018,770 |
| Insurance Brokers–1.15% |
| Willis Towers Watson PLC | 75,177 | 14,399,403 |
| Integrated Oil & Gas–3.70% |
| BP PLC (United Kingdom) | 1,941,231 | 13,566,139 |
| Chevron Corp. | 91,536 | 11,390,740 |
| Occidental Petroleum Corp. | 93,363 | 4,694,291 |
| Royal Dutch Shell PLC, Class A (United Kingdom) | 514,510 | 16,847,501 |
| | | | 46,498,671 |
| Internet & Direct Marketing Retail–0.86% |
| eBay, Inc. | 273,704 | 10,811,308 |
| Investment Banking & Brokerage–2.55% |
| Goldman Sachs Group, Inc. (The) | 62,388 | 12,764,585 |
| Morgan Stanley | 438,939 | 19,229,917 |
| | | | 31,994,502 |
| IT Consulting & Other Services–0.68% |
| Cognizant Technology Solutions Corp., Class A | 133,759 | 8,478,983 |
| Managed Health Care–0.64% |
| Anthem, Inc. | 28,590 | 8,068,384 |
| Multi-line Insurance–2.02% |
| American International Group, Inc. | 476,352 | 25,380,035 |
| Oil & Gas Equipment & Services–1.35% |
| Schlumberger Ltd. | 141,916 | 5,639,742 |
See accompanying Notes to Financial Statements which are an integral part of the financial statements.
Invesco V.I. Equity and Income Fund
| | Shares | Value |
| Oil & Gas Equipment & Services–(continued) |
| TechnipFMC PLC (United Kingdom) | 437,347 | $11,344,781 |
| | | | 16,984,523 |
| Oil & Gas Exploration & Production–2.53% |
| Canadian Natural Resources Ltd. (Canada) | 264,501 | 7,131,862 |
| Devon Energy Corp. | 466,432 | 13,302,641 |
| Marathon Oil Corp. | 797,987 | 11,339,395 |
| | | | 31,773,898 |
| Other Diversified Financial Services–1.17% |
| AXA Equitable Holdings, Inc. | 267,642 | 5,593,718 |
| Voya Financial, Inc. | 164,545 | 9,099,338 |
| | | | 14,693,056 |
| Packaged Foods & Meats–1.50% |
| Mondelez International, Inc., Class A | 348,748 | 18,797,517 |
| Pharmaceuticals–4.45% |
| Bristol-Myers Squibb Co. | 204,707 | 9,283,462 |
| Johnson & Johnson | 180,556 | 25,147,840 |
| Novartis AG (Switzerland) | 142,422 | 13,026,914 |
| Sanofi (France) | 97,231 | 8,411,347 |
| | | | 55,869,563 |
| Railroads–0.87% |
| CSX Corp. | 140,470 | 10,868,164 |
| Regional Banks–2.05% |
| Citizens Financial Group, Inc. | 462,596 | 16,357,395 |
| First Horizon National Corp. | 13,802 | 206,064 |
| PNC Financial Services Group, Inc. (The) | 67,222 | 9,228,236 |
| | | | 25,791,695 |
| Semiconductors–2.04% |
| Intel Corp. | 323,798 | 15,500,210 |
| QUALCOMM, Inc. | 132,955 | 10,113,887 |
| | | | 25,614,097 |
| Specialty Chemicals–0.56% |
| DuPont de Nemours, Inc. | 94,175 | 7,069,717 |
| Systems Software–1.57% |
| Oracle Corp. | 344,924 | 19,650,320 |
| Technology Hardware, Storage & Peripherals–0.82% |
| Apple, Inc. | 51,839 | 10,259,975 |
| Tobacco–1.58% |
| Philip Morris International, Inc. | 252,120 | 19,798,984 |
| Total Common Stocks & Other Equity Interests (Cost $601,245,710) | 754,221,274 |
| | Principal
Amount | Value |
| U.S. Dollar Denominated Bonds & Notes–20.55% |
| Aerospace & Defense–0.11% |
| BAE Systems Holdings, Inc. (United Kingdom), 2.85%, 12/15/2020(c) | | $262,000 | $263,053 |
| General Dynamics Corp., 2.88%, 05/11/2020 | | 397,000 | 399,057 |
| Precision Castparts Corp., 2.50%, 01/15/2023 | | 333,000 | 335,290 |
| United Technologies Corp., 4.45%, 11/16/2038 | | 299,000 | 335,784 |
| | | | 1,333,184 |
| Agricultural & Farm Machinery–0.09% |
| Deere & Co., 2.60%, 06/08/2022 | | 1,161,000 | 1,175,221 |
| Agricultural Products–0.02% |
| Ingredion, Inc., 6.63%, 04/15/2037 | | 232,000 | 291,208 |
| Air Freight & Logistics–0.13% |
| FedEx Corp., | | |
| 4.90%, 01/15/2034 | | 402,000 | 468,107 |
| 5.10%, 01/15/2044 | | 828,000 | 911,343 |
| United Parcel Service, Inc., 3.40%, 11/15/2046 | | 236,000 | 225,582 |
| | | | 1,605,032 |
| Airlines–0.15% |
| American Airlines Pass Through Trust, Series 2014-1, Class A, 3.70%, 04/01/2028 | | 308,287 | 319,185 |
| Continental Airlines Pass Through Trust, | | |
| Series 2010-1, Class A, 4.75%, 01/12/2021 | | 126,696 | 130,139 |
| Series 2012-1, Class A, 4.15%, 04/11/2024 | | 327,680 | 343,753 |
| United Airlines Pass Through Trust, | | |
| Series 2014-2, Class A, 3.75%, 09/03/2026 | | 398,317 | 414,568 |
| Series 2018-1, Class AA, 3.50%, 03/01/2030 | | 486,383 | 497,644 |
| Virgin Australia Pass Through Trust (Australia), Series 2013-1, Class A, 5.00%, 10/23/2023(c) | | 137,937 | 142,123 |
| | | | 1,847,412 |
| Alternative Carriers–0.20% |
| GCI Liberty, Inc., Conv., 1.75%, 10/05/2023(c)(d) | | 2,143,000 | 2,515,739 |
| Application Software–0.64% |
| Nuance Communications, Inc., | | |
Conv.,
1.00%, 12/15/2022(d) | | 2,458,000 | 2,319,304 |
| 1.25%, 04/01/2025 | | 1,558,000 | 1,534,481 |
| RealPage, Inc., Conv., 1.50%, 11/15/2022 | | 628,000 | 943,134 |
See accompanying Notes to Financial Statements which are an integral part of the financial statements.
Invesco V.I. Equity and Income Fund
| | Principal
Amount | Value |
| Application Software–(continued) |
| Workday, Inc., Conv., 0.25%, 10/01/2022 | | $2,173,000 | $3,265,043 |
| | | | 8,061,962 |
| Asset Management & Custody Banks–0.29% |
| Apollo Management Holdings L.P., 4.00%, 05/30/2024(c) | | 2,715,000 | 2,821,464 |
| Brookfield Asset Management, Inc. (Canada), 4.00%, 01/15/2025 | | 420,000 | 437,769 |
| Carlyle Holdings Finance LLC, 3.88%, 02/01/2023(c) | | 98,000 | 101,112 |
| KKR Group Finance Co. III LLC, 5.13%, 06/01/2044(c) | | 287,000 | 319,220 |
| | | | 3,679,565 |
| Automobile Manufacturers–0.18% |
| Ford Motor Credit Co. LLC, | | |
| 3.10%, 05/04/2023 | | 267,000 | 263,185 |
| 3.81%, 01/09/2024 | | 445,000 | 447,329 |
| 4.13%, 08/04/2025 | | 687,000 | 688,475 |
| General Motors Co., 6.60%, 04/01/2036 | | 361,000 | 400,223 |
| General Motors Financial Co., Inc., 5.25%, 03/01/2026 | | 459,000 | 492,746 |
| | | | 2,291,958 |
| Automotive Retail–0.05% |
| Advance Auto Parts, Inc., 4.50%, 12/01/2023 | | 602,000 | 646,089 |
| Biotechnology–0.83% |
| AbbVie, Inc., 4.50%, 05/14/2035 | | 656,000 | 675,054 |
| BioMarin Pharmaceutical, Inc., Conv., 1.50%, 10/15/2020 | | 2,172,000 | 2,440,785 |
| Celgene Corp., | | |
| 4.00%, 08/15/2023 | | 485,000 | 512,653 |
| 4.63%, 05/15/2044 | | 1,390,000 | 1,585,304 |
| Gilead Sciences, Inc., | | |
| 2.55%, 09/01/2020 | | 1,643,000 | 1,647,456 |
| 4.40%, 12/01/2021 | | 448,000 | 468,461 |
| Medicines Co. (The), Conv., 2.75%, 07/15/2023 | | 853,000 | 857,417 |
| Neurocrine Biosciences, Inc., Conv., 2.25%, 05/15/2024 | | 1,685,000 | 2,219,140 |
| | | | 10,406,270 |
| Brewers–0.30% |
| Anheuser-Busch Cos. LLC/Anheuser-Busch InBev Worldwide, Inc. (Belgium), | | |
| 4.70%, 02/01/2036 | | 914,000 | 1,006,655 |
| 4.90%, 02/01/2046 | | 1,021,000 | 1,136,541 |
| Heineken N.V. (Netherlands), 3.50%, 01/29/2028(c) | | 910,000 | 945,890 |
| | Principal
Amount | Value |
| Brewers–(continued) |
| Molson Coors Brewing Co., | | |
| 1.45%, 07/15/2019 | | $311,000 | $310,881 |
| 4.20%, 07/15/2046 | | 361,000 | 348,976 |
| | | | 3,748,943 |
| Cable & Satellite–1.34% |
| Charter Communications Operating, LLC/Charter Communications Operating Capital Corp., 4.46%, 07/23/2022 | | 969,000 | 1,018,256 |
| Comcast Corp., | | |
| 4.15%, 10/15/2028 | | 905,000 | 998,334 |
| 6.45%, 03/15/2037 | | 278,000 | 376,918 |
| 3.90%, 03/01/2038 | | 746,000 | 787,254 |
| 4.60%, 10/15/2038 | | 364,000 | 417,117 |
| DISH Network Corp., Conv., 3.38%, 08/15/2026 | | 4,505,000 | 4,390,952 |
| Liberty Latin America Ltd. (Chile), Conv., 2.00%, 07/15/2024(c) | | 830,000 | 839,789 |
| Liberty Media Corp., | | |
Conv.,
2.25%, 10/05/2021(d) | | 1,399,000 | 754,666 |
| 1.38%, 10/15/2023 | | 5,513,000 | 6,201,824 |
| Liberty Formula One, Conv., 1.00%, 01/30/2023 | | 520,000 | 613,476 |
| NBCUniversal Media LLC, | | |
| 5.15%, 04/30/2020 | | 161,000 | 164,647 |
| 5.95%, 04/01/2041 | | 197,000 | 258,863 |
| | | | 16,822,096 |
| Commodity Chemicals–0.07% |
| Basell Finance Co. B.V. (Netherlands), 8.10%, 03/15/2027(c) | | 678,000 | 860,923 |
| Communications Equipment–0.37% |
| Finisar Corp., Conv., 0.50%, 12/15/2021(d) | | 1,013,000 | 990,132 |
| Viavi Solutions, Inc., | | |
Conv.,
1.75%, 06/01/2023 | | 1,295,000 | 1,503,243 |
| 1.00%, 03/01/2024 | | 1,806,000 | 2,126,565 |
| | | | 4,619,940 |
| Consumer Finance–0.15% |
| American Express Co., 3.63%, 12/05/2024 | | 306,000 | 321,354 |
| Capital One Financial Corp., 3.20%, 01/30/2023 | | 943,000 | 967,113 |
| Synchrony Financial, 3.95%, 12/01/2027 | | 546,000 | 545,624 |
| | | | 1,834,091 |
| Data Processing & Outsourced Services–0.17% |
| Euronet Worldwide, Inc., Conv., 0.75%, 03/15/2025(c)(d) | | 554,000 | 673,758 |
| Fiserv, Inc., 3.80%, 10/01/2023 | | 1,397,000 | 1,471,703 |
| | | | 2,145,461 |
See accompanying Notes to Financial Statements which are an integral part of the financial statements.
Invesco V.I. Equity and Income Fund
| | Principal
Amount | Value |
| Diversified Banks–2.08% |
| ANZ New Zealand (Int’l) Ltd. (New Zealand), 2.88%, 01/25/2022(c) | | $350,000 | $354,076 |
| Australia & New Zealand Banking Group Ltd. (Australia), | | |
| 2.70%, 11/16/2020 | | 2,690,000 | 2,705,964 |
| 2.30%, 06/01/2021 | | 713,000 | 713,226 |
| Bank of America Corp., 3.25%, 10/21/2027 | | 515,000 | 527,872 |
| Bank of Montreal (Canada), 2.10%, 12/12/2019 | | 2,346,000 | 2,343,504 |
| BBVA Bancomer S.A. (Mexico), 4.38%, 04/10/2024(c) | | 700,000 | 731,850 |
| Citigroup, Inc., | | |
| 3.67%, 07/24/2028(e) | | 496,000 | 517,814 |
| 6.68%, 09/13/2043 | | 741,000 | 1,028,425 |
| 5.30%, 05/06/2044 | | 228,000 | 271,379 |
| 4.75%, 05/18/2046 | | 341,000 | 386,957 |
| Commonwealth Bank of Australia (Australia), 2.25%, 03/10/2020(c) | | 987,000 | 986,808 |
| Discover Bank, 3.35%, 02/06/2023 | | 1,500,000 | 1,535,570 |
| JPMorgan Chase & Co., | | |
| 4.50%, 01/24/2022 | | 74,000 | 77,978 |
| 3.20%, 06/15/2026 | | 379,000 | 390,207 |
| 3.51%, 01/23/2029(e) | | 1,043,000 | 1,086,604 |
| 4.26%, 02/22/2048(e) | | 479,000 | 529,237 |
| 3.90%, 01/23/2049(e) | | 1,043,000 | 1,094,871 |
| Series V, 5.64%(f) | | 582,000 | 580,865 |
| Mizuho Bank, Ltd. (Japan), 2.65%, 09/25/2019(c) | | 675,000 | 675,421 |
| Mizuho Financial Group Cayman 3 Ltd. (Japan), 4.60%, 03/27/2024(c) | | 200,000 | 212,695 |
| National Australia Bank Ltd. (Australia), 1.88%, 07/12/2021 | | 945,000 | 936,998 |
| SMBC Aviation Capital Finance DAC (Ireland), 2.65%, 07/15/2021(c) | | 315,000 | 314,905 |
| Societe Generale S.A. (France), | | |
| 2.63%, 09/16/2020(c) | | 890,000 | 892,832 |
| 5.00%, 01/17/2024(c) | | 735,000 | 780,205 |
| Standard Chartered PLC (United Kingdom), 3.05%, 01/15/2021(c) | | 680,000 | 685,823 |
| Sumitomo Mitsui Banking Corp. (Japan), 2.65%, 07/23/2020 | | 715,000 | 717,721 |
| Toronto-Dominion Bank (The) (Canada), 2.65%, 06/12/2024 | | 560,000 | 565,138 |
| U.S. Bancorp, Series W, 3.10%, 04/27/2026 | | 2,087,000 | 2,133,080 |
| Wells Fargo & Co., | �� | |
| 3.55%, 09/29/2025 | | 596,000 | 622,364 |
| 4.10%, 06/03/2026 | | 410,000 | 434,725 |
| 4.65%, 11/04/2044 | | 1,092,000 | 1,216,321 |
| | | | 26,051,435 |
| | Principal
Amount | Value |
| Diversified Capital Markets–0.65% |
| Credit Suisse AG (Switzerland), 6.50%, 08/08/2023(c) | | $686,000 | $756,744 |
| Credit Suisse Group AG (Switzerland), Conv., 0.50%, 06/24/2024(c) | | 7,880,000 | 7,420,596 |
| | | | 8,177,340 |
| Diversified Chemicals–0.02% |
| Eastman Chemical Co., 2.70%, 01/15/2020 | | 226,000 | 225,900 |
| Diversified Metals & Mining–0.02% |
| Rio Tinto Finance USA Ltd. (Australia), 7.13%, 07/15/2028 | | 182,000 | 243,368 |
| Drug Retail–0.14% |
| CVS Pass Through Trust, 6.04%, 12/10/2028 | | 656,762 | 735,446 |
| Walgreens Boots Alliance, Inc., | | |
| 3.30%, 11/18/2021 | | 548,000 | 559,057 |
| 4.50%, 11/18/2034 | | 404,000 | 415,893 |
| | | | 1,710,396 |
| Electric Utilities–0.36% |
| Electricite de France S.A. (France), | | |
| 5.63%(c)(f) | | 745,000 | 766,020 |
| 4.60%, 01/27/2020(c) | | 138,000 | 139,716 |
| 4.88%, 01/22/2044(c) | | 846,000 | 936,574 |
| Georgia Power Co., 2.00%, 03/30/2020 | | 1,897,000 | 1,889,942 |
| NextEra Energy Capital Holdings, Inc., 3.55%, 05/01/2027 | | 519,000 | 542,054 |
| Ohio Power Co., Series M, 5.38%, 10/01/2021 | | 182,000 | 194,373 |
| PPL Electric Utilities Corp., 6.25%, 05/15/2039 | | 46,000 | 63,016 |
| | | | 4,531,695 |
| Environmental & Facilities Services–0.04% |
| Waste Management, Inc., 3.90%, 03/01/2035 | | 427,000 | 456,718 |
| Food Retail–0.01% |
| Alimentation Couche-Tard, Inc. (Canada), 4.50%, 07/26/2047(c) | | 110,000 | 110,800 |
| General Merchandise Stores–0.03% |
| Dollar General Corp., 3.25%, 04/15/2023 | | 333,000 | 342,158 |
| Health Care Equipment–1.22% |
| Becton, Dickinson and Co., | | |
| 2.68%, 12/15/2019 | | 250,000 | 250,104 |
| 4.88%, 05/15/2044 | | 342,000 | 368,058 |
| DexCom, Inc., | | |
Conv.,
0.75%, 05/15/2022 | | 2,356,000 | 3,765,464 |
| 0.75%, 12/01/2023(c) | | 2,639,000 | 3,101,886 |
See accompanying Notes to Financial Statements which are an integral part of the financial statements.
Invesco V.I. Equity and Income Fund
| | Principal
Amount | Value |
| Health Care Equipment–(continued) |
| Insulet Corp., Conv., 1.38%, 11/15/2024 | | $433,000 | $616,768 |
| Medtronic, Inc., | | |
| 3.15%, 03/15/2022 | | 980,000 | 1,008,441 |
| 4.38%, 03/15/2035 | | 326,000 | 375,652 |
| NuVasive, Inc., Conv., 2.25%, 03/15/2021 | | 1,710,000 | 1,946,194 |
| Wright Medical Group N.V., Conv., 2.25%, 11/15/2021 | | 897,000 | 1,330,924 |
| Wright Medical Group, Inc., Conv., 1.63%, 06/15/2023 | | 2,296,000 | 2,529,905 |
| | | | 15,293,396 |
| Health Care REITs–0.31% |
| HCP, Inc., | | |
| 2.63%, 02/01/2020 | | 2,679,000 | 2,680,724 |
| 4.20%, 03/01/2024 | | 438,000 | 463,646 |
| 3.88%, 08/15/2024 | | 461,000 | 483,396 |
| Ventas Realty L.P., 5.70%, 09/30/2043 | | 196,000 | 235,107 |
| | | | 3,862,873 |
| Health Care Services–0.22% |
| Cigna Corp., 4.80%, 08/15/2038(c) | | 298,000 | 321,466 |
| CVS Health Corp., | | |
| 3.38%, 08/12/2024 | | 341,000 | 349,360 |
| 4.10%, 03/25/2025 | | 1,237,000 | 1,304,830 |
| Laboratory Corp. of America Holdings, | | |
| 3.20%, 02/01/2022 | | 548,000 | 557,201 |
| 4.70%, 02/01/2045 | | 241,000 | 249,514 |
| | | | 2,782,371 |
| Home Improvement Retail–0.09% |
| Home Depot, Inc. (The), 2.00%, 04/01/2021 | | 575,000 | 574,758 |
| Lowe’s Cos., Inc., 4.55%, 04/05/2049 | | 508,000 | 548,289 |
| | | | 1,123,047 |
| Homebuilding–0.07% |
| MDC Holdings, Inc., 6.00%, 01/15/2043 | | 956,000 | 898,640 |
| Hotel & Resort REITs–0.04% |
| Hospitality Properties Trust, | | |
| 5.00%, 08/15/2022 | | 182,000 | 190,867 |
| 4.50%, 06/15/2023 | | 246,000 | 254,821 |
| | | | 445,688 |
| Housewares & Specialties–0.04% |
| Tupperware Brands Corp., 4.75%, 06/01/2021 | | 433,000 | 444,730 |
| Insurance Brokers–0.05% |
| Marsh & McLennan Cos., Inc., 4.75%, 03/15/2039 | | 333,000 | 382,292 |
| | Principal
Amount | Value |
| Insurance Brokers–(continued) |
| Willis North America, Inc., 3.60%, 05/15/2024 | | $228,000 | $235,779 |
| | | | 618,071 |
| Integrated Oil & Gas–0.12% |
| Husky Energy, Inc. (Canada), 3.95%, 04/15/2022 | | 274,000 | 283,642 |
| Occidental Petroleum Corp., 3.40%, 04/15/2026 | | 333,000 | 339,442 |
| Petroleos Mexicanos (Mexico), 4.88%, 01/24/2022 | | 520,000 | 519,480 |
| Suncor Energy, Inc. (Canada), 3.60%, 12/01/2024 | | 304,000 | 317,275 |
| | | | 1,459,839 |
| Integrated Telecommunication Services–0.56% |
| AT&T, Inc., | | |
| 3.00%, 06/30/2022 | | 474,000 | 482,284 |
| 3.40%, 05/15/2025 | | 263,000 | 270,439 |
| 4.30%, 02/15/2030 | | 318,000 | 339,876 |
| 4.50%, 05/15/2035 | | 421,000 | 441,507 |
| 5.35%, 09/01/2040 | | 92,000 | 103,932 |
| 5.15%, 03/15/2042 | | 82,000 | 89,708 |
| 4.80%, 06/15/2044 | | 851,000 | 899,224 |
| 5.15%, 11/15/2046 | | 128,000 | 141,598 |
| Orange S.A. (France), 1.63%, 11/03/2019 | | 1,323,000 | 1,318,936 |
| Telefonica Emisiones S.A. (Spain), | | |
| 7.05%, 06/20/2036 | | 328,000 | 430,429 |
| 4.67%, 03/06/2038 | | 750,000 | 780,070 |
| 5.21%, 03/08/2047 | | 700,000 | 772,071 |
| Verizon Communications, Inc., | | |
| 4.40%, 11/01/2034 | | 297,000 | 329,518 |
| 4.81%, 03/15/2039 | | 459,000 | 529,049 |
| 4.13%, 08/15/2046 | | 77,000 | 80,411 |
| | | | 7,009,052 |
| Interactive Media & Services–0.14% |
| YY, Inc. (China), 1.38%, 06/15/2024(c)(d) | | 1,738,000 | 1,768,429 |
| Internet & Direct Marketing Retail–0.51% |
| Amazon.com, Inc., 2.60%, 12/05/2019 | | 1,510,000 | 1,511,920 |
| Ctrip.com International, Ltd. (China), Conv., 1.25%, 09/15/2019(d) | | 2,721,000 | 2,709,888 |
| Liberty Expedia Holdings, Inc., Conv., 1.00%, 07/05/2022(c)(d) | | 1,432,000 | 1,433,118 |
| QVC, Inc., 5.45%, 08/15/2034 | | 802,000 | 790,515 |
| | | | 6,445,441 |
| Internet Services & Infrastructure–0.26% |
| IAC Financeco 3, Inc., Conv., 2.00%, 01/15/2030(c) | | 3,211,000 | 3,312,025 |
See accompanying Notes to Financial Statements which are an integral part of the financial statements.
Invesco V.I. Equity and Income Fund
| | Principal
Amount | Value |
| Investment Banking & Brokerage–0.58% |
| Goldman Sachs Group, Inc. (The), | | |
| 5.25%, 07/27/2021 | | $364,000 | $384,558 |
| 4.25%, 10/21/2025 | | 502,000 | 532,772 |
| GS Finance Corp., Series 0001, Conv., 0.25%, 07/08/2024 | | 5,920,000 | 5,636,728 |
| Morgan Stanley, 4.00%, 07/23/2025 | | 619,000 | 663,166 |
| | | | 7,217,224 |
| IT Consulting & Other Services–0.04% |
| DXC Technology Co., 4.45%, 09/18/2022 | | 446,000 | 470,567 |
| Life & Health Insurance–0.36% |
| Athene Global Funding, | | |
| 4.00%, 01/25/2022(c) | | 1,110,000 | 1,148,424 |
| 2.75%, 06/25/2024(c) | | 260,000 | 259,371 |
| Guardian Life Global Funding, 2.90%, 05/06/2024(c) | | 669,000 | 686,691 |
| Jackson National Life Global Funding, | | |
| 2.10%, 10/25/2021(c) | | 479,000 | 475,667 |
| 3.25%, 01/30/2024(c) | | 438,000 | 451,246 |
| Nationwide Financial Services, Inc., 5.30%, 11/18/2044(c) | | 405,000 | 462,141 |
| Prudential Financial, Inc., | | |
| 3.91%, 12/07/2047 | | 141,000 | 147,347 |
| 3.94%, 12/07/2049 | | 451,000 | 473,562 |
| Reliance Standard Life Global Funding II, 3.05%, 01/20/2021(c) | | 423,000 | 426,610 |
| | | | 4,531,059 |
| Movies & Entertainment–0.18% |
| Live Nation Entertainment, Inc., 2.50%, 03/15/2023 | | 1,953,000 | 2,316,568 |
| Multi-line Insurance–0.17% |
| American Financial Group, Inc., 4.50%, 06/15/2047 | | 474,000 | 481,217 |
| American International Group, Inc., | | |
| 2.30%, 07/16/2019 | | 351,000 | 350,973 |
| 4.38%, 01/15/2055 | | 656,000 | 660,553 |
| Metropolitan Life Global Funding I, 2.05%, 06/12/2020(c) | | 590,000 | 589,396 |
| | | | 2,082,139 |
| Multi-Utilities–0.09% |
| NiSource, Inc., 4.38%, 05/15/2047 | | 562,000 | 601,265 |
| Sempra Energy, 3.80%, 02/01/2038 | | 551,000 | 534,968 |
| | | | 1,136,233 |
| Office REITs–0.05% |
| Government Properties Income Trust, 4.00%, 07/15/2022 | | 664,000 | 671,290 |
| | Principal
Amount | Value |
| Oil & Gas Equipment & Services–0.19% |
| Helix Energy Solutions Group, Inc., Conv., 4.25%, 05/01/2022 | | $1,105,000 | $1,114,453 |
| Oil States International, Inc., Conv., 1.50%, 02/15/2023 | | 1,451,000 | 1,297,786 |
| | | | 2,412,239 |
| Oil & Gas Exploration & Production–0.14% |
| Chesapeake Energy Corp., Conv., 5.50%, 09/15/2026 | | 948,000 | 759,043 |
| ConocoPhillips Co., 4.15%, 11/15/2034 | | 217,000 | 233,645 |
| Noble Energy, Inc., 5.25%, 11/15/2043 | | 756,000 | 814,993 |
| | | | 1,807,681 |
| Oil & Gas Storage & Transportation–0.88% |
| Energy Transfer Operating L.P., | | |
| 7.50%, 10/15/2020 | | 2,392,000 | 2,537,715 |
| 4.20%, 09/15/2023 | | 1,722,000 | 1,805,804 |
| 4.90%, 03/15/2035 | | 325,000 | 327,449 |
| Enterprise Products Operating LLC, | ��� | |
| 2.55%, 10/15/2019 | | 337,000 | 336,916 |
| 5.25%, 01/31/2020 | | 141,000 | 143,201 |
| 6.45%, 09/01/2040 | | 23,000 | 29,554 |
| 4.25%, 02/15/2048 | | 686,000 | 710,825 |
| Kinder Morgan, Inc., 5.30%, 12/01/2034 | | 384,000 | 434,609 |
| MPLX L.P., | | |
| 4.50%, 07/15/2023 | | 1,656,000 | 1,757,028 |
| 4.50%, 04/15/2038 | | 799,000 | 807,318 |
| Plains All American Pipeline L.P./PAA Finance Corp., 3.65%, 06/01/2022 | | 323,000 | 330,847 |
| Spectra Energy Partners, L.P., 4.50%, 03/15/2045 | | 488,000 | 515,801 |
| Sunoco Logistics Partners Operations L.P., | | |
| 5.50%, 02/15/2020 | | 487,000 | 495,174 |
| 5.30%, 04/01/2044 | | 587,000 | 607,474 |
| Texas Eastern Transmission L.P., 7.00%, 07/15/2032 | | 169,000 | 221,216 |
| | | | 11,060,931 |
| Other Diversified Financial Services–0.14% |
| ERAC USA Finance LLC, 2.35%, 10/15/2019(c) | | 851,000 | 850,019 |
| MassMutual Global Funding II, 2.00%, 04/15/2021(c) | | 945,000 | 941,866 |
| | | | 1,791,885 |
| Packaged Foods & Meats–0.31% |
| General Mills, Inc., 2.20%, 10/21/2019 | | 774,000 | 773,036 |
| J. M. Smucker Co. (The), 2.50%, 03/15/2020 | | 3,038,000 | 3,037,855 |
See accompanying Notes to Financial Statements which are an integral part of the financial statements.
Invesco V.I. Equity and Income Fund
| | Principal
Amount | Value |
| Packaged Foods & Meats–(continued) |
| Mead Johnson Nutrition Co. (United Kingdom), 4.13%, 11/15/2025 | | $60,000 | $64,936 |
| | | | 3,875,827 |
| Paper Packaging–0.11% |
| International Paper Co., 6.00%, 11/15/2041 | | 223,000 | 261,594 |
| Packaging Corp. of America, 4.50%, 11/01/2023 | | 1,037,000 | 1,110,620 |
| | | | 1,372,214 |
| Pharmaceuticals–0.74% |
| Allergan Funding SCS, 4.85%, 06/15/2044 | | 864,000 | 897,701 |
| Bayer US Finance II LLC (Germany), | | |
| 2.13%, 07/15/2019(c) | | 279,000 | 278,938 |
| 4.38%, 12/15/2028(c) | | 985,000 | 1,038,686 |
| Bayer US Finance LLC (Germany), | | |
| 2.38%, 10/08/2019(c) | | 2,070,000 | 2,067,406 |
| 3.00%, 10/08/2021(c) | | 590,000 | 594,387 |
| Bristol-Myers Squibb Co., 4.13%, 06/15/2039(c) | | 603,000 | 654,372 |
| GlaxoSmithKline Capital, Inc. (United Kingdom), 6.38%, 05/15/2038 | | 64,000 | 89,434 |
| Jazz Investments I Ltd., Conv., 1.88%, 08/15/2021 | | 1,455,000 | 1,486,179 |
| Mylan N.V., 3.15%, 06/15/2021 | | 393,000 | 393,106 |
| Pacira BioSciences Inc., Conv., 2.38%, 04/01/2022 | | 721,000 | 740,006 |
| Supernus Pharmaceuticals, Inc., 0.63%, 04/01/2023 | | 696,000 | 682,672 |
| Zoetis, Inc., 4.70%, 02/01/2043 | | 333,000 | 376,502 |
| | | | 9,299,389 |
| Property & Casualty Insurance–0.35% |
| Allstate Corp. (The), 3.28%, 12/15/2026 | | 292,000 | 305,286 |
| Liberty Mutual Group, Inc., 4.85%, 08/01/2044(c) | | 887,000 | 974,103 |
| Markel Corp., | | |
| 5.00%, 03/30/2043 | | 351,000 | 370,015 |
| 5.00%, 05/20/2049 | | 482,000 | 525,394 |
| PartnerRe Finance B LLC, 3.70%, 07/02/2029 | | 1,015,000 | 1,033,813 |
| Travelers Cos., Inc. (The), 4.60%, 08/01/2043 | | 605,000 | 717,098 |
| WR Berkley Corp., 4.63%, 03/15/2022 | | 382,000 | 404,070 |
| | | | 4,329,779 |
| Railroads–0.21% |
| Burlington Northern Santa Fe, LLC, 5.15%, 09/01/2043 | | 901,000 | 1,119,960 |
| CSX Corp., 5.50%, 04/15/2041 | | 346,000 | 418,551 |
| | Principal
Amount | Value |
| Railroads–(continued) |
| Union Pacific Corp., | | |
| 3.65%, 02/15/2024 | | $92,000 | $96,618 |
| 4.85%, 06/15/2044 | | 519,000 | 596,899 |
| 4.15%, 01/15/2045 | | 401,000 | 423,190 |
| | | | 2,655,218 |
| Regional Banks–0.09% |
| Citizens Financial Group, Inc., 2.38%, 07/28/2021 | | 415,000 | 414,707 |
| The PNC Financial Services Group, Inc., 3.45%, 04/23/2029 | | 669,000 | 704,588 |
| | | | 1,119,295 |
| Reinsurance–0.03% |
| Reinsurance Group of America, Inc., 4.70%, 09/15/2023 | | 352,000 | 381,068 |
| Renewable Electricity–0.04% |
| Oglethorpe Power Corp., 4.55%, 06/01/2044 | | 529,000 | 549,744 |
| Restaurants–0.06% |
| Starbucks Corp., 3.55%, 08/15/2029 | | 685,000 | 717,095 |
| Retail REITs–0.02% |
| Regency Centers, L.P., 4.65%, 03/15/2049 | | 256,000 | 286,147 |
| Semiconductor Equipment–0.16% |
| Applied Materials, Inc., 2.63%, 10/01/2020 | | 1,979,000 | 1,989,903 |
| Semiconductors–0.81% |
| Broadcom Corp./Broadcom Cayman Finance Ltd., 3.63%, 01/15/2024 | | 610,000 | 616,610 |
| Cree, Inc., Conv., 0.88%, 09/01/2023(c) | | 3,209,000 | 3,722,225 |
| Microchip Technology, Inc., Conv., 1.63%, 02/15/2027 | | 1,983,000 | 2,341,130 |
| NXP B.V./NXP Funding LLC (Netherlands), 5.35%, 03/01/2026(c) | | 656,000 | 727,281 |
| ON Semiconductor Corp., Conv., 1.00%, 12/01/2020 | | 1,548,000 | 1,905,577 |
| Silicon Laboratories, Inc., Conv., 1.38%, 03/01/2022 | | 563,000 | 701,786 |
| Texas Instruments, Inc., 2.63%, 05/15/2024 | | 210,000 | 213,903 |
| | | | 10,228,512 |
| Specialized Finance–0.94% |
| Convertible Trust - Consumer, Series 2018-1, 0.25%, 01/17/2024 | | 5,674,000 | 5,811,878 |
See accompanying Notes to Financial Statements which are an integral part of the financial statements.
Invesco V.I. Equity and Income Fund
| | Principal
Amount | Value |
| Specialized Finance–(continued) |
| Convertible Trust - Healthcare, Series 2018-1, 0.25%, 02/05/2024 | | $5,897,000 | $5,928,844 |
| | | | 11,740,722 |
| Specialized REITs–0.31% |
| Crown Castle International Corp., | | |
| 3.80%, 02/15/2028 | | 1,743,000 | 1,810,899 |
| 4.75%, 05/15/2047 | | 46,000 | 49,599 |
| EPR Properties, 4.75%, 12/15/2026 | | 1,556,000 | 1,649,442 |
| LifeStorage L.P., 3.50%, 07/01/2026 | | 404,000 | 404,178 |
| | | | 3,914,118 |
| Specialty Chemicals–0.01% |
| Sherwin-Williams Co. (The), 4.50%, 06/01/2047 | | 156,000 | 166,467 |
| Systems Software–0.27% |
| FireEye, Inc., | | |
| Series A, Conv., 1.00%, 06/01/2020(d) | | 1,566,000 | 1,526,850 |
| Series B, Conv., 1.63%, 06/01/2022(d) | | 1,587,000 | 1,499,715 |
| Microsoft Corp., 3.50%, 02/12/2035 | | 367,000 | 391,220 |
| | | | 3,417,785 |
| Technology Distributors–0.05% |
| Avnet, Inc., 4.63%, 04/15/2026 | | 641,000 | 670,714 |
| Technology Hardware, Storage & Peripherals–0.44% |
| Apple, Inc., | | |
| 2.15%, 02/09/2022 | | 652,000 | 654,615 |
| 3.35%, 02/09/2027 | | 305,000 | 320,601 |
| Dell International LLC/EMC Corp., | | |
| 5.45%, 06/15/2023(c) | | 587,000 | 633,072 |
| 8.35%, 07/15/2046(c) | | 14,000 | 17,715 |
| SanDisk LLC, Conv., 0.50%, 10/15/2020 | | 2,520,000 | 2,191,165 |
| Western Digital Corp., Conv., 1.50%, 02/01/2024(c) | | 1,916,000 | 1,725,417 |
| | | | 5,542,585 |
| Tobacco–0.23% |
| Altria Group, Inc., 5.80%, 02/14/2039 | | 1,088,000 | 1,223,600 |
| Philip Morris International, Inc., | | |
| 3.60%, 11/15/2023 | | 369,000 | 385,061 |
| 4.88%, 11/15/2043 | | 1,102,000 | 1,247,865 |
| | | | 2,856,526 |
| Trading Companies & Distributors–0.13% |
| AerCap Ireland Capital DAC/AerCap Global Aviation Trust (Ireland), 3.95%, 02/01/2022 | | 385,000 | 396,137 |
| | Principal
Amount | Value |
| Trading Companies & Distributors–(continued) |
| Air Lease Corp., | | |
| 3.00%, 09/15/2023 | | $63,000 | $63,162 |
| 4.25%, 09/15/2024 | | 392,000 | 414,594 |
| Aircastle Ltd., 4.40%, 09/25/2023 | | 761,000 | 790,571 |
| | | | 1,664,464 |
| Trucking–0.14% |
| Aviation Capital Group LLC, | | |
| 2.88%, 01/20/2022(c) | | 1,015,000 | 1,022,287 |
| 4.88%, 10/01/2025(c) | | 669,000 | 722,314 |
| | | | 1,744,601 |
| Wireless Telecommunication Services–0.21% |
| America Movil, S.A.B. de C.V. (Mexico), 4.38%, 07/16/2042 | | 600,000 | 645,861 |
| Rogers Communications, Inc. (Canada), | | |
| 4.50%, 03/15/2043 | | 533,000 | 575,399 |
| 4.30%, 02/15/2048 | | 1,379,000 | 1,476,622 |
| | | | 2,697,882 |
| Total U.S. Dollar Denominated Bonds & Notes (Cost $243,942,877) | 257,916,377 |
| U.S. Treasury Securities–11.63% |
| U.S. Treasury Bills–0.00% |
| 2.03%, 12/19/2019(g)(h) | | 40,000 | 39,612 |
| U.S. Treasury Bonds–1.66% |
| 4.50%, 02/15/2036 | | 3,636,800 | 4,795,462 |
| 4.50%, 08/15/2039 | | 36,400 | 49,138 |
| 4.38%, 05/15/2040 | | 72,800 | 96,888 |
| 3.00%, 02/15/2049 | | 14,421,600 | 15,819,256 |
| | | | 20,760,744 |
| U.S. Treasury Notes–9.97% |
| 3.63%, 08/15/2019 | | 1,386,600 | 1,388,911 |
| 3.38%, 11/15/2019 | | 272,800 | 274,036 |
| 3.63%, 02/15/2020 | | 41,900 | 42,295 |
| 2.63%, 11/15/2020 | | 545,600 | 551,216 |
| 2.13%, 05/31/2021 | | 74,289,300 | 74,781,176 |
| 1.75%, 06/15/2022 | | 15,572,500 | 15,590,445 |
| 2.00%, 05/31/2024 | | 16,945,100 | 17,137,387 |
| 2.13%, 05/31/2026 | | 2,304,800 | 2,342,073 |
| 2.38%, 05/15/2029 | | 12,655,100 | 13,072,076 |
| | | | 125,179,615 |
| Total U.S. Treasury Securities (Cost $144,081,535) | 145,979,971 |
| | Shares | |
| Preferred Stocks–0.59% |
| Asset Management & Custody Banks–0.17% |
| AMG Capital Trust II, $2.58 Conv. Pfd. | 42,732 | 2,073,761 |
| Diversified Banks–0.02% |
| Wells Fargo & Co., 5.85%, Series Q, Pfd. | 10,911 | 286,523 |
See accompanying Notes to Financial Statements which are an integral part of the financial statements.
Invesco V.I. Equity and Income Fund
| | Shares | Value |
| Oil & Gas Storage & Transportation–0.40% |
| El Paso Energy Capital Trust I, $2.38 Conv. Pfd. | 95,499 | $5,061,447 |
| Total Preferred Stocks (Cost $5,854,432) | 7,421,731 |
| | Principal
Amount | |
| U.S. Government Sponsored Agency Securities–0.08% |
| Federal Home Loan Mortgage Corp. (FHLMC)–0.08% |
Federal Home Loan Mortgage Corp., 6.75%, 03/15/2031
(Cost $842,322) | | $682,000 | 989,933 |
| U.S. Government Sponsored Agency Mortgage-Backed Securities–0.00% |
| Federal Home Loan Mortgage Corp. (FHLMC)–0.00% |
| 5.50%, 02/01/2037 | | 16 | 18 |
| Federal National Mortgage Association (FNMA)–0.00% |
| 5.50%, 03/01/2021 | | 26 | 26 |
| 9.50%, 04/01/2030 | | 1,147 | 1,292 |
| | | | 1,318 |
| Total U.S. Government Sponsored Agency Mortgage-Backed Securities (Cost $1,314) | 1,336 |
| | Shares | Value |
| Money Market Funds–6.44% |
| Invesco Government & Agency Portfolio, Institutional Class, 2.26%(i) | 28,309,014 | $28,309,014 |
| Invesco Liquid Assets Portfolio, Institutional Class, 2.40%(i) | 20,219,084 | 20,227,172 |
| Invesco Treasury Portfolio, Institutional Class, 2.22%(i) | 32,353,159 | 32,353,159 |
| Total Money Market Funds (Cost $80,885,339) | 80,889,345 |
| TOTAL INVESTMENTS IN SECURITIES–99.38% (Cost $1,076,853,529) | 1,247,419,967 |
| OTHER ASSETS LESS LIABILITIES–0.62% | 7,753,234 |
| NET ASSETS–100.00% | $1,255,173,201 |
Investment Abbreviations:
| Conv. | – Convertible |
| DAC | – Designated Activity Co. |
| Pfd. | – Preferred |
| REIT | – Real Estate Investment Trust |
Notes to Schedule of Investments:
| (a) | Industry and/or sector classifications used in this report are generally according to the Global Industry Classification Standard, which was developed by and is the exclusive property and a service mark of MSCI Inc. and Standard & Poor’s. |
| (b) | Non-income producing security. |
| (c) | Security purchased or received in a transaction exempt from registration under the Securities Act of 1933, as amended (the “1933 Act”). The security may be resold pursuant to an exemption from registration under the 1933 Act, typically to qualified institutional buyers. The aggregate value of these securities at June 30, 2019 was $55,654,694, which represented 4.43% of the Fund’s Net Assets. |
| (d) | Security has an irrevocable call by the issuer or mandatory put by the holder. Maturity date reflects such call or put. |
| (e) | Interest or dividend rate is redetermined periodically. Rate shown is the rate in effect on June 30, 2019. |
| (f) | Perpetual bond with no specified maturity date. |
| (g) | All or a portion of the value was pledged as collateral to cover margin requirements for futures contracts. See Note 1K. |
| (h) | Security traded on a discount basis. The interest rate shown represents the discount rate at the time of purchase by the Fund. |
| (i) | The money market fund and the Fund are affiliated by having the same investment adviser. The rate shown is the 7-day SEC standardized yield as of June 30, 2019. |
Portfolio Composition
By security type, based on Net Assets
as of June 30, 2019
| Common Stocks & Other Equity Interests | 60.09% |
| U.S. Dollar Denominated Bonds & Notes | 20.55 |
| U.S. Treasury Securities | 11.63 |
| Security Types Each Less Than 1% of Portfolio | 0.67 |
| Money Market Funds Plus Other Assets Less Liabilities | 7.06 |
See accompanying Notes to Financial Statements which are an integral part of the financial statements.
Invesco V.I. Equity and Income Fund
| Open Futures Contracts |
| Short Futures Contracts | Number of
Contracts | Expiration
Month | Notional
Value | Value | Unrealized
Appreciation
(Depreciation) |
| Interest Rate Risk |
| U.S. Treasury 10 Year Bonds | 15 | September-2019 | $(1,919,531) | $(33,903) | $(33,903) |
| U.S.Treasury 5 Year Notes | 16 | September-2019 | (1,890,500) | (23,575) | (23,575) |
| Total Futures Contracts | $(57,478) | $(57,478) |
| Open Forward Foreign Currency Contracts |
Settlement
Date | Counterparty | Contract to | Unrealized
Appreciation
(Depreciation) |
| Deliver | Receive |
| Currency Risk | | | | | | |
| 07/05/2019 | State Street Bank & Trust Co. | GBP | 374,643 | USD | 477,470 | $1,618 |
| 07/05/2019 | State Street Bank & Trust Co. | USD | 335,189 | CAD | 447,582 | 6,619 |
| 07/05/2019 | State Street Bank & Trust Co. | USD | 3,253,531 | CHF | 3,201,139 | 26,604 |
| 07/05/2019 | State Street Bank & Trust Co. | USD | 183,079 | EUR | 161,889 | 1,052 |
| 07/05/2019 | State Street Bank & Trust Co. | USD | 566,874 | GBP | 450,957 | 5,908 |
| Subtotal—Appreciation | 41,801 |
| Currency Risk | | | | | | |
| 07/05/2019 | Bank of New York Mellon (The) | CHF | 5,958,507 | USD | 5,985,153 | (120,393) |
| 07/05/2019 | Bank of New York Mellon (The) | EUR | 5,437,342 | USD | 6,105,809 | (78,578) |
| 07/05/2019 | Bank of New York Mellon (The) | GBP | 11,112,307 | USD | 14,075,037 | (39,220) |
| 07/05/2019 | State Street Bank & Trust Co. | CAD | 7,716,070 | USD | 5,729,909 | (162,687) |
| 07/05/2019 | State Street Bank & Trust Co. | CHF | 10,710,819 | USD | 10,786,850 | (188,283) |
| 07/05/2019 | State Street Bank & Trust Co. | EUR | 373,911 | USD | 422,881 | (2,402) |
| 07/05/2019 | State Street Bank & Trust Co. | GBP | 11,574,025 | USD | 14,661,472 | (39,233) |
| 07/05/2019 | State Street Bank & Trust Co. | USD | 789,788 | GBP | 618,913 | (3,678) |
| 07/05/2019 | State Street Bank & Trust Co. | USD | 192,747 | CHF | 187,188 | (940) |
| Subtotal—Depreciation | (635,414) |
| Total Forward Foreign Currency Contracts | $(593,613) |
| Abbreviations: |
| CAD | – Canadian Dollar |
| CHF | – Swiss Franc |
| EUR | – Euro |
| GBP | – British Pound Sterling |
| USD | – U.S. Dollar |
See accompanying Notes to Financial Statements which are an integral part of the financial statements.
Invesco V.I. Equity and Income Fund
Statement of Assets and Liabilities
June 30, 2019
(Unaudited)
| Assets: | |
Investments in securities, at value
(Cost $995,968,190) | $1,166,530,622 |
| Investments in affiliated money market funds, at value (Cost $80,885,339) | 80,889,345 |
| Other investments: | |
| Unrealized appreciation on forward foreign currency contracts outstanding | 41,801 |
| Cash | 65,802 |
| Foreign currencies, at value (Cost $463,883) | 463,792 |
| Receivable for: | |
| Dividends | 1,627,953 |
| Interest | 2,351,469 |
| Investments sold | 2,423,233 |
| Fund shares sold | 3,393,493 |
| Investment for trustee deferred compensation and retirement plans | 157,622 |
| Total assets | 1,257,945,132 |
| Liabilities: | |
| Other investments: | |
| Variation margin payable - futures contracts | 469 |
| Unrealized depreciation on forward foreign currency contracts outstanding | 635,414 |
| Payable for: | |
| Investments purchased | 136,254 |
| Fund shares reacquired | 522,048 |
| Accrued fees to affiliates | 1,221,256 |
| Accrued trustees’ and officers’ fees and benefits | 810 |
| Accrued other operating expenses | 83,226 |
| Trustee deferred compensation and retirement plans | 172,454 |
| Total liabilities | 2,771,931 |
| Net assets applicable to shares outstanding | $1,255,173,201 |
| Net assets consist of: | |
| Shares of beneficial interest | $907,625,277 |
| Distributable earnings | 347,547,924 |
| | $1,255,173,201 |
| Net Assets: |
| Series I | $51,374,802 |
| Series II | $1,203,798,399 |
| Shares outstanding, no par value, with an unlimited number of shares authorized: |
| Series I | 2,812,327 |
| Series II | 66,332,923 |
| Series I: | |
| Net asset value per share | $18.27 |
| Series II: | |
| Net asset value per share | $18.15 |
Statement of Operations
For the six months ended June 30, 2019
(Unaudited)
| Investment income: | |
| Dividends (net of foreign withholding taxes of $238,396) | $11,280,202 |
| Interest | 5,396,124 |
| Dividends from affiliated money market funds | 896,847 |
| Total investment income | 17,573,173 |
| Expenses: | |
| Advisory fees | 2,474,234 |
| Administrative services fees | 970,075 |
| Custodian fees | 22,964 |
| Distribution fees - Series II | 1,441,905 |
| Transfer agent fees | 23,857 |
| Trustees’ and officers’ fees and benefits | 21,391 |
| Reports to shareholders | 9,332 |
| Professional services fees | 54,573 |
| Other | 29,722 |
| Total expenses | 5,048,053 |
| Less: Fees waived | (41,823) |
| Net expenses | 5,006,230 |
| Net investment income | 12,566,943 |
| Realized and unrealized gain (loss) from: | |
| Net realized gain (loss) from: | |
| Investment securities | 56,983,835 |
| Foreign currencies | 117,883 |
| Forward foreign currency contracts | 901,477 |
| Futures contracts | (164,329) |
| | 57,838,866 |
| Change in net unrealized appreciation (depreciation) of: | |
| Investment securities | 83,852,709 |
| Foreign currencies | 3,588 |
| Forward foreign currency contracts | (501,643) |
| Futures contracts | 29,027 |
| | 83,383,681 |
| Net realized and unrealized gain | 141,222,547 |
| Net increase in net assets resulting from operations | $153,789,490 |
See accompanying Notes to Financial Statements which are an integral part of the financial statements.
Invesco V.I. Equity and Income Fund
Statement of Changes in Net Assets
For the six months ended June 30, 2019 and the year ended December 31, 2018
(Unaudited)
| | June 30,
2019 | December 31,
2018 |
| Operations: | | |
| Net investment income | $12,566,943 | $24,910,635 |
| Net realized gain | 57,838,866 | 92,833,956 |
| Change in net unrealized appreciation (depreciation) | 83,383,681 | (251,690,383) |
| Net increase (decrease) in net assets resulting from operations | 153,789,490 | (133,945,792) |
| Distributions to shareholders from distributable earnings: | | |
| Series I | — | (12,212,096) |
| Series II | — | (83,405,521) |
| Total distributions from distributable earnings | — | (95,617,617) |
| Share transactions–net: | | |
| Series I | (132,603,395) | 10,954,748 |
| Series II | 26,152,017 | (143,814,137) |
| Net increase (decrease) in net assets resulting from share transactions | (106,451,378) | (132,859,389) |
| Net increase (decrease) in net assets | 47,338,112 | (362,422,798) |
| Net assets: | | |
| Beginning of period | 1,207,835,089 | 1,570,257,887 |
| End of period | $1,255,173,201 | $1,207,835,089 |
See accompanying Notes to Financial Statements which are an integral part of the financial statements.
Invesco V.I. Equity and Income Fund
Financial Highlights
June 30, 2019
(Unaudited)
The following schedule presents financial highlights for a share of the Fund outstanding throughout the periods indicated.
| | Net asset
value,
beginning
of period | Net
investment
income(a) | Net gains
(losses)
on securities
(both
realized and
unrealized) | Total from
investment
operations | Dividends
from net
investment
income | Distributions
from net
realized
gains | Total
distributions | Net asset
value, end
of period | Total
return(b) | Net assets,
end of period
(000’s omitted) | Ratio of
expenses
to average
net assets
with fee waivers
and/or expenses
absorbed | Ratio of
expenses
to average net
assets without
fee waivers
and/or expenses
absorbed | Ratio of net
investment
income
to average
net assets | Portfolio
turnover(c) |
| Series I |
| Six months ended 06/30/19 | $16.12 | $0.19 | $1.96 | $2.15 | $— | $— | $— | $18.27 | 13.34% | $51,375 | 0.54%(d) | 0.55%(d) | 2.15%(d) | 66% |
| Year ended 12/31/18 | 19.04 | 0.35 | (2.00) | (1.65) | (0.43) | (0.84) | (1.27) | 16.12 | (9.50) | 165,924 | 0.54 | 0.55 | 1.91 | 150 |
| Year ended 12/31/17 | 17.76 | 0.35(e) | 1.58 | 1.93 | (0.31) | (0.34) | (0.65) | 19.04 | 11.03 | 184,768 | 0.55 | 0.56 | 1.93(e) | 119 |
| Year ended 12/31/16 | 16.23 | 0.29 | 2.10 | 2.39 | (0.32) | (0.54) | (0.86) | 17.76 | 15.12 | 157,774 | 0.60 | 0.61 | 1.78 | 101 |
| Year ended 12/31/15 | 18.93 | 0.28 | (0.78) | (0.50) | (0.49) | (1.71) | (2.20) | 16.23 | (2.29) | 96,287 | 0.64 | 0.65 | 1.55 | 87 |
| Year ended 12/31/14 | 18.58 | 0.37(f) | 1.28 | 1.65 | (0.35) | (0.95) | (1.30) | 18.93 | 9.03 | 72,391 | 0.66 | 0.67 | 1.92(f) | 85 |
| Series II |
| Six months ended 06/30/19 | 16.04 | 0.16 | 1.95 | 2.11 | — | — | — | 18.15 | 13.15 | 1,203,798 | 0.79(d) | 0.80(d) | 1.90(d) | 66 |
| Year ended 12/31/18 | 18.95 | 0.31 | (2.00) | (1.69) | (0.38) | (0.84) | (1.22) | 16.04 | (9.73) | 1,041,911 | 0.79 | 0.80 | 1.66 | 150 |
| Year ended 12/31/17 | 17.68 | 0.31(e) | 1.57 | 1.88 | (0.27) | (0.34) | (0.61) | 18.95 | 10.78 | 1,385,490 | 0.80 | 0.81 | 1.68(e) | 119 |
| Year ended 12/31/16 | 16.16 | 0.25 | 2.09 | 2.34 | (0.28) | (0.54) | (0.82) | 17.68 | 14.84 | 1,314,323 | 0.85 | 0.86 | 1.53 | 101 |
| Year ended 12/31/15 | 18.86 | 0.23 | (0.78) | (0.55) | (0.44) | (1.71) | (2.15) | 16.16 | (2.58) | 1,129,261 | 0.89 | 0.90 | 1.30 | 87 |
| Year ended 12/31/14 | 18.52 | 0.32(f) | 1.28 | 1.60 | (0.31) | (0.95) | (1.26) | 18.86 | 8.77 | 1,290,920 | 0.91 | 0.92 | 1.67(f) | 85 |
| (a) | Calculated using average shares outstanding. |
| (b) | Includes adjustments in accordance with accounting principles generally accepted in the United States of America and as such, the net asset value for financial reporting purposes and the returns based upon those net asset values may differ from the net asset value and returns for shareholder transactions. Total returns are not annualized for periods less than one year, if applicable, and do not reflect charges assessed in connection with a variable product, which if included would reduce total returns. |
| (c) | Portfolio turnover is calculated at the fund level and is not annualized for periods less than one year, if applicable. |
| (d) | Ratios are annualized and based on average daily net assets (000’s omitted) of $155,339 and $1,163,083 for Series I and Series II shares, respectively. |
| (e) | Net investment income per share and the ratio of net investment income to average net assets includes significant dividends received during the year ended December 31, 2017. Net investment income per share and the ratio of net investment income to average net assets excluding the significant dividends are $0.30 and 1.64% and $0.26 and 1.39% for Series I and Series II shares, respectively. |
| (f) | Net investment income per share and the ratio of net investment income to average net assets includes significant dividends received during the year ended December 31, 2014. Net investment income per share and the ratio of net investment income to average net assets excluding the significant dividends are $0.27 and 1.41% and $0.22 and 1.16% for Series I and Series II shares, respectively. |
See accompanying Notes to Financial Statements which are an integral part of the financial statements.
Invesco V.I. Equity and Income Fund
Notes to Financial Statements
June 30, 2019
(Unaudited)
NOTE 1—Significant Accounting Policies
Invesco V.I. Equity And Income Fund (the “Fund”) is a series portfolio of AIM Variable Insurance Funds (Invesco Variable Insurance Funds) (the “Trust”). The Trust is a Delaware statutory trust registered under the Investment Company Act of 1940, as amended (the “1940 Act”), as an open-end series management investment company. Information presented in these financial statements pertains only to the Fund. Matters affecting the Fund or each class will be voted on exclusively by the shareholders of the Fund or each class. Current Securities and Exchange Commission (“SEC”) guidance, however, requires participating insurance companies offering separate accounts to vote shares proportionally in accordance with the instructions of the contract owners whose investments are funded by shares of each Fund or class.
The Fund’s investment objectives are both capital appreciation and current income.
The Fund currently offers two classes of shares, Series I and Series II, both of which are offered to insurance company separate accounts funding variable annuity contracts and variable life insurance policies (“variable products”).
The Fund is an investment company and accordingly follows the investment company accounting and reporting guidance in accordance with Financial Accounting Standards Board Accounting Standards Codification Topic 946,Financial Services – Investment Companies.
The following is a summary of the significant accounting policies followed by the Fund in the preparation of its financial statements.
| A. | Security Valuations — Securities, including restricted securities, are valued according to the following policy. |
A security listed or traded on an exchange (except convertible securities) is valued at its last sales price or official closing price as of the close of the customary trading session on the exchange where the security is principally traded, or lacking any sales or official closing price on a particular day, the security may be valued at the closing bid price on that day. Securities traded in the over-the-counter market are valued based on prices furnished by independent pricing services or market makers. When such securities are valued by an independent pricing service they may be considered fair valued. Futures contracts are valued at the final settlement price set by an exchange on which they are principally traded. Listed options are valued at the mean between the last bid and asked prices from the exchange on which they are principally traded. Options not listed on an exchange are valued by an independent source at the mean between the last bid and asked prices. For purposes of determining net asset value (“NAV”) per share, futures and option contracts generally are valued 15 minutes after the close of the customary trading session of the New York Stock Exchange (“NYSE”).
Investments in open-end and closed-end registered investment companies that do not trade on an exchange are valued at the end-of-day net asset value per share. Investments in open-end and closed-end registered investment companies that trade on an exchange are valued at the last sales price or official closing price as of the close of the customary trading session on the exchange where the security is principally traded.
Debt obligations (including convertible securities) and unlisted equities are fair valued using an evaluated quote provided by an independent pricing service. Evaluated quotes provided by the pricing service may be determined without exclusive reliance on quoted prices, and may reflect appropriate factors such as institution-size trading in similar groups of securities, developments related to specific securities, dividend rate (for unlisted equities), yield (for debt obligations), quality, type of issue, coupon rate (for debt obligations), maturity (for debt obligations), individual trading characteristics and other market data. Pricing services generally value debt obligations assuming orderly transactions of institutional round lot size, but a fund may hold or transact in the same securities in smaller, odd lot sizes. Odd lots often trade at lower prices than institutional round lots. Debt obligations are subject to interest rate and credit risks. In addition, all debt obligations involve some risk of default with respect to interest and/or principal payments.
Foreign securities’ (including foreign exchange contracts) prices are converted into U.S. dollar amounts using the applicable exchange rates as of the close of the NYSE. If market quotations are available and reliable for foreign exchange-traded equity securities, the securities will be valued at the market quotations. Because trading hours for certain foreign securities end before the close of the NYSE, closing market quotations may become unreliable. If between the time trading ends on a particular security and the close of the customary trading session on the NYSE, events occur that the investment adviser determines are significant and make the closing price unreliable, the Fund may fair value the security. If the event is likely to have affected the closing price of the security, the security will be valued at fair value in good faith using procedures approved by the Board of Trustees. Adjustments to closing prices to reflect fair value may also be based on a screening process of an independent pricing service to indicate the degree of certainty, based on historical data, that the closing price in the principal market where a foreign security trades is not the current value as of the close of the NYSE. Foreign securities’ prices meeting the approved degree of certainty that the price is not reflective of current value will be priced at the indication of fair value from the independent pricing service. Multiple factors may be considered by the independent pricing service in determining adjustments to reflect fair value and may include information relating to sector indices, American Depositary Receipts and domestic and foreign index futures. Foreign securities may have additional risks including exchange rate changes, potential for sharply devalued currencies and high inflation, political and economic upheaval, the relative lack of issuer information, relatively low market liquidity and the potential lack of strict financial and accounting controls and standards.
Securities for which market prices are not provided by any of the above methods may be valued based upon quotes furnished by independent sources. The last bid price may be used to value equity securities. The mean between the last bid and asked prices is used to value debt obligations, including corporate loans.
Securities for which market quotations are not readily available or became unreliable are valued at fair value as determined in good faith by or under the supervision of the Trust’s officers following procedures approved by the Board of Trustees. Issuer specific events, market trends, bid/asked quotes of brokers and information providers and other market data may be reviewed in the course of making a good faith determination of a security’s fair value.
The Fund may invest in securities that are subject to interest rate risk, meaning the risk that the prices will generally fall as interest rates rise and, conversely, the prices will generally rise as interest rates fall. Specific securities differ in their sensitivity to changes in interest rates depending on their individual characteristics. Changes in interest rates may result in increased market volatility, which may affect the value and/or liquidity of certain Fund investments.
Invesco V.I. Equity and Income Fund
Valuations change in response to many factors including the historical and prospective earnings of the issuer, the value of the issuer’s assets, general economic conditions, interest rates, investor perceptions and market liquidity. Because of the inherent uncertainties of valuation, the values reflected in the financial statements may materially differ from the value received upon actual sale of those investments.
| B. | Securities Transactions and Investment Income – Securities transactions are accounted for on a trade date basis. Realized gains or losses on sales are computed on the basis of specific identification of the securities sold. Interest income (net of withholding tax, if any) is recorded on the accrual basis from settlement date. Bond premiums and discounts are amortized and/or accreted over the lives of the respective securities. Pay-in-kind interest income and non-cash dividend income received in the form of securities in-lieu of cash are recorded at the fair value of the securities received. Dividend income (net of withholding tax, if any) is recorded on the ex-dividend date. |
The Fund may periodically participate in litigation related to Fund investments. As such, the Fund may receive proceeds from litigation settlements. Any proceeds received are included in the Statement of Operations as realized gain (loss) for investments no longer held and as unrealized gain (loss) for investments still held.
Brokerage commissions and mark ups are considered transaction costs and are recorded as an increase to the cost basis of securities purchased and/or a reduction of proceeds on a sale of securities. Such transaction costs are included in the determination of net realized and unrealized gain (loss) from investment securities reported in the Statement of Operations and the Statement of Changes in Net Assets and the net realized and unrealized gains (losses) on securities per share in the Financial Highlights. Transaction costs are included in the calculation of the Fund’s net asset value and, accordingly, they reduce the Fund’s total returns. These transaction costs are not considered operating expenses and are not reflected in net investment income reported in the Statement of Operations and the Statement of Changes in Net Assets, or the net investment income per share and the ratios of expenses and net investment income reported in the Financial Highlights, nor are they limited by any expense limitation arrangements between the Fund and the investment adviser.
The Fund allocates income and realized and unrealized capital gains and losses to a class based on the relative net assets of each class.
| C. | Country Determination — For the purposes of making investment selection decisions and presentation in the Schedule of Investments, the investment adviser may determine the country in which an issuer is located and/or credit risk exposure based on various factors. These factors include the laws of the country under which the issuer is organized, where the issuer maintains a principal office, the country in which the issuer derives 50% or more of its total revenues and the country that has the primary market for the issuer’s securities, as well as other criteria. Among the other criteria that may be evaluated for making this determination are the country in which the issuer maintains 50% or more of its assets, the type of security, financial guarantees and enhancements, the nature of the collateral and the sponsor organization. Country of issuer and/or credit risk exposure has been determined to be the United States of America, unless otherwise noted. |
| D. | Distributions– Distributions from net investment income, if any, are declared and paid monthly. Distributions from net realized capital gain, if any, are generally declared and paid annually and recorded on the ex-dividend date. The Fund may elect to treat a portion of the proceeds from redemptions as distributions for federal income tax purposes. |
| E. | Federal Income Taxes –The Fund intends to comply with the requirements of Subchapter M of the Internal Revenue Code of 1986, as amended (the “Internal Revenue Code”), necessary to qualify as a regulated investment company and to distribute substantially all of the Fund’s taxable earnings to shareholders. As such, the Fund will not be subject to federal income taxes on otherwise taxable income (including net realized capital gain) that is distributed to shareholders. Therefore, no provision for federal income taxes is recorded in the financial statements. |
The Fund recognizes the tax benefits of uncertain tax positions only when the position is more likely than not to be sustained. Management has analyzed the Fund’s uncertain tax positions and concluded that no liability for unrecognized tax benefits should be recorded related to uncertain tax positions. Management is not aware of any tax positions for which it is reasonably possible that the total amounts of unrecognized tax benefits will change materially in the next 12 months.
The Fund files tax returns in the U.S. Federal jurisdiction and certain other jurisdictions. Generally, the Fund is subject to examinations by such taxing authorities for up to three years after the filing of the return for the tax period.
| F. | Expenses– Fees provided for under the Rule 12b-1 plan of a particular class of the Fund and which are directly attributable to that class are charged to the operations of such class. All other expenses are allocated among the classes based on relative net assets. |
| G. | Accounting Estimates – The preparation of financial statements in conformity with accounting principles generally accepted in the United States of America (“GAAP”) requires management to make estimates and assumptions that affect the reported amounts of assets and liabilities at the date of the financial statements and the reported amounts of revenues and expenses during the reporting period including estimates and assumptions related to taxation. Actual results could differ from those estimates by a significant amount. In addition, the Fund monitors for material events or transactions that may occur or become known after the period-end date and before the date the financial statements are released to print. |
| H. | Indemnifications – Under the Trust’s organizational documents, each Trustee, officer, employee or other agent of the Trust is indemnified against certain liabilities that may arise out of the performance of their duties to the Fund. Additionally, in the normal course of business, the Fund enters into contracts, including the Fund’s servicing agreements, that contain a variety of indemnification clauses. The Fund’s maximum exposure under these arrangements is unknown as this would involve future claims that may be made against the Fund that have not yet occurred. The risk of material loss as a result of such indemnification claims is considered remote. |
| I. | Foreign Currency Translations— Foreign currency is valued at the close of the NYSE based on quotations posted by banks and major currency dealers. Portfolio securities and other assets and liabilities denominated in foreign currencies are translated into U.S. dollar amounts at the date of valuation. Purchases and sales of portfolio securities (net of foreign taxes withheld on disposition) and income items denominated in foreign currencies are translated into U.S. dollar amounts on the respective dates of such transactions. The Fund does not separately account for the portion of the results of operations resulting from changes in foreign exchange rates on investments and the fluctuations arising from changes in market prices of securities held. The combined results of changes in foreign exchange rates and the fluctuation of market prices on investments (net of estimated foreign tax withholding) are included with the net realized and unrealized gain or loss from investments in the Statement of Operations. Reported net realized foreign currency gains or losses arise from (1) sales of foreign currencies, (2) currency gains or losses realized between the trade and settlement dates on securities transactions, and (3) the difference between the amounts of dividends, interest, and foreign withholding taxes recorded on the Fund’s books and the U.S. dollar equivalent of the amounts actually received or paid. Net unrealized foreign currency gains and losses arise from changes in the fair values of assets and liabilities, other than investments in securities at fiscal period end, resulting from changes in exchange rates. |
Invesco V.I. Equity and Income Fund
The Fund may invest in foreign securities, which may be subject to foreign taxes on income, gains on investments or currency repatriation, a portion of which may be recoverable. Foreign taxes, if any, are recorded based on the tax regulations and rates that exist in the foreign markets in which the Fund invests and are shown in the Statement of Operations.
| J. | Forward Foreign Currency Contracts— The Fund may engage in foreign currency transactions either on a spot (i.e. for prompt delivery and settlement) basis, or through forward foreign currency contracts, to manage or minimize currency or exchange rate risk. |
The Fund may also enter into forward foreign currency contracts for the purchase or sale of a security denominated in a foreign currency in order to “lock in” the U.S. dollar price of that security, or the Fund may also enter into forward foreign currency contracts that do not provide for physical settlement of the two currencies, but instead are settled by a single cash payment calculated as the difference between the agreed upon exchange rate and the spot rate at settlement based upon an agreed upon notional amount (non-deliverable forwards). The Fund will set aside liquid assets in an amount equal to the daily mark-to-market obligation for forward foreign currency contracts.
A forward foreign currency contract is an obligation between two parties (“Counterparties”) to purchase or sell a specific currency for an agreed-upon price at a future date. The use of forward foreign currency contracts does not eliminate fluctuations in the price of the underlying securities the Fund owns or intends to acquire but establishes a rate of exchange in advance. Fluctuations in the value of these contracts are measured by the difference in the contract date and reporting date exchange rates and are recorded as unrealized appreciation (depreciation) until the contracts are closed. When the contracts are closed, realized gains (losses) are recorded. Realized and unrealized gains (losses) on the contracts are included in the Statement of Operations. The primary risks associated with forward foreign currency contracts include failure of the Counterparty to meet the terms of the contract and the value of the foreign currency changing unfavorably. These risks may be in excess of the amounts reflected in the Statement of Assets and Liabilities.
| K. | Futures Contracts — The Fund may enter into futures contracts to manage exposure to interest rate, equity and market price movements and/or currency risks. A futures contract is an agreement between Counterparties to purchase or sell a specified underlying security, currency or commodity (or delivery of a cash settlement price, in the case of an index future) for a fixed price at a future date. The Fund currently invests only in exchange-traded futures and they are standardized as to maturity date and underlying financial instrument. Initial margin deposits required upon entering into futures contracts are satisfied by the segregation of specific securities or cash as collateral at the futures commission merchant (broker). During the period the futures contracts are open, changes in the value of the contracts are recognized as unrealized gains or losses by recalculating the value of the contracts on a daily basis. Subsequent or variation margin payments are received or made depending upon whether unrealized gains or losses are incurred. These amounts are reflected as receivables or payables on the Statement of Assets and Liabilities. When the contracts are closed or expire, the Fund recognizes a realized gain or loss equal to the difference between the proceeds from, or cost of, the closing transaction and the Fund’s basis in the contract. The net realized gain (loss) and the change in unrealized gain (loss) on futures contracts held during the period is included on the Statement of Operations. The primary risks associated with futures contracts are market risk and the absence of a liquid secondary market. If the Fund were unable to liquidate a futures contract and/or enter into an offsetting closing transaction, the Fund would continue to be subject to market risk with respect to the value of the contracts and continue to be required to maintain the margin deposits on the futures contracts. Futures contracts have minimal Counterparty risk since the exchange’s clearinghouse, as Counterparty to all exchange-traded futures, guarantees the futures against default. Risks may exceed amounts recognized in the Statement of Assets and Liabilities. |
| L. | Collateral—To the extent the Fund has designated or segregated a security as collateral and that security is subsequently sold, it is the Fund’s practice to replace such collateral no later than the next business day. |
NOTE 2—Advisory Fees and Other Fees Paid to Affiliates
The Trust has entered into a master investment advisory agreement with Invesco Advisers, Inc. (the "Adviser" or "Invesco"). Under the terms of the investment advisory agreement, the Fund accrues daily and pays monthly an advisory fee to the Adviser based on the annual rate of the Fund’s average daily net assets as follows:
| Average Daily Net Assets | Rate |
| First $150 million | 0.50% |
| Next $100 million | 0.45% |
| Next $100 million | 0.40% |
| Over $350 million | 0.35% |
For the six months ended June 30, 2019, the effective advisory fees incurred by the Fund was 0.38%.
Under the terms of a master sub-advisory agreement between the Adviser and each of Invesco Asset Management Deutschland GmbH, Invesco Asset Management Limited, Invesco Asset Management (Japan) Limited, Invesco Hong Kong Limited, Invesco Senior Secured Management, Inc. and Invesco Canada Ltd. (collectively, the "Affiliated Sub-Advisers") the Adviser, not the Fund, will pay 40% of the fees paid to the Adviser to any such Affiliated Sub-Adviser(s) that provide(s) discretionary investment management services to the Fund based on the percentage of assets allocated to such Affiliated Sub-Adviser(s).
The Adviser has contractually agreed, through at least June 30, 2020, to waive advisory fees and/or reimburse expenses of all shares to the extent necessary to limit total annual fund operating expenses after fee waiver and/or expense reimbursement (excluding certain items discussed below) of Series I shares to 1.50% and Series II shares to 1.75% of average daily net assets (the “expense limits”). In determining the Adviser’s obligation to waive advisory fees and/or reimburse expenses, the following expenses are not taken into account, and could cause the total annual fund operating expenses after fee waiver and/or expense reimbursement to exceed the numbers reflected above: (1) interest; (2) taxes; (3) dividend expense on short sales; (4) extraordinary or non-routine items, including litigation expenses; and (5) expenses that the Fund has incurred but did not actually pay because of an expense offset arrangement. Unless Invesco continues the fee waiver agreement, it will terminate on June 30, 2020. During its term, the fee waiver agreement cannot be terminated or amended to increase the expense limits or reduce the advisory fee waiver without approval of the Board of Trustees. The Adviser did not waive fees and/or reimburse expenses during the period under these expense limits.
Invesco V.I. Equity and Income Fund
The Adviser has contractually agreed, through at least June 30, 2021, to waive the advisory fee payable by the Fund in an amount equal to 100% of the net advisory fees the Adviser receives from the affiliated money market funds on investments by the Fund of uninvested cash in such affiliated money market funds.
For the six months ended June 30, 2019, the Adviser waived advisory fees of $41,823.
The Trust has entered into a master administrative services agreement with Invesco pursuant to which the Fund has agreed to pay Invesco a fee for costs incurred in providing accounting services and fund administrative services to the Fund and to reimburse Invesco for fees paid to insurance companies that have agreed to provide certain administrative services to the Fund. These administrative services provided by the insurance companies may include, among other things: maintenance of master accounts with the Fund; tracking, recording and transmitting net purchase and redemption orders for Fund shares; maintaining and preserving records related to the purchase, redemption and other account activity of variable product owners; distributing copies of Fund documents such as prospectuses, proxy materials and periodic reports, to variable product owners, and responding to inquiries from variable product owners about the Fund. Pursuant to such agreement, for the six months ended June 30, 2019, Invesco was paid $90,047 for accounting and fund administrative services and was reimbursed $880,028 for fees paid to insurance companies. Also, Invesco has entered into a sub-administration agreement whereby State Street Bank and Trust Company (“SSB”) serves as custodian and fund accountant and provides certain administrative services to the Fund.
The Trust has entered into a transfer agency and service agreement with Invesco Investment Services, Inc. (“IIS”) pursuant to which the Fund has agreed to pay IIS a fee for providing transfer agency and shareholder services to the Fund and reimburse IIS for certain expenses incurred by IIS in the course of providing such services. IIS may make payments to intermediaries that provide omnibus account services, sub-accounting services and/or networking services. All fees payable by IIS to intermediaries that provide omnibus account services or sub-accounting services are charged back to the Fund, subject to certain limitations approved by the Trust’s Board of Trustees. For the six months ended June 30, 2019, expenses incurred under the agreement are shown in the Statement of Operations asTransfer agent fees.
The Trust has entered into a master distribution agreement with Invesco Distributors, Inc. (“IDI”) to serve as the distributor for the Fund. The Trust has adopted a plan pursuant to Rule 12b-1 under the 1940 Act with respect to the Fund’s Series II shares (the “Plan”). The Fund, pursuant to the Plan, pays IDI compensation at the annual rate of 0.25% of the Fund’s average daily net assets of Series II shares. The fees are accrued daily and paid monthly. Of the Plan payments, up to 0.25% of the average daily net assets of the Series II shares may be paid to insurance companies who furnish continuing personal shareholder services to customers who purchase and own Series II shares of the Fund. For the six months ended June 30, 2019, expenses incurred under the Plan are detailed in the Statement of Operations asDistribution fees.
For the six months ended June 30, 2019, the Fund incurred $6,973 in brokerage commissions with Invesco Capital Markets, Inc., an affiliate of the Adviser and IDI, for portfolio transactions executed on behalf of the Fund.
Certain officers and trustees of the Trust are officers and directors of Invesco.
NOTE 3—Additional Valuation Information
GAAP defines fair value as the price that would be received to sell an asset or paid to transfer a liability in an orderly transaction between market participants at the measurement date, under current market conditions. GAAP establishes a hierarchy that prioritizes the inputs to valuation methods, giving the highest priority to readily available unadjusted quoted prices in an active market for identical assets (Level 1) and the lowest priority to significant unobservable inputs (Level 3), generally when market prices are not readily available or are unreliable. Based on the valuation inputs, the securities or other investments are tiered into one of three levels. Changes in valuation methods may result in transfers in or out of an investment’s assigned level:
Level 1 – Prices are determined using quoted prices in an active market for identical assets.
Level 2 – Prices are determined using other significant observable inputs. Observable inputs are inputs that other market participants may use in pricing a security. These may include quoted prices for similar securities, interest rates, prepayment speeds, credit risk, yield curves, loss severities, default rates, discount rates, volatilities and others.
Level 3 – Prices are determined using significant unobservable inputs. In situations where quoted prices or observable inputs are unavailable (for example, when there is little or no market activity for an investment at the end of the period), unobservable inputs may be used. Unobservable inputs reflect the Fund’s own assumptions about the factors market participants would use in determining fair value of the securities or instruments and would be based on the best available information.
The following is a summary of the tiered valuation input levels, as of June 30, 2019. The level assigned to the securities valuations may not be an indication of the risk or liquidity associated with investing in those securities. Because of the inherent uncertainties of valuation, the values reflected in the financial statements may materially differ from the value received upon actual sale of those investments.
| | Level 1 | Level 2 | Level 3 | Total |
| Investments in Securities | | | | |
| Common Stocks & Other Equity Interests | $695,264,535 | $58,956,739 | $— | $754,221,274 |
| U.S. Dollar Denominated Bonds & Notes | — | 257,916,377 | — | 257,916,377 |
| U.S. Treasury Securities | — | 145,979,971 | — | 145,979,971 |
| Preferred Stocks | 5,347,970 | 2,073,761 | — | 7,421,731 |
| U.S. Government Sponsored Agency Securities | — | 989,933 | — | 989,933 |
| U.S. Government Sponsored Agency Mortgage-Backed Securities | — | 1,336 | — | 1,336 |
| Money Market Funds | 80,889,345 | — | — | 80,889,345 |
| Total Investments in Securities | 781,501,850 | 465,918,117 | — | 1,247,419,967 |
| Other Investments - Assets* | | | | |
| Forward Foreign Currency Contracts | — | 41,801 | — | 41,801 |
Invesco V.I. Equity and Income Fund
| | Level 1 | Level 2 | Level 3 | Total |
| Other Investments - Liabilities* | | | | |
| Futures Contracts | $(57,478) | $— | $— | $(57,478) |
| Forward Foreign Currency Contracts | — | (635,414) | — | (635,414) |
| | (57,478) | (635,414) | — | (692,892) |
| Total Other Investments | (57,478) | (593,613) | — | (651,091) |
| Total Investments | $781,444,372 | $465,324,504 | $— | $1,246,768,876 |
| * | Unrealized appreciation (depreciation). |
NOTE 4—Derivative Investments
The Fund may enter into an International Swaps and Derivatives Association Master Agreement (“ISDA Master Agreement”) under which a fund may trade OTC derivatives. An OTC transaction entered into under an ISDA Master Agreement typically involves a collateral posting arrangement, payment netting provisions and close-out netting provisions. These netting provisions allow for reduction of credit risk through netting of contractual obligations. The enforceability of the netting provisions of the ISDA Master Agreement depends on the governing law of the ISDA Master Agreement, among other factors.
For financial reporting purposes, the Fund does not offset OTC derivative assets or liabilities that are subject to ISDA Master Agreements in the Statement of Assets and Liabilities.
Value of Derivative Investments at Period-End
The table below summarizes the value of the Fund’s derivative investments, detailed by primary risk exposure, held as of June 30, 2019:
| | Value |
| Derivative Assets | Currency
Risk | Interest
Rate Risk | Total |
| Unrealized appreciation on forward foreign currency contracts outstanding | $41,801 | $- | $41,801 |
| Derivatives not subject to master netting agreements | - | - | - |
| Total Derivative Assets subject to master netting agreements | $41,801 | $- | $41,801 |
| | Value |
| Derivative Liabilities | Currency
Risk | Interest
Rate Risk | Total |
| Unrealized depreciation on futures contracts — Exchange-Traded | $- | $(57,478) | $(57,478) |
| Unrealized depreciation on forward foreign currency contracts outstanding | (635,414) | - | (635,414) |
| Total Derivative Liabilities | (635,414) | (57,478) | (692,892) |
| Derivatives not subject to master netting agreements | - | 57,478 | 57,478 |
| Total Derivative Liabilities subject to master netting agreements | $(635,414) | $- | $(635,414) |
Offsetting Assets and Liabilities
The table below reflects the Fund’s exposure to Counterparties subject to either an ISDA Master Agreement or other agreement for OTC derivative transactions as of June 30, 2019.
| | Financial
Derivative
Assets | | Financial
Derivative
Liabilities | | Net Value of
Derivatives | | Collateral
(Received)/Pledged | | | | | | |
| Counterparty | Forward Foreign
Currency Contracts | | Forward Foreign
Currency Contracts | | Net Value of
Derivatives | | Non-Cash | Cash | Net
Amount | | | | |
| Bank of New York Mellon (The) | $– | | $ (238,191) | | $ (238,191) | | $– | $– | $ (238,191) | | | | |
| State Street Bank & Trust Co. | 41,801 | | (397,223) | | (355,422) | | – | – | (355,422) | | | | |
| Total | $ 41,801 | | $ (635,414) | | $ (593,613) | | $– | $– | $ (593,613) | | | | |
Invesco V.I. Equity and Income Fund
Effect of Derivative Investments for the six months ended June 30, 2019
The table below summarizes the gains (losses) on derivative investments, detailed by primary risk exposure, recognized in earnings during the period:
| | Location of Gain (Loss) on
Statement of Operations |
| | Currency
Risk | Interest
Rate Risk | Total |
| Realized Gain (Loss): | | | |
| Forward foreign currency contracts | $901,477 | $- | $901,477 |
| Futures contracts | - | (164,329) | (164,329) |
| Change in Net Unrealized Appreciation (Depreciation): | | | |
| Forward foreign currency contracts | (501,643) | - | (501,643) |
| Futures contracts | - | 29,027 | 29,027 |
| Total | $399,834 | $(135,302) | $264,532 |
The table below summarizes the average notional value of derivatives held during the period.
| | Forward
Foreign Currency
Contracts | Futures
Contracts |
| Average notional value | $105,464,378 | $4,236,208 |
NOTE 5—Trustees’ and Officers’ Fees and Benefits
Trustees’ and Officers’ Fees and Benefits include amounts accrued by the Fund to pay remuneration to certain Trustees and Officers of the Fund. Trustees have the option to defer compensation payable by the Fund, and Trustees’ and Officers’ Fees and Benefits also include amounts accrued by the Fund to fund such deferred compensation amounts. Those Trustees who defer compensation have the option to select various Invesco Funds in which their deferral accounts shall be deemed to be invested. Finally, certain current Trustees were eligible to participate in a retirement plan that provided for benefits to be paid upon retirement to Trustees over a period of time based on the number of years of service. The Fund may have certain former Trustees who also participate in a retirement plan and receive benefits under such plan.Trustees’ and Officers’ Fees and Benefits include amounts accrued by the Fund to fund such retirement benefits. Obligations under the deferred compensation and retirement plans represent unsecured claims against the general assets of the Fund.
NOTE 6—Cash Balances
The Fund is permitted to temporarily carry a negative or overdrawn balance in its account with SSB, the custodian bank. Such balances, if any at period-end, are shown in the Statement of Assets and Liabilities under the payable captionAmount due custodian. To compensate the custodian bank for such overdrafts, the overdrawn Fund may either (1) leave funds as a compensating balance in the account so the custodian bank can be compensated by earning the additional interest; or (2) compensate by paying the custodian bank at a rate agreed upon by the custodian bank and Invesco, not to exceed the contractually agreed upon rate.
NOTE 7—Tax Information
The amount and character of income and gains to be distributed are determined in accordance with income tax regulations, which may differ from GAAP. Reclassifications are made to the Fund’s capital accounts to reflect income and gains available for distribution (or available capital loss carryforward) under income tax regulations. The tax character of distributions paid during the year and the tax components of net assets will be reported at the Fund’s fiscal year-end.
Capital loss carryforward is calculated and reported as of a specific date. Results of transactions and other activity after that date may affect the amount of capital loss carryforward actually available for the Fund to utilize. Capital losses generated in years beginning after December 22, 2010 can be carried forward for an unlimited period, whereas previous losses expire in eight tax years. Capital losses with an expiration period may not be used to offset capital gains until all net capital losses without an expiration date have been utilized. Capital loss carryforwards with no expiration date will retain their character as either short-term or long-term capital losses instead of as short-term capital losses as under prior law. The ability to utilize capital loss carryforwards in the future may be limited under the Internal Revenue Code and related regulations based on the results of future transactions.
The Fund did not have a capital loss carryforward as of December 31, 2018.
On May 24, 2019, a total of 7,236,105 Series I shares of the Fund valued at $128,223,776 were redeemed by significant shareholders and settled through a redemption-in-kind transaction, of which $16,258,255 consisted of cash, which resulted in a realized gain of $26,600,525 to the Fund for book purposes. From a federal income tax perspective, the realized gains are not recognized.
NOTE 8—Investment Transactions
The aggregate amount of investment securities (other than short-term securities, U.S. Treasury obligations and money market funds, if any) purchased and sold by the Fund during the six months ended June 30, 2019 was $684,851,967 and $810,740,740, respectively. During the same period, purchases and sales of U.S. Treasury obligations were $110,313,386 and $112,769,835, respectively. Cost of investments, including any derivatives, on a tax basis includes the adjustments for financial reporting purposes as of the most recently completed federal income tax reporting period-end.
Invesco V.I. Equity and Income Fund
| Unrealized Appreciation (Depreciation) of Investments on a Tax Basis |
| Aggregate unrealized appreciation of investments | $200,641,419 |
| Aggregate unrealized (depreciation) of investments | (38,208,287) |
| Net unrealized appreciation of investments | $162,433,132 |
Cost of investments for tax purposes is $1,084,335,744.
NOTE 9—Share Information
| | Summary of Share Activity |
| | Six months ended
June 30, 2019(a) | | Year ended
December 31, 2018 |
| | Shares | Amount | | Shares | Amount |
| Sold: | | | | | |
| Series I | 270,925 | $4,746,035 | | 986,810 | $18,720,753 |
| Series II | 8,704,941 | 154,645,380 | | 3,896,513 | 72,253,278 |
| Issued as reinvestment of dividends: | | | | | |
| Series I | — | — | | 665,147 | 12,212,096 |
| Series II | — | — | | 4,562,665 | 83,405,521 |
| Reacquired: | | | | | |
| Series I | (7,753,631) | (137,349,430) | | (1,063,169) | (19,978,101) |
| Series II | (7,341,714) | (128,493,363) | | (16,614,655) | (299,472,936) |
| Net increase (decrease) in share activity | (6,119,479) | $(106,451,378) | | (7,566,689) | $(132,859,389) |
| (a) | There are entities that are record owners of more than 5% of the outstanding shares of the Fund and in the aggregate own 73% of the outstanding shares of the Fund. The Fund and the Fund’s principal underwriter or adviser, are parties to participation agreements with these entities whereby these entities sell units of interest in separate accounts funding variable products that are invested in the Fund. The Fund, Invesco and/or Invesco affiliates may make payments to these entities, which are considered to be related to the Fund, for providing services to the Fund, Invesco and/or Invesco affiliates including but not limited to services such as, securities brokerage, third party record keeping and account servicing and administrative services. The Fund has no knowledge as to whether all or any portion of the shares owned of record by these entities are also owned beneficially. |
Invesco V.I. Equity and Income Fund
Calculating your ongoing Fund expenses
Example
As a shareholder of the Fund, you incur ongoing costs, including management fees; distribution and/or service fees (12b-1); and other Fund expenses. This example is intended to help you understand your ongoing costs (in dollars) of investing in the Fund and to compare these costs with ongoing costs of investing in other mutual funds. The example is based on an investment of $1,000 invested at the beginning of the period and held for the entire period January 1, 2019 through June 30, 2019.
The actual and hypothetical expenses in the examples below do not represent the effect of any fees or other expenses assessed in connection with a variable product; if they did, the expenses shown would be higher while the ending account values shown would be lower.
Actual expenses
The table below provides information about actual account values and actual expenses. You may use the information in this table, together with the amount you invested, to estimate the expenses that you paid over the period. Simply divide your account value by $1,000 (for example, an $8,600 account value divided by $1,000 = 8.6), then multiply the result by the number in the table under the heading entitled “Actual Expenses Paid During Period” to estimate the expenses you paid on your account during this period.
Hypothetical example for comparison purposes
The table below also provides information about hypothetical account values and hypothetical expenses based on the Fund’s actual expense ratio and an assumed rate of return of 5% per year before expenses, which is not the Fund’s actual return.
The hypothetical account values and expenses may not be used to estimate the actual ending account balance or expenses you paid for the period. You may use this information to compare the ongoing costs of investing in the Fund and other funds. To do so, compare this 5% hypothetical example with the 5% hypothetical examples that appear in the shareholder reports of the other funds.
Please note that the expenses shown in the table are meant to highlight your ongoing costs. Therefore, the hypothetical information is useful in comparing ongoing costs, and will not help you determine the relative total costs of owning different funds.
| | Beginning
Account Value (01/01/19) | ACTUAL | HYPOTHETICAL
(5% annual return before
expenses) | Annualized
Expense
Ratio |
Ending
Account Value
(06/30/19)1 | Expenses
Paid During
Period2 | Ending
Account Value
(06/30/19) | Expenses
Paid During
Period2 |
| Series I | $1,000.00 | $1,133.40 | $2.86 | $1,022.12 | $2.71 | 0.54% |
| Series II | 1,000.00 | 1,131.50 | 4.18 | 1,020.88 | 3.96 | 0.79 |
| 1 | The actual ending account value is based on the actual total return of the Fund for the period January 1, 2019 through June 30, 2019, after actual expenses and will differ from the hypothetical ending account value which is based on the Fund’s expense ratio and a hypothetical annual return of 5% before expenses. |
| 2 | Expenses are equal to the Fund’s annualized expense ratio as indicated above multiplied by the average account value over the period, multiplied by 181/365 to reflect the most recent fiscal half year. |
Invesco V.I. Equity and Income Fund
Approval of Investment Advisory andSub-Advisory Contracts
At meetings held on June 10, 2019, the Board of Trustees (the Board or the Trustees) of AIM Variable Insurance Funds (Invesco Variable Insurance Funds) as a whole, and the independent Trustees, who comprise over 75% of the Board, voting separately, approved the continuance of the Invesco V.I. Equity and Income Fund’s (the Fund) Master Investment Advisory Agreement with Invesco Advisers, Inc. (Invesco Advisers and the investment advisory agreement) and the Master IntergroupSub-Advisory Contract for Mutual Funds with Invesco Asset Management Deutschland GmbH, Invesco Asset Management Limited, Invesco Asset Management (Japan) Limited, Invesco Hong Kong Limited, Invesco Senior Secured Management, Inc. and Invesco Canada Ltd. and separatesub-advisory contracts with Invesco Capital Management LLC and Invesco Asset Management (India) Private Limited (collectively, the AffiliatedSub-Advisers and thesub-advisory contracts) for another year, effective July 1, 2019. After evaluating the factors discussed below, among others, the Board approved the renewal of the Fund’s investment advisory agreement and thesub-advisory contracts and determined that the compensation payable by the Fund to Invesco Advisers and by Invesco Advisers to the AffiliatedSub-Advisers is fair and reasonable.
The Board’s Evaluation Process
The Board’s Investments Committee has established threeSub-Committees, which meet throughout the year to review the performance of funds advised by Invesco Advisers (the Invesco Funds). As part of a regularly scheduled basis ofin-person Board meetings, theSub-Committees meet with portfolio managers for their assigned Invesco Funds and other members of management to review detailed information about investment performance and portfolio attributes of these funds. The Board took into account evaluations and reports that it received from the Investments Committee andSub-Committees, as well as the information provided to such committees and the Board throughout the year, in considering whether to approve each Invesco Fund’s investment advisory agreement andsub-advisory contracts.
As part of the contract renewal process, the Board reviews and considers information provided in response to detailed requests for information submitted to management by the independent Trustees with assistance from legal counsel to the independent Trustees. The Board receives comparative investment performance and fee data regarding the Invesco Funds prepared by Invesco Advisers and Broadridge Financial Solutions, Inc. (Broadridge), an independent mutual fund data provider. The Board also receives an independent written evaluation from the Senior Officer, an officer of the Invesco Funds who reports directly to the
independent Trustees. The Senior Officer’s evaluation is prepared as part of his responsibility to manage the process by which the Invesco Funds’ proposed management fees are negotiated during the annual contract renewal process to ensure they are negotiated in a manner that is at arms’ length and reasonable. In addition to meetings with Invesco Advisers and fund counsel throughout the year, the independent Trustees also discuss the continuance of the investment advisory agreement andsub-advisory contracts in separate sessions with the Senior Officer and with independent legal counsel.
The discussion below is a summary of the Senior Officer’s independent written evaluation with respect to the Fund’s investment advisory agreement, as well as a discussion of the material factors and related conclusions that formed the basis for the Board’s approval of the Fund’s investment advisory agreement andsub-advisory contracts. The Trustees’ review and conclusions are based on the comprehensive consideration of all information presented to them during the course of the year and in prior years and are not the result of any single determinative factor. Moreover, one Trustee may have weighed a particular piece of information or factor differently than another Trustee. This information is current as of June 10, 2019.
Factors and Conclusions and Summary of Independent Written Fee Evaluation
| A. | Nature, Extent and Quality of Services Provided by Invesco Advisers and the AffiliatedSub-Advisers |
The Board reviewed the nature, extent and quality of the advisory services provided to the Fund by Invesco Advisers under the Fund’s investment advisory agreement, and the credentials and experience of the officers and employees of Invesco Advisers who provide these services, including the Fund’s portfolio manager(s). The Board’s review included consideration of Invesco Advisers’ investment process oversight and structure, credit analysis and investment risk management. The Board also considerednon-advisory services that Invesco Advisers and its affiliates provide to the Invesco Funds such as various back office support functions, third party oversight, internal audit, valuation, portfolio trading and legal and compliance. The Board also received and reviewed information about Invesco Advisers’ role as administrator of the Invesco Funds’ liquidity risk management program. The Board also reviewed and considered the benefits to shareholders of investing in a fund that is part of the Invesco family of funds under the umbrella of Invesco Ltd., Invesco Advisers’ parent company, and noted Invesco Ltd.’s depth and experience in conducting an investment management business, as well as its
commitment of financial and other resources to such business. The Board reviewed and considered information about the resources that Invesco Advisers intends to continue to commit to managing the Invesco family of funds following Invesco Ltd.’s acquisition of OppenheimerFunds, Inc. and its subsidiaries. The Board concluded that the nature, extent and quality of the services provided to the Fund by Invesco Advisers are appropriate and satisfactory.
The Board reviewed the services that may be provided by the AffiliatedSub-Advisers under thesub-advisory contracts and the credentials and experience of the officers and employees of the AffiliatedSub-Advisers who provide these services. The Board noted the AffiliatedSub-Advisers’ expertise with respect to certain asset classes and that the AffiliatedSub-Advisers have offices and personnel that are located in financial centers around the world. As a result, the Board noted that the AffiliatedSub-Advisers can provide research and investment analysis on the markets and economies of various countries in which the Fund may invest, make recommendations regarding securities and assist with security trades. The Board concluded that thesub-advisory contracts may benefit the Fund and its shareholders by permitting Invesco Advisers to use the resources and talents of the AffiliatedSub-Advisers in managing the Fund. The Board concluded that the nature, extent and quality of the services that may be provided by the AffiliatedSub-Advisers are appropriate and satisfactory.
| B. | Fund Investment Performance |
The Board considered Fund investment performance as a relevant factor in considering whether to approve the investment advisory agreement. The Board did not view Fund investment performance as a relevant factor in considering whether to approve thesub-advisory contracts for the Fund, as no AffiliatedSub-Adviser currently manages assets of the Fund.
The Board compared the Fund’s investment performance over multiple time periods ending December 31, 2018 to the performance of funds in the Broadridge performance universe and against the Lipper Variable Underlying Funds Mixed-Asset Target Allocation Growth Funds Index. The Board noted that performance of Series II shares of the Fund was in the fifth quintile of its performance universe for the one year period and the third quintile for the three and five year periods (the first quintile being the best performing funds and the fifth quintile being the worst performing funds). The Board noted that performance of Series II shares of the Fund was below the performance of the Index for the one and three year periods and reasonably comparable to the performance of the Index for the five year period. The Board
Invesco V.I. Equity and Income Fund
noted that the Fund’s value style of equity investing compared to its peers, including its underweight exposure to technology stocks and its overweight exposure to energy stocks, negatively impacted relative performance. The Trustees also reviewed more recent Fund performance and this review did not change their conclusions.
| C. | Advisory andSub-Advisory Fees and Fund Expenses |
The Board compared the Fund’s contractual management fee rate to the contractual management fee rates of funds in the Fund’s Broadridge expense group. The Board noted that the contractual management fee rate for Series II shares of the Fund was below the median contractual management fee rate of funds in its expense group. The Board noted that the term “contractual management fee” for funds in the expense group may include both advisory and certainnon-portfolio management administrative services fees, but that Broadridge does not provide information on a fund by fund basis as to what is included. The Board also reviewed the methodology used by Broadridge in providing expense group information, which includes using each fund’s contractual management fee schedule (including any applicable breakpoints) as reported in the most recent prospectus or statement of additional information for each fund in the expense group. The Board also considered comparative information regarding the Fund’s total expense ratio and its various components.
The Board noted that Invesco Advisers has contractually agreed to waive fees and/or limit expenses of the Fund for the term disclosed in the Fund’s registration statement in an amount necessary to limit total annual operating expenses to a specified percentage of average daily net assets for each class of the Fund.
The Board also considered the fees charged by Invesco Advisers and the AffiliatedSub-Advisers to other similarly managed client accounts. The Board noted that Invesco Advisers or the AffiliatedSub-Advisers may charge lower fees to large institutional clients. Invesco Advisers reviewed with the Board differences in the scope of services it provides to the Invesco Funds relative to certain other types of client accounts, including management of cash flows as a result of redemptions and purchases, necessary infrastructure such as officers, office space, technology, legal and distribution, oversight of service providers, costs and business risks associated with launching new funds and sponsoring and maintaining the product line, preparation of annual registration statement updates and financial information and compliance with federal and state laws and regulations.
The Board also compared the Fund’s effective advisory fee rate (the advisory fee rate after advisory fee waivers and before other expense limitations/waivers) to the effective advisory fee rates of other similarly managed third-party mutual funds advised orsub-advised by Invesco
Advisers and its affiliates, based on asset balances as of December 31, 2018.
The Board also considered the services that may be provided by the AffiliatedSub-Advisers pursuant to thesub-advisory contracts, as well as the fees payable by Invesco Advisers to the AffiliatedSub-Advisers pursuant to thesub-advisory contracts.
| D. | Economies of Scale and Breakpoints |
The Board considered the extent to which there may be economies of scale in the provision of advisory services to the Fund. The Board considered Invesco’s reinvestment in its business, including investments in business infrastructure and cybersecurity. The Board also considered that the Fund benefits from economies of scale through contractual breakpoints in the Fund’s advisory fee schedule, which generally operate to reduce the Fund’s expense ratio as it grows in size. The Board noted that the Fund shares directly in economies of scale through lower fees charged by third party service providers based on the combined size of the Invesco Funds. The Board noted that the Fund may also benefit from economies of scale through initial fee setting, fee waivers and expense reimbursements.
| E. | Profitability and Financial Resources |
The Board reviewed information from Invesco Advisers concerning the costs of the advisory and other services that Invesco Advisers and its affiliates provide to the Fund and the Invesco Funds and the profitability of Invesco Advisers and its affiliates in providing these services. The Board considered the methodology used for calculating profitability and noted the periodic review of such methodology by an independent consultant. The Board noted that Invesco Advisers continues to operate at a net profit from services Invesco Advisers and its affiliates provide to the Invesco Funds and the Fund. The Board did not deem the level of profits realized by Invesco Advisers and its affiliates from providing services to the Fund to be excessive given the nature, extent and quality of the services provided. The Board received information from Invesco Advisers demonstrating that Invesco Advisers and the AffiliatedSub-Advisers are financially sound and have the resources necessary to perform their obligations under the investment advisory agreement andsub-advisory contracts.
| F. | Collateral Benefits to Invesco Advisers and its Affiliates |
The Board considered various other benefits received by Invesco Advisers and its affiliates from the relationship with the Fund, including the fees received for providing administrative, transfer agency and distribution services to the Fund. The Board considered comparative information regarding fees charged for these services, including information provided by Broadridge and other independent sources. The Board considered the performance of Invesco Advisers and its affiliates in providing these services and the organizational structure employed to provide these services. The Board also considered that these services are provided
to the Fund pursuant to written contracts that are reviewed and approved on an annual basis by the Board; and that the services are required for the operation of the Fund.
The Board considered the benefits realized by Invesco Advisers and the AffiliatedSub-Advisers as a result of portfolio brokerage transactions executed through “soft dollar” arrangements. The Board noted that soft dollar arrangements may result in the Fund bearing costs to purchase research that may be used by Invesco Advisers or the AffiliatedSub-Advisers with other clients and may reduce Invesco Advisers’ or the AffiliatedSub-Advisers’ expenses. The Board also considered that it receives periodic reports from Invesco representing that these arrangements are consistent with regulatory requirements. The Board did not deem the soft dollar arrangements to be inappropriate.
The Board considered that the Fund’s uninvested cash and cash collateral from any securities lending arrangements may be invested in money market funds advised by Invesco Advisers pursuant to procedures approved by the Board. The Board considered information regarding the returns of the affiliated money market funds relative to comparable overnight investments, as well as the costs to the Fund of such investments. The Board noted that Invesco Advisers receives advisory fees from these affiliated money market funds attributable to such investments, although Invesco Advisers has contractually agreed to waive through varying periods the advisory fees payable by the Invesco Funds with respect to certain investments in the affiliated money market funds. The waiver is in an amount equal to 100% of the net advisory fee Invesco Advisers receives from the affiliated money market funds with respect to the Fund’s investment in the affiliated money market funds of uninvested cash, but not cash collateral. The Board concluded that the amount of advisory fees received by Invesco Advisers from the Fund’s investment of cash collateral from any securities lending arrangements in the affiliated money market funds is fair and reasonable.
The Board also considered that an affiliated broker may receive commissions for executing certain trades for the Fund. Invesco Advisers and the AffiliatedSub-Advisers may use the affiliated broker to, among other things, control order routing and minimize information leakage, and the Board was advised that such trades are executed in compliance with rules under the federal securities laws and consistent with best execution obligations.
Invesco V.I. Equity and Income Fund
| Semiannual Report to Shareholders | June 30, 2019 |
Invesco V.I. Global Core Equity Fund
Beginning on January 1, 2021, as permitted by regulations adopted by the Securities and Exchange Commission, the insurance company that offers your variable annuity or variable life insurance contract may no longer send you paper copies of the Fund’s shareholder reports by mail, unless you specifically request paper copies of the reports from the insurance company or your financial intermediary. Instead of delivering paper copies of the report, the insurance company may choose to make the reports available on a website, and will notify you by mail each time a report is posted and provide you with a website link to access the report. Instructions for requesting paper copies will be provided by your insurance company.
If the insurance company offers electronic delivery, you may elect to receive shareholder reports and other communications about the Fund electronically by following the instructions provided by the insurance company or by contacting your financial intermediary. If you already elected to receive shareholder reports electronically, you will not be affected by this change and you need not take any action.
You may elect to receive all future reports in paper free of charge from the insurance company. You can inform the insurance company or your financial intermediary that you wish to continue receiving paper copies of your shareholder reports by following the instructions provided by the insurance company or by contacting your financial intermediary. Your election to receive reports in paper will apply to all portfolio companies available under your contract with the insurance company.
The Fund provides a complete list of its holdings four times in each fiscal year, at the quarter-ends. For the second and fourth quarters, the lists appear in the Fund’s semiannual and annual reports to shareholders. For the first and third quarters, the Fund files the lists with the Securities and Exchange Commission (SEC) on Form N-Q (or any successor Form). The Fund’s Form N-Q (or any successor Form) filings are available on the SEC website, sec.gov. The SEC file numbers for the Fund are 811-07452 and 033-57340. The Fund’s most recent portfolio holdings, as filed on Form N-Q (or any successor Form), have also been made available to insurance companies issuing variable annuity contracts and variable life insurance policies (“variable products”) that invest in the Fund.
A description of the policies and procedures that the Fund uses to determine how to vote proxies relating to portfolio securities is available without charge, upon request, from our Client Services department at 800 959 4246 or at invesco.com/proxyguidelines. The information is also available on the SEC website, sec.gov.
Information regarding how the Fund voted proxies related to its portfolio securities during the most recent 12-month period ended June 30 is available at invesco.com/proxysearch. The information is also available on the SEC website, sec.gov.
Invesco Advisers, Inc. is an investment adviser; it provides investment advisory services to individual and institutional clients and does not sell securities. Invesco Distributors, Inc. is the US distributor for Invesco Ltd.’s retail mutual funds, exchange-traded funds and institutional money market funds. Both are wholly owned, indirect subsidiaries of Invesco Ltd.
This report must be accompanied or preceded by a currently effective Fund prospectus and variable product prospectus, which contain more complete information, including sales charges and expenses. Investors should read each carefully before investing.
NOT FDIC INSURED | MAY LOSE VALUE | NO BANK GUARANTEE
| Invesco Distributors, Inc. | VIGCE-SAR-1 |
Performance summary
Fund vs. Indexes
Cumulative total returns, December 31, 2018 to June 30, 2019, excluding variable product issuer charges. If variable product issuer charges were included, returns would be lower.
| Series I Shares | 15.24% |
| Series II Shares | 15.13 |
| MSCI World Index▼ (Broad Market/Style-Specific Index) | 16.98 |
Lipper VUF Global Multi-Cap Value Funds Classification Average■
(Peer Group) | 10.94 |
| Source(s):▼RIMES Technologies Corp.;■ Lipper Inc. |
TheMSCI World IndexSM is an unmanaged index considered representative of stocks of developed countries. The index is computed using the net return, which withholds applicable taxes for non-resident investors.
TheLipper VUF Global Multi-Cap Value Funds Classification Average represents an average of all variable insurance underlying funds in the Lipper Global Multi Cap Value Funds classification.
The Fund is not managed to track the performance of any particular index, including the indexes described here, and consequently, the performance of the Fund may deviate significantly from the performance of the indexes.
A direct investment cannot be made in an index. Unless otherwise indicated, index results include reinvested dividends, and they do not reflect sales charges. Performance of the peer group, if applicable, reflects fund expenses; performance of a market index does not.
| Average Annual Total Returns |
| As of 6/30/19 |
| Series I Shares | |
| Inception (1/2/97) | 4.97% |
| 10 Years | 7.48 |
| 5 Years | 3.93 |
| 1 Year | 0.40 |
| Series II Shares | |
| 10 Years | 7.21% |
| 5 Years | 3.70 |
| 1 Year | 0.22 |
Effective June 1, 2010, Class I shares of the predecessor fund, Universal Funds Global Value Equity Portfolio, advised by Morgan Stanley Investment Management Inc. were reorganized into Series I shares of Invesco Van Kampen V.I. Global Value Equity Fund (renamed Invesco V.I. Global Core Equity Fund on April 30, 2012). Returns shown above, prior to June 1, 2010, for Series I shares are blended returns of the predecessor fund and Invesco V.I. Global Value Equity Fund. Share class returns will differ from the predecessor fund because of different expenses.
Series II shares incepted on June 1, 2010. Series II share performance shown prior to that date is that of the predecessor fund’s Class I shares restated to reflect the higher 12b-1 fees applicable to Series II shares.
The performance data quoted represent past performance and cannot guarantee comparable future results; current performance may be lower or higher. Please contact your variable product issuer or financial adviser for
the most recent month-end variable product performance. Performance figures reflect Fund expenses, reinvested distributions and changes in net asset value. Performance figures do not reflect deduction of taxes a shareholder would pay on Fund distributions or sale of Fund shares. Investment return and principal value will fluctuate so that you may have a gain or loss when you sell shares.
The total annual Fund operating expense ratio set forth in the most recent Fund prospectus as of the date of this report for Series I and Series II shares was 1.02% and 1.27%, respectively. The expense ratios presented above may vary from the expense ratios presented in other sections of this report that are based on expenses incurred during the period covered by this report.
Invesco V.I. Global Core Equity Fund, a series portfolio of AIM Variable Insurance Funds (Invesco Variable Insurance Funds), is currently offered through insurance companies issuing
variable products. You cannot purchase shares of the Fund directly. Performance figures given represent the Fund and are not intended to reflect actual variable product values. They do not reflect sales charges, expenses and fees assessed in connection with a variable product. Sales charges, expenses and fees, which are determined by the variable product issuers, will vary and will lower the total return.
The most recent month-end performance at the Fund level, excluding variable product charges, is available at 800 451 4246. As mentioned above, for the most recent month-end performance including variable product charges, please contact your variable product issuer or financial adviser.
Fund performance reflects any applicable fee waivers and/or expense reimbursements. Had the adviser not waived fees and/or reimbursed expenses currently or in the past, returns would have been lower. See current prospectus for more information.
Invesco V.I. Global Core Equity Fund
Schedule of Investments
June 30, 2019
(Unaudited)
| | Shares | Value |
| Common Stocks & Other Equity Interests–100.22% |
| Australia–1.29% |
| Rio Tinto plc | 14,477 | $893,159 |
| Brazil–1.40% |
| Pagseguro Digital Ltd., Class A(a) | 24,885 | 969,768 |
| China–0.84% |
| Baidu, Inc., ADR(a) | 4,944 | 580,228 |
| Denmark–2.48% |
| AP Moller - Maersk A/S, Class B | 530 | 657,735 |
| Drilling Co. of 1972 A/S (The)(a) | 1,060 | 82,475 |
| Novo Nordisk A/S, Class B | 19,262 | 982,550 |
| | | | 1,722,760 |
| Germany–5.73% |
| Infineon Technologies AG | 24,987 | 441,572 |
| KION Group AG | 13,845 | 872,800 |
| SAP S.E. | 6,191 | 851,022 |
| Siemens AG | 15,251 | 1,812,805 |
| | | | 3,978,199 |
| Hong Kong–2.53% |
| AIA Group Ltd. | 162,200 | 1,753,486 |
| Ireland–0.99% |
| James Hardie Industries PLC | 52,239 | 687,182 |
| Italy–5.75% |
| Banca Mediolanum S.p.A. | 111,740 | 822,710 |
| Enel S.p.A. | 315,386 | 2,203,678 |
| Prysmian S.p.A. | 46,708 | 963,977 |
| | | | 3,990,365 |
| Japan–13.43% |
| Asahi Group Holdings, Ltd. | 37,900 | 1,707,897 |
| FANUC Corp. | 2,000 | 371,268 |
| Hitachi, Ltd. | 31,000 | 1,139,311 |
| KDDI Corp. | 48,200 | 1,227,971 |
| Komatsu Ltd. | 51,600 | 1,250,431 |
| Nissan Chemical Corp. | 5,600 | 252,869 |
| Shimano, Inc. | 7,900 | 1,173,835 |
| SoftBank Group Corp. | 45,600 | 2,197,406 |
| | | | 9,320,988 |
| Netherlands–2.57% |
| Heineken N.V. | 8,768 | 978,685 |
| ING Groep N.V. | 69,659 | 807,762 |
| | | | 1,786,447 |
| Singapore–1.42% |
| DBS Group Holdings Ltd. | 51,300 | 984,786 |
| | Shares | Value |
| South Korea–0.59% |
| Samsung Electronics Co., Ltd. | 10,079 | $410,941 |
| Sweden–1.33% |
| Svenska Handelsbanken AB, Class A | 93,468 | 925,346 |
| Switzerland–1.92% |
| Glencore PLC(a) | 181,081 | 630,112 |
| UBS Group AG(a) | 59,135 | 702,793 |
| | | | 1,332,905 |
| Taiwan–0.88% |
| Taiwan Semiconductor Manufacturing Co., Ltd. | 80,000 | 610,283 |
| United Kingdom–10.53% |
| Imperial Brands PLC | 44,456 | 1,043,838 |
| Just Eat PLC(a) | 98,630 | 783,214 |
| Nomad Foods Ltd.(a) | 67,831 | 1,448,870 |
| Reckitt Benckiser Group PLC | 4,016 | 317,374 |
| Royal Dutch Shell PLC, Class A, ADR | 36,853 | 2,398,025 |
| St. James’s Place PLC | 94,112 | 1,314,819 |
| | | | 7,306,140 |
| United States–46.54% |
| Activision Blizzard, Inc. | 10,545 | 497,724 |
| Allergan PLC | 4,881 | 817,226 |
| Alphabet, Inc., Class C(a) | 1,827 | 1,974,823 |
| American Express Co. | 15,619 | 1,928,009 |
| Aptiv PLC | 10,561 | 853,646 |
| Biogen, Inc.(a) | 3,076 | 719,384 |
| BioMarin Pharmaceutical, Inc.(a) | 7,875 | 674,494 |
| Booking Holdings, Inc.(a) | 438 | 821,123 |
| Carnival Corp. | 23,610 | 1,099,045 |
| Chevron Corp. | 16,961 | 2,110,627 |
| Colfax Corp.(a) | 11,994 | 336,192 |
| Comcast Corp., Class A | 36,617 | 1,548,167 |
| Concho Resources, Inc. | 10,438 | 1,076,993 |
| Delta Air Lines, Inc. | 24,789 | 1,406,776 |
| EPAM Systems, Inc.(a) | 6,212 | 1,075,297 |
| Facebook, Inc., Class A(a) | 4,938 | 953,034 |
| FedEx Corp. | 4,018 | 659,715 |
| First Republic Bank | 18,545 | 1,810,919 |
| Globus Medical, Inc., Class A(a) | 8,456 | 357,689 |
| HCA Healthcare, Inc. | 6,358 | 859,411 |
| Marsh & McLennan Cos., Inc. | 8,882 | 885,979 |
| Mastercard, Inc., Class A | 2,781 | 735,658 |
| Moody’s Corp. | 2,816 | 549,993 |
| NIKE, Inc., Class B | 11,649 | 977,933 |
| PepsiCo, Inc. | 10,522 | 1,379,750 |
| Progressive Corp. (The) | 8,077 | 645,595 |
| salesforce.com, inc.(a) | 2,193 | 332,744 |
See accompanying Notes to Financial Statements which are an integral part of the financial statements.
Invesco V.I. Global Core Equity Fund
| | Shares | Value |
| United States–(continued) |
| Texas Instruments, Inc. | 3,112 | $357,133 |
| U.S. Bancorp | 18,125 | 949,750 |
| United Technologies Corp. | 7,659 | 997,202 |
| Verizon Communications, Inc. | 21,632 | 1,235,836 |
| Wynn Resorts, Ltd. | 8,287 | 1,027,505 |
| Zimmer Biomet Holdings, Inc. | 5,446 | 641,216 |
| | | | 32,296,588 |
| TOTAL INVESTMENTS IN SECURITIES—100.22% (Cost $61,000,284) | 69,549,571 |
| OTHER ASSETS LESS LIABILITIES–(0.22)% | (154,189) |
| NET ASSETS–100.00% | $69,395,382 |
Investment Abbreviations:
| ADR | – American Depositary Receipt |
Notes to Schedule of Investments:
| (a) | Non-income producing security. |
| Open Forward Foreign Currency Contracts |
Settlement
Date | Counterparty | Contract to | Unrealized
Appreciation
(Depreciation) |
| Deliver | Receive |
| Currency Risk | | | | | | |
| 08/15/2019 | JPMorgan Chase Bank, N.A. | JPY | 202,000,000 | USD | 1,864,275 | $(15,462) |
| Abbreviations: |
| JPY | – Japanese Yen |
| USD | – U.S. Dollar |
Portfolio Composition
By country, based on Total Investments
as of June 30, 2019
| United States | 46.44% |
| Japan | 13.40 |
| United Kingdom | 10.50 |
| Italy | 5.74 |
| Germany | 5.72 |
| Netherlands | 2.57 |
| Hong Kong | 2.52 |
| Denmark | 2.48 |
| Other Countries, Each Less than 2% of Portfolio | 10.63 |
See accompanying Notes to Financial Statements which are an integral part of the financial statements.
Invesco V.I. Global Core Equity Fund
Statement of Assets and Liabilities
June 30, 2019
(Unaudited)
| Assets: | |
Investments in securities, at value
(Cost $61,000,284) | $69,549,571 |
| Foreign currencies, at value (Cost $153,304) | 153,201 |
| Receivable for: | |
| Investments sold | 53 |
| Dividends | 92,179 |
| Investment for trustee deferred compensation and retirement plans | 41,747 |
| Total assets | 69,836,751 |
| Liabilities: | |
| Other investments: | |
| Unrealized depreciation on forward foreign currency contracts outstanding | 15,462 |
| Payable for: | |
| Investments purchased | 132,626 |
| Fund shares reacquired | 108,754 |
| Amount due custodian | 70,317 |
| Accrued fees to affiliates | 34,575 |
| Accrued trustees’ and officers’ fees and benefits | 447 |
| Accrued other operating expenses | 34,883 |
| Trustee deferred compensation and retirement plans | 44,305 |
| Total liabilities | 441,369 |
| Net assets applicable to shares outstanding | $69,395,382 |
| Net assets consist of: | |
| Shares of beneficial interest | $55,710,146 |
| Distributable earnings | 13,685,236 |
| | $69,395,382 |
| Net Assets: |
| Series I | $58,972,674 |
| Series II | $10,422,708 |
| Shares outstanding, no par value, with an unlimited number of shares authorized: |
| Series I | 5,693,259 |
| Series II | 1,007,294 |
| Series I: | |
| Net asset value per share | $10.36 |
| Series II: | |
| Net asset value per share | $10.35 |
Statement of Operations
For the six months ended June 30, 2019
(Unaudited)
| Investment income: | |
| Dividends (net of foreign withholding taxes of $77,433) | $1,099,224 |
| Dividends from affiliated money market funds (includes securities lending income of $262) | 1,597 |
| Total investment income | 1,100,821 |
| Expenses: | |
| Advisory fees | 231,906 |
| Administrative services fees | 56,771 |
| Custodian fees | 6,587 |
| Distribution fees - Series II | 12,933 |
| Transfer agent fees | 7,434 |
| Trustees’ and officers’ fees and benefits | 11,887 |
| Reports to shareholders | 8,121 |
| Professional services fees | 30,670 |
| Other | 3,620 |
| Total expenses | 369,929 |
| Less: Fees waived | (90) |
| Net expenses | 369,839 |
| Net investment income | 730,982 |
| Realized and unrealized gain (loss) from: | |
| Net realized gain (loss) from: | |
| Investment securities | (986,598) |
| Foreign currencies | 1,806 |
| Forward foreign currency contracts | (36,264) |
| | (1,021,056) |
| Change in net unrealized appreciation of: | |
| Investment securities | 9,934,187 |
| Foreign currencies | 230 |
| Forward foreign currency contracts | 32,048 |
| | 9,966,465 |
| Net realized and unrealized gain | 8,945,409 |
| Net increase in net assets resulting from operations | $9,676,391 |
See accompanying Notes to Financial Statements which are an integral part of the financial statements.
Invesco V.I. Global Core Equity Fund
Statement of Changes in Net Assets
For the six months ended June 30, 2019 and the year ended December 31, 2018
(Unaudited)
| | June 30,
2019 | December 31,
2018 |
| Operations: | | |
| Net investment income | $730,982 | $922,275 |
| Net realized gain (loss) | (1,021,056) | 4,749,812 |
| Change in net unrealized appreciation (depreciation) | 9,966,465 | (17,548,034) |
| Net increase (decrease) in net assets resulting from operations | 9,676,391 | (11,875,947) |
| Distributions to shareholders from distributable earnings: | | |
| Series I | — | (726,931) |
| Series II | — | (93,313) |
| Total distributions from distributable earnings | — | (820,244) |
| Share transactions–net: | | |
| Series I | (4,122,518) | (8,045,844) |
| Series II | (628,122) | (1,547,564) |
| Net increase (decrease) in net assets resulting from share transactions | (4,750,640) | (9,593,408) |
| Net increase (decrease) in net assets | 4,925,751 | (22,289,599) |
| Net assets: | | |
| Beginning of period | 64,469,631 | 86,759,230 |
| End of period | $69,395,382 | $64,469,631 |
See accompanying Notes to Financial Statements which are an integral part of the financial statements.
Invesco V.I. Global Core Equity Fund
Financial Highlights
June 30, 2019
(Unaudited)
The following schedule presents financial highlights for a share of the Fund outstanding throughout the periods indicated.
| | Net asset
value,
beginning
of period | Net
investment
income(a) | Net gains
(losses)
on securities
(both
realized and
unrealized) | Total from
investment
operations | Dividends
from net
investment
income | Distributions
from net
realized
gains | Total
distributions | Net asset
value, end
of period | Total
return(b) | Net assets,
end of period
(000’s omitted) | Ratio of
expenses
to average
net assets
with fee waivers
and/or expenses
absorbed | Ratio of
expenses
to average net
assets without
fee waivers
and/or expenses
absorbed | Ratio of net
investment
income
to average
net assets | Portfolio
turnover(c) |
| Series I |
| Six months ended 06/30/19 | $8.99 | $0.11 | $1.26 | $1.37 | $— | $— | $— | $10.36 | 15.24% | $58,973 | 1.03%(d) | 1.03%(d) | 2.15%(d) | 9% |
| Year ended 12/31/18 | 10.73 | 0.13 | (1.76) | (1.63) | (0.11) | — | (0.11) | 8.99 | (15.32) | 54,854 | 1.02 | 1.02 | 1.19 | 26 |
| Year ended 12/31/17 | 8.83 | 0.09 | 1.93 | 2.02 | (0.12) | — | (0.12) | 10.73 | 22.90 | 73,716 | 1.04 | 1.04 | 0.95 | 69 |
| Year ended 12/31/16 | 8.35 | 0.10 | 0.47 | 0.57 | (0.09) | — | (0.09) | 8.83 | 6.81 | 62,130 | 1.05 | 1.05 | 1.14 | 47 |
| Year ended 12/31/15 | 8.94 | 0.09 | (0.23) | (0.14) | (0.13) | (0.32) | (0.45) | 8.35 | (1.42) | 65,167 | 1.06 | 1.06 | 0.98 | 75 |
| Year ended 12/31/14 | 9.06 | 0.12 | (0.05) | 0.07 | (0.19) | — | (0.19) | 8.94 | 0.69 | 73,816 | 1.06 | 1.06 | 1.26 | 123 |
| Series II |
| Six months ended 06/30/19 | 8.99 | 0.09 | 1.27 | 1.36 | — | — | — | 10.35 | 15.13 | 10,423 | 1.28(d) | 1.28(d) | 1.90(d) | 9 |
| Year ended 12/31/18 | 10.73 | 0.10 | (1.75) | (1.65) | (0.09) | — | (0.09) | 8.99 | (15.54) | 9,616 | 1.27 | 1.27 | 0.94 | 26 |
| Year ended 12/31/17 | 8.83 | 0.07 | 1.92 | 1.99 | (0.09) | — | (0.09) | 10.73 | 22.60 | 13,043 | 1.29 | 1.29 | 0.70 | 69 |
| Year ended 12/31/16 | 8.35 | 0.07 | 0.47 | 0.54 | (0.06) | — | (0.06) | 8.83 | 6.50 | 12,302 | 1.30 | 1.30 | 0.89 | 47 |
| Year ended 12/31/15 | 8.93 | 0.07 | (0.23) | (0.16) | (0.10) | (0.32) | (0.42) | 8.35 | (1.65) | 13,286 | 1.31 | 1.31 | 0.73 | 75 |
| Year ended 12/31/14 | 9.04 | 0.10 | (0.05) | 0.05 | (0.16) | — | (0.16) | 8.93 | 0.48 | 16,010 | 1.31 | 1.31 | 1.01 | 123 |
| (a) | Calculated using average shares outstanding. |
| (b) | Includes adjustments in accordance with accounting principles generally accepted in the United States of America and as such, the net asset value for financial reporting purposes and the returns based upon those net asset values may differ from the net asset value and returns for shareholder transactions. Total returns are not annualized for periods less than one year, if applicable, and do not reflect charges assessed in connection with a variable product, which if included would reduce total returns. |
| (c) | Portfolio turnover is calculated at the fund level and is not annualized for periods less than one year, if applicable. |
| (d) | Ratios are annualized and based on average daily net assets (000’s omitted) of $59,367 and $10,432 for Series I and Series II shares, respectively. |
See accompanying Notes to Financial Statements which are an integral part of the financial statements.
Invesco V.I. Global Core Equity Fund
Notes to Financial Statements
June 30, 2019
(Unaudited)
NOTE 1—Significant Accounting Policies
Invesco V.I. Global Core Equity Fund (the “Fund”) is a series portfolio of AIM Variable Insurance Funds (Invesco Variable Insurance Funds) (the “Trust”). The Trust is a Delaware statutory trust registered under the Investment Company Act of 1940, as amended (the “1940 Act”), as an open-end series management investment company. Information presented in these financial statements pertains only to the Fund. Matters affecting the Fund or each class will be voted on exclusively by the shareholders of the Fund or each class. Current Securities and Exchange Commission (“SEC”) guidance, however, requires participating insurance companies offering separate accounts to vote shares proportionally in accordance with the instructions of the contract owners whose investments are funded by shares of each Fund or class.
The Fund’s investment objective is long-term capital appreciation by investing primarily in equity securities of issuers throughout the world, including U.S. issuers.
The Fund currently offers two classes of shares, Series I and Series II, both of which are offered to insurance company separate accounts funding variable annuity contracts and variable life insurance policies (“variable products”).
The Fund is an investment company and accordingly follows the investment company accounting and reporting guidance in accordance with Financial Accounting Standards Board Accounting Standards Codification Topic 946,Financial Services – Investment Companies.
The following is a summary of the significant accounting policies followed by the Fund in the preparation of its financial statements.
| A. | Security Valuations — Securities, including restricted securities, are valued according to the following policy. |
A security listed or traded on an exchange (except convertible securities) is valued at its last sales price or official closing price as of the close of the customary trading session on the exchange where the security is principally traded, or lacking any sales or official closing price on a particular day, the security may be valued at the closing bid price on that day. Securities traded in the over-the-counter market are valued based on prices furnished by independent pricing services or market makers. When such securities are valued by an independent pricing service they may be considered fair valued. Futures contracts are valued at the final settlement price set by an exchange on which they are principally traded. Listed options are valued at the mean between the last bid and asked prices from the exchange on which they are principally traded. Options not listed on an exchange are valued by an independent source at the mean between the last bid and asked prices. For purposes of determining net asset value (“NAV”) per share, futures and option contracts generally are valued 15 minutes after the close of the customary trading session of the New York Stock Exchange (“NYSE”).
Investments in open-end and closed-end registered investment companies that do not trade on an exchange are valued at the end-of-day net asset value per share. Investments in open-end and closed-end registered investment companies that trade on an exchange are valued at the last sales price or official closing price as of the close of the customary trading session on the exchange where the security is principally traded.
Debt obligations (including convertible securities) and unlisted equities are fair valued using an evaluated quote provided by an independent pricing service. Evaluated quotes provided by the pricing service may be determined without exclusive reliance on quoted prices, and may reflect appropriate factors such as institution-size trading in similar groups of securities, developments related to specific securities, dividend rate (for unlisted equities), yield (for debt obligations), quality, type of issue, coupon rate (for debt obligations), maturity (for debt obligations), individual trading characteristics and other market data. Pricing services generally value debt obligations assuming orderly transactions of institutional round lot size, but a fund may hold or transact in the same securities in smaller, odd lot sizes. Odd lots often trade at lower prices than institutional round lots. Debt obligations are subject to interest rate and credit risks. In addition, all debt obligations involve some risk of default with respect to interest and/or principal payments.
Foreign securities’ (including foreign exchange contracts) prices are converted into U.S. dollar amounts using the applicable exchange rates as of the close of the NYSE. If market quotations are available and reliable for foreign exchange-traded equity securities, the securities will be valued at the market quotations. Because trading hours for certain foreign securities end before the close of the NYSE, closing market quotations may become unreliable. If between the time trading ends on a particular security and the close of the customary trading session on the NYSE, events occur that the investment adviser determines are significant and make the closing price unreliable, the Fund may fair value the security. If the event is likely to have affected the closing price of the security, the security will be valued at fair value in good faith using procedures approved by the Board of Trustees. Adjustments to closing prices to reflect fair value may also be based on a screening process of an independent pricing service to indicate the degree of certainty, based on historical data, that the closing price in the principal market where a foreign security trades is not the current value as of the close of the NYSE. Foreign securities’ prices meeting the approved degree of certainty that the price is not reflective of current value will be priced at the indication of fair value from the independent pricing service. Multiple factors may be considered by the independent pricing service in determining adjustments to reflect fair value and may include information relating to sector indices, American Depositary Receipts and domestic and foreign index futures. Foreign securities may have additional risks including exchange rate changes, potential for sharply devalued currencies and high inflation, political and economic upheaval, the relative lack of issuer information, relatively low market liquidity and the potential lack of strict financial and accounting controls and standards.
Securities for which market prices are not provided by any of the above methods may be valued based upon quotes furnished by independent sources. The last bid price may be used to value equity securities. The mean between the last bid and asked prices is used to value debt obligations, including corporate loans.
Securities for which market quotations are not readily available or became unreliable are valued at fair value as determined in good faith by or under the supervision of the Trust’s officers following procedures approved by the Board of Trustees. Issuer specific events, market trends, bid/asked quotes of brokers and information providers and other market data may be reviewed in the course of making a good faith determination of a security’s fair value.
The Fund may invest in securities that are subject to interest rate risk, meaning the risk that the prices will generally fall as interest rates rise and, conversely, the prices will generally rise as interest rates fall. Specific securities differ in their sensitivity to changes in interest rates depending on their individual characteristics. Changes in interest rates may result in increased market volatility, which may affect the value and/or liquidity of certain Fund investments.
Invesco V.I. Global Core Equity Fund
Valuations change in response to many factors including the historical and prospective earnings of the issuer, the value of the issuer’s assets, general economic conditions, interest rates, investor perceptions and market liquidity. Because of the inherent uncertainties of valuation, the values reflected in the financial statements may materially differ from the value received upon actual sale of those investments.
| B. | Securities Transactions and Investment Income — Securities transactions are accounted for on a trade date basis. Realized gains or losses on sales are computed on the basis of specific identification of the securities sold. Interest income (net of withholding tax, if any) is recorded on the accrual basis from settlement date. Dividend income (net of withholding tax, if any) is recorded on the ex-dividend date. |
The Fund may periodically participate in litigation related to Fund investments. As such, the Fund may receive proceeds from litigation settlements. Any proceeds received are included in the Statement of Operations as realized gain (loss) for investments no longer held and as unrealized gain (loss) for investments still held.
Brokerage commissions and mark ups are considered transaction costs and are recorded as an increase to the cost basis of securities purchased and/or a reduction of proceeds on a sale of securities. Such transaction costs are included in the determination of net realized and unrealized gain (loss) from investment securities reported in the Statement of Operations and the Statement of Changes in Net Assets and the net realized and unrealized gains (losses) on securities per share in the Financial Highlights. Transaction costs are included in the calculation of the Fund’s net asset value and, accordingly, they reduce the Fund’s total returns. These transaction costs are not considered operating expenses and are not reflected in net investment income reported in the Statement of Operations and the Statement of Changes in Net Assets, or the net investment income per share and the ratios of expenses and net investment income reported in the Financial Highlights, nor are they limited by any expense limitation arrangements between the Fund and the investment adviser.
The Fund allocates income and realized and unrealized capital gains and losses to a class based on the relative net assets of each class.
| C. | Country Determination — For the purposes of making investment selection decisions and presentation in the Schedule of Investments, the investment adviser may determine the country in which an issuer is located and/or credit risk exposure based on various factors. These factors include the laws of the country under which the issuer is organized, where the issuer maintains a principal office, the country in which the issuer derives 50% or more of its total revenues and the country that has the primary market for the issuer’s securities, as well as other criteria. Among the other criteria that may be evaluated for making this determination are the country in which the issuer maintains 50% or more of its assets, the type of security, financial guarantees and enhancements, the nature of the collateral and the sponsor organization. Country of issuer and/or credit risk exposure has been determined to be the United States of America, unless otherwise noted. |
| D. | Distributions– Distributions from net investment income and net realized capital gain, if any, are generally declared and paid to separate accounts of participating insurance companies annually and recorded on the ex-dividend date. |
| E. | Federal Income Taxes –The Fund intends to comply with the requirements of Subchapter M of the Internal Revenue Code of 1986, as amended (the “Internal Revenue Code”), necessary to qualify as a regulated investment company and to distribute substantially all of the Fund’s taxable earnings to shareholders. As such, the Fund will not be subject to federal income taxes on otherwise taxable income (including net realized capital gain) that is distributed to shareholders. Therefore, no provision for federal income taxes is recorded in the financial statements. |
The Fund recognizes the tax benefits of uncertain tax positions only when the position is more likely than not to be sustained. Management has analyzed the Fund’s uncertain tax positions and concluded that no liability for unrecognized tax benefits should be recorded related to uncertain tax positions. Management is not aware of any tax positions for which it is reasonably possible that the total amounts of unrecognized tax benefits will change materially in the next 12 months.
The Fund files tax returns in the U.S. Federal jurisdiction and certain other jurisdictions. Generally, the Fund is subject to examinations by such taxing authorities for up to three years after the filing of the return for the tax period.
| F. | Expenses– Fees provided for under the Rule 12b-1 plan of a particular class of the Fund and which are directly attributable to that class are charged to the operations of such class. All other expenses are allocated among the classes based on relative net assets. |
| G. | Accounting Estimates – The preparation of financial statements in conformity with accounting principles generally accepted in the United States of America (“GAAP”) requires management to make estimates and assumptions that affect the reported amounts of assets and liabilities at the date of the financial statements and the reported amounts of revenues and expenses during the reporting period including estimates and assumptions related to taxation. Actual results could differ from those estimates by a significant amount. In addition, the Fund monitors for material events or transactions that may occur or become known after the period-end date and before the date the financial statements are released to print. |
| H. | Indemnifications – Under the Trust’s organizational documents, each Trustee, officer, employee or other agent of the Trust is indemnified against certain liabilities that may arise out of the performance of their duties to the Fund. Additionally, in the normal course of business, the Fund enters into contracts, including the Fund’s servicing agreements, that contain a variety of indemnification clauses. The Fund’s maximum exposure under these arrangements is unknown as this would involve future claims that may be made against the Fund that have not yet occurred. The risk of material loss as a result of such indemnification claims is considered remote. |
| I. | Securities Lending– The Fund may lend portfolio securities having a market value up to one-third of the Fund’s total assets. Such loans are secured by collateral equal to no less than the market value of the loaned securities determined daily by the securities lending provider. Such collateral will be cash or debt securities issued or guaranteed by the U.S. Government or any of its sponsored agencies. Cash collateral received in connection with these loans is invested in short-term money market instruments or affiliated money market funds and is shown as such on the Schedule of Investments. The Fund bears the risk of loss with respect to the investment of collateral. It is the Fund’s policy to obtain additional collateral from or return excess collateral to the borrower by the end of the next business day, following the valuation date of the securities loaned. Therefore, the value of the collateral held may be temporarily less than the value of the securities on loan. When loaning securities, the Fund retains certain benefits of owning the securities, including the economic equivalent of dividends or interest generated by the security. Lending securities entails a risk of loss to the Fund if, and to the extent that, the market value of the securities loaned were to increase and the borrower did not increase the collateral accordingly, and the borrower failed to return the securities. The securities loaned are subject to termination at the option of the borrower or the Fund. Upon termination, the borrower will return to the Fund the securities loaned and the Fund will return the collateral. Upon the failure of the borrower to return the securities, collateral may be liquidated and the securities may be purchased on the open market to replace the loaned securities. The Fund could experience delays and costs in gaining access to the collateral and the securities may lose value during the delay which could result in potential losses to the Fund. Some of these losses may be indemnified by the lending agent. The Fund bears the risk of any deficiency in the amount of the collateral available for return to the borrower due to any loss on the |
Invesco V.I. Global Core Equity Fund
| | collateral invested. Dividends received on cash collateral investments for securities lending transactions, which are net of compensation to counterparties, are included inDividends from affiliated money market funds on the Statement of Operations. The aggregate value of securities out on loan, if any, is shown as a footnote on the Statement of Assets and Liabilities. |
| J. | Foreign Currency Translations— Foreign currency is valued at the close of the NYSE based on quotations posted by banks and major currency dealers. Portfolio securities and other assets and liabilities denominated in foreign currencies are translated into U.S. dollar amounts at the date of valuation. Purchases and sales of portfolio securities (net of foreign taxes withheld on disposition) and income items denominated in foreign currencies are translated into U.S. dollar amounts on the respective dates of such transactions. The Fund does not separately account for the portion of the results of operations resulting from changes in foreign exchange rates on investments and the fluctuations arising from changes in market prices of securities held. The combined results of changes in foreign exchange rates and the fluctuation of market prices on investments (net of estimated foreign tax withholding) are included with the net realized and unrealized gain or loss from investments in the Statement of Operations. Reported net realized foreign currency gains or losses arise from (1) sales of foreign currencies, (2) currency gains or losses realized between the trade and settlement dates on securities transactions, and (3) the difference between the amounts of dividends, interest, and foreign withholding taxes recorded on the Fund’s books and the U.S. dollar equivalent of the amounts actually received or paid. Net unrealized foreign currency gains and losses arise from changes in the fair values of assets and liabilities, other than investments in securities at fiscal period end, resulting from changes in exchange rates. |
The Fund may invest in foreign securities, which may be subject to foreign taxes on income, gains on investments or currency repatriation, a portion of which may be recoverable. Foreign taxes, if any, are recorded based on the tax regulations and rates that exist in the foreign markets in which the Fund invests and are shown in the Statement of Operations.
| K. | Forward Foreign Currency Contracts— The Fund may engage in foreign currency transactions either on a spot (i.e. for prompt delivery and settlement) basis, or through forward foreign currency contracts, to manage or minimize currency or exchange rate risk. |
The Fund may also enter into forward foreign currency contracts for the purchase or sale of a security denominated in a foreign currency in order to “lock in” the U.S. dollar price of that security, or the Fund may also enter into forward foreign currency contracts that do not provide for physical settlement of the two currencies, but instead are settled by a single cash payment calculated as the difference between the agreed upon exchange rate and the spot rate at settlement based upon an agreed upon notional amount (non-deliverable forwards). The Fund will set aside liquid assets in an amount equal to the daily mark-to-market obligation for forward foreign currency contracts.
A forward foreign currency contract is an obligation between two parties (“Counterparties”) to purchase or sell a specific currency for an agreed-upon price at a future date. The use of forward foreign currency contracts does not eliminate fluctuations in the price of the underlying securities the Fund owns or intends to acquire but establishes a rate of exchange in advance. Fluctuations in the value of these contracts are measured by the difference in the contract date and reporting date exchange rates and are recorded as unrealized appreciation (depreciation) until the contracts are closed. When the contracts are closed, realized gains (losses) are recorded. Realized and unrealized gains (losses) on the contracts are included in the Statement of Operations. The primary risks associated with forward foreign currency contracts include failure of the Counterparty to meet the terms of the contract and the value of the foreign currency changing unfavorably. These risks may be in excess of the amounts reflected in the Statement of Assets and Liabilities.
NOTE 2—Advisory Fees and Other Fees Paid to Affiliates
The Trust has entered into a master investment advisory agreement with Invesco Advisers, Inc. (the "Adviser" or "Invesco"). Under the terms of the investment advisory agreement, the Fund accrues daily and pays monthly an advisory fee to the Adviser based on the annual rate of the Fund’s average daily net assets as follows:
| Average Daily Net Assets | Rate |
| First $1 billion | 0.67% |
| Next $500 million | 0.645% |
| Next $1 billion | 0.62% |
| Next $1 billion | 0.595% |
| Next $1 billion | 0.57% |
| Over $4.5 billion | 0.545% |
For the six months ended June 30, 2019, the effective advisory fees incurred by the Fund was 0.67%.
Under the terms of a master sub-advisory agreement between the Adviser and each of Invesco Asset Management Deutschland GmbH, Invesco Asset Management Limited, Invesco Asset Management (Japan) Limited, Invesco Hong Kong Limited, Invesco Senior Secured Management, Inc. and Invesco Canada Ltd. (collectively, the "Affiliated Sub-Advisers") the Adviser, not the Fund, will pay 40% of the fees paid to the Adviser to any such Affiliated Sub-Adviser(s) that provide(s) discretionary investment management services to the Fund based on the percentage of assets allocated to such Affiliated Sub-Adviser(s).
The Adviser has contractually agreed, through at least June 30, 2020, to waive advisory fees and/or reimburse expenses of all shares to the extent necessary to limit total annual fund operating expenses after fee waiver and/or expense reimbursement (excluding certain items discussed below) of Series I shares to 2.25% and Series II shares to 2.50% of average daily net assets (the “expense limits”). In determining the Adviser’s obligation to waive advisory fees and/or reimburse expenses, the following expenses are not taken into account, and could cause the total annual fund operating expenses after fee waiver and/or expense reimbursement to exceed the numbers reflected above: (1) interest; (2) taxes; (3) dividend expense on short sales; (4) extraordinary or non-routine items, including litigation expenses; and (5) expenses that the Fund has incurred but did not actually pay because of an expense offset arrangement. Unless Invesco continues the fee waiver agreement, it will terminate on June 30, 2020. During its term, the fee waiver agreement cannot be terminated or amended to increase the expense limits or reduce the advisory fee waiver without approval of the Board of Trustees. The Adviser did not waive fees and/or reimburse expenses during the period under these expense limits.
Invesco V.I. Global Core Equity Fund
Further, the Adviser has contractually agreed, through at least June 30, 2021, to waive the advisory fee payable by the Fund in an amount equal to 100% of the net advisory fees the Adviser receives from the affiliated money market funds on investments by the Fund of uninvested cash in such affiliated money market funds.
For the six months ended June 30, 2019, the Adviser waived advisory fees of $90.
The Trust has entered into a master administrative services agreement with Invesco pursuant to which the Fund has agreed to pay Invesco a fee for costs incurred in providing accounting services and fund administrative services to the Fund and to reimburse Invesco for fees paid to insurance companies that have agreed to provide certain administrative services to the Fund. These administrative services provided by the insurance companies may include, among other things: maintenance of master accounts with the Fund; tracking, recording and transmitting net purchase and redemption orders for Fund shares; maintaining and preserving records related to the purchase, redemption and other account activity of variable product owners; distributing copies of Fund documents such as prospectuses, proxy materials and periodic reports, to variable product owners, and responding to inquiries from variable product owners about the Fund. Pursuant to such agreement, for the six months ended June 30, 2019, Invesco was paid $4,887 for accounting and fund administrative services and was reimbursed $51,884 for fees paid to insurance companies. Also, Invesco has entered into a sub-administration agreement whereby State Street Bank and Trust Company (“SSB”) serves as custodian and fund accountant and provides certain administrative services to the Fund.
The Trust has entered into a transfer agency and service agreement with Invesco Investment Services, Inc. (“IIS”) pursuant to which the Fund has agreed to pay IIS a fee for providing transfer agency and shareholder services to the Fund and reimburse IIS for certain expenses incurred by IIS in the course of providing such services. For the six months ended June 30, 2019, expenses incurred under the agreement are shown in the Statement of Operations asTransfer agent fees.
The Trust has entered into a master distribution agreement with Invesco Distributors, Inc. (“IDI”) to serve as the distributor for the Fund. The Trust has adopted a plan pursuant to Rule 12b-1 under the 1940 Act with respect to the Fund’s Series II shares (the “Plan”). The Fund, pursuant to the Plan, pays IDI compensation at the annual rate of 0.25% of the Fund’s average daily net assets of Series II shares. The fees are accrued daily and paid monthly. Of the Plan payments, up to 0.25% of the average daily net assets of the Series II shares may be paid to insurance companies who furnish continuing personal shareholder services to customers who purchase and own Series II shares of the Fund. For the six months ended June 30, 2019, expenses incurred under the Plan are detailed in the Statement of Operations asDistribution fees.
Certain officers and trustees of the Trust are officers and directors of Invesco.
NOTE 3—Additional Valuation Information
GAAP defines fair value as the price that would be received to sell an asset or paid to transfer a liability in an orderly transaction between market participants at the measurement date, under current market conditions. GAAP establishes a hierarchy that prioritizes the inputs to valuation methods, giving the highest priority to readily available unadjusted quoted prices in an active market for identical assets (Level 1) and the lowest priority to significant unobservable inputs (Level 3), generally when market prices are not readily available or are unreliable. Based on the valuation inputs, the securities or other investments are tiered into one of three levels. Changes in valuation methods may result in transfers in or out of an investment’s assigned level:
Level 1 – Prices are determined using quoted prices in an active market for identical assets.
Level 2 – Prices are determined using other significant observable inputs. Observable inputs are inputs that other market participants may use in pricing a security. These may include quoted prices for similar securities, interest rates, prepayment speeds, credit risk, yield curves, loss severities, default rates, discount rates, volatilities and others.
Level 3 – Prices are determined using significant unobservable inputs. In situations where quoted prices or observable inputs are unavailable (for example, when there is little or no market activity for an investment at the end of the period), unobservable inputs may be used. Unobservable inputs reflect the Fund’s own assumptions about the factors market participants would use in determining fair value of the securities or instruments and would be based on the best available information.
The following is a summary of the tiered valuation input levels, as of June 30, 2019. The level assigned to the securities valuations may not be an indication of the risk or liquidity associated with investing in those securities. Because of the inherent uncertainties of valuation, the values reflected in the financial statements may materially differ from the value received upon actual sale of those investments.
Invesco V.I. Global Core Equity Fund
| | Level 1 | Level 2 | Level 3 | Total |
| Investments in Securities | | | | |
| Australia | $— | $893,159 | $— | $893,159 |
| Brazil | 969,768 | — | — | 969,768 |
| China | 580,228 | — | — | 580,228 |
| Denmark | 82,475 | 1,640,285 | — | 1,722,760 |
| Germany | — | 3,978,199 | — | 3,978,199 |
| Hong Kong | — | 1,753,486 | — | 1,753,486 |
| Ireland | — | 687,182 | — | 687,182 |
| Italy | — | 3,990,365 | — | 3,990,365 |
| Japan | — | 9,320,988 | — | 9,320,988 |
| Netherlands | — | 1,786,447 | — | 1,786,447 |
| Singapore | — | 984,786 | — | 984,786 |
| South Korea | — | 410,941 | — | 410,941 |
| Sweden | — | 925,346 | — | 925,346 |
| Switzerland | — | 1,332,905 | — | 1,332,905 |
| Taiwan | — | 610,283 | — | 610,283 |
| United Kingdom | 3,846,895 | 3,459,245 | — | 7,306,140 |
| United States | 32,296,588 | — | — | 32,296,588 |
| Total Investments in Securities | 37,775,954 | 31,773,617 | — | 69,549,571 |
| Other Investments - Liabilities* | | | | |
| Forward Foreign Currency Contracts | — | (15,462) | — | (15,462) |
| Total Investments | $37,775,954 | $31,758,155 | $— | $69,534,109 |
| * | Unrealized appreciation (depreciation). |
NOTE 4—Derivative Investments
The Fund may enter into an International Swaps and Derivatives Association Master Agreement (“ISDA Master Agreement”) under which a fund may trade OTC derivatives. An OTC transaction entered into under an ISDA Master Agreement typically involves a collateral posting arrangement, payment netting provisions and close-out netting provisions. These netting provisions allow for reduction of credit risk through netting of contractual obligations. The enforceability of the netting provisions of the ISDA Master Agreement depends on the governing law of the ISDA Master Agreement, among other factors.
For financial reporting purposes, the Fund does not offset OTC derivative assets or liabilities that are subject to ISDA Master Agreements in the Statement of Assets and Liabilities.
Value of Derivative Investments at Period-End
The table below summarizes the value of the Fund’s derivative investments, detailed by primary risk exposure, held as of June 30, 2019:
| | Value |
| Derivative Liabilities | Currency
Risk |
| Unrealized depreciation on forward foreign currency contracts outstanding | $(15,462) |
| Derivatives not subject to master netting agreements | - |
| Total Derivative Liabilities subject to master netting agreements | $(15,462) |
Offsetting Assets and Liabilities
The table below reflects the Fund’s exposure to Counterparties subject to either an ISDA Master Agreement or other agreement for OTC derivative transactions as of June 30, 2019.
| | Financial
Derivative
Liabilities | | Collateral
(Received)/Pledged | |
| Counterparty | Forward Foreign
Currency Contracts | Net Value of
Derivatives | Non-Cash | Cash | Net
Amount |
| JPMorgan Chase Bank, N.A. | $(15,462) | $(15,462) | $– | $– | $(15,462) |
Invesco V.I. Global Core Equity Fund
Effect of Derivative Investments for the six months ended June 30, 2019
The table below summarizes the gains (losses) on derivative investments, detailed by primary risk exposure, recognized in earnings during the period:
| | Location of Gain (Loss) on
Statement of Operations |
| | Currency
Risk |
| Realized Gain (Loss): | |
| Forward foreign currency contracts | $(36,264) |
| Change in Net Unrealized Appreciation: | |
| Forward foreign currency contracts | 32,048 |
| Total | $(4,216) |
The table below summarizes the average notional value of derivatives held during the period.
| | Forward
Foreign Currency
Contracts |
| Average notional value | $1,846,342 |
NOTE 5—Trustees’ and Officers’ Fees and Benefits
Trustees’ and Officers’ Fees and Benefits include amounts accrued by the Fund to pay remuneration to certain Trustees and Officers of the Fund. Trustees have the option to defer compensation payable by the Fund, and Trustees’ and Officers’ Fees and Benefits also include amounts accrued by the Fund to fund such deferred compensation amounts. Those Trustees who defer compensation have the option to select various Invesco Funds in which their deferral accounts shall be deemed to be invested. Finally, certain current Trustees were eligible to participate in a retirement plan that provided for benefits to be paid upon retirement to Trustees over a period of time based on the number of years of service. The Fund may have certain former Trustees who also participate in a retirement plan and receive benefits under such plan.Trustees’ and Officers’ Fees and Benefits include amounts accrued by the Fund to fund such retirement benefits. Obligations under the deferred compensation and retirement plans represent unsecured claims against the general assets of the Fund.
NOTE 6—Cash Balances
The Fund is permitted to temporarily carry a negative or overdrawn balance in its account with State Street Bank and Trust Company, the custodian bank. Such balances, if any at period-end, are shown in the Statement of Assets and Liabilities under the payable caption Amount due custodian. To compensate the custodian bank for such overdrafts, the overdrawn Fund may either (1) leave funds as a compensating balance in the account so the custodian bank can be compensated by earning the additional interest; or (2) compensate by paying the custodian bank at a rate agreed upon by the custodian bank and Invesco, not to exceed the contractually agreed upon rate.
NOTE 7—Tax Information
The amount and character of income and gains to be distributed are determined in accordance with income tax regulations, which may differ from GAAP. Reclassifications are made to the Fund’s capital accounts to reflect income and gains available for distribution (or available capital loss carryforward) under income tax regulations. The tax character of distributions paid during the year and the tax components of net assets will be reported at the Fund’s fiscal year-end.
Capital loss carryforward is calculated and reported as of a specific date. Results of transactions and other activity after that date may affect the amount of capital loss carryforward actually available for the Fund to utilize. The ability to utilize capital loss carryforwards in the future may be limited under the Internal Revenue Code and related regulations based on the results of future transactions.
The Fund did not have a capital loss carryforward as of December 31, 2018.
NOTE 8—Investment Transactions
The aggregate amount of investment securities (other than short-term securities, U.S. Treasury obligations and money market funds, if any) purchased and sold by the Fund during the six months ended June 30, 2019 was $6,221,756 and $10,099,322, respectively. Cost of investments, including any derivatives, on a tax basis includes the adjustments for financial reporting purposes as of the most recently completed federal income tax reporting period-end.
| Unrealized Appreciation (Depreciation) of Investments on a Tax Basis |
| Aggregate unrealized appreciation of investments | $12,753,263 |
| Aggregate unrealized (depreciation) of investments | (4,219,428) |
| Net unrealized appreciation of investments | $8,533,835 |
Cost of investments for tax purposes is $61,000,274.
Invesco V.I. Global Core Equity Fund
NOTE 9—Share Information
| | Summary of Share Activity |
| | Six months ended
June 30, 2019(a) | | Year ended
December 31, 2018 |
| | Shares | Amount | | Shares | Amount |
| Sold: | | | | | |
| Series I | 81,086 | $811,468 | | 503,897 | $5,374,444 |
| Series II | 5,074 | 50,840 | | 8,185 | 83,331 |
| Issued as reinvestment of dividends: | | | | | |
| Series I | — | — | | 68,065 | 726,931 |
| Series II | — | — | | 8,717 | 93,182 |
| Reacquired: | | | | | |
| Series I | (491,655) | (4,933,986) | | (1,339,378) | (14,147,219) |
| Series II | (67,571) | (678,962) | | (162,966) | (1,724,077) |
| Net increase (decrease) in share activity | (473,066) | $(4,750,640) | | (913,480) | $(9,593,408) |
| (a) | There are entities that are record owners of more than 5% of the outstanding shares of the Fund and in the aggregate own 85% of the outstanding shares of the Fund. The Fund and the Fund’s principal underwriter or adviser, are parties to participation agreements with these entities whereby these entities sell units of interest in separate accounts funding variable products that are invested in the Fund. The Fund, Invesco and/or Invesco affiliates may make payments to these entities, which are considered to be related to the Fund, for providing services to the Fund, Invesco and/or Invesco affiliates including but not limited to services such as, securities brokerage, third party record keeping and account servicing and administrative services. The Fund has no knowledge as to whether all or any portion of the shares owned of record by these entities are also owned beneficially. |
Invesco V.I. Global Core Equity Fund
Calculating your ongoing Fund expenses
Example
As a shareholder of the Fund, you incur ongoing costs, including management fees; distribution and/or service fees (12b-1); and other Fund expenses. This example is intended to help you understand your ongoing costs (in dollars) of investing in the Fund and to compare these costs with ongoing costs of investing in other mutual funds. The example is based on an investment of $1,000 invested at the beginning of the period and held for the entire period January 1, 2019 through June 30, 2019.
The actual and hypothetical expenses in the examples below do not represent the effect of any fees or other expenses assessed in connection with a variable product; if they did, the expenses shown would be higher while the ending account values shown would be lower.
Actual expenses
The table below provides information about actual account values and actual expenses. You may use the information in this table, together with the amount you invested, to estimate the expenses that you paid over the period. Simply divide your account value by $1,000 (for example, an $8,600 account value divided by $1,000 = 8.6), then multiply the result by the number in the table under the heading entitled “Actual Expenses Paid During Period” to estimate the expenses you paid on your account during this period.
Hypothetical example for comparison purposes
The table below also provides information about hypothetical account values and hypothetical expenses based on the Fund’s actual expense ratio and an assumed rate of return of 5% per year before expenses, which is not the Fund’s actual return.
The hypothetical account values and expenses may not be used to estimate the actual ending account balance or expenses you paid for the period. You may use this information to compare the ongoing costs of investing in the Fund and other funds. To do so, compare this 5% hypothetical example with the 5% hypothetical examples that appear in the shareholder reports of the other funds.
Please note that the expenses shown in the table are meant to highlight your ongoing costs. Therefore, the hypothetical information is useful in comparing ongoing costs, and will not help you determine the relative total costs of owning different funds.
| | Beginning
Account Value (01/01/19) | ACTUAL | HYPOTHETICAL
(5% annual return before
expenses) | Annualized
Expense
Ratio |
Ending
Account Value
(06/30/19)1 | Expenses
Paid During
Period2 | Ending
Account Value
(06/30/19) | Expenses
Paid During
Period2 |
| Series I | $1,000.00 | $1,152.40 | $5.50 | $1,019.69 | $5.16 | 1.03% |
| Series II | 1,000.00 | 1,151.30 | 6.83 | 1,018.45 | 6.41 | 1.28 |
| 1 | The actual ending account value is based on the actual total return of the Fund for the period January 1, 2019 through June 30, 2019, after actual expenses and will differ from the hypothetical ending account value which is based on the Fund’s expense ratio and a hypothetical annual return of 5% before expenses. |
| 2 | Expenses are equal to the Fund’s annualized expense ratio as indicated above multiplied by the average account value over the period, multiplied by 181/365 to reflect the most recent fiscal half year. |
Invesco V.I. Global Core Equity Fund
Approval of Investment Advisory andSub-Advisory Contracts
At meetings held on June 10, 2019, the Board of Trustees (the Board or the Trustees) of AIM Variable Insurance Funds (Invesco Variable Insurance Funds) as a whole, and the independent Trustees, who comprise over 75% of the Board, voting separately, approved the continuance of the Invesco V.I. Global Core Equity Fund’s (the Fund) Master Investment Advisory Agreement with Invesco Advisers, Inc. (Invesco Advisers and the investment advisory agreement) and the Master IntergroupSub-Advisory Contract for Mutual Funds with Invesco Asset Management Deutschland GmbH, Invesco Asset Management Limited, Invesco Asset Management (Japan) Limited, Invesco Hong Kong Limited, Invesco Senior Secured Management, Inc. and Invesco Canada Ltd. and separatesub-advisory contracts with Invesco Capital Management LLC and Invesco Asset Management (India) Private Limited (collectively, the AffiliatedSub-Advisers and thesub-advisory contracts) for another year, effective July 1, 2019. After evaluating the factors discussed below, among others, the Board approved the renewal of the Fund’s investment advisory agreement and thesub-advisory contracts and determined that the compensation payable by the Fund to Invesco Advisers and by Invesco Advisers to the AffiliatedSub-Advisers is fair and reasonable.
The Board’s Evaluation Process
The Board’s Investments Committee has established threeSub-Committees, which meet throughout the year to review the performance of funds advised by Invesco Advisers (the Invesco Funds). As part of a regularly scheduled basis ofin-person Board meetings, theSub-Committees meet with portfolio managers for their assigned Invesco Funds and other members of management to review detailed information about investment performance and portfolio attributes of these funds. The Board took into account evaluations and reports that it received from the Investments Committee andSub-Committees, as well as the information provided to such committees and the Board throughout the year, in considering whether to approve each Invesco Fund’s investment advisory agreement andsub-advisory contracts.
As part of the contract renewal process, the Board reviews and considers information provided in response to detailed requests for information submitted to management by the independent Trustees with assistance from legal counsel to the independent Trustees. The Board receives comparative investment performance and fee data regarding the Invesco Funds prepared by Invesco Advisers and Broadridge Financial Solutions, Inc. (Broadridge), an independent mutual fund data provider. The Board also receives an independent written evaluation from the Senior Officer, an officer of the Invesco Funds who reports directly to the
independent Trustees. The Senior Officer’s evaluation is prepared as part of his responsibility to manage the process by which the Invesco Funds’ proposed management fees are negotiated during the annual contract renewal process to ensure they are negotiated in a manner that is at arms’ length and reasonable. In addition to meetings with Invesco Advisers and fund counsel throughout the year, the independent Trustees also discuss the continuance of the investment advisory agreement andsub-advisory contracts in separate sessions with the Senior Officer and with independent legal counsel.
The discussion below is a summary of the Senior Officer’s independent written evaluation with respect to the Fund’s investment advisory agreement, as well as a discussion of the material factors and related conclusions that formed the basis for the Board’s approval of the Fund’s investment advisory agreement andsub-advisory contracts. The Trustees’ review and conclusions are based on the comprehensive consideration of all information presented to them during the course of the year and in prior years and are not the result of any single determinative factor. Moreover, one Trustee may have weighed a particular piece of information or factor differently than another Trustee. This information is current as of June 10, 2019.
Factors and Conclusions and Summary of Independent Written Fee Evaluation
| A. | Nature, Extent and Quality of Services Provided by Invesco Advisers and the AffiliatedSub-Advisers |
The Board reviewed the nature, extent and quality of the advisory services provided to the Fund by Invesco Advisers under the Fund’s investment advisory agreement, and the credentials and experience of the officers and employees of Invesco Advisers who provide these services, including the Fund’s portfolio manager(s). The Board’s review included consideration of Invesco Advisers’ investment process oversight and structure, credit analysis and investment risk management. The Board also considerednon-advisory services that Invesco Advisers and its affiliates provide to the Invesco Funds such as various back office support functions, third party oversight, internal audit, valuation, portfolio trading and legal and compliance. The Board also received and reviewed information about Invesco Advisers’ role as administrator of the Invesco Funds’ liquidity risk management program. The Board also reviewed and considered the benefits to shareholders of investing in a fund that is part of the Invesco family of funds under the umbrella of Invesco Ltd., Invesco Advisers’ parent company, and noted Invesco Ltd.’s depth and experience in conducting an investment management business, as well as its
commitment of financial and other resources to such business. The Board reviewed and considered information about the resources that Invesco Advisers intends to continue to commit to managing the Invesco family of funds following Invesco Ltd.’s acquisition of OppenheimerFunds, Inc. and its subsidiaries. The Board concluded that the nature, extent and quality of the services provided to the Fund by Invesco Advisers are appropriate and satisfactory.
The Board reviewed the services that may be provided by the AffiliatedSub-Advisers under thesub-advisory contracts and the credentials and experience of the officers and employees of the AffiliatedSub-Advisers who provide these services. The Board noted the AffiliatedSub-Advisers’ expertise with respect to certain asset classes and that the AffiliatedSub-Advisers have offices and personnel that are located in financial centers around the world. As a result, the Board noted that the AffiliatedSub-Advisers can provide research and investment analysis on the markets and economies of various countries in which the Fund may invest, make recommendations regarding securities and assist with security trades. The Board concluded that thesub-advisory contracts may benefit the Fund and its shareholders by permitting Invesco Advisers to use the resources and talents of the AffiliatedSub-Advisers in managing the Fund. The Board concluded that the nature, extent and quality of the services that may be provided by the AffiliatedSub-Advisers are appropriate and satisfactory.
| B. | Fund Investment Performance |
The Board considered Fund investment performance as a relevant factor in considering whether to approve the investment advisory as well as thesub-advisory contracts for the Fund, as Invesco Asset Management Limited currently manages assets of the Fund.
The Board compared the Fund’s investment performance over multiple time periods ending December 31, 2018 to the performance of funds in the Broadridge performance universe.The Board noted that performance of Series I shares of the Fund was in the fifth quintile of its performance universe for the one, three and five year periods (the first quintile being the best performing funds and the fifth quintile being the worst performing funds). The Board also noted there was no comparative index. The Board noted that the Fund’s underweight and overweight exposure to and stock selection in certain sectors and regions negatively impacted performance. The Trustees also reviewed more recent Fund performance and this review did not change their conclusions.
| C. | Advisory andSub-Advisory Fees and Fund Expenses |
The Board compared the Fund’s contractual management fee rate to the contractual
Invesco V.I. Global Core Equity Fund
management fee rates of funds in the Fund’s Broadridge expense group. The Board noted that the contractual management fee rate for Series I shares of the Fund was below the median contractual management fee rate of funds in its expense group. The Board noted that the term “contractual management fee” for funds in the expense group may include both advisory and certainnon-portfolio management administrative services fees, but that Broadridge does not provide information on a fund by fund basis as to what is included. The Board also reviewed the methodology used by Broadridge in providing expense group information, which includes using each fund’s contractual management fee schedule (including any applicable breakpoints) as reported in the most recent prospectus or statement of additional information for each fund in the expense group. The Board also considered comparative information regarding the Fund’s total expense ratio and its various components. The Board noted that there were only five funds (including the Fund) in the expense group.
The Board noted that Invesco Advisers has contractually agreed to waive fees and/or limit expenses of the Fund for the term disclosed in the Fund’s registration statement in an amount necessary to limit total annual operating expenses to a specified percentage of average daily net assets for each class of the Fund.
The Board also considered the fees charged by Invesco Advisers and the AffiliatedSub-Advisers to other similarly managed client accounts. The Board noted that Invesco Advisers or the AffiliatedSub-Advisers may charge lower fees to large institutional clients. Invesco Advisers reviewed with the Board differences in the scope of services it provides to the Invesco Funds relative to certain other types of client accounts, including management of cash flows as a result of redemptions and purchases, necessary infrastructure such as officers, office space, technology, legal and distribution, oversight of service providers, costs and business risks associated with launching new funds and sponsoring and maintaining the product line, preparation of annual registration statement updates and financial information and compliance with federal and state laws and regulations.
The Board also considered the services that may be provided by the AffiliatedSub-Advisers pursuant to thesub-advisory contracts, as well as the fees payable by Invesco Advisers to the AffiliatedSub-Advisers pursuant to thesub-advisory contracts. The Board noted that Invesco Advisers retains overall responsibility for, and provides services to,sub-advised Invesco Funds, including oversight of the AffiliatedSub-Advisers as well as the additional services described herein other thanday-to-day portfolio management.
| D. | Economies of Scale and Breakpoints |
The Board considered the extent to which there may be economies of scale in the provision of advisory services to the Fund. The Board
considered Invesco’s reinvestment in its business, including investments in business infrastructure and cybersecurity. The Board also considered that the Fund may benefit from economies of scale through contractual breakpoints in the Fund’s advisory fee schedule, which generally operate to reduce the Fund’s expense ratio as it grows in size. The Board noted that the Fund shares directly in economies of scale through lower fees charged by third party service providers based on the combined size of the Invesco Funds. The Board noted that the Fund may also benefit from economies of scale through initial fee setting, fee waivers and expense reimbursements.
| E. | Profitability and Financial Resources |
The Board reviewed information from Invesco Advisers concerning the costs of the advisory and other services that Invesco Advisers and its affiliates provide to the Fund and the Invesco Funds and the profitability of Invesco Advisers and its affiliates in providing these services. The Board considered the methodology used for calculating profitability and noted the periodic review of such methodology by an independent consultant. The Board noted that Invesco Advisers continues to operate at a net profit from services Invesco Advisers and its affiliates provide to the Invesco Funds and the Fund. The Board did not deem the level of profits realized by Invesco Advisers and its affiliates from providing services to the Fund to be excessive given the nature, extent and quality of the services provided. The Board received information from Invesco Advisers demonstrating that Invesco Advisers and the AffiliatedSub-Advisers are financially sound and have the resources necessary to perform their obligations under the investment advisory agreement andsub-advisory contracts.
| F. | Collateral Benefits to Invesco Advisers and its Affiliates |
The Board considered various other benefits received by Invesco Advisers and its affiliates from the relationship with the Fund, including the fees received for providing administrative, transfer agency and distribution services to the Fund. The Board considered comparative information regarding fees charged for these services, including information provided by Broadridge and other independent sources. The Board considered the performance of Invesco Advisers and its affiliates in providing these services and the organizational structure employed to provide these services. The Board also considered that these services are provided to the Fund pursuant to written contracts that are reviewed and approved on an annual basis by the Board; and that the services are required for the operation of the Fund.
The Board considered the benefits realized by Invesco Advisers and the AffiliatedSub-Advisers as a result of portfolio brokerage transactions executed through “soft dollar” arrangements. The Board noted that soft dollar arrangements may result in the Fund bearing costs to purchase research that may be used by Invesco Advisers or the AffiliatedSub-Advisers with
other clients and may reduce Invesco Advisers’ or the AffiliatedSub-Advisers’ expenses. The Board also considered that it receives periodic reports from Invesco representing that these arrangements are consistent with regulatory requirements. The Board did not deem the soft dollar arrangements to be inappropriate.
The Board considered that the Fund’s uninvested cash and cash collateral from any securities lending arrangements may be invested in money market funds advised by Invesco Advisers pursuant to procedures approved by the Board. The Board considered information regarding the returns of the affiliated money market funds relative to comparable overnight investments, as well as the costs to the Fund of such investments. The Board noted that Invesco Advisers receives advisory fees from these affiliated money market funds attributable to such investments, although Invesco Advisers has contractually agreed to waive through varying periods the advisory fees payable by the Invesco Funds with respect to certain investments in the affiliated money market funds. The waiver is in an amount equal to 100% of the net advisory fee Invesco Advisers receives from the affiliated money market funds with respect to the Fund’s investment in the affiliated money market funds of uninvested cash, but not cash collateral. The Board concluded that the amount of advisory fees received by Invesco Advisers from the Fund’s investment of cash collateral from any securities lending arrangements in the affiliated money market funds is fair and reasonable.
The Board also considered that an affiliated broker may receive commissions for executing certain trades for the Fund. Invesco Advisers and the AffiliatedSub-Advisers may use the affiliated broker to, among other things, control order routing and minimize information leakage, and the Board was advised that such trades are executed in compliance with rules under the federal securities laws and consistent with best execution obligations.
Invesco V.I. Global Core Equity Fund
| Semiannual Report to Shareholders | June 30, 2019 |
Invesco V.I. Global Real Estate Fund
Beginning on January 1, 2021, as permitted by regulations adopted by the Securities and Exchange Commission, the insurance company that offers your variable annuity or variable life insurance contract may no longer send you paper copies of the Fund’s shareholder reports by mail, unless you specifically request paper copies of the reports from the insurance company or your financial intermediary. Instead of delivering paper copies of the report, the insurance company may choose to make the reports available on a website, and will notify you by mail each time a report is posted and provide you with a website link to access the report. Instructions for requesting paper copies will be provided by your insurance company.
If the insurance company offers electronic delivery, you may elect to receive shareholder reports and other communications about the Fund electronically by following the instructions provided by the insurance company or by contacting your financial intermediary. If you already elected to receive shareholder reports electronically, you will not be affected by this change and you need not take any action.
You may elect to receive all future reports in paper free of charge from the insurance company. You can inform the insurance company or your financial intermediary that you wish to continue receiving paper copies of your shareholder reports by following the instructions provided by the insurance company or by contacting your financial intermediary. Your election to receive reports in paper will apply to all portfolio companies available under your contract with the insurance company.
The Fund provides a complete list of its holdings four times in each fiscal year, at the quarter-ends. For the second and fourth quarters, the lists appear in the Fund’s semiannual and annual reports to shareholders. For the first and third quarters, the Fund files the lists with the Securities and Exchange Commission (SEC) on Form N-Q (or any successor Form). The Fund’s Form N-Q (or any successor Form) filings are available on the SEC website, sec.gov. The SEC file numbers for the Fund are 811-07452 and 033-57340. The Fund’s most recent portfolio holdings, as filed on Form N-Q (or any successor Form), have also been made available to insurance companies issuing variable annuity contracts and variable life insurance policies (“variable products”) that invest in the Fund.
A description of the policies and procedures that the Fund uses to determine how to vote proxies relating to portfolio securities is available without charge, upon request, from our Client Services department at 800 959 4246 or at invesco.com/proxyguidelines. The information is also available on the SEC website, sec.gov.
Information regarding how the Fund voted proxies related to its portfolio securities during the most recent 12-month period ended June 30 is available at invesco.com/proxysearch. The information is also available on the SEC website, sec.gov.
Invesco Advisers, Inc. is an investment adviser; it provides investment advisory services to individual and institutional clients and does not sell securities. Invesco Distributors, Inc. is the US distributor for Invesco Ltd.’s retail mutual funds, exchange-traded funds and institutional money market funds. Both are wholly owned, indirect subsidiaries of Invesco Ltd.
This report must be accompanied or preceded by a currently effective Fund prospectus and variable product prospectus, which contain more complete information, including sales charges and expenses. Investors should read each carefully before investing.
NOT FDIC INSURED | MAY LOSE VALUE | NO BANK GUARANTEE
| Invesco Distributors, Inc. | VIGRE-SAR-1 |
Performance summary
Fund vs. Indexes
Cumulative total returns, December 31, 2018 to June 30, 2019, excluding variable product issuer charges. If variable product issuer charges were included, returns would be lower.
| Series I Shares | 15.72% |
| Series II Shares | 15.57 |
| MSCI World Index▼ (Broad Market Index) | 16.98 |
Custom Invesco Global Real Estate Index■
(Style-Specific Index) | 14.86 |
Lipper VUF Real Estate Funds Classification Average♦
(Peer Group) | 18.39 |
| Source(s):▼RIMES Technologies Corp.;■ Invesco, RIMES Technologies Corp.;♦ Lipper Inc. |
The MSCI World IndexSM is an unmanaged index considered representative of stocks of developed countries. The index is computed using the net return, which withholds applicable taxes for non-resident investors.
TheCustom Invesco Global Real Estate Index is composed of the FTSE EPRA/NAREIT Developed Index (gross) from fund inception through February, 17, 2005; the FTSE EPRA/NAREIT Developed Index (net) from February 18, 2005, through June 30, 2014; and the FTSE EPRA/NAREIT Global Index (net) thereafter.
TheLipper VUF Real Estate Funds Classification Average represents an average of all of the variable insurance underlying funds in the Lipper Real Estate Funds classification.
TheFTSE EPRA/NAREIT Developed Index is considered representative of global real estate companies and REITs. The net version of the index is computed using the net return, which withholds applicable taxes for non-resident investors.
TheFTSE EPRA/NAREIT Global Index is designed to track the performance of listed real estate companies and REITS in developed and emerging markets. The index is computed using the net return, which withholds applicable taxes for non-resident investors.
The Fund is not managed to track the performance of any particular index, including the indexes described here, and consequently, the performance of the Fund may deviate significantly from the performance of the indexes.
A direct investment cannot be made in an index. Unless otherwise indicated, index results include reinvested dividends, and they do not reflect sales charges. Performance of the peer group, if applicable, reflects fund expenses; performance of a market index does not.
| Average Annual Total Returns |
| As of 6/30/19 |
| Series I Shares | |
| Inception (3/31/98) | 7.85% |
| 10 Years | 10.04 |
| 5 Years | 4.83 |
| 1 Year | 8.67 |
| Series II Shares | |
| Inception (4/30/04) | 7.75% |
| 10 Years | 9.78 |
| 5 Years | 4.57 |
| 1 Year | 8.38 |
The performance of the Fund’s Series I and Series II share classes will differ primarily due to different class expenses.
The performance data quoted represent past performance and cannot guarantee comparable future results; current performance may be lower or higher. Please contact your variable product issuer or financial adviser for the most recent month-end variable product performance. Performance figures reflect Fund expenses, reinvested distributions and changes in net asset value. Investment return and principal value will fluctuate so that you may have a gain or loss when you sell shares.
The total annual Fund operating expense ratio set forth in the most re-
cent Fund prospectus as of the date of this report for Series I and Series II shares was 1.01% and 1.26%, respectively. The expense ratios presented above may vary from the expense ratios presented in other sections of this report that are based on expenses incurred during the period covered by this report.
Invesco V.I. Global Real Estate Fund, a series portfolio of AIM Variable Insurance Funds (Invesco Variable Insurance Funds), is currently offered through insurance companies issuing variable products. You cannot purchase shares of the Fund directly. Performance figures given represent the Fund and are not intended to reflect actual variable product values. They do not reflect sales charges, expenses and
fees assessed in connection with a variable product. Sales charges, expenses and fees, which are determined by the variable product issuers, will vary and will lower the total return.
The most recent month-end performance at the Fund level, excluding variable product charges, is available at 800 451 4246. As mentioned above, for the most recent month-end performance including variable product charges, please contact your variable product issuer or financial adviser.
Fund performance reflects any applicable fee waivers and/or expense reimbursements. Had the adviser not waived fees and/or reimbursed expenses currently or in the past, returns would have been lower. See current prospectus for more information.
Invesco V.I. Global Real Estate Fund
Schedule of Investments
June 30, 2019
(Unaudited)
| | Shares | Value |
| Common Stocks & Other Equity Interests–98.58% |
| Australia–4.34% |
| Dexus | 128,072 | $1,168,880 |
| Goodman Group | 262,216 | 2,771,281 |
| GPT Group (The) | 179,523 | 776,435 |
| Mirvac Group | 587,476 | 1,293,257 |
| Scentre Group | 807,436 | 2,180,474 |
| | | | 8,190,327 |
| Brazil–0.57% |
| BR Malls Participacoes S.A. | 114,725 | 428,133 |
| BR Properties S.A. | 54,800 | 140,570 |
| Cyrela Brazil Realty S.A. Empreendimentos e Participacoes | 36,600 | 198,253 |
| Multiplan Empreendimentos Imobiliarios S.A. | 44,000 | 318,087 |
| | | | 1,085,043 |
| Canada–2.09% |
| Allied Properties REIT | 33,972 | 1,228,860 |
| Canadian Apartment Properties REIT | 14,206 | 524,609 |
| H&R REIT | 27,381 | 477,555 |
| Killam Apartment REIT | 66,971 | 960,930 |
| RioCan REIT | 838 | 16,631 |
| SmartCentres REIT | 29,011 | 735,715 |
| | | | 3,944,300 |
| Chile–0.09% |
| Parque Arauco S.A. | 60,410 | 167,682 |
| China–5.48% |
| Agile Group Holdings Ltd. | 194,000 | 260,125 |
| CapitaLand Retail China Trust | 88,000 | 101,518 |
| China Aoyuan Property Group Ltd. | 138,000 | 193,149 |
| China Evergrande Group | 265,000 | 740,618 |
| China Jinmao Holdings Group Ltd. | 610,000 | 371,491 |
| China Overseas Land & Investment Ltd. | 444,000 | 1,638,430 |
| China Resources Land Ltd. | 262,444 | 1,151,131 |
| China SCE Group Holdings Ltd. | 170,000 | 81,954 |
| China Vanke Co., Ltd., Class H | 262,100 | 983,780 |
| CIFI Holdings (Group) Co., Ltd. | 494,000 | 326,074 |
| Country Garden Holdings Co. Ltd. | 775,000 | 1,173,995 |
| Guangzhou R&F Properties Co. Ltd., Class H | 143,600 | 276,536 |
| Jiayuan International Group Ltd. | 106,000 | 46,703 |
| KWG Group Holdings Ltd.(a) | 187,000 | 189,041 |
| Logan Property Holdings Co. Ltd. | 186,000 | 301,666 |
| Ronshine China Holdings Ltd., REGS(a)(b) | 128,500 | 158,690 |
| Shimao Property Holdings Ltd. | 162,500 | 493,103 |
| Sino-Ocean Group Holding Ltd. | 230,500 | 98,036 |
| | Shares | Value |
| China–(continued) |
| SOHO China Ltd. | 213,500 | $75,495 |
| Sunac China Holdings Ltd. | 248,000 | 1,221,134 |
| Times China Holdings Ltd. | 83,000 | 166,560 |
| Yanlord Land Group Ltd. | 72,800 | 69,649 |
| Yuexiu Property Co. Ltd. | 390,000 | 88,499 |
| Yuzhou Properties Co. Ltd. | 312,000 | 146,813 |
| | | | 10,354,190 |
| France–1.89% |
| ICADE | 9,991 | 916,593 |
| Klepierre S.A. | 18,711 | 627,259 |
| Unibail-Rodamco-Westfield | 13,173 | 1,973,551 |
| Unibail-Rodamco-Westfield | 387 | 57,978 |
| | | | 3,575,381 |
| Germany–4.64% |
| Aroundtown S.A. | 170,282 | 1,403,012 |
| Deutsche Wohnen S.E. | 41,025 | 1,504,822 |
| Grand City Properties S.A. | 65,687 | 1,501,323 |
| LEG Immobilien AG | 10,789 | 1,216,820 |
| Vonovia S.E. | 65,607 | 3,133,273 |
| | | | 8,759,250 |
| Hong Kong–7.64% |
| CK Asset Holdings Ltd. | 161,800 | 1,263,060 |
| Hang Lung Properties Ltd. | 520,000 | 1,238,096 |
| Hongkong Land Holdings Ltd. | 160,900 | 1,037,871 |
| K Wah International Holdings Ltd. | 120,000 | 69,819 |
| Kerry Properties Ltd. | 30,000 | 126,053 |
| Link REIT | 315,000 | 3,874,492 |
| Mapletree North Asia Commercial Trust, REGS(b) | 178,000 | 192,132 |
| New World Development Co. Ltd. | 1,329,000 | 2,070,961 |
| Sino Land Co. Ltd. | 764,000 | 1,277,643 |
| Sun Hung Kai Properties Ltd. | 87,000 | 1,477,468 |
| Swire Properties Ltd. | 154,200 | 623,252 |
| Wharf Real Estate Investment Co. Ltd. | 152,000 | 1,067,818 |
| Yuexiu REIT | 156,000 | 106,656 |
| | | | 14,425,321 |
| India–0.28% |
| Ascendas India Trust | 50,600 | 50,861 |
| DLF Ltd. | 85,138 | 233,694 |
| Embassy Office Parks REIT(a) | 10,800 | 57,422 |
| Oberoi Realty Ltd. | 20,936 | 184,285 |
| | | | 526,262 |
| Indonesia–0.25% |
| PT Bumi Serpong Damai Tbk(a) | 1,842,400 | 200,321 |
| PT Ciputra Development Tbk | 603,163 | 49,146 |
See accompanying Notes to Financial Statements which are an integral part of the financial statements.
Invesco V.I. Global Real Estate Fund
| | Shares | Value |
| Indonesia–(continued) |
| PT Pakuwon Jati Tbk | 2,320,400 | $119,939 |
| PT Summarecon Agung Tbk | 1,301,200 | 112,428 |
| | | | 481,834 |
| Ireland–0.30% |
| Green REIT PLC | 271,116 | 558,025 |
| Japan–10.41% |
| Advance Residence Investment Corp. | 165 | 490,706 |
| Comforia Residential REIT, Inc | 252 | 723,418 |
| Daiwa Office Investment Corp. | 85 | 609,741 |
| Invincible Investment Corp. | 1,074 | 556,186 |
| Japan Hotel REIT Investment Corp. | 1,206 | 971,620 |
| Japan Real Estate Investment Corp. | 114 | 693,748 |
| Japan Rental Housing Investments, Inc. | 538 | 418,297 |
| Japan Retail Fund Investment Corp. | 508 | 1,027,017 |
| Kenedix Office Investment Corp. | 70 | 501,099 |
| Kenedix Retail REIT Corp. | 137 | 336,496 |
| Mitsubishi Estate Co., Ltd. | 128,120 | 2,390,060 |
| Mitsui Fudosan Co., Ltd. | 103,358 | 2,509,648 |
| Mitsui Fudosan Logistics Park, Inc. | 176 | 598,222 |
| Mori Hills REIT Investment Corp. | 326 | 461,611 |
| Nippon Prologis REIT, Inc. | 647 | 1,493,363 |
| Nomura Real Estate Master Fund, Inc. | 431 | 662,696 |
| ORIX JREIT, Inc. | 632 | 1,152,218 |
| Premier Investment Corp. | 329 | 432,633 |
| Sekisui House Reit, Inc. | 959 | 717,384 |
| Sumitomo Realty & Development Co., Ltd. | 44,889 | 1,605,111 |
| Tokyo Tatemono Co., Ltd. | 41,282 | 459,419 |
| Tokyu Fudosan Holdings Corp. | 100,200 | 554,145 |
| Tokyu REIT, Inc. | 171 | 296,954 |
| | | | 19,661,792 |
| Malaysia–0.33% |
| IOI Properties Group Bhd. | 410,800 | 137,271 |
| KLCCP Stapled Group | 156,900 | 295,083 |
| Mah Sing Group Bhd. | 291,200 | 64,833 |
| Sime Darby Property Bhd | 521,100 | 129,872 |
| | | | 627,059 |
| Malta–0.00% |
| BGP Holdings PLC, (Acquired 08/06/2009; Cost $0)(a)(b)(c) | 1,355,927 | 0 |
| Mexico–0.48% |
| Fibra Uno Administracion S.A. de C.V. | 349,300 | 462,609 |
| Macquarie Mexico Real Estate Management S.A. de C.V., REGS(b) | 225,200 | 255,662 |
| PLA Administradora Industrial, S. de R.L. de C.V. | 121,900 | 190,721 |
| | | | 908,992 |
| Netherlands–0.26% |
| InterXion Holding N.V.(a) | 6,575 | 500,292 |
| | Shares | Value |
| Philippines–0.91% |
| Ayala Land, Inc. | 891,700 | $884,477 |
| Megaworld Corp. | 337,100 | 40,130 |
| Robinsons Land Corp. | 243,300 | 125,106 |
| SM Prime Holdings, Inc. | 917,500 | 664,530 |
| | | | 1,714,243 |
| Singapore–2.02% |
| Ascendas REIT | 331,600 | 764,936 |
| CapitaLand Commercial Trust | 244,600 | 392,373 |
| CapitaLand Ltd. | 364,800 | 952,087 |
| CapitaLand Mall Trust | 339,600 | 661,016 |
| City Developments Ltd. | 74,600 | 523,760 |
| Mapletree Logistics Trust | 450,500 | 529,886 |
| | | | 3,824,058 |
| South Africa–0.81% |
| Growthpoint Properties Ltd. | 393,763 | 678,818 |
| Hyprop Investments Ltd. | 43,393 | 215,520 |
| Redefine Properties Ltd. | 671,517 | 431,011 |
| SA Corporate Real Estate Ltd. | 921,818 | 203,488 |
| | | | 1,528,837 |
| Spain–0.84% |
| Inmobiliaria Colonial Socimi, S.A. | 48,235 | 537,159 |
| Merlin Properties SOCIMI, S.A. | 75,176 | 1,042,929 |
| | | | 1,580,088 |
| Sweden–1.67% |
| Fabege AB | 70,472 | 1,060,603 |
| Hufvudstaden AB, Class A | 62,088 | 1,055,757 |
| Wihlborgs Fastigheter AB | 70,940 | 1,028,295 |
| | | | 3,144,655 |
| Switzerland–0.59% |
| Swiss Prime Site AG | 12,776 | 1,115,451 |
| Thailand–0.65% |
| AP Thailand PCL | 525,300 | 134,503 |
| Central Pattana PCL | 377,600 | 923,453 |
| Origin Property PCL, Foreign Shares | 76,400 | 19,182 |
| Supalai PCL | 115,500 | 88,506 |
| Supalai PCL, NVDR | 71,700 | 54,943 |
| | | | 1,220,587 |
| Turkey–0.02% |
| Emlak Konut Gayrimenkul Yatirim Ortakligi A.S. | 227,990 | 44,499 |
| United Arab Emirates–0.13% |
| Emaar Development | 112,047 | 122,439 |
| Emaar Malls PJSC | 211,906 | 117,139 |
| | | | 239,578 |
| United Kingdom–3.93% |
| Assura PLC | 871,062 | 705,982 |
| Big Yellow Group PLC | 44,374 | 557,656 |
See accompanying Notes to Financial Statements which are an integral part of the financial statements.
Invesco V.I. Global Real Estate Fund
| | Shares | Value |
| United Kingdom–(continued) |
| British Land Co. PLC (The) | 41,190 | $281,895 |
| Derwent London PLC | 19,701 | 779,822 |
| Grainger PLC | 172,280 | 537,662 |
| Land Securities Group PLC | 119,247 | 1,263,107 |
| SEGRO PLC | 158,615 | 1,471,224 |
| Tritax Big Box REIT PLC | 498,862 | 978,384 |
| UNITE Group PLC (The) | 29,655 | 367,332 |
| Workspace Group PLC | 42,711 | 474,383 |
| | | | 7,417,447 |
| United States–47.96% |
| Agree Realty Corp. | 25,491 | 1,632,699 |
| Alexandria Real Estate Equities, Inc. | 20,130 | 2,840,142 |
| American Assets Trust, Inc. | 15,474 | 729,135 |
| American Homes 4 Rent, Class A | 74,232 | 1,804,580 |
| Americold Realty Trust REIT | 29,663 | 961,674 |
| AvalonBay Communities, Inc. | 23,822 | 4,840,154 |
| Boston Properties, Inc. | 28,365 | 3,659,085 |
| CareTrust REIT, Inc. | 25,706 | 611,289 |
| Corporate Office Properties Trust | 34,289 | 904,201 |
| Crown Castle International Corp. | 12,561 | 1,637,326 |
| CyrusOne, Inc. | 12,435 | 717,748 |
| Digital Realty Trust, Inc. | 17,301 | 2,037,885 |
| EastGroup Properties, Inc. | 5,524 | 640,673 |
| Empire State Realty Trust, Inc., Class A | 44,061 | 652,543 |
| EPR Properties | 11,532 | 860,172 |
| Equity LifeStyle Properties, Inc. | 11,543 | 1,400,628 |
| Equity Residential | 36,347 | 2,759,464 |
| Essential Properties Realty Trust, Inc. | 29,032 | 581,801 |
| Essex Property Trust, Inc. | 7,045 | 2,056,647 |
| Extra Space Storage, Inc. | 6,320 | 670,552 |
| Federal Realty Investment Trust | 11,500 | 1,480,740 |
| Four Corners Property Trust, Inc. | 15,512 | 423,943 |
| Gaming and Leisure Properties, Inc. | 9,051 | 352,808 |
| HCP, Inc. | 69,772 | 2,231,309 |
| Healthcare Realty Trust, Inc. | 81,105 | 2,540,209 |
| Highwoods Properties, Inc. | 5,772 | 238,384 |
| Hilton Worldwide Holdings, Inc. | 15,029 | 1,468,934 |
| Hudson Pacific Properties, Inc. | 80,524 | 2,679,033 |
| Invitation Homes, Inc. | 93,583 | 2,501,474 |
| Liberty Property Trust | 27,264 | 1,364,291 |
| | Shares | Value |
| United States–(continued) |
| Macerich Co. (The) | 34,909 | $1,169,102 |
| Mid-America Apartment Communities, Inc. | 28,318 | 3,334,728 |
| National Retail Properties, Inc. | 28,490 | 1,510,255 |
| Omega Healthcare Investors, Inc. | 11,593 | 426,043 |
| Park Hotels & Resorts, Inc. | 55,512 | 1,529,911 |
| Pebblebrook Hotel Trust | 53,715 | 1,513,689 |
| Prologis, Inc. | 69,451 | 5,563,025 |
| Public Storage | 14,326 | 3,412,023 |
| QTS Realty Trust, Inc., Class A | 23,911 | 1,104,210 |
| Realty Income Corp. | 26,086 | 1,799,151 |
| Regency Centers Corp. | 11,319 | 755,430 |
| Retail Opportunity Investments Corp. | 118,503 | 2,029,956 |
| Rexford Industrial Realty, Inc. | 23,103 | 932,668 |
| RLJ Lodging Trust | 35,387 | 627,765 |
| Simon Property Group, Inc. | 25,535 | 4,079,472 |
| SL Green Realty Corp. | 1,284 | 103,195 |
| STAG Industrial, Inc. | 36,383 | 1,100,222 |
| Sun Communities, Inc. | 16,212 | 2,078,216 |
| Sunstone Hotel Investors, Inc. | 42,004 | 575,875 |
| Terreno Realty Corp. | 16,978 | 832,601 |
| Ventas, Inc. | 52,598 | 3,595,073 |
| VICI Properties, Inc. | 78,036 | 1,719,913 |
| Vornado Realty Trust | 12,239 | 784,520 |
| Weingarten Realty Investors | 11,467 | 314,425 |
| Welltower, Inc. | 29,358 | 2,393,558 |
| | | | 90,564,549 |
| Total Common Stocks & Other Equity Interests (Cost $167,063,983) | 186,159,742 |
| Money Market Funds–0.77% |
| Invesco Government & Agency Portfolio, Institutional Class, 2.26%(d) | 509,803 | 509,803 |
| Invesco Liquid Assets Portfolio, Institutional Class, 2.40%(d) | 364,224 | 364,370 |
| Invesco Treasury Portfolio, Institutional Class, 2.22%(d) | 582,633 | 582,633 |
| Total Money Market Funds (Cost $1,456,736) | 1,456,806 |
| TOTAL INVESTMENTS IN SECURITIES—99.35% (Cost $168,520,719) | 187,616,548 |
| OTHER ASSETS LESS LIABILITIES–0.65% | 1,233,275 |
| NET ASSETS–100.00% | $188,849,823 |
Investment Abbreviations:
| NVDR | – Non-Voting Depositary Receipt |
| REGS | – Regulation S |
| REIT | – Real Estate Investment Trust |
Notes to Schedule of Investments:
| (a) | Non-income producing security. |
| (b) | Security purchased or received in a transaction exempt from registration under the Securities Act of 1933, as amended (the “1933 Act”). The security may be resold pursuant to an exemption from registration under the 1933 Act, typically to qualified institutional buyers. The aggregate value of these securities at June 30, 2019 was $606,484, which represented less than 1% of the Fund’s Net Assets. |
| (c) | Security valued using significant unobservable inputs (Level 3). See Note 3. |
| (d) | The money market fund and the Fund are affiliated by having the same investment adviser. The rate shown is the 7-day SEC standardized yield as of June 30, 2019. |
See accompanying Notes to Financial Statements which are an integral part of the financial statements.
Invesco V.I. Global Real Estate Fund
Portfolio Composition
By country, based on Net Assets
as of June 30, 2019
| United States | 47.96% |
| Japan | 10.41 |
| Hong Kong | 7.64 |
| China | 5.48 |
| Germany | 4.64 |
| Australia | 4.34 |
| United Kingdom | 3.93 |
| Canada | 2.09 |
| Singapore | 2.02 |
| Countries, each less than 2% of portfolio | 10.07 |
| Money Market Funds Plus Other Assets Less Liabilities | 1.42 |
See accompanying Notes to Financial Statements which are an integral part of the financial statements.
Invesco V.I. Global Real Estate Fund
Statement of Assets and Liabilities
June 30, 2019
(Unaudited)
| Assets: | |
Investments in securities, at value
(Cost $167,063,983) | $186,159,742 |
| Investments in affiliated money market funds, at value (Cost $1,456,736) | 1,456,806 |
| Foreign currencies, at value (Cost $318,780) | 320,876 |
| Receivable for: | |
| Fund shares sold | 160,454 |
| Investments sold | 1,007,019 |
| Dividends | 1,007,092 |
| Investment for trustee deferred compensation and retirement plans | 71,534 |
| Other assets | 22,383 |
| Total assets | 190,205,906 |
| Liabilities: | |
| Payable for: | |
| Investments purchased | 1,054,100 |
| Fund shares reacquired | 43,410 |
| Accrued foreign taxes | 17,060 |
| Accrued fees to affiliates | 103,370 |
| Accrued trustees’ and officers’ fees and benefits | 627 |
| Accrued other operating expenses | 57,512 |
| Trustee deferred compensation and retirement plans | 80,004 |
| Total liabilities | 1,356,083 |
| Net assets applicable to shares outstanding | $188,849,823 |
| Net assets consist of: | |
| Shares of beneficial interest | $162,295,678 |
| Distributable earnings | 26,554,145 |
| | $188,849,823 |
| Net Assets: |
| Series I | $145,593,540 |
| Series II | $43,256,283 |
| Shares outstanding, no par value, with an unlimited number of shares authorized: |
| Series I | 8,104,493 |
| Series II | 2,490,492 |
| Series I: | |
| Net asset value per share | $17.96 |
| Series II: | |
| Net asset value per share | $17.37 |
Statement of Operations
For the six months ended June 30, 2019
(Unaudited)
| Investment income: | |
| Dividends (net of foreign withholding taxes of $157,582) | $4,625,770 |
| Dividends from affiliated money market funds | 30,740 |
| Total investment income | 4,656,510 |
| Expenses: | |
| Advisory fees | 675,251 |
| Administrative services fees | 145,177 |
| Custodian fees | 56,997 |
| Distribution fees - Series II | 48,925 |
| Transfer agent fees | 18,884 |
| Trustees’ and officers’ fees and benefits | 12,823 |
| Reports to shareholders | 4,862 |
| Professional services fees | 22,636 |
| Other | 9,342 |
| Total expenses | 994,897 |
| Less: Fees waived | (1,476) |
| Net expenses | 993,421 |
| Net investment income | 3,663,089 |
| Realized and unrealized gain (loss) from: | |
| Net realized gain (loss) from: | |
| Investment securities (net of foreign taxes of $61,280) | 151,883 |
| Foreign currencies | (6,431) |
| | 145,452 |
| Change in net unrealized appreciation of: | |
| Investment securities (net of foreign taxes of $1,281) | 20,439,648 |
| Foreign currencies | 3,214 |
| | 20,442,862 |
| Net realized and unrealized gain | 20,588,314 |
| Net increase in net assets resulting from operations | $24,251,403 |
See accompanying Notes to Financial Statements which are an integral part of the financial statements.
Invesco V.I. Global Real Estate Fund
Statement of Changes in Net Assets
For the six months ended June 30, 2019 and the year ended December 31, 2018
(Unaudited)
| | June 30,
2019 | December 31,
2018 |
| Operations: | | |
| Net investment income | $3,663,089 | $7,824,734 |
| Net realized gain | 145,452 | 32,257,333 |
| Change in net unrealized appreciation (depreciation) | 20,442,862 | (62,318,170) |
| Net increase (decrease) in net assets resulting from operations | 24,251,403 | (22,236,103) |
| Distributions to shareholders from distributable earnings: | | |
| Series I | — | (6,963,469) |
| Series II | — | (12,230,519) |
| Total distributions from distributable earnings | — | (19,193,988) |
| Share transactions–net: | | |
| Series I | 1,202,104 | (17,886,490) |
| Series II | 11,781,494 | (207,381,121) |
| Net increase (decrease) in net assets resulting from share transactions | 12,983,598 | (225,267,611) |
| Net increase (decrease) in net assets | 37,235,001 | (266,697,702) |
| Net assets: | | |
| Beginning of period | 151,614,822 | 418,312,524 |
| End of period | $188,849,823 | $151,614,822 |
See accompanying Notes to Financial Statements which are an integral part of the financial statements.
Invesco V.I. Global Real Estate Fund
Financial Highlights
June 30, 2019
(Unaudited)
The following schedule presents financial highlights for a share of the Fund outstanding throughout the periods indicated.
| | Net asset
value,
beginning
of period | Net
investment
income(a) | Net gains
(losses)
on securities
(both
realized and
unrealized) | Total from
investment
operations | Dividends
from net
investment
income | Distributions
from net
realized
gains | Total
distributions | Net asset
value, end
of period | Total
return(b) | Net assets,
end of period
(000’s omitted) | Ratio of
expenses
to average
net assets
with fee waivers
and/or expenses
absorbed | Ratio of
expenses
to average net
assets without
fee waivers
and/or expenses
absorbed | Ratio of net
investment
income
to average
net assets | Portfolio
turnover(c) |
| Series I |
| Six months ended 06/30/19 | $15.52 | $0.36 | $2.08 | $2.44 | $— | $— | $— | $17.96 | 15.72% | $145,594 | 1.05%(d) | 1.05%(d) | 4.12%(d) | 27% |
| Year ended 12/31/18 | 17.38 | 0.40 | (1.41) | (1.01) | (0.65) | (0.20) | (0.85) | 15.52 | (6.10) | 124,816 | 1.01 | 1.01 | 2.38 | 57 |
| Year ended 12/31/17 | 16.15 | 0.45(e) | 1.62 | 2.07 | (0.56) | (0.28) | (0.84) | 17.38 | 12.98 | 158,229 | 1.02 | 1.02 | 2.63(e) | 50 |
| Year ended 12/31/16 | 16.36 | 0.30 | 0.08 | 0.38 | (0.27) | (0.32) | (0.59) | 16.15 | 2.04 | 147,382 | 1.05 | 1.05 | 1.81 | 66 |
| Year ended 12/31/15 | 17.24 | 0.31 | (0.59) | (0.28) | (0.60) | — | (0.60) | 16.36 | (1.48) | 208,796 | 1.11 | 1.11 | 1.79 | 72 |
| Year ended 12/31/14 | 15.29 | 0.33 | 1.89 | 2.22 | (0.27) | — | (0.27) | 17.24 | 14.62 | 209,829 | 1.10 | 1.10 | 1.99 | 44 |
| Series II |
| Six months ended 06/30/19 | 15.03 | 0.32 | 2.02 | 2.34 | — | — | — | 17.37 | 15.57 | 43,256 | 1.30(d) | 1.30(d) | 3.87(d) | 27 |
| Year ended 12/31/18 | 16.86 | 0.34 | (1.35) | (1.01) | (0.62) | (0.20) | (0.82) | 15.03 | (6.33) | 26,799 | 1.26 | 1.26 | 2.13 | 57 |
| Year ended 12/31/17 | 15.69 | 0.39(e) | 1.58 | 1.97 | (0.52) | (0.28) | (0.80) | 16.86 | 12.73 | 260,083 | 1.27 | 1.27 | 2.38(e) | 50 |
| Year ended 12/31/16 | 15.91 | 0.25 | 0.08 | 0.33 | (0.23) | (0.32) | (0.55) | 15.69 | 1.82 | 216,893 | 1.30 | 1.30 | 1.56 | 66 |
| Year ended 12/31/15 | 16.79 | 0.26 | (0.58) | (0.32) | (0.56) | — | (0.56) | 15.91 | (1.74) | 208,000 | 1.36 | 1.36 | 1.54 | 72 |
| Year ended 12/31/14 | 14.90 | 0.28 | 1.84 | 2.12 | (0.23) | — | (0.23) | 16.79 | 14.34 | 200,299 | 1.35 | 1.35 | 1.74 | 44 |
| (a) | Calculated using average shares outstanding. |
| (b) | Includes adjustments in accordance with accounting principles generally accepted in the United States of America and as such, the net asset value for financial reporting purposes and the returns based upon those net asset values may differ from the net asset value and returns for shareholder transactions. Total returns are not annualized for periods less than one year, if applicable, and do not reflect charges assessed in connection with a variable product, which if included would reduce total returns. |
| (c) | Portfolio turnover is calculated at the fund level and is not annualized for periods less than one year, if applicable. |
| (d) | Ratios are annualized and based on average daily net assets (000’s omitted) of $142,095 and $39,465 for Series I and Series II shares, respectively. |
| (e) | Net investment income per share and the ratio of net investment income to average net assets includes significant dividends received during the period. Net investment income per share and the ratio of net investment income to average net assets excluding the significant dividends are $0.38 and 2.18%, $0.32 and 1.93% for Series I and Series II shares, respectively. |
See accompanying Notes to Financial Statements which are an integral part of the financial statements.
Invesco V.I. Global Real Estate Fund
Notes to Financial Statements
June 30, 2019
(Unaudited)
NOTE 1—Significant Accounting Policies
Invesco V.I. Global Real Estate Fund (the “Fund”) is a series portfolio of AIM Variable Insurance Funds (Invesco Variable Insurance Funds) (the “Trust”). The Trust is a Delaware statutory trust registered under the Investment Company Act of 1940, as amended (the “1940 Act”), as an open-end series management investment company. Information presented in these financial statements pertains only to the Fund. Matters affecting the Fund or each class will be voted on exclusively by the shareholders of the Fund or each class. Current Securities and Exchange Commission (“SEC”) guidance, however, requires participating insurance companies offering separate accounts to vote shares proportionally in accordance with the instructions of the contract owners whose investments are funded by shares of each Fund or class.
The Fund’s investment objective is total return through growth of capital and current income.
The Fund currently offers two classes of shares, Series I and Series II, both of which are offered to insurance company separate accounts funding variable annuity contracts and variable life insurance policies (“variable products”).
The Fund is an investment company and accordingly follows the investment company accounting and reporting guidance in accordance with Financial Accounting Standards Board Accounting Standards Codification Topic 946,Financial Services – Investment Companies.
The following is a summary of the significant accounting policies followed by the Fund in the preparation of its financial statements.
| A. | Security Valuations — Securities, including restricted securities, are valued according to the following policy. |
A security listed or traded on an exchange (except convertible securities) is valued at its last sales price or official closing price as of the close of the customary trading session on the exchange where the security is principally traded, or lacking any sales or official closing price on a particular day, the security may be valued at the closing bid price on that day. Securities traded in the over-the-counter market are valued based on prices furnished by independent pricing services or market makers. When such securities are valued by an independent pricing service they may be considered fair valued. Futures contracts are valued at the final settlement price set by an exchange on which they are principally traded. Listed options are valued at the mean between the last bid and asked prices from the exchange on which they are principally traded. Options not listed on an exchange are valued by an independent source at the mean between the last bid and asked prices. For purposes of determining net asset value (“NAV”) per share, futures and option contracts generally are valued 15 minutes after the close of the customary trading session of the New York Stock Exchange (“NYSE”).
Investments in open-end and closed-end registered investment companies that do not trade on an exchange are valued at the end-of-day net asset value per share. Investments in open-end and closed-end registered investment companies that trade on an exchange are valued at the last sales price or official closing price as of the close of the customary trading session on the exchange where the security is principally traded.
Debt obligations (including convertible securities) and unlisted equities are fair valued using an evaluated quote provided by an independent pricing service. Evaluated quotes provided by the pricing service may be determined without exclusive reliance on quoted prices, and may reflect appropriate factors such as institution-size trading in similar groups of securities, developments related to specific securities, dividend rate (for unlisted equities), yield (for debt obligations), quality, type of issue, coupon rate (for debt obligations), maturity (for debt obligations), individual trading characteristics and other market data. Pricing services generally value debt obligations assuming orderly transactions of institutional round lot size, but a fund may hold or transact in the same securities in smaller, odd lot sizes. Odd lots often trade at lower prices than institutional round lots. Debt obligations are subject to interest rate and credit risks. In addition, all debt obligations involve some risk of default with respect to interest and/or principal payments.
Foreign securities’ (including foreign exchange contracts) prices are converted into U.S. dollar amounts using the applicable exchange rates as of the close of the NYSE. If market quotations are available and reliable for foreign exchange-traded equity securities, the securities will be valued at the market quotations. Because trading hours for certain foreign securities end before the close of the NYSE, closing market quotations may become unreliable. If between the time trading ends on a particular security and the close of the customary trading session on the NYSE, events occur that the investment adviser determines are significant and make the closing price unreliable, the Fund may fair value the security. If the event is likely to have affected the closing price of the security, the security will be valued at fair value in good faith using procedures approved by the Board of Trustees. Adjustments to closing prices to reflect fair value may also be based on a screening process of an independent pricing service to indicate the degree of certainty, based on historical data, that the closing price in the principal market where a foreign security trades is not the current value as of the close of the NYSE. Foreign securities’ prices meeting the approved degree of certainty that the price is not reflective of current value will be priced at the indication of fair value from the independent pricing service. Multiple factors may be considered by the independent pricing service in determining adjustments to reflect fair value and may include information relating to sector indices, American Depositary Receipts and domestic and foreign index futures. Foreign securities may have additional risks including exchange rate changes, potential for sharply devalued currencies and high inflation, political and economic upheaval, the relative lack of issuer information, relatively low market liquidity and the potential lack of strict financial and accounting controls and standards.
Securities for which market prices are not provided by any of the above methods may be valued based upon quotes furnished by independent sources. The last bid price may be used to value equity securities. The mean between the last bid and asked prices is used to value debt obligations, including corporate loans.
Securities for which market quotations are not readily available or became unreliable are valued at fair value as determined in good faith by or under the supervision of the Trust’s officers following procedures approved by the Board of Trustees. Issuer specific events, market trends, bid/asked quotes of brokers and information providers and other market data may be reviewed in the course of making a good faith determination of a security’s fair value.
The Fund may invest in securities that are subject to interest rate risk, meaning the risk that the prices will generally fall as interest rates rise and, conversely, the prices will generally rise as interest rates fall. Specific securities differ in their sensitivity to changes in interest rates depending on their individual characteristics. Changes in interest rates may result in increased market volatility, which may affect the value and/or liquidity of certain Fund investments.
Invesco V.I. Global Real Estate Fund
Valuations change in response to many factors including the historical and prospective earnings of the issuer, the value of the issuer’s assets, general economic conditions, interest rates, investor perceptions and market liquidity. Because of the inherent uncertainties of valuation, the values reflected in the financial statements may materially differ from the value received upon actual sale of those investments.
| B. | Securities Transactions and Investment Income – Securities transactions are accounted for on a trade date basis. Realized gains or losses on sales are computed on the basis of specific identification of the securities sold. Interest income (net of withholding tax, if any) is recorded on the accrual basis from settlement date. Dividend income (net of withholding tax, if any) is recorded on the ex-dividend date. |
The Fund may periodically participate in litigation related to Fund investments. As such, the Fund may receive proceeds from litigation settlements. Any proceeds received are included in the Statement of Operations as realized gain (loss) for investments no longer held and as unrealized gain (loss) for investments still held.
Brokerage commissions and mark ups are considered transaction costs and are recorded as an increase to the cost basis of securities purchased and/or a reduction of proceeds on a sale of securities. Such transaction costs are included in the determination of net realized and unrealized gain (loss) from investment securities reported in the Statement of Operations and the Statement of Changes in Net Assets and the net realized and unrealized gains (losses) on securities per share in the Financial Highlights. Transaction costs are included in the calculation of the Fund’s net asset value and, accordingly, they reduce the Fund’s total returns. These transaction costs are not considered operating expenses and are not reflected in net investment income reported in the Statement of Operations and the Statement of Changes in Net Assets, or the net investment income per share and the ratios of expenses and net investment income reported in the Financial Highlights, nor are they limited by any expense limitation arrangements between the Fund and the investment adviser.
The Fund allocates income and realized and unrealized capital gains and losses to a class based on the relative net assets of each class.
The Fund recharacterizes distributions received from REIT investments based on information provided by the REIT into the following categories: ordinary income, long-term and short-term capital gains, and return of capital. If information is not available on a timely basis from the REIT, the recharacterization will be based on available information which may include the previous year’s allocation. If new or additional information becomes available from the REIT at a later date, a recharacterization will be made in the following year. The Fund records as dividend income the amount recharacterized as ordinary income and as realized gain the amount recharacterized as capital gain in the Statement of Operations, and the amount recharacterized as return of capital as a reduction of the cost of the related investment. These recharacterizations are reflected in the accompanying financial statements.
| C. | Country Determination — For the purposes of making investment selection decisions and presentation in the Schedule of Investments, the investment adviser may determine the country in which an issuer is located and/or credit risk exposure based on various factors. These factors include the laws of the country under which the issuer is organized, where the issuer maintains a principal office, the country in which the issuer derives 50% or more of its total revenues and the country that has the primary market for the issuer’s securities, as well as other criteria. Among the other criteria that may be evaluated for making this determination are the country in which the issuer maintains 50% or more of its assets, the type of security, financial guarantees and enhancements, the nature of the collateral and the sponsor organization. Country of issuer and/or credit risk exposure has been determined to be the United States of America, unless otherwise noted. |
| D. | Distributions– Distributions from net investment income and net realized capital gain, if any, are generally declared and paid to separate accounts of participating insurance companies annually and recorded on the ex-dividend date. |
| E. | Federal Income Taxes –The Fund intends to comply with the requirements of Subchapter M of the Internal Revenue Code of 1986, as amended (the “Internal Revenue Code”), necessary to qualify as a regulated investment company and to distribute substantially all of the Fund’s taxable earnings to shareholders. As such, the Fund will not be subject to federal income taxes on otherwise taxable income (including net realized capital gain) that is distributed to shareholders. Therefore, no provision for federal income taxes is recorded in the financial statements. |
The Fund recognizes the tax benefits of uncertain tax positions only when the position is more likely than not to be sustained. Management has analyzed the Fund’s uncertain tax positions and concluded that no liability for unrecognized tax benefits should be recorded related to uncertain tax positions. Management is not aware of any tax positions for which it is reasonably possible that the total amounts of unrecognized tax benefits will change materially in the next 12 months.
The Fund files tax returns in the U.S. Federal jurisdiction and certain other jurisdictions. Generally, the Fund is subject to examinations by such taxing authorities for up to three years after the filing of the return for the tax period.
| F. | Expenses– Fees provided for under the Rule 12b-1 plan of a particular class of the Fund and which are directly attributable to that class are charged to the operations of such class. All other expenses are allocated among the classes based on relative net assets. |
| G. | Accounting Estimates – The preparation of financial statements in conformity with accounting principles generally accepted in the United States of America (“GAAP”) requires management to make estimates and assumptions that affect the reported amounts of assets and liabilities at the date of the financial statements and the reported amounts of revenues and expenses during the reporting period including estimates and assumptions related to taxation. Actual results could differ from those estimates by a significant amount. In addition, the Fund monitors for material events or transactions that may occur or become known after the period-end date and before the date the financial statements are released to print. |
| H. | Indemnifications – Under the Trust’s organizational documents, each Trustee, officer, employee or other agent of the Trust is indemnified against certain liabilities that may arise out of the performance of their duties to the Fund. Additionally, in the normal course of business, the Fund enters into contracts, including the Fund’s servicing agreements, that contain a variety of indemnification clauses. The Fund’s maximum exposure under these arrangements is unknown as this would involve future claims that may be made against the Fund that have not yet occurred. The risk of material loss as a result of such indemnification claims is considered remote. |
| I. | Foreign Currency Translations— Foreign currency is valued at the close of the NYSE based on quotations posted by banks and major currency dealers. Portfolio securities and other assets and liabilities denominated in foreign currencies are translated into U.S. dollar amounts at the date of valuation. Purchases and sales of portfolio securities (net of foreign taxes withheld on disposition) and income items denominated in foreign currencies are translated into U.S. dollar amounts on the respective dates of such transactions. The Fund does not separately account for the portion of the results of operations resulting from changes in foreign exchange rates on investments and the fluctuations arising from changes in market prices of securities held. The combined results of changes in foreign exchange rates and the fluctuation of market prices on investments (net of estimated foreign tax withholding) are included with the net realized and unrealized gain or loss from investments in the Statement of Operations. Reported net realized foreign currency gains or losses arise from (1) sales of foreign currencies, (2) currency gains or |
Invesco V.I. Global Real Estate Fund
| | losses realized between the trade and settlement dates on securities transactions, and (3) the difference between the amounts of dividends, interest, and foreign withholding taxes recorded on the Fund’s books and the U.S. dollar equivalent of the amounts actually received or paid. Net unrealized foreign currency gains and losses arise from changes in the fair values of assets and liabilities, other than investments in securities at fiscal period end, resulting from changes in exchange rates. |
The Fund may invest in foreign securities, which may be subject to foreign taxes on income, gains on investments or currency repatriation, a portion of which may be recoverable. Foreign taxes, if any, are recorded based on the tax regulations and rates that exist in the foreign markets in which the Fund invests and are shown in the Statement of Operations.
| J. | Forward Foreign Currency Contracts— The Fund may engage in foreign currency transactions either on a spot (i.e. for prompt delivery and settlement) basis, or through forward foreign currency contracts, to manage or minimize currency or exchange rate risk. |
The Fund may also enter into forward foreign currency contracts for the purchase or sale of a security denominated in a foreign currency in order to “lock in” the U.S. dollar price of that security, or the Fund may also enter into forward foreign currency contracts that do not provide for physical settlement of the two currencies, but instead are settled by a single cash payment calculated as the difference between the agreed upon exchange rate and the spot rate at settlement based upon an agreed upon notional amount (non-deliverable forwards). The Fund will set aside liquid assets in an amount equal to the daily mark-to-market obligation for forward foreign currency contracts.
A forward foreign currency contract is an obligation between two parties (“Counterparties”) to purchase or sell a specific currency for an agreed-upon price at a future date. The use of forward foreign currency contracts does not eliminate fluctuations in the price of the underlying securities the Fund owns or intends to acquire but establishes a rate of exchange in advance. Fluctuations in the value of these contracts are measured by the difference in the contract date and reporting date exchange rates and are recorded as unrealized appreciation (depreciation) until the contracts are closed. When the contracts are closed, realized gains (losses) are recorded. Realized and unrealized gains (losses) on the contracts are included in the Statement of Operations. The primary risks associated with forward foreign currency contracts include failure of the Counterparty to meet the terms of the contract and the value of the foreign currency changing unfavorably. These risks may be in excess of the amounts reflected in the Statement of Assets and Liabilities.
| K. | Other Risks - The Fund’s investments are concentrated in a comparatively narrow segment of the economy. Consequently, the Fund may tend to be more volatile than other mutual funds, and the value of the Fund’s investments may tend to rise and fall more rapidly. |
Because the Fund concentrates its assets in the real estate industry, an investment in the Fund will be closely linked to the performance of the real estate markets. Property values may fall due to increasing vacancies or declining rents resulting from economic, legal, cultural or technological developments.
NOTE 2—Advisory Fees and Other Fees Paid to Affiliates
The Trust has entered into a master investment advisory agreement with Invesco Advisers, Inc. (the "Adviser" or "Invesco"). Under the terms of the investment advisory agreement, the Fund accrues daily and pays monthly an advisory fee to the Adviser based on the annual rate of the Fund’s average daily net assets as follows:
| Average Daily Net Assets | Rate |
| First $250 million | 0.75% |
| Next $250 million | 0.74% |
| Next $500 million | 0.73% |
| Next $1.5 billion | 0.72% |
| Next $2.5 billion | 0.71% |
| Next $2.5 billion | 0.70% |
| Next $2.5 billion | 0.69% |
| Over $10 billion | 0.68% |
For the six months ended June 30, 2019, the effective advisory fees incurred by the Fund was 0.75%.
Under the terms of a master sub-advisory agreement between the Adviser and each of Invesco Asset Management Deutschland GmbH, Invesco Asset Management Limited, Invesco Asset Management (Japan) Limited, Invesco Hong Kong Limited, Invesco Senior Secured Management, Inc. and Invesco Canada Ltd. and separate sub-advisory agreements with Invesco Capital Management LLC and Invesco Asset Management (India) Private Limited (collectively, the "Affiliated Sub-Advisers") the Adviser, not the Fund, will pay 40% of the fees paid to the Adviser to any such Affiliated Sub-Adviser(s) that provide(s) discretionary investment management services to the Fund based on the percentage of assets allocated to such Affiliated Sub-Adviser(s).
The Adviser has contractually agreed, through at least June 30, 2020, to waive advisory fees and/or reimburse expenses of all shares to the extent necessary to limit total annual fund operating expenses after fee waiver and/or expense reimbursement (excluding certain items discussed below) of Series I shares to 2.00% and Series II shares to 2.25% of average daily net assets (the “expense limits”). In determining the Adviser’s obligation to waive advisory fees and/or reimburse expenses, the following expenses are not taken into account, and could cause the total annual fund operating expenses after fee waiver and/or expense reimbursement to exceed the numbers reflected above: (1) interest; (2) taxes; (3) dividend expense on short sales; (4) extraordinary or non-routine items, including litigation expenses; and (5) expenses that the Fund has incurred but did not actually pay because of an expense offset arrangement. Unless Invesco continues the fee waiver agreement, it will terminate on June 30, 2020. During its term, the fee waiver agreement cannot be terminated or amended to increase the expense limits or reduce the advisory fee waiver without approval of the Board of Trustees. The Adviser did not waive fees and/or reimburse expenses during the period under these expense limits.
Further, the Adviser has contractually agreed, through at least June 30, 2021, to waive the advisory fee payable by the Fund in an amount equal to 100% of the net advisory fees the Adviser receives from the affiliated money market funds on investments by the Fund of uninvested cash in such affiliated money market funds.
For the six months ended June 30, 2019, the Adviser waived advisory fees of $1,476.
Invesco V.I. Global Real Estate Fund
The Trust has entered into a master administrative services agreement with Invesco pursuant to which the Fund has agreed to pay Invesco a fee for costs incurred in providing accounting services and fund administrative services to the Fund and to reimburse Invesco for fees paid to insurance companies that have agreed to provide certain administrative services to the Fund. These administrative services provided by the insurance companies may include, among other things: maintenance of master accounts with the Fund; tracking, recording and transmitting net purchase and redemption orders for Fund shares; maintaining and preserving records related to the purchase, redemption and other account activity of variable product owners; distributing copies of Fund documents such as prospectuses, proxy materials and periodic reports, to variable product owners, and responding to inquiries from variable product owners about the Fund. Pursuant to such agreement, for the six months ended June 30, 2019, Invesco was paid $12,711 for accounting and fund administrative services and was reimbursed $132,466 for fees paid to insurance companies. Also, Invesco has entered into a sub-administration agreement whereby State Street Bank and Trust Company (“SSB”) serves as custodian and fund accountant and provides certain administrative services to the Fund.
The Trust has entered into a transfer agency and service agreement with Invesco Investment Services, Inc. (“IIS”) pursuant to which the Fund has agreed to pay IIS a fee for providing transfer agency and shareholder services to the Fund and reimburse IIS for certain expenses incurred by IIS in the course of providing such services. For the six months ended June 30, 2019, expenses incurred under the agreement are shown in the Statement of Operations asTransfer agent fees.
The Trust has entered into a master distribution agreement with Invesco Distributors, Inc. (“IDI”) to serve as the distributor for the Fund. The Trust has adopted a plan pursuant to Rule 12b-1 under the 1940 Act with respect to the Fund’s Series II shares (the “Plan”). The Fund, pursuant to the Plan, pays IDI compensation at the annual rate of 0.25% of the Fund’s average daily net assets of Series II shares. The fees are accrued daily and paid monthly. Of the Plan payments, up to 0.25% of the average daily net assets of the Series II shares may be paid to insurance companies who furnish continuing personal shareholder services to customers who purchase and own Series II shares of the Fund. For the six months ended June 30, 2019, expenses incurred under the Plan are detailed in the Statement of Operations asDistribution fees.
Certain officers and trustees of the Trust are officers and directors of the Adviser, IIS and/or IDI.
NOTE 3—Additional Valuation Information
GAAP defines fair value as the price that would be received to sell an asset or paid to transfer a liability in an orderly transaction between market participants at the measurement date, under current market conditions. GAAP establishes a hierarchy that prioritizes the inputs to valuation methods, giving the highest priority to readily available unadjusted quoted prices in an active market for identical assets (Level 1) and the lowest priority to significant unobservable inputs (Level 3), generally when market prices are not readily available or are unreliable. Based on the valuation inputs, the securities or other investments are tiered into one of three levels. Changes in valuation methods may result in transfers in or out of an investment’s assigned level:
Level 1 – Prices are determined using quoted prices in an active market for identical assets.
Level 2 – Prices are determined using other significant observable inputs. Observable inputs are inputs that other market participants may use in pricing a security. These may include quoted prices for similar securities, interest rates, prepayment speeds, credit risk, yield curves, loss severities, default rates, discount rates, volatilities and others.
Level 3 – Prices are determined using significant unobservable inputs. In situations where quoted prices or observable inputs are unavailable (for example, when there is little or no market activity for an investment at the end of the period), unobservable inputs may be used. Unobservable inputs reflect the Fund’s own assumptions about the factors market participants would use in determining fair value of the securities or instruments and would be based on the best available information.
The following is a summary of the tiered valuation input levels, as of June 30, 2019. The level assigned to the securities valuations may not be an indication of the risk or liquidity associated with investing in those securities. Because of the inherent uncertainties of valuation, the values reflected in the financial statements may materially differ from the value received upon actual sale of those investments.
Invesco V.I. Global Real Estate Fund
| | Level 1 | Level 2 | Level 3 | Total |
| Investments in Securities | | | | |
| Australia | $— | $8,190,327 | $— | $8,190,327 |
| Brazil | 1,085,043 | — | — | 1,085,043 |
| Canada | 3,944,300 | — | — | 3,944,300 |
| Chile | 167,682 | — | — | 167,682 |
| China | — | 10,354,190 | — | 10,354,190 |
| France | 57,978 | 3,517,403 | — | 3,575,381 |
| Germany | — | 8,759,250 | — | 8,759,250 |
| Hong Kong | — | 14,425,321 | — | 14,425,321 |
| India | 57,422 | 468,840 | — | 526,262 |
| Indonesia | — | 481,834 | — | 481,834 |
| Ireland | — | 558,025 | — | 558,025 |
| Japan | — | 19,661,792 | — | 19,661,792 |
| Malaysia | — | 627,059 | — | 627,059 |
| Malta | — | — | 0 | 0 |
| Mexico | 908,992 | — | — | 908,992 |
| Netherlands | 500,292 | — | — | 500,292 |
| Philippines | — | 1,714,243 | — | 1,714,243 |
| Singapore | — | 3,824,058 | — | 3,824,058 |
| South Africa | — | 1,528,837 | — | 1,528,837 |
| Spain | — | 1,580,088 | — | 1,580,088 |
| Sweden | — | 3,144,655 | — | 3,144,655 |
| Switzerland | — | 1,115,451 | — | 1,115,451 |
| Thailand | 1,165,644 | 54,943 | — | 1,220,587 |
| Turkey | — | 44,499 | — | 44,499 |
| United Arab Emirates | — | 239,578 | — | 239,578 |
| United Kingdom | — | 7,417,447 | — | 7,417,447 |
| United States | 90,564,549 | — | — | 90,564,549 |
| Money Market Funds | 1,456,806 | — | — | 1,456,806 |
| Total Investments | $99,908,708 | $87,707,840 | $0 | $187,616,548 |
NOTE 4—Trustees’ and Officers’ Fees and Benefits
Trustees’ and Officers’ Fees and Benefits include amounts accrued by the Fund to pay remuneration to certain Trustees and Officers of the Fund. Trustees have the option to defer compensation payable by the Fund, and Trustees’ and Officers’ Fees and Benefits also include amounts accrued by the Fund to fund such deferred compensation amounts. Those Trustees who defer compensation have the option to select various Invesco Funds in which their deferral accounts shall be deemed to be invested. Finally, certain current Trustees were eligible to participate in a retirement plan that provided for benefits to be paid upon retirement to Trustees over a period of time based on the number of years of service. The Fund may have certain former Trustees who also participate in a retirement plan and receive benefits under such plan.Trustees’ and Officers’ Fees and Benefits include amounts accrued by the Fund to fund such retirement benefits. Obligations under the deferred compensation and retirement plans represent unsecured claims against the general assets of the Fund.
NOTE 5—Cash Balances
The Fund is permitted to temporarily carry a negative or overdrawn balance in its account with State Street Bank and Trust Company, the custodian bank. Such balances, if any at period-end, are shown in the Statement of Assets and Liabilities under the payable caption Amount due custodian. To compensate the custodian bank for such overdrafts, the overdrawn Fund may either (1) leave funds as a compensating balance in the account so the custodian bank can be compensated by earning the additional interest; or (2) compensate by paying the custodian bank at a rate agreed upon by the custodian bank and Invesco, not to exceed the contractually agreed upon rate.
NOTE 6—Tax Information
The amount and character of income and gains to be distributed are determined in accordance with income tax regulations, which may differ from GAAP. Reclassifications are made to the Fund’s capital accounts to reflect income and gains available for distribution (or available capital loss carryforward) under income tax regulations. The tax character of distributions paid during the year and the tax components of net assets will be reported at the Fund’s fiscal year-end.
Capital loss carryforward is calculated and reported as of a specific date. Results of transactions and other activity after that date may affect the amount of capital loss carryforward actually available for the Fund to utilize. Capital losses generated in years beginning after December 22, 2010 can be carried forward for an unlimited period, whereas previous losses expire in eight tax years. Capital losses with an expiration period may not be
Invesco V.I. Global Real Estate Fund
used to offset capital gains until all net capital losses without an expiration date have been utilized. Capital loss carryforwards with no expiration date will retain their character as either short-term or long-term capital losses instead of as short-term capital losses as under prior law. The ability to utilize capital loss carryforwards in the future may be limited under the Internal Revenue Code and related regulations based on the results of future transactions.
The Fund had a capital loss carryforward as of December 31, 2018, as follows:
| Capital Loss Carryforward* |
| Expiration | Short-Term | Long-Term | Total |
| Not subject to expiration | $114,768 | $— | $114,768 |
| * | Capital loss carryforward as of the date listed above is reduced for limitations, if any, to the extent required by the Internal Revenue Code and may be further limited depending upon a variety of factors, including the realization of net unrealized gains or losses as of the date of any reorganization. |
NOTE 7—Investment Transactions
The aggregate amount of investment securities (other than short-term securities, U.S. Treasury obligations and money market funds, if any) purchased and sold by the Fund during the six months ended June 30, 2019 was $62,527,314 and $47,964,278, respectively. Cost of investments, including any derivatives, on a tax basis includes the adjustments for financial reporting purposes as of the most recently completed federal income tax reporting period-end.
| Unrealized Appreciation (Depreciation) of Investments on a Tax Basis |
| Aggregate unrealized appreciation of investments | $20,791,541 |
| Aggregate unrealized (depreciation) of investments | (5,874,945) |
| Net unrealized appreciation of investments | $14,916,596 |
Cost of investments for tax purposes is $172,699,952.
NOTE 8—Share Information
| | Summary of Share Activity |
| | Six months ended
June 30, 2019(a) | | Year ended
December 31, 2018 |
| | Shares | Amount | | Shares | Amount |
| Sold: | | | | | |
| Series I | 1,197,808 | $20,908,495 | | 1,662,498 | $28,085,608 |
| Series II | 1,065,029 | 17,479,464 | | 1,936,421 | 31,871,041 |
| Issued as reinvestment of dividends: | | | | | |
| Series I | — | — | | 418,729 | 6,963,469 |
| Series II | — | — | | 759,188 | 12,230,519 |
| Reacquired: | | | | | |
| Series I | (1,133,487) | (19,706,391) | | (3,142,606) | (52,935,567) |
| Series II | (357,806) | (5,697,970) | | (16,340,645) | (251,482,681) |
| Net increase (decrease) in share activity | 771,544 | $12,983,598 | | (14,706,415) | $(225,267,611) |
| (a) | There are entities that are record owners of more than 5% of the outstanding shares of the Fund and in the aggregate own 63% of the outstanding shares of the Fund. The Fund and the Fund’s principal underwriter or adviser, are parties to participation agreements with these entities whereby these entities sell units of interest in separate accounts funding variable products that are invested in the Fund. The Fund, Invesco and/or Invesco affiliates may make payments to these entities, which are considered to be related to the Fund, for providing services to the Fund, Invesco and/or Invesco affiliates including but not limited to services such as, securities brokerage, third party record keeping and account servicing and administrative services. The Fund has no knowledge as to whether all or any portion of the shares owned of record by these entities are also owned beneficially. |
Invesco V.I. Global Real Estate Fund
Calculating your ongoing Fund expenses
Example
As a shareholder of the Fund, you incur ongoing costs, including management fees; distribution and/or service fees (12b-1); and other Fund expenses. This example is intended to help you understand your ongoing costs (in dollars) of investing in the Fund and to compare these costs with ongoing costs of investing in other mutual funds. The example is based on an investment of $1,000 invested at the beginning of the period and held for the entire period January 1, 2019 through June 30, 2019.
The actual and hypothetical expenses in the examples below do not represent the effect of any fees or other expenses assessed in connection with a variable product; if they did, the expenses shown would be higher while the ending account values shown would be lower.
Actual expenses
The table below provides information about actual account values and actual expenses. You may use the information in this table, together with the amount you invested, to estimate the expenses that you paid over the period. Simply divide your account value by $1,000 (for example, an $8,600 account value divided by $1,000 = 8.6), then multiply the result by the number in the table under the heading entitled “Actual Expenses Paid During Period” to estimate the expenses you paid on your account during this period.
Hypothetical example for comparison purposes
The table below also provides information about hypothetical account values and hypothetical expenses based on the Fund’s actual expense ratio and an assumed rate of return of 5% per year before expenses, which is not the Fund’s actual return.
The hypothetical account values and expenses may not be used to estimate the actual ending account balance or expenses you paid for the period. You may use this information to compare the ongoing costs of investing in the Fund and other funds. To do so, compare this 5% hypothetical example with the 5% hypothetical examples that appear in the shareholder reports of the other funds.
Please note that the expenses shown in the table are meant to highlight your ongoing costs. Therefore, the hypothetical information is useful in comparing ongoing costs, and will not help you determine the relative total costs of owning different funds.
| | Beginning
Account Value (01/01/19) | ACTUAL | HYPOTHETICAL
(5% annual return before
expenses) | Annualized
Expense
Ratio |
Ending
Account Value
(06/30/19)1 | Expenses
Paid During
Period2 | Ending
Account Value
(06/30/19) | Expenses
Paid During
Period2 |
| Series I | $1,000.00 | $1,157.20 | $5.62 | $1,019.59 | $5.26 | 1.05% |
| Series II | 1,000.00 | 1,155.70 | 6.95 | 1,018.35 | 6.51 | 1.30 |
| 1 | The actual ending account value is based on the actual total return of the Fund for the period January 1, 2019 through June 30, 2019, after actual expenses and will differ from the hypothetical ending account value which is based on the Fund’s expense ratio and a hypothetical annual return of 5% before expenses. |
| 2 | Expenses are equal to the Fund’s annualized expense ratio as indicated above multiplied by the average account value over the period, multiplied by 181/365 to reflect the most recent fiscal half year. |
Invesco V.I. Global Real Estate Fund
Invesco V.I. Global Real Estate Fund
Approval of Investment Advisory andSub-Advisory Contracts
At meetings held on June 10, 2019, the Board of Trustees (the Board or the Trustees) of AIM Variable Insurance Funds (Invesco Variable Insurance Funds) as a whole, and the independent Trustees, who comprise over 75% of the Board, voting separately, approved the continuance of the Invesco V.I. Global Real Estate Fund’s (the Fund) Master Investment Advisory Agreement with Invesco Advisers, Inc. (Invesco Advisers and the investment advisory agreement) and the Master IntergroupSub-Advisory Contract for Mutual Funds with Invesco Asset Management Deutschland GmbH, Invesco Asset Management Limited, Invesco Asset Management (Japan) Limited, Invesco Hong Kong Limited, Invesco Senior Secured Management, Inc. and Invesco Canada Ltd. and separatesub-advisory contracts with Invesco Capital Management LLC and Invesco Asset Management (India) Private Limited (collectively, the AffiliatedSub-Advisers and thesub-advisory contracts) for another year, effective July 1, 2019. After evaluating the factors discussed below, among others, the Board approved the renewal of the Fund’s investment advisory agreement and thesub-advisory contracts and determined that the compensation payable by the Fund to Invesco Advisers and by Invesco Advisers to the AffiliatedSub-Advisers is fair and reasonable.
The Board’s Evaluation Process
The Board’s Investments Committee has established threeSub-Committees, which meet throughout the year to review the performance of funds advised by Invesco Advisers (the Invesco Funds). As part of a regularly scheduled basis ofin-person Board meetings, theSub-Committees meet with portfolio managers for their assigned Invesco Funds and other members of management to review detailed information about investment performance and portfolio attributes of these funds. The Board took into account evaluations and reports that it received from the Investments Committee andSub-Committees, as well as the information provided to such committees and the Board throughout the year, in considering whether to approve each Invesco Fund’s investment advisory agreement andsub-advisory contracts.
As part of the contract renewal process, the Board reviews and considers information provided in response to detailed requests for information submitted to management by the independent Trustees with assistance from legal counsel to the independent Trustees. The Board receives comparative investment performance and fee data regarding the Invesco Funds prepared by Invesco Advisers and Broadridge Financial Solutions, Inc. (Broadridge), an independent mutual fund data provider. The Board also receives an independent written evaluation from the Senior Officer, an officer of the Invesco Funds who reports directly to the
independent Trustees. The Senior Officer’s evaluation is prepared as part of his responsibility to manage the process by which the Invesco Funds’ proposed management fees are negotiated during the annual contract renewal process to ensure they are negotiated in a manner that is at arms’ length and reasonable. In addition to meetings with Invesco Advisers and fund counsel throughout the year, the independent Trustees also discuss the continuance of the investment advisory agreement andsub-advisory contracts in separate sessions with the Senior Officer and with independent legal counsel.
The discussion below is a summary of the Senior Officer’s independent written evaluation with respect to the Fund’s investment advisory agreement, as well as a discussion of the material factors and related conclusions that formed the basis for the Board’s approval of the Fund’s investment advisory agreement andsub-advisory contracts. The Trustees’ review and conclusions are based on the comprehensive consideration of all information presented to them during the course of the year and in prior years and are not the result of any single determinative factor. Moreover, one Trustee may have weighed a particular piece of information or factor differently than another Trustee. This information is current as of June 10, 2019.
Factors and Conclusions and Summary of Independent Written Fee Evaluation
| A. | Nature, Extent and Quality of Services Provided by Invesco Advisers and the Affiliated Sub-Advisers |
The Board reviewed the nature, extent and quality of the advisory services provided to the Fund by Invesco Advisers under the Fund’s investment advisory agreement, and the credentials and experience of the officers and employees of Invesco Advisers who provide these services, including the Fund’s portfolio manager(s). The Board’s review included consideration of Invesco Advisers’ investment process oversight and structure, credit analysis and investment risk management. The Board also considerednon-advisory services that Invesco Advisers and its affiliates provide to the Invesco Funds such as various back office support functions, third party oversight, internal audit, valuation, portfolio trading and legal and compliance. The Board also received and reviewed information about Invesco Advisers’ role as administrator of the Invesco Funds’ liquidity risk management program. The Board also reviewed and considered the benefits to shareholders of investing in a fund that is part of the Invesco family of funds under the umbrella of Invesco Ltd., Invesco Advisers’ parent company, and noted Invesco Ltd.’s depth and experience in conducting an investment management business, as well as its
commitment of financial and other resources to such business. The Board reviewed and considered information about the resources that Invesco Advisers intends to continue to commit to managing the Invesco family of funds following Invesco Ltd.’s acquisition of OppenheimerFunds, Inc. and its subsidiaries. The Board concluded that the nature, extent and quality of the services provided to the Fund by Invesco Advisers are appropriate and satisfactory.
The Board reviewed the services that may be provided by the Affiliated Sub-Advisers under the sub-advisory contracts and the credentials and experience of the officers and employees of the Affiliated Sub-Advisers who provide these services. The Board noted the AffiliatedSub-Advisers’ expertise with respect to certain asset classes and that the AffiliatedSub-Advisers have offices and personnel that are located in financial centers around the world. As a result, the Board noted that the Affiliated Sub-Advisers can provide research and investment analysis on the markets and economies of various countries in which the Fund may invest, make recommendations regarding securities and assist with security trades. The Board concluded that thesub-advisory contracts may benefit the Fund and its shareholders by permitting Invesco Advisers to use the resources and talents of the Affiliated Sub-Advisers in managing the Fund. The Board concluded that the nature, extent and quality of the services that may be provided by the Affiliated Sub-Advisers are appropriate and satisfactory.
| B. | Fund Investment Performance |
The Board considered Fund investment performance as a relevant factor in considering whether to approve the investment advisory agreement as well as thesub-advisory contracts for the Fund, as Invesco Asset Management Limited currently manages assets of the Fund.
The Board compared the Fund’s investment performance over multiple time periods ending December 31, 2018 to the performance of funds in the Broadridge performance universe and against the Lipper Variable Underlying Funds Global Real Estate Funds Index. The Board noted that performance of Series I shares of the Fund was in the second quintile of its performance universe for the one, three and five year periods (the first quintile being the best performing funds and the fifth quintile being the worst performing funds). The Board noted that performance of Series I shares of the Fund was above the performance of the Index for the one, three and five year periods. The Trustees also reviewed more recent Fund performance and this review did not change their conclusions.
Invesco V.I. Global Real Estate Fund
| C. | Advisory and Sub-Advisory Fees and Fund Expenses |
The Board compared the Fund’s contractual management fee rate to the contractual management fee rates of funds in the Fund’s Broadridge expense group. The Board noted that the contractual management fee rate for Series I shares of the Fund was below the median contractual management fee rate of funds in its expense group. The Board noted that the term “contractual management fee” for funds in the expense group may include both advisory and certainnon-portfolio management administrative services fees, but that Broadridge does not provide information on a fund by fund basis as to what is included. The Board also reviewed the methodology used by Broadridge in providing expense group information, which includes using each fund’s contractual management fee schedule (including any applicable breakpoints) as reported in the most recent prospectus or statement of additional information for each fund in the expense group. The Board also considered comparative information regarding the Fund’s total expense ratio and its various components.
The Board noted that Invesco Advisers has contractually agreed to waive fees and/or limit expenses of the Fund for the term disclosed in the Fund’s registration statement in an amount necessary to limit total annual operating expenses to a specified percentage of average daily net assets for each class of the Fund.
The Board also considered the fees charged by Invesco Advisers and the AffiliatedSub-Advisers to other similarly managed client accounts. The Board noted that Invesco Advisers or the AffiliatedSub-Advisers may charge lower fees to large institutional clients. Invesco Advisers reviewed with the Board differences in the scope of services it provides to the Invesco Funds relative to certain other types of client accounts, including management of cash flows as a result of redemptions and purchases, necessary infrastructure such as officers, office space, technology, legal and distribution, oversight of service providers, costs and business risks associated with launching new funds and sponsoring and maintaining the product line, preparation of annual registration statement updates and financial information and compliance with federal and state laws and regulations.
The Board also compared the Fund’s effective advisory fee rate (the advisory fee rate after advisory fee waivers and before other expense limitations/waivers) to the effective advisory fee rates of other similarly managed third-party mutual funds advised orsub-advised by Invesco Advisers and its affiliates, based on asset balances as of December 31, 2018.
The Board also considered the services that may be provided by the AffiliatedSub-Advisers pursuant to thesub-advisory contracts, as well as the fees payable by Invesco Advisers to the AffiliatedSub-Advisers pursuant to thesub-advisory contracts. The Board noted that
Invesco Advisers retains overall responsibility for, and provides services to,sub-advised Invesco Funds, including oversight of the AffiliatedSub-Advisers as well as the additional services described herein other thanday-to-day portfolio management.
| D. | Economies of Scale and Breakpoints |
The Board considered the extent to which there may be economies of scale in the provision of advisory services to the Fund. The Board considered Invesco’s reinvestment in its business, including investments in business infrastructure and cybersecurity. The Board also considered that the Fund may benefit from economies of scale through contractual breakpoints in the Fund’s advisory fee schedule, which generally operate to reduce the Fund’s expense ratio as it grows in size. The Board noted that the Fund shares directly in economies of scale through lower fees charged by third party service providers based on the combined size of the Invesco Funds. The Board noted that the Fund may also benefit from economies of scale through initial fee setting, fee waivers and expense reimbursements.
| E. | Profitability and Financial Resources |
The Board reviewed information from Invesco Advisers concerning the costs of the advisory and other services that Invesco Advisers and its affiliates provide to the Fund and the Invesco Funds and the profitability of Invesco Advisers and its affiliates in providing these services. The Board considered the methodology used for calculating profitability and noted the periodic review of such methodology by an independent consultant. The Board noted that Invesco Advisers continues to operate at a net profit from services Invesco Advisers and its affiliates provide to the Invesco Funds and the Fund. The Board did not deem the level of profits realized by Invesco Advisers and its affiliates from providing services to the Fund to be excessive given the nature, extent and quality of the services provided. The Board received information from Invesco Advisers demonstrating that Invesco Advisers and the Affiliated Sub-Advisers are financially sound and have the resources necessary to perform their obligations under the investment advisory agreement and sub-advisory contracts.
| F. | Collateral Benefits to Invesco Advisers and its Affiliates |
The Board considered various other benefits received by Invesco Advisers and its affiliates from the relationship with the Fund, including the fees received for providing administrative, transfer agency and distribution services to the Fund. The Board considered comparative information regarding fees charged for these services, including information provided by Broadridge and other independent sources. The Board considered the performance of Invesco Advisers and its affiliates in providing these services and the organizational structure employed to provide these services. The Board also considered that these services are provided to the Fund pursuant to written contracts that are reviewed and approved on an annual basis
by the Board; and that the services are required for the operation of the Fund.
The Board considered the benefits realized by Invesco Advisers and the AffiliatedSub-Advisers as a result of portfolio brokerage transactions executed through “soft dollar” arrangements. The Board noted that soft dollar arrangements may result in the Fund bearing costs to purchase research that may be used by Invesco Advisers or the AffiliatedSub-Advisers with other clients and may reduce Invesco Advisers’ or the AffiliatedSub-Advisers’ expenses. The Board also considered that it receives periodic reports from Invesco representing that these arrangements are consistent with regulatory requirements. The Board did not deem the soft dollar arrangements to be inappropriate.
The Board considered that the Fund’s uninvested cash and cash collateral from any securities lending arrangements may be invested in money market funds advised by Invesco Advisers pursuant to procedures approved by the Board. The Board considered information regarding the returns of the affiliated money market funds relative to comparable overnight investments, as well as the costs to the Fund of such investments. The Board noted that Invesco Advisers receives advisory fees from these affiliated money market funds attributable to such investments, although Invesco Advisers has contractually agreed to waive through varying periods the advisory fees payable by the Invesco Funds with respect to certain investments in the affiliated money market funds. The waiver is in an amount equal to 100% of the net advisory fee Invesco Advisers receives from the affiliated money market funds with respect to the Fund’s investment in the affiliated money market funds of uninvested cash, but not cash collateral. The Board concluded that the amount of advisory fees received by Invesco Advisers from the Fund’s investment of cash collateral from any securities lending arrangements in the affiliated money market funds is fair and reasonable.
The Board also considered that an affiliated broker may receive commissions for executing certain trades for the Fund. Invesco Advisers and the AffiliatedSub-Advisers may use the affiliated broker to, among other things, control order routing and minimize information leakage, and the Board was advised that such trades are executed in compliance with rules under the federal securities laws and consistent with best execution obligations.
Invesco V.I. Global Real Estate Fund
| Semiannual Report to Shareholders | June 30, 2019 |
Invesco V.I. Government Money Market Fund
Beginning on January 1, 2021, as permitted by regulations adopted by the Securities and Exchange Commission, the insurance company that offers your variable annuity or variable life insurance contract may no longer send you paper copies of the Fund’s shareholder reports by mail, unless you specifically request paper copies of the reports from the insurance company or your financial intermediary. Instead of delivering paper copies of the report, the insurance company may choose to make the reports available on a website, and will notify you by mail each time a report is posted and provide you with a website link to access the report. Instructions for requesting paper copies will be provided by your insurance company.
If the insurance company offers electronic delivery, you may elect to receive shareholder reports and other communications about the Fund electronically by following the instructions provided by the insurance company or by contacting your financial intermediary. If you already elected to receive shareholder reports electronically, you will not be affected by this change and you need not take any action.
You may elect to receive all future reports in paper free of charge from the insurance company. You can inform the insurance company or your financial intermediary that you wish to continue receiving paper copies of your shareholder reports by following the instructions provided by the insurance company or by contacting your financial intermediary. Your election to receive reports in paper will apply to all portfolio companies available under your contract with the insurance company.
The Fund provides a complete list of its holdings four times in each fiscal year, at the quarter-ends. For the second and fourth quarters, the lists appear in the Fund’s semiannual and annual reports to shareholders. For the first and third quarters, the Fund files the lists with the Securities and Exchange Commission (SEC) on Form N-Q (or any successor Form). The Fund’s Form N-Q (or any successor Form) filings are available on the SEC website, sec.gov. The SEC file numbers for the Fund are 811-07452 and 033-57340. The Fund’s most recent portfolio holdings, as filed on Form N-Q (or any successor Form), have also been made available to insurance companies issuing variable annuity contracts and variable life insurance policies (“variable products”) that invest in the Fund.
A description of the policies and procedures that the Fund uses to determine how to vote proxies relating to portfolio securities is available without charge, upon request, from our Client Services department at 800 959 4246 or at invesco.com/proxyguidelines. The information is also available on the SEC website, sec.gov.
Information regarding how the Fund voted proxies related to its portfolio securities during the most recent 12-month period ended June 30 is available at invesco.com/proxysearch. The information is also available on the SEC website, sec.gov.
Invesco Advisers, Inc. is an investment adviser; it provides investment advisory services to individual and institutional clients and does not sell securities. Invesco Distributors, Inc. is the US distributor for Invesco Ltd.’s retail mutual funds, exchange-traded funds and institutional money market funds. Both are wholly owned, indirect subsidiaries of Invesco Ltd.
This report must be accompanied or preceded by a currently effective Fund prospectus and variable product prospectus, which contain more complete information, including sales charges and expenses. Investors should read each carefully before investing.
NOT FDC INSURED | MAY LOSE VALUE | NO BANK GUARANTEE
| Invesco Distributors, Inc. | VIGMKT-SAR-1 |
Invesco V.I. Government Money Market Fund, a series portfolio of AIM Variable Insurance Funds (Invesco Variable Insurance Funds), is currently offered through insurance companies issuing variable products. You cannot purchase shares of the Fund directly. Performance figures given represent the Fund and are not intended to reflect actual variable product values. They do not reflect sales charges, expenses and fees assessed in connection with a variable product. Sales charges, expenses and fees, which are determined by the variable product issuers, will vary and will lower the total return.
The most recent month-end performance at the Fund level, excluding variable product charges, is available at 800 451 4246. As mentioned above, for the most recent monthend performance including variable product charges, please contact your variable product issuer or financial adviser.
Fund performance reflects any applicable fee waivers and/or expense reimbursements. Had the adviser not waived fees and/or reimbursed expenses currently or in the past, returns would have been lower. See current prospectus for more information.
You could lose money by investing in the Fund. Although the Fund seeks to preserve the value of your investment at $1.00 per share, it cannot guarantee it will do so. An investment in the Fund is not insured or guaranteed by the Federal Deposit Insurance Corporation or any other government agency. The Fund’s sponsor has no legal obligation to provide financial support to the Fund, and you should not expect that the sponsor will provide financial support to the Fund at any time.
The Fund is subject to certain other risks. Please see the current prospectus for more information regarding the risks associated with an investment in the Fund.
Invesco V.I. Government Money Market Fund
Schedule of Investments
June 30, 2019
(Unaudited)
| | Interest
Rate | Maturity
Date | Principal
Amount
(000) | Value |
| U.S. Treasury Securities-33.87% |
| U.S. Treasury Bills-18.55%(a) |
| U.S. Treasury Bills | 2.48%-2.49% | 07/18/2019 | | $ 40,000 | $ 39,953,578 |
| U.S. Treasury Bills | 2.48% | 07/25/2019 | | 5,000 | 4,991,833 |
| U.S. Treasury Bills | 2.18% | 07/30/2019 | | 40,000 | 39,933,267 |
| U.S. Treasury Bills | 2.48% | 08/01/2019 | | 10,000 | 9,978,903 |
| U.S. Treasury Bills | 2.49% | 08/29/2019 | | 10,000 | 9,959,765 |
| U.S. Treasury Bills | 2.49% | 09/12/2019 | | 5,000 | 4,975,109 |
| U.S. Treasury Bills | 2.48% | 09/19/2019 | | 15,000 | 14,918,333 |
| | | | | | 124,710,788 |
| U.S. Treasury Notes-15.32% |
| U.S. Treasury Floating Rate Notes (3 mo. U.S. Treasury Bill Money Market Yield Rate + 0.05%)(b) | 2.36% | 10/31/2019 | | 8,000 | 8,000,343 |
| U.S. Treasury Floating Rate Notes (3 mo. U.S. Treasury Bill Money Market Yield Rate)(b) | 2.31% | 01/31/2020 | | 10,000 | 9,997,963 |
| U.S. Treasury Floating Rate Notes (3 mo. U.S. Treasury Bill Money Market Yield Rate + 0.03%)(b) | 2.35% | 04/30/2020 | | 3,000 | 3,000,117 |
| U.S. Treasury Floating Rate Notes (3 mo. U.S. Treasury Bill Money Market Yield Rate + 0.04%)(b) | 2.36% | 07/31/2020 | | 13,000 | 12,999,624 |
| U.S. Treasury Floating Rate Notes (3 mo. U.S. Treasury Bill Money Market Yield Rate + 0.05%)(b) | 2.36% | 10/31/2020 | | 45,000 | 44,998,558 |
| U.S. Treasury Floating Rate Notes (3 mo. U.S. Treasury Bill Money Market Yield Rate + 0.12%)(b) | 2.43% | 01/31/2021 | | 14,000 | 13,992,012 |
| U.S. Treasury Floating Rate Notes (3 mo. U.S. Treasury Bill Money Market Yield Rate + 0.14%)(b) | 2.55% | 04/30/2021 | | 10,000 | 10,000,053 |
| | | | | | 102,988,670 |
| Total U.S. Treasury Securities (Cost $227,699,458) | 227,699,458 |
| U.S. Government Sponsored Agency Securities-28.25% |
| Federal Farm Credit Bank (FFCB)-4.24% |
| Federal Farm Credit Bank (1 mo. USD LIBOR - 0.10%)(b) | 2.37% | 10/08/2019 | | 10,000 | 9,998,979 |
| Federal Farm Credit Bank (1 mo. USD LIBOR - 0.06%)(b) | 2.37% | 12/04/2019 | | 5,000 | 4,999,944 |
| Federal Farm Credit Bank (1 mo. USD LIBOR - 0.06%)(b) | 2.38% | 12/18/2019 | | 5,000 | 4,999,776 |
| Federal Farm Credit Bank (1 mo. USD LIBOR - 0.06%)(b) | 2.34% | 03/25/2020 | | 8,500 | 8,497,309 |
| | | | | | 28,496,008 |
| Federal Home Loan Bank (FHLB)-18.86% |
| Federal Home Loan Bank(a) | 2.39% | 07/09/2019 | | 6,900 | 6,896,351 |
| Federal Home Loan Bank(a) | 2.39% | 07/10/2019 | | 9,880 | 9,874,121 |
| Federal Home Loan Bank(a) | 2.43% | 07/16/2019 | | 1,895 | 1,893,089 |
| Federal Home Loan Bank (1 mo. USD LIBOR + 0.07%)(b) | 2.40% | 07/19/2019 | | 7,000 | 7,000,000 |
| Federal Home Loan Bank(a) | 2.39% | 08/02/2019 | | 7,350 | 7,334,451 |
| Federal Home Loan Bank (1 mo. USD LIBOR - 0.09%)(b) | 2.36% | 08/14/2019 | | 10,000 | 10,000,000 |
| Federal Home Loan Bank (SOFR + 0.03%)(b) | 2.42% | 10/09/2019 | | 5,000 | 5,000,000 |
| Federal Home Loan Bank (1 mo. USD LIBOR - 0.06%)(b) | 2.39% | 10/11/2019 | | 2,000 | 2,000,000 |
| Federal Home Loan Bank (1 mo. USD LIBOR - 0.03%)(b) | 2.44% | 12/09/2019 | | 5,000 | 5,000,000 |
| Federal Home Loan Bank (SOFR)(b) | 2.51% | 12/11/2019 | | 20,000 | 20,000,000 |
| Federal Home Loan Bank (1 mo. USD LIBOR - 0.03%)(b) | 2.40% | 12/16/2019 | | 15,000 | 15,000,000 |
| Federal Home Loan Bank (1 mo. USD LIBOR - 0.09%)(b) | 2.35% | 12/20/2019 | | 5,000 | 5,000,000 |
| Federal Home Loan Bank (1 mo. USD LIBOR - 0.09%)(b) | 2.35% | 12/20/2019 | | 4,000 | 4,000,000 |
| Federal Home Loan Bank (SOFR + 0.01%)(b) | 2.52% | 12/20/2019 | | 5,000 | 5,000,000 |
See accompanying Notes to Financial Statements which are an integral part of the financial statements.
Invesco V.I. Government Money Market Fund
| | Interest
Rate | Maturity
Date | Principal
Amount
(000) | Value |
| Federal Home Loan Bank (FHLB)-(continued) |
| Federal Home Loan Bank (1 mo. USD LIBOR - 0.06%)(b) | 2.37% | 01/23/2020 | | $ 9,800 | $ 9,797,682 |
| Federal Home Loan Bank (SOFR + 0.08%)(b) | 2.47% | 07/24/2020 | | 3,000 | 3,000,000 |
| Federal Home Loan Bank (SOFR + 0.05%)(b) | 2.56% | 09/28/2020 | | 10,000 | 10,000,000 |
| | | | | | 126,795,694 |
| Federal National Mortgage Association (FNMA)-1.35% |
| Federal National Mortgage Association | 0.88% | 08/02/2019 | | 4,099 | 4,093,335 |
| Federal National Mortgage Association (SOFR + 0.07%)(b) | 2.58% | 10/30/2019 | | 2,000 | 2,000,416 |
| Federal National Mortgage Association (SOFR + 0.06%)(b) | 2.45% | 07/30/2020 | | 3,000 | 3,000,000 |
| | | | | | 9,093,751 |
| Overseas Private Investment Corp. (OPIC)-3.80% |
| Overseas Private Investment Corp. VRD Bonds (3 mo. U.S. Treasury Bill Rate)(c) | 2.37% | 09/15/2020 | | 5,000 | 5,000,000 |
| Overseas Private Investment Corp. VRD Bonds (3 mo. U.S. Treasury Bill Rate)(c) | 2.37% | 06/15/2025 | | 3,000 | 3,000,000 |
| Overseas Private Investment Corp. VRD Bonds (3 mo. U.S. Treasury Bill Rate)(c) | 2.37% | 07/15/2025 | | 324 | 323,611 |
| Overseas Private Investment Corp. VRD Bonds (3 mo. U.S. Treasury Bill Rate)(c) | 2.37% | 02/15/2028 | | 9,722 | 9,722,222 |
| Overseas Private Investment Corp. VRD Bonds (3 mo. U.S. Treasury Bill Rate)(c) | 2.45% | 07/07/2040 | | 7,498 | 7,498,463 |
| | | | | | 25,544,296 |
| Total U.S. Government Sponsored Agency Securities (Cost $189,929,749) | 189,929,749 |
TOTAL INVESTMENTS IN SECURITIES (excluding Repurchase Agreements)-62.12%
(Cost $417,629,207) | 417,629,207 |
| | | | Repurchase
Amount | |
| Repurchase Agreements-44.87%(d) |
| Bank of Nova Scotia, joint agreement dated 06/28/2019, aggregate maturing value of $725,151,042 (collateralized by domestic agency mortgage-backed securities valued at $739,500,001; 2.47% - 6.50%; 11/01/2020 - 06/01/2049) | 2.50% | 07/01/2019 | | 19,928,195 | 19,924,044 |
| BNP Paribas Securities Corp., joint term agreement dated 04/24/2019, aggregate maturing value of $754,612,500 (collateralized by U.S. sponsored government agency obligations, domestic agency mortgage-backed securities and U.S. Treasury obligations valued at $765,000,000; 0% - 8.50%; 07/18/2019 - 06/20/2049)(e) | 2.46% | 07/23/2019 | | 20,123,000 | 20,000,000 |
| BNP Paribas Securities Corp., joint term agreement dated 06/19/2019, maturing value of $1,002,016,667 (collateralized by U.S. Treasury obligations valued at $1,020,000,094; 0% - 4.50%; 07/18/2019 - 02/15/2047)(e) | 2.42% | 07/19/2019 | | 10,020,167 | 10,000,000 |
| Fixed Income Clearing Corp. - Bank of New York Mellon (The), agreement dated 06/28/2019, maturing value of $35,007,350 (collateralized by a U.S. Treasury obligation valued at $35,700,086; 1.63%; 07/31/2020) | 2.52% | 07/01/2019 | | 35,007,350 | 35,000,000 |
| ING Financial Markets, LLC, joint term agreement dated 05/13/2019, aggregate maturing value of $654,041,917 (collateralized by domestic agency mortgage-backed securities valued at $663,000,070; 2.00% - 7.00%; 01/01/2024 - 05/01/2058) | 2.46% | 08/12/2019 | | 15,093,275 | 15,000,000 |
| ING Financial Markets, LLC, joint term agreement dated 06/27/2019, aggregate maturing value of $450,202,434 (collateralized by U.S. Treasury obligations valued at $462,559,923; 0% - 1.63%; 07/11/2019 - 08/15/2047)(e) | 2.62% | 07/03/2019 | | 15,007,525 | 15,000,975 |
| ING Financial Markets, LLC, term agreement dated 04/15/2019, maturing value of $10,067,783 (collateralized by domestic agency mortgage-backed securities valued at $10,200,000; 3.00% - 5.50%; 11/01/2033 - 05/01/2058) | 2.49% | 07/22/2019 | | 10,067,783 | 10,000,000 |
| J.P. Morgan Securities LLC, joint open agreement dated 05/02/2019 (collateralized by domestic agency mortgage-backed securities and U.S. Treasury obligations valued at $510,000,000; 0% - 7.50%; 08/01/2020 - 06/20/2049)(f) | 2.51% | - | | - | 12,000,000 |
| J.P. Morgan Securities LLC, joint open agreement dated 05/15/2019 (collateralized by domestic agency mortgage-backed securities and U.S. Treasury obligations valued at $295,800,000; 0% - 7.00%; 10/01/2022 - 04/01/2049)(f) | 2.55% | - | | - | 5,000,000 |
| Metropolitan Life Insurance Co., joint term agreement dated 06/27/2019, aggregate maturing value of $300,172,667 (collateralized by domestic agency mortgage-backed securities valued at $306,000,001; 2.00% - 5.00%; 08/01/2024 - 05/01/2058)(e) | 2.59% | 07/05/2019 | | 10,005,756 | 10,000,000 |
See accompanying Notes to Financial Statements which are an integral part of the financial statements.
Invesco V.I. Government Money Market Fund
| | Interest
Rate | Maturity
Date | Repurchase
Amount | Value |
| Mitsubishi UFJ Trust & Banking Corp., joint term agreement dated 06/26/2019, aggregate maturing value of $100,048,611 (collateralized by U.S. Treasury obligations valued at $102,021,348; 2.63%; 02/15/2029)(e) | 2.50% | 07/03/2019 | | $15,007,292 | $ 15,000,000 |
| Mitsubishi UFJ Trust & Banking Corp., joint term agreement dated 06/27/2019, aggregate maturing value of $1,309,196,433 (collateralized by U.S. Treasury obligations valued at $1,337,275,021; 2.00% - 2.88%; 04/30/2024 - 05/15/2028)(e) | 2.62% | 07/03/2019 | | 29,788,002 | 29,775,000 |
| Natixis, joint term agreement dated 05/20/2019, aggregate maturing value of $501,983,056 (collateralized by U.S. Treasury obligations valued at $510,000,087; 0% - 8.13%; 04/15/2020 - 05/15/2047)(e) | 2.42% | 07/18/2019 | | 5,019,831 | 5,000,000 |
| RBC Capital Markets LLC, joint term agreement dated 06/28/2019, aggregate maturing value of $1,250,000,000 (collateralized by domestic agency mortgage-backed securities and a foreign corporate obligation valued at $1,275,000,002; 0% - 7.00%; 03/01/2020 - 02/20/2069)(b)(e) | 2.42% | 08/28/2019 | | 45,000,000 | 45,000,000 |
| Royal Bank of Canada, joint term agreement dated 04/23/2019, aggregate maturing value of $251,531,250 (collateralized by domestic agency mortgage-backed securities valued at $255,000,000; 2.74% - 4.50%; 06/01/2029 - 10/15/2058)(e) | 2.45% | 07/22/2019 | | 5,030,625 | 5,000,000 |
| Royal Bank of Canada, joint term agreement dated 04/24/2019, aggregate maturing value of $437,653,500 (collateralized by domestic agency mortgage-backed securities valued at $443,700,000; 0% - 6.50%; 04/01/2026 - 02/25/2059)(e) | 2.44% | 07/23/2019 | | 10,061,000 | 10,000,000 |
| Societe Generale, joint open agreement dated 06/25/2018 (collateralized by U.S. government sponsored agency obligations, U.S. Treasury obligations and domestic agency mortgage-backed securities valued at $510,000,000; 0% - 5.94%; 09/06/2019 - 08/20/2064)(f) | 2.39% | - | | - | 5,000,000 |
| Wells Fargo Securities, LLC, joint agreement dated 06/28/2019, aggregate maturing value of $760,159,600 (collateralized by domestic agency mortgage-backed securities valued at $775,200,000; 3.50%; 04/01/2049) | 2.52% | 07/01/2019 | | 35,007,350 | 35,000,000 |
| Total Repurchase Agreements (Cost $301,700,019) | 301,700,019 |
| TOTAL INVESTMENTS IN SECURITIES(g)-106.99% (Cost $719,329,226) | 719,329,226 |
| OTHER ASSETS LESS LIABILITIES-(6.99)% | (47,002,704) |
| NET ASSETS-100.00% | $672,326,522 |
Investment Abbreviations:
| LIBOR | -London Interbank Offered Rate |
| SOFR | -Secured Overnight Financing Rate |
| USD | -U.S. Dollar |
| VRD | -Variable Rate Demand |
Notes to Schedule of Investments:
| (a) | Security traded on a discount basis. The interest rate shown represents the discount rate at the time of purchase by the Fund. |
| (b) | Interest or dividend rate is redetermined periodically. Rate shown is the rate in effect on June 30, 2019. |
| (c) | Demand security payable upon demand by the Fund at specified time intervals no greater than thirteen months. Interest rate is redetermined periodically by the issuer or agent based on current market conditions. Rate shown is the rate in effect on June 30, 2019 |
| (d) | Principal amount equals value at period end. See Note 1I. |
| (e) | The Fund may demand payment of the term repurchase agreement upon one to seven business days’ notice depending on the timing of the demand. |
| (f) | Either party may terminate the agreement upon demand. Interest rates, principal amount and collateral are redetermined daily. |
| (g) | Also represents cost for federal income tax purposes. |
See accompanying Notes to Financial Statements which are an integral part of the financial statements.
Invesco V.I. Government Money Market Fund
Portfolio Composition by Maturity*
In days, as of 06/30/2019
| 1-7 | 22.1% |
| 8-30 | 23.8 |
| 31-60 | 14.1 |
| 61-90 | 2.8 |
| 91-180 | 12.7 |
| 181+ | 24.5 |
| * | The number of days to maturity of each holding is determined in accordance with the provisions of Rule 2a-7 under the Investment Company Act of 1940. |
See accompanying Notes to Financial Statements which are an integral part of the financial statements.
Invesco V.I. Government Money Market Fund
Statement of Assets and Liabilities
June 30, 2019
(Unaudited)
| Assets: | |
| Investments in securities, excluding repurchase agreements, at value and cost | $417,629,207 |
| Repurchase agreements, at value and cost | 301,700,019 |
| Receivable for: | |
| Fund shares sold | 81,855 |
| Interest | 1,075,744 |
| Investment for trustee deferred compensation and retirement plans | 39,096 |
| Total assets | 720,525,921 |
| Liabilities: | |
| Payable for: | |
| Investments purchased | 39,933,267 |
| Fund shares reacquired | 7,799,367 |
| Dividends | 28,115 |
| Accrued fees to affiliates | 350,324 |
| Accrued trustees’ and officers’ fees and benefits | 206 |
| Accrued operating expenses | 40,376 |
| Trustee deferred compensation and retirement plans | 47,744 |
| Total liabilities | 48,199,399 |
| Net assets applicable to shares outstanding | $672,326,522 |
| Net assets consist of: | |
| Shares of beneficial interest | $672,337,524 |
| Distributable earnings | (11,002) |
| | $672,326,522 |
| Net Assets: |
| Series I | $592,722,950 |
| Series II | $79,603,572 |
Shares outstanding, no par value,
unlimited number of shares authorized: |
| Series I | 592,721,308 |
| Series II | 79,603,354 |
| Series I | |
| Net asset value and offering price per share | $1.00 |
| Series II | |
| Net asset value and offering price per share | $1.00 |
Statement of Operations
For the six months ended June 30, 2019
(Unaudited)
| Investment income: | |
| Interest | $9,628,727 |
| Expenses: | |
| Advisory fees | 583,814 |
| Administrative services fees | 736,846 |
| Custodian fees | 6,515 |
| Distributions fees - Series II | 102,467 |
| Transfer agent fees | 9,897 |
| Trustees’ and officers’ fees and benefits | 17,182 |
| Reports to shareholders | 6,670 |
| Professional services fees | 33,763 |
| Other | 6,811 |
| Net expenses | 1,503,965 |
| Net investment income | 8,124,762 |
| Realized and unrealized gain from: | |
| Net realized gain from investment securities | 5,158 |
| Net increase in net assets resulting from operations | $8,129,920 |
See accompanying Notes to Financial Statements which are an integral part of the financial statements.
Invesco V.I. Government Money Market Fund
Statement of Changes in Net Assets
For the six months ended June 30, 2019 and the year ended December 31, 2018
(Unaudited)
| | June 30,
2019 | December 31,
2018 |
| Operations: | | |
| Net investment income | $8,124,762 | $12,056,451 |
| Net realized gain (loss) | 5,158 | (1,401) |
| Net increase in net assets resulting from operations | 8,129,920 | 12,055,050 |
| Distributions to shareholders from distributable earnings: | | |
| Series I | (7,360,963) | (10,928,099) |
| Series II | (763,818) | (1,128,352) |
| Total distributions from distributable earnings | (8,124,781) | (12,056,451) |
| Share transactions-net: | | |
| Series I | (308,182,278) | 244,533,792 |
| Series II | (16,736,295) | 10,798,163 |
| Net increase (decrease) in net assets resulting from share transactions | (324,918,573) | 255,331,955 |
| Net increase (decrease) in net assets | (324,913,434) | 255,330,554 |
| Net assets: | | |
| Beginning of period | 997,239,956 | 741,909,402 |
| End of period | $672,326,522 | $997,239,956 |
See accompanying Notes to Financial Statements which are an integral part of the financial statements.
Invesco V.I. Government Money Market Fund
Notes to Financial Statements
June 30, 2019
(Unaudited)
NOTE 1—Significant Accounting Policies
Invesco V.I. Government Money Market Fund (the “Fund”) is a series portfolio of AIM Variable Insurance Funds (Invesco Variable Insurance Funds) (the “Trust”). The Trust is a Delaware statutory trust registered under the Investment Company Act of 1940, as amended (the “1940 Act”), as an open-end series management investment company. Information presented in these financial statements pertains only to the Fund. Matters affecting the Fund or each class will be voted on exclusively by the shareholders of the Fund or each class. Current Securities and Exchange Commission (“SEC”) guidance, however, requires participating insurance companies offering separate accounts to vote shares proportionally in accordance with the instructions of the contract owners whose investments are funded by shares of each Fund or class.
The Fund’s investment objective is to provide current income consistent with preservation of capital and liquidity.
The Fund currently offers two classes of shares, Series I and Series II, both of which are offered to insurance company separate accounts funding variable annuity contracts and variable life insurance policies (“variable products”).
The Fund is an investment company and accordingly follows the investment company accounting and reporting guidance in accordance with Financial Accounting Standards Board Accounting Standards Codification Topic 946, Financial Services — Investment Companies.
The following is a summary of the significant accounting policies followed by the Fund in the preparation of its financial statements.
| A. | Security Valuations — The Fund’s securities are recorded on the basis of amortized cost which approximates value as permitted by Rule 2a-7 under the 1940 Act. This method values a security at its cost on the date of purchase and, thereafter, assumes a constant amortization to maturity of any premiums or accretion of any discounts. |
Because of the inherent uncertainties of valuation, the values reflected in the financial statements may materially differ from the value received upon actual sale of those investments.
The Fund may invest in securities that are subject to interest rate risk, meaning the risk that the prices will generally fall as interest rates rise and, conversely, the prices will generally rise as interest rates fall. Specific securities differ in their sensitivity to changes in interest rates depending on their individual characteristics. Changes in interest rates may result in increased market volatility, which may affect the value and/or liquidity of certain Fund investments.
| B. | Securities Transactions and Investment Income – Securities transactions are accounted for on a trade date basis. Realized gains or losses on sales are computed on the basis of specific identification of the securities sold. Interest income (net of withholding tax, if any) is recorded on the accrual basis from settlement date. Bond premiums and discounts are amortized and/or accreted over the lives of the respective securities. Pay-in-kind interest income and non-cash dividend income received in the form of securities in-lieu of cash are recorded at the fair value of the securities received. Paydown gains and losses on mortgage and asset-backed securities are recorded as adjustments to interest income. |
The Fund may periodically participate in litigation related to Fund investments. As such, the Fund may receive proceeds from litigation settlements. Any proceeds received are included in the Statement of Operations as realized gain (loss) for investments no longer held and as unrealized gain (loss) for investments still held.
Brokerage commissions and mark ups are considered transaction costs and are recorded as an increase to the cost basis of securities purchased and/or a reduction of proceeds on a sale of securities. Such transaction costs are included in the determination of net realized and unrealized gain (loss) from investment securities reported in the Statement of Operations and the Statement of Changes in Net Assets and the net realized and unrealized gains (losses) on securities per share in the Financial Highlights. Transaction costs are included in the calculation of the Fund’s net asset value and, accordingly, they reduce the Fund’s total returns. These transaction costs are not considered operating expenses and are not reflected in net investment income reported in the Statement of Operations and the Statement of Changes in Net Assets, or the net investment income per share and the ratios of expenses and net investment income reported in the Financial Highlights, nor are they limited by any expense limitation arrangements between the Fund and the investment adviser.
The Fund allocates realized and unrealized capital gains and losses to a class based on the relative net assets of each class. The Fund allocates income to a class based on the relative value of the settled shares of each class.
| C. | Country Determination -For the purposes of making investment selection decisions and presentation in the Schedule of Investments, the investment adviser may determine the country in which an issuer is located and/or credit risk exposure based on various factors. These factors include the laws of the country under which the issuer is organized, where the issuer maintains a principal office, the country in which the issuer derives 50% or more of its total revenues and the country that has the primary market for the issuer’s securities, as well as other criteria. Among the other criteria that may be evaluated for making this determination are the country in which the issuer maintains 50% or more of its assets, the type of security, financial guarantees and enhancements, the nature of the collateral and the sponsor organization. Country of issuer and/or credit risk exposure has been determined to be the United States of America, unless otherwise noted. |
| D. | Distributions - Distributions from net investment income, if any, are declared daily and paid monthly to separate accounts of participating insurance companies. Distributions from net realized gain, if any, are generally declared and paid annually and recorded on the ex-dividend date. |
| E. | Federal Income Taxes - The Fund intends to comply with the requirements of Subchapter M of the Internal Revenue Code of 1986, as amended (the “Internal Revenue Code”), necessary to qualify as a regulated investment company and to distribute substantially all of the Fund’s taxable earnings to shareholders. As such, the Fund will not be subject to federal income taxes on otherwise taxable income (including net realized capital gain) that is distributed to shareholders. Therefore, no provision for federal income taxes is recorded in the financial statements. |
The Fund recognizes the tax benefits of uncertain tax positions only when the position is more likely than not to be sustained. Management has analyzed the Fund’s uncertain tax positions and concluded that no liability for unrecognized tax benefits should be recorded related to uncertain tax positions. Management is not aware of any tax positions for which it is reasonably possible that the total amounts of unrecognized tax benefits will change materially in the next 12 months.
The Fund files tax returns in the U.S. Federal jurisdiction and certain other jurisdictions. Generally, the Fund is subject to examinations by such taxing authorities for up to three years after the filing of the return for the tax period.
Invesco V.I. Government Money Market Fund
| F. | Expenses - Fees provided for under the Rule 12b-1 plan of a particular class of the Fund and which are directly attributable to that class are charged to the operations of such class. All other expenses are allocated among the classes based on relative net assets. |
| G. | Accounting Estimates - The preparation of financial statements in conformity with accounting principles generally accepted in the United States of America (“GAAP”) requires management to make estimates and assumptions that affect the reported amounts of assets and liabilities at the date of the financial statements and the reported amounts of revenues and expenses during the reporting period including estimates and assumptions related to taxation. Actual results could differ from those estimates by a significant amount. In addition, the Fund monitors for material events or transactions that may occur or become known after the period-end date and before the date the financial statements are released to print. |
| H. | Indemnifications - Under the Trust’s organizational documents, each Trustee, officer, employee or other agent of the Trust is indemnified against certain liabilities that may arise out of the performance of their duties to the Fund. Additionally, in the normal course of business, the Fund enters into contracts, including the Fund’s servicing agreements, that contain a variety of indemnification clauses. The Fund’s maximum exposure under these arrangements is unknown as this would involve future claims that may be made against the Fund that have not yet occurred. The risk of material loss as a result of such indemnification claims is considered remote. |
| I. | Repurchase Agreements -The Fund may enter into repurchase agreements. Collateral on repurchase agreements, including the Fund’s prorata interest in joint repurchase agreements, is taken into possession by the Fund upon entering into the repurchase agreement. Collateral consisting of U.S. Government Securities and U.S. Government Sponsored Agency Securities is marked to market daily to ensure its market value is at least 102% of the sales price of the repurchase agreement. The investments in some repurchase agreements, pursuant to procedures approved by the Board of Trustees, are through participation with other mutual funds, private accounts and certain non-registered investment companies managed by the investment advisor or its affiliates (“Joint repurchase agreements”). The principal amount of the repurchase agreement is equal to the value at period-end. If the seller of a repurchase agreement fails to repurchase the security in accordance with the terms of the agreement, the Fund might incur expenses in enforcing its rights, and could experience losses, including a decline in the value of the collateral and loss of income. |
| J. | Other Risks - Investments in obligations issued by agencies and instrumentalities of the U.S. Government may vary in the level of support they receive from the government. The government may choose not to provide financial support to government sponsored agencies or instrumentalities if it is not legally obligated to do so. In this case, if the issuer defaulted, the Fund may not be able to recover its investment in such issuer from the U.S. Government. |
NOTE 2—Advisory Fees and Other Fees Paid to Affiliates
The Trust has entered into a master investment advisory agreement with Invesco Advisers, Inc. (the “Adviser” or “Invesco”). Under the terms of the investment advisory agreement, the Fund pays an advisory fee to the Adviser based on the annual rate of 0.15% of the Fund’s average daily net assets.
Under the terms of a master sub-advisory agreement between the Adviser and each of Invesco Asset Management Deutschland GmbH, Invesco Asset Management Limited, Invesco Asset Management (Japan) Limited, Invesco Hong Kong Limited, Invesco Senior Secured Management, Inc. and Invesco Canada Ltd. and separate sub-advisory agreements with Invesco Capital Management LLC, formerly Invesco PowerShares Capital Management LLC, and Invesco Asset Management (India) Private Limited (collectively, the “Affiliated Sub-Advisers”) the Adviser, not the Fund, will pay 40% of the fees paid to the Adviser to any such Affiliated Sub-Adviser(s) that provide(s) discretionary investment management services to the Fund based on the percentage of assets allocated to such Affiliated Sub-Adviser(s).
The Adviser has contractually agreed, through at least June 30, 2020, to waive advisory fees and/or reimburse expenses to the extent necessary to limit total annual operating expenses after fee waivers and/or expense reimbursements (excluding certain items discussed below) of Series I shares to 1.50% and Series II shares to 1.75% of average daily net assets (the “expense limits”). In determining the Adviser’s obligation to waive advisory fees and/or reimburse expenses, the following expenses are not taken into account, and could cause the total annual operating expenses after fee waivers and/or expense reimbursements to exceed the numbers reflected above: (1) interest; (2) taxes; (3) dividend expense on short sales; (4) extraordinary or non-routine items, including litigation expenses; and (5) expenses that the Fund has incurred but did not actually pay because of an expense offset arrangement. Unless Invesco continues the fee waiver agreement, it will terminate on June 30, 2020. During its term, the fee waiver agreement cannot be terminated or amended to increase the expense limits or reduce the advisory fee waiver without approval of the Board of Trustees. The Adviser did not waive fees and/or reimburse expenses during the period under these expense limits.
The Adviser and/or Invesco Distributors, Inc., (“IDI”) voluntarily agreed to waive fees and/or reimburse expenses in order to increase the Fund’s yield. Voluntary fee waivers and/or reimbursements may be modified at any time upon consultation with the Board of Trustees without further notice to investors.
The Trust has entered into a master administrative services agreement with Invesco pursuant to which the Fund has agreed to pay Invesco a fee for costs incurred in providing accounting services and fund administrative services to the Fund and to reimburse Invesco for fees paid to insurance companies that have agreed to provide certain administrative services to the Fund. These administrative services provided by the insurance companies may include, among other things: maintenance of master accounts with the Fund; tracking, recording and transmitting net purchase and redemption orders for Fund shares; maintaining and preserving records related to the purchase, redemption and other account activity of variable product owners; distributing copies of Fund documents such as prospectuses, proxy materials and periodic reports, to variable product owners, and responding to inquiries from variable product owners about the Fund. Pursuant to such agreement, for the six months ended June 30, 2019, Invesco was paid $172,624 for accounting and fund administrative services and was reimbursed $564,222 for fees paid to insurance companies.
The Trust has entered into a transfer agency and service agreement with Invesco Investment Services, Inc. (“IIS”) pursuant to which the Fund has agreed to pay IIS a fee for providing transfer agency and shareholder services to the Fund and reimburse IIS for certain expenses incurred by IIS in the course of providing such services. For the six months ended June 30, 2019, expenses incurred under the agreement are shown in the Statement of Operations asTransfer agent fees.
The Trust has entered into a master distribution agreement with IDI to serve as the distributor for the Fund. The Trust has adopted a plan pursuant to Rule 12b-1 under the 1940 Act with respect to the Fund’s Series II shares (the “Plan”). The Fund, pursuant to the Plan, pays IDI compensation at the annual rate of 0.25% of the Fund’s average daily net assets of Series II shares. The fees are accrued daily and paid monthly. Of the Plan payments, up to 0.25% of the average daily net assets of the Series II shares may be paid to insurance companies who furnish continuing personal shareholder
Invesco V.I. Government Money Market Fund
services to customers who purchase and own Series II shares of the Fund. For the six months ended June 30, 2019, expenses incurred under the Plan are detailed in the Statement of Operations as Distribution fees.
Certain officers and trustees of the Trust are officers and directors of the Adviser, IIS and/or IDI.
NOTE 3—Additional Valuation Information
GAAP defines fair value as the price that would be received to sell an asset or paid to transfer a liability in an orderly transaction between market participants at the measurement date, under current market conditions. GAAP establishes a hierarchy that prioritizes the inputs to valuation methods, giving the highest priority to readily available unadjusted quoted prices in an active market for identical assets (Level 1) and the lowest priority to significant unobservable inputs (Level 3), generally when market prices are not readily available or are unreliable. Based on the valuation inputs, the securities or other investments are tiered into one of three levels. Changes in valuation methods may result in transfers in or out of an investment’s assigned level:
Level 1 — Prices are determined using quoted prices in an active market for identical assets.
Level 2 — Prices are determined using other significant observable inputs. Observable inputs are inputs that other market participants may use in pricing a security. These may include quoted prices for similar securities, interest rates, prepayment speeds, credit risk, yield curves, loss severities, default rates, discount rates, volatilities and others.
Level 3 — Prices are determined using significant unobservable inputs. In situations where quoted prices or observable inputs are unavailable (for example, when there is little or no market activity for an investment at the end of the period), unobservable inputs may be used. Unobservable inputs reflect the Fund’s own assumptions about the factors market participants would use in determining fair value of the securities or instruments and would be based on the best available information.
As of June 30, 2019, all of the securities in this Fund were valued based on Level 2 inputs (see the Schedule of Investments for security categories). The level assigned to the securities valuations may not be an indication of the risk or liquidity associated with investing in those securities. Because of the inherent uncertainties of valuation, the values reflected in the financial statements may materially differ from the value received upon actual sale of those investments.
NOTE 4—Trustees’ and Officers’ Fees and Benefits
Trustees’ and Officers’ Fees and Benefits include amounts accrued by the Fund to pay remuneration to certain Trustees and Officers of the Fund. Trustees have the option to defer compensation payable by the Fund, andTrustees’ and Officers’ Fees and Benefits also include amounts accrued by the Fund to fund such deferred compensation amounts. Those Trustees who defer compensation have the option to select various Invesco Funds in which their deferral accounts shall be deemed to be invested. Finally, certain current Trustees were eligible to participate in a retirement plan that provided for benefits to be paid upon retirement to Trustees over a period of time based on the number of years of service. The Fund may have certain former Trustees who also participate in a retirement plan and receive benefits under such plan.Trustees’ and Officers’ Fees and Benefits include amounts accrued by the Fund to fund such retirement benefits. Obligations under the deferred compensation and retirement plans represent unsecured claims against the general assets of the Fund.
NOTE 5—Cash Balances
The Fund is permitted to temporarily carry a negative or overdrawn balance in its account with The Bank of New York Mellon, the custodian bank. Such balances, if any at period-end, are shown in the Statement of Assets and Liabilities under the payable captionAmount due custodian. To compensate the custodian bank for such overdrafts, the overdrawn Fund may either (1) leave funds as a compensating balance in the account so the custodian bank can be compensated by earning the additional interest; or (2) compensate by paying the custodian bank at a rate agreed upon by the custodian bank and Invesco, not to exceed the contractually agreed upon rate.
NOTE 6—Tax Information
The amount and character of income and gains to be distributed are determined in accordance with income tax regulations, which may differ from GAAP. Reclassifications are made to the Fund’s capital accounts to reflect income and gains available for distribution (or available capital loss carryforward) under income tax regulations. The tax character of distributions paid during the year and the tax components of net assets will be reported at the Fund’s fiscal year-end.
Capital loss carryforward is calculated and reported as of a specific date. Results of transactions and other activity after that date may affect the amount of capital loss carryforward actually available for the Fund to utilize. The ability to utilize capital loss carryforwards in the future may be limited under the Internal Revenue Code and related regulations based on the results of future transactions.
The Fund had a capital loss carryforward as of December 31, 2018, as follows:
| Capital Loss Carryforward* |
| Expiration | Short-Term | Long-Term | Total |
| Not subject to expiration | $18,758 | $- | $18,758 |
| * | Capital loss carryforwards as of the date listed above is reduced for limitations, if any, to the extent required by the Internal Revenue Code and may be further limited depending upon a variety of factors, including the realization of net unrealized gains or losses as of the date of any reorganization. |
Invesco V.I. Government Money Market Fund
NOTE 7—Share Information
| | Summary of Share Activity |
| | Six months ended
June 30, 2019(a) | | Year ended
December 31, 2018 |
| | Shares | Amount | | Shares | Amount |
| Sold: | | | | | |
| Series I | 515,039,186 | $515,039,186 | | 1,959,818,121 | $1,959,818,121 |
| Series II | 25,200,779 | 25,200,779 | | 73,566,458 | 73,566,458 |
| Issued as reinvestment of dividends: | | | | | |
| Series I | 7,180,195 | 7,180,195 | | 10,672,129 | 10,672,129 |
| Series II | 764,017 | 764,017 | | 1,128,365 | 1,128,365 |
| Reacquired: | | | | | |
| Series I | (830,401,659) | (830,401,659) | | (1,725,956,458) | (1,725,956,458) |
| Series II | (42,701,091) | (42,701,091) | | (63,896,660) | (63,896,660) |
| Net increase (decrease) in share activity | (324,918,573) | $(324,918,573) | | 255,331,955 | $255,331,955 |
| (a) | There are entities that are record owners of more than 5% of the outstanding shares of the Fund and in the aggregate own 93% of the outstanding shares of the Fund. The Fund and the Fund’s principal underwriter or adviser, are parties to participation agreements with these entities whereby these entities sell units of interest in separate accounts funding variable products that are invested in the Fund. The Fund, Invesco and/or Invesco affiliates may make payments to these entities, which are considered to be related to the Fund, for providing services to the Fund, Invesco and/or Invesco affiliates including but not limited to services such as, securities brokerage, third party record keeping and account servicing and administrative services. The Fund has no knowledge as to whether all or any portion of the shares owned of record by these entities are also owned beneficially. |
NOTE 8—Financial Highlights
The following schedule presents financial highlights for a share of the Fund outstanding throughout the periods indicated.
| | Net asset
value,
beginning
of period | Net
investment
income(a) | Net gains
(losses)
on securities
(realized) | Total from
investment
operations | Dividends
from net
investment
income | Net asset
value, end
of period | Total
return(b) | Net assets,
end of period
(000’s omitted) | Ratio of
expenses
to average
net assets
with fee waivers
and/or expenses
absorbed | Ratio of
expenses
to average net
assets without
fee waivers
and/or expenses
absorbed | Ratio of net
investment
income
to average
net assets |
| Series I |
| Six months ended 06/30/19 | $1.00 | $0.01 | $(0.00) | $0.01 | $(0.01) | $1.00 | 1.05% | $592,723 | 0.36%(c) | 0.36%(c) | 2.11%(c) |
| Year ended 12/31/18 | 1.00 | 0.02 | (0.00) | 0.02 | (0.02) | 1.00 | 1.55 | 900,901 | 0.36 | 0.36 | 1.55 |
| Year ended 12/31/17 | 1.00 | 0.01 | (0.00) | 0.01 | (0.01) | 1.00 | 0.56 | 656,368 | 0.40 | 0.40 | 0.56 |
| Year ended 12/31/16 | 1.00 | 0.00 | 0.00 | 0.00 | (0.00) | 1.00 | 0.10 | 636,532 | 0.35 | 0.38 | 0.10 |
| Year ended 12/31/15 | 1.00 | 0.00 | 0.00 | 0.00 | (0.00) | 1.00 | 0.01 | 737,858 | 0.21 | 0.51 | 0.01 |
| Year ended 12/31/14 | 1.00 | 0.00 | 0.00 | 0.00 | (0.00) | 1.00 | 0.01 | 606,553 | 0.16 | 0.50 | 0.01 |
| Series II |
| Six months ended 06/30/19 | 1.00 | 0.01 | 0.00 | 0.01 | (0.01) | 1.00 | 0.93 | 79,604 | 0.61(c) | 0.61(c) | 1.86(c) |
| Year ended 12/31/18 | 1.00 | 0.01 | (0.00) | 0.01 | (0.01) | 1.00 | 1.30 | 96,339 | 0.61 | 0.61 | 1.30 |
| Year ended 12/31/17 | 1.00 | 0.00 | (0.00) | 0.00 | (0.00) | 1.00 | 0.31 | 85,541 | 0.65 | 0.65 | 0.31 |
| Year ended 12/31/16 | 1.00 | 0.00 | 0.00 | 0.00 | (0.00) | 1.00 | 0.03 | 97,362 | 0.43 | 0.63 | 0.02 |
| Year ended 12/31/15 | 1.00 | 0.00 | 0.00 | 0.00 | (0.00) | 1.00 | 0.01 | 23,940 | 0.21 | 0.76 | 0.01 |
| Year ended 12/31/14 | 1.00 | 0.00 | 0.00 | 0.00 | (0.00) | 1.00 | 0.01 | 17,496 | 0.16 | 0.75 | 0.01 |
| (a) | Calculated using average shares outstanding. |
| (b) | Includes adjustments in accordance with accounting principles generally accepted in the United States of America. Total returns are not annualized for periods less than one year, if applicable and do not reflect charges assessed in connection with a variable product, which if included would reduce total returns. |
| (c) | Ratios are annualized and based on average daily net assets (000’s omitted) of $702,216 and $82,653 for Series I and Series II shares, respectively. |
Invesco V.I. Government Money Market Fund
Calculating your ongoing Fund expenses
Example
As a shareholder of the Fund, you incur ongoing costs, including management fees; distribution and/or service fees (12b-1); and other Fund expenses. This example is intended to help you understand your ongoing costs (in dollars) of investing in the Fund and to compare these costs with ongoing costs of investing in other mutual funds. The example is based on an investment of $1,000 invested at the beginning of the period and held for the entire period January 1, 2019 through June 30, 2019.
The actual and hypothetical expenses in the examples below do not represent the effect of any fees or other expenses assessed in connection with a variable product; if they did, the expenses shown would be higher while the ending account values shown would be lower.
Actual expenses
The table below provides information about actual account values and actual expenses. You may use the information in this table, together with the amount you invested, to estimate the expenses that you paid over the period. Simply divide your account value by $1,000 (for example, an $8,600 account value divided by $1,000 = 8.6), then multiply the result by the number in the table under the heading entitled “Actual Expenses Paid During Period” to estimate the expenses you paid on your account during this period.
Hypothetical example for comparison purposes
The table below also provides information about hypothetical account values and hypothetical expenses based on the Fund’s actual expense ratio and an assumed rate of return of 5% per year before expenses, which is not the Fund’s actual return.
The hypothetical account values and expenses may not be used to estimate the actual ending account balance or expenses you paid for the period. You may use this information to compare the ongoing costs of investing in the Fund and other funds. To do so, compare this 5% hypothetical example with the 5% hypothetical examples that appear in the shareholder reports of the other funds.
Please note that the expenses shown in the table are meant to highlight your ongoing costs. Therefore, the hypothetical information is useful in comparing ongoing costs, and will not help you determine the relative total costs of owning different funds.
| Class | Beginning
Account Value
(01/01/19) | ACTUAL | HYPOTHETICAL
(5% annual return before expenses) | Annualized
Expense
Ratio |
Ending
Account Value
(06/30/19)1 | Expenses
Paid During
Period2 | Ending
Account Value
(06/30/19) | Expenses
Paid During
Period2 |
| Series I | $1,000.00 | $1,010.50 | $1.79 | $1,023.01 | $1.81 | 0.36% |
| Series II | 1,000.00 | 1,009.30 | 3.04 | 1,021.77 | 3.06 | 0.61 |
| 1 | The actual ending account value is based on the actual total return of the Fund for the period January 1, 2019 through June 30, 2019, after actual expenses and will differ from the hypothetical ending account value which is based on the Fund’s expense ratio and a hypothetical annual return of 5% before expenses. |
| 2 | Expenses are equal to the Fund’s annualized expense ratio as indicated above multiplied by the average account value over the period, multiplied by 181/365 to reflect the most recent fiscal half year. |
Invesco V.I. Government Money Market Fund
Approval of Investment Advisory andSub-Advisory Contracts
At meetings held on June 10, 2019, the Board of Trustees (the Board or the Trustees) of AIM Variable Insurance Funds (Invesco Variable Insurance Funds) as a whole, and the independent Trustees, who comprise over 75% of the Board, voting separately, approved the continuance of the Invesco V.I. Government Money Market Fund’s (the Fund) Master Investment Advisory Agreement with Invesco Advisers, Inc. (Invesco Advisers and the investment advisory agreement) and the Master IntergroupSub-Advisory Contract for Mutual Funds with Invesco Asset Management Deutschland GmbH, Invesco Asset Management Limited, Invesco Asset Management (Japan) Limited, Invesco Hong Kong Limited, Invesco Senior Secured Management, Inc. and Invesco Canada Ltd. and separatesub-advisory contracts with Invesco Capital Management LLC and Invesco Asset Management (India) Private Limited (collectively, the AffiliatedSub-Advisers and thesub-advisory contracts) for another year, effective July 1, 2019. After evaluating the factors discussed below, among others, the Board approved the renewal of the Fund’s investment advisory agreement and thesub-advisory contracts and determined that the compensation payable by the Fund to Invesco Advisers and by Invesco Advisers to the AffiliatedSub-Advisers is fair and reasonable.
The Board’s Evaluation Process
The Board’s Investments Committee has established threeSub-Committees, which meet throughout the year to review the performance of funds advised by Invesco Advisers (the Invesco Funds). As part of a regularly scheduled basis ofin-person Board meetings, theSub-Committees meet with portfolio managers for their assigned Invesco Funds and other members of management to review detailed information about investment performance and portfolio attributes of these funds. The Board took into account evaluations and reports that it received from the Investments Committee andSub-Committees, as well as the information provided to such committees and the Board throughout the year, in considering whether to approve each Invesco Fund’s investment advisory agreement andsub-advisory contracts.
As part of the contract renewal process, the Board reviews and considers information provided in response to detailed requests for information submitted to management by the independent Trustees with assistance from legal counsel to the independent Trustees. The Board receives comparative investment performance and fee data regarding the Invesco Funds prepared by Invesco Advisers and Broadridge Financial Solutions, Inc. (Broadridge), an independent mutual fund data provider. The Board also receives an independent written evaluation from the Senior Officer, an officer of the Invesco Funds who reports directly to the
independent Trustees. The Senior Officer’s evaluation is prepared as part of his responsibility to manage the process by which the Invesco Funds’ proposed management fees are negotiated during the annual contract renewal process to ensure they are negotiated in a manner that is at arms’ length and reasonable. In addition to meetings with Invesco Advisers and fund counsel throughout the year, the independent Trustees also discuss the continuance of the investment advisory agreement andsub-advisory contracts in separate sessions with the Senior Officer and with independent legal counsel.
The discussion below is a summary of the Senior Officer’s independent written evaluation with respect to the Fund’s investment advisory agreement as well as a discussion of the material factors and related conclusions that formed the basis for the Board’s approval of the Fund’s investment advisory agreement andsub-advisory contracts. The Trustees’ review and conclusions are based on the comprehensive consideration of all information presented to them during the course of the year and in prior years and are not the result of any single determinative factor. Moreover, one Trustee may have weighed a particular piece of information or factor differently than another Trustee. This information is current as of June 10, 2019.
Factors and Conclusions and Summary of Independent Written Fee Evaluation
| A. | Nature, Extent and Quality of Services Provided by Invesco Advisers and the AffiliatedSub-Advisers |
The Board reviewed the nature, extent and quality of the advisory services provided to the Fund by Invesco Advisers under the Fund’s investment advisory agreement, and the credentials and experience of the officers and employees of Invesco Advisers who provide these services, including the Fund’s portfolio manager(s). The Board’s review included consideration of Invesco Advisers’ investment process oversight and structure, credit analysis and investment risk management. The Board also considerednon-advisory services that Invesco Advisers and its affiliates provide to the Invesco Funds such as various back office support functions, third party oversight, internal audit, valuation, portfolio trading and legal and compliance. The Board also reviewed and considered the benefits to shareholders of investing in a fund that is part of the Invesco family of funds under the umbrella of Invesco Ltd., Invesco Advisers’ parent company, and noted Invesco Ltd.’s depth and experience in conducting an investment management business, as well as its commitment of financial and other resources to such business. The Board reviewed and considered information about the resources that Invesco Advisers
intends to continue to commit to managing the Invesco family of funds following Invesco Ltd.’s acquisition of OppenheimerFunds, Inc. and its subsidiaries. The Board concluded that the nature, extent and quality of the services provided to the Fund by Invesco Advisers are appropriate and satisfactory.
The Board reviewed the services that may be provided by the AffiliatedSub-Advisers under thesub-advisory contracts and the credentials and experience of the officers and employees of the AffiliatedSub-Advisers who provide these services. The Board noted the AffiliatedSub-Advisers’ expertise with respect to certain asset classes and that the AffiliatedSub-Advisers have offices and personnel that are located in financial centers around the world. As a result, the Board noted that the AffiliatedSub-Advisers can provide research and investment analysis on the markets and economies of various countries in which the Fund may invest, make recommendations regarding securities and assist with security trades. The Board concluded that thesub-advisory contracts may benefit the Fund and its shareholders by permitting Invesco Advisers to use the resources and talents of the AffiliatedSub-Advisers in managing the Fund. The Board concluded that the nature, extent and quality of the services that may be provided by the AffiliatedSub-Advisers are appropriate and satisfactory.
| B. | Fund Investment Performance |
The Board considered Fund investment performance as a relevant factor in considering whether to approve the investment advisory agreement. The Board did not view Fund investment performance as a relevant factor in considering whether to approve thesub-advisory contracts for the Fund, as no AffiliatedSub-Adviser currently manages assets of the Fund.
The Board compared the Fund’s investment performance over multiple time periods ending December 31, 2018 to the performance of funds in the Broadridge performance universe and against the Lipper Variable Underlying Funds Money Market Funds Index. The Board noted that performance of Series I shares of the Fund was in the first quintile of its performance universe for the one year period and the second quintile for the three and five year periods (the first quintile being the best performing funds and the fifth quintile being the worst performing funds). The Board noted that performance of Series I shares of the Fund was above the performance of the Index for the one, three and five year periods.The Trustees also reviewed more recent Fund performance and this review did not change their conclusions.
| C. | Advisory andSub-Advisory Fees and Fund Expenses |
The Board compared the Fund’s contractual management fee rate to the contractual
Invesco V.I. Government Money Market Fund
management fee rates of funds in the Fund’s Broadridge expense group. The Board noted that the contractual management fee rate for Series I shares of the Fund was below the median contractual management fee rate of funds in its expense group. The Board noted that the term “contractual management fee” for funds in the expense group may include both advisory and certainnon-portfolio management administrative services fees, but that Broadridge does not provide information on a fund by fund basis as to what is included. The Board also reviewed the methodology used by Broadridge in providing expense group information, which includes using each fund’s contractual management fee schedule (including any applicable breakpoints) as reported in the most recent prospectus or statement of additional information for each fund in the expense group. The Board also considered comparative information regarding the Fund’s total expense ratio and its various components.
The Board noted that Invesco Advisers has contractually agreed to waive fees and/or limit expenses of the Fund for the term disclosed in the Fund’s registration statement in an amount necessary to limit total annual operating expenses to a specified percentage of average daily net assets for each class of the Fund.
The Board also considered the fees charged by Invesco Advisers and the AffiliatedSub-Advisers to other similarly managed client accounts. The Board noted that Invesco Advisers or the AffiliatedSub-Advisers may charge lower fees to large institutional clients. Invesco Advisers reviewed with the Board differences in the scope of services it provides to the Invesco Funds relative to certain other types of client accounts, including management of cash flows as a result of redemptions and purchases, necessary infrastructure such as officers, office space, technology, legal and distribution, oversight of service providers, costs and business risks associated with launching new funds and sponsoring and maintaining the product line, preparation of annual registration statement updates and financial information and compliance with federal and state laws and regulations.
The Board also considered the services that may be provided by the AffiliatedSub-Advisers pursuant to thesub-advisory contracts, as well as the fees payable by Invesco Advisers to the AffiliatedSub-Advisers pursuant to thesub-advisory contracts.
| D. | Economies of Scale and Breakpoints |
The Board considered the extent to which there may be economies of scale in the provision of advisory services to the Fund. The Board considered Invesco’s reinvestment in its business, including investments in business infrastructure and cybersecurity. The Board noted that the Fund does not benefit from economies of scale through contractual breakpoints, but does share directly in economies of scale through lower fees charged by third party service providers based on the
combined size of the Invesco Funds. The Board noted that the Fund may also benefit from economies of scale through initial fee setting, fee waivers and expense reimbursements.
| E. | Profitability and Financial Resources |
The Board reviewed information from Invesco Advisers concerning the costs of the advisory and other services that Invesco Advisers and its affiliates provide to the Fund and the Invesco Funds and the profitability of Invesco Advisers and its affiliates in providing these services. The Board considered the methodology used for calculating profitability and noted the periodic review of such methodology by an independent consultant. The Board noted that Invesco Advisers continues to operate at a net profit from services Invesco Advisers and its affiliates provide to the Invesco Funds and the Fund. The Board did not deem the level of profits realized by Invesco Advisers and its affiliates from providing services to the Fund to be excessive given the nature, extent and quality of the services provided. The Board received information from Invesco Advisers demonstrating that Invesco Advisers and the AffiliatedSub-Advisers are financially sound and have the resources necessary to perform their obligations under the investment advisory agreement andsub-advisory contracts.
| F. | Collateral Benefits to Invesco Advisers and its Affiliates |
The Board considered various other benefits received by Invesco Advisers and its affiliates from the relationship with the Fund, including the fees received for providing administrative, transfer agency and distribution services to the Fund. The Board considered comparative information regarding fees charged for these services, including information provided by Broadridge and other independent sources. The Board considered the performance of Invesco Advisers and its affiliates in providing these services and the organizational structure employed to provide these services. The Board also considered that these services are provided to the Fund pursuant to written contracts that are reviewed and approved on an annual basis by the Board; and that the services are required for the operation of the Fund.
Invesco V.I. Government Money Market Fund
| Semiannual Report to Shareholders | June 30, 2019 |
Invesco V.I. Government Securities Fund
Beginning on January 1, 2021, as permitted by regulations adopted by the Securities and Exchange Commission, the insurance company that offers your variable annuity or variable life insurance contract may no longer send you paper copies of the Fund’s shareholder reports by mail, unless you specifically request paper copies of the reports from the insurance company or your financial intermediary. Instead of delivering paper copies of the report, the insurance company may choose to make the reports available on a website, and will notify you by mail each time a report is posted and provide you with a website link to access the report. Instructions for requesting paper copies will be provided by your insurance company.
If the insurance company offers electronic delivery, you may elect to receive shareholder reports and other communications about the Fund electronically by following the instructions provided by the insurance company or by contacting your financial intermediary. If you already elected to receive shareholder reports electronically, you will not be affected by this change and you need not take any action.
You may elect to receive all future reports in paper free of charge from the insurance company. You can inform the insurance company or your financial intermediary that you wish to continue receiving paper copies of your shareholder reports by following the instructions provided by the insurance company or by contacting your financial intermediary. Your election to receive reports in paper will apply to all portfolio companies available under your contract with the insurance company.
The Fund provides a complete list of its holdings four times in each fiscal year, at the quarter-ends. For the second and fourth quarters, the lists appear in the Fund’s semiannual and annual reports to shareholders. For the first and third quarters, the Fund files the lists with the Securities and Exchange Commission (SEC) on Form N-Q (or any successor Form). The Fund’s Form N-Q (or any successor Form) filings are available on the SEC website, sec.gov. The SEC file numbers for the Fund are 811-07452 and 033-57340. The Fund’s most recent portfolio holdings, as filed on Form N-Q (or any successor Form), have also been made available to insurance companies issuing variable annuity contracts and variable life insurance policies (“variable products”) that invest in the Fund.
A description of the policies and procedures that the Fund uses to determine how to vote proxies relating to portfolio securities is available without charge, upon request, from our Client Services department at 800 959 4246 or at invesco.com/proxyguidelines. The information is also available on the SEC website, sec.gov.
Information regarding how the Fund voted proxies related to its portfolio securities during the most recent 12-month period ended June 30 is available at invesco.com/proxysearch. The information is also available on the SEC website, sec.gov.
Invesco Advisers, Inc. is an investment adviser; it provides investment advisory services to individual and institutional clients and does not sell securities. Invesco Distributors, Inc. is the US distributor for Invesco Ltd.’s retail mutual funds, exchange-traded funds and institutional money market funds. Both are wholly owned, indirect subsidiaries of Invesco Ltd.
This report must be accompanied or preceded by a currently effective Fund prospectus and variable product prospectus, which contain more complete information, including sales charges and expenses. Investors should read each carefully before investing.
NOT FDIC INSURED | MAY LOSE VALUE | NO BANK GUARANTEE
| Invesco Distributors, Inc. | VIGOV-SAR-1 |
Performance summary
Fund vs. Indexes
Cumulative total returns, December 31, 2018 to June 30, 2019, excluding variable product issuer charges. If variable product issuer charges were included, returns would be lower.
| Series I Shares | 4.46% |
| Series II Shares | 4.32 |
| Bloomberg Barclays U.S. Aggregate Bond Index▼ (Broad Market Index) | 6.11 |
| Bloomberg Barclays U.S. Government Index▼ (Style-Specific Index) | 5.15 |
Lipper VUF General U.S. Government Funds Index■
(Peer Group Index) | 4.75 |
| Source(s):▼FactSet Research Systems Inc.;■ Lipper Inc. |
The Bloomberg Barclays U.S. Aggregate Bond Index is an unmanaged index considered representative of the US investment grade, fixed-rate bond market.
TheBloomberg Barclays U.S. Government Index is an unmanaged index considered representative of fixed income obligations issued by the US Treasury, government agencies and quasi-federal corporations.
TheLipper VUF General U.S. Government Funds Index is an unmanaged index considered representative of general US government variable insurance underlying funds tracked by Lipper.
The Fund is not managed to track the performance of any particular index, including the indexes described here, and consequently, the performance of the Fund may deviate significantly from the performance of the indexes.
A direct investment cannot be made in an index. Unless otherwise indicated, index results include reinvested dividends, and they do not reflect sales charges. Performance of the peer group, if applicable, reflects fund expenses; performance of a market index does not.
| Average Annual Total Returns |
| As of 6/30/19 |
| Series I Shares | |
| Inception (5/5/93) | 4.18% |
| 10 Years | 2.74 |
| 5 Years | 2.06 |
| 1 Year | 5.78 |
| Series II Shares | |
| Inception (9/19/01) | 3.23% |
| 10 Years | 2.48 |
| 5 Years | 1.81 |
| 1 Year | 5.56 |
The performance of the Fund’s Series I and Series II share classes will differ primarily due to different class expenses.
The performance data quoted represent past performance and cannot guarantee comparable future results; current performance may be lower or higher. Please contact your variable product issuer or financial adviser for the most recent month-end variable product performance. Performance figures reflect Fund expenses, reinvested distributions and changes in net asset value. Investment return and principal value will fluctuate so that you may have a gain or loss when you sell shares.
The total annual Fund operating expense ratio set forth in the most re-
cent Fund prospectus as of the date of this report for Series I and Series II shares was 0.69% and 0.94%, respectively. The expense ratios presented above may vary from the expense ratios presented in other sections of this report that are based on expenses incurred during the period covered by this report.
Invesco V.I. Government Securities Fund, a series portfolio of AIM Variable Insurance Funds (Invesco Variable Insurance Funds), is currently offered through insurance companies issuing variable products. You cannot purchase shares of the Fund directly. Performance figures given represent the Fund and are not intended to reflect actual variable product values. They do not reflect sales charges, expenses and
fees assessed in connection with a variable product. Sales charges, expenses and fees, which are determined by the variable product issuers, will vary and will lower the total return.
The most recent month-end performance at the Fund level, excluding variable product charges, is available at 800 451 4246. As mentioned above, for the most recent month-end performance including variable product charges, please contact your variable product issuer or financial adviser.
Fund performance reflects any applicable fee waivers and/or expense reimbursements. Had the adviser not waived fees and/or reimbursed expenses currently or in the past, returns would have been lower. See current prospectus for more information.
Invesco V.I. Government Securities Fund
Schedule of Investments
June 30, 2019
(Unaudited)
| | Principal
Amount | Value |
| U.S. Government Sponsored Agency Mortgage-Backed Securities–42.78% |
| Collateralized Mortgage Obligations–13.85% |
| Fannie Mae, 3.27%, 01/25/2029 | | $5,000,000 | $5,276,705 |
| Fannie Mae ACES, 3.03% (1 mo. USD LIBOR + 0.59%), 09/25/2023(a) | | 1,339,339 | 1,336,980 |
| Fannie Mae REMICs | | |
| 5.00%, 08/25/2019 | | 204 | 204 |
| 3.00%, 10/25/2025 | | 89,338 | 89,302 |
| 2.50%, 03/25/2026 | | 119,978 | 119,477 |
| 7.00%, 09/18/2027 | | 190,308 | 209,619 |
| 1.50%, 01/25/2028 | | 3,348,184 | 3,279,277 |
| 6.50%, 03/25/2032 | | 574,212 | 653,028 |
| 5.75%, 10/25/2035 | | 217,984 | 238,964 |
| 2.70%, (1 mo. USD LIBOR + 0.30%), 05/25/2036(a) | | 1,992,987 | 1,988,205 |
| 4.25%, 02/25/2037 | | 322,582 | 327,918 |
| 2.94%, (1 mo. USD LIBOR + 0.45%), 03/25/2037(a) | | 994,448 | 980,992 |
| 2.80%, (1 mo. USD LIBOR + 0.40%), 06/25/2038(a) | | 1,479,055 | 1,480,264 |
| 6.59%, 06/25/2039(b) | | 2,612,721 | 3,012,339 |
| 4.00%, 02/25/40 to 07/25/40 | | 1,783,846 | 1,882,817 |
| 2.90%, 03/25/40 to 05/25/41 | | 2,365,262 | 2,377,552 |
| 2.95%, (1 mo. USD LIBOR + 0.55%), 02/25/2041(a) | | 2,042,403 | 2,053,764 |
| 3.01%, (1 mo. USD LIBOR + 0.52%), 11/25/2041(a) | | 1,027,855 | 1,032,131 |
| 2.81%, (1 mo. USD LIBOR + 0.32%), 08/25/2044(a) | | 1,802,285 | 1,798,492 |
| 2.97%, (1 mo. USD LIBOR + 0.48%), 02/25/2056(a) | | 3,532,220 | 3,532,227 |
| 2.91%, (1 mo. USD LIBOR + 0.42%), 12/25/2056(a) | | 4,210,643 | 4,204,209 |
| Freddie Mac REMICs | | |
| 3.00%, 04/15/2026 | | 134,659 | 134,494 |
| 2.89%, 12/15/35 to 03/15/40 | | 3,942,263 | 3,963,046 |
| 2.69%, (1 mo. USD LIBOR + 0.30%), 03/15/2036(a) | | 1,413,599 | 1,413,165 |
| 2.84%, (1 mo. USD LIBOR + 0.35%), 11/15/2036(a) | | 2,639,762 | 2,628,774 |
| 2.76%, (1 mo. USD LIBOR + 0.37%), 03/15/2037(a) | | 1,040,170 | 1,039,403 |
| 2.79%, (1 mo. USD LIBOR + 0.40%), 05/15/2037(a) | | 493,195 | 493,958 |
| 2.88%, (1 mo. USD LIBOR + 0.40%), 06/15/2037(a) | | 1,502,312 | 1,496,479 |
| 3.25%, (1 mo. USD LIBOR + 0.86%), 11/15/2039(a) | | 545,866 | 557,011 |
| 2.93%, (1 mo. USD LIBOR + 0.45%), 03/15/2040(a) | | 1,975,074 | 1,984,543 |
| 2.84%, (1 mo. USD LIBOR + 0.45%), 02/15/2042(a) | | 4,101,712 | 4,105,683 |
| | Principal
Amount | Value |
| Collateralized Mortgage Obligations–(continued) |
| 2.78%, (1 mo. USD LIBOR + 0.30%), 09/15/2044(a) | | $7,874,416 | $7,797,299 |
| Freddie Mac STRIPS, 2.79% (1 mo. USD LIBOR + 0.35%), 10/15/2037(a) | | 2,083,369 | 2,084,639 |
| Freddie Mac Whole Loan Securities Trust, 3.50%, 05/25/2047 | | 1,651,480 | 1,670,174 |
| | | | 65,243,134 |
| Federal Home Loan Mortgage Corp. (FHLMC)–7.59% |
| 6.00%, 07/01/2019 to 07/01/2038 | | 193,105 | 211,008 |
| 4.50%, 09/01/2020 to 08/01/2041 | | 6,339,307 | 6,841,580 |
| 6.50%, 02/01/2021 to 12/01/2035 | | 1,783,461 | 2,037,226 |
| 10.00%, 03/01/2021 | | 455 | 457 |
| 9.00%, 06/01/2021 to 06/01/2022 | | 9,844 | 9,870 |
| 7.00%, 12/01/2021 to 11/01/2035 | | 2,305,167 | 2,626,276 |
| 8.00%, 12/01/2021 to 02/01/2035 | | 511,031 | 537,861 |
| 7.50%, 09/01/2022 to 06/01/2035 | | 744,938 | 837,765 |
| 8.50%, 11/17/2022 to 08/01/2031 | | 243,966 | 264,258 |
| 5.50%, 12/01/2022 | | 26,316 | 26,507 |
| 3.50%, 08/01/2026 | | 479,497 | 499,955 |
| 3.00%, 05/01/2027 to 02/01/2032 | | 5,328,865 | 5,456,685 |
| 7.05%, 05/20/2027 | | 84,868 | 91,542 |
| 6.03%, 10/20/2030 | | 652,547 | 733,324 |
| 5.00%, 01/01/2037 to 01/01/2040 | | 951,447 | 1,035,475 |
See accompanying Notes to Financial Statements which are an integral part of the financial statements.
Invesco V.I. Government Securities Fund
| | Principal
Amount | Value |
| Federal Home Loan Mortgage Corp. (FHLMC)–(continued) |
| ARM, | | |
| 4.71%, (1 yr. USD LIBOR + 1.88%), 09/01/2035(a) | | $2,461,191 | $2,591,715 |
| 4.75%, (1 yr. USD LIBOR + 1.88%), 07/01/2036(a) | | 2,241,217 | 2,362,409 |
| 4.31%, (1 yr. USD LIBOR + 1.55%), 10/01/2036(a) | | 1,254,430 | 1,309,459 |
| 4.73%, (1 yr. USD LIBOR + 1.91%), 10/01/2036(a) | | 98,363 | 104,165 |
| 4.85%, (1 yr. USD LIBOR + 1.97%), 11/01/2037(a) | | 578,833 | 612,438 |
| 5.08%, (1 yr. USD LIBOR + 2.01%), 01/01/2038(a) | | 35,049 | 36,927 |
| 4.74%, (1 yr. USD LIBOR + 1.84%), 07/01/2038(a) | | 664,067 | 702,895 |
| 4.68%, (1 yr. USD LIBOR + 1.79%), 06/01/2043(a) | | 989,157 | 1,033,390 |
| 2.89%, (1 yr. USD LIBOR + 1.64%), 01/01/2048(a) | | 5,679,377 | 5,794,015 |
| | | | 35,757,202 |
| Federal National Mortgage Association (FNMA)–16.46% |
| 6.50%, 10/01/2019 to 11/01/2037 | | 1,729,690 | 1,920,031 |
| 5.00%, 03/01/2020 to 12/01/2033 | | 160,046 | 168,540 |
| 7.00%, 08/01/2020 to 06/01/2036 | | 2,038,504 | 2,195,176 |
| 8.00%, 02/01/2021 to 10/01/2037 | | 2,131,746 | 2,506,615 |
| 8.50%, 02/01/2021 to 08/01/2037 | | 635,595 | 714,221 |
| 5.50%, 03/01/2021 to 05/01/2035 | | 1,046,953 | 1,162,343 |
| 6.00%, 08/01/2021 to 10/01/2038 | | 1,243,342 | 1,399,566 |
| 7.50%, 11/01/2022 to 08/01/2037 | | 3,282,907 | 3,734,338 |
| 6.75%, 07/01/2024 | | 161,039 | 178,674 |
| 4.50%, 11/01/2024 to 12/01/2048 | | 13,417,077 | 14,252,141 |
| 6.95%, 10/01/2025 | | 14,022 | 14,134 |
| 3.50%, 03/01/2027 to 08/01/2027 | | 6,408,477 | 6,636,866 |
| 3.00%, 05/01/2027 to 07/01/2032 | | 9,666,822 | 9,893,446 |
| 4.00%, 12/01/2048 | | 8,935,288 | 9,409,980 |
| 2.51%, 12/25/2025 | | 5,000,000 | 5,042,926 |
| 2.88%, 04/25/2026 | | 5,000,000 | 5,174,282 |
| 2.76%, 12/25/2028 | | 2,000,000 | 2,054,612 |
| 3.02%, 04/25/2029 | | 5,000,000 | 5,199,496 |
| | Principal
Amount | Value |
| Federal National Mortgage Association (FNMA)–(continued) |
| ARM, | | |
| 4.84%, (1 yr. U.S. Treasury Yield Curve Rate + 2.36%), 10/01/2034(a) | | $1,517,625 | $1,608,930 |
| 4.69%, (1 yr. U.S. Treasury Yield Curve Rate + 2.21%), 05/01/2035(a) | | 195,858 | 206,743 |
| 4.68%, (1 yr. USD LIBOR + 1.72%), 03/01/2038(a) | | 43,048 | 45,360 |
| 4.70%, (1 yr. USD LIBOR + 1.75%), 02/01/2042(a) | | 464,854 | 481,117 |
| 2.19%, (1 yr. USD LIBOR + 1.52%), 08/01/2043(a) | | 1,730,835 | 1,756,842 |
| 2.28%, (1 yr. U.S. Treasury Yield Curve Rate + 1.88%), 05/01/2044(a) | | 1,710,591 | 1,761,728 |
| | | | 77,518,107 |
| Government National Mortgage Association (GNMA)–4.88% |
| 6.50%, 07/15/2020 to 09/15/2034 | | 2,501,723 | 2,738,037 |
| 7.00%, 07/15/2020 to 12/15/2036 | | 686,723 | 753,544 |
| 6.00%, 09/15/2020 to 08/15/2033 | | 543,803 | 589,592 |
| 7.50%, 09/15/2022 to 10/15/2035 | | 1,614,477 | 1,812,044 |
| 8.00%, 01/15/2023 to 01/15/2037 | | 935,182 | 1,066,790 |
| 5.00%, 02/15/2025 | | 130,822 | 136,895 |
| 8.50%, 02/15/2025 to 01/15/2037 | | 133,646 | 139,201 |
| 6.95%, 08/20/2025 to 08/20/2027 | | 148,494 | 148,674 |
| 6.38%, 10/20/2027 to 02/20/2028 | | 198,841 | 211,156 |
| 6.10%, 12/20/2033 | | 3,307,733 | 3,709,203 |
| 5.71%, 08/20/2034(b) | | 938,562 | 1,046,238 |
| 5.88%, 01/20/2039(b) | | 3,296,243 | 3,701,657 |
| 3.19%, (1 mo. USD LIBOR + 0.80%), 09/16/2039(a) | | 1,013,428 | 1,031,823 |
| 4.49%, 07/20/2041(b) | | 724,740 | 776,956 |
| 3.72%, 09/20/2041(b) | | 2,466,030 | 2,532,825 |
| 2.74%, (1 mo. USD LIBOR + 0.25%), 01/20/2042(a) | | 457,740 | 456,884 |
| 3.50%, 10/20/2042 | | 2,062,045 | 2,120,154 |
| | | | 22,971,673 |
| Total U.S. Government Sponsored Agency Mortgage-Backed Securities (Cost $198,286,438) | 201,490,116 |
| U.S. Treasury Securities–42.71% |
| U.S. Treasury Bills–0.22% |
| 2.04% - 2.05%, 12/19/2019(c)(d) | | 1,055,000 | 1,044,776 |
See accompanying Notes to Financial Statements which are an integral part of the financial statements.
Invesco V.I. Government Securities Fund
| | Principal
Amount | Value |
| U.S. Treasury Bonds–5.91% |
| 3.38%, 05/15/2044 | | $6,000,000 | $6,967,031 |
| 3.00%, 05/15/2045 | | 7,000,000 | 7,647,500 |
| 2.75%, 08/15/2047 | | 10,000,000 | 10,423,438 |
| 3.13%, 05/15/2048 | | 2,500,000 | 2,801,953 |
| | | | 27,839,922 |
| U.S. Treasury Inflation — Indexed Bonds–1.45% |
| 0.50%, 04/15/2024(e) | | 2,026,120 | 2,051,927 |
| 0.75%, 07/15/2028(e) | | 4,580,415 | 4,774,815 |
| | | | 6,826,742 |
| U.S. Treasury Inflation — Indexed Notes–1.54% |
| 0.13%, 04/15/2021(e) | | 2,156,080 | 2,136,374 |
| 0.63%, 04/15/2023(e) | | 2,674,438 | 2,706,538 |
| 0.88%, 01/15/2029(e) | | 2,276,730 | 2,397,773 |
| | | | 7,240,685 |
| U.S. Treasury Notes–33.59% |
| 2.00%, 09/30/2020 | | 2,500,000 | 2,503,613 |
| 1.75%, 12/31/2020 | | 2,500,000 | 2,496,680 |
| 1.38%, 01/31/2021 | | 3,000,000 | 2,978,789 |
| 7.88%, 02/15/2021 | | 1,100,000 | 1,206,004 |
| 2.50%, 02/28/2021 | | 5,900,000 | 5,965,799 |
| 2.25%, 04/30/2021 | | 5,000,000 | 5,041,406 |
| 2.63% - 3.13%, 05/15/2021 | | 4,100,000 | 4,182,219 |
| 2.13%, 08/15/2021 | | 2,700,000 | 2,720,250 |
| 2.00%, 10/31/2021 | | 2,500,000 | 2,514,697 |
| 2.00%, 11/15/2021 | | 3,300,000 | 3,321,334 |
| 2.00%, 12/31/2021 | | 3,000,000 | 3,019,805 |
| 2.00%, 07/31/2022 | | 2,000,000 | 2,016,211 |
| 1.63%, 08/31/2022 | | 5,000,000 | 4,983,105 |
| 1.63%, 11/15/2022 | | 2,000,000 | 1,992,891 |
| 2.00%, 11/30/2022 | | 2,700,000 | 2,723,889 |
| 2.38%, 01/31/2023 | | 2,000,000 | 2,044,219 |
| 1.63%, 04/30/2023 | | 4,000,000 | 3,983,359 |
| 1.63% - 2.75%, 05/31/2023 | | 9,700,000 | 10,009,344 |
| 1.63%, 10/31/2023 | | 625,000 | 621,716 |
| 2.13%, 11/30/2023 | | 5,500,000 | 5,586,475 |
| 2.63%, 12/31/2023 | | 14,000,000 | 14,522,266 |
| 2.13%, 03/31/2024 | | 4,000,000 | 4,065,312 |
| 2.00%, 05/31/2024 | | 2,500,000 | 2,528,369 |
| 2.13%, 07/31/2024 | | 3,000,000 | 3,049,863 |
| 2.25%, 11/15/2024 | | 5,000,000 | 5,115,137 |
| 2.88%, 05/31/2025 | | 4,000,000 | 4,233,828 |
| 2.88%, 11/30/2025 | | 2,500,000 | 2,654,004 |
| 2.63%, 12/31/2025 | | 4,000,000 | 4,187,422 |
| 1.50%, 08/15/2026 | | 5,250,000 | 5,113,215 |
| 2.38%, 05/15/2027 | | 1,000,000 | 1,033,379 |
| 2.25%, 11/15/2027 | | 4,000,000 | 4,093,359 |
| 2.38%, 05/15/2029 | | 2,600,000 | 2,685,668 |
| 5.38%, 02/15/2031 | | 3,800,000 | 5,101,574 |
| 2.88%, 08/15/2045 | | 750,000 | 800,859 |
| | Principal
Amount | Value |
| U.S. Treasury Notes–(continued) |
| 3.00%, 11/15/2045 | | $3,000,000 | $3,279,902 |
| 2.50%, 05/15/2046 | | 6,000,000 | 5,958,750 |
| 2.25%, 08/15/2046 | | 6,550,000 | 6,181,179 |
| 3.00%, 05/15/2047 | | 7,300,000 | 7,987,797 |
| 2.75%, 11/15/2047 | | 5,500,000 | 5,733,643 |
| | | | 158,237,331 |
| Total U.S. Treasury Securities (Cost $194,449,400) | 201,189,456 |
|
| Asset-Backed Securities–9.91%(f) |
| Banc of America Commercial Mortgage Trust, Series 2015-UBS7, Class XA, IO, 0.98%, 09/15/2048(b) | | 16,065,407 | 671,682 |
| Bear Stearns Adjustable Rate Mortgage Trust, Series 2004-10, Class 12A1, 4.24%, 01/25/2035(b) | | 446,666 | 462,730 |
| Chase Mortgage Finance Corp., | | |
| Series 2016-1, Class M3, 3.75%, 04/25/2045(b)(g) | | 2,159,973 | 2,192,793 |
| Series 2016-2, Class M3, 3.75%, 12/25/2045(b)(g) | | 2,538,461 | 2,590,843 |
| Commercial Mortgage Trust, | | |
Series 2015-CR23, Class CMB–
Class CMB, 3.81%, 05/10/2048(b)(g) | | 4,740,000 | 4,773,987 |
| Series 2015-CR24, Class B, 4.52%, 08/10/2048(b) | | 6,200,000 | 6,674,518 |
| FRESB Mortgage Trust, Series 2019-SB63, Class A5, 2.55% (1 mo. USD LIBOR + 2.55%), 02/25/2039(a) | | 3,800,000 | 3,828,111 |
| Galton Funding Mortgage Trust, Series 2018-2, Series A41, 4.50%, 10/25/2058(b)(g) | | 3,586,410 | 3,690,501 |
JP Morgan Mortgage Trust, Series 2018-8, Class A15–
Class A15, 4.00%, 01/25/2049(b)(g) | | 2,805,075 | 2,846,683 |
| New Residential Mortgage Loan Trust, Series 2018-4A, Class A1S, 3.15% (1 mo. USD LIBOR + 0.75%), 01/25/2048(a)(g) | | 3,911,215 | 3,918,275 |
| Starwood Mortgage Residential Trust, Series IMC2, Class A3, 4.38%, 10/25/2048(b)(g) | | 4,097,099 | 4,215,599 |
| Towd Point Mortgage Trust, Series 2015-1, Class AES, 3.00%, 10/25/2053(b)(g) | | 1,233,439 | 1,237,245 |
| Verus Securitization Trust, Series 2018-3, Class A-2, 4.18%, 10/25/2058(b)(g) | | 3,319,997 | 3,405,030 |
| Wells Fargo Commercial Mortgage Trust, Series 2015-C28, Class B, 4.25%, 05/15/2048(b) | | 5,900,000 | 6,179,468 |
| Total Asset-Backed Securities (Cost $45,764,668) | 46,687,465 |
See accompanying Notes to Financial Statements which are an integral part of the financial statements.
Invesco V.I. Government Securities Fund
| | Principal
Amount | Value |
| U.S. Dollar Denominated Bonds & Notes–2.34% |
| Other Diversified Financial Services–1.41% |
| Private Export Funding Corp., | | |
| Series BB, 4.30%, 12/15/2021 | | $1,540,000 | $1,624,810 |
| Series HH, 1.45%, 08/15/2019 | | 5,000,000 | 4,995,404 |
| | | | 6,620,214 |
| Sovereign Debt–0.93% |
| Israel Government AID Bond, 5.13%, 11/01/2024 | | 3,800,000 | 4,386,982 |
| Total U.S. Dollar Denominated Bonds & Notes (Cost $10,350,571) | 11,007,196 |
| U.S. Government Sponsored Agency Securities–1.76% |
| Federal Home Loan Bank (FHLB)–1.34% |
| Federal Home Loan Bank, 3.38%, 06/12/2020 | | 6,220,000 | 6,300,012 |
| | Principal
Amount | Value |
| Tennessee Valley Authority (TVA)–0.42% |
| Tennessee Valley Authority, 1.88%, 08/15/2022 | | $2,000,000 | $2,001,199 |
| Total U.S. Government Sponsored Agency Securities (Cost $8,280,220) | 8,301,211 |
| | Shares | |
| Money Market Funds–0.28% |
| Invesco Government & Agency Portfolio,Institutional Class, 2.26% (Cost $1,330,449)(h) | 1,330,449 | 1,330,449 |
| TOTAL INVESTMENTS IN SECURITIES–99.78% (Cost $458,461,746) | 470,005,893 |
| OTHER ASSETS LESS LIABILITIES–0.22% | 1,025,424 |
| NET ASSETS–100.00% | $471,031,317 |
Investment Abbreviations:
| ACES | – Automatically Convertible Extendable Security |
| ARM | – Adjustable Rate Mortgage |
| IO | – Interest Only |
| LIBOR | – London Interbank Offered Rate |
| REMICs | – Real Estate Mortgage Investment Conduits |
| STRIPS | – Separately Traded Registered Interest and Principal Security |
| USD | – U.S. Dollar |
Notes to Schedule of Investments:
| (a) | Interest or dividend rate is redetermined periodically. Rate shown is the rate in effect on June 30, 2019. |
| (b) | Interest rate is redetermined periodically based on the cash flows generated by the pool of assets backing the security, less any applicable fees. The rate shown is the rate in effect on June 30, 2019. |
| (c) | All or a portion of the value was pledged and/or designated as collateral to cover margin requirements for open futures contracts and swap agreements. See Note 1J and Note 1L. |
| (d) | Security traded on a discount basis. The interest rate shown represents the discount rate at the time of purchase by the Fund. |
| (e) | Principal amount of security and interest payments are adjusted for inflation. See Note 1I. |
| (f) | Non-U.S. government sponsored securities. |
| (g) | Security purchased or received in a transaction exempt from registration under the Securities Act of 1933, as amended (the “1933 Act”). The security may be resold pursuant to an exemption from registration under the 1933 Act, typically to qualified institutional buyers. The aggregate value of these securities at June 30, 2019 was $28,870,956, which represented 6.13% of the Fund’s Net Assets. |
| (h) | The money market fund and the Fund are affiliated by having the same investment adviser. The rate shown is the 7-day SEC standardized yield as of June 30, 2019. |
| Open Futures Contracts |
| Long Futures Contracts | Number of
Contracts | Expiration
Month | Notional
Value | Value | Unrealized
Appreciation
(Depreciation)(a) |
| Interest Rate Risk |
| U.S. Treasury 2 Year Notes | 229 | September-2019 | $49,276,149 | $282,354 | $282,354 |
| U.S. Treasury 5 Year Notes | 86 | September-2019 | 10,161,438 | 12,576 | 12,576 |
| U.S. Treasury 10 Year Notes | 150 | September-2019 | 19,195,312 | 126,596 | 126,596 |
| U.S. Treasury Ultra Bonds | 96 | September-2019 | 17,046,000 | 498,990 | 498,990 |
| Subtotal—Long Futures Contracts | 920,516 | 920,516 |
| Short Futures Contracts | | | | | |
| Interest Rate Risk |
| U.S. Treasury 10 Year Ultra Bonds | 79 | September-2019 | (10,911,875) | (185,981) | (185,981) |
| Total Futures Contracts | $734,535 | $734,535 |
| (a) | The daily variation margin receivable (payable) at period end is recorded in the Statement of Assets and Liabilities. |
See accompanying Notes to Financial Statements which are an integral part of the financial statements.
Invesco V.I. Government Securities Fund
| Open Centrally Cleared Interest Rate Swap Agreements |
Pay/
Receive
Floating
Rate | Floating Rate Index | Payment
Frequency | (Pay)/
Receive
Fixed
Rate | Payment
Frequency | Maturity
Date | Notional Value | Upfront
Payments
Paid
(Received) | Value | Unrealized
Appreciation
(Depreciation)(a) |
| Interest Rate Risk |
| Receive | 3 month USD LIBOR | Quarterly | (2.592)% | Semi-Annually | 03/11/2021 | $ | (22,000,000) | $— | $(273,631) | $(273,631) |
| Receive | 3 month USD LIBOR | Quarterly | (2.585) | Semi-Annually | 03/12/2021 | $ | (47,000,000) | — | (581,339) | (581,339) |
| Total Centrally Cleared Interest Rate Swap Agreements | | | | $— | $(854,970) | $(854,970) |
| (a) | The daily variation margin receivable at period end is recorded in the Statement of Assets and Liabilities. |
Portfolio Composition
By security type, based on Net Assets
as of June 30, 2019
| U.S. Government Sponsored Agency Mortgage-Backed Securities | 42.78% |
| U.S. Treasury Securities | 42.71 |
| Asset-Backed Securities | 9.91 |
| U.S. Dollar Denominated Bonds & Notes | 2.34 |
| U.S. Government Sponsored Agency Securities | 1.76 |
| Money Market Funds Plus Other Assets Less Liabilities | 0.50 |
See accompanying Notes to Financial Statements which are an integral part of the financial statements.
Invesco V.I. Government Securities Fund
Statement of Assets and Liabilities
June 30, 2019
(Unaudited)
| Assets: | |
Investments in securities, at value
(Cost $457,131,297) | $468,675,444 |
| Investments in affiliated money market funds, at value (Cost $1,330,449) | 1,330,449 |
| Other investments: | |
| Variation margin receivable—centrally cleared swap agreements | 20,665 |
| Receivable for: | |
| Dividends | 13,368 |
| Fund shares sold | 128,052 |
| Principal paydowns | 528,623 |
| Interest | 2,033,461 |
| Investment for trustee deferred compensation and retirement plans | 240,332 |
| Total assets | 472,970,394 |
| Liabilities: | |
| Other investments: | |
| Variation margin payable - futures contracts | 24,713 |
| Payable for: | |
| Fund shares reacquired | 856,246 |
| Amount due custodian | 431,715 |
| Accrued fees to affiliates | 305,536 |
| Accrued trustees’ and officers’ fees and benefits | 142 |
| Accrued other operating expenses | 62,050 |
| Trustee deferred compensation and retirement plans | 258,675 |
| Total liabilities | 1,939,077 |
| Net assets applicable to shares outstanding | $471,031,317 |
| Net assets consist of: | |
| Shares of beneficial interest | $462,626,399 |
| Distributable earnings | 8,404,918 |
| | $471,031,317 |
| Net Assets: |
| Series I | $278,839,828 |
| Series II | $192,191,489 |
| Shares outstanding, no par value, with an unlimited number of shares authorized: |
| Series I | 23,797,181 |
| Series II | 16,575,388 |
| Series I: | |
| Net asset value per share | $11.72 |
| Series II: | |
| Net asset value per share | $11.59 |
Statement of Operations
For the six months ended June 30, 2019
(Unaudited)
| Investment income: | |
| Interest | $7,042,790 |
| Treasury Inflation-Protected Securities inflation adjustments | 174,515 |
| Dividends from affiliated money market funds | 55,060 |
| Total investment income | 7,272,365 |
| Expenses: | |
| Advisory fees | 1,085,115 |
| Administrative services fees | 372,742 |
| Custodian fees | 19,588 |
| Distribution fees - Series II | 234,545 |
| Transfer agent fees | 23,734 |
| Trustees’ and officers’ fees and benefits | 14,420 |
| Reports to shareholders | 6,071 |
| Professional services fees | 32,410 |
| Other | 16,372 |
| Total expenses | 1,804,997 |
| Less: Fees waived | (2,184) |
| Net expenses | 1,802,813 |
| Net investment income | 5,469,552 |
| Realized and unrealized gain (loss) from: | |
| Net realized gain (loss) from: | |
| Investment securities | (714,912) |
| Futures contracts | 1,427,525 |
| Swap agreements | 335,265 |
| | 1,047,878 |
| Change in net unrealized appreciation (depreciation) of: | |
| Investment securities | 13,766,637 |
| Futures contracts | 431,425 |
| Swap agreements | (1,180,635) |
| | 13,017,427 |
| Net realized and unrealized gain | 14,065,305 |
| Net increase in net assets resulting from operations | $19,534,857 |
See accompanying Notes to Financial Statements which are an integral part of the financial statements.
Invesco V.I. Government Securities Fund
Statement of Changes in Net Assets
For the six months ended June 30, 2019 and the year ended December 31, 2018
(Unaudited)
| | June 30,
2019 | December 31,
2018 |
| Operations: | | |
| Net investment income | $5,469,552 | $10,721,947 |
| Net realized gain (loss) | 1,047,878 | (4,268,596) |
| Change in net unrealized appreciation (depreciation) | 13,017,427 | (4,960,649) |
| Net increase in net assets resulting from operations | 19,534,857 | 1,492,702 |
| Distributions to shareholders from distributable earnings: | | |
| Series I | — | (6,550,635) |
| Series II | — | (3,832,997) |
| Total distributions from distributable earnings | — | (10,383,632) |
| Share transactions–net: | | |
| Series I | (12,266,560) | (33,348,279) |
| Series II | (7,438,778) | (11,943,167) |
| Net increase (decrease) in net assets resulting from share transactions | (19,705,338) | (45,291,446) |
| Net increase (decrease) in net assets | (170,481) | (54,182,376) |
| Net assets: | | |
| Beginning of period | 471,201,798 | 525,384,174 |
| End of period | $471,031,317 | $471,201,798 |
See accompanying Notes to Financial Statements which are an integral part of the financial statements.
Invesco V.I. Government Securities Fund
Financial Highlights
June 30, 2019
(Unaudited)
The following schedule presents financial highlights for a share of the Fund outstanding throughout the periods indicated.
| | Net asset
value,
beginning
of period | Net
investment
income(a) | Net gains
(losses)
on securities
(both
realized and
unrealized) | Total from
investment
operations | Dividends
from net
investment
income | Net asset
value, end
of period | Total
return(b) | Net assets,
end of period
(000’s omitted) | Ratio of
expenses
to average
net assets
with fee waivers
and/or expenses
absorbed | Ratio of
expenses
to average net
assets without
fee waivers
and/or expenses
absorbed | Ratio of net
investment
income
to average
net assets | Portfolio
turnover(c) |
| Series I |
| Six months ended 06/30/19 | $11.22 | $0.14 | $0.36 | $0.50 | $— | $11.72 | 4.46% | $278,840 | 0.69%(d) | 0.69%(d) | 2.51%(d) | 22% |
| Year ended 12/31/18 | 11.41 | 0.25 | (0.19) | 0.06 | (0.25) | 11.22 | 0.56 | 279,476 | 0.69 | 0.69 | 2.25 | 25 |
| Year ended 12/31/17 | 11.44 | 0.22 | (0.01) | 0.21 | (0.24) | 11.41 | 1.87 | 318,298 | 0.70 | 0.70 | 1.97 | 35 |
| Year ended 12/31/16 | 11.52 | 0.23 | (0.07) | 0.16 | (0.24) | 11.44 | 1.32 | 353,614 | 0.73 | 0.73 | 1.93 | 31 |
| Year ended 12/31/15 | 11.74 | 0.17 | (0.13) | 0.04 | (0.26) | 11.52 | 0.34 | 393,090 | 0.77 | 0.77 | 1.44 | 59 |
| Year ended 12/31/14 | 11.64 | 0.16 | 0.32 | 0.48 | (0.38) | 11.74 | 4.14 | 474,556 | 0.78 | 0.78 | 1.36 | 55 |
| Series II |
| Six months ended 06/30/19 | 11.12 | 0.13 | 0.34 | 0.47 | — | 11.59 | 4.23 | 192,191 | 0.94(d) | 0.94(d) | 2.26(d) | 22 |
| Year ended 12/31/18 | 11.31 | 0.22 | (0.19) | 0.03 | (0.22) | 11.12 | 0.29 | 191,725 | 0.94 | 0.94 | 2.00 | 25 |
| Year ended 12/31/17 | 11.33 | 0.19 | (0.00) | 0.19 | (0.21) | 11.31 | 1.72 | 207,086 | 0.95 | 0.95 | 1.72 | 35 |
| Year ended 12/31/16 | 11.42 | 0.20 | (0.08) | 0.12 | (0.21) | 11.33 | 1.00 | 205,010 | 0.98 | 0.98 | 1.68 | 31 |
| Year ended 12/31/15 | 11.64 | 0.14 | (0.13) | 0.01 | (0.23) | 11.42 | 0.06 | 195,392 | 1.02 | 1.02 | 1.19 | 59 |
| Year ended 12/31/14 | 11.54 | 0.13 | 0.31 | 0.44 | (0.34) | 11.64 | 3.88 | 212,788 | 1.03 | 1.03 | 1.11 | 55 |
| (a) | Calculated using average shares outstanding. |
| (b) | Includes adjustments in accordance with accounting principles generally accepted in the United States of America and as such, the net asset value for financial reporting purposes and the returns based upon those net asset values may differ from the net asset value and returns for shareholder transactions. Total returns are not annualized for periods less than one year, if applicable, and do not reflect charges assessed in connection with a variable product, which if included would reduce total returns. |
| (c) | Portfolio turnover is calculated at the fund level and is not annualized for periods less than one year, if applicable. |
| (d) | Ratios are annualized and based on average daily net assets (000’s omitted) of $269,334 and $189,191 for Series I and Series II shares, respectively. |
See accompanying Notes to Financial Statements which are an integral part of the financial statements.
Invesco V.I. Government Securities Fund
Notes to Financial Statements
June 30, 2019
(Unaudited)
NOTE 1—Significant Accounting Policies
Invesco V.I. Government Securities Fund (the “Fund”) is a series portfolio of AIM Variable Insurance Funds (Invesco Variable Insurance Funds) (the “Trust”). The Trust is a Delaware statutory trust registered under the Investment Company Act of 1940, as amended (the “1940 Act”), as an open-end series management investment company. Information presented in these financial statements pertains only to the Fund. Matters affecting the Fund or each class will be voted on exclusively by the shareholders of the Fund or each class. Current Securities and Exchange Commission (“SEC”) guidance, however, requires participating insurance companies offering separate accounts to vote shares proportionally in accordance with the instructions of the contract owners whose investments are funded by shares of each Fund or class.
The Fund’s investment objective is total return, comprised of current income and capital appreciation.
The Fund currently offers two classes of shares, Series I and Series II, both of which are offered to insurance company separate accounts funding variable annuity contracts and variable life insurance policies (“variable products”).
The Fund is an investment company and accordingly follows the investment company accounting and reporting guidance in accordance with Financial Accounting Standards Board Accounting Standards Codification Topic 946,Financial Services – Investment Companies.
The following is a summary of the significant accounting policies followed by the Fund in the preparation of its financial statements.
| A. | Security Valuations – Securities, including restricted securities, are valued according to the following policy. |
Debt obligations (including convertible securities) and unlisted equities are fair valued using an evaluated quote provided by an independent pricing service. Evaluated quotes provided by the pricing service may be determined without exclusive reliance on quoted prices, and may reflect appropriate factors such as institution-size trading in similar groups of securities, developments related to specific securities, dividend rate (for unlisted equities), yield (for debt obligations), quality, type of issue, coupon rate (for debt obligations), maturity (for debt obligations), individual trading characteristics and other market data. Pricing services generally value debt obligations assuming orderly transactions of institutional round lot size, but a fund may hold or transact in the same securities in smaller, odd lot sizes. Odd lots often trade at lower prices than institutional round lots. Debt obligations are subject to interest rate and credit risks. In addition, all debt obligations involve some risk of default with respect to interest and/or principal payments.
A security listed or traded on an exchange (except convertible securities) is valued at its last sales price or official closing price as of the close of the customary trading session on the exchange where the security is principally traded, or lacking any sales or official closing price on a particular day, the security may be valued at the closing bid price on that day. Securities traded in the over-the-counter market are valued based on prices furnished by independent pricing services or market makers. When such securities are valued by an independent pricing service they may be considered fair valued. Futures contracts are valued at the final settlement price set by an exchange on which they are principally traded. Listed options are valued at the mean between the last bid and asked prices from the exchange on which they are principally traded. Options not listed on an exchange are valued by an independent source at the mean between the last bid and asked prices. For purposes of determining net asset value ("NAV") per share, futures and option contracts generally are valued 15 minutes after the close of the customary trading session of the New York Stock Exchange (“NYSE”).
Investments in open-end and closed-end registered investment companies that do not trade on an exchange are valued at the end-of-day net asset value per share. Investments in open-end and closed-end registered investment companies that trade on an exchange are valued at the last sales price or official closing price as of the close of the customary trading session on the exchange where the security is principally traded.
Swap agreements are fair valued using an evaluated quote, if available, provided by an independent pricing service. Evaluated quotes provided by the pricing service are valued based on a model which may include end-of-day net present values, spreads, ratings, industry, company performance and returns of referenced assets. Centrally cleared swap agreements are valued at the daily settlement price determined by the relevant exchange or clearinghouse.
Foreign securities’ (including foreign exchange contracts) prices are converted into U.S. dollar amounts using the applicable exchange rates as of the close of the NYSE. If market quotations are available and reliable for foreign exchange-traded equity securities, the securities will be valued at the market quotations. Because trading hours for certain foreign securities end before the close of the NYSE, closing market quotations may become unreliable. If between the time trading ends on a particular security and the close of the customary trading session on the NYSE, events occur that the investment adviser determines are significant and make the closing price unreliable, the Fund may fair value the security. If the event is likely to have affected the closing price of the security, the security will be valued at fair value in good faith using procedures approved by the Board of Trustees. Adjustments to closing prices to reflect fair value may also be based on a screening process of an independent pricing service to indicate the degree of certainty, based on historical data, that the closing price in the principal market where a foreign security trades is not the current value as of the close of the NYSE. Foreign securities’ prices meeting the approved degree of certainty that the price is not reflective of current value will be priced at the indication of fair value from the independent pricing service. Multiple factors may be considered by the independent pricing service in determining adjustments to reflect fair value and may include information relating to sector indices, American Depositary Receipts and domestic and foreign index futures. Foreign securities may have additional risks including exchange rate changes, potential for sharply devalued currencies and high inflation, political and economic upheaval, the relative lack of issuer information, relatively low market liquidity and the potential lack of strict financial and accounting controls and standards.
Securities for which market prices are not provided by any of the above methods may be valued based upon quotes furnished by independent sources. The last bid price may be used to value equity securities. The mean between the last bid and asked prices is used to value debt obligations, including corporate loans.
Securities for which market quotations are not readily available or became unreliable are valued at fair value as determined in good faith by or under the supervision of the Trust’s officers following procedures approved by the Board of Trustees. Issuer specific events, market trends, bid/asked quotes of brokers and information providers and other market data may be reviewed in the course of making a good faith determination of a security’s fair value.
Invesco V.I. Government Securities Fund
The Fund may invest in securities that are subject to interest rate risk, meaning the risk that the prices will generally fall as interest rates rise and, conversely, the prices will generally rise as interest rates fall. Specific securities differ in their sensitivity to changes in interest rates depending on their individual characteristics. Changes in interest rates may result in increased market volatility, which may affect the value and/or liquidity of certain Fund investments.
Valuations change in response to many factors including the historical and prospective earnings of the issuer, the value of the issuer’s assets, general economic conditions, interest rates, investor perceptions and market liquidity. Because of the inherent uncertainties of valuation, the values reflected in the financial statements may materially differ from the value received upon actual sale of those investments.
| B. | Securities Transactions and Investment Income – Securities transactions are accounted for on a trade date basis. Realized gains or losses on sales are computed on the basis of specific identification of the securities sold. Interest income (net of withholding tax, if any) is recorded on the accrual basis from settlement date. Bond premiums and discounts are amortized and/or accreted over the lives of the respective securities. Pay-in-kind interest income and non-cash dividend income received in the form of securities in-lieu of cash are recorded at the fair value of the securities received. Paydown gains and losses on mortgage and asset-backed securities are recorded as adjustments to interest income. Dividend income (net of withholding tax, if any) is recorded on the ex-dividend date. |
The Fund may periodically participate in litigation related to Fund investments. As such, the Fund may receive proceeds from litigation settlements. Any proceeds received are included in the Statement of Operations as realized gain (loss) for investments no longer held and as unrealized gain (loss) for investments still held.
Brokerage commissions and mark ups are considered transaction costs and are recorded as an increase to the cost basis of securities purchased and/or a reduction of proceeds on a sale of securities. Such transaction costs are included in the determination of net realized and unrealized gain (loss) from investment securities reported in the Statement of Operations and the Statement of Changes in Net Assets and the net realized and unrealized gains (losses) on securities per share in the Financial Highlights. Transaction costs are included in the calculation of the Fund’s net asset value and, accordingly, they reduce the Fund’s total returns. These transaction costs are not considered operating expenses and are not reflected in net investment income reported in the Statement of Operations and the Statement of Changes in Net Assets, or the net investment income per share and the ratios of expenses and net investment income reported in the Financial Highlights, nor are they limited by any expense limitation arrangements between the Fund and the investment adviser.
The Fund allocates income and realized and unrealized capital gains and losses to a class based on the relative net assets of each class.
| C. | Country Determination — For the purposes of making investment selection decisions and presentation in the Schedule of Investments, the investment adviser may determine the country in which an issuer is located and/or credit risk exposure based on various factors. These factors include the laws of the country under which the issuer is organized, where the issuer maintains a principal office, the country in which the issuer derives 50% or more of its total revenues and the country that has the primary market for the issuer’s securities, as well as other criteria. Among the other criteria that may be evaluated for making this determination are the country in which the issuer maintains 50% or more of its assets, the type of security, financial guarantees and enhancements, the nature of the collateral and the sponsor organization. Country of issuer and/or credit risk exposure has been determined to be the United States of America, unless otherwise noted. |
| D. | Distributions– Distributions from net investment income and net realized capital gain, if any, are generally declared and paid to separate accounts of participating insurance companies annually and recorded on the ex-dividend date. |
| E. | Federal Income Taxes –The Fund intends to comply with the requirements of Subchapter M of the Internal Revenue Code of 1986, as amended (the “Internal Revenue Code”), necessary to qualify as a regulated investment company and to distribute substantially all of the Fund’s taxable earnings to shareholders. As such, the Fund will not be subject to federal income taxes on otherwise taxable income (including net realized capital gain) that is distributed to shareholders. Therefore, no provision for federal income taxes is recorded in the financial statements. |
The Fund recognizes the tax benefits of uncertain tax positions only when the position is more likely than not to be sustained. Management has analyzed the Fund’s uncertain tax positions and concluded that no liability for unrecognized tax benefits should be recorded related to uncertain tax positions. Management is not aware of any tax positions for which it is reasonably possible that the total amounts of unrecognized tax benefits will change materially in the next 12 months.
The Fund files tax returns in the U.S. Federal jurisdiction and certain other jurisdictions. Generally, the Fund is subject to examinations by such taxing authorities for up to three years after the filing of the return for the tax period.
| F. | Expenses– Fees provided for under the Rule 12b-1 plan of a particular class of the Fund and which are directly attributable to that class are charged to the operations of such class. All other expenses are allocated among the classes based on relative net assets. |
| G. | Accounting Estimates – The preparation of financial statements in conformity with accounting principles generally accepted in the United States of America (“GAAP”) requires management to make estimates and assumptions that affect the reported amounts of assets and liabilities at the date of the financial statements and the reported amounts of revenues and expenses during the reporting period including estimates and assumptions related to taxation. Actual results could differ from those estimates by a significant amount. In addition, the Fund monitors for material events or transactions that may occur or become known after the period-end date and before the date the financial statements are released to print. |
| H. | Indemnifications – Under the Trust’s organizational documents, each Trustee, officer, employee or other agent of the Trust is indemnified against certain liabilities that may arise out of the performance of their duties to the Fund. Additionally, in the normal course of business, the Fund enters into contracts, including the Fund’s servicing agreements, that contain a variety of indemnification clauses. The Fund’s maximum exposure under these arrangements is unknown as this would involve future claims that may be made against the Fund that have not yet occurred. The risk of material loss as a result of such indemnification claims is considered remote. |
| I. | Treasury Inflation-Protected Securities— The Fund may invest in Treasury Inflation-Protected Securities (“TIPS”). TIPS are fixed income securities whose principal value is periodically adjusted to the rate of inflation. The principal value of TIPS will be adjusted upward or downward, and any increase or decrease in the principal amount of TIPS will be shown asTreasury Inflation-Protected Securities inflation adjustments in the Statement of Operations, even though investors do not receive their principal until maturity. |
| J. | Futures Contracts — The Fund may enter into futures contracts to manage exposure to interest rate, equity and market price movements and/or currency risks. A futures contract is an agreement between two parties ("Counterparties") to purchase or sell a specified underlying security, currency or commodity (or delivery of a cash settlement price, in the case of an index future) for a fixed price at a future date. The Fund currently invests only in exchange-traded futures and they are standardized as to maturity date and underlying financial instrument. Initial margin |
Invesco V.I. Government Securities Fund
| | deposits required upon entering into futures contracts are satisfied by the segregation of specific securities or cash as collateral at the futures commission merchant (broker). During the period the futures contracts are open, changes in the value of the contracts are recognized as unrealized gains or losses by recalculating the value of the contracts on a daily basis. Subsequent or variation margin payments are received or made depending upon whether unrealized gains or losses are incurred. These amounts are reflected as receivables or payables on the Statement of Assets and Liabilities. When the contracts are closed or expire, the Fund recognizes a realized gain or loss equal to the difference between the proceeds from, or cost of, the closing transaction and the Fund’s basis in the contract. The net realized gain (loss) and the change in unrealized gain (loss) on futures contracts held during the period is included on the Statement of Operations. The primary risks associated with futures contracts are market risk and the absence of a liquid secondary market. If the Fund were unable to liquidate a futures contract and/or enter into an offsetting closing transaction, the Fund would continue to be subject to market risk with respect to the value of the contracts and continue to be required to maintain the margin deposits on the futures contracts. Futures contracts have minimal Counterparty risk since the exchange’s clearinghouse, as Counterparty to all exchange-traded futures, guarantees the futures against default. Risks may exceed amounts recognized in the Statement of Assets and Liabilities. |
| K. | Put Options Purchased – The Fund may purchase put options including options on securities indexes, or foreign currency and/or futures contracts. By purchasing a put option, the Fund obtains the right (but not the obligation) to sell the option’s underlying instrument at a fixed strike price. In return for this right, the Fund pays an option premium. The option’s underlying instrument may be a security, securities index, or a futures contract. |
Additionally, the Fund may enter into an option on a swap agreement, also called a “swaption”. A swaption is an option that gives the buyer the right, but not the obligation, to enter into a swap on a future date in exchange for paying a market-based premium. A receiver swaption gives the owner the right to receive the total return of a specified asset, reference rate or index. Swaptions also include options that allow an existing swap to be terminated or extended by one of the Counterparties.
Put options may be used by the Fund to hedge securities it owns by locking in a minimum price at which the Fund can sell. If security prices fall, the put option could be exercised to offset all or a portion of the Fund’s resulting losses. At the same time, because the maximum the Fund has at risk is the cost of the option, purchasing put options does not eliminate the potential for the Fund to profit from an increase in the value of the securities hedged. Realized and unrealized gains and losses on put options purchased are included in the Statement of Operations as Net realized gain (loss) from and Change in net unrealized appreciation (depreciation) of Investment securities. A risk in buying an option is that the Fund pays a premium whether or not the option is exercised. In addition, there can be no assurance that a liquid secondary market will exist for any option purchased.
| L. | Swap Agreements — The Fund may enter into various swap transactions, including interest rate, total return, index, currency and credit default swap contracts (“CDS”) for investment purposes or to manage interest rate, currency or credit risk. Such transactions are agreements between Counterparties. A swap agreement may be negotiated bilaterally and traded over-the-counter (“OTC”) between two parties (“uncleared/ OTC”) or, in some instances, must be transacted through a future commission merchant (“FCM”) and cleared through a clearinghouse that serves as a central Counterparty (“centrally cleared swap”). These agreements may contain among other conditions, events of default and termination events, and various covenants and representations such as provisions that require the Fund to maintain a pre-determined level of net assets, and/ or provide limits regarding the decline of the Fund’s NAV over specific periods of time. If the Fund were to trigger such provisions and have open derivative positions at that time, the Counterparty may be able to terminate such agreement and request immediate payment in an amount equal to the net liability positions, if any. |
Interest rate, total return, index, and currency swap agreements are two-party contracts entered into primarily to exchange the returns (or differentials in rates of returns) earned or realized on particular predetermined investments or instruments. The gross returns to be exchanged or “swapped” between the parties are calculated with respect to a notional amount, i.e., the return on or increase in value of a particular dollar amount invested at a particular interest rate or return of an underlying asset, in a particular foreign currency, or in a “basket” of securities representing a particular index.
In a centrally cleared swap, the Fund’s ultimate Counterparty is a central clearinghouse. The Fund initially will enter into centrally cleared swaps through an executing broker. When a fund enters into a centrally cleared swap, it must deliver to the central Counterparty (via the FCM) an amount referred to as “initial margin.” Initial margin requirements are determined by the central Counterparty, but an FCM may require additional initial margin above the amount required by the central Counterparty. Initial margin deposits required upon entering into centrally cleared swaps are satisfied by cash or securities as collateral at the FCM. Securities deposited as initial margin are designated on the Schedule of Investments and cash deposited is recorded on the Statement of Assets and Liabilities. During the term of a cleared swap agreement, a “variation margin” amount may be required to be paid by the Fund or may be received by the Fund, based on the daily change in price of the underlying reference instrument subject to the swap agreement and is recorded as a receivable or payable for variation margin in the Statement of Assets and Liabilities until the centrally cleared swap is terminated at which time a realized gain or loss is recorded.
A CDS is an agreement between Counterparties to exchange the credit risk of an issuer. A buyer of a CDS is said to buy protection by paying a fixed payment over the life of the agreement and in some situations an upfront payment to the seller of the CDS. If a defined credit event occurs (such as payment default or bankruptcy), the Fund as a protection buyer would cease paying its fixed payment, the Fund would deliver eligible bonds issued by the reference entity to the seller, and the seller would pay the full notional value, or the “par value”, of the referenced obligation to the Fund. A seller of a CDS is said to sell protection and thus would receive a fixed payment over the life of the agreement and an upfront payment, if applicable. If a credit event occurs, the Fund as a protection seller would cease to receive the fixed payment stream, the Fund would pay the buyer “par value” or the full notional value of the referenced obligation, and the Fund would receive the eligible bonds issued by the reference entity. In turn, these bonds may be sold in order to realize a recovery value. Alternatively, the seller of the CDS and its Counterparty may agree to net the notional amount and the market value of the bonds and make a cash payment equal to the difference to the buyer of protection. If no credit event occurs, the Fund receives the fixed payment over the life of the agreement. As the seller, the Fund would effectively add leverage to its portfolio because, in addition to its total net assets, the Fund would be subject to investment exposure on the notional amount of the CDS. In connection with these agreements, cash and securities may be identified as collateral in accordance with the terms of the respective swap agreements to provide assets of value and recourse in the event of default under the swap agreement or bankruptcy/insolvency of a party to the swap agreement. If a Counterparty becomes bankrupt or otherwise fails to perform its obligations due to financial difficulties, the Fund may experience significant delays in obtaining any recovery in a bankruptcy or other reorganization proceeding. The Fund may obtain only
Invesco V.I. Government Securities Fund
limited recovery or may obtain no recovery in such circumstances. The Fund’s maximum risk of loss from Counterparty risk, either as the protection seller or as the protection buyer, is the value of the contract. The risk may be mitigated by having a master netting arrangement between the Fund and the Counterparty and by the designation of collateral by the Counterparty to cover the Fund’s exposure to the Counterparty.
Implied credit spreads represent the current level at which protection could be bought or sold given the terms of the existing CDS contract and serve as an indicator of the current status of the payment/performance risk of the CDS. An implied spread that has widened or increased since entry into the initial contract may indicate a deteriorating credit profile and increased risk of default for the reference entity. A declining or narrowing spread may indicate an improving credit profile or decreased risk of default for the reference entity. Alternatively, credit spreads may increase or decrease reflecting the general tolerance for risk in the credit markets.
An interest rate swap is an agreement between Counterparties pursuant to which the parties exchange a floating rate payment for a fixed rate payment based on a specified notional amount.
Changes in the value of centrally cleared and OTC swap agreements are recognized as unrealized gains (losses) in the Statement of Operations by “marking to market” on a daily basis to reflect the value of the swap agreement at the end of each trading day. Payments received or paid at the beginning of the agreement are reflected as such on the Statement of Assets and Liabilities and may be referred to as upfront payments. The Fund accrues for the fixed payment stream and amortizes upfront payments, if any, on swap agreements on a daily basis with the net amount, recorded as a component of realized gain (loss) on the Statement of Operations. A liquidation payment received or made at the termination of a swap agreement is recorded as realized gain (loss) on the Statement of Operations. The Fund segregates cash or liquid securities having a value at least equal to the amount of the potential obligation of a Fund under any swap transaction. Cash held as collateral is recorded as deposits with brokers on the Statement of Assets and Liabilities. Entering into these agreements involves, to varying degrees, lack of liquidity and elements of credit, market, and Counterparty risk in excess of amounts recognized on the Statement of Assets and Liabilities. Such risks involve the possibility that a swap is difficult to sell or liquidate; the Counterparty does not honor its obligations under the agreement and unfavorable interest rates and market fluctuations. It is possible that developments in the swaps market, including potential government regulation, could adversely affect the Fund’s ability to terminate existing swap agreements or to realize amounts to be received under such agreements. A short position in a security poses more risk than holding the same security long. As there is no limit on how much the price of the security can increase, the Fund’s exposure is unlimited.
| M. | Other Risks– The Fund may invest in obligations issued by agencies and instrumentalities of the U.S. Government that may vary in the level of support they receive from the government. The government may choose not to provide financial support to government sponsored agencies or instrumentalities if it is not legally obligated to do so. In this case, if the issuer defaulted, the Fund may not be able to recover its investment in such issuer from the U.S. Government. Many securities purchased by the Fund are not guaranteed by the U.S. Government. |
| N. | Leverage Risk — Leverage exists when the Fund can lose more than it originally invests because it purchases or sells an instrument or enters into a transaction without investing an amount equal to the full economic exposure of the instrument or transaction. |
| O. | Collateral—To the extent the Fund has designated or segregated a security as collateral and that security is subsequently sold, it is the Fund’s practice to replace such collateral no later than the next business day. |
NOTE 2—Advisory Fees and Other Fees Paid to Affiliates
The Trust has entered into a master investment advisory agreement with Invesco Advisers, Inc. (the "Adviser" or "Invesco"). Under the terms of the investment advisory agreement, the Fund accrues daily and pays monthly an advisory fee to the Adviser based on the annual rate of the Fund’s average daily net assets as follows:
| Average Daily Net Assets | Rate |
| First $250 million | 0.50% |
| Over $250 million | 0.45% |
For the six months ended June 30, 2019, the effective advisory fees incurred by the Fund was 0.48%.
Under the terms of a master sub-advisory agreement between the Adviser and each of Invesco Asset Management Deutschland GmbH, Invesco Asset Management Limited, Invesco Asset Management (Japan) Limited, Invesco Hong Kong Limited, Invesco Senior Secured Management, Inc. and Invesco Canada Ltd. and separate sub-advisory agreements with Invesco Capital Management LLC and Invesco Asset Management (India) Private Limited (collectively, the "Affiliated Sub-Advisers") the Adviser, not the Fund, will pay 40% of the fees paid to the Adviser to any such Affiliated Sub-Adviser(s) that provide(s) discretionary investment management services to the Fund based on the percentage of assets allocated to such Affiliated Sub-Adviser(s).
The Adviser has contractually agreed, through at least June 30, 2020, to waive advisory fees and/or reimburse expenses of all shares to the extent necessary to limit total annual fund operating expenses after fee waiver and/or expense reimbursement (excluding certain items discussed below) of Series I shares to 1.50% and Series II shares to 1.75% of average daily net assets (the “expense limits”). In determining the Adviser’s obligation to waive advisory fees and/or reimburse expenses, the following expenses are not taken into account, and could cause the total annual fund operating expenses after fee waiver and/or expense reimbursement to exceed the numbers reflected above: (1) interest; (2) taxes; (3) dividend expense on short sales; (4) extraordinary or non-routine items, including litigation expenses; and (5) expenses that the Fund has incurred but did not actually pay because of an expense offset arrangement. Unless Invesco continues the fee waiver agreement, it will terminate on June 30, 2020. During its term, the fee waiver agreement cannot be terminated or amended to increase the expense limits or reduce the advisory fee waiver without approval of the Board of Trustees. The Adviser did not waive fees and/or reimburse expenses during the period under these expense limits.
Further, the Adviser has contractually agreed, through at least June 30, 2021, to waive the advisory fee payable by the Fund in an amount equal to 100% of the net advisory fees the Adviser receives from the affiliated money market funds on investments by the Fund of uninvested cash in such affiliated money market funds.
For the six months ended June 30, 2019, the Adviser waived advisory fees of $2,184.
The Trust has entered into a master administrative services agreement with Invesco pursuant to which the Fund has agreed to pay Invesco a fee for costs incurred in providing accounting services and fund administrative services to the Fund and to reimburse Invesco for fees paid to insurance
Invesco V.I. Government Securities Fund
companies that have agreed to provide certain administrative services to the Fund. These administrative services provided by the insurance companies may include, among other things: maintenance of master accounts with the Fund; tracking, recording and transmitting net purchase and redemption orders for Fund shares; maintaining and preserving records related to the purchase, redemption and other account activity of variable product owners; distributing copies of Fund documents such as prospectuses, proxy materials and periodic reports, to variable product owners, and responding to inquiries from variable product owners about the Fund. Pursuant to such agreement, for the six months ended June 30, 2019, Invesco was paid $32,095 for accounting and fund administrative services and was reimbursed $340,647 for fees paid to insurance companies. Also, Invesco has entered into a sub-administration agreement whereby State Street Bank and Trust Company (“SSB”) serves as custodian and fund accountant and provides certain administrative services to the Fund.
The Trust has entered into a transfer agency and service agreement with Invesco Investment Services, Inc. (“IIS”) pursuant to which the Fund has agreed to pay IIS a fee for providing transfer agency and shareholder services to the Fund and reimburse IIS for certain expenses incurred by IIS in the course of providing such services. For the six months ended June 30, 2019, expenses incurred under the agreement are shown in the Statement of Operations asTransfer agent fees.
The Trust has entered into a master distribution agreement with Invesco Distributors, Inc. (“IDI”) to serve as the distributor for the Fund. The Trust has adopted a plan pursuant to Rule 12b-1 under the 1940 Act with respect to the Fund’s Series II shares (the “Plan”). The Fund, pursuant to the Plan, pays IDI compensation at the annual rate of 0.25% of the Fund’s average daily net assets of Series II shares. The fees are accrued daily and paid monthly. Of the Plan payments, up to 0.25% of the average daily net assets of the Series II shares may be paid to insurance companies who furnish continuing personal shareholder services to customers who purchase and own Series II shares of the Fund. For the six months ended June 30, 2019, expenses incurred under the Plan are detailed in the Statement of Operations asDistribution fees.
Certain officers and trustees of the Trust are officers and directors of the Adviser, IIS and/or IDI.
NOTE 3—Additional Valuation Information
GAAP defines fair value as the price that would be received to sell an asset or paid to transfer a liability in an orderly transaction between market participants at the measurement date, under current market conditions. GAAP establishes a hierarchy that prioritizes the inputs to valuation methods, giving the highest priority to readily available unadjusted quoted prices in an active market for identical assets (Level 1) and the lowest priority to significant unobservable inputs (Level 3), generally when market prices are not readily available or are unreliable. Based on the valuation inputs, the securities or other investments are tiered into one of three levels. Changes in valuation methods may result in transfers in or out of an investment’s assigned level:
Level 1 – Prices are determined using quoted prices in an active market for identical assets.
Level 2 – Prices are determined using other significant observable inputs. Observable inputs are inputs that other market participants may use in pricing a security. These may include quoted prices for similar securities, interest rates, prepayment speeds, credit risk, yield curves, loss severities, default rates, discount rates, volatilities and others.
Level 3 – Prices are determined using significant unobservable inputs. In situations where quoted prices or observable inputs are unavailable (for example, when there is little or no market activity for an investment at the end of the period), unobservable inputs may be used. Unobservable inputs reflect the Fund’s own assumptions about the factors market participants would use in determining fair value of the securities or instruments and would be based on the best available information.
The following is a summary of the tiered valuation input levels, as of June 30, 2019. The level assigned to the securities valuations may not be an indication of the risk or liquidity associated with investing in those securities. Because of the inherent uncertainties of valuation, the values reflected in the consolidated financial statements may materially differ from the value received upon actual sale of those investments.
| | Level 1 | Level 2 | Level 3 | Total |
| Investments in Securities | | | | |
| U.S. Government Sponsored Agency Mortgage-Backed Securities | $— | $201,490,116 | $— | $201,490,116 |
| U.S. Treasury Securities | — | 201,189,456 | — | 201,189,456 |
| Asset-Backed Securities | — | 46,687,465 | — | 46,687,465 |
| U.S. Dollar Denominated Bonds & Notes | — | 11,007,196 | — | 11,007,196 |
| U.S. Government Sponsored Agency Securities | — | 8,301,211 | — | 8,301,211 |
| Money Market Funds | 1,330,449 | — | — | 1,330,449 |
| Total Investments in Securities | 1,330,449 | 468,675,444 | — | 470,005,893 |
| Other Investments - Assets* | | | | |
| Futures Contracts | 920,516 | — | — | 920,516 |
| Other Investments - Liabilities* | | | | |
| Futures Contracts | (185,981) | — | — | (185,981) |
| Swap Agreements | — | (854,970) | — | (854,970) |
| | (185,981) | (854,970) | — | (1,040,951) |
| Total Other Investments | 734,535 | (854,970) | — | (120,435) |
| Total Investments | $2,064,984 | $467,820,474 | $— | $469,885,458 |
| * | Unrealized appreciation (depreciation). |
Invesco V.I. Government Securities Fund
NOTE 4—Derivative Investments
The Fund may enter into an International Swaps and Derivatives Association Master Agreement (“ISDA Master Agreement”) under which a fund may trade OTC derivatives. An OTC transaction entered into under an ISDA Master Agreement typically involves a collateral posting arrangement, payment netting provisions and close-out netting provisions. These netting provisions allow for reduction of credit risk through netting of contractual obligations. The enforceability of the netting provisions of the ISDA Master Agreement depends on the governing law of the ISDA Master Agreement, among other factors.
For financial reporting purposes, the Fund does not offset OTC derivative assets or liabilities that are subject to ISDA Master Agreements in the Statement of Assets and Liabilities.
Value of Derivative Investments at Period-End
The table below summarizes the value of the Fund’s derivative investments, detailed by primary risk exposure, held as of June 30, 2019:
| | Value |
| Derivative Assets | Interest
Rate Risk |
| Unrealized appreciation on futures contracts — Exchange-Traded(a) | $920,516 |
| Derivatives not subject to master netting agreements | (920,516) |
| Total Derivative Assets subject to master netting agreements | $- |
| | Value |
| Derivative Liabilities | Interest
Rate Risk |
| Unrealized depreciation on futures contracts — Exchange-Traded(a) | $(185,981) |
| Unrealized depreciation on swap agreements — Centrally Cleared(a) | (854,970) |
| Total Derivative Liabilities | (1,040,951) |
| Derivatives not subject to master netting agreements | 1,040,951 |
| Total Derivative Liabilities subject to master netting agreements | $- |
| (a) | The daily variation margin receivable (payable) at period-end is recorded in the Statement of Assets and Liabilities. |
Effect of Derivative Investments for the six months ended June 30, 2019
The table below summarizes the gains (losses) on derivative investments, detailed by primary risk exposure, recognized in earnings during the period:
| | Location of Gain (Loss) on
Statement of Operations |
| | Interest
Rate Risk |
| Realized Gain (Loss): | |
| Futures contracts | $1,427,525 |
| Options purchased(a) | (279,125) |
| Swap agreements | 335,265 |
| Change in Net Unrealized Appreciation (Depreciation): | |
| Futures contracts | 431,425 |
| Options purchased(a) | 148,784 |
| Swap agreements | (1,180,635) |
| Total | $883,239 |
| (a) | Options purchased are included in the net realized gain (loss) from investment securities and the change in net unrealized appreciation (depreciation) on investment securities. |
The table below summarizes the six month average notional value of futures contracts, two month average notional of swaptions purchased and four month average notional of swap agreements outstanding during the period.
| | Futures
Contracts | Swaptions
Purchased | Swap
Agreements |
| Average notional value | $112,633,309 | $57,000,000 | $69,000,000 |
NOTE 5—Trustees’ and Officers’ Fees and Benefits
Trustees’ and Officers’ Fees and Benefits include amounts accrued by the Fund to pay remuneration to certain Trustees and Officers of the Fund. Trustees have the option to defer compensation payable by the Fund, and Trustees’ and Officers’ Fees and Benefits also include amounts accrued by the Fund to fund such deferred compensation amounts. Those Trustees who defer compensation have the option to select various Invesco Funds in which
Invesco V.I. Government Securities Fund
their deferral accounts shall be deemed to be invested. Finally, certain current Trustees were eligible to participate in a retirement plan that provided for benefits to be paid upon retirement to Trustees over a period of time based on the number of years of service. The Fund may have certain former Trustees who also participate in a retirement plan and receive benefits under such plan.Trustees’ and Officers’ Fees and Benefits include amounts accrued by the Fund to fund such retirement benefits. Obligations under the deferred compensation and retirement plans represent unsecured claims against the general assets of the Fund.
NOTE 6—Cash Balances
The Fund is permitted to temporarily carry a negative or overdrawn balance in its account with State Street Bank and Trust Company, the custodian bank. Such balances, if any at period-end, are shown in the Statement of Assets and Liabilities under the payable caption Amount due custodian. To compensate the custodian bank for such overdrafts, the overdrawn Fund may either (1) leave funds as a compensating balance in the account so the custodian bank can be compensated by earning the additional interest; or (2) compensate by paying the custodian bank at a rate agreed upon by the custodian bank and Invesco, not to exceed the contractually agreed upon rate.
NOTE 7—Tax Information
The amount and character of income and gains to be distributed are determined in accordance with income tax regulations, which may differ from GAAP. Reclassifications are made to the Fund’s capital accounts to reflect income and gains available for distribution (or available capital loss carryforward) under income tax regulations. The tax character of distributions paid during the year and the tax components of net assets will be reported at the Fund’s fiscal year-end.
Capital loss carryforward is calculated and reported as of a specific date. Results of transactions and other activity after that date may affect the amount of capital loss carryforward actually available for the Fund to utilize. Capital losses generated in years beginning after December 22, 2010 can be carried forward for an unlimited period, whereas previous losses expire in eight tax years. Capital losses with an expiration period may not be used to offset capital gains until all net capital losses without an expiration date have been utilized. Capital loss carryforwards with no expiration date will retain their character as either short-term or long-term capital losses instead of as short-term capital losses as under prior law. The ability to utilize capital loss carryforwards in the future may be limited under the Internal Revenue Code and related regulations based on the results of future transactions.
The Fund had a capital loss carryforward as of December 31, 2018, as follows:
| Capital Loss Carryforward |
| Expiration | Short-Term | Long-Term | Total |
| Not subject to expiration | $9,307,474 | $10,075,889 | $19,383,363 |
NOTE 8—Investment Transactions
The aggregate amount of investment securities (other than short-term securities, U.S. Treasury obligations and money market funds, if any) purchased and sold by the Fund during the six months ended June 30, 2019 was $84,620,846 and $94,690,557, respectively. During the same period, purchases and sales of U.S. Treasury obligations were $16,382,647 and $27,251,178, respectively. Cost of investments, including any derivatives, on a tax basis includes the adjustments for financial reporting purposes as of the most recently completed federal income tax reporting period-end.
| Unrealized Appreciation (Depreciation) of Investments on a Tax Basis |
| Aggregate unrealized appreciation of investments | $13,448,518 |
| Aggregate unrealized (depreciation) of investments | (2,556,664) |
| Net unrealized appreciation of investments | $10,891,854 |
Cost of investments for tax purposes is $458,993,604.
Invesco V.I. Government Securities Fund
NOTE 9—Share Information
| | Summary of Share Activity |
| | Six months ended
June 30, 2019(a) | | Year ended
December 31, 2018 |
| | Shares | Amount | | Shares | Amount |
| Sold: | | | | | |
| Series I | 2,230,237 | $25,586,291 | | 3,593,416 | $40,500,688 |
| Series II | 767,062 | 8,782,182 | | 1,057,433 | 11,758,788 |
| Issued as reinvestment of dividends: | | | | | |
| Series I | — | — | | 594,971 | 6,550,635 |
| Series II | — | — | | 351,007 | 3,832,997 |
| Reacquired: | | | | | |
| Series I | (3,335,034) | (37,852,851) | | (7,180,556) | (80,399,602) |
| Series II | (1,433,538) | (16,220,960) | | (2,482,818) | (27,534,952) |
| Net increase (decrease) in share activity | (1,771,273) | $(19,705,338) | | (4,066,547) | $(45,291,446) |
| (a) | There are entities that are record owners of more than 5% of the outstanding shares of the Fund and in the aggregate own 78% of the outstanding shares of the Fund. The Fund and the Fund’s principal underwriter or adviser, are parties to participation agreements with these entities whereby these entities sell units of interest in separate accounts funding variable products that are invested in the Fund. The Fund, Invesco and/or Invesco affiliates may make payments to these entities, which are considered to be related to the Fund, for providing services to the Fund, Invesco and/or Invesco affiliates including but not limited to services such as, securities brokerage, third party record keeping and account servicing and administrative services. The Fund has no knowledge as to whether all or any portion of the shares owned of record by these entities are also owned beneficially. |
Invesco V.I. Government Securities Fund
Calculating your ongoing Fund expenses
Example
As a shareholder of the Fund, you incur ongoing costs, including management fees; distribution and/or service fees (12b-1); and other Fund expenses. This example is intended to help you understand your ongoing costs (in dollars) of investing in the Fund and to compare these costs with ongoing costs of investing in other mutual funds. The example is based on an investment of $1,000 invested at the beginning of the period and held for the entire period January 1, 2019 through June 30, 2019.
The actual and hypothetical expenses in the examples below do not represent the effect of any fees or other expenses assessed in connection with a variable product; if they did, the expenses shown would be higher while the ending account values shown would be lower.
Actual expenses
The table below provides information about actual account values and actual expenses. You may use the information in this table, together with the amount you invested, to estimate the expenses that you paid over the period. Simply divide your account value by $1,000 (for example, an $8,600 account value divided by $1,000 = 8.6), then multiply the result by the number in the table under the heading entitled “Actual Expenses Paid During Period” to estimate the expenses you paid on your account during this period.
Hypothetical example for comparison purposes
The table below also provides information about hypothetical account values and hypothetical expenses based on the Fund’s actual expense ratio and an assumed rate of return of 5% per year before expenses, which is not the Fund’s actual return.
The hypothetical account values and expenses may not be used to estimate the actual ending account balance or expenses you paid for the period. You may use this information to compare the ongoing costs of investing in the Fund and other funds. To do so, compare this 5% hypothetical example with the 5% hypothetical examples that appear in the shareholder reports of the other funds.
Please note that the expenses shown in the table are meant to highlight your ongoing costs. Therefore, the hypothetical information is useful in comparing ongoing costs, and will not help you determine the relative total costs of owning different funds.
| | Beginning
Account Value (01/01/19) | ACTUAL | HYPOTHETICAL
(5% annual return before
expenses) | Annualized
Expense
Ratio |
Ending
Account Value
(06/30/19)1 | Expenses
Paid During
Period2 | Ending
Account Value
(06/30/19) | Expenses
Paid During
Period2 |
| Series I | $1,000.00 | $1,044.60 | $3.50 | $1,021.37 | $3.46 | 0.69% |
| Series II | 1,000.00 | 1,043.20 | 4.76 | 1,020.13 | 4.71 | 0.94 |
| 1 | The actual ending account value is based on the actual total return of the Fund for the period January 1, 2019 through June 30, 2019, after actual expenses and will differ from the hypothetical ending account value which is based on the Fund’s expense ratio and a hypothetical annual return of 5% before expenses. |
| 2 | Expenses are equal to the Fund’s annualized expense ratio as indicated above multiplied by the average account value over the period, multiplied by 181/365 to reflect the most recent fiscal half year. |
Invesco V.I. Government Securities Fund
Approval of Investment Advisory and Sub-Advisory Contracts
At meetings held on June 10, 2019, the Board of Trustees (the Board or the Trustees) of AIM Variable Insurance Funds (Invesco Variable Insurance Funds) as a whole, and the independent Trustees, who comprise over 75% of the Board, voting separately, approved the continuance of the Invesco V.I. Government Securities Fund’s (the Fund) Master Investment Advisory Agreement with Invesco Advisers, Inc. (Invesco Advisers and the investment advisory agreement) and the Master IntergroupSub-Advisory Contract for Mutual Funds with Invesco Asset Management Deutschland GmbH, Invesco Asset Management Limited, Invesco Asset Management (Japan) Limited, Invesco Hong Kong Limited, Invesco Senior Secured Management, Inc. and Invesco Canada Ltd. and separatesub-advisory contracts with Invesco Capital Management LLC and Invesco Asset Management (India) Private Limited (collectively, the AffiliatedSub-Advisers and thesub-advisory contracts) for another year, effective July 1, 2019. After evaluating the factors discussed below, among others, the Board approved the renewal of the Fund’s investment advisory agreement and thesub-advisory contracts and determined that the compensation payable by the Fund to Invesco Advisers and by Invesco Advisers to the AffiliatedSub-Advisers is fair and reasonable.
The Board’s Evaluation Process
The Board’s Investments Committee has established threeSub-Committees, which meet throughout the year to review the performance of funds advised by Invesco Advisers (the Invesco Funds). As part of a regularly scheduled basis ofin-person Board meetings, theSub-Committees meet with portfolio managers for their assigned Invesco Funds and other members of management to review detailed information about investment performance and portfolio attributes of these funds. The Board took into account evaluations and reports that it received from the Investments Committee andSub-Committees, as well as the information provided to such committees and the Board throughout the year, in considering whether to approve each Invesco Fund’s investment advisory agreement andsub-advisory contracts.
As part of the contract renewal process, the Board reviews and considers information provided in response to detailed requests for information submitted to management by the independent Trustees with assistance from legal counsel to the independent Trustees. The Board receives comparative investment performance and fee data regarding the Invesco Funds prepared by Invesco Advisers and Broadridge Financial Solutions, Inc. (Broadridge), an independent mutual fund data provider. The Board also receives an independent written evaluation from the Senior Officer, an officer of the Invesco Funds who reports directly to the
independent Trustees. The Senior Officer’s evaluation is prepared as part of his responsibility to manage the process by which the Invesco Funds’ proposed management fees are negotiated during the annual contract renewal process to ensure they are negotiated in a manner that is at arms’ length and reasonable. In addition to meetings with Invesco Advisers and fund counsel throughout the year, the independent Trustees also discuss the continuance of the investment advisory agreement andsub-advisory contracts in separate sessions with the Senior Officer and with independent legal counsel.
The discussion below is a summary of the Senior Officer’s independent written evaluation with respect to the Fund’s investment advisory agreement, as well as a discussion of the material factors and related conclusions that formed the basis for the Board’s approval of the Fund’s investment advisory agreement andsub-advisory contracts. The Trustees’ review and conclusions are based on the comprehensive consideration of all information presented to them during the course of the year and in prior years and are not the result of any single determinative factor. Moreover, one Trustee may have weighed a particular piece of information or factor differently than another Trustee. This information is current as of June 10, 2019.
Factors and Conclusions and Summary of Independent Written Fee Evaluation
| A. | Nature, Extent and Quality of Services Provided by Invesco Advisers and the AffiliatedSub-Advisers |
The Board reviewed the nature, extent and quality of the advisory services provided to the Fund by Invesco Advisers under the Fund’s investment advisory agreement, and the credentials and experience of the officers and employees of Invesco Advisers who provide these services, including the Fund’s portfolio manager(s). The Board’s review included consideration of Invesco Advisers’ investment process oversight and structure, credit analysis and investment risk management. The Board also considerednon-advisory services that Invesco Advisers and its affiliates provide to the Invesco Funds such as various back office support functions, third party oversight, internal audit, valuation, portfolio trading and legal and compliance. The Board also received and reviewed information about Invesco Advisers’ role as administrator of the Invesco Funds’ liquidity risk management program. The Board also reviewed and considered the benefits to shareholders of investing in a fund that is part of the Invesco family of funds under the umbrella of Invesco Ltd., Invesco Advisers’ parent company, and noted Invesco Ltd.’s depth and experience in conducting an investment management business, as well as its
commitment of financial and other resources to such business. The Board reviewed and considered information about the resources that Invesco Advisers intends to continue to commit to managing the Invesco family of funds following Invesco Ltd.’s acquisition of OppenheimerFunds, Inc. and its subsidiaries. The Board concluded that the nature, extent and quality of the services provided to the Fund by Invesco Advisers are appropriate and satisfactory.
The Board reviewed the services that may be provided by the AffiliatedSub-Advisers under thesub-advisory contracts and the credentials and experience of the officers and employees of the AffiliatedSub-Advisers who provide these services. The Board noted the AffiliatedSub-Advisers’ expertise with respect to certain asset classes and that the AffiliatedSub-Advisers have offices and personnel that are located in financial centers around the world. As a result, the Board noted that the AffiliatedSub-Advisers can provide research and investment analysis on the markets and economies of various countries in which the Fund may invest, make recommendations regarding securities and assist with security trades. The Board concluded that thesub-advisory contracts may benefit the Fund and its shareholders by permitting Invesco Advisers to use the resources and talents of the AffiliatedSub-Advisers in managing the Fund. The Board concluded that the nature, extent and quality of the services that may be provided by the AffiliatedSub-Advisers are appropriate and satisfactory.
| B. | Fund Investment Performance |
The Board considered Fund investment performance as a relevant factor in considering whether to approve the investment advisory agreement. The Board did not view Fund investment performance as a relevant factor in considering whether to approve thesub-advisory contracts for the Fund, as no AffiliatedSub-Adviser currently manages assets of the Fund.
The Board compared the Fund’s investment performance over multiple time periods ending December 31, 2018 to the performance of funds in the Broadridge performance universe and against the Lipper Variable Underlying Funds General U.S. Government Funds Index. The Board noted that performance of Series I shares of the Fund was in the third quintile of its performance universe for the one and five year periods and the second quintile for the three year period (the first quintile being the best performing funds and the fifth quintile being the worst performing funds). The Board noted that performance of Series I shares of the Fund was below the performance of the Index for the one year period, above the performance of the Index for the three year period and reasonably comparable to the performance of the Index for
Invesco V.I. Government Securities Fund
the five year period. The Trustees also reviewed more recent Fund performance and this review did not change their conclusions.
| C. | Advisory andSub-Advisory Fees and Fund Expenses |
The Board compared the Fund’s contractual management fee rate to the contractual management fee rates of funds in the Fund’s Broadridge expense group. The Board noted that the contractual management fee rate for Series I shares of the Fund was reasonably comparable to the median contractual management fee rate of funds in its expense group. The Board noted that the term “contractual management fee” for funds in the expense group may include both advisory and certainnon-portfolio management administrative services fees, but that Broadridge does not provide information on a fund by fund basis as to what is included. The Board also reviewed the methodology used by Broadridge in providing expense group information, which includes using each fund’s contractual management fee schedule (including any applicable breakpoints) as reported in the most recent prospectus or statement of additional information for each fund in the expense group. The Board also considered comparative information regarding the Fund’s total expense ratio and its various components.
The Board noted that Invesco Advisers has contractually agreed to waive fees and/or limit expenses of the Fund for the term disclosed in the Fund’s registration statement in an amount necessary to limit total annual operating expenses to a specified percentage of average daily net assets for each class of the Fund.
The Board noted that Invesco Advisers and the AffiliatedSub-Advisers do not manage other similarly managed mutual funds or client accounts.
The Board also considered the services that may be provided by the AffiliatedSub-Advisers pursuant to thesub-advisory contracts, as well as the fees payable by Invesco Advisers to the AffiliatedSub-Advisers pursuant to thesub-advisory contracts.
| D. | Economies of Scale and Breakpoints |
The Board considered the extent to which there may be economies of scale in the provision of advisory services to the Fund. The Board considered Invesco’s reinvestment in its business, including investments in business infrastructure and cybersecurity. The Board also considered that the Fund benefits from economies of scale through contractual breakpoints in the Fund’s advisory fee schedule, which generally operate to reduce the Fund’s expense ratio as it grows in size. The Board noted that the Fund shares directly in economies of scale through lower fees charged by third party service providers based on the combined size of the Invesco Funds. The Board noted that the Fund may also benefit from economies of scale through initial fee setting, fee waivers and expense reimbursements.
| E. | Profitability and Financial Resources |
The Board reviewed information from Invesco Advisers concerning the costs of the advisory and other services that Invesco Advisers and its affiliates provide to the Fund and the Invesco Funds and the profitability of Invesco Advisers and its affiliates in providing these services. The Board considered the methodology used for calculating profitability and noted the periodic review of such methodology by an independent consultant. The Board noted that Invesco Advisers continues to operate at a net profit from services Invesco Advisers and its affiliates provide to the Invesco Funds and the Fund. The Board did not deem the level of profits realized by Invesco Advisers and its affiliates from providing services to the Fund to be excessive given the nature, extent and quality of the services provided. The Board received information from Invesco Advisers demonstrating that Invesco Advisers and the AffiliatedSub-Advisers are financially sound and have the resources necessary to perform their obligations under the investment advisory agreement andsub-advisory contracts.
| F. | Collateral Benefits to Invesco Advisers and its Affiliates |
The Board considered various other benefits received by Invesco Advisers and its affiliates from the relationship with the Fund, including the fees received for providing administrative, transfer agency and distribution services to the Fund. The Board considered comparative information regarding fees charged for these services, including information provided by Broadridge and other independent sources. The Board considered the performance of Invesco Advisers and its affiliates in providing these services and the organizational structure employed to provide these services. The Board also considered that these services are provided to the Fund pursuant to written contracts that are reviewed and approved on an annual basis by the Board; and that the services are required for the operation of the Fund.
The Board considered the benefits realized by Invesco Advisers and the AffiliatedSub-Advisers as a result of portfolio brokerage transactions executed through “soft dollar” arrangements. Invesco Advisers noted that the Fund does not execute brokerage transactions through “soft dollar” arrangements to any significant degree.
The Board considered that the Fund’s uninvested cash and cash collateral from any securities lending arrangements may be invested in money market funds advised by Invesco Advisers pursuant to procedures approved by the Board. The Board considered information regarding the returns of the affiliated money market funds relative to comparable overnight investments, as well as the costs to the Fund of such investments. The Board noted that Invesco Advisers receives advisory fees from these affiliated money market funds attributable to such investments, although Invesco Advisers has contractually agreed to waive through varying periods the advisory fees payable by the Invesco Funds with
respect to certain investments in the affiliated money market funds. The waiver is in an amount equal to 100% of the net advisory fee Invesco Advisers receives from the affiliated money market funds with respect to the Fund’s investment in the affiliated money market funds of uninvested cash, but not cash collateral. The Board concluded that the amount of advisory fees received by Invesco Advisers from the Fund’s investment of cash collateral from any securities lending arrangements in the affiliated money market funds is fair and reasonable.
Invesco V.I. Government Securities Fund
| Semiannual Report to Shareholders | June 30, 2019 |
Invesco V.I. Growth and Income Fund
Beginning on January 1, 2021, as permitted by regulations adopted by the Securities and Exchange Commission, the insurance company that offers your variable annuity or variable life insurance contract may no longer send you paper copies of the Fund’s shareholder reports by mail, unless you specifically request paper copies of the reports from the insurance company or your financial intermediary. Instead of delivering paper copies of the report, the insurance company may choose to make the reports available on a website, and will notify you by mail each time a report is posted and provide you with a website link to access the report. Instructions for requesting paper copies will be provided by your insurance company.
If the insurance company offers electronic delivery, you may elect to receive shareholder reports and other communications about the Fund electronically by following the instructions provided by the insurance company or by contacting your financial intermediary. If you already elected to receive shareholder reports electronically, you will not be affected by this change and you need not take any action.
You may elect to receive all future reports in paper free of charge from the insurance company. You can inform the insurance company or your financial intermediary that you wish to continue receiving paper copies of your shareholder reports by following the instructions provided by the insurance company or by contacting your financial intermediary. Your election to receive reports in paper will apply to all portfolio companies available under your contract with the insurance company.
The Fund provides a complete list of its holdings four times in each fiscal year, at the quarter-ends. For the second and fourth quarters, the lists appear in the Fund’s semiannual and annual reports to shareholders. For the first and third quarters, the Fund files the lists with the Securities and Exchange Commission (SEC) on Form N-Q (or any successor Form). The Fund’s Form N-Q (or any successor Form) filings are available on the SEC website, sec.gov. The SEC file numbers for the Fund are 811-07452 and 033-57340. The Fund’s most recent portfolio holdings, as filed on Form N-Q (or any successor Form), have also been made available to insurance companies issuing variable annuity contracts and variable life insurance policies (“variable products”) that invest in the Fund.
A description of the policies and procedures that the Fund uses to determine how to vote proxies relating to portfolio securities is available without charge, upon request, from our Client Services department at 800 959 4246 or at invesco.com/proxyguidelines. The information is also available on the SEC website, sec.gov.
Information regarding how the Fund voted proxies related to its portfolio securities during the most recent 12-month period ended June 30 is available at invesco.com/proxysearch. The information is also available on the SEC website, sec.gov.
Invesco Advisers, Inc. is an investment adviser; it provides investment advisory services to individual and institutional clients and does not sell securities. Invesco Distributors, Inc. is the US distributor for Invesco Ltd.’s retail mutual funds, exchange-traded funds and institutional money market funds. Both are wholly owned, indirect subsidiaries of Invesco Ltd.
This report must be accompanied or preceded by a currently effective Fund prospectus and variable product prospectus, which contain more complete information, including sales charges and expenses. Investors should read each carefully before investing.
NOT FDIC INSURED | MAY LOSE VALUE | NO BANK GUARANTEE
| Invesco Distributors, Inc. | VK-VIGRI-SAR-1 |
Performance summary
Fund vs. Indexes
Cumulative total returns, December 31, 2018 to June 30, 2019, excluding variable product issuer charges. If variable product issuer charges were included, returns would be lower.
| Series I Shares | 16.10% |
| Series II Shares | 15.96 |
| S&P 500 Index▼ (Broad Market Index) | 18.54 |
Russell 1000 Value Index■
(Style-Specific Index) | 16.24 |
Lipper VUF Large-Cap Value Funds Index♦
(Peer Group Index) | 15.89 |
| Source(s):▼FactSet Research Systems Inc.;■ RIMES Technologies Corp.;♦ Lipper Inc. |
The S&P 500®Index is an unmanaged index considered representative of the US stock market.
TheRussell 1000® Value Index is an unmanaged index considered representative of large-cap value stocks. The Russell 1000 Value Index is a trademark/service mark of the Frank Russell Co. Russell® is a trademark of the Frank Russell Co.
TheLipper VUF Large-Cap Value Funds Index is an unmanaged index considered representative of large-cap value variable insurance underlying funds tracked by Lipper.
The Fund is not managed to track the performance of any particular index, including the indexes described here, and consequently, the performance of the Fund may deviate significantly from the performance of the indexes.
A direct investment cannot be made in an index. Unless otherwise indicated, index results include reinvested dividends, and they do not reflect sales charges. Performance of the peer group, if applicable, reflects fund expenses; performance of a market index does not.
| Average Annual Total Returns |
| As of 6/30/19 | |
| Series I Shares | |
| Inception (12/23/96) | 8.67% |
| 10 Years | 12.09 |
| 5 Years | 6.63 |
| 1 Year | 2.01 |
| Series II Shares | |
| Inception (9/18/00) | 6.52% |
| 10 Years | 11.81 |
| 5 Years | 6.36 |
| 1 Year | 1.77 |
Effective June 1, 2010, Class I and Class II shares of the predecessor fund, Van Kampen Life Investment Trust Growth and Income Portfolio, advised by Van Kampen Asset Management were reorganized into Series I and Series II shares, respectively, of Invesco Van Kampen V.I. Growth and Income Fund (renamed Invesco V.I. Growth and Income Fund on April 29, 2013). Returns shown above, prior to June 1, 2010, for Series I and Series II shares are blended returns of the predecessor fund and Invesco V.I. Growth and Income Fund. Share class returns will differ from the predecessor fund because of different expenses.
The performance data quoted represent past performance and cannot guarantee comparable future results; current performance may be lower or higher. Please contact your variable product issuer or financial adviser for the most recent month-end variable product performance. Performance figures reflect Fund expenses, rein-
vested distributions and changes in net asset value. Performance figures do not reflect deduction of taxes a shareholder would pay on Fund distributions or sale of Fund shares. Investment return and principal value will fluctuate so that you may have a gain or loss when you sell shares.
The total annual Fund operating expense ratio set forth in the most recent Fund prospectus as of the date of this report for Series I and Series II shares was 0.75% and 1.00%, respectively. The expense ratios presented above may vary from the expense ratios presented in other sections of this report that are based on expenses incurred during the period covered by this report.
Invesco V.I. Growth and Income Fund, a series portfolio of AIM Variable Insurance Funds (Invesco Variable Insurance Funds), is currently offered through insurance companies issuing variable products. You cannot pur-
chase shares of the Fund directly. Performance figures given represent the Fund and are not intended to reflect actual variable product values. They do not reflect sales charges, expenses and fees assessed in connection with a variable product. Sales charges, expenses and fees, which are determined by the variable product issuers, will vary and will lower the total return.
The most recent month-end performance at the Fund level, excluding variable product charges, is available at 800 451 4246. As mentioned above, for the most recent month-end performance including variable product charges, please contact your variable product issuer or financial adviser.
Fund performance reflects any applicable fee waivers and/or expense reimbursements. Had the adviser not waived fees and/or reimbursed expenses currently or in the past, returns would have been lower. See current prospectus for more information.
Invesco V.I. Growth and Income Fund
Schedule of Investments(a)
June 30, 2019
(Unaudited)
| | Shares | Value |
| Common Stocks & Other Equity Interests–94.42% |
| Aerospace & Defense–2.17% |
| General Dynamics Corp. | 185,993 | $33,817,247 |
| Apparel, Accessories & Luxury Goods–1.41% |
| Capri Holdings Ltd.(b) | 633,173 | 21,958,440 |
| Asset Management & Custody Banks–0.39% |
| State Street Corp. | 109,578 | 6,142,943 |
| Automobile Manufacturers–2.66% |
| General Motors Co. | 1,076,842 | 41,490,722 |
| Biotechnology–0.86% |
| Celgene Corp.(b) | 145,059 | 13,409,254 |
| Broadcasting–0.81% |
| CBS Corp., Class B | 253,104 | 12,629,890 |
| Building Products–1.72% |
| Johnson Controls International PLC | 650,285 | 26,863,273 |
| Cable & Satellite–3.10% |
| Charter Communications, Inc., Class A(b) | 81,355 | 32,149,869 |
| Comcast Corp., Class A | 381,883 | 16,146,013 |
| | | | 48,295,882 |
| Commodity Chemicals–0.69% |
| Dow, Inc. | 218,733 | 10,785,724 |
| Communications Equipment–1.70% |
| Cisco Systems, Inc. | 483,206 | 26,445,864 |
| Diversified Banks–13.65% |
| Bank of America Corp. | 2,233,152 | 64,761,408 |
| Citigroup, Inc. | 1,112,397 | 77,901,162 |
| JPMorgan Chase & Co. | 420,464 | 47,007,875 |
| Wells Fargo & Co. | 488,092 | 23,096,514 |
| | | | 212,766,959 |
| Electric Utilities–1.17% |
| Duke Energy Corp. | 117,096 | 10,332,551 |
| FirstEnergy Corp. | 182,999 | 7,834,187 |
| | | | 18,166,738 |
| Fertilizers & Agricultural Chemicals–1.61% |
| Corteva, Inc.(b) | 474,838 | 14,040,960 |
| Nutrien Ltd. (Canada) | 206,034 | 11,014,577 |
| | | | 25,055,537 |
| Food Distributors–1.40% |
| US Foods Holding Corp.(b) | 609,156 | 21,783,419 |
| | Shares | Value |
| Health Care Distributors–1.37% |
| McKesson Corp. | 159,124 | $21,384,674 |
| Health Care Equipment–2.42% |
| Medtronic PLC | 164,464 | 16,017,149 |
| Zimmer Biomet Holdings, Inc. | 184,542 | 21,727,975 |
| | | | 37,745,124 |
| Health Care Services–1.38% |
| CVS Health Corp. | 395,351 | 21,542,676 |
| Health Care Supplies–0.80% |
| Alcon, Inc. (Switzerland)(b) | 202,782 | 12,541,713 |
| Home Improvement Retail–0.83% |
| Kingfisher PLC (United Kingdom) | 4,725,760 | 12,910,128 |
| Hotels, Resorts & Cruise Lines–1.96% |
| Carnival Corp. | 656,945 | 30,580,790 |
| Industrial Machinery–1.31% |
| Ingersoll-Rand PLC | 161,033 | 20,398,050 |
| Insurance Brokers–2.02% |
| Willis Towers Watson PLC | 164,487 | 31,505,840 |
| Integrated Oil & Gas–5.92% |
| BP PLC (United Kingdom) | 3,547,540 | 24,791,702 |
| Chevron Corp. | 176,330 | 21,942,505 |
| Occidental Petroleum Corp. | 188,100 | 9,457,668 |
| Royal Dutch Shell PLC, Class A (United Kingdom) | 1,102,952 | 36,115,886 |
| | | | 92,307,761 |
| Internet & Direct Marketing Retail–1.33% |
| eBay, Inc. | 526,208 | 20,785,216 |
| Investment Banking & Brokerage–3.78% |
| Goldman Sachs Group, Inc. (The) | 115,425 | 23,615,955 |
| Morgan Stanley | 807,254 | 35,365,798 |
| | | | 58,981,753 |
| IT Consulting & Other Services–1.09% |
| Cognizant Technology Solutions Corp., Class A | 268,940 | 17,048,107 |
| Managed Health Care–0.97% |
| Anthem, Inc. | 53,402 | 15,070,578 |
| Multi-line Insurance–3.40% |
| American International Group, Inc. | 993,920 | 52,956,058 |
| Oil & Gas Equipment & Services–2.00% |
| Schlumberger Ltd. | 253,128 | 10,059,306 |
| TechnipFMC PLC (United Kingdom) | 813,271 | 21,096,250 |
| | | | 31,155,556 |
See accompanying Notes to Financial Statements which are an integral part of the financial statements.
Invesco V.I. Growth and Income Fund
| | Shares | Value |
| Oil & Gas Exploration & Production–4.17% |
| Canadian Natural Resources Ltd. (Canada) | 571,115 | $15,399,237 |
| Devon Energy Corp. | 869,493 | 24,797,940 |
| Marathon Oil Corp. | 1,745,695 | 24,806,326 |
| | | | 65,003,503 |
| Other Diversified Financial Services–1.74% |
| AXA Equitable Holdings, Inc. | 491,740 | 10,277,366 |
| Voya Financial, Inc. | 303,442 | 16,780,343 |
| | | | 27,057,709 |
| Packaged Foods & Meats–2.29% |
| Mondelez International, Inc., Class A | 663,854 | 35,781,731 |
| Pharmaceuticals–7.21% |
| Bristol-Myers Squibb Co. | 375,957 | 17,049,650 |
| Johnson & Johnson | 357,064 | 49,731,874 |
| Novartis AG (Switzerland) | 321,576 | 29,413,594 |
| Sanofi (France) | 187,024 | 16,179,240 |
| | | | 112,374,358 |
| Railroads–1.27% |
| CSX Corp. | 255,548 | 19,771,749 |
| Regional Banks–3.27% |
| Citizens Financial Group, Inc. | 952,753 | 33,689,346 |
| PNC Financial Services Group, Inc. (The) | 126,465 | 17,361,115 |
| | | | 51,050,461 |
| Semiconductors–3.51% |
| Intel Corp. | 721,238 | 34,525,663 |
| | Shares | Value |
| Semiconductors–(continued) |
| QUALCOMM, Inc. | 265,069 | $20,163,799 |
| | | | 54,689,462 |
| Specialty Chemicals–0.88% |
| DuPont de Nemours, Inc. | 182,467 | 13,697,798 |
| Systems Software–2.38% |
| Oracle Corp. | 649,984 | 37,029,588 |
| Technology Hardware, Storage & Peripherals–1.26% |
| Apple, Inc. | 99,454 | 19,683,936 |
| Tobacco–2.52% |
| Philip Morris International, Inc. | 499,424 | 39,219,767 |
| Total Common Stocks & Other Equity Interests (Cost $1,261,121,934) | 1,471,885,978 |
| Money Market Funds–6.27% |
| Invesco Government & Agency Portfolio, Institutional Class, 2.26%(c) | 34,202,045 | 34,202,045 |
| Invesco Liquid Assets Portfolio, Institutional Class, 2.40%(c) | 24,425,026 | 24,434,796 |
| Invesco Treasury Portfolio, Institutional Class, 2.22%(c) | 39,088,052 | 39,088,052 |
| Total Money Market Funds (Cost $97,721,889) | 97,724,893 |
| TOTAL INVESTMENTS IN SECURITIES–100.69% (Cost $1,358,843,823) | 1,569,610,871 |
| OTHER ASSETS LESS LIABILITIES–(0.69)% | (10,718,318) |
| NET ASSETS–100.00% | $1,558,892,553 |
Notes to Schedule of Investments:
| (a) | Industry and/or sector classifications used in this report are generally according to the Global Industry Classification Standard, which was developed by and is the exclusive property and a service mark of MSCI Inc. and Standard & Poor’s. |
| (b) | Non-income producing security. |
| (c) | The money market fund and the Fund are affiliated by having the same investment adviser. The rate shown is the 7-day SEC standardized yield as of June 30, 2019. |
| Open Forward Foreign Currency Contracts |
Settlement
Date | Counterparty | Contract to | Unrealized
Appreciation
(Depreciation) |
| Deliver | Receive |
| Currency Risk | | | | | | |
| 07/05/2019 | State Street Bank & Trust Co. | CHF | 439,086 | USD | 450,022 | $101 |
| 07/05/2019 | State Street Bank & Trust Co. | GBP | 3,270,027 | USD | 4,157,078 | 3,664 |
| 07/05/2019 | State Street Bank & Trust Co. | USD | 1,331,971 | CAD | 1,777,331 | 25,337 |
| 07/05/2019 | State Street Bank & Trust Co. | USD | 834,643 | EUR | 736,698 | 3,272 |
| 07/05/2019 | State Street Bank & Trust Co. | USD | 7,461,479 | CHF | 7,341,327 | 61,011 |
| 07/05/2019 | State Street Bank & Trust Co. | USD | 1,003,285 | GBP | 798,129 | 10,456 |
| Subtotal—Appreciation | 103,841 |
| Currency Risk | | | | | | |
| 07/05/2019 | Bank of New York Mellon (The) | CHF | 13,288,412 | USD | 13,347,836 | (268,496) |
| 07/05/2019 | Bank of New York Mellon (The) | EUR | 10,271,878 | USD | 11,534,703 | (148,444) |
| 07/05/2019 | Bank of New York Mellon (The) | GBP | 21,444,805 | USD | 27,162,355 | (75,688) |
| 07/05/2019 | State Street Bank & Trust Co. | CAD | 17,038,380 | USD | 12,666,429 | (345,416) |
| 07/05/2019 | State Street Bank & Trust Co. | CHF | 24,061,618 | USD | 24,246,674 | (408,716) |
See accompanying Notes to Financial Statements which are an integral part of the financial statements.
Invesco V.I. Growth and Income Fund
| Open Forward Foreign Currency Contracts—(continued) |
Settlement
Date | Counterparty | Contract to | Unrealized
Appreciation
(Depreciation) |
| Deliver | Receive |
| 07/05/2019 | State Street Bank & Trust Co. | EUR | 1,143,295 | USD | 1,294,199 | $(6,176) |
| 07/05/2019 | State Street Bank & Trust Co. | GBP | 22,950,357 | USD | 29,073,232 | (77,081) |
| 07/05/2019 | State Street Bank & Trust Co. | USD | 4,093,949 | GBP | 3,212,689 | (13,363) |
| Subtotal—Depreciation | (1,343,380) |
| Total Forward Foreign Currency Contracts | $(1,239,539) |
| Abbreviations: |
| CAD | – Canadian Dollar |
| CHF | – Swiss Franc |
| EUR | – Euro |
| GBP | – British Pound Sterling |
| USD | – U.S. Dollar |
Portfolio Composition
By sector, based on Net Assets
as of June 30, 2019
| Financials | 28.25% |
| Health Care | 15.01 |
| Energy | 12.09 |
| Information Technology | 9.94 |
| Consumer Discretionary | 8.19 |
| Industrials | 6.47 |
| Consumer Staples | 6.21 |
| Communication Services | 3.91 |
| Materials | 3.18 |
| Utilities | 1.17 |
| Money Market Funds Plus Other Assets Less Liabilities | 5.58 |
See accompanying Notes to Financial Statements which are an integral part of the financial statements.
Invesco V.I. Growth and Income Fund
Statement of Assets and Liabilities
June 30, 2019
(Unaudited)
| Assets: | |
Investments in securities, at value
(Cost $1,261,121,934) | $1,471,885,978 |
| Investments in affiliated money market funds, at value (Cost $97,721,889) | 97,724,893 |
| Other investments: | |
| Unrealized appreciation on forward foreign currency contracts outstanding | 103,841 |
| Cash | 83,312 |
| Foreign currencies, at value (Cost $879,043) | 879,585 |
| Receivable for: | |
| Investments sold | 1,303,000 |
| Dividends | 2,757,776 |
| Fund shares sold | 10,165,161 |
| Investment for trustee deferred compensation and retirement plans | 214,025 |
| Total assets | 1,585,117,571 |
| Liabilities: | |
| Other investments: | |
| Unrealized depreciation on forward foreign currency contracts outstanding | 1,343,380 |
| Payable for: | |
| Investments purchased | 21,838,536 |
| Fund shares reacquired | 1,282,354 |
| Accrued fees to affiliates | 1,471,702 |
| Accrued trustees’ and officers’ fees and benefits | 840 |
| Accrued other operating expenses | 50,866 |
| Trustee deferred compensation and retirement plans | 237,340 |
| Total liabilities | 26,225,018 |
| Net assets applicable to shares outstanding | $1,558,892,553 |
| Net assets consist of: | |
| Shares of beneficial interest | $1,160,441,371 |
| Distributable earnings | 398,451,182 |
| | $1,558,892,553 |
| Net Assets: |
| Series I | $185,185,245 |
| Series II | $1,373,707,308 |
| Shares outstanding, no par value, with an unlimited number of shares authorized: |
| Series I | 9,106,934 |
| Series II | 67,764,366 |
| Series I: | |
| Net asset value per share | $20.33 |
| Series II: | |
| Net asset value per share | $20.27 |
Statement of Operations
For the six months ended June 30, 2019
(Unaudited)
| Investment income: | |
| Dividends (net of foreign withholding taxes of $444,553) | $18,997,648 |
| Dividends from affiliated money market funds | 901,563 |
| Total investment income | 19,899,211 |
| Expenses: | |
| Advisory fees | 4,143,492 |
| Administrative services fees | 1,198,551 |
| Custodian fees | 27,808 |
| Distribution fees - Series II | 1,599,015 |
| Transfer agent fees | 17,133 |
| Trustees’ and officers’ fees and benefits | 22,253 |
| Reports to shareholders | 4,936 |
| Professional services fees | 54,304 |
| Other | 14,127 |
| Total expenses | 7,081,619 |
| Less: Fees waived | (38,638) |
| Net expenses | 7,042,981 |
| Net investment income | 12,856,230 |
| Realized and unrealized gain (loss) from: | |
| Net realized gain (loss) from: | |
| Investment securities | (12,720,824) |
| Foreign currencies | 350,512 |
| Forward foreign currency contracts | 1,660,473 |
| | (10,709,839) |
| Change in net unrealized appreciation (depreciation) of: | |
| Investment securities | 189,053,678 |
| Foreign currencies | 8,395 |
| Forward foreign currency contracts | (1,087,623) |
| | 187,974,450 |
| Net realized and unrealized gain | 177,264,611 |
| Net increase in net assets resulting from operations | $190,120,841 |
See accompanying Notes to Financial Statements which are an integral part of the financial statements.
Invesco V.I. Growth and Income Fund
Statement of Changes in Net Assets
For the six months ended June 30, 2019 and the year ended December 31, 2018
(Unaudited)
| | June 30,
2019 | December 31,
2018 |
| Operations: | | |
| Net investment income | $12,856,230 | $25,317,518 |
| Net realized gain (loss) | (10,709,839) | 167,616,765 |
| Change in net unrealized appreciation (depreciation) | 187,974,450 | (397,739,484) |
| Net increase (decrease) in net assets resulting from operations | 190,120,841 | (204,805,201) |
| Distributions to shareholders from distributable earnings: | | |
| Series I | — | (20,657,576) |
| Series II | — | (184,183,100) |
| Total distributions from distributable earnings | — | (204,840,676) |
| Share transactions–net: | | |
| Series I | (7,758,089) | 25,029,084 |
| Series II | 124,963,947 | (374,156,431) |
| Net increase (decrease) in net assets resulting from share transactions | 117,205,858 | (349,127,347) |
| Net increase (decrease) in net assets | 307,326,699 | (758,773,224) |
| Net assets: | | |
| Beginning of period | 1,251,565,854 | 2,010,339,078 |
| End of period | $1,558,892,553 | $1,251,565,854 |
See accompanying Notes to Financial Statements which are an integral part of the financial statements.
Invesco V.I. Growth and Income Fund
Financial Highlights
June 30, 2019
(Unaudited)
The following schedule presents financial highlights for a share of the Fund outstanding throughout the periods indicated.
| | Net asset
value,
beginning
of period | Net
investment
income(a) | Net gains
(losses)
on securities
(both
realized and
unrealized) | Total from
investment
operations | Dividends
from net
investment
income | Distributions
from net
realized
gains | Total
distributions | Net asset
value, end
of period | Total
return(b) | Net assets,
end of period
(000’s omitted) | Ratio of
expenses
to average
net assets
with fee waivers
and/or expenses
absorbed | Ratio of
expenses
to average net
assets without
fee waivers
and/or expenses
absorbed | Ratio of net
investment
income
to average
net assets | Portfolio
turnover(c) |
| Series I |
| Six months ended 06/30/19 | $17.51 | $0.19 | $2.63 | $2.82 | $— | $— | $— | $20.33 | 16.10% | $185,185 | 0.74%(d) | 0.75%(d) | 1.98%(d) | 32% |
| Year ended 12/31/18 | 22.70 | 0.36 | (2.95) | (2.59) | (0.47) | (2.13) | (2.60) | 17.51 | (13.38) | 166,306 | 0.75 | 0.75 | 1.63 | 32 |
| Year ended 12/31/17 | 21.05 | 0.41(e) | 2.52 | 2.93 | (0.34) | (0.94) | (1.28) | 22.70 | 14.32 | 187,254 | 0.76 | 0.76 | 1.90(e) | 17 |
| Year ended 12/31/16 | 19.60 | 0.33 | 3.29 | 3.62 | (0.23) | (1.94) | (2.17) | 21.05 | 19.69 | 168,082 | 0.77 | 0.79 | 1.69 | 28 |
| Year ended 12/31/15 | 25.15 | 0.33 | (1.30) | (0.97) | (0.74) | (3.84) | (4.58) | 19.60 | (3.06) | 149,066 | 0.78 | 0.84 | 1.41 | 22 |
| Year ended 12/31/14 | 26.29 | 0.59(f) | 2.02 | 2.61 | (0.50) | (3.25) | (3.75) | 25.15 | 10.28 | 161,866 | 0.78 | 0.83 | 2.22(f) | 31 |
| Series II |
| Six months ended 06/30/19 | 17.48 | 0.17 | 2.62 | 2.79 | — | — | — | 20.27 | 15.96 | 1,373,707 | 0.99(d) | 1.00(d) | 1.73(d) | 32 |
| Year ended 12/31/18 | 22.66 | 0.30 | (2.95) | (2.65) | (0.40) | (2.13) | (2.53) | 17.48 | (13.59) | 1,085,260 | 1.00 | 1.00 | 1.38 | 32 |
| Year ended 12/31/17 | 21.02 | 0.36(e) | 2.51 | 2.87 | (0.29) | (0.94) | (1.23) | 22.66 | 14.04 | 1,823,085 | 1.01 | 1.01 | 1.65(e) | 17 |
| Year ended 12/31/16 | 19.58 | 0.28 | 3.28 | 3.56 | (0.18) | (1.94) | (2.12) | 21.02 | 19.37 | 1,838,074 | 1.02 | 1.04 | 1.44 | 28 |
| Year ended 12/31/15 | 25.09 | 0.27 | (1.29) | (1.02) | (0.65) | (3.84) | (4.49) | 19.58 | (3.26) | 1,435,111 | 1.03 | 1.09 | 1.16 | 22 |
| Year ended 12/31/14 | 26.23 | 0.52(f) | 2.01 | 2.53 | (0.42) | (3.25) | (3.67) | 25.09 | 9.96 | 1,828,854 | 1.03 | 1.08 | 1.97(f) | 31 |
| (a) | Calculated using average shares outstanding. |
| (b) | Includes adjustments in accordance with accounting principles generally accepted in the United States of America and as such, the net asset value for financial reporting purposes and the returns based upon those net asset values may differ from the net asset value and returns for shareholder transactions. Total returns are not annualized for periods less than one year, if applicable, and do not reflect charges assessed in connection with a variable product, which if included would reduce total returns. |
| (c) | Portfolio turnover is calculated at the fund level and is not annualized for periods less than one year, if applicable. |
| (d) | Ratios are annualized and based on average daily net assets (000’s omitted) of $183,943 and $1,289,814 for Series I and Series II shares, respectively. |
| (e) | Net investment income per share and the ratio of net investment income to average net assets include significant dividends received during the period. Net investment income per share and the ratio of net investment income to average net assets excluding the significant dividends are $0.30 and 1.42%, and $0.25 and 1.17%, for Series I and Series II, respectively. |
| (f) | Net investment income per share and the ratio of net investment income to average net assets include significant dividends received during the period. Net investment income per share and the ratio of net investment income to average net assets excluding the significant dividends are $0.35 and 1.29%, and $0.28 and 1.04%, for Series I and Series II, respectively. |
See accompanying Notes to Financial Statements which are an integral part of the financial statements.
Invesco V.I. Growth and Income Fund
Notes to Financial Statements
June 30, 2019
(Unaudited)
NOTE 1—Significant Accounting Policies
Invesco V.I. Growth And Income Fund (the “Fund”) is a series portfolio of AIM Variable Insurance Funds (Invesco Variable Insurance Funds) (the “Trust”). The Trust is a Delaware statutory trust registered under the Investment Company Act of 1940, as amended (the “1940 Act”), as an open-end series management investment company. Information presented in these financial statements pertains only to the Fund. Matters affecting the Fund or each class will be voted on exclusively by the shareholders of the Fund or each class. Current Securities and Exchange Commission (“SEC”) guidance, however, requires participating insurance companies offering separate accounts to vote shares proportionally in accordance with the instructions of the contract owners whose investments are funded by shares of each Fund or class.
The Fund’s investment objective is to seek long-term growth of capital and income.
The Fund currently offers two classes of shares, Series I and Series II, both of which are offered to insurance company separate accounts funding variable annuity contracts and variable life insurance policies (“variable products”).
The Fund is an investment company and accordingly follows the investment company accounting and reporting guidance in accordance with Financial Accounting Standards Board Accounting Standards Codification Topic 946,Financial Services – Investment Companies.
The following is a summary of the significant accounting policies followed by the Fund in the preparation of its financial statements.
| A. | Security Valuations — Securities, including restricted securities, are valued according to the following policy. |
A security listed or traded on an exchange (except convertible securities) is valued at its last sales price or official closing price as of the close of the customary trading session on the exchange where the security is principally traded, or lacking any sales or official closing price on a particular day, the security may be valued at the closing bid price on that day. Securities traded in the over-the-counter market are valued based on prices furnished by independent pricing services or market makers. When such securities are valued by an independent pricing service they may be considered fair valued. Futures contracts are valued at the final settlement price set by an exchange on which they are principally traded. Listed options are valued at the mean between the last bid and asked prices from the exchange on which they are principally traded. Options not listed on an exchange are valued by an independent source at the mean between the last bid and asked prices. For purposes of determining net asset value (“NAV”) per share, futures and option contracts generally are valued 15 minutes after the close of the customary trading session of the New York Stock Exchange (“NYSE”).
Investments in open-end and closed-end registered investment companies that do not trade on an exchange are valued at the end-of-day net asset value per share. Investments in open-end and closed-end registered investment companies that trade on an exchange are valued at the last sales price or official closing price as of the close of the customary trading session on the exchange where the security is principally traded.
Debt obligations (including convertible securities) and unlisted equities are fair valued using an evaluated quote provided by an independent pricing service. Evaluated quotes provided by the pricing service may be determined without exclusive reliance on quoted prices, and may reflect appropriate factors such as institution-size trading in similar groups of securities, developments related to specific securities, dividend rate (for unlisted equities), yield (for debt obligations), quality, type of issue, coupon rate (for debt obligations), maturity (for debt obligations), individual trading characteristics and other market data. Pricing services generally value debt obligations assuming orderly transactions of institutional round lot size, but a fund may hold or transact in the same securities in smaller, odd lot sizes. Odd lots often trade at lower prices than institutional round lots. Debt obligations are subject to interest rate and credit risks. In addition, all debt obligations involve some risk of default with respect to interest and/or principal payments.
Foreign securities’ (including foreign exchange contracts) prices are converted into U.S. dollar amounts using the applicable exchange rates as of the close of the NYSE. If market quotations are available and reliable for foreign exchange-traded equity securities, the securities will be valued at the market quotations. Because trading hours for certain foreign securities end before the close of the NYSE, closing market quotations may become unreliable. If between the time trading ends on a particular security and the close of the customary trading session on the NYSE, events occur that the investment adviser determines are significant and make the closing price unreliable, the Fund may fair value the security. If the event is likely to have affected the closing price of the security, the security will be valued at fair value in good faith using procedures approved by the Board of Trustees. Adjustments to closing prices to reflect fair value may also be based on a screening process of an independent pricing service to indicate the degree of certainty, based on historical data, that the closing price in the principal market where a foreign security trades is not the current value as of the close of the NYSE. Foreign securities’ prices meeting the approved degree of certainty that the price is not reflective of current value will be priced at the indication of fair value from the independent pricing service. Multiple factors may be considered by the independent pricing service in determining adjustments to reflect fair value and may include information relating to sector indices, American Depositary Receipts and domestic and foreign index futures. Foreign securities may have additional risks including exchange rate changes, potential for sharply devalued currencies and high inflation, political and economic upheaval, the relative lack of issuer information, relatively low market liquidity and the potential lack of strict financial and accounting controls and standards.
Securities for which market prices are not provided by any of the above methods may be valued based upon quotes furnished by independent sources. The last bid price may be used to value equity securities. The mean between the last bid and asked prices is used to value debt obligations, including corporate loans.
Securities for which market quotations are not readily available or became unreliable are valued at fair value as determined in good faith by or under the supervision of the Trust’s officers following procedures approved by the Board of Trustees. Issuer specific events, market trends, bid/asked quotes of brokers and information providers and other market data may be reviewed in the course of making a good faith determination of a security’s fair value.
The Fund may invest in securities that are subject to interest rate risk, meaning the risk that the prices will generally fall as interest rates rise and, conversely, the prices will generally rise as interest rates fall. Specific securities differ in their sensitivity to changes in interest rates depending on their individual characteristics. Changes in interest rates may result in increased market volatility, which may affect the value and/or liquidity of certain Fund investments.
Invesco V.I. Growth and Income Fund
Valuations change in response to many factors including the historical and prospective earnings of the issuer, the value of the issuer’s assets, general economic conditions, interest rates, investor perceptions and market liquidity. Because of the inherent uncertainties of valuation, the values reflected in the financial statements may materially differ from the value received upon actual sale of those investments.
| B. | Securities Transactions and Investment Income — Securities transactions are accounted for on a trade date basis. Realized gains or losses on sales are computed on the basis of specific identification of the securities sold. Interest income (net of withholding tax, if any) is recorded on the accrual basis from settlement date. Dividend income (net of withholding tax, if any) is recorded on the ex-dividend date. |
The Fund may periodically participate in litigation related to Fund investments. As such, the Fund may receive proceeds from litigation settlements. Any proceeds received are included in the Statement of Operations as realized gain (loss) for investments no longer held and as unrealized gain (loss) for investments still held.
Brokerage commissions and mark ups are considered transaction costs and are recorded as an increase to the cost basis of securities purchased and/or a reduction of proceeds on a sale of securities. Such transaction costs are included in the determination of net realized and unrealized gain (loss) from investment securities reported in the Statement of Operations and the Statement of Changes in Net Assets and the net realized and unrealized gains (losses) on securities per share in the Financial Highlights. Transaction costs are included in the calculation of the Fund’s net asset value and, accordingly, they reduce the Fund’s total returns. These transaction costs are not considered operating expenses and are not reflected in net investment income reported in the Statement of Operations and the Statement of Changes in Net Assets, or the net investment income per share and the ratios of expenses and net investment income reported in the Financial Highlights, nor are they limited by any expense limitation arrangements between the Fund and the investment adviser.
The Fund allocates income and realized and unrealized capital gains and losses to a class based on the relative net assets of each class.
| C. | Country Determination — For the purposes of making investment selection decisions and presentation in the Schedule of Investments, the investment adviser may determine the country in which an issuer is located and/or credit risk exposure based on various factors. These factors include the laws of the country under which the issuer is organized, where the issuer maintains a principal office, the country in which the issuer derives 50% or more of its total revenues and the country that has the primary market for the issuer’s securities, as well as other criteria. Among the other criteria that may be evaluated for making this determination are the country in which the issuer maintains 50% or more of its assets, the type of security, financial guarantees and enhancements, the nature of the collateral and the sponsor organization. Country of issuer and/or credit risk exposure has been determined to be the United States of America, unless otherwise noted. |
| D. | Distributions– Distributions from net investment income and net realized capital gain, if any, are generally declared and paid to separate accounts of participating insurance companies annually and recorded on the ex-dividend date. |
| E. | Federal Income Taxes –The Fund intends to comply with the requirements of Subchapter M of the Internal Revenue Code of 1986, as amended (the “Internal Revenue Code”), necessary to qualify as a regulated investment company and to distribute substantially all of the Fund’s taxable earnings to shareholders. As such, the Fund will not be subject to federal income taxes on otherwise taxable income (including net realized capital gain) that is distributed to shareholders. Therefore, no provision for federal income taxes is recorded in the financial statements. |
The Fund recognizes the tax benefits of uncertain tax positions only when the position is more likely than not to be sustained. Management has analyzed the Fund’s uncertain tax positions and concluded that no liability for unrecognized tax benefits should be recorded related to uncertain tax positions. Management is not aware of any tax positions for which it is reasonably possible that the total amounts of unrecognized tax benefits will change materially in the next 12 months.
The Fund files tax returns in the U.S. Federal jurisdiction and certain other jurisdictions. Generally, the Fund is subject to examinations by such taxing authorities for up to three years after the filing of the return for the tax period.
| F. | Expenses– Fees provided for under the Rule 12b-1 plan of a particular class of the Fund and which are directly attributable to that class are charged to the operations of such class. All other expenses are allocated among the classes based on relative net assets. |
| G. | Accounting Estimates – The preparation of financial statements in conformity with accounting principles generally accepted in the United States of America (“GAAP”) requires management to make estimates and assumptions that affect the reported amounts of assets and liabilities at the date of the financial statements and the reported amounts of revenues and expenses during the reporting period including estimates and assumptions related to taxation. Actual results could differ from those estimates by a significant amount. In addition, the Fund monitors for material events or transactions that may occur or become known after the period-end date and before the date the financial statements are released to print. |
| H. | Indemnifications – Under the Trust’s organizational documents, each Trustee, officer, employee or other agent of the Trust is indemnified against certain liabilities that may arise out of the performance of their duties to the Fund. Additionally, in the normal course of business, the Fund enters into contracts, including the Fund’s servicing agreements, that contain a variety of indemnification clauses. The Fund’s maximum exposure under these arrangements is unknown as this would involve future claims that may be made against the Fund that have not yet occurred. The risk of material loss as a result of such indemnification claims is considered remote. |
| I. | Foreign Currency Translations— Foreign currency is valued at the close of the NYSE based on quotations posted by banks and major currency dealers. Portfolio securities and other assets and liabilities denominated in foreign currencies are translated into U.S. dollar amounts at the date of valuation. Purchases and sales of portfolio securities (net of foreign taxes withheld on disposition) and income items denominated in foreign currencies are translated into U.S. dollar amounts on the respective dates of such transactions. The Fund does not separately account for the portion of the results of operations resulting from changes in foreign exchange rates on investments and the fluctuations arising from changes in market prices of securities held. The combined results of changes in foreign exchange rates and the fluctuation of market prices on investments (net of estimated foreign tax withholding) are included with the net realized and unrealized gain or loss from investments in the Statement of Operations. Reported net realized foreign currency gains or losses arise from (1) sales of foreign currencies, (2) currency gains or losses realized between the trade and settlement dates on securities transactions, and (3) the difference between the amounts of dividends, interest, and foreign withholding taxes recorded on the Fund’s books and the U.S. dollar equivalent of the amounts actually received or paid. Net unrealized foreign currency gains and losses arise from changes in the fair values of assets and liabilities, other than investments in securities at fiscal period end, resulting from changes in exchange rates. |
The Fund may invest in foreign securities, which may be subject to foreign taxes on income, gains on investments or currency repatriation, a portion of which may be recoverable. Foreign taxes, if any, are recorded based on the tax regulations and rates that exist in the foreign markets in which the Fund invests and are shown in the Statement of Operations.
Invesco V.I. Growth and Income Fund
| J. | Forward Foreign Currency Contracts— The Fund may engage in foreign currency transactions either on a spot (i.e. for prompt delivery and settlement) basis, or through forward foreign currency contracts, to manage or minimize currency or exchange rate risk. |
The Fund may also enter into forward foreign currency contracts for the purchase or sale of a security denominated in a foreign currency in order to “lock in” the U.S. dollar price of that security, or the Fund may also enter into forward foreign currency contracts that do not provide for physical settlement of the two currencies, but instead are settled by a single cash payment calculated as the difference between the agreed upon exchange rate and the spot rate at settlement based upon an agreed upon notional amount (non-deliverable forwards). The Fund will set aside liquid assets in an amount equal to the daily mark-to-market obligation for forward foreign currency contracts.
A forward foreign currency contract is an obligation between two parties (“Counterparties”) to purchase or sell a specific currency for an agreed-upon price at a future date. The use of forward foreign currency contracts does not eliminate fluctuations in the price of the underlying securities the Fund owns or intends to acquire but establishes a rate of exchange in advance. Fluctuations in the value of these contracts are measured by the difference in the contract date and reporting date exchange rates and are recorded as unrealized appreciation (depreciation) until the contracts are closed. When the contracts are closed, realized gains (losses) are recorded. Realized and unrealized gains (losses) on the contracts are included in the Statement of Operations. The primary risks associated with forward foreign currency contracts include failure of the Counterparty to meet the terms of the contract and the value of the foreign currency changing unfavorably. These risks may be in excess of the amounts reflected in the Statement of Assets and Liabilities.
NOTE 2—Advisory Fees and Other Fees Paid to Affiliates
The Trust has entered into a master investment advisory agreement with Invesco Advisers, Inc. (the "Adviser" or "Invesco"). Under the terms of the investment advisory agreement, the Fund accrues daily and pays monthly an advisory fee to the Adviser based on the annual rate of the Fund’s average daily net assets as follows:
| Average Daily Net Assets | Rate |
| First $500 million | 0.60% |
| Over $500 million | 0.55% |
For the six months ended June 30, 2019, the effective advisory fees incurred by the Fund was 0.57%.
Under the terms of a master sub-advisory agreement between the Adviser and each of Invesco Asset Management Deutschland GmbH, Invesco Asset Management Limited, Invesco Asset Management (Japan) Limited, Invesco Hong Kong Limited, Invesco Senior Secured Management, Inc. and Invesco Canada Ltd. and separate sub-advisory agreements with Invesco Capital Management LLC and Invesco Asset Management (India) Private Limited (collectively, the "Affiliated Sub-Advisers") the Adviser, not the Fund, will pay 40% of the fees paid to the Adviser to any such Affiliated Sub-Adviser(s) that provide(s) discretionary investment management services to the Fund based on the percentage of assets allocated to such Affiliated Sub-Adviser(s).
The Adviser has contractually agreed, through at least April 30, 2020, to waive advisory fees and/or reimburse expenses of all shares to the extent necessary to limit total annual fund operating expenses after fee waiver and/or expense reimbursement (excluding certain items discussed below) of Series I shares to 0.78% and Series II shares to 1.03% of average daily net assets (the “expense limits”). In determining the Adviser’s obligation to waive advisory fees and/or reimburse expenses, the following expenses are not taken into account, and could cause the total annual fund operating expenses after fee waiver and/or expense reimbursement to exceed the numbers reflected above: (1) interest; (2) taxes; (3) dividend expense on short sales; (4) extraordinary or non-routine items, including litigation expenses; and (5) expenses that the Fund has incurred but did not actually pay because of an expense offset arrangement. Unless Invesco continues the fee waiver agreement, it will terminate on April 30, 2020. During its term, the fee waiver agreement cannot be terminated or amended to increase the expense limits or reduce the advisory fee waiver without approval of the Board of Trustees. The Adviser did not waive fees and/or reimburse expenses during the period under these expense limits.
Further, the Adviser has contractually agreed, through at least June 30, 2021, to waive the advisory fee payable by the Fund in an amount equal to 100% of the net advisory fees the Adviser receives from the affiliated money market funds on investments by the Fund of uninvested cash in such affiliated money market funds.
For the six months ended June 30, 2019, the Adviser waived advisory fees of $38,638.
The Trust has entered into a master administrative services agreement with Invesco pursuant to which the Fund has agreed to pay Invesco a fee for costs incurred in providing accounting services and fund administrative services to the Fund and to reimburse Invesco for fees paid to insurance companies that have agreed to provide certain administrative services to the Fund. These administrative services provided by the insurance companies may include, among other things: maintenance of master accounts with the Fund; tracking, recording and transmitting net purchase and redemption orders for Fund shares; maintaining and preserving records related to the purchase, redemption and other account activity of variable product owners; distributing copies of Fund documents such as prospectuses, proxy materials and periodic reports, to variable product owners, and responding to inquiries from variable product owners about the Fund. Pursuant to such agreement, for the six months ended June 30, 2019, Invesco was paid $103,103 for accounting and fund administrative services and was reimbursed $1,095,448 for fees paid to insurance companies. Also, Invesco has entered into a sub-administration agreement whereby State Street Bank and Trust Company (“SSB”) serves as custodian and fund accountant and provides certain administrative services to the Fund.
The Trust has entered into a transfer agency and service agreement with Invesco Investment Services, Inc. (“IIS”) pursuant to which the Fund has agreed to pay IIS a fee for providing transfer agency and shareholder services to the Fund and reimburse IIS for certain expenses incurred by IIS in the course of providing such services. For the six months ended June 30, 2019, expenses incurred under the agreement are shown in the Statement of Operations asTransfer agent fees.
The Trust has entered into a master distribution agreement with Invesco Distributors, Inc. (“IDI”) to serve as the distributor for the Fund. The Trust has adopted a plan pursuant to Rule 12b-1 under the 1940 Act with respect to the Fund’s Series II shares (the “Plan”). The Fund, pursuant to the Plan, pays IDI compensation at the annual rate of 0.25% of the Fund’s average daily net assets of Series II shares. The fees are accrued daily and paid monthly. Of the Plan payments, up to 0.25% of the average daily net assets of the Series II shares may be paid to insurance companies who furnish continuing personal shareholder services to customers who purchase and own Series II shares of the Fund. For the six months ended June 30, 2019, expenses incurred under the Plan are detailed in the Statement of Operations asDistribution fees.
Invesco V.I. Growth and Income Fund
For the six months ended June 30, 2019, the Fund incurred $37,172 in brokerage commissions with Invesco Capital Markets, Inc., an affiliate of the Adviser and IDI, for portfolio transactions executed on behalf of the Fund.
Certain officers and trustees of the Trust are officers and directors of the Adviser, IIS and/or IDI.
NOTE 3—Additional Valuation Information
GAAP defines fair value as the price that would be received to sell an asset or paid to transfer a liability in an orderly transaction between market participants at the measurement date, under current market conditions. GAAP establishes a hierarchy that prioritizes the inputs to valuation methods, giving the highest priority to readily available unadjusted quoted prices in an active market for identical assets (Level 1) and the lowest priority to significant unobservable inputs (Level 3), generally when market prices are not readily available or are unreliable. Based on the valuation inputs, the securities or other investments are tiered into one of three levels. Changes in valuation methods may result in transfers in or out of an investment’s assigned level:
Level 1 – Prices are determined using quoted prices in an active market for identical assets.
Level 2 – Prices are determined using other significant observable inputs. Observable inputs are inputs that other market participants may use in pricing a security. These may include quoted prices for similar securities, interest rates, prepayment speeds, credit risk, yield curves, loss severities, default rates, discount rates, volatilities and others.
Level 3 – Prices are determined using significant unobservable inputs. In situations where quoted prices or observable inputs are unavailable (for example, when there is little or no market activity for an investment at the end of the period), unobservable inputs may be used. Unobservable inputs reflect the Fund’s own assumptions about the factors market participants would use in determining fair value of the securities or instruments and would be based on the best available information.
The following is a summary of the tiered valuation input levels, as of June 30, 2019. The level assigned to the securities valuations may not be an indication of the risk or liquidity associated with investing in those securities. Because of the inherent uncertainties of valuation, the values reflected in the financial statements may materially differ from the value received upon actual sale of those investments.
| | Level 1 | Level 2 | Level 3 | Total |
| Investments in Securities | | | | |
| Common Stocks & Other Equity Interests | $1,352,475,428 | $119,410,550 | $— | $1,471,885,978 |
| Money Market Funds | 97,724,893 | — | — | 97,724,893 |
| Total Investments in Securities | 1,450,200,321 | 119,410,550 | — | 1,569,610,871 |
| Other Investments - Assets* | | | | |
| Forward Foreign Currency Contracts | — | 103,841 | — | 103,841 |
| Other Investments - Liabilities* | | | | |
| Forward Foreign Currency Contracts | — | (1,343,380) | — | (1,343,380) |
| Total Other Investments | — | (1,239,539) | — | (1,239,539) |
| Total Investments | $1,450,200,321 | $118,171,011 | $— | $1,568,371,332 |
| * | Unrealized appreciation (depreciation). |
NOTE 4—Derivative Investments
The Fund may enter into an International Swaps and Derivatives Association Master Agreement (“ISDA Master Agreement”) under which a fund may trade OTC derivatives. An OTC transaction entered into under an ISDA Master Agreement typically involves a collateral posting arrangement, payment netting provisions and close-out netting provisions. These netting provisions allow for reduction of credit risk through netting of contractual obligations. The enforceability of the netting provisions of the ISDA Master Agreement depends on the governing law of the ISDA Master Agreement, among other factors.
For financial reporting purposes, the Fund does not offset OTC derivative assets or liabilities that are subject to ISDA Master Agreements in the Statement of Assets and Liabilities.
Value of Derivative Investments at Period-End
The table below summarizes the value of the Fund’s derivative investments, detailed by primary risk exposure, held as of June 30, 2019:
| | Value |
| Derivative Assets | Currency
Risk |
| Unrealized appreciation on forward foreign currency contracts outstanding | $103,841 |
| Derivatives not subject to master netting agreements | - |
| Total Derivative Assets subject to master netting agreements | $103,841 |
Invesco V.I. Growth and Income Fund
| | Value |
| Derivative Liabilities | Currency
Risk |
| Unrealized depreciation on forward foreign currency contracts outstanding | $(1,343,380) |
| Derivatives not subject to master netting agreements | - |
| Total Derivative Liabilities subject to master netting agreements | $(1,343,380) |
Offsetting Assets and Liabilities
The table below reflects the Fund’s exposure to Counterparties subject to either an ISDA Master Agreement or other agreement for OTC derivative transactions as of June 30, 2019.
| | Financial
Derivative
Assets | | Financial
Derivative
Liabilities | | Collateral
(Received)/Pledged | | |
| Counterparty | Forward Foreign
Currency Contracts | | Forward Foreign
Currency Contracts | Net Value of
Derivatives | Non-Cash | Cash | Net
Amount |
| Bank of New York Mellon (The) | $– | | $ (492,628) | $ (492,628) | $– | $– | $ (492,628) |
| State Street Bank and Trust Co. | 103,841 | | (850,752) | (746,911) | – | – | (746,911) |
| Total | $ 103,841 | | $ (1,343,380) | $ (1,239,539) | $– | $– | $ (1,239,539) |
Effect of Derivative Investments for the six months ended June 30, 2019
The table below summarizes the gains (losses) on derivative investments, detailed by primary risk exposure, recognized in earnings during the period:
| | Location of Gain (Loss) on
Statement of Operations |
| | Currency
Risk |
| Realized Gain: | |
| Forward foreign currency contracts | $1,660,473 |
| Change in Net Unrealized Appreciation (Depreciation): | |
| Forward foreign currency contracts | (1,087,623) |
| Total | $572,850 |
The table below summarizes the average notional value of derivatives held during the period.
| | Forward
Foreign Currency
Contracts |
| Average notional value | $188,270,434 |
NOTE 5—Trustees’ and Officers’ Fees and Benefits
Trustees’ and Officers’ Fees and Benefits include amounts accrued by the Fund to pay remuneration to certain Trustees and Officers of the Fund. Trustees have the option to defer compensation payable by the Fund, and Trustees’ and Officers’ Fees and Benefits also include amounts accrued by the Fund to fund such deferred compensation amounts. Those Trustees who defer compensation have the option to select various Invesco Funds in which their deferral accounts shall be deemed to be invested. Finally, certain current Trustees were eligible to participate in a retirement plan that provided for benefits to be paid upon retirement to Trustees over a period of time based on the number of years of service. The Fund may have certain former Trustees who also participate in a retirement plan and receive benefits under such plan.Trustees’ and Officers’ Fees and Benefits include amounts accrued by the Fund to fund such retirement benefits. Obligations under the deferred compensation and retirement plans represent unsecured claims against the general assets of the Fund.
NOTE 6—Cash Balances
The Fund is permitted to temporarily carry a negative or overdrawn balance in its account with State Street Bank and Trust Company, the custodian bank. Such balances, if any at period-end, are shown in the Statement of Assets and Liabilities under the payable caption Amount due custodian. To compensate the custodian bank for such overdrafts, the overdrawn Fund may either (1) leave funds as a compensating balance in the account so the custodian bank can be compensated by earning the additional interest; or (2) compensate by paying the custodian bank at a rate agreed upon by the custodian bank and Invesco, not to exceed the contractually agreed upon rate.
NOTE 7—Tax Information
The amount and character of income and gains to be distributed are determined in accordance with income tax regulations, which may differ from GAAP. Reclassifications are made to the Fund’s capital accounts to reflect income and gains available for distribution (or available capital loss
Invesco V.I. Growth and Income Fund
carryforward) under income tax regulations. The tax character of distributions paid during the year and the tax components of net assets will be reported at the Fund’s fiscal year-end.
Capital loss carryforward is calculated and reported as of a specific date. Results of transactions and other activity after that date may affect the amount of capital loss carryforward actually available for the Fund to utilize. Capital losses generated in years beginning after December 22, 2010 can be carried forward for an unlimited period, whereas previous losses expire in eight tax years. Capital losses with an expiration period may not be used to offset capital gains until all net capital losses without an expiration date have been utilized. Capital loss carryforwards with no expiration date will retain their character as either short-term or long-term capital losses instead of as short-term capital losses as under prior law. The ability to utilize capital loss carryforwards in the future may be limited under the Internal Revenue Code and related regulations based on the results of future transactions.
The Fund did not have a capital loss carryforward as of December 31, 2018.
NOTE 8—Investment Transactions
The aggregate amount of investment securities (other than short-term securities, U.S. Treasury obligations and money market funds, if any) purchased and sold by the Fund during the six months ended June 30, 2019 was $550,904,820 and $445,832,449, respectively. Cost of investments, including any derivatives, on a tax basis includes the adjustments for financial reporting purposes as of the most recently completed federal income tax reporting period-end.
| Unrealized Appreciation (Depreciation) of Investments on a Tax Basis |
| Aggregate unrealized appreciation of investments | $262,346,785 |
| Aggregate unrealized (depreciation) of investments | (54,877,465) |
| Net unrealized appreciation of investments | $207,469,320 |
Cost of investments for tax purposes is $1,360,902,012.
NOTE 9—Share Information
| | Summary of Share Activity |
| | Six months ended
June 30, 2019(a) | | Year ended
December 31, 2018 |
| | Shares | Amount | | Shares | Amount |
| Sold: | | | | | |
| Series I | 427,960 | $8,360,052 | | 1,599,024 | $33,449,701 |
| Series II | 24,977,623 | 502,990,079 | | 4,823,927 | 100,263,745 |
| Issued as reinvestment of dividends: | | | | | |
| Series I | — | — | | 978,568 | 20,657,576 |
| Series II | — | — | | 8,737,339 | 184,183,100 |
| Reacquired: | | | | | |
| Series I | (818,152) | (16,118,141) | | (1,330,437) | (29,078,193) |
| Series II | (19,303,367) | (378,026,132) | | (31,937,812) | (658,603,276) |
| Net increase (decrease) in share activity | 5,284,064 | $117,205,858 | | (17,129,391) | $(349,127,347) |
| (a) | There are entities that are record owners of more than 5% of the outstanding shares of the Fund and in the aggregate own 77% of the outstanding shares of the Fund. The Fund and the Fund’s principal underwriter or adviser, are parties to participation agreements with these entities whereby these entities sell units of interest in separate accounts funding variable products that are invested in the Fund. The Fund, Invesco and/or Invesco affiliates may make payments to these entities, which are considered to be related to the Fund, for providing services to the Fund, Invesco and/or Invesco affiliates including but not limited to services such as, securities brokerage, third party record keeping and account servicing and administrative services. The Fund has no knowledge as to whether all or any portion of the shares owned of record by these entities are also owned beneficially. |
Invesco V.I. Growth and Income Fund
Calculating your ongoing Fund expenses
Example
As a shareholder of the Fund, you incur ongoing costs, including management fees; distribution and/or service fees (12b-1); and other Fund expenses. This example is intended to help you understand your ongoing costs (in dollars) of investing in the Fund and to compare these costs with ongoing costs of investing in other mutual funds. The example is based on an investment of $1,000 invested at the beginning of the period and held for the entire period January 1, 2019 through June 30, 2019.
The actual and hypothetical expenses in the examples below do not represent the effect of any fees or other expenses assessed in connection with a variable product; if they did, the expenses shown would be higher while the ending account values shown would be lower.
Actual expenses
The table below provides information about actual account values and actual expenses. You may use the information in this table, together with the amount you invested, to estimate the expenses that you paid over the period. Simply divide your account value by $1,000 (for example, an $8,600 account value divided by $1,000 = 8.6), then multiply the result by the number in the table under the heading entitled “Actual Expenses Paid During Period” to estimate the expenses you paid on your account during this period.
Hypothetical example for comparison purposes
The table below also provides information about hypothetical account values and hypothetical expenses based on the Fund’s actual expense ratio and an assumed rate of return of 5% per year before expenses, which is not the Fund’s actual return.
The hypothetical account values and expenses may not be used to estimate the actual ending account balance or expenses you paid for the period. You may use this information to compare the ongoing costs of investing in the Fund and other funds. To do so, compare this 5% hypothetical example with the 5% hypothetical examples that appear in the shareholder reports of the other funds.
Please note that the expenses shown in the table are meant to highlight your ongoing costs. Therefore, the hypothetical information is useful in comparing ongoing costs, and will not help you determine the relative total costs of owning different funds.
| | Beginning
Account Value (01/01/19) | ACTUAL | HYPOTHETICAL
(5% annual return before
expenses) | Annualized
Expense
Ratio |
Ending
Account Value
(06/30/19)1 | Expenses
Paid During
Period2 | Ending
Account Value
(06/30/19) | Expenses
Paid During
Period2 |
| Series I | $1,000.00 | $1,161.00 | $3.96 | $1,021.12 | $3.71 | 0.74% |
| Series II | 1,000.00 | 1,159.60 | 5.30 | 1,019.89 | 4.96 | 0.99 |
| 1 | The actual ending account value is based on the actual total return of the Fund for the period January 1, 2019 through June 30, 2019, after actual expenses and will differ from the hypothetical ending account value which is based on the Fund’s expense ratio and a hypothetical annual return of 5% before expenses. |
| 2 | Expenses are equal to the Fund’s annualized expense ratio as indicated above multiplied by the average account value over the period, multiplied by 181/365 to reflect the most recent fiscal half year. |
Invesco V.I. Growth and Income Fund
Approval of Investment Advisory andSub-Advisory Contracts
At meetings held on June 10, 2019, the Board of Trustees (the Board or the Trustees) of AIM Variable Insurance Funds (Invesco Variable Insurance Funds) as a whole, and the independent Trustees, who comprise over 75% of the Board, voting separately, approved the continuance of the Invesco V.I. Growth and Income Fund’s (the Fund) Master Investment Advisory Agreement with Invesco Advisers, Inc. (Invesco Advisers and the investment advisory agreement) and the Master IntergroupSub-Advisory Contract for Mutual Funds with Invesco Asset Management Deutschland GmbH, Invesco Asset Management Limited, Invesco Asset Management (Japan) Limited, Invesco Hong Kong Limited, Invesco Senior Secured Management, Inc. and Invesco Canada Ltd. and separatesub-advisory contracts with Invesco Capital Management LLC and Invesco Asset Management (India) Private Limited (collectively, the AffiliatedSub-Advisers and thesub-advisory contracts) for another year, effective July 1, 2019. After evaluating the factors discussed below, among others, the Board approved the renewal of the Fund’s investment advisory agreement and thesub-advisory contracts and determined that the compensation payable by the Fund to Invesco Advisers and by Invesco Advisers to the AffiliatedSub-Advisers is fair and reasonable.
The Board’s Evaluation Process
The Board’s Investments Committee has established threeSub-Committees, which meet throughout the year to review the performance of funds advised by Invesco Advisers (the Invesco Funds). As part of a regularly scheduled basis ofin-person Board meetings, theSub-Committees meet with portfolio managers for their assigned Invesco Funds and other members of management to review detailed information about investment performance and portfolio attributes of these funds. The Board took into account evaluations and reports that it received from the Investments Committee andSub-Committees, as well as the information provided to such committees and the Board throughout the year, in considering whether to approve each Invesco Fund’s investment advisory agreement andsub-advisory contracts.
As part of the contract renewal process, the Board reviews and considers information provided in response to detailed requests for information submitted to management by the independent Trustees with assistance from legal counsel to the independent Trustees. The Board receives comparative investment performance and fee data regarding the Invesco Funds prepared by Invesco Advisers and Broadridge Financial Solutions, Inc. (Broadridge), an independent mutual fund data provider. The Board also receives an independent written evaluation from the Senior Officer, an officer of the Invesco Funds who reports directly to the
independent Trustees. The Senior Officer’s evaluation is prepared as part of his responsibility to manage the process by which the Invesco Funds’ proposed management fees are negotiated during the annual contract renewal process to ensure they are negotiated in a manner that is at arms’ length and reasonable. In addition to meetings with Invesco Advisers and fund counsel throughout the year, the independent Trustees also discuss the continuance of the investment advisory agreement andsub-advisory contracts in separate sessions with the Senior Officer and with independent legal counsel.
The discussion below is a summary of the Senior Officer’s independent written evaluation with respect to the Fund’s investment advisory agreement, as well as a discussion of the material factors and related conclusions that formed the basis for the Board’s approval of the Fund’s investment advisory agreement andsub-advisory contracts. The Trustees’ review and conclusions are based on the comprehensive consideration of all information presented to them during the course of the year and in prior years and are not the result of any single determinative factor. Moreover, one Trustee may have weighed a particular piece of information or factor differently than another Trustee. This information is current as of June 10, 2019.
Factors and Conclusions and Summary of Independent Written Fee Evaluation
| A. | Nature, Extent and Quality of Services Provided by Invesco Advisers and the AffiliatedSub-Advisers |
The Board reviewed the nature, extent and quality of the advisory services provided to the Fund by Invesco Advisers under the Fund’s investment advisory agreement, and the credentials and experience of the officers and employees of Invesco Advisers who provide these services, including the Fund’s portfolio manager(s). The Board’s review included consideration of Invesco Advisers’ investment process oversight and structure, credit analysis and investment risk management. The Board also considerednon-advisory services that Invesco Advisers and its affiliates provide to the Invesco Funds such as various back office support functions, third party oversight, internal audit, valuation, portfolio trading and legal and compliance. The Board also received and reviewed information about Invesco Advisers’ role as administrator of the Invesco Funds’ liquidity risk management program. The Board also reviewed and considered the benefits to shareholders of investing in a fund that is part of the Invesco family of funds under the umbrella of Invesco Ltd., Invesco Advisers’ parent company, and noted Invesco Ltd.’s depth and experience in conducting an investment management business, as well as its
commitment of financial and other resources to such business. The Board reviewed and considered information about the resources that Invesco Advisers intends to continue to commit to managing the Invesco family of funds following Invesco Ltd.’s acquisition of OppenheimerFunds, Inc. and its subsidiaries. The Board concluded that the nature, extent and quality of the services provided to the Fund by Invesco Advisers are appropriate and satisfactory.
The Board reviewed the services that may be provided by the AffiliatedSub-Advisers under thesub-advisory contracts and the credentials and experience of the officers and employees of the AffiliatedSub-Advisers who provide these services. The Board noted the AffiliatedSub-Advisers’ expertise with respect to certain asset classes and that the AffiliatedSub-Advisers have offices and personnel that are located in financial centers around the world. As a result, the Board noted that the AffiliatedSub-Advisers can provide research and investment analysis on the markets and economies of various countries in which the Fund may invest, make recommendations regarding securities and assist with security trades. The Board concluded that thesub-advisory contracts may benefit the Fund and its shareholders by permitting Invesco Advisers to use the resources and talents of the AffiliatedSub-Advisers in managing the Fund. The Board concluded that the nature, extent and quality of the services that may be provided by the AffiliatedSub-Advisers are appropriate and satisfactory.
| B. | Fund Investment Performance |
The Board considered Fund investment performance as a relevant factor in considering whether to approve the investment advisory agreement. The Board did not view Fund investment performance as a relevant factor in considering whether to approve thesub-advisory contracts for the Fund, as no AffiliatedSub-Adviser currently manages assets of the Fund.
The Board compared the Fund’s investment performance over multiple time periods ending December 31, 2018 to the performance of funds in the Broadridge performance universe and against the Lipper Variable Underlying FundsLarge-Cap Value Funds Index. The Board noted that performance of Series I shares of the Fund was in the fifth quintile of its performance universe for the one year period and the third quintile for the three and five year periods (the first quintile being the best performing funds and the fifth quintile being the worst performing funds). The Board noted that performance of Series I shares of the Fund was below the performance of the Index for the one and three year periods and reasonably comparable to the performance of the Index for the five year period. The Board noted that the Fund’s
Invesco V.I. Growth and Income Fund
overweight and underweight exposure to and stock selection in certain sectors negatively impacted performance. The Trustees also reviewed more recent Fund performance and this review did not change their conclusions.
| C. | Advisory and Sub-Advisory Fees and Fund Expenses |
The Board compared the Fund’s contractual management fee rate to the contractual management fee rates of funds in the Fund’s Broadridge expense group. The Board noted that the contractual management fee rate for Series I shares of the Fund was below the median contractual management fee rate of funds in its expense group. The Board noted that the term “contractual management fee” for funds in the expense group may include both advisory and certainnon-portfolio management administrative services fees, but that Broadridge does not provide information on a fund by fund basis as to what is included. The Board also reviewed the methodology used by Broadridge in providing expense group information, which includes using each fund’s contractual management fee schedule (including any applicable breakpoints) as reported in the most recent prospectus or statement of additional information for each fund in the expense group. The Board also considered comparative information regarding the Fund’s total expense ratio and its various components.
The Board noted that Invesco Advisers has contractually agreed to waive fees and/or limit expenses of the Fund for the term disclosed in the Fund’s registration statement in an amount necessary to limit total annual operating expenses to a specified percentage of average daily net assets for each class of the Fund.
The Board also considered the fees charged by Invesco Advisers and the AffiliatedSub-Advisers to other similarly managed client accounts. The Board noted that Invesco Advisers or the AffiliatedSub-Advisers may charge lower fees to large institutional clients. Invesco Advisers reviewed with the Board differences in the scope of services it provides to the Invesco Funds relative to certain other types of client accounts, including management of cash flows as a result of redemptions and purchases, necessary infrastructure such as officers, office space, technology, legal and distribution, oversight of service providers, costs and business risks associated with launching new funds and sponsoring and maintaining the product line, preparation of annual registration statement updates and financial information and compliance with federal and state laws and regulations.
The Board also compared the Fund’s effective advisory fee rate (the advisory fee rate after advisory fee waivers and before other expense limitations/waivers) to the effective advisory fee rates of other similarly managed third-party mutual funds advised orsub-advised by Invesco Advisers and its affiliates, based on asset balances as of December 31, 2018.
The Board also considered the services that may be provided by the AffiliatedSub-Advisers pursuant to thesub-advisory contracts, as well as the fees payable by Invesco Advisers to the AffiliatedSub-Advisers pursuant to thesub-advisory contracts.
| D. | Economies of Scale and Breakpoints |
The Board considered the extent to which there may be economies of scale in the provision of advisory services to the Fund. The Board considered Invesco’s reinvestment in its business, including investments in business infrastructure and cybersecurity. The Board also considered that the Fund benefits from economies of scale through contractual breakpoints in the Fund’s advisory fee schedule, which generally operate to reduce the Fund’s expense ratio as it grows in size. The Board noted that the Fund shares directly in economies of scale through lower fees charged by third party service providers based on the combined size of the Invesco Funds. The Board noted that the Fund may also benefit from economies of scale through initial fee setting, fee waivers and expense reimbursements.
| E. | Profitability and Financial Resources |
The Board reviewed information from Invesco Advisers concerning the costs of the advisory and other services that Invesco Advisers and its affiliates provide to the Fund and the Invesco Funds and the profitability of Invesco Advisers and its affiliates in providing these services. The Board considered the methodology used for calculating profitability and noted the periodic review of such methodology by an independent consultant. The Board noted that Invesco Advisers continues to operate at a net profit from services Invesco Advisers and its affiliates provide to the Invesco Funds and the Fund. The Board did not deem the level of profits realized by Invesco Advisers and its affiliates from providing services to the Fund to be excessive given the nature, extent and quality of the services provided. The Board received information from Invesco Advisers demonstrating that Invesco Advisers and the Affiliated Sub-Advisers are financially sound and have the resources necessary to perform their obligations under the investment advisory agreement andsub-advisory contracts.
| F. | Collateral Benefits to Invesco Advisers and its Affiliates |
The Board considered various other benefits received by Invesco Advisers and its affiliates from the relationship with the Fund, including the fees received for providing administrative, transfer agency and distribution services to the Fund. The Board considered comparative information regarding fees charged for these services, including information provided by Broadridge and other independent sources. The Board considered the performance of Invesco Advisers and its affiliates in providing these services and the organizational structure employed to provide these services. The Board also considered that these services are provided to the Fund pursuant to written contracts that are reviewed and approved on an annual basis
by the Board; and that the services are required for the operation of the Fund.
The Board considered the benefits realized by Invesco Advisers and the AffiliatedSub-Advisers as a result of portfolio brokerage transactions executed through “soft dollar” arrangements. The Board noted that soft dollar arrangements may result in the Fund bearing costs to purchase research that may be used by Invesco Advisers or the AffiliatedSub-Advisers with other clients and may reduce Invesco Advisers’ or the AffiliatedSub-Advisers’ expenses. The Board also considered that it receives periodic reports from Invesco representing that these arrangements are consistent with regulatory requirements. The Board did not deem the soft dollar arrangements to be inappropriate.
The Board considered that the Fund’s uninvested cash and cash collateral from any securities lending arrangements may be invested in money market funds advised by Invesco Advisers pursuant to procedures approved by the Board. The Board considered information regarding the returns of the affiliated money market funds relative to comparable overnight investments, as well as the costs to the Fund of such investments. The Board noted that Invesco Advisers receives advisory fees from these affiliated money market funds attributable to such investments, although Invesco Advisers has contractually agreed to waive through varying periods the advisory fees payable by the Invesco Funds with respect to certain investments in the affiliated money market funds. The waiver is in an amount equal to 100% of the net advisory fee Invesco Advisers receives from the affiliated money market funds with respect to the Fund’s investment in the affiliated money market funds of uninvested cash, but not cash collateral. The Board concluded that the amount of advisory fees received by Invesco Advisers from the Fund’s investment of cash collateral from any securities lending arrangements in the affiliated money market funds is fair and reasonable.
The Board also considered that an affiliated broker may receive commissions for executing certain trades for the Fund. Invesco Advisers and the AffiliatedSub-Advisers may use the affiliated broker to, among other things, control order routing and minimize information leakage, and the Board was advised that such trades are executed in compliance with rules under the federal securities laws and consistent with best execution obligations.
Invesco V.I. Growth and Income Fund
| Semiannual Report to Shareholders | June 30, 2019 |
Invesco V.I. Health Care Fund
Beginning on January 1, 2021, as permitted by regulations adopted by the Securities and Exchange Commission, the insurance company that offers your variable annuity or variable life insurance contract may no longer send you paper copies of the Fund’s shareholder reports by mail, unless you specifically request paper copies of the reports from the insurance company or your financial intermediary. Instead of delivering paper copies of the report, the insurance company may choose to make the reports available on a website, and will notify you by mail each time a report is posted and provide you with a website link to access the report. Instructions for requesting paper copies will be provided by your insurance company.
If the insurance company offers electronic delivery, you may elect to receive shareholder reports and other communications about the Fund electronically by following the instructions provided by the insurance company or by contacting your financial intermediary. If you already elected to receive shareholder reports electronically, you will not be affected by this change and you need not take any action.
You may elect to receive all future reports in paper free of charge from the insurance company. You can inform the insurance company or your financial intermediary that you wish to continue receiving paper copies of your shareholder reports by following the instructions provided by the insurance company or by contacting your financial intermediary. Your election to receive reports in paper will apply to all portfolio companies available under your contract with the insurance company.
The Fund provides a complete list of its holdings four times in each fiscal year, at the quarter-ends. For the second and fourth quarters, the lists appear in the Fund’s semiannual and annual reports to shareholders. For the first and third quarters, the Fund files the lists with the Securities and Exchange Commission (SEC) on Form N-Q (or any successor Form). The Fund’s Form N-Q (or any successor Form) filings are available on the SEC website, sec.gov. The SEC file numbers for the Fund are 811-07452 and 033-57340. The Fund’s most recent portfolio holdings, as filed on Form N-Q (or any successor Form), have also been made available to insurance companies issuing variable annuity contracts and variable life insurance policies (“variable products”) that invest in the Fund.
A description of the policies and procedures that the Fund uses to determine how to vote proxies relating to portfolio securities is available without charge, upon request, from our Client Services department at 800 959 4246 or at invesco.com/proxyguidelines. The information is also available on the SEC website, sec.gov.
Information regarding how the Fund voted proxies related to its portfolio securities during the most recent 12-month period ended June 30 is available at invesco.com/proxysearch. The information is also available on the SEC website, sec.gov.
Invesco Advisers, Inc. is an investment adviser; it provides investment advisory services to individual and institutional clients and does not sell securities. Invesco Distributors, Inc. is the US distributor for Invesco Ltd.’s retail mutual funds, exchange-traded funds and institutional money market funds. Both are wholly owned, indirect subsidiaries of Invesco Ltd.
This report must be accompanied or preceded by a currently effective Fund prospectus and variable product prospectus, which contain more complete information, including sales charges and expenses. Investors should read each carefully before investing.
NOT FDIC INSURED | MAY LOSE VALUE | NO BANK GUARANTEE
| Invesco Distributors, Inc. | I-VIGHC-SAR-1 |
Performance summary
Fund vs. Indexes
Cumulative total returns, December 31, 2018 to June 30, 2019, excluding variable product issuer charges. If variable product issuer charges were included, returns would be lower.
| Series I Shares | 15.46% |
| Series II Shares | 15.36 |
| MSCI World Index▼ (Broad Market Index) | 16.98 |
| MSCI World Health Care Index▼ (Style-Specific Index) | 9.76 |
Lipper VUF Health/Biotechnology Funds Classification Average■
(Peer Group) | 13.74 |
| Source(s):▼RIMES Technologies Corp.;■ Lipper Inc. |
TheMSCI World IndexSM is an unmanaged index considered representative of stocks of developed countries. The index is computed using the net return, which withholds applicable taxes for non-resident investors.
TheMSCI World Health Care Index is an unmanaged index considered representative of health care stocks of developed countries. The index is computed using the net return, which withholds applicable taxes for non-resident investors.
TheLipper VUF Health/Biotechnology Funds Classification Average represents an average of all variable insurance underlying funds in the Lipper Health/Biotechnology Funds classification.
The Fund is not managed to track the performance of any particular index, including the indexes described here, and consequently, the performance of the Fund may deviate significantly from the performance of the indexes.
A direct investment cannot be made in an index. Unless otherwise indicated, index results include reinvested dividends, and they do not reflect sales charges. Performance of the peer group, if applicable, reflects fund expenses; performance of a market index does not.
| Average Annual Total Returns |
| As of 6/30/19 |
| Series I Shares | |
| Inception (5/21/97) | 8.63% |
| 10 Years | 12.42 |
| 5 Years | 6.20 |
| 1 Year | 12.76 |
| Series II Shares | |
| Inception (4/30/04) | 7.93% |
| 10 Years | 12.14 |
| 5 Years | 5.94 |
| 1 Year | 12.50 |
The performance of the Fund’s Series I and Series II share classes will differ primarily due to different class expenses.
The performance data quoted represent past performance and cannot guarantee comparable future results; current performance may be lower or higher. Please contact your variable product issuer or financial adviser for the most recent month-end variable product performance. Performance figures reflect Fund expenses, reinvested distributions and changes in net asset value. Investment return and principal value will fluctuate so that you may have a gain or loss when you sell shares.
The total annual Fund operating expense ratio set forth in the most re-
cent Fund prospectus as of the date of this report for Series I and Series II shares was 1.00% and 1.25%, respectively. The expense ratios presented above may vary from the expense ratios presented in other sections of this report that are based on expenses incurred during the period covered by this report.
Invesco V.I. Health Care Fund, a series portfolio of AIM Variable Insurance Funds (Invesco Variable Insurance Funds), is currently offered through insurance companies issuing variable products. You cannot purchase shares of the Fund directly. Performance figures given represent the Fund and are not intended to reflect actual variable product values. They do not reflect sales charges, expenses and fees as-
sessed in connection with a variable product. Sales charges, expenses and fees, which are determined by the variable product issuers, will vary and will lower the total return.
The most recent month-end performance at the Fund level, excluding variable product charges, is available at 800 451 4246. As mentioned above, for the most recent month-end performance including variable product charges, please contact your variable product issuer or financial adviser.
Fund performance reflects any applicable fee waivers and/or expense reimbursements. Had the adviser not waived fees and/or reimbursed expenses currently or in the past, returns would have been lower. See current prospectus for more information.
Invesco V.I. Health Care Fund
Schedule of Investments(a)
June 30, 2019
(Unaudited)
| | Shares | Value |
| Common Stocks & Other Equity Interests–98.07% |
| Biotechnology–18.37% |
| ACADIA Pharmaceuticals, Inc.(b) | 33,994 | $908,660 |
| Alexion Pharmaceuticals, Inc.(b) | 27,043 | 3,542,092 |
| Amarin Corp. PLC, ADR (Ireland)(b) | 60,664 | 1,176,275 |
| ArQule, Inc.(b) | 47,848 | 526,807 |
| Ascendis Pharma A/S, ADR (Denmark)(b) | 9,637 | 1,109,701 |
| Avrobio, Inc.(b) | 15,465 | 251,461 |
| BioCryst Pharmaceuticals, Inc.(b) | 155,452 | 589,163 |
| Biogen, Inc.(b) | 15,393 | 3,599,961 |
| Biohaven Pharmaceutical Holding Co., Ltd.(b) | 22,190 | 971,700 |
| BioMarin Pharmaceutical, Inc.(b) | 49,881 | 4,272,308 |
| Bluebird Bio, Inc.(b) | 8,802 | 1,119,614 |
| DBV Technologies S.A., ADR (France)(b) | 86,045 | 707,290 |
| Exact Sciences Corp.(b) | 32,052 | 3,783,418 |
| Global Blood Therapeutics, Inc.(b) | 21,833 | 1,148,416 |
| Heron Therapeutics, Inc.(b) | 31,133 | 578,762 |
| Immunomedics, Inc.(b) | 58,505 | 811,464 |
| Incyte Corp.(b) | 22,563 | 1,916,953 |
| Kadmon Holdings, Inc.(b) | 193,153 | 397,895 |
| KalVista Pharmaceuticals, Inc.(b) | 22,496 | 498,286 |
| Neurocrine Biosciences, Inc.(b) | 15,163 | 1,280,212 |
| REGENXBIO, Inc.(b) | 14,958 | 768,392 |
| Rocket Pharmaceuticals, Inc.(b) | 64,393 | 965,895 |
| Rubius Therapeutics, Inc.(b) | 40,991 | 644,788 |
| Sarepta Therapeutics, Inc.(b) | 11,570 | 1,758,062 |
| Vertex Pharmaceuticals, Inc.(b) | 21,773 | 3,992,733 |
| | | | 37,320,308 |
| Drug Retail–0.51% |
| Raia Drogasil S.A. (Brazil) | 52,760 | 1,045,596 |
| Health Care Equipment–17.96% |
| Abbott Laboratories | 63,019 | 5,299,898 |
| Baxter International, Inc. | 32,641 | 2,673,298 |
| Becton, Dickinson and Co. | 6,568 | 1,655,201 |
| Boston Scientific Corp.(b) | 117,358 | 5,044,047 |
| Edwards Lifesciences Corp.(b) | 12,869 | 2,377,419 |
| Koninklijke Philips N.V. (Netherlands) | 82,593 | 3,587,522 |
| Medtronic PLC | 82,603 | 8,044,706 |
| Wright Medical Group N.V.(b) | 117,095 | 3,491,773 |
| Zimmer Biomet Holdings, Inc. | 36,731 | 4,324,708 |
| | | | 36,498,572 |
| Health Care Facilities–1.66% |
| HCA Healthcare, Inc. | 24,932 | 3,370,058 |
| Health Care Services–2.41% |
| Cigna Corp. | 16,951 | 2,670,630 |
| | Shares | Value |
| Health Care Services–(continued) |
| CVS Health Corp. | 40,803 | $2,223,356 |
| | | | 4,893,986 |
| Health Care Supplies–2.16% |
| Alcon, Inc. (Switzerland)(b) | 20,862 | 1,294,487 |
| Align Technology, Inc.(b) | 6,791 | 1,858,697 |
| Silk Road Medical, Inc.(b) | 25,700 | 1,245,422 |
| | | | 4,398,606 |
| Health Care Technology–1.29% |
| HMS Holdings Corp.(b) | 32,082 | 1,039,136 |
| Inspire Medical Systems, Inc.(b) | 25,931 | 1,572,715 |
| | | | 2,611,851 |
| Life Sciences Tools & Services–8.35% |
| Adaptive Biotechnologies Corp.(b) | 6,817 | 329,261 |
| Agilent Technologies, Inc. | 16,723 | 1,248,707 |
| Bio-Rad Laboratories, Inc., Class A(b) | 6,180 | 1,931,806 |
| Eurofins Scientific S.E. (Luxembourg) | 3,931 | 1,738,993 |
| Illumina, Inc.(b) | 7,505 | 2,762,966 |
| Thermo Fisher Scientific, Inc. | 30,496 | 8,956,065 |
| | | | 16,967,798 |
| Managed Health Care–11.90% |
| Anthem, Inc. | 15,612 | 4,405,862 |
| Centene Corp.(b) | 61,590 | 3,229,779 |
| Hapvida Participacoes e Investimentos S.A., REGS (Brazil)(c) | 155,200 | 1,593,650 |
| HealthEquity, Inc.(b) | 11,488 | 751,315 |
| Humana, Inc. | 15,133 | 4,014,785 |
| Notre Dame Intermedica Participacoes S.A. (Brazil) | 155,383 | 1,631,543 |
| UnitedHealth Group, Inc. | 35,063 | 8,555,723 |
| | | | 24,182,657 |
| Pharmaceuticals–33.46% |
| Allergan PLC | 11,065 | 1,852,613 |
| AstraZeneca PLC, ADR (United Kingdom) | 168,910 | 6,972,605 |
| Axsome Therapeutics, Inc.(b) | 70,534 | 1,816,251 |
| Bristol-Myers Squibb Co. | 80,743 | 3,661,695 |
| Elanco Animal Health, Inc.(b) | 58,724 | 1,984,871 |
| Eli Lilly and Co. | 40,643 | 4,502,838 |
| Jazz Pharmaceuticals PLC(b) | 9,871 | 1,407,210 |
| Johnson & Johnson | 59,326 | 8,262,925 |
| Merck & Co., Inc. | 79,259 | 6,645,867 |
| Milestone Pharmaceuticals, Inc. (Canada)(b) | 34,630 | 940,205 |
| Nippon Shinyaku Co., Ltd. (Japan) | 30,100 | 2,131,764 |
| Novartis AG, ADR (Switzerland) | 97,228 | 8,877,889 |
| Novo Nordisk A/S, Class B (Denmark) | 72,684 | 3,707,595 |
| Odonate Therapeutics, Inc.(b) | 42,502 | 1,559,398 |
See accompanying Notes to Financial Statements which are an integral part of the financial statements.
Invesco V.I. Health Care Fund
| | Shares | Value |
| Pharmaceuticals–(continued) |
| Pfizer, Inc. | 92,726 | $4,016,890 |
| Roche Holding AG (Switzerland) | 13,062 | 3,675,206 |
| Sanofi, ADR (France) | 118,483 | 5,126,759 |
| Zogenix, Inc.(b) | 17,712 | 846,279 |
| | | | 67,988,860 |
| Total Common Stocks & Other Equity Interests (Cost $153,535,837) | 199,278,292 |
| Money Market Funds–0.98% |
| Invesco Government & Agency Portfolio, Institutional Class, 2.26%(d) | 697,865 | 697,865 |
| | Shares | Value |
| Money Market Funds–(continued) |
| Invesco Liquid Assets Portfolio, Institutional Class, 2.40%(d) | 498,210 | $498,409 |
| Invesco Treasury Portfolio, Institutional Class, 2.22%(d) | 797,560 | 797,560 |
| Total Money Market Funds (Cost $1,993,834) | 1,993,834 |
| TOTAL INVESTMENTS IN SECURITIES–99.05% (Cost $155,529,671) | 201,272,126 |
| OTHER ASSETS LESS LIABILITIES–0.95% | 1,929,436 |
| NET ASSETS–100.00% | $203,201,562 |
Investment Abbreviations:
| ADR | – American Depositary Receipt |
| REGS | – Regulation S |
Notes to Schedule of Investments:
| (a) | Industry and/or sector classifications used in this report are generally according to the Global Industry Classification Standard, which was developed by and is the exclusive property and a service mark of MSCI Inc. and Standard & Poor’s. |
| (b) | Non-income producing security. |
| (c) | Security purchased or received in a transaction exempt from registration under the Securities Act of 1933, as amended (the “1933 Act”). The security may be resold pursuant to an exemption from registration under the 1933 Act, typically to qualified institutional buyers. The value of this security at June 30, 2019 represented less than 1% of the Fund’s Net Assets. |
| (d) | The money market fund and the Fund are affiliated by having the same investment adviser. The rate shown is the 7-day SEC standardized yield as of June 30, 2019. |
Portfolio Composition
By country, based on Net Assets
as of June 30, 2019
| United States | 75.78% |
| Switzerland | 6.82 |
| United Kingdom | 3.43 |
| France | 2.87 |
| Denmark | 2.37 |
| Brazil | 2.09 |
| Countries, each less than 2% of portfolio | 4.71 |
| Money Market Funds Plus Other Assets Less Liabilities | 1.93 |
See accompanying Notes to Financial Statements which are an integral part of the financial statements.
Invesco V.I. Health Care Fund
Statement of Assets and Liabilities
June 30, 2019
(Unaudited)
| Assets: | |
Investments in securities, at value
(Cost $153,535,837) | $199,278,292 |
| Investments in affiliated money market funds, at value (Cost $1,993,834) | 1,993,834 |
| Foreign currencies, at value (Cost $85,043) | 85,772 |
| Receivable for: | |
| Fund shares sold | 6,758 |
| Dividends | 335,672 |
| Investments sold | 3,032,576 |
| Investment for trustee deferred compensation and retirement plans | 76,907 |
| Total assets | 204,809,811 |
| Liabilities: | |
| Payable for: | |
| Investments purchased | 1,225,605 |
| Fund shares reacquired | 144,846 |
| Accrued fees to affiliates | 115,182 |
| Accrued trustees’ and officers’ fees and benefits | 122 |
| Accrued other operating expenses | 37,114 |
| Trustee deferred compensation and retirement plans | 85,380 |
| Total liabilities | 1,608,249 |
| Net assets applicable to shares outstanding | $203,201,562 |
| Net assets consist of: | |
| Shares of beneficial interest | $147,265,191 |
| Distributable earnings | 55,936,371 |
| | $203,201,562 |
| Net Assets: |
| Series I | $137,301,934 |
| Series II | $65,899,628 |
| Shares outstanding, no par value, with an unlimited number of shares authorized: |
| Series I | 5,079,703 |
| Series II | 2,580,461 |
| Series I: | |
| Net asset value per share | $27.03 |
| Series II: | |
| Net asset value per share | $25.54 |
Statement of Operations
For the six months ended June 30, 2019
(Unaudited)
| Investment income: | |
| Dividends (net of foreign withholding taxes of $112,730) | $1,547,763 |
| Dividends from affiliated money market funds | 48,753 |
| Total investment income | 1,596,516 |
| Expenses: | |
| Advisory fees | 741,661 |
| Administrative services fees | 162,147 |
| Custodian fees | 3,740 |
| Distribution fees - Series II | 79,702 |
| Transfer agent fees | 10,508 |
| Trustees’ and officers’ fees and benefits | 12,559 |
| Reports to shareholders | 3,712 |
| Professional services fees | 17,291 |
| Other | 1,798 |
| Total expenses | 1,033,118 |
| Less: Fees waived | (2,665) |
| Net expenses | 1,030,453 |
| Net investment income | 566,063 |
| Realized and unrealized gain from: | |
| Net realized gain from: | |
| Investment securities | 4,960,397 |
| Foreign currencies | 1,482 |
| | 4,961,879 |
| Change in net unrealized appreciation of: | |
| Investment securities | 22,610,299 |
| Foreign currencies | 2,295 |
| | 22,612,594 |
| Net realized and unrealized gain | 27,574,473 |
| Net increase in net assets resulting from operations | $28,140,536 |
See accompanying Notes to Financial Statements which are an integral part of the financial statements.
Invesco V.I. Health Care Fund
Statement of Changes in Net Assets
For the six months ended June 30, 2019 and the year ended December 31, 2018
(Unaudited)
| | June 30,
2019 | December 31,
2018 |
| Operations: | | |
| Net investment income | $566,063 | $52,575 |
| Net realized gain | 4,961,879 | 6,023,929 |
| Change in net unrealized appreciation (depreciation) | 22,612,594 | (4,170,670) |
| Net increase in net assets resulting from operations | 28,140,536 | 1,905,834 |
| Distributions to shareholders from distributable earnings: | | |
| Series I | — | (18,007,655) |
| Series II | — | (8,604,944) |
| Total distributions from distributable earnings | — | (26,612,599) |
| Share transactions–net: | | |
| Series I | (11,175,279) | 1,916,919 |
| Series II | (3,446,723) | 1,194,044 |
| Net increase (decrease) in net assets resulting from share transactions | (14,622,002) | 3,110,963 |
| Net increase (decrease) in net assets | 13,518,534 | (21,595,802) |
| Net assets: | | |
| Beginning of period | 189,683,028 | 211,278,830 |
| End of period | $203,201,562 | $189,683,028 |
See accompanying Notes to Financial Statements which are an integral part of the financial statements.
Invesco V.I. Health Care Fund
Financial Highlights
June 30, 2019
(Unaudited)
The following schedule presents financial highlights for a share of the Fund outstanding throughout the periods indicated.
| | Net asset
value,
beginning
of period | Net
investment
income
(loss)(a) | Net gains
(losses)
on securities
(both
realized and
unrealized) | Total from
investment
operations | Dividends
from net
investment
income | Distributions
from net
realized
gains | Total
distributions | Net asset
value, end
of period | Total
return(b) | Net assets,
end of period
(000’s omitted) | Ratio of
expenses
to average
net assets
with fee waivers
and/or expenses
absorbed | Ratio of
expenses
to average net
assets without
fee waivers
and/or expenses
absorbed | Ratio of net
investment
income
(loss)
to average
net assets | Portfolio
turnover(c) |
| Series I |
| Six months ended 06/30/19 | $23.41 | $0.08 | $3.54 | $3.62 | $— | $— | $— | $27.03 | 15.46% | $137,302 | 0.96%(d) | 0.96%(d) | 0.65%(d) | 6% |
| Year ended 12/31/18 | 26.44 | 0.03(e) | 0.59 | 0.62 | — | (3.65) | (3.65) | 23.41 | 0.90 | 129,377 | 1.00 | 1.00 | 0.10(e) | 35 |
| Year ended 12/31/17 | 24.11 | (0.02) | 3.86 | 3.84 | (0.10) | (1.41) | (1.51) | 26.44 | 15.83 | 144,038 | 1.01 | 1.01 | (0.08) | 37 |
| Year ended 12/31/16 | 31.75 | 0.09 | (3.36) | (3.27) | — | (4.37) | (4.37) | 24.11 | (11.46) | 145,408 | 1.04 | 1.04 | 0.31 | 23 |
| Year ended 12/31/15 | 33.78 | 0.00 | 1.08 | 1.08 | — | (3.11) | (3.11) | 31.75 | 3.16 | 209,511 | 1.06 | 1.07 | 0.01 | 42 |
| Year ended 12/31/14 | 29.32 | (0.00) | 5.71 | 5.71 | — | (1.25) | (1.25) | 33.78 | 19.67 | 220,561 | 1.08 | 1.09 | (0.01) | 29 |
| Series II |
| Six months ended 06/30/19 | 22.14 | 0.05 | 3.35 | 3.40 | — | — | — | 25.54 | 15.36 | 65,900 | 1.21(d) | 1.21(d) | 0.40(d) | 6 |
| Year ended 12/31/18 | 25.25 | (0.04)(e) | 0.58 | 0.54 | — | (3.65) | (3.65) | 22.14 | 0.62 | 60,306 | 1.25 | 1.25 | (0.15)(e) | 35 |
| Year ended 12/31/17 | 23.07 | (0.08) | 3.69 | 3.61 | (0.02) | (1.41) | (1.43) | 25.25 | 15.55 | 67,240 | 1.26 | 1.26 | (0.33) | 37 |
| Year ended 12/31/16 | 30.65 | 0.02 | (3.23) | (3.21) | — | (4.37) | (4.37) | 23.07 | (11.69) | 69,190 | 1.29 | 1.29 | 0.06 | 23 |
| Year ended 12/31/15 | 32.80 | (0.08) | 1.04 | 0.96 | — | (3.11) | (3.11) | 30.65 | 2.89 | 103,464 | 1.31 | 1.32 | (0.24) | 42 |
| Year ended 12/31/14 | 28.57 | (0.08) | 5.56 | 5.48 | — | (1.25) | (1.25) | 32.80 | 19.38 | 78,070 | 1.33 | 1.34 | (0.26) | 29 |
| (a) | Calculated using average shares outstanding. |
| (b) | Includes adjustments in accordance with accounting principles generally accepted in the United States of America and as such, the net asset value for financial reporting purposes and the returns based upon those net asset values may differ from the net asset value and returns for shareholder transactions. Total returns are not annualized for periods less than one year, if applicable, and do not reflect charges assessed in connection with a variable product, which if included would reduce total returns. |
| (c) | Portfolio turnover is calculated at the fund level and is not annualized for periods less than one year, if applicable. |
| (d) | Ratios are annualized and based on average daily net assets (000’s omitted) of $135,126 and $64,290 for Series I and Series II shares, respectively. |
| (e) | Net investment income per share and the ratio of net investment income to average net assets include significant dividends received during the year ended December 31, 2018. Net investment income per share and the ratio of net investment income to average net assets excluding the significant dividends are $0.00 and (0.03)%, $(0.07) and (0.28)%, for Series I and Series II shares, respectively. |
See accompanying Notes to Financial Statements which are an integral part of the financial statements.
Invesco V.I. Health Care Fund
Notes to Financial Statements
June 30, 2019
(Unaudited)
NOTE 1—Significant Accounting Policies
Invesco V.I. Health Care Fund (the “Fund”) is a series portfolio of AIM Variable Insurance Funds (Invesco Variable Insurance Funds) (the “Trust”). The Trust is a Delaware statutory trust registered under the Investment Company Act of 1940, as amended (the “1940 Act”), as an open-end series management investment company. Information presented in these financial statements pertains only to the Fund. Matters affecting the Fund or each class will be voted on exclusively by the shareholders of the Fund or each class. Current Securities and Exchange Commission (“SEC”) guidance, however, requires participating insurance companies offering separate accounts to vote shares proportionally in accordance with the instructions of the contract owners whose investments are funded by shares of each Fund or class.
The Fund’s investment objective is long-term growth of capital.
The Fund currently offers two classes of shares, Series I and Series II, both of which are offered to insurance company separate accounts funding variable annuity contracts and variable life insurance policies (“variable products”).
The Fund is an investment company and accordingly follows the investment company accounting and reporting guidance in accordance with Financial Accounting Standards Board Accounting Standards Codification Topic 946,Financial Services – Investment Companies.
The following is a summary of the significant accounting policies followed by the Fund in the preparation of its financial statements.
| A. | Security Valuations — Securities, including restricted securities, are valued according to the following policy. |
A security listed or traded on an exchange (except convertible securities) is valued at its last sales price or official closing price as of the close of the customary trading session on the exchange where the security is principally traded, or lacking any sales or official closing price on a particular day, the security may be valued at the closing bid price on that day. Securities traded in the over-the-counter market are valued based on prices furnished by independent pricing services or market makers. When such securities are valued by an independent pricing service they may be considered fair valued. Futures contracts are valued at the final settlement price set by an exchange on which they are principally traded. Listed options are valued at the mean between the last bid and asked prices from the exchange on which they are principally traded. Options not listed on an exchange are valued by an independent source at the mean between the last bid and asked prices. For purposes of determining net asset value (“NAV”) per share, futures and option contracts generally are valued 15 minutes after the close of the customary trading session of the New York Stock Exchange (“NYSE”).
Investments in open-end and closed-end registered investment companies that do not trade on an exchange are valued at the end-of-day net asset value per share. Investments in open-end and closed-end registered investment companies that trade on an exchange are valued at the last sales price or official closing price as of the close of the customary trading session on the exchange where the security is principally traded.
Debt obligations (including convertible securities) and unlisted equities are fair valued using an evaluated quote provided by an independent pricing service. Evaluated quotes provided by the pricing service may be determined without exclusive reliance on quoted prices, and may reflect appropriate factors such as institution-size trading in similar groups of securities, developments related to specific securities, dividend rate (for unlisted equities), yield (for debt obligations), quality, type of issue, coupon rate (for debt obligations), maturity (for debt obligations), individual trading characteristics and other market data. Pricing services generally value debt obligations assuming orderly transactions of institutional round lot size, but a fund may hold or transact in the same securities in smaller, odd lot sizes. Odd lots often trade at lower prices than institutional round lots. Debt obligations are subject to interest rate and credit risks. In addition, all debt obligations involve some risk of default with respect to interest and/or principal payments.
Foreign securities’ (including foreign exchange contracts) prices are converted into U.S. dollar amounts using the applicable exchange rates as of the close of the NYSE. If market quotations are available and reliable for foreign exchange-traded equity securities, the securities will be valued at the market quotations. Because trading hours for certain foreign securities end before the close of the NYSE, closing market quotations may become unreliable. If between the time trading ends on a particular security and the close of the customary trading session on the NYSE, events occur that the investment adviser determines are significant and make the closing price unreliable, the Fund may fair value the security. If the event is likely to have affected the closing price of the security, the security will be valued at fair value in good faith using procedures approved by the Board of Trustees. Adjustments to closing prices to reflect fair value may also be based on a screening process of an independent pricing service to indicate the degree of certainty, based on historical data, that the closing price in the principal market where a foreign security trades is not the current value as of the close of the NYSE. Foreign securities’ prices meeting the approved degree of certainty that the price is not reflective of current value will be priced at the indication of fair value from the independent pricing service. Multiple factors may be considered by the independent pricing service in determining adjustments to reflect fair value and may include information relating to sector indices, American Depositary Receipts and domestic and foreign index futures. Foreign securities may have additional risks including exchange rate changes, potential for sharply devalued currencies and high inflation, political and economic upheaval, the relative lack of issuer information, relatively low market liquidity and the potential lack of strict financial and accounting controls and standards.
Securities for which market prices are not provided by any of the above methods may be valued based upon quotes furnished by independent sources. The last bid price may be used to value equity securities. The mean between the last bid and asked prices is used to value debt obligations, including corporate loans.
Securities for which market quotations are not readily available or became unreliable are valued at fair value as determined in good faith by or under the supervision of the Trust’s officers following procedures approved by the Board of Trustees. Issuer specific events, market trends, bid/asked quotes of brokers and information providers and other market data may be reviewed in the course of making a good faith determination of a security’s fair value.
The Fund may invest in securities that are subject to interest rate risk, meaning the risk that the prices will generally fall as interest rates rise and, conversely, the prices will generally rise as interest rates fall. Specific securities differ in their sensitivity to changes in interest rates depending on their individual characteristics. Changes in interest rates may result in increased market volatility, which may affect the value and/or liquidity of certain Fund investments.
Invesco V.I. Health Care Fund
Valuations change in response to many factors including the historical and prospective earnings of the issuer, the value of the issuer’s assets, general economic conditions, interest rates, investor perceptions and market liquidity. Because of the inherent uncertainties of valuation, the values reflected in the financial statements may materially differ from the value received upon actual sale of those investments.
| B. | Securities Transactions and Investment Income — Securities transactions are accounted for on a trade date basis. Realized gains or losses on sales are computed on the basis of specific identification of the securities sold. Interest income (net of withholding tax, if any) is recorded on the accrual basis from settlement date. Dividend income (net of withholding tax, if any) is recorded on the ex-dividend date. |
The Fund may periodically participate in litigation related to Fund investments. As such, the Fund may receive proceeds from litigation settlements. Any proceeds received are included in the Statement of Operations as realized gain (loss) for investments no longer held and as unrealized gain (loss) for investments still held.
Brokerage commissions and mark ups are considered transaction costs and are recorded as an increase to the cost basis of securities purchased and/or a reduction of proceeds on a sale of securities. Such transaction costs are included in the determination of net realized and unrealized gain (loss) from investment securities reported in the Statement of Operations and the Statement of Changes in Net Assets and the net realized and unrealized gains (losses) on securities per share in the Financial Highlights. Transaction costs are included in the calculation of the Fund’s net asset value and, accordingly, they reduce the Fund’s total returns. These transaction costs are not considered operating expenses and are not reflected in net investment income reported in the Statement of Operations and the Statement of Changes in Net Assets, or the net investment income per share and the ratios of expenses and net investment income reported in the Financial Highlights, nor are they limited by any expense limitation arrangements between the Fund and the investment adviser.
The Fund allocates income and realized and unrealized capital gains and losses to a class based on the relative net assets of each class.
| C. | Country Determination — For the purposes of making investment selection decisions and presentation in the Schedule of Investments, the investment adviser may determine the country in which an issuer is located and/or credit risk exposure based on various factors. These factors include the laws of the country under which the issuer is organized, where the issuer maintains a principal office, the country in which the issuer derives 50% or more of its total revenues and the country that has the primary market for the issuer’s securities, as well as other criteria. Among the other criteria that may be evaluated for making this determination are the country in which the issuer maintains 50% or more of its assets, the type of security, financial guarantees and enhancements, the nature of the collateral and the sponsor organization. Country of issuer and/or credit risk exposure has been determined to be the United States of America, unless otherwise noted. |
| D. | Distributions– Distributions from net investment income and net realized capital gain, if any, are generally declared and paid to separate accounts of participating insurance companies annually and recorded on the ex-dividend date. |
| E. | Federal Income Taxes –The Fund intends to comply with the requirements of Subchapter M of the Internal Revenue Code of 1986, as amended (the “Internal Revenue Code”), necessary to qualify as a regulated investment company and to distribute substantially all of the Fund’s taxable earnings to shareholders. As such, the Fund will not be subject to federal income taxes on otherwise taxable income (including net realized capital gain) that is distributed to shareholders. Therefore, no provision for federal income taxes is recorded in the financial statements. |
The Fund recognizes the tax benefits of uncertain tax positions only when the position is more likely than not to be sustained. Management has analyzed the Fund’s uncertain tax positions and concluded that no liability for unrecognized tax benefits should be recorded related to uncertain tax positions. Management is not aware of any tax positions for which it is reasonably possible that the total amounts of unrecognized tax benefits will change materially in the next 12 months.
The Fund files tax returns in the U.S. Federal jurisdiction and certain other jurisdictions. Generally, the Fund is subject to examinations by such taxing authorities for up to three years after the filing of the return for the tax period.
| F. | Expenses– Fees provided for under the Rule 12b-1 plan of a particular class of the Fund and which are directly attributable to that class are charged to the operations of such class. All other expenses are allocated among the classes based on relative net assets. |
| G. | Accounting Estimates – The preparation of financial statements in conformity with accounting principles generally accepted in the United States of America (“GAAP”) requires management to make estimates and assumptions that affect the reported amounts of assets and liabilities at the date of the financial statements and the reported amounts of revenues and expenses during the reporting period including estimates and assumptions related to taxation. Actual results could differ from those estimates by a significant amount. In addition, the Fund monitors for material events or transactions that may occur or become known after the period-end date and before the date the financial statements are released to print. |
| H. | Indemnifications – Under the Trust’s organizational documents, each Trustee, officer, employee or other agent of the Trust is indemnified against certain liabilities that may arise out of the performance of their duties to the Fund. Additionally, in the normal course of business, the Fund enters into contracts, including the Fund’s servicing agreements, that contain a variety of indemnification clauses. The Fund’s maximum exposure under these arrangements is unknown as this would involve future claims that may be made against the Fund that have not yet occurred. The risk of material loss as a result of such indemnification claims is considered remote. |
| I. | Foreign Currency Translations— Foreign currency is valued at the close of the NYSE based on quotations posted by banks and major currency dealers. Portfolio securities and other assets and liabilities denominated in foreign currencies are translated into U.S. dollar amounts at the date of valuation. Purchases and sales of portfolio securities (net of foreign taxes withheld on disposition) and income items denominated in foreign currencies are translated into U.S. dollar amounts on the respective dates of such transactions. The Fund does not separately account for the portion of the results of operations resulting from changes in foreign exchange rates on investments and the fluctuations arising from changes in market prices of securities held. The combined results of changes in foreign exchange rates and the fluctuation of market prices on investments (net of estimated foreign tax withholding) are included with the net realized and unrealized gain or loss from investments in the Statement of Operations. Reported net realized foreign currency gains or losses arise from (1) sales of foreign currencies, (2) currency gains or losses realized between the trade and settlement dates on securities transactions, and (3) the difference between the amounts of dividends, interest, and foreign withholding taxes recorded on the Fund’s books and the U.S. dollar equivalent of the amounts actually received or paid. Net unrealized foreign currency gains and losses arise from changes in the fair values of assets and liabilities, other than investments in securities at fiscal period end, resulting from changes in exchange rates. |
The Fund may invest in foreign securities, which may be subject to foreign taxes on income, gains on investments or currency repatriation, a portion of which may be recoverable. Foreign taxes, if any, are recorded based on the tax regulations and rates that exist in the foreign markets in which the Fund invests and are shown in the Statement of Operations.
Invesco V.I. Health Care Fund
| J. | Forward Foreign Currency Contracts— The Fund may engage in foreign currency transactions either on a spot (i.e. for prompt delivery and settlement) basis, or through forward foreign currency contracts, to manage or minimize currency or exchange rate risk. |
The Fund may also enter into forward foreign currency contracts for the purchase or sale of a security denominated in a foreign currency in order to “lock in” the U.S. dollar price of that security, or the Fund may also enter into forward foreign currency contracts that do not provide for physical settlement of the two currencies, but instead are settled by a single cash payment calculated as the difference between the agreed upon exchange rate and the spot rate at settlement based upon an agreed upon notional amount (non-deliverable forwards). The Fund will set aside liquid assets in an amount equal to the daily mark-to-market obligation for forward foreign currency contracts.
A forward foreign currency contract is an obligation between two parties (“Counterparties”) to purchase or sell a specific currency for an agreed-upon price at a future date. The use of forward foreign currency contracts does not eliminate fluctuations in the price of the underlying securities the Fund owns or intends to acquire but establishes a rate of exchange in advance. Fluctuations in the value of these contracts are measured by the difference in the contract date and reporting date exchange rates and are recorded as unrealized appreciation (depreciation) until the contracts are closed. When the contracts are closed, realized gains (losses) are recorded. Realized and unrealized gains (losses) on the contracts are included in the Statement of Operations. The primary risks associated with forward foreign currency contracts include failure of the Counterparty to meet the terms of the contract and the value of the foreign currency changing unfavorably. These risks may be in excess of the amounts reflected in the Statement of Assets and Liabilities.
| K. | Other Risks - The Fund’s performance is vulnerable to factors affecting the health care industry, including government regulation, obsolescence caused by scientific advances and technological innovations. |
NOTE 2—Advisory Fees and Other Fees Paid to Affiliates
The Trust has entered into a master investment advisory agreement with Invesco Advisers, Inc. (the "Adviser" or "Invesco"). Under the terms of the investment advisory agreement, the Fund accrues daily and pays monthly an advisory fee to the Adviser based on the annual rate of the Fund’s average daily net assets as follows:
| Average Daily Net Assets | Rate |
| First $250 million | 0.75% |
| Next $250 million | 0.74% |
| Next $500 million | 0.73% |
| Next $1.5 billion | 0.72% |
| Next $2.5 billion | 0.71% |
| Next $2.5 billion | 0.70% |
| Next $2.5 billion | 0.69% |
| Over $10 billion | 0.68% |
For the six months ended June 30, 2019, the effective advisory fees incurred by the Fund was 0.75%.
Under the terms of a master sub-advisory agreement between the Adviser and each of Invesco Asset Management Deutschland GmbH, Invesco Asset Management Limited, Invesco Asset Management (Japan) Limited, Invesco Hong Kong Limited, Invesco Senior Secured Management, Inc. and Invesco Canada Ltd. and separate sub-advisory agreements with Invesco Capital Management LLC and Invesco Asset Management (India) Private Limited (collectively, the "Affiliated Sub-Advisers") the Adviser, not the Fund, will pay 40% of the fees paid to the Adviser to any such Affiliated Sub-Adviser(s) that provide(s) discretionary investment management services to the Fund based on the percentage of assets allocated to such Affiliated Sub-Adviser(s).
The Adviser has contractually agreed, through at least June 30, 2020, to waive advisory fees and/or reimburse expenses of all shares to the extent necessary to limit total annual fund operating expenses after fee waiver and/or expense reimbursement (excluding certain items discussed below) of Series I shares to 2.00% and Series II shares to 2.25% of average daily net assets (the “expense limits”). In determining the Adviser’s obligation to waive advisory fees and/or reimburse expenses, the following expenses are not taken into account, and could cause the total annual fund operating expenses after fee waiver and/or expense reimbursement to exceed the numbers reflected above: (1) interest; (2) taxes; (3) dividend expense on short sales; (4) extraordinary or non-routine items, including litigation expenses; and (5) expenses that the Fund has incurred but did not actually pay because of an expense offset arrangement. Unless Invesco continues the fee waiver agreement, it will terminate on June 30, 2020. During its term, the fee waiver agreement cannot be terminated or amended to increase the expense limits or reduce the advisory fee waiver without approval of the Board of Trustees. The Adviser did not waive fees and/or reimburse expenses during the period under these expense limits.
Further, the Adviser has contractually agreed, through at least June 30, 2021, to waive the advisory fee payable by the Fund in an amount equal to 100% of the net advisory fees the Adviser receives from the affiliated money market funds on investments by the Fund of uninvested cash in such affiliated money market funds.
For the six months ended June 30, 2019, the Adviser waived advisory fees of $2,665.
The Trust has entered into a master administrative services agreement with Invesco pursuant to which the Fund has agreed to pay Invesco a fee for costs incurred in providing accounting services and fund administrative services to the Fund and to reimburse Invesco for fees paid to insurance companies that have agreed to provide certain administrative services to the Fund. These administrative services provided by the insurance companies may include, among other things: maintenance of master accounts with the Fund; tracking, recording and transmitting net purchase and redemption orders for Fund shares; maintaining and preserving records related to the purchase, redemption and other account activity of variable product owners; distributing copies of Fund documents such as prospectuses, proxy materials and periodic reports, to variable product owners, and responding to inquiries from variable product owners about the Fund. Pursuant to such agreement, for the six months ended June 30, 2019, Invesco was paid $13,963 for accounting and fund administrative services and was reimbursed $148,184 for fees paid to insurance companies. Also, Invesco has entered into a sub-administration agreement whereby State Street Bank and Trust Company (“SSB”) serves as custodian and fund accountant and provides certain administrative services to the Fund.
Invesco V.I. Health Care Fund
The Trust has entered into a transfer agency and service agreement with Invesco Investment Services, Inc. (“IIS”) pursuant to which the Fund has agreed to pay IIS a fee for providing transfer agency and shareholder services to the Fund and reimburse IIS for certain expenses incurred by IIS in the course of providing such services. For the six months ended June 30, 2019, expenses incurred under the agreement are shown in the Statement of Operations asTransfer agent fees.
The Trust has entered into a master distribution agreement with Invesco Distributors, Inc. (“IDI”) to serve as the distributor for the Fund. The Trust has adopted a plan pursuant to Rule 12b-1 under the 1940 Act with respect to the Fund’s Series II shares (the “Plan”). The Fund, pursuant to the Plan, pays IDI compensation at the annual rate of 0.25% of the Fund’s average daily net assets of Series II shares. The fees are accrued daily and paid monthly. Of the Plan payments, up to 0.25% of the average daily net assets of the Series II shares may be paid to insurance companies who furnish continuing personal shareholder services to customers who purchase and own Series II shares of the Fund. For the six months ended June 30, 2019, expenses incurred under the Plan are detailed in the Statement of Operations asDistribution fees.
Certain officers and trustees of the Trust are officers and directors of the Adviser, IIS and/or IDI.
NOTE 3—Additional Valuation Information
GAAP defines fair value as the price that would be received to sell an asset or paid to transfer a liability in an orderly transaction between market participants at the measurement date, under current market conditions. GAAP establishes a hierarchy that prioritizes the inputs to valuation methods, giving the highest priority to readily available unadjusted quoted prices in an active market for identical assets (Level 1) and the lowest priority to significant unobservable inputs (Level 3), generally when market prices are not readily available or are unreliable. Based on the valuation inputs, the securities or other investments are tiered into one of three levels. Changes in valuation methods may result in transfers in or out of an investment’s assigned level:
Level 1 – Prices are determined using quoted prices in an active market for identical assets.
Level 2 – Prices are determined using other significant observable inputs. Observable inputs are inputs that other market participants may use in pricing a security. These may include quoted prices for similar securities, interest rates, prepayment speeds, credit risk, yield curves, loss severities, default rates, discount rates, volatilities and others.
Level 3 – Prices are determined using significant unobservable inputs. In situations where quoted prices or observable inputs are unavailable (for example, when there is little or no market activity for an investment at the end of the period), unobservable inputs may be used. Unobservable inputs reflect the Fund’s own assumptions about the factors market participants would use in determining fair value of the securities or instruments and would be based on the best available information.
The following is a summary of the tiered valuation input levels, as of June 30, 2019. The level assigned to the securities valuations may not be an indication of the risk or liquidity associated with investing in those securities. Because of the inherent uncertainties of valuation, the values reflected in the financial statements may materially differ from the value received upon actual sale of those investments.
| | Level 1 | Level 2 | Level 3 | Total |
| Investments in Securities | | | | |
| Common Stocks & Other Equity Interests | $184,437,212 | $14,841,080 | $— | $199,278,292 |
| Money Market Funds | 1,993,834 | — | — | 1,993,834 |
| Total Investments | $186,431,046 | $14,841,080 | $— | $201,272,126 |
NOTE 4—Trustees’ and Officers’ Fees and Benefits
Trustees’ and Officers’ Fees and Benefits include amounts accrued by the Fund to pay remuneration to certain Trustees and Officers of the Fund. Trustees have the option to defer compensation payable by the Fund, and Trustees’ and Officers’ Fees and Benefits also include amounts accrued by the Fund to fund such deferred compensation amounts. Those Trustees who defer compensation have the option to select various Invesco Funds in which their deferral accounts shall be deemed to be invested. Finally, certain current Trustees were eligible to participate in a retirement plan that provided for benefits to be paid upon retirement to Trustees over a period of time based on the number of years of service. The Fund may have certain former Trustees who also participate in a retirement plan and receive benefits under such plan.Trustees’ and Officers’ Fees and Benefits include amounts accrued by the Fund to fund such retirement benefits. Obligations under the deferred compensation and retirement plans represent unsecured claims against the general assets of the Fund.
NOTE 5—Cash Balances
The Fund is permitted to temporarily carry a negative or overdrawn balance in its account with SSB, the custodian bank. Such balances, if any at period-end, are shown in the Statement of Assets and Liabilities under the payable captionAmount due custodian. To compensate the custodian bank for such overdrafts, the overdrawn Fund may either (1) leave funds as a compensating balance in the account so the custodian bank can be compensated by earning the additional interest; or (2) compensate by paying the custodian bank at a rate agreed upon by the custodian bank and Invesco, not to exceed the contractually agreed upon rate.
NOTE 6—Tax Information
The amount and character of income and gains to be distributed are determined in accordance with income tax regulations, which may differ from GAAP. Reclassifications are made to the Fund’s capital accounts to reflect income and gains available for distribution (or available capital loss carryforward) under income tax regulations. The tax character of distributions paid during the year and the tax components of net assets will be reported at the Fund’s fiscal year-end.
Capital loss carryforward is calculated and reported as of a specific date. Results of transactions and other activity after that date may affect the amount of capital loss carryforward actually available for the Fund to utilize. Capital losses generated in years beginning after December 22, 2010
Invesco V.I. Health Care Fund
can be carried forward for an unlimited period, whereas previous losses expire in eight tax years. Capital losses with an expiration period may not be used to offset capital gains until all net capital losses without an expiration date have been utilized. Capital loss carryforwards with no expiration date will retain their character as either short-term or long-term capital losses instead of as short-term capital losses as under prior law. The ability to utilize capital loss carryforwards in the future may be limited under the Internal Revenue Code and related regulations based on the results of future transactions.
The Fund did not have a capital loss carryforward as of December 31, 2018.
NOTE 7—Investment Transactions
The aggregate amount of investment securities (other than short-term securities, U.S. Treasury obligations and money market funds, if any) purchased and sold by the Fund during the six months ended June 30, 2019 was $11,267,650 and $26,021,497, respectively. Cost of investments, including any derivatives, on a tax basis includes the adjustments for financial reporting purposes as of the most recently completed federal income tax reporting period-end.
| Unrealized Appreciation (Depreciation) of Investments on a Tax Basis |
| Aggregate unrealized appreciation of investments | $53,170,687 |
| Aggregate unrealized (depreciation) of investments | (7,428,838) |
| Net unrealized appreciation of investments | $45,741,849 |
Cost of investments for tax purposes is $155,530,277.
NOTE 8—Share Information
| | Summary of Share Activity |
| | Six months ended
June 30, 2019(a) | | Year ended
December 31, 2018 |
| | Shares | Amount | | Shares | Amount |
| Sold: | | | | | |
| Series I | 273,508 | $6,993,540 | | 682,421 | $18,324,767 |
| Series II | 108,374 | 2,614,891 | | 204,677 | 5,112,391 |
| Issued as reinvestment of dividends: | | | | | |
| Series I | — | — | | 689,156 | 18,007,655 |
| Series II | — | — | | 347,815 | 8,604,944 |
| Reacquired: | | | | | |
| Series I | (720,821) | (18,168,819) | | (1,292,416) | (34,415,503) |
| Series II | (251,302) | (6,061,614) | | (492,468) | (12,523,291) |
| Net increase (decrease) in share activity | (590,241) | $(14,622,002) | | 139,185 | $(3,110,963) |
| (a) | There are entities that are record owners of more than 5% of the outstanding shares of the Fund and in the aggregate own 52% of the outstanding shares of the Fund. The Fund and the Fund’s principal underwriter or adviser, are parties to participation agreements with these entities whereby these entities sell units of interest in separate accounts funding variable products that are invested in the Fund. The Fund, Invesco and/or Invesco affiliates may make payments to these entities, which are considered to be related to the Fund, for providing services to the Fund, Invesco and/or Invesco affiliates including but not limited to services such as, securities brokerage, third party record keeping and account servicing and administrative services. The Fund has no knowledge as to whether all or any portion of the shares owned of record by these entities are also owned beneficially. |
Invesco V.I. Health Care Fund
Calculating your ongoing Fund expenses
Example
As a shareholder of the Fund, you incur ongoing costs, including management fees; distribution and/or service fees (12b-1); and other Fund expenses. This example is intended to help you understand your ongoing costs (in dollars) of investing in the Fund and to compare these costs with ongoing costs of investing in other mutual funds. The example is based on an investment of $1,000 invested at the beginning of the period and held for the entire period January 1, 2019 through June 30, 2019.
The actual and hypothetical expenses in the examples below do not represent the effect of any fees or other expenses assessed in connection with a variable product; if they did, the expenses shown would be higher while the ending account values shown would be lower.
Actual expenses
The table below provides information about actual account values and actual expenses. You may use the information in this table, together with the amount you invested, to estimate the expenses that you paid over the period. Simply divide your account value by $1,000 (for example, an $8,600 account value divided by $1,000 = 8.6), then multiply the result by the number in the table under the heading entitled “Actual Expenses Paid During Period” to estimate the expenses you paid on your account during this period.
Hypothetical example for comparison purposes
The table below also provides information about hypothetical account values and hypothetical expenses based on the Fund’s actual expense ratio and an assumed rate of return of 5% per year before expenses, which is not the Fund’s actual return.
The hypothetical account values and expenses may not be used to estimate the actual ending account balance or expenses you paid for the period. You may use this information to compare the ongoing costs of investing in the Fund and other funds. To do so, compare this 5% hypothetical example with the 5% hypothetical examples that appear in the shareholder reports of the other funds.
Please note that the expenses shown in the table are meant to highlight your ongoing costs. Therefore, the hypothetical information is useful in comparing ongoing costs, and will not help you determine the relative total costs of owning different funds.
| | Beginning
Account Value (01/01/19) | ACTUAL | HYPOTHETICAL
(5% annual return before
expenses) | Annualized
Expense
Ratio |
Ending
Account Value
(06/30/19)1 | Expenses
Paid During
Period2 | Ending
Account Value
(06/30/19) | Expenses
Paid During
Period2 |
| Series I | $1,000.00 | $1,154.60 | $5.13 | $1,020.03 | $4.81 | 0.96% |
| Series II | 1,000.00 | 1,153.60 | 6.46 | 1,018.79 | 6.06 | 1.21 |
| 1 | The actual ending account value is based on the actual total return of the Fund for the period January 1, 2019 through June 30, 2019, after actual expenses and will differ from the hypothetical ending account value which is based on the Fund’s expense ratio and a hypothetical annual return of 5% before expenses. |
| 2 | Expenses are equal to the Fund’s annualized expense ratio as indicated above multiplied by the average account value over the period, multiplied by 181/365 to reflect the most recent fiscal half year. |
Invesco V.I. Health Care Fund
Approval of Investment Advisory andSub-Advisory Contracts
At meetings held on June 10, 2019, the Board of Trustees (the Board or the Trustees) of AIM Variable Insurance Funds (Invesco Variable Insurance Funds) as a whole, and the independent Trustees, who comprise over 75% of the Board, voting separately, approved the continuance of the Invesco V.I. Health Care Fund’s (the Fund) Master Investment Advisory Agreement with Invesco Advisers, Inc. (Invesco Advisers and the investment advisory agreement) and the Master IntergroupSub-Advisory Contract for Mutual Funds with Invesco Asset Management Deutschland GmbH, Invesco Asset Management Limited, Invesco Asset Management (Japan) Limited, Invesco Hong Kong Limited, Invesco Senior Secured Management, Inc. and Invesco Canada Ltd. and separatesub-advisory contracts with Invesco Capital Management LLC and Invesco Asset Management (India) Private Limited (collectively, the AffiliatedSub-Advisers and thesub-advisory contracts) for another year, effective July 1, 2019. After evaluating the factors discussed below, among others, the Board approved the renewal of the Fund’s investment advisory agreement and thesub-advisory contracts and determined that the compensation payable by the Fund to Invesco Advisers and by Invesco Advisers to the AffiliatedSub-Advisers is fair and reasonable.
The Board’s Evaluation Process
The Board’s Investments Committee has established threeSub-Committees, which meet throughout the year to review the performance of funds advised by Invesco Advisers (the Invesco Funds). As part of a regularly scheduled basis ofin-person Board meetings, theSub-Committees meet with portfolio managers for their assigned Invesco Funds and other members of management to review detailed information about investment performance and portfolio attributes of these funds. The Board took into account evaluations and reports that it received from the Investments Committee andSub-Committees, as well as the information provided to such committees and the Board throughout the year, in considering whether to approve each Invesco Fund’s investment advisory agreement andsub-advisory contracts.
As part of the contract renewal process, the Board reviews and considers information provided in response to detailed requests for information submitted to management by the independent Trustees with assistance from legal counsel to the independent Trustees. The Board receives comparative investment performance and fee data regarding the Invesco Funds prepared by Invesco Advisers and Broadridge Financial Solutions, Inc. (Broadridge), an independent mutual fund data provider. The Board also receives an independent written evaluation from the Senior Officer, an officer of the Invesco Funds who reports directly to the
independent Trustees. The Senior Officer’s evaluation is prepared as part of his responsibility to manage the process by which the Invesco Funds’ proposed management fees are negotiated during the annual contract renewal process to ensure they are negotiated in a manner that is at arms’ length and reasonable. In addition to meetings with Invesco Advisers and fund counsel throughout the year, the independent Trustees also discuss the continuance of the investment advisory agreement andsub-advisory contracts in separate sessions with the Senior Officer and with independent legal counsel.
The discussion below is a summary of the Senior Officer’s independent written evaluation with respect to the Fund’s investment advisory agreement, as well as a discussion of the material factors and related conclusions that formed the basis for the Board’s approval of the Fund’s investment advisory agreement andsub-advisory contracts. The Trustees’ review and conclusions are based on the comprehensive consideration of all information presented to them during the course of the year and in prior years and are not the result of any single determinative factor. Moreover, one Trustee may have weighed a particular piece of information or factor differently than another Trustee. This information is current as of June 10, 2019.
Factors and Conclusions and Summary of Independent Written Fee Evaluation
| A. | Nature, Extent and Quality of Services Provided by Invesco Advisers and the AffiliatedSub-Advisers |
The Board reviewed the nature, extent and quality of the advisory services provided to the Fund by Invesco Advisers under the Fund’s investment advisory agreement, and the credentials and experience of the officers and employees of Invesco Advisers who provide these services, including the Fund’s portfolio manager(s). The Board’s review included consideration of Invesco Advisers’ investment process oversight and structure, credit analysis and investment risk management. The Board also considerednon-advisory services that Invesco Advisers and its affiliates provide to the Invesco Funds such as various back office support functions, third party oversight, internal audit, valuation, portfolio trading and legal and compliance. The Board also received and reviewed information about Invesco Advisers’ role as administrator of the Invesco Funds’ liquidity risk management program. The Board also reviewed and considered the benefits to shareholders of investing in a fund that is part of the Invesco family of funds under the umbrella of Invesco Ltd., Invesco Advisers’ parent company, and noted Invesco Ltd.’s depth and experience in conducting an investment management business, as well as its
commitment of financial and other resources to such business. The Board reviewed and considered information about the resources that Invesco Advisers intends to continue to commit to managing the Invesco family of funds following Invesco Ltd.’s acquisition of OppenheimerFunds, Inc. and its subsidiaries. The Board concluded that the nature, extent and quality of the services provided to the Fund by Invesco Advisers are appropriate and satisfactory.
The Board reviewed the services that may be provided by the AffiliatedSub-Advisers under thesub-advisory contracts and the credentials and experience of the officers and employees of the AffiliatedSub-Advisers who provide these services. The Board noted the AffiliatedSub-Advisers’ expertise with respect to certain asset classes and that the AffiliatedSub-Advisers have offices and personnel that are located in financial centers around the world. As a result, the Board noted that the AffiliatedSub-Advisers can provide research and investment analysis on the markets and economies of various countries in which the Fund may invest, make recommendations regarding securities and assist with security trades. The Board concluded that thesub-advisory contracts may benefit the Fund and its shareholders by permitting Invesco Advisers to use the resources and talents of the AffiliatedSub-Advisers in managing the Fund. The Board concluded that the nature, extent and quality of the services that may be provided by the AffiliatedSub-Advisers are appropriate and satisfactory.
| B. | Fund Investment Performance |
The Board considered Fund investment performance as a relevant factor in considering whether to approve the investment advisory agreement. The Board did not view Fund investment performance as a relevant factor in considering whether to approve thesub-advisory contracts for the Fund, as no AffiliatedSub-Adviser currently manages assets of the Fund.
The Board compared the Fund’s investment performance over multiple time periods ending December 31, 2018 to the performance of funds in the Broadridge performance universe and against the Lipper Variable Underlying Funds Health/Biotechnology Funds Index. The Board noted that performance of Series I shares of the Fund was in the third quintile of its performance universe for the one year period, fourth quintile for the three year period and fifth quintile for the five year period (the first quintile being the best performing funds and the fifth quintile being the worst performing funds). The Board noted that performance of Series I shares of the Fund was below the performance of the Index for the one, three and five year periods. The Board noted that the Fund’s underweight and overweight exposure to and
Invesco V.I. Health Care Fund
security selection in certain health care industries negatively impacted performance. The Trustees also reviewed more recent Fund performance and this review did not change their conclusions.
| C. | Advisory andSub-Advisory Fees and Fund Expenses |
The Board compared the Fund’s contractual management fee rate to the contractual management fee rates of funds in the Fund’s Broadridge expense group. The Board noted that the contractual management fee rate for Series I shares of the Fund was below the median contractual management fee rate of funds in its expense group. The Board noted that the term “contractual management fee” for funds in the expense group may include both advisory and certainnon-portfolio management administrative services fees, but that Broadridge does not provide information on a fund by fund basis as to what is included. The Board also reviewed the methodology used by Broadridge in providing expense group information, which includes using each fund’s contractual management fee schedule (including any applicable breakpoints) as reported in the most recent prospectus or statement of additional information for each fund in the expense group. The Board also considered comparative information regarding the Fund’s total expense ratio and its various components.
The Board noted that Invesco Advisers has contractually agreed to waive fees and/or limit expenses of the Fund for the term disclosed in the Fund’s registration statement in an amount necessary to limit total annual operating expenses to a specified percentage of average daily net assets for each class of the Fund.
The Board also considered the fees charged by Invesco Advisers and the AffiliatedSub-Advisers to other similarly managed client accounts. The Board noted that Invesco Advisers or the AffiliatedSub-Advisers may charge lower fees to large institutional clients. Invesco Advisers reviewed with the Board differences in the scope of services it provides to the Invesco Funds relative to certain other types of client accounts, including management of cash flows as a result of redemptions and purchases, necessary infrastructure such as officers, office space, technology, legal and distribution, oversight of service providers, costs and business risks associated with launching new funds and sponsoring and maintaining the product line, preparation of annual registration statement updates and financial information and compliance with federal and state laws and regulations.
The Board also considered the services that may be provided by the AffiliatedSub-Advisers pursuant to thesub-advisory contracts, as well as the fees payable by Invesco Advisers to the AffiliatedSub-Advisers pursuant to thesub-advisory contracts.
| D. | Economies of Scale and Breakpoints |
The Board considered the extent to which there may be economies of scale in the provision of
advisory services to the Fund. The Board considered Invesco’s reinvestment in its business, including investments in business infrastructure and cybersecurity. The Board also considered that the Fund may benefit from economies of scale through contractual breakpoints in the Fund’s advisory fee schedule, which generally operate to reduce the Fund’s expense ratio as it grows in size. The Board noted that the Fund shares directly in economies of scale through lower fees charged by third party service providers based on the combined size of the Invesco Funds. The Board noted that the Fund may also benefit from economies of scale through initial fee setting, fee waivers and expense reimbursements.
| E. | Profitability and Financial Resources |
The Board reviewed information from Invesco Advisers concerning the costs of the advisory and other services that Invesco Advisers and its affiliates provide to the Fund and the Invesco Funds and the profitability of Invesco Advisers and its affiliates in providing these services. The Board considered the methodology used for calculating profitability and noted the periodic review of such methodology by an independent consultant. The Board noted that Invesco Advisers continues to operate at a net profit from services Invesco Advisers and its affiliates provide to the Invesco Funds and the Fund. The Board did not deem the level of profits realized by Invesco Advisers and its affiliates from providing services to the Fund to be excessive given the nature, extent and quality of the services provided. The Board received information from Invesco Advisers demonstrating that Invesco Advisers and the AffiliatedSub-Advisers are financially sound and have the resources necessary to perform their obligations under the investment advisory agreement andsub-advisory contracts.
| F. | Collateral Benefits to Invesco Advisers and its Affiliates |
The Board considered various other benefits received by Invesco Advisers and its affiliates from the relationship with the Fund, including the fees received for providing administrative, transfer agency and distribution services to the Fund. The Board considered comparative information regarding fees charged for these services, including information provided by Broadridge and other independent sources. The Board considered the performance of Invesco Advisers and its affiliates in providing these services and the organizational structure employed to provide these services. The Board also considered that these services are provided to the Fund pursuant to written contracts that are reviewed and approved on an annual basis by the Board; and that the services are required for the operation of the Fund.
The Board considered the benefits realized by Invesco Advisers and the AffiliatedSub-Advisers as a result of portfolio brokerage transactions executed through “soft dollar” arrangements. The Board noted that soft dollar arrangements may result in the Fund bearing costs to purchase research that may be used by Invesco
Advisers or the AffiliatedSub-Advisers with other clients and may reduce Invesco Advisers’ or the AffiliatedSub-Advisers’ expenses. The Board also considered that it receives periodic reports from Invesco representing that these arrangements are consistent with regulatory requirements. The Board did not deem the soft dollar arrangements to be inappropriate.
The Board considered that the Fund’s uninvested cash and cash collateral from any securities lending arrangements may be invested in money market funds advised by Invesco Advisers pursuant to procedures approved by the Board. The Board considered information regarding the returns of the affiliated money market funds relative to comparable overnight investments, as well as the costs to the Fund of such investments. The Board noted that Invesco Advisers receives advisory fees from these affiliated money market funds attributable to such investments, although Invesco Advisers has contractually agreed to waive through varying periods the advisory fees payable by the Invesco Funds with respect to certain investments in the affiliated money market funds. The waiver is in an amount equal to 100% of the net advisory fee Invesco Advisers receives from the affiliated money market funds with respect to the Fund’s investment in the affiliated money market funds of uninvested cash, but not cash collateral. The Board concluded that the amount of advisory fees received by Invesco Advisers from the Fund’s investment of cash collateral from any securities lending arrangements in the affiliated money market funds is fair and reasonable.
The Board also considered that an affiliated broker may receive commissions for executing certain trades for the Fund. Invesco Advisers and the AffiliatedSub-Advisers may use the affiliated broker to, among other things, control order routing and minimize information leakage, and the Board was advised that such trades are executed in compliance with rules under the federal securities laws and consistent with best execution obligations.
Invesco V.I. Health Care Fund
| Semiannual Report to Shareholders | June 30, 2019 |
Invesco V.I. High Yield Fund
Beginning on January 1, 2021, as permitted by regulations adopted by the Securities and Exchange Commission, the insurance company that offers your variable annuity or variable life insurance contract may no longer send you paper copies of the Fund’s shareholder reports by mail, unless you specifically request paper copies of the reports from the insurance company or your financial intermediary. Instead of delivering paper copies of the report, the insurance company may choose to make the reports available on a website, and will notify you by mail each time a report is posted and provide you with a website link to access the report. Instructions for requesting paper copies will be provided by your insurance company.
If the insurance company offers electronic delivery, you may elect to receive shareholder reports and other communications about the Fund electronically by following the instructions provided by the insurance company or by contacting your financial intermediary. If you already elected to receive shareholder reports electronically, you will not be affected by this change and you need not take any action.
You may elect to receive all future reports in paper free of charge from the insurance company. You can inform the insurance company or your financial intermediary that you wish to continue receiving paper copies of your shareholder reports by following the instructions provided by the insurance company or by contacting your financial intermediary. Your election to receive reports in paper will apply to all portfolio companies available under your contract with the insurance company.
The Fund provides a complete list of its holdings four times in each fiscal year, at the quarter-ends. For the second and fourth quarters, the lists appear in the Fund’s semiannual and annual reports to shareholders. For the first and third quarters, the Fund files the lists with the Securities and Exchange Commission (SEC) on Form N-Q (or any successor Form). The Fund’s Form N-Q (or any successor Form) filings are available on the SEC website, sec.gov. The SEC file numbers for the Fund are 811-07452 and 033-57340. The Fund’s most recent portfolio holdings, as filed on Form N-Q (or any successor Form), have also been made available to insurance companies issuing variable annuity contracts and variable life insurance policies (“variable products”) that invest in the Fund.
A description of the policies and procedures that the Fund uses to determine how to vote proxies relating to portfolio securities is available without charge, upon request, from our Client Services department at 800 959 4246 or at invesco.com/proxyguidelines. The information is also available on the SEC website, sec.gov.
Information regarding how the Fund voted proxies related to its portfolio securities during the most recent 12-month period ended June 30 is available at invesco.com/proxysearch. The information is also available on the SEC website, sec.gov.
Invesco Advisers, Inc. is an investment adviser; it provides investment advisory services to individual and institutional clients and does not sell securities. Invesco Distributors, Inc. is the US distributor for Invesco Ltd.’s retail mutual funds, exchange-traded funds and institutional money market funds. Both are wholly owned, indirect subsidiaries of Invesco Ltd.
This report must be accompanied or preceded by a currently effective Fund prospectus and variable product prospectus, which contain more complete information, including sales charges and expenses. Investors should read each carefully before investing.
NOT FDIC INSURED | MAY LOSE VALUE | NO BANK GUARANTEE
| Invesco Distributors, Inc. | VIHYI-SAR-1 |
Performance summary
Fund vs. Indexes
Cumulative total returns, December 31, 2018 to June 30, 2019, excluding variable product issuer charges. If variable product issuer charges were included, returns would be lower.
| Series I Shares | 9.88% |
| Series II Shares | 9.76 |
| Bloomberg Barclays U.S. Aggregate Bond Index▼ (Broad Market Index) | 6.11 |
| Bloomberg Barclays U.S. Corporate High Yield 2% Issuer Cap Index▼ (Style-Specific Index) | 9.94 |
Lipper VUF High Yield Bond Funds Classification Average■
(Peer Group) | 9.14 |
| Source(s):▼FactSet Research Systems Inc.;■ Lipper Inc. |
TheBloomberg Barclays U.S. Aggregate Bond Index is an unmanaged index considered representative of the US investment grade, fixed-rate bond market.
TheBloomberg Barclays U.S. Corporate High Yield 2% Issuer Cap Index is an unmanaged index considered representative of the US high-yield, fixed-rate corporate bond market. Index weights for each issuer are capped at 2%.
TheLipper VUF High Yield Bond Funds Classification Averagerepresents an average of all of the variable insurance underlying funds in the Lipper High Yield Bond Funds classification.
The Fund is not managed to track the performance of any particular index, including the indexes described here, and consequently, the performance of the Fund may deviate significantly from the performance of the indexes.
A direct investment cannot be made in an index. Unless otherwise indicated, index results include reinvested dividends, and they do not reflect sales charges. Performance of the peer group, if applicable, reflects fund expenses; performance of a market index does not.
| Average Annual Total Returns |
| As of 6/30/19 |
| Series I Shares | |
| Inception (5/1/98) | 4.32% |
| 10 Years | 8.01 |
| 5 Years | 3.28 |
| 1 Year | 6.97 |
| Series II Shares | |
| Inception (3/26/02) | 6.61% |
| 10 Years | 7.76 |
| 5 Years | 3.05 |
| 1 Year | 6.78 |
The performance of the Fund’s Series I and Series II share classes will differ primarily due to different class expenses.
The performance data quoted represent past performance and cannot guarantee comparable future results; current performance may be lower or higher. Please contact your variable product issuer or financial adviser for the most recent month-end variable product performance. Performance figures reflect Fund expenses, reinvested distributions and changes in net asset value. Performance figures do not reflect deduction of taxes a shareholder would pay on Fund distributions or sale of Fund shares. Investment return and principal value will fluctuate so that you may have a gain or loss when you sell shares.
The total annual Fund operating expense ratio set forth in the most recent Fund prospectus as of the date of this report for Series I and Series II shares was 1.18% and 1.43%, respectively. The expense ratios presented above may vary from the expense ratios presented in other sections of this report that are based on expenses incurred during the period covered by this report.
Invesco V.I. High Yield Fund, a series portfolio of AIM Variable Insurance Funds (Invesco Variable Insurance Funds), is currently offered through insurance companies issuing variable products. You cannot purchase shares of the Fund directly. Performance figures given represent the Fund and are not intended to reflect actual variable product values. They do not reflect
sales charges, expenses and fees assessed in connection with a variable product. Sales charges, expenses and fees, which are determined by the variable product issuers, will vary and will lower the total return.
The most recent month-end performance data at the Fund level, excluding variable product charges, is available at 800 451 4246. As mentioned above, for the most recent month-end performance including variable product charges, please contact your variable product issuer or financial adviser.
Fund performance reflects any applicable fee waivers and/or expense reimbursements. Had the adviser not waived fees and/or reimbursed expenses currently or in the past, returns would have been lower. See current prospectus for more information.
Invesco V.I. High Yield Fund
Schedule of Investments(a)
June 30, 2019
(Unaudited)
| | Principal
Amount | Value |
| U.S. Dollar Denominated Bonds & Notes–94.39% |
| Aerospace & Defense–3.51% |
| Bombardier, Inc. (Canada), | | |
| 8.75%, 12/01/2021(b) | | $170,000 | $185,938 |
| 5.75%, 03/15/2022(b) | | 215,000 | 219,031 |
| 6.13%, 01/15/2023(b) | | 428,000 | 434,955 |
| 7.50%, 03/15/2025(b) | | 982,000 | 988,432 |
| 7.88%, 04/15/2027(b) | | 161,000 | 161,604 |
| TransDigm UK Holdings PLC, 6.88%, 05/15/2026 | | 600,000 | 608,625 |
| TransDigm, Inc., | | |
| 6.50%, 07/15/2024 | | 157,000 | 159,551 |
| 6.50%, 05/15/2025 | | 574,000 | 582,610 |
| 6.25%, 03/15/2026(b) | | 871,000 | 913,461 |
| Triumph Group, Inc., 7.75%, 08/15/2025 | | 819,000 | 794,430 |
| | | | 5,048,637 |
| Agricultural & Farm Machinery–0.72% |
| Titan International, Inc., 6.50%, 11/30/2023 | | 1,181,000 | 1,030,423 |
| Agricultural Products–0.31% |
| Kernel Holding S.A. (Ukraine), REGS, 8.75%, 01/31/2022(b) | | 418,000 | 442,162 |
| Airlines–0.30% |
| Air Canada (Canada), 7.75%, 04/15/2021(b) | | 400,000 | 433,200 |
| Alternative Carriers–1.27% |
| CenturyLink, Inc., | | |
| Series S, 6.45%, 06/15/2021 | | 635,000 | 673,100 |
| Series Y, 7.50%, 04/01/2024 | | 696,000 | 771,690 |
| Level 3 Financing, Inc., 5.38%, 05/01/2025 | | 365,000 | 377,775 |
| | | | 1,822,565 |
| Apparel Retail–0.92% |
| L Brands, Inc., | | |
| 5.63%, 02/15/2022 | | 473,000 | 496,111 |
| 6.88%, 11/01/2035 | | 404,000 | 361,321 |
| 6.75%, 07/01/2036 | | 101,000 | 87,365 |
| Michaels Stores, Inc., 8.00%, 07/15/2027(b) | | 372,000 | 371,680 |
| | | | 1,316,477 |
| Apparel, Accessories & Luxury Goods–0.23% |
| William Carter Co. (The), 5.63%, 03/15/2027(b) | | 317,000 | 333,246 |
| | Principal
Amount | Value |
| Asset Management & Custody Banks–0.33% |
| Prime Security Services Borrower LLC/Prime Finance, Inc., 9.25%, 05/15/2023(b) | | $457,000 | $480,798 |
| Auto Parts & Equipment–0.58% |
| Dana, Inc., 5.50%, 12/15/2024 | | 498,000 | 512,940 |
| Flexi-Van Leasing, Inc., 10.00%, 02/15/2023(b) | | 346,000 | 322,645 |
| | | | 835,585 |
| Automobile Manufacturers–1.15% |
| Ford Motor Credit Co. LLC, 5.60%, 01/07/2022 | | 514,000 | 544,445 |
| J.B. Poindexter & Co., Inc., 7.13%, 04/15/2026(b) | | 1,086,000 | 1,113,150 |
| Motors Liquidation Co., 0.00%, 07/15/2033(c)(d) | | 1,060,000 | 0 |
| | | | 1,657,595 |
| Automotive Retail–1.39% |
| Lithia Motors, Inc., 5.25%, 08/01/2025(b) | | 248,000 | 256,370 |
| Murphy Oil USA, Inc., 5.63%, 05/01/2027 | | 722,000 | 754,490 |
| Penske Automotive Group, Inc., 5.50%, 05/15/2026 | | 942,000 | 985,567 |
| | | | 1,996,427 |
| Broadcasting–1.79% |
| AMC Networks, Inc., | | |
| 5.00%, 04/01/2024 | | 750,000 | 771,563 |
| 4.75%, 08/01/2025 | | 127,000 | 129,381 |
| Clear Channel Worldwide Holdings, Inc., 9.25%, 02/15/2024(b) | | 328,000 | 356,700 |
| Gray Television, Inc., 7.00%, 05/15/2027(b) | | 264,000 | 287,100 |
| Nexstar Broadcasting, Inc., 5.63%, 08/01/2024(b) | | 540,000 | 560,768 |
| TV Azteca, S.A.B. de C.V. (Mexico), REGS, 8.25%, 08/09/2024(b) | | 470,000 | 465,187 |
| | | | 2,570,699 |
| Cable & Satellite–8.47% |
| Altice Financing S.A. (Luxembourg), | | |
| 6.63%, 02/15/2023(b) | | 600,000 | 616,500 |
| 7.50%, 05/15/2026(b) | | 430,000 | 433,268 |
| Altice Luxembourg S.A. (Luxembourg), | | |
| 7.75%, 05/15/2022(b) | | 208,000 | 211,900 |
| 10.50%, 05/15/2027(b) | | 410,000 | 422,300 |
| CCO Holdings LLC/CCO Holdings Capital Corp., | | |
| 5.75%, 01/15/2024 | | 40,000 | 40,995 |
| 5.75%, 02/15/2026(b) | | 1,545,000 | 1,624,181 |
See accompanying Notes to Financial Statements which are an integral part of the financial statements.
Invesco V.I. High Yield Fund
| | Principal
Amount | Value |
| Cable & Satellite–(continued) |
| CSC Holdings, LLC, | | |
| 10.88%, 10/15/2025(b) | | $445,000 | $511,196 |
| 6.50%, 02/01/2029(b) | | 1,395,000 | 1,524,909 |
| DISH DBS Corp., | | |
| 5.88%, 11/15/2024 | | 1,446,000 | 1,373,700 |
| 7.75%, 07/01/2026 | | 163,000 | 160,148 |
| Hughes Satellite Systems Corp., 7.63%, 06/15/2021 | | 942,000 | 1,010,295 |
| Intelsat Jackson Holdings S.A. (Luxembourg), | | |
| 5.50%, 08/01/2023 | | 1,563,000 | 1,434,052 |
| 8.50%, 10/15/2024(b) | | 501,000 | 498,495 |
| Telenet Finance Luxembourg Notes S.a r.l. (Belgium), 5.50%, 03/01/2028(b) | | 400,000 | 408,000 |
| UPCB Finance IV Ltd. (Netherlands), 5.38%, 01/15/2025(b) | | 450,000 | 463,640 |
| Virgin Media Finance PLC (United Kingdom), 6.00%, 10/15/2024(b) | | 450,000 | 468,000 |
| Virgin Media Secured Finance PLC (United Kingdom), 5.50%, 08/15/2026(b) | | 300,000 | 311,625 |
| VTR Finance B.V. (Chile), 6.88%, 01/15/2024(b) | | 440,000 | 457,050 |
| Ziggo Bond Co., B.V. (Netherlands), 5.88%, 01/15/2025(b) | | 200,000 | 203,084 |
| | | | 12,173,338 |
| Casinos & Gaming–2.77% |
| Boyd Gaming Corp., | | |
| 6.88%, 05/15/2023 | | 125,000 | 129,531 |
| 6.00%, 08/15/2026 | | 226,000 | 238,430 |
| Cirsa Finance International S.a.r.l. (Spain), 7.88%, 12/20/2023(b) | | 211,000 | 224,188 |
| Codere Finance 2 (Luxembourg) S.A. (Spain), 7.63%, 11/01/2021(b) | | 448,000 | 436,258 |
| MGM China Holdings Ltd. (Macau), 5.88%, 05/15/2026(b) | | 206,000 | 211,923 |
| MGM Resorts International, | | |
| 7.75%, 03/15/2022 | | 519,000 | 579,982 |
| 6.00%, 03/15/2023 | | 305,000 | 331,306 |
| Scientific Games International, Inc., 10.00%, 12/01/2022 | | 570,000 | 599,925 |
| Studio City Finance Ltd. (Macau), 7.25%, 02/11/2024(b) | | 505,000 | 526,715 |
| Wynn Las Vegas LLC/Wynn Las Vegas Capital Corp., 5.50%, 03/01/2025(b) | | 685,000 | 709,180 |
| | | | 3,987,438 |
| Coal & Consumable Fuels–0.75% |
| SunCoke Energy Partners L.P./SunCoke Energy Partners Finance Corp., 7.50%, 06/15/2025(b) | | 1,097,000 | 1,075,060 |
| Commodity Chemicals–0.50% |
| Koppers, Inc., 6.00%, 02/15/2025(b) | | 460,000 | 433,550 |
| | Principal
Amount | Value |
| Commodity Chemicals–(continued) |
| Nufarm Australia Ltd./Nufarm Americas, Inc. (Australia), 5.75%, 04/30/2026(b) | | $306,000 | $292,230 |
| | | | 725,780 |
| Communications Equipment–0.33% |
| CommScope Technologies LLC, 6.00%, 06/15/2025(b) | | 502,000 | 472,989 |
| Construction & Engineering–0.43% |
| William Lyon Homes, Inc., | | |
| 6.00%, 09/01/2023 | | 124,000 | 126,480 |
| 6.63%, 07/15/2027(b) | | 485,000 | 485,000 |
| | | | 611,480 |
| Consumer Finance–1.82% |
| Ally Financial, Inc., 5.13%, 09/30/2024 | | 966,000 | 1,045,695 |
| Navient Corp., | | |
| 8.00%, 03/25/2020 | | 535,000 | 555,062 |
| 7.25%, 01/25/2022 | | 345,000 | 373,463 |
| 7.25%, 09/25/2023 | | 605,000 | 648,106 |
| | | | 2,622,326 |
| Copper–1.99% |
| First Quantum Minerals Ltd. (Zambia), 7.50%, 04/01/2025(b) | | 1,022,000 | 977,287 |
| Freeport-McMoRan, Inc., 5.40%, 11/14/2034 | | 1,118,000 | 1,070,485 |
| Taseko Mines Ltd. (Canada), 8.75%, 06/15/2022(b) | | 840,000 | 812,700 |
| | | | 2,860,472 |
| Diversified Banks–2.23% |
| Barclays Bank PLC (United Kingdom), 7.63%, 11/21/2022 | | 200,000 | 218,519 |
| Barclays PLC (United Kingdom), REGS, 7.88%(b)(e) | | 263,000 | 275,821 |
| Credit Agricole S.A. (France), REGS, 8.13%(b)(e) | | 507,000 | 587,863 |
| Dresdner Funding Trust I, REGS, 8.15%, 06/30/2031(b) | | 465,000 | 628,099 |
| ING Groep N.V. (Netherlands), REGS, 6.88%(b)(e) | | 280,000 | 295,473 |
| Royal Bank of Scotland Group PLC (The) (United Kingdom), 8.63%(e) | | 548,000 | 591,977 |
| Societe Generale S.A. (France), REGS, 7.38%(b)(e) | | 308,000 | 324,570 |
| Standard Chartered PLC (United Kingdom), REGS, 7.50%(b)(e) | | 263,000 | 278,780 |
| | | | 3,201,102 |
| Diversified Capital Markets–0.21% |
| Credit Suisse Group AG (Switzerland), REGS, 7.13%(b)(e) | | 279,000 | 296,199 |
See accompanying Notes to Financial Statements which are an integral part of the financial statements.
Invesco V.I. High Yield Fund
| | Principal
Amount | Value |
| Diversified Chemicals–0.35% |
| Chemours Co. (The), 7.00%, 05/15/2025 | | $220,000 | $230,450 |
| Trinseo Materials Operating S.C.A./Trinseo Materials Finance, Inc., 5.38%, 09/01/2025(b) | | 285,000 | 275,738 |
| | | | 506,188 |
| Diversified Metals & Mining–0.57% |
| Hudbay Minerals, Inc. (Canada), 7.63%, 01/15/2025(b) | | 396,000 | 410,850 |
| Vedanta Resources Ltd. (India), 6.38%, 07/30/2022(b) | | 407,000 | 402,014 |
| | | | 812,864 |
| Diversified REITs–0.20% |
| Colony Capital, Inc., | | |
| 5.00%, 04/15/2023 | | 268,000 | 258,276 |
| Conv., 3.88%, 01/15/2021 | | 34,000 | 33,235 |
| | | | 291,511 |
| Diversified Support Services–0.33% |
| IAA Spinco, Inc., 5.50%, 06/15/2027(b) | | 454,000 | 473,295 |
| Electrical Components & Equipment–0.43% |
| EnerSys, 5.00%, 04/30/2023(b) | | 598,000 | 612,095 |
| Electronic Equipment & Instruments–0.32% |
| Itron, Inc., 5.00%, 01/15/2026(b) | | 452,000 | 463,300 |
| Environmental & Facilities Services–1.88% |
| Core & Main L.P., 6.13%, 08/15/2025(b) | | 861,000 | 873,915 |
| GFL Environmental, Inc. (Canada), 7.00%, 06/01/2026(b) | | 1,337,000 | 1,372,096 |
| Waste Pro USA, Inc., 5.50%, 02/15/2026(b) | | 444,000 | 456,210 |
| | | | 2,702,221 |
| Fertilizers & Agricultural Chemicals–0.35% |
| OCI N.V. (Netherlands), 6.63%, 04/15/2023(b) | | 481,000 | 502,645 |
| Food Retail–0.89% |
| Albertsons Cos. LLC/Safeway, Inc./New Albertson’s, Inc./Albertson’s LLC, | | |
| 6.63%, 06/15/2024 | | 783,000 | 815,299 |
| 7.50%, 03/15/2026(b) | | 429,000 | 460,102 |
| | | | 1,275,401 |
| Forest Products–0.27% |
| Norbord, Inc. (Canada), 5.75%, 07/15/2027(b) | | 385,000 | 389,813 |
| Gas Utilities–1.29% |
| AmeriGas Partners, L.P./AmeriGas Finance Corp., 5.88%, 08/20/2026 | | 327,000 | 348,255 |
| Ferrellgas L.P./Ferrellgas Finance Corp., | | |
| 6.50%, 05/01/2021 | | 487,000 | 444,387 |
| 6.75%, 06/15/2023 | | 117,000 | 103,253 |
| | Principal
Amount | Value |
| Gas Utilities–(continued) |
| Suburban Propane Partners, L.P./Suburban Energy Finance Corp., 5.50%, 06/01/2024 | | $955,000 | $964,550 |
| | | | 1,860,445 |
| Health Care Equipment–0.46% |
| Hill-Rom Holdings, Inc., 5.00%, 02/15/2025(b) | | 645,000 | 667,575 |
| Health Care Facilities–3.17% |
| Community Health Systems, Inc., 6.25%, 03/31/2023 | | 377,000 | 364,276 |
| HCA, Inc., | | |
| 7.50%, 02/15/2022 | | 334,000 | 369,070 |
| 5.38%, 02/01/2025 | | 640,000 | 692,400 |
| 5.88%, 02/15/2026 | | 410,000 | 454,075 |
| 5.50%, 06/15/2047 | | 845,000 | 903,182 |
| Tenet Healthcare Corp., 6.75%, 06/15/2023 | | 1,760,000 | 1,773,200 |
| | | | 4,556,203 |
| Health Care REITs–0.57% |
| MPT Operating Partnership L.P./MPT Finance Corp., 5.00%, 10/15/2027 | | 795,000 | 820,838 |
| Health Care Services–3.50% |
| CHS/Community Health Systems, Inc., 8.00%, 03/15/2026(b) | | 449,000 | 432,625 |
| DaVita, Inc., 5.00%, 05/01/2025 | | 372,000 | 368,652 |
| Eagle Holding Co. II, LLC, 8.38% PIK Rate, 7.63% Cash Rate, 05/15/2022(b)(f) | | 474,000 | 477,555 |
| Envision Healthcare Corp., 8.75%, 10/15/2026(b) | | 213,000 | 148,568 |
| Hadrian Merger Sub, Inc., 8.50%, 05/01/2026(b) | | 723,000 | 685,042 |
| MEDNAX, Inc., 6.25%, 01/15/2027(b) | | 759,000 | 748,564 |
| MPH Acquisition Holdings LLC, 7.13%, 06/01/2024(b) | | 835,000 | 787,154 |
| Polaris Intermediate Corp., 9.25% PIK Rate, 8.50% Cash Rate, 12/01/2022(b)(f) | | 586,000 | 520,075 |
| Surgery Center Holdings, Inc., | | |
| 6.75%, 07/01/2025(b) | | 233,000 | 202,710 |
| 10.00%, 04/15/2027(b) | | 308,000 | 308,000 |
| Team Health Holdings, Inc., 6.38%, 02/01/2025(b) | | 460,000 | 354,200 |
| | | | 5,033,145 |
| Home Improvement Retail–0.53% |
| Hillman Group, Inc. (The), 6.38%, 07/15/2022(b) | | 858,000 | 763,620 |
| Homebuilding–1.85% |
| Beazer Homes USA, Inc., | | |
| 8.75%, 03/15/2022 | | 934,000 | 974,862 |
| 6.75%, 03/15/2025 | | 402,000 | 386,423 |
| KB Home, 8.00%, 03/15/2020 | | 211,000 | 218,427 |
See accompanying Notes to Financial Statements which are an integral part of the financial statements.
Invesco V.I. High Yield Fund
| | Principal
Amount | Value |
| Homebuilding–(continued) |
| Lennar Corp., | | |
| 8.38%, 01/15/2021 | | $112,000 | $120,960 |
| 5.38%, 10/01/2022 | | 404,000 | 429,755 |
| Taylor Morrison Communities, Inc./Taylor Morrison Holdings II, Inc., 5.88%, 04/15/2023(b) | | 498,000 | 525,390 |
| | | | 2,655,817 |
| Household Products–1.49% |
| Reynolds Group Issuer, Inc./LLC, 7.00%, 07/15/2024(b) | | 1,361,000 | 1,409,853 |
| Spectrum Brands, Inc., 5.75%, 07/15/2025 | | 705,000 | 735,844 |
| | | | 2,145,697 |
| Independent Power Producers & Energy Traders–0.79% |
| Calpine Corp., 5.50%, 02/01/2024 | | 334,000 | 331,913 |
| NRG Energy, Inc., | | |
| 7.25%, 05/15/2026 | | 200,000 | 221,000 |
| 6.63%, 01/15/2027 | | 175,000 | 190,750 |
| 5.25%, 06/15/2029(b) | | 374,000 | 399,245 |
| | | | 1,142,908 |
| Industrial Machinery–1.64% |
| Cleaver-Brooks, Inc., 7.88%, 03/01/2023(b) | | 748,000 | 719,172 |
| EnPro Industries, Inc., 5.75%, 10/15/2026 | | 795,000 | 814,875 |
| Mueller Industries, Inc., 6.00%, 03/01/2027 | | 825,000 | 831,188 |
| | | | 2,365,235 |
| Integrated Oil & Gas–1.28% |
| Parsley Energy, LLC/Parsley Finance Corp., | | |
| 6.25%, 06/01/2024(b) | | 470,000 | 489,975 |
| 5.63%, 10/15/2027(b) | | 640,000 | 672,000 |
| Petrobras Global Finance B.V. (Brazil), 5.75%, 02/01/2029 | | 645,000 | 673,961 |
| | | | 1,835,936 |
| Integrated Telecommunication Services–3.53% |
| Altice France S.A. (France), | | |
| 6.25%, 05/15/2024(b) | | 325,000 | 335,969 |
| 7.38%, 05/01/2026(b) | | 764,000 | 785,010 |
| Cincinnati Bell, Inc., | | |
| 7.00%, 07/15/2024(b) | | 629,000 | 558,237 |
| 8.00%, 10/15/2025(b) | | 94,000 | 80,370 |
| CommScope, Inc., | | |
| 6.00%, 03/01/2026(b) | | 360,000 | 370,800 |
| 8.25%, 03/01/2027(b) | | 536,000 | 548,650 |
| Frontier Communications Corp., | | |
| 10.50%, 09/15/2022 | | 1,272,000 | 868,140 |
| 11.00%, 09/15/2025 | | 264,000 | 165,000 |
| 8.00%, 04/01/2027(b) | | 775,000 | 807,937 |
| | Principal
Amount | Value |
| Integrated Telecommunication Services–(continued) |
| Telecom Italia Capital S.A. (Italy), | | |
| 6.38%, 11/15/2033 | | $95,000 | $99,038 |
| 7.20%, 07/18/2036 | | 417,000 | 461,827 |
| | | | 5,080,978 |
| Interactive Media & Services–0.07% |
| Cumulus Media New Holdings, Inc., 6.75%, 07/01/2026(b) | | 102,000 | 102,000 |
| Leisure Products–0.22% |
| Mattel, Inc., 6.75%, 12/31/2025(b) | | 303,000 | 312,469 |
| Managed Health Care–1.00% |
| Centene Corp., 5.38%, 06/01/2026(b) | | 356,000 | 375,135 |
| Molina Healthcare, Inc., 4.88%, 06/15/2025(b) | | 340,000 | 346,375 |
| WellCare Health Plans, Inc., | | |
| 5.25%, 04/01/2025 | | 367,000 | 383,974 |
| 5.38%, 08/15/2026(b) | | 310,000 | 329,375 |
| | | | 1,434,859 |
| Metal & Glass Containers–0.91% |
| Ardagh Packaging Finance PLC/Ardagh Holdings USA, Inc. (Ireland), | | |
| 7.25%, 05/15/2024(b) | | 310,000 | 327,825 |
| 6.00%, 02/15/2025(b) | | 500,000 | 518,750 |
| Flex Acquisition Co., Inc., 7.88%, 07/15/2026(b) | | 507,000 | 468,975 |
| | | | 1,315,550 |
| Movies & Entertainment–1.30% |
| AMC Entertainment Holdings, Inc., | | |
| 5.75%, 06/15/2025 | | 735,000 | 683,587 |
| 6.13%, 05/15/2027 | | 183,000 | 163,785 |
| Netflix, Inc., | | |
| 5.75%, 03/01/2024 | | 355,000 | 385,619 |
| 5.88%, 11/15/2028 | | 577,000 | 640,250 |
| | | | 1,873,241 |
| Multi-line Insurance–0.08% |
| Acrisure LLC/Acrisure Finance, Inc., 8.13%, 02/15/2024(b) | | 106,000 | 109,644 |
| Oil & Gas Drilling–2.12% |
| Diamond Offshore Drilling, Inc., 4.88%, 11/01/2043 | | 240,000 | 150,000 |
| Ensco Rowan plc, | | |
| 4.50%, 10/01/2024 | | 24,000 | 18,000 |
| 7.75%, 02/01/2026 | | 827,000 | 620,250 |
| Ensign Drilling, Inc. (Canada), 9.25%, 04/15/2024(b) | | 395,000 | 390,063 |
| Noble Holding International Ltd., 7.75%, 01/15/2024 | | 953,000 | 731,427 |
| Precision Drilling Corp. (Canada), | | |
| 7.75%, 12/15/2023 | | 94,000 | 96,322 |
| 5.25%, 11/15/2024 | | 514,000 | 478,020 |
See accompanying Notes to Financial Statements which are an integral part of the financial statements.
Invesco V.I. High Yield Fund
| | Principal
Amount | Value |
| Oil & Gas Drilling–(continued) |
| Transocean, Inc., 7.50%, 04/15/2031 | | $662,000 | $566,010 |
| | | | 3,050,092 |
| Oil & Gas Equipment & Services–1.34% |
| Antero Midstream Partners L.P./Antero Midstream Finance Corp., 5.75%, 01/15/2028(b) | | 813,000 | 805,886 |
| Archrock Partners, L.P./Archrock Partners Finance Corp., 6.00%, 10/01/2022 | | 490,000 | 498,575 |
| Calfrac Holdings L.P. (Canada), 8.50%, 06/15/2026(b) | | 350,000 | 246,750 |
| SESI, L.L.C., 7.13%, 12/15/2021 | | 521,000 | 368,608 |
| | | | 1,919,819 |
| Oil & Gas Exploration & Production–8.87% |
| Antero Resources Corp., 5.00%, 03/01/2025 | | 407,000 | 377,493 |
| Ascent Resources Utica Holdings, LLC/ARU Finance Corp., 10.00%, 04/01/2022(b) | | 633,000 | 673,290 |
| Brazos Valley Longhorn LLC/Brazos Valley Longhorn Finance Corp., 6.88%, 02/01/2025 | | 931,000 | 879,795 |
| California Resources Corp., 8.00%, 12/15/2022(b) | | 559,000 | 424,141 |
| Callon Petroleum Co., 6.13%, 10/01/2024 | | 932,000 | 945,980 |
| Centennial Resource Production, LLC, 6.88%, 04/01/2027(b) | | 793,000 | 804,895 |
| Denbury Resources, Inc., | | |
| 9.00%, 05/15/2021(b) | | 250,000 | 247,500 |
| 5.50%, 05/01/2022 | | 323,000 | 188,955 |
| EP Energy LLC/Everest Acquisition Finance, Inc., 8.00%, 11/29/2024(b) | | 420,000 | 289,800 |
| Gulfport Energy Corp., 6.00%, 10/15/2024 | | 747,000 | 580,792 |
| Jagged Peak Energy LLC, 5.88%, 05/01/2026 | | 862,000 | 853,380 |
| Oasis Petroleum, Inc., 6.88%, 01/15/2023 | | 1,019,000 | 1,021,547 |
| Petroleos Mexicanos (Mexico), 6.50%, 03/13/2027 | | 706,000 | 698,022 |
| QEP Resources, Inc., 5.25%, 05/01/2023 | | 375,000 | 362,813 |
| Range Resources Corp., | | |
| 5.88%, 07/01/2022 | | 446,000 | 443,770 |
| 4.88%, 05/15/2025 | | 816,000 | 720,120 |
| SM Energy Co., | | |
| 6.13%, 11/15/2022 | | 139,000 | 138,653 |
| 6.75%, 09/15/2026 | | 285,000 | 268,613 |
| 6.63%, 01/15/2027 | | 96,000 | 89,280 |
| Southwestern Energy Co., | | |
| 7.50%, 04/01/2026 | | 341,000 | 324,762 |
| 7.75%, 10/01/2027 | | 425,000 | 409,062 |
| Tullow Oil PLC (Ghana), 7.00%, 03/01/2025(b) | | 321,000 | 327,019 |
| | Principal
Amount | Value |
| Oil & Gas Exploration & Production–(continued) |
| Whiting Petroleum Corp., 6.25%, 04/01/2023 | | $733,000 | $734,832 |
| WPX Energy, Inc., 5.25%, 09/15/2024 | | 930,000 | 955,575 |
| | | | 12,760,089 |
| Oil & Gas Refining & Marketing–0.62% |
| NuStar Logistics, L.P., 6.00%, 06/01/2026 | | 481,000 | 499,038 |
| Parkland Fuel Corp. (Canada), 6.00%, 04/01/2026(b) | | 376,000 | 385,870 |
| | | | 884,908 |
| Oil & Gas Storage & Transportation–1.41% |
| Energy Transfer Operating, L.P., Series A, 6.25%(e) | | 307,000 | 285,977 |
| Plains All American Pipeline, L.P., Series B, 6.13%(e) | | 456,000 | 435,033 |
| SemGroup Corp., 6.38%, 03/15/2025 | | 535,000 | 521,625 |
| Targa Resources Partners L.P./Targa Resources Partners Finance Corp., 5.88%, 04/15/2026 | | 743,000 | 790,366 |
| | | | 2,033,001 |
| Other Diversified Financial Services–1.82% |
| eG Global Finance PLC (United Kingdom), 6.75%, 02/07/2025(b) | | 449,000 | 446,620 |
| Lions Gate Capital Holdings LLC, 6.38%, 02/01/2024(b) | | 704,000 | �� 741,840 |
| LPL Holdings, Inc., 5.75%, 09/15/2025(b) | | 509,000 | 522,361 |
| Tempo Acquisition LLC/Tempo Acquisition Finance Corp., 6.75%, 06/01/2025(b) | | 710,000 | 734,850 |
| VFH Parent LLC/Orchestra Co-Issuer, Inc., 6.75%, 06/15/2022(b) | | 171,000 | 177,271 |
| | | | 2,622,942 |
| Packaged Foods & Meats–1.11% |
| B&G Foods, Inc., 5.25%, 04/01/2025 | | 389,000 | 394,349 |
| JBS Investments GmbH, 7.25%, 04/03/2024(b) | | 525,000 | 546,219 |
| JBS USA Lux S.A./JBS USA Finance, Inc., 5.75%, 06/15/2025(b) | | 180,000 | 187,875 |
| TreeHouse Foods, Inc., 6.00%, 02/15/2024(b) | | 448,000 | 466,959 |
| | | | 1,595,402 |
| Paper Products–0.97% |
| Mercer International, Inc. (Canada), | | |
| 7.75%, 12/01/2022 | | 57,000 | 59,209 |
| 6.50%, 02/01/2024 | | 442,000 | 459,127 |
| 5.50%, 01/15/2026 | | 162,000 | 161,798 |
| Schweitzer-Mauduit International, Inc., 6.88%, 10/01/2026(b) | | 693,000 | 710,325 |
| | | | 1,390,459 |
See accompanying Notes to Financial Statements which are an integral part of the financial statements.
Invesco V.I. High Yield Fund
| | Principal
Amount | Value |
| Pharmaceuticals–2.15% |
| Bausch Health Americas, Inc., 9.25%, 04/01/2026(b) | | $372,000 | $417,123 |
| Bausch Health Cos., Inc., | | |
| 5.88%, 05/15/2023(b) | | 83,000 | 84,276 |
| 6.13%, 04/15/2025(b) | | 410,000 | 419,225 |
| 9.00%, 12/15/2025(b) | | 974,000 | 1,091,903 |
| Endo Dac/Endo Finance LLC/Endo Finco, Inc., 6.00%, 07/15/2023(b) | | 240,000 | 174,000 |
| HLF Financing S.a.r.l. LLC/Herbalife International, Inc., 7.25%, 08/15/2026(b) | | 424,000 | 426,650 |
| Teva Pharmaceutical Finance IV, B.V. (Israel), 3.65%, 11/10/2021 | | 500,000 | 484,625 |
| | | | 3,097,802 |
| Publishing–0.82% |
| Meredith Corp., 6.88%, 02/01/2026 | | 1,105,000 | 1,178,074 |
| Railroads–0.67% |
| Kenan Advantage Group, Inc. (The), 7.88%, 07/31/2023(b) | | 1,068,000 | 966,540 |
| Restaurants–0.90% |
| 1011778 BC ULC/New Red Finance, Inc. (Canada), 5.00%, 10/15/2025(b) | | 758,000 | 765,807 |
| IRB Holding Corp., 6.75%, 02/15/2026(b) | | 531,000 | 529,673 |
| | | | 1,295,480 |
| Security & Alarm Services–0.24% |
| Brink’s Co. (The), 4.63%, 10/15/2027(b) | | 345,000 | 345,431 |
| Sovereign Debt–0.33% |
| Ukraine Government International Bond (Ukraine), 6.75%, 06/20/2026(b) | | 390,000 | 470,880 |
| Specialized Consumer Services–0.57% |
| ServiceMaster Co., LLC (The), 7.45%, 08/15/2027 | | 765,000 | 823,331 |
| Specialized REITs–1.14% |
| Iron Mountain US Holdings, Inc., 5.38%, 06/01/2026(b) | | 248,000 | 250,170 |
| Iron Mountain, Inc., | | |
| 5.75%, 08/15/2024 | | 377,000 | 381,765 |
| 5.25%, 03/15/2028(b) | | 192,000 | 193,200 |
| Rayonier A.M. Products, Inc., 5.50%, 06/01/2024(b) | | 948,000 | 815,280 |
| | | | 1,640,415 |
| Specialty Chemicals–0.82% |
| Element Solutions Inc., 5.88%, 12/01/2025(b) | | 578,000 | 604,733 |
| GCP Applied Technologies, Inc., 5.50%, 04/15/2026(b) | | 567,000 | 578,340 |
| | | | 1,183,073 |
| | Principal
Amount | Value |
| Steel–0.83% |
| United States Steel Corp., 6.88%, 08/15/2025 | | $1,256,000 | $1,186,920 |
| Technology Hardware, Storage & Peripherals–0.29% |
| Dell International LLC/EMC Corp., 7.13%, 06/15/2024(b) | | 396,000 | 418,069 |
| Textiles–0.54% |
| Eagle Intermediate Global Holding B.V./Ruyi US Finance LLC (China), 7.50%, 05/01/2025(b) | | 814,000 | 776,353 |
| Trading Companies & Distributors–0.81% |
| AerCap Global Aviation Trust (Ireland), 6.50%, 06/15/2045(b)(g) | | 434,000 | 455,700 |
| BMC East, LLC, 5.50%, 10/01/2024(b) | | 649,000 | 660,357 |
| United Rentals North America Inc., 5.50%, 07/15/2025 | | 41,000 | 42,794 |
| | | | 1,158,851 |
| Trucking–0.83% |
| Avis Budget Car Rental LLC/Avis Budget Finance, Inc., 6.38%, 04/01/2024(b) | | 150,000 | 157,875 |
| United Rentals North America, Inc., | | |
| 5.88%, 09/15/2026 | | 525,000 | 561,094 |
| 6.50%, 12/15/2026 | | 188,000 | 203,980 |
| 5.25%, 01/15/2030 | | 262,000 | 269,860 |
| | | | 1,192,809 |
| Wireless Telecommunication Services–3.92% |
| Digicel Group One Ltd. (Jamaica), 8.25%, 12/30/2022(b) | | 205,000 | 114,800 |
| Digicel Group Two Ltd. (Jamaica), 8.25%, 09/30/2022(b) | | 194,000 | 43,650 |
| Oztel Holdings SPC Ltd. (Oman), 5.63%, 10/24/2023(b) | | 477,000 | 487,650 |
| Sprint Capital Corp., 8.75%, 03/15/2032 | | 196,000 | 227,360 |
| Sprint Corp., | | |
| 7.25%, 09/15/2021 | | 1,416,000 | 1,508,040 |
| 7.88%, 09/15/2023 | | 1,429,000 | 1,557,610 |
| 7.63%, 02/15/2025 | | 275,000 | 293,219 |
| T-Mobile USA, Inc., | | |
| 6.38%, 03/01/2025 | | 647,000 | 673,527 |
| 6.50%, 01/15/2026 | | 671,000 | 727,069 |
| | | | 5,632,925 |
| Total U.S. Dollar Denominated Bonds & Notes (Cost $135,377,849) | 135,723,156 |
| Non-U.S. Dollar Denominated Bonds & Notes–0.70%(h) |
| Brewers–0.16% |
| Sunshine Mid B.V. (Netherlands), , 6.50%, 05/15/2026(b) | EUR | 200,000 | 236,780 |
| Diversified Banks–0.18% |
| Erste Group Bank AG (Austria), REGS, 6.50%(b)(e) | EUR | 200,000 | 261,107 |
See accompanying Notes to Financial Statements which are an integral part of the financial statements.
Invesco V.I. High Yield Fund
| | Principal
Amount | Value |
| Food Retail–0.28% |
| Iceland Bondco PLC (United Kingdom), , 4.63%, 03/15/2025(b) | GBP | 350,000 | $403,034 |
| Textiles–0.08% |
| Eagle Intermediate Global Holding B.V./Ruyi US Finance LLC (China), , 5.38%, 05/01/2023(b) | EUR | 100,000 | 108,586 |
| Total Non-U.S. Dollar Denominated Bonds & Notes (Cost $1,080,007) | 1,009,507 |
| Variable Rate Senior Loan Interests–0.58%(i) |
| Data Processing & Outsourced Services–0.58% |
First Data Corp., Term Loan, 4.40% (3 mo. USD LIBOR + 2.00%), 07/08/2022
(Cost $814,911)(g) | | $831,642 | 831,621 |
| U.S. Treasury Securities–0.12% |
| U.S. Treasury Bills–0.12% |
2.03%, 12/19/2019
(Cost $173,317)(j)(k) | | 175,000 | 173,304 |
| | Shares | |
| Common Stocks & Other Equity Interests–0.00% |
| Asset Management & Custody Banks–0.00% |
| Motors Liquidation Co. GUC Trust(l) | 1 | 10 |
| | Shares | Value |
| Diversified Support Services–0.00% |
| ACC Claims Holdings, LLC(d)(l) | 269,616 | $1,618 |
| Other Diversified Financial Services–0.00% |
| Adelphia Recovery Trust, Series ACC-1(m) | 318,570 | 127 |
| Adelphia Recovery Trust, Series Arahova(m) | 109,170 | 1,092 |
| | | | 1,219 |
| Total Common Stocks & Other Equity Interests (Cost $143,574) | 2,847 |
| Money Market Funds–3.68% |
| Invesco Government & Agency Portfolio, Institutional Class, 2.26%(n) | 1,849,305 | 1,849,305 |
| Invesco Liquid Assets Portfolio, Institutional Class, 2.40%(n) | 1,320,475 | 1,321,003 |
| Invesco Treasury Portfolio, Institutional Class, 2.22%(n) | 2,113,491 | 2,113,491 |
| Total Money Market Funds (Cost $5,283,740) | 5,283,799 |
| TOTAL INVESTMENTS IN SECURITIES–99.47% (Cost $142,873,398) | 143,024,234 |
| OTHER ASSETS LESS LIABILITIES–0.53% | 768,675 |
| NET ASSETS–100.00% | $143,792,909 |
Investment Abbreviations:
| Conv. | – Convertible |
| EUR | – Euro |
| GBP | – British Pound Sterling |
| GUC | – General Unsecured Creditors |
| LIBOR | – London Interbank Offered Rate |
| PIK | – Pay-in-Kind |
| REGS | – Regulation S |
| REIT | – Real Estate Investment Trust |
| USD | – U.S. Dollar |
Notes to Schedule of Investments:
| (a) | Industry and/or sector classifications used in this report are generally according to the Global Industry Classification Standard, which was developed by and is the exclusive property and a service mark of MSCI Inc. and Standard & Poor’s. |
| (b) | Security purchased or received in a transaction exempt from registration under the Securities Act of 1933, as amended (the “1933 Act”). The security may be resold pursuant to an exemption from registration under the 1933 Act, typically to qualified institutional buyers. The aggregate value of these securities at June 30, 2019 was $70,592,103, which represented 49.09% of the Fund’s Net Assets. |
| (c) | Defaulted security. Currently, the issuer is in default with respect to principal and/or interest payments. The value of this security at June 30, 2019 represented less than 1% of the Fund’s Net Assets. |
| (d) | Security valued using significant unobservable inputs (Level 3). See Note 3. |
| (e) | Perpetual bond with no specified maturity date. |
| (f) | All or a portion of this security is Pay-in-Kind. Pay-in-Kind securities pay interest income in the form of securities. |
| (g) | Interest or dividend rate is redetermined periodically. Rate shown is the rate in effect on June 30, 2019. |
| (h) | Foreign denominated security. Principal amount is denominated in the currency indicated. |
| (i) | Variable rate senior loan interests are, at present, not readily marketable, not registered under the 1933 Act and may be subject to contractual and legal restrictions on sale. Variable rate senior loan interests in the Fund’s portfolio generally have variable rates which adjust to a base, such as the London Interbank Offered Rate (“LIBOR”), on set dates, typically every 30 days, but not greater than one year, and/or have interest rates that float at margin above a widely recognized base lending rate such as the Prime Rate of a designated U.S. bank. |
| (j) | All or a portion of the value was designated as collateral to cover margin requirements for swap agreements. See Note 1O. |
| (k) | Security traded on a discount basis. The interest rate shown represents the discount rate at the time of purchase by the Fund. |
| (l) | Non-income producing security. |
| (m) | Acquired as part of the Adelphia Communications bankruptcy reorganization. |
| (n) | The money market fund and the Fund are affiliated by having the same investment adviser. The rate shown is the 7-day SEC standardized yield as of June 30, 2019. |
See accompanying Notes to Financial Statements which are an integral part of the financial statements.
Invesco V.I. High Yield Fund
| Open Forward Foreign Currency Contracts |
Settlement
Date | Counterparty | Contract to | Unrealized
Appreciation
(Depreciation) |
| Deliver | Receive |
| Currency Risk | | | | | | |
| 08/30/2019 | Barclays Bank PLC | USD | 644,381 | EUR | 573,699 | $11,022 |
| 08/30/2019 | Canadian Imperial Bank of Commerce | GBP | 146,765 | USD | 188,311 | 1,423 |
| 08/30/2019 | Goldman Sachs International | USD | 58,051 | EUR | 51,389 | 656 |
| Subtotal—Appreciation | 13,101 |
| Currency Risk | | | | | | |
| 08/30/2019 | Goldman Sachs International | EUR | 1,181,716 | USD | 1,329,171 | (20,842) |
| 08/30/2019 | State Street Bank & Trust Co. | EUR | 150,000 | USD | 169,012 | (2,350) |
| Subtotal—Depreciation | (23,192) |
| Total Forward Foreign Currency Contracts | $(10,091) |
| Abbreviations: |
| EUR | – Euro |
| GBP | – British Pound Sterling |
| USD | – U.S. Dollar |
| Open Centrally Cleared Credit Default Swap Agreements |
| Reference Entity | Buy/Sell
Protection | (Pay)/
Receive
Fixed
Rate | Payment
Frequency | Maturity Date | Implied
Credit
Spread(a) | Notional Value | Upfront
Payments Paid
(Received) | Value | Unrealized
Appreciation(b) |
| Credit Risk |
| Markit CDX North America High Yield Index, Series 31, Version 1 | Sell | 5.00% | Quarterly | 12/20/2023 | 2.93% | USD | 2,910,000 | $87,689 | $237,771 | $150,082 |
| Abbreviations: |
| USD - | U.S. Dollar |
| (a) | Implied credit spreads represent the current level, as of June 30, 2019, at which protection could be bought or sold given the terms of the existing credit default swap agreement and serve as an indicator of the current status of the payment/performance risk of the credit default swap agreement. An implied credit spread that has widened or increased since entry into the initial agreement may indicate a deteriorating credit profile and increased risk of default for the reference entity. A declining or narrowing spread may indicate an improving credit profile or decreased risk of default for the reference entity. Alternatively, credit spreads may increase or decrease reflecting the general tolerance for risk in the credit markets generally. |
| (b) | The daily variation margin receivable (payable) at period end is recorded in the Statement of Assets and Liabilities. |
Portfolio Composition*
By credit quality, based on Total Investments
as of June 30, 2019
| AAA | 0.1% |
| BBB | 4.8 |
| BB | 47.9 |
| B | 35.8 |
| CCC | 7.9 |
| Non-rated | 3.5 |
| * | Source: Standard & Poor’s. A credit rating is an assessment provided by a nationally recognized statistical rating organization (NRSRO) of the creditworthiness of an issuer with respect to debt obligations, including specific securities, money market instruments or other debts. Ratings are measured on a scale that generally ranges from AAA (highest) to D (lowest); ratings are subject to change without notice. “Non- Rated” indicates the debtor was not rated, and should not be interpreted as indicating low quality. For more information on Standard & Poor’s rating methodology, please visit standardandpoors.com and select “Understanding Ratings” under Rating Resources on the homepage. |
See accompanying Notes to Financial Statements which are an integral part of the financial statements.
Invesco V.I. High Yield Fund
Statement of Assets and Liabilities
June 30, 2019
(Unaudited)
| Assets: | |
Investments in securities, at value
(Cost $137,589,658) | $137,740,435 |
| Investments in affiliated money market funds, at value (Cost $5,283,740) | 5,283,799 |
| Other investments: | |
| Variation margin receivable—centrally cleared swap agreements | 4,040 |
| Unrealized appreciation on forward foreign currency contracts outstanding | 13,101 |
| Foreign currencies, at value (Cost $9,497) | 9,438 |
| Receivable for: | |
| Investments matured, at value (Cost $7,390,409) | 0 |
| Dividends | 4,337 |
| Fund shares sold | 56,939 |
| Investments sold | 523,532 |
| Interest | 2,352,541 |
| Investment for trustee deferred compensation and retirement plans | 78,588 |
| Total assets | 146,066,750 |
| Liabilities: | |
| Other investments: | |
| Unrealized depreciation on forward foreign currency contracts outstanding | 23,192 |
| Payable for: | |
| Investments purchased | 1,243,781 |
| Fund shares reacquired | 123,566 |
| Amount due custodian | 635,518 |
| Accrued fees to affiliates | 121,219 |
| Accrued trustees’ and officers’ fees and benefits | 594 |
| Accrued other operating expenses | 42,439 |
| Trustee deferred compensation and retirement plans | 83,532 |
| Total liabilities | 2,273,841 |
| Net assets applicable to shares outstanding | $143,792,909 |
| Net assets consist of: | |
| Shares of beneficial interest | $150,048,604 |
| Distributable earnings | (6,255,695) |
| | $143,792,909 |
| Net Assets: |
| Series I | $43,465,407 |
| Series II | $100,327,502 |
| Shares outstanding, no par value, with an unlimited number of shares authorized: |
| Series I | 7,811,149 |
| Series II | 18,215,092 |
| Series I: | |
| Net asset value per share | $5.56 |
| Series II: | |
| Net asset value per share | $5.51 |
Statement of Operations
For the six months ended June 30, 2019
(Unaudited)
| Investment income: | |
| Interest | $4,860,721 |
| Dividends from affiliated money market funds | 58,895 |
| Dividends | 12,000 |
| Total investment income | 4,931,616 |
| Expenses: | |
| Advisory fees | 481,283 |
| Administrative services fees | 126,293 |
| Custodian fees | 5,955 |
| Distribution fees - Series II | 117,535 |
| Transfer agent fees | 11,905 |
| Trustees’ and officers’ fees and benefits | 12,668 |
| Reports to shareholders | 4,173 |
| Professional services fees | 34,152 |
| Other | 9,449 |
| Total expenses | 803,413 |
| Less: Fees waived | (3,373) |
| Net expenses | 800,040 |
| Net investment income | 4,131,576 |
| Realized and unrealized gain (loss) from: | |
| Net realized gain (loss) from: | |
| Investment securities | 18,273 |
| Foreign currencies | 469 |
| Forward foreign currency contracts | 37,176 |
| Option contracts written | 30,012 |
| Swap agreements | (48,674) |
| | 37,256 |
| Change in net unrealized appreciation (depreciation) of: | |
| Investment securities | 9,430,795 |
| Foreign currencies | (3,138) |
| Forward foreign currency contracts | 3,114 |
| Option contracts written | 5,167 |
| Swap agreements | 388,444 |
| | 9,824,382 |
| Net realized and unrealized gain | 9,861,638 |
| Net increase in net assets resulting from operations | $13,993,214 |
See accompanying Notes to Financial Statements which are an integral part of the financial statements.
Invesco V.I. High Yield Fund
Statement of Changes in Net Assets
For the six months ended June 30, 2019 and the year ended December 31, 2018
(Unaudited)
| | June 30,
2019 | December 31,
2018 |
| Operations: | | |
| Net investment income | $4,131,576 | $8,275,606 |
| Net realized gain (loss) | 37,256 | (824,052) |
| Change in net unrealized appreciation (depreciation) | 9,824,382 | (13,592,308) |
| Net increase (decrease) in net assets resulting from operations | 13,993,214 | (6,140,754) |
| Distributions to shareholders from distributable earnings: | | |
| Series I | — | (4,211,171) |
| Series II | — | (4,569,006) |
| Total distributions from distributable earnings | — | (8,780,177) |
| Share transactions–net: | | |
| Series I | (17,672,171) | (17,542,621) |
| Series II | 5,532,795 | 2,229,098 |
| Net increase (decrease) in net assets resulting from share transactions | (12,139,376) | (15,313,523) |
| Net increase (decrease) in net assets | 1,853,838 | (30,234,454) |
| Net assets: | | |
| Beginning of period | 141,939,071 | 172,173,525 |
| End of period | $143,792,909 | $141,939,071 |
See accompanying Notes to Financial Statements which are an integral part of the financial statements.
Invesco V.I. High Yield Fund
Financial Highlights
June 30, 2019
(Unaudited)
The following schedule presents financial highlights for a share of the Fund outstanding throughout the periods indicated.
| | Net asset
value,
beginning
of period | Net
investment
income(a) | Net gains
(losses)
on securities
(both
realized and
unrealized) | Total from
investment
operations | Dividends
from net
investment
income | Net asset
value, end
of period | Total
return(b) | Net assets,
end of period
(000’s omitted) | Ratio of
expenses
to average
net assets
with fee waivers
and/or expenses
absorbed | Ratio of
expenses
to average net
assets without
fee waivers
and/or expenses
absorbed | Ratio of net
investment
income
to average
net assets | Portfolio
turnover(c) |
| Series I |
| Six months ended 06/30/19 | $5.06 | $0.15 | $0.35 | $0.50 | $— | $5.56 | 9.88% | $43,465 | 0.89%(d) | 0.89%(d) | 5.51%(d) | 22% |
| Year ended 12/31/18 | 5.51 | 0.26 | (0.43) | (0.17) | (0.28) | 5.06 | (3.35) | 55,703 | 1.17 | 1.17 | 4.84 | 66 |
| Year ended 12/31/17 | 5.40 | 0.26 | 0.08 | 0.34 | (0.23) | 5.51 | 6.30 | 80,372 | 0.99 | 1.00 | 4.73 | 73 |
| Year ended 12/31/16 | 5.06 | 0.28 | 0.28 | 0.56 | (0.22) | 5.40 | 11.21 | 94,653 | 0.96 | 0.96 | 5.25 | 99 |
| Year ended 12/31/15 | 5.53 | 0.29 | (0.46) | (0.17) | (0.30) | 5.06 | (3.17) | 73,594 | 1.03 | 1.03 | 5.23 | 99 |
| Year ended 12/31/14 | 5.70 | 0.29 | (0.19) | 0.10 | (0.27) | 5.53 | 1.73 | 94,345 | 0.92 | 0.98 | 5.11 | 103 |
| Series II |
| Six months ended 06/30/19 | 5.02 | 0.14 | 0.35 | 0.49 | — | 5.51 | 9.76 | 100,328 | 1.14(d) | 1.14(d) | 5.26(d) | 22 |
| Year ended 12/31/18 | 5.46 | 0.25 | (0.42) | (0.17) | (0.27) | 5.02 | (3.43) | 86,236 | 1.42 | 1.42 | 4.59 | 66 |
| Year ended 12/31/17 | 5.36 | 0.25 | 0.07 | 0.32 | (0.22) | 5.46 | 5.93 | 91,802 | 1.24 | 1.25 | 4.48 | 73 |
| Year ended 12/31/16 | 5.03 | 0.26 | 0.28 | 0.54 | (0.21) | 5.36 | 10.83 | 82,971 | 1.21 | 1.21 | 5.00 | 99 |
| Year ended 12/31/15 | 5.50 | 0.27 | (0.45) | (0.18) | (0.29) | 5.03 | (3.37) | 70,840 | 1.28 | 1.28 | 4.98 | 99 |
| Year ended 12/31/14 | 5.67 | 0.28 | (0.19) | 0.09 | (0.26) | 5.50 | 1.59 | 59,683 | 1.17 | 1.23 | 4.86 | 103 |
| (a) | Calculated using average shares outstanding. |
| (b) | Includes adjustments in accordance with accounting principles generally accepted in the United States of America and as such, the net asset value for financial reporting purposes and the returns based upon those net asset values may differ from the net asset value and returns for shareholder transactions. Total returns are not annualized for periods less than one year, if applicable, and do not reflect charges assessed in connection with a variable product, which if included would reduce total returns. |
| (c) | Portfolio turnover is calculated at the fund level and is not annualized for periods less than one year, if applicable. |
| (d) | Ratios are annualized and based on average daily net assets (000’s omitted) of $60,480 and $94,807 for Series I and Series II shares, respectively. |
See accompanying Notes to Financial Statements which are an integral part of the financial statements.
Invesco V.I. High Yield Fund
Notes to Financial Statements
June 30, 2019
(Unaudited)
NOTE 1—Significant Accounting Policies
Invesco V.I. High Yield Fund (the “Fund”) is a series portfolio of AIM Variable Insurance Funds (Invesco Variable Insurance Funds) (the “Trust”). The Trust is a Delaware statutory trust registered under the Investment Company Act of 1940, as amended (the “1940 Act”), as an open-end series management investment company. Information presented in these financial statements pertains only to the Fund. Matters affecting the Fund or each class will be voted on exclusively by the shareholders of the Fund or each class. Current Securities and Exchange Commission (“SEC”) guidance, however, requires participating insurance companies offering separate accounts to vote shares proportionally in accordance with the instructions of the contract owners whose investments are funded by shares of each Fund or class.
The Fund’s investment objective is total return, comprised of current income and capital appreciation.
The Fund currently offers two classes of shares, Series I and Series II, both of which are offered to insurance company separate accounts funding variable annuity contracts and variable life insurance policies (“variable products”).
The Fund is an investment company and accordingly follows the investment company accounting and reporting guidance in accordance with Financial Accounting Standards Board Accounting Standards Codification Topic 946,Financial Services – Investment Companies.
The following is a summary of the significant accounting policies followed by the Fund in the preparation of its financial statements.
| A. | Security Valuations – Securities, including restricted securities, are valued according to the following policy. |
Debt obligations (including convertible securities) and unlisted equities are fair valued using an evaluated quote provided by an independent pricing service. Evaluated quotes provided by the pricing service may be determined without exclusive reliance on quoted prices, and may reflect appropriate factors such as institution-size trading in similar groups of securities, developments related to specific securities, dividend rate (for unlisted equities), yield (for debt obligations), quality, type of issue, coupon rate (for debt obligations), maturity (for debt obligations), individual trading characteristics and other market data. Pricing services generally value debt obligations assuming orderly transactions of institutional round lot size, but a fund may hold or transact in the same securities in smaller, odd lot sizes. Odd lots often trade at lower prices than institutional round lots. Debt obligations are subject to interest rate and credit risks. In addition, all debt obligations involve some risk of default with respect to interest and/or principal payments.
Variable rate senior loan interests are fair valued using quotes provided by an independent pricing service. Quotes provided by the pricing service may reflect appropriate factors such as ratings, tranche type, industry, company performance, spread, individual trading characteristics, institution-size trading in similar groups of securities and other market data.
A security listed or traded on an exchange (except convertible securities) is valued at its last sales price or official closing price as of the close of the customary trading session on the exchange where the security is principally traded, or lacking any sales or official closing price on a particular day, the security may be valued at the closing bid price on that day. Securities traded in the over-the-counter market are valued based on prices furnished by independent pricing services or market makers. When such securities are valued by an independent pricing service they may be considered fair valued. Futures contracts are valued at the final settlement price set by an exchange on which they are principally traded. Listed options are valued at the mean between the last bid and asked prices from the exchange on which they are principally traded. Options not listed on an exchange are valued by an independent source at the mean between the last bid and asked prices. For purposes of determining net asset value ("NAV") per share, futures and option contracts generally are valued 15 minutes after the close of the customary trading session of the New York Stock Exchange (“NYSE”).
Investments in open-end and closed-end registered investment companies that do not trade on an exchange are valued at the end-of-day net asset value per share. Investments in open-end and closed-end registered investment companies that trade on an exchange are valued at the last sales price or official closing price as of the close of the customary trading session on the exchange where the security is principally traded.
Swap agreements are fair valued using an evaluated quote, if available, provided by an independent pricing service. Evaluated quotes provided by the pricing service are valued based on a model which may include end-of-day net present values, spreads, ratings, industry, company performance and returns of referenced assets. Centrally cleared swap agreements are valued at the daily settlement price determined by the relevant exchange or clearinghouse.
Foreign securities’ (including foreign exchange contracts) prices are converted into U.S. dollar amounts using the applicable exchange rates as of the close of the NYSE. If market quotations are available and reliable for foreign exchange-traded equity securities, the securities will be valued at the market quotations. Because trading hours for certain foreign securities end before the close of the NYSE, closing market quotations may become unreliable. If between the time trading ends on a particular security and the close of the customary trading session on the NYSE, events occur that the investment adviser determines are significant and make the closing price unreliable, the Fund may fair value the security. If the event is likely to have affected the closing price of the security, the security will be valued at fair value in good faith using procedures approved by the Board of Trustees. Adjustments to closing prices to reflect fair value may also be based on a screening process of an independent pricing service to indicate the degree of certainty, based on historical data, that the closing price in the principal market where a foreign security trades is not the current value as of the close of the NYSE. Foreign securities’ prices meeting the approved degree of certainty that the price is not reflective of current value will be priced at the indication of fair value from the independent pricing service. Multiple factors may be considered by the independent pricing service in determining adjustments to reflect fair value and may include information relating to sector indices, American Depositary Receipts and domestic and foreign index futures. Foreign securities may have additional risks including exchange rate changes, potential for sharply devalued currencies and high inflation, political and economic upheaval, the relative lack of issuer information, relatively low market liquidity and the potential lack of strict financial and accounting controls and standards.
Securities for which market prices are not provided by any of the above methods may be valued based upon quotes furnished by independent sources. The last bid price may be used to value equity securities. The mean between the last bid and asked prices is used to value debt obligations, including corporate loans.
Securities for which market quotations are not readily available or became unreliable are valued at fair value as determined in good faith by or under the supervision of the Trust’s officers following procedures approved by the Board of Trustees. Issuer specific events, market trends,
Invesco V.I. High Yield Fund
bid/asked quotes of brokers and information providers and other market data may be reviewed in the course of making a good faith determination of a security’s fair value.
The Fund may invest in securities that are subject to interest rate risk, meaning the risk that the prices will generally fall as interest rates rise and, conversely, the prices will generally rise as interest rates fall. Specific securities differ in their sensitivity to changes in interest rates depending on their individual characteristics. Changes in interest rates may result in increased market volatility, which may affect the value and/or liquidity of certain Fund investments.
Valuations change in response to many factors including the historical and prospective earnings of the issuer, the value of the issuer’s assets, general economic conditions, interest rates, investor perceptions and market liquidity. Because of the inherent uncertainties of valuation, the values reflected in the financial statements may materially differ from the value received upon actual sale of those investments.
| B. | Securities Transactions and Investment Income – Securities transactions are accounted for on a trade date basis. Realized gains or losses on sales are computed on the basis of specific identification of the securities sold. Interest income (net of withholding tax, if any) is recorded on the accrual basis from settlement date. Bond premiums and discounts are amortized and/or accreted over the lives of the respective securities. Pay-in-kind interest income and non-cash dividend income received in the form of securities in-lieu of cash are recorded at the fair value of the securities received. Dividend income (net of withholding tax, if any) is recorded on the ex-dividend date. |
The Fund may periodically participate in litigation related to Fund investments. As such, the Fund may receive proceeds from litigation settlements. Any proceeds received are included in the Statement of Operations as realized gain (loss) for investments no longer held and as unrealized gain (loss) for investments still held.
Brokerage commissions and mark ups are considered transaction costs and are recorded as an increase to the cost basis of securities purchased and/or a reduction of proceeds on a sale of securities. Such transaction costs are included in the determination of net realized and unrealized gain (loss) from investment securities reported in the Statement of Operations and the Statement of Changes in Net Assets and the net realized and unrealized gains (losses) on securities per share in the Financial Highlights. Transaction costs are included in the calculation of the Fund’s net asset value and, accordingly, they reduce the Fund’s total returns. These transaction costs are not considered operating expenses and are not reflected in net investment income reported in the Statement of Operations and the Statement of Changes in Net Assets, or the net investment income per share and the ratios of expenses and net investment income reported in the Financial Highlights, nor are they limited by any expense limitation arrangements between the Fund and the investment adviser.
The Fund allocates income and realized and unrealized capital gains and losses to a class based on the relative net assets of each class.
| C. | Country Determination — For the purposes of making investment selection decisions and presentation in the Schedule of Investments, the investment adviser may determine the country in which an issuer is located and/or credit risk exposure based on various factors. These factors include the laws of the country under which the issuer is organized, where the issuer maintains a principal office, the country in which the issuer derives 50% or more of its total revenues and the country that has the primary market for the issuer’s securities, as well as other criteria. Among the other criteria that may be evaluated for making this determination are the country in which the issuer maintains 50% or more of its assets, the type of security, financial guarantees and enhancements, the nature of the collateral and the sponsor organization. Country of issuer and/or credit risk exposure has been determined to be the United States of America, unless otherwise noted. |
| D. | Distributions– Distributions from net investment income and net realized capital gain, if any, are generally declared and paid to separate accounts of participating insurance companies annually and recorded on the ex-dividend date. |
| E. | Securities Purchased on a When-Issued and Delayed Delivery Basis — The Fund may purchase and sell interests in corporate loans and corporate debt securities and other portfolio securities on a when-issued and delayed delivery basis, with payment and delivery scheduled for a future date. No income accrues to the Fund on such interests or securities in connection with such transactions prior to the date the Fund actually takes delivery of such interests or securities. These transactions are subject to market fluctuations and are subject to the risk that the value at delivery may be more or less than the trade date purchase price. Although the Fund will generally purchase these securities with the intention of acquiring such securities, they may sell such securities prior to the settlement date. |
| F. | Federal Income Taxes –The Fund intends to comply with the requirements of Subchapter M of the Internal Revenue Code of 1986, as amended (the “Internal Revenue Code”), necessary to qualify as a regulated investment company and to distribute substantially all of the Fund’s taxable earnings to shareholders. As such, the Fund will not be subject to federal income taxes on otherwise taxable income (including net realized capital gain) that is distributed to shareholders. Therefore, no provision for federal income taxes is recorded in the financial statements. |
The Fund recognizes the tax benefits of uncertain tax positions only when the position is more likely than not to be sustained. Management has analyzed the Fund’s uncertain tax positions and concluded that no liability for unrecognized tax benefits should be recorded related to uncertain tax positions. Management is not aware of any tax positions for which it is reasonably possible that the total amounts of unrecognized tax benefits will change materially in the next 12 months.
The Fund files tax returns in the U.S. Federal jurisdiction and certain other jurisdictions. Generally, the Fund is subject to examinations by such taxing authorities for up to three years after the filing of the return for the tax period.
| G. | Expenses– Fees provided for under the Rule 12b-1 plan of a particular class of the Fund and which are directly attributable to that class are charged to the operations of such class. All other expenses are allocated among the classes based on relative net assets. |
| H. | Accounting Estimates – The preparation of financial statements in conformity with accounting principles generally accepted in the United States of America (“GAAP”) requires management to make estimates and assumptions that affect the reported amounts of assets and liabilities at the date of the financial statements and the reported amounts of revenues and expenses during the reporting period including estimates and assumptions related to taxation. Actual results could differ from those estimates by a significant amount. In addition, the Fund monitors for material events or transactions that may occur or become known after the period-end date and before the date the financial statements are released to print. |
| I. | Indemnifications – Under the Trust’s organizational documents, each Trustee, officer, employee or other agent of the Trust is indemnified against certain liabilities that may arise out of the performance of their duties to the Fund. Additionally, in the normal course of business, the Fund enters into contracts, including the Fund’s servicing agreements, that contain a variety of indemnification clauses. The Fund’s maximum exposure under these arrangements is unknown as this would involve future claims that may be made against the Fund that have not yet occurred. The risk of material loss as a result of such indemnification claims is considered remote. |
Invesco V.I. High Yield Fund
| J. | Lower-Rated Securities – The Fund normally invests at least 80% of its net assets in lower-quality debt securities, i.e., “junk bonds”. Investments in lower-rated securities or unrated securities of comparable quality tend to be more sensitive to economic conditions than higher rated securities. Junk bonds involve a greater risk of default by the issuer because such securities are generally unsecured and are often subordinated to other creditors’ claims. |
| K. | Foreign Currency Translations— Foreign currency is valued at the close of the NYSE based on quotations posted by banks and major currency dealers. Portfolio securities and other assets and liabilities denominated in foreign currencies are translated into U.S. dollar amounts at the date of valuation. Purchases and sales of portfolio securities (net of foreign taxes withheld on disposition) and income items denominated in foreign currencies are translated into U.S. dollar amounts on the respective dates of such transactions. The Fund does not separately account for the portion of the results of operations resulting from changes in foreign exchange rates on investments and the fluctuations arising from changes in market prices of securities held. The combined results of changes in foreign exchange rates and the fluctuation of market prices on investments (net of estimated foreign tax withholding) are included with the net realized and unrealized gain or loss from investments in the Statement of Operations. Reported net realized foreign currency gains or losses arise from (1) sales of foreign currencies, (2) currency gains or losses realized between the trade and settlement dates on securities transactions, and (3) the difference between the amounts of dividends, interest, and foreign withholding taxes recorded on the Fund’s books and the U.S. dollar equivalent of the amounts actually received or paid. Net unrealized foreign currency gains and losses arise from changes in the fair values of assets and liabilities, other than investments in securities at fiscal period end, resulting from changes in exchange rates. |
The Fund may invest in foreign securities, which may be subject to foreign taxes on income, gains on investments or currency repatriation, a portion of which may be recoverable. Foreign taxes, if any, are recorded based on the tax regulations and rates that exist in the foreign markets in which the Fund invests and are shown in the Statement of Operations.
| L. | Forward Foreign Currency Contracts— The Fund may engage in foreign currency transactions either on a spot (i.e. for prompt delivery and settlement) basis, or through forward foreign currency contracts, to manage or minimize currency or exchange rate risk. |
The Fund may also enter into forward foreign currency contracts for the purchase or sale of a security denominated in a foreign currency in order to “lock in” the U.S. dollar price of that security, or the Fund may also enter into forward foreign currency contracts that do not provide for physical settlement of the two currencies, but instead are settled by a single cash payment calculated as the difference between the agreed upon exchange rate and the spot rate at settlement based upon an agreed upon notional amount (non-deliverable forwards). The Fund will set aside liquid assets in an amount equal to the daily mark-to-market obligation for forward foreign currency contracts.
A forward foreign currency contract is an obligation between two parties (“Counterparties”) to purchase or sell a specific currency for an agreed-upon price at a future date. The use of forward foreign currency contracts does not eliminate fluctuations in the price of the underlying securities the Fund owns or intends to acquire but establishes a rate of exchange in advance. Fluctuations in the value of these contracts are measured by the difference in the contract date and reporting date exchange rates and are recorded as unrealized appreciation (depreciation) until the contracts are closed. When the contracts are closed, realized gains (losses) are recorded. Realized and unrealized gains (losses) on the contracts are included in the Statement of Operations. The primary risks associated with forward foreign currency contracts include failure of the Counterparty to meet the terms of the contract and the value of the foreign currency changing unfavorably. These risks may be in excess of the amounts reflected in the Statement of Assets and Liabilities.
| M. | Call Options Purchased and Written – The Fund may write covered call options and/or buy call options. A covered call option gives the purchaser of such option the right to buy, and the writer the obligation to sell, the underlying security or foreign currency at the stated exercise price during the option period. Options written by the Fund normally will have expiration dates between three and nine months from the date written. The exercise price of a call option may be below, equal to, or above the current market value of the underlying security at the time the option is written. |
Additionally, the Fund may enter into an option on a swap agreement, also called a “swaption”. A swaption is an option that gives the buyer the right, but not the obligation, to enter into a swap on a future date in exchange for paying a market-based premium. A receiver swaption gives the owner the right to receive the total return of a specified asset, reference rate or index. Swaptions also include options that allow an existing swap to be terminated or extended by one of the Counterparties.
When the Fund writes a covered call option, an amount equal to the premium received by the Fund is recorded as an asset and an equivalent liability in the Statement of Assets and Liabilities. The amount of the liability is subsequently “marked-to-market” to reflect the current market value of the option written. If a written covered call option expires on the stipulated expiration date, or if the Fund enters into a closing purchase transaction, the Fund realizes a gain (or a loss if the closing purchase transaction exceeds the premium received when the option was written) without regard to any unrealized gain or loss on the underlying security, and the liability related to such option is extinguished. If a written covered call option is exercised, the Fund realizes a gain or a loss from the sale of the underlying security and the proceeds of the sale are increased by the premium originally received. Realized and unrealized gains and losses on call options written are included in the Statement of Operations as Net realized gain (loss) from and Change in net unrealized appreciation (depreciation) of Option contracts written. A risk in writing a covered call option is that the Fund gives up the opportunity for profit if the market price of the security increases and the option is exercised.
When the Fund buys a call option, an amount equal to the premium paid by the Fund is recorded as an investment on the Statement of Assets and Liabilities. The amount of the investment is subsequently “marked-to-market” to reflect the current value of the option purchased. Realized and unrealized gains and losses on call options purchased are included in the Statement of Operations as Net realized gain (loss) from and Change in net unrealized appreciation (depreciation) of Investment securities. A risk in buying an option is that the Fund pays a premium whether or not the option is exercised. In addition, there can be no assurance that a liquid secondary market will exist for any option purchased.
| N. | Put Options Purchased and Written– The Fund may purchase and write put options including options on securities indexes, or foreign currency and/or futures contracts. By purchasing a put option, the Fund obtains the right (but not the obligation) to sell the option’s underlying instrument at a fixed strike price. In return for this right, the Fund pays an option premium. The option’s underlying instrument may be a security, securities index, or a futures contract. |
Additionally, the Fund may enter into an option on a swap agreement, also called a “swaption”. A swaption is an option that gives the buyer the right, but not the obligation, to enter into a swap on a future date in exchange for paying a market-based premium. A receiver swaption gives the owner the right to receive the total return of a specified asset, reference rate or index. Swaptions also include options that allow an existing swap to be terminated or extended by one of the Counterparties.
Invesco V.I. High Yield Fund
Put options may be used by the Fund to hedge securities it owns by locking in a minimum price at which the Fund can sell. If security prices fall, the put option could be exercised to offset all or a portion of the Fund’s resulting losses. At the same time, because the maximum the Fund has at risk is the cost of the option, purchasing put options does not eliminate the potential for the Fund to profit from an increase in the value of the underlying portfolio securities. The Fund may write put options to earn additional income in the form of option premiums if it expects the price of the underlying instrument to remain stable or rise during the option period so that the option will not be exercised. The risk in this strategy is that the price of the underlying securities may decline by an amount greater than the premium received. Put options written are reported as a liability in the Statement of Assets and Liabilities. Realized and unrealized gains and losses on put options purchased and put options written are included in the Statement of Operations as Net realized gain (loss) from and Change in net unrealized appreciation (depreciation) of Investment securities and Option contracts written, respectively. A risk in buying an option is that the Fund pays a premium whether or not the option is exercised. In addition, there can be no assurance that a liquid secondary market will exist for any option purchased.
| O. | Swap Agreements — The Fund may enter into various swap transactions, including interest rate, total return, index, currency and credit default swap contracts (“CDS”) for investment purposes or to manage interest rate, currency or credit risk. Such transactions are agreements between Counterparties. A swap agreement may be negotiated bilaterally and traded over-the-counter (“OTC”) between two parties (“uncleared/ OTC”) or, in some instances, must be transacted through a future commission merchant (“FCM”) and cleared through a clearinghouse that serves as a central Counterparty (“centrally cleared swap”). These agreements may contain among other conditions, events of default and termination events, and various covenants and representations such as provisions that require the Fund to maintain a pre-determined level of net assets, and/ or provide limits regarding the decline of the Fund’s NAV over specific periods of time. If the Fund were to trigger such provisions and have open derivative positions at that time, the Counterparty may be able to terminate such agreement and request immediate payment in an amount equal to the net liability positions, if any. |
Interest rate, total return, index, and currency swap agreements are two-party contracts entered into primarily to exchange the returns (or differentials in rates of returns) earned or realized on particular predetermined investments or instruments. The gross returns to be exchanged or “swapped” between the parties are calculated with respect to a notional amount, i.e., the return on or increase in value of a particular dollar amount invested at a particular interest rate or return of an underlying asset, in a particular foreign currency, or in a “basket” of securities representing a particular index.
In a centrally cleared swap, the Fund’s ultimate Counterparty is a central clearinghouse. The Fund initially will enter into centrally cleared swaps through an executing broker. When a fund enters into a centrally cleared swap, it must deliver to the central Counterparty (via the FCM) an amount referred to as “initial margin.” Initial margin requirements are determined by the central Counterparty, but an FCM may require additional initial margin above the amount required by the central Counterparty. Initial margin deposits required upon entering into centrally cleared swaps are satisfied by cash or securities as collateral at the FCM. Securities deposited as initial margin are designated on the Schedule of Investments and cash deposited is recorded on the Statement of Assets and Liabilities. During the term of a cleared swap agreement, a “variation margin” amount may be required to be paid by the Fund or may be received by the Fund, based on the daily change in price of the underlying reference instrument subject to the swap agreement and is recorded as a receivable or payable for variation margin in the Statement of Assets and Liabilities until the centrally cleared swap is terminated at which time a realized gain or loss is recorded.
A CDS is an agreement between Counterparties to exchange the credit risk of an issuer. A buyer of a CDS is said to buy protection by paying a fixed payment over the life of the agreement and in some situations an upfront payment to the seller of the CDS. If a defined credit event occurs (such as payment default or bankruptcy), the Fund as a protection buyer would cease paying its fixed payment, the Fund would deliver eligible bonds issued by the reference entity to the seller, and the seller would pay the full notional value, or the “par value”, of the referenced obligation to the Fund. A seller of a CDS is said to sell protection and thus would receive a fixed payment over the life of the agreement and an upfront payment, if applicable. If a credit event occurs, the Fund as a protection seller would cease to receive the fixed payment stream, the Fund would pay the buyer “par value” or the full notional value of the referenced obligation, and the Fund would receive the eligible bonds issued by the reference entity. In turn, these bonds may be sold in order to realize a recovery value. Alternatively, the seller of the CDS and its Counterparty may agree to net the notional amount and the market value of the bonds and make a cash payment equal to the difference to the buyer of protection. If no credit event occurs, the Fund receives the fixed payment over the life of the agreement. As the seller, the Fund would effectively add leverage to its portfolio because, in addition to its total net assets, the Fund would be subject to investment exposure on the notional amount of the CDS. In connection with these agreements, cash and securities may be identified as collateral in accordance with the terms of the respective swap agreements to provide assets of value and recourse in the event of default under the swap agreement or bankruptcy/insolvency of a party to the swap agreement. If a Counterparty becomes bankrupt or otherwise fails to perform its obligations due to financial difficulties, the Fund may experience significant delays in obtaining any recovery in a bankruptcy or other reorganization proceeding. The Fund may obtain only limited recovery or may obtain no recovery in such circumstances. The Fund’s maximum risk of loss from Counterparty risk, either as the protection seller or as the protection buyer, is the value of the contract. The risk may be mitigated by having a master netting arrangement between the Fund and the Counterparty and by the designation of collateral by the Counterparty to cover the Fund’s exposure to the Counterparty.
Implied credit spreads represent the current level at which protection could be bought or sold given the terms of the existing CDS contract and serve as an indicator of the current status of the payment/performance risk of the CDS. An implied spread that has widened or increased since entry into the initial contract may indicate a deteriorating credit profile and increased risk of default for the reference entity. A declining or narrowing spread may indicate an improving credit profile or decreased risk of default for the reference entity. Alternatively, credit spreads may increase or decrease reflecting the general tolerance for risk in the credit markets.
An interest rate swap is an agreement between Counterparties pursuant to which the parties exchange a floating rate payment for a fixed rate payment based on a specified notional amount.
Changes in the value of centrally cleared and OTC swap agreements are recognized as unrealized gains (losses) in the Statement of Operations by “marking to market” on a daily basis to reflect the value of the swap agreement at the end of each trading day. Payments received or paid at the beginning of the agreement are reflected as such on the Statement of Assets and Liabilities and may be referred to as upfront payments. The Fund accrues for the fixed payment stream and amortizes upfront payments, if any, on swap agreements on a daily basis with the net amount, recorded as a component of realized gain (loss) on the Statement of Operations. A liquidation payment received or made at the termination of a swap agreement is recorded as realized gain (loss) on the Statement of Operations. The Fund segregates cash or liquid securities having a value at least
Invesco V.I. High Yield Fund
equal to the amount of the potential obligation of a Fund under any swap transaction. Cash held as collateral is recorded as deposits with brokers on the Statement of Assets and Liabilities. Entering into these agreements involves, to varying degrees, lack of liquidity and elements of credit, market, and Counterparty risk in excess of amounts recognized on the Statement of Assets and Liabilities. Such risks involve the possibility that a swap is difficult to sell or liquidate; the Counterparty does not honor its obligations under the agreement and unfavorable interest rates and market fluctuations. It is possible that developments in the swaps market, including potential government regulation, could adversely affect the Fund’s ability to terminate existing swap agreements or to realize amounts to be received under such agreements. A short position in a security poses more risk than holding the same security long. As there is no limit on how much the price of the security can increase, the Fund’s exposure is unlimited.
Notional amounts of each individual credit default swap agreement outstanding as of June 30, 2019 for which the Fund is the seller of protection are disclosed in the open swap agreements table. These potential amounts would be partially offset by any recovery values of the respective referenced obligations, upfront payments received upon entering into the agreement, or net amounts received from the settlement of buy protection credit default swap agreements entered into by the Fund for the same referenced entity or entities.
| P. | Other Risks – The Fund invests in corporate loans from U.S. or non-U.S. companies (the “Borrowers”). The investment of the Fund in a corporate loan may take the form of participation interests or assignments. If the Fund purchases a participation interest from a syndicate of lenders (“Lenders”) or one of the participants in the syndicate (“Participant”), one or more of which administers the loan on behalf of all the Lenders (the “Agent Bank”), the Fund would be required to rely on the Lender that sold the participation interest not only for the enforcement of the Fund’s rights against the Borrower but also for the receipt and processing of payments due to the Fund under the corporate loans. As such, the Fund is subject to the credit risk of the Borrower and the Participant. Lenders and Participants interposed between the Fund and a Borrower, together with Agent Banks, are referred to as “Intermediate Participants”. |
| Q. | Leverage Risk — Leverage exists when the Fund can lose more than it originally invests because it purchases or sells an instrument or enters into a transaction without investing an amount equal to the full economic exposure of the instrument or transaction. |
| R. | Collateral—To the extent the Fund has designated or segregated a security as collateral and that security is subsequently sold, it is the Fund’s practice to replace such collateral no later than the next business day. |
NOTE 2—Advisory Fees and Other Fees Paid to Affiliates
The Trust has entered into a master investment advisory agreement with Invesco Advisers, Inc. (the "Adviser" or "Invesco"). Under the terms of the investment advisory agreement, the Fund accrues daily and pays monthly an advisory fee to the Adviser based on the annual rate of the Fund’s average daily net assets as follows:
| Average Daily Net Assets | Rate |
| First $200 million | 0.625% |
| Next $300 million | 0.55% |
| Next $500 million | 0.50% |
| Over $1 billion | 0.45% |
For the six months ended June 30, 2019, the effective advisory fees incurred by the Fund was 0.625%.
Under the terms of a master sub-advisory agreement between the Adviser and each of Invesco Asset Management Deutschland GmbH, Invesco Asset Management Limited, Invesco Asset Management (Japan) Limited, Invesco Hong Kong Limited, Invesco Senior Secured Management, Inc. and Invesco Canada Ltd. and separate sub-advisory agreements with Invesco Capital Management LLC and Invesco Asset Management (India) Private Limited (collectively, the "Affiliated Sub-Advisers") the Adviser, not the Fund, will pay 40% of the fees paid to the Adviser to any such Affiliated Sub-Adviser(s) that provide(s) discretionary investment management services to the Fund based on the percentage of assets allocated to such Affiliated Sub-Adviser(s).
The Adviser has contractually agreed, through at least June 30, 2020, to waive advisory fees and/or reimburse expenses of all shares to the extent necessary to limit total annual fund operating expenses after fee waiver and/or expense reimbursement (excluding certain items discussed below) of Series I shares to 1.50% and Series II shares to 1.75% of average daily net assets (the “expense limits”). In determining the Adviser’s obligation to waive advisory fees and/or reimburse expenses, the following expenses are not taken into account, and could cause the total annual fund operating expenses after fee waiver and/or expense reimbursement to exceed the numbers reflected above: (1) interest; (2) taxes; (3) dividend expense on short sales; (4) extraordinary or non-routine items, including litigation expenses; and (5) expenses that the Fund has incurred but did not actually pay because of an expense offset arrangement. Unless Invesco continues the fee waiver agreement, it will terminate on June 30, 2020. During its term, the fee waiver agreement cannot be terminated or amended to increase the expense limits or reduce the advisory fee waiver without approval of the Board of Trustees. The Adviser did not waive fees and/or reimburse expenses during the period under these expense limits.
Further, the Adviser has contractually agreed, through at least June 30, 2021, to waive the advisory fee payable by the Fund in an amount equal to 100% of the net advisory fees the Adviser receives from the affiliated money market funds on investments by the Fund of uninvested cash in such affiliated money market funds.
For the six months ended June 30, 2019, the Adviser waived advisory fees of $3,373.
The Trust has entered into a master administrative services agreement with Invesco pursuant to which the Fund has agreed to pay Invesco a fee for costs incurred in providing accounting services and fund administrative services to the Fund and to reimburse Invesco for fees paid to insurance companies that have agreed to provide certain administrative services to the Fund. These administrative services provided by the insurance companies may include, among other things: maintenance of master accounts with the Fund; tracking, recording and transmitting net purchase and redemption orders for Fund shares; maintaining and preserving records related to the purchase, redemption and other account activity of variable product owners; distributing copies of Fund documents such as prospectuses, proxy materials and periodic reports, to variable product owners, and responding to inquiries from variable product owners about the Fund. Pursuant to such agreement, for the six months ended June 30, 2019, Invesco was paid $10,873 for accounting and fund administrative services and was reimbursed $115,420 for fees paid to insurance companies. Also, Invesco has entered into a sub-administration agreement whereby State Street Bank and Trust Company (“SSB”) serves as custodian and fund accountant and provides certain administrative services to the Fund.
Invesco V.I. High Yield Fund
The Trust has entered into a transfer agency and service agreement with Invesco Investment Services, Inc. (“IIS”) pursuant to which the Fund has agreed to pay IIS a fee for providing transfer agency and shareholder services to the Fund and reimburse IIS for certain expenses incurred by IIS in the course of providing such services. For the six months ended June 30, 2019, expenses incurred under the agreement are shown in the Statement of Operations asTransfer agent fees.
The Trust has entered into a master distribution agreement with Invesco Distributors, Inc. (“IDI”) to serve as the distributor for the Fund. The Trust has adopted a plan pursuant to Rule 12b-1 under the 1940 Act with respect to the Fund’s Series II shares (the “Plan”). The Fund, pursuant to the Plan, pays IDI compensation at the annual rate of 0.25% of the Fund’s average daily net assets of Series II shares. The fees are accrued daily and paid monthly. Of the Plan payments, up to 0.25% of the average daily net assets of the Series II shares may be paid to insurance companies who furnish continuing personal shareholder services to customers who purchase and own Series II shares of the Fund. For the six months ended June 30, 2019, expenses incurred under the Plan are detailed in the Statement of Operations asDistribution fees.
Certain officers and trustees of the Trust are officers and directors of the Adviser, IIS and/or IDI.
NOTE 3—Additional Valuation Information
GAAP defines fair value as the price that would be received to sell an asset or paid to transfer a liability in an orderly transaction between market participants at the measurement date, under current market conditions. GAAP establishes a hierarchy that prioritizes the inputs to valuation methods, giving the highest priority to readily available unadjusted quoted prices in an active market for identical assets (Level 1) and the lowest priority to significant unobservable inputs (Level 3), generally when market prices are not readily available or are unreliable. Based on the valuation inputs, the securities or other investments are tiered into one of three levels. Changes in valuation methods may result in transfers in or out of an investment’s assigned level:
Level 1 – Prices are determined using quoted prices in an active market for identical assets.
Level 2 – Prices are determined using other significant observable inputs. Observable inputs are inputs that other market participants may use in pricing a security. These may include quoted prices for similar securities, interest rates, prepayment speeds, credit risk, yield curves, loss severities, default rates, discount rates, volatilities and others.
Level 3 – Prices are determined using significant unobservable inputs. In situations where quoted prices or observable inputs are unavailable (for example, when there is little or no market activity for an investment at the end of the period), unobservable inputs may be used. Unobservable inputs reflect the Fund’s own assumptions about the factors market participants would use in determining fair value of the securities or instruments and would be based on the best available information.
The following is a summary of the tiered valuation input levels, as of June 30, 2019. The level assigned to the securities valuations may not be an indication of the risk or liquidity associated with investing in those securities. Because of the inherent uncertainties of valuation, the values reflected in the financial statements may materially differ from the value received upon actual sale of those investments.
| | Level 1 | Level 2 | Level 3 | Total |
| Investments in Securities | | | | |
| U.S. Dollar Denominated Bonds & Notes | $— | $135,723,156 | $0 | $135,723,156 |
| Non-U.S. Dollar Denominated Bonds & Notes | — | 1,009,507 | — | 1,009,507 |
| Variable Rate Senior Loan Interests | — | 831,621 | — | 831,621 |
| U.S. Treasury Securities | — | 173,304 | — | 173,304 |
| Common Stocks & Other Equity Interests | 1,229 | — | 1,618 | 2,847 |
| Money Market Funds | 5,283,799 | — | — | 5,283,799 |
| Investments Matured | — | — | 0 | 0 |
| Total Investments in Securities | 5,285,028 | 137,737,588 | 1,618 | 143,024,234 |
| Other Investments - Assets* | | | | |
| Forward Foreign Currency Contracts | — | 13,101 | — | 13,101 |
| Swap Agreements | — | 150,082 | — | 150,082 |
| | — | 163,183 | — | 163,183 |
| Other Investments - Liabilities* | | | | |
| Forward Foreign Currency Contracts | — | (23,192) | — | (23,192) |
| Total Other Investments | — | 139,991 | — | 139,991 |
| Total Investments | $5,285,028 | $137,877,579 | $1,618 | $143,164,225 |
| * | Unrealized appreciation (depreciation). |
NOTE 4—Derivative Investments
The Fund may enter into an International Swaps and Derivatives Association Master Agreement (“ISDA Master Agreement”) under which a fund may trade OTC derivatives. An OTC transaction entered into under an ISDA Master Agreement typically involves a collateral posting arrangement, payment netting provisions and close-out netting provisions. These netting provisions allow for reduction of credit risk through netting of contractual obligations. The enforceability of the netting provisions of the ISDA Master Agreement depends on the governing law of the ISDA Master Agreement, among other factors.
For financial reporting purposes, the Fund does not offset OTC derivative assets or liabilities that are subject to ISDA Master Agreements in the Statement of Assets and Liabilities.
Invesco V.I. High Yield Fund
Value of Derivative Investments at Period-End
The table below summarizes the value of the Fund’s derivative investments, detailed by primary risk exposure, held as of June 30, 2019:
| | Value |
| Derivative Assets | Credit
Risk | Currency
Risk | Total |
| Unrealized appreciation on swap agreements — Centrally Cleared(a) | $150,082 | $- | $150,082 |
| Unrealized appreciation on forward foreign currency contracts outstanding | - | 13,101 | 13,101 |
| Total Derivative Assets | 150,082 | 13,101 | 163,183 |
| Derivatives not subject to master netting agreements | (150,082) | - | (150,082) |
| Total Derivative Assets subject to master netting agreements | $- | $13,101 | $13,101 |
| | Value |
| Derivative Liabilities | Credit
Risk | Currency
Risk | Total |
| Unrealized depreciation on forward foreign currency contracts outstanding | $- | $(23,192) | $(23,192) |
| Derivatives not subject to master netting agreements | - | - | - |
| Total Derivative Liabilities subject to master netting agreements | $- | $(23,192) | $(23,192) |
| (a) | The daily variation margin receivable at period-end is recorded in the Statement of Assets and Liabilities. |
Offsetting Assets and Liabilities
The table below reflects the Fund’s exposure to Counterparties subject to either an ISDA Master Agreement or other agreement for OTC derivative transactions as of June 30, 2019.
| | Financial
Derivative
Assets | | Financial
Derivative
Liabilities | | Net Value of
Derivatives | | Collateral
(Received)/Pledged | | |
| Counterparty | Forward Foreign
Currency Contracts | | Forward Foreign
Currency Contracts | | Net Value of
Derivatives | | Non-Cash | Cash | Net
Amount |
| Barclays Bank PLC | $ 11,022 | | $– | | $ 11,022 | | $– | $– | $ 11,022 |
| Canadian Imperial Bank of Commerce | 1,423 | | – | | 1,423 | | – | – | 1,423 |
| Goldman Sachs International | 656 | | (20,842) | | (20,186) | | – | – | (20,186) |
| State Street Bank & Trust Co. | – | | (2,350) | | (2,350) | | – | – | (2,350) |
| Total | $13,101 | | $(23,192) | | $(10,091) | | $– | $– | $(10,091) |
Effect of Derivative Investments for the six months ended June 30, 2019
The table below summarizes the gains (losses) on derivative investments, detailed by primary risk exposure, recognized in earnings during the period:
| | Location of Gain (Loss) on
Statement of Operations |
| | Credit
Risk | Currency
Risk | Total |
| Realized Gain (Loss): | | | |
| Forward foreign currency contracts | $- | $37,176 | $37,176 |
| Options purchased(a) | 40,180 | - | 40,180 |
| Options written | 30,012 | - | 30,012 |
| Swap agreements | (48,674) | - | (48,674) |
| Change in Net Unrealized Appreciation: | | | |
| Forward foreign currency contracts | - | 3,114 | 3,114 |
| Options purchased(a) | 31,680 | - | 31,680 |
| Options written | 5,167 | - | 5,167 |
| Swap agreements | 388,444 | - | 388,444 |
| Total | $446,809 | $40,290 | $487,099 |
| (a) | Options purchased are included in the net realized gain (loss) from investment securities and the change in net unrealized appreciation (depreciation) of investment securities. |
Invesco V.I. High Yield Fund
The table below summarizes the average notional value of derivatives held during the period.
| | Forward
Foreign Currency
Contracts | Options
Purchased | Options
Written | Swap
Agreements |
| Average notional value | $1,911,355 | $8,200,000 | $8,200,000 | $2,925,000 |
NOTE 5—Trustees’ and Officers’ Fees and Benefits
Trustees’ and Officers’ Fees and Benefits include amounts accrued by the Fund to pay remuneration to certain Trustees and Officers of the Fund. Trustees have the option to defer compensation payable by the Fund, and Trustees’ and Officers’ Fees and Benefits also include amounts accrued by the Fund to fund such deferred compensation amounts. Those Trustees who defer compensation have the option to select various Invesco Funds in which their deferral accounts shall be deemed to be invested. Finally, certain current Trustees were eligible to participate in a retirement plan that provided for benefits to be paid upon retirement to Trustees over a period of time based on the number of years of service. The Fund may have certain former Trustees who also participate in a retirement plan and receive benefits under such plan.Trustees’ and Officers’ Fees and Benefits include amounts accrued by the Fund to fund such retirement benefits. Obligations under the deferred compensation and retirement plans represent unsecured claims against the general assets of the Fund.
NOTE 6—Cash Balances
The Fund may borrow for leveraging in an amount up to 5% of the Fund’s total assets (excluding the amount borrowed) at the time the borrowing is made. In doing so, the Fund is permitted to temporarily carry a negative or overdrawn balance in its account with SSB, the custodian bank. Such balances, if any at period end, are shown in the Statement of Assets and Liabilities under the payable captionAmount due custodian. To compensate the custodian bank for such overdrafts, the overdrawn Fund may either (1) leave funds as a compensating balance in the account so the custodian bank can be compensated by earning the additional interest; or (2) compensate by paying the custodian bank at a rate agreed upon by the custodian bank and Invesco, not to exceed the contractually agreed upon rate. The Fund may not purchase additional securities when any borrowings from banks exceed 5% of the Fund’s total assets.
NOTE 7—Tax Information
The amount and character of income and gains to be distributed are determined in accordance with income tax regulations, which may differ from GAAP. Reclassifications are made to the Fund’s capital accounts to reflect income and gains available for distribution (or available capital loss carryforward) under income tax regulations. The tax character of distributions paid during the year and the tax components of net assets will be reported at the Fund’s fiscal year-end.
Capital loss carryforward is calculated and reported as of a specific date. Results of transactions and other activity after that date may affect the amount of capital loss carryforward actually available for the Fund to utilize. Capital losses generated in years beginning after December 22, 2010 can be carried forward for an unlimited period, whereas previous losses expire in eight tax years. Capital losses with an expiration period may not be used to offset capital gains until all net capital losses without an expiration date have been utilized. Capital loss carryforwards with no expiration date will retain their character as either short-term or long-term capital losses instead of as short-term capital losses as under prior law. The ability to utilize capital loss carryforwards in the future may be limited under the Internal Revenue Code and related regulations based on the results of future transactions.
The Fund had a capital loss carryforward as of December 31, 2018, as follows:
| Capital Loss Carryforward* |
| Expiration | Short-Term | Long-Term | Total |
| Not subject to expiration | $6,475,665 | $5,345,942 | $11,821,607 |
| * | Capital loss carryforward as of the date listed above is reduced for limitations, if any, to the extent required by the Internal Revenue Code and may be further limited depending upon a variety of factors, including the realization of net unrealized gains or losses as of the date of any reorganization. |
NOTE 8—Investment Transactions
The aggregate amount of investment securities (other than short-term securities, U.S. Treasury obligations and money market funds, if any) purchased and sold by the Fund during the six months ended June 30, 2019 was $32,740,228 and $42,558,452, respectively. Cost of investments, including any derivatives, on a tax basis includes the adjustments for financial reporting purposes as of the most recently completed federal income tax reporting period-end.
| Unrealized Appreciation (Depreciation) of Investments on a Tax Basis |
| Aggregate unrealized appreciation of investments | $3,845,731 |
| Aggregate unrealized (depreciation) of investments | (11,055,736) |
| Net unrealized appreciation (depreciation) of investments | $(7,210,005) |
Cost of investments for tax purposes is $150,461,919.
Invesco V.I. High Yield Fund
NOTE 9—Share Information
| | Summary of Share Activity |
| | Six months ended
June 30, 2019(a) | | Year ended
December 31, 2018 |
| | Shares | Amount | | Shares | Amount |
| Sold: | | | | | |
| Series I | 3,813,908 | $20,455,064 | | 14,839,601 | $80,754,950 |
| Series II | 2,320,299 | 12,512,585 | | 3,110,907 | 16,714,977 |
| Issued as reinvestment of dividends: | | | | | |
| Series I | — | — | | 793,064 | 4,211,171 |
| Series II | — | — | | 866,984 | 4,569,006 |
| Reacquired: | | | | | |
| Series I | (7,012,906) | (38,127,235) | | (19,216,611) | (102,508,742) |
| Series II | (1,300,263) | (6,979,790) | | (3,585,217) | (19,054,885) |
| Net increase (decrease) in share activity | (2,178,962) | $(12,139,376) | | (3,191,272) | $(15,313,523) |
| (a) | There are entities that are record owners of more than 5% of the outstanding shares of the Fund and in the aggregate own 65% of the outstanding shares of the Fund. The Fund and the Fund’s principal underwriter or adviser, are parties to participation agreements with these entities whereby these entities sell units of interest in separate accounts funding variable products that are invested in the Fund. The Fund, Invesco and/or Invesco affiliates may make payments to these entities, which are considered to be related to the Fund, for providing services to the Fund, Invesco and/or Invesco affiliates including but not limited to services such as, securities brokerage, third party record keeping and account servicing and administrative services. The Fund has no knowledge as to whether all or any portion of the shares owned of record by these entities are also owned beneficially. |
Invesco V.I. High Yield Fund
Calculating your ongoing Fund expenses
Example
As a shareholder of the Fund, you incur ongoing costs, including management fees; distribution and/or service fees (12b-1); and other Fund expenses. This example is intended to help you understand your ongoing costs (in dollars) of investing in the Fund and to compare these costs with ongoing costs of investing in other mutual funds. The example is based on an investment of $1,000 invested at the beginning of the period and held for the entire period January 1, 2019 through June 30, 2019.
The actual and hypothetical expenses in the examples below do not represent the effect of any fees or other expenses assessed in connection with a variable product; if they did, the expenses shown would be higher while the ending account values shown would be lower.
Actual expenses
The table below provides information about actual account values and actual expenses. You may use the information in this table, together with the amount you invested, to estimate the expenses that you paid over the period. Simply divide your account value by $1,000 (for example, an $8,600 account value divided by $1,000 = 8.6), then multiply the result by the number in the table under the heading entitled “Actual Expenses Paid During Period” to estimate the expenses you paid on your account during this period.
Hypothetical example for comparison purposes
The table below also provides information about hypothetical account values and hypothetical expenses based on the Fund’s actual expense ratio and an assumed rate of return of 5% per year before expenses, which is not the Fund’s actual return.
The hypothetical account values and expenses may not be used to estimate the actual ending account balance or expenses you paid for the period. You may use this information to compare the ongoing costs of investing in the Fund and other funds. To do so, compare this 5% hypothetical example with the 5% hypothetical examples that appear in the shareholder reports of the other funds.
Please note that the expenses shown in the table are meant to highlight your ongoing costs. Therefore, the hypothetical information is useful in comparing ongoing costs, and will not help you determine the relative total costs of owning different funds.
| | Beginning
Account Value (01/01/19) | ACTUAL | HYPOTHETICAL
(5% annual return before
expenses) | Annualized
Expense
Ratio |
Ending
Account Value
(06/30/19)1 | Expenses
Paid During
Period2 | Ending
Account Value
(06/30/19) | Expenses
Paid During
Period |
| Series I | $1,000.00 | $1,098.80 | $4.63 | $1,020.38 | $4.46 | 0.89% |
| Series II | 1,000.00 | 1,097.60 | 5.93 | 1,019.14 | 5.71 | 1.14 |
| 1 | The actual ending account value is based on the actual total return of the Fund for the period January 1, 2019 through June 30, 2019, after actual expenses and will differ from the hypothetical ending account value which is based on the Fund’s expense ratio and a hypothetical annual return of 5% before expenses. |
| 2 | Expenses are equal to the Fund’s annualized expense ratio as indicated above multiplied by the average account value over the period, multiplied by 181/365 to reflect the most recent fiscal half year. |
Invesco V.I. High Yield Fund
Approval of Investment Advisory and Sub-Advisory Contracts
At meetings held on June 10, 2019, the Board of Trustees (the Board or the Trustees) of AIM Variable Insurance Funds (Invesco Variable Insurance Funds) as a whole, and the independent Trustees, who comprise over 75% of the Board, voting separately, approved the continuance of the Invesco V.I. High Yield Fund’s (the Fund) Master Investment Advisory Agreement with Invesco Advisers, Inc. (Invesco Advisers and the investment advisory agreement) and the Master IntergroupSub-Advisory Contract for Mutual Funds with Invesco Asset Management Deutschland GmbH, Invesco Asset Management Limited, Invesco Asset Management (Japan) Limited, Invesco Hong Kong Limited, Invesco Senior Secured Management, Inc. and Invesco Canada Ltd. and separatesub-advisory contracts with Invesco Capital Management LLC and Invesco Asset Management (India) Private Limited (collectively, the AffiliatedSub-Advisers and thesub-advisory contracts) for another year, effective July 1, 2019. After evaluating the factors discussed below, among others, the Board approved the renewal of the Fund’s investment advisory agreement and thesub-advisory contracts and determined that the compensation payable by the Fund to Invesco Advisers and by Invesco Advisers to the AffiliatedSub-Advisers is fair and reasonable.
The Board’s Evaluation Process
The Board’s Investments Committee has established threeSub-Committees, which meet throughout the year to review the performance of funds advised by Invesco Advisers (the Invesco Funds). As part of a regularly scheduled basis ofin-person Board meetings, theSub-Committees meet with portfolio managers for their assigned Invesco Funds and other members of management to review detailed information about investment performance and portfolio attributes of these funds. The Board took into account evaluations and reports that it received from the Investments Committee andSub-Committees, as well as the information provided to such committees and the Board throughout the year, in considering whether to approve each Invesco Fund’s investment advisory agreement andsub-advisory contracts.
As part of the contract renewal process, the Board reviews and considers information provided in response to detailed requests for information submitted to management by the independent Trustees with assistance from legal counsel to the independent Trustees. The Board receives comparative investment performance and fee data regarding the Invesco Funds prepared by Invesco Advisers and Broadridge Financial Solutions, Inc. (Broadridge), an independent mutual fund data provider. The Board also receives an independent written evaluation from the Senior Officer, an officer of the Invesco Funds who reports directly to the
independent Trustees. The Senior Officer’s evaluation is prepared as part of his responsibility to manage the process by which the Invesco Funds’ proposed management fees are negotiated during the annual contract renewal process to ensure they are negotiated in a manner that is at arms’ length and reasonable. In addition to meetings with Invesco Advisers and fund counsel throughout the year, the independent Trustees also discuss the continuance of the investment advisory agreement andsub-advisory contracts in separate sessions with the Senior Officer and with independent legal counsel.
The discussion below is a summary of the Senior Officer’s independent written evaluation with respect to the Fund’s investment advisory agreement, as well as a discussion of the material factors and related conclusions that formed the basis for the Board’s approval of the Fund’s investment advisory agreement andsub-advisory contracts. The Trustees’ review and conclusions are based on the comprehensive consideration of all information presented to them during the course of the year and in prior years and are not the result of any single determinative factor. Moreover, one Trustee may have weighed a particular piece of information or factor differently than another Trustee. This information is current as of June 10, 2019.
Factors and Conclusions and Summary of Independent Written Fee Evaluation
| A. | Nature, Extent and Quality of Services Provided by Invesco Advisers and the AffiliatedSub-Advisers |
The Board reviewed the nature, extent and quality of the advisory services provided to the Fund by Invesco Advisers under the Fund’s investment advisory agreement, and the credentials and experience of the officers and employees of Invesco Advisers who provide these services, including the Fund’s portfolio manager(s). The Board’s review included consideration of Invesco Advisers’ investment process oversight and structure, credit analysis and investment risk management. The Board also considerednon-advisory services that Invesco Advisers and its affiliates provide to the Invesco Funds such as various back office support functions, third party oversight, internal audit, valuation, portfolio trading and legal and compliance. The Board also received and reviewed information about Invesco Advisers’ role as administrator of the Invesco Funds’ liquidity risk management program. The Board also reviewed and considered the benefits to shareholders of investing in a fund that is part of the Invesco family of funds under the umbrella of Invesco Ltd., Invesco Advisers’ parent company, and noted Invesco Ltd.’s depth and experience in conducting an investment management business, as well as its
commitment of financial and other resources to such business. The Board reviewed and considered information about the resources that Invesco Advisers intends to continue to commit to managing the Invesco family of funds following Invesco Ltd.’s acquisition of OppenheimerFunds, Inc. and its subsidiaries. The Board concluded that the nature, extent and quality of the services provided to the Fund by Invesco Advisers are appropriate and satisfactory.
The Board reviewed the services that may be provided by the AffiliatedSub-Advisers under thesub-advisory contracts and the credentials and experience of the officers and employees of the AffiliatedSub-Advisers who provide these services. The Board noted the AffiliatedSub-Advisers’ expertise with respect to certain asset classes and that the AffiliatedSub-Advisers have offices and personnel that are located in financial centers around the world. As a result, the Board noted that the AffiliatedSub-Advisers can provide research and investment analysis on the markets and economies of various countries in which the Fund may invest, make recommendations regarding securities and assist with security trades.The Board concluded that thesub-advisory contracts may benefit the Fund and its shareholders by permitting Invesco Advisers to use the resources and talents of the AffiliatedSub-Advisers in managing the Fund. The Board concluded that the nature, extent and quality of the services that may be provided by the AffiliatedSub-Advisers are appropriate and satisfactory.
| B. | Fund Investment Performance |
The Board considered Fund investment performance as a relevant factor in considering whether to approve the investment advisory agreement as well as thesub-advisory contracts for the Fund, as Invesco Canada Ltd. currently manages assets of the Fund.
The Board compared the Fund’s investment performance over multiple time periods ending December 31, 2018 to the performance of funds in the Broadridge performance universe and against the Lipper Variable Underlying Funds High Yield Index. The Board noted that performance of Series I shares of the Fund was in the fourth quintile of its performance universe for the one and three year periods and the fifth quintile for the five year period (the first quintile being the best performing funds and the fifth quintile being the worst performing funds). The Board noted that performance of Series I shares of the Fund was below the performance of the Index for the one, three and five year periods. The Board noted that the Fund’s security selection in and underweight exposure to certain industries negatively impacted Fund performance. The Trustees also reviewed more recent Fund performance and this review did not change their conclusions.
Invesco V.I. High Yield Fund
| C. | Advisory andSub-Advisory Fees and Fund Expenses |
The Board compared the Fund’s contractual management fee rate to the contractual management fee rates of funds in the Fund’s Broadridge expense group. The Board noted that the contractual management fee rate for Series I shares of the Fund was below the median contractual management fee rate of funds in its expense group. The Board noted that the term “contractual management fee” for funds in the expense group may include both advisory and certainnon-portfolio management administrative services fees, but that Broadridge does not provide information on a fund by fund basis as to what is included. The Board also reviewed the methodology used by Broadridge in providing expense group information, which includes using each fund’s contractual management fee schedule (including any applicable breakpoints) as reported in the most recent prospectus or statement of additional information for each fund in the expense group. The Board also considered comparative information regarding the Fund’s total expense ratio and its various components. The Board noted that the Fund’s total expense ratio was in the fifth quintile of its expense group and discussed with management reasons for such relative total expenses.
The Board noted that Invesco Advisers has contractually agreed to waive fees and/or limit expenses of the Fund for the term disclosed in the Fund’s registration statement in an amount necessary to limit total annual operating expenses to a specified percentage of average daily net assets for each class of the Fund.
The Board also considered the fees charged by Invesco Advisers and the AffiliatedSub-Advisers to other similarly managed client accounts. The Board noted that Invesco Advisers or the AffiliatedSub-Advisers may charge lower fees to large institutional clients. Invesco Advisers reviewed with the Board differences in the scope of services it provides to the Invesco Funds relative to certain other types of client accounts, including management of cash flows as a result of redemptions and purchases, necessary infrastructure such as officers, office space, technology, legal and distribution, oversight of service providers, costs and business risks associated with launching new funds and sponsoring and maintaining the product line, preparation of annual registration statement updates and financial information and compliance with federal and state laws and regulations.
The Board also considered the services that may be provided by the AffiliatedSub-Advisers pursuant to thesub-advisory contracts, as well as the fees payable by Invesco Advisers to the AffiliatedSub-Advisers pursuant to thesub-advisory contracts. The Board noted that Invesco Advisers retains overall responsibility for, and provides services to,sub-advised Invesco Funds, including oversight of the AffiliatedSub-Advisers as well as the additional
services described herein other thanday-to-day portfolio management.
| D. | Economies of Scale and Breakpoints |
The Board considered the extent to which there may be economies of scale in the provision of advisory services to the Fund. The Board considered Invesco’s reinvestment in its business, including investments in business infrastructure and cybersecurity. The Board also considered that the Fund may benefit from economies of scale through contractual breakpoints in the Fund’s advisory fee schedule, which generally operate to reduce the Fund’s expense ratio as it grows in size. The Board noted that the Fund shares directly in economies of scale through lower fees charged by third party service providers based on the combined size of the Invesco Funds. The Board noted that the Fund may also benefit from economies of scale through initial fee setting, fee waivers and expense reimbursements.
| E. | Profitability and Financial Resources |
The Board reviewed information from Invesco Advisers concerning the costs of the advisory and other services that Invesco Advisers and its affiliates provide to the Fund and the Invesco Funds and the profitability of Invesco Advisers and its affiliates in providing these services. The Board considered the methodology used for calculating profitability and noted the periodic review of such methodology by an independent consultant. The Board noted that Invesco Advisers continues to operate at a net profit from services Invesco Advisers and its affiliates provide to the Invesco Funds. The Board did not deem the level of profits realized by Invesco Advisers and its affiliates from providing services to the Fund to be excessive given the nature, extent and quality of the services provided. The Board received information from Invesco Advisers demonstrating that Invesco Advisers and the AffiliatedSub-Advisers are financially sound and have the resources necessary to perform their obligations under the investment advisory agreement andsub-advisory contracts.
| F. | Collateral Benefits to Invesco Advisers and its Affiliates |
The Board considered various other benefits received by Invesco Advisers and its affiliates from the relationship with the Fund, including the fees received for providing administrative, transfer agency and distribution services to the Fund. The Board considered comparative information regarding fees charged for these services, including information provided by Broadridge and other independent sources. The Board considered the performance of Invesco Advisers and its affiliates in providing these services and the organizational structure employed to provide these services. The Board also considered that these services are provided to the Fund pursuant to written contracts that are reviewed and approved on an annual basis by the Board; and that the services are required for the operation of the Fund.
The Board considered the benefits realized by Invesco Advisers and the AffiliatedSub-Advisers
as a result of portfolio brokerage transactions executed through “soft dollar” arrangements. Invesco Advisers noted that the Fund does not execute brokerage transactions through “soft dollar” arrangements to any significant degree.
The Board considered that the Fund’s uninvested cash and cash collateral from any securities lending arrangements may be invested in money market funds advised by Invesco Advisers pursuant to procedures approved by the Board. The Board considered information regarding the returns of the affiliated money market funds relative to comparable overnight investments, as well as the costs to the Fund of such investments. The Board noted that Invesco Advisers receives advisory fees from these affiliated money market funds attributable to such investments, although Invesco Advisers has contractually agreed to waive through varying periods the advisory fees payable by the Invesco Funds with respect to certain investments in the affiliated money market funds. The waiver is in an amount equal to 100% of the net advisory fee Invesco Advisers receives from the affiliated money market funds with respect to the Fund’s investment in the affiliated money market funds of uninvested cash, but not cash collateral. The Board concluded that the amount of advisory fees received by Invesco Advisers from the Fund’s investment of cash collateral from any securities lending arrangements in the affiliated money market funds is fair and reasonable.
Invesco V.I. High Yield Fund
| Semiannual Report to Shareholders | June 30, 2019 |
Invesco V.I. International Growth Fund
Beginning on January 1, 2021, as permitted by regulations adopted by the Securities and Exchange Commission, the insurance company that offers your variable annuity or variable life insurance contract may no longer send you paper copies of the Fund’s shareholder reports by mail, unless you specifically request paper copies of the reports from the insurance company or your financial intermediary. Instead of delivering paper copies of the report, the insurance company may choose to make the reports available on a website, and will notify you by mail each time a report is posted and provide you with a website link to access the report. Instructions for requesting paper copies will be provided by your insurance company.
If the insurance company offers electronic delivery, you may elect to receive shareholder reports and other communications about the Fund electronically by following the instructions provided by the insurance company or by contacting your financial intermediary. If you already elected to receive shareholder reports electronically, you will not be affected by this change and you need not take any action.
You may elect to receive all future reports in paper free of charge from the insurance company. You can inform the insurance company or your financial intermediary that you wish to continue receiving paper copies of your shareholder reports by following the instructions provided by the insurance company or by contacting your financial intermediary. Your election to receive reports in paper will apply to all portfolio companies available under your contract with the insurance company.
The Fund provides a complete list of its holdings four times in each fiscal year, at the quarter-ends. For the second and fourth quarters, the lists appear in the Fund’s semiannual and annual reports to shareholders. For the first and third quarters, the Fund files the lists with the Securities and Exchange Commission (SEC) on Form N-Q (or any successor Form). The Fund’s Form N-Q (or any successor Form) filings are available on the SEC website, sec.gov. The SEC file numbers for the Fund are 811-07452 and 033-57340. The Fund’s most recent portfolio holdings, as filed on Form N-Q (or any successor Form), have also been made available to insurance companies issuing variable annuity contracts and variable life insurance policies (“variable products”) that invest in the Fund.
A description of the policies and procedures that the Fund uses to determine how to vote proxies relating to portfolio securities is available without charge, upon request, from our Client Services department at 800 959 4246 or at invesco.com/proxyguidelines. The information is also available on the SEC website, sec.gov.
Information regarding how the Fund voted proxies related to its portfolio securities during the most recent 12-month period ended June 30 is available at invesco.com/proxysearch. The information is also available on the SEC website, sec.gov.
Invesco Advisers, Inc. is an investment adviser; it provides investment advisory services to individual and institutional clients and does not sell securities. Invesco Distributors, Inc. is the US distributor for Invesco Ltd.’s retail mutual funds, exchange-traded funds and institutional money market funds. Both are wholly owned, indirect subsidiaries of Invesco Ltd.
This report must be accompanied or preceded by a currently effective Fund prospectus and variable product prospectus, which contain more complete information, including sales charges and expenses. Investors should read each carefully before investing.
NOT FDIC INSURED | MAY LOSE VALUE | NO BANK GUARANTEE
| Invesco Distributors, Inc. | VIIGR-SAR-1 |
Performance summary
Fund vs. Indexes
Cumulative total returns, December 31, 2018 to June 30, 2019, excluding variable product issuer charges. If variable product issuer charges were included, returns would be lower.
| Series I Shares | 19.86% |
| Series II Shares | 19.75 |
| MSCI All Country World ex USA Index▼ (Broad Market Index) | 13.60 |
Custom Invesco International Growth Index■
(Style-Specific Index) | 17.20 |
Lipper VUF International Large-Cap Growth Funds Index♦
(Peer Group Index) | 18.03 |
| Source(s):▼RIMES Technologies Corp.;■ Invesco, RIMES Technologies Corp.;♦ Lipper Inc. |
The MSCI All Country World ex USA® Indexis an index considered representative of developed and emerging stock markets, excluding the U.S. The index is computed using the net return, which withholds applicable taxes for non-resident investors.
TheCustom Invesco International Growth Index is composed of the MSCI EAFE Growth Index through Feb. 28, 2013, and the MSCI All Country World ex-U.S. Growth Index thereafter.
TheLipper VUF International Large-Cap Growth Funds Indexis an unmanaged index considered representative of international large-cap growth variable insurance underlying funds tracked by Lipper.
The MSCI EAFE® Growth Indexis an unmanaged index considered representative of growth stocks of Europe, Australasia and the Far East. It is computed using the net return, which withholds applicable taxes for non-resident investors.
TheMSCI All Country World ex-U.S. Growth Index is a market capitalization weighted index that includes growth companies in developed and emerging markets, excluding the US. It is computed using the net return, which withholds applicable taxes for non-resident investors.
The Fund is not managed to track the performance of any particular index, including the indexes described here, and consequently, the performance of the Fund may deviate significantly from the performance of the indexes.
A direct investment cannot be made in an index. Unless otherwise indicated, index results include reinvested dividends, and they do not reflect sales charges. Performance of the peer group, if applicable, reflects fund expenses; performance of a market index does not.
| Average Annual Total Returns |
| As of 6/30/19 | |
| Series I Shares | |
| Inception (5/5/93) | 7.04% |
| 10 Years | 8.00 |
| 5 Years | 2.84 |
| 1 Year | 8.12 |
| Series II Shares | |
| Inception (9/19/01) | 7.14% |
| 10 Years | 7.73 |
| 5 Years | 2.59 |
| 1 Year | 7.85 |
The performance of the Fund’s Series I and Series II share classes will differ primarily due to different class expenses.
The performance data quoted represent past performance and cannot guarantee comparable future results; current performance may be lower or higher. Please contact your variable product issuer or financial adviser for the most recent month-end variable product performance. Performance figures reflect Fund expenses, reinvested distributions and changes in net asset value. Performance figures do not reflect deduction of taxes a shareholder would pay on Fund distributions or sale of Fund shares. Investment return and principal value will fluctuate so that you may have a gain or loss when you sell shares.
The net annual Fund operating expense ratio set forth in the most recent Fund prospectus as of the date of this report for Series I and Series II shares was 0.93% and 1.18%, respectively.1 The total annual Fund operating expense ratio set forth in the most recent Fund prospectus as of the date of this report for Series I and Series II shares was 0.94% and 1.19%, respectively. The expense ratios presented above may vary from the expense ratios presented in other sections of this report that are based on expenses incurred during the period covered by this report.
Invesco V.I. International Growth Fund, a series portfolio of AIM Variable Insurance Funds (Invesco Variable Insurance Funds), is currently offered through insurance companies issuing
variable products. You cannot purchase shares of the Fund directly. Performance figures given represent the Fund and are not intended to reflect actual variable product values. They do not reflect sales charges, expenses and fees assessed in connection with a variable product. Sales charges, expenses and fees, which are determined by the variable product issuers, will vary and will lower the total return.
The most recent month-end performance at the Fund level, excluding variable product charges, is available at 800 451 4246. As mentioned above, for the most recent month-end performance including variable product charges, please contact your variable product issuer or financial adviser.
Invesco V.I. International Growth Fund
Fund performance reflects any applicable fee waivers and/or expense reimbursements. Had the adviser not waived fees and/or reimbursed expenses currently or in the past, returns would have been lower. See current prospectus for more information.
| 1 | Total annual Fund operating expenses after any contractual fee waivers and/or expense reimbursements by the adviser in effect through at least June 30, 2021. See current prospectus for more information. |
Invesco V.I. International Growth Fund
Schedule of Investments
June 30, 2019
(Unaudited)
| | Shares | Value |
| Common Stocks & Other Equity Interests–96.50% |
| Australia–1.87% |
| Brambles Ltd. | 1,740,821 | $15,773,239 |
| CSL Ltd. | 77,295 | 11,693,566 |
| | | | 27,466,805 |
| Brazil–4.56% |
| Ambev S.A., ADR | 4,537,080 | 21,188,164 |
| B3 S.A.–Brasil, Bolsa, Balcao | 2,423,597 | 23,643,001 |
| Banco Bradesco S.A., ADR | 2,251,936 | 22,114,012 |
| | | | 66,945,177 |
| Canada–9.62% |
| Canadian National Railway Co. | 289,002 | 26,747,388 |
| CGI, Inc.(a) | 740,444 | 56,926,350 |
| Nutrien Ltd. | 399,302 | 21,359,326 |
| PrairieSky Royalty Ltd. | 1,338,798 | 18,810,953 |
| Suncor Energy, Inc. | 559,399 | 17,449,849 |
| | | | 141,293,866 |
| China–6.97% |
| Alibaba Group Holding Ltd., ADR(a) | 133,674 | 22,651,059 |
| Kweichow Moutai Co., Ltd., Class A | 113,621 | 16,300,461 |
| New Oriental Education & Technology Group, Inc., ADR(a) | 171,152 | 16,529,860 |
| Wuliangye Yibin Co., Ltd., Class A | 1,132,697 | 19,479,949 |
| Yum China Holdings, Inc. | 593,975 | 27,441,645 |
| | | | 102,402,974 |
| Denmark–1.58% |
| Carlsberg A/S, Class B | 174,990 | 23,203,765 |
| France–8.67% |
| Bureau Veritas S.A. | 915,508 | 22,613,625 |
| EssilorLuxottica S.A. | 96,046 | 12,554,969 |
| Pernod Ricard S.A. | 87,723 | 16,165,286 |
| Schneider Electric S.E. | 282,286 | 25,605,467 |
| Vinci S.A. | 271,431 | 27,829,188 |
| Vivendi S.A. | 821,984 | 22,655,327 |
| | | | 127,423,862 |
| Germany–8.34% |
| Allianz S.E. | 154,539 | 37,246,269 |
| Beiersdorf AG | 72,793 | 8,737,600 |
| Deutsche Boerse AG | 246,578 | 34,879,755 |
| GEA Group AG | 158,579 | 4,505,233 |
| SAP S.E. | 270,397 | 37,169,065 |
| | | | 122,537,922 |
| Italy–2.49% |
| FinecoBank Banca Fineco S.p.A. | 1,606,103 | 17,916,003 |
| | Shares | Value |
| Italy–(continued) |
| Mediobanca Banca di Credito Finanziario S.p.A. | 1,812,642 | $18,705,961 |
| | | | 36,621,964 |
| Japan–8.42% |
| Asahi Group Holdings, Ltd. | 586,100 | 26,411,565 |
| FANUC Corp. | 144,800 | 26,879,823 |
| Hoya Corp. | 390,100 | 29,964,750 |
| Kao Corp. | 130,300 | 9,940,605 |
| Keyence Corp. | 34,000 | 20,894,342 |
| Komatsu Ltd. | 397,200 | 9,625,412 |
| | | | 123,716,497 |
| Macau–1.59% |
| Galaxy Entertainment Group Ltd. | 3,460,000 | 23,373,563 |
| Mexico–1.92% |
| Fomento Economico Mexicano, S.A.B. de C.V., ADR | 291,129 | 28,166,731 |
| Netherlands–4.15% |
| ING Groep N.V. | 1,886,064 | 21,870,701 |
| Wolters Kluwer N.V. | 536,257 | 39,040,871 |
| | | | 60,911,572 |
| Singapore–2.05% |
| United Overseas Bank Ltd. | 1,562,166 | 30,183,033 |
| South Korea–2.52% |
| NAVER Corp. | 101,466 | 10,016,730 |
| Samsung Electronics Co., Ltd. | 662,932 | 27,029,047 |
| | | | 37,045,777 |
| Spain–1.51% |
| Amadeus IT Group S.A. | 280,425 | 22,191,740 |
| Sweden–2.82% |
| Investor AB, Class B | 861,807 | 41,403,862 |
| Switzerland–6.29% |
| Alcon, Inc.(a) | 193,742 | 11,982,605 |
| Cie Financiere Richemont S.A. | 209,601 | 17,789,675 |
| Julius Baer Group Ltd. | 294,544 | 13,139,918 |
| Kuehne + Nagel International AG | 107,858 | 16,011,575 |
| Novartis AG | 291,336 | 26,647,632 |
| UBS Group AG(a) | 575,987 | 6,845,343 |
| | | | 92,416,748 |
| Taiwan–2.19% |
| Taiwan Semiconductor Manufacturing Co. Ltd., ADR | 823,069 | 32,239,613 |
See accompanying Notes to Financial Statements which are an integral part of the financial statements.
Invesco V.I. International Growth Fund
| | Shares | Value |
| Thailand–0.53% |
| Kasikornbank PCL, NVDR | 1,267,000 | $7,767,050 |
| Turkey–0.75% |
| Akbank T.A.S.(a) | 9,432,012 | 11,076,795 |
| United Kingdom–12.88% |
| Amcor Ltd. | 2,099,273 | 23,860,734 |
| British American Tobacco PLC | 731,777 | 25,541,939 |
| Compass Group PLC | 948,666 | 22,734,983 |
| Informa PLC | 2,498,146 | 26,521,128 |
| Reckitt Benckiser Group PLC | 244,588 | 19,329,139 |
| RELX PLC | 1,526,818 | 37,108,119 |
| Royal Dutch Shell PLC, Class B | 422,269 | 13,773,803 |
| TechnipFMC PLC | 785,121 | 20,334,546 |
| | | | 189,204,391 |
| United States–4.78% |
| Broadcom, Inc. | 137,019 | 39,442,289 |
| | Shares | Value |
| United States–(continued) |
| Philip Morris International, Inc. | 391,828 | $30,770,253 |
| | | | 70,212,542 |
| Total Common Stocks & Other Equity Interests (Cost $1,017,408,976) | 1,417,806,249 |
| Money Market Funds–3.16% |
| Invesco Government & Agency Portfolio, Institutional Class, 2.26%(b) | 16,246,470 | 16,246,470 |
| Invesco Liquid Assets Portfolio, Institutional Class, 2.40%(b) | 11,613,919 | 11,618,565 |
| Invesco Treasury Portfolio, Institutional Class, 2.22%(b) | 18,567,393 | 18,567,393 |
| Total Money Market Funds (Cost $46,428,672) | 46,432,428 |
| TOTAL INVESTMENTS IN SECURITIES—99.66% (Cost $1,063,837,648) | 1,464,238,677 |
| OTHER ASSETS LESS LIABILITIES–0.34% | 4,951,590 |
| NET ASSETS–100.00% | $1,469,190,267 |
Investment Abbreviations:
| ADR | – American Depositary Receipt |
| NVDR | – Non-Voting Depositary Receipt |
Notes to Schedule of Investments:
| (a) | Non-income producing security. |
| (b) | The money market fund and the Fund are affiliated by having the same investment adviser. The rate shown is the 7-day SEC standardized yield as of June 30, 2019. |
Portfolio Composition
By sector, based on Net Assets
as of June 30, 2019
| Financials | 19.52% |
| Industrials | 17.13 |
| Consumer Staples | 16.70 |
| Information Technology | 16.06 |
| Consumer Discretionary | 9.74 |
| Health Care | 5.47 |
| Energy | 4.79 |
| Communication Services | 4.02 |
| Materials | 3.07 |
| Money Market Funds Plus Other Assets Less Liabilities | 3.50 |
See accompanying Notes to Financial Statements which are an integral part of the financial statements.
Invesco V.I. International Growth Fund
Statement of Assets and Liabilities
June 30, 2019
(Unaudited)
| Assets: | |
Investments in securities, at value
(Cost $1,017,408,976) | $1,417,806,249 |
| Investments in affiliated money market funds, at value (Cost $46,428,672) | 46,432,428 |
| Foreign currencies, at value (Cost $2,449,883) | 2,452,188 |
| Receivable for: | |
| Fund shares sold | 388,716 |
| Investments sold | 4,901,623 |
| Dividends | 5,150,169 |
| Investment for trustee deferred compensation and retirement plans | 259,930 |
| Total assets | 1,477,391,303 |
| Liabilities: | |
| Payable for: | |
| Investments purchased | 5,433,619 |
| Fund shares reacquired | 1,090,435 |
| Accrued foreign taxes | 45,657 |
| Accrued fees to affiliates | 1,207,862 |
| Accrued trustees’ and officers’ fees and benefits | 245 |
| Accrued other operating expenses | 138,622 |
| Trustee deferred compensation and retirement plans | 284,596 |
| Total liabilities | 8,201,036 |
| Net assets applicable to shares outstanding | $1,469,190,267 |
| Net assets consist of: | |
| Shares of beneficial interest | $949,598,323 |
| Distributable earnings | 519,591,944 |
| | $1,469,190,267 |
| Net Assets: |
| Series I | $464,192,859 |
| Series II | $1,004,997,408 |
| Shares outstanding, no par value, with an unlimited number of shares authorized: |
| Series I | 11,741,446 |
| Series II | 25,816,264 |
| Series I: | |
| Net asset value per share | $39.53 |
| Series II: | |
| Net asset value per share | $38.93 |
Statement of Operations
For the six months ended June 30, 2019
(Unaudited)
| Investment income: | |
| Dividends (net of foreign withholding taxes of $2,384,801) | $21,888,238 |
| Dividends from affiliated money market funds | 771,002 |
| Total investment income | 22,659,240 |
| Expenses: | |
| Advisory fees | 4,968,352 |
| Administrative services fees | 1,142,894 |
| Custodian fees | 96,331 |
| Distribution fees - Series II | 1,193,085 |
| Transfer agent fees | 67,519 |
| Trustees’ and officers’ fees and benefits | 21,351 |
| Reports to shareholders | 7,413 |
| Professional services fees | 51,945 |
| Other | 26,015 |
| Total expenses | 7,574,905 |
| Less: Fees waived | (34,838) |
| Net expenses | 7,540,067 |
| Net investment income | 15,119,173 |
| Realized and unrealized gain (loss) from: | |
| Net realized gain (loss) from: | |
| Investment securities | 22,004,942 |
| Foreign currencies | (124,449) |
| | 21,880,493 |
| Change in net unrealized appreciation of: | |
| Investment securities (net of foreign taxes of $21,286) | 212,181,692 |
| Foreign currencies | 242 |
| | 212,181,934 |
| Net realized and unrealized gain | 234,062,427 |
| Net increase in net assets resulting from operations | $249,181,600 |
See accompanying Notes to Financial Statements which are an integral part of the financial statements.
Invesco V.I. International Growth Fund
Statement of Changes in Net Assets
For the six months ended June 30, 2019 and the year ended December 31, 2018
(Unaudited)
| | June 30,
2019 | December 31,
2018 |
| Operations: | | |
| Net investment income | $15,119,173 | $27,428,724 |
| Net realized gain | 21,880,493 | 141,516,648 |
| Change in net unrealized appreciation (depreciation) | 212,181,934 | (430,688,387) |
| Net increase (decrease) in net assets resulting from operations | 249,181,600 | (261,743,015) |
| Distributions to shareholders from distributable earnings: | | |
| Series I | — | (14,207,500) |
| Series II | — | (29,812,608) |
| Total distributions from distributable earnings | — | (44,020,108) |
| Share transactions–net: | | |
| Series I | (30,882,719) | (118,679,986) |
| Series II | (26,611,635) | (374,671,558) |
| Net increase (decrease) in net assets resulting from share transactions | (57,494,354) | (493,351,544) |
| Net increase (decrease) in net assets | 191,687,246 | (799,114,667) |
| Net assets: | | |
| Beginning of period | 1,277,503,021 | 2,076,617,688 |
| End of period | $1,469,190,267 | $1,277,503,021 |
See accompanying Notes to Financial Statements which are an integral part of the financial statements.
Invesco V.I. International Growth Fund
Financial Highlights
June 30, 2019
(Unaudited)
The following schedule presents financial highlights for a share of the Fund outstanding throughout the periods indicated.
| | Net asset
value,
beginning
of period | Net
investment
income(a) | Net gains
(losses)
on securities
(both
realized and
unrealized) | Total from
investment
operations | Dividends
from net
investment
income | Distributions
from net
realized
gains | Total
distributions | Net asset
value, end
of period | Total
return(b) | Net assets,
end of period
(000’s omitted) | Ratio of
expenses
to average
net assets
with fee waivers
and/or expenses
absorbed | Ratio of
expenses
to average net
assets without
fee waivers
and/or expenses
absorbed | Ratio of net
investment
income
to average
net assets | Portfolio
turnover(c) |
| Series I |
| Six months ended 06/30/19 | $32.98 | $0.43 | $6.12 | $6.55 | $— | $— | $— | $39.53 | 19.86% | $464,193 | 0.91%(d) | 0.91%(d) | 2.32%(d) | 19% |
| Year ended 12/31/18 | 39.89 | 0.66 | (6.51) | (5.85) | (0.79) | (0.27) | (1.06) | 32.98 | (14.97) | 414,774 | 0.92 | 0.93 | 1.74 | 35 |
| Year ended 12/31/17 | 32.89 | 0.49 | 7.06 | 7.55 | (0.55) | — | (0.55) | 39.89 | 23.00 | 627,894 | 0.92 | 0.93 | 1.34 | 34 |
| Year ended 12/31/16 | 33.49 | 0.50 | (0.63) | (0.13) | (0.47) | — | (0.47) | 32.89 | (0.45) | 540,460 | 0.95 | 0.96 | 1.51 | 18 |
| Year ended 12/31/15 | 34.87 | 0.48 | (1.33) | (0.85) | (0.53) | — | (0.53) | 33.49 | (2.34) | 601,760 | 1.00 | 1.01 | 1.35 | 22 |
| Year ended 12/31/14 | 35.32 | 0.56 | (0.44) | 0.12 | (0.57) | — | (0.57) | 34.87 | 0.33 | 647,530 | 1.01 | 1.02 | 1.58 | 26 |
| Series II |
| Six months ended 06/30/19 | 32.52 | 0.38 | 6.03 | 6.41 | — | — | — | 38.93 | 19.71 | 1,004,997 | 1.16(d) | 1.16(d) | 2.07(d) | 19 |
| Year ended 12/31/18 | 39.33 | 0.56 | (6.42) | (5.86) | (0.68) | (0.27) | (0.95) | 32.52 | (15.18) | 862,729 | 1.17 | 1.18 | 1.49 | 35 |
| Year ended 12/31/17 | 32.44 | 0.40 | 6.96 | 7.36 | (0.47) | — | (0.47) | 39.33 | 22.73 | 1,448,723 | 1.17 | 1.18 | 1.09 | 34 |
| Year ended 12/31/16 | 33.04 | 0.41 | (0.62) | (0.21) | (0.39) | — | (0.39) | 32.44 | (0.70) | 1,167,820 | 1.20 | 1.21 | 1.26 | 18 |
| Year ended 12/31/15 | 34.42 | 0.38 | (1.31) | (0.93) | (0.45) | — | (0.45) | 33.04 | (2.61) | 1,169,823 | 1.25 | 1.26 | 1.10 | 22 |
| Year ended 12/31/14 | 34.88 | 0.47 | (0.43) | 0.04 | (0.50) | — | (0.50) | 34.42 | 0.09 | 1,079,488 | 1.26 | 1.27 | 1.33 | 26 |
| (a) | Calculated using average shares outstanding. |
| (b) | Includes adjustments in accordance with accounting principles generally accepted in the United States of America and as such, the net asset value for financial reporting purposes and the returns based upon those net asset values may differ from the net asset value and returns for shareholder transactions. Total returns are not annualized for periods less than one year, if applicable, and do not reflect charges assessed in connection with a variable product, which if included would reduce total returns. |
| (c) | Portfolio turnover is calculated at the fund level and is not annualized for periods less than one year, if applicable. |
| (d) | Ratios are annualized and based on average daily net assets (000’s omitted) of $451,058 and $962,378 for Series I and Series II shares, respectively. |
See accompanying Notes to Financial Statements which are an integral part of the financial statements.
Invesco V.I. International Growth Fund
Notes to Financial Statements
June 30, 2019
(Unaudited)
NOTE 1—Significant Accounting Policies
Invesco V.I. International Growth Fund (the “Fund”) is a series portfolio of AIM Variable Insurance Funds (Invesco Variable Insurance Funds) (the “Trust”). The Trust is a Delaware statutory trust registered under the Investment Company Act of 1940, as amended (the “1940 Act”), as an open-end series management investment company. Information presented in these financial statements pertains only to the Fund. Matters affecting the Fund or each class will be voted on exclusively by the shareholders of the Fund or each class. Current Securities and Exchange Commission (“SEC”) guidance, however, requires participating insurance companies offering separate accounts to vote shares proportionally in accordance with the instructions of the contract owners whose investments are funded by shares of each Fund or class.
The Fund’s investment objective is long-term growth of capital.
The Fund currently offers two classes of shares, Series I and Series II, both of which are offered to insurance company separate accounts funding variable annuity contracts and variable life insurance policies (“variable products”).
The Fund is an investment company and accordingly follows the investment company accounting and reporting guidance in accordance with Financial Accounting Standards Board Accounting Standards Codification Topic 946,Financial Services – Investment Companies.
The following is a summary of the significant accounting policies followed by the Fund in the preparation of its financial statements.
| A. | Security Valuations — Securities, including restricted securities, are valued according to the following policy. |
A security listed or traded on an exchange (except convertible securities) is valued at its last sales price or official closing price as of the close of the customary trading session on the exchange where the security is principally traded, or lacking any sales or official closing price on a particular day, the security may be valued at the closing bid price on that day. Securities traded in the over-the-counter market are valued based on prices furnished by independent pricing services or market makers. When such securities are valued by an independent pricing service they may be considered fair valued. Futures contracts are valued at the final settlement price set by an exchange on which they are principally traded. Listed options are valued at the mean between the last bid and asked prices from the exchange on which they are principally traded. Options not listed on an exchange are valued by an independent source at the mean between the last bid and asked prices. For purposes of determining net asset value (“NAV”) per share, futures and option contracts generally are valued 15 minutes after the close of the customary trading session of the New York Stock Exchange (“NYSE”).
Investments in open-end and closed-end registered investment companies that do not trade on an exchange are valued at the end-of-day net asset value per share. Investments in open-end and closed-end registered investment companies that trade on an exchange are valued at the last sales price or official closing price as of the close of the customary trading session on the exchange where the security is principally traded.
Debt obligations (including convertible securities) and unlisted equities are fair valued using an evaluated quote provided by an independent pricing service. Evaluated quotes provided by the pricing service may be determined without exclusive reliance on quoted prices, and may reflect appropriate factors such as institution-size trading in similar groups of securities, developments related to specific securities, dividend rate (for unlisted equities), yield (for debt obligations), quality, type of issue, coupon rate (for debt obligations), maturity (for debt obligations), individual trading characteristics and other market data. Pricing services generally value debt obligations assuming orderly transactions of institutional round lot size, but a fund may hold or transact in the same securities in smaller, odd lot sizes. Odd lots often trade at lower prices than institutional round lots. Debt obligations are subject to interest rate and credit risks. In addition, all debt obligations involve some risk of default with respect to interest and/or principal payments.
Foreign securities’ (including foreign exchange contracts) prices are converted into U.S. dollar amounts using the applicable exchange rates as of the close of the NYSE. If market quotations are available and reliable for foreign exchange-traded equity securities, the securities will be valued at the market quotations. Because trading hours for certain foreign securities end before the close of the NYSE, closing market quotations may become unreliable. If between the time trading ends on a particular security and the close of the customary trading session on the NYSE, events occur that the investment adviser determines are significant and make the closing price unreliable, the Fund may fair value the security. If the event is likely to have affected the closing price of the security, the security will be valued at fair value in good faith using procedures approved by the Board of Trustees. Adjustments to closing prices to reflect fair value may also be based on a screening process of an independent pricing service to indicate the degree of certainty, based on historical data, that the closing price in the principal market where a foreign security trades is not the current value as of the close of the NYSE. Foreign securities’ prices meeting the approved degree of certainty that the price is not reflective of current value will be priced at the indication of fair value from the independent pricing service. Multiple factors may be considered by the independent pricing service in determining adjustments to reflect fair value and may include information relating to sector indices, American Depositary Receipts and domestic and foreign index futures. Foreign securities may have additional risks including exchange rate changes, potential for sharply devalued currencies and high inflation, political and economic upheaval, the relative lack of issuer information, relatively low market liquidity and the potential lack of strict financial and accounting controls and standards.
Securities for which market prices are not provided by any of the above methods may be valued based upon quotes furnished by independent sources. The last bid price may be used to value equity securities. The mean between the last bid and asked prices is used to value debt obligations, including corporate loans.
Securities for which market quotations are not readily available or became unreliable are valued at fair value as determined in good faith by or under the supervision of the Trust’s officers following procedures approved by the Board of Trustees. Issuer specific events, market trends, bid/asked quotes of brokers and information providers and other market data may be reviewed in the course of making a good faith determination of a security’s fair value.
The Fund may invest in securities that are subject to interest rate risk, meaning the risk that the prices will generally fall as interest rates rise and, conversely, the prices will generally rise as interest rates fall. Specific securities differ in their sensitivity to changes in interest rates depending on their individual characteristics. Changes in interest rates may result in increased market volatility, which may affect the value and/or liquidity of certain Fund investments.
Invesco V.I. International Growth Fund
Valuations change in response to many factors including the historical and prospective earnings of the issuer, the value of the issuer’s assets, general economic conditions, interest rates, investor perceptions and market liquidity. Because of the inherent uncertainties of valuation, the values reflected in the financial statements may materially differ from the value received upon actual sale of those investments.
| B. | Securities Transactions and Investment Income — Securities transactions are accounted for on a trade date basis. Realized gains or losses on sales are computed on the basis of specific identification of the securities sold. Interest income (net of withholding tax, if any) is recorded on the accrual basis from settlement date. Dividend income (net of withholding tax, if any) is recorded on the ex-dividend date. |
The Fund may periodically participate in litigation related to Fund investments. As such, the Fund may receive proceeds from litigation settlements. Any proceeds received are included in the Statement of Operations as realized gain (loss) for investments no longer held and as unrealized gain (loss) for investments still held.
Brokerage commissions and mark ups are considered transaction costs and are recorded as an increase to the cost basis of securities purchased and/or a reduction of proceeds on a sale of securities. Such transaction costs are included in the determination of net realized and unrealized gain (loss) from investment securities reported in the Statement of Operations and the Statement of Changes in Net Assets and the net realized and unrealized gains (losses) on securities per share in the Financial Highlights. Transaction costs are included in the calculation of the Fund’s net asset value and, accordingly, they reduce the Fund’s total returns. These transaction costs are not considered operating expenses and are not reflected in net investment income reported in the Statement of Operations and the Statement of Changes in Net Assets, or the net investment income per share and the ratios of expenses and net investment income reported in the Financial Highlights, nor are they limited by any expense limitation arrangements between the Fund and the investment adviser.
The Fund allocates income and realized and unrealized capital gains and losses to a class based on the relative net assets of each class.
| C. | Country Determination — For the purposes of making investment selection decisions and presentation in the Schedule of Investments, the investment adviser may determine the country in which an issuer is located and/or credit risk exposure based on various factors. These factors include the laws of the country under which the issuer is organized, where the issuer maintains a principal office, the country in which the issuer derives 50% or more of its total revenues and the country that has the primary market for the issuer’s securities, as well as other criteria. Among the other criteria that may be evaluated for making this determination are the country in which the issuer maintains 50% or more of its assets, the type of security, financial guarantees and enhancements, the nature of the collateral and the sponsor organization. Country of issuer and/or credit risk exposure has been determined to be the United States of America, unless otherwise noted. |
| D. | Distributions– Distributions from net investment income and net realized capital gain, if any, are generally declared and paid to separate accounts of participating insurance companies annually and recorded on the ex-dividend date. |
| E. | Federal Income Taxes –The Fund intends to comply with the requirements of Subchapter M of the Internal Revenue Code of 1986, as amended (the “Internal Revenue Code”), necessary to qualify as a regulated investment company and to distribute substantially all of the Fund’s taxable earnings to shareholders. As such, the Fund will not be subject to federal income taxes on otherwise taxable income (including net realized capital gain) that is distributed to shareholders. Therefore, no provision for federal income taxes is recorded in the financial statements. |
The Fund recognizes the tax benefits of uncertain tax positions only when the position is more likely than not to be sustained. Management has analyzed the Fund’s uncertain tax positions and concluded that no liability for unrecognized tax benefits should be recorded related to uncertain tax positions. Management is not aware of any tax positions for which it is reasonably possible that the total amounts of unrecognized tax benefits will change materially in the next 12 months.
The Fund files tax returns in the U.S. Federal jurisdiction and certain other jurisdictions. Generally, the Fund is subject to examinations by such taxing authorities for up to three years after the filing of the return for the tax period.
| F. | Expenses– Fees provided for under the Rule 12b-1 plan of a particular class of the Fund and which are directly attributable to that class are charged to the operations of such class. All other expenses are allocated among the classes based on relative net assets. |
| G. | Accounting Estimates – The preparation of financial statements in conformity with accounting principles generally accepted in the United States of America (“GAAP”) requires management to make estimates and assumptions that affect the reported amounts of assets and liabilities at the date of the financial statements and the reported amounts of revenues and expenses during the reporting period including estimates and assumptions related to taxation. Actual results could differ from those estimates by a significant amount. In addition, the Fund monitors for material events or transactions that may occur or become known after the period-end date and before the date the financial statements are released to print. |
| H. | Indemnifications – Under the Trust’s organizational documents, each Trustee, officer, employee or other agent of the Trust is indemnified against certain liabilities that may arise out of the performance of their duties to the Fund. Additionally, in the normal course of business, the Fund enters into contracts, including the Fund’s servicing agreements, that contain a variety of indemnification clauses. The Fund’s maximum exposure under these arrangements is unknown as this would involve future claims that may be made against the Fund that have not yet occurred. The risk of material loss as a result of such indemnification claims is considered remote. |
| I. | Foreign Currency Translations— Foreign currency is valued at the close of the NYSE based on quotations posted by banks and major currency dealers. Portfolio securities and other assets and liabilities denominated in foreign currencies are translated into U.S. dollar amounts at the date of valuation. Purchases and sales of portfolio securities (net of foreign taxes withheld on disposition) and income items denominated in foreign currencies are translated into U.S. dollar amounts on the respective dates of such transactions. The Fund does not separately account for the portion of the results of operations resulting from changes in foreign exchange rates on investments and the fluctuations arising from changes in market prices of securities held. The combined results of changes in foreign exchange rates and the fluctuation of market prices on investments (net of estimated foreign tax withholding) are included with the net realized and unrealized gain or loss from investments in the Statement of Operations. Reported net realized foreign currency gains or losses arise from (1) sales of foreign currencies, (2) currency gains or losses realized between the trade and settlement dates on securities transactions, and (3) the difference between the amounts of dividends, interest, and foreign withholding taxes recorded on the Fund’s books and the U.S. dollar equivalent of the amounts actually received or paid. Net unrealized foreign currency gains and losses arise from changes in the fair values of assets and liabilities, other than investments in securities at fiscal period end, resulting from changes in exchange rates. |
The Fund may invest in foreign securities, which may be subject to foreign taxes on income, gains on investments or currency repatriation, a portion of which may be recoverable. Foreign taxes, if any, are recorded based on the tax regulations and rates that exist in the foreign markets in which the Fund invests and are shown in the Statement of Operations.
Invesco V.I. International Growth Fund
| J. | Forward Foreign Currency Contracts— The Fund may engage in foreign currency transactions either on a spot (i.e. for prompt delivery and settlement) basis, or through forward foreign currency contracts, to manage or minimize currency or exchange rate risk. |
The Fund may also enter into forward foreign currency contracts for the purchase or sale of a security denominated in a foreign currency in order to “lock in” the U.S. dollar price of that security, or the Fund may also enter into forward foreign currency contracts that do not provide for physical settlement of the two currencies, but instead are settled by a single cash payment calculated as the difference between the agreed upon exchange rate and the spot rate at settlement based upon an agreed upon notional amount (non-deliverable forwards). The Fund will set aside liquid assets in an amount equal to the daily mark-to-market obligation for forward foreign currency contracts.
A forward foreign currency contract is an obligation between two parties (“Counterparties”) to purchase or sell a specific currency for an agreed-upon price at a future date. The use of forward foreign currency contracts does not eliminate fluctuations in the price of the underlying securities the Fund owns or intends to acquire but establishes a rate of exchange in advance. Fluctuations in the value of these contracts are measured by the difference in the contract date and reporting date exchange rates and are recorded as unrealized appreciation (depreciation) until the contracts are closed. When the contracts are closed, realized gains (losses) are recorded. Realized and unrealized gains (losses) on the contracts are included in the Statement of Operations. The primary risks associated with forward foreign currency contracts include failure of the Counterparty to meet the terms of the contract and the value of the foreign currency changing unfavorably. These risks may be in excess of the amounts reflected in the Statement of Assets and Liabilities.
NOTE 2—Advisory Fees and Other Fees Paid to Affiliates
The Trust has entered into a master investment advisory agreement with Invesco Advisers, Inc. (the "Adviser" or "Invesco"). Under the terms of the investment advisory agreement, the Fund accrues daily and pays monthly an advisory fee to the Adviser based on the annual rate of the Fund’s average daily net assets as follows:
| Average Daily Net Assets | Rate |
| First $250 million | 0.75% |
| Over $250 million | 0.70% |
For the six months ended June 30, 2019, the effective advisory fees incurred by the Fund was 0.71%.
Under the terms of a master sub-advisory agreement between the Adviser and each of Invesco Asset Management Deutschland GmbH, Invesco Asset Management Limited, Invesco Asset Management (Japan) Limited, Invesco Hong Kong Limited, Invesco Senior Secured Management, Inc. and Invesco Canada Ltd. and separate sub-advisory agreements with Invesco Capital Management LLC and Invesco Asset Management (India) Private Limited (collectively, the "Affiliated Sub-Advisers") the Adviser, not the Fund, will pay 40% of the fees paid to the Adviser to any such Affiliated Sub-Adviser(s) that provide(s) discretionary investment management services to the Fund based on the percentage of assets allocated to such Affiliated Sub-Adviser(s).
The Adviser has contractually agreed, through at least June 30, 2020, to waive advisory fees and/or reimburse expenses of all shares to the extent necessary to limit total annual fund operating expenses after fee waiver and/or expense reimbursement (excluding certain items discussed below) of Series I shares to 2.25% and Series II shares to 2.50% of average daily net assets (the “expense limits”). In determining the Adviser’s obligation to waive advisory fees and/or reimburse expenses, the following expenses are not taken into account, and could cause the total annual fund operating expenses after fee waiver and/or expense reimbursement to exceed the numbers reflected above: (1) interest; (2) taxes; (3) dividend expense on short sales; (4) extraordinary or non-routine items, including litigation expenses; and (5) expenses that the Fund has incurred but did not actually pay because of an expense offset arrangement. Unless Invesco continues the fee waiver agreement, it will terminate on June 30, 2020. During its term, the fee waiver agreement cannot be terminated or amended to increase the expense limits or reduce the advisory fee waiver without approval of the Board of Trustees. The Adviser did not waive fees and/or reimburse expenses during the period under these expense limits.
Further, the Adviser has contractually agreed, through at least June 30, 2021, to waive the advisory fee payable by the Fund in an amount equal to 100% of the net advisory fees the Adviser receives from the affiliated money market funds on investments by the Fund of uninvested cash in such affiliated money market funds.
For the six months ended June 30, 2019, the Adviser waived advisory fees of $34,838.
The Trust has entered into a master administrative services agreement with Invesco pursuant to which the Fund has agreed to pay Invesco a fee for costs incurred in providing accounting services and fund administrative services to the Fund and to reimburse Invesco for fees paid to insurance companies that have agreed to provide certain administrative services to the Fund. These administrative services provided by the insurance companies may include, among other things: maintenance of master accounts with the Fund; tracking, recording and transmitting net purchase and redemption orders for Fund shares; maintaining and preserving records related to the purchase, redemption and other account activity of variable product owners; distributing copies of Fund documents such as prospectuses, proxy materials and periodic reports, to variable product owners, and responding to inquiries from variable product owners about the Fund. Pursuant to such agreement, for the six months ended June 30, 2019, Invesco was paid $98,937 for accounting and fund administrative services and was reimbursed $1,043,957 for fees paid to insurance companies. Also, Invesco has entered into a sub-administration agreement whereby State Street Bank and Trust Company (“SSB”) serves as custodian and fund accountant and provides certain administrative services to the Fund.
The Trust has entered into a transfer agency and service agreement with Invesco Investment Services, Inc. (“IIS”) pursuant to which the Fund has agreed to pay IIS a fee for providing transfer agency and shareholder services to the Fund and reimburse IIS for certain expenses incurred by IIS in the course of providing such services. For the six months ended June 30, 2019, expenses incurred under the agreement are shown in the Statement of Operations asTransfer agent fees.
The Trust has entered into a master distribution agreement with Invesco Distributors, Inc. (“IDI”) to serve as the distributor for the Fund. The Trust has adopted a plan pursuant to Rule 12b-1 under the 1940 Act with respect to the Fund’s Series II shares (the “Plan”). The Fund, pursuant to the Plan, pays IDI compensation at the annual rate of 0.25% of the Fund’s average daily net assets of Series II shares. The fees are accrued daily and paid monthly. Of the Plan payments, up to 0.25% of the average daily net assets of the Series II shares may be paid to insurance companies who furnish continuing personal shareholder services to customers who purchase and own Series II shares of the Fund. For the six months ended June 30, 2019, expenses incurred under the Plan are detailed in the Statement of Operations asDistribution fees.
Invesco V.I. International Growth Fund
Certain officers and trustees of the Trust are officers and directors of the Adviser, IIS and/or IDI.
NOTE 3—Additional Valuation Information
GAAP defines fair value as the price that would be received to sell an asset or paid to transfer a liability in an orderly transaction between market participants at the measurement date, under current market conditions. GAAP establishes a hierarchy that prioritizes the inputs to valuation methods, giving the highest priority to readily available unadjusted quoted prices in an active market for identical assets (Level 1) and the lowest priority to significant unobservable inputs (Level 3), generally when market prices are not readily available or are unreliable. Based on the valuation inputs, the securities or other investments are tiered into one of three levels. Changes in valuation methods may result in transfers in or out of an investment’s assigned level:
Level 1 – Prices are determined using quoted prices in an active market for identical assets.
Level 2 – Prices are determined using other significant observable inputs. Observable inputs are inputs that other market participants may use in pricing a security. These may include quoted prices for similar securities, interest rates, prepayment speeds, credit risk, yield curves, loss severities, default rates, discount rates, volatilities and others.
Level 3 – Prices are determined using significant unobservable inputs. In situations where quoted prices or observable inputs are unavailable (for example, when there is little or no market activity for an investment at the end of the period), unobservable inputs may be used. Unobservable inputs reflect the Fund’s own assumptions about the factors market participants would use in determining fair value of the securities or instruments and would be based on the best available information.
The following is a summary of the tiered valuation input levels, as of June 30, 2019. The level assigned to the securities valuations may not be an indication of the risk or liquidity associated with investing in those securities. Because of the inherent uncertainties of valuation, the values reflected in the financial statements may materially differ from the value received upon actual sale of those investments.
| | Level 1 | Level 2 | Level 3 | Total |
| Investments in Securities | | | | |
| Australia | $— | $27,466,805 | $— | $27,466,805 |
| Brazil | 66,945,177 | — | — | 66,945,177 |
| Canada | 141,293,866 | — | — | 141,293,866 |
| China | 66,622,564 | 35,780,410 | — | 102,402,974 |
| Denmark | — | 23,203,765 | — | 23,203,765 |
| France | — | 127,423,862 | — | 127,423,862 |
| Germany | — | 122,537,922 | — | 122,537,922 |
| Italy | — | 36,621,964 | — | 36,621,964 |
| Japan | — | 123,716,497 | — | 123,716,497 |
| Macau | — | 23,373,563 | — | 23,373,563 |
| Mexico | 28,166,731 | — | — | 28,166,731 |
| Netherlands | — | 60,911,572 | — | 60,911,572 |
| Singapore | — | 30,183,033 | — | 30,183,033 |
| South Korea | — | 37,045,777 | — | 37,045,777 |
| Spain | — | 22,191,740 | — | 22,191,740 |
| Sweden | — | 41,403,862 | — | 41,403,862 |
| Switzerland | 11,982,605 | 80,434,143 | — | 92,416,748 |
| Taiwan | 32,239,613 | — | — | 32,239,613 |
| Thailand | — | 7,767,050 | — | 7,767,050 |
| Turkey | — | 11,076,795 | — | 11,076,795 |
| United Kingdom | 23,860,734 | 165,343,657 | — | 189,204,391 |
| United States | 70,212,542 | — | — | 70,212,542 |
| Money Market Funds | 46,432,428 | — | — | 46,432,428 |
| Total Investments | $487,756,260 | $976,482,417 | $— | $1,464,238,677 |
NOTE 4—Trustees’ and Officers’ Fees and Benefits
Trustees’ and Officers’ Fees and Benefits include amounts accrued by the Fund to pay remuneration to certain Trustees and Officers of the Fund. Trustees have the option to defer compensation payable by the Fund, and Trustees’ and Officers’ Fees and Benefits also include amounts accrued by the Fund to fund such deferred compensation amounts. Those Trustees who defer compensation have the option to select various Invesco Funds in which their deferral accounts shall be deemed to be invested. Finally, certain current Trustees were eligible to participate in a retirement plan that provided for benefits to be paid upon retirement to Trustees over a period of time based on the number of years of service. The Fund may have certain former Trustees who also participate in a retirement plan and receive benefits under such plan.Trustees’ and Officers’ Fees and Benefits include amounts accrued by the Fund to fund such retirement benefits. Obligations under the deferred compensation and retirement plans represent unsecured claims against the general assets of the Fund.
Invesco V.I. International Growth Fund
NOTE 5—Cash Balances
The Fund is permitted to temporarily carry a negative or overdrawn balance in its account with State Street Bank and Trust Company, the custodian bank. Such balances, if any at period-end, are shown in the Statement of Assets and Liabilities under the payable caption Amount due custodian. To compensate the custodian bank for such overdrafts, the overdrawn Fund may either (1) leave funds as a compensating balance in the account so the custodian bank can be compensated by earning the additional interest; or (2) compensate by paying the custodian bank at a rate agreed upon by the custodian bank and Invesco, not to exceed the contractually agreed upon rate.
NOTE 6—Tax Information
The amount and character of income and gains to be distributed are determined in accordance with income tax regulations, which may differ from GAAP. Reclassifications are made to the Fund’s capital accounts to reflect income and gains available for distribution (or available capital loss carryforward) under income tax regulations. The tax character of distributions paid during the year and the tax components of net assets will be reported at the Fund’s fiscal year-end.
Capital loss carryforward is calculated and reported as of a specific date. Results of transactions and other activity after that date may affect the amount of capital loss carryforward actually available for the Fund to utilize. Capital losses generated in years beginning after December 22, 2010 can be carried forward for an unlimited period, whereas previous losses expire in eight tax years. Capital losses with an expiration period may not be used to offset capital gains until all net capital losses without an expiration date have been utilized. Capital loss carryforwards with no expiration date will retain their character as either short-term or long-term capital losses instead of as short-term capital losses as under prior law. The ability to utilize capital loss carryforwards in the future may be limited under the Internal Revenue Code and related regulations based on the results of future transactions.
The Fund did not have a capital loss carryforward as of December 31, 2018.
NOTE 7—Investment Transactions
The aggregate amount of investment securities (other than short-term securities, U.S. Treasury obligations and money market funds, if any) purchased and sold by the Fund during the six months ended June 30, 2019 was $261,438,951 and $311,337,941, respectively. Cost of investments, including any derivatives, on a tax basis includes the adjustments for financial reporting purposes as of the most recently completed federal income tax reporting period-end.
| Unrealized Appreciation (Depreciation) of Investments on a Tax Basis |
| Aggregate unrealized appreciation of investments | $420,819,132 |
| Aggregate unrealized (depreciation) of investments | (43,581,175) |
| Net unrealized appreciation of investments | $377,237,957 |
Cost of investments for tax purposes is $1,087,000,720.
NOTE 8—Share Information
| | Summary of Share Activity |
| | Six months ended
June 30, 2019(a) | | Year ended
December 31, 2018 |
| | Shares | Amount | | Shares | Amount |
| Sold: | | | | | |
| Series I | 568,020 | $21,175,253 | | 1,795,725 | $68,266,200 |
| Series II | 1,765,208 | 64,124,000 | | 3,256,967 | 122,515,503 |
| Issued as reinvestment of dividends: | | | | | |
| Series I | — | — | | 378,411 | 14,076,897 |
| Series II | — | — | | 812,333 | 29,812,608 |
| Reacquired: | | | | | |
| Series I | (1,402,331) | (52,057,972) | | (5,338,737) | (201,023,083) |
| Series II | (2,480,669) | (90,735,635) | | (14,373,620) | (526,999,669) |
| Net increase (decrease) in share activity | (1,549,772) | $(57,494,354) | | (13,468,921) | $(493,351,544) |
| (a) | There are entities that are record owners of more than 5% of the outstanding shares of the Fund and in the aggregate own 45% of the outstanding shares of the Fund. The Fund and the Fund’s principal underwriter or adviser, are parties to participation agreements with these entities whereby these entities sell units of interest in separate accounts funding variable products that are invested in the Fund. The Fund, Invesco and/or Invesco affiliates may make payments to these entities, which are considered to be related to the Fund, for providing services to the Fund, Invesco and/or Invesco affiliates including but not limited to services such as, securities brokerage, third party record keeping and account servicing and administrative services. The Fund has no knowledge as to whether all or any portion of the shares owned of record by these entities are also owned beneficially. |
Invesco V.I. International Growth Fund
Calculating your ongoing Fund expenses
Example
As a shareholder of the Fund, you incur ongoing costs, including management fees; distribution and/or service fees (12b-1); and other Fund expenses. This example is intended to help you understand your ongoing costs (in dollars) of investing in the Fund and to compare these costs with ongoing costs of investing in other mutual funds. The example is based on an investment of $1,000 invested at the beginning of the period and held for the entire period January 1, 2019 through June 30, 2019.
The actual and hypothetical expenses in the examples below do not represent the effect of any fees or other expenses assessed in connection with a variable product; if they did, the expenses shown would be higher while the ending account values shown would be lower.
Actual expenses
The table below provides information about actual account values and actual expenses. You may use the information in this table, together with the amount you invested, to estimate the expenses that you paid over the period. Simply divide your account value by $1,000 (for example, an $8,600 account value divided by $1,000 = 8.6), then multiply the result by the number in the table under the heading entitled “Actual Expenses Paid During Period” to estimate the expenses you paid on your account during this period.
Hypothetical example for comparison purposes
The table below also provides information about hypothetical account values and hypothetical expenses based on the Fund’s actual expense ratio and an assumed rate of return of 5% per year before expenses, which is not the Fund’s actual return.
The hypothetical account values and expenses may not be used to estimate the actual ending account balance or expenses you paid for the period. You may use this information to compare the ongoing costs of investing in the Fund and other funds. To do so, compare this 5% hypothetical example with the 5% hypothetical examples that appear in the shareholder reports of the other funds.
Please note that the expenses shown in the table are meant to highlight your ongoing costs. Therefore, the hypothetical information is useful in comparing ongoing costs, and will not help you determine the relative total costs of owning different funds.
| | Beginning
Account Value (01/01/19) | ACTUAL | HYPOTHETICAL
(5% annual return before
expenses) | Annualized
Expense
Ratio |
Ending
Account Value
(06/30/19)1 | Expenses
Paid During
Period2 | Ending
Account Value
(06/30/19) | Expenses
Paid During
Period2 |
| Series I | $1,000.00 | $1,198.60 | $4.96 | $1,020.28 | $4.56 | 0.91% |
| Series II | 1,000.00 | 1,197.50 | 6.32 | 1,019.04 | 5.81 | 1.16 |
| 1 | The actual ending account value is based on the actual total return of the Fund for the period January 1, 2019 through June 30, 2019, after actual expenses and will differ from the hypothetical ending account value which is based on the Fund’s expense ratio and a hypothetical annual return of 5% before expenses. |
| 2 | Expenses are equal to the Fund’s annualized expense ratio as indicated above multiplied by the average account value over the period, multiplied by 181/365 to reflect the most recent fiscal half year. |
Invesco V.I. International Growth Fund
Approval of Investment Advisory andSub-Advisory Contracts
At meetings held on June 10, 2019, the Board of Trustees (the Board or the Trustees) of AIM Variable Insurance Funds (Invesco Variable Insurance Funds) as a whole, and the independent Trustees, who comprise over 75% of the Board, voting separately, approved the continuance of the Invesco V.I. International Growth Fund’s (the Fund) Master Investment Advisory Agreement with Invesco Advisers, Inc. (Invesco Advisers and the investment advisory agreement) and the Master IntergroupSub-Advisory Contract for Mutual Funds with Invesco Asset Management Deutschland GmbH, Invesco Asset Management Limited, Invesco Asset Management (Japan) Limited, Invesco Hong Kong Limited, Invesco Senior Secured Management, Inc. and Invesco Canada Ltd. and separatesub-advisory contracts with Invesco Capital Management LLC and Invesco Asset Management (India) Private Limited (collectively, the AffiliatedSub-Advisers and thesub-advisory contracts) for another year, effective July 1, 2019. After evaluating the factors discussed below, among others, the Board approved the renewal of the Fund’s investment advisory agreement and thesub-advisory contracts and determined that the compensation payable by the Fund to Invesco Advisers and by Invesco Advisers to the AffiliatedSub-Advisers is fair and reasonable.
The Board’s Evaluation Process
The Board’s Investments Committee has established three Sub-Committees, which meet throughout the year to review the performance of funds advised by Invesco Advisers (the Invesco Funds). As part of a regularly scheduled basis of in-person Board meetings, theSub-Committees meet with portfolio managers for their assigned Invesco Funds and other members of management to review detailed information about investment performance and portfolio attributes of these funds. The Board took into account evaluations and reports that it received from the Investments Committee and Sub-Committees, as well as the information provided to such committees and the Board throughout the year, in considering whether to approve each Invesco Fund’s investment advisory agreement and sub-advisory contracts.
As part of the contract renewal process, the Board reviews and considers information provided in response to detailed requests for information submitted to management by the independent Trustees with assistance from legal counsel to the independent Trustees. The Board receives comparative investment performance and fee data regarding the Invesco Funds prepared by Invesco Advisers and Broadridge Financial Solutions, Inc. (Broadridge), an independent mutual fund data provider. The Board also receives an independent written evaluation from the Senior Officer, an officer of the Invesco Funds who reports directly to the
independent Trustees. The Senior Officer’s evaluation is prepared as part of his responsibility to manage the process by which the Invesco Funds’ proposed management fees are negotiated during the annual contract renewal process to ensure they are negotiated in a manner that is at arms’ length and reasonable. In addition to meetings with Invesco Advisers and fund counsel throughout the year, the independent Trustees also discuss the continuance of the investment advisory agreement and sub-advisory contracts in separate sessions with the Senior Officer and with independent legal counsel.
The discussion below is a summary of the Senior Officer’s independent written evaluation with respect to the Fund’s investment advisory agreement, as well as a discussion of the material factors and related conclusions that formed the basis for the Board’s approval of the Fund’s investment advisory agreement andsub-advisory contracts. The Trustees’ review and conclusions are based on the comprehensive consideration of all information presented to them during the course of the year and in prior years and are not the result of any single determinative factor. Moreover, one Trustee may have weighed a particular piece of information or factor differently than another Trustee. This information is current as of June 10, 2019.
Factors and Conclusions and Summary of Independent Written Fee Evaluation
| A. | Nature, Extent and Quality of Services Provided by Invesco Advisers and the Affiliated Sub-Advisers |
The Board reviewed the nature, extent and quality of the advisory services provided to the Fund by Invesco Advisers under the Fund’s investment advisory agreement, and the credentials and experience of the officers and employees of Invesco Advisers who provide these services, including the Fund’s portfolio manager(s). The Board’s review included consideration of Invesco Advisers’ investment process oversight and structure, credit analysis and investment risk management. The Board also considered non-advisory services that Invesco Advisers and its affiliates provide to the Invesco Funds such as various back office support functions, third party oversight, internal audit, valuation, portfolio trading and legal and compliance. The Board also received and reviewed information about Invesco Advisers’ role as administrator of the Invesco Funds’ liquidity risk management program. The Board also reviewed and considered the benefits to shareholders of investing in a fund that is part of the Invesco family of funds under the umbrella of Invesco Ltd., Invesco Advisers’ parent company, and noted Invesco Ltd.’s depth and experience in conducting an investment management business, as well as its
commitment of financial and other resources to such business. The Board reviewed and considered information about the resources that Invesco Advisers intends to continue to commit to managing the Invesco family of funds following Invesco Ltd.’s acquisition of OppenheimerFunds, Inc. and its subsidiaries. The Board concluded that the nature, extent and quality of the services provided to the Fund by Invesco Advisers are appropriate and satisfactory.
The Board reviewed the services that may be provided by the Affiliated Sub-Advisers under the sub-advisory contracts and the credentials and experience of the officers and employees of the Affiliated Sub-Advisers who provide these services. The Board noted the AffiliatedSub-Advisers’ expertise with respect to certain asset classes and that the AffiliatedSub-Advisers have offices and personnel that are located in financial centers around the world. As a result, the Board noted that the Affiliated Sub-Advisers can provide research and investment analysis on the markets and economies of various countries in which the Fund may invest, make recommendations regarding securities and assist with security trades. The Board concluded that thesub-advisory contracts may benefit the Fund and its shareholders by permitting Invesco Advisers to use the resources and talents of the Affiliated Sub-Advisers in managing the Fund. The Board concluded that the nature, extent and quality of the services that may be provided by the Affiliated Sub-Advisers are appropriate and satisfactory.
| B. | Fund Investment Performance |
The Board considered Fund investment performance as a relevant factor in considering whether to approve the investment advisory agreement. The Board did not view Fund investment performance as a relevant factor in considering whether to approve thesub-advisory contracts for the Fund, as no Affiliated Sub-Adviser currently manages assets of the Fund.
The Board compared the Fund’s investment performance over multiple time periods ending December 31, 2018 to the performance of funds in the Broadridge performance universe and against the Lipper Variable Underlying Funds International Large-Cap Growth Funds Index. The Board noted that performance of Series I shares of the Fund was in the fourth quintile of its performance universe for the one year period and the third quintile for the three and five year periods (the first quintile being the best performing funds and the fifth quintile being the worst performing funds). The Board noted that performance of Series I shares of the Fund was below the performance of the Index for the one, three and five year periods. The Board noted that not owning certain names as a result of the valuation component of the Fund’s
Invesco V.I. International Growth Fund
investment process, as well as stock selection in certain sectors and regions detracted from Fund performance. The Trustees also reviewed more recent Fund performance and this review did not change their conclusions.
| C. | Advisory and Sub-Advisory Fees and Fund Expenses |
The Board compared the Fund’s contractual management fee rate to the contractual management fee rates of funds in the Fund’s Broadridge expense group. The Board noted that the contractual management fee rate for Series I shares of the Fund was below the median contractual management fee rate of funds in its expense group. The Board noted that the term “contractual management fee” for funds in the expense group may include both advisory and certain non-portfolio management administrative services fees, but that Broadridge does not provide information on a fund by fund basis as to what is included. The Board also reviewed the methodology used by Broadridge in providing expense group information, which includes using each fund’s contractual management fee schedule (including any applicable breakpoints) as reported in the most recent prospectus or statement of additional information for each fund in the expense group. The Board also considered comparative information regarding the Fund’s total expense ratio and its various components.
The Board noted that Invesco Advisers has contractually agreed to waive fees and/or limit expenses of the Fund for the term disclosed in the Fund’s registration statement in an amount necessary to limit total annual operating expenses to a specified percentage of average daily net assets for each class of the Fund.
The Board also considered the fees charged by Invesco Advisers and the AffiliatedSub-Advisers to other similarly managed client accounts. The Board noted that Invesco Advisers or the Affiliated Sub-Advisers may charge lower fees to large institutional clients. Invesco Advisers reviewed with the Board differences in the scope of services it provides to the Invesco Funds relative to certain other types of client accounts, including management of cash flows as a result of redemptions and purchases, necessary infrastructure such as officers, office space, technology, legal and distribution, oversight of service providers, costs and business risks associated with launching new funds and sponsoring and maintaining the product line, preparation of annual registration statement updates and financial information and compliance with federal and state laws and regulations.
The Board also compared the Fund’s effective advisory fee rate (the advisory fee rate after advisory fee waivers and before other expense limitations/waivers) to the effective advisory fee rates of other similarly managed third-party mutual funds advised or sub-advised by Invesco Advisers and its affiliates, based on asset balances as of December 31, 2018.
The Board also considered the services that may be provided by the Affiliated Sub-Advisers pursuant to the sub-advisory contracts, as well as the fees payable by Invesco Advisers to the Affiliated Sub-Advisers pursuant to thesub-advisory contracts.
| D. | Economies of Scale and Breakpoints |
The Board considered the extent to which there may be economies of scale in the provision of advisory services to the Fund. The Board considered Invesco’s reinvestment in its business, including investments in business infrastructure and cybersecurity. The Board also considered that the Fund benefits from economies of scale through contractual breakpoints in the Fund’s advisory fee schedule, which generally operate to reduce the Fund’s expense ratio as it grows in size. The Board noted that the Fund shares directly in economies of scale through lower fees charged by third party service providers based on the combined size of the Invesco Funds. The Board noted that the Fund may also benefit from economies of scale through initial fee setting, fee waivers and expense reimbursements.
| E. | Profitability and Financial Resources |
The Board reviewed information from Invesco Advisers concerning the costs of the advisory and other services that Invesco Advisers and its affiliates provide to the Fund and the Invesco Funds and the profitability of Invesco Advisers and its affiliates in providing these services. The Board considered the methodology used for calculating profitability and noted the periodic review of such methodology by an independent consultant. The Board noted that Invesco Advisers continues to operate at a net profit from services Invesco Advisers and its affiliates provide to the Invesco Funds and the Fund. The Board did not deem the level of profits realized by Invesco Advisers and its affiliates from providing services to the Fund to be excessive given the nature, extent and quality of the services provided. The Board received information from Invesco Advisers demonstrating that Invesco Advisers and the Affiliated Sub-Advisers are financially sound and have the resources necessary to perform their obligations under the investment advisory agreement and sub-advisory contracts.
| F. | Collateral Benefits to Invesco Advisers and its Affiliates |
The Board considered various other benefits received by Invesco Advisers and its affiliates from the relationship with the Fund, including the fees received for providing administrative, transfer agency and distribution services to the Fund. The Board considered comparative information regarding fees charged for these services, including information provided by Broadridge and other independent sources. The Board considered the performance of Invesco Advisers and its affiliates in providing these services and the organizational structure employed to provide these services. The Board also considered that these services are provided to the Fund pursuant to written contracts that are reviewed and approved on an annual basis
by the Board; and that the services are required for the operation of the Fund.
The Board considered the benefits realized by Invesco Advisers and the Affiliated Sub-Advisers as a result of portfolio brokerage transactions executed through “soft dollar” arrangements. The Board noted that soft dollar arrangements may result in the Fund bearing costs to purchase research that may be used by Invesco Advisers or the Affiliated Sub-Advisers with other clients and may reduce Invesco Advisers’ or the Affiliated Sub-Advisers’ expenses. The Board also considered that it receives periodic reports from Invesco representing that these arrangements are consistent with regulatory requirements. The Board did not deem the soft dollar arrangements to be inappropriate.
The Board considered that the Fund’s uninvested cash and cash collateral from any securities lending arrangements may be invested in money market funds advised by Invesco Advisers pursuant to procedures approved by the Board. The Board considered information regarding the returns of the affiliated money market funds relative to comparable overnight investments, as well as the costs to the Fund of such investments. The Board noted that Invesco Advisers receives advisory fees from these affiliated money market funds attributable to such investments, although Invesco Advisers has contractually agreed to waive through varying periods the advisory fees payable by the Invesco Funds with respect to certain investments in the affiliated money market funds. The waiver is in an amount equal to 100% of the net advisory fee Invesco Advisers receives from the affiliated money market funds with respect to the Fund’s investment in the affiliated money market funds of uninvested cash, but not cash collateral. The Board concluded that the amount of advisory fees received by Invesco Advisers from the Fund’s investment of cash collateral from any securities lending arrangements in the affiliated money market funds is fair and reasonable.
The Board also considered that an affiliated broker may receive commissions for executing certain trades for the Fund. Invesco Advisers and the Affiliated Sub-Advisers may use the affiliated broker to, among other things, control order routing and minimize information leakage, and the Board was advised that such trades are executed in compliance with rules under the federal securities laws and consistent with best execution obligations.
Invesco V.I. International Growth Fund
| Semiannual Report to Shareholders | June 30, 2019 |
Invesco V.I. Managed Volatility Fund
Beginning on January 1, 2021, as permitted by regulations adopted by the Securities and Exchange Commission, the insurance company that offers your variable annuity or variable life insurance contract may no longer send you paper copies of the Fund’s shareholder reports by mail, unless you specifically request paper copies of the reports from the insurance company or your financial intermediary. Instead of delivering paper copies of the report, the insurance company may choose to make the reports available on a website, and will notify you by mail each time a report is posted and provide you with a website link to access the report. Instructions for requesting paper copies will be provided by your insurance company.
If the insurance company offers electronic delivery, you may elect to receive shareholder reports and other communications about the Fund electronically by following the instructions provided by the insurance company or by contacting your financial intermediary. If you already elected to receive shareholder reports electronically, you will not be affected by this change and you need not take any action.
You may elect to receive all future reports in paper free of charge from the insurance company. You can inform the insurance company or your financial intermediary that you wish to continue receiving paper copies of your shareholder reports by following the instructions provided by the insurance company or by contacting your financial intermediary. Your election to receive reports in paper will apply to all portfolio companies available under your contract with the insurance company.
The Fund provides a complete list of its holdings four times in each fiscal year, at the quarter-ends. For the second and fourth quarters, the lists appear in the Fund’s semiannual and annual reports to shareholders. For the first and third quarters, the Fund files the lists with the Securities and Exchange Commission (SEC) on Form N-Q (or any successor Form). The Fund’s Form N-Q (or any successor Form) filings are available on the SEC website, sec.gov. The SEC file numbers for the Fund are 811-07452 and 033-57340. The Fund’s most recent portfolio holdings, as filed on Form N-Q (or any successor Form), have also been made available to insurance companies issuing variable annuity contracts and variable life insurance policies (“variable products”) that invest in the Fund.
A description of the policies and procedures that the Fund uses to determine how to vote proxies relating to portfolio securities is available without charge, upon request, from our Client Services department at 800 959 4246 or at invesco.com/proxyguidelines. The information is also available on the SEC website, sec.gov.
Information regarding how the Fund voted proxies related to its portfolio securities during the most recent 12-month period ended June 30 is available at invesco.com/proxysearch. The information is also available on the SEC website, sec.gov.
Invesco Advisers, Inc. is an investment adviser; it provides investment advisory services to individual and institutional clients and does not sell securities. Invesco Distributors, Inc. is the US distributor for Invesco Ltd.’s retail mutual funds, exchange-traded funds and institutional money market funds. Both are wholly owned, indirect subsidiaries of Invesco Ltd.
This report must be accompanied or preceded by a currently effective Fund prospectus and variable product prospectus, which contain more complete information, including sales charges and expenses. Investors should read each carefully before investing.
NOT FDIC INSURED | MAY LOSE VALUE | NO BANK GUARANTEE
| Invesco Distributors, Inc. | I-VIMGV-SAR-1 |
Performance summary
Fund vs. Indexes
Cumulative total returns, December 31, 2018 to June 30, 2019, excluding variable product issuer charges. If variable product issuer charges were included, returns would be lower.
| Series I Shares | 12.05% |
| Series II Shares | 11.92 |
| Russell 1000 Value Index▼ (Broad Market Index) | 16.24 |
Bloomberg Barclays U.S. Government/Credit Index■
(Style-Specific Index) | 6.90 |
Lipper VUF Mixed-Asset Target Allocation Growth Funds Index♦
(Peer Group Index) | 13.11 |
| Source(s):▼RIMES Technologies Corp.;■ FactSet Research Systems Inc.;♦ Lipper Inc. |
TheRussell 1000® Value Index is an unmanaged index considered representative of large-cap value stocks. The Russell 1000 Value Index is a trademark/service mark of the Frank Russell Co. Russell® is a trademark of the Frank Russell Co.
TheBloomberg Barclays U.S. Government/Credit Index is a broad-based benchmark that includes investment-grade, US dollar-denominated, fixed-rate Treasuries, government-related and corporate securities.
TheLipper VUF Mixed-Asset Target Allocation Growth Funds Index is an unmanaged index considered representative of mixed-asset target allocation growth variable insurance underlying funds tracked by Lipper.
The Fund is not managed to track the performance of any particular index, including the indexes described here, and consequently, the performance of the Fund may deviate significantly from the performance of the indexes.
A direct investment cannot be made in an index. Unless otherwise indicated, index results include reinvested dividends, and they do not reflect sales charges. Performance of the peer group, if applicable, reflects fund expenses; performance of a market index does not.
| Average Annual Total Returns |
| As of 6/30/19 |
| Series I Shares | |
| Inception (12/30/94) | 7.00% |
| 10 Years | 8.89 |
| 5 Years | 4.10 |
| 1 Year | 1.75 |
| Series II Shares | |
| Inception (4/30/04) | 8.28% |
| 10 Years | 8.61 |
| 5 Years | 3.84 |
| 1 Year | 1.41 |
The performance of the Fund’s Series I and Series II share classes will differ primarily due to different class expenses.
The performance data quoted represent past performance and cannot guarantee comparable future results; current performance may be lower or higher. Please contact your variable product issuer or financial adviser for the most recent month-end variable product performance. Performance figures reflect Fund expenses, reinvested distributions and changes in net asset value. Performance figures do not reflect deduction of taxes a shareholder would pay on Fund distributions or sale of Fund shares. Investment return and principal value will fluctuate so that you may have a gain or loss when you sell shares.
The net annual Fund operating expense ratio set forth in the most recent Fund prospectus as of the date of this report for Series I and Series II
shares was 1.13% and 1.38%, respectively.1 The total annual Fund operating expense ratio set forth in the most recent Fund prospectus as of the date of this report for Series I and Series II shares was 1.14% and 1.39%, respectively. The expense ratios presented above may vary from the expense ratios presented in other sections of this report that are based on expenses incurred during the period covered by this report.
Invesco V.I. Managed Volatility Fund, a series portfolio of AIM Variable Insurance Funds (Invesco Variable Insurance Funds), is currently offered through insurance companies issuing variable products. You cannot purchase shares of the Fund directly. Performance figures given represent the Fund and are not intended to reflect actual variable product values. They do not reflect sales charges, expenses and fees assessed in connection with a variable product. Sales charges, expenses
and fees, which are determined by the variable product issuers, will vary and will lower the total return.
The most recent month-end performance at the Fund level, excluding variable product charges, is available at 800 451 4246. As mentioned above, for the most recent month-end performance including variable product charges, please contact your variable product issuer or financial adviser.
Fund performance reflects any applicable fee waivers and/or expense reimbursements. Had the adviser not waived fees and/or reimbursed expenses currently or in the past, returns would have been lower. See current prospectus for more information.
| 1 | Total annual Fund operating expenses after any contractual fee waivers and/or expense reimbursements by the adviser in effect through at least June 30, 2021. See current prospectus for more information. |
Invesco V.I. Managed Volatility Fund
Schedule of Investments(a)
June 30, 2019
(Unaudited)
| | Shares | Value |
| Common Stocks & Other Equity Interests–59.34% |
| Aerospace & Defense–1.33% |
| General Dynamics Corp. | 2,746 | $499,278 |
| Apparel, Accessories & Luxury Goods–0.81% |
| Capri Holdings Ltd.(b) | 8,711 | 302,097 |
| Asset Management & Custody Banks–0.26% |
| State Street Corp. | 1,717 | 96,255 |
| Automobile Manufacturers–1.68% |
| General Motors Co. | 16,384 | 631,276 |
| Biotechnology–0.54% |
| Celgene Corp.(b) | 2,208 | 204,108 |
| Broadcasting–0.52% |
| CBS Corp., Class B | 3,934 | 196,307 |
| Building Products–1.15% |
| Johnson Controls International PLC | 10,432 | 430,946 |
| Cable & Satellite–2.07% |
| Charter Communications, Inc., Class A(b) | 1,319 | 521,242 |
| Comcast Corp., Class A | 5,985 | 253,046 |
| | | | 774,288 |
| Commodity Chemicals–0.45% |
| Dow, Inc. | 3,390 | 167,161 |
| Communications Equipment–1.10% |
| Cisco Systems, Inc. | 7,548 | 413,102 |
| Diversified Banks–8.58% |
| Bank of America Corp. | 33,382 | 968,078 |
| Citigroup, Inc. | 16,467 | 1,153,184 |
| JPMorgan Chase & Co. | 6,452 | 721,334 |
| Wells Fargo & Co. | 7,860 | 371,935 |
| | | | 3,214,531 |
| Electric Utilities–0.67% |
| Duke Energy Corp. | 1,376 | 121,418 |
| FirstEnergy Corp. | 3,045 | 130,357 |
| | | | 251,775 |
| Fertilizers & Agricultural Chemicals–1.02% |
| Corteva, Inc.(b) | 6,854 | 202,673 |
| Nutrien Ltd. (Canada) | 3,329 | 177,968 |
| | | | 380,641 |
| Food Distributors–0.85% |
| US Foods Holding Corp.(b) | 8,935 | 319,516 |
| | Shares | Value |
| Health Care Distributors–0.96% |
| McKesson Corp. | 2,678 | $359,896 |
| Health Care Equipment–1.56% |
| Medtronic PLC | 2,581 | 251,363 |
| Zimmer Biomet Holdings, Inc. | 2,839 | 334,264 |
| | | | 585,627 |
| Health Care Services–0.89% |
| CVS Health Corp. | 6,102 | 332,498 |
| Health Care Supplies–0.43% |
| Alcon, Inc. (Switzerland)(b) | 2,629 | 162,599 |
| Home Improvement Retail–0.61% |
| Kingfisher PLC (United Kingdom) | 83,436 | 227,936 |
| Hotels, Resorts & Cruise Lines–1.15% |
| Carnival Corp. | 9,238 | 430,029 |
| Industrial Machinery–0.88% |
| Ingersoll-Rand PLC | 2,595 | 328,709 |
| Insurance Brokers–1.07% |
| Willis Towers Watson PLC | 2,097 | 401,659 |
| Integrated Oil & Gas–3.64% |
| BP PLC (United Kingdom) | 57,039 | 398,613 |
| Chevron Corp. | 2,630 | 327,277 |
| Occidental Petroleum Corp. | 2,818 | 141,689 |
| Royal Dutch Shell PLC, Class A (United Kingdom) | 15,153 | 496,181 |
| | | | 1,363,760 |
| Internet & Direct Marketing Retail–0.85% |
| eBay, Inc. | 8,103 | 320,068 |
| Investment Banking & Brokerage–2.45% |
| Goldman Sachs Group, Inc. (The) | 1,783 | 364,802 |
| Morgan Stanley | 12,628 | 553,232 |
| | | | 918,034 |
| IT Consulting & Other Services–0.70% |
| Cognizant Technology Solutions Corp., Class A | 4,135 | 262,118 |
| Managed Health Care–0.61% |
| Anthem, Inc. | 806 | 227,461 |
| Multi-line Insurance–2.06% |
| American International Group, Inc. | 14,530 | 774,158 |
| Oil & Gas Equipment & Services–1.35% |
| Schlumberger Ltd. | 4,346 | 172,710 |
See accompanying Notes to Financial Statements which are an integral part of the financial statements.
Invesco V.I. Managed Volatility Fund
| | Shares | Value |
| Oil & Gas Equipment & Services–(continued) |
| TechnipFMC PLC (United Kingdom) | 12,885 | $334,237 |
| | | | 506,947 |
| Oil & Gas Exploration & Production–2.48% |
| Canadian Natural Resources Ltd. (Canada) | 7,748 | 208,913 |
| Devon Energy Corp. | 14,162 | 403,900 |
| Marathon Oil Corp. | 22,286 | 316,684 |
| | | | 929,497 |
| Other Diversified Financial Services–1.23% |
| AXA Equitable Holdings, Inc. | 8,243 | 172,279 |
| Voya Financial, Inc. | 5,253 | 290,491 |
| | | | 462,770 |
| Packaged Foods & Meats–1.50% |
| Mondelez International, Inc., Class A | 10,410 | 561,099 |
| Pharmaceuticals–4.60% |
| Bristol-Myers Squibb Co. | 6,799 | 308,335 |
| Johnson & Johnson | 5,398 | 751,833 |
| Novartis AG (Switzerland) | 4,549 | 416,083 |
| Sanofi (France) | 2,847 | 246,291 |
| | | | 1,722,542 |
| Railroads–0.87% |
| CSX Corp. | 4,201 | 325,031 |
| Regional Banks–1.99% |
| Citizens Financial Group, Inc. | 13,298 | 470,217 |
| First Horizon National Corp. | 406 | 6,062 |
| PNC Financial Services Group, Inc. (The) | 1,978 | 271,540 |
| | | | 747,819 |
| Semiconductors–1.93% |
| Intel Corp. | 8,796 | 421,065 |
| QUALCOMM, Inc. | 3,987 | 303,291 |
| | | | 724,356 |
| Specialty Chemicals–0.56% |
| DuPont de Nemours, Inc. | 2,799 | 210,121 |
| Systems Software–1.58% |
| Oracle Corp. | 10,398 | 592,374 |
| Technology Hardware, Storage & Peripherals–0.82% |
| Apple, Inc. | 1,552 | 307,172 |
| Tobacco–1.54% |
| Philip Morris International, Inc. | 7,340 | 576,410 |
| Total Common Stocks & Other Equity Interests (Cost $18,654,698) | 22,241,971 |
| | Principal
Amount | Value |
| U.S. Dollar Denominated Bonds & Notes–25.56% |
| Aerospace & Defense–0.05% |
| General Dynamics Corp., 2.88%, 05/11/2020 | | $10,000 | $10,052 |
| United Technologies Corp., 4.45%, 11/16/2038 | | 9,000 | 10,107 |
| | | | 20,159 |
| Air Freight & Logistics–0.01% |
| United Parcel Service, Inc., 3.40%, 11/15/2046 | | 4,000 | 3,823 |
| Airlines–0.18% |
| American Airlines Pass Through Trust, Series 2014-1, Class A, 3.70%, 04/01/2028 | | 18,798 | 19,463 |
| United Airlines Pass Through Trust, | | |
| Series 2014-2, Class A, 3.75%, 09/03/2026 | | 24,043 | 25,024 |
| Series 2018-1, Class AA, 3.50%, 03/01/2030 | | 16,704 | 17,091 |
| Virgin Australia Pass Through Trust (Australia), Series 2013-1, Class A, 5.00%, 10/23/2023(c) | | 4,304 | 4,434 |
| | | | 66,012 |
| Alternative Carriers–0.27% |
| GCI Liberty, Inc., Conv., 1.75%, 10/05/2023(c)(d) | | 85,000 | 99,784 |
| Application Software–0.85% |
| Nuance Communications, Inc., | | |
Conv.,
1.00%, 12/15/2022(d) | | 127,000 | 119,834 |
| 1.25%, 04/01/2025 | | 49,000 | 48,260 |
| RealPage, Inc., Conv., 1.50%, 11/15/2022 | | 24,000 | 36,043 |
| Workday, Inc., Conv., 0.25%, 10/01/2022 | | 75,000 | 112,692 |
| | | | 316,829 |
| Asset Management & Custody Banks–0.90% |
| Apollo Management Holdings L.P., 4.00%, 05/30/2024(c) | | 40,000 | 41,569 |
| Blackstone Holdings Finance Co. LLC, 5.00%, 06/15/2044(c) | | 150,000 | 170,340 |
| Brookfield Asset Management, Inc. (Canada), 4.00%, 01/15/2025 | | 25,000 | 26,058 |
| Carlyle Holdings Finance LLC, 3.88%, 02/01/2023(c) | | 5,000 | 5,159 |
| KKR Group Finance Co. III LLC, 5.13%, 06/01/2044(c) | | 85,000 | 94,542 |
| | | | 337,668 |
| Automobile Manufacturers–0.64% |
| Ford Motor Credit Co. LLC, 4.13%, 08/04/2025 | | 200,000 | 200,429 |
| General Motors Co., 6.60%, 04/01/2036 | | 16,000 | 17,739 |
See accompanying Notes to Financial Statements which are an integral part of the financial statements.
Invesco V.I. Managed Volatility Fund
| | Principal
Amount | Value |
| Automobile Manufacturers–(continued) |
| General Motors Financial Co., Inc., 5.25%, 03/01/2026 | | $21,000 | $22,544 |
| | | | 240,712 |
| Biotechnology–1.28% |
| AbbVie, Inc., 4.50%, 05/14/2035 | | 38,000 | 39,104 |
| BioMarin Pharmaceutical, Inc., Conv., 1.50%, 10/15/2020 | | 117,000 | 131,479 |
| Celgene Corp., 4.63%, 05/15/2044 | | 100,000 | 114,051 |
| Gilead Sciences, Inc., | | |
| 2.55%, 09/01/2020 | | 50,000 | 50,135 |
| 4.40%, 12/01/2021 | | 25,000 | 26,142 |
| Medicines Co. (The), Conv., 2.75%, 07/15/2023 | | 37,000 | 37,191 |
| Neurocrine Biosciences, Inc., Conv., 2.25%, 05/15/2024 | | 62,000 | 81,654 |
| | | | 479,756 |
| Brewers–0.44% |
| Anheuser-Busch Cos. LLC/Anheuser-Busch InBev Worldwide, Inc. (Belgium), | | |
| 4.70%, 02/01/2036 | | 45,000 | 49,562 |
| 4.90%, 02/01/2046 | | 47,000 | 52,319 |
| Heineken N.V. (Netherlands), 3.50%, 01/29/2028(c) | | 35,000 | 36,380 |
| Molson Coors Brewing Co., | | |
| 1.45%, 07/15/2019 | | 13,000 | 12,995 |
| 4.20%, 07/15/2046 | | 16,000 | 15,467 |
| | | | 166,723 |
| Cable & Satellite–1.80% |
| Charter Communications Operating, LLC/Charter Communications Operating Capital Corp., 4.46%, 07/23/2022 | | 60,000 | 63,050 |
| Comcast Corp., | | |
| 4.15%, 10/15/2028 | | 30,000 | 33,094 |
| 3.90%, 03/01/2038 | | 10,000 | 10,553 |
| 4.60%, 10/15/2038 | | 10,000 | 11,459 |
| DISH Network Corp., Conv., 3.38%, 08/15/2026 | | 147,000 | 143,278 |
| Liberty Latin America Ltd. (Chile), Conv., 2.00%, 07/15/2024(c) | | 25,000 | 25,295 |
| Liberty Media Corp., | | |
Conv.,
2.25%, 10/05/2021(d) | | 55,000 | 29,669 |
| 1.38%, 10/15/2023 | | 299,000 | 336,359 |
| Liberty Formula One, Conv., 1.00%, 01/30/2023 | | 20,000 | 23,595 |
| | | | 676,352 |
| Communications Equipment–0.53% |
| Finisar Corp., Conv., 0.50%, 12/15/2021(d) | | 39,000 | 38,120 |
| | Principal
Amount | Value |
| Communications Equipment–(continued) |
| Viavi Solutions, Inc., | | |
Conv.,
1.75%, 06/01/2023 | | $71,000 | $82,417 |
| 1.00%, 03/01/2024 | | 68,000 | 80,070 |
| | | | 200,607 |
| Consumer Finance–0.12% |
| American Express Co., 3.63%, 12/05/2024 | | 18,000 | 18,903 |
| Capital One Financial Corp., 3.20%, 01/30/2023 | | 15,000 | 15,384 |
| Synchrony Financial, 3.95%, 12/01/2027 | | 10,000 | 9,993 |
| | | | 44,280 |
| Data Processing & Outsourced Services–0.10% |
| Euronet Worldwide, Inc., Conv., 0.75%, 03/15/2025(c)(d) | | 17,000 | 20,675 |
| Fiserv, Inc., 3.80%, 10/01/2023 | | 15,000 | 15,802 |
| | | | 36,477 |
| Diversified Banks–1.86% |
| Bank of America Corp., 3.25%, 10/21/2027 | | 10,000 | 10,250 |
| Bank of Montreal (Canada), 2.10%, 12/12/2019 | | 75,000 | 74,920 |
| Citigroup, Inc., | | |
| 4.00%, 08/05/2024 | | 60,000 | 63,262 |
| 3.67%, 07/24/2028 | | 15,000 | 15,660 |
| 4.75%, 05/18/2046 | | 15,000 | 17,021 |
| Commonwealth Bank of Australia (Australia), 2.25%, 03/10/2020(c) | | 40,000 | 39,992 |
| JPMorgan Chase & Co., | | |
| 3.20%, 06/15/2026 | | 15,000 | 15,443 |
| 3.51%, 01/23/2029 | | 15,000 | 15,627 |
| 4.26%, 02/22/2048 | | 10,000 | 11,049 |
| 3.90%, 01/23/2049 | | 15,000 | 15,746 |
| Series V, 5.64%(e) | | 150,000 | 149,707 |
| Toronto-Dominion Bank (The) (Canada), 2.65%, 06/12/2024 | | 15,000 | 15,138 |
| U.S. Bancorp, Series W, 3.10%, 04/27/2026 | | 10,000 | 10,221 |
| Wells Fargo & Co., | | |
| 3.55%, 09/29/2025 | | 30,000 | 31,327 |
| 4.10%, 06/03/2026 | | 95,000 | 100,729 |
| 4.65%, 11/04/2044 | | 100,000 | 111,385 |
| | | | 697,477 |
| Diversified Capital Markets–0.65% |
| Credit Suisse Group AG (Switzerland), Conv., 0.50%, 06/24/2024(c) | | 260,000 | 244,842 |
| Diversified Chemicals–0.03% |
| Eastman Chemical Co., 2.70%, 01/15/2020 | | 13,000 | 12,994 |
See accompanying Notes to Financial Statements which are an integral part of the financial statements.
Invesco V.I. Managed Volatility Fund
| | Principal
Amount | Value |
| Drug Retail–0.15% |
| Walgreens Boots Alliance, Inc., | | |
| 3.30%, 11/18/2021 | | $32,000 | $32,646 |
| 4.50%, 11/18/2034 | | 24,000 | 24,706 |
| | | | 57,352 |
| Electric Utilities–0.12% |
| Georgia Power Co., 2.00%, 03/30/2020 | | 35,000 | 34,870 |
| NextEra Energy Capital Holdings, Inc., 3.55%, 05/01/2027 | | 11,000 | 11,488 |
| | | | 46,358 |
| Environmental & Facilities Services–0.07% |
| Waste Management, Inc., 3.90%, 03/01/2035 | | 25,000 | 26,740 |
| Food Retail–0.01% |
| Alimentation Couche-Tard, Inc. (Canada), 4.50%, 07/26/2047(c) | | 2,000 | 2,015 |
| General Merchandise Stores–0.05% |
| Dollar General Corp., 3.25%, 04/15/2023 | | 20,000 | 20,550 |
| Health Care Equipment–1.93% |
| Becton, Dickinson and Co., | | |
| 2.68%, 12/15/2019 | | 15,000 | 15,006 |
| 4.88%, 05/15/2044 | | 86,000 | 92,553 |
| DexCom, Inc., | | |
Conv.,
0.75%, 05/15/2022 | | 88,000 | 140,646 |
| 0.75%, 12/01/2023(c) | | 86,000 | 101,085 |
| Insulet Corp., Conv., 1.38%, 11/15/2024 | | 13,000 | 18,517 |
| Medtronic, Inc., | | |
| 3.15%, 03/15/2022 | | 58,000 | 59,683 |
| 4.38%, 03/15/2035 | | 20,000 | 23,046 |
| NuVasive, Inc., Conv., 2.25%, 03/15/2021 | | 80,000 | 91,050 |
| Wright Medical Group N.V., Conv., 2.25%, 11/15/2021 | | 39,000 | 57,866 |
| Wright Medical Group, Inc., Conv., 1.63%, 06/15/2023 | | 113,000 | 124,512 |
| | | | 723,964 |
| Health Care REITs–0.07% |
| HCP, Inc., 3.88%, 08/15/2024 | | 25,000 | 26,215 |
| Health Care Services–0.28% |
| Cigna Corp., 4.80%, 08/15/2038(c) | | 9,000 | 9,709 |
| CVS Health Corp., | | |
| 3.38%, 08/12/2024 | | 20,000 | 20,491 |
| 4.10%, 03/25/2025 | | 16,000 | 16,877 |
| Laboratory Corp. of America Holdings, | | |
| 3.20%, 02/01/2022 | | 33,000 | 33,554 |
| 4.70%, 02/01/2045 | | 22,000 | 22,777 |
| | | | 103,408 |
| | Principal
Amount | Value |
| Home Improvement Retail–0.07% |
| Home Depot, Inc. (The), 2.00%, 04/01/2021 | | $27,000 | $26,989 |
| Hotel & Resort REITs–0.03% |
| Hospitality Properties Trust, 4.50%, 06/15/2023 | | 10,000 | 10,359 |
| Insurance Brokers–0.04% |
| Marsh & McLennan Cos., Inc., 4.75%, 03/15/2039 | | 10,000 | 11,480 |
| Willis North America, Inc., 3.60%, 05/15/2024 | | 5,000 | 5,171 |
| | | | 16,651 |
| Integrated Oil & Gas–0.09% |
| Occidental Petroleum Corp., 3.40%, 04/15/2026 | | 15,000 | 15,290 |
| Suncor Energy, Inc. (Canada), 3.60%, 12/01/2024 | | 18,000 | 18,786 |
| | | | 34,076 |
| Integrated Telecommunication Services–1.76% |
| AT&T, Inc., | | |
| 3.00%, 06/30/2022 | | 28,000 | 28,489 |
| 3.40%, 05/15/2025 | | 15,000 | 15,424 |
| 4.50%, 05/15/2035 | | 25,000 | 26,218 |
| 5.15%, 03/15/2042 | | 150,000 | 164,101 |
| 4.80%, 06/15/2044 | | 40,000 | 42,267 |
| Orange S.A. (France), 1.63%, 11/03/2019 | | 55,000 | 54,831 |
| Telefonica Emisiones S.A. (Spain), 7.05%, 06/20/2036 | | 150,000 | 196,843 |
| Verizon Communications, Inc., 4.40%, 11/01/2034 | | 120,000 | 133,138 |
| | | | 661,311 |
| Interactive Media & Services–0.14% |
| YY, Inc. (China), 1.38%, 06/15/2024(c)(d) | | 52,000 | 52,910 |
| Internet & Direct Marketing Retail–0.74% |
| Amazon.com, Inc., | | |
| 2.60%, 12/05/2019 | | 50,000 | 50,064 |
| 4.80%, 12/05/2034 | | 9,000 | 11,052 |
| Ctrip.com International, Ltd. (China), Conv., 1.25%, 09/15/2019(d) | | 113,000 | 112,539 |
| Liberty Expedia Holdings, Inc., Conv., 1.00%, 07/05/2022(c)(d) | | 53,000 | 53,041 |
| QVC, Inc., 5.45%, 08/15/2034 | | 50,000 | 49,284 |
| | | | 275,980 |
| Internet Services & Infrastructure–0.26% |
| IAC Financeco 3, Inc., Conv., 2.00%, 01/15/2030(c) | | 94,000 | 96,957 |
| Investment Banking & Brokerage–1.15% |
| Goldman Sachs Group, Inc. (The), 4.25%, 10/21/2025 | | 27,000 | 28,655 |
See accompanying Notes to Financial Statements which are an integral part of the financial statements.
Invesco V.I. Managed Volatility Fund
| | Principal
Amount | Value |
| Investment Banking & Brokerage–(continued) |
| GS Finance Corp., Series 0001, Conv., 0.25%, 07/08/2024 | | $198,000 | $188,526 |
| Morgan Stanley, | | |
| 2.38%, 07/23/2019 | | 175,000 | 174,994 |
| 4.00%, 07/23/2025 | | 35,000 | 37,497 |
| | | | 429,672 |
| Life & Health Insurance–0.41% |
| Athene Global Funding, 4.00%, 01/25/2022(c) | | 45,000 | 46,558 |
| Guardian Life Global Funding, 2.90%, 05/06/2024(c) | | 20,000 | 20,529 |
| Jackson National Life Global Funding, | | |
| 2.10%, 10/25/2021(c) | | 10,000 | 9,930 |
| 3.25%, 01/30/2024(c) | | 15,000 | 15,454 |
| Nationwide Financial Services, Inc., 5.30%, 11/18/2044(c) | | 35,000 | 39,938 |
| Reliance Standard Life Global Funding II, 3.05%, 01/20/2021(c) | | 20,000 | 20,171 |
| | | | 152,580 |
| Movies & Entertainment–0.20% |
| Live Nation Entertainment, Inc., 2.50%, 03/15/2023 | | 62,000 | 73,542 |
| Multi-line Insurance–0.21% |
| American Financial Group, Inc., 4.50%, 06/15/2047 | | 20,000 | 20,305 |
| American International Group, Inc., | | |
| 2.30%, 07/16/2019 | | 20,000 | 19,998 |
| 4.38%, 01/15/2055 | | 40,000 | 40,278 |
| | | | 80,581 |
| Multi-Utilities–0.05% |
| NiSource, Inc., 4.38%, 05/15/2047 | | 9,000 | 9,629 |
| Sempra Energy, 3.80%, 02/01/2038 | | 8,000 | 7,767 |
| | | | 17,396 |
| Office REITs–0.47% |
| Government Properties Income Trust, 4.00%, 07/15/2022 | | 25,000 | 25,274 |
| Highwoods Realty L.P., 3.20%, 06/15/2021 | | 150,000 | 151,069 |
| | | | 176,343 |
| Oil & Gas Equipment & Services–0.22% |
| Helix Energy Solutions Group, Inc., Conv., 4.25%, 05/01/2022 | | 40,000 | 40,342 |
| Oil States International, Inc., Conv., 1.50%, 02/15/2023 | | 46,000 | 41,143 |
| | | | 81,485 |
| Oil & Gas Exploration & Production–0.12% |
| Chesapeake Energy Corp., Conv., 5.50%, 09/15/2026 | | 37,000 | 29,625 |
| ConocoPhillips Co., 4.15%, 11/15/2034 | | 13,000 | 13,997 |
| | | | 43,622 |
| | Principal
Amount | Value |
| Oil & Gas Storage & Transportation–0.48% |
| Energy Transfer Operating L.P., | | |
| 7.50%, 10/15/2020 | | $20,000 | $21,218 |
| 4.20%, 09/15/2023 | | 2,000 | 2,097 |
| 4.90%, 03/15/2035 | | 19,000 | 19,143 |
| Enterprise Products Operating LLC, | | |
| 2.55%, 10/15/2019 | | 20,000 | 19,995 |
| 4.25%, 02/15/2048 | | 10,000 | 10,362 |
| Kinder Morgan, Inc., 5.30%, 12/01/2034 | | 23,000 | 26,031 |
| MPLX L.P., | | |
| 4.50%, 07/15/2023 | | 65,000 | 68,966 |
| 4.50%, 04/15/2038 | | 11,000 | 11,115 |
| | | | 178,927 |
| Other Diversified Financial Services–0.13% |
| ERAC USA Finance LLC, 2.35%, 10/15/2019(c) | | 50,000 | 49,942 |
| Packaged Foods & Meats–0.26% |
| General Mills, Inc., 2.20%, 10/21/2019 | | 45,000 | 44,944 |
| J. M. Smucker Co. (The), 2.50%, 03/15/2020 | | 50,000 | 49,997 |
| Mead Johnson Nutrition Co. (United Kingdom), 4.13%, 11/15/2025 | | 3,000 | 3,247 |
| | | | 98,188 |
| Pharmaceuticals–1.43% |
| Allergan Funding SCS, 4.85%, 06/15/2044 | | 150,000 | 155,851 |
| Bayer US Finance II LLC (Germany), 2.13%, 07/15/2019(c) | | 15,000 | 14,997 |
| Bayer US Finance LLC (Germany), 3.00%, 10/08/2021(c) | | 200,000 | 201,487 |
| Bristol-Myers Squibb Co., 4.13%, 06/15/2039(c) | | 18,000 | 19,533 |
| Jazz Investments I Ltd., Conv., 1.88%, 08/15/2021 | | 76,000 | 77,629 |
| Mylan N.V., 3.15%, 06/15/2021 | | 17,000 | 17,005 |
| Pacira BioSciences Inc., Conv., 2.38%, 04/01/2022 | | 26,000 | 26,685 |
| Supernus Pharmaceuticals, Inc., 0.63%, 04/01/2023 | | 22,000 | 21,579 |
| | | | 534,766 |
| Property & Casualty Insurance–0.49% |
| Allstate Corp. (The), 3.28%, 12/15/2026 | | 10,000 | 10,455 |
| Liberty Mutual Group, Inc., 4.85%, 08/01/2044(c) | | 115,000 | 126,293 |
| Markel Corp., 5.00%, 05/20/2049 | | 15,000 | 16,350 |
| PartnerRe Finance B LLC, 3.70%, 07/02/2029 | | 30,000 | 30,556 |
| | | | 183,654 |
| Railroads–0.07% |
| Union Pacific Corp., 4.15%, 01/15/2045 | | 25,000 | 26,383 |
See accompanying Notes to Financial Statements which are an integral part of the financial statements.
Invesco V.I. Managed Volatility Fund
| | Principal
Amount | Value |
| Regional Banks–0.10% |
| Citizens Financial Group, Inc., 2.38%, 07/28/2021 | | $15,000 | $14,989 |
| The PNC Financial Services Group, Inc., 3.45%, 04/23/2029 | | 20,000 | 21,064 |
| | | | 36,053 |
| Renewable Electricity–0.42% |
| Oglethorpe Power Corp., 4.55%, 06/01/2044 | | 150,000 | 155,882 |
| Restaurants–0.06% |
| Starbucks Corp., 3.55%, 08/15/2029 | | 20,000 | 20,937 |
| Semiconductor Equipment–0.17% |
| Applied Materials, Inc., 2.63%, 10/01/2020 | | 65,000 | 65,358 |
| Semiconductors–1.01% |
| Broadcom Corp./Broadcom Cayman Finance Ltd., 3.63%, 01/15/2024 | | 30,000 | 30,325 |
| Cree, Inc., Conv., 0.88%, 09/01/2023(c) | | 98,000 | 113,673 |
| Microchip Technology, Inc., Conv., 1.63%, 02/15/2027 | | 74,000 | 87,364 |
| NXP B.V./NXP Funding LLC (Netherlands), 5.35%, 03/01/2026(c) | | 20,000 | 22,173 |
| ON Semiconductor Corp., Conv., 1.00%, 12/01/2020 | | 76,000 | 93,556 |
| Silicon Laboratories, Inc., Conv., 1.38%, 03/01/2022 | | 21,000 | 26,177 |
| Texas Instruments, Inc., 2.63%, 05/15/2024 | | 5,000 | 5,093 |
| | | | 378,361 |
| Specialized Finance–0.89% |
| Convertible Trust - Consumer, Series 2018-1, 0.25%, 01/17/2024 | | 160,000 | 163,888 |
| Convertible Trust - Healthcare, Series 2018-1, 0.25%, 02/05/2024 | | 168,000 | 168,907 |
| | | | 332,795 |
| Specialized REIT–0.04% |
| Crown Castle International Corp., 3.80%, 02/15/2028 | | 15,000 | 15,584 |
| Specialty Chemicals–0.01% |
| Sherwin-Williams Co. (The), 4.50%, 06/01/2047 | | 3,000 | 3,201 |
| Systems Software–0.50% |
| FireEye, Inc., | | |
| Series A, Conv., 1.00%, 06/01/2020(d) | | 76,000 | 74,100 |
| Series B, Conv., 1.63%, 06/01/2022(d) | | 77,000 | 72,765 |
| Microsoft Corp., 3.50%, 02/12/2035 | | 37,000 | 39,442 |
| | | | 186,307 |
| Technology Distributors–0.08% |
| Avnet, Inc., 4.63%, 04/15/2026 | | 30,000 | 31,391 |
| | Principal
Amount | Value |
| Technology Hardware, Storage & Peripherals–0.68% |
| Apple, Inc., | | |
| 2.15%, 02/09/2022 | | $39,000 | $39,156 |
| 3.35%, 02/09/2027 | | 10,000 | 10,512 |
| Dell International LLC/EMC Corp., 5.45%, 06/15/2023(c) | | 26,000 | 28,041 |
| SanDisk LLC, Conv., 0.50%, 10/15/2020 | | 140,000 | 121,731 |
| Western Digital Corp., Conv., 1.50%, 02/01/2024(c) | | 61,000 | 54,932 |
| | | | 254,372 |
| Tobacco–0.11% |
| Altria Group, Inc., 5.80%, 02/14/2039 | | 36,000 | 40,487 |
| Trading Companies & Distributors–0.13% |
| Air Lease Corp., 4.25%, 09/15/2024 | | 35,000 | 37,017 |
| Aircastle Ltd., 4.40%, 09/25/2023 | | 10,000 | 10,389 |
| | | | 47,406 |
| Trucking–0.11% |
| Aviation Capital Group LLC, 4.88%, 10/01/2025(c) | | 40,000 | 43,188 |
| Wireless Telecommunication Services–0.04% |
| Rogers Communications, Inc. (Canada), 4.30%, 02/15/2048 | | 15,000 | 16,062 |
| Total U.S. Dollar Denominated Bonds & Notes (Cost $9,067,885) | 9,580,795 |
| U.S. Treasury Securities–7.43% |
| U.S. Treasury Bonds–0.87% |
| 4.50%, 02/15/2036 | | 75,000 | 98,895 |
| 3.00%, 02/15/2049 | | 208,200 | 228,377 |
| | | | 327,272 |
| U.S. Treasury Notes–6.56% |
| 2.13%, 05/31/2021 | | 2,128,000 | 2,142,090 |
| 1.75%, 06/15/2022 | | 290,000 | 290,334 |
| 2.00%, 05/31/2024 | | 3,200 | 3,236 |
| 2.13%, 05/31/2026 | | 19,300 | 19,612 |
| 2.38%, 05/15/2029 | | 1,300 | 1,343 |
| | | | 2,456,615 |
| Total U.S. Treasury Securities (Cost $2,756,043) | 2,783,887 |
| | Shares | |
| Preferred Stocks–0.22% |
| Asset Management & Custody Banks–0.22% |
AMG Capital Trust II, $2.58 Conv. Pfd.
(Cost $106,269) | 1,700 | 82,500 |
| Money Market Funds–6.94% |
| Invesco Government & Agency Portfolio, Institutional Class, 2.26%(f) | 910,931 | 910,931 |
| Invesco Liquid Assets Portfolio, Institutional Class, 2.40%(f) | 650,440 | 650,700 |
See accompanying Notes to Financial Statements which are an integral part of the financial statements.
Invesco V.I. Managed Volatility Fund
| | Shares | Value |
| Money Market Funds–(continued) |
| Invesco Treasury Portfolio, Institutional Class, 2.22%(f) | 1,041,065 | $1,041,065 |
| Total Money Market Funds (Cost $2,602,632) | 2,602,696 |
| TOTAL INVESTMENTS IN SECURITIES–99.49% (Cost $33,187,527) | 37,291,849 |
| OTHER ASSETS LESS LIABILITIES–0.51% | 192,280 |
| NET ASSETS–100.00% | $37,484,129 |
Investment Abbreviations:
| Conv. | – Convertible |
| Pfd. | – Preferred |
| REIT | – Real Estate Investment Trust |
Notes to Schedule of Investments:
| (a) | Industry and/or sector classifications used in this report are generally according to the Global Industry Classification Standard, which was developed by and is the exclusive property and a service mark of MSCI Inc. and Standard & Poor’s. |
| (b) | Non-income producing security. |
| (c) | Security purchased or received in a transaction exempt from registration under the Securities Act of 1933, as amended (the “1933 Act”). The security may be resold pursuant to an exemption from registration under the 1933 Act, typically to qualified institutional buyers. The aggregate value of these securities at June 30, 2019 was $1,925,568, which represented 5.14% of the Fund’s Net Assets. |
| (d) | Security has an irrevocable call by the issuer or mandatory put by the holder. Maturity date reflects such call or put. |
| (e) | Perpetual bond with no specified maturity date. |
| (f) | The money market fund and the Fund are affiliated by having the same investment adviser. The rate shown is the 7-day SEC standardized yield as of June 30, 2019. |
| Open Forward Foreign Currency Contracts |
Settlement
Date | Counterparty | Contract to | Unrealized
Appreciation
(Depreciation) |
| Deliver | Receive |
| Currency Risk | | | | | | |
| 07/05/2019 | State Street Bank & Trust Co. | GBP | 9,307 | USD | 11,863 | $42 |
| 07/05/2019 | State Street Bank & Trust Co. | USD | 9,435 | CAD | 12,599 | 186 |
| 07/05/2019 | State Street Bank & Trust Co. | USD | 5,361 | EUR | 4,740 | 31 |
| Subtotal—Appreciation | 259 |
| Currency Risk | | | | | | |
| 07/05/2019 | Bank of New York Mellon (The) | CHF | 186,582 | USD | 187,417 | (3,770) |
| 07/05/2019 | Bank of New York Mellon (The) | EUR | 156,093 | USD | 175,283 | (2,256) |
| 07/05/2019 | Bank of New York Mellon (The) | GBP | 326,169 | USD | 413,131 | (1,151) |
| 07/05/2019 | State Street Bank & Trust Co. | CAD | 225,515 | USD | 167,512 | (4,709) |
| 07/05/2019 | State Street Bank & Trust Co. | CHF | 241,193 | USD | 242,376 | (4,768) |
| 07/05/2019 | State Street Bank & Trust Co. | EUR | 14,065 | USD | 15,928 | (70) |
| 07/05/2019 | State Street Bank & Trust Co. | GBP | 326,162 | USD | 413,125 | (1,149) |
| 07/05/2019 | State Street Bank & Trust Co. | USD | 6,124 | CHF | 5,947 | (30) |
| Subtotal—Depreciation | (17,903) |
| Total Forward Foreign Currency Contracts | $(17,644) |
| Abbreviations: |
| CAD | – Canadian Dollar |
| CHF | – Swiss Franc |
| EUR | – Euro |
| GBP | – British Pound Sterling |
| USD | – U.S. Dollar |
See accompanying Notes to Financial Statements which are an integral part of the financial statements.
Invesco V.I. Managed Volatility Fund
Portfolio Composition
By sector, based on Net Assets
as of June 30, 2019
| Financials | 24.81% |
| Health Care | 14.51 |
| Information Technology | 10.05 |
| Energy | 8.38 |
| U.S. Treasury Securities | 7.43 |
| Consumer Discretionary | 6.92 |
| Communication Services | 6.80 |
| Consumer Staples | 4.86 |
| Industrials | 4.85 |
| Materials | 2.07 |
| Other Sectors, Each Less than 2% of Net Assets | 1.87 |
| Money Market Funds Plus Other Assets Less Liabilities | 7.45 |
See accompanying Notes to Financial Statements which are an integral part of the financial statements.
Invesco V.I. Managed Volatility Fund
Statement of Assets and Liabilities
June 30, 2019
(Unaudited)
| Assets: | |
Investments in securities, at value
(Cost $30,584,895) | $34,689,153 |
| Investments in affiliated money market funds, at value (Cost $2,602,632) | 2,602,696 |
| Other investments: | |
| Unrealized appreciation on forward foreign currency contracts outstanding | 259 |
| Cash | 1,387 |
| Foreign currencies, at value (Cost $24,822) | 24,893 |
| Receivable for: | |
| Fund shares sold | 37,651 |
| Dividends | 48,814 |
| Interest | 74,348 |
| Investments sold | 123,010 |
| Investment for trustee deferred compensation and retirement plans | 68,806 |
| Total assets | 37,671,017 |
| Liabilities: | |
| Other investments: | |
| Unrealized depreciation on forward foreign currency contracts outstanding | 17,903 |
| Payable for: | |
| Investments purchased | 4,007 |
| Fund shares reacquired | 23,186 |
| Accrued fees to affiliates | 17,261 |
| Accrued trustees’ and officers’ fees and benefits | 437 |
| Accrued other operating expenses | 50,924 |
| Trustee deferred compensation and retirement plans | 73,170 |
| Total liabilities | 186,888 |
| Net assets applicable to shares outstanding | $37,484,129 |
| Net assets consist of: | |
| Shares of beneficial interest | $31,195,896 |
| Distributable earnings | 6,288,233 |
| | $37,484,129 |
| Net Assets: |
| Series I | $36,178,466 |
| Series II | $1,305,663 |
| Shares outstanding, no par value, with an unlimited number of shares authorized: |
| Series I | 2,924,479 |
| Series II | 106,893 |
| Series I: | |
| Net asset value per share | $12.37 |
| Series II: | |
| Net asset value per share | $12.21 |
Statement of Operations
For the six months ended June 30, 2019
(Unaudited)
| Investment income: | |
| Dividends (net of foreign withholding taxes of $6,656) | $309,264 |
| Interest | 174,979 |
| Dividends from affiliated money market funds | 24,842 |
| Total investment income | 509,085 |
| Expenses: | |
| Advisory fees | 111,330 |
| Administrative services fees | 30,427 |
| Custodian fees | 6,424 |
| Distribution fees - Series II | 1,600 |
| Transfer agent fees | 9,914 |
| Trustees’ and officers’ fees and benefits | 11,618 |
| Reports to shareholders | 5,146 |
| Professional services fees | 27,890 |
| Other | 7,583 |
| Total expenses | 211,932 |
| Less: Fees waived | (1,108) |
| Net expenses | 210,824 |
| Net investment income | 298,261 |
| Realized and unrealized gain (loss) from: | |
| Net realized gain (loss) from: | |
| Investment securities | 621,364 |
| Foreign currencies | 3,461 |
| Forward foreign currency contracts | 22,376 |
| Futures contracts | (444,579) |
| | 202,622 |
| Change in net unrealized appreciation (depreciation) of: | |
| Investment securities | 3,561,517 |
| Foreign currencies | 145 |
| Forward foreign currency contracts | (14,755) |
| Futures contracts | 172,631 |
| | 3,719,538 |
| Net realized and unrealized gain | 3,922,160 |
| Net increase in net assets resulting from operations | $4,220,421 |
See accompanying Notes to Financial Statements which are an integral part of the financial statements.
Invesco V.I. Managed Volatility Fund
Statement of Changes in Net Assets
For the six months ended June 30, 2019 and the year ended December 31, 2018
(Unaudited)
| | June 30,
2019 | December 31,
2018 |
| Operations: | | |
| Net investment income | $298,261 | $521,300 |
| Net realized gain | 202,622 | 1,584,562 |
| Change in net unrealized appreciation (depreciation) | 3,719,538 | (6,547,229) |
| Net increase (decrease) in net assets resulting from operations | 4,220,421 | (4,441,367) |
| Distributions to shareholders from distributable earnings: | | |
| Series I | — | (2,054,218) |
| Series II | — | (66,296) |
| Total distributions from distributable earnings | — | (2,120,514) |
| Share transactions–net: | | |
| Series I | (2,318,639) | (3,342,378) |
| Series II | (51,835) | (11,717) |
| Net increase (decrease) in net assets resulting from share transactions | (2,370,474) | (3,354,095) |
| Net increase (decrease) in net assets | 1,849,947 | (9,915,976) |
| Net assets: | | |
| Beginning of period | 35,634,182 | 45,550,158 |
| End of period | $37,484,129 | $35,634,182 |
See accompanying Notes to Financial Statements which are an integral part of the financial statements.
Invesco V.I. Managed Volatility Fund
Financial Highlights
June 30, 2019
(Unaudited)
The following schedule presents financial highlights for a share of the Fund outstanding throughout the periods indicated.
| | Net asset
value,
beginning
of period | Net
investment
income(a) | Net gains
(losses)
on securities
(both
realized and
unrealized) | Total from
investment
operations | Dividends
from net
investment
income | Distributions
from net
realized
gains | Total
distributions | Net asset
value, end
of period | Total
return(b) | Net assets,
end of period
(000’s omitted) | Ratio of
expenses
to average
net assets
with fee waivers
and/or expenses
absorbed | Ratio of
expenses
to average net
assets without
fee waivers
and/or expenses
absorbed | Ratio of net
investment
income
to average
net assets | Portfolio
turnover(c) |
| Series I |
| Six months ended 06/30/19 | $11.04 | $0.10 | $1.23 | $1.33 | $— | $— | $— | $12.37 | 12.05% | $36,178 | 1.12%(d) | 1.13%(d) | 1.62%(d) | 45% |
| Year ended 12/31/18 | 13.06 | 0.16 | (1.51) | (1.35) | (0.22) | (0.45) | (0.67) | 11.04 | (11.00) | 34,420 | 1.23 | 1.24 | 1.24 | 111 |
| Year ended 12/31/17 | 11.97 | 0.18(e) | 1.08 | 1.26 | (0.17) | — | (0.17) | 13.06 | 10.56 | 44,104 | 1.13 | 1.13 | 1.42(e) | 91 |
| Year ended 12/31/16 | 11.38 | 0.14 | 1.03 | 1.17 | (0.22) | (0.36) | (0.58) | 11.97 | 10.61 | 50,183 | 1.15 | 1.16 | 1.26 | 92 |
| Year ended 12/31/15 | 19.02 | 0.18 | (0.74) | (0.56) | (0.27) | (6.81) | (7.08) | 11.38 | (2.15) | 52,360 | 1.08 | 1.10 | 1.07 | 117 |
| Year ended 12/31/14 | 17.03 | 0.24 | 3.23 | 3.47 | (0.56) | (0.92) | (1.48) | 19.02 | 20.57 | 70,717 | 1.03 | 1.10 | 1.26 | 201 |
| Series II |
| Six months ended 06/30/19 | 10.91 | 0.08 | 1.22 | 1.30 | — | — | — | 12.21 | 11.92 | 1,306 | 1.37(d) | 1.38(d) | 1.37(d) | 45 |
| Year ended 12/31/18 | 12.92 | 0.12 | (1.49) | (1.37) | (0.19) | (0.45) | (0.64) | 10.91 | (11.28) | 1,214 | 1.48 | 1.49 | 0.99 | 111 |
| Year ended 12/31/17 | 11.84 | 0.15(e) | 1.07 | 1.22 | (0.14) | — | (0.14) | 12.92 | 10.33 | 1,446 | 1.38 | 1.38 | 1.17(e) | 91 |
| Year ended 12/31/16 | 11.26 | 0.11 | 1.02 | 1.13 | (0.19) | (0.36) | (0.55) | 11.84 | 10.31 | 1,462 | 1.40 | 1.41 | 1.01 | 92 |
| Year ended 12/31/15 | 18.88 | 0.13 | (0.72) | (0.59) | (0.22) | (6.81) | (7.03) | 11.26 | (2.37) | 1,500 | 1.33 | 1.35 | 0.82 | 117 |
| Year ended 12/31/14 | 16.91 | 0.19 | 3.21 | 3.40 | (0.51) | (0.92) | (1.43) | 18.88 | 20.30 | 1,794 | 1.28 | 1.35 | 1.01 | 201 |
| (a) | Calculated using average shares outstanding. |
| (b) | Includes adjustments in accordance with accounting principles generally accepted in the United States of America and as such, the net asset value for financial reporting purposes and the returns based upon those net asset values may differ from the net asset value and returns for shareholder transactions. Total returns are not annualized for periods less than one year, if applicable, and do not reflect charges assessed in connection with a variable product, which if included would reduce total returns. |
| (c) | Portfolio turnover is calculated at the fund level and is not annualized for periods less than one year, if applicable. |
| (d) | Ratios are annualized and based on average daily net assets (000’s omitted) of $36,127 and $1,290 for Series I and Series II shares, respectively. |
| (e) | Net investment income per share and the ratio of net investment income to average net assets includes significant dividends received during the year ended December 31, 2017. Net investment income per share and the ratio of net investment income to average net assets excluding the significant dividends are $0.14 and 1.11% and $0.11 and 0.86% for Series I and Series II shares, respectively. |
See accompanying Notes to Financial Statements which are an integral part of the financial statements.
Invesco V.I. Managed Volatility Fund
Notes to Financial Statements
June 30, 2019
(Unaudited)
NOTE 1—Significant Accounting Policies
Invesco V.I. Managed Volatility Fund (the “Fund”) is a series portfolio of AIM Variable Insurance Funds (Invesco Variable Insurance Funds) (the “Trust”). The Trust is a Delaware statutory trust registered under the Investment Company Act of 1940, as amended (the “1940 Act”), as an open-end series management investment company. Information presented in these financial statements pertains only to the Fund. Matters affecting the Fund or each class will be voted on exclusively by the shareholders of the Fund or each class. Current Securities and Exchange Commission (“SEC”) guidance, however, requires participating insurance companies offering separate accounts to vote shares proportionally in accordance with the instructions of the contract owners whose investments are funded by shares of each Fund or class.
The Fund’s investment objective is both capital appreciation and current income while managing portfolio volatility.
The Fund currently offers two classes of shares, Series I and Series II, both of which are offered to insurance company separate accounts funding variable annuity contracts and variable life insurance policies (“variable products”).
The Fund is an investment company and accordingly follows the investment company accounting and reporting guidance in accordance with Financial Accounting Standards Board Accounting Standards Codification Topic 946,Financial Services – Investment Companies.
The following is a summary of the significant accounting policies followed by the Fund in the preparation of its financial statements.
| A. | Security Valuations — Securities, including restricted securities, are valued according to the following policy. |
A security listed or traded on an exchange (except convertible securities) is valued at its last sales price or official closing price as of the close of the customary trading session on the exchange where the security is principally traded, or lacking any sales or official closing price on a particular day, the security may be valued at the closing bid price on that day. Securities traded in the over-the-counter market are valued based on prices furnished by independent pricing services or market makers. When such securities are valued by an independent pricing service they may be considered fair valued. Futures contracts are valued at the final settlement price set by an exchange on which they are principally traded. Listed options are valued at the mean between the last bid and asked prices from the exchange on which they are principally traded. Options not listed on an exchange are valued by an independent source at the mean between the last bid and asked prices. For purposes of determining net asset value (“NAV”) per share, futures and option contracts generally are valued 15 minutes after the close of the customary trading session of the New York Stock Exchange (“NYSE”).
Investments in open-end and closed-end registered investment companies that do not trade on an exchange are valued at the end-of-day net asset value per share. Investments in open-end and closed-end registered investment companies that trade on an exchange are valued at the last sales price or official closing price as of the close of the customary trading session on the exchange where the security is principally traded.
Debt obligations (including convertible securities) and unlisted equities are fair valued using an evaluated quote provided by an independent pricing service. Evaluated quotes provided by the pricing service may be determined without exclusive reliance on quoted prices, and may reflect appropriate factors such as institution-size trading in similar groups of securities, developments related to specific securities, dividend rate (for unlisted equities), yield (for debt obligations), quality, type of issue, coupon rate (for debt obligations), maturity (for debt obligations), individual trading characteristics and other market data. Pricing services generally value debt obligations assuming orderly transactions of institutional round lot size, but a fund may hold or transact in the same securities in smaller, odd lot sizes. Odd lots often trade at lower prices than institutional round lots. Debt obligations are subject to interest rate and credit risks. In addition, all debt obligations involve some risk of default with respect to interest and/or principal payments.
Foreign securities’ (including foreign exchange contracts) prices are converted into U.S. dollar amounts using the applicable exchange rates as of the close of the NYSE. If market quotations are available and reliable for foreign exchange-traded equity securities, the securities will be valued at the market quotations. Because trading hours for certain foreign securities end before the close of the NYSE, closing market quotations may become unreliable. If between the time trading ends on a particular security and the close of the customary trading session on the NYSE, events occur that the investment adviser determines are significant and make the closing price unreliable, the Fund may fair value the security. If the event is likely to have affected the closing price of the security, the security will be valued at fair value in good faith using procedures approved by the Board of Trustees. Adjustments to closing prices to reflect fair value may also be based on a screening process of an independent pricing service to indicate the degree of certainty, based on historical data, that the closing price in the principal market where a foreign security trades is not the current value as of the close of the NYSE. Foreign securities’ prices meeting the approved degree of certainty that the price is not reflective of current value will be priced at the indication of fair value from the independent pricing service. Multiple factors may be considered by the independent pricing service in determining adjustments to reflect fair value and may include information relating to sector indices, American Depositary Receipts and domestic and foreign index futures. Foreign securities may have additional risks including exchange rate changes, potential for sharply devalued currencies and high inflation, political and economic upheaval, the relative lack of issuer information, relatively low market liquidity and the potential lack of strict financial and accounting controls and standards.
Securities for which market prices are not provided by any of the above methods may be valued based upon quotes furnished by independent sources. The last bid price may be used to value equity securities. The mean between the last bid and asked prices is used to value debt obligations, including corporate loans.
Securities for which market quotations are not readily available or became unreliable are valued at fair value as determined in good faith by or under the supervision of the Trust’s officers following procedures approved by the Board of Trustees. Issuer specific events, market trends, bid/asked quotes of brokers and information providers and other market data may be reviewed in the course of making a good faith determination of a security’s fair value.
The Fund may invest in securities that are subject to interest rate risk, meaning the risk that the prices will generally fall as interest rates rise and, conversely, the prices will generally rise as interest rates fall. Specific securities differ in their sensitivity to changes in interest rates depending on their individual characteristics. Changes in interest rates may result in increased market volatility, which may affect the value and/or liquidity of certain Fund investments.
Invesco V.I. Managed Volatility Fund
Valuations change in response to many factors including the historical and prospective earnings of the issuer, the value of the issuer’s assets, general economic conditions, interest rates, investor perceptions and market liquidity. Because of the inherent uncertainties of valuation, the values reflected in the financial statements may materially differ from the value received upon actual sale of those investments.
| B. | Securities Transactions and Investment Income — Securities transactions are accounted for on a trade date basis. Realized gains or losses on sales are computed on the basis of specific identification of the securities sold. Interest income (net of withholding tax, if any) is recorded on the accrual basis from settlement date. Dividend income (net of withholding tax, if any) is recorded on the ex-dividend date. |
The Fund may periodically participate in litigation related to Fund investments. As such, the Fund may receive proceeds from litigation settlements. Any proceeds received are included in the Statement of Operations as realized gain (loss) for investments no longer held and as unrealized gain (loss) for investments still held.
Brokerage commissions and mark ups are considered transaction costs and are recorded as an increase to the cost basis of securities purchased and/or a reduction of proceeds on a sale of securities. Such transaction costs are included in the determination of net realized and unrealized gain (loss) from investment securities reported in the Statement of Operations and the Statement of Changes in Net Assets and the net realized and unrealized gains (losses) on securities per share in the Financial Highlights. Transaction costs are included in the calculation of the Fund’s net asset value and, accordingly, they reduce the Fund’s total returns. These transaction costs are not considered operating expenses and are not reflected in net investment income reported in the Statement of Operations and the Statement of Changes in Net Assets, or the net investment income per share and the ratios of expenses and net investment income reported in the Financial Highlights, nor are they limited by any expense limitation arrangements between the Fund and the investment adviser.
The Fund allocates income and realized and unrealized capital gains and losses to a class based on the relative net assets of each class.
| C. | Country Determination — For the purposes of making investment selection decisions and presentation in the Schedule of Investments, the investment adviser may determine the country in which an issuer is located and/or credit risk exposure based on various factors. These factors include the laws of the country under which the issuer is organized, where the issuer maintains a principal office, the country in which the issuer derives 50% or more of its total revenues and the country that has the primary market for the issuer’s securities, as well as other criteria. Among the other criteria that may be evaluated for making this determination are the country in which the issuer maintains 50% or more of its assets, the type of security, financial guarantees and enhancements, the nature of the collateral and the sponsor organization. Country of issuer and/or credit risk exposure has been determined to be the United States of America, unless otherwise noted. |
| D. | Distributions– Distributions from net investment income and net realized capital gain, if any, are generally declared and paid to separate accounts of participating insurance companies annually and recorded on the ex-dividend date. |
| E. | Federal Income Taxes –The Fund intends to comply with the requirements of Subchapter M of the Internal Revenue Code of 1986, as amended (the “Internal Revenue Code”), necessary to qualify as a regulated investment company and to distribute substantially all of the Fund’s taxable earnings to shareholders. As such, the Fund will not be subject to federal income taxes on otherwise taxable income (including net realized capital gain) that is distributed to shareholders. Therefore, no provision for federal income taxes is recorded in the financial statements. |
The Fund recognizes the tax benefits of uncertain tax positions only when the position is more likely than not to be sustained. Management has analyzed the Fund’s uncertain tax positions and concluded that no liability for unrecognized tax benefits should be recorded related to uncertain tax positions. Management is not aware of any tax positions for which it is reasonably possible that the total amounts of unrecognized tax benefits will change materially in the next 12 months.
The Fund files tax returns in the U.S. Federal jurisdiction and certain other jurisdictions. Generally, the Fund is subject to examinations by such taxing authorities for up to three years after the filing of the return for the tax period.
| F. | Expenses– Fees provided for under the Rule 12b-1 plan of a particular class of the Fund and which are directly attributable to that class are charged to the operations of such class. All other expenses are allocated among the classes based on relative net assets. |
| G. | Accounting Estimates – The preparation of financial statements in conformity with accounting principles generally accepted in the United States of America (“GAAP”) requires management to make estimates and assumptions that affect the reported amounts of assets and liabilities at the date of the financial statements and the reported amounts of revenues and expenses during the reporting period including estimates and assumptions related to taxation. Actual results could differ from those estimates by a significant amount. In addition, the Fund monitors for material events or transactions that may occur or become known after the period-end date and before the date the financial statements are released to print. |
| H. | Indemnifications – Under the Trust’s organizational documents, each Trustee, officer, employee or other agent of the Trust is indemnified against certain liabilities that may arise out of the performance of their duties to the Fund. Additionally, in the normal course of business, the Fund enters into contracts, including the Fund’s servicing agreements, that contain a variety of indemnification clauses. The Fund’s maximum exposure under these arrangements is unknown as this would involve future claims that may be made against the Fund that have not yet occurred. The risk of material loss as a result of such indemnification claims is considered remote. |
| I. | Foreign Currency Translations— Foreign currency is valued at the close of the NYSE based on quotations posted by banks and major currency dealers. Portfolio securities and other assets and liabilities denominated in foreign currencies are translated into U.S. dollar amounts at the date of valuation. Purchases and sales of portfolio securities (net of foreign taxes withheld on disposition) and income items denominated in foreign currencies are translated into U.S. dollar amounts on the respective dates of such transactions. The Fund does not separately account for the portion of the results of operations resulting from changes in foreign exchange rates on investments and the fluctuations arising from changes in market prices of securities held. The combined results of changes in foreign exchange rates and the fluctuation of market prices on investments (net of estimated foreign tax withholding) are included with the net realized and unrealized gain or loss from investments in the Statement of Operations. Reported net realized foreign currency gains or losses arise from (1) sales of foreign currencies, (2) currency gains or losses realized between the trade and settlement dates on securities transactions, and (3) the difference between the amounts of dividends, interest, and foreign withholding taxes recorded on the Fund’s books and the U.S. dollar equivalent of the amounts actually received or paid. Net unrealized foreign currency gains and losses arise from changes in the fair values of assets and liabilities, other than investments in securities at fiscal period end, resulting from changes in exchange rates. |
The Fund may invest in foreign securities, which may be subject to foreign taxes on income, gains on investments or currency repatriation, a portion of which may be recoverable. Foreign taxes, if any, are recorded based on the tax regulations and rates that exist in the foreign markets in which the Fund invests and are shown in the Statement of Operations.
Invesco V.I. Managed Volatility Fund
| J. | Forward Foreign Currency Contracts— The Fund may engage in foreign currency transactions either on a spot (i.e. for prompt delivery and settlement) basis, or through forward foreign currency contracts, to manage or minimize currency or exchange rate risk. |
The Fund may also enter into forward foreign currency contracts for the purchase or sale of a security denominated in a foreign currency in order to “lock in” the U.S. dollar price of that security, or the Fund may also enter into forward foreign currency contracts that do not provide for physical settlement of the two currencies, but instead are settled by a single cash payment calculated as the difference between the agreed upon exchange rate and the spot rate at settlement based upon an agreed upon notional amount (non-deliverable forwards). The Fund will set aside liquid assets in an amount equal to the daily mark-to-market obligation for forward foreign currency contracts.
A forward foreign currency contract is an obligation between two parties (“Counterparties”) to purchase or sell a specific currency for an agreed-upon price at a future date. The use of forward foreign currency contracts does not eliminate fluctuations in the price of the underlying securities the Fund owns or intends to acquire but establishes a rate of exchange in advance. Fluctuations in the value of these contracts are measured by the difference in the contract date and reporting date exchange rates and are recorded as unrealized appreciation (depreciation) until the contracts are closed. When the contracts are closed, realized gains (losses) are recorded. Realized and unrealized gains (losses) on the contracts are included in the Statement of Operations. The primary risks associated with forward foreign currency contracts include failure of the Counterparty to meet the terms of the contract and the value of the foreign currency changing unfavorably. These risks may be in excess of the amounts reflected in the Statement of Assets and Liabilities.
| K. | Futures Contracts — The Fund may enter into futures contracts to manage exposure to interest rate, equity and market price movements and/or currency risks. A futures contract is an agreement between two parties ("Counterparties") to purchase or sell a specified underlying security, currency or commodity (or delivery of a cash settlement price, in the case of an index future) for a fixed price at a future date. The Fund currently invests only in exchange-traded futures and they are standardized as to maturity date and underlying financial instrument. Initial margin deposits required upon entering into futures contracts are satisfied by the segregation of specific securities or cash as collateral at the futures commission merchant (broker). During the period the futures contracts are open, changes in the value of the contracts are recognized as unrealized gains or losses by recalculating the value of the contracts on a daily basis. Subsequent or variation margin payments are received or made depending upon whether unrealized gains or losses are incurred. These amounts are reflected as receivables or payables on the Statement of Assets and Liabilities. When the contracts are closed or expire, the Fund recognizes a realized gain or loss equal to the difference between the proceeds from, or cost of, the closing transaction and the Fund’s basis in the contract. The net realized gain (loss) and the change in unrealized gain (loss) on futures contracts held during the period is included on the Statement of Operations. The primary risks associated with futures contracts are market risk and the absence of a liquid secondary market. If the Fund were unable to liquidate a futures contract and/or enter into an offsetting closing transaction, the Fund would continue to be subject to market risk with respect to the value of the contracts and continue to be required to maintain the margin deposits on the futures contracts. Futures contracts have minimal Counterparty risk since the exchange’s clearinghouse, as Counterparty to all exchange-traded futures, guarantees the futures against default. Risks may exceed amounts recognized in the Statement of Assets and Liabilities. |
NOTE 2—Advisory Fees and Other Fees Paid to Affiliates
The Trust has entered into a master investment advisory agreement with Invesco Advisers, Inc. (the “Adviser” or “Invesco”). Under the terms of the investment advisory agreement, the Fund accrues daily and pays monthly an advisory fee to the Adviser at the annual rate of 0.60% of the Fund’s average daily net assets.
Under the terms of a master sub-advisory agreement between the Adviser and each of Invesco Asset Management Deutschland GmbH, Invesco Asset Management Limited, Invesco Asset Management (Japan) Limited, Invesco Hong Kong Limited, Invesco Senior Secured Management, Inc. and Invesco Canada Ltd. and separate sub-advisory agreements with Invesco Capital Management LLC and Invesco Asset Management (India) Private Limited (collectively, the "Affiliated Sub-Advisers") the Adviser, not the Fund, will pay 40% of the fees paid to the Adviser to any such Affiliated Sub-Adviser(s) that provide(s) discretionary investment management services to the Fund based on the percentage of assets allocated to such Affiliated Sub-Adviser(s).
The Adviser has contractually agreed, through at least June 30, 2020, to waive advisory fees and/or reimburse expenses of all shares to the extent necessary to limit total annual fund operating expenses after fee waiver and/or expense reimbursement (excluding certain items discussed below) of Series I shares to 2.00% and Series II shares to 2.25% of average daily net assets (the “expense limits”). In determining the Adviser’s obligation to waive advisory fees and/or reimburse expenses, the following expenses are not taken into account, and could cause the total annual fund operating expenses after fee waiver and/or expense reimbursement to exceed the numbers reflected above: (1) interest; (2) taxes; (3) dividend expense on short sales; (4) extraordinary or non-routine items, including litigation expenses; and (5) expenses that the Fund has incurred but did not actually pay because of an expense offset arrangement. Unless Invesco continues the fee waiver agreement, it will terminate on June 30, 2020. During its term, the fee waiver agreement cannot be terminated or amended to increase the expense limits or reduce the advisory fee waiver without approval of the Board of Trustees. The Adviser did not waive fees and/or reimburse expenses during the period under these expense limits.
Further, the Adviser has contractually agreed, through at least June 30, 2021, to waive the advisory fee payable by the Fund in an amount equal to 100% of the net advisory fees the Adviser receives from the affiliated money market funds on investments by the Fund of uninvested cash in such affiliated money market funds.
For the six months ended June 30, 2019, the Adviser waived advisory fees of $1,108.
The Trust has entered into a master administrative services agreement with Invesco pursuant to which the Fund has agreed to pay Invesco a fee for costs incurred in providing accounting services and fund administrative services to the Fund and to reimburse Invesco for fees paid to insurance companies that have agreed to provide certain administrative services to the Fund. These administrative services provided by the insurance companies may include, among other things: maintenance of master accounts with the Fund; tracking, recording and transmitting net purchase and redemption orders for Fund shares; maintaining and preserving records related to the purchase, redemption and other account activity of variable product owners; distributing copies of Fund documents such as prospectuses, proxy materials and periodic reports, to variable product owners, and responding to inquiries from variable product owners about the Fund. Pursuant to such agreement, for the six months ended June 30, 2019, Invesco was paid $2,620 for accounting and fund administrative services and was reimbursed $27,807 for fees paid to insurance companies. Also, Invesco has entered into a sub-administration agreement whereby State Street Bank and Trust Company (“SSB”) serves as custodian and fund accountant and provides certain administrative services to the Fund.
Invesco V.I. Managed Volatility Fund
The Trust has entered into a transfer agency and service agreement with Invesco Investment Services, Inc. (“IIS”) pursuant to which the Fund has agreed to pay IIS a fee for providing transfer agency and shareholder services to the Fund and reimburse IIS for certain expenses incurred by IIS in the course of providing such services. For the six months ended June 30, 2019, expenses incurred under the agreement are shown in the Statement of Operations asTransfer agent fees.
The Trust has entered into a master distribution agreement with Invesco Distributors, Inc. (“IDI”) to serve as the distributor for the Fund. The Trust has adopted a plan pursuant to Rule 12b-1 under the 1940 Act with respect to the Fund’s Series II shares (the “Plan”). The Fund, pursuant to the Plan, pays IDI compensation at the annual rate of 0.25% of the Fund’s average daily net assets of Series II shares. The fees are accrued daily and paid monthly. Of the Plan payments, up to 0.25% of the average daily net assets of the Series II shares may be paid to insurance companies who furnish continuing personal shareholder services to customers who purchase and own Series II shares of the Fund. For the six months ended June 30, 2019, expenses incurred under the Plan are detailed in the Statement of Operations asDistribution fees.
Certain officers and trustees of the Trust are officers and directors of the Adviser, IIS and/or IDI.
NOTE 3—Additional Valuation Information
GAAP defines fair value as the price that would be received to sell an asset or paid to transfer a liability in an orderly transaction between market participants at the measurement date, under current market conditions. GAAP establishes a hierarchy that prioritizes the inputs to valuation methods, giving the highest priority to readily available unadjusted quoted prices in an active market for identical assets (Level 1) and the lowest priority to significant unobservable inputs (Level 3), generally when market prices are not readily available or are unreliable. Based on the valuation inputs, the securities or other investments are tiered into one of three levels. Changes in valuation methods may result in transfers in or out of an investment’s assigned level:
Level 1 – Prices are determined using quoted prices in an active market for identical assets.
Level 2 – Prices are determined using other significant observable inputs. Observable inputs are inputs that other market participants may use in pricing a security. These may include quoted prices for similar securities, interest rates, prepayment speeds, credit risk, yield curves, loss severities, default rates, discount rates, volatilities and others.
Level 3 – Prices are determined using significant unobservable inputs. In situations where quoted prices or observable inputs are unavailable (for example, when there is little or no market activity for an investment at the end of the period), unobservable inputs may be used. Unobservable inputs reflect the Fund’s own assumptions about the factors market participants would use in determining fair value of the securities or instruments and would be based on the best available information.
The following is a summary of the tiered valuation input levels, as of June 30, 2019. The level assigned to the securities valuations may not be an indication of the risk or liquidity associated with investing in those securities. Because of the inherent uncertainties of valuation, the values reflected in the financial statements may materially differ from the value received upon actual sale of those investments.
| | Level 1 | Level 2 | Level 3 | Total |
| Investments in Securities | | | | |
| Common Stocks & Other Equity Interests | $20,456,867 | $1,785,104 | $— | $22,241,971 |
| U.S. Dollar Denominated Bonds & Notes | — | 9,580,795 | — | 9,580,795 |
| U.S. Treasury Securities | — | 2,783,887 | — | 2,783,887 |
| Preferred Stocks | — | 82,500 | — | 82,500 |
| Money Market Funds | 2,602,696 | — | — | 2,602,696 |
| Total Investments in Securities | 23,059,563 | 14,232,286 | — | 37,291,849 |
| Other Investments - Assets* | | | | |
| Forward Foreign Currency Contracts | — | 259 | — | 259 |
| Other Investments - Liabilities* | | | | |
| Forward Foreign Currency Contracts | — | (17,903) | — | (17,903) |
| Total Other Investments | — | (17,644) | — | (17,644) |
| Total Investments | $23,059,563 | $14,214,642 | $— | $37,274,205 |
| * | Unrealized appreciation (depreciation). |
NOTE 4—Derivative Investments
The Fund may enter into an International Swaps and Derivatives Association Master Agreement (“ISDA Master Agreement”) under which a fund may trade OTC derivatives. An OTC transaction entered into under an ISDA Master Agreement typically involves a collateral posting arrangement, payment netting provisions and close-out netting provisions. These netting provisions allow for reduction of credit risk through netting of contractual obligations. The enforceability of the netting provisions of the ISDA Master Agreement depends on the governing law of the ISDA Master Agreement, among other factors.
For financial reporting purposes, the Fund does not offset OTC derivative assets or liabilities that are subject to ISDA Master Agreements in the Statement of Assets and Liabilities.
Invesco V.I. Managed Volatility Fund
Value of Derivative Investments at Period-End
The table below summarizes the value of the Fund’s derivative investments, detailed by primary risk exposure, held as of June 30, 2019:
| | Value |
| Derivative Assets | Currency
Risk |
| Unrealized appreciation on forward foreign currency contracts outstanding | $259 |
| Derivatives not subject to master netting agreements | - |
| Total Derivative Assets subject to master netting agreements | $259 |
| | Value |
| Derivative Liabilities | Currency
Risk |
| Unrealized depreciation on forward foreign currency contracts outstanding | $(17,903) |
| Derivatives not subject to master netting agreements | - |
| Total Derivative Liabilities subject to master netting agreements | $(17,903) |
Offsetting Assets and Liabilities
The table below reflects the Fund’s exposure to Counterparties subject to either an ISDA Master Agreement or other agreement for OTC derivative transactions as of June 30, 2019.
| | Financial
Derivative
Assets | Financial
Derivative
Liabilities | | Collateral
(Received)/Pledged | | |
| Counterparty | Forward Foreign
Currency Contracts | Forward Foreign
Currency Contracts | Net Value of
Derivatives | Non-Cash | Cash | Net
Amount |
| Bank of New York Mellon (The) | $– | $ (7,177) | $ (7,177) | $– | $– | $ (7,177) |
| State Street Bank & Trust Co. | 259 | (10,726) | (10,467) | – | – | (10,467) |
| Total | $ 259 | $ (17,903) | $ (17,644) | $– | $– | $ (17,644) |
Effect of Derivative Investments for the six months ended June 30, 2019
The table below summarizes the gains (losses) on derivative investments, detailed by primary risk exposure, recognized in earnings during the period:
| | Location of Gain (Loss) on
Statement of Operations |
| | Currency
Risk | Equity
Risk | Total |
| Realized Gain (Loss): | | | |
| Forward foreign currency contracts | $22,376 | $- | $22,376 |
| Futures contracts | - | (444,579) | (444,579) |
| Change in Net Unrealized Appreciation (Depreciation): | | | |
| Forward foreign currency contracts | (14,755) | - | (14,755) |
| Futures contracts | - | 172,631 | 172,631 |
| Total | $7,621 | $(271,948) | $(264,327) |
The table below summarizes the average notional value of derivatives held during the period.
| | Forward
Foreign Currency
Contracts | Futures
Contracts |
| Average notional value | $2,895,546 | $3,035,031 |
NOTE 5—Trustees’ and Officers’ Fees and Benefits
Trustees’ and Officers’ Fees and Benefits include amounts accrued by the Fund to pay remuneration to certain Trustees and Officers of the Fund. Trustees have the option to defer compensation payable by the Fund, and Trustees’ and Officers’ Fees and Benefits also include amounts accrued by the Fund to fund such deferred compensation amounts. Those Trustees who defer compensation have the option to select various Invesco Funds in which their deferral accounts shall be deemed to be invested. Finally, certain current Trustees were eligible to participate in a retirement plan that provided for benefits to be paid upon retirement to Trustees over a period of time based on the number of years of service. The Fund may have certain former Trustees who also participate in a retirement plan and receive benefits under such plan.Trustees’ and Officers’ Fees and Benefits include amounts accrued by the Fund to fund such retirement benefits. Obligations under the deferred compensation and retirement plans represent unsecured claims against the general assets of the Fund.
Invesco V.I. Managed Volatility Fund
NOTE 6—Cash Balances
The Fund is permitted to temporarily carry a negative or overdrawn balance in its account with State Street Bank and Trust Company, the custodian bank. Such balances, if any at period-end, are shown in the Statement of Assets and Liabilities under the payable caption Amount due custodian. To compensate the custodian bank for such overdrafts, the overdrawn Fund may either (1) leave funds as a compensating balance in the account so the custodian bank can be compensated by earning the additional interest; or (2) compensate by paying the custodian bank at a rate agreed upon by the custodian bank and Invesco, not to exceed the contractually agreed upon rate.
NOTE 7—Tax Information
The amount and character of income and gains to be distributed are determined in accordance with income tax regulations, which may differ from GAAP. Reclassifications are made to the Fund’s capital accounts to reflect income and gains available for distribution (or available capital loss carryforward) under income tax regulations. The tax character of distributions paid during the year and the tax components of net assets will be reported at the Fund’s fiscal year-end.
Capital loss carryforward is calculated and reported as of a specific date. Results of transactions and other activity after that date may affect the amount of capital loss carryforward actually available for the Fund to utilize. Capital losses generated in years beginning after December 22, 2010 can be carried forward for an unlimited period, whereas previous losses expire in eight tax years. Capital losses with an expiration period may not be used to offset capital gains until all net capital losses without an expiration date have been utilized. Capital loss carryforwards with no expiration date will retain their character as either short-term or long-term capital losses instead of as short-term capital losses as under prior law. The ability to utilize capital loss carryforwards in the future may be limited under the Internal Revenue Code and related regulations based on the results of future transactions.
The Fund did not have a capital loss carryforward as of December 31, 2018.
NOTE 8—Investment Transactions
The aggregate amount of investment securities (other than short-term securities, U.S. Treasury obligations and money market funds, if any) purchased and sold by the Fund during the six months ended June 30, 2019 was $13,236,279 and $16,428,466, respectively. During the same period, purchases and sales of U.S. Treasury obligations were $2,464,874 and $2,538,233, respectively. Cost of investments, including any derivatives, on a tax basis includes the adjustments for financial reporting purposes as of the most recently completed federal income tax reporting period-end.
| Unrealized Appreciation (Depreciation) of Investments on a Tax Basis |
| Aggregate unrealized appreciation of investments | $5,214,328 |
| Aggregate unrealized (depreciation) of investments | (1,250,044) |
| Net unrealized appreciation of investments | $3,964,284 |
Cost of investments for tax purposes is $33,309,921.
NOTE 9—Share Information
| | Summary of Share Activity |
| | Six months ended
June 30, 2019(a) | | Year ended
December 31, 2018 |
| | Shares | Amount | | Shares | Amount |
| Sold: | | | | | |
| Series I | 81,292 | $985,669 | | 209,264 | $2,541,868 |
| Series II | 1,195 | 14,276 | | 5,870 | 72,638 |
| Issued as reinvestment of dividends: | | | | | |
| Series I | — | — | | 162,517 | 2,054,218 |
| Series II | — | — | | 5,304 | 66,295 |
| Reacquired: | | | | | |
| Series I | (274,868) | (3,304,308) | | (630,388) | (7,938,464) |
| Series II | (5,586) | (66,111) | | (11,831) | (150,650) |
| Net increase (decrease) in share activity | (197,967) | $(2,370,474) | | (259,264) | $(3,354,095) |
| (a) | There are entities that are record owners of more than 5% of the outstanding shares of the Fund and in the aggregate own 59% of the outstanding shares of the Fund. The Fund and the Fund’s principal underwriter or adviser, are parties to participation agreements with these entities whereby these entities sell units of interest in separate accounts funding variable products that are invested in the Fund. The Fund, Invesco and/or Invesco affiliates may make payments to these entities, which are considered to be related to the Fund, for providing services to the Fund, Invesco and/or Invesco affiliates including but not limited to services such as, securities brokerage, third party record keeping and account servicing and administrative services. The Fund has no knowledge as to whether all or any portion of the shares owned of record by these entities are also owned beneficially. |
Invesco V.I. Managed Volatility Fund
Calculating your ongoing Fund expenses
Example
As a shareholder of the Fund, you incur ongoing costs, including management fees; distribution and/or service fees (12b-1); and other Fund expenses. This example is intended to help you understand your ongoing costs (in dollars) of investing in the Fund and to compare these costs with ongoing costs of investing in other mutual funds. The example is based on an investment of $1,000 invested at the beginning of the period and held for the entire period January 1, 2019 through June 30, 2019.
The actual and hypothetical expenses in the examples below do not represent the effect of any fees or other expenses assessed in connection with a variable product; if they did, the expenses shown would be higher while the ending account values shown would be lower.
Actual expenses
The table below provides information about actual account values and actual expenses. You may use the information in this table, together with the amount you invested, to estimate the expenses that you paid over the period. Simply divide your account value by $1,000 (for example, an $8,600 account value divided by $1,000 = 8.6), then multiply the result by the number in the table under the heading entitled “Actual Expenses Paid During Period” to estimate the expenses you paid on your account during this period.
Hypothetical example for comparison purposes
The table below also provides information about hypothetical account values and hypothetical expenses based on the Fund’s actual expense ratio and an assumed rate of return of 5% per year before expenses, which is not the Fund’s actual return.
The hypothetical account values and expenses may not be used to estimate the actual ending account balance or expenses you paid for the period. You may use this information to compare the ongoing costs of investing in the Fund and other funds. To do so, compare this 5% hypothetical example with the 5% hypothetical examples that appear in the shareholder reports of the other funds.
Please note that the expenses shown in the table are meant to highlight your ongoing costs. Therefore, the hypothetical information is useful in comparing ongoing costs, and will not help you determine the relative total costs of owning different funds.
| | Beginning
Account Value (01/01/19) | ACTUAL | HYPOTHETICAL
(5% annual return before
expenses) | Annualized
Expense
Ratio |
Ending
Account Value
(06/30/19)1 | Expenses
Paid During
Period2 | Ending
Account Value
(06/30/19) | Expenses
Paid During
Period2 |
| Series I | $1,000.00 | $1,120.50 | $5.89 | $1,019.24 | $5.61 | 1.12% |
| Series II | 1,000.00 | 1,119.20 | 7.20 | 1,018.00 | 6.85 | 1.37 |
| 1 | The actual ending account value is based on the actual total return of the Fund for the period January 1, 2019 through June 30, 2019, after actual expenses and will differ from the hypothetical ending account value which is based on the Fund’s expense ratio and a hypothetical annual return of 5% before expenses. |
| 2 | Expenses are equal to the Fund’s annualized expense ratio as indicated above multiplied by the average account value over the period, multiplied by 181/365 to reflect the most recent fiscal half year. |
Invesco V.I. Managed Volatility Fund
Approval of Investment Advisory andSub-Advisory Contracts
At meetings held on June 10, 2019, the Board of Trustees (the Board or the Trustees) of AIM Variable Insurance Funds (Invesco Variable Insurance Funds) as a whole, and the independent Trustees, who comprise over 75% of the Board, voting separately, approved the continuance of the Invesco V.I. Managed Volatility Fund’s (the Fund) Master Investment Advisory Agreement with Invesco Advisers, Inc. (Invesco Advisers and the investment advisory agreement) and the Master IntergroupSub-Advisory Contract for Mutual Funds with Invesco Asset Management Deutschland GmbH, Invesco Asset Management Limited, Invesco Asset Management (Japan) Limited, Invesco Hong Kong Limited, Invesco Senior Secured Management, Inc. and Invesco Canada Ltd. and separatesub-advisory contracts with Invesco Capital Management LLC and Invesco Asset Management (India) Private Limited (collectively, the AffiliatedSub-Advisers and thesub-advisory contracts) for another year, effective July 1, 2019. After evaluating the factors discussed below, among others, the Board approved the renewal of the Fund’s investment advisory agreement and thesub-advisory contracts and determined that the compensation payable by the Fund to Invesco Advisers and by Invesco Advisers to the AffiliatedSub-Advisers is fair and reasonable.
The Board’s Evaluation Process
The Board’s Investments Committee has established threeSub-Committees, which meet throughout the year to review the performance of funds advised by Invesco Advisers (the Invesco Funds). As part of a regularly scheduled basis ofin-person Board meetings, theSub-Committees meet with portfolio managers for their assigned Invesco Funds and other members of management to review detailed information about investment performance and portfolio attributes of these funds. The Board took into account evaluations and reports that it received from the Investments Committee andSub-Committees, as well as the information provided to such committees and the Board throughout the year, in considering whether to approve each Invesco Fund’s investment advisory agreement andsub-advisory contracts.
As part of the contract renewal process, the Board reviews and considers information provided in response to detailed requests for information submitted to management by the independent Trustees with assistance from legal counsel to the independent Trustees. The Board receives comparative investment performance and fee data regarding the Invesco Funds prepared by Invesco Advisers and Broadridge Financial Solutions, Inc. (Broadridge), an independent mutual fund data provider. The Board also receives an independent written evaluation from the Senior Officer, an officer of the Invesco Funds who reports directly to the
independent Trustees. The Senior Officer’s evaluation is prepared as part of his responsibility to manage the process by which the Invesco Funds’ proposed management fees are negotiated during the annual contract renewal process to ensure they are negotiated in a manner that is at arms’ length and reasonable. In addition to meetings with Invesco Advisers and fund counsel throughout the year, the independent Trustees also discuss the continuance of the investment advisory agreement andsub-advisory contracts in separate sessions with the Senior Officer and with independent legal counsel.
The discussion below is a summary of the Senior Officer’s independent written evaluation with respect to the Fund’s investment advisory agreement, as well as a discussion of the material factors and related conclusions that formed the basis for the Board’s approval of the Fund’s investment advisory agreement andsub-advisory contracts. The Trustees’ review and conclusions are based on the comprehensive consideration of all information presented to them during the course of the year and in prior years and are not the result of any single determinative factor. Moreover, one Trustee may have weighed a particular piece of information or factor differently than another Trustee. This information is current as of June 10, 2019.
Factors and Conclusions and Summary of Independent Written Fee Evaluation
| A. | Nature, Extent and Quality of Services Provided by Invesco Advisers and the AffiliatedSub-Advisers |
The Board reviewed the nature, extent and quality of the advisory services provided to the Fund by Invesco Advisers under the Fund’s investment advisory agreement, and the credentials and experience of the officers and employees of Invesco Advisers who provide these services, including the Fund’s portfolio manager(s). The Board’s review included consideration of Invesco Advisers’ investment process oversight and structure, credit analysis and investment risk management. The Board also considerednon-advisory services that Invesco Advisers and its affiliates provide to the Invesco Funds such as various back office support functions, third party oversight, internal audit, valuation, portfolio trading and legal and compliance. The Board also received and reviewed information about Invesco Advisers’ role as administrator of the Invesco Funds’ liquidity risk management program. The Board also reviewed and considered the benefits to shareholders of investing in a fund that is part of the Invesco family of funds under the umbrella of Invesco Ltd., Invesco Advisers’ parent company, and noted Invesco Ltd.’s depth and experience in conducting an investment management business, as well as its
commitment of financial and other resources to such business. The Board reviewed and considered information about the resources that Invesco Advisers intends to continue to commit to managing the Invesco family of funds following Invesco Ltd.’s acquisition of OppenheimerFunds, Inc. and its subsidiaries. The Board concluded that the nature, extent and quality of the services provided to the Fund by Invesco Advisers are appropriate and satisfactory.
The Board reviewed the services that may be provided by the AffiliatedSub-Advisers under thesub-advisory contracts and the credentials and experience of the officers and employees of the AffiliatedSub-Advisers who provide these services. The Board noted the AffiliatedSub-Advisers’ expertise with respect to certain asset classes and that the AffiliatedSub-Advisers have offices and personnel that are located in financial centers around the world. As a result, the Board noted that the AffiliatedSub-Advisers can provide research and investment analysis on the markets and economies of various countries in which the Fund may invest, make recommendations regarding securities and assist with security trades. The Board concluded that thesub-advisory contracts may benefit the Fund and its shareholders by permitting Invesco Advisers to use the resources and talents of the AffiliatedSub-Advisers in managing the Fund. The Board concluded that the nature, extent and quality of the services that may be provided by the AffiliatedSub-Advisers are appropriate and satisfactory.
| B. | Fund Investment Performance |
The Board considered Fund investment performance as a relevant factor in considering whether to approve the investment advisory agreement. The Board did not view Fund investment performance as a relevant factor in considering whether to approve thesub-advisory contracts for the Fund, as no AffiliatedSub-Adviser currently manages assets of the Fund.
The Board compared the Fund’s investment performance over multiple time periods ending December 31, 2018 to the performance of funds in the Broadridge performance universe and against the Lipper Variable Underlying Funds Mixed-Asset Target Allocation Growth Funds Index. The Board noted that performance of Series I shares of the Fund was in the fifth quintile of its performance universe for the one and three year periods and the first quintile for the five year period (the first quintile being the best performing funds and the fifth quintile being the worst performing funds). The Board noted that performance of Series I shares of the Fund was below the performance of the Index for the one and three year periods and above the performance of the Index for the five year period. The Board noted that the Fund’s value
Invesco V.I. Managed Volatility Fund
style of equity investing compared to its peers, including its underweight exposure to technology stocks and its overweight exposure to energy stocks, negatively impacted relative performance. The Trustees also reviewed more recent Fund performance and this review did not change their conclusions.
| C. | Advisory andSub-Advisory Fees and Fund Expenses |
The Board compared the Fund’s contractual management fee rate to the contractual management fee rates of funds in the Fund’s Broadridge expense group. The Board noted that the contractual management fee rate for Series I shares of the Fund was below the median contractual management fee rate of funds in its expense group. The Board noted that the term “contractual management fee” for funds in the expense group may include both advisory and certainnon-portfolio management administrative services fees, but that Broadridge does not provide information on a fund by fund basis as to what is included. The Board also reviewed the methodology used by Broadridge in providing expense group information, which includes using each fund’s contractual management fee schedule (including any applicable breakpoints) as reported in the most recent prospectus or statement of additional information for each fund in the expense group. The Board also considered comparative information regarding the Fund’s total expense ratio and its various components. The Board noted that there were only five funds (including the Fund) in the expense group. The Board also noted that the Fund’s total expense ratio ranked fifth in its expense group and discussed with management reasons for such relative total expenses.
The Board noted that Invesco Advisers has contractually agreed to waive fees and/or limit expenses of the Fund for the term disclosed in the Fund’s registration statement in an amount necessary to limit total annual operating expenses to a specified percentage of average daily net assets for each class of the Fund.
The Board also considered the fees charged by Invesco Advisers and the AffiliatedSub-Advisers to other similarly managed client accounts. The Board noted that Invesco Advisers or the AffiliatedSub-Advisers may charge lower fees to large institutional clients. Invesco Advisers reviewed with the Board differences in the scope of services it provides to the Invesco Funds relative to certain other types of client accounts, including management of cash flows as a result of redemptions and purchases, necessary infrastructure such as officers, office space, technology, legal and distribution, oversight of service providers, costs and business risks associated with launching new funds and sponsoring and maintaining the product line, preparation of annual registration statement updates and financial information and compliance with federal and state laws and regulations.
The Board also compared the Fund’s effective advisory fee rate (the advisory fee rate after
advisory fee waivers and before other expense limitations/waivers) to the effective advisory fee rates of other similarly managed third-party mutual funds advised orsub-advised by Invesco Advisers and its affiliates, based on asset balances as of December 31, 2018.
The Board also considered the services that may be provided by the AffiliatedSub-Advisers pursuant to thesub-advisory contracts, as well as the fees payable by Invesco Advisers to the AffiliatedSub-Advisers pursuant to thesub-advisory contracts.
| D. | Economies of Scale and Breakpoints |
The Board considered the extent to which there may be economies of scale in the provision of advisory services to the Fund. The Board considered Invesco’s reinvestment in its business, including investments in business infrastructure and cybersecurity. The Board noted that the Fund does not benefit from economies of scale through contractual breakpoints, but does share in economies of scale through lower fees charged by third party service providers based on the combined size of the Invesco Funds. The Board noted that the Fund may also benefit from economies of scale through initial fee setting, fee waivers and expense reimbursements.
| E. | Profitability and Financial Resources |
The Board reviewed information from Invesco Advisers concerning the costs of the advisory and other services that Invesco Advisers and its affiliates provide to the Fund and the Invesco Funds and the profitability of Invesco Advisers and its affiliates in providing these services. The Board considered the methodology used for calculating profitability and noted the periodic review of such methodology by an independent consultant. The Board noted that Invesco Advisers continues to operate at a net profit from services Invesco Advisers and its affiliates provide to the Invesco Funds and the Fund. The Board did not deem the level of profits realized by Invesco Advisers and its affiliates from providing services to the Fund to be excessive given the nature, extent and quality of the services provided. The Board received information from Invesco Advisers demonstrating that Invesco Advisers and the AffiliatedSub-Advisers are financially sound and have the resources necessary to perform their obligations under the investment advisory agreement andsub-advisory contracts.
| F. | Collateral Benefits to Invesco Advisers and its Affiliates |
The Board considered various other benefits received by Invesco Advisers and its affiliates from the relationship with the Fund, including the fees received for providing administrative, transfer agency and distribution services to the Fund. The Board considered comparative information regarding fees charged for these services, including information provided by Broadridge and other independent sources. The Board considered the performance of Invesco Advisers and its affiliates in providing these services and the organizational structure employed to provide these services. The Board
also considered that these services are provided to the Fund pursuant to written contracts that are reviewed and approved on an annual basis by the Board; and that the services are required for the operation of the Fund.
The Board considered the benefits realized by Invesco Advisers and the AffiliatedSub-Advisers as a result of portfolio brokerage transactions executed through “soft dollar” arrangements. The Board noted that soft dollar arrangements may result in the Fund bearing costs to purchase research that may be used by Invesco Advisers or the AffiliatedSub-Advisers with other clients and may reduce Invesco Advisers’ or the AffiliatedSub-Advisers’ expenses. The Board also considered that it receives periodic reports from Invesco representing that these arrangements are consistent with regulatory requirements. The Board did not deem the soft dollar arrangements to be inappropriate.
The Board considered that the Fund’s uninvested cash and cash collateral from any securities lending arrangements may be invested in money market funds advised by Invesco Advisers pursuant to procedures approved by the Board. The Board considered information regarding the returns of the affiliated money market funds relative to comparable overnight investments, as well as the costs to the Fund of such investments. The Board noted that Invesco Advisers receives advisory fees from these affiliated money market funds attributable to such investments, although Invesco Advisers has contractually agreed to waive through varying periods the advisory fees payable by the Invesco Funds with respect to certain investments in the affiliated money market funds. The waiver is in an amount equal to 100% of the net advisory fee Invesco Advisers receives from the affiliated money market funds with respect to the Fund’s investment in the affiliated money market funds of uninvested cash, but not cash collateral. The Board concluded that the amount of advisory fees received by Invesco Advisers from the Fund’s investment of cash collateral from any securities lending arrangements in the affiliated money market funds is fair and reasonable.
The Board also considered that an affiliated broker may receive commissions for executing certain trades for the Fund. Invesco Advisers and the AffiliatedSub-Advisers may use the affiliated broker to, among other things, control order routing and minimize information leakage, and the Board was advised that such trades are executed in compliance with rules under the federal securities laws and consistent with best execution obligations.
Invesco V.I. Managed Volatility Fund
| Semiannual Report to Shareholders | June 30, 2019 |
Invesco V.I. Mid Cap Core Equity Fund
Beginning on January 1, 2021, as permitted by regulations adopted by the Securities and Exchange Commission, the insurance company that offers your variable annuity or variable life insurance contract may no longer send you paper copies of the Fund’s shareholder reports by mail, unless you specifically request paper copies of the reports from the insurance company or your financial intermediary. Instead of delivering paper copies of the report, the insurance company may choose to make the reports available on a website, and will notify you by mail each time a report is posted and provide you with a website link to access the report. Instructions for requesting paper copies will be provided by your insurance company.
If the insurance company offers electronic delivery, you may elect to receive shareholder reports and other communications about the Fund electronically by following the instructions provided by the insurance company or by contacting your financial intermediary. If you already elected to receive shareholder reports electronically, you will not be affected by this change and you need not take any action.
You may elect to receive all future reports in paper free of charge from the insurance company. You can inform the insurance company or your financial intermediary that you wish to continue receiving paper copies of your shareholder reports by following the instructions provided by the insurance company or by contacting your financial intermediary. Your election to receive reports in paper will apply to all portfolio companies available under your contract with the insurance company.
The Fund provides a complete list of its holdings four times in each fiscal year, at the quarter-ends. For the second and fourth quarters, the lists appear in the Fund’s semiannual and annual reports to shareholders. For the first and third quarters, the Fund files the lists with the Securities and Exchange Commission (SEC) on Form N-Q (or any successor Form). The Fund’s Form N-Q (or any successor Form) filings are available on the SEC website, sec.gov. The SEC file numbers for the Fund are 811-07452 and 033-57340. The Fund’s most recent portfolio holdings, as filed on Form N-Q (or any successor Form), have also been made available to insurance companies issuing variable annuity contracts and variable life insurance policies (“variable products”) that invest in the Fund.
A description of the policies and procedures that the Fund uses to determine how to vote proxies relating to portfolio securities is available without charge, upon request, from our Client Services department at 800 959 4246 or at invesco.com/proxyguidelines. The information is also available on the SEC website, sec.gov.
Information regarding how the Fund voted proxies related to its portfolio securities during the most recent 12-month period ended June 30 is available at invesco.com/proxysearch. The information is also available on the SEC website, sec.gov.
Invesco Advisers, Inc. is an investment adviser; it provides investment advisory services to individual and institutional clients and does not sell securities. Invesco Distributors, Inc. is the US distributor for Invesco Ltd.’s retail mutual funds, exchange-traded funds and institutional money market funds. Both are wholly owned, indirect subsidiaries of Invesco Ltd.
This report must be accompanied or preceded by a currently effective Fund prospectus and variable product prospectus, which contain more complete information, including sales charges and expenses. Investors should read each carefully before investing.
NOT FDIC INSURED | MAY LOSE VALUE | NO BANK GUARANTEE
| Invesco Distributors, Inc. | VIMCCE-SAR-1 |
Performance summary
Fund vs. Indexes
Cumulative total returns, December 31, 2018 to June 30, 2019, excluding variable product issuer charges. If variable product issuer charges were included, returns would be lower.
| Series I Shares | 15.31% |
| Series II Shares | 15.21 |
| S&P 500 Index▼ (Broad Market Index) | 18.54 |
Russell Midcap Index■
(Style-Specific Index) | 21.35 |
Lipper VUF Mid-Cap Core Funds Index♦
(Peer Group Index) | 18.13 |
| Source(s):▼FactSet Research Systems Inc.;■ RIMES Technologies Corp.;♦ Lipper Inc. |
TheS&P 500® Index is an unmanaged index considered representative of the US stock market.
TheRussell Midcap® Index is an unmanaged index considered representative of mid-cap stocks. The Russell Midcap Index is a trademark/service mark of the Frank Russell Co. Russell® is a trademark of the Frank Russell Co.
TheLipper VUF Mid-Cap Core Funds Index is an unmanaged index considered representative of mid-cap core variable insurance underlying funds tracked by Lipper.
The Fund is not managed to track the performance of any particular index, including the indexes described here, and consequently, the performance of the Fund may deviate significantly from the performance of the indexes.
A direct investment cannot be made in an index. Unless otherwise indicated, index results include reinvested dividends, and they do not reflect sales charges. Performance of the peer group, if applicable, reflects fund expenses; performance of a market index does not.
| Average Annual Total Returns |
| As of 6/30/19 |
| Series I Shares | |
| Inception (9/10/01) | 7.19% |
| 10 Years | 9.51 |
| 5 Years | 4.42 |
| 1 Year | 4.92 |
| Series II Shares | |
| Inception (9/10/01) | 6.93% |
| 10 Years | 9.23 |
| 5 Years | 4.15 |
| 1 Year | 4.66 |
The performance of the Fund’s Series I and Series II share classes will differ primarily due to different class expenses.
The performance data quoted represent past performance and cannot guarantee comparable future results; current performance may be lower or higher. Please contact your variable product issuer or financial adviser for the most recent month-end variable product performance. Performance figures reflect Fund expenses, reinvested distributions and changes in net asset value. Performance figures do not reflect deduction of taxes a shareholder would pay on Fund distributions or sale of Fund shares. Investment return and principal value will fluctuate so that you may have a gain or loss when you sell shares.
The net annual Fund operating expense ratio set forth in the most recent Fund prospectus as of the date of this report for Series I and Series II
shares was 0.95% and 1.20%, respectively.1 The total annual Fund operating expense ratio set forth in the most recent Fund prospectus as of the date of this report for Series I and Series II shares was 0.98% and 1.23%, respectively. The expense ratios presented above may vary from the expense ratios presented in other sections of this report that are based on expenses incurred during the period covered by this report.
Invesco V.I. Mid Cap Core Equity Fund, a series portfolio of AIM Variable Insurance Funds (Invesco Variable Insurance Funds), is currently offered through insurance companies issuing variable products. You cannot purchase shares of the Fund directly. Performance figures given represent the Fund and are not intended to reflect actual variable product values. They do not reflect sales charges, expenses and fees assessed in connection with a variable product. Sales charges, expenses
and fees, which are determined by the variable product issuers, will vary and will lower the total return.
The most recent month-end performance at the Fund level, excluding variable product charges, is available at 800 451 4246. As mentioned above, for the most recent month-end performance including variable product charges, please contact your variable product issuer or financial adviser.
Fund performance reflects any applicable fee waivers and/or expense reimbursements. Had the adviser not waived fees and/or reimbursed expenses currently or in the past, returns would have been lower. See current prospectus for more information.
| 1 | Total annual Fund operating expenses after any contractual fee waivers and/or expense reimbursements by the adviser in effect through at least June 30, 2021. See current prospectus for more information. |
Invesco V.I. Mid Cap Core Equity Fund
Schedule of Investments(a)
June 30, 2019
(Unaudited)
| | Shares | Value |
| Common Stocks & Other Equity Interests–91.75% |
| Aerospace & Defense–1.22% |
| L3 Technologies, Inc. | 7,050 | $1,728,449 |
| Spirit AeroSystems Holdings, Inc., Class A | 15,058 | 1,225,269 |
| | | | 2,953,718 |
| Apparel, Accessories & Luxury Goods–0.60% |
| Samsonite International S.A.(b)(c) | 629,400 | 1,447,508 |
| Application Software–3.07% |
| ANSYS, Inc.(c) | 10,259 | 2,101,248 |
| Q2 Holdings, Inc.(c) | 16,235 | 1,239,705 |
| Synopsys, Inc.(c) | 31,929 | 4,108,943 |
| | | | 7,449,896 |
| Asset Management & Custody Banks–0.98% |
| St. James’s Place PLC (United Kingdom) | 170,828 | 2,386,602 |
| Auto Parts & Equipment–0.81% |
| Visteon Corp.(c) | 33,708 | 1,974,615 |
| Automotive Retail–0.73% |
| O’Reilly Automotive, Inc.(c) | 4,824 | 1,781,600 |
| Biotechnology–0.64% |
| Sarepta Therapeutics, Inc.(c) | 4,731 | 718,876 |
| Seattle Genetics, Inc.(c) | 11,940 | 826,367 |
| | | | 1,545,243 |
| Building Products–2.50% |
| Allegion PLC | 27,691 | 3,061,240 |
| Masco Corp. | 76,740 | 3,011,278 |
| | | | 6,072,518 |
| Commodity Chemicals–1.46% |
| Valvoline, Inc. | 181,046 | 3,535,828 |
| Communications Equipment–2.91% |
| Ciena Corp.(c) | 65,150 | 2,679,619 |
| Motorola Solutions, Inc. | 26,264 | 4,378,997 |
| | | | 7,058,616 |
| Construction Machinery & Heavy Trucks–1.00% |
| Wabtec Corp. | 33,926 | 2,434,530 |
| Consumer Finance–0.75% |
| Capital One Financial Corp. | 20,065 | 1,820,698 |
| Data Processing & Outsourced Services–3.13% |
| First Data Corp., Class A(c) | 199,999 | 5,413,973 |
| Pagseguro Digital Ltd., Class A (Brazil)(c) | 56,194 | 2,189,880 |
| | | | 7,603,853 |
| | Shares | Value |
| Diversified Chemicals–1.77% |
| Eastman Chemical Co. | 55,207 | $4,296,761 |
| Electric Utilities–0.73% |
| PPL Corp. | 57,200 | 1,773,772 |
| Electronic Components–1.16% |
| Amphenol Corp., Class A | 29,323 | 2,813,249 |
| Electronic Equipment & Instruments–2.14% |
| Keysight Technologies, Inc.(c) | 57,752 | 5,186,707 |
| Electronic Manufacturing Services–0.91% |
| IPG Photonics Corp.(c) | 14,338 | 2,211,636 |
| Environmental & Facilities Services–2.91% |
| Republic Services, Inc. | 52,609 | 4,558,044 |
| Tetra Tech, Inc. | 31,741 | 2,493,255 |
| | | | 7,051,299 |
| Financial Exchanges & Data–1.07% |
| Moody’s Corp. | 13,254 | 2,588,639 |
| General Merchandise Stores–1.96% |
| Dollar General Corp. | 35,275 | 4,767,769 |
| Health Care Equipment–4.78% |
| Boston Scientific Corp.(c) | 42,734 | 1,836,707 |
| Globus Medical, Inc., Class A(c) | 45,892 | 1,941,232 |
| Hill-Rom Holdings, Inc. | 28,872 | 3,020,589 |
| Wright Medical Group N.V.(c) | 120,692 | 3,599,035 |
| Zimmer Biomet Holdings, Inc. | 10,280 | 1,210,367 |
| | | | 11,607,930 |
| Health Care Services–0.21% |
| Guardant Health, Inc.(c) | 5,849 | 504,944 |
| Health Care Supplies–1.13% |
| Alcon, Inc. (Switzerland)(c) | 44,009 | 2,730,758 |
| Homebuilding–0.75% |
| D.R. Horton, Inc. | 42,074 | 1,814,652 |
| Human Resource & Employment Services–0.76% |
| Korn Ferry | 46,013 | 1,843,741 |
| Industrial Machinery–7.74% |
| Fortive Corp. | 30,515 | 2,487,583 |
| Ingersoll-Rand PLC | 23,141 | 2,931,270 |
| ITT, Inc. | 61,086 | 3,999,911 |
| Lincoln Electric Holdings, Inc. | 14,811 | 1,219,241 |
| Nordson Corp. | 14,868 | 2,100,997 |
| Parker-Hannifin Corp. | 19,862 | 3,376,739 |
| Stanley Black & Decker, Inc. | 18,470 | 2,670,947 |
| | | | 18,786,688 |
See accompanying Notes to Financial Statements which are an integral part of the financial statements.
Invesco V.I. Mid Cap Core Equity Fund
| | Shares | Value |
| Industrial REITs–2.25% |
| Prologis, Inc. | 68,090 | $5,454,009 |
| Insurance Brokers–0.32% |
| Arthur J. Gallagher & Co. | 8,763 | 767,551 |
| Interactive Home Entertainment–0.51% |
| Zynga, Inc., Class A(c) | 201,157 | 1,233,092 |
| IT Consulting & Other Services–1.52% |
| Amdocs Ltd. | 19,431 | 1,206,471 |
| EPAM Systems, Inc.(c) | 14,376 | 2,488,485 |
| | | | 3,694,956 |
| Life & Health Insurance–1.58% |
| Lincoln National Corp. | 19,270 | 1,241,951 |
| Torchmark Corp. | 28,882 | 2,583,784 |
| | | | 3,825,735 |
| Life Sciences Tools & Services–1.72% |
| Agilent Technologies, Inc. | 55,839 | 4,169,498 |
| Marine–1.00% |
| Kirby Corp.(c) | 30,760 | 2,430,040 |
| Multi-Utilities–2.48% |
| CMS Energy Corp. | 72,944 | 4,224,187 |
| Dominion Energy, Inc. | 23,309 | 1,802,252 |
| | | | 6,026,439 |
| Office REITs–0.74% |
| SL Green Realty Corp. | 22,235 | 1,787,027 |
| Oil & Gas Equipment & Services–1.78% |
| Apergy Corp.(c) | 27,260 | 914,300 |
| Cactus, Inc., Class A(c) | 37,804 | 1,252,069 |
| Core Laboratories N.V.(d) | 41,386 | 2,163,660 |
| | | | 4,330,029 |
| Oil & Gas Exploration & Production–2.94% |
| Concho Resources, Inc. | 9,594 | 989,909 |
| Continental Resources, Inc.(c) | 27,919 | 1,175,111 |
| Diamondback Energy, Inc. | 23,017 | 2,508,163 |
| Noble Energy, Inc. | 109,826 | 2,460,102 |
| | | | 7,133,285 |
| Packaged Foods & Meats–3.96% |
| Conagra Brands, Inc. | 128,640 | 3,411,533 |
| JM Smucker Co. (The) | 23,797 | 2,741,176 |
| McCormick & Co., Inc. | 22,367 | 3,467,109 |
| | | | 9,619,818 |
| Property & Casualty Insurance–2.33% |
| Fidelity National Financial, Inc. | 29,650 | 1,194,895 |
| Progressive Corp. (The) | 55,808 | 4,460,733 |
| | | | 5,655,628 |
| | Shares | Value |
| Railroads–1.96% |
| Canadian Pacific Railway Ltd. (Canada) | 6,604 | $1,553,525 |
| Genesee & Wyoming, Inc., Class A(c) | 31,914 | 3,191,400 |
| | | | 4,744,925 |
| Regional Banks–3.13% |
| East West Bancorp, Inc. | 81,433 | 3,808,621 |
| Sterling Bancorp | 58,949 | 1,254,435 |
| SVB Financial Group(c) | 11,281 | 2,533,600 |
| | | | 7,596,656 |
| Restaurants–1.99% |
| Domino’s Pizza, Inc. | 6,564 | 1,826,630 |
| Wendy’s Co. (The) | 153,812 | 3,011,639 |
| | | | 4,838,269 |
| Semiconductor Equipment–3.45% |
| Entegris, Inc. | 46,308 | 1,728,215 |
| KLA-Tencor Corp. | 30,205 | 3,570,231 |
| Teradyne, Inc. | 63,963 | 3,064,467 |
| | | | 8,362,913 |
| Semiconductors–3.13% |
| Microchip Technology, Inc. | 37,645 | 3,263,821 |
| Xilinx, Inc. | 36,663 | 4,323,301 |
| | | | 7,587,122 |
| Specialized REITs–1.71% |
| Lamar Advertising Co., Class A | 37,248 | 3,006,286 |
| Outfront Media, Inc. | 44,821 | 1,155,934 |
| | | | 4,162,220 |
| Specialty Chemicals–1.16% |
| International Flavors & Fragrances, Inc.(d) | 19,488 | 2,827,514 |
| Specialty Stores–0.90% |
| Ulta Beauty, Inc.(c) | 6,284 | 2,179,857 |
| Systems Software–1.37% |
| Symantec Corp. | 152,718 | 3,323,144 |
| Wireless Telecommunication Services–2.00% |
| T-Mobile US, Inc.(c) | 65,456 | 4,852,908 |
| Total Common Stocks & Other Equity Interests (Cost $172,382,618) | 222,646,405 |
| Money Market Funds–7.49% |
| Invesco Government & Agency Portfolio, Institutional Class, 2.26%(e) | 5,504,097 | 5,504,097 |
| Invesco Liquid Assets Portfolio, Institutional Class, 2.40%(e) | 3,930,855 | 3,932,427 |
| Invesco Treasury Portfolio, Institutional Class, 2.22%(e) | 8,742,846 | 8,742,846 |
| Total Money Market Funds (Cost $18,178,040) | 18,179,370 |
| TOTAL INVESTMENTS IN SECURITIES (excluding investments purchased with cash collateral from securities on loan)-99.24% (Cost $190,560,658) | | | 240,825,775 |
See accompanying Notes to Financial Statements which are an integral part of the financial statements.
Invesco V.I. Mid Cap Core Equity Fund
| | Shares | Value |
| Investments Purchased with Cash Collateral from Securities on Loan |
| Money Market Funds–1.40% |
| Invesco Government & Agency Portfolio, Institutional Class, 2.26%(e)(f) | 2,542,879 | $2,542,879 |
| Invesco Liquid Assets Portfolio, Institutional Class, 2.40%(e)(f) | 847,287 | 847,626 |
| Total Investments Purchased with Cash Collateral from Securities on Loan (Cost $3,390,505) | 3,390,505 |
| TOTAL INVESTMENTS IN SECURITIES–100.64% (Cost $193,951,163) | 244,216,280 |
| OTHER ASSETS LESS LIABILITIES–(0.64)% | (1,559,424) |
| NET ASSETS–100.00% | $242,656,856 |
Investment Abbreviations:
| REIT | – Real Estate Investment Trust |
Notes to Schedule of Investments:
| (a) | Industry and/or sector classifications used in this report are generally according to the Global Industry Classification Standard, which was developed by and is the exclusive property and a service mark of MSCI Inc. and Standard & Poor’s. |
| (b) | Security purchased or received in a transaction exempt from registration under the Securities Act of 1933, as amended (the “1933 Act”). The security may be resold pursuant to an exemption from registration under the 1933 Act, typically to qualified institutional buyers. The value of this security at June 30, 2019 represented less than 1% of the Fund’s Net Assets. |
| (c) | Non-income producing security. |
| (d) | All or a portion of this security was out on loan at June 30, 2019. |
| (e) | The money market fund and the Fund are affiliated by having the same investment adviser. The rate shown is the 7-day SEC standardized yield as of June 30, 2019. |
| (f) | The security has been segregated to satisfy the commitment to return the cash collateral received in securities lending transactions upon the borrower’s return of the securities loaned. See Note 1I. |
Portfolio Composition
By sector, based on Net Assets
as of June 30, 2019
| Information Technology | 22.79% |
| Industrials | 19.09 |
| Financials | 10.16 |
| Health Care | 8.48 |
| Consumer Discretionary | 7.74 |
| Energy | 4.72 |
| Real Estate | 4.70 |
| Materials | 4.39 |
| Consumer Staples | 3.96 |
| Utilities | 3.21 |
| Communication Services | 2.51 |
| Money Market Funds Plus Other Assets Less Liabilities | 8.25 |
See accompanying Notes to Financial Statements which are an integral part of the financial statements.
Invesco V.I. Mid Cap Core Equity Fund
Statement of Assets and Liabilities
June 30, 2019
(Unaudited)
| Assets: | |
Investments in securities, at value
(Cost $172,382,618)* | $222,646,405 |
| Investments in affiliated money market funds, at value (Cost $21,568,545) | 21,569,875 |
| Cash | 22,774 |
| Foreign currencies, at value (Cost $595) | 599 |
| Receivable for: | |
| Fund shares sold | 14,172 |
| Dividends | 254,473 |
| Investments sold | 22,845,049 |
| Investment for trustee deferred compensation and retirement plans | 120,315 |
| Total assets | 267,473,662 |
| Liabilities: | |
| Payable for: | |
| Investments purchased | 20,998,697 |
| Fund shares reacquired | 123,430 |
| Collateral upon return of securities loaned | 3,390,505 |
| Accrued fees to affiliates | 143,489 |
| Accrued trustees’ and officers’ fees and benefits | 496 |
| Accrued other operating expenses | 29,563 |
| Trustee deferred compensation and retirement plans | 130,626 |
| Total liabilities | 24,816,806 |
| Net assets applicable to shares outstanding | $242,656,856 |
| Net assets consist of: | |
| Shares of beneficial interest | $156,105,937 |
| Distributable earnings | 86,550,919 |
| | $242,656,856 |
| Net Assets: |
| Series I | $157,674,079 |
| Series II | $84,982,777 |
| Shares outstanding, no par value, with an unlimited number of shares authorized: |
| Series I | 12,465,991 |
| Series II | 6,883,399 |
| Series I: | |
| Net asset value per share | $12.65 |
| Series II: | |
| Net asset value per share | $12.35 |
| * | At June 30, 2019, securities with an aggregate value of $3,321,734 were on loan to brokers. |
Statement of Operations
For the six months ended June 30, 2019
(Unaudited)
| Investment income: | |
| Dividends (net of foreign withholding taxes of $27,805) | $1,379,694 |
| Dividends from affiliated money market funds (includes securities lending income of $17) | 601,369 |
| Total investment income | 1,981,063 |
| Expenses: | |
| Advisory fees | 864,934 |
| Administrative services fees | 195,707 |
| Custodian fees | 2,201 |
| Distribution fees - Series II | 100,673 |
| Transfer agent fees | 16,311 |
| Trustees’ and officers’ fees and benefits | 13,181 |
| Reports to shareholders | 4,091 |
| Professional services fees | 20,149 |
| Other | 1,924 |
| Total expenses | 1,219,171 |
| Less: Fees waived | (29,182) |
| Net expenses | 1,189,989 |
| Net investment income | 791,074 |
| Realized and unrealized gain (loss) from: | |
| Net realized gain from: | |
| Investment securities (includes net gains from securities sold to affiliates of $284,464) | 9,827,524 |
| Foreign currencies | 370 |
| | 9,827,894 |
| Change in net unrealized appreciation (depreciation) of: | |
| Investment securities | 22,743,235 |
| Foreign currencies | (1,654) |
| | 22,741,581 |
| Net realized and unrealized gain | 32,569,475 |
| Net increase in net assets resulting from operations | $33,360,549 |
See accompanying Notes to Financial Statements which are an integral part of the financial statements.
Invesco V.I. Mid Cap Core Equity Fund
Statement of Changes in Net Assets
For the six months ended June 30, 2019 and the year ended December 31, 2018
(Unaudited)
| | June 30,
2019 | December 31,
2018 |
| Operations: | | |
| Net investment income | $791,074 | $999,300 |
| Net realized gain | 9,827,894 | 26,580,216 |
| Change in net unrealized appreciation (depreciation) | 22,741,581 | (58,167,791) |
| Net increase (decrease) in net assets resulting from operations | 33,360,549 | (30,588,275) |
| Distributions to shareholders from distributable earnings: | | |
| Series I | — | (25,354,121) |
| Series II | — | (12,182,243) |
| Total distributions from distributable earnings | — | (37,536,364) |
| Share transactions–net: | | |
| Series I | (12,792,210) | 350,737 |
| Series II | 2,181,667 | (45,715,623) |
| Net increase (decrease) in net assets resulting from share transactions | (10,610,543) | (45,364,886) |
| Net increase (decrease) in net assets | 22,750,006 | (113,489,525) |
| Net assets: | | |
| Beginning of period | 219,906,850 | 333,396,375 |
| End of period | $242,656,856 | $219,906,850 |
See accompanying Notes to Financial Statements which are an integral part of the financial statements.
Invesco V.I. Mid Cap Core Equity Fund
Financial Highlights
June 30, 2019
(Unaudited)
The following schedule presents financial highlights for a share of the Fund outstanding throughout the periods indicated.
| | Net asset
value,
beginning
of period | Net
investment
income
(loss)(a) | Net gains
(losses)
on securities
(both
realized and
unrealized) | Total from
investment
operations | Dividends
from net
investment
income | Distributions
from net
realized
gains | Total
distributions | Net asset
value, end
of period | Total
return(b) | Net assets,
end of period
(000’s omitted) | Ratio of
expenses
to average
net assets
with fee waivers
and/or expenses
absorbed | Ratio of
expenses
to average net
assets without
fee waivers
and/or expenses
absorbed | Ratio of net
investment
income
(loss)
to average
net assets | Portfolio
turnover(c) |
| Series I |
| Six months ended 06/30/19 | $10.97 | $0.05 | $1.63 | $1.68 | $— | $— | $— | $12.65 | 15.31% | $157,674 | 0.92%(d) | 0.94%(d) | 0.74%(d) | 45% |
| Year ended 12/31/18 | 14.41 | 0.06 | (1.39) | (1.33) | (0.07) | (2.04) | (2.11) | 10.97 | (11.35) | 148,078 | 0.91 | 0.94 | 0.46 | 27 |
| Year ended 12/31/17 | 12.87 | 0.05 | 1.85 | 1.90 | (0.07) | (0.29) | (0.36) | 14.41 | 14.92 | 192,277 | 0.94 | 0.96 | 0.37 | 45 |
| Year ended 12/31/16 | 12.12 | 0.07 | 1.54 | 1.61 | (0.01) | (0.85) | (0.86) | 12.87 | 13.43 | 195,464 | 0.98 | 1.00 | 0.57 | 29 |
| Year ended 12/31/15 | 14.06 | 0.02 | (0.58) | (0.56) | (0.05) | (1.33) | (1.38) | 12.12 | (4.03) | 201,685 | 1.01 | 1.03 | 0.17 | 44 |
| Year ended 12/31/14 | 15.13 | 0.05 | 0.64 | 0.69 | (0.01) | (1.75) | (1.76) | 14.06 | 4.43 | 254,553 | 1.01 | 1.04 | 0.29 | 38 |
| Series II |
| Six months ended 06/30/19 | 10.72 | 0.03 | 1.60 | 1.63 | — | — | — | 12.35 | 15.21 | 84,983 | 1.17(d) | 1.19(d) | 0.49(d) | 45 |
| Year ended 12/31/18 | 14.11 | 0.03 | (1.36) | (1.33) | (0.02) | (2.04) | (2.06) | 10.72 | (11.60) | 71,829 | 1.16 | 1.19 | 0.21 | 27 |
| Year ended 12/31/17 | 12.61 | 0.02 | 1.81 | 1.83 | (0.04) | (0.29) | (0.33) | 14.11 | 14.65 | 141,120 | 1.19 | 1.21 | 0.12 | 45 |
| Year ended 12/31/16 | 11.91 | 0.04 | 1.51 | 1.55 | — | (0.85) | (0.85) | 12.61 | 13.16 | 130,118 | 1.23 | 1.25 | 0.32 | 29 |
| Year ended 12/31/15 | 13.84 | (0.01) | (0.57) | (0.58) | (0.02) | (1.33) | (1.35) | 11.91 | (4.28) | 118,276 | 1.26 | 1.28 | (0.08) | 44 |
| Year ended 12/31/14 | 14.95 | 0.01 | 0.63 | 0.64 | — | (1.75) | (1.75) | 13.84 | 4.17 | 128,305 | 1.26 | 1.29 | 0.04 | 38 |
| (a) | Calculated using average shares outstanding. |
| (b) | Includes adjustments in accordance with accounting principles generally accepted in the United States of America and as such, the net asset value for financial reporting purposes and the returns based upon those net asset values may differ from the net asset value and returns for shareholder transactions. Total returns are not annualized for periods less than one year, if applicable, and do not reflect charges assessed in connection with a variable product, which if included would reduce total returns. |
| (c) | Portfolio turnover is calculated at the fund level and is not annualized for periods less than one year, if applicable. |
| (d) | Ratios are annualized and based on average daily net assets (000’s omitted) of $159,374 and $81,206 for Series I and Series II shares, respectively. |
See accompanying Notes to Financial Statements which are an integral part of the financial statements.
Invesco V.I. Mid Cap Core Equity Fund
Notes to Financial Statements
June 30, 2019
(Unaudited)
NOTE 1—Significant Accounting Policies
Invesco V.I. Mid Cap Core Equity Fund (the “Fund”) is a series portfolio of AIM Variable Insurance Funds (Invesco Variable Insurance Funds) (the “Trust”). The Trust is a Delaware statutory trust registered under the Investment Company Act of 1940, as amended (the “1940 Act”), as an open-end series management investment company. Information presented in these financial statements pertains only to the Fund. Matters affecting the Fund or each class will be voted on exclusively by the shareholders of the Fund or each class. Current Securities and Exchange Commission (“SEC”) guidance, however, requires participating insurance companies offering separate accounts to vote shares proportionally in accordance with the instructions of the contract owners whose investments are funded by shares of each Fund or class.
The Fund’s investment objective is long-term growth of capital.
The Fund currently offers two classes of shares, Series I and Series II, both of which are offered to insurance company separate accounts funding variable annuity contracts and variable life insurance policies (“variable products”).
The Fund is an investment company and accordingly follows the investment company accounting and reporting guidance in accordance with Financial Accounting Standards Board Accounting Standards Codification Topic 946,Financial Services – Investment Companies.
The following is a summary of the significant accounting policies followed by the Fund in the preparation of its financial statements.
| A. | Security Valuations — Securities, including restricted securities, are valued according to the following policy. |
A security listed or traded on an exchange (except convertible securities) is valued at its last sales price or official closing price as of the close of the customary trading session on the exchange where the security is principally traded, or lacking any sales or official closing price on a particular day, the security may be valued at the closing bid price on that day. Securities traded in the over-the-counter market are valued based on prices furnished by independent pricing services or market makers. When such securities are valued by an independent pricing service they may be considered fair valued. Futures contracts are valued at the final settlement price set by an exchange on which they are principally traded. Listed options are valued at the mean between the last bid and asked prices from the exchange on which they are principally traded. Options not listed on an exchange are valued by an independent source at the mean between the last bid and asked prices. For purposes of determining net asset value (“NAV”) per share, futures and option contracts generally are valued 15 minutes after the close of the customary trading session of the New York Stock Exchange (“NYSE”).
Investments in open-end and closed-end registered investment companies that do not trade on an exchange are valued at the end-of-day net asset value per share. Investments in open-end and closed-end registered investment companies that trade on an exchange are valued at the last sales price or official closing price as of the close of the customary trading session on the exchange where the security is principally traded.
Debt obligations (including convertible securities) and unlisted equities are fair valued using an evaluated quote provided by an independent pricing service. Evaluated quotes provided by the pricing service may be determined without exclusive reliance on quoted prices, and may reflect appropriate factors such as institution-size trading in similar groups of securities, developments related to specific securities, dividend rate (for unlisted equities), yield (for debt obligations), quality, type of issue, coupon rate (for debt obligations), maturity (for debt obligations), individual trading characteristics and other market data. Pricing services generally value debt obligations assuming orderly transactions of institutional round lot size, but a fund may hold or transact in the same securities in smaller, odd lot sizes. Odd lots often trade at lower prices than institutional round lots. Debt obligations are subject to interest rate and credit risks. In addition, all debt obligations involve some risk of default with respect to interest and/or principal payments.
Foreign securities’ (including foreign exchange contracts) prices are converted into U.S. dollar amounts using the applicable exchange rates as of the close of the NYSE. If market quotations are available and reliable for foreign exchange-traded equity securities, the securities will be valued at the market quotations. Because trading hours for certain foreign securities end before the close of the NYSE, closing market quotations may become unreliable. If between the time trading ends on a particular security and the close of the customary trading session on the NYSE, events occur that the investment adviser determines are significant and make the closing price unreliable, the Fund may fair value the security. If the event is likely to have affected the closing price of the security, the security will be valued at fair value in good faith using procedures approved by the Board of Trustees. Adjustments to closing prices to reflect fair value may also be based on a screening process of an independent pricing service to indicate the degree of certainty, based on historical data, that the closing price in the principal market where a foreign security trades is not the current value as of the close of the NYSE. Foreign securities’ prices meeting the approved degree of certainty that the price is not reflective of current value will be priced at the indication of fair value from the independent pricing service. Multiple factors may be considered by the independent pricing service in determining adjustments to reflect fair value and may include information relating to sector indices, American Depositary Receipts and domestic and foreign index futures. Foreign securities may have additional risks including exchange rate changes, potential for sharply devalued currencies and high inflation, political and economic upheaval, the relative lack of issuer information, relatively low market liquidity and the potential lack of strict financial and accounting controls and standards.
Securities for which market prices are not provided by any of the above methods may be valued based upon quotes furnished by independent sources. The last bid price may be used to value equity securities. The mean between the last bid and asked prices is used to value debt obligations, including corporate loans.
Securities for which market quotations are not readily available or became unreliable are valued at fair value as determined in good faith by or under the supervision of the Trust’s officers following procedures approved by the Board of Trustees. Issuer specific events, market trends, bid/asked quotes of brokers and information providers and other market data may be reviewed in the course of making a good faith determination of a security’s fair value.
The Fund may invest in securities that are subject to interest rate risk, meaning the risk that the prices will generally fall as interest rates rise and, conversely, the prices will generally rise as interest rates fall. Specific securities differ in their sensitivity to changes in interest rates depending on their individual characteristics. Changes in interest rates may result in increased market volatility, which may affect the value and/or liquidity of certain Fund investments.
Invesco V.I. Mid Cap Core Equity Fund
Valuations change in response to many factors including the historical and prospective earnings of the issuer, the value of the issuer’s assets, general economic conditions, interest rates, investor perceptions and market liquidity. Because of the inherent uncertainties of valuation, the values reflected in the financial statements may materially differ from the value received upon actual sale of those investments.
| B. | Securities Transactions and Investment Income — Securities transactions are accounted for on a trade date basis. Realized gains or losses on sales are computed on the basis of specific identification of the securities sold. Interest income (net of withholding tax, if any) is recorded on the accrual basis from settlement date. Dividend income (net of withholding tax, if any) is recorded on the ex-dividend date. |
The Fund may periodically participate in litigation related to Fund investments. As such, the Fund may receive proceeds from litigation settlements. Any proceeds received are included in the Statement of Operations as realized gain (loss) for investments no longer held and as unrealized gain (loss) for investments still held.
Brokerage commissions and mark ups are considered transaction costs and are recorded as an increase to the cost basis of securities purchased and/or a reduction of proceeds on a sale of securities. Such transaction costs are included in the determination of net realized and unrealized gain (loss) from investment securities reported in the Statement of Operations and the Statement of Changes in Net Assets and the net realized and unrealized gains (losses) on securities per share in the Financial Highlights. Transaction costs are included in the calculation of the Fund’s net asset value and, accordingly, they reduce the Fund’s total returns. These transaction costs are not considered operating expenses and are not reflected in net investment income reported in the Statement of Operations and the Statement of Changes in Net Assets, or the net investment income per share and the ratios of expenses and net investment income reported in the Financial Highlights, nor are they limited by any expense limitation arrangements between the Fund and the investment adviser.
The Fund allocates income and realized and unrealized capital gains and losses to a class based on the relative net assets of each class.
| C. | Country Determination — For the purposes of making investment selection decisions and presentation in the Schedule of Investments, the investment adviser may determine the country in which an issuer is located and/or credit risk exposure based on various factors. These factors include the laws of the country under which the issuer is organized, where the issuer maintains a principal office, the country in which the issuer derives 50% or more of its total revenues and the country that has the primary market for the issuer’s securities, as well as other criteria. Among the other criteria that may be evaluated for making this determination are the country in which the issuer maintains 50% or more of its assets, the type of security, financial guarantees and enhancements, the nature of the collateral and the sponsor organization. Country of issuer and/or credit risk exposure has been determined to be the United States of America, unless otherwise noted. |
| D. | Distributions– Distributions from net investment income and net realized capital gain, if any, are generally declared and paid to separate accounts of participating insurance companies annually and recorded on the ex-dividend date. |
| E. | Federal Income Taxes –The Fund intends to comply with the requirements of Subchapter M of the Internal Revenue Code of 1986, as amended (the “Internal Revenue Code”), necessary to qualify as a regulated investment company and to distribute substantially all of the Fund’s taxable earnings to shareholders. As such, the Fund will not be subject to federal income taxes on otherwise taxable income (including net realized capital gain) that is distributed to shareholders. Therefore, no provision for federal income taxes is recorded in the financial statements. |
The Fund recognizes the tax benefits of uncertain tax positions only when the position is more likely than not to be sustained. Management has analyzed the Fund’s uncertain tax positions and concluded that no liability for unrecognized tax benefits should be recorded related to uncertain tax positions. Management is not aware of any tax positions for which it is reasonably possible that the total amounts of unrecognized tax benefits will change materially in the next 12 months.
The Fund files tax returns in the U.S. Federal jurisdiction and certain other jurisdictions. Generally, the Fund is subject to examinations by such taxing authorities for up to three years after the filing of the return for the tax period.
| F. | Expenses– Fees provided for under the Rule 12b-1 plan of a particular class of the Fund and which are directly attributable to that class are charged to the operations of such class. All other expenses are allocated among the classes based on relative net assets. |
| G. | Accounting Estimates – The preparation of financial statements in conformity with accounting principles generally accepted in the United States of America (“GAAP”) requires management to make estimates and assumptions that affect the reported amounts of assets and liabilities at the date of the financial statements and the reported amounts of revenues and expenses during the reporting period including estimates and assumptions related to taxation. Actual results could differ from those estimates by a significant amount. In addition, the Fund monitors for material events or transactions that may occur or become known after the period-end date and before the date the financial statements are released to print. |
| H. | Indemnifications – Under the Trust’s organizational documents, each Trustee, officer, employee or other agent of the Trust is indemnified against certain liabilities that may arise out of the performance of their duties to the Fund. Additionally, in the normal course of business, the Fund enters into contracts, including the Fund’s servicing agreements, that contain a variety of indemnification clauses. The Fund’s maximum exposure under these arrangements is unknown as this would involve future claims that may be made against the Fund that have not yet occurred. The risk of material loss as a result of such indemnification claims is considered remote. |
| I. | Securities Lending– The Fund may lend portfolio securities having a market value up to one-third of the Fund’s total assets. Such loans are secured by collateral equal to no less than the market value of the loaned securities determined daily by the securities lending provider. Such collateral will be cash or debt securities issued or guaranteed by the U.S. Government or any of its sponsored agencies. Cash collateral received in connection with these loans is invested in short-term money market instruments or affiliated money market funds and is shown as such on the Schedule of Investments. The Fund bears the risk of loss with respect to the investment of collateral. It is the Fund’s policy to obtain additional collateral from or return excess collateral to the borrower by the end of the next business day, following the valuation date of the securities loaned. Therefore, the value of the collateral held may be temporarily less than the value of the securities on loan. When loaning securities, the Fund retains certain benefits of owning the securities, including the economic equivalent of dividends or interest generated by the security. Lending securities entails a risk of loss to the Fund if, and to the extent that, the market value of the securities loaned were to increase and the borrower did not increase the collateral accordingly, and the borrower failed to return the securities. The securities loaned are subject to termination at the option of the borrower or the Fund. Upon termination, the borrower will return to the Fund the securities loaned and the Fund will return the collateral. Upon the failure of the borrower to return the securities, collateral may be liquidated and the securities may be purchased on the open market to replace the loaned securities. The Fund could experience delays and costs in gaining access to the collateral and the securities may lose value during the delay which could result in potential losses to the Fund. Some of these losses may be indemnified by the lending agent. The Fund bears the risk of any deficiency in the amount of the collateral available for return to the borrower due to any loss on the |
Invesco V.I. Mid Cap Core Equity Fund
| | collateral invested. Dividends received on cash collateral investments for securities lending transactions, which are net of compensation to counterparties, are included inDividends from affiliated money market funds on the Statement of Operations. The aggregate value of securities out on loan, if any, is shown as a footnote on the Statement of Assets and Liabilities. |
| J. | Foreign Currency Translations— Foreign currency is valued at the close of the NYSE based on quotations posted by banks and major currency dealers. Portfolio securities and other assets and liabilities denominated in foreign currencies are translated into U.S. dollar amounts at the date of valuation. Purchases and sales of portfolio securities (net of foreign taxes withheld on disposition) and income items denominated in foreign currencies are translated into U.S. dollar amounts on the respective dates of such transactions. The Fund does not separately account for the portion of the results of operations resulting from changes in foreign exchange rates on investments and the fluctuations arising from changes in market prices of securities held. The combined results of changes in foreign exchange rates and the fluctuation of market prices on investments (net of estimated foreign tax withholding) are included with the net realized and unrealized gain or loss from investments in the Statement of Operations. Reported net realized foreign currency gains or losses arise from (1) sales of foreign currencies, (2) currency gains or losses realized between the trade and settlement dates on securities transactions, and (3) the difference between the amounts of dividends, interest, and foreign withholding taxes recorded on the Fund’s books and the U.S. dollar equivalent of the amounts actually received or paid. Net unrealized foreign currency gains and losses arise from changes in the fair values of assets and liabilities, other than investments in securities at fiscal period end, resulting from changes in exchange rates. |
The Fund may invest in foreign securities, which may be subject to foreign taxes on income, gains on investments or currency repatriation, a portion of which may be recoverable. Foreign taxes, if any, are recorded based on the tax regulations and rates that exist in the foreign markets in which the Fund invests and are shown in the Statement of Operations.
| K. | Forward Foreign Currency Contracts— The Fund may engage in foreign currency transactions either on a spot (i.e. for prompt delivery and settlement) basis, or through forward foreign currency contracts, to manage or minimize currency or exchange rate risk. |
The Fund may also enter into forward foreign currency contracts for the purchase or sale of a security denominated in a foreign currency in order to “lock in” the U.S. dollar price of that security, or the Fund may also enter into forward foreign currency contracts that do not provide for physical settlement of the two currencies, but instead are settled by a single cash payment calculated as the difference between the agreed upon exchange rate and the spot rate at settlement based upon an agreed upon notional amount (non-deliverable forwards). The Fund will set aside liquid assets in an amount equal to the daily mark-to-market obligation for forward foreign currency contracts.
A forward foreign currency contract is an obligation between two parties (“Counterparties”) to purchase or sell a specific currency for an agreed-upon price at a future date. The use of forward foreign currency contracts does not eliminate fluctuations in the price of the underlying securities the Fund owns or intends to acquire but establishes a rate of exchange in advance. Fluctuations in the value of these contracts are measured by the difference in the contract date and reporting date exchange rates and are recorded as unrealized appreciation (depreciation) until the contracts are closed. When the contracts are closed, realized gains (losses) are recorded. Realized and unrealized gains (losses) on the contracts are included in the Statement of Operations. The primary risks associated with forward foreign currency contracts include failure of the Counterparty to meet the terms of the contract and the value of the foreign currency changing unfavorably. These risks may be in excess of the amounts reflected in the Statement of Assets and Liabilities.
NOTE 2—Advisory Fees and Other Fees Paid to Affiliates
The Trust has entered into a master investment advisory agreement with Invesco Advisers, Inc. (the "Adviser" or "Invesco"). Under the terms of the investment advisory agreement, the Fund accrues daily and pays monthly an advisory fee to the Adviser based on the annual rate of the Fund’s average daily net assets as follows:
| Average Daily Net Assets | Rate |
| First $500 million | 0.725% |
| Next $500 million | 0.70% |
| Next $500 million | 0.675% |
| Over $1.5 billion | 0.65% |
For the six months ended June 30, 2019, the effective advisory fees incurred by the Fund was 0.725%.
Under the terms of a master sub-advisory agreement between the Adviser and each of Invesco Asset Management Deutschland GmbH, Invesco Asset Management Limited, Invesco Asset Management (Japan) Limited, Invesco Hong Kong Limited, Invesco Senior Secured Management, Inc. and Invesco Canada Ltd. and separate sub-advisory agreements with Invesco Capital Management LLC and Invesco Asset Management (India) Private Limited (collectively, the "Affiliated Sub-Advisers") the Adviser, not the Fund, will pay 40% of the fees paid to the Adviser to any such Affiliated Sub-Adviser(s) that provide(s) discretionary investment management services to the Fund based on the percentage of assets allocated to such Affiliated Sub-Adviser(s).
The Adviser has contractually agreed, through at least June 30, 2020, to waive advisory fees and/or reimburse expenses of all shares to the extent necessary to limit total annual fund operating expenses after fee waiver and/or expense reimbursement (excluding certain items discussed below) of Series I shares to 2.00% and Series II shares to 2.25% of average daily net assets (the “expense limits”). In determining the Adviser’s obligation to waive advisory fees and/or reimburse expenses, the following expenses are not taken into account, and could cause the total annual fund operating expenses after fee waiver and/or expense reimbursement to exceed the numbers reflected above: (1) interest; (2) taxes; (3) dividend expense on short sales; (4) extraordinary or non-routine items, including litigation expenses; and (5) expenses that the Fund has incurred but did not actually pay because of an expense offset arrangement. Unless Invesco continues the fee waiver agreement, it will terminate on June 30, 2020. During its term, the fee waiver agreement cannot be terminated or amended to increase the expense limits or reduce the advisory fee waiver without approval of the Board of Trustees. The Adviser did not waive fees and/or reimburse expenses during the period under these expense limits.
Further, the Adviser has contractually agreed, through at least June 30, 2021, to waive the advisory fee payable by the Fund in an amount equal to 100% of the net advisory fees the Adviser receives from the affiliated money market funds on investments by the Fund of uninvested cash in such affiliated money market funds.
For the six months ended June 30, 2019, the Adviser waived advisory fees of $29,182.
Invesco V.I. Mid Cap Core Equity Fund
The Trust has entered into a master administrative services agreement with Invesco pursuant to which the Fund has agreed to pay Invesco a fee for costs incurred in providing accounting services and fund administrative services to the Fund and to reimburse Invesco for fees paid to insurance companies that have agreed to provide certain administrative services to the Fund. These administrative services provided by the insurance companies may include, among other things: maintenance of master accounts with the Fund; tracking, recording and transmitting net purchase and redemption orders for Fund shares; maintaining and preserving records related to the purchase, redemption and other account activity of variable product owners; distributing copies of Fund documents such as prospectuses, proxy materials and periodic reports, to variable product owners, and responding to inquiries from variable product owners about the Fund. Pursuant to such agreement, for the six months ended June 30, 2019, Invesco was paid $16,844 for accounting and fund administrative services and was reimbursed $178,863 for fees paid to insurance companies. Also, Invesco has entered into a sub-administration agreement whereby State Street Bank and Trust Company (“SSB”) serves as custodian and fund accountant and provides certain administrative services to the Fund.
The Trust has entered into a transfer agency and service agreement with Invesco Investment Services, Inc. (“IIS”) pursuant to which the Fund has agreed to pay IIS a fee for providing transfer agency and shareholder services to the Fund and reimburse IIS for certain expenses incurred by IIS in the course of providing such services. IIS may make payments to intermediaries that provide omnibus account services, sub-accounting services and/or networking services. All fees payable by IIS to intermediaries that provide omnibus account services or sub-accounting services are charged back to the Fund, subject to certain limitations approved by the Trust’s Board of Trustees. For the six months ended June 30, 2019, expenses incurred under the agreement are shown in the Statement of Operations asTransfer agent fees.
The Trust has entered into a master distribution agreement with Invesco Distributors, Inc. (“IDI”) to serve as the distributor for the Fund. The Trust has adopted a plan pursuant to Rule 12b-1 under the 1940 Act with respect to the Fund’s Series II shares (the “Plan”). The Fund, pursuant to the Plan, pays IDI compensation at the annual rate of 0.25% of the Fund’s average daily net assets of Series II shares. The fees are accrued daily and paid monthly. Of the Plan payments, up to 0.25% of the average daily net assets of the Series II shares may be paid to insurance companies who furnish continuing personal shareholder services to customers who purchase and own Series II shares of the Fund. For the six months ended June 30, 2019, expenses incurred under the Plan are detailed in the Statement of Operations asDistribution fees.
For the six months ended June 30, 2019, the Fund incurred $216 in brokerage commissions with Invesco Capital Markets, Inc., an affiliate of the Adviser and IDI, for portfolio transactions executed on behalf of the Fund.
Certain officers and trustees of the Trust are officers and directors of the Adviser, IIS and/or IDI.
NOTE 3—Additional Valuation Information
GAAP defines fair value as the price that would be received to sell an asset or paid to transfer a liability in an orderly transaction between market participants at the measurement date, under current market conditions. GAAP establishes a hierarchy that prioritizes the inputs to valuation methods, giving the highest priority to readily available unadjusted quoted prices in an active market for identical assets (Level 1) and the lowest priority to significant unobservable inputs (Level 3), generally when market prices are not readily available or are unreliable. Based on the valuation inputs, the securities or other investments are tiered into one of three levels. Changes in valuation methods may result in transfers in or out of an investment’s assigned level:
Level 1 – Prices are determined using quoted prices in an active market for identical assets.
Level 2 – Prices are determined using other significant observable inputs. Observable inputs are inputs that other market participants may use in pricing a security. These may include quoted prices for similar securities, interest rates, prepayment speeds, credit risk, yield curves, loss severities, default rates, discount rates, volatilities and others.
Level 3 – Prices are determined using significant unobservable inputs. In situations where quoted prices or observable inputs are unavailable (for example, when there is little or no market activity for an investment at the end of the period), unobservable inputs may be used. Unobservable inputs reflect the Fund’s own assumptions about the factors market participants would use in determining fair value of the securities or instruments and would be based on the best available information.
The following is a summary of the tiered valuation input levels, as of June 30, 2019. The level assigned to the securities valuations may not be an indication of the risk or liquidity associated with investing in those securities. Because of the inherent uncertainties of valuation, the values reflected in the financial statements may materially differ from the value received upon actual sale of those investments.
| | Level 1 | Level 2 | Level 3 | Total |
| Investments in Securities | | | | |
| Common Stocks & Other Equity Interests | $218,812,295 | $3,834,110 | $— | $222,646,405 |
| Money Market Funds | 21,569,875 | — | — | 21,569,875 |
| Total Investments | $240,382,170 | $3,834,110 | $— | $244,216,280 |
NOTE 4—Security Transactions with Affiliated Funds
The Fund is permitted to purchase or sell securities from or to certain other Invesco Funds under specified conditions outlined in procedures adopted by the Board of Trustees of the Trust. The procedures have been designed to ensure that any purchase or sale of securities by the Fund from or to another fund or portfolio that is or could be considered an affiliate by virtue of having a common investment adviser (or affiliated investment advisers), common Trustees and/or common officers complies with Rule 17a-7 of the 1940 Act. Further, as defined under the procedures, each transaction is effected at the current market price. Pursuant to these procedures, for the six months ended June 30, 2019, the Fund engaged in securities purchases of $1,545,270 and securities sales of $1,519,256, which resulted in net realized gains of $284,464.
NOTE 5—Trustees’ and Officers’ Fees and Benefits
Trustees’ and Officers’ Fees and Benefits include amounts accrued by the Fund to pay remuneration to certain Trustees and Officers of the Fund. Trustees have the option to defer compensation payable by the Fund, and Trustees’ and Officers’ Fees and Benefits also include amounts accrued by the
Invesco V.I. Mid Cap Core Equity Fund
Fund to fund such deferred compensation amounts. Those Trustees who defer compensation have the option to select various Invesco Funds in which their deferral accounts shall be deemed to be invested. Finally, certain current Trustees were eligible to participate in a retirement plan that provided for benefits to be paid upon retirement to Trustees over a period of time based on the number of years of service. The Fund may have certain former Trustees who also participate in a retirement plan and receive benefits under such plan.Trustees’ and Officers’ Fees and Benefits include amounts accrued by the Fund to fund such retirement benefits. Obligations under the deferred compensation and retirement plans represent unsecured claims against the general assets of the Fund.
NOTE 6—Cash Balances
The Fund is permitted to temporarily carry a negative or overdrawn balance in its account with State Street Bank and Trust Company, the custodian bank. Such balances, if any at period-end, are shown in the Statement of Assets and Liabilities under the payable caption Amount due custodian. To compensate the custodian bank for such overdrafts, the overdrawn Fund may either (1) leave funds as a compensating balance in the account so the custodian bank can be compensated by earning the additional interest; or (2) compensate by paying the custodian bank at a rate agreed upon by the custodian bank and Invesco, not to exceed the contractually agreed upon rate.
NOTE 7—Tax Information
The amount and character of income and gains to be distributed are determined in accordance with income tax regulations, which may differ from GAAP. Reclassifications are made to the Fund’s capital accounts to reflect income and gains available for distribution (or available capital loss carryforward) under income tax regulations. The tax character of distributions paid during the year and the tax components of net assets will be reported at the Fund’s fiscal year-end.
Capital loss carryforward is calculated and reported as of a specific date. Results of transactions and other activity after that date may affect the amount of capital loss carryforward actually available for the Fund to utilize. Capital losses generated in years beginning after December 22, 2010 can be carried forward for an unlimited period, whereas previous losses expire in eight tax years. Capital losses with an expiration period may not be used to offset capital gains until all net capital losses without an expiration date have been utilized. Capital loss carryforwards with no expiration date will retain their character as either short-term or long-term capital losses instead of as short-term capital losses as under prior law. The ability to utilize capital loss carryforwards in the future may be limited under the Internal Revenue Code and related regulations based on the results of future transactions.
The Fund did not have a capital loss carryforward as of December 31, 2018.
NOTE 8—Investment Transactions
The aggregate amount of investment securities (other than short-term securities, U.S. Treasury obligations and money market funds, if any) purchased and sold by the Fund during the six months ended June 30, 2019 was $109,384,074 and $86,169,453, respectively. Cost of investments, including any derivatives, on a tax basis includes the adjustments for financial reporting purposes as of the most recently completed federal income tax reporting period-end.
| Unrealized Appreciation (Depreciation) of Investments on a Tax Basis |
| Aggregate unrealized appreciation of investments | $55,050,181 |
| Aggregate unrealized (depreciation) of investments | (4,786,394) |
| Net unrealized appreciation of investments | $50,263,787 |
Cost of investments for tax purposes is $193,952,493.
NOTE 9—Share Information
| | Summary of Share Activity |
| | Six months ended
June 30, 2019(a) | | Year ended
December 31, 2018 |
| | Shares | Amount | | Shares | Amount |
| Sold: | | | | | |
| Series I | 168,835 | $2,046,568 | | 300,113 | $3,835,156 |
| Series II | 728,533 | 8,729,358 | | 740,161 | 9,893,417 |
| Issued as reinvestment of dividends: | | | | | |
| Series I | — | — | | 1,976,159 | 25,354,119 |
| Series II | — | — | | 970,697 | 12,182,244 |
Invesco V.I. Mid Cap Core Equity Fund
| | Summary of Share Activity |
| | Six months ended
June 30, 2019(a) | | Year ended
December 31, 2018 |
| | Shares | Amount | | Shares | Amount |
| Reacquired: | | | | | |
| Series I | (1,205,863) | (14,838,778) | | (2,114,524) | (28,838,538) |
| Series II | (547,088) | (6,547,691) | | (5,009,103) | (67,791,284) |
| Net increase (decrease) in share activity | (855,583) | $(10,610,543) | | (3,136,497) | $(45,364,886) |
| (a) | There are entities that are record owners of more than 5% of the outstanding shares of the Fund and in the aggregate own 72% of the outstanding shares of the Fund. The Fund and the Fund’s principal underwriter or adviser, are parties to participation agreements with these entities whereby these entities sell units of interest in separate accounts funding variable products that are invested in the Fund. The Fund, Invesco and/or Invesco affiliates may make payments to these entities, which are considered to be related to the Fund, for providing services to the Fund, Invesco and/or Invesco affiliates including but not limited to services such as, securities brokerage, third party record keeping and account servicing and administrative services. The Fund has no knowledge as to whether all or any portion of the shares owned of record by these entities are also owned beneficially. |
Invesco V.I. Mid Cap Core Equity Fund
Calculating your ongoing Fund expenses
Example
As a shareholder of the Fund, you incur ongoing costs, including management fees; distribution and/or service fees (12b-1); and other Fund expenses. This example is intended to help you understand your ongoing costs (in dollars) of investing in the Fund and to compare these costs with ongoing costs of investing in other mutual funds. The example is based on an investment of $1,000 invested at the beginning of the period and held for the entire period January 1, 2019 through June 30, 2019.
The actual and hypothetical expenses in the examples below do not represent the effect of any fees or other expenses assessed in connection with a variable product; if they did, the expenses shown would be higher while the ending account values shown would be lower.
Actual expenses
The table below provides information about actual account values and actual expenses. You may use the information in this table, together with the amount you invested, to estimate the expenses that you paid over the period. Simply divide your account value by $1,000 (for example, an $8,600 account value divided by $1,000 = 8.6), then multiply the result by the number in the table under the heading entitled “Actual Expenses Paid During Period” to estimate the expenses you paid on your account during this period.
Hypothetical example for comparison purposes
The table below also provides information about hypothetical account values and hypothetical expenses based on the Fund’s actual expense ratio and an assumed rate of return of 5% per year before expenses, which is not the Fund’s actual return.
The hypothetical account values and expenses may not be used to estimate the actual ending account balance or expenses you paid for the period. You may use this information to compare the ongoing costs of investing in the Fund and other funds. To do so, compare this 5% hypothetical example with the 5% hypothetical examples that appear in the shareholder reports of the other funds.
Please note that the expenses shown in the table are meant to highlight your ongoing costs. Therefore, the hypothetical information is useful in comparing ongoing costs, and will not help you determine the relative total costs of owning different funds.
| | Beginning
Account Value (01/01/19) | ACTUAL | HYPOTHETICAL
(5% annual return before
expenses) | Annualized
Expense
Ratio |
Ending
Account Value
(06/30/19)1 | Expenses
Paid During
Period2 | Ending
Account Value
(06/30/19) | Expenses
Paid During
Period |
| Series I | $1,000.00 | $1,153.10 | $4.91 | $1,020.23 | $4.61 | 0.92% |
| Series II | 1,000.00 | 1,152.10 | 6.24 | 1,018.99 | 5.86 | 1.17 |
| 1 | The actual ending account value is based on the actual total return of the Fund for the period January 1, 2019 through June 30, 2019, after actual expenses and will differ from the hypothetical ending account value which is based on the Fund’s expense ratio and a hypothetical annual return of 5% before expenses. |
| 2 | Expenses are equal to the Fund’s annualized expense ratio as indicated above multiplied by the average account value over the period, multiplied by 181/365 to reflect the most recent fiscal half year. |
Invesco V.I. Mid Cap Core Equity Fund
Invesco V.I. Mid Cap Core Equity Fund
Approval of Investment Advisory and Sub-Advisory Contracts
At meetings held on June 10, 2019, the Board of Trustees (the Board or the Trustees) of AIM Variable Insurance Funds (Invesco Variable Insurance Funds) as a whole, and the independent Trustees, who comprise over 75% of the Board, voting separately, approved the continuance of the Invesco V.I. Mid Cap Core Equity Fund’s (the Fund) Master Investment Advisory Agreement with Invesco Advisers, Inc. (Invesco Advisers and the investment advisory agreement) and the Master IntergroupSub-Advisory Contract for Mutual Funds with Invesco Asset Management Deutschland GmbH, Invesco Asset Management Limited, Invesco Asset Management (Japan) Limited, Invesco Hong Kong Limited, Invesco Senior Secured Management, Inc. and Invesco Canada Ltd. and separatesub-advisory contracts with Invesco Capital Management LLC and Invesco Asset Management (India) Private Limited (collectively, the AffiliatedSub-Advisers and thesub-advisory contracts) for another year, effective July 1, 2019. After evaluating the factors discussed below, among others, the Board approved the renewal of the Fund’s investment advisory agreement and thesub-advisory contracts and determined that the compensation payable by the Fund to Invesco Advisers and by Invesco Advisers to the Affiliated Sub-Advisers is fair and reasonable.
The Board’s Evaluation Process
The Board’s Investments Committee has established three Sub-Committees, which meet throughout the year to review the performance of funds advised by Invesco Advisers (the Invesco Funds). As part of a regularly scheduled basis of in-person Board meetings, the Sub-Committees meet with portfolio managers for their assigned Invesco Funds and other members of management to review detailed information about investment performance and portfolio attributes of these funds. The Board took into account evaluations and reports that it received from the Investments Committee and Sub-Committees, as well as the information provided to such committees and the Board throughout the year, in considering whether to approve each Invesco Fund’s investment advisory agreement and sub-advisory contracts.
As part of the contract renewal process, the Board reviews and considers information provided in response to detailed requests for information submitted to management by the independent Trustees with assistance from legal counsel to the independent Trustees. The Board receives comparative investment performance and fee data regarding the Invesco Funds prepared by Invesco Advisers and Broadridge Financial Solutions, Inc. (Broadridge), an independent mutual fund data provider. The Board also receives an independent written evaluation from the Senior Officer, an officer of the Invesco Funds who reports directly to the
independent Trustees. The Senior Officer’s evaluation is prepared as part of his responsibility to manage the process by which the Invesco Funds’ proposed management fees are negotiated during the annual contract renewal process to ensure they are negotiated in a manner that is at arms’ length and reasonable. In addition to meetings with Invesco Advisers and fund counsel throughout the year, the independent Trustees also discuss the continuance of the investment advisory agreement and sub-advisory contracts in separate sessions with the Senior Officer and with independent legal counsel.
The discussion below is a summary of the Senior Officer’s independent written evaluation with respect to the Fund’s investment advisory agreement, as well as a discussion of the material factors and related conclusions that formed the basis for the Board’s approval of the Fund’s investment advisory agreement and sub-advisory contracts. The Trustees’ review and conclusions are based on the comprehensive consideration of all information presented to them during the course of the year and in prior years and are not the result of any single determinative factor. Moreover, one Trustee may have weighed a particular piece of information or factor differently than another Trustee. This information is current as of June 10, 2019.
Factors and Conclusions and Summary of Independent Written Fee Evaluation
| A. | Nature, Extent and Quality of Services Provided by Invesco Advisers and the Affiliated Sub-Advisers |
The Board reviewed the nature, extent and quality of the advisory services provided to the Fund by Invesco Advisers under the Fund’s investment advisory agreement, and the credentials and experience of the officers and employees of Invesco Advisers who provide these services, including the Fund’s portfolio manager(s). The Board’s review included consideration of Invesco Advisers’ investment process oversight and structure, credit analysis and investment risk management. The Board also considerednon-advisory services that Invesco Advisers and its affiliates provide to the Invesco Funds such as various back office support functions, third party oversight, internal audit, valuation, portfolio trading and legal and compliance. The Board also received and reviewed information about Invesco Advisers’ role as administrator of the Invesco Funds’ liquidity risk management program. The Board also reviewed and considered the benefits to shareholders of investing in a fund that is part of the Invesco family of funds under the umbrella of Invesco Ltd., Invesco Advisers’ parent company, and noted Invesco Ltd.’s depth and experience in conducting an investment management business, as well as its
commitment of financial and other resources to such business. The Board reviewed and considered information about the resources that Invesco Advisers intends to continue to commit to managing the Invesco family of funds following Invesco Ltd.’s acquisition of OppenheimerFunds, Inc. and its subsidiaries. The Board concluded that the nature, extent and quality of the services provided to the Fund by Invesco Advisers are appropriate and satisfactory.
The Board reviewed the services that may be provided by the Affiliated Sub-Advisers under the sub-advisory contracts and the credentials and experience of the officers and employees of the Affiliated Sub-Advisers who provide these services. The Board noted the Affiliated Sub-Advisers’ expertise with respect to certain asset classes and that the Affiliated Sub-Advisers have offices and personnel that are located in financial centers around the world. As a result, the Board noted that the Affiliated Sub-Advisers can provide research and investment analysis on the markets and economies of various countries in which the Fund may invest, make recommendations regarding securities and assist with security trades. The Board concluded that the sub-advisory contracts may benefit the Fund and its shareholders by permitting Invesco Advisers to use the resources and talents of the Affiliated Sub-Advisers in managing the Fund. The Board concluded that the nature, extent and quality of the services that may be provided by the Affiliated Sub-Advisers are appropriate and satisfactory.
| B. | Fund Investment Performance |
The Board considered Fund investment performance as a relevant factor in considering whether to approve the investment advisory agreement. The Board did not view Fund investment performance as a relevant factor in considering whether to approve the sub-advisory contracts for the Fund, as no Affiliated Sub-Adviser currently manages assets of the Fund.
The Board compared the Fund’s investment performance over multiple time periods ending December 31, 2018 to the performance of funds in the Broadridge performance universe and against the Lipper Variable Underlying Funds Mid-Cap Core Funds Index. The Board noted that performance of Series I shares of the Fund was in the second quintile of its performance universe for the one year period, the third quintile for the three year period and the fourth quintile for the five year period (the first quintile being the best performing funds and the fifth quintile being the worst performing funds). The Board noted that performance of Series I shares of the Fund was reasonably comparable to the performance of the Index for the one year period and below the performance of the Index for the three and five year periods. The Board noted that the Fund’s high-quality
Invesco V.I. Mid Cap Core Equity Fund
bias negatively impacted the Fund’s relative performance. The Trustees also reviewed more recent Fund performance and this review did not change their conclusions.
| C. | Advisory and Sub-Advisory Fees and Fund Expenses |
The Board compared the Fund’s contractual management fee rate to the contractual management fee rates of funds in the Fund’s Broadridge expense group. The Board noted that the contractual management fee rate for Series I shares of the Fund was below the median contractual management fee rate of funds in its expense group. The Board noted that the term “contractual management fee” for funds in the expense group may include both advisory and certain non-portfolio management administrative services fees, but that Broadridge does not provide information on a fund by fund basis as to what is included. The Board also reviewed the methodology used by Broadridge in providing expense group information, which includes using each fund’s contractual management fee schedule (including any applicable breakpoints) as reported in the most recent prospectus or statement of additional information for each fund in the expense group. The Board also considered comparative information regarding the Fund’s total expense ratio and its various components.
The Board noted that Invesco Advisers has contractually agreed to waive fees and/or limit expenses of the Fund for the term disclosed in the Fund’s registration statement in an amount necessary to limit total annual operating expenses to a specified percentage of average daily net assets for each class of the Fund.
The Board also considered the fees charged by Invesco Advisers and the Affiliated Sub-Advisers to other similarly managed client accounts. The Board noted that Invesco Advisers or the Affiliated Sub-Advisers may charge lower fees to large institutional clients. Invesco Advisers reviewed with the Board differences in the scope of services it provides to the Invesco Funds relative to certain other types of client accounts, including management of cash flows as a result of redemptions and purchases, necessary infrastructure such as officers, office space, technology, legal and distribution, oversight of service providers, costs and business risks associated with launching new funds and sponsoring and maintaining the product line, preparation of annual registration statement updates and financial information and compliance with federal and state laws and regulations.
The Board also considered the services that may be provided by the Affiliated Sub-Advisers pursuant to the sub-advisory contracts, as well as the fees payable by Invesco Advisers to the Affiliated Sub-Advisers pursuant to the sub-advisory contracts.
| D. | Economies of Scale and Breakpoints |
The Board considered the extent to which there may be economies of scale in the provision of advisory services to the Fund. The Board
considered Invesco’s reinvestment in its business, including investments in business infrastructure and cybersecurity. The Board also considered that the Fund may benefit from economies of scale through contractual breakpoints in the Fund’s advisory fee schedule, which generally operate to reduce the Fund’s expense ratio as it grows in size. The Board noted that the Fund shares directly in economies of scale through lower fees charged by third party service providers based on the combined size of the Invesco Funds. The Board noted that the Fund may also benefit from economies of scale through initial fee setting, fee waivers and expense reimbursements.
| E. | Profitability and Financial Resources |
The Board reviewed information from Invesco Advisers concerning the costs of the advisory and other services that Invesco Advisers and its affiliates provide to the Fund and the Invesco Funds and the profitability of Invesco Advisers and its affiliates in providing these services. The Board considered the methodology used for calculating profitability and noted the periodic review of such methodology by an independent consultant. The Board noted that Invesco Advisers continues to operate at a net profit from services Invesco Advisers and its affiliates provide to the Invesco Funds and the Fund. The Board did not deem the level of profits realized by Invesco Advisers and its affiliates from providing services to the Fund to be excessive given the nature, extent and quality of the services provided. The Board received information from Invesco Advisers demonstrating that Invesco Advisers and the AffiliatedSub-Advisers are financially sound and have the resources necessary to perform their obligations under the investment advisory agreement andsub-advisory contracts.
| F. | Collateral Benefits to Invesco Advisers and its Affiliates |
The Board considered various other benefits received by Invesco Advisers and its affiliates from the relationship with the Fund, including the fees received for providing administrative, transfer agency and distribution services to the Fund. The Board considered comparative information regarding fees charged for these services, including information provided by Broadridge and other independent sources. The Board considered the performance of Invesco Advisers and its affiliates in providing these services and the organizational structure employed to provide these services. The Board also considered that these services are provided to the Fund pursuant to written contracts that are reviewed and approved on an annual basis by the Board; and that the services are required for the operation of the Fund.
The Board considered the benefits realized by Invesco Advisers and the Affiliated Sub-Advisers as a result of portfolio brokerage transactions executed through “soft dollar” arrangements. The Board noted that soft dollar arrangements may result in the Fund bearing costs to purchase research that may be used by Invesco Advisers or the Affiliated Sub-Advisers with
other clients and may reduce Invesco Advisers’ or the Affiliated Sub-Advisers’ expenses. The Board also considered that it receives periodic reports from Invesco representing that these arrangements are consistent with regulatory requirements. The Board did not deem the soft dollar arrangements to be inappropriate.
The Board considered that the Fund’s uninvested cash and cash collateral from any securities lending arrangements may be invested in money market funds advised by Invesco Advisers pursuant to procedures approved by the Board. The Board considered information regarding the returns of the affiliated money market funds relative to comparable overnight investments, as well as the costs to the Fund of such investments. The Board noted that Invesco Advisers receives advisory fees from these affiliated money market funds attributable to such investments, although Invesco Advisers has contractually agreed to waive through varying periods the advisory fees payable by the Invesco Funds with respect to certain investments in the affiliated money market funds. The waiver is in an amount equal to 100% of the net advisory fee Invesco Advisers receives from the affiliated money market funds with respect to the Fund’s investment in the affiliated money market funds of uninvested cash, but not cash collateral. The Board concluded that the amount of advisory fees received by Invesco Advisers from the Fund’s investment of cash collateral from any securities lending arrangements in the affiliated money market funds is fair and reasonable.
The Board also considered that an affiliated broker may receive commissions for executing certain trades for the Fund. Invesco Advisers and the Affiliated Sub-Advisers may use the affiliated broker to, among other things, control order routing and minimize information leakage, and the Board was advised that such trades are executed in compliance with rules under the federal securities laws and consistent with best execution obligations.
Invesco V.I. Mid Cap Core Equity Fund
| Semiannual Report to Shareholders | June 30, 2019 |
Invesco V.I. Mid Cap Growth Fund
Beginning on January 1, 2021, as permitted by regulations adopted by the Securities and Exchange Commission, the insurance company that offers your variable annuity or variable life insurance contract may no longer send you paper copies of the Fund’s shareholder reports by mail, unless you specifically request paper copies of the reports from the insurance company or your financial intermediary. Instead of delivering paper copies of the report, the insurance company may choose to make the reports available on a website, and will notify you by mail each time a report is posted and provide you with a website link to access the report. Instructions for requesting paper copies will be provided by your insurance company.
If the insurance company offers electronic delivery, you may elect to receive shareholder reports and other communications about the Fund electronically by following the instructions provided by the insurance company or by contacting your financial intermediary. If you already elected to receive shareholder reports electronically, you will not be affected by this change and you need not take any action.
You may elect to receive all future reports in paper free of charge from the insurance company. You can inform the insurance company or your financial intermediary that you wish to continue receiving paper copies of your shareholder reports by following the instructions provided by the insurance company or by contacting your financial intermediary. Your election to receive reports in paper will apply to all portfolio companies available under your contract with the insurance company.
The Fund provides a complete list of its holdings four times in each fiscal year, at the quarter-ends. For the second and fourth quarters, the lists appear in the Fund’s semiannual and annual reports to shareholders. For the first and third quarters, the Fund files the lists with the Securities and Exchange Commission (SEC) on Form N-Q (or any successor Form). The Fund’s Form N-Q (or any successor Form) filings are available on the SEC website, sec.gov. The SEC file numbers for the Fund are 811-07452 and 033-57340. The Fund’s most recent portfolio holdings, as filed on Form N-Q (or any successor Form), have also been made available to insurance companies issuing variable annuity contracts and variable life insurance policies (“variable products”) that invest in the Fund.
A description of the policies and procedures that the Fund uses to determine how to vote proxies relating to portfolio securities is available without charge, upon request, from our Client Services department at 800 959 4246 or at invesco.com/proxyguidelines. The information is also available on the SEC website, sec.gov.
Information regarding how the Fund voted proxies related to its portfolio securities during the most recent 12-month period ended June 30 is available at invesco.com/proxysearch. The information is also available on the SEC website, sec.gov.
Invesco Advisers, Inc. is an investment adviser; it provides investment advisory services to individual and institutional clients and does not sell securities. Invesco Distributors, Inc. is the US distributor for Invesco Ltd.’s retail mutual funds, exchange-traded funds and institutional money market funds. Both are wholly owned, indirect subsidiaries of Invesco Ltd.
This report must be accompanied or preceded by a currently effective Fund prospectus and variable product prospectus, which contain more complete information, including sales charges and expenses. Investors should read each carefully before investing.
NOT FDIC INSURED | MAY LOSE VALUE | NO BANK GUARANTEE
| Invesco Distributors, Inc. | VK-VIMCG-SAR-1 |
Performance summary
Fund vs. Indexes
Cumulative total returns, December 31, 2018 to June 30, 2019, excluding variable product issuer charges. If variable product issuer charges were included, returns would be lower.
| Series I Shares | 25.16% |
| Series II Shares | 25.05 |
| S&P 500 Index▼ (Broad Market Index) | 18.54 |
Russell Midcap Growth Index■
(Style-Specific Index) | 26.08 |
Lipper VUF Mid-Cap Growth Funds Index♦
(Peer Group Index) | 27.13 |
| Source(s):▼FactSet Research Systems Inc.;■ RIMES Technologies Corp.;♦ Lipper Inc. |
The S&P 500® Index is an unmanaged index considered representative of the U.S. stock market.
TheRussell Midcap® Growth Index is an unmanaged index considered representative of mid-cap growth stocks. The Russell Midcap Growth Index is a trademark/service mark of the Frank Russell Co. Russell® is a trademark of the Frank Russell Co.
TheLipper VUF Mid-Cap Growth Funds Indexis an unmanaged index considered representative of mid-cap growth variable insurance underlying funds tracked by Lipper.
The Fund is not managed to track the performance of any particular index, including the indexes described here, and consequently, the performance of the Fund may deviate significantly from the performance of the indexes.
A direct investment cannot be made in an index. Unless otherwise indicated, index results include reinvested dividends, and they do not reflect sales charges. Performance of the peer group, if applicable, reflects fund expenses; performance of a market index does not.
| Average Annual Total Returns |
| As of 6/30/19 |
| Series I Shares | |
| 10 Years | 13.66% |
| 5 Years | 8.55 |
| 1 Year | 9.41 |
| Series II Shares | |
| Inception (9/25/00) | 2.41% |
| 10 Years | 13.45 |
| 5 Years | 8.30 |
| 1 Year | 9.22 |
Effective June 1, 2010, Class II shares of the predecessor fund, Van Kampen Life Investment Trust Mid Cap Growth Portfolio, advised by Van Kampen Asset Management were reorganized into Series II shares, of Invesco Van Kampen V.I. Mid Cap Growth Fund (renamed Invesco V.I. Mid Cap Growth Fund on April 29, 2013). Returns shown above, prior to June 1, 2010, for Series II shares are blended returns of the predecessor fund and Invesco V.I. Mid Cap Growth Fund. Share class returns will differ from the predecessor fund because of different expenses.
Series I shares incepted on June 1, 2010. Series I share performance shown prior to that date is that of the predecessor fund’s Class II shares and includes the 12b-1 fees applicable to the predecessor fund’s Class II shares.
The performance data quoted represent past performance and cannot guarantee comparable future results; current performance may be lower or higher. Please contact your variable product issuer or financial adviser for
the most recent month-end variable product performance. Performance figures reflect Fund expenses, reinvested distributions and changes in net asset value. Performance figures do not reflect deduction of taxes a shareholder would pay on Fund distributions or sale of Fund shares. Investment return and principal value will fluctuate so that you may have a gain or loss when you sell shares.
The total annual Fund operating expense ratio set forth in the most recent Fund prospectus as of the date of this report for Series I and Series II shares was 1.00% and 1.25%, respectively. The expense ratios presented above may vary from the expense ratios presented in other sections of this report that are based on expenses incurred during the period covered by this report.
Invesco V.I. Mid Cap Growth Fund, a series portfolio of AIM Variable Insurance Funds (Invesco Variable Insurance Funds), is currently offered through insurance companies issuing
variable products. You cannot purchase shares of the Fund directly. Performance figures given represent the Fund and are not intended to reflect actual variable product values. They do not reflect sales charges, expenses and fees assessed in connection with a variable product. Sales charges, expenses and fees, which are determined by the variable product issuers, will vary and will lower the total return.
The most recent month-end performance at the Fund level, excluding variable product charges, is available at 800 451 4246. As mentioned above, for the most recent month-end performance including variable product charges, please contact your variable product issuer or financial adviser.
Fund performance reflects any applicable fee waivers and/or expense reimbursements. Had the adviser not waived fees and/or reimbursed expenses currently or in the past, returns would have been lower. See current prospectus for more information.
Invesco V.I. Mid Cap Growth Fund
Schedule of Investments(a)
June 30, 2019
(Unaudited)
| | Shares | Value |
| Common Stocks & Other Equity Interests–100.75% |
| Aerospace & Defense–3.06% |
| HEICO Corp. | 21,053 | $2,817,102 |
| L3Harris Technologies, Inc.(b) | 4,141 | 783,187 |
| TransDigm Group, Inc.(b) | 6,715 | 3,248,717 |
| | | | 6,849,006 |
| Airlines–0.52% |
| United Airlines Holdings, Inc.(b) | 13,256 | 1,160,563 |
| Apparel Retail–0.41% |
| Burlington Stores, Inc.(b) | 5,344 | 909,282 |
| Apparel, Accessories & Luxury Goods–1.89% |
| lululemon Athletica, Inc.(b) | 23,503 | 4,235,476 |
| Application Software–9.84% |
| ANSYS, Inc.(b) | 5,179 | 1,060,763 |
| Atlassian Corp. PLC, Class A(b) | 19,253 | 2,519,063 |
| Coupa Software, Inc.(b) | 9,079 | 1,149,492 |
| Fair Isaac Corp.(b) | 5,507 | 1,729,308 |
| Paycom Software, Inc.(b) | 5,327 | 1,207,737 |
| RingCentral, Inc., Class A(b) | 39,727 | 4,565,427 |
| Splunk, Inc.(b) | 13,310 | 1,673,733 |
| Synopsys, Inc.(b) | 36,185 | 4,656,648 |
| Trade Desk, Inc. (The), Class A(b) | 5,550 | 1,264,179 |
| Zendesk, Inc.(b) | 24,816 | 2,209,368 |
| | | | 22,035,718 |
| Asset Management & Custody Banks–0.43% |
| KKR & Co., Inc., Class A | 37,976 | 959,653 |
| Automotive Retail–1.47% |
| O’Reilly Automotive, Inc.(b) | 8,900 | 3,286,948 |
| Biotechnology–1.94% |
| BioMarin Pharmaceutical, Inc.(b) | 13,114 | 1,123,214 |
| Exact Sciences Corp.(b) | 10,018 | 1,182,525 |
| Neurocrine Biosciences, Inc.(b) | 5,434 | 458,793 |
| Sage Therapeutics, Inc.(b) | 2,139 | 391,629 |
| Sarepta Therapeutics, Inc.(b) | 7,838 | 1,190,984 |
| | | | 4,347,145 |
| Building Products–0.51% |
| Masco Corp. | 29,348 | 1,151,615 |
| Cable & Satellite–0.59% |
| Cable One, Inc. | 1,136 | 1,330,245 |
| Communications Equipment–1.08% |
| Motorola Solutions, Inc. | 14,518 | 2,420,586 |
| Consumer Electronics–0.49% |
| Roku, Inc.(b) | 12,035 | 1,090,130 |
| | Shares | Value |
| Data Processing & Outsourced Services–6.99% |
| Black Knight, Inc.(b) | 50,935 | $3,063,740 |
| Euronet Worldwide, Inc.(b) | 18,021 | 3,031,853 |
| FleetCor Technologies, Inc.(b) | 4,967 | 1,394,982 |
| Global Payments, Inc. | 22,087 | 3,536,791 |
| Total System Services, Inc. | 20,409 | 2,617,863 |
| WEX, Inc.(b) | 9,607 | 1,999,217 |
| | | | 15,644,446 |
| Distributors–1.23% |
| Pool Corp. | 14,428 | 2,755,748 |
| Diversified Support Services–1.52% |
| Cintas Corp. | 8,071 | 1,915,168 |
| IAA INC IAA-W(b) | 29,759 | 1,154,054 |
| KAR Auction Services, Inc. | 13,108 | 327,700 |
| | | | 3,396,922 |
| Education Services–1.97% |
| Bright Horizons Family Solutions, Inc.(b) | 29,250 | 4,412,947 |
| Electrical Components & Equipment–0.55% |
| AMETEK, Inc. | 13,638 | 1,238,876 |
| Electronic Components–0.43% |
| Amphenol Corp., Class A | 10,104 | 969,378 |
| Electronic Equipment & Instruments–1.87% |
| Keysight Technologies, Inc.(b) | 26,846 | 2,411,039 |
| Zebra Technologies Corp., Class A(b) | 8,440 | 1,768,096 |
| | | | 4,179,135 |
| Environmental & Facilities Services–2.50% |
| Republic Services, Inc. | 31,973 | 2,770,141 |
| Waste Connections, Inc. | 29,588 | 2,828,021 |
| | | | 5,598,162 |
| Financial Exchanges & Data–3.41% |
| Cboe Global Markets, Inc. | 548 | 56,789 |
| London Stock Exchange Group PLC (United Kingdom) | 16,592 | 1,156,025 |
| MarketAxess Holdings, Inc. | 5,281 | 1,697,419 |
| MSCI, Inc. | 15,918 | 3,801,059 |
| Tradeweb Markets, Inc., Class A | 21,225 | 929,867 |
| | | | 7,641,159 |
| General Merchandise Stores–0.90% |
| Dollar General Corp. | 7,132 | 963,961 |
| Ollie’s Bargain Outlet Holdings, Inc.(b) | 12,106 | 1,054,554 |
| | | | 2,018,515 |
| Health Care Equipment–5.91% |
| DexCom, Inc.(b) | 19,863 | 2,976,272 |
See accompanying Notes to Financial Statements which are an integral part of the financial statements.
Invesco V.I. Mid Cap Growth Fund
| | Shares | Value |
| Health Care Equipment–(continued) |
| Edwards Lifesciences Corp.(b) | 10,265 | $1,896,356 |
| IDEXX Laboratories, Inc.(b) | 10,419 | 2,868,663 |
| Insulet Corp.(b) | 5,465 | 652,412 |
| LivaNova PLC(b) | 1,618 | 116,431 |
| Masimo Corp.(b) | 7,603 | 1,131,478 |
| Penumbra, Inc.(b) | 4,240 | 678,400 |
| STERIS PLC | 13,319 | 1,982,933 |
| Varian Medical Systems, Inc.(b) | 6,821 | 928,543 |
| | | | 13,231,488 |
| Health Care Supplies–1.35% |
| Cooper Cos., Inc. (The) | 4,619 | 1,556,095 |
| West Pharmaceutical Services, Inc. | 11,629 | 1,455,369 |
| | | | 3,011,464 |
| Health Care Technology–1.01% |
| Veeva Systems, Inc., Class A(b) | 13,967 | 2,264,190 |
| Hotels, Resorts & Cruise Lines–0.83% |
| Hilton Worldwide Holdings, Inc. | 17,980 | 1,757,365 |
| Royal Caribbean Cruises Ltd. | 768 | 93,089 |
| | | | 1,850,454 |
| Household Products–1.17% |
| Church & Dwight Co., Inc. | 35,963 | 2,627,457 |
| Industrial Conglomerates–2.22% |
| Roper Technologies, Inc. | 13,562 | 4,967,218 |
| Industrial Machinery–3.46% |
| Fortive Corp. | 11,974 | 976,121 |
| Graco, Inc. | 1,096 | 54,997 |
| IDEX Corp. | 24,439 | 4,206,929 |
| Ingersoll-Rand PLC | 9,028 | 1,143,577 |
| Woodward, Inc. | 11,962 | 1,353,620 |
| | | | 7,735,244 |
| Insurance Brokers–0.94% |
| Arthur J. Gallagher & Co. | 24,106 | 2,111,445 |
| Interactive Home Entertainment–0.05% |
| Take-Two Interactive Software, Inc.(b) | 937 | 106,378 |
| Interactive Media & Services–1.27% |
| IAC/InterActiveCorp.(b) | 13,027 | 2,833,763 |
| Internet Services & Infrastructure–1.47% |
| GoDaddy, Inc., Class A(b) | 12,603 | 884,100 |
| Twilio, Inc., Class A(b) | 17,568 | 2,395,397 |
| | | | 3,279,497 |
| Investment Banking & Brokerage–0.69% |
| E*TRADE Financial Corp. | 17,289 | 771,089 |
| TD Ameritrade Holding Corp. | 15,580 | 777,754 |
| | | | 1,548,843 |
| | Shares | Value |
| IT Consulting & Other Services–1.14% |
| Booz Allen Hamilton Holding Corp. | 38,575 | $2,554,051 |
| Leisure Facilities–1.63% |
| Planet Fitness, Inc., Class A(b) | 44,829 | 3,247,413 |
| Vail Resorts, Inc. | 1,763 | 393,466 |
| | | | 3,640,879 |
| Life Sciences Tools & Services–4.99% |
| Agilent Technologies, Inc. | 15,677 | 1,170,601 |
| Bio-Rad Laboratories, Inc., Class A(b) | 3,142 | 982,158 |
| Bio-Techne Corp. | 5,523 | 1,151,490 |
| ICON PLC (Ireland)(b) | 21,244 | 3,270,939 |
| IQVIA Holdings, Inc.(b) | 18,821 | 3,028,299 |
| Mettler-Toledo International, Inc.(b) | 1,878 | 1,577,520 |
| | | | 11,181,007 |
| Metal & Glass Containers–1.04% |
| Ball Corp. | 33,166 | 2,321,288 |
| Movies & Entertainment–1.50% |
| Live Nation Entertainment, Inc.(b) | 50,727 | 3,360,664 |
| Office REITs–0.78% |
| Alexandria Real Estate Equities, Inc. | 12,344 | 1,741,615 |
| Oil & Gas Exploration & Production–0.86% |
| Diamondback Energy, Inc. | 17,607 | 1,918,635 |
| Oil & Gas Storage & Transportation–0.99% |
| Cheniere Energy, Inc.(b) | 32,278 | 2,209,429 |
| Packaged Foods & Meats–1.01% |
| McCormick & Co., Inc. | 14,570 | 2,258,496 |
| Paper Packaging–0.44% |
| Avery Dennison Corp. | 8,558 | 989,989 |
| Pharmaceuticals–0.61% |
| Zoetis, Inc. | 11,986 | 1,360,291 |
| Real Estate Services–0.62% |
| CBRE Group, Inc., Class A(b) | 27,172 | 1,393,924 |
| Regional Banks–0.51% |
| First Republic Bank | 11,581 | 1,130,885 |
| Research & Consulting Services–4.13% |
| CoStar Group, Inc.(b) | 9,390 | 5,202,623 |
| IHS Markit Ltd.(b) | 49,139 | 3,131,137 |
| TransUnion | 12,449 | 915,126 |
| | | | 9,248,886 |
| Restaurants–2.89% |
| Chipotle Mexican Grill, Inc.(b) | 4,066 | 2,979,890 |
| Darden Restaurants, Inc. | 13,960 | 1,699,351 |
| Domino’s Pizza, Inc. | 6,422 | 1,787,114 |
| | | | 6,466,355 |
See accompanying Notes to Financial Statements which are an integral part of the financial statements.
Invesco V.I. Mid Cap Growth Fund
| | Shares | Value |
| Semiconductor Equipment–1.14% |
| KLA-Tencor Corp. | 1,579 | $186,638 |
| Lam Research Corp. | 12,534 | 2,354,386 |
| | | | 2,541,024 |
| Semiconductors–3.73% |
| Advanced Micro Devices, Inc.(b) | 63,869 | 1,939,702 |
| Cree, Inc.(b) | 14,667 | 823,992 |
| Marvell Technology Group Ltd. | 59,445 | 1,418,952 |
| Microchip Technology, Inc. | 118 | 10,231 |
| Monolithic Power Systems, Inc. | 14,960 | 2,031,269 |
| Universal Display Corp. | 4,302 | 809,034 |
| Xilinx, Inc. | 11,158 | 1,315,751 |
| | | | 8,348,931 |
| Soft Drinks–0.65% |
| Keurig Dr Pepper, Inc. | 50,434 | 1,457,543 |
| Specialized Consumer Services–0.98% |
| ServiceMaster Global Holdings, Inc.(b) | 42,227 | 2,199,604 |
| Specialized REIT–1.60% |
| SBA Communications Corp.(b) | 15,949 | 3,585,973 |
| Specialty Chemicals–0.92% |
| Celanese Corp. | 5,015 | 540,617 |
| Ingevity Corp.(b) | 10,692 | 1,124,478 |
| Sherwin-Williams Co. (The) | 873 | 400,087 |
| | | | 2,065,182 |
| | Shares | Value |
| Specialty Stores–2.18% |
| Tractor Supply Co. | 16,867 | $1,835,130 |
| Ulta Beauty, Inc.(b) | 8,791 | 3,049,510 |
| | | | 4,884,640 |
| Systems Software–0.64% |
| ServiceNow, Inc.(b) | 5,220 | 1,433,255 |
| Technology Distributors–1.56% |
| CDW Corp. | 31,406 | 3,486,066 |
| Trading Companies & Distributors–0.24% |
| HD Supply Holdings, Inc.(b) | 13,108 | 527,990 |
| Total Common Stocks & Other Equity Interests (Cost $194,390,474) | 225,505,698 |
| Money Market Funds–0.21% |
| Invesco Government & Agency Portfolio, Institutional Class, 2.26%(c) | 166,992 | 166,992 |
| Invesco Liquid Assets Portfolio, Institutional Class, 2.40%(c) | 118,988 | 119,036 |
| Invesco Treasury Portfolio, Institutional Class, 2.22%(c) | 190,849 | 190,849 |
| Total Money Market Funds (Cost $476,876) | 476,877 |
| TOTAL INVESTMENTS IN SECURITIES–100.96% (Cost $194,867,350) | 225,982,575 |
| OTHER ASSETS LESS LIABILITIES–(0.96)% | (2,142,859) |
| NET ASSETS–100.00% | $223,839,716 |
Investment Abbreviations:
| REIT | – Real Estate Investment Trust |
Notes to Schedule of Investments:
| (a) | Industry and/or sector classifications used in this report are generally according to the Global Industry Classification Standard, which was developed by and is the exclusive property and a service mark of MSCI Inc. and Standard & Poor’s. |
| (b) | Non-income producing security. |
| (c) | The money market fund and the Fund are affiliated by having the same investment adviser. The rate shown is the 7-day SEC standardized yield as of June 30, 2019. |
Portfolio Composition
By sector, based on Total Investments
as of June 30, 2019
| Information Technology | 29.60% |
| Industrials | 18.52 |
| Consumer Discretionary | 16.69 |
| Health Care | 15.66 |
| Financials | 5.94 |
| Communication Services | 3.38 |
| Real Estate | 2.98 |
| Consumer Staples | 2.81 |
| Materials | 2.38 |
| Security types each less than 2% portfolio | 2.04 |
See accompanying Notes to Financial Statements which are an integral part of the financial statements.
Invesco V.I. Mid Cap Growth Fund
Statement of Assets and Liabilities
June 30, 2019
(Unaudited)
| Assets: | |
Investments in securities, at value
(Cost $194,390,474) | $225,505,698 |
| Investments in affiliated money market funds, at value (Cost $476,876) | 476,877 |
| Cash | 13,215 |
| Foreign currencies, at value (Cost $35,769) | 35,756 |
| Receivable for: | |
| Fund shares sold | 7,291 |
| Dividends | 62,923 |
| Investments sold | 80,917,627 |
| Investment for trustee deferred compensation and retirement plans | 118,983 |
| Other assets | 6,649 |
| Total assets | 307,145,019 |
| Liabilities: | |
| Payable for: | |
| Investments purchased | 82,823,775 |
| Fund shares reacquired | 161,694 |
| Accrued fees to affiliates | 158,670 |
| Accrued trustees’ and officers’ fees and benefits | 487 |
| Accrued other operating expenses | 33,086 |
| Trustee deferred compensation and retirement plans | 127,591 |
| Total liabilities | 83,305,303 |
| Net assets applicable to shares outstanding | $223,839,716 |
| Net assets consist of: | |
| Shares of beneficial interest | $126,653,225 |
| Distributable earnings | 97,186,491 |
| | $223,839,716 |
| Net Assets: |
| Series I | $106,927,194 |
| Series II | $116,912,522 |
| Shares outstanding, no par value, with an unlimited number of shares authorized: |
| Series I | 17,909,165 |
| Series II | 20,021,740 |
| Series I: | |
| Net asset value per share | $5.97 |
| Series II: | |
| Net asset value per share | $5.84 |
Statement of Operations
For the six months ended June 30, 2019
(Unaudited)
| Investment income: | |
| Dividends (net of foreign withholding taxes of $3,243) | $671,767 |
| Dividends from affiliated money market funds (includes securities lending income of $12,328) | 52,646 |
| Total investment income | 724,413 |
| Expenses: | |
| Advisory fees | 793,793 |
| Administrative services fees | 175,230 |
| Custodian fees | 3,816 |
| Distribution fees - Series II | 136,313 |
| Transfer agent fees | 20,746 |
| Trustees’ and officers’ fees and benefits | 12,935 |
| Reports to shareholders | 3,744 |
| Professional services fees | 18,497 |
| Other | 1,753 |
| Total expenses | 1,166,827 |
| Less: Fees waived | (1,913) |
| Net expenses | 1,164,914 |
| Net investment income (loss) | (440,501) |
| Realized and unrealized gain (loss) from: | |
| Net realized gain from: | |
| Investment securities | 37,003,069 |
| Foreign currencies | 81 |
| | 37,003,150 |
| Change in net unrealized appreciation (depreciation) of: | |
| Investment securities | 9,093,034 |
| Foreign currencies | (475) |
| | 9,092,559 |
| Net realized and unrealized gain | 46,095,709 |
| Net increase in net assets resulting from operations | $45,655,208 |
See accompanying Notes to Financial Statements which are an integral part of the financial statements.
Invesco V.I. Mid Cap Growth Fund
Statement of Changes in Net Assets
For the six months ended June 30, 2019 and the year ended December 31, 2018
(Unaudited)
| | June 30,
2019 | December 31,
2018 |
| Operations: | | |
| Net investment income (loss) | $(440,501) | $(1,121,299) |
| Net realized gain | 37,003,150 | 32,029,158 |
| Change in net unrealized appreciation (depreciation) | 9,092,559 | (40,227,712) |
| Net increase (decrease) in net assets resulting from operations | 45,655,208 | (9,319,853) |
| Distributions to shareholders from distributable earnings: | | |
| Series I | — | (11,710,806) |
| Series II | — | (12,842,411) |
| Total distributions from distributable earnings | — | (24,553,217) |
| Share transactions–net: | | |
| Series I | (7,040,477) | (1,294,488) |
| Series II | 1,928,859 | (13,180,099) |
| Net increase (decrease) in net assets resulting from share transactions | (5,111,618) | (14,474,587) |
| Net increase (decrease) in net assets | 40,543,590 | (48,347,657) |
| Net assets: | | |
| Beginning of period | 183,296,126 | 231,643,783 |
| End of period | $223,839,716 | $183,296,126 |
See accompanying Notes to Financial Statements which are an integral part of the financial statements.
Invesco V.I. Mid Cap Growth Fund
Financial Highlights
June 30, 2019
(Unaudited)
The following schedule presents financial highlights for a share of the Fund outstanding throughout the periods indicated.
| | Net asset
value,
beginning
of period | Net
investment
income
(loss)(a) | Net gains
(losses)
on securities
(both
realized and
unrealized) | Total from
investment
operations | Distributions
from net
realized
gains | Net asset
value, end
of period | Total
return(b) | Net assets,
end of period
(000’s omitted) | Ratio of
expenses
to average
net assets
with fee waivers
and/or expenses
absorbed | Ratio of
expenses
to average net
assets without
fee waivers
and/or expenses
absorbed | Ratio of net
investment
income
(loss)
to average
net assets | Portfolio
turnover(c) |
| Series I |
| Six months ended 06/30/19 | $4.77 | $(0.01) | $1.21 | $1.20 | $— | $5.97 | 25.16% | $106,927 | 0.97%(d) | 0.97%(d) | (0.29)%(d) | 86% |
| Year ended 12/31/18 | 5.62 | (0.02) | (0.18) | (0.20) | (0.65) | 4.77 | (5.58) | 91,501 | 1.00 | 1.00 | (0.37) | 57 |
| Year ended 12/31/17 | 4.89 | (0.02) | 1.10 | 1.08 | (0.35) | 5.62 | 22.49 | 109,197 | 1.00 | 1.00 | (0.34) | 46 |
| Year ended 12/31/16 | 5.38 | (0.02) | 0.07 | 0.05 | (0.54) | 4.89 | 0.76 | 97,444 | 1.03 | 1.03 | (0.39) | 60 |
| Year ended 12/31/15 | 5.78 | (0.02) | 0.08 | 0.06 | (0.46) | 5.38 | 1.21 | 103,632 | 1.07 | 1.07 | (0.33) | 62 |
| Year ended 12/31/14 | 5.35 | (0.02) | 0.45 | 0.43 | — | 5.78 | 8.04 | 106,390 | 1.07 | 1.07 | (0.36) | 71 |
| Series II |
| Six months ended 06/30/19 | 4.67 | (0.01) | 1.18 | 1.17 | — | 5.84 | 25.05 | 116,913 | 1.22(d) | 1.22(d) | (0.54)(d) | 86 |
| Year ended 12/31/18 | 5.53 | (0.03) | (0.18) | (0.21) | (0.65) | 4.67 | (5.87) | 91,795 | 1.25 | 1.25 | (0.62) | 57 |
| Year ended 12/31/17 | 4.83 | (0.03) | 1.08 | 1.05 | (0.35) | 5.53 | 22.14 | 122,447 | 1.25 | 1.25 | (0.59) | 46 |
| Year ended 12/31/16 | 5.33 | (0.03) | 0.07 | 0.04 | (0.54) | 4.83 | 0.57 | 114,282 | 1.28 | 1.28 | (0.64) | 60 |
| Year ended 12/31/15 | 5.74 | (0.03) | 0.08 | 0.05 | (0.46) | 5.33 | 1.04 | 158,684 | 1.32 | 1.32 | (0.58) | 62 |
| Year ended 12/31/14 | 5.33 | (0.03) | 0.44 | 0.41 | — | 5.74 | 7.69 | 162,299 | 1.32 | 1.32 | (0.61) | 71 |
| (a) | Calculated using average shares outstanding. |
| (b) | Includes adjustments in accordance with accounting principles generally accepted in the United States of America and as such, the net asset value for financial reporting purposes and the returns based upon those net asset values may differ from the net asset value and returns for shareholder transactions. Total returns are not annualized for periods less than one year, if applicable, and do not reflect charges assessed in connection with a variable product, which if included would reduce total returns. |
| (c) | Portfolio turnover is calculated at the fund level and is not annualized for periods less than one year, if applicable. |
| (d) | Ratios are annualized and based on average daily net assets (000’s omitted) of $103,478 and $109,954 for Series I and Series II shares, respectively. |
See accompanying Notes to Financial Statements which are an integral part of the financial statements.
Invesco V.I. Mid Cap Growth Fund
Notes to Financial Statements
June 30, 2019
(Unaudited)
NOTE 1—Significant Accounting Policies
Invesco V.I. Mid Cap Growth Fund (the “Fund”) is a series portfolio of AIM Variable Insurance Funds (Invesco Variable Insurance Funds) (the “Trust”). The Trust is a Delaware statutory trust registered under the Investment Company Act of 1940, as amended (the “1940 Act”), as an open-end series management investment company. Information presented in these financial statements pertains only to the Fund. Matters affecting the Fund or each class will be voted on exclusively by the shareholders of the Fund or each class. Current Securities and Exchange Commission (“SEC”) guidance, however, requires participating insurance companies offering separate accounts to vote shares proportionally in accordance with the instructions of the contract owners whose investments are funded by shares of each Fund or class.
The Fund’s investment objective is to seek capital growth.
The Fund currently offers two classes of shares, Series I and Series II, both of which are offered to insurance company separate accounts funding variable annuity contracts and variable life insurance policies (“variable products”).
The Fund is an investment company and accordingly follows the investment company accounting and reporting guidance in accordance with Financial Accounting Standards Board Accounting Standards Codification Topic 946,Financial Services – Investment Companies.
The following is a summary of the significant accounting policies followed by the Fund in the preparation of its financial statements.
| A. | Security Valuations — Securities, including restricted securities, are valued according to the following policy. |
A security listed or traded on an exchange (except convertible securities) is valued at its last sales price or official closing price as of the close of the customary trading session on the exchange where the security is principally traded, or lacking any sales or official closing price on a particular day, the security may be valued at the closing bid price on that day. Securities traded in the over-the-counter market are valued based on prices furnished by independent pricing services or market makers. When such securities are valued by an independent pricing service they may be considered fair valued. Futures contracts are valued at the final settlement price set by an exchange on which they are principally traded. Listed options are valued at the mean between the last bid and asked prices from the exchange on which they are principally traded. Options not listed on an exchange are valued by an independent source at the mean between the last bid and asked prices. For purposes of determining net asset value (“NAV”) per share, futures and option contracts generally are valued 15 minutes after the close of the customary trading session of the New York Stock Exchange (“NYSE”).
Investments in open-end and closed-end registered investment companies that do not trade on an exchange are valued at the end-of-day net asset value per share. Investments in open-end and closed-end registered investment companies that trade on an exchange are valued at the last sales price or official closing price as of the close of the customary trading session on the exchange where the security is principally traded.
Debt obligations (including convertible securities) and unlisted equities are fair valued using an evaluated quote provided by an independent pricing service. Evaluated quotes provided by the pricing service may be determined without exclusive reliance on quoted prices, and may reflect appropriate factors such as institution-size trading in similar groups of securities, developments related to specific securities, dividend rate (for unlisted equities), yield (for debt obligations), quality, type of issue, coupon rate (for debt obligations), maturity (for debt obligations), individual trading characteristics and other market data. Pricing services generally value debt obligations assuming orderly transactions of institutional round lot size, but a fund may hold or transact in the same securities in smaller, odd lot sizes. Odd lots often trade at lower prices than institutional round lots. Debt obligations are subject to interest rate and credit risks. In addition, all debt obligations involve some risk of default with respect to interest and/or principal payments.
Foreign securities’ (including foreign exchange contracts) prices are converted into U.S. dollar amounts using the applicable exchange rates as of the close of the NYSE. If market quotations are available and reliable for foreign exchange-traded equity securities, the securities will be valued at the market quotations. Because trading hours for certain foreign securities end before the close of the NYSE, closing market quotations may become unreliable. If between the time trading ends on a particular security and the close of the customary trading session on the NYSE, events occur that the investment adviser determines are significant and make the closing price unreliable, the Fund may fair value the security. If the event is likely to have affected the closing price of the security, the security will be valued at fair value in good faith using procedures approved by the Board of Trustees. Adjustments to closing prices to reflect fair value may also be based on a screening process of an independent pricing service to indicate the degree of certainty, based on historical data, that the closing price in the principal market where a foreign security trades is not the current value as of the close of the NYSE. Foreign securities’ prices meeting the approved degree of certainty that the price is not reflective of current value will be priced at the indication of fair value from the independent pricing service. Multiple factors may be considered by the independent pricing service in determining adjustments to reflect fair value and may include information relating to sector indices, American Depositary Receipts and domestic and foreign index futures. Foreign securities may have additional risks including exchange rate changes, potential for sharply devalued currencies and high inflation, political and economic upheaval, the relative lack of issuer information, relatively low market liquidity and the potential lack of strict financial and accounting controls and standards.
Securities for which market prices are not provided by any of the above methods may be valued based upon quotes furnished by independent sources. The last bid price may be used to value equity securities. The mean between the last bid and asked prices is used to value debt obligations, including corporate loans.
Securities for which market quotations are not readily available or became unreliable are valued at fair value as determined in good faith by or under the supervision of the Trust’s officers following procedures approved by the Board of Trustees. Issuer specific events, market trends, bid/asked quotes of brokers and information providers and other market data may be reviewed in the course of making a good faith determination of a security’s fair value.
The Fund may invest in securities that are subject to interest rate risk, meaning the risk that the prices will generally fall as interest rates rise and, conversely, the prices will generally rise as interest rates fall. Specific securities differ in their sensitivity to changes in interest rates depending on their individual characteristics. Changes in interest rates may result in increased market volatility, which may affect the value and/or liquidity of certain Fund investments.
Invesco V.I. Mid Cap Growth Fund
Valuations change in response to many factors including the historical and prospective earnings of the issuer, the value of the issuer’s assets, general economic conditions, interest rates, investor perceptions and market liquidity. Because of the inherent uncertainties of valuation, the values reflected in the financial statements may materially differ from the value received upon actual sale of those investments.
| B. | Securities Transactions and Investment Income — Securities transactions are accounted for on a trade date basis. Realized gains or losses on sales are computed on the basis of specific identification of the securities sold. Interest income (net of withholding tax, if any) is recorded on the accrual basis from settlement date. Dividend income (net of withholding tax, if any) is recorded on the ex-dividend date. |
The Fund may periodically participate in litigation related to Fund investments. As such, the Fund may receive proceeds from litigation settlements. Any proceeds received are included in the Statement of Operations as realized gain (loss) for investments no longer held and as unrealized gain (loss) for investments still held.
Brokerage commissions and mark ups are considered transaction costs and are recorded as an increase to the cost basis of securities purchased and/or a reduction of proceeds on a sale of securities. Such transaction costs are included in the determination of net realized and unrealized gain (loss) from investment securities reported in the Statement of Operations and the Statement of Changes in Net Assets and the net realized and unrealized gains (losses) on securities per share in the Financial Highlights. Transaction costs are included in the calculation of the Fund’s net asset value and, accordingly, they reduce the Fund’s total returns. These transaction costs are not considered operating expenses and are not reflected in net investment income reported in the Statement of Operations and the Statement of Changes in Net Assets, or the net investment income per share and the ratios of expenses and net investment income reported in the Financial Highlights, nor are they limited by any expense limitation arrangements between the Fund and the investment adviser.
The Fund allocates income and realized and unrealized capital gains and losses to a class based on the relative net assets of each class.
| C. | Country Determination — For the purposes of making investment selection decisions and presentation in the Schedule of Investments, the investment adviser may determine the country in which an issuer is located and/or credit risk exposure based on various factors. These factors include the laws of the country under which the issuer is organized, where the issuer maintains a principal office, the country in which the issuer derives 50% or more of its total revenues and the country that has the primary market for the issuer’s securities, as well as other criteria. Among the other criteria that may be evaluated for making this determination are the country in which the issuer maintains 50% or more of its assets, the type of security, financial guarantees and enhancements, the nature of the collateral and the sponsor organization. Country of issuer and/or credit risk exposure has been determined to be the United States of America, unless otherwise noted. |
| D. | Distributions– Distributions from net investment income and net realized capital gain, if any, are generally declared and paid to separate accounts of participating insurance companies annually and recorded on the ex-dividend date. |
| E. | Federal Income Taxes –The Fund intends to comply with the requirements of Subchapter M of the Internal Revenue Code of 1986, as amended (the “Internal Revenue Code”), necessary to qualify as a regulated investment company and to distribute substantially all of the Fund’s taxable earnings to shareholders. As such, the Fund will not be subject to federal income taxes on otherwise taxable income (including net realized capital gain) that is distributed to shareholders. Therefore, no provision for federal income taxes is recorded in the financial statements. |
The Fund recognizes the tax benefits of uncertain tax positions only when the position is more likely than not to be sustained. Management has analyzed the Fund’s uncertain tax positions and concluded that no liability for unrecognized tax benefits should be recorded related to uncertain tax positions. Management is not aware of any tax positions for which it is reasonably possible that the total amounts of unrecognized tax benefits will change materially in the next 12 months.
The Fund files tax returns in the U.S. Federal jurisdiction and certain other jurisdictions. Generally, the Fund is subject to examinations by such taxing authorities for up to three years after the filing of the return for the tax period.
| F. | Expenses– Fees provided for under the Rule 12b-1 plan of a particular class of the Fund and which are directly attributable to that class are charged to the operations of such class. All other expenses are allocated among the classes based on relative net assets. |
| G. | Accounting Estimates – The preparation of financial statements in conformity with accounting principles generally accepted in the United States of America (“GAAP”) requires management to make estimates and assumptions that affect the reported amounts of assets and liabilities at the date of the financial statements and the reported amounts of revenues and expenses during the reporting period including estimates and assumptions related to taxation. Actual results could differ from those estimates by a significant amount. In addition, the Fund monitors for material events or transactions that may occur or become known after the period-end date and before the date the financial statements are released to print. |
| H. | Indemnifications – Under the Trust’s organizational documents, each Trustee, officer, employee or other agent of the Trust is indemnified against certain liabilities that may arise out of the performance of their duties to the Fund. Additionally, in the normal course of business, the Fund enters into contracts, including the Fund’s servicing agreements, that contain a variety of indemnification clauses. The Fund’s maximum exposure under these arrangements is unknown as this would involve future claims that may be made against the Fund that have not yet occurred. The risk of material loss as a result of such indemnification claims is considered remote. |
| I. | Securities Lending– The Fund may lend portfolio securities having a market value up to one-third of the Fund’s total assets. Such loans are secured by collateral equal to no less than the market value of the loaned securities determined daily by the securities lending provider. Such collateral will be cash or debt securities issued or guaranteed by the U.S. Government or any of its sponsored agencies. Cash collateral received in connection with these loans is invested in short-term money market instruments or affiliated money market funds and is shown as such on the Schedule of Investments. The Fund bears the risk of loss with respect to the investment of collateral. It is the Fund’s policy to obtain additional collateral from or return excess collateral to the borrower by the end of the next business day, following the valuation date of the securities loaned. Therefore, the value of the collateral held may be temporarily less than the value of the securities on loan. When loaning securities, the Fund retains certain benefits of owning the securities, including the economic equivalent of dividends or interest generated by the security. Lending securities entails a risk of loss to the Fund if, and to the extent that, the market value of the securities loaned were to increase and the borrower did not increase the collateral accordingly, and the borrower failed to return the securities. The securities loaned are subject to termination at the option of the borrower or the Fund. Upon termination, the borrower will return to the Fund the securities loaned and the Fund will return the collateral. Upon the failure of the borrower to return the securities, collateral may be liquidated and the securities may be purchased on the open market to replace the loaned securities. The Fund could experience delays and costs in gaining access to the collateral and the securities may lose value during the delay which could result in potential losses to the Fund. Some of these losses may be indemnified by the lending agent. The Fund bears the risk of any deficiency in the amount of the collateral available for return to the borrower due to any loss on the |
Invesco V.I. Mid Cap Growth Fund
| | collateral invested. Dividends received on cash collateral investments for securities lending transactions, which are net of compensation to counterparties, are included inDividends from affiliated money market funds on the Statement of Operations. The aggregate value of securities out on loan, if any, is shown as a footnote on the Statement of Assets and Liabilities. |
| J. | Foreign Currency Translations— Foreign currency is valued at the close of the NYSE based on quotations posted by banks and major currency dealers. Portfolio securities and other assets and liabilities denominated in foreign currencies are translated into U.S. dollar amounts at the date of valuation. Purchases and sales of portfolio securities (net of foreign taxes withheld on disposition) and income items denominated in foreign currencies are translated into U.S. dollar amounts on the respective dates of such transactions. The Fund does not separately account for the portion of the results of operations resulting from changes in foreign exchange rates on investments and the fluctuations arising from changes in market prices of securities held. The combined results of changes in foreign exchange rates and the fluctuation of market prices on investments (net of estimated foreign tax withholding) are included with the net realized and unrealized gain or loss from investments in the Statement of Operations. Reported net realized foreign currency gains or losses arise from (1) sales of foreign currencies, (2) currency gains or losses realized between the trade and settlement dates on securities transactions, and (3) the difference between the amounts of dividends, interest, and foreign withholding taxes recorded on the Fund’s books and the U.S. dollar equivalent of the amounts actually received or paid. Net unrealized foreign currency gains and losses arise from changes in the fair values of assets and liabilities, other than investments in securities at fiscal period end, resulting from changes in exchange rates. |
The Fund may invest in foreign securities, which may be subject to foreign taxes on income, gains on investments or currency repatriation, a portion of which may be recoverable. Foreign taxes, if any, are recorded based on the tax regulations and rates that exist in the foreign markets in which the Fund invests and are shown in the Statement of Operations.
| K. | Forward Foreign Currency Contracts— The Fund may engage in foreign currency transactions either on a spot (i.e. for prompt delivery and settlement) basis, or through forward foreign currency contracts, to manage or minimize currency or exchange rate risk. |
The Fund may also enter into forward foreign currency contracts for the purchase or sale of a security denominated in a foreign currency in order to “lock in” the U.S. dollar price of that security, or the Fund may also enter into forward foreign currency contracts that do not provide for physical settlement of the two currencies, but instead are settled by a single cash payment calculated as the difference between the agreed upon exchange rate and the spot rate at settlement based upon an agreed upon notional amount (non-deliverable forwards). The Fund will set aside liquid assets in an amount equal to the daily mark-to-market obligation for forward foreign currency contracts.
A forward foreign currency contract is an obligation between two parties (“Counterparties”) to purchase or sell a specific currency for an agreed-upon price at a future date. The use of forward foreign currency contracts does not eliminate fluctuations in the price of the underlying securities the Fund owns or intends to acquire but establishes a rate of exchange in advance. Fluctuations in the value of these contracts are measured by the difference in the contract date and reporting date exchange rates and are recorded as unrealized appreciation (depreciation) until the contracts are closed. When the contracts are closed, realized gains (losses) are recorded. Realized and unrealized gains (losses) on the contracts are included in the Statement of Operations. The primary risks associated with forward foreign currency contracts include failure of the Counterparty to meet the terms of the contract and the value of the foreign currency changing unfavorably. These risks may be in excess of the amounts reflected in the Statement of Assets and Liabilities.
NOTE 2—Advisory Fees and Other Fees Paid to Affiliates
The Trust has entered into a master investment advisory agreement with Invesco Advisers, Inc. (the "Adviser" or "Invesco"). Under the terms of the investment advisory agreement, the Fund accrues daily and pays monthly an advisory fee to the Adviser based on the annual rate of the Fund’s average daily net assets as follows:
| Average Daily Net Assets | Rate |
| First $500 million | 0.75% |
| Next $500 million | 0.70% |
| Over $1 billion | 0.65% |
For the six months ended June 30, 2019, the effective advisory fees incurred by the Fund was 0.75%.
Under the terms of a master sub-advisory agreement between the Adviser and each of Invesco Asset Management Deutschland GmbH, Invesco Asset Management Limited, Invesco Asset Management (Japan) Limited, Invesco Hong Kong Limited, Invesco Senior Secured Management, Inc. and Invesco Canada Ltd. and separate sub-advisory agreements with Invesco Capital Management LLC and Invesco Asset Management (India) Private Limited (collectively, the "Affiliated Sub-Advisers") the Adviser, not the Fund, will pay 40% of the fees paid to the Adviser to any such Affiliated Sub-Adviser(s) that provide(s) discretionary investment management services to the Fund based on the percentage of assets allocated to such Affiliated Sub-Adviser(s).
The Adviser has contractually agreed, through at least June 30, 2020, to waive advisory fees and/or reimburse expenses of all shares to the extent necessary to limit total annual fund operating expenses after fee waiver and/or expense reimbursement (excluding certain items discussed below) of Series I shares to 2.00% and Series II shares to 2.25% of average daily net assets (the “expense limits”). In determining the Adviser’s obligation to waive advisory fees and/or reimburse expenses, the following expenses are not taken into account, and could cause the total annual fund operating expenses after fee waiver and/or expense reimbursement to exceed the numbers reflected above: (1) interest; (2) taxes; (3) dividend expense on short sales; (4) extraordinary or non-routine items, including litigation expenses; and (5) expenses that the Fund has incurred but did not actually pay because of an expense offset arrangement. Unless Invesco continues the fee waiver agreement, it will terminate on June 30, 2020. During its term, the fee waiver agreement cannot be terminated or amended to increase the expense limits or reduce the advisory fee waiver without approval of the Board of Trustees. The Adviser did not waive fees and/or reimburse expenses during the period under these expense limits.
Further, the Adviser has contractually agreed, through at least June 30, 2021, to waive the advisory fee payable by the Fund in an amount equal to 100% of the net advisory fees the Adviser receives from the affiliated money market funds on investments by the Fund of uninvested cash (excluding investments of cash collateral from securities lending) in such affiliated money market funds.
For the six months ended June 30, 2019, the Adviser waived advisory fees of $1,913.
Invesco V.I. Mid Cap Growth Fund
The Trust has entered into a master administrative services agreement with Invesco pursuant to which the Fund has agreed to pay Invesco a fee for costs incurred in providing accounting services and fund administrative services to the Fund and to reimburse Invesco for fees paid to insurance companies that have agreed to provide certain administrative services to the Fund. These administrative services provided by the insurance companies may include, among other things: maintenance of master accounts with the Fund; tracking, recording and transmitting net purchase and redemption orders for Fund shares; maintaining and preserving records related to the purchase, redemption and other account activity of variable product owners; distributing copies of Fund documents such as prospectuses, proxy materials and periodic reports, to variable product owners, and responding to inquiries from variable product owners about the Fund. Pursuant to such agreement, for the six months ended June 30, 2019, Invesco was paid $14,940 for accounting and fund administrative services and was reimbursed $160,290 for fees paid to insurance companies. Also, Invesco has entered into a sub-administration agreement whereby State Street Bank and Trust Company (“SSB”) serves as custodian and fund accountant and provides certain administrative services to the Fund.
The Trust has entered into a transfer agency and service agreement with Invesco Investment Services, Inc. (“IIS”) pursuant to which the Fund has agreed to pay IIS a fee for providing transfer agency and shareholder services to the Fund and reimburse IIS for certain expenses incurred by IIS in the course of providing such services. For the six months ended June 30, 2019, expenses incurred under the agreement are shown in the Statement of Operations asTransfer agent fees.
The Trust has entered into a master distribution agreement with Invesco Distributors, Inc. (“IDI”) to serve as the distributor for the Fund. The Trust has adopted a plan pursuant to Rule 12b-1 under the 1940 Act with respect to the Fund’s Series II shares (the “Plan”). The Fund, pursuant to the Plan, pays IDI compensation at the annual rate of 0.25% of the Fund’s average daily net assets of Series II shares. The fees are accrued daily and paid monthly. Of the Plan payments, up to 0.25% of the average daily net assets of the Series II shares may be paid to insurance companies who furnish continuing personal shareholder services to customers who purchase and own Series II shares of the Fund. For the six months ended June 30, 2019, expenses incurred under the Plan are detailed in the Statement of Operations asDistribution fees.
For the six months ended June 30, 2019, the Fund incurred $1,165 in brokerage commissions with Invesco Capital Markets, Inc., an affiliate of the Adviser and IDI, for portfolio transactions executed on behalf of the Fund.
Certain officers and trustees of the Trust are officers and directors of the Adviser, IIS and/or IDI.
NOTE 3—Additional Valuation Information
GAAP defines fair value as the price that would be received to sell an asset or paid to transfer a liability in an orderly transaction between market participants at the measurement date, under current market conditions. GAAP establishes a hierarchy that prioritizes the inputs to valuation methods, giving the highest priority to readily available unadjusted quoted prices in an active market for identical assets (Level 1) and the lowest priority to significant unobservable inputs (Level 3), generally when market prices are not readily available or are unreliable. Based on the valuation inputs, the securities or other investments are tiered into one of three levels. Changes in valuation methods may result in transfers in or out of an investment’s assigned level:
Level 1 – Prices are determined using quoted prices in an active market for identical assets.
Level 2 – Prices are determined using other significant observable inputs. Observable inputs are inputs that other market participants may use in pricing a security. These may include quoted prices for similar securities, interest rates, prepayment speeds, credit risk, yield curves, loss severities, default rates, discount rates, volatilities and others.
Level 3 – Prices are determined using significant unobservable inputs. In situations where quoted prices or observable inputs are unavailable (for example, when there is little or no market activity for an investment at the end of the period), unobservable inputs may be used. Unobservable inputs reflect the Fund’s own assumptions about the factors market participants would use in determining fair value of the securities or instruments and would be based on the best available information.
The following is a summary of the tiered valuation input levels, as of June 30, 2019. The level assigned to the securities valuations may not be an indication of the risk or liquidity associated with investing in those securities. Because of the inherent uncertainties of valuation, the values reflected in the financial statements may materially differ from the value received upon actual sale of those investments.
| | Level 1 | Level 2 | Level 3 | Total |
| Investments in Securities | | | | |
| Common Stocks & Other Equity Interests | $224,349,673 | $1,156,025 | $— | $225,505,698 |
| Money Market Funds | 476,877 | — | — | 476,877 |
| Total Investments | $224,826,550 | $1,156,025 | $— | $225,982,575 |
NOTE 4—Trustees’ and Officers’ Fees and Benefits
Trustees’ and Officers’ Fees and Benefits include amounts accrued by the Fund to pay remuneration to certain Trustees and Officers of the Fund. Trustees have the option to defer compensation payable by the Fund, and Trustees’ and Officers’ Fees and Benefits also include amounts accrued by the Fund to fund such deferred compensation amounts. Those Trustees who defer compensation have the option to select various Invesco Funds in which their deferral accounts shall be deemed to be invested. Finally, certain current Trustees were eligible to participate in a retirement plan that provided for benefits to be paid upon retirement to Trustees over a period of time based on the number of years of service. The Fund may have certain former Trustees who also participate in a retirement plan and receive benefits under such plan.Trustees’ and Officers’ Fees and Benefits include amounts accrued by the Fund to fund such retirement benefits. Obligations under the deferred compensation and retirement plans represent unsecured claims against the general assets of the Fund.
NOTE 5—Cash Balances
The Fund is permitted to temporarily carry a negative or overdrawn balance in its account with State Street Bank and Trust Company, the custodian bank. Such balances, if any at period-end, are shown in the Statement of Assets and Liabilities under the payable caption Amount due custodian. To
Invesco V.I. Mid Cap Growth Fund
compensate the custodian bank for such overdrafts, the overdrawn Fund may either (1) leave funds as a compensating balance in the account so the custodian bank can be compensated by earning the additional interest; or (2) compensate by paying the custodian bank at a rate agreed upon by the custodian bank and Invesco, not to exceed the contractually agreed upon rate.
NOTE 6—Tax Information
The amount and character of income and gains to be distributed are determined in accordance with income tax regulations, which may differ from GAAP. Reclassifications are made to the Fund’s capital accounts to reflect income and gains available for distribution (or available capital loss carryforward) under income tax regulations. The tax character of distributions paid during the year and the tax components of net assets will be reported at the Fund’s fiscal year-end.
Capital loss carryforward is calculated and reported as of a specific date. Results of transactions and other activity after that date may affect the amount of capital loss carryforward actually available for the Fund to utilize. Capital losses generated in years beginning after December 22, 2010 can be carried forward for an unlimited period, whereas previous losses expire in eight tax years. Capital losses with an expiration period may not be used to offset capital gains until all net capital losses without an expiration date have been utilized. Capital loss carryforwards with no expiration date will retain their character as either short-term or long-term capital losses instead of as short-term capital losses as under prior law. The ability to utilize capital loss carryforwards in the future may be limited under the Internal Revenue Code and related regulations based on the results of future transactions.
The Fund did not have a capital loss carryforward as of December 31, 2018.
NOTE 7—Investment Transactions
The aggregate amount of investment securities (other than short-term securities, U.S. Treasury obligations and money market funds, if any) purchased and sold by the Fund during the six months ended June 30, 2019 was $179,556,167 and $182,396,952, respectively. Cost of investments, including any derivatives, on a tax basis includes the adjustments for financial reporting purposes as of the most recently completed federal income tax reporting period-end.
| Unrealized Appreciation (Depreciation) of Investments on a Tax Basis |
| Aggregate unrealized appreciation of investments | $30,082,734 |
| Aggregate unrealized (depreciation) of investments | (241,338) |
| Net unrealized appreciation of investments | $29,841,396 |
Cost of investments for tax purposes is $196,141,179.
NOTE 8—Share Information
| | Summary of Share Activity |
| | Six months ended
June 30, 2019(a) | | Year ended
December 31, 2018 |
| | Shares | Amount | | Shares | Amount |
| Sold: | | | | | |
| Series I | 826,098 | $4,563,675 | | 1,634,000 | $9,588,108 |
| Series II | 2,120,329 | 11,383,354 | | 1,697,932 | 9,678,387 |
| Issued as reinvestment of dividends: | | | | | |
| Series I | — | — | | 2,026,091 | 11,710,806 |
| Series II | — | — | | 2,264,976 | 12,842,411 |
| Reacquired: | | | | | |
| Series I | (2,084,011) | (11,604,152) | | (3,918,877) | (22,593,402) |
| Series II | (1,735,339) | (9,454,495) | | (6,472,581) | (35,700,897) |
| Net increase (decrease) in share activity | (872,923) | $(5,111,618) | | (2,768,459) | $(14,474,587) |
| (a) | There are entities that are record owners of more than 5% of the outstanding shares of the Fund and in the aggregate own 56% of the outstanding shares of the Fund. The Fund and the Fund’s principal underwriter or adviser, are parties to participation agreements with these entities whereby these entities sell units of interest in separate accounts funding variable products that are invested in the Fund. The Fund, Invesco and/or Invesco affiliates may make payments to these entities, which are considered to be related to the Fund, for providing services to the Fund, Invesco and/or Invesco affiliates including but not limited to services such as, securities brokerage, third party record keeping and account servicing and administrative services. The Fund has no knowledge as to whether all or any portion of the shares owned of record by these entities are also owned beneficially. |
Invesco V.I. Mid Cap Growth Fund
Calculating your ongoing Fund expenses
Example
As a shareholder of the Fund, you incur ongoing costs, including management fees; distribution and/or service fees (12b-1); and other Fund expenses. This example is intended to help you understand your ongoing costs (in dollars) of investing in the Fund and to compare these costs with ongoing costs of investing in other mutual funds. The example is based on an investment of $1,000 invested at the beginning of the period and held for the entire period January 1, 2019 through June 30, 2019.
The actual and hypothetical expenses in the examples below do not represent the effect of any fees or other expenses assessed in connection with a variable product; if they did, the expenses shown would be higher while the ending account values shown would be lower.
Actual expenses
The table below provides information about actual account values and actual expenses. You may use the information in this table, together with the amount you invested, to estimate the expenses that you paid over the period. Simply divide your account value by $1,000 (for example, an $8,600 account value divided by $1,000 = 8.6), then multiply the result by the number in the table under the heading entitled “Actual Expenses Paid During Period” to estimate the expenses you paid on your account during this period.
Hypothetical example for comparison purposes
The table below also provides information about hypothetical account values and hypothetical expenses based on the Fund’s actual expense ratio and an assumed rate of return of 5% per year before expenses, which is not the Fund’s actual return.
The hypothetical account values and expenses may not be used to estimate the actual ending account balance or expenses you paid for the period. You may use this information to compare the ongoing costs of investing in the Fund and other funds. To do so, compare this 5% hypothetical example with the 5% hypothetical examples that appear in the shareholder reports of the other funds.
Please note that the expenses shown in the table are meant to highlight your ongoing costs. Therefore, the hypothetical information is useful in comparing ongoing costs, and will not help you determine the relative total costs of owning different funds.
| | Beginning
Account Value (01/01/19) | ACTUAL | HYPOTHETICAL
(5% annual return before
expenses) | Annualized
Expense
Ratio |
Ending
Account Value
(06/30/19)1 | Expenses
Paid During
Period2 | Ending
Account Value
(06/30/19) | Expenses
Paid During
Period2 |
| Series I | $1,000.00 | $1,251.60 | $5.42 | $1,019.98 | $4.86 | 0.97% |
| Series II | 1,000.00 | 1,250.50 | 6.81 | 1,018.74 | 6.11 | 1.22 |
| 1 | The actual ending account value is based on the actual total return of the Fund for the period January 1, 2019 through June 30, 2019, after actual expenses and will differ from the hypothetical ending account value which is based on the Fund’s expense ratio and a hypothetical annual return of 5% before expenses. |
| 2 | Expenses are equal to the Fund’s annualized expense ratio as indicated above multiplied by the average account value over the period, multiplied by 181/365 to reflect the most recent fiscal half year. |
Invesco V.I. Mid Cap Growth Fund
Approval of Investment Advisory and Sub-Advisory Contracts
At meetings held on June 10, 2019, the Board of Trustees (the Board or the Trustees) of AIM Variable Insurance Funds (Invesco Variable Insurance Funds) as a whole, and the independent Trustees, who comprise over 75% of the Board, voting separately, approved the continuance of the Invesco V.I. Mid Cap Growth Fund’s (the Fund) Master Investment Advisory Agreement with Invesco Advisers, Inc. (Invesco Advisers and the investment advisory agreement) and the Master IntergroupSub-Advisory Contract for Mutual Funds with Invesco Asset Management Deutschland GmbH, Invesco Asset Management Limited, Invesco Asset Management (Japan) Limited, Invesco Hong Kong Limited, Invesco Senior Secured Management, Inc. and Invesco Canada Ltd. and separate sub-advisory contracts with Invesco Capital Management LLC and Invesco Asset Management (India) Private Limited (collectively, the Affiliated Sub-Advisers and the sub-advisory contracts) for another year, effective July 1, 2019. After evaluating the factors discussed below, among others, the Board approved the renewal of the Fund’s investment advisory agreement and thesub-advisory contracts and determined that the compensation payable by the Fund to Invesco Advisers and by Invesco Advisers to the Affiliated Sub-Advisers is fair and reasonable.
The Board’s Evaluation Process
The Board’s Investments Committee has established threeSub-Committees, which meet throughout the year to review the performance of funds advised by Invesco Advisers (the Invesco Funds). As part of a regularly scheduled basis ofin-person Board meetings, theSub-Committees meet with portfolio managers for their assigned Invesco Funds and other members of management to review detailed information about investment performance and portfolio attributes of these funds. The Board took into account evaluations and reports that it received from the Investments Committee and Sub-Committees, as well as the information provided to such committees and the Board throughout the year, in considering whether to approve each Invesco Fund’s investment advisory agreement and sub-advisory contracts.
As part of the contract renewal process, the Board reviews and considers information provided in response to detailed requests for information submitted to management by the independent Trustees with assistance from legal counsel to the independent Trustees. The Board receives comparative investment performance and fee data regarding the Invesco Funds prepared by Invesco Advisers and Broadridge Financial Solutions, Inc. (Broadridge), an independent mutual fund data provider. The Board also receives an independent written evaluation from the Senior Officer, an officer of the Invesco Funds who reports directly to the
independent Trustees. The Senior Officer’s evaluation is prepared as part of his responsibility to manage the process by which the Invesco Funds’ proposed management fees are negotiated during the annual contract renewal process to ensure they are negotiated in a manner that is at arms’ length and reasonable. In addition to meetings with Invesco Advisers and fund counsel throughout the year, the independent Trustees also discuss the continuance of the investment advisory agreement and sub-advisory contracts in separate sessions with the Senior Officer and with independent legal counsel.
The discussion below is a summary of the Senior Officer’s independent written evaluation with respect to the Fund’s investment advisory agreement, as well as a discussion of the material factors and related conclusions that formed the basis for the Board’s approval of the Fund’s investment advisory agreement andsub-advisory contracts. The Trustees’ review and conclusions are based on the comprehensive consideration of all information presented to them during the course of the year and in prior years and are not the result of any single determinative factor. Moreover, one Trustee may have weighed a particular piece of information or factor differently than another Trustee. This information is current as of June 10, 2019.
Factors and Conclusions and Summary of Independent Written Fee Evaluation
| A. | Nature, Extent and Quality of Services Provided by Invesco Advisers and the Affiliated Sub-Advisers |
The Board reviewed the nature, extent and quality of the advisory services provided to the Fund by Invesco Advisers under the Fund’s investment advisory agreement, and the credentials and experience of the officers and employees of Invesco Advisers who provide these services, including the Fund’s portfolio manager(s). The Board’s review included consideration of Invesco Advisers’ investment process oversight and structure, credit analysis and investment risk management. The Board also considered non-advisory services that Invesco Advisers and its affiliates provide to the Invesco Funds such as various back office support functions, third party oversight, internal audit, valuation, portfolio trading and legal and compliance. The Board also received and reviewed information about Invesco Advisers’ role as administrator of the Invesco Funds’ liquidity risk management program. The Board also reviewed and considered the benefits to shareholders of investing in a fund that is part of the Invesco family of funds under the umbrella of Invesco Ltd., Invesco Advisers’ parent company, and noted Invesco Ltd.’s depth and experience in conducting an investment management business, as well as its
commitment of financial and other resources to such business. The Board reviewed and considered information about the resources that Invesco Advisers intends to continue to commit to managing the Invesco family of funds following Invesco Ltd.’s acquisition of OppenheimerFunds, Inc. and its subsidiaries. The Board concluded that the nature, extent and quality of the services provided to the Fund by Invesco Advisers are appropriate and satisfactory.
The Board reviewed the services that may be provided by the Affiliated Sub-Advisers under the sub-advisory contracts and the credentials and experience of the officers and employees of the Affiliated Sub-Advisers who provide these services. The Board noted the AffiliatedSub-Advisers’ expertise with respect to certain asset classes and that the AffiliatedSub-Advisers have offices and personnel that are located in financial centers around the world. As a result, the Board noted that the AffiliatedSub-Advisers can provide research and investment analysis on the markets and economies of various countries in which the Fund may invest, make recommendations regarding securities and assist with security trades. The Board concluded that thesub-advisory contracts may benefit the Fund and its shareholders by permitting Invesco Advisers to use the resources and talents of the Affiliated Sub-Advisers in managing the Fund. The Board concluded that the nature, extent and quality of the services that may be provided by the Affiliated Sub-Advisers are appropriate and satisfactory.
| B. | Fund Investment Performance |
The Board considered Fund investment performance as a relevant factor in considering whether to approve the investment advisory agreement. The Board did not view Fund investment performance as a relevant factor in considering whether to approve thesub-advisory contracts for the Fund, as no Affiliated Sub-Adviser currently manages assets of the Fund.
The Board compared the Fund’s investment performance over multiple time periods ending December 31, 2018 to the performance of funds in the Broadridge performance universe and against the Lipper Variable Underlying Funds Mid-Cap Growth Funds Index. The Board noted that performance of Series II shares of the Fund was in the fourth quintile of its performance universe for the one year period and the fifth quintile for the three and five year periods (the first quintile being the best performing funds and the fifth quintile being the worst performing funds). The Board noted that performance of Series II shares of the Fund was below the performance of the Index for the one, three and five year periods. The Board noted that the Fund’s overweight and underweight exposure to and security selection in certain
Invesco V.I. Mid Cap Growth Fund
sectors detracted from Fund performance. The Trustees also reviewed more recent Fund performance and this review did not change their conclusions.
| C. | Advisory and Sub-Advisory Fees and Fund Expenses |
The Board compared the Fund’s contractual management fee rate to the contractual management fee rates of funds in the Fund’s Broadridge expense group. The Board noted that the contractual management fee rate for Series II shares of the Fund was below the median contractual management fee rate of funds in its expense group. The Board noted that the term “contractual management fee” for funds in the expense group may include both advisory and certain non-portfolio management administrative services fees, but that Broadridge does not provide information on a fund by fund basis as to what is included. The Board also reviewed the methodology used by Broadridge in providing expense group information, which includes using each fund’s contractual management fee schedule (including any applicable breakpoints) as reported in the most recent prospectus or statement of additional information for each fund in the expense group. The Board also considered comparative information regarding the Fund’s total expense ratio and its various components. The Board noted that the Fund’s total expense ratio was in the fifth quintile of its expense group and discussed with management reasons for such relative total expenses.
The Board noted that Invesco Advisers has contractually agreed to waive fees and/or limit expenses of the Fund for the term disclosed in the Fund’s registration statement in an amount necessary to limit total annual operating expenses to a specified percentage of average daily net assets for each class of the Fund.
The Board noted that Invesco Advisers and the Affiliated Sub-Advisers do not manage other similarly managed mutual funds or client accounts.
The Board also considered the services that may be provided by the Affiliated Sub-Advisers pursuant to the sub-advisory contracts, as well as the fees payable by Invesco Advisers to the Affiliated Sub-Advisers pursuant to thesub-advisory contracts.
| D. | Economies of Scale and Breakpoints |
The Board considered the extent to which there may be economies of scale in the provision of advisory services to the Fund. The Board considered Invesco’s reinvestment in its business, including investments in business infrastructure and cybersecurity. The Board also considered that the Fund may benefit from economies of scale through contractual breakpoints in the Fund’s advisory fee schedule, which generally operate to reduce the Fund’s expense ratio as it grows in size. The Board noted that the Fund shares directly in economies of scale through lower fees charged by third party service providers based on the combined size of the Invesco Funds. The Board noted that the Fund may also benefit from
economies of scale through initial fee setting, fee waivers and expense reimbursements.
| E. | Profitability and Financial Resources |
The Board reviewed information from Invesco Advisers concerning the costs of the advisory and other services that Invesco Advisers and its affiliates provide to the Fund and the Invesco Funds and the profitability of Invesco Advisers and its affiliates in providing these services. The Board considered the methodology used for calculating profitability and noted the periodic review of such methodology by an independent consultant. The Board noted that Invesco Advisers continues to operate at a net profit from services Invesco Advisers and its affiliates provide to the Invesco Funds and the Fund. The Board did not deem the level of profits realized by Invesco Advisers and its affiliates from providing services to the Fund to be excessive given the nature, extent and quality of the services provided. The Board received information from Invesco Advisers demonstrating that Invesco Advisers and the Affiliated Sub-Advisers are financially sound and have the resources necessary to perform their obligations under the investment advisory agreement and sub-advisory contracts.
| F. | Collateral Benefits to Invesco Advisers and its Affiliates |
The Board considered various other benefits received by Invesco Advisers and its affiliates from the relationship with the Fund, including the fees received for providing administrative, transfer agency and distribution services to the Fund. The Board considered comparative information regarding fees charged for these services, including information provided by Broadridge and other independent sources. The Board considered the performance of Invesco Advisers and its affiliates in providing these services and the organizational structure employed to provide these services. The Board also considered that these services are provided to the Fund pursuant to written contracts that are reviewed and approved on an annual basis by the Board; and that the services are required for the operation of the Fund.
The Board considered the benefits realized by Invesco Advisers and the Affiliated Sub-Advisers as a result of portfolio brokerage transactions executed through “soft dollar” arrangements. The Board noted that soft dollar arrangements may result in the Fund bearing costs to purchase research that may be used by Invesco Advisers or the Affiliated Sub-Advisers with other clients and may reduce Invesco Advisers’ or the Affiliated Sub-Advisers’ expenses. The Board also considered that it receives periodic reports from Invesco representing that these arrangements are consistent with regulatory requirements. The Board did not deem the soft dollar arrangements to be inappropriate.
The Board considered that the Fund’s uninvested cash and cash collateral from any securities lending arrangements may be invested in money market funds advised by Invesco Advisers pursuant to procedures approved by the Board. The Board considered
information regarding the returns of the affiliated money market funds relative to comparable overnight investments, as well as the costs to the Fund of such investments. The Board noted that Invesco Advisers receives advisory fees from these affiliated money market funds attributable to such investments, although Invesco Advisers has contractually agreed to waive through varying periods the advisory fees payable by the Invesco Funds with respect to certain investments in the affiliated money market funds. The waiver is in an amount equal to 100% of the net advisory fee Invesco Advisers receives from the affiliated money market funds with respect to the Fund’s investment in the affiliated money market funds of uninvested cash, but not cash collateral. The Board concluded that the amount of advisory fees received by Invesco Advisers from the Fund’s investment of cash collateral from any securities lending arrangements in the affiliated money market funds is fair and reasonable.
The Board also considered that an affiliated broker may receive commissions for executing certain trades for the Fund. Invesco Advisers and the Affiliated Sub-Advisers may use the affiliated broker to, among other things, control order routing and minimize information leakage, and the Board was advised that such trades are executed in compliance with rules under the federal securities laws and consistent with best execution obligations.
Invesco V.I. Mid Cap Growth Fund
| Semiannual Report to Shareholders | June 30, 2019 |
Invesco V.I. S&P 500 Index Fund
Beginning on January 1, 2021, as permitted by regulations adopted by the Securities and Exchange Commission, the insurance company that offers your variable annuity or variable life insurance contract may no longer send you paper copies of the Fund’s shareholder reports by mail, unless you specifically request paper copies of the reports from the insurance company or your financial intermediary. Instead of delivering paper copies of the report, the insurance company may choose to make the reports available on a website, and will notify you by mail each time a report is posted and provide you with a website link to access the report. Instructions for requesting paper copies will be provided by your insurance company.
If the insurance company offers electronic delivery, you may elect to receive shareholder reports and other communications about the Fund electronically by following the instructions provided by the insurance company or by contacting your financial intermediary. If you already elected to receive shareholder reports electronically, you will not be affected by this change and you need not take any action.
You may elect to receive all future reports in paper free of charge from the insurance company. You can inform the insurance company or your financial intermediary that you wish to continue receiving paper copies of your shareholder reports by following the instructions provided by the insurance company or by contacting your financial intermediary. Your election to receive reports in paper will apply to all portfolio companies available under your contract with the insurance company.
The Fund provides a complete list of its holdings four times in each fiscal year, at the quarter-ends. For the second and fourth quarters, the lists appear in the Fund’s semiannual and annual reports to shareholders. For the first and third quarters, the Fund files the lists with the Securities and Exchange Commission (SEC) on Form N-Q (or any successor Form). The Fund’s Form N-Q (or any successor Form) filings are available on the SEC website, sec.gov. The SEC file numbers for the Fund are 811-07452 and 033-57340. The Fund’s most recent portfolio holdings, as filed on Form N-Q (or any successor Form), have also been made available to insurance companies issuing variable annuity contracts and variable life insurance policies (“variable products”) that invest in the Fund.
A description of the policies and procedures that the Fund uses to determine how to vote proxies relating to portfolio securities is available without charge, upon request, from our Client Services department at 800 959 4246 or at invesco.com/proxyguidelines. The information is also available on the SEC website, sec.gov.
Information regarding how the Fund voted proxies related to its portfolio securities during the most recent 12-month period ended June 30 is available at invesco.com/proxysearch. The information is also available on the SEC website, sec.gov.
Invesco Advisers, Inc. is an investment adviser; it provides investment advisory services to individual and institutional clients and does not sell securities. Invesco Distributors, Inc. is the US distributor for Invesco Ltd.’s retail mutual funds, exchange-traded funds and institutional money market funds. Both are wholly owned, indirect subsidiaries of Invesco Ltd.
This report must be accompanied or preceded by a currently effective Fund prospectus and variable product prospectus, which contain more complete information, including sales charges and expenses. Investors should read each carefully before investing.
NOT FDIC INSURED | MAY LOSE VALUE | NO BANK GUARANTEE
| Invesco Distributors, Inc. | MS-VISPI-SAR-1 |
Performance summary
Fund vs. Indexes
Cumulative total returns, December 31, 2018 to June 30, 2019, excluding variable product issuer charges. If variable product issuer charges were included, returns would be lower.
| Series I Shares | 18.23% |
| Series II Shares | 18.09 |
| S&P 500 Index▼ (Broad Market/Style-Specific Index) | 18.54 |
Lipper VUF S&P 500 Funds Index■
(Peer Group Index) | 18.32 |
| Source(s):▼FactSet Research Systems Inc.;■ Lipper Inc. |
The S&P 500® Index is an unmanaged index considered representative of the US stock market.
The Lipper VUF S&P 500 Funds Index is an unmanaged index considered representative of S&P 500 variable insurance underlying funds tracked by Lipper.
A direct investment cannot be made in an index. Unless otherwise indicated, index results include reinvested dividends, and they do not reflect sales charges. Performance of the peer group, if applicable, reflects fund expenses; performance of a market index does not.
| Average Annual Total Returns |
| As of 6/30/19 | |
| Series I Shares | |
| Inception (5/18/98) | 6.39% |
| 10 Years | 14.30 |
| 5 Years | 10.24 |
| 1 Year | 9.89 |
| Series II Shares | |
| Inception (6/5/00) | 5.15% |
| 10 Years | 14.02 |
| 5 Years | 9.96 |
| 1 Year | 9.61 |
Effective June 1, 2010, Class X and Class Y shares of the predecessor fund, Morgan Stanley Variable Investment S&P 500 Index Portfolio advised by Morgan Stanley Investment Advisors Inc. were reorganized into Series I and Series II shares, respectively, of Invesco V.I. S&P 500 Index Fund. Returns shown above, prior to June 1, 2010, for Series I and Series II shares are blended returns of the predecessor fund and Invesco V.I. S&P 500 Index Fund. Share class returns will differ from the predecessor fund because of different expenses.
The performance data quoted represent past performance and cannot guarantee comparable future results; current performance may be lower or higher. Please contact your variable product issuer or financial adviser for the most recent month-end variable product performance. Performance figures reflect Fund expenses, reinvested distributions and changes in net
asset value. Performance figures do not reflect deduction of taxes a shareholder would pay on Fund distributions or sale of Fund shares. Investment return and principal value will fluctuate so that you may have a gain or loss when you sell shares.
The total annual Fund operating expense ratio set forth in the most recent Fund prospectus as of the date of this report for Series I and Series II shares was 0.51% and 0.76%, respectively. The expense ratios presented above may vary from the expense ratios presented in other sections of this report that are based on expenses incurred during the period covered by this report.
Invesco V.I. S&P 500 Index Fund, a series portfolio of AIM Variable Insurance Funds (Invesco Variable Insurance Funds), is currently offered through insurance companies issuing variable products. You cannot purchase shares of the Fund directly. Per-
formance figures given represent the Fund and are not intended to reflect actual variable product values. They do not reflect sales charges, expenses and fees assessed in connection with a variable product. Sales charges, expenses and fees, which are determined by the variable product issuers, will vary and will lower the total return.
The most recent month-end performance at the Fund level, excluding variable product charges, is available at 800 451 4246. As mentioned above, for the most recent month-end performance including variable product charges, please contact your variable product issuer or financial adviser.
Fund performance reflects any applicable fee waivers and/or expense reimbursements. Had the adviser not waived fees and/or reimbursed expenses currently or in the past, returns would have been lower. See current prospectus for more information.
Invesco V.I. S&P 500 Index Fund
Schedule of Investments(a)
June 30, 2019
(Unaudited)
| | Shares | Value |
| Common Stocks & Other Equity Interests–99.60% |
| Advertising–0.11% |
| Interpublic Group of Cos., Inc. (The) | 1,400 | $31,626 |
| Omnicom Group, Inc. | 797 | 65,314 |
| | | | 96,940 |
| Aerospace & Defense–2.59% |
| Arconic, Inc. | 1,436 | 37,077 |
| Boeing Co. (The) | 1,875 | 682,519 |
| General Dynamics Corp. | 973 | 176,911 |
| Huntington Ingalls Industries, Inc. | 147 | 33,037 |
| L3 Technologies, Inc. | 284 | 69,628 |
| L3Harris Technologies, Inc.(b) | 423 | 80,002 |
| Lockheed Martin Corp. | 881 | 320,279 |
| Northrop Grumman Corp. | 608 | 196,451 |
| Raytheon Co. | 998 | 173,532 |
| Textron, Inc. | 851 | 45,137 |
| TransDigm Group, Inc.(b) | 175 | 84,665 |
| United Technologies Corp. | 2,909 | 378,752 |
| | | | 2,277,990 |
| Agricultural & Farm Machinery–0.21% |
| Deere & Co. | 1,136 | 188,247 |
| Agricultural Products–0.09% |
| Archer-Daniels-Midland Co. | 2,020 | 82,416 |
| Air Freight & Logistics–0.55% |
| C.H. Robinson Worldwide, Inc. | 487 | 41,078 |
| Expeditors International of Washington, Inc. | 611 | 46,350 |
| FedEx Corp. | 856 | 140,547 |
| United Parcel Service, Inc., Class B | 2,502 | 258,382 |
| | | | 486,357 |
| Airlines–0.40% |
| Alaska Air Group, Inc. | 438 | 27,993 |
| American Airlines Group, Inc. | 1,426 | 46,502 |
| Delta Air Lines, Inc. | 2,136 | 121,218 |
| Southwest Airlines Co. | 1,752 | 88,966 |
| United Airlines Holdings, Inc.(b) | 799 | 69,952 |
| | | | 354,631 |
| Alternative Carriers–0.05% |
| CenturyLink, Inc. | 3,467 | 40,772 |
| Apparel Retail–0.47% |
| Foot Locker, Inc. | 413 | 17,313 |
| Gap, Inc. (The) | 761 | 13,675 |
| L Brands, Inc. | 833 | 21,741 |
| Ross Stores, Inc. | 1,322 | 131,037 |
| | Shares | Value |
| Apparel Retail–(continued) |
| TJX Cos., Inc. (The) | 4,349 | $229,975 |
| | | | 413,741 |
| Apparel, Accessories & Luxury Goods–0.29% |
| Capri Holdings Ltd.(b) | 543 | 18,831 |
| Hanesbrands, Inc. | 1,329 | 22,885 |
| PVH Corp. | 272 | 25,742 |
| Ralph Lauren Corp. | 187 | 21,241 |
| Tapestry, Inc. | 1,045 | 33,158 |
| Under Armour, Inc., Class A(b) | 669 | 16,959 |
| Under Armour, Inc., Class C(b) | 722 | 16,029 |
| VF Corp. | 1,167 | 101,938 |
| | | | 256,783 |
| Application Software–1.77% |
| Adobe, Inc.(b) | 1,749 | 515,343 |
| ANSYS, Inc.(b) | 298 | 61,036 |
| Autodesk, Inc.(b) | 787 | 128,202 |
| Cadence Design Systems, Inc.(b) | 1,000 | 70,810 |
| Citrix Systems, Inc. | 454 | 44,556 |
| Intuit, Inc. | 929 | 242,776 |
| salesforce.com, inc.(b) | 2,785 | 422,568 |
| Synopsys, Inc.(b) | 537 | 69,106 |
| | | | 1,554,397 |
| Asset Management & Custody Banks–0.83% |
| Affiliated Managers Group, Inc. | 184 | 16,954 |
| Ameriprise Financial, Inc. | 482 | 69,967 |
| Bank of New York Mellon Corp. (The) | 3,159 | 139,470 |
| BlackRock, Inc. | 426 | 199,922 |
| Franklin Resources, Inc. | 1,072 | 37,305 |
| Invesco Ltd.(c) | 1,419 | 29,033 |
| Northern Trust Corp. | 778 | 70,020 |
| State Street Corp. | 1,351 | 75,737 |
| T. Rowe Price Group, Inc. | 842 | 92,376 |
| | | | 730,784 |
| Auto Parts & Equipment–0.12% |
| Aptiv PLC | 927 | 74,929 |
| BorgWarner, Inc. | 762 | 31,989 |
| | | | 106,918 |
| Automobile Manufacturers–0.37% |
| Ford Motor Co. | 14,056 | 143,793 |
| General Motors Co. | 4,731 | 182,285 |
| | | | 326,078 |
| Automotive Retail–0.33% |
| Advance Auto Parts, Inc. | 260 | 40,077 |
| AutoZone, Inc.(b) | 88 | 96,753 |
See accompanying Notes to Financial Statements which are an integral part of the financial statements.
Invesco V.I. S&P 500 Index Fund
| | Shares | Value |
| Automotive Retail–(continued) |
| CarMax, Inc.(b) | 606 | $52,619 |
| O’Reilly Automotive, Inc.(b) | 278 | 102,671 |
| | | | 292,120 |
| Biotechnology–2.17% |
| AbbVie, Inc. | 5,302 | 385,561 |
| Alexion Pharmaceuticals, Inc.(b) | 804 | 105,308 |
| Amgen, Inc. | 2,186 | 402,836 |
| Biogen, Inc.(b) | 695 | 162,540 |
| Celgene Corp.(b) | 2,529 | 233,781 |
| Gilead Sciences, Inc. | 4,553 | 307,601 |
| Incyte Corp.(b) | 638 | 54,204 |
| Regeneron Pharmaceuticals, Inc.(b) | 281 | 87,953 |
| Vertex Pharmaceuticals, Inc.(b) | 918 | 168,343 |
| | | | 1,908,127 |
| Brewers–0.04% |
| Molson Coors Brewing Co., Class B | 669 | 37,464 |
| Broadcasting–0.21% |
| CBS Corp., Class B | 1,261 | 62,924 |
| Discovery, Inc., Class A(b) | 580 | 17,806 |
| Discovery, Inc., Class C(b) | 1,313 | 37,355 |
| Fox Corp., Class A | 1,280 | 46,899 |
| Fox Corp., Class B | 585 | 21,370 |
| | | | 186,354 |
| Building Products–0.29% |
| A.O. Smith Corp. | 517 | 24,382 |
| Allegion PLC | 344 | 38,029 |
| Fortune Brands Home & Security, Inc. | 500 | 28,565 |
| Johnson Controls International PLC | 2,854 | 117,899 |
| Masco Corp. | 1,068 | 41,908 |
| | | | 250,783 |
| Cable & Satellite–1.09% |
| Charter Communications, Inc., Class A(b) | 618 | 244,221 |
| Comcast Corp., Class A | 16,247 | 686,923 |
| DISH Network Corp., Class A(b) | 831 | 31,919 |
| | | | 963,063 |
| Casinos & Gaming–0.11% |
| MGM Resorts International | 1,851 | 52,883 |
| Wynn Resorts, Ltd. | 351 | 43,521 |
| | | | 96,404 |
| Commodity Chemicals–0.26% |
| Dow, Inc. | 2,682 | 132,249 |
| LyondellBasell Industries N.V., Class A | 1,085 | 93,451 |
| | | | 225,700 |
| Communications Equipment–1.20% |
| Arista Networks, Inc.(b) | 188 | 48,808 |
| Cisco Systems, Inc. | 15,355 | 840,379 |
| F5 Networks, Inc.(b) | 211 | 30,728 |
| | Shares | Value |
| Communications Equipment–(continued) |
| Juniper Networks, Inc. | 1,243 | $33,101 |
| Motorola Solutions, Inc. | 590 | 98,371 |
| | | | 1,051,387 |
| Computer & Electronics Retail–0.07% |
| Best Buy Co., Inc. | 843 | 58,782 |
| Construction & Engineering–0.06% |
| Jacobs Engineering Group, Inc. | 417 | 35,191 |
| Quanta Services, Inc. | 513 | 19,591 |
| | | | 54,782 |
| Construction Machinery & Heavy Trucks–0.57% |
| Caterpillar, Inc. | 2,054 | 279,940 |
| Cummins, Inc. | 515 | 88,240 |
| PACCAR, Inc. | 1,237 | 88,644 |
| Wabtec Corp. | 590 | 42,338 |
| | | | 499,162 |
| Construction Materials–0.13% |
| Martin Marietta Materials, Inc. | 225 | 51,775 |
| Vulcan Materials Co. | 469 | 64,398 |
| | | | 116,173 |
| Consumer Electronics–0.04% |
| Garmin Ltd. | 441 | 35,192 |
| Consumer Finance–0.71% |
| American Express Co. | 2,456 | 303,169 |
| Capital One Financial Corp. | 1,683 | 152,715 |
| Discover Financial Services | 1,171 | 90,858 |
| Synchrony Financial | 2,274 | 78,840 |
| | | | 625,582 |
| Copper–0.07% |
| Freeport-McMoRan, Inc. | 5,173 | 60,059 |
| Data Processing & Outsourced Services–3.90% |
| Alliance Data Systems Corp. | 165 | 23,121 |
| Automatic Data Processing, Inc. | 1,560 | 257,915 |
| Broadridge Financial Solutions, Inc. | 412 | 52,604 |
| Fidelity National Information Services, Inc. | 1,161 | 142,431 |
| Fiserv, Inc.(b) | 1,407 | 128,262 |
| FleetCor Technologies, Inc.(b) | 309 | 86,783 |
| Global Payments, Inc. | 561 | 89,833 |
| Jack Henry & Associates, Inc. | 274 | 36,694 |
| Mastercard, Inc., Class A | 3,222 | 852,316 |
| Paychex, Inc. | 1,151 | 94,716 |
| PayPal Holdings, Inc.(b) | 4,213 | 482,220 |
| Total System Services, Inc. | 580 | 74,397 |
| Visa, Inc., Class A | 6,237 | 1,082,431 |
| Western Union Co. (The) | 1,501 | 29,855 |
| | | | 3,433,578 |
See accompanying Notes to Financial Statements which are an integral part of the financial statements.
Invesco V.I. S&P 500 Index Fund
| | Shares | Value |
| Department Stores–0.07% |
| Kohl’s Corp. | 594 | $28,245 |
| Macy’s, Inc. | 1,132 | 24,293 |
| Nordstrom, Inc. | 381 | 12,138 |
| | | | 64,676 |
| Distillers & Vintners–0.17% |
| Brown-Forman Corp., Class B | 592 | 32,815 |
| Constellation Brands, Inc., Class A | 599 | 117,967 |
| | | | 150,782 |
| Distributors–0.10% |
| Genuine Parts Co. | 520 | 53,861 |
| LKQ Corp.(b) | 1,144 | 30,442 |
| | | | 84,303 |
| Diversified Banks–4.29% |
| Bank of America Corp. | 31,720 | 919,880 |
| Citigroup, Inc. | 8,294 | 580,829 |
| JPMorgan Chase & Co. | 11,636 | 1,300,905 |
| U.S. Bancorp | 5,371 | 281,440 |
| Wells Fargo & Co. | 14,509 | 686,566 |
| | | | 3,769,620 |
| Diversified Chemicals–0.04% |
| Eastman Chemical Co. | 498 | 38,759 |
| Diversified Support Services–0.14% |
| Cintas Corp. | 301 | 71,424 |
| Copart, Inc.(b) | 728 | 54,411 |
| | | | 125,835 |
| Drug Retail–0.17% |
| Walgreens Boots Alliance, Inc. | 2,787 | 152,365 |
| Electric Utilities–1.98% |
| Alliant Energy Corp. | 841 | 41,276 |
| American Electric Power Co., Inc. | 1,760 | 154,898 |
| Duke Energy Corp. | 2,611 | 230,395 |
| Edison International | 1,162 | 78,330 |
| Entergy Corp. | 675 | 69,478 |
| Evergy, Inc. | 875 | 52,631 |
| Eversource Energy | 1,141 | 86,442 |
| Exelon Corp. | 3,482 | 166,927 |
| FirstEnergy Corp. | 1,797 | 76,930 |
| NextEra Energy, Inc. | 1,717 | 351,745 |
| Pinnacle West Capital Corp. | 405 | 38,106 |
| PPL Corp. | 2,596 | 80,502 |
| Southern Co. (The) | 3,733 | 206,360 |
| Xcel Energy, Inc. | 1,852 | 110,176 |
| | | | 1,744,196 |
| Electrical Components & Equipment–0.47% |
| AMETEK, Inc. | 810 | 73,580 |
| Eaton Corp. PLC | 1,511 | 125,836 |
| Emerson Electric Co. | 2,193 | 146,317 |
| | Shares | Value |
| Electrical Components & Equipment–(continued) |
| Rockwell Automation, Inc. | 425 | $69,628 |
| | | | 415,361 |
| Electronic Components–0.22% |
| Amphenol Corp., Class A | 1,063 | 101,984 |
| Corning, Inc. | 2,808 | 93,310 |
| | | | 195,294 |
| Electronic Equipment & Instruments–0.10% |
| FLIR Systems, Inc. | 482 | 26,076 |
| Keysight Technologies, Inc.(b) | 669 | 60,083 |
| | | | 86,159 |
| Electronic Manufacturing Services–0.15% |
| IPG Photonics Corp.(b) | 131 | 20,207 |
| TE Connectivity Ltd. | 1,208 | 115,702 |
| | | | 135,909 |
| Environmental & Facilities Services–0.28% |
| Republic Services, Inc. | 768 | 66,540 |
| Rollins, Inc. | 537 | 19,262 |
| Waste Management, Inc. | 1,400 | 161,518 |
| | | | 247,320 |
| Fertilizers & Agricultural Chemicals–0.22% |
| CF Industries Holdings, Inc. | 809 | 37,788 |
| Corteva, Inc.(b) | 2,682 | 79,307 |
| FMC Corp. | 479 | 39,733 |
| Mosaic Co. (The) | 1,296 | 32,439 |
| | | | 189,267 |
| Financial Exchanges & Data–1.07% |
| Cboe Global Markets, Inc. | 403 | 41,763 |
| CME Group, Inc. | 1,283 | 249,043 |
| Intercontinental Exchange, Inc. | 2,028 | 174,286 |
| MarketAxess Holdings, Inc. | 135 | 43,392 |
| Moody’s Corp. | 592 | 115,624 |
| MSCI, Inc. | 300 | 71,637 |
| Nasdaq, Inc. | 420 | 40,391 |
| S&P Global, Inc. | 886 | 201,822 |
| | | | 937,958 |
| Food Distributors–0.14% |
| Sysco Corp. | 1,685 | 119,163 |
| Food Retail–0.07% |
| Kroger Co. (The) | 2,876 | 62,438 |
| Footwear–0.43% |
| NIKE, Inc., Class B | 4,508 | 378,447 |
| Gas Utilities–0.05% |
| Atmos Energy Corp. | 416 | 43,913 |
| General Merchandise Stores–0.43% |
| Dollar General Corp. | 926 | 125,158 |
See accompanying Notes to Financial Statements which are an integral part of the financial statements.
Invesco V.I. S&P 500 Index Fund
| | Shares | Value |
| General Merchandise Stores–(continued) |
| Dollar Tree, Inc.(b) | 857 | $92,033 |
| Target Corp. | 1,837 | 159,103 |
| | | | 376,294 |
| Gold–0.13% |
| Newmont Goldcorp Corp. | 2,916 | 112,179 |
| Health Care Distributors–0.26% |
| AmerisourceBergen Corp. | 556 | 47,405 |
| Cardinal Health, Inc. | 1,073 | 50,538 |
| Henry Schein, Inc.(b) | 534 | 37,327 |
| McKesson Corp. | 683 | 91,788 |
| | | | 227,058 |
| Health Care Equipment–3.33% |
| Abbott Laboratories | 6,327 | 532,101 |
| ABIOMED, Inc.(b) | 163 | 42,460 |
| Baxter International, Inc. | 1,700 | 139,230 |
| Becton, Dickinson and Co. | 967 | 243,694 |
| Boston Scientific Corp.(b) | 4,988 | 214,384 |
| Danaher Corp. | 2,260 | 322,999 |
| Edwards Lifesciences Corp.(b) | 747 | 138,001 |
| Hologic, Inc.(b) | 970 | 46,579 |
| IDEXX Laboratories, Inc.(b) | 306 | 84,251 |
| Intuitive Surgical, Inc.(b) | 413 | 216,639 |
| Medtronic PLC | 4,809 | 468,348 |
| ResMed, Inc. | 517 | 63,089 |
| Stryker Corp. | 1,110 | 228,194 |
| Teleflex, Inc. | 167 | 55,302 |
| Varian Medical Systems, Inc.(b) | 327 | 44,515 |
| Zimmer Biomet Holdings, Inc. | 728 | 85,715 |
| | | | 2,925,501 |
| Health Care Facilities–0.19% |
| HCA Healthcare, Inc. | 952 | 128,682 |
| Universal Health Services, Inc., Class B | 297 | 38,726 |
| | | | 167,408 |
| Health Care REITs–0.30% |
| HCP, Inc. | 1,720 | 55,006 |
| Ventas, Inc. | 1,324 | 90,495 |
| Welltower, Inc. | 1,451 | 118,300 |
| | | | 263,801 |
| Health Care Services–0.69% |
| Cigna Corp. | 1,356 | 213,638 |
| CVS Health Corp. | 4,660 | 253,924 |
| DaVita, Inc.(b) | 463 | 26,048 |
| Laboratory Corp. of America Holdings(b) | 351 | 60,688 |
| Quest Diagnostics, Inc. | 478 | 48,665 |
| | | | 602,963 |
| Health Care Supplies–0.20% |
| Align Technology, Inc.(b) | 261 | 71,436 |
| Cooper Cos., Inc. (The) | 177 | 59,629 |
| | Shares | Value |
| Health Care Supplies–(continued) |
| DENTSPLY SIRONA, Inc. | 838 | $48,906 |
| | | | 179,971 |
| Health Care Technology–0.10% |
| Cerner Corp. | 1,157 | 84,808 |
| Home Furnishings–0.06% |
| Leggett & Platt, Inc. | 476 | 18,264 |
| Mohawk Industries, Inc.(b) | 226 | 33,328 |
| | | | 51,592 |
| Home Improvement Retail–1.26% |
| Home Depot, Inc. (The) | 3,946 | 820,650 |
| Lowe’s Cos., Inc. | 2,808 | 283,355 |
| | | | 1,104,005 |
| Homebuilding–0.15% |
| D.R. Horton, Inc. | 1,212 | 52,273 |
| Lennar Corp., Class A | 1,037 | 50,253 |
| PulteGroup, Inc. | 909 | 28,743 |
| | | | 131,269 |
| Hotel & Resort REITs–0.05% |
| Host Hotels & Resorts, Inc. | 2,615 | 47,645 |
| Hotels, Resorts & Cruise Lines–0.48% |
| Carnival Corp. | 1,442 | 67,125 |
| Hilton Worldwide Holdings, Inc. | 1,044 | 102,041 |
| Marriott International, Inc., Class A | 990 | 138,887 |
| Norwegian Cruise Line Holdings Ltd.(b) | 772 | 41,402 |
| Royal Caribbean Cruises Ltd. | 611 | 74,059 |
| | | | 423,514 |
| Household Appliances–0.04% |
| Whirlpool Corp. | 229 | 32,600 |
| Household Products–1.71% |
| Church & Dwight Co., Inc. | 886 | 64,731 |
| Clorox Co. (The) | 456 | 69,818 |
| Colgate-Palmolive Co. | 3,075 | 220,385 |
| Kimberly-Clark Corp. | 1,228 | 163,668 |
| Procter & Gamble Co. (The) | 8,997 | 986,521 |
| | | | 1,505,123 |
| Housewares & Specialties–0.02% |
| Newell Brands, Inc. | 1,411 | 21,758 |
| Human Resource & Employment Services–0.03% |
| Robert Half International, Inc. | 437 | 24,913 |
| Hypermarkets & Super Centers–1.10% |
| Costco Wholesale Corp. | 1,576 | 416,474 |
| Walmart, Inc. | 5,017 | 554,328 |
| | | | 970,802 |
| Independent Power Producers & Energy Traders–0.08% |
| AES Corp. (The) | 2,340 | 39,218 |
See accompanying Notes to Financial Statements which are an integral part of the financial statements.
Invesco V.I. S&P 500 Index Fund
| | Shares | Value |
| Independent Power Producers & Energy Traders–(continued) |
| NRG Energy, Inc. | 957 | $33,610 |
| | | | 72,828 |
| Industrial Conglomerates–1.45% |
| 3M Co. | 2,066 | 358,120 |
| General Electric Co.(d) | 31,282 | 328,461 |
| Honeywell International, Inc. | 2,610 | 455,680 |
| Roper Technologies, Inc. | 372 | 136,249 |
| | | | 1,278,510 |
| Industrial Gases–0.65% |
| Air Products and Chemicals, Inc. | 789 | 178,606 |
| Linde PLC (United Kingdom) | 1,946 | 390,757 |
| | | | 569,363 |
| Industrial Machinery–0.80% |
| Dover Corp. | 526 | 52,705 |
| Flowserve Corp. | 474 | 24,975 |
| Fortive Corp. | 1,058 | 86,248 |
| Illinois Tool Works, Inc. | 1,076 | 162,272 |
| Ingersoll-Rand PLC | 863 | 109,316 |
| Parker-Hannifin Corp. | 460 | 78,205 |
| Pentair PLC | 574 | 21,353 |
| Snap-on, Inc. | 197 | 32,631 |
| Stanley Black & Decker, Inc. | 543 | 78,523 |
| Xylem, Inc. | 640 | 53,530 |
| | | | 699,758 |
| Industrial REITs–0.25% |
| Duke Realty Corp. | 1,281 | 40,493 |
| Prologis, Inc. | 2,262 | 181,186 |
| | | | 221,679 |
| Insurance Brokers–0.56% |
| Aon PLC | 862 | 166,349 |
| Arthur J. Gallagher & Co. | 661 | 57,897 |
| Marsh & McLennan Cos., Inc. | 1,833 | 182,841 |
| Willis Towers Watson PLC | 459 | 87,917 |
| | | | 495,004 |
| Integrated Oil & Gas–2.44% |
| Chevron Corp. | 6,833 | 850,299 |
| Exxon Mobil Corp. | 15,177 | 1,163,013 |
| Occidental Petroleum Corp. | 2,675 | 134,499 |
| | | | 2,147,811 |
| Integrated Telecommunication Services–1.96% |
| AT&T, Inc. | 26,178 | 877,225 |
| Verizon Communications, Inc. | 14,851 | 848,437 |
| | | | 1,725,662 |
| Interactive Home Entertainment–0.32% |
| Activision Blizzard, Inc. | 2,747 | 129,658 |
| Electronic Arts, Inc.(b) | 1,068 | 108,146 |
| | Shares | Value |
| Interactive Home Entertainment–(continued) |
| Take-Two Interactive Software, Inc.(b) | 403 | $45,753 |
| | | | 283,557 |
| Interactive Media & Services–4.68% |
| Alphabet, Inc., Class A(b) | 1,073 | 1,161,845 |
| Alphabet, Inc., Class C(b) | 1,098 | 1,186,839 |
| Facebook, Inc., Class A(b) | 8,617 | 1,663,081 |
| TripAdvisor, Inc.(b) | 373 | 17,266 |
| Twitter, Inc.(b) | 2,600 | 90,740 |
| | | | 4,119,771 |
| Internet & Direct Marketing Retail–3.72% |
| Amazon.com, Inc.(b) | 1,482 | 2,806,359 |
| Booking Holdings, Inc.(b) | 155 | 290,580 |
| eBay, Inc. | 2,938 | 116,051 |
| Expedia Group, Inc. | 424 | 56,405 |
| | | | 3,269,395 |
| Internet Services & Infrastructure–0.14% |
| Akamai Technologies, Inc.(b) | 581 | 46,561 |
| VeriSign, Inc.(b) | 375 | 78,435 |
| | | | 124,996 |
| Investment Banking & Brokerage–0.80% |
| Charles Schwab Corp. (The) | 4,261 | 171,249 |
| E*TRADE Financial Corp. | 894 | 39,872 |
| Goldman Sachs Group, Inc. (The) | 1,221 | 249,817 |
| Morgan Stanley | 4,586 | 200,913 |
| Raymond James Financial, Inc. | 452 | 38,217 |
| | | | 700,068 |
| IT Consulting & Other Services–1.24% |
| Accenture PLC, Class A | 2,288 | 422,754 |
| Cognizant Technology Solutions Corp., Class A | 2,052 | 130,076 |
| DXC Technology Co. | 956 | 52,723 |
| Gartner, Inc.(b) | 319 | 51,340 |
| International Business Machines Corp. | 3,175 | 437,833 |
| | | | 1,094,726 |
| Leisure Products–0.05% |
| Hasbro, Inc. | 412 | 43,540 |
| Life & Health Insurance–0.71% |
| Aflac, Inc. | 2,678 | 146,781 |
| Lincoln National Corp. | 725 | 46,726 |
| MetLife, Inc. | 3,417 | 169,722 |
| Principal Financial Group, Inc. | 939 | 54,387 |
| Prudential Financial, Inc. | 1,459 | 147,359 |
| Torchmark Corp. | 369 | 33,011 |
| Unum Group | 765 | 25,666 |
| | | | 623,652 |
| Life Sciences Tools & Services–1.09% |
| Agilent Technologies, Inc. | 1,133 | 84,601 |
| Illumina, Inc.(b) | 527 | 194,015 |
See accompanying Notes to Financial Statements which are an integral part of the financial statements.
Invesco V.I. S&P 500 Index Fund
| | Shares | Value |
| Life Sciences Tools & Services–(continued) |
| IQVIA Holdings, Inc.(b) | 570 | $91,713 |
| Mettler-Toledo International, Inc.(b) | 87 | 73,080 |
| PerkinElmer, Inc. | 400 | 38,536 |
| Thermo Fisher Scientific, Inc. | 1,436 | 421,724 |
| Waters Corp.(b) | 249 | 53,595 |
| | | | 957,264 |
| Managed Health Care–1.53% |
| Anthem, Inc. | 922 | 260,198 |
| Centene Corp.(b) | 1,474 | 77,296 |
| Humana, Inc. | 483 | 128,140 |
| UnitedHealth Group, Inc. | 3,408 | 831,586 |
| WellCare Health Plans, Inc.(b) | 180 | 51,313 |
| | | | 1,348,533 |
| Metal & Glass Containers–0.10% |
| Ball Corp. | 1,192 | 83,428 |
| Motorcycle Manufacturers–0.02% |
| Harley-Davidson, Inc. | 579 | 20,746 |
| Movies & Entertainment–1.69% |
| Netflix, Inc.(b) | 1,567 | 575,590 |
| Viacom, Inc., Class B | 1,273 | 38,025 |
| Walt Disney Co. (The) | 6,261 | 874,286 |
| | | | 1,487,901 |
| Multi-line Insurance–0.30% |
| American International Group, Inc. | 3,103 | 165,328 |
| Assurant, Inc. | 219 | 23,297 |
| Hartford Financial Services Group, Inc. (The) | 1,300 | 72,436 |
| | | | 261,061 |
| Multi-Sector Holdings–1.70% |
| Berkshire Hathaway, Inc., Class B(b) | 6,951 | 1,481,745 |
| Jefferies Financial Group, Inc. | 935 | 17,980 |
| | | | 1,499,725 |
| Multi-Utilities–1.09% |
| Ameren Corp. | 879 | 66,022 |
| CenterPoint Energy, Inc. | 1,806 | 51,706 |
| CMS Energy Corp. | 1,025 | 59,358 |
| Consolidated Edison, Inc. | 1,172 | 102,761 |
| Dominion Energy, Inc. | 2,877 | 222,450 |
| DTE Energy Co. | 655 | 83,761 |
| NiSource, Inc. | 1,352 | 38,938 |
| Public Service Enterprise Group, Inc. | 1,803 | 106,052 |
| Sempra Energy | 983 | 135,103 |
| WEC Energy Group, Inc. | 1,136 | 94,708 |
| | | | 960,859 |
| Office REITs–0.22% |
| Alexandria Real Estate Equities, Inc. | 401 | 56,577 |
| Boston Properties, Inc. | 555 | 71,595 |
| SL Green Realty Corp. | 306 | 24,593 |
| | Shares | Value |
| Office REITs–(continued) |
| Vornado Realty Trust | 627 | $40,191 |
| | | | 192,956 |
| Oil & Gas Drilling–0.02% |
| Helmerich & Payne, Inc. | 405 | 20,501 |
| Oil & Gas Equipment & Services–0.44% |
| Baker Hughes, a GE Co., Class A | 1,850 | 45,566 |
| Halliburton Co. | 3,114 | 70,812 |
| National Oilwell Varco, Inc. | 1,387 | 30,833 |
| Schlumberger Ltd. | 4,968 | 197,428 |
| TechnipFMC PLC (United Kingdom) | 1,518 | 39,377 |
| | | | 384,016 |
| Oil & Gas Exploration & Production–1.22% |
| Anadarko Petroleum Corp. | 1,800 | 127,008 |
| Apache Corp. | 1,339 | 38,791 |
| Cabot Oil & Gas Corp. | 1,536 | 35,266 |
| Cimarex Energy Co. | 368 | 21,833 |
| Concho Resources, Inc. | 721 | 74,393 |
| ConocoPhillips | 4,049 | 246,989 |
| Devon Energy Corp. | 1,479 | 42,181 |
| Diamondback Energy, Inc. | 555 | 60,478 |
| EOG Resources, Inc. | 2,080 | 193,773 |
| Hess Corp. | 907 | 57,658 |
| Marathon Oil Corp. | 2,918 | 41,465 |
| Noble Energy, Inc. | 1,729 | 38,730 |
| Pioneer Natural Resources Co. | 600 | 92,316 |
| | | | 1,070,881 |
| Oil & Gas Refining & Marketing–0.49% |
| HollyFrontier Corp. | 570 | 26,379 |
| Marathon Petroleum Corp. | 2,376 | 132,771 |
| Phillips 66 | 1,496 | 139,936 |
| Valero Energy Corp. | 1,490 | 127,559 |
| | | | 426,645 |
| Oil & Gas Storage & Transportation–0.42% |
| Kinder Morgan, Inc. | 6,949 | 145,095 |
| ONEOK, Inc. | 1,482 | 101,976 |
| Williams Cos., Inc. (The) | 4,345 | 121,834 |
| | | | 368,905 |
| Packaged Foods & Meats–1.05% |
| Campbell Soup Co. | 686 | 27,488 |
| Conagra Brands, Inc. | 1,732 | 45,933 |
| General Mills, Inc. | 2,147 | 112,760 |
| Hershey Co. (The) | 495 | 66,345 |
| Hormel Foods Corp. | 972 | 39,405 |
| JM Smucker Co. (The) | 409 | 47,113 |
| Kellogg Co. | 895 | 47,945 |
| Kraft Heinz Co. (The) | 2,241 | 69,561 |
| Lamb Weston Holdings, Inc. | 533 | 33,771 |
| McCormick & Co., Inc. | 436 | 67,584 |
See accompanying Notes to Financial Statements which are an integral part of the financial statements.
Invesco V.I. S&P 500 Index Fund
| | Shares | Value |
| Packaged Foods & Meats–(continued) |
| Mondelez International, Inc., Class A | 5,166 | $278,447 |
| Tyson Foods, Inc., Class A | 1,063 | 85,827 |
| | | | 922,179 |
| Paper Packaging–0.29% |
| Amcor PLC (United Kingdom)(b) | 5,802 | 66,665 |
| Avery Dennison Corp. | 304 | 35,167 |
| International Paper Co. | 1,428 | 61,861 |
| Packaging Corp. of America | 336 | 32,027 |
| Sealed Air Corp. | 564 | 24,128 |
| Westrock Co. | 931 | 33,954 |
| | | | 253,802 |
| Personal Products–0.18% |
| Coty, Inc., Class A | 1,077 | 14,432 |
| Estee Lauder Cos., Inc. (The), Class A | 786 | 143,924 |
| | | | 158,356 |
| Pharmaceuticals–4.58% |
| Allergan PLC | 1,104 | 184,843 |
| Bristol-Myers Squibb Co. | 5,867 | 266,068 |
| Eli Lilly and Co. | 3,099 | 343,338 |
| Johnson & Johnson | 9,524 | 1,326,503 |
| Merck & Co., Inc. | 9,235 | 774,355 |
| Mylan N.V.(b) | 1,872 | 35,643 |
| Nektar Therapeutics(b) | 629 | 22,380 |
| Perrigo Co. PLC | 445 | 21,191 |
| Pfizer, Inc. | 19,927 | 863,237 |
| Zoetis, Inc. | 1,716 | 194,749 |
| | | | 4,032,307 |
| Property & Casualty Insurance–0.89% |
| Allstate Corp. (The) | 1,194 | 121,418 |
| Chubb Ltd. | 1,641 | 241,703 |
| Cincinnati Financial Corp. | 540 | 55,982 |
| Loews Corp. | 962 | 52,593 |
| Progressive Corp. (The) | 2,093 | 167,293 |
| Travelers Cos., Inc. (The) | 939 | 140,399 |
| | | | 779,388 |
| Publishing–0.03% |
| News Corp., Class A | 1,400 | 18,886 |
| News Corp., Class B | 442 | 6,170 |
| | | | 25,056 |
| Railroads–1.00% |
| CSX Corp. | 2,765 | 213,928 |
| Kansas City Southern | 365 | 44,464 |
| Norfolk Southern Corp. | 953 | 189,962 |
| Union Pacific Corp. | 2,539 | 429,370 |
| | | | 877,724 |
| Real Estate Services–0.07% |
| CBRE Group, Inc., Class A(b) | 1,114 | 57,148 |
| | Shares | Value |
| Regional Banks–1.18% |
| BB&T Corp. | 2,747 | $134,960 |
| Citizens Financial Group, Inc. | 1,642 | 58,061 |
| Comerica, Inc. | 552 | 40,097 |
| Fifth Third Bancorp | 2,608 | 72,763 |
| First Republic Bank | 587 | 57,321 |
| Huntington Bancshares, Inc. | 3,782 | 52,267 |
| KeyCorp | 3,616 | 64,184 |
| M&T Bank Corp. | 493 | 83,845 |
| People’s United Financial, Inc. | 1,385 | 23,240 |
| PNC Financial Services Group, Inc. (The) | 1,618 | 222,119 |
| Regions Financial Corp. | 3,595 | 53,709 |
| SunTrust Banks, Inc. | 1,581 | 99,366 |
| SVB Financial Group(b) | 186 | 41,774 |
| Zions Bancorp. N.A. | 654 | 30,071 |
| | | | 1,033,777 |
| Reinsurance–0.04% |
| Everest Re Group, Ltd. | 147 | 36,335 |
| Research & Consulting Services–0.29% |
| Equifax, Inc. | 436 | 58,965 |
| IHS Markit Ltd.(b) | 1,296 | 82,581 |
| Nielsen Holdings PLC | 1,300 | 29,380 |
| Verisk Analytics, Inc. | 582 | 85,240 |
| | | | 256,166 |
| Residential REITs–0.44% |
| Apartment Investment & Management Co., Class A | 533 | 26,714 |
| AvalonBay Communities, Inc. | 499 | 101,387 |
| Equity Residential | 1,319 | 100,138 |
| Essex Property Trust, Inc. | 237 | 69,187 |
| Mid-America Apartment Communities, Inc. | 409 | 48,164 |
| UDR, Inc. | 1,010 | 45,339 |
| | | | 390,929 |
| Restaurants–1.33% |
| Chipotle Mexican Grill, Inc.(b) | 87 | 63,761 |
| Darden Restaurants, Inc. | 446 | 54,292 |
| McDonald’s Corp. | 2,738 | 568,573 |
| Starbucks Corp. | 4,339 | 363,738 |
| Yum! Brands, Inc. | 1,093 | 120,962 |
| | | | 1,171,326 |
| Retail REITs–0.42% |
| Federal Realty Investment Trust | 272 | 35,023 |
| Kimco Realty Corp. | 1,513 | 27,960 |
| Macerich Co. (The) | 393 | 13,162 |
| Realty Income Corp. | 1,128 | 77,798 |
| Regency Centers Corp. | 597 | 39,844 |
| Simon Property Group, Inc. | 1,107 | 176,854 |
| | | | 370,641 |
| Semiconductor Equipment–0.36% |
| Applied Materials, Inc. | 3,357 | 150,763 |
See accompanying Notes to Financial Statements which are an integral part of the financial statements.
Invesco V.I. S&P 500 Index Fund
| | Shares | Value |
| Semiconductor Equipment–(continued) |
| KLA-Tencor Corp. | 579 | $68,438 |
| Lam Research Corp. | 537 | 100,870 |
| | | | 320,071 |
| Semiconductors–3.37% |
| Advanced Micro Devices, Inc.(b) | 3,176 | 96,455 |
| Analog Devices, Inc. | 1,325 | 149,553 |
| Broadcom, Inc. | 1,419 | 408,473 |
| Intel Corp. | 16,054 | 768,505 |
| Maxim Integrated Products, Inc. | 975 | 58,325 |
| Microchip Technology, Inc. | 851 | 73,782 |
| Micron Technology, Inc.(b) | 3,969 | 153,164 |
| NVIDIA Corp. | 2,183 | 358,514 |
| Qorvo, Inc.(b) | 427 | 28,443 |
| QUALCOMM, Inc. | 4,360 | 331,665 |
| Skyworks Solutions, Inc. | 620 | 47,907 |
| Texas Instruments, Inc. | 3,365 | 386,167 |
| Xilinx, Inc. | 910 | 107,307 |
| | | | 2,968,260 |
| Soft Drinks–1.65% |
| Coca-Cola Co. (The) | 13,772 | 701,270 |
| Monster Beverage Corp.(b) | 1,395 | 89,043 |
| PepsiCo, Inc. | 5,028 | 659,322 |
| | | | 1,449,635 |
| Specialized Consumer Services–0.03% |
| H&R Block, Inc. | 750 | 21,975 |
| Specialized REITs–1.28% |
| American Tower Corp. | 1,584 | 323,849 |
| Crown Castle International Corp. | 1,490 | 194,222 |
| Digital Realty Trust, Inc. | 741 | 87,282 |
| Equinix, Inc. | 301 | 151,791 |
| Extra Space Storage, Inc. | 453 | 48,063 |
| Iron Mountain, Inc. | 1,050 | 32,865 |
| Public Storage | 538 | 128,136 |
| SBA Communications Corp.(b) | 406 | 91,285 |
| Weyerhaeuser Co. | 2,664 | 70,170 |
| | | | 1,127,663 |
| Specialty Chemicals–0.84% |
| Albemarle Corp. | 381 | 26,826 |
| Celanese Corp. | 453 | 48,833 |
| DuPont de Nemours, Inc. | 2,682 | 201,338 |
| Ecolab, Inc. | 909 | 179,473 |
| International Flavors & Fragrances, Inc. | 360 | 52,233 |
| PPG Industries, Inc. | 841 | 98,153 |
| Sherwin-Williams Co. (The) | 290 | 132,904 |
| | | | 739,760 |
| Specialty Stores–0.17% |
| Tiffany & Co. | 386 | 36,145 |
| Tractor Supply Co. | 432 | 47,002 |
| | Shares | Value |
| Specialty Stores–(continued) |
| Ulta Beauty, Inc.(b) | 199 | $69,031 |
| | | | 152,178 |
| Steel–0.07% |
| Nucor Corp. | 1,089 | 60,004 |
| Systems Software–4.99% |
| Fortinet, Inc.(b) | 525 | 40,336 |
| Microsoft Corp. | 27,489 | 3,682,427 |
| Oracle Corp. | 8,703 | 495,810 |
| Red Hat, Inc.(b) | 637 | 119,603 |
| Symantec Corp. | 2,215 | 48,198 |
| | | | 4,386,374 |
| Technology Hardware, Storage & Peripherals–3.93% |
| Apple, Inc. | 15,678 | 3,102,990 |
| Hewlett Packard Enterprise Co. | 4,798 | 71,730 |
| HP, Inc. | 5,366 | 111,559 |
| NetApp, Inc. | 880 | 54,296 |
| Seagate Technology PLC | 914 | 43,068 |
| Western Digital Corp. | 1,042 | 49,547 |
| Xerox Corp. | 725 | 25,672 |
| | | | 3,458,862 |
| Tobacco–0.86% |
| Altria Group, Inc. | 6,710 | 317,719 |
| Philip Morris International, Inc. | 5,580 | 438,197 |
| | | | 755,916 |
| Trading Companies & Distributors–0.17% |
| Fastenal Co. | 2,040 | 66,484 |
| United Rentals, Inc.(b) | 283 | 37,534 |
| W.W. Grainger, Inc. | 163 | 43,721 |
| | | | 147,739 |
| Trucking–0.03% |
| J.B. Hunt Transport Services, Inc. | 318 | 29,068 |
| Water Utilities–0.09% |
| American Water Works Co., Inc. | 644 | 74,704 |
| Total Common Stocks & Other Equity Interests (Cost $25,765,987) | 87,616,819 |
| Money Market Funds–0.46% |
| Invesco Government & Agency Portfolio, Institutional Class, 2.26%(e) | 138,378 | 138,377 |
| Invesco Liquid Assets Portfolio, Institutional Class, 2.40%(e) | 98,832 | 98,872 |
| Invesco Treasury Portfolio, Institutional Class, 2.22%(e) | 171,560 | 171,560 |
| Total Money Market Funds (Cost $408,792) | 408,809 |
| TOTAL INVESTMENTS IN SECURITIES–100.06% (Cost $26,174,779) | 88,025,628 |
| OTHER ASSETS LESS LIABILITIES–(0.06)% | (52,425) |
| NET ASSETS–100.00% | $87,973,203 |
See accompanying Notes to Financial Statements which are an integral part of the financial statements.
Invesco V.I. S&P 500 Index Fund
Investment Abbreviations:
| REIT | – Real Estate Investment Trust |
Notes to Schedule of Investments:
| (a) | Industry and/or sector classifications used in this report are generally according to the Global Industry Classification Standard, which was developed by and is the exclusive property and a service mark of MSCI Inc. and Standard & Poor’s. |
| (b) | Non-income producing security. |
| (c) | The Fund’s Adviser is a subsidiary of Invesco Ltd. and therefore, Invesco Ltd. is considered to be affiliated with the Fund. The value of this security as of June 30, 2019 represented less than 1% of the Fund’s Net Assets. See Note 5. |
| (d) | All or a portion of the value was pledged as collateral to cover margin requirements for open futures contracts. See Note 1J. |
| (e) | The money market fund and the Fund are affiliated by having the same investment adviser. The rate shown is the 7-day SEC standardized yield as of June 30, 2019. |
| Open Futures Contracts |
| Long Futures Contracts | Number of
Contracts | Expiration
Month | Notional
Value | Value | Unrealized
Appreciation |
| Equity Risk |
| E-Mini S&P 500 Index | 2 | September-2019 | $294,420 | $1,901 | $1,901 |
Portfolio Composition
By sector, based on Net Assets
as of June 30, 2019
| Information Technology | 21.37% |
| Health Care | 14.14 |
| Financials | 13.08 |
| Consumer Discretionary | 10.16 |
| Communication Services | 10.14 |
| Industrials | 9.33 |
| Consumer Staples | 7.23 |
| Energy | 5.03 |
| Utilities | 3.29 |
| Real Estate | 3.03 |
| Materials | 2.80 |
| Money Market Funds Plus Other Assets Less Liabilities | 0.40 |
See accompanying Notes to Financial Statements which are an integral part of the financial statements.
Invesco V.I. S&P 500 Index Fund
Statement of Assets and Liabilities
June 30, 2019
(Unaudited)
| Assets: | |
Investments in securities, at value
(Cost $25,732,321) | $87,587,786 |
Investments in affiliates, at value
(Cost $442,458) | 437,842 |
| Other investments: | |
| Variation margin receivable — futures contracts | 1,710 |
| Cash | 749 |
| Receivable for: | |
| Fund shares sold | 37,989 |
| Dividends | 73,245 |
| Investment for trustee deferred compensation and retirement plans | 37,496 |
| Total assets | 88,176,817 |
| Liabilities: | |
| Payable for: | |
| Investments purchased | 43,391 |
| Fund shares reacquired | 8,126 |
| Accrued fees to affiliates | 65,282 |
| Accrued trustees’ and officers’ fees and benefits | 415 |
| Accrued other operating expenses | 42,555 |
| Trustee deferred compensation and retirement plans | 43,845 |
| Total liabilities | 203,614 |
| Net assets applicable to shares outstanding | $87,973,203 |
| Net assets consist of: | |
| Shares of beneficial interest | $16,342,341 |
| Distributable earnings | 71,630,862 |
| | $87,973,203 |
| Net Assets: |
| Series I | $37,584,292 |
| Series II | $50,388,911 |
| Shares outstanding, no par value, with an unlimited number of shares authorized: |
| Series I | 1,970,480 |
| Series II | 2,661,327 |
| Series I: | |
| Net asset value per share | $19.07 |
| Series II: | |
| Net asset value per share | $18.93 |
Statement of Operations
For the six months ended June 30, 2019
(Unaudited)
| Investment income: | |
| Dividends | $861,046 |
| Dividends from affiliated money market funds (includes securities lending income of $24) | 9,781 |
| Total investment income | 870,827 |
| Expenses: | |
| Advisory fees | 50,966 |
| Administrative services fees | 69,676 |
| Custodian fees | 3,876 |
| Distribution fees - Series II | 61,401 |
| Transfer agent fees | 1,866 |
| Trustees’ and officers’ fees and benefits | 12,073 |
| Licensing fees | 8,494 |
| Reports to shareholders | 7,298 |
| Professional services fees | 16,801 |
| Other | 14,979 |
| Total expenses | 247,430 |
| Less: Fees waived | (560) |
| Net expenses | 246,870 |
| Net investment income | 623,957 |
| Realized and unrealized gain from: | |
| Net realized gain from: | |
| Investment securities | 1,852,699 |
| Futures contracts | 98,472 |
| | 1,951,171 |
| Change in net unrealized appreciation of: | |
| Investment securities | 11,441,218 |
| Futures contracts | 66,927 |
| | 11,508,145 |
| Net realized and unrealized gain | 13,459,316 |
| Net increase in net assets resulting from operations | $14,083,273 |
See accompanying Notes to Financial Statements which are an integral part of the financial statements.
Invesco V.I. S&P 500 Index Fund
Statement of Changes in Net Assets
For the six months ended June 30, 2019 and the year ended December 31, 2018
(Unaudited)
| | June 30,
2019 | December 31,
2018 |
| Operations: | | |
| Net investment income | $623,957 | $1,125,215 |
| Net realized gain | 1,951,171 | 8,831,060 |
| Change in net unrealized appreciation (depreciation) | 11,508,145 | (13,888,492) |
| Net increase (decrease) in net assets resulting from operations | 14,083,273 | (3,932,217) |
| Distributions to shareholders from distributable earnings: | | |
| Series I | — | (3,325,539) |
| Series II | — | (4,552,548) |
| Total distributions from distributable earnings | — | (7,878,087) |
| Share transactions–net: | | |
| Series I | (2,233,366) | 268,373 |
| Series II | (2,737,189) | (3,137,670) |
| Net increase (decrease) in net assets resulting from share transactions | (4,970,555) | (2,869,297) |
| Net increase (decrease) in net assets | 9,112,718 | (14,679,601) |
| Net assets: | | |
| Beginning of period | 78,860,485 | 93,540,086 |
| End of period | $87,973,203 | $78,860,485 |
See accompanying Notes to Financial Statements which are an integral part of the financial statements.
Invesco V.I. S&P 500 Index Fund
Financial Highlights
June 30, 2019
(Unaudited)
The following schedule presents financial highlights for a share of the Fund outstanding throughout the periods indicated.
| | Net asset
value,
beginning
of period | Net
investment
income(a) | Net gains
(losses)
on securities
(both
realized and
unrealized) | Total from
investment
operations | Dividends
from net
investment
income | Distributions
from net
realized
gains | Total
distributions | Net asset
value, end
of period | Total
return(b) | Net assets,
end of period
(000’s omitted) | Ratio of
expenses
to average
net assets
with fee waivers
and/or expenses
absorbed | Ratio of
expenses
to average net
assets without
fee waivers
and/or expenses
absorbed | Ratio of net
investment
income
to average
net assets | Portfolio
turnover(c) |
| Series I |
| Six months ended 06/30/19 | $16.12 | $0.14 | $2.81 | $2.95 | $— | $— | $— | $19.07 | 18.30% | $37,584 | 0.44%(d) | 0.44%(d) | 1.61%(d) | 1% |
| Year ended 12/31/18 | 18.53 | 0.26 | (0.91) | (0.65) | (0.30) | (1.46) | (1.76) | 16.12 | (4.86) | 33,758 | 0.51 | 0.51 | 1.41 | 3 |
| Year ended 12/31/17 | 16.78 | 0.26 | 3.18 | 3.44 | (0.31) | (1.38) | (1.69) | 18.53 | 21.26 | 38,450 | 0.48 | 0.48 | 1.46 | 3 |
| Year ended 12/31/16 | 16.58 | 0.30 | 1.55 | 1.85 | (0.31) | (1.34) | (1.65) | 16.78 | 11.45 | 34,812 | 0.41 | 0.41 | 1.81 | 4 |
| Year ended 12/31/15 | 18.52 | 0.30 | (0.24) | 0.06 | (0.33) | (1.67) | (2.00) | 16.58 | 1.03 | 35,586 | 0.41 | 0.41 | 1.66 | 7 |
| Year ended 12/31/14 | 16.66 | 0.28 | 1.92 | 2.20 | (0.34) | — | (0.34) | 18.52 | 13.32 | 37,685 | 0.41 | 0.41 | 1.62 | 3 |
| Series II |
| Six months ended 06/30/19 | 16.03 | 0.12 | 2.78 | 2.90 | — | — | — | 18.93 | 18.09 | 50,389 | 0.69(d) | 0.69(d) | 1.36(d) | 1 |
| Year ended 12/31/18 | 18.43 | 0.22 | (0.91) | (0.69) | (0.25) | (1.46) | (1.71) | 16.03 | (5.07) | 45,102 | 0.76 | 0.76 | 1.16 | 3 |
| Year ended 12/31/17 | 16.69 | 0.22 | 3.17 | 3.39 | (0.27) | (1.38) | (1.65) | 18.43 | 21.00 | 55,090 | 0.73 | 0.73 | 1.21 | 3 |
| Year ended 12/31/16 | 16.49 | 0.26 | 1.54 | 1.80 | (0.26) | (1.34) | (1.60) | 16.69 | 11.20 | 52,212 | 0.66 | 0.66 | 1.56 | 4 |
| Year ended 12/31/15 | 18.43 | 0.25 | (0.24) | 0.01 | (0.28) | (1.67) | (1.95) | 16.49 | 0.72 | 58,268 | 0.66 | 0.66 | 1.41 | 7 |
| Year ended 12/31/14 | 16.58 | 0.24 | 1.90 | 2.14 | (0.29) | — | (0.29) | 18.43 | 13.02 | 63,667 | 0.66 | 0.66 | 1.37 | 3 |
| (a) | Calculated using average shares outstanding. |
| (b) | Includes adjustments in accordance with accounting principles generally accepted in the United States of America and as such, the net asset value for financial reporting purposes and the returns based upon those net asset values may differ from the net asset value and returns for shareholder transactions. Total returns are not annualized for periods less than one year, if applicable, and do not reflect charges assessed in connection with a variable product, which if included would reduce total returns. |
| (c) | Portfolio turnover is calculated at the fund level and is not annualized for periods less than one year, if applicable. |
| (d) | Ratios are annualized and based on average daily net assets (000’s omitted) of $36,425 and $49,222 for Series I and Series II shares, respectively. |
See accompanying Notes to Financial Statements which are an integral part of the financial statements.
Invesco V.I. S&P 500 Index Fund
Notes to Financial Statements
June 30, 2019
(Unaudited)
NOTE 1—Significant Accounting Policies
Invesco V.I. S&P 500 Index Fund (the “Fund”) is a series portfolio of AIM Variable Insurance Funds (Invesco Variable Insurance Funds) (the “Trust”). The Trust is a Delaware statutory trust registered under the Investment Company Act of 1940, as amended (the “1940 Act”), as an open-end series management investment company. Information presented in these financial statements pertains only to the Fund. Matters affecting the Fund or each class will be voted on exclusively by the shareholders of the Fund or each class. Current Securities and Exchange Commission (“SEC”) guidance, however, requires participating insurance companies offering separate accounts to vote shares proportionally in accordance with the instructions of the contract owners whose investments are funded by shares of each Fund or class.
The Fund’s investment objective is to provide investment results that, before expenses, correspond to the total return (i.e., the combination of capital changes and income) of the Standard & Poor’s 500® Composite Stock Price Index.
The Fund currently offers two classes of shares, Series I and Series II, both of which are offered to insurance company separate accounts funding variable annuity contracts and variable life insurance policies (“variable products”).
The Fund is an investment company and accordingly follows the investment company accounting and reporting guidance in accordance with Financial Accounting Standards Board Accounting Standards Codification Topic 946,Financial Services – Investment Companies.
The following is a summary of the significant accounting policies followed by the Fund in the preparation of its financial statements.
| A. | Security Valuations — Securities, including restricted securities, are valued according to the following policy. |
A security listed or traded on an exchange (except convertible securities) is valued at its last sales price or official closing price as of the close of the customary trading session on the exchange where the security is principally traded, or lacking any sales or official closing price on a particular day, the security may be valued at the closing bid price on that day. Securities traded in the over-the-counter market are valued based on prices furnished by independent pricing services or market makers. When such securities are valued by an independent pricing service they may be considered fair valued. Futures contracts are valued at the final settlement price set by an exchange on which they are principally traded. Listed options are valued at the mean between the last bid and asked prices from the exchange on which they are principally traded. Options not listed on an exchange are valued by an independent source at the mean between the last bid and asked prices. For purposes of determining net asset value (“NAV”) per share, futures and option contracts generally are valued 15 minutes after the close of the customary trading session of the New York Stock Exchange (“NYSE”).
Investments in open-end and closed-end registered investment companies that do not trade on an exchange are valued at the end-of-day net asset value per share. Investments in open-end and closed-end registered investment companies that trade on an exchange are valued at the last sales price or official closing price as of the close of the customary trading session on the exchange where the security is principally traded.
Debt obligations (including convertible securities) and unlisted equities are fair valued using an evaluated quote provided by an independent pricing service. Evaluated quotes provided by the pricing service may be determined without exclusive reliance on quoted prices, and may reflect appropriate factors such as institution-size trading in similar groups of securities, developments related to specific securities, dividend rate (for unlisted equities), yield (for debt obligations), quality, type of issue, coupon rate (for debt obligations), maturity (for debt obligations), individual trading characteristics and other market data. Pricing services generally value debt obligations assuming orderly transactions of institutional round lot size, but a fund may hold or transact in the same securities in smaller, odd lot sizes. Odd lots often trade at lower prices than institutional round lots. Debt obligations are subject to interest rate and credit risks. In addition, all debt obligations involve some risk of default with respect to interest and/or principal payments.
Foreign securities’ (including foreign exchange contracts) prices are converted into U.S. dollar amounts using the applicable exchange rates as of the close of the NYSE. If market quotations are available and reliable for foreign exchange-traded equity securities, the securities will be valued at the market quotations. Because trading hours for certain foreign securities end before the close of the NYSE, closing market quotations may become unreliable. If between the time trading ends on a particular security and the close of the customary trading session on the NYSE, events occur that the investment adviser determines are significant and make the closing price unreliable, the Fund may fair value the security. If the event is likely to have affected the closing price of the security, the security will be valued at fair value in good faith using procedures approved by the Board of Trustees. Adjustments to closing prices to reflect fair value may also be based on a screening process of an independent pricing service to indicate the degree of certainty, based on historical data, that the closing price in the principal market where a foreign security trades is not the current value as of the close of the NYSE. Foreign securities’ prices meeting the approved degree of certainty that the price is not reflective of current value will be priced at the indication of fair value from the independent pricing service. Multiple factors may be considered by the independent pricing service in determining adjustments to reflect fair value and may include information relating to sector indices, American Depositary Receipts and domestic and foreign index futures. Foreign securities may have additional risks including exchange rate changes, potential for sharply devalued currencies and high inflation, political and economic upheaval, the relative lack of issuer information, relatively low market liquidity and the potential lack of strict financial and accounting controls and standards.
Securities for which market prices are not provided by any of the above methods may be valued based upon quotes furnished by independent sources. The last bid price may be used to value equity securities. The mean between the last bid and asked prices is used to value debt obligations, including corporate loans.
Securities for which market quotations are not readily available or became unreliable are valued at fair value as determined in good faith by or under the supervision of the Trust’s officers following procedures approved by the Board of Trustees. Issuer specific events, market trends, bid/asked quotes of brokers and information providers and other market data may be reviewed in the course of making a good faith determination of a security’s fair value.
The Fund may invest in securities that are subject to interest rate risk, meaning the risk that the prices will generally fall as interest rates rise and, conversely, the prices will generally rise as interest rates fall. Specific securities differ in their sensitivity to changes in interest rates depending on their individual characteristics. Changes in interest rates may result in increased market volatility, which may affect the value and/or liquidity of certain Fund investments.
Invesco V.I. S&P 500 Index Fund
Valuations change in response to many factors including the historical and prospective earnings of the issuer, the value of the issuer’s assets, general economic conditions, interest rates, investor perceptions and market liquidity. Because of the inherent uncertainties of valuation, the values reflected in the financial statements may materially differ from the value received upon actual sale of those investments.
| B. | Securities Transactions and Investment Income — Securities transactions are accounted for on a trade date basis. Realized gains or losses on sales are computed on the basis of specific identification of the securities sold. Interest income (net of withholding tax, if any) is recorded on the accrual basis from settlement date. Dividend income (net of withholding tax, if any) is recorded on the ex-dividend date. |
The Fund may periodically participate in litigation related to Fund investments. As such, the Fund may receive proceeds from litigation settlements. Any proceeds received are included in the Statement of Operations as realized gain (loss) for investments no longer held and as unrealized gain (loss) for investments still held.
Brokerage commissions and mark ups are considered transaction costs and are recorded as an increase to the cost basis of securities purchased and/or a reduction of proceeds on a sale of securities. Such transaction costs are included in the determination of net realized and unrealized gain (loss) from investment securities reported in the Statement of Operations and the Statement of Changes in Net Assets and the net realized and unrealized gains (losses) on securities per share in the Financial Highlights. Transaction costs are included in the calculation of the Fund’s net asset value and, accordingly, they reduce the Fund’s total returns. These transaction costs are not considered operating expenses and are not reflected in net investment income reported in the Statement of Operations and the Statement of Changes in Net Assets, or the net investment income per share and the ratios of expenses and net investment income reported in the Financial Highlights, nor are they limited by any expense limitation arrangements between the Fund and the investment adviser.
The Fund allocates income and realized and unrealized capital gains and losses to a class based on the relative net assets of each class.
| C. | Country Determination — For the purposes of making investment selection decisions and presentation in the Schedule of Investments, the investment adviser may determine the country in which an issuer is located and/or credit risk exposure based on various factors. These factors include the laws of the country under which the issuer is organized, where the issuer maintains a principal office, the country in which the issuer derives 50% or more of its total revenues and the country that has the primary market for the issuer’s securities, as well as other criteria. Among the other criteria that may be evaluated for making this determination are the country in which the issuer maintains 50% or more of its assets, the type of security, financial guarantees and enhancements, the nature of the collateral and the sponsor organization. Country of issuer and/or credit risk exposure has been determined to be the United States of America, unless otherwise noted. |
| D. | Distributions– Distributions from net investment income and net realized capital gain, if any, are generally declared and paid to separate accounts of participating insurance companies annually and recorded on the ex-dividend date. |
| E. | Federal Income Taxes –The Fund intends to comply with the requirements of Subchapter M of the Internal Revenue Code of 1986, as amended (the “Internal Revenue Code”), necessary to qualify as a regulated investment company and to distribute substantially all of the Fund’s taxable earnings to shareholders. As such, the Fund will not be subject to federal income taxes on otherwise taxable income (including net realized capital gain) that is distributed to shareholders. Therefore, no provision for federal income taxes is recorded in the financial statements. |
The Fund recognizes the tax benefits of uncertain tax positions only when the position is more likely than not to be sustained. Management has analyzed the Fund’s uncertain tax positions and concluded that no liability for unrecognized tax benefits should be recorded related to uncertain tax positions. Management is not aware of any tax positions for which it is reasonably possible that the total amounts of unrecognized tax benefits will change materially in the next 12 months.
The Fund files tax returns in the U.S. Federal jurisdiction and certain other jurisdictions. Generally, the Fund is subject to examinations by such taxing authorities for up to three years after the filing of the return for the tax period.
| F. | Expenses– Fees provided for under the Rule 12b-1 plan of a particular class of the Fund and which are directly attributable to that class are charged to the operations of such class. All other expenses are allocated among the classes based on relative net assets. |
| G. | Accounting Estimates – The preparation of financial statements in conformity with accounting principles generally accepted in the United States of America (“GAAP”) requires management to make estimates and assumptions that affect the reported amounts of assets and liabilities at the date of the financial statements and the reported amounts of revenues and expenses during the reporting period including estimates and assumptions related to taxation. Actual results could differ from those estimates by a significant amount. In addition, the Fund monitors for material events or transactions that may occur or become known after the period-end date and before the date the financial statements are released to print. |
| H. | Indemnifications – Under the Trust’s organizational documents, each Trustee, officer, employee or other agent of the Trust is indemnified against certain liabilities that may arise out of the performance of their duties to the Fund. Additionally, in the normal course of business, the Fund enters into contracts, including the Fund’s servicing agreements, that contain a variety of indemnification clauses. The Fund’s maximum exposure under these arrangements is unknown as this would involve future claims that may be made against the Fund that have not yet occurred. The risk of material loss as a result of such indemnification claims is considered remote. |
| I. | Securities Lending– The Fund may lend portfolio securities having a market value up to one-third of the Fund’s total assets. Such loans are secured by collateral equal to no less than the market value of the loaned securities determined daily by the securities lending provider. Such collateral will be cash or debt securities issued or guaranteed by the U.S. Government or any of its sponsored agencies. Cash collateral received in connection with these loans is invested in short-term money market instruments or affiliated money market funds and is shown as such on the Schedule of Investments. The Fund bears the risk of loss with respect to the investment of collateral. It is the Fund’s policy to obtain additional collateral from or return excess collateral to the borrower by the end of the next business day, following the valuation date of the securities loaned. Therefore, the value of the collateral held may be temporarily less than the value of the securities on loan. When loaning securities, the Fund retains certain benefits of owning the securities, including the economic equivalent of dividends or interest generated by the security. Lending securities entails a risk of loss to the Fund if, and to the extent that, the market value of the securities loaned were to increase and the borrower did not increase the collateral accordingly, and the borrower failed to return the securities. The securities loaned are subject to termination at the option of the borrower or the Fund. Upon termination, the borrower will return to the Fund the securities loaned and the Fund will return the collateral. Upon the failure of the borrower to return the securities, collateral may be liquidated and the securities may be purchased on the open market to replace the loaned securities. The Fund could experience delays and costs in gaining access to the collateral and the securities may lose value during the delay which could result in potential losses to the Fund. Some of these losses may be indemnified by the lending agent. The Fund bears the risk of any deficiency in the amount of the collateral available for return to the borrower due to any loss on the |
Invesco V.I. S&P 500 Index Fund
| | collateral invested. Dividends received on cash collateral investments for securities lending transactions, which are net of compensation to counterparties, are included inDividends from affiliated money market funds on the Statement of Operations. The aggregate value of securities out on loan, if any, is shown as a footnote on the Statement of Assets and Liabilities. |
| J. | Futures Contracts — The Fund may enter into futures contracts to manage exposure to interest rate, equity and market price movements and/or currency risks. A futures contract is an agreement between two parties ("Counterparties") to purchase or sell a specified underlying security, currency or commodity (or delivery of a cash settlement price, in the case of an index future) for a fixed price at a future date. The Fund currently invests only in exchange-traded futures and they are standardized as to maturity date and underlying financial instrument. Initial margin deposits required upon entering into futures contracts are satisfied by the segregation of specific securities or cash as collateral at the futures commission merchant (broker). During the period the futures contracts are open, changes in the value of the contracts are recognized as unrealized gains or losses by recalculating the value of the contracts on a daily basis. Subsequent or variation margin payments are received or made depending upon whether unrealized gains or losses are incurred. These amounts are reflected as receivables or payables on the Statement of Assets and Liabilities. When the contracts are closed or expire, the Fund recognizes a realized gain or loss equal to the difference between the proceeds from, or cost of, the closing transaction and the Fund’s basis in the contract. The net realized gain (loss) and the change in unrealized gain (loss) on futures contracts held during the period is included on the Statement of Operations. The primary risks associated with futures contracts are market risk and the absence of a liquid secondary market. If the Fund were unable to liquidate a futures contract and/or enter into an offsetting closing transaction, the Fund would continue to be subject to market risk with respect to the value of the contracts and continue to be required to maintain the margin deposits on the futures contracts. Futures contracts have minimal Counterparty risk since the exchange’s clearinghouse, as Counterparty to all exchange-traded futures, guarantees the futures against default. Risks may exceed amounts recognized in the Statement of Assets and Liabilities. |
| K. | Collateral—To the extent the Fund has designated or segregated a security as collateral and that security is subsequently sold, it is the Fund’s practice to replace such collateral no later than the next business day. |
NOTE 2—Advisory Fees and Other Fees Paid to Affiliates
The Trust has entered into a master investment advisory agreement with Invesco Advisers, Inc. (the "Adviser" or "Invesco"). Under the terms of the investment advisory agreement, the Fund accrues daily and pays monthly an advisory fee to the Adviser based on the annual rate of the Fund’s average daily net assets as follows:
| Average Daily Net Assets | Rate |
| First $2 billion | 0.12% |
| Over $2 billion | 0.10% |
For the six months ended June 30, 2019, the effective advisory fees incurred by the Fund was 0.12%.
Under the terms of a master sub-advisory agreement between the Adviser and each of Invesco Asset Management Deutschland GmbH, Invesco Asset Management Limited, Invesco Asset Management (Japan) Limited, Invesco Hong Kong Limited, Invesco Senior Secured Management, Inc. and Invesco Canada Ltd. and separate sub-advisory agreements with Invesco Capital Management LLC and Invesco Asset Management (India) Private Limited (collectively, the "Affiliated Sub-Advisers") the Adviser, not the Fund, will pay 40% of the fees paid to the Adviser to any such Affiliated Sub-Adviser(s) that provide(s) discretionary investment management services to the Fund based on the percentage of assets allocated to such Affiliated Sub-Adviser(s).
The Adviser has contractually agreed, through at least June 30, 2020, to waive advisory fees and/or reimburse expenses of all shares to the extent necessary to limit total annual fund operating expenses after fee waiver and/or expense reimbursement (excluding certain items discussed below) of Series I shares to 2.00% and Series II shares to 2.25% of average daily net assets (the “expense limits”). In determining the Adviser’s obligation to waive advisory fees and/or reimburse expenses, the following expenses are not taken into account, and could cause the total annual fund operating expenses after fee waiver and/or expense reimbursement to exceed the numbers reflected above: (1) interest; (2) taxes; (3) dividend expense on short sales; (4) extraordinary or non-routine items, including litigation expenses; and (5) expenses that the Fund has incurred but did not actually pay because of an expense offset arrangement. Unless Invesco continues the fee waiver agreement, it will terminate on June 30, 2020. During its term, the fee waiver agreement cannot be terminated or amended to increase the expense limits or reduce the advisory fee waiver without approval of the Board of Trustees. The Adviser did not waive fees and/or reimburse expenses during the period under these expense limits.
Further, the Adviser has contractually agreed, through at least June 30, 2021, to waive the advisory fee payable by the Fund in an amount equal to 100% of the net advisory fees the Adviser receives from the affiliated money market funds on investments by the Fund of uninvested cash (excluding investments of cash collateral from securities lending) in such affiliated money market funds.
For the six months ended June 30, 2019, the Adviser waived advisory fees of $560.
The Trust has entered into a master administrative services agreement with Invesco pursuant to which the Fund has agreed to pay Invesco a fee for costs incurred in providing accounting services and fund administrative services to the Fund and to reimburse Invesco for fees paid to insurance companies that have agreed to provide certain administrative services to the Fund. These administrative services provided by the insurance companies may include, among other things: maintenance of master accounts with the Fund; tracking, recording and transmitting net purchase and redemption orders for Fund shares; maintaining and preserving records related to the purchase, redemption and other account activity of variable product owners; distributing copies of Fund documents such as prospectuses, proxy materials and periodic reports, to variable product owners, and responding to inquiries from variable product owners about the Fund. Pursuant to such agreement, for the six months ended June 30, 2019, Invesco was paid $6,014 for accounting and fund administrative services and was reimbursed $63,662 for fees paid to insurance companies. Also, Invesco has entered into a sub-administration agreement whereby State Street Bank and Trust Company (“SSB”) serves as custodian and fund accountant and provides certain administrative services to the Fund.
The Trust has entered into a transfer agency and service agreement with Invesco Investment Services, Inc. (“IIS”) pursuant to which the Fund has agreed to pay IIS a fee for providing transfer agency and shareholder services to the Fund and reimburse IIS for certain expenses incurred by IIS in the course of providing such services. For the six months ended June 30, 2019, expenses incurred under the agreement are shown in the Statement of Operations asTransfer agent fees.
Invesco V.I. S&P 500 Index Fund
The Trust has entered into a master distribution agreement with Invesco Distributors, Inc. (“IDI”) to serve as the distributor for the Fund. The Trust has adopted a plan pursuant to Rule 12b-1 under the 1940 Act with respect to the Fund’s Series II shares (the “Plan”). The Fund, pursuant to the Plan, pays IDI compensation at the annual rate of 0.25% of the Fund’s average daily net assets of Series II shares. The fees are accrued daily and paid monthly. Of the Plan payments, up to 0.25% of the average daily net assets of the Series II shares may be paid to insurance companies who furnish continuing personal shareholder services to customers who purchase and own Series II shares of the Fund. For the six months ended June 30, 2019, expenses incurred under the Plan are detailed in the Statement of Operations asDistribution fees.
Certain officers and trustees of the Trust are officers and directors of the Adviser, IIS and/or IDI.
NOTE 3—Additional Valuation Information
GAAP defines fair value as the price that would be received to sell an asset or paid to transfer a liability in an orderly transaction between market participants at the measurement date, under current market conditions. GAAP establishes a hierarchy that prioritizes the inputs to valuation methods, giving the highest priority to readily available unadjusted quoted prices in an active market for identical assets (Level 1) and the lowest priority to significant unobservable inputs (Level 3), generally when market prices are not readily available or are unreliable. Based on the valuation inputs, the securities or other investments are tiered into one of three levels. Changes in valuation methods may result in transfers in or out of an investment’s assigned level:
Level 1 – Prices are determined using quoted prices in an active market for identical assets.
Level 2 – Prices are determined using other significant observable inputs. Observable inputs are inputs that other market participants may use in pricing a security. These may include quoted prices for similar securities, interest rates, prepayment speeds, credit risk, yield curves, loss severities, default rates, discount rates, volatilities and others.
Level 3 – Prices are determined using significant unobservable inputs. In situations where quoted prices or observable inputs are unavailable (for example, when there is little or no market activity for an investment at the end of the period), unobservable inputs may be used. Unobservable inputs reflect the Fund’s own assumptions about the factors market participants would use in determining fair value of the securities or instruments and would be based on the best available information.
The following is a summary of the tiered valuation input levels, as of June 30, 2019. The level assigned to the securities valuations may not be an indication of the risk or liquidity associated with investing in those securities. Because of the inherent uncertainties of valuation, the values reflected in the financial statements may materially differ from the value received upon actual sale of those investments.
| | Level 1 | Level 2 | Level 3 | Total |
| Investments in Securities | | | | |
| Common Stocks & Other Equity Interests | $87,616,819 | $— | $— | $87,616,819 |
| Money Market Funds | 408,809 | — | — | 408,809 |
| Total Investments in Securities | 88,025,628 | — | — | 88,025,628 |
| Other Investments - Assets* | | | | |
| Futures Contracts | 1,901 | — | — | 1,901 |
| Total Investments | $88,027,529 | $— | $— | $88,027,529 |
| * | Unrealized appreciation. |
NOTE 4—Derivative Investments
The Fund may enter into an International Swaps and Derivatives Association Master Agreement (“ISDA Master Agreement”) under which a fund may trade OTC derivatives. An OTC transaction entered into under an ISDA Master Agreement typically involves a collateral posting arrangement, payment netting provisions and close-out netting provisions. These netting provisions allow for reduction of credit risk through netting of contractual obligations. The enforceability of the netting provisions of the ISDA Master Agreement depends on the governing law of the ISDA Master Agreement, among other factors.
For financial reporting purposes, the Fund does not offset OTC derivative assets or liabilities that are subject to ISDA Master Agreements in the Statement of Assets and Liabilities.
Value of Derivative Investments at Period-End
The table below summarizes the value of the Fund’s derivative investments, detailed by primary risk exposure, held as of June 30, 2019:
| | Value |
| Derivative Assets | Equity
Risk |
| Unrealized appreciation on futures contracts — Exchange-Traded(a) | $1,901 |
| Derivatives not subject to master netting agreements | (1,901) |
| Total Derivative Assets subject to master netting agreements | $- |
| (a) | The daily variation margin receivable at period-end is recorded in the Statement of Assets and Liabilities. |
Invesco V.I. S&P 500 Index Fund
Effect of Derivative Investments for the six months ended June 30, 2019
The table below summarizes the gains (losses) on derivative investments, detailed by primary risk exposure, recognized in earnings during the period:
| | Location of Gain on
Statement of Operations |
| | Equity
Risk |
| Realized Gain: | |
| Futures contracts | $98,472 |
| Change in Net Unrealized Appreciation: | |
| Futures contracts | 66,927 |
| Total | $165,399 |
The table below summarizes the average notional value of derivatives held during the period.
| | Futures
Contracts |
| Average notional value | $827,724 |
NOTE 5—Investments in Affiliates
| | Value
12/31/18 | Purchases
at Cost | Proceeds
from Sales | Change in
Unrealized
Appreciation | Realized
Gain (Loss) | Value
06/30/19 | Dividend
Income |
| Invesco, Ltd. | $ 25,428 | $– | $ (1,978) | $ 6,179 | $ (596) | $ 29,033 | $ 896 |
NOTE 6—Trustees’ and Officers’ Fees and Benefits
Trustees’ and Officers’ Fees and Benefits include amounts accrued by the Fund to pay remuneration to certain Trustees and Officers of the Fund. Trustees have the option to defer compensation payable by the Fund, and Trustees’ and Officers’ Fees and Benefits also include amounts accrued by the Fund to fund such deferred compensation amounts. Those Trustees who defer compensation have the option to select various Invesco Funds in which their deferral accounts shall be deemed to be invested. Finally, certain current Trustees were eligible to participate in a retirement plan that provided for benefits to be paid upon retirement to Trustees over a period of time based on the number of years of service. The Fund may have certain former Trustees who also participate in a retirement plan and receive benefits under such plan.Trustees’ and Officers’ Fees and Benefits include amounts accrued by the Fund to fund such retirement benefits. Obligations under the deferred compensation and retirement plans represent unsecured claims against the general assets of the Fund.
NOTE 7—Cash Balances
The Fund is permitted to temporarily carry a negative or overdrawn balance in its account with State Street Bank and Trust Company, the custodian bank. Such balances, if any at period-end, are shown in the Statement of Assets and Liabilities under the payable caption Amount due custodian. To compensate the custodian bank for such overdrafts, the overdrawn Fund may either (1) leave funds as a compensating balance in the account so the custodian bank can be compensated by earning the additional interest; or (2) compensate by paying the custodian bank at a rate agreed upon by the custodian bank and Invesco, not to exceed the contractually agreed upon rate.
NOTE 8—Tax Information
The amount and character of income and gains to be distributed are determined in accordance with income tax regulations, which may differ from GAAP. Reclassifications are made to the Fund’s capital accounts to reflect income and gains available for distribution (or available capital loss carryforward) under income tax regulations. The tax character of distributions paid during the year and the tax components of net assets will be reported at the Fund’s fiscal year-end.
Capital loss carryforward is calculated and reported as of a specific date. Results of transactions and other activity after that date may affect the amount of capital loss carryforward actually available for the Fund to utilize. Capital losses generated in years beginning after December 22, 2010 can be carried forward for an unlimited period, whereas previous losses expire in eight tax years. Capital losses with an expiration period may not be used to offset capital gains until all net capital losses without an expiration date have been utilized. Capital loss carryforwards with no expiration date will retain their character as either short-term or long-term capital losses instead of as short-term capital losses as under prior law. The ability to utilize capital loss carryforwards in the future may be limited under the Internal Revenue Code and related regulations based on the results of future transactions.
The Fund did not have a capital loss carryforward as of December 31, 2018.
NOTE 9—Investment Transactions
The aggregate amount of investment securities (other than short-term securities, U.S. Treasury obligations and money market funds, if any) purchased and sold by the Fund during the six months ended June 30, 2019 was $911,425 and $3,826,233, respectively. Cost of investments, including any derivatives, on a tax basis includes the adjustments for financial reporting purposes as of the most recently completed federal income tax reporting period-end.
Invesco V.I. S&P 500 Index Fund
| Unrealized Appreciation (Depreciation) of Investments on a Tax Basis |
| Aggregate unrealized appreciation of investments | $60,837,654 |
| Aggregate unrealized (depreciation) of investments | (1,093,758) |
| Net unrealized appreciation of investments | $59,743,896 |
Cost of investments for tax purposes is $28,283,633.
NOTE 10—Share Information
| | Summary of Share Activity |
| | Six months ended
June 30, 2019(a) | | Year ended
December 31, 2018 |
| | Shares | Amount | | Shares | Amount |
| Sold: | | | | | |
| Series I | 73,283 | $1,324,193 | | 197,507 | $3,659,064 |
| Series II | 34,236 | 617,307 | | 126,250 | 2,450,887 |
| Issued as reinvestment of dividends: | | | | | |
| Series I | — | — | | 177,118 | 3,324,539 |
| Series II | �� | — | | 243,843 | 4,552,548 |
| Reacquired: | | | | | |
| Series I | (196,337) | (3,557,559) | | (355,679) | (6,715,230) |
| Series II | (187,154) | (3,354,496) | | (544,977) | (10,141,105) |
| Net increase (decrease) in share activity | (275,972) | $(4,970,555) | | (155,938) | $(2,869,297) |
| (a) | There are entities that are record owners of more than 5% of the outstanding shares of the Fund and in the aggregate own 89% of the outstanding shares of the Fund. The Fund and the Fund’s principal underwriter or adviser, are parties to participation agreements with these entities whereby these entities sell units of interest in separate accounts funding variable products that are invested in the Fund. The Fund, Invesco and/or Invesco affiliates may make payments to these entities, which are considered to be related to the Fund, for providing services to the Fund, Invesco and/or Invesco affiliates including but not limited to services such as, securities brokerage, third party record keeping and account servicing and administrative services. The Fund has no knowledge as to whether all or any portion of the shares owned of record by these entities are also owned beneficially. |
Invesco V.I. S&P 500 Index Fund
Calculating your ongoing Fund expenses
Example
As a shareholder of the Fund, you incur ongoing costs, including management fees; distribution and/or service fees (12b-1); and other Fund expenses. This example is intended to help you understand your ongoing costs (in dollars) of investing in the Fund and to compare these costs with ongoing costs of investing in other mutual funds. The example is based on an investment of $1,000 invested at the beginning of the period and held for the entire period January 1, 2019 through June 30, 2019.
The actual and hypothetical expenses in the examples below do not represent the effect of any fees or other expenses assessed in connection with a variable product; if they did, the expenses shown would be higher while the ending account values shown would be lower.
Actual expenses
The table below provides information about actual account values and actual expenses. You may use the information in this table, together with the amount you invested, to estimate the expenses that you paid over the period. Simply divide your account value by $1,000 (for example, an $8,600 account value divided by $1,000 = 8.6), then multiply the result by the number in the table under the heading entitled “Actual Expenses Paid During Period” to estimate the expenses you paid on your account during this period.
Hypothetical example for comparison purposes
The table below also provides information about hypothetical account values and hypothetical expenses based on the Fund’s actual expense ratio and an assumed rate of return of 5% per year before expenses, which is not the Fund’s actual return.
The hypothetical account values and expenses may not be used to estimate the actual ending account balance or expenses you paid for the period. You may use this information to compare the ongoing costs of investing in the Fund and other funds. To do so, compare this 5% hypothetical example with the 5% hypothetical examples that appear in the shareholder reports of the other funds.
Please note that the expenses shown in the table are meant to highlight your ongoing costs. Therefore, the hypothetical information is useful in comparing ongoing costs, and will not help you determine the relative total costs of owning different funds.
| | Beginning
Account Value (01/01/19) | ACTUAL | HYPOTHETICAL
(5% annual return before
expenses) | Annualized
Expense
Ratio |
Ending
Account Value
(06/30/19)1 | Expenses
Paid During
Period2 | Ending
Account Value
(06/30/19) | Expenses
Paid During
Period2 |
| Series I | $1,000.00 | $1,182.30 | $2.38 | $1,022.61 | $2.21 | 0.44% |
| Series II | 1,000.00 | 1,180.90 | 3.73 | 1,021.37 | 3.46 | 0.69 |
| 1 | The actual ending account value is based on the actual total return of the Fund for the period January 1, 2019 through June 30, 2019, after actual expenses and will differ from the hypothetical ending account value which is based on the Fund’s expense ratio and a hypothetical annual return of 5% before expenses. |
| 2 | Expenses are equal to the Fund’s annualized expense ratio as indicated above multiplied by the average account value over the period, multiplied by 181/365 to reflect the most recent fiscal half year. |
Invesco V.I. S&P 500 Index Fund
Approval of Investment Advisory andSub-Advisory Contracts
At meetings held on June 10, 2019, the Board of Trustees (the Board or the Trustees) of AIM Variable Insurance Funds (Invesco Variable Insurance Funds) as a whole, and the independent Trustees, who comprise over 75% of the Board, voting separately, approved the continuance of the Invesco V.I. S&P 500 Index Fund’s (the Fund) Master Investment Advisory Agreement with Invesco Advisers, Inc. (Invesco Advisers and the investment advisory agreement) and the Master IntergroupSub-Advisory Contract for Mutual Funds with Invesco Asset Management Deutschland GmbH, Invesco Asset Management Limited, Invesco Asset Management (Japan) Limited, Invesco Hong Kong Limited, Invesco Senior Secured Management, Inc. and Invesco Canada Ltd. and separatesub-advisory contracts with Invesco Capital Management LLC and Invesco Asset Management (India) Private Limited (collectively, the AffiliatedSub-Advisers and thesub-advisory contracts) for another year, effective July 1, 2019. After evaluating the factors discussed below, among others, the Board approved the renewal of the Fund’s investment advisory agreement and thesub-advisory contracts and determined that the compensation payable by the Fund to Invesco Advisers and by Invesco Advisers to the AffiliatedSub-Advisers is fair and reasonable.
The Board’s Evaluation Process
The Board’s Investments Committee has established threeSub-Committees, which meet throughout the year to review the performance of funds advised by Invesco Advisers (the Invesco Funds). As part of a regularly scheduled basis ofin-person Board meetings, theSub-Committees meet with portfolio managers for their assigned Invesco Funds and other members of management to review detailed information about investment performance and portfolio attributes of these funds. The Board took into account evaluations and reports that it received from the Investments Committee andSub-Committees, as well as the information provided to such committees and the Board throughout the year, in considering whether to approve each Invesco Fund’s investment advisory agreement andsub-advisory contracts.
As part of the contract renewal process, the Board reviews and considers information provided in response to detailed requests for information submitted to management by the independent Trustees with assistance from legal counsel to the independent Trustees. The Board receives comparative investment performance and fee data regarding the Invesco Funds prepared by Invesco Advisers and Broadridge Financial Solutions, Inc. (Broadridge), an independent mutual fund data provider. The Board also receives an independent written evaluation from the Senior Officer, an officer of the Invesco Funds who reports directly to the
independent Trustees. The Senior Officer’s evaluation is prepared as part of his responsibility to manage the process by which the Invesco Funds’ proposed management fees are negotiated during the annual contract renewal process to ensure they are negotiated in a manner that is at arms’ length and reasonable. In addition to meetings with Invesco Advisers and fund counsel throughout the year, the independent Trustees also discuss the continuance of the investment advisory agreement andsub-advisory contracts in separate sessions with the Senior Officer and with independent legal counsel.
The discussion below is a summary of the Senior Officer’s independent written evaluation with respect to the Fund’s investment advisory agreement, as well as a discussion of the material factors and related conclusions that formed the basis for the Board’s approval of the Fund’s investment advisory agreement andsub-advisory contracts. The Trustees’ review and conclusions are based on the comprehensive consideration of all information presented to them during the course of the year and in prior years and are not the result of any single determinative factor. Moreover, one Trustee may have weighed a particular piece of information or factor differently than another Trustee. This information is current as of June 10, 2019.
Factors and Conclusions and Summary of Independent Written Fee Evaluation
| A. | Nature, Extent and Quality of Services Provided by Invesco Advisers and the AffiliatedSub-Advisers |
The Board reviewed the nature, extent and quality of the advisory services provided to the Fund by Invesco Advisers under the Fund’s investment advisory agreement, and the credentials and experience of the officers and employees of Invesco Advisers who provide these services, including the Fund’s portfolio manager(s). The Board’s review included consideration of Invesco Advisers’ investment process oversight and structure, credit analysis and investment risk management. The Board also considerednon-advisory services that Invesco Advisers and its affiliates provide to the Invesco Funds such as various back office support functions, third party oversight, internal audit, valuation, portfolio trading and legal and compliance. The Board also received and reviewed information about Invesco Advisers’ role as administrator of the Invesco Funds’ liquidity risk management program. The Board also reviewed and considered the benefits to shareholders of investing in a fund that is part of the Invesco family of funds under the umbrella of Invesco Ltd., Invesco Advisers’ parent company, and noted Invesco Ltd.’s depth and experience in conducting an investment management business, as well as its
commitment of financial and other resources to such business. The Board reviewed and considered information about the resources that Invesco Advisers intends to continue to commit to managing the Invesco family of funds following Invesco Ltd.’s acquisition of OppenheimerFunds, Inc. and its subsidiaries. The Board concluded that the nature, extent and quality of the services provided to the Fund by Invesco Advisers are appropriate and satisfactory.
The Board reviewed the services that may be provided by the AffiliatedSub-Advisers under thesub-advisory contracts and the credentials and experience of the officers and employees of the AffiliatedSub-Advisers who provide these services. The Board noted the AffiliatedSub-Advisers’ expertise with respect to certain asset classes and that the AffiliatedSub-Advisers have offices and personnel that are located in financial centers around the world. As a result, the Board noted that the AffiliatedSub-Advisers can provide research and investment analysis on the markets and economies of various countries in which the Fund may invest, make recommendations regarding securities and assist with security trades. The Board concluded that thesub-advisory contracts may benefit the Fund and its shareholders by permitting Invesco Advisers to use the resources and talents of the AffiliatedSub-Advisers in managing the Fund. The Board concluded that the nature, extent and quality of the services that may be provided by the AffiliatedSub-Advisers are appropriate and satisfactory.
| B. | Fund Investment Performance |
The Board considered Fund investment performance as a relevant factor in considering whether to approve the investment advisory agreement. The Board did not view Fund investment performance as a relevant factor in considering whether to approve thesub-advisory contracts for the Fund, as no AffiliatedSub-Adviser currently manages assets of the Fund.
The Board compared the Fund’s investment performance over multiple time periods ending December 31, 2018 to the performance of funds in the Broadridge performance universe and against the Lipper Variable Underlying Funds S&P 500 Funds Index. The Board noted that performance of Series I shares of the Fund was in the fourth quintile of its performance universe for the one and three year periods and the third quintile for the five year period (the first quintile being the best performing funds and the fifth quintile being the worst performing funds). The Board noted that performance of Series I shares of the Fund was reasonably comparable to the performance of the Index for the one, three and five year periods. The Board noted that the Fund is passively managed and discussed reasons for differences in the Fund’s
Invesco V.I. S&P 500 Index Fund
performance versus its peers and the Index. The Trustees also reviewed more recent Fund performance and this review did not change their conclusions.
| C. | Advisory andSub-Advisory Fees and Fund Expenses |
The Board compared the Fund’s contractual management fee rate to the contractual management fee rates of funds in the Fund’s Broadridge expense group. The Board noted that the contractual management fee rate for Series I shares of the Fund was below the median contractual management fee rate of funds in its expense group. The Board noted that the term “contractual management fee” for funds in the expense group may include both advisory and certainnon-portfolio management administrative services fees, but that Broadridge does not provide information on a fund by fund basis as to what is included. The Board also reviewed the methodology used by Broadridge in providing expense group information, which includes using each fund’s contractual management fee schedule (including any applicable breakpoints) as reported in the most recent prospectus or statement of additional information for each fund in the expense group. The Board also considered comparative information regarding the Fund’s total expense ratio and its various components.
The Board noted that Invesco Advisers has contractually agreed to waive fees and/or limit expenses of the Fund for the term disclosed in the Fund’s registration statement in an amount necessary to limit total annual operating expenses to a specified percentage of average daily net assets for each class of the Fund.
The Board also considered the fees charged by Invesco Advisers and the AffiliatedSub-Advisers to other similarly managed client accounts. The Board noted that Invesco Advisers or the AffiliatedSub-Advisers may charge lower fees to large institutional clients. Invesco Advisers reviewed with the Board differences in the scope of services it provides to the Invesco Funds relative to certain other types of client accounts, including management of cash flows as a result of redemptions and purchases, necessary infrastructure such as officers, office space, technology, legal and distribution, oversight of service providers, costs and business risks associated with launching new funds and sponsoring and maintaining the product line, preparation of annual registration statement updates and financial information and compliance with federal and state laws and regulations.
The Board also considered the services that may be provided by the AffiliatedSub-Advisers pursuant to thesub-advisory contracts, as well as the fees payable by Invesco Advisers to the AffiliatedSub-Advisers pursuant to thesub-advisory contracts.
| D. | Economies of Scale and Breakpoints |
The Board considered the extent to which there may be economies of scale in the provision of advisory services to the Fund. The Board
considered Invesco’s reinvestment in its business, including investments in business infrastructure and cybersecurity. The Board also considered that the Fund may benefit from economies of scale through contractual breakpoints in the Fund’s advisory fee schedule, which generally operate to reduce the Fund’s expense ratio as it grows in size. The Board noted that the Fund shares directly in economies of scale through lower fees charged by third party service providers based on the combined size of the Invesco Funds. The Board noted that the Fund may also benefit from economies of scale through initial fee setting, fee waivers and expense reimbursements.
| E. | Profitability and Financial Resources |
The Board reviewed information from Invesco Advisers concerning the costs of the advisory and other services that Invesco Advisers and its affiliates provide to the Fund and the Invesco Funds and the profitability of Invesco Advisers and its affiliates in providing these services. The Board considered the methodology used for calculating profitability and noted the periodic review of such methodology by an independent consultant. The Board noted that Invesco Advisers continues to operate at a net profit from services Invesco Advisers and its affiliates provide to the Invesco Funds and the Fund. The Board did not deem the level of profits realized by Invesco Advisers and its affiliates from providing services to the Fund to be excessive given the nature, extent and quality of the services provided. The Board received information from Invesco Advisers demonstrating that Invesco Advisers and the AffiliatedSub-Advisers are financially sound and have the resources necessary to perform their obligations under the investment advisory agreement andsub-advisory contracts.
| F. | Collateral Benefits to Invesco Advisers and its Affiliates |
The Board considered various other benefits received by Invesco Advisers and its affiliates from the relationship with the Fund, including the fees received for providing administrative, transfer agency and distribution services to the Fund. The Board considered comparative information regarding fees charged for these services, including information provided by Broadridge and other independent sources. The Board considered the performance of Invesco Advisers and its affiliates in providing these services and the organizational structure employed to provide these services. The Board also considered that these services are provided to the Fund pursuant to written contracts that are reviewed and approved on an annual basis by the Board; and that the services are required for the operation of the Fund.
The Board considered the benefits realized by Invesco Advisers and the AffiliatedSub-Advisers as a result of portfolio brokerage transactions executed through “soft dollar” arrangements. The Board noted that soft dollar arrangements may result in the Fund bearing costs to purchase research that may be used by Invesco Advisers or the AffiliatedSub-Advisers with
other clients and may reduce Invesco Advisers’ or the AffiliatedSub-Advisers’ expenses. The Board also considered that it receives periodic reports from Invesco representing that these arrangements are consistent with regulatory requirements. The Board did not deem the soft dollar arrangements to be inappropriate.
The Board considered that the Fund’s uninvested cash and cash collateral from any securities lending arrangements may be invested in money market funds advised by Invesco Advisers pursuant to procedures approved by the Board. The Board considered information regarding the returns of the affiliated money market funds relative to comparable overnight investments, as well as the costs to the Fund of such investments. The Board noted that Invesco Advisers receives advisory fees from these affiliated money market funds attributable to such investments, although Invesco Advisers has contractually agreed to waive through varying periods the advisory fees payable by the Invesco Funds with respect to certain investments in the affiliated money market funds. The waiver is in an amount equal to 100% of the net advisory fee Invesco Advisers receives from the affiliated money market funds with respect to the Fund’s investment in the affiliated money market funds of uninvested cash, but not cash collateral. The Board concluded that the amount of advisory fees received by Invesco Advisers from the Fund’s investment of cash collateral from any securities lending arrangements in the affiliated money market funds is fair and reasonable.
The Board also considered that an affiliated broker may receive commissions for executing certain trades for the Fund. Invesco Advisers and the AffiliatedSub-Advisers may use the affiliated broker to, among other things, control order routing and minimize information leakage, and the Board was advised that such trades are executed in compliance with rules under the federal securities laws and consistent with best execution obligations.
Invesco V.I. S&P 500 Index Fund
| Semiannual Report to Shareholders | June 30, 2019 |
Invesco V.I. Small Cap Equity Fund
Beginning on January 1, 2021, as permitted by regulations adopted by the Securities and Exchange Commission, the insurance company that offers your variable annuity or variable life insurance contract may no longer send you paper copies of the Fund’s shareholder reports by mail, unless you specifically request paper copies of the reports from the insurance company or your financial intermediary. Instead of delivering paper copies of the report, the insurance company may choose to make the reports available on a website, and will notify you by mail each time a report is posted and provide you with a website link to access the report. Instructions for requesting paper copies will be provided by your insurance company.
If the insurance company offers electronic delivery, you may elect to receive shareholder reports and other communications about the Fund electronically by following the instructions provided by the insurance company or by contacting your financial intermediary. If you already elected to receive shareholder reports electronically, you will not be affected by this change and you need not take any action.
You may elect to receive all future reports in paper free of charge from the insurance company. You can inform the insurance company or your financial intermediary that you wish to continue receiving paper copies of your shareholder reports by following the instructions provided by the insurance company or by contacting your financial intermediary. Your election to receive reports in paper will apply to all portfolio companies available under your contract with the insurance company.
The Fund provides a complete list of its holdings four times in each fiscal year, at the quarter-ends. For the second and fourth quarters, the lists appear in the Fund’s semiannual and annual reports to shareholders. For the first and third quarters, the Fund files the lists with the Securities and Exchange Commission (SEC) on Form N-Q (or any successor Form). The Fund’s Form N-Q (or any successor Form) filings are available on the SEC website, sec.gov. The SEC file numbers for the Fund are 811-07452 and 033-57340. The Fund’s most recent portfolio holdings, as filed on Form N-Q (or any successor Form), have also been made available to insurance companies issuing variable annuity contracts and variable life insurance policies (“variable products”) that invest in the Fund.
A description of the policies and procedures that the Fund uses to determine how to vote proxies relating to portfolio securities is available without charge, upon request, from our Client Services department at 800 959 4246 or at invesco.com/proxyguidelines. The information is also available on the SEC website, sec.gov.
Information regarding how the Fund voted proxies related to its portfolio securities during the most recent 12-month period ended June 30 is available at invesco.com/proxysearch. The information is also available on the SEC website, sec.gov.
Invesco Advisers, Inc. is an investment adviser; it provides investment advisory services to individual and institutional clients and does not sell securities. Invesco Distributors, Inc. is the US distributor for Invesco Ltd.’s retail mutual funds, exchange-traded funds and institutional money market funds. Both are wholly owned, indirect subsidiaries of Invesco Ltd.
This report must be accompanied or preceded by a currently effective Fund prospectus and variable product prospectus, which contain more complete information, including sales charges and expenses. Investors should read each carefully before investing.
NOT FDIC INSURED | MAY LOSE VALUE | NO BANK GUARANTEE
| Invesco Distributors, Inc. | VISCE-SAR-1 |
Performance summary
Fund vs. Indexes
Cumulative total returns, December 31, 2018 to June 30, 2019, excluding variable product issuer charges. If variable product issuer charges were included, returns would be lower.
| Series I Shares | 19.34% |
| Series II Shares | 19.11 |
| S&P 500 Index▼ (Broad Market Index) | 18.54 |
Russell 2000 Index■
(Style-Specific Index) | 16.98 |
Lipper VUF Small-Cap Core Funds Index♦
(Peer Group Index) | 15.54 |
| Source(s):▼FactSet Research Systems Inc.;■ RIMES Technologies Corp.;♦ Lipper Inc. |
TheS&P 500® Index is an unmanaged index considered representative of the US stock market.
TheRussell 2000® Index is an unmanaged index considered representative of small-cap stocks. The Russell 2000 Index is a trademark/service mark of the Frank Russell Co. Russell® is a trademark of the Frank Russell Co.
TheLipper VUF Small-Cap Core Funds Index is an unmanaged index considered representative of small-cap core variable insurance underlying funds tracked by Lipper.
The Fund is not managed to track the performance of any particular index, including the indexes described here, and consequently, the performance of the Fund may deviate significantly from the performance of the indexes.
A direct investment cannot be made in an index. Unless otherwise indicated, index results include reinvested dividends, and they do not reflect sales charges. Performance of the peer group, if applicable, reflects fund expenses; performance of a market index does not.
| Average Annual Total Returns |
| As of 6/30/19 |
| Series I Shares | |
| Inception (8/29/03) | 8.17% |
| 10 Years | 11.32 |
| 5 Years | 4.60 |
| 1 Year | –3.20 |
| Series II Shares | |
| Inception (8/29/03) | 7.91% |
| 10 Years | 11.03 |
| 5 Years | 4.33 |
| 1 Year | –3.49 |
The performance of the Fund’s Series I and Series II share classes will differ primarily due to different class expenses.
The performance data quoted represent past performance and cannot guarantee comparable future results; current performance may be lower or higher. Please contact your variable product issuer or financial adviser for the most recent month-end variable product performance. Performance figures reflect Fund expenses, reinvested distributions and changes in net asset value. Investment return and principal value will fluctuate so that you may have a gain or loss when you sell shares.
The total annual Fund operating expense ratio set forth in the most re-
cent Fund prospectus as of the date of this report for Series I and Series II shares was 0.96% and 1.21%, respectively. The expense ratios presented above may vary from the expense ratios presented in other sections of this report that are based on expenses incurred during the period covered by this report.
Invesco V.I. Small Cap Equity Fund, a series portfolio of AIM Variable Insurance Funds (Invesco Variable Insurance Funds), is currently offered through insurance companies issuing variable products. You cannot purchase shares of the Fund directly. Performance figures given represent the Fund and are not intended to reflect actual variable product values. They do not reflect sales charges, expenses and
fees assessed in connection with a variable product. Sales charges, expenses and fees, which are determined by the variable product issuers, will vary and will lower the total return.
The most recent month-end performance at the Fund level, excluding variable product charges, is available at 800 451 4246. As mentioned above, for the most recent month-end performance including variable product charges, please contact your variable product issuer or financial adviser.
Fund performance reflects any applicable fee waivers and/or expense reimbursements. Had the adviser not waived fees and/or reimbursed expenses currently or in the past, returns would have been lower. See current prospectus for more information.
Invesco V.I. Small Cap Equity Fund
Schedule of Investments(a)
June 30, 2019
(Unaudited)
| | Shares | Value |
| Common Stocks & Other Equity Interests–95.68% |
| Aerospace & Defense–3.39% |
| BWX Technologies, Inc. | 49,718 | $2,590,308 |
| Cubic Corp. | 48,679 | 3,138,822 |
| Curtiss-Wright Corp. | 24,662 | 3,135,280 |
| | | | 8,864,410 |
| Alternative Carriers–1.94% |
| Iridium Communications, Inc.(b) | 218,551 | 5,083,496 |
| Apparel Retail–3.08% |
| American Eagle Outfitters, Inc. | 130,243 | 2,201,107 |
| Boot Barn Holdings, Inc.(b) | 103,088 | 3,674,056 |
| Childrens Place, Inc. (The)(c) | 22,700 | 2,165,126 |
| | | | 8,040,289 |
| Application Software–4.99% |
| Avalara, Inc.(b) | 58,886 | 4,251,569 |
| Blackbaud, Inc. | 31,762 | 2,652,127 |
| Cornerstone OnDemand, Inc.(b) | 56,821 | 3,291,641 |
| Q2 Holdings, Inc.(b) | 37,342 | 2,851,435 |
| | | | 13,046,772 |
| Auto Parts & Equipment–0.71% |
| Visteon Corp.(b) | 31,606 | 1,851,479 |
| Biotechnology–3.56% |
| Array BioPharma, Inc.(b) | 105,887 | 4,905,745 |
| Neurocrine Biosciences, Inc.(b) | 30,343 | 2,561,859 |
| Retrophin, Inc.(b) | 91,939 | 1,847,055 |
| | | | 9,314,659 |
| Building Products–1.35% |
| Trex Co., Inc.(b) | 49,321 | 3,536,316 |
| Casinos & Gaming–1.73% |
| Boyd Gaming Corp. | 91,222 | 2,457,520 |
| Penn National Gaming, Inc.(b) | 107,149 | 2,063,690 |
| | | | 4,521,210 |
| Communications Equipment–2.23% |
| Ciena Corp.(b) | 72,933 | 2,999,734 |
| Lumentum Holdings, Inc.(b) | 52,949 | 2,828,006 |
| | | | 5,827,740 |
| Construction & Engineering–1.51% |
| Dycom Industries, Inc.(b) | 30,467 | 1,793,592 |
| Primoris Services Corp. | 103,391 | 2,163,974 |
| | | | 3,957,566 |
| Consumer Finance–0.95% |
| SLM Corp. | 255,713 | 2,485,530 |
| | Shares | Value |
| Data Processing & Outsourced Services–2.00% |
| Euronet Worldwide, Inc.(b) | 15,992 | $2,690,494 |
| Jack Henry & Associates, Inc. | 18,969 | 2,540,329 |
| | | | 5,230,823 |
| Diversified Support Services–0.90% |
| Mobile Mini, Inc. | 77,073 | 2,345,331 |
| Education Services–1.39% |
| Strategic Education, Inc. | 20,415 | 3,633,870 |
| Electric Utilities–0.93% |
| IDACORP, Inc. | 24,325 | 2,442,960 |
| Electrical Components & Equipment–1.06% |
| EnerSys | 40,513 | 2,775,140 |
| Electronic Components–0.86% |
| Belden, Inc. | 37,584 | 2,238,879 |
| Electronic Equipment & Instruments–1.24% |
| FLIR Systems, Inc. | 59,781 | 3,234,152 |
| Environmental & Facilities Services–3.37% |
| ABM Industries, Inc. | 72,043 | 2,881,720 |
| BrightView Holdings, Inc.(b) | 156,908 | 2,935,749 |
| Waste Connections, Inc. | 31,375 | 2,998,822 |
| | | | 8,816,291 |
| Fertilizers & Agricultural Chemicals–1.03% |
| Scotts Miracle-Gro Co. (The) | 27,205 | 2,679,693 |
| Food Retail–0.90% |
| Sprouts Farmers Market, Inc.(b) | 124,122 | 2,344,665 |
| Footwear–1.07% |
| Wolverine World Wide, Inc. | 101,834 | 2,804,508 |
| General Merchandise Stores–0.58% |
| Big Lots, Inc. | 53,144 | 1,520,450 |
| Health Care Equipment–3.71% |
| Hill-Rom Holdings, Inc. | 26,345 | 2,756,214 |
| STERIS PLC | 26,565 | 3,954,997 |
| Wright Medical Group N.V.(b) | 99,906 | 2,979,197 |
| | | | 9,690,408 |
| Health Care Facilities–0.68% |
| Acadia Healthcare Co., Inc.(b) | 50,838 | 1,776,788 |
| Health Care REITs–0.91% |
| Healthcare Trust of America, Inc., Class A | 87,063 | 2,388,138 |
| Health Care Supplies–2.63% |
| ICU Medical, Inc.(b) | 11,052 | 2,784,109 |
See accompanying Notes to Financial Statements which are an integral part of the financial statements.
Invesco V.I. Small Cap Equity Fund
| | Shares | Value |
| Health Care Supplies–(continued) |
| Lantheus Holdings, Inc.(b) | 144,238 | $4,081,936 |
| | | | 6,866,045 |
| Industrial Machinery–3.47% |
| Albany International Corp., Class A | 50,429 | 4,181,068 |
| SPX Corp.(b) | 148,454 | 4,901,951 |
| | | | 9,083,019 |
| Investment Banking & Brokerage–3.15% |
| Lazard Ltd., Class A | 69,063 | 2,375,077 |
| LPL Financial Holdings, Inc. | 37,046 | 3,021,842 |
| Piper Jaffray Cos. | 38,166 | 2,834,589 |
| | | | 8,231,508 |
| Life Sciences Tools & Services–1.51% |
| Cambrex Corp.(b) | 52,201 | 2,443,529 |
| NeoGenomics, Inc.(b) | 69,020 | 1,514,299 |
| | | | 3,957,828 |
| Managed Health Care–1.21% |
| HealthEquity, Inc.(b) | 48,499 | 3,171,835 |
| Multi-line Insurance–1.15% |
| American Financial Group, Inc. | 29,331 | 3,005,548 |
| Office REITs–0.90% |
| Highwoods Properties, Inc. | 56,667 | 2,340,347 |
| Oil & Gas Equipment & Services–1.49% |
| Apergy Corp.(b) | 73,142 | 2,453,182 |
| Core Laboratories N.V. | 27,467 | 1,435,975 |
| | | | 3,889,157 |
| Oil & Gas Exploration & Production–2.39% |
| Matador Resources Co.(b) | 98,442 | 1,957,027 |
| Parsley Energy, Inc., Class A(b) | 99,845 | 1,898,053 |
| Viper Energy Partners L.P. | 77,639 | 2,392,834 |
| | | | 6,247,914 |
| Paper Packaging–1.05% |
| Graphic Packaging Holding Co. | 196,470 | 2,746,651 |
| Property & Casualty Insurance–4.16% |
| Argo Group International Holdings Ltd. | 50,610 | 3,747,671 |
| Hanover Insurance Group, Inc. (The) | 32,258 | 4,138,701 |
| Selective Insurance Group, Inc. | 39,825 | 2,982,494 |
| | | | 10,868,866 |
| Real Estate Services–1.13% |
| FirstService Corp. (Canada) | 30,562 | 2,940,561 |
| Regional Banks–7.59% |
| Columbia Banking System, Inc. | 75,262 | 2,722,979 |
| Great Western Bancorp, Inc. | 72,605 | 2,593,451 |
| IBERIABANK Corp. | 44,196 | 3,352,267 |
| Synovus Financial Corp. | 58,551 | 2,049,285 |
| UMB Financial Corp. | 40,552 | 2,669,133 |
| | Shares | Value |
| Regional Banks–(continued) |
| Webster Financial Corp. | 74,841 | $3,575,154 |
| Western Alliance Bancorp(b) | 64,478 | 2,883,456 |
| | | | 19,845,725 |
| Restaurants–1.68% |
| Papa John’s International, Inc.(c) | 39,740 | 1,777,173 |
| Wendy’s Co. (The) | 133,034 | 2,604,806 |
| | | | 4,381,979 |
| Semiconductor Equipment–1.47% |
| Brooks Automation, Inc. | 99,166 | 3,842,682 |
| Semiconductors–1.68% |
| Power Integrations, Inc. | 22,229 | 1,782,321 |
| Semtech Corp.(b) | 54,294 | 2,608,827 |
| | | | 4,391,148 |
| Specialized Consumer Services–1.29% |
| ServiceMaster Global Holdings, Inc.(b) | 64,702 | 3,370,327 |
| Specialized REITs–2.52% |
| CubeSmart | 117,456 | 3,927,729 |
| CyrusOne, Inc. | 45,906 | 2,649,694 |
| | | | 6,577,423 |
| Specialty Chemicals–1.92% |
| Minerals Technologies, Inc. | 43,709 | 2,338,869 |
| Sensient Technologies Corp. | 36,565 | 2,686,796 |
| | | | 5,025,665 |
| Systems Software–0.96% |
| Rapid7, Inc.(b) | 43,578 | 2,520,552 |
| Technology Distributors–1.15% |
| Tech Data Corp.(b) | 28,748 | 3,007,041 |
| Tires & Rubber–0.90% |
| Cooper Tire & Rubber Co. | 74,855 | 2,361,675 |
| Trading Companies & Distributors–0.89% |
| Univar, Inc.(b) | 105,482 | 2,324,823 |
| Trucking–2.29% |
| Knight-Swift Transportation Holdings, Inc. | 78,613 | 2,581,651 |
| Old Dominion Freight Line, Inc. | 22,824 | 3,406,710 |
| | | | 5,988,361 |
| Water Utilities–1.03% |
| California Water Service Group | 53,281 | 2,697,617 |
| Total Common Stocks & Other Equity Interests (Cost $205,295,725) | 250,135,860 |
| Money Market Funds–4.35% |
| Invesco Government & Agency Portfolio, Institutional Class, 2.26%(d) | 3,980,193 | 3,980,193 |
| Invesco Liquid Assets Portfolio, Institutional Class, 2.40%(d) | 2,842,494 | 2,843,631 |
See accompanying Notes to Financial Statements which are an integral part of the financial statements.
Invesco V.I. Small Cap Equity Fund
| | Shares | Value |
| Money Market Funds–(continued) |
| Invesco Treasury Portfolio, Institutional Class, 2.22%(d) | 4,548,791 | $4,548,791 |
| Total Money Market Funds (Cost $11,372,095) | 11,372,615 |
| TOTAL INVESTMENTS IN SECURITIES (excluding investments purchased with cash collateral from securities on loan)-100.03% (Cost $216,667,820) | | | 261,508,475 |
| Investments Purchased with Cash Collateral from Securities on Loan |
| Money Market Funds–1.18% |
| Invesco Government & Agency Portfolio, Institutional Class, 2.26%(d)(e) | 2,213,281 | 2,213,281 |
| | Shares | Value |
| Money Market Funds–(continued) |
| Invesco Liquid Assets Portfolio, Institutional Class, 2.40%(d)(e) | 883,609 | $883,962 |
| Total Investments Purchased with Cash Collateral from Securities on Loan (Cost $3,097,234) | 3,097,243 |
| TOTAL INVESTMENTS IN SECURITIES–101.21% (Cost $219,765,054) | 264,605,718 |
| OTHER ASSETS LESS LIABILITIES–(1.21)% | (3,162,976) |
| NET ASSETS–100.00% | $261,442,742 |
Investment Abbreviations:
| REIT | – Real Estate Investment Trust |
Notes to Schedule of Investments:
| (a) | Industry and/or sector classifications used in this report are generally according to the Global Industry Classification Standard, which was developed by and is the exclusive property and a service mark of MSCI Inc. and Standard & Poor’s. |
| (b) | Non-income producing security. |
| (c) | All or a portion of this security was out on loan at June 30, 2019. |
| (d) | The money market fund and the Fund are affiliated by having the same investment adviser. The rate shown is the 7-day SEC standardized yield as of June 30, 2019. |
| (e) | The security has been segregated to satisfy the commitment to return the cash collateral received in securities lending transactions upon the borrower’s return of the securities loaned. See Note 1I. |
Portfolio Composition
By sector, based on Net Assets
as of June 30, 2019
| Industrials | 18.23% |
| Financials | 17.00 |
| Information Technology | 16.58 |
| Health Care | 13.30 |
| Consumer Discretionary | 12.43 |
| Real Estate | 5.46 |
| Materials | 4.00 |
| Energy | 3.88 |
| Other Sectors, Each Less than 2% of Net Assets | 4.80 |
| Money Market Funds Plus Other Assets Less Liabilities | 4.32 |
See accompanying Notes to Financial Statements which are an integral part of the financial statements.
Invesco V.I. Small Cap Equity Fund
Statement of Assets and Liabilities
June 30, 2019
(Unaudited)
| Assets: | |
Investments in securities, at value
(Cost $205,295,725)* | $250,135,860 |
| Investments in affiliated money market funds, at value (Cost $14,469,329) | 14,469,858 |
| Cash | 8,915 |
| Receivable for: | |
| Dividends | 181,015 |
| Fund shares sold | 272,760 |
| Investments sold | 539,182 |
| Investment for trustee deferred compensation and retirement plans | 79,005 |
| Total assets | 265,686,595 |
| Liabilities: | |
| Payable for: | |
| Investments purchased | 741,304 |
| Fund shares reacquired | 95,568 |
| Collateral upon return of securities loaned | 3,097,234 |
| Accrued fees to affiliates | 187,648 |
| Accrued trustees’ and officers’ fees and benefits | 655 |
| Accrued other operating expenses | 34,076 |
| Trustee deferred compensation and retirement plans | 87,368 |
| Total liabilities | 4,243,853 |
| Net assets applicable to shares outstanding | $261,442,742 |
| Net assets consist of: | |
| Shares of beneficial interest | $180,406,998 |
| Distributable earnings | 81,035,744 |
| | $261,442,742 |
| Net Assets: |
| Series I | $118,784,091 |
| Series II | $142,658,651 |
| Shares outstanding, no par value, with an unlimited number of shares authorized: |
| Series I | 6,249,781 |
| Series II | 7,946,112 |
| Series I: | |
| Net asset value per share | $19.01 |
| Series II: | |
| Net asset value per share | $17.95 |
| * | At June 30, 2019, securities with an aggregate value of $3,035,429 were on loan to brokers. |
Statement of Operations
For the six months ended June 30, 2019
(Unaudited)
| Investment income: | |
| Dividends (net of foreign withholding taxes of $6,851) | $1,680,942 |
| Dividends from affiliated money market funds (includes securities lending income of $16,311) | 124,101 |
| Total investment income | 1,805,043 |
| Expenses: | |
| Advisory fees | 943,443 |
| Administrative services fees | 207,884 |
| Custodian fees | 4,251 |
| Distribution fees - Series II | 170,493 |
| Transfer agent fees | 15,496 |
| Trustees’ and officers’ fees and benefits | 13,410 |
| Reports to shareholders | 5,107 |
| Professional services fees | 23,677 |
| Other | 2,328 |
| Total expenses | 1,386,089 |
| Less: Fees waived | (4,811) |
| Net expenses | 1,381,278 |
| Net investment income | 423,765 |
| Realized and unrealized gain (loss) from: | |
| Net realized gain (loss) from: | |
| Investment securities | 5,024,467 |
| Foreign currencies | (65) |
| Forward foreign currency contracts | 133 |
| | 5,024,535 |
| Change in net unrealized appreciation of Investment securities | 37,825,460 |
| Net realized and unrealized gain | 42,849,995 |
| Net increase in net assets resulting from operations | $43,273,760 |
See accompanying Notes to Financial Statements which are an integral part of the financial statements.
Invesco V.I. Small Cap Equity Fund
Statement of Changes in Net Assets
For the six months ended June 30, 2019 and the year ended December 31, 2018
(Unaudited)
| | June 30,
2019 | December 31,
2018 |
| Operations: | | |
| Net investment income (loss) | $423,765 | $(76,606) |
| Net realized gain | 5,024,535 | 31,854,197 |
| Change in net unrealized appreciation (depreciation) | 37,825,460 | (70,466,254) |
| Net increase (decrease) in net assets resulting from operations | 43,273,760 | (38,688,663) |
| Distributions to shareholders from distributable earnings: | | |
| Series I | — | (8,819,904) |
| Series II | — | (10,565,170) |
| Total distributions from distributable earnings | — | (19,385,074) |
| Share transactions–net: | | |
| Series I | (7,618,884) | (16,916,326) |
| Series II | 59,047 | (6,035,415) |
| Net increase (decrease) in net assets resulting from share transactions | (7,559,837) | (22,951,741) |
| Net increase (decrease) in net assets | 35,713,923 | (81,025,478) |
| Net assets: | | |
| Beginning of period | 225,728,819 | 306,754,297 |
| End of period | $261,442,742 | $225,728,819 |
See accompanying Notes to Financial Statements which are an integral part of the financial statements.
Invesco V.I. Small Cap Equity Fund
Financial Highlights
June 30, 2019
(Unaudited)
The following schedule presents financial highlights for a share of the Fund outstanding throughout the periods indicated.
| | Net asset
value,
beginning
of period | Net
investment
income
(loss)(a) | Net gains
(losses)
on securities
(both
realized and
unrealized) | Total from
investment
operations | Distributions
from net
realized
gains | Net asset
value, end
of period | Total
return(b) | Net assets,
end of period
(000’s omitted) | Ratio of
expenses
to average
net assets
with fee waivers
and/or expenses
absorbed | Ratio of
expenses
to average net
assets without
fee waivers
and/or expenses
absorbed | Ratio of net
investment
income
(loss)
to average
net assets | Portfolio
turnover(c) |
| Series I |
| Six months ended 06/30/19 | $15.93 | $0.04 | $3.04 | $3.08 | $— | $19.01 | 19.34% | $118,784 | 0.96%(d) | 0.96%(d) | 0.46%(d) | 16% |
| Year ended 12/31/18 | 20.02 | 0.02 | (2.74) | (2.72) | (1.37) | 15.93 | (15.08) | 106,064 | 0.96 | 0.96 | 0.10 | 22 |
| Year ended 12/31/17 | 18.38 | (0.01) | 2.53 | 2.52 | (0.88) | 20.02 | 14.06 | 149,405 | 0.97 | 0.97 | (0.02) | 20 |
| Year ended 12/31/16 | 17.64 | 0.01 | 2.06 | 2.07 | (1.33) | 18.38 | 12.06 | 161,727 | 1.01 | 1.01 | 0.04 | 37 |
| Year ended 12/31/15 | 23.64 | 0.00 | (1.27) | (1.27) | (4.73) | 17.64 | (5.52) | 166,407 | 1.04 | 1.04 | 0.02 | 31 |
| Year ended 12/31/14 | 25.44 | (0.04) | 0.47 | 0.43 | (2.23) | 23.64 | 2.36 | 203,963 | 1.05 | 1.05 | (0.17) | 45 |
| Series II |
| Six months ended 06/30/19 | 15.07 | 0.02 | 2.86 | 2.88 | — | 17.95 | 19.11 | 142,659 | 1.21(d) | 1.21(d) | 0.21(d) | 16 |
| Year ended 12/31/18 | 19.05 | (0.03) | (2.58) | (2.61) | (1.37) | 15.07 | (15.27) | 119,664 | 1.21 | 1.21 | (0.15) | 22 |
| Year ended 12/31/17 | 17.58 | (0.05) | 2.40 | 2.35 | (0.88) | 19.05 | 13.73 | 157,349 | 1.22 | 1.22 | (0.27) | 20 |
| Year ended 12/31/16 | 16.96 | (0.03) | 1.98 | 1.95 | (1.33) | 17.58 | 11.84 | 148,883 | 1.26 | 1.26 | (0.21) | 37 |
| Year ended 12/31/15 | 22.97 | (0.05) | (1.23) | (1.28) | (4.73) | 16.96 | (5.74) | 128,614 | 1.29 | 1.29 | (0.23) | 31 |
| Year ended 12/31/14 | 24.85 | (0.10) | 0.45 | 0.35 | (2.23) | 22.97 | 2.08 | 145,505 | 1.30 | 1.30 | (0.42) | 45 |
| (a) | Calculated using average shares outstanding. |
| (b) | Includes adjustments in accordance with accounting principles generally accepted in the United States of America and as such, the net asset value for financial reporting purposes and the returns based upon those net asset values may differ from the net asset value and returns for shareholder transactions. Total returns are not annualized for periods less than one year, if applicable, and do not reflect charges assessed in connection with a variable product, which if included would reduce total returns. |
| (c) | Portfolio turnover is calculated at the fund level and is not annualized for periods less than one year, if applicable. |
| (d) | Ratios are annualized and based on average daily net assets (000’s omitted) of $117,958 and $137,525 for Series I and Series II shares, respectively. |
See accompanying Notes to Financial Statements which are an integral part of the financial statements.
Invesco V.I. Small Cap Equity Fund
Notes to Financial Statements
June 30, 2019
(Unaudited)
NOTE 1—Significant Accounting Policies
Invesco V.I. Small Cap Equity Fund (the “Fund”) is a series portfolio of AIM Variable Insurance Funds (Invesco Variable Insurance Funds) (the “Trust”). The Trust is a Delaware statutory trust registered under the Investment Company Act of 1940, as amended (the “1940 Act”), as an open-end series management investment company. Information presented in these financial statements pertains only to the Fund. Matters affecting the Fund or each class will be voted on exclusively by the shareholders of the Fund or each class. Current Securities and Exchange Commission (“SEC”) guidance, however, requires participating insurance companies offering separate accounts to vote shares proportionally in accordance with the instructions of the contract owners whose investments are funded by shares of each Fund or class.
The Fund’s investment objective is long-term growth of capital.
The Fund currently offers two classes of shares, Series I and Series II, both of which are offered to insurance company separate accounts funding variable annuity contracts and variable life insurance policies (“variable products”).
The Fund is an investment company and accordingly follows the investment company accounting and reporting guidance in accordance with Financial Accounting Standards Board Accounting Standards Codification Topic 946,Financial Services – Investment Companies.
The following is a summary of the significant accounting policies followed by the Fund in the preparation of its financial statements.
| A. | Security Valuations — Securities, including restricted securities, are valued according to the following policy. |
A security listed or traded on an exchange (except convertible securities) is valued at its last sales price or official closing price as of the close of the customary trading session on the exchange where the security is principally traded, or lacking any sales or official closing price on a particular day, the security may be valued at the closing bid price on that day. Securities traded in the over-the-counter market are valued based on prices furnished by independent pricing services or market makers. When such securities are valued by an independent pricing service they may be considered fair valued. Futures contracts are valued at the final settlement price set by an exchange on which they are principally traded. Listed options are valued at the mean between the last bid and asked prices from the exchange on which they are principally traded. Options not listed on an exchange are valued by an independent source at the mean between the last bid and asked prices. For purposes of determining net asset value (“NAV”) per share, futures and option contracts generally are valued 15 minutes after the close of the customary trading session of the New York Stock Exchange (“NYSE”).
Investments in open-end and closed-end registered investment companies that do not trade on an exchange are valued at the end-of-day net asset value per share. Investments in open-end and closed-end registered investment companies that trade on an exchange are valued at the last sales price or official closing price as of the close of the customary trading session on the exchange where the security is principally traded.
Debt obligations (including convertible securities) and unlisted equities are fair valued using an evaluated quote provided by an independent pricing service. Evaluated quotes provided by the pricing service may be determined without exclusive reliance on quoted prices, and may reflect appropriate factors such as institution-size trading in similar groups of securities, developments related to specific securities, dividend rate (for unlisted equities), yield (for debt obligations), quality, type of issue, coupon rate (for debt obligations), maturity (for debt obligations), individual trading characteristics and other market data. Pricing services generally value debt obligations assuming orderly transactions of institutional round lot size, but a fund may hold or transact in the same securities in smaller, odd lot sizes. Odd lots often trade at lower prices than institutional round lots. Debt obligations are subject to interest rate and credit risks. In addition, all debt obligations involve some risk of default with respect to interest and/or principal payments.
Foreign securities’ (including foreign exchange contracts) prices are converted into U.S. dollar amounts using the applicable exchange rates as of the close of the NYSE. If market quotations are available and reliable for foreign exchange-traded equity securities, the securities will be valued at the market quotations. Because trading hours for certain foreign securities end before the close of the NYSE, closing market quotations may become unreliable. If between the time trading ends on a particular security and the close of the customary trading session on the NYSE, events occur that the investment adviser determines are significant and make the closing price unreliable, the Fund may fair value the security. If the event is likely to have affected the closing price of the security, the security will be valued at fair value in good faith using procedures approved by the Board of Trustees. Adjustments to closing prices to reflect fair value may also be based on a screening process of an independent pricing service to indicate the degree of certainty, based on historical data, that the closing price in the principal market where a foreign security trades is not the current value as of the close of the NYSE. Foreign securities’ prices meeting the approved degree of certainty that the price is not reflective of current value will be priced at the indication of fair value from the independent pricing service. Multiple factors may be considered by the independent pricing service in determining adjustments to reflect fair value and may include information relating to sector indices, American Depositary Receipts and domestic and foreign index futures. Foreign securities may have additional risks including exchange rate changes, potential for sharply devalued currencies and high inflation, political and economic upheaval, the relative lack of issuer information, relatively low market liquidity and the potential lack of strict financial and accounting controls and standards.
Securities for which market prices are not provided by any of the above methods may be valued based upon quotes furnished by independent sources. The last bid price may be used to value equity securities. The mean between the last bid and asked prices is used to value debt obligations, including corporate loans.
Securities for which market quotations are not readily available or became unreliable are valued at fair value as determined in good faith by or under the supervision of the Trust’s officers following procedures approved by the Board of Trustees. Issuer specific events, market trends, bid/asked quotes of brokers and information providers and other market data may be reviewed in the course of making a good faith determination of a security’s fair value.
The Fund may invest in securities that are subject to interest rate risk, meaning the risk that the prices will generally fall as interest rates rise and, conversely, the prices will generally rise as interest rates fall. Specific securities differ in their sensitivity to changes in interest rates depending on their individual characteristics. Changes in interest rates may result in increased market volatility, which may affect the value and/or liquidity of certain Fund investments.
Invesco V.I. Small Cap Equity Fund
Valuations change in response to many factors including the historical and prospective earnings of the issuer, the value of the issuer’s assets, general economic conditions, interest rates, investor perceptions and market liquidity. Because of the inherent uncertainties of valuation, the values reflected in the financial statements may materially differ from the value received upon actual sale of those investments.
| B. | Securities Transactions and Investment Income — Securities transactions are accounted for on a trade date basis. Realized gains or losses on sales are computed on the basis of specific identification of the securities sold. Interest income (net of withholding tax, if any) is recorded on the accrual basis from settlement date. Dividend income (net of withholding tax, if any) is recorded on the ex-dividend date. |
The Fund may periodically participate in litigation related to Fund investments. As such, the Fund may receive proceeds from litigation settlements. Any proceeds received are included in the Statement of Operations as realized gain (loss) for investments no longer held and as unrealized gain (loss) for investments still held.
Brokerage commissions and mark ups are considered transaction costs and are recorded as an increase to the cost basis of securities purchased and/or a reduction of proceeds on a sale of securities. Such transaction costs are included in the determination of net realized and unrealized gain (loss) from investment securities reported in the Statement of Operations and the Statement of Changes in Net Assets and the net realized and unrealized gains (losses) on securities per share in the Financial Highlights. Transaction costs are included in the calculation of the Fund’s net asset value and, accordingly, they reduce the Fund’s total returns. These transaction costs are not considered operating expenses and are not reflected in net investment income reported in the Statement of Operations and the Statement of Changes in Net Assets, or the net investment income per share and the ratios of expenses and net investment income reported in the Financial Highlights, nor are they limited by any expense limitation arrangements between the Fund and the investment adviser.
The Fund allocates income and realized and unrealized capital gains and losses to a class based on the relative net assets of each class.
| C. | Country Determination — For the purposes of making investment selection decisions and presentation in the Schedule of Investments, the investment adviser may determine the country in which an issuer is located and/or credit risk exposure based on various factors. These factors include the laws of the country under which the issuer is organized, where the issuer maintains a principal office, the country in which the issuer derives 50% or more of its total revenues and the country that has the primary market for the issuer’s securities, as well as other criteria. Among the other criteria that may be evaluated for making this determination are the country in which the issuer maintains 50% or more of its assets, the type of security, financial guarantees and enhancements, the nature of the collateral and the sponsor organization. Country of issuer and/or credit risk exposure has been determined to be the United States of America, unless otherwise noted. |
| D. | Distributions– Distributions from net investment income and net realized capital gain, if any, are generally declared and paid to separate accounts of participating insurance companies annually and recorded on the ex-dividend date. |
| E. | Federal Income Taxes –The Fund intends to comply with the requirements of Subchapter M of the Internal Revenue Code of 1986, as amended (the “Internal Revenue Code”), necessary to qualify as a regulated investment company and to distribute substantially all of the Fund’s taxable earnings to shareholders. As such, the Fund will not be subject to federal income taxes on otherwise taxable income (including net realized capital gain) that is distributed to shareholders. Therefore, no provision for federal income taxes is recorded in the financial statements. |
The Fund recognizes the tax benefits of uncertain tax positions only when the position is more likely than not to be sustained. Management has analyzed the Fund’s uncertain tax positions and concluded that no liability for unrecognized tax benefits should be recorded related to uncertain tax positions. Management is not aware of any tax positions for which it is reasonably possible that the total amounts of unrecognized tax benefits will change materially in the next 12 months.
The Fund files tax returns in the U.S. Federal jurisdiction and certain other jurisdictions. Generally, the Fund is subject to examinations by such taxing authorities for up to three years after the filing of the return for the tax period.
| F. | Expenses– Fees provided for under the Rule 12b-1 plan of a particular class of the Fund and which are directly attributable to that class are charged to the operations of such class. All other expenses are allocated among the classes based on relative net assets. |
| G. | Accounting Estimates – The preparation of financial statements in conformity with accounting principles generally accepted in the United States of America (“GAAP”) requires management to make estimates and assumptions that affect the reported amounts of assets and liabilities at the date of the financial statements and the reported amounts of revenues and expenses during the reporting period including estimates and assumptions related to taxation. Actual results could differ from those estimates by a significant amount. In addition, the Fund monitors for material events or transactions that may occur or become known after the period-end date and before the date the financial statements are released to print. |
| H. | Indemnifications – Under the Trust’s organizational documents, each Trustee, officer, employee or other agent of the Trust is indemnified against certain liabilities that may arise out of the performance of their duties to the Fund. Additionally, in the normal course of business, the Fund enters into contracts, including the Fund’s servicing agreements, that contain a variety of indemnification clauses. The Fund’s maximum exposure under these arrangements is unknown as this would involve future claims that may be made against the Fund that have not yet occurred. The risk of material loss as a result of such indemnification claims is considered remote. |
| I. | Securities Lending– The Fund may lend portfolio securities having a market value up to one-third of the Fund’s total assets. Such loans are secured by collateral equal to no less than the market value of the loaned securities determined daily by the securities lending provider. Such collateral will be cash or debt securities issued or guaranteed by the U.S. Government or any of its sponsored agencies. Cash collateral received in connection with these loans is invested in short-term money market instruments or affiliated money market funds and is shown as such on the Schedule of Investments. The Fund bears the risk of loss with respect to the investment of collateral. It is the Fund’s policy to obtain additional collateral from or return excess collateral to the borrower by the end of the next business day, following the valuation date of the securities loaned. Therefore, the value of the collateral held may be temporarily less than the value of the securities on loan. When loaning securities, the Fund retains certain benefits of owning the securities, including the economic equivalent of dividends or interest generated by the security. Lending securities entails a risk of loss to the Fund if, and to the extent that, the market value of the securities loaned were to increase and the borrower did not increase the collateral accordingly, and the borrower failed to return the securities. The securities loaned are subject to termination at the option of the borrower or the Fund. Upon termination, the borrower will return to the Fund the securities loaned and the Fund will return the collateral. Upon the failure of the borrower to return the securities, collateral may be liquidated and the securities may be purchased on the open market to replace the loaned securities. The Fund could experience delays and costs in gaining access to the collateral and the securities may lose value during the delay which could result in potential losses to the Fund. Some of these losses may be indemnified by the lending agent. The Fund bears the risk of any deficiency in the amount of the collateral available for return to the borrower due to any loss on the |
Invesco V.I. Small Cap Equity Fund
| | collateral invested. Dividends received on cash collateral investments for securities lending transactions, which are net of compensation to counterparties, are included inDividends from affiliated money market funds on the Statement of Operations. The aggregate value of securities out on loan, if any, is shown as a footnote on the Statement of Assets and Liabilities. |
| J. | Foreign Currency Translations— Foreign currency is valued at the close of the NYSE based on quotations posted by banks and major currency dealers. Portfolio securities and other assets and liabilities denominated in foreign currencies are translated into U.S. dollar amounts at the date of valuation. Purchases and sales of portfolio securities (net of foreign taxes withheld on disposition) and income items denominated in foreign currencies are translated into U.S. dollar amounts on the respective dates of such transactions. The Fund does not separately account for the portion of the results of operations resulting from changes in foreign exchange rates on investments and the fluctuations arising from changes in market prices of securities held. The combined results of changes in foreign exchange rates and the fluctuation of market prices on investments (net of estimated foreign tax withholding) are included with the net realized and unrealized gain or loss from investments in the Statement of Operations. Reported net realized foreign currency gains or losses arise from (1) sales of foreign currencies, (2) currency gains or losses realized between the trade and settlement dates on securities transactions, and (3) the difference between the amounts of dividends, interest, and foreign withholding taxes recorded on the Fund’s books and the U.S. dollar equivalent of the amounts actually received or paid. Net unrealized foreign currency gains and losses arise from changes in the fair values of assets and liabilities, other than investments in securities at fiscal period end, resulting from changes in exchange rates. |
The Fund may invest in foreign securities, which may be subject to foreign taxes on income, gains on investments or currency repatriation, a portion of which may be recoverable. Foreign taxes, if any, are recorded based on the tax regulations and rates that exist in the foreign markets in which the Fund invests and are shown in the Statement of Operations.
| K. | Forward Foreign Currency Contracts— The Fund may engage in foreign currency transactions either on a spot (i.e. for prompt delivery and settlement) basis, or through forward foreign currency contracts, to manage or minimize currency or exchange rate risk. |
The Fund may also enter into forward foreign currency contracts for the purchase or sale of a security denominated in a foreign currency in order to “lock in” the U.S. dollar price of that security, or the Fund may also enter into forward foreign currency contracts that do not provide for physical settlement of the two currencies, but instead are settled by a single cash payment calculated as the difference between the agreed upon exchange rate and the spot rate at settlement based upon an agreed upon notional amount (non-deliverable forwards). The Fund will set aside liquid assets in an amount equal to the daily mark-to-market obligation for forward foreign currency contracts.
A forward foreign currency contract is an obligation between two parties (“Counterparties”) to purchase or sell a specific currency for an agreed-upon price at a future date. The use of forward foreign currency contracts does not eliminate fluctuations in the price of the underlying securities the Fund owns or intends to acquire but establishes a rate of exchange in advance. Fluctuations in the value of these contracts are measured by the difference in the contract date and reporting date exchange rates and are recorded as unrealized appreciation (depreciation) until the contracts are closed. When the contracts are closed, realized gains (losses) are recorded. Realized and unrealized gains (losses) on the contracts are included in the Statement of Operations. The primary risks associated with forward foreign currency contracts include failure of the Counterparty to meet the terms of the contract and the value of the foreign currency changing unfavorably. These risks may be in excess of the amounts reflected in the Statement of Assets and Liabilities.
NOTE 2—Advisory Fees and Other Fees Paid to Affiliates
The Trust has entered into a master investment advisory agreement with Invesco Advisers, Inc. (the "Adviser" or "Invesco"). Under the terms of the investment advisory agreement, the Fund accrues daily and pays monthly an advisory fee to the Adviser based on the annual rate of the Fund’s average daily net assets as follows:
| Average Daily Net Assets | Rate |
| First $250 million | 0.745% |
| Next $250 million | 0.73% |
| Next $500 million | 0.715% |
| Next $1.5 billion | 0.70% |
| Next $2.5 billion | 0.685% |
| Next $2.5 billion | 0.67% |
| Next $2.5 billion | 0.655% |
| Over $10 billion | 0.64% |
For the six months ended June 30, 2019, the effective advisory fees incurred by the Fund was 0.74%.
Under the terms of a master sub-advisory agreement between the Adviser and each of Invesco Asset Management Deutschland GmbH, Invesco Asset Management Limited, Invesco Asset Management (Japan) Limited, Invesco Hong Kong Limited, Invesco Senior Secured Management, Inc. and Invesco Canada Ltd. and separate sub-advisory agreements with Invesco Capital Management LLC and Invesco Asset Management (India) Private Limited (collectively, the "Affiliated Sub-Advisers") the Adviser, not the Fund, will pay 40% of the fees paid to the Adviser to any such Affiliated Sub-Adviser(s) that provide(s) discretionary investment management services to the Fund based on the percentage of assets allocated to such Affiliated Sub-Adviser(s).
The Adviser has contractually agreed, through at least June 30, 2020, to waive advisory fees and/or reimburse expenses of all shares to the extent necessary to limit total annual fund operating expenses after fee waiver and/or expense reimbursement (excluding certain items discussed below) of Series I shares to 2.00% and Series II shares to 2.25% of average daily net assets (the “expense limits”). In determining the Adviser’s obligation to waive advisory fees and/or reimburse expenses, the following expenses are not taken into account, and could cause the total annual fund operating expenses after fee waiver and/or expense reimbursement to exceed the numbers reflected above: (1) interest; (2) taxes; (3) dividend expense on short sales; (4) extraordinary or non-routine items, including litigation expenses; and (5) expenses that the Fund has incurred but did not actually pay because of an expense offset arrangement. Unless Invesco continues the fee waiver agreement, it will terminate on June 30, 2020.
Invesco V.I. Small Cap Equity Fund
During its term, the fee waiver agreement cannot be terminated or amended to increase the expense limits or reduce the advisory fee waiver without approval of the Board of Trustees. The Adviser did not waive fees and/or reimburse expenses during the period under these expense limits.
Further, the Adviser has contractually agreed, through at least June 30, 2021, to waive the advisory fee payable by the Fund in an amount equal to 100% of the net advisory fees the Adviser receives from the affiliated money market funds on investments by the Fund of uninvested cash (excluding investments of cash collateral from securities lending) in such affiliated money market funds.
For the six months ended June 30, 2019, the Adviser waived advisory fees of $4,811.
The Trust has entered into a master administrative services agreement with Invesco pursuant to which the Fund has agreed to pay Invesco a fee for costs incurred in providing accounting services and fund administrative services to the Fund and to reimburse Invesco for fees paid to insurance companies that have agreed to provide certain administrative services to the Fund. These administrative services provided by the insurance companies may include, among other things: maintenance of master accounts with the Fund; tracking, recording and transmitting net purchase and redemption orders for Fund shares; maintaining and preserving records related to the purchase, redemption and other account activity of variable product owners; distributing copies of Fund documents such as prospectuses, proxy materials and periodic reports, to variable product owners, and responding to inquiries from variable product owners about the Fund. Pursuant to such agreement, for the six months ended June 30, 2019, Invesco was paid $17,891 for accounting and fund administrative services and was reimbursed $189,993 for fees paid to insurance companies. Also, Invesco has entered into a sub-administration agreement whereby State Street Bank and Trust Company (“SSB”) serves as custodian and fund accountant and provides certain administrative services to the Fund.
The Trust has entered into a transfer agency and service agreement with Invesco Investment Services, Inc. (“IIS”) pursuant to which the Fund has agreed to pay IIS a fee for providing transfer agency and shareholder services to the Fund and reimburse IIS for certain expenses incurred by IIS in the course of providing such services. IIS may make payments to intermediaries that provide omnibus account services, sub-accounting services and/or networking services. All fees payable by IIS to intermediaries that provide omnibus account services or sub-accounting services are charged back to the Fund, subject to certain limitations approved by the Trust’s Board of Trustees. For the six months ended June 30, 2019, expenses incurred under the agreement are shown in the Statement of Operations asTransfer agent fees.
The Trust has entered into a master distribution agreement with Invesco Distributors, Inc. (“IDI”) to serve as the distributor for the Fund. The Trust has adopted a plan pursuant to Rule 12b-1 under the 1940 Act with respect to the Fund’s Series II shares (the “Plan”). The Fund, pursuant to the Plan, pays IDI compensation at the annual rate of 0.25% of the Fund’s average daily net assets of Series II shares. The fees are accrued daily and paid monthly. Of the Plan payments, up to 0.25% of the average daily net assets of the Series II shares may be paid to insurance companies who furnish continuing personal shareholder services to customers who purchase and own Series II shares of the Fund. For the six months ended June 30, 2019, expenses incurred under the Plan are detailed in the Statement of Operations asDistribution fees.
For the six months ended June 30, 2019, the Fund incurred $2,460 in brokerage commissions with Invesco Capital Markets, Inc., an affiliate of the Adviser and IDI, for portfolio transactions executed on behalf of the Fund.
Certain officers and trustees of the Trust are officers and directors of the Adviser, IIS and/or IDI.
NOTE 3—Additional Valuation Information
GAAP defines fair value as the price that would be received to sell an asset or paid to transfer a liability in an orderly transaction between market participants at the measurement date, under current market conditions. GAAP establishes a hierarchy that prioritizes the inputs to valuation methods, giving the highest priority to readily available unadjusted quoted prices in an active market for identical assets (Level 1) and the lowest priority to significant unobservable inputs (Level 3), generally when market prices are not readily available or are unreliable. Based on the valuation inputs, the securities or other investments are tiered into one of three levels. Changes in valuation methods may result in transfers in or out of an investment’s assigned level:
Level 1 — Prices are determined using quoted prices in an active market for identical assets.
Level 2 — Prices are determined using other significant observable inputs. Observable inputs are inputs that other market participants may use in pricing a security. These may include quoted prices for similar securities, interest rates, prepayment speeds, credit risk, yield curves, loss severities, default rates, discount rates, volatilities and others.
Level 3 — Prices are determined using significant unobservable inputs. In situations where quoted prices or observable inputs are unavailable (for example, when there is little or no market activity for an investment at the end of the period), unobservable inputs may be used. Unobservable inputs reflect the Fund’s own assumptions about the factors market participants would use in determining fair value of the securities or instruments and would be based on the best available information.
As of June 30, 2019, all of the securities in this Fund were valued based on Level 1 inputs (see the Schedule of Investments for security categories). The level assigned to the securities valuations may not be an indication of the risk or liquidity associated with investing in those securities. Because of the inherent uncertainties of valuation, the values reflected in the financial statements may materially differ from the value received upon actual sale of those investments.
NOTE 4—Derivative Investments
The Fund may enter into an International Swaps and Derivatives Association Master Agreement (“ISDA Master Agreement”) under which a fund may trade OTC derivatives. An OTC transaction entered into under an ISDA Master Agreement typically involves a collateral posting arrangement, payment netting provisions and close-out netting provisions. These netting provisions allow for reduction of credit risk through netting of contractual obligations. The enforceability of the netting provisions of the ISDA Master Agreement depends on the governing law of the ISDA Master Agreement, among other factors.
For financial reporting purposes, the Fund does not offset OTC derivative assets or liabilities that are subject to ISDA Master Agreements in the Statement of Assets and Liabilities.
Invesco V.I. Small Cap Equity Fund
Effect of Derivative Investments for the six months ended June 30, 2019
The table below summarizes the gains (losses) on derivative investments, detailed by primary risk exposure, recognized in earnings during the period:
| | Location of Gain on
Statement of Operations |
| | Currency
Risk |
| Realized Gain: | |
| Forward foreign currency contracts | $133 |
| Total | $133 |
The table below summarizes the five day average notional value of derivatives held during the period.
| | Forward
Foreign Currency
Contracts |
| Average notional value | $47,267 |
NOTE 5—Trustees’ and Officers’ Fees and Benefits
Trustees’ and Officers’ Fees and Benefits include amounts accrued by the Fund to pay remuneration to certain Trustees and Officers of the Fund. Trustees have the option to defer compensation payable by the Fund, and Trustees’ and Officers’ Fees and Benefits also include amounts accrued by the Fund to fund such deferred compensation amounts. Those Trustees who defer compensation have the option to select various Invesco Funds in which their deferral accounts shall be deemed to be invested. Finally, certain current Trustees were eligible to participate in a retirement plan that provided for benefits to be paid upon retirement to Trustees over a period of time based on the number of years of service. The Fund may have certain former Trustees who also participate in a retirement plan and receive benefits under such plan.Trustees’ and Officers’ Fees and Benefits include amounts accrued by the Fund to fund such retirement benefits. Obligations under the deferred compensation and retirement plans represent unsecured claims against the general assets of the Fund.
NOTE 6—Cash Balances
The Fund is permitted to temporarily carry a negative or overdrawn balance in its account with State Street Bank and Trust Company, the custodian bank. Such balances, if any at period-end, are shown in the Statement of Assets and Liabilities under the payable caption Amount due custodian. To compensate the custodian bank for such overdrafts, the overdrawn Fund may either (1) leave funds as a compensating balance in the account so the custodian bank can be compensated by earning the additional interest; or (2) compensate by paying the custodian bank at a rate agreed upon by the custodian bank and Invesco, not to exceed the contractually agreed upon rate.
NOTE 7—Tax Information
The amount and character of income and gains to be distributed are determined in accordance with income tax regulations, which may differ from GAAP. Reclassifications are made to the Fund’s capital accounts to reflect income and gains available for distribution (or available capital loss carryforward) under income tax regulations. The tax character of distributions paid during the year and the tax components of net assets will be reported at the Fund’s fiscal year-end.
Capital loss carryforward is calculated and reported as of a specific date. Results of transactions and other activity after that date may affect the amount of capital loss carryforward actually available for the Fund to utilize. Capital losses generated in years beginning after December 22, 2010 can be carried forward for an unlimited period, whereas previous losses expire in eight tax years. Capital losses with an expiration period may not be used to offset capital gains until all net capital losses without an expiration date have been utilized. Capital loss carryforwards with no expiration date will retain their character as either short-term or long-term capital losses instead of as short-term capital losses as under prior law. The ability to utilize capital loss carryforwards in the future may be limited under the Internal Revenue Code and related regulations based on the results of future transactions.
The Fund did not have a capital loss carryforward as of December 31, 2018.
NOTE 8—Investment Transactions
The aggregate amount of investment securities (other than short-term securities, U.S. Treasury obligations and money market funds, if any) purchased and sold by the Fund during the six months ended June 30, 2019 was $39,941,007 and $53,005,040, respectively. Cost of investments, including any derivatives, on a tax basis includes the adjustments for financial reporting purposes as of the most recently completed federal income tax reporting period-end.
| Unrealized Appreciation (Depreciation) of Investments on a Tax Basis |
| Aggregate unrealized appreciation of investments | $61,893,725 |
| Aggregate unrealized (depreciation) of investments | (17,086,598) |
| Net unrealized appreciation of investments | $44,807,127 |
Cost of investments for tax purposes is $219,798,591.
Invesco V.I. Small Cap Equity Fund
NOTE 9—Share Information
| | Summary of Share Activity |
| | Six months ended
June 30, 2019(a) | | Year ended
December 31, 2018 |
| | Shares | Amount | | Shares | Amount |
| Sold: | | | | | |
| Series I | 290,043 | $5,095,127 | | 705,274 | $13,617,305 |
| Series II | 734,742 | 12,582,721 | | 610,379 | 11,139,397 |
| Issued as reinvestment of dividends: | | | | | |
| Series I | — | — | | 433,837 | 8,819,904 |
| Series II | — | — | | 549,125 | 10,565,170 |
| Reacquired: | | | | | |
| Series I | (696,652) | (12,714,011) | | (1,946,379) | (39,353,535) |
| Series II | (729,151) | (12,523,674) | | (1,480,032) | (27,739,982) |
| Net increase (decrease) in share activity | (401,018) | $(7,559,837) | | (1,127,796) | $(22,951,741) |
| (a) | There are entities that are record owners of more than 5% of the outstanding shares of the Fund and in the aggregate own 60% of the outstanding shares of the Fund. The Fund and the Fund’s principal underwriter or adviser, are parties to participation agreements with these entities whereby these entities sell units of interest in separate accounts funding variable products that are invested in the Fund. The Fund, Invesco and/or Invesco affiliates may make payments to these entities, which are considered to be related to the Fund, for providing services to the Fund, Invesco and/or Invesco affiliates including but not limited to services such as, securities brokerage, third party record keeping and account servicing and administrative services. The Fund has no knowledge as to whether all or any portion of the shares owned of record by these entities are also owned beneficially. |
Invesco V.I. Small Cap Equity Fund
Calculating your ongoing Fund expenses
Example
As a shareholder of the Fund, you incur ongoing costs, including management fees; distribution and/or service fees (12b-1); and other Fund expenses. This example is intended to help you understand your ongoing costs (in dollars) of investing in the Fund and to compare these costs with ongoing costs of investing in other mutual funds. The example is based on an investment of $1,000 invested at the beginning of the period and held for the entire period January 1, 2019 through June 30, 2019.
The actual and hypothetical expenses in the examples below do not represent the effect of any fees or other expenses assessed in connection with a variable product; if they did, the expenses shown would be higher while the ending account values shown would be lower.
Actual expenses
The table below provides information about actual account values and actual expenses. You may use the information in this table, together with the amount you invested, to estimate the expenses that you paid over the period. Simply divide your account value by $1,000 (for example, an $8,600 account value divided by $1,000 = 8.6), then multiply the result by the number in the table under the heading entitled “Actual Expenses Paid During Period” to estimate the expenses you paid on your account during this period.
Hypothetical example for comparison purposes
The table below also provides information about hypothetical account values and hypothetical expenses based on the Fund’s actual expense ratio and an assumed rate of return of 5% per year before expenses, which is not the Fund’s actual return.
The hypothetical account values and expenses may not be used to estimate the actual ending account balance or expenses you paid for the period. You may use this information to compare the ongoing costs of investing in the Fund and other funds. To do so, compare this 5% hypothetical example with the 5% hypothetical examples that appear in the shareholder reports of the other funds.
Please note that the expenses shown in the table are meant to highlight your ongoing costs. Therefore, the hypothetical information is useful in comparing ongoing costs, and will not help you determine the relative total costs of owning different funds.
| | Beginning
Account Value (01/01/19) | ACTUAL | HYPOTHETICAL
(5% annual return before
expenses) | Annualized
Expense
Ratio |
Ending
Account Value
(06/30/19)1 | Expenses
Paid During
Period2 | Ending
Account Value
(06/30/19) | Expenses
Paid During
Period2 |
| Series I | $1,000.00 | $1,193.40 | $5.22 | $1,020.03 | $4.81 | 0.96% |
| Series II | 1,000.00 | 1,191.10 | 6.57 | 1,018.79 | 6.06 | 1.21 |
| 1 | The actual ending account value is based on the actual total return of the Fund for the period January 1, 2019 through June 30, 2019, after actual expenses and will differ from the hypothetical ending account value which is based on the Fund’s expense ratio and a hypothetical annual return of 5% before expenses. |
| 2 | Expenses are equal to the Fund’s annualized expense ratio as indicated above multiplied by the average account value over the period, multiplied by 181/365 to reflect the most recent fiscal half year. |
Invesco V.I. Small Cap Equity Fund
Approval of Investment Advisory andSub-Advisory Contracts
At meetings held on June 10, 2019, the Board of Trustees (the Board or the Trustees) of AIM Variable Insurance Funds (Invesco Variable Insurance Funds) as a whole, and the independent Trustees, who comprise over 75% of the Board, voting separately, approved the continuance of the Invesco V.I. Small Cap Equity Fund’s (the Fund) Master Investment Advisory Agreement with Invesco Advisers, Inc. (Invesco Advisers and the investment advisory agreement) and the Master IntergroupSub-Advisory Contract for Mutual Funds with Invesco Asset Management Deutschland GmbH, Invesco Asset Management Limited, Invesco Asset Management (Japan) Limited, Invesco Hong Kong Limited, Invesco Senior Secured Management, Inc. and Invesco Canada Ltd. and separatesub-advisory contracts with Invesco Capital Management LLC and Invesco Asset Management (India) Private Limited (collectively, the AffiliatedSub-Advisers and thesub-advisory contracts) for another year, effective July 1, 2019. After evaluating the factors discussed below, among others, the Board approved the renewal of the Fund’s investment advisory agreement and thesub-advisory contracts and determined that the compensation payable by the Fund to Invesco Advisers and by Invesco Advisers to the AffiliatedSub-Advisers is fair and reasonable.
The Board’s Evaluation Process
The Board’s Investments Committee has established threeSub-Committees, which meet throughout the year to review the performance of funds advised by Invesco Advisers (the Invesco Funds). As part of a regularly scheduled basis ofin-person Board meetings, theSub-Committees meet with portfolio managers for their assigned Invesco Funds and other members of management to review detailed information about investment performance and portfolio attributes of these funds. The Board took into account evaluations and reports that it received from the Investments Committee andSub-Committees, as well as the information provided to such committees and the Board throughout the year, in considering whether to approve each Invesco Fund’s investment advisory agreement andsub-advisory contracts.
As part of the contract renewal process, the Board reviews and considers information provided in response to detailed requests for information submitted to management by the independent Trustees with assistance from legal counsel to the independent Trustees. The Board receives comparative investment performance and fee data regarding the Invesco Funds prepared by Invesco Advisers and Broadridge Financial Solutions, Inc. (Broadridge), an independent mutual fund data provider. The Board also receives an independent written evaluation from the Senior Officer, an officer of the Invesco Funds who reports directly to the
independent Trustees. The Senior Officer’s evaluation is prepared as part of his responsibility to manage the process by which the Invesco Funds’ proposed management fees are negotiated during the annual contract renewal process to ensure they are negotiated in a manner that is at arms’ length and reasonable. In addition to meetings with Invesco Advisers and fund counsel throughout the year, the independent Trustees also discuss the continuance of the investment advisory agreement andsub-advisory contracts in separate sessions with the Senior Officer and with independent legal counsel.
The discussion below is a summary of the Senior Officer’s independent written evaluation with respect to the Fund’s investment advisory agreement, as well as a discussion of the material factors and related conclusions that formed the basis for the Board’s approval of the Fund’s investment advisory agreement andsub-advisory contracts. The Trustees’ review and conclusions are based on the comprehensive consideration of all information presented to them during the course of the year and in prior years and are not the result of any single determinative factor. Moreover, one Trustee may have weighed a particular piece of information or factor differently than another Trustee. This information is current as of June 10, 2019.
Factors and Conclusions and Summary of Independent Written Fee Evaluation
| A. | Nature, Extent and Quality of Services Provided by Invesco Advisers and the AffiliatedSub-Advisers |
The Board reviewed the nature, extent and quality of the advisory services provided to the Fund by Invesco Advisers under the Fund’s investment advisory agreement, and the credentials and experience of the officers and employees of Invesco Advisers who provide these services, including the Fund’s portfolio manager(s). The Board’s review included consideration of Invesco Advisers’ investment process oversight and structure, credit analysis and investment risk management. The Board also considerednon-advisory services that Invesco Advisers and its affiliates provide to the Invesco Funds such as various back office support functions, third party oversight, internal audit, valuation, portfolio trading and legal and compliance. The Board also received and reviewed information about Invesco Advisers’ role as administrator of the Invesco Funds’ liquidity risk management program. The Board also reviewed and considered the benefits to shareholders of investing in a fund that is part of the Invesco family of funds under the umbrella of Invesco Ltd., Invesco Advisers’ parent company, and noted Invesco Ltd.’s depth and experience in conducting an investment management business, as well as its
commitment of financial and other resources to such business. The Board reviewed and considered information about the resources that Invesco Advisers intends to continue to commit to managing the Invesco family of funds following Invesco Ltd.’s acquisition of OppenheimerFunds, Inc. and its subsidiaries. The Board concluded that the nature, extent and quality of the services provided to the Fund by Invesco Advisers are appropriate and satisfactory.
The Board reviewed the services that may be provided by the AffiliatedSub-Advisers under thesub-advisory contracts and the credentials and experience of the officers and employees of the AffiliatedSub-Advisers who provide these services. The Board noted the AffiliatedSub-Advisers’ expertise with respect to certain asset classes and that the AffiliatedSub-Advisers have offices and personnel that are located in financial centers around the world. As a result, the Board noted that the AffiliatedSub-Advisers can provide research and investment analysis on the markets and economies of various countries in which the Fund may invest, make recommendations regarding securities and assist with security trades. The Board concluded that thesub-advisory contracts may benefit the Fund and its shareholders by permitting Invesco Advisers to use the resources and talents of the AffiliatedSub-Advisers in managing the Fund. The Board concluded that the nature, extent and quality of the services that may be provided by the AffiliatedSub-Advisers are appropriate and satisfactory.
| B. | Fund Investment Performance |
The Board considered Fund investment performance as a relevant factor in considering whether to approve the investment advisory agreement. The Board did not view Fund investment performance as a relevant factor in considering whether to approve thesub-advisory contracts for the Fund, as no AffiliatedSub-Adviser currently manages assets of the Fund.
The Board compared the Fund’s investment performance over multiple time periods ending December 31, 2018 to the performance of funds in the Broadridge performance universe and against the Lipper Variable Underlying FundsSmall-Cap Core Funds Index. The Board noted that performance of Series I shares of the Fund was in the fourth quintile of its performance universe for the one year period and the fifth quintile for the three and five year periods (the first quintile being the best performing funds and the fifth quintile being the worst performing funds). The Board noted that performance of Series I shares of the Fund was below the performance of the Index for the one, three and five year periods. The Board noted that the Fund’s high quality bias and security selection in certain sectors detracted from Fund
Invesco V.I. Small Cap Equity Fund
performance. The Trustees also reviewed more recent Fund performance and this review did not change their conclusions.
| C. | Advisory andSub-Advisory Fees and Fund Expenses |
The Board compared the Fund’s contractual management fee rate to the contractual management fee rates of funds in the Fund’s Broadridge expense group. The Board noted that the contractual management fee rate for Series I shares of the Fund was below the median contractual management fee rate of funds in its expense group. The Board noted that the term “contractual management fee” for funds in the expense group may include both advisory and certainnon-portfolio management administrative services fees, but that Broadridge does not provide information on a fund by fund basis as to what is included. The Board also reviewed the methodology used by Broadridge in providing expense group information, which includes using each fund’s contractual management fee schedule (including any applicable breakpoints) as reported in the most recent prospectus or statement of additional information for each fund in the expense group. The Board also considered comparative information regarding the Fund’s total expense ratio and its various components.
The Board noted that Invesco Advisers has contractually agreed to waive fees and/or limit expenses of the Fund for the term disclosed in the Fund’s registration statement in an amount necessary to limit total annual operating expenses to a specified percentage of average daily net assets for each class of the Fund.
The Board also considered the fees charged by Invesco Advisers and the AffiliatedSub-Advisers to other similarly managed client accounts. The Board noted that Invesco Advisers or the AffiliatedSub-Advisers may charge lower fees to large institutional clients. Invesco Advisers reviewed with the Board differences in the scope of services it provides to the Invesco Funds relative to certain other types of client accounts, including management of cash flows as a result of redemptions and purchases, necessary infrastructure such as officers, office space, technology, legal and distribution, oversight of service providers, costs and business risks associated with launching new funds and sponsoring and maintaining the product line, preparation of annual registration statement updates and financial information and compliance with federal and state laws and regulations.
The Board also compared the Fund’s effective advisory fee rate (the advisory fee rate after advisory fee waivers and before other expense limitations/waivers) to the effective advisory fee rates of other similarly managed third-party mutual funds advised orsub-advised by Invesco Advisers and its affiliates, based on asset balances as of December 31, 2018.
The Board also considered the services that may be provided by the AffiliatedSub-Advisers pursuant to thesub-advisory contracts, as well
as the fees payable by Invesco Advisers to the AffiliatedSub-Advisers pursuant to thesub-advisory contracts.
| D. | Economies of Scale and Breakpoints |
The Board considered the extent to which there may be economies of scale in the provision of advisory services to the Fund. The Board considered Invesco’s reinvestment in its business, including investments in business infrastructure and cybersecurity. The Board also considered that the Fund may benefit from economies of scale through contractual breakpoints in the Fund’s advisory fee schedule, which generally operate to reduce the Fund’s expense ratio as it grows in size. The Board noted that the Fund shares directly in economies of scale through lower fees charged by third party service providers based on the combined size of the Invesco Funds. The Board noted that the Fund may also benefit from economies of scale through initial fee setting, fee waivers and expense reimbursements.
| E. | Profitability and Financial Resources |
The Board reviewed information from Invesco Advisers concerning the costs of the advisory and other services that Invesco Advisers and its affiliates provide to the Fund and the Invesco Funds and the profitability of Invesco Advisers and its affiliates in providing these services. The Board considered the methodology used for calculating profitability and noted the periodic review of such methodology by an independent consultant. The Board noted that Invesco Advisers continues to operate at a net profit from services Invesco Advisers and its affiliates provide to the Invesco Funds and the Fund. The Board did not deem the level of profits realized by Invesco Advisers and its affiliates from providing services to the Fund to be excessive given the nature, extent and quality of the services provided. The Board received information from Invesco Advisers demonstrating that Invesco Advisers and the AffiliatedSub-Advisers are financially sound and have the resources necessary to perform their obligations under the investment advisory agreement andsub-advisory contracts.
| F. | Collateral Benefits to Invesco Advisers and its Affiliates |
The Board considered various other benefits received by Invesco Advisers and its affiliates from the relationship with the Fund, including the fees received for providing administrative, transfer agency and distribution services to the Fund. The Board considered comparative information regarding fees charged for these services, including information provided by Broadridge and other independent sources. The Board considered the performance of Invesco Advisers and its affiliates in providing these services and the organizational structure employed to provide these services. The Board also considered that these services are provided to the Fund pursuant to written contracts that are reviewed and approved on an annual basis by the Board; and that the services are required for the operation of the Fund.
The Board considered the benefits realized by Invesco Advisers and the AffiliatedSub-Advisers as a result of portfolio brokerage transactions executed through “soft dollar” arrangements. The Board noted that soft dollar arrangements may result in the Fund bearing costs to purchase research that may be used by Invesco Advisers or the AffiliatedSub-Advisers with other clients and may reduce Invesco Advisers’ or the AffiliatedSub-Advisers’ expenses. The Board also considered that it receives periodic reports from Invesco representing that these arrangements are consistent with regulatory requirements. The Board did not deem the soft dollar arrangements to be inappropriate.
The Board considered that the Fund’s uninvested cash and cash collateral from any securities lending arrangements may be invested in money market funds advised by Invesco Advisers pursuant to procedures approved by the Board. The Board considered information regarding the returns of the affiliated money market funds relative to comparable overnight investments, as well as the costs to the Fund of such investments. The Board noted that Invesco Advisers receives advisory fees from these affiliated money market funds attributable to such investments, although Invesco Advisers has contractually agreed to waive through varying periods the advisory fees payable by the Invesco Funds with respect to certain investments in the affiliated money market funds. The waiver is in an amount equal to 100% of the net advisory fee Invesco Advisers receives from the affiliated money market funds with respect to the Fund’s investment in the affiliated money market funds of uninvested cash, but not cash collateral. The Board concluded that the amount of advisory fees received by Invesco Advisers from the Fund’s investment of cash collateral from any securities lending arrangements in the affiliated money market funds is fair and reasonable.
The Board also considered that an affiliated broker may receive commissions for executing certain trades for the Fund. Invesco Advisers and the AffiliatedSub-Advisers may use the affiliated broker to, among other things, control order routing and minimize information leakage, and the Board was advised that such trades are executed in compliance with rules under the federal securities laws and consistent with best execution obligations.
Invesco V.I. Small Cap Equity Fund
| Semiannual Report to Shareholders | June 30, 2019 |
Invesco V.I. Technology Fund
Beginning on January 1, 2021, as permitted by regulations adopted by the Securities and Exchange Commission, the insurance company that offers your variable annuity or variable life insurance contract may no longer send you paper copies of the Fund’s shareholder reports by mail, unless you specifically request paper copies of the reports from the insurance company or your financial intermediary. Instead of delivering paper copies of the report, the insurance company may choose to make the reports available on a website, and will notify you by mail each time a report is posted and provide you with a website link to access the report. Instructions for requesting paper copies will be provided by your insurance company.
If the insurance company offers electronic delivery, you may elect to receive shareholder reports and other communications about the Fund electronically by following the instructions provided by the insurance company or by contacting your financial intermediary. If you already elected to receive shareholder reports electronically, you will not be affected by this change and you need not take any action.
You may elect to receive all future reports in paper free of charge from the insurance company. You can inform the insurance company or your financial intermediary that you wish to continue receiving paper copies of your shareholder reports by following the instructions provided by the insurance company or by contacting your financial intermediary. Your election to receive reports in paper will apply to all portfolio companies available under your contract with the insurance company.
The Fund provides a complete list of its holdings four times in each fiscal year, at the quarter-ends. For the second and fourth quarters, the lists appear in the Fund’s semiannual and annual reports to shareholders. For the first and third quarters, the Fund files the lists with the Securities and Exchange Commission (SEC) on Form N-Q (or any successor Form). The Fund’s Form N-Q (or any successor Form) filings are available on the SEC website, sec.gov. The SEC file numbers for the Fund are 811-07452 and 033-57340. The Fund’s most recent portfolio holdings, as filed on Form N-Q (or any successor Form), have also been made available to insurance companies issuing variable annuity contracts and variable life insurance policies (“variable products”) that invest in the Fund.
A description of the policies and procedures that the Fund uses to determine how to vote proxies relating to portfolio securities is available without charge, upon request, from our Client Services department at 800 959 4246 or at invesco.com/proxyguidelines. The information is also available on the SEC website, sec.gov.
Information regarding how the Fund voted proxies related to its portfolio securities during the most recent 12-month period ended June 30 is available at invesco.com/proxysearch. The information is also available on the SEC website, sec.gov.
Invesco Advisers, Inc. is an investment adviser; it provides investment advisory services to individual and institutional clients and does not sell securities. Invesco Distributors, Inc. is the US distributor for Invesco Ltd.’s retail mutual funds, exchange-traded funds and institutional money market funds. Both are wholly owned, indirect subsidiaries of Invesco Ltd.
This report must be accompanied or preceded by a currently effective Fund prospectus and variable product prospectus, which contain more complete information, including sales charges and expenses. Investors should read each carefully before investing.
NOT FDIC INSURED | MAY LOSE VALUE | NO BANK GUARANTEE
| Invesco Distributors, Inc. | I-VITEC-SAR-1 |
Performance summary
Fund vs. Indexes
Cumulative total returns, December 31, 2018 to June 30, 2019, excluding variable product issuer charges. If variable product issuer charges were included, returns would be lower.
| Series I Shares | 23.58% |
| Series II Shares | 23.47 |
| NASDAQ Composite Index▼ (Broad Market/Style-Specific Index) | 21.33 |
Lipper VUF Science & Technology Funds Classification Average■
(Peer Group) | 24.57 |
| Source(s):▼FactSet Research Systems Inc.;■ Lipper Inc. |
TheNASDAQ Composite Index is a broad-based, market index of the common stocks and similar securities listed on the Nasdaq stock market.
TheLipper VUF Science & Technology Funds Classification Average represents an average of all variable insurance underlying funds in the Lipper Science & Technology Funds classification.
The Fund is not managed to track the performance of any particular index, including the indexes described here, and consequently, the performance of the Fund may deviate significantly from the performance of the indexes.
A direct investment cannot be made in an index. Unless otherwise indicated, index results include reinvested dividends, and they do not reflect sales charges. Performance of the peer group, if applicable, reflects fund expenses; performance of a market index does not.
| Average Annual Total Returns |
| As of 6/30/19 |
| Series I Shares | |
| Inception (5/20/97) | 6.68% |
| 10 Years | 15.02 |
| 5 Years | 12.99 |
| 1 Year | 8.77 |
| Series II Shares | |
| Inception (4/30/04) | 8.79% |
| 10 Years | 14.73 |
| 5 Years | 12.71 |
| 1 Year | 8.52 |
The performance of the Fund’s Series I and Series II share classes will differ primarily due to different class expenses.
The performance data quoted represent past performance and cannot guarantee comparable future results; current performance may be lower or higher. Please contact your variable product issuer or financial adviser for the most recent month-end variable product performance. Performance figures reflect Fund expenses, reinvested distributions and changes in net asset value. Performance figures do not reflect deduction of taxes a shareholder would pay on Fund distributions or sale of Fund shares. Investment return and principal value will fluctuate so that you may have a gain or loss when you sell shares.
The total annual Fund operating expense ratio set forth in the most recent Fund prospectus as of the date of this report for Series I and Series II shares was 1.03% and 1.28%, respectively. The expense ratios presented above may vary from the expense ratios presented in other sections of this report that are based on expenses incurred during the period covered by this report.
Invesco V.I. Technology Fund, a series portfolio of AIM Variable Insurance Funds (Invesco Variable Insurance Funds), is currently offered through insurance companies issuing variable products. You cannot purchase shares of the Fund directly. Performance figures given represent the Fund and are not intended to reflect actual variable product values. They do not reflect
sales charges, expenses and fees assessed in connection with a variable product. Sales charges, expenses and fees, which are determined by the variable product issuers, will vary and will lower the total return.
The most recent month-end performance at the Fund level, excluding variable product charges, is available at 800 451 4246. As mentioned above, for the most recent month-end performance including variable product charges, please contact your variable product issuer or financial adviser.
Fund performance reflects any applicable fee waivers and/or expense reimbursements. Had the adviser not waived fees and/or reimbursed expenses currently or in the past, returns would have been lower. See current prospectus for more information.
Invesco V.I. Technology Fund
Schedule of Investments(a)
June 30, 2019
(Unaudited)
| | Shares | Value |
| Common Stocks & Other Equity Interests–99.40% |
| Alternative Carriers–1.99% |
| Intelsat S.A.(b) | 135,138 | $2,628,434 |
| Application Software–5.43% |
| Adobe, Inc.(b) | 8,778 | 2,586,438 |
| salesforce.com, inc.(b) | 21,431 | 3,251,725 |
| Splunk, Inc.(b) | 10,569 | 1,329,052 |
| | | | 7,167,215 |
| Biotechnology–1.00% |
| Alexion Pharmaceuticals, Inc.(b) | 10,098 | 1,322,636 |
| Consumer Electronics–1.49% |
| Sony Corp. (Japan) | 37,700 | 1,969,785 |
| Data Processing & Outsourced Services–7.75% |
| First Data Corp., Class A(b) | 22,903 | 619,984 |
| Mastercard, Inc., Class A | 8,499 | 2,248,241 |
| PayPal Holdings, Inc.(b) | 32,757 | 3,749,366 |
| Visa, Inc., Class A | 20,784 | 3,607,063 |
| | | | 10,224,654 |
| Health Care Equipment–5.36% |
| Abbott Laboratories | 28,664 | 2,410,642 |
| Boston Scientific Corp.(b) | 32,776 | 1,408,713 |
| Intuitive Surgical, Inc.(b) | 1,915 | 1,004,513 |
| Teleflex, Inc. | 6,775 | 2,243,541 |
| | | | 7,067,409 |
| Interactive Home Entertainment–11.06% |
| Activision Blizzard, Inc. | 52,825 | 2,493,340 |
| Electronic Arts, Inc.(b) | 23,409 | 2,370,395 |
| Nintendo Co., Ltd. (Japan) | 11,300 | 4,154,220 |
| Sea Ltd., ADR (Thailand)(b) | 63,066 | 2,095,053 |
| Take-Two Interactive Software, Inc.(b) | 8,042 | 913,008 |
| Ubisoft Entertainment S.A. (France)(b) | 32,699 | 2,563,607 |
| | | | 14,589,623 |
| Interactive Media & Services–12.18% |
| Alphabet, Inc., Class A(b) | 5,789 | 6,268,329 |
| Alphabet, Inc., Class C(b) | 1,214 | 1,312,225 |
| Facebook, Inc., Class A(b) | 36,237 | 6,993,741 |
| Match Group, Inc. | 22,295 | 1,499,785 |
| | | | 16,074,080 |
| Internet & Direct Marketing Retail–13.98% |
| Alibaba Group Holding Ltd., ADR (China)(b) | 32,005 | 5,423,247 |
| Amazon.com, Inc.(b) | 6,522 | 12,350,255 |
| Booking Holdings, Inc.(b) | 357 | 669,271 |
| | | | 18,442,773 |
| | Shares | Value |
| Life Sciences Tools & Services–7.25% |
| Illumina, Inc.(b) | 14,168 | $5,215,949 |
| IQVIA Holdings, Inc.(b) | 15,648 | 2,517,763 |
| Thermo Fisher Scientific, Inc. | 6,212 | 1,824,340 |
| | | | 9,558,052 |
| Managed Health Care–0.53% |
| UnitedHealth Group, Inc. | 2,882 | 703,237 |
| Movies & Entertainment–1.97% |
| Netflix, Inc.(b) | 7,084 | 2,602,095 |
| Semiconductor Equipment–4.60% |
| Applied Materials, Inc. | 69,473 | 3,120,033 |
| ASML Holding N.V., New York Shares (Netherlands) | 14,183 | 2,949,071 |
| | | | 6,069,104 |
| Semiconductors–8.69% |
| Broadcom, Inc. | 8,245 | 2,373,406 |
| NVIDIA Corp. | 8,593 | 1,411,228 |
| QUALCOMM, Inc. | 30,333 | 2,307,431 |
| Semtech Corp.(b) | 44,452 | 2,135,919 |
| Silicon Motion Technology Corp., ADR (Taiwan) | 73,051 | 3,242,003 |
| | | | 11,469,987 |
| Systems Software–9.52% |
| Microsoft Corp. | 60,907 | 8,159,102 |
| Palo Alto Networks, Inc.(b) | 8,894 | 1,812,241 |
| ServiceNow, Inc.(b) | 9,445 | 2,593,314 |
| | | | 12,564,657 |
| Technology Hardware, Storage & Peripherals–4.88% |
| Apple, Inc. | 32,505 | 6,433,390 |
| Trucking–1.72% |
| Lyft, Inc., Class A(b)(c) | 12,016 | 789,571 |
| Uber Technologies, Inc.(b) | 31,983 | 1,483,372 |
| | | | 2,272,943 |
| Total Common Stocks & Other Equity Interests (Cost $68,644,210) | 131,160,074 |
| Money Market Funds–0.65% |
| Invesco Government & Agency Portfolio, Institutional Class, 2.26%(d) | 300,715 | 300,715 |
| Invesco Liquid Assets Portfolio, Institutional Class, 2.40%(d) | 214,741 | 214,827 |
| Invesco Treasury Portfolio, Institutional Class, 2.22%(d) | 343,674 | 343,674 |
| Total Money Market Funds (Cost $859,194) | 859,216 |
| TOTAL INVESTMENTS IN SECURITIES (excluding investments purchased with cash collateral from securities on loan)-100.05% (Cost $69,503,404) | | | 132,019,290 |
See accompanying Notes to Financial Statements which are an integral part of the financial statements.
Invesco V.I. Technology Fund
| | Shares | Value |
| Investments Purchased with Cash Collateral from Securities on Loan |
| Money Market Funds–0.46% |
| Invesco Government & Agency Portfolio, Institutional Class, 2.26%(d)(e) | 425,700 | $425,700 |
| Invesco Liquid Assets Portfolio, Institutional Class, 2.40%(d)(e) | 180,387 | 180,459 |
| Total Investments Purchased with Cash Collateral from Securities on Loan (Cost $606,143) | 606,159 |
| TOTAL INVESTMENTS IN SECURITIES–100.51% (Cost $70,109,547) | 132,625,449 |
| OTHER ASSETS LESS LIABILITIES–(0.51)% | (676,235) |
| NET ASSETS–100.00% | $131,949,214 |
Investment Abbreviations:
| ADR | – American Depositary Receipt |
Notes to Schedule of Investments:
| (a) | Industry and/or sector classifications used in this report are generally according to the Global Industry Classification Standard, which was developed by and is the exclusive property and a service mark of MSCI Inc. and Standard & Poor’s. |
| (b) | Non-income producing security. |
| (c) | All or a portion of this security was out on loan at June 30, 2019. |
| (d) | The money market fund and the Fund are affiliated by having the same investment adviser. The rate shown is the 7-day SEC standardized yield as of June 30, 2019. |
| (e) | The security has been segregated to satisfy the commitment to return the cash collateral received in securities lending transactions upon the borrower’s return of the securities loaned. See Note 1I. |
Portfolio Composition
By sector, based on Net Assets
as of June 30, 2019
| Information Technology | 40.87% |
| Communication Services | 27.20 |
| Consumer Discretionary | 15.47 |
| Health Care | 14.14 |
| Industrials | 1.72 |
| Money Market Funds Plus Other Assets Less Liabilities | 0.60 |
See accompanying Notes to Financial Statements which are an integral part of the financial statements.
Invesco V.I. Technology Fund
Statement of Assets and Liabilities
June 30, 2019
(Unaudited)
| Assets: | |
Investments in securities, at value
(Cost $68,644,210)* | $131,160,074 |
| Investments in affiliated money market funds, at value (Cost $1,465,337) | 1,465,375 |
| Foreign currencies, at value (Cost $74,438) | 74,411 |
| Receivable for: | |
| Fund shares sold | 4,617 |
| Dividends | 25,508 |
| Investment for trustee deferred compensation and retirement plans | 67,141 |
| Total assets | 132,797,126 |
| Liabilities: | |
| Payable for: | |
| Fund shares reacquired | 72,329 |
| Collateral upon return of securities loaned | 606,143 |
| Accrued fees to affiliates | 60,118 |
| Accrued trustees’ and officers’ fees and benefits | 139 |
| Accrued other operating expenses | 35,538 |
| Trustee deferred compensation and retirement plans | 73,645 |
| Total liabilities | 847,912 |
| Net assets applicable to shares outstanding | $131,949,214 |
| Net assets consist of: | |
| Shares of beneficial interest | $50,388,418 |
| Distributable earnings | 81,560,796 |
| | $131,949,214 |
| Net Assets: |
| Series I | $121,327,713 |
| Series II | $10,621,501 |
| Shares outstanding, no par value, with an unlimited number of shares authorized: |
| Series I | 4,478,703 |
| Series II | 413,821 |
| Series I: | |
| Net asset value per share | $27.09 |
| Series II: | |
| Net asset value per share | $25.67 |
| * | At June 30, 2019, securities with an aggregate value of $592,717 were on loan to brokers. |
Statement of Operations
For the six months ended June 30, 2019
(Unaudited)
| Investment income: | |
| Dividends (net of foreign withholding taxes of $14,434) | $383,977 |
| Dividends from affiliated money market funds (includes securities lending income of $6,117) | 23,916 |
| Total investment income | 407,893 |
| Expenses: | |
| Advisory fees | 487,671 |
| Administrative services fees | 106,353 |
| Custodian fees | 4,666 |
| Distribution fees - Series II | 13,032 |
| Transfer agent fees | 13,573 |
| Trustees’ and officers’ fees and benefits | 12,022 |
| Reports to shareholders | 5,880 |
| Professional services fees | 17,070 |
| Other | 1,325 |
| Total expenses | 661,592 |
| Less: Fees waived | (898) |
| Net expenses | 660,694 |
| Net investment income (loss) | (252,801) |
| Realized and unrealized gain (loss) from: | |
| Net realized gain from: | |
| Investment securities | 9,269,059 |
| Foreign currencies | 6,026 |
| | 9,275,085 |
| Change in net unrealized appreciation (depreciation) of: | |
| Investment securities | 18,337,681 |
| Foreign currencies | (32) |
| | 18,337,649 |
| Net realized and unrealized gain | 27,612,734 |
| Net increase in net assets resulting from operations | $27,359,933 |
See accompanying Notes to Financial Statements which are an integral part of the financial statements.
Invesco V.I. Technology Fund
Statement of Changes in Net Assets
For the six months ended June 30, 2019 and the year ended December 31, 2018
(Unaudited)
| | June 30,
2019 | December 31,
2018 |
| Operations: | | |
| Net investment income (loss) | $(252,801) | $(667,086) |
| Net realized gain | 9,275,085 | 10,614,800 |
| Change in net unrealized appreciation (depreciation) | 18,337,649 | (10,726,385) |
| Net increase (decrease) in net assets resulting from operations | 27,359,933 | (778,671) |
| Distributions to shareholders from distributable earnings: | | |
| Series I | — | (5,582,826) |
| Series II | — | (539,546) |
| Total distributions from distributable earnings | — | (6,122,372) |
| Share transactions–net: | | |
| Series I | (13,466,519) | 2,448,136 |
| Series II | (1,126,866) | 844,764 |
| Net increase (decrease) in net assets resulting from share transactions | (14,593,385) | 3,292,900 |
| Net increase (decrease) in net assets | 12,766,548 | (3,608,143) |
| Net assets: | | |
| Beginning of period | 119,182,666 | 122,790,809 |
| End of period | $131,949,214 | $119,182,666 |
See accompanying Notes to Financial Statements which are an integral part of the financial statements.
Invesco V.I. Technology Fund
Financial Highlights
June 30, 2019
(Unaudited)
The following schedule presents financial highlights for a share of the Fund outstanding throughout the periods indicated.
| | Net asset
value,
beginning
of period | Net
investment
income
(loss)(a) | Net gains
(losses)
on securities
(both
realized and
unrealized) | Total from
investment
operations | Distributions
from net
realized
gains | Net asset
value, end
of period | Total
return(b) | Net assets,
end of period
(000’s omitted) | Ratio of
expenses
to average
net assets
with fee waivers
and/or expenses
absorbed | Ratio of
expenses
to average net
assets without
fee waivers
and/or expenses
absorbed | Ratio of net
investment
income
(loss)
to average
net assets | Portfolio
turnover(c) |
| Series I |
| Six months ended 06/30/19 | $21.92 | $(0.05) | $5.22 | $5.17 | $— | $27.09 | 23.58% | $121,328 | 1.00%(d) | 1.00%(d) | (0.37)%(d) | 24% |
| Year ended 12/31/18 | 22.97 | (0.12) | 0.22 | 0.10 | (1.15) | 21.92 | (0.45) | 109,596 | 1.03 | 1.03 | (0.47) | 48 |
| Year ended 12/31/17 | 17.89 | (0.09) | 6.34 | 6.25 | (1.17) | 22.97 | 35.13 | 113,352 | 1.06 | 1.06 | (0.41) | 43 |
| Year ended 12/31/16 | 18.83 | (0.06) | (0.06) | (0.12) | (0.82) | 17.89 | (0.76) | 87,632 | 1.10 | 1.10 | (0.33) | 52 |
| Year ended 12/31/15 | 19.75 | (0.11) | 1.29 | 1.18 | (2.10) | 18.83 | 6.82 | 107,257 | 1.15 | 1.15 | (0.53) | 61 |
| Year ended 12/31/14 | 19.42 | (0.13) | 2.20 | 2.07 | (1.74) | 19.75 | 11.05 | 104,556 | 1.16 | 1.16 | (0.65) | 77 |
| Series II |
| Six months ended 06/30/19 | 20.79 | (0.07) | 4.95 | 4.88 | — | 25.67 | 23.47 | 10,622 | 1.25(d) | 1.25(d) | (0.62)(d) | 24 |
| Year ended 12/31/18 | 21.89 | (0.17) | 0.22 | 0.05 | (1.15) | 20.79 | (0.71) | 9,587 | 1.28 | 1.28 | (0.72) | 48 |
| Year ended 12/31/17 | 17.14 | (0.14) | 6.06 | 5.92 | (1.17) | 21.89 | 34.74 | 9,439 | 1.31 | 1.31 | (0.66) | 43 |
| Year ended 12/31/16 | 18.12 | (0.10) | (0.06) | (0.16) | (0.82) | 17.14 | (1.01) | 6,799 | 1.35 | 1.35 | (0.58) | 52 |
| Year ended 12/31/15 | 19.13 | (0.15) | 1.24 | 1.09 | (2.10) | 18.12 | 6.56 | 8,043 | 1.40 | 1.40 | (0.78) | 61 |
| Year ended 12/31/14 | 18.90 | (0.17) | 2.14 | 1.97 | (1.74) | 19.13 | 10.82 | 4,775 | 1.41 | 1.41 | (0.90) | 77 |
| (a) | Calculated using average shares outstanding. |
| (b) | Includes adjustments in accordance with accounting principles generally accepted in the United States of America and as such, the net asset value for financial reporting purposes and the returns based upon those net asset values may differ from the net asset value and returns for shareholder transactions. Total returns are not annualized for periods less than one year, if applicable, and do not reflect charges assessed in connection with a variable product, which if included would reduce total returns. |
| (c) | Portfolio turnover is calculated at the fund level and is not annualized for periods less than one year, if applicable. |
| (d) | Ratios are annualized and based on average daily net assets (000’s omitted) of $120,611 and $10,512 for Series I and Series II shares, respectively. |
See accompanying Notes to Financial Statements which are an integral part of the financial statements.
Invesco V.I. Technology Fund
Notes to Financial Statements
June 30, 2019
(Unaudited)
NOTE 1—Significant Accounting Policies
Invesco V.I. Technology Fund (the “Fund”) is a series portfolio of AIM Variable Insurance Funds (Invesco Variable Insurance Funds) (the “Trust”). The Trust is a Delaware statutory trust registered under the Investment Company Act of 1940, as amended (the “1940 Act”), as an open-end series management investment company. Information presented in these financial statements pertains only to the Fund. Matters affecting the Fund or each class will be voted on exclusively by the shareholders of the Fund or each class. Current Securities and Exchange Commission (“SEC”) guidance, however, requires participating insurance companies offering separate accounts to vote shares proportionally in accordance with the instructions of the contract owners whose investments are funded by shares of each Fund or class.
The Fund’s investment objective is long-term growth of capital.
The Fund currently offers two classes of shares, Series I and Series II, both of which are offered to insurance company separate accounts funding variable annuity contracts and variable life insurance policies (“variable products”).
The Fund is an investment company and accordingly follows the investment company accounting and reporting guidance in accordance with Financial Accounting Standards Board Accounting Standards Codification Topic 946,Financial Services – Investment Companies.
The following is a summary of the significant accounting policies followed by the Fund in the preparation of its financial statements.
| A. | Security Valuations — Securities, including restricted securities, are valued according to the following policy. |
A security listed or traded on an exchange (except convertible securities) is valued at its last sales price or official closing price as of the close of the customary trading session on the exchange where the security is principally traded, or lacking any sales or official closing price on a particular day, the security may be valued at the closing bid price on that day. Securities traded in the over-the-counter market are valued based on prices furnished by independent pricing services or market makers. When such securities are valued by an independent pricing service they may be considered fair valued. Futures contracts are valued at the final settlement price set by an exchange on which they are principally traded. Listed options are valued at the mean between the last bid and asked prices from the exchange on which they are principally traded. Options not listed on an exchange are valued by an independent source at the mean between the last bid and asked prices. For purposes of determining net asset value (“NAV”) per share, futures and option contracts generally are valued 15 minutes after the close of the customary trading session of the New York Stock Exchange (“NYSE”).
Investments in open-end and closed-end registered investment companies that do not trade on an exchange are valued at the end-of-day net asset value per share. Investments in open-end and closed-end registered investment companies that trade on an exchange are valued at the last sales price or official closing price as of the close of the customary trading session on the exchange where the security is principally traded.
Debt obligations (including convertible securities) and unlisted equities are fair valued using an evaluated quote provided by an independent pricing service. Evaluated quotes provided by the pricing service may be determined without exclusive reliance on quoted prices, and may reflect appropriate factors such as institution-size trading in similar groups of securities, developments related to specific securities, dividend rate (for unlisted equities), yield (for debt obligations), quality, type of issue, coupon rate (for debt obligations), maturity (for debt obligations), individual trading characteristics and other market data. Pricing services generally value debt obligations assuming orderly transactions of institutional round lot size, but a fund may hold or transact in the same securities in smaller, odd lot sizes. Odd lots often trade at lower prices than institutional round lots. Debt obligations are subject to interest rate and credit risks. In addition, all debt obligations involve some risk of default with respect to interest and/or principal payments.
Foreign securities’ (including foreign exchange contracts) prices are converted into U.S. dollar amounts using the applicable exchange rates as of the close of the NYSE. If market quotations are available and reliable for foreign exchange-traded equity securities, the securities will be valued at the market quotations. Because trading hours for certain foreign securities end before the close of the NYSE, closing market quotations may become unreliable. If between the time trading ends on a particular security and the close of the customary trading session on the NYSE, events occur that the investment adviser determines are significant and make the closing price unreliable, the Fund may fair value the security. If the event is likely to have affected the closing price of the security, the security will be valued at fair value in good faith using procedures approved by the Board of Trustees. Adjustments to closing prices to reflect fair value may also be based on a screening process of an independent pricing service to indicate the degree of certainty, based on historical data, that the closing price in the principal market where a foreign security trades is not the current value as of the close of the NYSE. Foreign securities’ prices meeting the approved degree of certainty that the price is not reflective of current value will be priced at the indication of fair value from the independent pricing service. Multiple factors may be considered by the independent pricing service in determining adjustments to reflect fair value and may include information relating to sector indices, American Depositary Receipts and domestic and foreign index futures. Foreign securities may have additional risks including exchange rate changes, potential for sharply devalued currencies and high inflation, political and economic upheaval, the relative lack of issuer information, relatively low market liquidity and the potential lack of strict financial and accounting controls and standards.
Securities for which market prices are not provided by any of the above methods may be valued based upon quotes furnished by independent sources. The last bid price may be used to value equity securities. The mean between the last bid and asked prices is used to value debt obligations, including corporate loans.
Securities for which market quotations are not readily available or became unreliable are valued at fair value as determined in good faith by or under the supervision of the Trust’s officers following procedures approved by the Board of Trustees. Issuer specific events, market trends, bid/asked quotes of brokers and information providers and other market data may be reviewed in the course of making a good faith determination of a security’s fair value.
The Fund may invest in securities that are subject to interest rate risk, meaning the risk that the prices will generally fall as interest rates rise and, conversely, the prices will generally rise as interest rates fall. Specific securities differ in their sensitivity to changes in interest rates depending on their individual characteristics. Changes in interest rates may result in increased market volatility, which may affect the value and/or liquidity of certain Fund investments.
Invesco V.I. Technology Fund
Valuations change in response to many factors including the historical and prospective earnings of the issuer, the value of the issuer’s assets, general economic conditions, interest rates, investor perceptions and market liquidity. Because of the inherent uncertainties of valuation, the values reflected in the financial statements may materially differ from the value received upon actual sale of those investments.
| B. | Securities Transactions and Investment Income — Securities transactions are accounted for on a trade date basis. Realized gains or losses on sales are computed on the basis of specific identification of the securities sold. Interest income (net of withholding tax, if any) is recorded on the accrual basis from settlement date. Dividend income (net of withholding tax, if any) is recorded on the ex-dividend date. |
The Fund may periodically participate in litigation related to Fund investments. As such, the Fund may receive proceeds from litigation settlements. Any proceeds received are included in the Statement of Operations as realized gain (loss) for investments no longer held and as unrealized gain (loss) for investments still held.
Brokerage commissions and mark ups are considered transaction costs and are recorded as an increase to the cost basis of securities purchased and/or a reduction of proceeds on a sale of securities. Such transaction costs are included in the determination of net realized and unrealized gain (loss) from investment securities reported in the Statement of Operations and the Statement of Changes in Net Assets and the net realized and unrealized gains (losses) on securities per share in the Financial Highlights. Transaction costs are included in the calculation of the Fund’s net asset value and, accordingly, they reduce the Fund’s total returns. These transaction costs are not considered operating expenses and are not reflected in net investment income reported in the Statement of Operations and the Statement of Changes in Net Assets, or the net investment income per share and the ratios of expenses and net investment income reported in the Financial Highlights, nor are they limited by any expense limitation arrangements between the Fund and the investment adviser.
The Fund allocates income and realized and unrealized capital gains and losses to a class based on the relative net assets of each class.
| C. | Country Determination — For the purposes of making investment selection decisions and presentation in the Schedule of Investments, the investment adviser may determine the country in which an issuer is located and/or credit risk exposure based on various factors. These factors include the laws of the country under which the issuer is organized, where the issuer maintains a principal office, the country in which the issuer derives 50% or more of its total revenues and the country that has the primary market for the issuer’s securities, as well as other criteria. Among the other criteria that may be evaluated for making this determination are the country in which the issuer maintains 50% or more of its assets, the type of security, financial guarantees and enhancements, the nature of the collateral and the sponsor organization. Country of issuer and/or credit risk exposure has been determined to be the United States of America, unless otherwise noted. |
| D. | Distributions– Distributions from net investment income and net realized capital gain, if any, are generally declared and paid to separate accounts of participating insurance companies annually and recorded on the ex-dividend date. |
| E. | Federal Income Taxes –The Fund intends to comply with the requirements of Subchapter M of the Internal Revenue Code of 1986, as amended (the “Internal Revenue Code”), necessary to qualify as a regulated investment company and to distribute substantially all of the Fund’s taxable earnings to shareholders. As such, the Fund will not be subject to federal income taxes on otherwise taxable income (including net realized capital gain) that is distributed to shareholders. Therefore, no provision for federal income taxes is recorded in the financial statements. |
The Fund recognizes the tax benefits of uncertain tax positions only when the position is more likely than not to be sustained. Management has analyzed the Fund’s uncertain tax positions and concluded that no liability for unrecognized tax benefits should be recorded related to uncertain tax positions. Management is not aware of any tax positions for which it is reasonably possible that the total amounts of unrecognized tax benefits will change materially in the next 12 months.
The Fund files tax returns in the U.S. Federal jurisdiction and certain other jurisdictions. Generally, the Fund is subject to examinations by such taxing authorities for up to three years after the filing of the return for the tax period.
| F. | Expenses– Fees provided for under the Rule 12b-1 plan of a particular class of the Fund and which are directly attributable to that class are charged to the operations of such class. All other expenses are allocated among the classes based on relative net assets. |
| G. | Accounting Estimates – The preparation of financial statements in conformity with accounting principles generally accepted in the United States of America (“GAAP”) requires management to make estimates and assumptions that affect the reported amounts of assets and liabilities at the date of the financial statements and the reported amounts of revenues and expenses during the reporting period including estimates and assumptions related to taxation. Actual results could differ from those estimates by a significant amount. In addition, the Fund monitors for material events or transactions that may occur or become known after the period-end date and before the date the financial statements are released to print. |
| H. | Indemnifications – Under the Trust’s organizational documents, each Trustee, officer, employee or other agent of the Trust is indemnified against certain liabilities that may arise out of the performance of their duties to the Fund. Additionally, in the normal course of business, the Fund enters into contracts, including the Fund’s servicing agreements, that contain a variety of indemnification clauses. The Fund’s maximum exposure under these arrangements is unknown as this would involve future claims that may be made against the Fund that have not yet occurred. The risk of material loss as a result of such indemnification claims is considered remote. |
| I. | Securities Lending– The Fund may lend portfolio securities having a market value up to one-third of the Fund’s total assets. Such loans are secured by collateral equal to no less than the market value of the loaned securities determined daily by the securities lending provider. Such collateral will be cash or debt securities issued or guaranteed by the U.S. Government or any of its sponsored agencies. Cash collateral received in connection with these loans is invested in short-term money market instruments or affiliated money market funds and is shown as such on the Schedule of Investments. The Fund bears the risk of loss with respect to the investment of collateral. It is the Fund’s policy to obtain additional collateral from or return excess collateral to the borrower by the end of the next business day, following the valuation date of the securities loaned. Therefore, the value of the collateral held may be temporarily less than the value of the securities on loan. When loaning securities, the Fund retains certain benefits of owning the securities, including the economic equivalent of dividends or interest generated by the security. Lending securities entails a risk of loss to the Fund if, and to the extent that, the market value of the securities loaned were to increase and the borrower did not increase the collateral accordingly, and the borrower failed to return the securities. The securities loaned are subject to termination at the option of the borrower or the Fund. Upon termination, the borrower will return to the Fund the securities loaned and the Fund will return the collateral. Upon the failure of the borrower to return the securities, collateral may be liquidated and the securities may be purchased on the open market to replace the loaned securities. The Fund could experience delays and costs in gaining access to the collateral and the securities may lose value during the delay which could result in potential losses to the Fund. Some of these losses may be indemnified by the lending agent. The Fund bears the risk of any deficiency in the amount of the collateral available for return to the borrower due to any loss on the |
Invesco V.I. Technology Fund
| | collateral invested. Dividends received on cash collateral investments for securities lending transactions, which are net of compensation to counterparties, are included inDividends from affiliated money market funds on the Statement of Operations. The aggregate value of securities out on loan, if any, is shown as a footnote on the Statement of Assets and Liabilities. |
| J. | Foreign Currency Translations— Foreign currency is valued at the close of the NYSE based on quotations posted by banks and major currency dealers. Portfolio securities and other assets and liabilities denominated in foreign currencies are translated into U.S. dollar amounts at the date of valuation. Purchases and sales of portfolio securities (net of foreign taxes withheld on disposition) and income items denominated in foreign currencies are translated into U.S. dollar amounts on the respective dates of such transactions. The Fund does not separately account for the portion of the results of operations resulting from changes in foreign exchange rates on investments and the fluctuations arising from changes in market prices of securities held. The combined results of changes in foreign exchange rates and the fluctuation of market prices on investments (net of estimated foreign tax withholding) are included with the net realized and unrealized gain or loss from investments in the Statement of Operations. Reported net realized foreign currency gains or losses arise from (1) sales of foreign currencies, (2) currency gains or losses realized between the trade and settlement dates on securities transactions, and (3) the difference between the amounts of dividends, interest, and foreign withholding taxes recorded on the Fund’s books and the U.S. dollar equivalent of the amounts actually received or paid. Net unrealized foreign currency gains and losses arise from changes in the fair values of assets and liabilities, other than investments in securities at fiscal period end, resulting from changes in exchange rates. |
The Fund may invest in foreign securities, which may be subject to foreign taxes on income, gains on investments or currency repatriation, a portion of which may be recoverable. Foreign taxes, if any, are recorded based on the tax regulations and rates that exist in the foreign markets in which the Fund invests and are shown in the Statement of Operations.
| K. | Forward Foreign Currency Contracts— The Fund may engage in foreign currency transactions either on a spot (i.e. for prompt delivery and settlement) basis, or through forward foreign currency contracts, to manage or minimize currency or exchange rate risk. |
The Fund may also enter into forward foreign currency contracts for the purchase or sale of a security denominated in a foreign currency in order to “lock in” the U.S. dollar price of that security, or the Fund may also enter into forward foreign currency contracts that do not provide for physical settlement of the two currencies, but instead are settled by a single cash payment calculated as the difference between the agreed upon exchange rate and the spot rate at settlement based upon an agreed upon notional amount (non-deliverable forwards). The Fund will set aside liquid assets in an amount equal to the daily mark-to-market obligation for forward foreign currency contracts.
A forward foreign currency contract is an obligation between two parties (“Counterparties”) to purchase or sell a specific currency for an agreed-upon price at a future date. The use of forward foreign currency contracts does not eliminate fluctuations in the price of the underlying securities the Fund owns or intends to acquire but establishes a rate of exchange in advance. Fluctuations in the value of these contracts are measured by the difference in the contract date and reporting date exchange rates and are recorded as unrealized appreciation (depreciation) until the contracts are closed. When the contracts are closed, realized gains (losses) are recorded. Realized and unrealized gains (losses) on the contracts are included in the Statement of Operations. The primary risks associated with forward foreign currency contracts include failure of the Counterparty to meet the terms of the contract and the value of the foreign currency changing unfavorably. These risks may be in excess of the amounts reflected in the Statement of Assets and Liabilities.
| L. | Other Risks - The Fund’s investments are concentrated in a comparatively narrow segment of the economy, which may make the Fund more volatile. |
Many products and services offered in technology-related industries are subject to rapid obsolescence, which may lower the value of the issuers in this sector.
NOTE 2—Advisory Fees and Other Fees Paid to Affiliates
The Trust has entered into a master investment advisory agreement with Invesco Advisers, Inc. (the "Adviser" or "Invesco"). Under the terms of the investment advisory agreement, the Fund accrues daily and pays monthly an advisory fee to the Adviser based on the annual rate of the Fund’s average daily net assets as follows:
| Average Daily Net Assets | Rate |
| First $250 million | 0.75% |
| First $250 million | 0.74% |
| First $500 million | 0.73% |
| Next $1.5 billion | 0.72% |
| Next $2.5 billion | 0.71% |
| Next $2.5 billion | 0.70% |
| Next $2.5 billion | 0.69% |
| Over $10 billion | 0.68% |
For the six months ended June 30, 2019, the effective advisory fees incurred by the Fund was 0.75%.
Under the terms of a master sub-advisory agreement between the Adviser and each of Invesco Asset Management Deutschland GmbH, Invesco Asset Management Limited, Invesco Asset Management (Japan) Limited, Invesco Hong Kong Limited, Invesco Senior Secured Management, Inc. and Invesco Canada Ltd. and separate sub-advisory agreements with Invesco Capital Management LLC and Invesco Asset Management (India) Private Limited (collectively, the "Affiliated Sub-Advisers") the Adviser, not the Fund, will pay 40% of the fees paid to the Adviser to any such Affiliated Sub-Adviser(s) that provide(s) discretionary investment management services to the Fund based on the percentage of assets allocated to such Affiliated Sub-Adviser(s).
The Adviser has contractually agreed, through at least June 30, 2020, to waive advisory fees and/or reimburse expenses of all shares to the extent necessary to limit total annual fund operating expenses after fee waiver and/or expense reimbursement (excluding certain items discussed below) of Series I shares to 2.00% and Series II shares to 2.25% of average daily net assets (the “expense limits”). In determining the Adviser’s obligation to waive advisory fees and/or reimburse expenses, the following expenses are not taken into account, and could cause the total annual fund
Invesco V.I. Technology Fund
operating expenses after fee waiver and/or expense reimbursement to exceed the numbers reflected above: (1) interest; (2) taxes; (3) dividend expense on short sales; (4) extraordinary or non-routine items, including litigation expenses; and (5) expenses that the Fund has incurred but did not actually pay because of an expense offset arrangement. Unless Invesco continues the fee waiver agreement, it will terminate on June 30, 2020. During its term, the fee waiver agreement cannot be terminated or amended to increase the expense limits or reduce the advisory fee waiver without approval of the Board of Trustees. The Adviser did not waive fees and/or reimburse expenses during the period under these expense limits.
Further, the Adviser has contractually agreed, through at least June 30, 2021, to waive the advisory fee payable by the Fund in an amount equal to 100% of the net advisory fees the Adviser receives from the affiliated money market funds on investments by the Fund of uninvested cash (excluding investments of cash collateral from securities lending) in such affiliated money market funds.
For the six months ended June 30, 2019, the Adviser waived advisory fees of $898.
The Trust has entered into a master administrative services agreement with Invesco pursuant to which the Fund has agreed to pay Invesco a fee for costs incurred in providing accounting services and fund administrative services to the Fund and to reimburse Invesco for fees paid to insurance companies that have agreed to provide certain administrative services to the Fund. These administrative services provided by the insurance companies may include, among other things: maintenance of master accounts with the Fund; tracking, recording and transmitting net purchase and redemption orders for Fund shares; maintaining and preserving records related to the purchase, redemption and other account activity of variable product owners; distributing copies of Fund documents such as prospectuses, proxy materials and periodic reports, to variable product owners, and responding to inquiries from variable product owners about the Fund. Pursuant to such agreement, for the six months ended June 30, 2019, Invesco was paid $9,179 for accounting and fund administrative services and was reimbursed $97,174 for fees paid to insurance companies. Also, Invesco has entered into a sub-administration agreement whereby State Street Bank and Trust Company (“SSB”) serves as custodian and fund accountant and provides certain administrative services to the Fund.
The Trust has entered into a transfer agency and service agreement with Invesco Investment Services, Inc. (“IIS”) pursuant to which the Fund has agreed to pay IIS a fee for providing transfer agency and shareholder services to the Fund and reimburse IIS for certain expenses incurred by IIS in the course of providing such services. For the six months ended June 30, 2019, expenses incurred under the agreement are shown in the Statement of Operations asTransfer agent fees.
The Trust has entered into a master distribution agreement with Invesco Distributors, Inc. (“IDI”) to serve as the distributor for the Fund. The Trust has adopted a plan pursuant to Rule 12b-1 under the 1940 Act with respect to the Fund’s Series II shares (the “Plan”). The Fund, pursuant to the Plan, pays IDI compensation at the annual rate of 0.25% of the Fund’s average daily net assets of Series II shares. The fees are accrued daily and paid monthly. Of the Plan payments, up to 0.25% of the average daily net assets of the Series II shares may be paid to insurance companies who furnish continuing personal shareholder services to customers who purchase and own Series II shares of the Fund. For the six months ended June 30, 2019, expenses incurred under the Plan are detailed in the Statement of Operations asDistribution fees.
For the six months ended June 30, 2019, the Fund incurred $430 in brokerage commissions with Invesco Capital Markets, Inc., an affiliate of the Adviser and IDI, for portfolio transactions executed on behalf of the Fund.
Certain officers and trustees of the Trust are officers and directors of the Adviser, IIS and/or IDI.
NOTE 3—Additional Valuation Information
GAAP defines fair value as the price that would be received to sell an asset or paid to transfer a liability in an orderly transaction between market participants at the measurement date, under current market conditions. GAAP establishes a hierarchy that prioritizes the inputs to valuation methods, giving the highest priority to readily available unadjusted quoted prices in an active market for identical assets (Level 1) and the lowest priority to significant unobservable inputs (Level 3), generally when market prices are not readily available or are unreliable. Based on the valuation inputs, the securities or other investments are tiered into one of three levels. Changes in valuation methods may result in transfers in or out of an investment’s assigned level:
Level 1 – Prices are determined using quoted prices in an active market for identical assets.
Level 2 – Prices are determined using other significant observable inputs. Observable inputs are inputs that other market participants may use in pricing a security. These may include quoted prices for similar securities, interest rates, prepayment speeds, credit risk, yield curves, loss severities, default rates, discount rates, volatilities and others.
Level 3 – Prices are determined using significant unobservable inputs. In situations where quoted prices or observable inputs are unavailable (for example, when there is little or no market activity for an investment at the end of the period), unobservable inputs may be used. Unobservable inputs reflect the Fund’s own assumptions about the factors market participants would use in determining fair value of the securities or instruments and would be based on the best available information.
The following is a summary of the tiered valuation input levels, as of June 30, 2019. The level assigned to the securities valuations may not be an indication of the risk or liquidity associated with investing in those securities. Because of the inherent uncertainties of valuation, the values reflected in the financial statements may materially differ from the value received upon actual sale of those investments.
| | Level 1 | Level 2 | Level 3 | Total |
| Investments in Securities | | | | |
| Common Stocks & Other Equity Interests | $122,472,462 | $8,687,612 | $— | $131,160,074 |
| Money Market Funds | 1,465,375 | — | — | 1,465,375 |
| Total Investments | $123,937,837 | $8,687,612 | $— | $132,625,449 |
NOTE 4—Trustees’ and Officers’ Fees and Benefits
Trustees’ and Officers’ Fees and Benefits include amounts accrued by the Fund to pay remuneration to certain Trustees and Officers of the Fund. Trustees have the option to defer compensation payable by the Fund, and Trustees’ and Officers’ Fees and Benefits also include amounts accrued by the Fund to fund such deferred compensation amounts. Those Trustees who defer compensation have the option to select various Invesco Funds in which their deferral accounts shall be deemed to be invested. Finally, certain current Trustees were eligible to participate in a retirement plan that provided
Invesco V.I. Technology Fund
for benefits to be paid upon retirement to Trustees over a period of time based on the number of years of service. The Fund may have certain former Trustees who also participate in a retirement plan and receive benefits under such plan.Trustees’ and Officers’ Fees and Benefits include amounts accrued by the Fund to fund such retirement benefits. Obligations under the deferred compensation and retirement plans represent unsecured claims against the general assets of the Fund.
NOTE 5—Cash Balances
The Fund is permitted to temporarily carry a negative or overdrawn balance in its account with State Street Bank and Trust Company, the custodian bank. Such balances, if any at period-end, are shown in the Statement of Assets and Liabilities under the payable caption Amount due custodian. To compensate the custodian bank for such overdrafts, the overdrawn Fund may either (1) leave funds as a compensating balance in the account so the custodian bank can be compensated by earning the additional interest; or (2) compensate by paying the custodian bank at a rate agreed upon by the custodian bank and Invesco, not to exceed the contractually agreed upon rate.
NOTE 6—Tax Information
The amount and character of income and gains to be distributed are determined in accordance with income tax regulations, which may differ from GAAP. Reclassifications are made to the Fund’s capital accounts to reflect income and gains available for distribution (or available capital loss carryforward) under income tax regulations. The tax character of distributions paid during the year and the tax components of net assets will be reported at the Fund’s fiscal year-end.
Capital loss carryforward is calculated and reported as of a specific date. Results of transactions and other activity after that date may affect the amount of capital loss carryforward actually available for the Fund to utilize. Capital losses generated in years beginning after December 22, 2010 can be carried forward for an unlimited period, whereas previous losses expire in eight tax years. Capital losses with an expiration period may not be used to offset capital gains until all net capital losses without an expiration date have been utilized. Capital loss carryforwards with no expiration date will retain their character as either short-term or long-term capital losses instead of as short-term capital losses as under prior law. The ability to utilize capital loss carryforwards in the future may be limited under the Internal Revenue Code and related regulations based on the results of future transactions.
The Fund did not have a capital loss carryforward as of December 31, 2018.
NOTE 7—Investment Transactions
The aggregate amount of investment securities (other than short-term securities, U.S. Treasury obligations and money market funds, if any) purchased and sold by the Fund during the six months ended June 30, 2019 was $30,255,253 and $48,209,308, respectively. Cost of investments, including any derivatives, on a tax basis includes the adjustments for financial reporting purposes as of the most recently completed federal income tax reporting period-end.
| Unrealized Appreciation (Depreciation) of Investments on a Tax Basis |
| Aggregate unrealized appreciation of investments | $62,409,190 |
| Aggregate unrealized (depreciation) of investments | (313,151) |
| Net unrealized appreciation of investments | $62,096,039 |
Cost of investments for tax purposes is $70,529,410.
NOTE 8—Share Information
| | Summary of Share Activity |
| | Six months ended
June 30, 2019(a) | | Year ended
December 31, 2018 |
| | Shares | Amount | | Shares | Amount |
| Sold: | | | | | |
| Series I | 214,161 | $5,385,578 | | 1,041,909 | $26,582,108 |
| Series II | 16,986 | 406,737 | | 86,082 | 2,113,927 |
| Issued as reinvestment of dividends: | | | | | |
| Series I | — | — | | 209,251 | 5,582,826 |
| Series II | — | — | | 21,301 | 539,546 |
| Reacquired: | | | | | |
| Series I | (736,007) | (18,852,097) | | (1,185,392) | (29,716,798) |
| Series II | (64,265) | (1,533,603) | | (77,423) | (1,808,709) |
| Net increase (decrease) in share activity | (569,125) | $(14,593,385) | | 95,728 | $3,292,900 |
| (a) | There are entities that are record owners of more than 5% of the outstanding shares of the Fund and in the aggregate own 60% of the outstanding shares of the Fund. The Fund and the Fund’s principal underwriter or adviser, are parties to participation agreements with these entities whereby these entities sell units of interest in separate accounts funding variable products that are invested in the Fund. The Fund, Invesco and/or Invesco affiliates may make payments to these entities, which are considered to be related to the Fund, for providing services to the Fund, Invesco and/or Invesco affiliates including but not limited to services such as, securities brokerage, third party record keeping and account servicing and administrative services. The Fund has no knowledge as to whether all or any portion of the shares owned of record by these entities are also owned beneficially. |
Invesco V.I. Technology Fund
Calculating your ongoing Fund expenses
Example
As a shareholder of the Fund, you incur ongoing costs, including management fees; distribution and/or service fees (12b-1); and other Fund expenses. This example is intended to help you understand your ongoing costs (in dollars) of investing in the Fund and to compare these costs with ongoing costs of investing in other mutual funds. The example is based on an investment of $1,000 invested at the beginning of the period and held for the entire period January 1, 2019 through June 30, 2019.
The actual and hypothetical expenses in the examples below do not represent the effect of any fees or other expenses assessed in connection with a variable product; if they did, the expenses shown would be higher while the ending account values shown would be lower.
Actual expenses
The table below provides information about actual account values and actual expenses. You may use the information in this table, together with the amount you invested, to estimate the expenses that you paid over the period. Simply divide your account value by $1,000 (for example, an $8,600 account value divided by $1,000 = 8.6), then multiply the result by the number in the table under the heading entitled “Actual Expenses Paid During Period” to estimate the expenses you paid on your account during this period.
Hypothetical example for comparison purposes
The table below also provides information about hypothetical account values and hypothetical expenses based on the Fund’s actual expense ratio and an assumed rate of return of 5% per year before expenses, which is not the Fund’s actual return.
The hypothetical account values and expenses may not be used to estimate the actual ending account balance or expenses you paid for the period. You may use this information to compare the ongoing costs of investing in the Fund and other funds. To do so, compare this 5% hypothetical example with the 5% hypothetical examples that appear in the shareholder reports of the other funds.
Please note that the expenses shown in the table are meant to highlight your ongoing costs. Therefore, the hypothetical information is useful in comparing ongoing costs, and will not help you determine the relative total costs of owning different funds.
| | Beginning
Account Value (01/01/19) | ACTUAL | HYPOTHETICAL
(5% annual return before
expenses) | Annualized
Expense
Ratio |
Ending
Account Value
(06/30/19)1 | Expenses
Paid During
Period2 | Ending
Account Value
(06/30/19) | Expenses
Paid During
Period2 |
| Series I | $1,000.00 | $1,235.80 | $5.54 | $1,019.84 | $5.01 | 1.00% |
| Series II | 1,000.00 | 1,234.70 | 6.93 | 1,018.60 | 6.26 | 1.25 |
| 1 | The actual ending account value is based on the actual total return of the Fund for the period January 1, 2019 through June 30, 2019, after actual expenses and will differ from the hypothetical ending account value which is based on the Fund’s expense ratio and a hypothetical annual return of 5% before expenses. |
| 2 | Expenses are equal to the Fund’s annualized expense ratio as indicated above multiplied by the average account value over the period, multiplied by 181/365 to reflect the most recent fiscal half year. |
Invesco V.I. Technology Fund
Approval of Investment Advisory andSub-Advisory Contracts
At meetings held on June 10, 2019, the Board of Trustees (the Board or the Trustees) of AIM Variable Insurance Funds (Invesco Variable Insurance Funds) as a whole, and the independent Trustees, who comprise over 75% of the Board, voting separately, approved the continuance of the Invesco V.I. Technology Fund’s (the Fund) Master Investment Advisory Agreement with Invesco Advisers, Inc. (Invesco Advisers and the investment advisory agreement) and the Master IntergroupSub-Advisory Contract for Mutual Funds with Invesco Asset Management Deutschland GmbH, Invesco Asset Management Limited, Invesco Asset Management (Japan) Limited, Invesco Hong Kong Limited, Invesco Senior Secured Management, Inc. and Invesco Canada Ltd. and separatesub-advisory contracts with Invesco Capital Management LLC and Invesco Asset Management (India) Private Limited (collectively, the AffiliatedSub-Advisers and thesub-advisory contracts) for another year, effective July 1, 2019. After evaluating the factors discussed below, among others, the Board approved the renewal of the Fund’s investment advisory agreement and thesub-advisory contracts and determined that the compensation payable by the Fund to Invesco Advisers and by Invesco Advisers to the AffiliatedSub-Advisers is fair and reasonable.
The Board’s Evaluation Process
The Board’s Investments Committee has established threeSub-Committees, which meet throughout the year to review the performance of funds advised by Invesco Advisers (the Invesco Funds). As part of a regularly scheduled basis ofin-person Board meetings, theSub-Committees meet with portfolio managers for their assigned Invesco Funds and other members of management to review detailed information about investment performance and portfolio attributes of these funds. The Board took into account evaluations and reports that it received from the Investments Committee andSub-Committees, as well as the information provided to such committees and the Board throughout the year, in considering whether to approve each Invesco Fund’s investment advisory agreement andsub-advisory contracts.
As part of the contract renewal process, the Board reviews and considers information provided in response to detailed requests for information submitted to management by the independent Trustees with assistance from legal counsel to the independent Trustees. The Board receives comparative investment performance and fee data regarding the Invesco Funds prepared by Invesco Advisers and Broadridge Financial Solutions, Inc. (Broadridge), an independent mutual fund data provider. The Board also receives an independent written evaluation from the Senior Officer, an officer of the Invesco Funds who reports directly to the
independent Trustees. The Senior Officer’s evaluation is prepared as part of his responsibility to manage the process by which the Invesco Funds’ proposed management fees are negotiated during the annual contract renewal process to ensure they are negotiated in a manner that is at arms’ length and reasonable. In addition to meetings with Invesco Advisers and fund counsel throughout the year, the independent Trustees also discuss the continuance of the investment advisory agreement andsub-advisory contracts in separate sessions with the Senior Officer and with independent legal counsel.
The discussion below is a summary of the Senior Officer’s independent written evaluation with respect to the Fund’s investment advisory agreement, as well as a discussion of the material factors and related conclusions that formed the basis for the Board’s approval of the Fund’s investment advisory agreement andsub-advisory contracts. The Trustees’ review and conclusions are based on the comprehensive consideration of all information presented to them during the course of the year and in prior years and are not the result of any single determinative factor. Moreover, one Trustee may have weighed a particular piece of information or factor differently than another Trustee. This information is current as of June 10, 2019.
Factors and Conclusions and Summary of Independent Written Fee Evaluation
| A. | Nature, Extent and Quality of Services Provided by Invesco Advisers and the AffiliatedSub-Advisers |
The Board reviewed the nature, extent and quality of the advisory services provided to the Fund by Invesco Advisers under the Fund’s investment advisory agreement, and the credentials and experience of the officers and employees of Invesco Advisers who provide these services, including the Fund’s portfolio manager(s). The Board’s review included consideration of Invesco Advisers’ investment process oversight and structure, credit analysis and investment risk management. The Board also considerednon-advisory services that Invesco Advisers and its affiliates provide to the Invesco Funds such as various back office support functions, third party oversight, internal audit, valuation, portfolio trading and legal and compliance. The Board also received and reviewed information about Invesco Advisers’ role as administrator of the Invesco Funds’ liquidity risk management program. The Board also reviewed and considered the benefits to shareholders of investing in a fund that is part of the Invesco family of funds under the umbrella of Invesco Ltd., Invesco Advisers’ parent company, and noted Invesco Ltd.’s depth and experience in conducting an investment management business, as well as its
commitment of financial and other resources to such business. The Board reviewed and considered information about the resources that Invesco Advisers intends to continue to commit to managing the Invesco family of funds following Invesco Ltd.’s acquisition of OppenheimerFunds, Inc. and its subsidiaries. The Board concluded that the nature, extent and quality of the services provided to the Fund by Invesco Advisers are appropriate and satisfactory.
The Board reviewed the services that may be provided by the AffiliatedSub-Advisers under thesub-advisory contracts and the credentials and experience of the officers and employees of the AffiliatedSub-Advisers who provide these services. The Board noted the AffiliatedSub-Advisers’ expertise with respect to certain asset classes and that the AffiliatedSub-Advisers have offices and personnel that are located in financial centers around the world. As a result, the Board noted that the AffiliatedSub-Advisers can provide research and investment analysis on the markets and economies of various countries in which the Fund may invest, make recommendations regarding securities and assist with security trades. The Board concluded that thesub-advisory contracts may benefit the Fund and its shareholders by permitting Invesco Advisers to use the resources and talents of the AffiliatedSub-Advisers in managing the Fund. The Board concluded that the nature, extent and quality of the services that may be provided by the AffiliatedSub-Advisers are appropriate and satisfactory.
| B. | Fund Investment Performance |
The Board considered Fund investment performance as a relevant factor in considering whether to approve the investment advisory agreement. The Board did not view Fund investment performance as a relevant factor in considering whether to approve thesub-advisory contracts for the Fund, as no AffiliatedSub-Adviser currently manages assets of the Fund.
The Board compared the Fund’s investment performance over multiple time periods ending December 31, 2018 to the performance of funds in the Broadridge performance universe and against the Lipper Variable Underlying Funds Science & Technology Funds Index. The Board noted that performance of Series I shares of the Fund was in the second quintile of its performance universe for the one year period and the fourth quintile for the three and five year periods (the first quintile being the best performing funds and the fifth quintile being the worst performing funds). The Board noted that performance of Series I shares of the Fund was above the performance of the Index for the one year period, and below the performance of the Index for the three and five year periods. The Board noted that overweight and underweight
Invesco V.I. Technology Fund
exposure to and security selection in certain technologysub-sectors negatively impacted Fund performance. The Trustees also reviewed more recent Fund performance and this review did not change their conclusions.
| C. | Advisory andSub-Advisory Fees and Fund Expenses |
The Board compared the Fund’s contractual management fee rate to the contractual management fee rates of funds in the Fund’s Broadridge expense group. The Board noted that the contractual management fee rate for Series I shares of the Fund was below the median contractual management fee rate of funds in its expense group. The Board noted that the term “contractual management fee” for funds in the expense group may include both advisory and certainnon-portfolio management administrative services fees, but that Broadridge does not provide information on a fund by fund basis as to what is included. The Board also reviewed the methodology used by Broadridge in providing expense group information, which includes using each fund’s contractual management fee schedule (including any applicable breakpoints) as reported in the most recent prospectus or statement of additional information for each fund in the expense group. The Board also considered comparative information regarding the Fund’s total expense ratio and its various components.
The Board noted that Invesco Advisers has contractually agreed to waive fees and/or limit expenses of the Fund for the term disclosed in the Fund’s registration statement in an amount necessary to limit total annual operating expenses to a specified percentage of average daily net assets for each class of the Fund.
The Board noted that Invesco Advisers and the AffiliatedSub-Advisers do not manage other similarly managed mutual funds or client accounts.
The Board also considered the services that may be provided by the AffiliatedSub-Advisers pursuant to thesub-advisory contracts, as well as the fees payable by Invesco Advisers to the AffiliatedSub-Advisers pursuant to thesub-advisory contracts.
| D. | Economies of Scale and Breakpoints |
The Board considered the extent to which there may be economies of scale in the provision of advisory services to the Fund. The Board considered Invesco’s reinvestment in its business, including investments in business infrastructure and cybersecurity. The Board also considered that the Fund may benefit from economies of scale through contractual breakpoints in the Fund’s advisory fee schedule, which generally operate to reduce the Fund’s expense ratio as it grows in size. The Board noted that the Fund shares directly in economies of scale through lower fees charged by third party service providers based on the combined size of the Invesco Funds. The Board noted that the Fund may also benefit from economies of scale through initial fee setting, fee waivers and expense reimbursements.
| E. | Profitability and Financial Resources |
The Board reviewed information from Invesco Advisers concerning the costs of the advisory and other services that Invesco Advisers and its affiliates provide to the Fund and the Invesco Funds and the profitability of Invesco Advisers and its affiliates in providing these services. The Board considered the methodology used for calculating profitability and noted the periodic review of such methodology by an independent consultant. The Board noted that Invesco Advisers continues to operate at a net profit from services Invesco Advisers and its affiliates provide to the Invesco Funds and the Fund. The Board did not deem the level of profits realized by Invesco Advisers and its affiliates from providing services to the Fund to be excessive given the nature, extent and quality of the services provided. The Board received information from Invesco Advisers demonstrating that Invesco Advisers and the AffiliatedSub-Advisers are financially sound and have the resources necessary to perform their obligations under the investment advisory agreement andsub-advisory contracts.
| F. | Collateral Benefits to Invesco Advisers and its Affiliates |
The Board considered various other benefits received by Invesco Advisers and its affiliates from the relationship with the Fund, including the fees received for providing administrative, transfer agency and distribution services to the Fund. The Board considered comparative information regarding fees charged for these services, including information provided by Broadridge and other independent sources. The Board considered the performance of Invesco Advisers and its affiliates in providing these services and the organizational structure employed to provide these services. The Board also considered that these services are provided to the Fund pursuant to written contracts that are reviewed and approved on an annual basis by the Board; and that the services are required for the operation of the Fund.
The Board considered the benefits realized by Invesco Advisers and the AffiliatedSub-Advisers as a result of portfolio brokerage transactions executed through “soft dollar” arrangements. The Board noted that soft dollar arrangements may result in the Fund bearing costs to purchase research that may be used by Invesco Advisers or the AffiliatedSub-Advisers with other clients and may reduce Invesco Advisers’ or the AffiliatedSub-Advisers’ expenses. The Board also considered that it receives periodic reports from Invesco representing that these arrangements are consistent with regulatory requirements. The Board did not deem the soft dollar arrangements to be inappropriate.
The Board considered that the Fund’s uninvested cash and cash collateral from any securities lending arrangements may be invested in money market funds advised by Invesco Advisers pursuant to procedures approved by the Board. The Board considered information regarding the returns of the affiliated money market funds relative to
comparable overnight investments, as well as the costs to the Fund of such investments. The Board noted that Invesco Advisers receives advisory fees from these affiliated money market funds attributable to such investments, although Invesco Advisers has contractually agreed to waive through varying periods the advisory fees payable by the Invesco Funds with respect to certain investments in the affiliated money market funds. The waiver is in an amount equal to 100% of the net advisory fee Invesco Advisers receives from the affiliated money market funds with respect to the Fund’s investment in the affiliated money market funds of uninvested cash, but not cash collateral. The Board concluded that the amount of advisory fees received by Invesco Advisers from the Fund’s investment of cash collateral from any securities lending arrangements in the affiliated money market funds is fair and reasonable.
The Board also considered that an affiliated broker may receive commissions for executing certain trades for the Fund. Invesco Advisers and the AffiliatedSub-Advisers may use the affiliated broker to, among other things, control order routing and minimize information leakage, and the Board was advised that such trades are executed in compliance with rules under the federal securities laws and consistent with best execution obligations.
Invesco V.I. Technology Fund
| Semiannual Report to Shareholders | June 30, 2019 |
Invesco V.I. Value Opportunities Fund
Beginning on January 1, 2021, as permitted by regulations adopted by the Securities and Exchange Commission, the insurance company that offers your variable annuity or variable life insurance contract may no longer send you paper copies of the Fund’s shareholder reports by mail, unless you specifically request paper copies of the reports from the insurance company or your financial intermediary. Instead of delivering paper copies of the report, the insurance company may choose to make the reports available on a website, and will notify you by mail each time a report is posted and provide you with a website link to access the report. Instructions for requesting paper copies will be provided by your insurance company.
If the insurance company offers electronic delivery, you may elect to receive shareholder reports and other communications about the Fund electronically by following the instructions provided by the insurance company or by contacting your financial intermediary. If you already elected to receive shareholder reports electronically, you will not be affected by this change and you need not take any action.
You may elect to receive all future reports in paper free of charge from the insurance company. You can inform the insurance company or your financial intermediary that you wish to continue receiving paper copies of your shareholder reports by following the instructions provided by the insurance company or by contacting your financial intermediary. Your election to receive reports in paper will apply to all portfolio companies available under your contract with the insurance company.
The Fund provides a complete list of its holdings four times in each fiscal year, at the quarter-ends. For the second and fourth quarters, the lists appear in the Fund’s semiannual and annual reports to shareholders. For the first and third quarters, the Fund files the lists with the Securities and Exchange Commission (SEC) on Form N-Q (or any successor Form). The Fund’s Form N-Q (or any successor Form) filings are available on the SEC website, sec.gov. The SEC file numbers for the Fund are 811-07452 and 033-57340. The Fund’s most recent portfolio holdings, as filed on Form N-Q (or any successor Form), have also been made available to insurance companies issuing variable annuity contracts and variable life insurance policies (“variable products”) that invest in the Fund.
A description of the policies and procedures that the Fund uses to determine how to vote proxies relating to portfolio securities is available without charge, upon request, from our Client Services department at 800 959 4246 or at invesco.com/proxyguidelines. The information is also available on the SEC website, sec.gov.
Information regarding how the Fund voted proxies related to its portfolio securities during the most recent 12-month period ended June 30 is available at invesco.com/proxysearch. The information is also available on the SEC website, sec.gov.
Invesco Advisers, Inc. is an investment adviser; it provides investment advisory services to individual and institutional clients and does not sell securities. Invesco Distributors, Inc. is the US distributor for Invesco Ltd.’s retail mutual funds, exchange-traded funds and institutional money market funds. Both are wholly owned, indirect subsidiaries of Invesco Ltd.
This report must be accompanied or preceded by a currently effective Fund prospectus and variable product prospectus, which contain more complete information, including sales charges and expenses. Investors should read each carefully before investing.
NOT FDIC INSURED | MAY LOSE VALUE | NO BANK GUARANTEE
| Invesco Distributors, Inc. | VK-VIVOPP-SAR-1 |
Performance summary
Fund vs. Indexes
Cumulative total returns, December 31, 2018 to June 30, 2019, excluding variable product issuer charges. If variable product issuer charges were included, returns would be lower.
| Series I Shares | 21.64% |
| Series II Shares | 21.49 |
| S&P 500 Index▼ (Broad Market Index) | 18.54 |
| S&P 1500 Value Index▼ (Style-Specific Index) | 16.63 |
Lipper VUF Multi-Cap Value Funds Index■
(Peer Group Index) | 15.04 |
| Source(s):▼FactSet Research Systems Inc.;■ Lipper Inc. |
TheS&P 500® Index is an unmanaged index considered representative of the US stock market.
The S&P 1500 Value Index tracks the performance of US large-, mid- and small-cap value stocks.
TheLipper VUF Multi-Cap Value Funds Indexis an unmanaged index considered representative of multi-cap value variable insurance underlying funds tracked by Lipper.
The Fund is not managed to track the performance of any particular index, including the indexes described here, and consequently, the performance of the Fund may deviate significantly from the performance of the indexes.
A direct investment cannot be made in an index. Unless otherwise indicated, index results include reinvested dividends, and they do not reflect sales charges. Performance of the peer group, if applicable, reflects fund expenses; performance of a market index does not.
| Average Annual Total Returns |
| As of 6/30/19 |
| Series I Shares | |
| Inception (9/10/01) | 4.53% |
| 10 Years | 10.50 |
| 5 Years | 4.40 |
| 1 Year | 1.53 |
| Series II Shares | |
| Inception (9/10/01) | 4.27% |
| 10 Years | 10.24 |
| 5 Years | 4.13 |
| 1 Year | 1.20 |
| Performance includes litigation proceeds. Had these proceeds not been received, total returns would have been lower. |
The performance of the Fund’s Series I and Series II share classes will differ primarily due to different class expenses.
The performance data quoted represent past performance and cannot guarantee comparable future results; current performance may be lower or higher. Please contact your variable product issuer or financial adviser for the most recent month-end variable product performance. Performance figures reflect Fund expenses, reinvested distributions and changes in net asset value. Performance figures do not reflect deduction of taxes a shareholder would pay on Fund distributions or sale of Fund shares. Investment return and principal value will fluctuate so that you may have a gain or loss when you sell shares.
The total annual Fund operating expense ratio set forth in the most recent Fund prospectus as of the date of this report for Series I and Series II shares was 1.01% and 1.26%, respectively. The expense ratios presented above may vary from the expense ratios presented in other sections of this report that are based on expenses incurred during the period covered by this report.
Invesco V.I. Value Opportunities Fund, a series portfolio of AIM Variable Insurance Funds (Invesco Variable Insurance Funds), is currently offered through insurance companies issuing variable products. You cannot purchase shares of the Fund directly. Performance figures given represent the Fund and are not intended to reflect actual variable product values. They do
not reflect sales charges, expenses and fees assessed in connection with a variable product. Sales charges, expenses and fees, which are determined by the variable product issuers, will vary and will lower the total return.
The most recent month-end performance at the Fund level, excluding variable product charges, is available at 800 451 4246. As mentioned above, for the most recent month-end performance including variable product charges, please contact your variable product issuer or financial adviser.
Fund performance reflects any applicable fee waivers and/or expense reimbursements. Had the adviser not waived fees and/or reimbursed expenses currently or in the past, returns would have been lower. See current prospectus for more information.
Invesco V.I. Value Opportunities Fund
Schedule of Investments(a)
June 30, 2019
(Unaudited)
| | Shares | Value |
| Common Stocks & Other Equity Interests–96.74% |
| Advertising–0.20% |
| Interpublic Group of Cos., Inc. (The) | 4,100 | $92,619 |
| Omnicom Group, Inc. | 1,115 | 91,374 |
| | | | 183,993 |
| Agricultural & Farm Machinery–2.37% |
| AGCO Corp., | 27,989 | 2,171,107 |
| Asset Management & Custody Banks–2.11% |
| Affiliated Managers Group, Inc. | 20,940 | 1,929,412 |
| Auto Parts & Equipment–6.24% |
| Dana, Inc. | 131,327 | 2,618,660 |
| Delphi Technologies PLC | 154,765 | 3,095,300 |
| | | | 5,713,960 |
| Building Products–7.71% |
| Masco Corp. | 76,308 | 2,994,326 |
| Owens Corning | 69,800 | 4,062,360 |
| | | | 7,056,686 |
| Construction & Engineering–6.47% |
| AECOM(b) | 112,004 | 4,239,351 |
| Fluor Corp. | 49,900 | 1,681,131 |
| | | | 5,920,482 |
| Consumer Finance–1.56% |
| SLM Corp. | 146,500 | 1,423,980 |
| Distributors–3.04% |
| LKQ Corp.(b) | 104,600 | 2,783,406 |
| Diversified Banks–4.94% |
| Bank of America Corp. | 48,774 | 1,414,446 |
| Citigroup, Inc. | 41,072 | 2,876,272 |
| JPMorgan Chase & Co. | 2,119 | 236,904 |
| | | | 4,527,622 |
| Diversified Chemicals–4.48% |
| Chemours Co. (The) | 77,737 | 1,865,688 |
| Huntsman Corp. | 109,500 | 2,238,180 |
| | | | 4,103,868 |
| Electronic Manufacturing Services–2.33% |
| Flex Ltd.(b) | 223,365 | 2,137,603 |
| Environmental & Facilities Services–2.62% |
| Stericycle, Inc.(b) | 50,146 | 2,394,472 |
| Health Care Distributors–3.47% |
| Cardinal Health, Inc. | 26,400 | 1,243,440 |
| McKesson Corp. | 14,400 | 1,935,216 |
| | | | 3,178,656 |
| | Shares | Value |
| Health Care Facilities–1.98% |
| Brookdale Senior Living, Inc.(b) | 251,151 | $1,810,799 |
| Health Care Services–1.27% |
| Cigna Corp. | 7,400 | 1,165,870 |
| Homebuilding–0.19% |
| D.R. Horton, Inc. | 4,100 | 176,833 |
| Hotels, Resorts & Cruise Lines–0.34% |
| Norwegian Cruise Line Holdings Ltd.(b) | 5,800 | 311,054 |
| Household Products–1.10% |
| Spectrum Brands Holdings, Inc. | 18,809 | 1,011,360 |
| Industrial Conglomerates–3.19% |
| Carlisle Cos., Inc. | 20,800 | 2,920,528 |
| Investment Banking & Brokerage–2.68% |
| Goldman Sachs Group, Inc. (The) | 12,000 | 2,455,200 |
| Life & Health Insurance–0.06% |
| MetLife, Inc. | 1,017 | 50,514 |
| Managed Health Care–2.19% |
| Anthem, Inc. | 7,100 | 2,003,691 |
| Metal & Glass Containers–4.51% |
| Crown Holdings, Inc.(b) | 67,600 | 4,130,360 |
| Oil & Gas Exploration & Production–9.46% |
| Apache Corp. | 28,200 | 816,954 |
| Diamondback Energy, Inc. | 18,400 | 2,005,048 |
| Noble Energy, Inc. | 84,800 | 1,899,520 |
| Parsley Energy, Inc., Class A(b) | 100,600 | 1,912,406 |
| Pioneer Natural Resources Co. | 13,200 | 2,030,952 |
| | | | 8,664,880 |
| Oil & Gas Refining & Marketing–2.19% |
| Marathon Petroleum Corp. | 35,800 | 2,000,504 |
| Other Diversified Financial Services–1.82% |
| AXA Equitable Holdings, Inc. | 79,900 | 1,669,910 |
| Paper Packaging–3.71% |
| Sealed Air Corp. | 79,500 | 3,401,010 |
| Pharmaceuticals–3.13% |
| Mylan N.V.(b) | 104,600 | 1,991,584 |
| Novartis AG (Switzerland) | 9,552 | 873,693 |
| | | | 2,865,277 |
| Steel–2.21% |
| Allegheny Technologies, Inc.(b) | 80,405 | 2,026,206 |
See accompanying Notes to Financial Statements which are an integral part of the financial statements.
Invesco V.I. Value Opportunities Fund
| | Shares | Value |
| Systems Software–3.29% |
| Oracle Corp. | 52,795 | $3,007,731 |
| Thrifts & Mortgage Finance–5.88% |
| MGIC Investment Corp.(b) | 248,221 | 3,261,624 |
| Radian Group, Inc. | 92,876 | 2,122,217 |
| | | | 5,383,841 |
| Total Common Stocks & Other Equity Interests (Cost $84,255,113) | 88,580,815 |
| Money Market Funds–3.35% |
| Invesco Government & Agency Portfolio, Institutional Class, 2.26%(c) | 1,228,616 | 1,228,616 |
| | Shares | Value |
| Money Market Funds–(continued) |
| Invesco Liquid Assets Portfolio, Institutional Class, 2.40%(c) | 877,292 | $877,643 |
| Invesco Treasury Portfolio, Institutional Class, 2.22%(c) | 959,863 | 959,863 |
| Total Money Market Funds (Cost $3,065,909) | 3,066,122 |
| TOTAL INVESTMENTS IN SECURITIES–100.09% (Cost $87,321,022) | 91,646,937 |
| OTHER ASSETS LESS LIABILITIES–(0.09)% | (79,480) |
| NET ASSETS–100.00% | $91,567,457 |
Notes to Schedule of Investments:
| (a) | Industry and/or sector classifications used in this report are generally according to the Global Industry Classification Standard, which was developed by and is the exclusive property and a service mark of MSCI Inc. and Standard & Poor’s. |
| (b) | Non-income producing security. |
| (c) | The money market fund and the Fund are affiliated by having the same investment adviser. The rate shown is the 7-day SEC standardized yield as of June 30, 2019. |
Portfolio Composition
By sector, based on Net Assets
as of June 30, 2019
| Industrials | 22.36% |
| Financials | 19.05 |
| Materials | 14.91 |
| Health Care | 12.04 |
| Energy | 11.65 |
| Consumer Discretionary | 9.81 |
| Information Technology | 5.62 |
| Other Sectors, Each Less than 2% of Net Assets | 1.30 |
| Money Market Funds Plus Other Assets Less Liabilities | 3.26 |
See accompanying Notes to Financial Statements which are an integral part of the financial statements.
Invesco V.I. Value Opportunities Fund
Statement of Assets and Liabilities
June 30, 2019
(Unaudited)
| Assets: | |
Investments in securities, at value
(Cost $84,255,113) | $88,580,815 |
| Investments in affiliated money market funds, at value (Cost $3,065,909) | 3,066,122 |
| Foreign currencies, at value (Cost $3,126) | 3,426 |
| Receivable for: | |
| Fund shares sold | 1,368 |
| Dividends | 65,341 |
| Investment for trustee deferred compensation and retirement plans | 112,812 |
| Other assets | 145 |
| Total assets | 91,830,029 |
| Liabilities: | |
| Payable for: | |
| Fund shares reacquired | 55,051 |
| Accrued fees to affiliates | 50,237 |
| Accrued trustees’ and officers’ fees and benefits | 427 |
| Accrued other operating expenses | 35,280 |
| Trustee deferred compensation and retirement plans | 121,577 |
| Total liabilities | 262,572 |
| Net assets applicable to shares outstanding | $91,567,457 |
| Net assets consist of: | |
| Shares of beneficial interest | $65,759,053 |
| Distributable earnings | 25,808,404 |
| | $91,567,457 |
| Net Assets: |
| Series I | $67,554,858 |
| Series II | $24,012,599 |
| Shares outstanding, no par value, with an unlimited number of shares authorized: |
| Series I | 10,103,281 |
| Series II | 3,602,232 |
| Series I: | |
| Net asset value per share | $6.69 |
| Series II: | |
| Net asset value per share | $6.67 |
Statement of Operations
For the six months ended June 30, 2019
(Unaudited)
| Investment income: | |
| Dividends (net of foreign withholding taxes of $4,085) | $522,557 |
| Dividends from affiliated money market funds | 37,989 |
| Total investment income | 560,546 |
| Expenses: | |
| Advisory fees | 320,353 |
| Administrative services fees | 75,592 |
| Custodian fees | 1,616 |
| Distribution fees - Series II | 30,188 |
| Transfer agent fees | 8,436 |
| Trustees’ and officers’ fees and benefits | 12,366 |
| Reports to shareholders | 4,750 |
| Professional services fees | 15,448 |
| Other | 888 |
| Total expenses | 469,637 |
| Less: Fees waived | (1,697) |
| Net expenses | 467,940 |
| Net investment income | 92,606 |
| Realized and unrealized gain from: | |
| Net realized gain from: | |
| Investment securities | 4,358,638 |
| Foreign currencies | 230 |
| | 4,358,868 |
| Change in net unrealized appreciation of: | |
| Investment securities | 12,990,478 |
| Foreign currencies | 267 |
| | 12,990,745 |
| Net realized and unrealized gain | 17,349,613 |
| Net increase in net assets resulting from operations | $17,442,219 |
See accompanying Notes to Financial Statements which are an integral part of the financial statements.
Invesco V.I. Value Opportunities Fund
Statement of Changes in Net Assets
For the six months ended June 30, 2019 and the year ended December 31, 2018
(Unaudited)
| | June 30,
2019 | December 31,
2018 |
| Operations: | | |
| Net investment income | $92,606 | $162,392 |
| Net realized gain | 4,358,868 | 18,204,360 |
| Change in net unrealized appreciation (depreciation) | 12,990,745 | (37,763,094) |
| Net increase (decrease) in net assets resulting from operations | 17,442,219 | (19,396,342) |
| Distributions to shareholders from distributable earnings: | | |
| Series I | — | (8,093,985) |
| Series II | — | (2,790,803) |
| Total distributions from distributable earnings | — | (10,884,788) |
| Share transactions–net: | | |
| Series I | (5,338,755) | (4,794,903) |
| Series II | (1,842,964) | (6,176,982) |
| Net increase (decrease) in net assets resulting from share transactions | (7,181,719) | (10,971,885) |
| Net increase (decrease) in net assets | 10,260,500 | (41,253,015) |
| Net assets: | | |
| Beginning of period | 81,306,957 | 122,559,972 |
| End of period | $91,567,457 | $81,306,957 |
See accompanying Notes to Financial Statements which are an integral part of the financial statements.
Invesco V.I. Value Opportunities Fund
Financial Highlights
June 30, 2019
(Unaudited)
The following schedule presents financial highlights for a share of the Fund outstanding throughout the periods indicated.
| | Net asset
value,
beginning
of period | Net
investment
income(a) | Net gains
(losses)
on securities
(both
realized and
unrealized) | Total from
investment
operations | Dividends
from net
investment
income | Distributions
from net
realized
gains | Total
distributions | Net asset
value, end
of period | Total
return(b) | Net assets,
end of period
(000’s omitted) | Ratio of
expenses
to average
net assets
with fee waivers
and/or expenses
absorbed | Ratio of
expenses
to average net
assets without
fee waivers
and/or expenses
absorbed | Ratio of net
investment
income
(loss)
to average
net assets | Portfolio
turnover(c) |
| Series I |
| Six months ended 06/30/19 | $5.50 | $0.01 | $1.18 | $1.19 | $— | $— | $— | $6.69 | 21.64% | $67,555 | 0.95%(d) | 0.95%(d) | 0.27%(d) | 22% |
| Year ended 12/31/18 | 7.58 | 0.01 | (1.30) | (1.29) | (0.02) | (0.77) | (0.79) | 5.50 | (19.18) | 59,998 | 1.01 | 1.01 | 0.22 | 45 |
| Year ended 12/31/17 | 6.48 | 0.02 | 1.11(e) | 1.13 | (0.03) | — | (0.03) | 7.58 | 17.44(e) | 87,232 | 0.98 | 0.98 | 0.30 | 28 |
| Year ended 12/31/16 | 7.82 | 0.03 | 1.10 | 1.13 | (0.03) | (2.44) | (2.47) | 6.48 | 18.34 | 85,722 | 1.01 | 1.02 | 0.43 | 36 |
| Year ended 12/31/15 | 9.84 | 0.05 | (1.09) | (1.04) | (0.26) | (0.72) | (0.98) | 7.82 | (10.40) | 83,889 | 1.04 | 1.04 | 0.51 | 82 |
| Year ended 12/31/14 | 9.36 | 0.18(f) | 0.44 | 0.62 | (0.14) | — | (0.14) | 9.84 | 6.62 | 110,865 | 1.03 | 1.04 | 1.87(f) | 15 |
| Series II |
| Six months ended 06/30/19 | 5.49 | 0.00 | 1.18 | 1.18 | — | — | — | 6.67 | 21.49 | 24,013 | 1.20(d) | 1.20(d) | 0.02(d) | 22 |
| Year ended 12/31/18 | 7.56 | 0.00 | (1.30) | (1.30) | — | (0.77) | (0.77) | 5.49 | (19.35) | 21,309 | 1.26 | 1.26 | (0.03) | 45 |
| Year ended 12/31/17 | 6.45 | 0.00 | 1.11(e) | 1.11 | 0.00 | — | 0.00 | 7.56 | 17.23(e) | 35,328 | 1.23 | 1.23 | 0.05 | 28 |
| Year ended 12/31/16 | 7.79 | 0.01 | 1.10 | 1.11 | (0.01) | (2.44) | (2.45) | 6.45 | 17.92 | 54,438 | 1.26 | 1.27 | 0.18 | 36 |
| Year ended 12/31/15 | 9.79 | 0.02 | (1.08) | (1.06) | (0.22) | (0.72) | (0.94) | 7.79 | (10.65) | 54,887 | 1.29 | 1.29 | 0.26 | 82 |
| Year ended 12/31/14 | 9.31 | 0.15(f) | 0.44 | 0.59 | (0.11) | — | (0.11) | 9.79 | 6.39 | 80,217 | 1.28 | 1.29 | 1.62(f) | 15 |
| (a) | Calculated using average shares outstanding. |
| (b) | Includes adjustments in accordance with accounting principles generally accepted in the United States of America and as such, the net asset value for financial reporting purposes and the returns based upon those net asset values may differ from the net asset value and returns for shareholder transactions. Total returns are not annualized for periods less than one year, if applicable, and do not reflect charges assessed in connection with a variable product, which if included would reduce total returns. |
| (c) | Portfolio turnover is calculated at the fund level and is not annualized for periods less than one year, if applicable. |
| (d) | Ratios are annualized and based on average daily net assets (000’s omitted) of $68,602 and $24,350 for Series I and Series II shares, respectively. |
| (e) | Includes litigation proceeds received during the period. Had these litigation proceeds not been received, Net gains (losses) on securities (both realized and unrealized) per share would have been $1.09 and $1.09 for Series I and Series II shares, respectively. Total returns would have been lower. |
| (f) | Net Investment income per share and the ratio of net investment income to average net assets include significant dividends received during the year ended December 31, 2014. Net Investment income per share and the ratio of net investment income to average net assets excluding the significant dividends are $0.12 and 1.23% and $0.09 and 0.98% for Series I and Series II, respectively. |
See accompanying Notes to Financial Statements which are an integral part of the financial statements.
Invesco V.I. Value Opportunities Fund
Notes to Financial Statements
June 30, 2019
(Unaudited)
NOTE 1—Significant Accounting Policies
Invesco V.I. Value Opportunities Fund (the “Fund”) is a series portfolio of AIM Variable Insurance Funds (Invesco Variable Insurance Funds) (the “Trust”). The Trust is a Delaware statutory trust registered under the Investment Company Act of 1940, as amended (the “1940 Act”), as an open-end series management investment company. Information presented in these financial statements pertains only to the Fund. Matters affecting the Fund or each class will be voted on exclusively by the shareholders of the Fund or each class. Current Securities and Exchange Commission (“SEC”) guidance, however, requires participating insurance companies offering separate accounts to vote shares proportionally in accordance with the instructions of the contract owners whose investments are funded by shares of each Fund or class.
The Fund’s investment objective is long-term growth of capital.
The Fund currently offers two classes of shares, Series I and Series II, both of which are offered to insurance company separate accounts funding variable annuity contracts and variable life insurance policies (“variable products”).
The Fund is an investment company and accordingly follows the investment company accounting and reporting guidance in accordance with Financial Accounting Standards Board Accounting Standards Codification Topic 946,Financial Services – Investment Companies.
The following is a summary of the significant accounting policies followed by the Fund in the preparation of its financial statements.
| A. | Security Valuations — Securities, including restricted securities, are valued according to the following policy. |
A security listed or traded on an exchange (except convertible securities) is valued at its last sales price or official closing price as of the close of the customary trading session on the exchange where the security is principally traded, or lacking any sales or official closing price on a particular day, the security may be valued at the closing bid price on that day. Securities traded in the over-the-counter market are valued based on prices furnished by independent pricing services or market makers. When such securities are valued by an independent pricing service they may be considered fair valued. Futures contracts are valued at the final settlement price set by an exchange on which they are principally traded. Listed options are valued at the mean between the last bid and asked prices from the exchange on which they are principally traded. Options not listed on an exchange are valued by an independent source at the mean between the last bid and asked prices. For purposes of determining net asset value (“NAV”) per share, futures and option contracts generally are valued 15 minutes after the close of the customary trading session of the New York Stock Exchange (“NYSE”).
Investments in open-end and closed-end registered investment companies that do not trade on an exchange are valued at the end-of-day net asset value per share. Investments in open-end and closed-end registered investment companies that trade on an exchange are valued at the last sales price or official closing price as of the close of the customary trading session on the exchange where the security is principally traded.
Debt obligations (including convertible securities) and unlisted equities are fair valued using an evaluated quote provided by an independent pricing service. Evaluated quotes provided by the pricing service may be determined without exclusive reliance on quoted prices, and may reflect appropriate factors such as institution-size trading in similar groups of securities, developments related to specific securities, dividend rate (for unlisted equities), yield (for debt obligations), quality, type of issue, coupon rate (for debt obligations), maturity (for debt obligations), individual trading characteristics and other market data. Pricing services generally value debt obligations assuming orderly transactions of institutional round lot size, but a fund may hold or transact in the same securities in smaller, odd lot sizes. Odd lots often trade at lower prices than institutional round lots. Debt obligations are subject to interest rate and credit risks. In addition, all debt obligations involve some risk of default with respect to interest and/or principal payments.
Foreign securities’ (including foreign exchange contracts) prices are converted into U.S. dollar amounts using the applicable exchange rates as of the close of the NYSE. If market quotations are available and reliable for foreign exchange-traded equity securities, the securities will be valued at the market quotations. Because trading hours for certain foreign securities end before the close of the NYSE, closing market quotations may become unreliable. If between the time trading ends on a particular security and the close of the customary trading session on the NYSE, events occur that the investment adviser determines are significant and make the closing price unreliable, the Fund may fair value the security. If the event is likely to have affected the closing price of the security, the security will be valued at fair value in good faith using procedures approved by the Board of Trustees. Adjustments to closing prices to reflect fair value may also be based on a screening process of an independent pricing service to indicate the degree of certainty, based on historical data, that the closing price in the principal market where a foreign security trades is not the current value as of the close of the NYSE. Foreign securities’ prices meeting the approved degree of certainty that the price is not reflective of current value will be priced at the indication of fair value from the independent pricing service. Multiple factors may be considered by the independent pricing service in determining adjustments to reflect fair value and may include information relating to sector indices, American Depositary Receipts and domestic and foreign index futures. Foreign securities may have additional risks including exchange rate changes, potential for sharply devalued currencies and high inflation, political and economic upheaval, the relative lack of issuer information, relatively low market liquidity and the potential lack of strict financial and accounting controls and standards.
Securities for which market prices are not provided by any of the above methods may be valued based upon quotes furnished by independent sources. The last bid price may be used to value equity securities. The mean between the last bid and asked prices is used to value debt obligations, including corporate loans.
Securities for which market quotations are not readily available or became unreliable are valued at fair value as determined in good faith by or under the supervision of the Trust’s officers following procedures approved by the Board of Trustees. Issuer specific events, market trends, bid/asked quotes of brokers and information providers and other market data may be reviewed in the course of making a good faith determination of a security’s fair value.
The Fund may invest in securities that are subject to interest rate risk, meaning the risk that the prices will generally fall as interest rates rise and, conversely, the prices will generally rise as interest rates fall. Specific securities differ in their sensitivity to changes in interest rates depending on their individual characteristics. Changes in interest rates may result in increased market volatility, which may affect the value and/or liquidity of certain Fund investments.
Invesco V.I. Value Opportunities Fund
Valuations change in response to many factors including the historical and prospective earnings of the issuer, the value of the issuer’s assets, general economic conditions, interest rates, investor perceptions and market liquidity. Because of the inherent uncertainties of valuation, the values reflected in the financial statements may materially differ from the value received upon actual sale of those investments.
| B. | Securities Transactions and Investment Income — Securities transactions are accounted for on a trade date basis. Realized gains or losses on sales are computed on the basis of specific identification of the securities sold. Interest income (net of withholding tax, if any) is recorded on the accrual basis from settlement date. Dividend income (net of withholding tax, if any) is recorded on the ex-dividend date. |
The Fund may periodically participate in litigation related to Fund investments. As such, the Fund may receive proceeds from litigation settlements. Any proceeds received are included in the Statement of Operations as realized gain (loss) for investments no longer held and as unrealized gain (loss) for investments still held.
Brokerage commissions and mark ups are considered transaction costs and are recorded as an increase to the cost basis of securities purchased and/or a reduction of proceeds on a sale of securities. Such transaction costs are included in the determination of net realized and unrealized gain (loss) from investment securities reported in the Statement of Operations and the Statement of Changes in Net Assets and the net realized and unrealized gains (losses) on securities per share in the Financial Highlights. Transaction costs are included in the calculation of the Fund’s net asset value and, accordingly, they reduce the Fund’s total returns. These transaction costs are not considered operating expenses and are not reflected in net investment income reported in the Statement of Operations and the Statement of Changes in Net Assets, or the net investment income per share and the ratios of expenses and net investment income reported in the Financial Highlights, nor are they limited by any expense limitation arrangements between the Fund and the investment adviser.
The Fund allocates income and realized and unrealized capital gains and losses to a class based on the relative net assets of each class.
| C. | Country Determination — For the purposes of making investment selection decisions and presentation in the Schedule of Investments, the investment adviser may determine the country in which an issuer is located and/or credit risk exposure based on various factors. These factors include the laws of the country under which the issuer is organized, where the issuer maintains a principal office, the country in which the issuer derives 50% or more of its total revenues and the country that has the primary market for the issuer’s securities, as well as other criteria. Among the other criteria that may be evaluated for making this determination are the country in which the issuer maintains 50% or more of its assets, the type of security, financial guarantees and enhancements, the nature of the collateral and the sponsor organization. Country of issuer and/or credit risk exposure has been determined to be the United States of America, unless otherwise noted. |
| D. | Distributions– Distributions from net investment income and net realized capital gain, if any, are generally declared and paid to separate accounts of participating insurance companies annually and recorded on the ex-dividend date. |
| E. | Federal Income Taxes –The Fund intends to comply with the requirements of Subchapter M of the Internal Revenue Code of 1986, as amended (the “Internal Revenue Code”), necessary to qualify as a regulated investment company and to distribute substantially all of the Fund’s taxable earnings to shareholders. As such, the Fund will not be subject to federal income taxes on otherwise taxable income (including net realized capital gain) that is distributed to shareholders. Therefore, no provision for federal income taxes is recorded in the financial statements. |
The Fund recognizes the tax benefits of uncertain tax positions only when the position is more likely than not to be sustained. Management has analyzed the Fund’s uncertain tax positions and concluded that no liability for unrecognized tax benefits should be recorded related to uncertain tax positions. Management is not aware of any tax positions for which it is reasonably possible that the total amounts of unrecognized tax benefits will change materially in the next 12 months.
The Fund files tax returns in the U.S. Federal jurisdiction and certain other jurisdictions. Generally, the Fund is subject to examinations by such taxing authorities for up to three years after the filing of the return for the tax period.
| F. | Expenses– Fees provided for under the Rule 12b-1 plan of a particular class of the Fund and which are directly attributable to that class are charged to the operations of such class. All other expenses are allocated among the classes based on relative net assets. |
| G. | Accounting Estimates – The preparation of financial statements in conformity with accounting principles generally accepted in the United States of America (“GAAP”) requires management to make estimates and assumptions that affect the reported amounts of assets and liabilities at the date of the financial statements and the reported amounts of revenues and expenses during the reporting period including estimates and assumptions related to taxation. Actual results could differ from those estimates by a significant amount. In addition, the Fund monitors for material events or transactions that may occur or become known after the period-end date and before the date the financial statements are released to print. |
| H. | Indemnifications – Under the Trust’s organizational documents, each Trustee, officer, employee or other agent of the Trust is indemnified against certain liabilities that may arise out of the performance of their duties to the Fund. Additionally, in the normal course of business, the Fund enters into contracts, including the Fund’s servicing agreements, that contain a variety of indemnification clauses. The Fund’s maximum exposure under these arrangements is unknown as this would involve future claims that may be made against the Fund that have not yet occurred. The risk of material loss as a result of such indemnification claims is considered remote. |
| I. | Foreign Currency Translations— Foreign currency is valued at the close of the NYSE based on quotations posted by banks and major currency dealers. Portfolio securities and other assets and liabilities denominated in foreign currencies are translated into U.S. dollar amounts at the date of valuation. Purchases and sales of portfolio securities (net of foreign taxes withheld on disposition) and income items denominated in foreign currencies are translated into U.S. dollar amounts on the respective dates of such transactions. The Fund does not separately account for the portion of the results of operations resulting from changes in foreign exchange rates on investments and the fluctuations arising from changes in market prices of securities held. The combined results of changes in foreign exchange rates and the fluctuation of market prices on investments (net of estimated foreign tax withholding) are included with the net realized and unrealized gain or loss from investments in the Statement of Operations. Reported net realized foreign currency gains or losses arise from (1) sales of foreign currencies, (2) currency gains or losses realized between the trade and settlement dates on securities transactions, and (3) the difference between the amounts of dividends, interest, and foreign withholding taxes recorded on the Fund’s books and the U.S. dollar equivalent of the amounts actually received or paid. Net unrealized foreign currency gains and losses arise from changes in the fair values of assets and liabilities, other than investments in securities at fiscal period end, resulting from changes in exchange rates. |
The Fund may invest in foreign securities, which may be subject to foreign taxes on income, gains on investments or currency repatriation, a portion of which may be recoverable. Foreign taxes, if any, are recorded based on the tax regulations and rates that exist in the foreign markets in which the Fund invests and are shown in the Statement of Operations.
Invesco V.I. Value Opportunities Fund
| J. | Forward Foreign Currency Contracts— The Fund may engage in foreign currency transactions either on a spot (i.e. for prompt delivery and settlement) basis, or through forward foreign currency contracts, to manage or minimize currency or exchange rate risk. |
The Fund may also enter into forward foreign currency contracts for the purchase or sale of a security denominated in a foreign currency in order to “lock in” the U.S. dollar price of that security, or the Fund may also enter into forward foreign currency contracts that do not provide for physical settlement of the two currencies, but instead are settled by a single cash payment calculated as the difference between the agreed upon exchange rate and the spot rate at settlement based upon an agreed upon notional amount (non-deliverable forwards). The Fund will set aside liquid assets in an amount equal to the daily mark-to-market obligation for forward foreign currency contracts.
A forward foreign currency contract is an obligation between two parties (“Counterparties”) to purchase or sell a specific currency for an agreed-upon price at a future date. The use of forward foreign currency contracts does not eliminate fluctuations in the price of the underlying securities the Fund owns or intends to acquire but establishes a rate of exchange in advance. Fluctuations in the value of these contracts are measured by the difference in the contract date and reporting date exchange rates and are recorded as unrealized appreciation (depreciation) until the contracts are closed. When the contracts are closed, realized gains (losses) are recorded. Realized and unrealized gains (losses) on the contracts are included in the Statement of Operations. The primary risks associated with forward foreign currency contracts include failure of the Counterparty to meet the terms of the contract and the value of the foreign currency changing unfavorably. These risks may be in excess of the amounts reflected in the Statement of Assets and Liabilities.
NOTE 2—Advisory Fees and Other Fees Paid to Affiliates
The Trust has entered into a master investment advisory agreement with Invesco Advisers, Inc. (the "Adviser" or "Invesco"). Under the terms of the investment advisory agreement, the Fund accrues daily and pays monthly an advisory fee to the Adviser based on the annual rate of the Fund’s average daily net assets as follows:
| Average Daily Net Assets | Rate |
| First $250 million | 0.695% |
| First $250 million | 0.67% |
| First $500 million | 0.645% |
| Next $1.5 billion | 0.62% |
| Next $2.5 billion | 0.595% |
| Next $2.5 billion | 0.57% |
| Next $2.5 billion | 0.545% |
| Over $10 billion | 0.52% |
For the six months ended June 30, 2019, the effective advisory fees incurred by the Fund was 0.695%.
Under the terms of a master sub-advisory agreement between the Adviser and each of Invesco Asset Management Deutschland GmbH, Invesco Asset Management Limited, Invesco Asset Management (Japan) Limited, Invesco Hong Kong Limited, Invesco Senior Secured Management, Inc. and Invesco Canada Ltd. and separate sub-advisory agreements with Invesco Capital Management LLC and Invesco Asset Management (India) Private Limited (collectively, the "Affiliated Sub-Advisers") the Adviser, not the Fund, will pay 40% of the fees paid to the Adviser to any such Affiliated Sub-Adviser(s) that provide(s) discretionary investment management services to the Fund based on the percentage of assets allocated to such Affiliated Sub-Adviser(s).
The Adviser has contractually agreed, through at least June 30, 2020, to waive advisory fees and/or reimburse expenses of all shares to the extent necessary to limit total annual fund operating expenses after fee waiver and/or expense reimbursement (excluding certain items discussed below) of Series I shares to 2.00% and Series II shares to 2.25% of average daily net assets (the “expense limits”). In determining the Adviser’s obligation to waive advisory fees and/or reimburse expenses, the following expenses are not taken into account, and could cause the total annual fund operating expenses after fee waiver and/or expense reimbursement to exceed the numbers reflected above: (1) interest; (2) taxes; (3) dividend expense on short sales; (4) extraordinary or non-routine items, including litigation expenses; and (5) expenses that the Fund has incurred but did not actually pay because of an expense offset arrangement. Unless Invesco continues the fee waiver agreement, it will terminate on June 30, 2020. During its term, the fee waiver agreement cannot be terminated or amended to increase the expense limits or reduce the advisory fee waiver without approval of the Board of Trustees. The Adviser did not waive fees and/or reimburse expenses during the period under these expense limits.
Further, the Adviser has contractually agreed, through at least June 30, 2021, to waive the advisory fee payable by the Fund in an amount equal to 100% of the net advisory fees the Adviser receives from the affiliated money market funds on investments by the Fund of uninvested cash in such affiliated money market funds.
For the six months ended June 30, 2019, the Adviser waived advisory fees of $1,697.
The Trust has entered into a master administrative services agreement with Invesco pursuant to which the Fund has agreed to pay Invesco a fee for costs incurred in providing accounting services and fund administrative services to the Fund and to reimburse Invesco for fees paid to insurance companies that have agreed to provide certain administrative services to the Fund. These administrative services provided by the insurance companies may include, among other things: maintenance of master accounts with the Fund; tracking, recording and transmitting net purchase and redemption orders for Fund shares; maintaining and preserving records related to the purchase, redemption and other account activity of variable product owners; distributing copies of Fund documents such as prospectuses, proxy materials and periodic reports, to variable product owners, and responding to inquiries from variable product owners about the Fund. Pursuant to such agreement, for the six months ended June 30, 2019, Invesco was paid $6,511 for accounting and fund administrative services and was reimbursed $69,081 for fees paid to insurance companies. Also, Invesco has entered into a sub-administration agreement whereby State Street Bank and Trust Company (“SSB”) serves as custodian and fund accountant and provides certain administrative services to the Fund.
The Trust has entered into a transfer agency and service agreement with Invesco Investment Services, Inc. (“IIS”) pursuant to which the Fund has agreed to pay IIS a fee for providing transfer agency and shareholder services to the Fund and reimburse IIS for certain expenses incurred by IIS in the
Invesco V.I. Value Opportunities Fund
course of providing such services. For the six months ended June 30, 2019, expenses incurred under the agreement are shown in the Statement of Operations asTransfer agent fees.
The Trust has entered into a master distribution agreement with Invesco Distributors, Inc. (“IDI”) to serve as the distributor for the Fund. The Trust has adopted a plan pursuant to Rule 12b-1 under the 1940 Act with respect to the Fund’s Series II shares (the “Plan”). The Fund, pursuant to the Plan, pays IDI compensation at the annual rate of 0.25% of the Fund’s average daily net assets of Series II shares. The fees are accrued daily and paid monthly. Of the Plan payments, up to 0.25% of the average daily net assets of the Series II shares may be paid to insurance companies who furnish continuing personal shareholder services to customers who purchase and own Series II shares of the Fund. For the six months ended June 30, 2019, expenses incurred under the Plan are detailed in the Statement of Operations asDistribution fees.
For the six months ended June 30, 2019, the Fund incurred $390 in brokerage commissions with Invesco Capital Markets, Inc., an affiliate of the Adviser and IDI, for portfolio transactions executed on behalf of the Fund.
Certain officers and trustees of the Trust are officers and directors of the Adviser, IIS and/or IDI.
NOTE 3—Additional Valuation Information
GAAP defines fair value as the price that would be received to sell an asset or paid to transfer a liability in an orderly transaction between market participants at the measurement date, under current market conditions. GAAP establishes a hierarchy that prioritizes the inputs to valuation methods, giving the highest priority to readily available unadjusted quoted prices in an active market for identical assets (Level 1) and the lowest priority to significant unobservable inputs (Level 3), generally when market prices are not readily available or are unreliable. Based on the valuation inputs, the securities or other investments are tiered into one of three levels. Changes in valuation methods may result in transfers in or out of an investment’s assigned level:
Level 1 – Prices are determined using quoted prices in an active market for identical assets.
Level 2 – Prices are determined using other significant observable inputs. Observable inputs are inputs that other market participants may use in pricing a security. These may include quoted prices for similar securities, interest rates, prepayment speeds, credit risk, yield curves, loss severities, default rates, discount rates, volatilities and others.
Level 3 – Prices are determined using significant unobservable inputs. In situations where quoted prices or observable inputs are unavailable (for example, when there is little or no market activity for an investment at the end of the period), unobservable inputs may be used. Unobservable inputs reflect the Fund’s own assumptions about the factors market participants would use in determining fair value of the securities or instruments and would be based on the best available information.
The following is a summary of the tiered valuation input levels, as of June 30, 2019. The level assigned to the securities valuations may not be an indication of the risk or liquidity associated with investing in those securities. Because of the inherent uncertainties of valuation, the values reflected in the financial statements may materially differ from the value received upon actual sale of those investments.
| | Level 1 | Level 2 | Level 3 | Total |
| Investments in Securities | | | | |
| Common Stocks & Other Equity Interests | $87,707,122 | $873,693 | $— | $88,580,815 |
| Money Market Funds | 3,066,122 | — | — | 3,066,122 |
| Total Investments | $90,773,244 | $873,693 | $— | $91,646,937 |
NOTE 4—Trustees’ and Officers’ Fees and Benefits
Trustees’ and Officers’ Fees and Benefits include amounts accrued by the Fund to pay remuneration to certain Trustees and Officers of the Fund. Trustees have the option to defer compensation payable by the Fund, and Trustees’ and Officers’ Fees and Benefits also include amounts accrued by the Fund to fund such deferred compensation amounts. Those Trustees who defer compensation have the option to select various Invesco Funds in which their deferral accounts shall be deemed to be invested. Finally, certain current Trustees were eligible to participate in a retirement plan that provided for benefits to be paid upon retirement to Trustees over a period of time based on the number of years of service. The Fund may have certain former Trustees who also participate in a retirement plan and receive benefits under such plan.Trustees’ and Officers’ Fees and Benefits include amounts accrued by the Fund to fund such retirement benefits. Obligations under the deferred compensation and retirement plans represent unsecured claims against the general assets of the Fund.
NOTE 5—Cash Balances
The Fund is permitted to temporarily carry a negative or overdrawn balance in its account with State Street Bank and Trust Company, the custodian bank. Such balances, if any at period-end, are shown in the Statement of Assets and Liabilities under the payable caption Amount due custodian. To compensate the custodian bank for such overdrafts, the overdrawn Fund may either (1) leave funds as a compensating balance in the account so the custodian bank can be compensated by earning the additional interest; or (2) compensate by paying the custodian bank at a rate agreed upon by the custodian bank and Invesco, not to exceed the contractually agreed upon rate.
NOTE 6—Tax Information
The amount and character of income and gains to be distributed are determined in accordance with income tax regulations, which may differ from GAAP. Reclassifications are made to the Fund’s capital accounts to reflect income and gains available for distribution (or available capital loss carryforward) under income tax regulations. The tax character of distributions paid during the year and the tax components of net assets will be reported at the Fund’s fiscal year-end.
Capital loss carryforward is calculated and reported as of a specific date. Results of transactions and other activity after that date may affect the amount of capital loss carryforward actually available for the Fund to utilize. Capital losses generated in years beginning after December 22, 2010
Invesco V.I. Value Opportunities Fund
can be carried forward for an unlimited period, whereas previous losses expire in eight tax years. Capital losses with an expiration period may not be used to offset capital gains until all net capital losses without an expiration date have been utilized. Capital loss carryforwards with no expiration date will retain their character as either short-term or long-term capital losses instead of as short-term capital losses as under prior law. The ability to utilize capital loss carryforwards in the future may be limited under the Internal Revenue Code and related regulations based on the results of future transactions.
The Fund did not have a capital loss carryforward as of December 31, 2018.
NOTE 7—Investment Transactions
The aggregate amount of investment securities (other than short-term securities, U.S. Treasury obligations and money market funds, if any) purchased and sold by the Fund during the six months ended June 30, 2019 was $19,764,913 and $27,319,866, respectively. Cost of investments, including any derivatives, on a tax basis includes the adjustments for financial reporting purposes as of the most recently completed federal income tax reporting period-end.
| Unrealized Appreciation (Depreciation) of Investments on a Tax Basis |
| Aggregate unrealized appreciation of investments | $12,567,832 |
| Aggregate unrealized (depreciation) of investments | (9,011,395) |
| Net unrealized appreciation of investments | $3,556,437 |
Cost of investments for tax purposes is $88,090,500.
NOTE 8—Share Information
| | Summary of Share Activity |
| | Six months ended
June 30, 2019(a) | | Year ended
December 31, 2018 |
| | Shares | Amount | | Shares | Amount |
| Sold: | | | | | |
| Series I | 292,193 | $1,870,552 | | 246,902 | $1,647,873 |
| Series II | 81,761 | 528,375 | | 230,991 | 1,598,135 |
| Issued as reinvestment of dividends: | | | | | |
| Series I | — | — | | 1,156,284 | 8,093,985 |
| Series II | — | — | | 399,257 | 2,790,803 |
| Reacquired: | | | | | |
| Series I | (1,106,090) | (7,209,307) | | (1,997,013) | (14,536,761) |
| Series II | (364,082) | (2,371,339) | | (1,418,342) | (10,565,920) |
| Net increase (decrease) in share activity | (1,096,218) | $(7,181,719) | | (1,381,921) | $(10,971,885) |
| (a) | There are entities that are record owners of more than 5% of the outstanding shares of the Fund and in the aggregate own 69% of the outstanding shares of the Fund. The Fund and the Fund’s principal underwriter or adviser, are parties to participation agreements with these entities whereby these entities sell units of interest in separate accounts funding variable products that are invested in the Fund. The Fund, Invesco and/or Invesco affiliates may make payments to these entities, which are considered to be related to the Fund, for providing services to the Fund, Invesco and/or Invesco affiliates including but not limited to services such as, securities brokerage, third party record keeping and account servicing and administrative services. The Fund has no knowledge as to whether all or any portion of the shares owned of record by these entities are also owned beneficially. |
Invesco V.I. Value Opportunities Fund
Calculating your ongoing Fund expenses
Example
As a shareholder of the Fund, you incur ongoing costs, including management fees; distribution and/or service fees (12b-1); and other Fund expenses. This example is intended to help you understand your ongoing costs (in dollars) of investing in the Fund and to compare these costs with ongoing costs of investing in other mutual funds. The example is based on an investment of $1,000 invested at the beginning of the period and held for the entire period January 1, 2019 through June 30, 2019.
The actual and hypothetical expenses in the examples below do not represent the effect of any fees or other expenses assessed in connection with a variable product; if they did, the expenses shown would be higher while the ending account values shown would be lower.
Actual expenses
The table below provides information about actual account values and actual expenses. You may use the information in this table, together with the amount you invested, to estimate the expenses that you paid over the period. Simply divide your account value by $1,000 (for example, an $8,600 account value divided by $1,000 = 8.6), then multiply the result by the number in the table under the heading entitled “Actual Expenses Paid During Period” to estimate the expenses you paid on your account during this period.
Hypothetical example for comparison purposes
The table below also provides information about hypothetical account values and hypothetical expenses based on the Fund’s actual expense ratio and an assumed rate of return of 5% per year before expenses, which is not the Fund’s actual return.
The hypothetical account values and expenses may not be used to estimate the actual ending account balance or expenses you paid for the period. You may use this information to compare the ongoing costs of investing in the Fund and other funds. To do so, compare this 5% hypothetical example with the 5% hypothetical examples that appear in the shareholder reports of the other funds.
Please note that the expenses shown in the table are meant to highlight your ongoing costs. Therefore, the hypothetical information is useful in comparing ongoing costs, and will not help you determine the relative total costs of owning different funds.
| | Beginning
Account Value (01/01/19) | ACTUAL | HYPOTHETICAL
(5% annual return before
expenses) | Annualized
Expense
Ratio |
Ending
Account Value
(06/30/19)1 | Expenses
Paid During
Period2 | Ending
Account Value
(06/30/19) | Expenses
Paid During
Period2 |
| Series I | $1,000.00 | $1,216.40 | $5.22 | $1,020.08 | $4.76 | 0.95% |
| Series II | 1,000.00 | 1,214.90 | 6.59 | 1,018.84 | 6.01 | 1.20 |
| 1 | The actual ending account value is based on the actual total return of the Fund for the period January 1, 2019 through June 30, 2019, after actual expenses and will differ from the hypothetical ending account value which is based on the Fund’s expense ratio and a hypothetical annual return of 5% before expenses. |
| 2 | Expenses are equal to the Fund’s annualized expense ratio as indicated above multiplied by the average account value over the period, multiplied by 181/365 to reflect the most recent fiscal half year. |
Invesco V.I. Value Opportunities Fund
Invesco V.I. Value Opportunities Fund
Approval of Investment Advisory andSub-Advisory Contracts
At meetings held on June 10, 2019, the Board of Trustees (the Board or the Trustees) of AIM Variable Insurance Funds (Invesco Variable Insurance Funds) as a whole, and the independent Trustees, who comprise over 75% of the Board, voting separately, approved the continuance of the Invesco V.I. Value Opportunities Fund’s (the Fund) Master Investment Advisory Agreement with Invesco Advisers, Inc. (Invesco Advisers and the investment advisory agreement) and the Master IntergroupSub-Advisory Contract for Mutual Funds with Invesco Asset Management Deutschland GmbH, Invesco Asset Management Limited, Invesco Asset Management (Japan) Limited, Invesco Hong Kong Limited, Invesco Senior Secured Management, Inc. and Invesco Canada Ltd. and separatesub-advisory contracts with Invesco Capital Management LLC and Invesco Asset Management (India) Private Limited (collectively, the AffiliatedSub-Advisers and thesub-advisory contracts) for another year, effective July 1, 2019. After evaluating the factors discussed below, among others, the Board approved the renewal of the Fund’s investment advisory agreement and thesub-advisory contracts and determined that the compensation payable by the Fund to Invesco Advisers and by Invesco Advisers to the AffiliatedSub-Advisers is fair and reasonable.
The Board’s Evaluation Process
The Board’s Investments Committee has established threeSub-Committees, which meet throughout the year to review the performance of funds advised by Invesco Advisers (the Invesco Funds). As part of a regularly scheduled basis ofin-person Board meetings, theSub-Committees meet with portfolio managers for their assigned Invesco Funds and other members of management to review detailed information about investment performance and portfolio attributes of these funds. The Board took into account evaluations and reports that it received from the Investments Committee andSub-Committees, as well as the information provided to such committees and the Board throughout the year, in considering whether to approve each Invesco Fund’s investment advisory agreement andsub-advisory contracts.
As part of the contract renewal process, the Board reviews and considers information provided in response to detailed requests for information submitted to management by the independent Trustees with assistance from legal counsel to the independent Trustees. The Board receives comparative investment performance and fee data regarding the Invesco Funds prepared by Invesco Advisers and Broadridge Financial Solutions, Inc. (Broadridge), an independent mutual fund data provider. The Board also receives an independent written evaluation from the Senior Officer, an officer of the Invesco Funds who reports directly to the
independent Trustees. The Senior Officer’s evaluation is prepared as part of his responsibility to manage the process by which the Invesco Funds’ proposed management fees are negotiated during the annual contract renewal process to ensure they are negotiated in a manner that is at arms’ length and reasonable. In addition to meetings with Invesco Advisers and fund counsel throughout the year, the independent Trustees also discuss the continuance of the investment advisory agreement andsub-advisory contracts in separate sessions with the Senior Officer and with independent legal counsel.
The discussion below is a summary of the Senior Officer’s independent written evaluation with respect to the Fund’s investment advisory agreement, as well as a discussion of the material factors and related conclusions that formed the basis for the Board’s approval of the Fund’s investment advisory agreement andsub-advisory contracts. The Trustees’ review and conclusions are based on the comprehensive consideration of all information presented to them during the course of the year and in prior years and are not the result of any single determinative factor. Moreover, one Trustee may have weighed a particular piece of information or factor differently than another Trustee. This information is current as of June 10, 2019.
Factors and Conclusions and Summary of Independent Written Fee Evaluation
| A. | Nature, Extent and Quality of Services Provided by Invesco Advisers and the AffiliatedSub-Advisers |
The Board reviewed the nature, extent and quality of the advisory services provided to the Fund by Invesco Advisers under the Fund’s investment advisory agreement, and the credentials and experience of the officers and employees of Invesco Advisers who provide these services, including the Fund’s portfolio manager(s). The Board’s review included consideration of Invesco Advisers’ investment process oversight and structure, credit analysis and investment risk management. The Board also considerednon-advisory services that Invesco Advisers and its affiliates provide to the Invesco Funds such as various back office support functions, third party oversight, internal audit, valuation, portfolio trading and legal and compliance. The Board also received and reviewed information about Invesco Advisers’ role as administrator of the Invesco Funds’ liquidity risk management program. The Board also reviewed and considered the benefits to shareholders of investing in a fund that is part of the Invesco family of funds under the umbrella of Invesco Ltd., Invesco Advisers’ parent company, and noted Invesco Ltd.’s depth and experience in conducting an investment management business, as well as its
commitment of financial and other resources to such business. The Board reviewed and considered information about the resources that Invesco Advisers intends to continue to commit to managing the Invesco family of funds following Invesco Ltd.’s acquisition of OppenheimerFunds, Inc. and its subsidiaries. The Board concluded that the nature, extent and quality of the services provided to the Fund by Invesco Advisers are appropriate and satisfactory.
The Board reviewed the services that may be provided by the AffiliatedSub-Advisers under thesub-advisory contracts and the credentials and experience of the officers and employees of the AffiliatedSub-Advisers who provide these services. The Board noted the AffiliatedSub-Advisers’ expertise with respect to certain asset classes and that the AffiliatedSub-Advisers have offices and personnel that are located in financial centers around the world. As a result, the Board noted that the AffiliatedSub-Advisers can provide research and investment analysis on the markets and economies of various countries in which the Fund may invest, make recommendations regarding securities and assist with security trades. The Board concluded that thesub-advisory contracts may benefit the Fund and its shareholders by permitting Invesco Advisers to use the resources and talents of the AffiliatedSub-Advisers in managing the Fund. The Board concluded that the nature, extent and quality of the services that may be provided by the AffiliatedSub-Advisers are appropriate and satisfactory.
| B. | Fund Investment Performance |
The Board considered Fund investment performance as a relevant factor in considering whether to approve the investment advisory agreement. The Board did not view Fund investment performance as a relevant factor in considering whether to approve thesub-advisory contracts for the Fund, as no AffiliatedSub-Adviser currently manages assets of the Fund.
The Board compared the Fund’s investment performance over multiple time periods ending December 31, 2018 to the performance of funds in the Broadridge performance universe and against the Lipper Variable Underlying FundsMulti-Cap Value Funds Index. The Board noted that performance of Series I shares of the Fund was in the fifth quintile of its performance universe for the one, three and five year periods (the first quintile being the best performing funds and the fifth quintile being the worst performing funds). The Board noted that performance of Series I shares of the Fund was below the performance of the Index for the one, three and five year periods. The Board noted that the Fund’s underweight exposure to certain defensive sectors and the market environment for the Fund’s value investing style negatively
Invesco V.I. Value Opportunities Fund
impacted performance. The Trustees also reviewed more recent Fund performance and this review did not change their conclusions.
| C. | Advisory andSub-Advisory Fees and Fund Expenses |
The Board compared the Fund’s contractual management fee rate to the contractual management fee rates of funds in the Fund’s Broadridge expense group. The Board noted that the contractual management fee rate for Series I shares of the Fund was the same as the median contractual management fee rate of funds in its expense group. The Board noted that the term “contractual management fee” for funds in the expense group may include both advisory and certainnon-portfolio management administrative services fees, but that Broadridge does not provide information on a fund by fund basis as to what is included. The Board also reviewed the methodology used by Broadridge in providing expense group information, which includes using each fund’s contractual management fee schedule (including any applicable breakpoints) as reported in the most recent prospectus or statement of additional information for each fund in the expense group. The Board also considered comparative information regarding the Fund’s total expense ratio and its various components. The Board noted that the Fund’s actual management fees and total expense ratio were in the fourth quintile of its expense group and discussed with management reasons for such relative actual management fees and total expenses.
The Board noted that Invesco Advisers has contractually agreed to waive fees and/or limit expenses of the Fund for the term disclosed in the Fund’s registration statement in an amount necessary to limit total annual operating expenses to a specified percentage of average daily net assets for each class of the Fund.
The Board noted that Invesco Advisers and the AffiliatedSub-Advisers do not manage other similarly managed mutual funds or client accounts.
The Board also considered the services that may be provided by the AffiliatedSub-Advisers pursuant to thesub-advisory contracts, as well as the fees payable by Invesco Advisers to the AffiliatedSub-Advisers pursuant to thesub-advisory contracts.
| D. | Economies of Scale and Breakpoints |
The Board considered the extent to which there may be economies of scale in the provision of advisory services to the Fund. The Board considered Invesco’s reinvestment in its business, including investments in business infrastructure and cybersecurity. The Board also considered that the Fund may benefit from economies of scale through contractual breakpoints in the Fund’s advisory fee schedule, which generally operate to reduce the Fund’s expense ratio as it grows in size. The Board noted that the Fund shares directly in economies of scale through lower fees charged by third party service providers based on the combined size of the Invesco Funds. The Board
noted that the Fund may also benefit from economies of scale through initial fee setting, fee waivers and expense reimbursements.
| E. | Profitability and Financial Resources |
The Board reviewed information from Invesco Advisers concerning the costs of the advisory and other services that Invesco Advisers and its affiliates provide to the Fund and the Invesco Funds and the profitability of Invesco Advisers and its affiliates in providing these services. The Board considered the methodology used for calculating profitability and noted the periodic review of such methodology by an independent consultant. The Board noted that Invesco Advisers continues to operate at a net profit from services Invesco Advisers and its affiliates provide to the Invesco Funds and the Fund. The Board did not deem the level of profits realized by Invesco Advisers and its affiliates from providing services to the Fund to be excessive given the nature, extent and quality of the services provided. The Board received information from Invesco Advisers demonstrating that Invesco Advisers and the AffiliatedSub-Advisers are financially sound and have the resources necessary to perform their obligations under the investment advisory agreement andsub-advisory contracts.
| F. | Collateral Benefits to Invesco Advisers and its Affiliates |
The Board considered various other benefits received by Invesco Advisers and its affiliates from the relationship with the Fund, including the fees received for providing administrative, transfer agency and distribution services to the Fund. The Board considered comparative information regarding fees charged for these services, including information provided by Broadridge and other independent sources. The Board considered the performance of Invesco Advisers and its affiliates in providing these services and the organizational structure employed to provide these services. The Board also considered that these services are provided to the Fund pursuant to written contracts that are reviewed and approved on an annual basis by the Board; and that the services are required for the operation of the Fund.
The Board considered the benefits realized by Invesco Advisers and the AffiliatedSub-Advisers as a result of portfolio brokerage transactions executed through “soft dollar” arrangements. The Board noted that soft dollar arrangements may result in the Fund bearing costs to purchase research that may be used by Invesco Advisers or the AffiliatedSub-Advisers with other clients and may reduce Invesco Advisers’ or the AffiliatedSub-Advisers’ expenses. The Board also considered that it receives periodic reports from Invesco representing that these arrangements are consistent with regulatory requirements. The Board did not deem the soft dollar arrangements to be inappropriate.
The Board considered that the Fund’s uninvested cash and cash collateral from any securities lending arrangements may be invested in money market funds advised by Invesco Advisers pursuant to procedures
approved by the Board. The Board considered information regarding the returns of the affiliated money market funds relative to comparable overnight investments, as well as the costs to the Fund of such investments. The Board noted that Invesco Advisers receives advisory fees from these affiliated money market funds attributable to such investments, although Invesco Advisers has contractually agreed to waive through varying periods the advisory fees payable by the Invesco Funds with respect to certain investments in the affiliated money market funds. The waiver is in an amount equal to 100% of the net advisory fee Invesco Advisers receives from the affiliated money market funds with respect to the Fund’s investment in the affiliated money market funds of uninvested cash, but not cash collateral. The Board concluded that the amount of advisory fees received by Invesco Advisers from the Fund’s investment of cash collateral from any securities lending arrangements in the affiliated money market funds is fair and reasonable.
The Board also considered that an affiliated broker may receive commissions for executing certain trades for the Fund. Invesco Advisers and the AffiliatedSub-Advisers may use the affiliated broker to, among other things, control order routing and minimize information leakage, and the Board was advised that such trades are executed in compliance with rules under the federal securities laws and consistent with best execution obligations.
Invesco V.I. Value Opportunities Fund
| | | | |
 | | Semiannual Report | | 6/30/2019 |
| | |
| | Invesco Oppenheimer V.I. Capital Appreciation Fund* | | |
| |
| | The Fund provides a complete list of its holdings four times in each fiscal year, at the quarter ends. For the second and fourth quarters, the lists appear in the Fund’s semi annual and annual reports to shareholders. For the first and third quarters, the Fund files the lists with the Securities and Exchange Commission (SEC) on Form N-Q (or any successor Form). The Fund’s Form N-Q (or any successor Form) filings are available on the SEC website, sec.gov. The Fund’s most recent portfolio holdings, as filed on Form N-Q (or any successor Form), have also been made available to insurance companies issuing variable annuity contracts and variable life insurance policies (“variable products”) that invest in the Fund. A description of the policies and procedures that the Fund uses to determine how to vote proxies relating to portfolio securities is available without charge, upon request, from our Client Services department at 800 959 4246 or at invesco.com/proxyguidelines. The information is also available on the SEC website, sec.gov. Information regarding how the Fund voted proxies related to its portfolio securities during the most recent 12-month period ended June 30 is available at invesco.com/proxysearch. The information is also available on the SEC website, sec.gov. Invesco Advisers, Inc. is an investment adviser; it provides investment advisory services to individual and institutional clients and does not sell securities. Invesco Distributors, Inc. is the US distributor for Invesco Ltd.’s retail mutual funds, exchange- traded funds and institutional money market funds. Both are wholly owned, indirect subsidiaries of Invesco Ltd. This report must be accompanied or preceded by a currently effective Fund prospectus and variable product prospectus, which contain more complete information, including sales charges and expenses. Investors should read each carefully before investing. * Prior to the close of business on May 24, 2019, the Fund’s name was Oppenheimer Capital Appreciation Fund/VA. See Important Update on the following page for more information. |
Important Update
On October 18, 2018, Massachusetts Mutual Life Insurance Company, an indirect corporate parent of OppenheimerFunds, Inc. and its subsidiaries OFI Global Asset Management, Inc., OFI SteelPath, Inc. and OFI Advisors, LLC, announced that it had entered into an agreement whereby Invesco Ltd., a global investment management company would acquire OppenheimerFunds and its subsidiaries (together, “OppenheimerFunds”). After the close of business on May 24, 2019 Invesco Ltd. completed the acquisition of OppenheimerFunds. This Fund was included in that acquisition and as of that date, became part of the Invesco family of funds. Please visit invesco.com for more information or call Invesco’s Client Services team at 800-959-4246.
PORTFOLIO MANAGER:Erik Voss, Ido Cohen1
AVERAGE ANNUAL TOTAL RETURNS FOR THE PERIODS ENDED 6/30/19
| | | | | | | | | | | | | | | | | | |
| | | Inception Date | | | 6-Months | | 1-Year | | | 5-Year | | | 10-Year | |
Series I Shares2 | | | 4/3/85 | | | 22.25% | | | 10.08 | % | | | 9.93 | % | | | 12.87 | % |
Series II Shares2 | | | 9/18/01 | | | 22.09 | | | 9.82 | | | | 9.65 | | | | 12.58 | |
S&P 500 Index | | | | | | 18.54 | | | 10.42 | | | | 10.71 | | | | 14.70 | |
Russell 1000 Growth Index | | | | | | 21.49 | | | 11.56 | | | | 13.39 | | | | 16.28 | |
Performance quoted is past performance and cannot guarantee comparable future results; current performance may be lower or higher. Visit invesco.com for the most recent month-end performance. Performance figures reflect reinvested distributions and changes in net asset value (NAV). Investment return and principal value will vary so that you may have a gain or a loss when you sell shares. Fund returns include changes in share price, reinvested distributions and sales charges except where “without sales charge” is indicated. Effective after the close of business on May 24, 2019, the Non-Service and Service share classes of the predecessor fund were reorganized into Series I and Series II Shares, respectively, of the Fund. Returns shown for Series I and Series II shares are blended returns of the predecessor fund and the Fund. Share class returns will differ from those of the predecessor fund because of different expenses. See Fund prospectuses and summary prospectuses for more information on share classes, sales charges and new fee agreements, if any. Fund literature is available at invesco.com.
The Fund’s performance is compared to the performance of the S&P 500 Index and the Russell 1000 Growth Index. The S&P 500 Index is a broad-based measure of domestic stock performance. The Russell 1000 Growth Index measures the performance of the large-cap growth segment of the U.S. equity universe. It includes those Russell 1000 companies with higher price-to-book ratios and higher forecasted growth values. The indices are unmanaged and cannot be purchased directly by investors. While index comparisons may be useful to provide a benchmark for the Fund’s performance, it must be noted that the Fund’s investments are not limited to the investments comprising the indices. Index performance includes reinvestment of income, but does not reflect transaction costs, fees, expenses or taxes. Index performance is shown for illustrative purposes only as a benchmark for the Fund’s performance, and does not predict or depict performance of the Fund. The Fund’s performance reflects the effects of the Fund’s business and operating expenses.
TOP HOLDINGS AND ALLOCATIONS
TOP TEN COMMON STOCK HOLDINGS
| | | | |
Amazon.com, Inc. | | | 8.9 | % |
Mastercard, Inc., Cl. A | | | 5.7 | |
Facebook, Inc., Cl. A | | | 5.0 | |
Alphabet, Inc., Cl. C | | | 4.3 | |
Microsoft Corp. | | | 3.7 | |
salesforce.com, Inc. | | | 3.0 | |
Lowe’s Cos., Inc. | | | 2.7 | |
UnitedHealth Group, Inc. | | | 2.4 | |
Alibaba Group Holding Ltd., Sponsored ADR | | | 2.3 | |
Apple, Inc. | | | 2.0 | |
Portfolio holdings and allocations are subject to change. Percentages are as of June 30, 2019, and are based on net assets.
SECTOR ALLOCATION
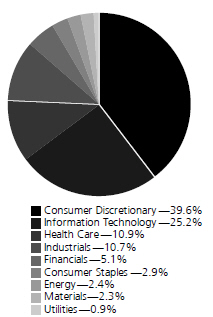
Portfolio holdings and allocations are subject to change. Percentages are as of June 30, 2019, and are based on the total market value of common stocks.
1. Erik Voss and Ido Chen were named Portfolio Managers of the Fund effective June 21, 2019.
2. Effective after the close of business on May 24, 2019, the Non-Service and Service share classes of the predecessor fund were reorganized into Series I and Series II Shares, respectively, of the Fund. Returns shown for Series I and Series II shares are blended returns of the predecessor fund and the Fund. Share class returns will differ from those of the predecessor fund because of different expenses.
For more current Fund holdings, please visit invesco.com.
3 INVESCO OPPENHEIMER V.I. CAPITAL APPRECIATION FUND
Before investing, investors should carefully read the prospectus and/or summary prospectus and carefully consider the investment objectives, risks, charges and expenses. For this and more complete information about the fund(s), investors should ask their advisors for a prospectus/summary prospectus or visit invesco.com/fundprospectus.
Shares of Invesco funds are not deposits or obligations of any bank, are not guaranteed by any bank, are not insured by the FDIC or any other agency, and involve investment risks, including the possible loss of the principal amount invested.
4 INVESCO OPPENHEIMER V.I. CAPITAL APPRECIATION FUND
Fund Expenses
Fund Expenses.As a shareholder of the Fund, you incur two types of costs: (1) transaction costs and (2) ongoing costs, including management fees; distribution and service fees; and other Fund expenses. These examples are intended to help you understand your ongoing costs (in dollars) of investing in the Fund and to compare these costs with the ongoing costs of investing in other mutual funds.
The examples are based on an investment of $1,000.00 invested at the beginning of the period and held for the entire 6-month period ended June 30, 2019.
Actual Expenses. The first section of the table provides information about actual account values and actual expenses. You may use the information in this section for the class of shares you hold, together with the amount you invested, to estimate the expense that you paid over the period. Simply divide your account value by $1,000.00 (for example, an $8,600.00 account value divided by $1,000.00 = 8.60), then multiply the result by the number in the first section under the heading entitled “Expenses Paid During 6 Months Ended June 30, 2019” to estimate the expenses you paid on your account during this period.
Hypothetical Example for Comparison Purposes.
The second section of the table provides information about hypothetical account values and hypothetical expenses based on the Fund’s actual expense ratio for each class of shares, and an assumed rate of return of 5% per year for each class before expenses, which is not the actual return. The hypothetical account values and expenses may not be used to estimate the actual ending account balance or expenses you paid for the period. You may use this information to compare the ongoing costs of investing in the Fund and other funds. To do so, compare this 5% hypothetical example for the class of shares you hold with the 5% hypothetical examples that appear in the shareholder reports of the other funds.
Please note that the expenses shown in the table are meant to highlight your ongoing costs only and do not reflect any charges associated with the separate accounts that offer this Fund. Therefore, the “hypothetical” lines of the table are useful in comparing ongoing costs only, and will not help you determine the relative total costs of owning different funds. In addition, if these separate account charges were included your costs would have been higher.
| | | | | | | | | | | | | | | | |
Actual | | Beginning Account Value January 1, 2019 | | | Ending Account Value June 30, 2019 | | | Expenses Paid During 6 Months Ended June 30, 2019 | | | | |
Series I shares | | | 1,000.00 | | | | 1,222.50 | | | | 4.42 | | | | | |
Series II shares | | | 1,000.00 | | | | 1,220.90 | | | | 5.80 | | | | | |
| | | | |
Hypothetical (5% return before expenses) | | | | | | | | | | | | | | | | |
Series I shares | | | 1,000.00 | | | | 1,020.83 | | | | 4.02 | | | | | |
Series II shares | | | 1,000.00 | | | | 1,019.59 | | | | 5.27 | | | | | |
Expenses are equal to the Fund’s annualized expense ratio for that class, multiplied by the average account value over the period, multiplied by 181/365 (to reflect the one-half year period). Those annualized expense ratios, excluding indirect expenses from affiliated funds, based on the 6-month period ended June 30, 2019 are as follows:
| | | | | | | | | | |
| Class | | Expense Ratios | | |
Series I shares | | | | 0.80% | | | | | | |
Series II shares | | | | 1.05 | | | | | | |
The expense ratios reflect voluntary and/or contractual waivers and/or reimbursements of expenses by the Fund’s Manager. Some of these undertakings may be modified or terminated at any time, as indicated in the Fund’s prospectus. The “Financial Highlights” tables in the Fund’s financial statements, included in this report, also show the gross expense ratios, without such waivers or reimbursements and reduction to custodian expenses, if applicable.
5 INVESCO OPPENHEIMER V.I. CAPITAL APPRECIATION FUND
STATEMENT OF INVESTMENTSJune 30, 2019 Unaudited
| | | | | | | | |
| | | Shares | | | Value | |
Common Stocks—98.3% | | | | | | | | |
| Consumer Discretionary—38.9% | |
| Diversified Consumer Services—0.4% | | | | | | | | |
Service Corp. International | | | 58,810 | | | $ | 2,751,132 | |
| Entertainment—6.7% | |
| Activision Blizzard, Inc. | | | 281,070 | | | | 13,266,504 | |
| Electronic Arts, Inc.1 | | | 88,660 | | | | 8,977,712 | |
| Netflix, Inc.1 | | | 11,280 | | | | 4,143,370 | |
| Nintendo Co. Ltd. | | | 30,100 | | | | 11,065,664 | |
| Take-Two Interactive Software, Inc.1 | | | 67,910 | | | | 7,709,822 | |
| Vivendi SA | | | 97,340 | | | | 2,682,861 | |
| | | | | | | | 47,845,933 | |
| Hotels, Restaurants & Leisure—3.0% | | | | | | | | |
| Cedar Fair LP2 | | | 193,913 | | | | 9,247,711 | |
| Norwegian Cruise Line Holdings Ltd.1 | | | 163,426 | | | | 8,764,536 | |
| Royal Caribbean Cruises Ltd. | | | 31,240 | | | | 3,786,601 | |
| | | | | | | | 21,798,848 | |
| Household Durables—1.2% | |
Sony Corp. | | | 162,200 | | | | 8,474,778 | |
| Interactive Media & Services—9.5% | |
| Alphabet, Inc., Cl. C1 | | | 28,538 | | | | 30,847,009 | |
| Facebook, Inc., Cl. A1 | | | 184,788 | | | | 35,664,084 | |
| Tencent Holdings Ltd., ADR | | | 42,080 | | | | 1,904,541 | |
| | | | | | | | 68,415,634 | |
| Internet & Catalog Retail—12.8% | |
| Alibaba Group Holding Ltd., Sponsored ADR1 | | | 99,044 | | | | 16,783,006 | |
| Amazon.com, Inc.1 | | | 33,563 | | | | 63,555,903 | |
| Booking Holdings, Inc.1 | | | 6,018 | | | | 11,282,005 | |
| | | | | | | | 91,620,914 | |
| Media—1.1% | |
| Altice USA, Inc., Cl. A1 | | | 121,430 | | | | 2,956,821 | |
| Charter Communications, Inc., Cl. A1 | | | 7,430 | | | | 2,936,187 | |
| DISH Network Corp., Cl. A1 | | | 37,690 | | | | 1,447,673 | |
| IMAX Corp.1 | | | 18,444 | | | | 372,569 | |
| | | | | | | | 7,713,250 | |
| Specialty Retail—4.2% | |
| AutoNation, Inc.1 | | | 157,150 | | | | 6,590,871 | |
| CarMax, Inc.1 | | | 51,980 | | | | 4,513,423 | |
| Lowe’s Cos., Inc. | | | 190,800 | | | | 19,253,628 | |
| | | | | | | | 30,357,922 | |
| Consumer Staples—2.8% | |
| Food Products—2.8% | |
| Conagra Brands, Inc. | | | 111,630 | | | | 2,960,428 | |
| Lamb Weston Holdings, Inc. | | | 52,780 | | | | 3,344,141 | |
| Mondelez International, Inc., Cl. A | | | 77,818 | | | | 4,194,390 | |
| Nomad Foods Ltd.1 | | | 85,070 | | | | 1,817,095 | |
| Tyson Foods, Inc., Cl. A | | | 98,050 | | | | 7,916,557 | |
| | | | | | | | 20,232,611 | |
| Energy—2.4% | |
| Oil, Gas & Consumable Fuels—2.4% | |
| Husky Energy, Inc. | | | 489,701 | | | | 4,640,670 | |
| Magellan Midstream Partners LP2 | | | 141,249 | | | | 9,039,936 | |
| Marathon Petroleum Corp. | | | 26,180 | | | | 1,462,938 | |
| PBF Energy, Inc., Cl. A | | | 47,490 | | | | 1,486,437 | |
| Viper Energy Partners LP2 | | | 21,203 | | | | 653,477 | |
| | | | | | | | 17,283,458 | |
| Financials—5.0% | |
| Capital Markets—3.5% | |
| Apollo Global Management LLC, Cl. A2 | | | 62,030 | | | | 2,127,629 | |
| Ares Management Corp., Cl. A | | | 109,320 | | | | 2,860,904 | |
| Charles Schwab Corp. (The) | | | 71,583 | | | | 2,876,921 | |
| CME Group, Inc., Cl. A | | | 14,315 | | | | 2,778,685 | |
| Goldman Sachs Group, Inc. (The) | | | 6,630 | | | | 1,356,498 | |
| Intercontinental Exchange, Inc. | | | 81,993 | | | | 7,046,478 | |
| | | | | | | | |
| | | Shares | | | Value | |
| Capital Markets (Continued) | |
| Legg Mason, Inc. | | | 39,210 | | | $ | 1,500,959 | |
| London Stock Exchange Group plc | | | 20,340 | | | | 1,417,162 | |
| LPL Financial Holdings, Inc. | | | 36,180 | | | | 2,951,202 | |
| S&P Global, Inc. | | | 740 | | | | 168,565 | |
| | | | | | | | 25,085,003 | |
| Commercial Banks—0.2% | |
SVB Financial Group1 | | | 6,780 | | | | 1,522,720 | |
| Diversified Financial Services—0.4% | |
Berkshire Hathaway, Inc., Cl. B1 | | | 13,475 | | | | 2,872,466 | |
| Insurance—0.9% | |
| Progressive Corp. (The) | | | 65,810 | | | | 5,260,193 | |
| Reinsurance Group of America, Inc., Cl. A | | | 8,890 | | | | 1,387,107 | |
| | | | | | | | 6,647,300 | |
| Health Care—10.7% | |
| Biotechnology—2.4% | |
| Alnylam Pharmaceuticals, Inc.1 | | | 12,050 | | | | 874,348 | |
| Bluebird Bio, Inc.1 | | | 2,700 | | | | 343,440 | |
| Galapagos NV1 | | | 24,567 | | | | 3,168,785 | |
| Gilead Sciences, Inc. | | | 103,060 | | | | 6,962,734 | |
| Moderna, Inc.1 | | | 8,155 | | | | 119,389 | |
| Sage Therapeutics, Inc.1 | | | 2,523 | | | | 461,936 | |
| Seattle Genetics, Inc.1 | | | 11,530 | | | | 797,991 | |
| Vertex Pharmaceuticals, Inc.1 | | | 23,730 | | | | 4,351,607 | |
| | | | | | | | 17,080,230 | |
| Health Care Equipment & Supplies—1.4% | |
| Intuitive Surgical, Inc.1 | | | 14,613 | | | | 7,665,249 | |
| Teleflex, Inc. | | | 6,840 | | | | 2,265,066 | |
| | | | | | | | 9,930,315 | |
| Health Care Providers & Services—3.7% | |
| Laboratory Corp. of America Holdings1 | | | 53,755 | | | | 9,294,240 | |
| UnitedHealth Group, Inc. | | | 72,310 | | | | 17,644,363 | |
| | | | | | | | 26,938,603 | |
| Health Care Technology—0.9% | |
Cerner Corp. | | | 86,760 | | | | 6,359,508 | |
| Life Sciences Tools & Services—1.2% | |
Illumina, Inc.1 | | | 23,960 | | | | 8,820,874 | |
| Pharmaceuticals—1.1% | |
Merck & Co., Inc. | | | 93,560 | | | | 7,845,006 | |
| Industrials—10.5% | |
| Aerospace & Defense—3.3% | | | | | | | | |
| Airbus SE | | | 84,510 | | | | 11,983,086 | |
| Harris Corp. | | | 10,860 | | | | 2,053,952 | |
| Lockheed Martin Corp. | | | 12,510 | | | | 4,547,885 | |
| Teledyne Technologies, Inc.1 | | | 18,237 | | | | 4,994,567 | |
| | | | | | | | 23,579,490 | |
| Airlines—0.3% | |
Spirit Airlines, Inc.1 | | | 51,270 | | | | 2,447,117 | |
| Commercial Services & Supplies—3.1% | |
| Cintas Corp. | | | 22,630 | | | | 5,369,873 | |
| Clean Harbors, Inc.1 | | | 16,901 | | | | 1,201,661 | |
| IAA, Inc.1 | | | 128,970 | | | | 5,001,457 | |
| KAR Auction Services, Inc. | | | 128,970 | | | | 3,224,250 | |
| Waste Connections, Inc. | | | 24,130 | | | | 2,306,345 | |
| Waste Management, Inc. | | | 42,840 | | | | 4,942,451 | |
| | | | | | | | 22,046,037 | |
| Industrial Conglomerates—0.4% | |
Roper Technologies, Inc. | | | 7,540 | | | | 2,761,600 | |
| Machinery—1.0% | |
| Deere & Co. | | | 24,503 | | | | 4,060,392 | |
| Stanley Black & Decker, Inc. | | | 22,680 | | | | 3,279,755 | |
| | | | | | | 7,340,147 | |
6 INVESCO OPPENHEIMER V.I. CAPITAL APPRECIATION FUND
| | | | | | | | |
| | | Shares | | | Value | |
| Road & Rail—2.4% | |
| Kansas City Southern | | | 37,710 | | | $ | 4,593,832 | |
| Lyft, Inc., Cl. A1 | | | 43,600 | | | | 2,864,956 | |
| Uber Technologies, Inc.1 | | | 65,920 | | | | 3,057,369 | |
| Union Pacific Corp. | | | 38,370 | | | | 6,488,751 | |
| | | | | | | | 17,004,908 | |
| Information Technology—24.8% | |
| Communications Equipment—1.8% | | | | | | | | |
Motorola Solutions, Inc. | | | 75,860 | | | | 12,648,138 | |
| IT Services—6.5% | | | | | | | | |
| First Data Corp., Cl. A1 | | | 216,360 | | | | 5,856,865 | |
| Mastercard, Inc., Cl. A | | | 155,348 | | | | 41,094,207 | |
| | | | | | | | 46,951,072 | |
| Semiconductors & Semiconductor Equipment—6.1% | |
| Applied Materials, Inc. | | | 209,430 | | | | 9,405,501 | |
| NVIDIA Corp. | | | 70,060 | | | | 11,505,954 | |
| QUALCOMM, Inc. | | | 117,260 | | | | 8,919,968 | |
| Semtech Corp.1 | | | 30,130 | | | | 1,447,746 | |
| Silicon Motion Technology Corp., ADR | | | 21,194 | | | | 940,590 | |
| Texas Instruments, Inc. | | | 97,338 | | | | 11,170,509 | |
| | | | | | | | 43,390,268 | |
| Software—8.4% | |
| Microsoft Corp. | | | 199,653 | | | | 26,745,516 | |
| salesforce.com, Inc.1 | | | 138,480 | | | | 21,011,570 | |
| | | | | | | | |
| | | Shares | | | Value | |
| Software (Continued) | |
| ServiceNow, Inc.1 | | | 45,140 | | | $ | 12,394,090 | |
| | | | | | | | 60,151,176 | |
| Technology Hardware, Storage & Peripherals—2.0% | |
Apple, Inc. | | | 72,523 | | | | 14,353,752 | |
| Materials—2.3% | |
| Chemicals—1.4% | |
| Albemarle Corp. | | | 20,733 | | | | 1,459,810 | |
| Linde plc | | | 6,330 | | | | 1,271,064 | |
| Sherwin-Williams Co. (The) | | | 7,390 | | | | 3,386,763 | |
| Westlake Chemical Corp. | | | 52,480 | | | | 3,645,261 | |
| | | | | | | | 9,762,898 | |
| Metals & Mining—0.9% | |
Compass Minerals International, Inc. | | | 116,538 | | | | 6,403,763 | |
| Utilities—0.9% | |
| Gas Utilities—0.9% | |
| AmeriGas Partners LP2 | | | 184,690 | | | | 6,434,600 | |
Total Common Stocks (Cost $514,347,132) | | | | 704,871,471 | |
| Investment Company—4.0% | |
| Invesco Oppenheimer Institutional Government Money Market Fund, Cl. IN, 2.37%3 (Cost $28,833,796) | | | 28,833,796 | | | | 28,833,796 | |
Total Investments, at Value
(Cost $543,180,928) | | | 102.3 | % | | | 733,705,267 | |
| Net Other Assets (Liabilities) | | | (2.3 | ) | | | (16,535,705 | ) |
| Net Assets | | | 100.0 | % | | $ | 717,169,562 | |
| | | | | | | | |
Footnotes to Statement of Investments
1. Non-income producing security.
2. Security is a Master Limited Partnership.
3. The money market fund and the Fund are affiliate by having the same investment adviser. The rate shown is the 7-day SEC standardized yield as of June 30, 2019.
See accompanying Notes to Financial Statements.
7 INVESCO OPPENHEIMER V.I. CAPITAL APPRECIATION FUND
STATEMENT OF ASSETS AND LIABILITIESJune 30, 2019 Unaudited
| | | | |
| Assets | | | | |
Investments, at value—see accompanying statement of investments: | | | | |
Unaffiliated companies (cost $514,347,132) | | | $ 704,871,471 | |
Affiliated companies (cost $28,833,796) | | | 28,833,796 | |
| | | | |
| | | | 733,705,267 | |
Receivables and other assets: | | | | |
Investments sold | | | 52,588,837 | |
Dividends | | | 527,489 | |
Shares of beneficial interest sold | | | 176,545 | |
Other | | | 123,890 | |
| | | | |
Total assets | | | 787,122,028 | |
| | | | |
| Liabilities | | | | |
Bank overdraft | | | 2,237,207 | |
Payables and other liabilities: | | | | |
Investments purchased | | | 66,569,568 | |
Shares of beneficial interest redeemed | | | 793,196 | |
Trustees’ compensation | | | 110,072 | |
Administration fee | | | 98,078 | |
Management fee | | | 41,516 | |
Distribution and service plan fees | | | 39,299 | |
Shareholder communications | | | 30,370 | |
Transfer and shareholder servicing agent fees | | | 12,742 | |
Other | | | 20,418 | |
| | | | |
Total liabilities | | | 69,952,466 | |
| | | | | |
Net Assets | | | $ 717,169,562 | |
| | | | |
| | | | |
| Composition of Net Assets | | | | |
Shares of beneficial interest | | | $ 464,588,094 | |
Total distributable earnings | | | 252,581,468 | |
Net Assets | | | $ 717,169,562 | |
| | | | |
| | | | |
| Net Asset Value Per Share | | | | |
Series I Shares: | | | | |
| Net asset value, redemption price per share and offering price per share (based on net assets of $522,843,388 and 9,743,964 shares of beneficial interest outstanding) | | | $53.66 | |
Series II Shares: | | | | |
| Net asset value, redemption price per share and offering price per share (based on net assets of $194,326,174 and 3,684,754 shares of beneficial interest outstanding) | | | $52.74 | |
See accompanying Notes to Financial Statements.
8 INVESCO OPPENHEIMER V.I. CAPITAL APPRECIATION FUND
STATEMENT OF OPERATIONSFor the Six Month Ended June 30, 2019 Unaudited
| | | | |
| Investment Income | | | | |
Dividends: | | | | |
Unaffiliated companies (net of foreign withholding taxes of $20,245) | | $ | 3,534,793 | |
Affiliated companies | | | 165,641 | |
| | | | |
Total investment income | | | 3,700,434 | |
| | | | |
| Expenses | | | | |
Management fees | | | 2,435,740 | |
Administration fees | | | 106,149 | |
Distribution and service plan fees — Series II shares | | | 227,228 | |
Transfer and shareholder servicing agent fees: | | | | |
Series I shares | | | 250,446 | |
Series II shares | | | 88,981 | |
Shareholder communications: | | | | |
Series I shares | | | 27,628 | |
Series II shares | | | 9,773 | |
Trustees’ compensation | | | 11,511 | |
Borrowing fees | | | 8,475 | |
Custodian fees and expenses | | | 7,767 | |
Other | | | 41,076 | |
| | | | |
Total expenses | | | 3,214,774 | |
Less reduction to custodian expenses | | | (6,423) | |
Less waivers and reimbursements of expenses | | | (227,542) | |
| | | | |
Net expenses | | | 2,980,809 | |
| | | | | |
Net Investment Income | | | 719,625 | |
| | | | |
| Realized and Unrealized Gain (Loss) | | | | |
Net realized gain (loss) on: | | | | |
Investment transactions (includes net gains from securities sold to affiliates of $215,597) | | | 64,737,907 | |
Foreign currency transactions | | | (10,287) | |
| | | | |
Net realized gain | | | 64,727,620 | |
Net change in unrealized appreciation/(depreciation) on: | | | | |
Investment transactions | | | 68,233,991 | |
Translation of assets and liabilities denominated in foreign currencies | | | 23,093 | |
| | | | |
Net change in unrealized appreciation/(depreciation) | | | 68,257,084 | |
| | | | | |
Net Increase in Net Assets Resulting from Operations | | $ | 133,704,329 | |
| | | | |
See accompanying Notes to Financial Statements.
9 INVESCO OPPENHEIMER V.I. CAPITAL APPRECIATION FUND
STATEMENTS OF CHANGES IN NET ASSETS
| | | | | | | | |
| | | Six Months Ended
June 30, 2019
(Unaudited) | | | Year Ended
December 31, 2018 | |
| Operations | | | | | | | | |
Net investment income | | $ | 719,625 | | | | $ 689,854 | |
| |
Net realized gain | | | 64,727,620 | | | | 77,503,315 | |
| |
Net change in unrealized appreciation/(depreciation) | | | 68,257,084 | | | | (110,172,740) | |
| | | | |
Net increase (decrease) in net assets resulting from operations | | | 133,704,329 | | | | (31,979,571) | |
|
| |
| Dividends and/or Distributions to Shareholders | | | | | | | | |
Distributions to shareholders from distributable earnings: | | | | | | | | |
Series I shares | | | (49,378,533 | ) | | | (43,131,733) | |
Series II shares | | | (18,651,335 | ) | | | (16,387,466) | |
| | | | |
Total distributions from distributable earnings | | | (68,029,868 | ) | | | (59,519,199) | |
|
| |
| Beneficial Interest Transactions | | | | | | | | |
Net increase (decrease) in net assets resulting from beneficial interest transactions: | | | | | | | | |
Series I shares | | | 11,205,820 | | | | (28,802,499) | |
Series II shares | | | 37,791,526 | | | | (150,292,452) | |
| | | | |
Total beneficial interest transactions | | | 48,997,346 | | | | (179,094,951) | |
|
| |
| Net Assets | | | | | | | | |
Total increase (decrease) | | | 114,671,807 | | | | (270,593,721) | |
| |
Beginning of period | | | 602,497,755 | | | | 873,091,476 | |
| | | | |
End of period | | $ | 717,169,562 | | | | $ 602,497,755 | |
| | | | |
See accompanying Notes to Financial Statements.
10 INVESCO OPPENHEIMER V.I. CAPITAL APPRECIATION FUND
FINANCIAL HIGHLIGHTS
| | | | | | | | | | | | | | | | | | | | | | |
| Series I Shares | | Six Months
Ended
June 30, 2019
(Unaudited) | | | Year Ended
December 31,
2018 | | | Year Ended
December 31,
2017 | | | Year Ended
December 31,
2016 | | | Year Ended
December 31,
2015 | | | Year Ended
December 31,
2014 |
| Per Share Operating Data | | | | | | | | | | | | | | | | | | | | | | |
Net asset value, beginning of period | | | $48.50 | | | | $55.70 | | | | $48.36 | | | | $55.49 | | | | $64.87 | | | $57.88 |
|
Income (loss) from investment operations: | | | | | | | | | | | | | | | | | | | | | | |
Net investment income1 | | | 0.08 | | | | 0.09 | | | | 0.15 | | | | 0.12 | | | | 0.22 | | | 0.09 |
Net realized and unrealized gain (loss) | | | 10.67 | | | | (2.71) | | | | 12.33 | | | | (1.57) | | | | 2.25 | | | 8.64 |
| | | |
Total from investment operations | | | 10.75 | | | | (2.62) | | | | 12.48 | | | | (1.45) | | | | 2.47 | | | 8.73 |
|
Dividends and/or distributions to shareholders: | | | | | | | | | | | | | | | | | | | | | | |
Dividends from net investment income | | | (0.04) | | | | (0.19) | | | | (0.13) | | | | (0.22) | | | | (0.06) | | | (0.27) |
Distributions from net realized gain | | | (5.55) | | | | (4.39) | | | | (5.01) | | | | (5.46) | | | | (11.79) | | | (1.47) |
| | | |
Total dividends and/or distributions to shareholders | | | (5.59) | | | | (4.58) | | | | (5.14) | | | | (5.68) | | | | (11.85) | | | (1.74) |
|
Net asset value, end of period | | | $53.66 | | | | $48.50 | | | | $55.70 | | | | $48.36 | | | | $55.49 | | | $64.87 |
| | | |
|
|
| Total Return, at Net Asset Value2 | | | 22.25% | | | | (5.73)% | | | | 26.83% | | | | (2.20)% | | | | 3.54% | | | 15.41% |
|
|
| Ratios/Supplemental Data | | | | | | | | | | | | | | | | | | | | | | |
Net assets, end of period (in thousands) | | | $522,843 | | | | $460,708 | | | | $556,227 | | | | $501,756 | | | | $564,514 | | | $616,862 |
|
Average net assets (in thousands) | | | $510,373 | | | | $542,971 | | | | $539,255 | | | | $514,525 | | | | $601,110 | | | $614,272 |
|
Ratios to average net assets:3 | | | | | | | | | | | | | | | | | | | | | | |
Net investment income | | | 0.27% | | | | 0.16% | | | | 0.29% | | | | 0.25% | | | | 0.36% | | | 0.15% |
Expenses excluding specific expenses listed below | | | 0.87% | | | | 0.85% | | | | 0.82% | | | | 0.83% | | | | 0.81% | | | 0.80% |
Interest and fees from borrowings | | | 0.00%4 | | | | 0.00%4 | | | | 0.00%4 | | | | 0.00%4 | | | | 0.00%4 | | | 0.00% |
| | | |
Total expenses5 | | | 0.87% | | | | 0.85% | | | | 0.82% | | | | 0.83% | | | | 0.81% | | | 0.80% |
| Expenses after payments, waivers and/or reimbursements and reduction to custodian expenses | | | 0.80% | | | | 0.80% | | | | 0.80% | | | | 0.80% | | | | 0.80% | | | 0.80%6 |
|
Portfolio turnover rate | | | 46% | | | | 27% | | | | 26% | | | | 114% | | | | 60% | | | 61% |
1. Per share amounts calculated based on the average shares outstanding during the period.
2. Assumes an initial investment on the business day before the first day of the fiscal period, with all dividends and distributions reinvested in additional shares on the reinvestment date, and redemption at the net asset value calculated on the last business day of the fiscal period. Total returns are not annualized for periods less than one full year. Total return information does not reflect expenses that apply at the separate account level or to related insurance products. Inclusion of these charges would reduce the total return figures for all periods shown. Returns do not reflect the deduction of taxes that a shareholder would pay on fund distributions or the redemption of fund shares.
3.Annualized for periods less than one full year.
4. Less than 0.005%.
5. Total expenses including indirect expenses from affiliated fund fees and expenses were as follows:
| | | | | | | | |
| | | | | | | | |
| | Six Months Ended June 30, 2019 | | | 0.87% | |
| | Year Ended December 31, 2018 | | | 0.85% | |
| | Year Ended December 31, 2017 | | | 0.82% | |
| | Year Ended December 31, 2016 | | | 0.83% | |
| | Year Ended December 31, 2015 | | | 0.81% | |
| | Year Ended December 31, 2014 | | | 0.80% | |
6.Waiver less than 0.005%.
See accompanying Notes to Financial Statements.
11 INVESCO OPPENHEIMER V.I. CAPITAL APPRECIATION FUND
FINANCIAL HIGHLIGHTS Continued
| | | | | | | | | | | | | | | | | | | | | | |
| Series II Shares | | Six Months
Ended
June 30, 2019
(Unaudited) | | | Year Ended
December 31,
2018 | | | Year Ended
December 31,
2017 | | | Year Ended
December 31,
2016 | | | Year Ended
December 31,
2015 | | | Year Ended
December 31,
2014 |
| Per Share Operating Data | | | | | | | | | | | | | | | | | | | | | | |
Net asset value, beginning of period | | | $47.78 | | | | $54.89 | | | | $47.73 | | | | $54.80 | | | | $64.30 | | | $57.37 |
|
|
Income (loss) from investment operations: | | | | | | | | | | | | | | | | | | | | | | |
Net investment income (loss)1 | | | 0.01 | | | | (0.05) | | | | 0.02 | | | | 0.002 | | | | 0.07 | | | (0.06) |
Net realized and unrealized gain (loss) | | | 10.50 | | | | (2.67) | | | | 12.16 | | | | (1.55) | | | | 2.22 | | | 8.57 |
| | | |
Total from investment operations | | | 10.51 | | | | (2.72) | | | | 12.18 | | | | (1.55) | | | | 2.29 | | | 8.51 |
|
|
Dividends and/or distributions to shareholders: | | | | | | | | | | | | | | | | | | | | | | |
Dividends from net investment income | | | 0.00 | | | | 0.00 | | | | (0.01) | | | | (0.06) | | | | 0.00 | | | (0.11) |
Distributions from net realized gain | | | (5.55) | | | | (4.39) | | | | (5.01) | | | | (5.46) | | | | (11.79) | | | (1.47) |
| | | |
Total dividends and/or distributions to shareholders | | | (5.55) | | | | (4.39) | | | | (5.02) | | | | (5.52) | | | | (11.79) | | | (1.58) |
|
|
Net asset value, end of period | | | $52.74 | | | | $47.78 | | | | $54.89 | | | | $47.73 | | | | $54.80 | | | $64.30 |
| | | |
|
|
| Total Return, at Net Asset Value3 | | | 22.09% | | | | (5.96)% | | | | 26.50% | | | | (2.43)% | | | | 3.27% | | | 15.13% |
|
|
| Ratios/Supplemental Data | | | | | | | | | | | | | | | | | | | | | | |
Net assets, end of period (in thousands) | | | $194,326 | | | | $141,790 | | | | $316,864 | | | | $295,226 | | | | $317,737 | | | $337,318 |
|
|
Average net assets (in thousands) | | | $183,330 | | | | $232,457 | | | | $314,506 | | | | $287,933 | | | | $332,468 | | | $343,254 |
|
|
Ratios to average net assets:4 | | | | | | | | | | | | | | | | | | | | | | |
Net investment income (loss) | | | 0.03% | | | | (0.09)% | | | | 0.04% | | | | 0.00%5 | | | | 0.12% | | | (0.10)% |
Expenses excluding specific expenses listed below | | | 1.12% | | | | 1.10% | | | | 1.07% | | | | 1.08% | | | | 1.06% | | | 1.05% |
Interest and fees from borrowings | | | 0.00%5 | | | | 0.00%5 | | | | 0.00%5 | | | | 0.00%5 | | | | 0.00%5 | | | 0.00% |
| | | |
Total expenses6 | | | 1.12% | | | | 1.10% | | | | 1.07% | | | | 1.08% | | | | 1.06% | | | 1.05% |
| Expenses after payments, waivers and/or reimbursements and reduction to custodian expenses | | | 1.05% | | | | 1.05% | | | | 1.05% | | | | 1.05% | | | | 1.05% | | | 1.05%7 |
|
|
Portfolio turnover rate | | | 46% | | | | 27% | | | | 26% | | | | 114% | | | | 60% | | | 61% |
1. Per share amounts calculated based on the average shares outstanding during the period.
2. Less than $0.005 per share.
3. Assumes an initial investment on the business day before the first day of the fiscal period, with all dividends and distributions reinvested in additional shares on the reinvestment date, and redemption at the net asset value calculated on the last business day of the fiscal period. Total returns are not annualized for periods less than one full year. Total return information does not reflect expenses that apply at the separate account level or to related insurance products. Inclusion of these charges would reduce the total return figures for all periods shown. Returns do not reflect the deduction of taxes that a shareholder would pay on fund distributions or the redemption of fund shares.
4. Annualized for periods less than one full year.
5. Less than 0.005%.
6. Total expenses including indirect expenses from affiliated fund fees and expenses were as follows:
| | | | | | | | |
| | | | | | | | |
| | Six Months Ended June 30, 2019 | | | 1.12% | |
| | Year Ended December 31, 2018 | | | 1.10% | |
| | Year Ended December 31, 2017 | | | 1.07% | |
| | Year Ended December 31, 2016 | | | 1.08% | |
| | Year Ended December 31, 2015 | | | 1.06% | |
| | Year Ended December 31, 2014 | | | 1.05% | |
7. Waiver less than 0.005%.
See accompanying Notes to Financial Statements.
12 INVESCO OPPENHEIMER V.I. CAPITAL APPRECIATION FUND
NOTES TO FINANCIAL STATEMENTSJune 30, 2019 Unaudited
Note 1 - Significant Accounting Policies
Invesco Oppenheimer V.I. Capital Appreciation Fund (the “Fund”) is a series portfolio of Aim Variable Insurance Funds (Invesco Variable Insurance Funds) (the “Trust”). The Trust is a Delaware statutory trust registered under the Investment Company Act of 1940, as amended (the “1940 Act”), as an open-end series management investment company authorized to issue an unlimited number of shares of beneficial interest. Information presented in these financial statements pertains only to the Fund. Matters affecting the Fund or each class will be voted on exclusively by the shareholders of such Fund or each class.
Prior to the close of business on May 24, 2019, the Fund operated as Oppenheimer Capital Appreciation Fund/VA (the “Acquired Fund” or “Predecessor Fund”). The Acquired Fund was reorganized after the close of business on May 24, 2019 (the “Reorganization Date”) through the transfer of all of its assets and liabilities to the Fund (the “Reorganization”).
Upon closing of the Reorganization, holders of the Acquired Fund’s Non-Service and Service shares received Series I and Series II shares of the Fund, respectively. Information for the Acquired Fund’s Non-Service and Service shares prior to the Reorganization is included with Series I and Series II, respectively, throughout this report.
The Fund’s investment objective is to seek capital appreciation.
The Fund currently offers two classes of shares, Series I and Series II, both of which are offered to insurance company separate accounts funding variable annuity contracts and variable life insurance policies (“variable products”).
The Fund is an investment company and accordingly follows the investment company accounting and reporting guidance in accordance with Financial Accounting Standards Board Accounting Standards Codification Topic 946, Financial Services – Investment Companies.
The following is a summary of the significant accounting policies followed by the Fund in the preparation of its financial statements.
| A. | Security Valuations– Securities, including restricted securities, are valued according to the following policy. |
A security listed or traded on an exchange (except convertible securities) is valued at its last sales price or official closing price as of the close of the customary trading session on the exchange where the security is principally traded, or lacking any sales or official closing price on a particular day, the security may be valued at the closing bid price on that day. Securities traded in the over-the-counter market are valued based on prices furnished by independent pricing services or market makers. When such securities are valued by an independent pricing service they may be considered fair valued. Futures contracts are valued at the final settlement price set by an exchange on which they are principally traded. Listed options are valued at the mean between the last bid and asked prices from the exchange on which they are principally traded. Options not listed on an exchange are valued by an independent source at the mean between the last bid and asked prices. For purposes of determining net asset value (“NAV”) per share, futures and option contracts generally are valued 15 minutes after the close of the customary trading session of the New York Stock Exchange (“NYSE”).
Investments in open-end and closed-end registered investment companies that do not trade on an exchange are valued at the end-of-day net asset value per share. Investments in open-end and closed-end registered investment companies that trade on an exchange are valued at the last sales price or official closing price as of the close of the customary trading session on the exchange where the security is principally traded.
Debt obligations (including convertible securities) and unlisted equities are fair valued using an evaluated quote provided by an independent pricing service. Evaluated quotes provided by the pricing service may be determined without exclusive reliance on quoted prices, and may reflect appropriate factors such as institution-size trading in similar groups of securities, developments related to specific securities, dividend rate (for unlisted equities), yield (for debt obligations), quality, type of issue, coupon rate (for debt obligations), maturity (for debt obligations), individual trading characteristics and other market data. Pricing services generally value debt obligations assuming orderly transactions of institutional round lot size, but a fund may hold or transact in the same securities in smaller, odd lot sizes. Odd lots often trade at lower prices than institutional round lots. Debt obligations are subject to interest rate and credit risks. In addition, all debt obligations involve some risk of default with respect to interest and/or principal payments.
Foreign securities’ (including foreign exchange contracts) prices are converted into U.S. dollar amounts using the applicable exchange rates as of the close of the NYSE. If market quotations are available and reliable for foreign exchange-traded equity securities, the securities will be valued at the market quotations. Because trading hours for certain foreign securities end before the close of the NYSE, closing market quotations may become unreliable. If between the time trading ends on a particular security and the close of the customary trading session on the NYSE, events occur that the investment adviser determines are significant and make the closing price unreliable, the Fund may fair value the security. If the event is likely to have affected the closing price of the security, the security will be valued at fair value in good faith using procedures approved by the Board of Trustees. Adjustments to closing prices to reflect fair value may also be based on a screening process of an independent pricing service to indicate the degree of certainty, based on historical data, that the closing price in the principal market where a foreign security trades is not the current value as of the close of the NYSE. Foreign securities’ prices meeting the approved degree of certainty that the price is not reflective of current value will be priced at the indication of fair value from the independent pricing service. Multiple factors may be considered by the independent pricing service in determining adjustments to reflect fair value and may include information relating to sector indices, American Depositary Receipts and domestic and foreign index futures. Foreign securities may have additional risks including exchange rate changes, potential for sharply devalued currencies and high inflation, political and economic upheaval, the relative lack of issuer information, relatively low market liquidity and the potential lack of strict financial and accounting controls and standards.
Securities for which market prices are not provided by any of the above methods may be valued based upon quotes furnished by independent sources. The last bid price may be used to value equity securities. The mean between the last bid and asked prices is used to value debt obligations, including corporate loans.
Securities for which market quotations are not readily available or became unreliable are valued at fair value as determined in good faith by or under the supervision of the Trust’s officers following procedures approved by the Board of Trustees. Issuer specific events, market trends, bid/ asked quotes of brokers and information providers and other market data may be reviewed in the course of making a good faith determination of a
13 INVESCO OPPENHEIMER V.I. CAPITAL APPRECIATION FUND
NOTES TO FINANCIAL STATEMENTSUnaudited / Continued
security’s fair value.
The Fund may invest in securities that are subject to interest rate risk, meaning the risk that the prices will generally fall as interest rates rise and, conversely, the prices will generally rise as interest rates fall. Specific securities differ in their sensitivity to changes in interest rates depending on their individual characteristics. Changes in interest rates may result in increased market volatility, which may affect the value and/or liquidity of certain Fund investments.
Valuations change in response to many factors including the historical and prospective earnings of the issuer, the value of the issuer’s assets, general economic conditions, interest rates, investor perceptions and market liquidity. Because of the inherent uncertainties of valuation, the values reflected in the financial statements may materially differ from the value received upon actual sale of those investments.
| B. | Securities Transactions and Investment Income -Securities transactions are accounted for on a trade date basis. Realized gains or losses on sales are computed on the basis of specific identification of the securities sold. Interest income (net of withholding tax, if any) is recorded on the accrual basis from settlement date. Dividend income (net of withholding tax, if any) is recorded on the ex-dividend date. |
The Fund may periodically participate in litigation related to Fund investments. As such, the Fund may receive proceeds from litigation settlements. Any proceeds received are included in the Statement of Operations as realized gain (loss) for investments no longer held and as unrealized gain (loss) for investments still held.
Brokerage commissions and mark ups are considered transaction costs and are recorded as an increase to the cost basis of securities purchased and/or a reduction of proceeds on a sale of securities. Such transaction costs are included in the determination of net realized and unrealized gain (loss) from investment securities reported in the Statement of Operations and the Statement of Changes in Net Assets and the net realized and unrealized gains (losses) on securities per share in the Financial Highlights. Transaction costs are included in the calculation of the Fund’s net asset value and, accordingly, they reduce the Fund’s total returns. These transaction costs are not considered operating expenses and are not reflected in net investment income reported in the Statement of Operations and the Statement of Changes in Net Assets, or the net investment income per share and the ratios of expenses and net investment income reported in the Financial Highlights, nor are they limited by any expense limitation arrangements between the Fund and the investment adviser.
The Fund allocates income and realized and unrealized capital gains and losses to a class based on the relative net assets of each class.
| C. | Country Determination- For the purposes of making investment selection decisions and presentation in the Schedule of Investments, the investment adviser may determine the country in which an issuer is located and/or credit risk exposure based on various factors. These factors include the laws of the country under which the issuer is organized, where the issuer maintains a principal office, the country in which the issuer derives 50% or more of its total revenues and the country that has the primary market for the issuer’s securities, as well as other criteria. Among the other criteria that may be evaluated for making this determination are the country in which the issuer maintains 50% or more of its assets, the type of security, financial guarantees and enhancements, the nature of the collateral and the sponsor organization. Country of issuer and/or credit risk exposure has been determined to be the United States of America, unless otherwise noted. |
| D. | Distributions - Dividends and distributions to shareholders, which are determined in accordance with income tax regulations and may differ from U.S. GAAP, are recorded on the ex-dividend date. Income distributions, if any, are declared and paid quarterly. Capital gain distributions, if any, are declared and paid annually or at other times as determined necessary by the Adviser. |
The tax character of distributions is determined as of the Fund’s fiscal year end. Therefore, a portion of the Fund’s distributions made to shareholders prior to the Fund’s fiscal year end may ultimately be categorized as a tax return of capital.
| E. | Master Limited Partnerships - The Fund invests in Master Limited Partnerships (“MLPs”). MLPs are publicly traded partnerships and limited liability companies taxed as partnerships under the Internal Revenue Code of 1986, as amended (the “Internal Revenue Code”). The Fund invests in MLPs engaged in, among other things, the transportation, storage, processing, refining, marketing, exploration, production and mining of minerals and natural resources. The Fund is a partner in each MLP; accordingly, the Fund is required to take into account the Fund’s allocable share of income, gains, losses, deductions, expenses, and tax credits recognized by each MLP. |
MLP’s may be less liquid and subject to more abrupt or erratic price movements than conventional publicly traded securities.
| F. | Return of Capital -Distributions received from the Fund’s investments in MLPs generally are comprised of income and return of capital. The Fund records investment income and return of capital based on estimates made at the time such distributions are received. The return of capital portion of the distribution is a reduction to investment income that results in an equivalent reduction in the cost basis of the associated investments and increases net realized gains (losses) and change in unrealized appreciation (depreciation). Such estimates are based on historical information available from each MLP and other industry sources. These estimates will subsequently be revised and may materially differ primarily based on information received from the MLPs after their tax reporting periods are concluded. |
| G. | Federal Income Taxes -The Fund intends to comply with provisions of the Internal Revenue Code applicable to regulated investment companies and to distribute substantially all of its investment company taxable income to shareholders. Therefore, no federal income or excise tax provision is required. The Fund files income tax returns in U.S. federal and applicable state jurisdictions. The statute of limitations on the Fund’s tax return filings generally remains open for the three preceding fiscal reporting period ends. The Fund has analyzed its tax positions for the fiscal year ended December 31, 2018, including open tax years, and does not believe there are any uncertain tax positions requiring recognition in the Fund’s financial statements. |
During the fiscal year ended December 31, 2018, the Fund did not utilize any capital loss carryforwards to offset capital gains realized in that fiscal year. Capital losses will be carried forward to future years if not offset by gains.
At period end, it is estimated that the capital loss carryforwards would be zero. The estimated capital loss carryforward represents the carryforward as of the end of the last fiscal year, increased or decreased by capital losses or gains realized in the first six months of the current fiscal year. During the reporting period, it is estimated that the Fund will not utilize any capital loss carryforward to offset realized capital gains.
Net investment income (loss) and net realized gain (loss) may differ for financial statement and tax purposes. The character of dividends and
14 INVESCO OPPENHEIMER V.I. CAPITAL APPRECIATION FUND
distributions made during the fiscal year from net investment income or net realized gains are determined in accordance with federal income tax requirements, which may differ from the character of net investment income or net realized gains presented in those financial statements in accordance with U.S. GAAP. Also, due to timing of dividends and distributions, the fiscal year in which amounts are distributed may differ from the fiscal year in which the income or net realized gain was recorded by the Fund.
The aggregate cost of securities and other investments and the composition of unrealized appreciation and depreciation of securities and other investments for federal income tax purposes at period end are noted in the following table. The primary difference between book and tax appreciation or depreciation of securities and other investments, if applicable, is attributable to the tax deferral of losses or tax realization of financial statement unrealized gain or loss.
| | | | |
Federal tax cost of securities | | $ | 544,598,739 | |
| | | | |
Gross unrealized appreciation | | $ | 197,207,211 | |
Gross unrealized depreciation | | | (8,093,094 | ) |
| | | | |
Net unrealized appreciation | | $ | 189,114,117 | |
| | | | |
| H. | Expenses -Fees provided for under the Rule 12b-1 plan of a particular class of the Fund are charged to the operations of such class. Transfer agency fees and expenses and other shareholder recordkeeping fees and expenses attributable to each share class based on relative net assets. Transfer agency fees and expenses and other shareholder recordkeeping fees and expenses relating to all other classes are allocated among those classes based on relative net assets. All other expenses are allocated among the classes based on relative net assets. |
| I. | Accounting Estimates -The financial statements are prepared on a basis in conformity with accounting principles generally accepted in the United States of America (“GAAP”), which requires management to make estimates and assumptions that affect the reported amounts of assets and liabilities at the date of the financial statements and the reported amounts of revenues and expenses during the reporting period including estimates and assumptions related to taxation. Actual results could differ from those estimates by a significant amount. In addition, the Fund monitors for material events or transactions that may occur or become known after the period-end date and before the date the financial statements are released to print. |
| J. | Indemnifications -Under the Trust’s organizational documents, each Trustee, officer, employee or other agent of the Trust is indemnified against certain liabilities that may arise out of the performance of their duties to the Fund. Additionally, in the normal course of business, the Fund enters into contracts, including the Fund’s servicing agreements, that contain a variety of indemnification clauses. The Fund’s maximum exposure under these arrangements is unknown as this would involve future claims that may be made against the Fund that have not yet occurred. The risk of material loss as a result of such indemnification claims is considered remote. |
| K. | Foreign Currency Translations -Foreign currency is valued at the close of the NYSE based on quotations posted by banks and major currency dealers. Portfolio securities and other assets and liabilities denominated in foreign currencies are translated into U.S. dollar amounts at the date of valuation. Purchases and sales of portfolio securities (net of foreign taxes withheld on disposition) and income items denominated in foreign currencies are translated into U.S. dollar amounts on the respective dates of such transactions. The Fund does not separately account for the portion of the results of operations resulting from changes in foreign exchange rates on investments and the fluctuations arising from changes in market prices of securities held. The combined results of changes in foreign exchange rates and the fluctuation of market prices on investments (net of estimated foreign tax withholding) are included with the net realized and unrealized gain or loss from investments in the Statement of Operations. Reported net realized foreign currency gains or losses arise from (1) sales of foreign currencies, (2) currency gains or losses realized between the trade and settlement dates on securities transactions, and (3) the difference between the amounts of dividends, interest, and foreign withholding taxes recorded on the Fund’s books and the U.S. dollar equivalent of the amounts actually received or paid. Net unrealized foreign currency gains and losses arise from changes in the fair values of assets and liabilities, other than investments in securities at fiscal period end, resulting from changes in exchange rates. The Fund may invest in foreign securities, which may be subject to foreign taxes on income, gains on investments or currency repatriation, a portion of which may be recoverable. Foreign taxes, if any, are recorded based on the tax regulations and rates that exist in the foreign markets in which the Fund invests and are shown in the Statement of Operations. |
Note 2 - Advisory Fees and Other Fees Paid to Affiliates
The Trust has entered into a master investment advisory agreement with Invesco Advisers, Inc. (the “Adviser” or “Invesco”). Under the terms of the investment advisory agreement, the Fund accrues daily and pays monthly an advisory fee to the Adviser based on the annual rate of the Fund’s average daily net assets as follows:
| | | | |
| Fee Schedule* | | | |
Up to $200 million | | | 0.75% | |
Next $200 million | | | 0.72 | |
Next $200 million | | | 0.69 | |
Next $200 million | | | 0.66 | |
Next $200 million | | | 0.60 | |
Over $1 billion | | | 0.58 | |
* The advisory fee paid by the Fund shall be reduced by any amounts paid by the Fund under the administrative services agreement with the Adviser.
For the six months ended June 30, 2019, the effective advisory fees incurred by the Fund were 0.71%.
From the beginning of the fiscal period until the date of the Reorganization, the Acquired Fund paid $1,938,757 in advisory fees to OFI Global Asset Management, Inc. based on the annual rates above of the Acquired Fund’s average daily net assets.
15 INVESCO OPPENHEIMER V.I. CAPITAL APPRECIATION FUND
NOTES TO FINANCIAL STATEMENTSUnaudited / Continued
Under the terms of a master sub-advisory agreement between the Adviser and each of Invesco Asset Management Deutschland GmbH, Invesco Asset Management Limited, Invesco Asset Management (Japan) Limited, Invesco Hong Kong Limited, Invesco Senior Secured Management, Inc. and Invesco Canada Ltd. and separate sub-advisory agreements with Invesco Capital Management LLC, and Invesco Asset Management (India) Private Limited (collectively, the “Affiliated Sub-Advisers”) the Adviser, not the Fund, will pay 40% of the fees paid to the Adviser to any such Affiliated Sub-Adviser(s) that provide(s) discretionary investment management services to the Fund based on the percentage of assets allocated to such Sub-Adviser(s). Invesco has also entered into a Sub-Advisory Agreement with OppenheimerFunds, Inc. to provide discretionary management services to the Funds.
Effective on the Reorganization Date, the Adviser has contractually agreed, through at least May 31, 2021, to waive advisory fees and/or reimburse expenses of all shares to the to the extent necessary to limit the total annual fund operating expenses after fee waiver and/or expense reimbursement (excluding certain items discussed below) of Series I and Series II shares to 0.80% and 1.05%, respectively, of the Fund’s average daily net assets (the “expense limits”). In determining the Adviser’s obligation to waive advisory fees and/or reimburse expenses, the following expenses are not taken into account, and could cause total annual fund operating expenses after fee waivers and/or expense reimbursement to exceed the numbers reflected above: (1) interest; (2) taxes; (3) dividend expenses on short sales; (4) extraordinary or non-routine items, including litigation expenses; and (5) expenses that the Fund has incurred but did not actually pay because of an expense offset arrangement. Unless Invesco continues the fee waiver agreement, it will terminate May 31, 2021. During its term, the fee waiver agreement cannot be terminated or amended to increase the expense limits or reduce the advisory fee waiver without approval of the Board of Trustees.
Further, the Adviser has contractually agreed, through at least June 30, 2021, to waive the advisory fee payable by the Fund in an amount equal to 100% of the net advisory fees the Adviser receives from the affiliated money market funds on investments by the Fund of uninvested cash in such affiliated money market funds.
For the six months ended June 30, 2019, the Adviser waived advisory fee of $6,840 and reimbursed fund expenses of $159,605 and $61,097 of Series I and Series II, respectively.
Prior to the Reorganization, the OFI Global Asset Management, Inc. had contractually agreed to waive fees and/or reimburse expenses of Series I and Series II shares to 0.80% and 1.05%, respectively, of the Acquired Fund’s average daily net assets.
The Trust has entered into a master administrative services agreement with Invesco pursuant to which the Fund has agreed to pay Invesco for certain administrative costs incurred in providing accounting services to the Fund. For the six months ended June 30, 2019, expenses incurred under the agreement are shown in the Statement of Operations as Administration fees. Additionally, Invesco has entered into service agreements whereby JPMorgan Chase Bank serves as custodian to the Fund. Prior to the Reorganization, the Acquired Fund paid administrative fees to OFI Global Asset Management, Inc.
The Trust has entered into a transfer agency and service agreement with Invesco Investment Services, Inc. (“IIS”) pursuant to which the Fund has agreed to pay IIS a fee for providing transfer agency and shareholder services to the Fund and reimburse IIS for certain expenses incurred by IIS in the course of providing such services. IIS may make payments to intermediaries that provide omnibus account services, sub-accounting services and/or networking services. All fees payable by IIS to intermediaries that provide omnibus account services or sub-accounting services are charged back to the Fund, subject to certain limitations approved by the Trust’s Board of Trustees. Prior to the Reorganization, the Acquired Fund paid transfer agent fees to OFI Global Asset Management, Inc. and Shareholder Services, Inc. For the six months ended June 30, 2019, expenses incurred under these agreements are shown in the Statement of Operations as Transfer and shareholder servicing agent fees.
The Trust has entered into master distribution agreements with Invesco Distributors, Inc. (“IDI”) to serve as the distributor for the Service II shares of the Fund. The Trust has adopted a plan pursuant to Rule 12b-1 under the 1940 Act with respect to the Fund’s Service II shares (the “Plan”). The Fund, pursuant to the Plan, pays IDI at an annual rate of 0.25% of the average daily net assets of Service II shares. The fees are accrued daily and paid monthly. Of the Plan payments, up to 0.25% of the average daily net assets of the class of shares may be paid to furnish continuing personal shareholder services to customers who purchase and own shares of such class. Any amounts not paid as a service fee under the Plan would constitute an asset-based sales charge. Rules of the Financial Industry Regulatory Authority (“FINRA”) impose a cap on the total sales charges, including asset-based sales charges, that may be paid by any class of shares of the Fund plans. Prior to the Reorganization, the Acquired Fund paid distribution fees to OppenheimerFunds Distributor, Inc. For the six months ended June 30, 2019, expenses incurred under the plans are shown in the Statement of Operations as Distribution and service plan fees.
Certain officers and trustees of the Trust are officers and directors of the Adviser, IIS and/or IDI.
Note 3 - Additional Valuation Information
GAAP defines fair value as the price that would be received to sell an asset or paid to transfer a liability in an orderly transaction between market participants at the measurement date, under current market conditions. GAAP establishes a hierarchy that prioritizes the inputs to valuation methods, giving the highest priority to readily available unadjusted quoted prices in an active market for identical assets (Level 1) and the lowest priority to significant unobservable inputs (Level 3), generally when market prices are not readily available or are unreliable. Based on the valuation inputs, the securities or other investments are tiered into one of three levels. Changes in valuation methods may result in transfers in or out of an investment’s assigned level:
Level 1 — Prices are determined using quoted prices in an active market for identical assets.
Level 2 — Prices are determined using other significant observable inputs. Observable inputs are inputs that other market participants may use in pricing a security. These may include quoted prices for similar securities, interest rates, prepayment speeds, credit risk, yield curves, loss severities, default rates, discount rates, volatilities and others.
Level 3 — Prices are determined using significant unobservable inputs. In situations where quoted prices or observable inputs are unavailable (for
16 INVESCO OPPENHEIMER V.I. CAPITAL APPRECIATION FUND
example, when there is little or no market activity for an investment at the end of the period), unobservable inputs may be used. Unobservable inputs reflect the Fund’s own assumptions about the factors market participants would use in determining fair value of the securities or instruments and would be based on the best available information.
The following is a summary of the tiered valuation input levels, as of June 30, 2019. The level assigned to the securities valuations may not be an indication of the risk or liquidity associated with investing in those securities. Because of the inherent uncertainties of valuation, the values reflected in the financial statements may materially differ from the value received upon actual sale of those investments.
| | | | | | | | | | | | | | |
| | | Level 1— Unadjusted
Quoted Prices | | | Level 2— Other Significant
Observable Inputs | | | Level 3—
Significant
Unobservable
Inputs | | | Value |
Assets Table | | | | | | | | | | | | | | |
Investments, at Value: | | | | | | | | | | | | | | |
| Common Stocks | | | | | | | | | | | | | | |
Consumer Discretionary | | $ | 256,755,108 | | | $ | 22,223,303 | | | $ | — | | | $ 278,978,411 |
Consumer Staples | | | 20,232,611 | | | | — | | | | — | | | 20,232,611 |
Energy | | | 17,283,458 | | | | — | | | | — | | | 17,283,458 |
Financials | | | 34,710,327 | | | | 1,417,162 | | | | — | | | 36,127,489 |
Health Care | | | 73,805,751 | | | | 3,168,785 | | | | — | | | 76,974,536 |
Industrials | | | 63,196,213 | | | | 11,983,086 | | | | — | | | 75,179,299 |
Information Technology | | | 177,494,406 | | | | — | | | | — | | | 177,494,406 |
Materials | | | 16,166,661 | | | | — | | | | — | | | 16,166,661 |
Utilities | | | 6,434,600 | | | | — | | | | — | | | 6,434,600 |
Investment Company | | | 28,833,796 | | | | — | | | | — | | | 28,833,796 |
| | | |
| Total Assets | | $ | 694,912,931 | | | $ | 38,792,336 | | | $ | — | | | $ 733,705,267 |
| | | |
Forward currency exchange contracts and futures contracts, if any, are reported at their unrealized appreciation/depreciation at measurement date, which represents the change in the contract’s value from trade date. All additional assets and liabilities included in the above table are reported at their market value at measurement date.
Note 4 - Security Transactions with Affiliated Funds
The Fund is permitted to purchase or sell securities from or to certain other Invesco Funds under specified conditions outlined in procedures adopted by the Board of Trustees of the Trust. The procedures have been designed to ensure that any purchase or sale of securities by the Fund from or to another fund or portfolio that is or could be considered an affiliate by virtue of having a common investment adviser (or affiliated investment advisers), common Trustees and/or common officers complies with Rule 17a-7 of the 1940 Act. Further, as defined under the procedures, each transaction is effected at the current market price. Pursuant to these procedures for the period January 1, 2018 to May 24, 2019, the Predecessor Fund engaged in transactions with affiliates as listed: Securities purchases of $3,806,485 and securities sales of $611,914, which resulted in net realized gains of $215,597. For the period May 25, 2019 to June 30, 2019, the Fund engaged in transactions with affiliates as listed: Securities purchases of $9,976,512.
Note 5 – Expense Offset Arrangement
The expense offset arrangement is comprised of custodian credits which result from periodic overnight cash balances at the custodian. For the six months ended June 30, 2019, the Fund received credits from this arrangement, which resulted in the reduction of the Fund’s total expenses of $6,423.
Note 6 – Trustee and Officer Fees and Benefits
Certain Trustees have executed a Deferred Compensation Agreement pursuant to which they have the option to elect to defer receipt of all or a portion of the annual compensation they are entitled to receive from the Fund. For purposes of determining the amount owed to the Trustees under the plan, deferred amounts are treated as though equal dollar amounts had been invested in shares of the Fund or in other Invesco and/or Invesco Oppenheimer funds selected by the Trustees. The Fund purchases shares of the funds selected for deferral by the Trustees in amounts equal to his or her deemed investment, resulting in a Fund asset equal to the deferred compensation liability. Such assets are included as a component of “Other” within the asset section of the Statement of Assets and Liabilities. Deferral of Trustees’ fees under the plan will not affect the net assets of the Fund and will not materially affect the Fund’s assets, liabilities or net investment income per share. Amounts will be deferred until distributed in accordance with the compensation deferral plan.
Note 7 – Cash Balances
The Fund is permitted to temporarily carry a negative or overdrawn balance in its account with JP Morgan Chase Bank, the custodian bank. Such balances, if any at period-end, are shown in the Statement of Assets and Liabilities under the payable caption Amount due custodian. To compensate the custodian bank for such overdrafts, the overdrawn Fund may either (1) leave funds as a compensating balance in the account so the custodian bank can be compensated by earning the additional interest; or (2) compensate by paying the custodian bank at a rate agreed upon by the custodian bank and
17 INVESCO OPPENHEIMER V.I. CAPITAL APPRECIATION FUND
NOTES TO FINANCIAL STATEMENTSUnaudited / Continued
Invesco, not to exceed the contractually agreed upon rate.
Note 8 – Investment Transactions
The aggregate amount of investment securities (other than short-term securities, U.S. Treasury obligations and money market funds, if any) purchased and sold by the Fund during the six months ended June 30, 2019 was $309,350,076 and $329,022,441, respectively.
Note 9 – Share Information
Transactions in shares of beneficial interest were as follows:
| | | | | | | | | | | | | | | | |
| | | Six Months Ended June 30, 20191 | | | Year Ended December 31, 2018 | |
| | | | |
| | | Shares | | | Amount | | | Shares | | | Amount |
Series I Shares | | | | | | | | | | | | | | | | |
Sold | | | 123,246 | | | $ | 6,861,089 | | | | 363,347 | | | $ | 19,418,739 | |
Dividends and/or distributions reinvested | | | 930,266 | | | | 49,378,533 | | | | 779,254 | | | | 43,131,733 | |
Redeemed | | | (807,886 | ) | | | (45,033,802 | ) | | | (1,630,524 | ) | | | (91,352,971 | ) |
| | | | |
Net increase (decrease) | | | 245,626 | | | $ | 11,205,820 | | | | (487,923 | ) | | $ | (28,802,499 | ) |
| | | | |
| | | | |
| | | | | | | | | | | | | | | | |
Series II Shares | | | | | | | | | | | | | | | | |
Sold | | | 727,829 | | | $ | 39,273,683 | | | | 124,097 | | | $ | 6,689,300 | |
Dividends and/or distributions reinvested | | | 357,511 | | | | 18,651,335 | | | | 300,192 | | | | 16,387,466 | |
Redeemed | | | (368,135 | ) | | | (20,133,492 | ) | | | (3,229,296 | ) | | | (173,369,218 | ) |
| | | | |
Net increase (decrease) | | | 717,205 | | | $ | 37,791,526 | | | | (2,805,007 | ) | | $ | (150,292,452 | ) |
| | | | |
| | | | |
1. There are entities that are record owners of more than 5% of the outstanding shares of the Fund and own 10% of the outstanding shares of the Fund. The Fund and the Fund’s principal underwriter or adviser, are parties to participation agreements with these entities whereby these entities sell units of interest in separate accounts funding variable products that are invested in the Fund. The Fund, Invesco and/or Invesco affiliates may make payments to these entities, which are considered to be related to the Fund, for providing services to the Fund, Invesco and/or Invesco affiliates, including, but not limited to services such as securities brokerage, distribution, third party record keeping and account servicing. The Fund has no knowledge as to whether all or any portion of the shares owned of record by these entities are also owned beneficially.
In addition, 30% of the outstanding shares of the Fund are owned by the Adviser or an affiliate of the Adviser.
Note 10 - Borrowings
Joint Credit Facility.A number of mutual funds managed by the Adviser participate in a $1.95 billion revolving credit facility (the “Facility”) intended to provide short-term financing, if necessary, subject to certain restrictions in connection with atypical redemption activity. Expenses and fees related to the Facility are paid by the participating funds and are disclosed separately or as other expenses on the Statement of Operations. The Fund did not utilize the Facility during the reporting period. The Facility terminated May 24, 2019.
Note 11 – Independent Registered Public Accounting Firm
The Audit Committee of the Board of Trustees appointed, and the Board of Trustees ratified and approved, PricewaterhouseCoopers LLP (“PWC”) as the independent registered public accounting firm of the Fund for the fiscal periods ending after May 24, 2019. Prior to the close of business on May 24, 2019, the Predecessor Fund was a separate series of an unaffiliated investment company and its financial statements were audited by a different independent registered public accounting firm (the “Prior Auditor”).
Effective after the close of business on May 24, 2019, the Prior Auditor resigned as the independent registered public accounting firm of the Fund. The Prior Auditor’s report on the financial statements of the Predecessor Fund for the past two fiscal years did not contain an adverse or disclaimer of opinion, and was not qualified or modified as to uncertainty, audit scope or accounting principles. During the Predecessor Fund’s two most recent fiscal years and through the close of business on May 24, 2019, there were no (1) disagreements with the Prior Auditor on any matter of accounting principles or practices, financial statement disclosure, or auditing scope or procedure, which disagreements, if not resolved to the Prior Auditor’s satisfaction, would have caused it to make reference to that matter in connection with its report; or (2) “reportable events,” as that term is defined in Item 304(a)(1)(v) of Regulation S-K under the Securities Exchange Act of 1934.
18 INVESCO OPPENHEIMER V.I. CAPITAL APPRECIATION FUND
APPROVAL OF THE INVESTMENT ADVISORY AND SUB-ADVISORY CONTRACTSUnaudited
At meetings held on December 14, 2018, the Board of Trustees (the Board or the Trustees) of AIM Variable Insurance Funds (Invesco Variable Insurance Funds) (the Trust) as a whole, and the independent Trustees, who comprise over 75% of the Board, voting separately, approved (i) an amendment to the Trust’s Master Investment Advisory Agreement with Invesco Advisers, Inc. (Invesco Advisers and the investment advisory agreement) to add Invesco Oppenheimer V.I. Capital Appreciation Fund (the Fund), (ii) an amendment to the Master Intergroup Sub-Advisory Contract for Mutual Funds with Invesco Asset Management Deutschland GmbH, Invesco Asset Management Limited, Invesco Asset Management (Japan) Limited, Invesco Hong Kong Limited, Invesco Senior Secured Management, Inc. and Invesco Canada Ltd. to add the Fund, (iii) an amendment to the separate sub-advisory contract with Invesco Capital Management LLC to add the Fund, (iv) an amendment to the separate sub-advisory contract with Invesco Asset Management (India) Private Limited to add the Fund, and (v) an initial sub-advisory contract with OppenheimerFunds, Inc. (collectively, the Affiliated Sub-Advisers and the sub-advisory contracts). Additionally, on March 26, 2019, the Board re-approved an initial sub-advisory contract with OppenheimerFunds, Inc. following its change of control as a result of the acquisition of OppenheimerFunds, Inc. and its subsidiaries, including the Oppenheimer mutual funds (each, an Oppenheimer Fund), by Invesco Ltd. (the OFI Transaction). After evaluating the factors discussed below, among others, the Board approved the Fund’s investment advisory agreement and the sub-advisory contracts and determined that the compensation payable by the Fund to Invesco Advisers and by Invesco Advisers to the Affiliated Sub-Advisers is fair and reasonable.
The Board’s Evaluation Process
The Board noted that it had previously approved establishing the Fund at the Board meeting held on October 23, 2018 and that the Fund was formed to acquire the assets and liabilities of an Oppenheimer Fund (the Acquired Fund) with the same investment objective and substantially similar principal investment strategies and risks. At the time of approval, the Fund had no assets and no performance history and the portfolio managers were not employed by Invesco Advisers or any of the Affiliated Sub-Advisers except OppenheimerFunds, Inc., which was not affiliated with Invesco at that time.
In approving the investment advisory agreement and sub-advisory contracts, the Board followed a process similar to the process that it follows in annually reviewing and approving investment advisory agreements and sub-advisory contracts for the series portfolios of funds advised by Invesco Advisers and considered the information provided in the most recent annual review process for those funds as well as the information provided with respect to the Fund. As part of the approval process, the Board reviewed and considered information provided in response to detailed requests for information submitted to management by the independent Trustees with assistance from legal counsel to the independent Trustees. The Board reviewed comparative investment performance and fee data prepared by Invesco Advisers and an independent mutual fund data provider. The Board was assisted in its review by the Senior Officer, an officer of the Invesco Funds who reports directly to the independent Trustees, and by independent legal counsel.
The discussion below serves as a summary of the material factors and related conclusions that formed the basis for the Board’s approval of the Fund’s investment advisory agreement and sub-advisory contracts. The Trustees’ review and conclusions are based on the comprehensive consideration of all information presented to them and are not the result of any single determinative factor. Moreover, one Trustee may have weighed a particular piece of information or factor differently than another Trustee. This information is current as of December 14, 2018 and March 26, 2019 for the sub-advisory contract with OppenheimerFunds, Inc.
Factors and Conclusions and Summary of Independent Written Fee Evaluation
A. Nature, Extent and Quality of Services Provided by Invesco Advisers and the Affiliated Sub-Advisers
The Board reviewed the nature, extent and quality of the advisory services to be provided to the Fund by Invesco Advisers under the Fund’s investment advisory agreement, and the credentials and experience of the officers and employees of Invesco Advisers who will provide these services. The Board’s review included consideration of the investment process oversight and structure, credit analysis and investment risk management to be employed in providing advisory services to the Fund. The Board also considered non-advisory services that Invesco Advisers and its affiliates provide to the Invesco Funds and will provide to the Fund, such as various back office support functions, third party oversight, internal audit, valuation, portfolio trading and legal and compliance. The Board also received and reviewed information about Invesco Advisers’ role as administrator of the Invesco Funds’ liquidity risk management program. The Board also reviewed and considered the benefits to shareholders of investing in a fund that is part of the Invesco family of funds under the umbrella of Invesco Ltd., Invesco Advisers’ parent company, and noted Invesco Ltd.’s depth and experience in conducting an investment management business, as well as its commitment of financial and other resources to such business. The Board reviewed and considered information about the resources that Invesco Advisers intends to continue to commit to managing the Invesco family of funds, including the Fund, following the OFI Transaction. The Board concluded that the nature, extent and quality of the services to be provided to the Fund by Invesco Advisers are appropriate and satisfactory.
The Board reviewed the services that may be provided by the Affiliated Sub-Advisers under the sub-advisory contracts and the credentials and experience of the officers and employees of the Affiliated Sub-Advisers who provide these services. The Board noted the Affiliated Sub-Advisers’ expertise with respect to certain asset classes and that the Affiliated Sub-Advisers have offices and personnel that are located in financial centers around the world. As a result, the Board noted that the Affiliated Sub-Advisers can provide research and investment analysis on the markets and economies of various countries in which the Fund may invest, make recommendations regarding securities and assist with security trades. The Board concluded that the sub-advisory contracts may benefit the Fund and its shareholders by permitting Invesco Advisers to use the resources and talents of the Affiliated Sub-Advisers in managing the Fund. The Board concluded that the nature, extent and quality of the services that may be provided by the Affiliated Sub-Advisers are appropriate and satisfactory.
19 INVESCO OPPENHEIMER V.I. CAPITAL APPRECIATION FUND
APPROVAL OF THE INVESTMENT ADVISORY AND SUB-ADVISORY CONTRACTSUnaudited / Continued
B. Fund Investment Performance
The Board noted that the Fund would continue the historical performance information of the Acquired Fund following the consummation of the OFI Transaction. The Board considered the performance of the Acquired Fund and the fact that, at the closing of the OFI Transaction, management anticipates that the Fund will be managed pursuant to substantially similar investment strategies and by substantially the same portfolio management team as managed the Acquired Fund. The Board did not view Fund performance as a relevant factor in considering whether to approve the sub-advisory contracts for the Fund, as no Affiliated Sub-Adviser currently manages assets of the Fund.
The Board compared the Fund’s investment performance over multiple time periods ending December 31, 2017 to the performance of funds in the Morningstar performance universe and against the Fund’s benchmark index. The Trustees also reviewed more recent Fund performance and this review did not change their conclusions.
C. Advisory and Sub-Advisory Fees and Fund Expenses
The Board compared the Fund’s contractual management fee rate to the contractual management fee rates of funds in the Fund’s Morningstar expense group. The Board also considered comparative information regarding the Fund’s total expense ratio and its various components.
The Board noted that Invesco Advisers has contractually agreed to waive fees and/or limit expenses of the Fund for at least two years from the closing date of the OFI Transaction in an amount necessary to limit total annual operating expenses to a specified percentage of average daily net assets for each class of the Fund.
The Board also considered the fees charged by Invesco Advisers and the Affiliated Sub-Advisers to other similarly managed client accounts. The Board noted that Invesco Advisers or the Affiliated Sub-Advisers may charge lower fees to large institutional clients. Invesco Advisers reviewed with the Board differences in the scope of services it provides to the Invesco Funds relative to certain other types of client accounts, including management of cash flows as a result of redemptions and purchases, necessary infrastructure such as officers, office space, technology, legal and distribution, oversight of service providers, costs and business risks associated with launching new funds and sponsoring and maintaining the product line, preparation of annual registration statement updates and financial information and compliance with federal and state laws and regulations.
The Board also considered the services that may be provided by the Affiliated Sub-Advisers pursuant to the sub-advisory contracts, as well as the fees payable by Invesco Advisers to the Affiliated Sub-Advisers pursuant to the sub-advisory contracts.
D. Economies of Scale and Breakpoints
The Board considered the extent to which there may be economies of scale in the provision of advisory services to the Fund. The Board considered Invesco’s reinvestment in its business, including investments in business infrastructure and cybersecurity. The Board also considered that the Fund may benefit from economies of scale through contractual breakpoints in the Fund’s advisory fee schedule, which generally operate to reduce the Fund’s expense ratio as it grows in size. The Board noted that the Fund will share directly in economies of scale through lower fees charged by third party service providers based on the combined size of the Invesco Funds. The Board noted that the Fund may also benefit from economies of scale through initial fee setting, fee waivers and expense reimbursements.
E. Profitability and Financial Resources
The Board reviewed information from the 2018 contract renewal process provided by Invesco Advisers concerning the costs of the advisory and other services that Invesco Advisers and its affiliates provide to the Invesco Funds and the profitability of Invesco Advisers and its affiliates in providing these services. The Board considered the methodology used for calculating profitability and noted the periodic review of such methodology by an independent consultant. The Board noted that Invesco Advisers will continue to operate at a net profit from services Invesco Advisers and its affiliates provide to the Invesco Funds. The Board did not deem the level of profits realized by Invesco Advisers and its affiliates from providing services to the Invesco Funds, and the profits estimated to be realized by the Fund, to be excessive given the nature, extent and quality of the services provided. The Board received information from Invesco Advisers demonstrating that Invesco Advisers and the Affiliated Sub-Advisers are financially sound and have the resources necessary to perform their obligations under the investment advisory agreement and sub-advisory contracts.
F. Collateral Benefits to Invesco Advisers and its Affiliates
The Board considered various other benefits to be received by Invesco Advisers and its affiliates from the relationship with the Fund, including the fees to be received for providing administrative, transfer agency and distribution services to the Fund. The Board considered the performance of Invesco Advisers and its affiliates in providing these services to other Invesco Funds and the organizational structure employed to provide these services. The Board also considered that these services will be provided to the Fund pursuant to written contracts that are reviewed and approved on an annual basis by the Board; and that the services are required for the operation of the Fund.
The Board considered the benefits realized by Invesco Advisers and the Affiliated Sub-Advisers as a result of portfolio brokerage transactions executed through “soft dollar” arrangements. The Board noted that soft dollar arrangements may result in the Fund bearing costs to purchase research that may be used by Invesco Advisers or the Affiliated Sub-Advisers with other clients and may reduce Invesco Advisers’ or the Affiliated Sub-Advisers’ expenses. The Board also considered that it will receive periodic reports from Invesco representing that these arrangements are consistent with regulatory requirements. The Board did not deem the soft dollar arrangements to be inappropriate.
20 INVESCO OPPENHEIMER V.I. CAPITAL APPRECIATION FUND
APPROVAL OF THE INVESTMENT ADVISORY AND SUB-ADVISORY CONTRACTSUnaudited / Continued
The Board considered that the Fund’s uninvested cash and cash collateral from any securities lending arrangements may be invested in money market funds advised by Invesco Advisers pursuant to procedures approved by the Board. The Board considered that Invesco Advisers will receive advisory fees from these affiliated money market funds attributable to such investments, although Invesco Advisers has contractually agreed to waive through varying periods the advisory fees payable by the Invesco Funds with respect to certain investments in the affiliated money market funds. The waiver is in an amount equal to 100% of the net advisory fee Invesco Advisers will receive from the affiliated money market funds with respect to the Fund’s investment in the affiliated money market funds of uninvested cash, but not cash collateral. The Board concluded that the amount of advisory fees to be received by Invesco Advisers from the Fund’s investment of cash collateral from any securities lending arrangements in the affiliated money market funds is fair and reasonable.
The Board also considered that an affiliated broker may receive commissions for executing certain trades for the Fund. Invesco Advisers and the Affiliated Sub-Advisers may use the affiliated broker to, among other things, control order routing and minimize information leakage, and the Board was be advised that such trades will be executed in compliance with rules under the federal securities laws and consistent with best execution obligations.
21 INVESCO OPPENHEIMER V.I. CAPITAL APPRECIATION FUND
PORTFOLIO PROXY VOTING POLICIES AND GUIDELINES; UPDATES TO STATEMENT OF INVESTMENTSUnaudited
Go paperless with eDelivery
Visit invesco.com/edelivery to enjoy the convenience and security of anytime electronic access to your investment documents.
With eDelivery, you can elect to have any or all of the following materials delivered straight to your inbox to download, save and print from your own computer:
• Fund reports and prospectuses
• Quarterly statements
• Daily confirmations
• Tax forms
Invesco mailing information
Send general correspondence to Invesco Investment Services, Inc., P.O. Box 219078, Kansas City, MO 64121-9078.
Important notice regarding delivery of security holder documents
To reduce Fund expenses, only one copy of most shareholder documents may be mailed to shareholders with multiple accounts at the same address (Householding). Mailing of your shareholder documents may be householded indefinitely unless you instruct us otherwise. If you do not want the mailing of these documents to be combined with those for other members of your household, please contact Invesco Investment Services, Inc. at 800 959 4246 or contact your financial institution. We will begin sending you individual copies for each account within 30 days after receiving your request.
Fund holdings and proxy voting information
The Fund provides a complete list of its holdings four times in each fiscal year, at the quarter ends. For the second and fourth quarters, the lists appear in the Fund’s semiannual and annual reports to shareholders. For the first and third quarters, the Fund files the lists with the Securities and Exchange Commission (SEC) on Form N-Q (or any successor Form). The most recent list of portfolio holdings is available at invesco.com/completeqtrholdings. Shareholders can also look up the Fund’s Forms N-Q (or any successor Form) on the SEC website at sec.gov.
A description of the policies and procedures that the Fund uses to determine how to vote proxies relating to portfolio securities is available without charge, upon request, from our Client Services department at 800 959 4246 or at invesco.com/proxyguidelines. The information is also available on the SEC website, sec.gov.
Information regarding how the Fund voted proxies related to its portfolio securities during the most recent 12-month period ended June 30 is available at invesco.com/proxysearch. The information is also available on the SEC website, sec.gov.
Invesco Advisers, Inc. is an investment adviser; it provides investment advisory services to individual and institutional clients and does not sell securities. Invesco Distributors, Inc. is the US distributor for Invesco Ltd.’s retail mutual funds, exchange-traded funds and institutional money market funds. Both are wholly owned, indirect subsidiaries of Invesco Ltd.
22 INVESCO OPPENHEIMER V.I. CAPITAL APPRECIATION FUND
SHAREHOLDER PROXYUnaudited
A Special Meeting (“Meeting”) of Shareholders of Invesco Oppenheimer V.I. Capital Appreciation Fund was held on April 12, 2019. The Meeting was held for the following purpose:
(1) Approval of an Agreement and Plan of Reorganization that provides for the reorganization of Oppenheimer Capital Appreciation Fund/VA into Invesco Oppenheimer V.I. Capital Appreciation Fund.
The results of the voting on the above matter was as follows:
| | | | | | | | | | | | | | | | |
| Matter | | Votes For | | | Votes
Against | | | Votes
Abstain | | | Broker
Non-Votes | |
| (1) Approval of an Agreement and Plan of Reorganization | | | 10,681,595 | | | | 242,764 | | | | 518,416 | | | | 0 | |
23 Invesco Oppenheimer V.I. Capital Appreciation Fund


| | | | |
Semiannual Report | | 6/30/2019 | | |
Invesco Oppenheimer
V.I. Conservative Balanced Fund*
The Fund provides a complete list of its holdings four times in each fiscal year, at the quarter ends. For the second and fourth quarters, the lists appear in the Fund’s semi annual and annual reports to shareholders. For the first and third quarters, the Fund files the lists with the Securities and Exchange Commission (SEC) on Form N-Q (or any successor Form). The Fund’s Form N-Q (or any successor Form) filings are available on the SEC website, sec.gov. The Fund’s most recent portfolio holdings, as filed on Form N-Q (or any successor Form), have also been made available to insurance companies issuing variable annuity contracts and variable life insurance policies (“variable products”) that invest in the Fund.
A description of the policies and procedures that the Fund uses to determine how to vote proxies relating to portfolio securities is available without charge, upon request, from our Client Services department at 800 959 4246 or at invesco.com/proxyguidelines. The information is also available on the SEC website, sec.gov.
Information regarding how the Fund voted proxies related to its portfolio securities during the most recent 12-month period ended June 30 is available at invesco.com/proxysearch. The information is also available on the SEC website, sec.gov.
Invesco Advisers, Inc. is an investment adviser; it provides investment advisory services to individual and institutional clients and does not sell securities. Invesco Distributors, Inc. is the US distributor for Invesco Ltd.’s retail mutual funds, exchange- traded funds and institutional money market funds. Both are wholly owned, indirect subsidiaries of Invesco Ltd.
This report must be accompanied or preceded by a currently effective Fund prospectus and variable product prospectus, which contain more complete information, including sales charges and expenses. Investors should read each carefully before investing.
*Prior to the close of business on May 24, 2019, the Fund’s name was Oppenheimer Conservative Balanced Fund/VA. See Important Update on the following page for more information.
Important Update
On October 18, 2018, Massachusetts Mutual Life Insurance Company, an indirect corporate parent of OppenheimerFunds, Inc. and its subsidiaries OFI Global Asset Management, Inc., OFI SteelPath, Inc. and OFI Advisors, LLC, announced that it had entered into an agreement whereby Invesco Ltd., a global investment management company would acquire OppenheimerFunds and its subsidiaries (together, “OppenheimerFunds”). After the close of business on May 24, 2019 Invesco Ltd. completed the acquisition of OppenheimerFunds. This Fund was included in that acquisition and as of that date, became part of the Invesco family of funds. Please visit invesco.com for more information or call Invesco’s Client Services team at 800-959-4246.
PORTFOLIO MANAGER: Michael Hyman1 and Magnus Krantz
AVERAGE ANNUAL TOTAL RETURNS FOR THE PERIODS ENDED6/30/19
| | | | | | | | | | | | | | | | | | | | |
| | | Inception
Date | | | 6-Months | | 1-Year | | 5-Year | | 10-Year |
| Series I Shares* | | | 2/9/87 | | | | 11.97 | % | | | 7.07 | % | | | 4.75 | % | | | 8.05 | % |
| Series II Shares* | | | 5/1/02 | | | | 11.82 | | | | 6.80 | | | | 4.48 | | | | 7.77 | |
| Russell 3000 Index | | | | | | | 18.71 | | | | 8.98 | | | | 10.19 | | | | 14.67 | |
Bloomberg Barclays U.S. Aggregate Bond Index | | | | | | | 6.11 | | | | 7.87 | | | | 2.95 | | | | 3.90 | |
Custom Invesco Oppenheimer V.I. Conservative Balanced Index | | | | | | | 10.49 | | | | 8.59 | | | | 5.69 | | | | 7.89 | |
Performance quoted is past performance and cannot guarantee comparable future results; current performance may be lower or higher. Visit invesco.com for the most recent month-end performance. Performance figures reflect reinvested distributions and changes in net asset value (NAV). Investment return and principal value will vary so that you may have a gain or a loss when you sell shares. Fund returns include changes in share price, reinvested distributions and sales charges except where “without sales charge” is indicated. Effective after the close of business on May 24, 2019, the Non-Service and Service share classes of the predecessor fund were reorganized into Series I and Series II Shares, respectively, of the Fund. Returns shown for Series I and Series II shares are blended returns of the predecessor fund and the Fund. Share class returns will differ from those of the predecessor fund because of different expenses. See Fund prospectuses and summary prospectuses for more information on share classes, sales charges and new fee agreements, if any. Fund literature is available at invesco.com.
The Fund’s performance is compared to the performance of the Russell 3000 Index, the Bloomberg Barclays U.S. Aggregate Bond Index and the Custom Invesco Oppenheimer V.I. Conservative Balanced Index. The Russell 3000 Index measures the performance of the largest 3,000 U.S. companies, representing approximately 98% of the investable U.S. equity market. The Bloomberg Barclays U.S. Aggregate Bond Index is an index of U.S dollar-denominated, investment-grade U.S. corporate government and mortgage-backed securities. The Custom Invesco Oppenheimer V.I. Conservative Balanced Index is a customized weighted index currently comprised of 65% of the Bloomberg Barclays U.S. Aggregate Bond Index and 35% of the Russell 3000 Index. The indices are unmanaged and cannot be purchased directly by investors. While index comparisons may be useful to provide a benchmark for the Fund’s performance, it must be noted that the Fund’s investments are not limited to the investments comprising the indices. Index performance includes reinvestment of income, but does not reflect transaction costs, fees, expenses or taxes. Index performance is shown for illustrative purposes only as a benchmark for the Fund’s performance, and does not predict or depict performance of the Fund. The Fund’s performance reflects the effects of the Fund’s business and operating expenses.
TOP HOLDINGS AND ALLOCATIONS
TOP TEN COMMON STOCK HOLDINGS
| | | | |
Microsoft Corp. | | | 1.6 | % |
JPMorgan Chase & Co. | | | 1.3 | |
Amazon.com, Inc. | | | 1.1 | |
Facebook, Inc., Cl. A | | | 1.0 | |
Exxon Mobil Corp. | | | 0.9 | |
Walmart, Inc. | | | 0.8 | |
Apple, Inc. | | | 0.8 | |
Mastercard, Inc., Cl. A | | | 0.7 | |
Johnson & Johnson | | | 0.7 | |
Verizon Communications, Inc. | | | 0.7 | |
Portfolio holdings and allocations are subject to change. Percentages are as of June 30, 2019, and are based on net assets.
PORTFOLIO ALLOCATION
| | | | |
Common Stocks | | | 31.7 | % |
| Mortgage-Backed Obligations | | | | |
Government Agency | | | 21.5 | |
Non-Agency | | | 7.5 | |
Non-Convertible Corporate Bonds and Notes | | | 28.1 | |
Asset-Backed Securities | | | 8.7 | |
Investment Company | | | 2.5 | |
Portfolio holdings and allocations are subject to change. Percentages are as of June 30, 2019, and are based on the total market value of investments.
1. Michael Hyman was named Portfolio Manager of the Fund effective July 3, 2019.
For more current Fund holdings, please visit invesco.com.
3 INVESCO OPPENHEIMER V.I. CONSERVATIVE BALANCED FUND
*Effective after the close of business on May 24, 2019, the Non-Service and Service share classes of the predecessor fund were reorganized into Series I and Series II Shares, respectively, of the Fund. Returns shown for Series I and Series II shares are blended returns of the predecessor fund and the Fund. Share class returns will differ from those of the predecessor fund because of different expenses.
Before investing, investors should carefully read the prospectus and/or summary prospectus and carefully consider the investment objectives, risks, charges and expenses. For this and more complete information about the fund(s), investors should ask their advisors for a prospectus/summary prospectus or visit invesco.com/fundprospectus.
Shares of Invesco funds are not deposits or obligations of any bank, are not guaranteed by any bank, are not insured by the FDIC or any other agency, and involve investment risks, including the possible loss of the principal amount invested.
4 INVESCO OPPENHEIMER V.I. CONSERVATIVE BALANCED FUND
Fund Expenses
Fund Expenses.As a shareholder of the Fund, you incur two types of costs: (1) transaction costs and (2) ongoing costs, including management fees; distribution and service fees; and other Fund expenses. These examples are intended to help you understand your ongoing costs (in dollars) of investing in the Fund and to compare these costs with the ongoing costs of investing in other mutual funds.
The examples are based on an investment of $1,000.00 invested at the beginning of the period and held for the entire 6-month period ended June 30, 2019.
Actual Expenses. The first section of the table provides information about actual account values and actual expenses. You may use the information in this section for the class of shares you hold, together with the amount you invested, to estimate the expense that you paid over the period. Simply divide your account value by $1,000.00 (for example, an $8,600.00 account value divided by $1,000.00 = 8.60), then multiply the result by the number in the first section under the heading entitled “Expenses Paid During 6 Months Ended June 30, 2019” to estimate the expenses you paid on your account during this period.
Hypothetical Example for Comparison Purposes.
The second section of the table provides information about hypothetical account values and hypothetical expenses based on the Fund’s actual expense ratio for each class of shares, and an assumed rate of return of 5% per year for each class before expenses, which is not the actual return. The hypothetical account values and expenses may not be used to estimate the actual ending account balance or expenses you paid for the period. You may use this information to compare the ongoing costs of investing in the Fund and other funds. To do so, compare this 5% hypothetical example for the class of shares you hold with the 5% hypothetical examples that appear in the shareholder reports of the other funds.
Please note that the expenses shown in the table are meant to highlight your ongoing costs only and do not reflect any charges associated with the separate accounts that offer this Fund. Therefore, the “hypothetical” lines of the table are useful in comparing ongoing costs only, and will not help you determine the relative total costs of owning different funds. In addition, if these separate account charges were included your costs would have been higher.
| | | | | | | | | | | | | | | |
| Actual | | Beginning
Account Value
January 1, 2019 | | Ending
Account
Value
June 30, 2019 | | Expenses Paid During 6 Months Ended
June 30, 2019 |
| Series I shares | | | $ | 1,000.00 | | | | $ | 1,119.70 | | | | $ | 3.53 | |
| Series II shares | | | | 1,000.00 | | | | | 1,118.20 | | | | | 4.84 | |
| | | |
Hypothetical (5% return before expenses) | | | | | | | | | | | | | | | |
| Series I shares | | | | 1,000.00 | | | | | 1,021.47 | | | | | 3.36 | |
| Series II shares | | | | 1,000.00 | | | | | 1,020.23 | | | | | 4.62 | |
Expenses are equal to the Fund’s annualized expense ratio for that class, multiplied by the average account value over the period, multiplied by 181/365 (to reflect the one-half year period). Those annualized expense ratios, excluding indirect expenses from affiliated funds, based on the 6-month period ended June 30, 2019 are as follows:
| | | | |
| Class | | Expense Ratios |
| Series I shares | | | 0.67 | % |
| Series II shares | | | 0.92 | |
The expense ratios reflect voluntary and/or contractual waivers and/or reimbursements of expenses by the Fund’s Manager. Some of these undertakings may be modified or terminated at any time, as indicated in the Fund’s prospectus. The “Financial Highlights” tables in the Fund’s financial statements, included in this report, also show the gross expense ratios, without such waivers or reimbursements and reduction to custodian expenses, if applicable.
5 INVESCO OPPENHEIMER V.I. CONSERVATIVE BALANCED FUND
STATEMENT OF INVESTMENTSJune 30, 2019 Unaudited
| | | | | | | | |
| | | Shares | | | Value |
| Common Stocks—34.7% | | | | | |
| Consumer Discretionary—5.8% | | | | | |
| Auto Components—0.1% | | | | | |
| Visteon Corp.1 | | | 4,230 | | | $ | 247,793 | |
| | | | | | | | | |
| Entertainment—0.8% | | | | | | | | |
| Netflix, Inc.1 | | | 2,590 | | | | 951,359 | |
| Zynga, Inc., Cl. A1 | | | 106,890 | | | | 655,235 | |
| | | | | | | 1,606,594 | |
| | | | | | | | | |
| Hotels, Restaurants & Leisure—0.7% | | | | | | | | |
| Cedar Fair LP2 | | | 5,485 | | | | 261,580 | |
| McDonald’s Corp. | | | 5,300 | | | | 1,100,598 | |
| | | | | | | 1,362,178 | |
| | | | | | | | | |
| Interactive Media & Services—1.3% | | | | | | | | |
| Facebook, Inc., Cl. A1 | | | 10,090 | | | | 1,947,370 | |
| Snap, Inc., Cl. A1 | | | 33,890 | | | | 484,627 | |
| | | | | | | 2,431,997 | |
| | | | | | | | | |
| Internet & Catalog Retail—1.1% | | | | | | | | |
| Amazon.com, Inc.1 | | | 1,090 | | | | 2,064,057 | |
| | | | | | | | | |
| Specialty Retail—1.4% | | | | | | | | |
| Burlington Stores, Inc.1 | | | 4,490 | | | | 763,973 | |
| CarMax, Inc.1 | | | 9,070 | | | | 787,548 | |
| Home Depot, Inc. (The) | | | 5,770 | | | | 1,199,987 | |
| | | | | | | 2,751,508 | |
| | | | | | | | | |
| Textiles, Apparel & Luxury Goods—0.4% | | | | | | | | |
| NIKE, Inc., Cl. B | | | 8,910 | | | | 747,995 | |
| | | | | | | | | |
| Consumer Staples—1.9% | | | | | | | | |
| Beverages—0.6% | | | | | | | | |
| Coca-Cola Co. (The) | | | 21,420 | | | | 1,090,706 | |
| | | | | | | | | |
| Food & Staples Retailing—0.8% | | | | | | | | |
| Walmart, Inc. | | | 14,850 | | | | 1,640,776 | |
| | | | | | | | | |
| Food Products—0.4% | | | | | | | | |
| Conagra Brands, Inc. | | | 30,630 | | | | 812,308 | |
| | | | | | | | | |
| Tobacco—0.1% | | | | | | | | |
| Philip Morris International, Inc. | | | 2,030 | | | | 159,416 | |
| | | | | | | | | |
| Energy—1.8% | | | | | | | | |
| Energy Equipment & Services—0.3% | | | | | | | | |
| Schlumberger Ltd. | | | 15,410 | | | | 612,393 | |
| | | | | | | | | |
| Oil, Gas & Consumable Fuels—1.5% | | | | | | | | |
| EQT Corp. | | | 37,169 | | | | 587,642 | |
| Exxon Mobil Corp. | | | 21,820 | | | | 1,672,067 | |
| Shell Midstream Partners LP2 | | | 29,695 | | | | 615,280 | |
| | | | | | | 2,874,989 | |
| | | | | | | | | |
| Financials—6.4% | | | | | | | | |
| Capital Markets—0.6% | | | | | | | | |
| Intercontinental Exchange, Inc. | | | 12,900 | | | | 1,108,626 | |
| | | | | | | | | |
| Commercial Banks—3.1% | | | | | | | | |
| Citigroup, Inc. | | | 11,360 | | | | 795,541 | |
| East West Bancorp, Inc. | | | 21,220 | | | | 992,459 | |
| IBERIABANK Corp. | | | 7,010 | | | | 531,709 | |
| JPMorgan Chase & Co. | | | 21,510 | | | | 2,404,818 | |
| Signature Bank (New York) | | | 2,860 | | | | 345,602 | |
| SVB Financial Group1 | | | 3,730 | | | | 837,721 | |
| | | | | | | 5,907,850 | |
| | | | | | | | | |
| Insurance—1.5% | | | | | | | | |
| American International Group, Inc. | | | 17,710 | | | | 943,589 | |
| Arthur J. Gallagher & Co. | | | 4,190 | | | | 367,002 | |
| Fidelity National Financial, Inc. | | | 17,030 | | | | 686,309 | |
| Progressive Corp. (The) | | | 12,480 | | | | 997,526 | |
| | | | | | | 2,994,426 | |
| | | | | | | | | |
| Real Estate Investment Trusts (REITs)—1.2% | |
| EPR Properties | | | 8,940 | | | | 666,835 | |
| | | | | | | | |
| | | Shares | | | Value |
| Real Estate Investment Trusts (REITs) (Continued) | |
| Mid-America Apartment Communities, Inc. | | | 3,390 | | | $ | 399,206 | |
| Prologis, Inc. | | | 15,367 | | | | 1,230,897 | |
| | | | | | | 2,296,938 | |
| | | | | | | | | |
| Health Care—4.6% | | | | | | | | |
| Biotechnology—0.6% | | | | | | | | |
| BioMarin Pharmaceutical, Inc.1 | | | 3,030 | | | | 259,520 | |
| uniQure NV1 | | | 5,100 | | | | 398,565 | |
| Vertex Pharmaceuticals, Inc.1 | | | 2,790 | | | | 511,630 | |
| | | | | | | 1,169,715 | |
| | | | | | | | | |
| Health Care Equipment & Supplies—1.4% | |
| Becton Dickinson & Co. | | | 2,550 | | | | 642,626 | |
| Boston Scientific Corp.1 | | | 15,750 | | | | 676,935 | |
| CryoPort, Inc.1 | | | 16,840 | | | | 308,509 | |
| Intuitive Surgical, Inc.1 | | | 1,380 | | | | 723,879 | |
| Zimmer Biomet Holdings, Inc. | | | 2,610 | | | | 307,301 | |
| | | | | | | 2,659,250 | |
| | | | | | | | | |
| Health Care Providers & Services—0.5% | | | | | | | | |
| Anthem, Inc. | | | 3,110 | | | | 877,673 | |
| | | | | | | | | |
| Health Care Technology—0.2% | | | | | | | | |
| Teladoc Health, Inc.1 | | | 5,340 | | | | 354,629 | |
| | | | | | | | | |
| Life Sciences Tools & Services—0.3% | | | | | |
| Agilent Technologies, Inc. | | | 7,850 | | | | 586,160 | |
| | | | | | | | | |
| Pharmaceuticals—1.6% | | | | | | | | |
| Bayer AG, Sponsored ADR | | | 27,990 | | | | 488,425 | |
| Johnson & Johnson | | | 10,160 | | | | 1,415,085 | |
| Merck & Co., Inc. | | | 14,100 | | | | 1,182,285 | |
| TherapeuticsMD, Inc.1 | | | 30,050 | | | | 78,130 | |
| | | | | | | 3,163,925 | |
| | | | | | | | | |
| Industrials—3.5% | | | | | | | | |
| Aerospace & Defense—1.0% | | | | | | | | |
| Boeing Co. (The) | | | 1,830 | | | | 666,138 | |
| Lockheed Martin Corp. | | | 2,250 | | | | 817,965 | |
| Spirit AeroSystems Holdings, Inc., Cl. A | | | 6,610 | | | | 537,856 | |
| | | | | | | 2,021,959 | |
| | | | | | | | | |
| Airlines—0.3% | | | | | | | | |
| Spirit Airlines, Inc.1 | | | 10,570 | | | | 504,506 | |
| | | | | | | | | |
| Building Products—0.2% | | | | | | | | |
| Masco Corp. | | | 11,590 | | | | 454,792 | |
| | | | | | | | | |
| Commercial Services & Supplies—0.5% | | | | | |
| ACCO Brands Corp. | | | 35,660 | | | | 280,644 | |
| IAA, Inc.1 | | | 7,380 | | | | 286,196 | |
| Waste Connections, Inc. | | | 4,810 | | | | 459,740 | |
| | | | | | | 1,026,580 | |
| | | | | | | | | |
| Machinery—0.5% | | | | | | | | |
| Illinois Tool Works, Inc. | | | 3,180 | | | | 479,576 | |
| Stanley Black & Decker, Inc. | | | 3,200 | | | | 462,752 | |
| | | | | | | 942,328 | |
| | | | | | | | | |
| Professional Services—0.3% | | | | | | | | |
| Korn Ferry | | | 12,820 | | | | 513,697 | |
| | | | | | | | | |
| Road & Rail—0.4% | | | | | | | | |
| Canadian Pacific Railway Ltd. | | | 3,140 | | | | 738,654 | |
| | | | | | | | | |
| Trading Companies & Distributors—0.3% | |
| Fastenal Co. | | | 16,040 | | | | 522,744 | |
| | | | | | | | | |
| Information Technology—7.7% | | | | | | | | |
| Communications Equipment—0.6% | | | | | |
| Motorola Solutions, Inc. | | | 7,180 | | | | 1,197,122 | |
| | | | | | | | | |
| IT Services—1.8% | | | | | | | | |
| Accenture plc, Cl. A | | | 3,830 | | | | 707,669 | |
| DXC Technology Co. | | | 5,930 | | | | 327,040 | |
| First Data Corp., Cl. A1 | | | 20,730 | | | | 561,161 | |
6 INVESCO OPPENHEIMER V.I. CONSERVATIVE BALANCED FUND
| | | | | | | | |
| | | Shares | | | Value |
| IT Services (Continued) | | | | | | | | |
| Mastercard, Inc., Cl. A | | | 5,440 | | | $ | 1,439,043 | |
| Perspecta, Inc. | | | 16,597 | | | | 388,536 | |
| | | | | | | 3,423,449 | |
| | | | | | | | | |
| Semiconductors & Semiconductor Equipment—1.7% | |
| Applied Materials, Inc. | | | 18,890 | | | | 848,350 | |
| NVIDIA Corp. | | | 6,370 | | | | 1,046,145 | |
| QUALCOMM, Inc. | | | 8,550 | | | | 650,398 | |
| Texas Instruments, Inc. | | | 5,860 | | | | 672,494 | |
| | | | | | | 3,217,387 | |
| | | | | | | | | |
| Software—2.6% | | | | | | | | |
| Microsoft Corp. | | | 23,140 | | | | 3,099,834 | |
| Palo Alto Networks, Inc.1 | | | 1,940 | | | | 395,294 | |
| Q2 Holdings, Inc.1 | | | 4,970 | | | | 379,509 | |
| salesforce.com, Inc.1 | | | 4,120 | | | | 625,128 | |
| ServiceNow, Inc.1 | | | 2,110 | | | | 579,343 | |
| | | | | | | 5,079,108 | |
| | | | | | | | | |
| Technology Hardware, Storage & Peripherals—1.0% | |
| Apple, Inc. | | | 7,610 | | | | 1,506,171 | |
| Western Digital Corp. | | | 8,760 | | | | 416,538 | |
| | | | | | | 1,922,709 | |
| | | | | | | | | |
| Materials—0.7% | | | | | | | | |
| Chemicals—0.4% | | | | | | | | |
| Corteva, Inc.1 | | | 13,796 | | | | 407,948 | |
| Valvoline, Inc. | | | 18,870 | | | | 368,531 | |
| | | | | | | 776,479 | |
| | | | | | | | | |
| Metals & Mining—0.3% | | | | | | | | |
| Compass Minerals International, Inc. | | | 10,780 | | | | 592,361 | |
| | | | | | | | | |
| Telecommunication Services—1.0% | | | | | |
| Diversified Telecommunication Services—0.7% | |
| ORBCOMM, Inc.1 | | | 375 | | | | 2,718 | |
| Verizon Communications, Inc. | | | 23,060 | | | | 1,317,418 | |
| | | | | | | 1,320,136 | |
| | | | | | | | | |
| Wireless Telecommunication Services—0.3% | | | | | |
| T-Mobile US, Inc.1 | | | 8,070 | | | | 598,310 | |
| | | | | | | | | |
| Utilities—1.3% | | | | | | | | |
| Electric Utilities—0.3% | | | | | | | | |
| Duke Energy Corp. | | | 6,220 | | | | 548,853 | |
| | | | | | | | | |
| Gas Utilities—0.3% | | | | | | | | |
| Suburban Propane Partners LP2 | | | 22,085 | | | | 536,445 | |
| | | | | | | | | |
| Multi-Utilities—0.4% | | | | | | | | |
| Dominion Energy, Inc. | | | 11,260 | | | | 870,623 | |
| | | | | | | | | |
| Water Utilities—0.3% | | | | | | | | |
| Aqua America, Inc. | | | 16,050 | | | | 663,988 | |
| Total Common Stocks (Cost $55,392,355) | | | | 66,994,132 | |
| | |
| | | Principal
Amount | | | |
| Asset-Backed Securities—9.5% | | | | | |
| American Credit Acceptance Receivables Trust: | |
| Series 2017-4, Cl. B, 2.61%, 5/10/213 | | $ | 2,910 | | | | 2,910 | |
| Series 2017-4, Cl. C, 2.94%, 1/10/243 | | | 195,000 | | | | 195,285 | |
| Series 2017-4, Cl. D, 3.57%, 1/10/243 | | | 246,000 | | | | 248,520 | |
| Series 2018-2, Cl. C, 3.70%, 7/10/243 | | | 275,000 | | | | 277,909 | |
| Series 2018-3, Cl. B, 3.49%, 6/13/223 | | | 80,000 | | | | 80,390 | |
| Series 2018-3, Cl. D, 4.14%, 10/15/243 | | | 25,000 | | | | 25,631 | |
| Series 2018-4, Cl. C, 3.97%, 1/13/253 | | | 180,000 | | | | 183,685 | |
| Series 2019-2, Cl. D, 3.41%, 6/12/253 | | | 140,000 | | | | 141,094 | |
| AmeriCredit Automobile Receivables Trust: | |
| Series 2017-2, Cl. D, 3.42%, 4/18/23 | | | 320,000 | | | | 325,273 | |
| Series 2017-4, Cl. D, 3.08%, 12/18/23 | | | 205,000 | | | | 208,031 | |
| Series 2018-3, Cl. C, 3.74%, 10/18/24 | | | 260,000 | | | | 269,089 | |
| Series 2019-2, Cl. C, 2.74%, 4/18/25 | | | 100,000 | | | | 100,616 | |
| Series 2019-2, Cl. D, 2.99%, 6/18/25 | | | 225,000 | | | | 226,435 | |
| | | | | | | | |
| | | Principal
Amount | | | Value |
| Asset-Backed Securities (Continued) | | | | | |
| Ameriquest Mortgage Securities, Inc. Asset-Backed Pass-Through Certificates, Series 2005-R5, Cl. M2, 3.094% [US0001M+69], 7/25/354 | | $ | 55,538 | | | $ | 55,747 | |
| Capital Auto Receivables Asset Trust: | | | | | | | | |
| Series 2017-1, Cl. D, 3.15%, 2/20/253 | | | 40,000 | | | | 40,208 | |
| Series 2018-2, Cl. B, 3.48%, 10/20/233 | | | 125,000 | | | | 126,828 | |
| Series 2018-2, Cl. C, 3.69%, 12/20/233 | | | 120,000 | | | | 121,915 | |
| CarMax Auto Owner Trust: | | | | | | | | |
| Series 2015-2, Cl. D, 3.04%, 11/15/21 | | | 115,000 | | | | 115,001 | |
| Series 2015-3, Cl. D, 3.27%, 3/15/22 | | | 330,000 | | | | 330,706 | |
| Series 2016-1, Cl. D, 3.11%, 8/15/22 | | | 220,000 | | | | 220,417 | |
| Series 2017-1, Cl. D, 3.43%, 7/17/23 | | | 245,000 | | | | 247,534 | |
| Series 2017-4, Cl. D, 3.30%, 5/15/24 | | | 110,000 | | | | 111,252 | |
| Series 2018-1, Cl. D, 3.37%, 7/15/24 | | | 75,000 | | | | 76,068 | |
| Series 2018-4, Cl. C, 3.85%, 7/15/24 | | | 90,000 | | | | 93,881 | |
| CCG Receivables Trust: | | | | | | | | |
| Series 2017-1, Cl. B, 2.75%, 11/14/233 | | | 250,000 | | | | 250,489 | |
| Series 2018-1, Cl. B, 3.09%, 6/16/253 | | | 90,000 | | | | 91,000 | |
| Series 2018-1, Cl. C, 3.42%, 6/16/253 | | | 25,000 | | | | 25,367 | |
| Series 2018-2, Cl. C, 3.87%, 12/15/253 | | | 60,000 | | | | 61,884 | |
| Series 2019-1, Cl. B, 3.22%, 9/14/263 | | | 170,000 | | | | 173,386 | |
| Series 2019-1, Cl. C, 3.57%, 9/14/263 | | | 40,000 | | | | 40,810 | |
| CIG Auto Receivables Trust, Series 2017-1A, Cl. A, 2.71%, 5/15/233 | | | 38,603 | | | | 38,581 | |
| CNH Equipment Trust: | | | | | | | | |
| Series 2017-C, Cl. B, 2.54%, 5/15/25 | | | 70,000 | | | | 70,487 | |
| Series 2019-A, Cl. A4, 3.22%, 1/15/26 | | | 120,000 | | | | 124,299 | |
| CPS Auto Receivables Trust: | | | | | | | | |
| Series 2018-A, Cl. B, 2.77%, 4/18/223 | | | 145,000 | | | | 145,112 | |
| Series 2018-B, Cl. B, 3.23%, 7/15/223 | | | 155,000 | | | | 155,894 | |
| CPS Auto Trust, Series 2017-A, Cl. B, 2.68%, 5/17/213 | | | 16,935 | | | | 16,934 | |
| Credit Acceptance Auto Loan Trust: | |
| Series 2017-3A, Cl. C, 3.48%, | | | | | | | | |
| 10/15/263 | | | 220,000 | | | | 222,406 | |
| Series 2018-1A, Cl. B, 3.60%, 4/15/273 | | | 170,000 | | | | 173,263 | |
| Series 2018-1A, Cl. C, 3.77%, 6/15/273 | | | 190,000 | | | | 193,111 | |
| Series 2018-2A, Cl. C, 4.16%, 9/15/273 | | | 160,000 | | | | 166,349 | |
| Series 2018-3A, Cl. C, 4.04%, | | | | | | | | |
| 12/15/273 | | | 220,000 | | | | 226,547 | |
| Series 2019-1A, Cl. B, 3.75%, 4/17/283 | | | 100,000 | | | | 102,921 | |
| Series 2019-1A, Cl. C, 3.94%, 6/15/283 | | | 105,000 | | | | 108,280 | |
| Dell Equipment Finance Trust: | | | | | | | | |
| Series 2017-2, Cl. B, 2.47%, 10/24/223 | | | 75,000 | | | | 74,863 | |
| Series 2018-1, Cl. B, 3.34%, 6/22/233 | | | 90,000 | | | | 91,537 | |
| Series 2019-1, Cl. C, 3.14%, 3/22/243 | | | 330,000 | | | | 335,348 | |
| Drive Auto Receivables Trust: | | | | | |
| Series 2016-CA, Cl. D, 4.18%, 3/15/243 | | | 170,000 | | | | 172,698 | |
| Series 2017-1, Cl. D, 3.84%, 3/15/23 | | | 225,000 | | | | 227,761 | |
| Series 2018-1, Cl. D, 3.81%, 5/15/24 | | | 160,000 | | | | 162,873 | |
| Series 2018-2, Cl. D, 4.14%, 8/15/24 | | | 315,000 | | | | 322,740 | |
| Series 2018-3, Cl. D, 4.30%, 9/16/24 | | | 215,000 | | | | 221,715 | |
| Series 2018-5, Cl. C, 3.99%, 1/15/25 | | | 210,000 | | | | 216,298 | |
| Series 2019-1, Cl. C, 3.78%, 4/15/25 | | | 340,000 | | | | 346,967 | |
| Series 2019-3, Cl. D, 3.18%, 10/15/26 | | | 145,000 | | | | 146,009 | |
| DT Auto Owner Trust: | | | | | | | | |
| Series 2016-4A, Cl. E, 6.49%, 9/15/233 | | | 75,000 | | | | 78,063 | |
| Series 2017-1A, Cl. D, 3.55%, 11/15/223 | | | 150,000 | | | | 150,924 | |
| Series 2017-2A, Cl. D, 3.89%, 1/15/233 | | | 180,000 | | | | 181,369 | |
| Series 2017-3A, Cl. D, 3.58%, 5/15/233 | | | 75,000 | | | | 75,772 | |
| Series 2017-3A, Cl. E, 5.60%, 8/15/243 | | | 195,000 | | | | 203,875 | |
| Series 2017-4A, Cl. D, 3.47%, 7/17/233 | | | 205,000 | | | | 206,561 | |
| Series 2017-4A, Cl. E, 5.15%, 11/15/243 | | | 225,000 | | | | 233,563 | |
| Series 2018-3A, Cl. B, 3.56%, 9/15/223 | | | 270,000 | | | | 273,445 | |
| Series 2018-3A, Cl. C, 3.79%, 7/15/243 | | | 105,000 | | | | 107,140 | |
7 INVESCO OPPENHEIMER V.I. CONSERVATIVE BALANCED FUND
STATEMENT OF INVESTMENTSUnaudited / Continued
| | | | | | | | |
| | | Principal
Amount | | | Value |
| Asset-Backed Securities (Continued) | | | | | |
| DT Auto Owner Trust: (Continued) | |
| Series 2019-2A, Cl. D, 3.48%, 2/18/253 | | $ | 130,000 | | | $ | 132,525 | |
| Element Rail Leasing I LLC, Series 2014-1A, Cl. A1, 2.299%, 4/19/443 | | | 98,826 | | | | 99,005 | |
| Exeter Automobile Receivables Trust: | |
| Series 2018-1A, Cl. B, 2.75%, 4/15/223 | | | 151,164 | | | | 151,265 | |
| Series 2018-4A, Cl. B, 3.64%, 11/15/223 | | | 220,000 | | | | 222,632 | |
| Series 2019-1A, Cl. D, 4.13%, 12/16/243 | | | 190,000 | | | | 196,625 | |
| Series 2019-2A, Cl. C, 3.30%, 3/15/243 | | | 322,000 | | | | 327,634 | |
| Flagship Credit Auto Trust, Series 2016-1, Cl. C, 6.22%, 6/15/223 | | | 380,000 | | | | 393,357 | |
| GE Capital Credit Card Master Note Trust, Series 2012-7, Cl. B, 2.21%, 9/15/22 | | | 200,000 | | | | 199,761 | |
| GLS Auto Receivables Trust, Series 2018-1A, Cl. A, 2.82%, 7/15/225 | | | 170,286 | | | | 170,540 | |
| GM Financial Automobile Leasing Trust: | |
| Series 2017-3, Cl. C, 2.73%, 9/20/21 | | | 120,000 | | | | 120,075 | |
| Series 2018-2, Cl. C, 3.50%, 4/20/22 | | | 145,000 | | | | 146,717 | |
| GMF Floorplan Owner Revolving Trust: | |
| Series 2018-3, Cl. B, 3.49%, 9/15/223 | | | 250,000 | | | | 253,537 | |
| Series 2018-3, Cl. C, 3.68%, 9/15/223 | | | 210,000 | | | | 213,031 | |
| Series 2018-4, Cl. B, 3.68%, 9/15/233 | | | 210,000 | | | | 215,383 | |
| Series 2018-4, Cl. C, 3.88%, 9/15/233 | | | 265,000 | | | | 271,801 | |
| Navistar Financial Dealer Note Master Owner Trust II: | |
| Series 2018-1, Cl. A, 3.034% [US0001M+63], 9/25/233,4 | | | 115,000 | | | | 115,261 | |
| Series 2018-1, Cl. B, 3.204% [US0001M+80], 9/25/233,4 | | | 135,000 | | | | 135,252 | |
| Series 2019-1, Cl. C, 3.363% [US0001M+95], 5/28/243,4 | | | 25,000 | | | | 25,030 | |
| Series 2019-1, Cl. D, 3.863% [US0001M+145], 5/28/243,4 | | | 25,000 | | | | 25,026 | |
| Santander Drive Auto Receivables Trust: | |
| Series 2017-1, Cl. E, 5.05%, 7/15/243 | | | 410,000 | | | | 420,396 | |
| Series 2017-3, Cl. D, 3.20%, 11/15/23 | | | 295,000 | | | | 298,203 | |
| Series 2018-1, Cl. D, 3.32%, 3/15/24 | | | 110,000 | | | | 111,640 | |
| Series 2018-2, Cl. D, 3.88%, 2/15/24 | | | 170,000 | | | | 174,264 | |
| Series 2018-5, Cl. C, 3.81%, 12/16/24 | | | 225,000 | | | | 229,750 | |
| Series 2019-2, Cl. D, 3.22%, 7/15/25 | | | 195,000 | | | | 197,878 | |
| Santander Retail Auto Lease Trust, Series 2019-A, Cl. C, 3.30%, 5/22/233 | | | 320,000 | | | | 323,578 | |
| TCF Auto Receivables Owner Trust, Series 2015-1A, Cl. D, 3.53%, 3/15/223 | | | 190,000 | | | | 190,016 | |
| United Auto Credit Securitization Trust: | |
| Series 2018-1, Cl. C, 3.05%, 9/10/213 | | | 285,000 | | | | 285,214 | |
| Series 2019-1, Cl. C, 3.16%, 8/12/243 | | | 150,000 | | | | 151,166 | |
| Veros Automobile Receivables Trust, Series 2017-1, Cl. A, 2.84%, 4/17/233 | | | 18,872 | | | | 18,861 | |
| Westlake Automobile Receivables Trust: | |
| Series 2017-2A, Cl. E, 4.63%, 7/15/243 | | | 320,000 | | | | 327,631 | |
| Series 2018-1A, Cl. D, 3.41%, 5/15/233 | | | 315,000 | | | | 317,418 | |
| Series 2018-3A, Cl. B, 3.32%, 10/16/233 | | | 252,000 | | | | 254,410 | |
| World Financial Network Credit Card Master Trust: | |
| Series 2018-A, Cl. A, 3.07%, 12/16/24 | | | 540,000 | | | | 547,417 | |
| Series 2018-B, Cl. A, 3.46%, 7/15/25 | | | 245,000 | | | | 251,946 | |
| Series 2018-C, Cl. A, 3.55%, 8/15/25 | | | 490,000 | | | | 505,264 | |
| Series 2019-A, Cl. A, 3.14%, 12/15/25 | | | 75,000 | | | | 76,969 | |
| Series 2019-B, Cl. A, 2.49%, 4/15/26 | | | 260,000 | | | | 260,025 | |
| Total Asset-Backed Securities (Cost $18,124,244) | | | | | | | 18,397,569 | |
| | | | | | | | |
| | | Principal
Amount | | | Value |
| Mortgage-Backed Obligations—31.8% | | | | | |
| Government Agency—23.6% | | | | | | | | |
| FHLMC/FNMA/FHLB/Sponsored—21.1% | | | | | |
| Federal Home Loan Mortgage Corp., Series 2018-HQA2, Cl. M1, 3.154% [US0001M+75], 10/25/483,4 | | $ | 395,000 | | | $ | 395,631 | |
| Federal Home Loan Mortgage Corp. Gold Pool: | |
| 5.00%, 12/1/34 | | | 1,754 | | | | 1,898 | |
| 5.50%, 9/1/39 | | | 193,943 | | | | 209,447 | |
| 6.50%, 7/1/28-4/1/34 | | | 15,611 | | | | 17,337 | |
| 7.00%, 10/1/31-10/1/37 | | | 52,796 | | | | 60,612 | |
| 9.00%, 8/1/22-5/1/25 | | | 748 | | | | 804 | |
| Federal Home Loan Mortgage Corp., Interest-Only Stripped Mtg.-Backed Security: | |
| Series 183,Cl. IO, 98.133%, 4/1/276 | | | 38,681 | | | | 7,866 | |
| Series 192,Cl. IO, 99.999%, 2/1/286 | | | 10,427 | | | | 1,954 | |
| Series 243,Cl. 6, 6.942%, 12/15/326 | | | 30,210 | | | | 5,513 | |
| Series 304,Cl. C31, 9.152%, 12/15/276 | | | 147,548 | | | | 11,651 | |
| Series 304,Cl. C45, 6.694%, 12/15/276 | | | 72,884 | | | | 5,689 | |
| Series 304,Cl. C47, 5.019%, 12/15/276 | | | 67,630 | | | | 5,601 | |
| Federal Home Loan Mortgage Corp., Mtg.-Linked Amortizing Global Debt Securities, Series 2012-1, Cl. A10, 2.06%, 1/15/22 | | | 108,490 | | | | 108,594 | |
| Federal Home Loan Mortgage Corp., Multifamily Structured Pass Through Certificates, Interest-Only Stripped Mtg.-Backed Security, Series K093, Cl. X1, 0.00%, 5/25/296,7 | | | 1,655,000 | | | | 131,703 | |
| Federal Home Loan Mortgage Corp., Multifamily Structured Pass-Through Certificates, Interest-Only Stripped Mtg.-Backed Security: | |
| Series K734,Cl. X1, 0.00%, 2/25/266,7 | | | 2,069,706 | | | | 78,098 | |
| Series KC02,Cl. X1, 0.00%, 3/25/246,7 | | | 4,862,824 | | | | 80,479 | |
| Series KC03,Cl. X1, 0.00%, 11/25/246,7 | | | 2,715,000 | | | | 67,712 | |
| Federal Home Loan Mortgage Corp., Principal-Only Stripped Mtg.-Backed Security, Series 176, Cl. PO, 4.198%, 6/1/268 | | | 11,260 | | | | 10,493 | |
| Federal Home Loan Mortgage Corp., Real Estate Mtg. Investment Conduit Multiclass Pass-Through Certificates: | |
| Series 2427,Cl. ZM, 6.50%, 3/15/32 | | | 71,070 | | | | 79,253 | |
| Series 2461,Cl. PZ, 6.50%, 6/15/32 | | | 27,787 | | | | 31,114 | |
| Series 2626,Cl. TB, 5.00%, 6/15/33 | | | 40,141 | | | | 42,191 | |
| Series 2635,Cl. AG, 3.50%, 5/15/32 | | | 23,153 | | | | 23,849 | |
| Series 3010,Cl. WB, 4.50%, 7/15/20 | | | 1,534 | | | | 1,536 | |
| Series 3025,Cl. SJ, 15.971% [-3.667 x LIBOR01M+2,475], 8/15/354 | | | 10,393 | | | | 15,474 | |
| Series 3030,Cl. FL, 2.794% [LIBOR01M+40], 9/15/354 | | | 54,800 | | | | 54,830 | |
| Series 3822,Cl. JA, 5.00%, 6/15/40 | | | 13,418 | | | | 13,595 | |
| Series 3848,Cl. WL, 4.00%, 4/15/40 | | | 46,458 | | | | 47,246 | |
| Series 3857,Cl. GL, 3.00%, 5/15/40 | | | 3,236 | | | | 3,325 | |
| Series 4221,Cl. HJ, 1.50%, 7/15/23 | | | 291,079 | | | | 288,257 | |
| Federal Home Loan Mortgage Corp., Real Estate Mtg. Investment Conduit Multiclass Pass-Through Certificates, Interest-Only Stripped Mtg.-Backed Security: | |
| Series 2130,Cl. SC, 61.959%, 3/15/296 | | | 27,750 | | | | 3,911 | |
| Series 2796,Cl. SD, 48.626%, 7/15/266 | | | 49,899 | | | | 6,068 | |
| Series 2920,Cl. S, 13.664%, 1/15/356 | | | 291,252 | | | | 49,807 | |
| Series 2922,Cl. SE, 16.685%, 2/15/356 | | | 16,653 | | | | 2,730 | |
| Series 2981,Cl. AS, 1.216%, 5/15/356 | | | 142,196 | | | | 20,730 | |
| Series 3397,Cl. GS, 0.00%, 12/15/376,7 | | | 18,342 | | | | 3,837 | |
| Series 3424,Cl. EI, 0.00%, 4/15/386,7 | | | 6,797 | | | | 675 | |
| Series 3450,Cl. BI, 9.10%, 5/15/386 | | | 51,627 | | | | 8,491 | |
| Series 3606,Cl. SN, 12.926%, 12/15/396 | | | 26,728 | | | | 4,266 | |
| Series 4057,Cl. QI, 5.421%, 6/15/276 | | | 477,991 | | | | 34,772 | |
| Series 4146,Cl. AI, 10.153%, 12/15/276 | | | 188,965 | | | | 14,233 | |
| Series 4205,Cl. AI, 7.078%, 5/15/286 | | | 116,802 | | | | 8,416 | |
| Series 4316,Cl. JS, 0.00%, 1/15/446,7 | | | 191,107 | | | | 28,396 | |
| Series 4818,Cl. BI, 0.00%, 3/15/456,7 | | | 198,397 | | | | 27,400 | |
8 INVESCO OPPENHEIMER V.I. CONSERVATIVE BALANCED FUND
| | | | | | | | |
| | | Principal
Amount | | | Value |
| FHLMC/FNMA/FHLB/Sponsored (Continued) | |
| Federal Home Loan Mortgage Corp., STACR Trust, Series 2019-HRP1, Cl. M2, 3.811% [US0001M+140], 2/25/493,4 | | $ | 60,000 | | | $ | 60,159 | |
| Federal National Mortgage Assn.: | |
| 2.50%, 7/1/349 | | | 1,435,000 | | | | 1,444,417 | |
| 3.00%, 7/1/34-7/1/469 | | | 6,990,000 | | | | 7,060,834 | |
| 3.50%, 7/1/499 | | | 14,065,000 | | | | 14,375,968 | |
| 4.00%, 7/1/499 | | | 7,715,000 | | | | 7,972,518 | |
| 4.50%, 7/1/499 | | | 3,355,000 | | | | 3,506,040 | |
| 5.00%, 7/1/499 | | | 2,385,000 | | | | 2,520,866 | |
| Federal National Mortgage Assn. Pool: | |
| 5.00%, 3/1/21 | | | 121 | | | | 124 | |
| 5.50%, 9/1/20 | | | 408 | | | | 411 | |
| 6.00%, 3/1/37 | | | 88,749 | | | | 100,133 | |
| 7.00%, 10/1/35 | | | 2,997 | | | | 3,000 | |
| 7.50%, 1/1/33 | | | 40,919 | | | | 48,329 | |
| 8.50%, 7/1/32 | | | 1,272 | | | | 1,286 | |
| Federal National Mortgage Assn., Interest-Only Stripped Mtg.-Backed Security: | |
| Series 222,Cl. 2, 99.999%, 6/25/236 | | | 61,333 | | | | 6,112 | |
| Series 233,Cl. 2, 60.126%, 8/25/236 | | | 36,569 | | | | 3,591 | |
| Series 252,Cl. 2, 99.999%, 11/25/236 | | | 52,117 | | | | 5,874 | |
| Series 319,Cl. 2, 25.205%, 2/25/326 | | | 17,672 | | | | 3,717 | |
| Series 320,Cl. 2, 67.405%, 4/25/326 | | | 6,698 | | | | 1,514 | |
| Series 321,Cl. 2, 32.707%, 4/25/326 | | | 65,668 | | | | 14,296 | |
| Series 331,Cl. 9, 15.697%, 2/25/336 | | | 75,613 | | | | 15,331 | |
| Series 334,Cl. 17, 36.694%, 2/25/336 | | | 41,422 | | | | 8,768 | |
| Series 339,Cl. 12, 0.00%, 6/25/336,7 | | | 53,982 | | | | 11,369 | |
| Series 339,Cl. 7, 0.00%, 11/25/336,7 | | | 157,666 | | | | 30,818 | |
| Series 343,Cl. 13, 0.00%, 9/25/336,7 | | | 59,196 | | | | 12,075 | |
| Series 345,Cl. 9, 0.00%, 1/25/346,7 | | | 54,048 | | | | 10,516 | |
| Series 351,Cl. 10, 0.00%, 4/25/346,7 | | | 7,156 | | | | 1,448 | |
| Series 351,Cl. 8, 0.00%, 4/25/346,7 | | | 25,467 | | | | 5,156 | |
| Series 356,Cl. 10, 0.00%, 6/25/356,7 | | | 17,450 | | | | 3,300 | |
| Series 356,Cl. 12, 0.00%, 2/25/356,7 | | | 9,437 | | | | 1,811 | |
| Series 362,Cl. 13, 0.00%, 8/25/356,7 | | | 66,529 | | | | 13,642 | |
| Series 364,Cl. 16, 0.00%, 9/25/356,7 | | | 48,228 | | | | 9,673 | |
| Federal National Mortgage Assn., Real Estate Mtg. Investment Conduit Multiclass Pass-Through Certificates: | |
| Series 1998-61,Cl. PL, 6.00%, 11/25/28 | | | 27,512 | | | | 30,483 | |
| Series 2003-130,Cl. CS, 9.291% [-2 x LIBOR01M+1,410], 12/25/334 | | | 921 | | | | 955 | |
| Series 2005-104,Cl. MC, 5.50%, 12/25/25 | | | 91,932 | | | | 96,044 | |
| Series 2005-31,Cl. PB, 5.50%, 4/25/35 | | | 250,000 | | | | 279,560 | |
| Series 2005-73,Cl. DF, 2.654% [LIBOR01M+25], 8/25/354 | | | 41,296 | | | | 41,251 | |
| Series 2006-11,Cl. PS, 15.751% [-3.667 x LIBOR01M+2,456.67], 3/25/364 | | | 42,900 | | | | 65,475 | |
| Series 2006-46,Cl. SW, 15.384% [-3.667 x LIBOR01M+2,419.92], 6/25/364 | | | 27,709 | | | | 41,312 | |
| Series 2006-50,Cl. KS, 15.384% | | | | | | | | |
| [-3.667 x LIBOR01M+2,420], 6/25/364 | | | 5,424 | | | | 8,096 | |
| Series 2009-113,Cl. DB, 3.00%, 12/25/20 | | | 1,931 | | | | 1,926 | |
| Series 2009-36,Cl. FA, 3.344% [LIBOR01M+94], 6/25/374 | | | 19,484 | | | | 19,972 | |
| Series 2009-70,Cl. TL, 4.00%, 8/25/19 | | | 4 | | | | 4 | |
| Series 2010-43,Cl. KG, 3.00%, 1/25/21 | | | 2,744 | | | | 2,745 | |
| Series 2011-15,Cl. DA, 4.00%, 3/25/41 | | | 11,668 | | | | 12,107 | |
| Series 2011-3,Cl. EL, 3.00%, 5/25/20 | | | 1,090 | | | | 1,087 | |
| Series 2011-3,Cl. KA, 5.00%, 4/25/40 | | | 77,163 | | | | 80,942 | |
| Series 2011-82,Cl. AD, 4.00%, 8/25/26 | | | 14,350 | | | | 14,394 | |
| | | | | | | | |
| | | Principal
Amount | | | Value |
| FHLMC/FNMA/FHLB/Sponsored (Continued) | |
| Federal National Mortgage Assn., Real Estate Mtg. Investment Conduit Multiclass Pass-Through Certificates, Interest-Only Stripped Mtg.-Backed Security: | |
| Series 2001-65,Cl. S, 14.916%, 11/25/316 | | $ | 68,586 | | | $ | 13,198 | |
| Series 2001-81,Cl. S, 19.063%, 1/25/326 | | | 17,528 | | | | 3,283 | |
| Series 2002-47,Cl. NS, 14.079%, 4/25/326 | | | 49,883 | | | | 9,908 | |
| Series 2002-51,Cl. S, 14.337%, 8/25/326 | | | 45,804 | | | | 9,098 | |
| Series 2002-52,Cl. SD, 47.631%, 9/25/326 | | | 71,937 | | | | 14,401 | |
| Series 2002-77,Cl. SH, 25.379%, 12/18/326 | | | 23,870 | | | | 4,252 | |
| Series 2002-84,Cl. SA, 8.642%, 12/25/326 | | | 64,221 | | | | 12,749 | |
| Series 2002-9,Cl. MS, 17.766%, 3/25/326 | | | 18,512 | | | | 3,839 | |
| Series 2003-33,Cl. SP, 11.486%, 5/25/336 | | | 71,317 | | | | 14,279 | |
| Series 2003-4,Cl. S, 5.624%, 2/25/336 | | | 38,242 | | | | 7,845 | |
| Series 2003-46,Cl. IH, 0.00%, 6/25/236,7 | | | 92,584 | | | | 6,961 | |
| Series 2004-54,Cl. DS, 54.899%, 11/25/306 | | | 53,795 | | | | 8,099 | |
| Series 2004-56,Cl. SE, 7.679%, 10/25/336 | | | 13,800 | | | | 2,635 | |
| Series 2005-12,Cl. SC, 21.721%, 3/25/356 | | | 7,740 | | | | 1,210 | |
| Series 2005-14,Cl. SE, 13.084%, 3/25/356 | | | 26,253 | | | | 3,733 | |
| Series 2005-40,Cl. SA, 22.772%, 5/25/356 | | | 142,432 | | | | 24,614 | |
| Series 2005-52,Cl. JH, 23.299%, 5/25/356 | | | 366,283 | | | | 59,699 | |
| Series 2005-93,Cl. SI, 0.501%, 10/25/356 | | | 33,191 | | | | 5,323 | |
| Series 2007-88,Cl. XI, 0.00%, 6/25/376,7 | | | 69,681 | | | | 12,494 | |
| Series 2008-55,Cl. SA, 0.00%, 7/25/386,7 | | | 21,482 | | | | 2,361 | |
| Series 2009-8,Cl. BS, 0.00%, 2/25/246,7 | | | 197 | | | | 11 | |
| Series 2011-96,Cl. SA, 6.105%, 10/25/416 | | | 90,296 | | | | 15,433 | |
| Series 2012-121,Cl. IB, 6.893%, 11/25/276 | | | 201,635 | | | | 15,157 | |
| Series 2012-134,Cl. SA, 0.00%, 12/25/426,7 | | | 354,840 | | | | 67,601 | |
| Series 2012-40,Cl. PI, 22.879%, 4/25/416 | | | 179,806 | | | | 20,091 | |
| Series 2015-57,Cl. LI, 6.199%, 8/25/356 | | | 436,877 | | | | 61,138 | |
| Series 2016-45,Cl. MI, 8.378%, 7/25/466 | | | 126,004 | | | | 27,988 | |
| Series 2017-60,Cl. LI, 0.00%, 8/25/476,7 | | | 250,702 | | | | 29,023 | |
| Series 2017-66,Cl. AS, 0.00%, 9/25/476,7 | | | 1,083,926 | | | | 164,838 | |
| Series 2018-16,Cl. NI, 0.00%, 12/25/446,10 | | | 100,778 | | | | 12,965 | |
| Series 2018-69,Cl. CI, 0.00%, 10/25/466,7 | | | 223,468 | | | | 15,716 | |
9 INVESCO OPPENHEIMER V.I. CONSERVATIVE BALANCED FUND
STATEMENT OF INVESTMENTSUnaudited / Continued
| | | | | | | | |
| | | Principal
Amount | | | Value |
| FHLMC/FNMA/FHLB/Sponsored (Continued) | | | | | |
| Federal National Mortgage Assn., Real Estate Mtg. Investment Conduit Multiclass Pass-Through Certificates, Principal-Only Stripped Mtg.-Backed Security, Series 1993-184, Cl. M, 5.343%, 9/25/238 | | $ | 22,749 | | | $ | 21,702 | |
| | | | | | | 40,636,577 | |
| | | | | | | | | |
| GNMA/Guaranteed—2.5% | | | | | | | | |
| Government National Mortgage Assn. I Pool: | |
| 7.00%, 1/15/24 | | | 7,266 | | | | 7,278 | |
| 7.50%, 1/15/23-6/15/24 | | | 11,813 | | | | 12,029 | |
| 8.00%, 4/15/23 | | | 4,692 | | | | 4,855 | |
| Government National Mortgage Assn. II Pool, 3.50%, 7/1/499 | | | 4,465,000 | | | | 4,611,159 | |
| Government National Mortgage Assn., Interest-Only Stripped Mtg.-Backed Security: | |
| Series 2002-15,Cl. SM, 76.475%, 2/16/326 | | | 69,932 | | | | 498 | |
| Series 2002-76,Cl. SY, 0.00%, 12/16/266,7 | | | 121,564 | | | | 322 | |
| Series 2007-17,Cl. AI, 39.003%, 4/16/376 | | | 240,556 | | | | 37,905 | |
| Series 2011-52,Cl. HS, 18.30%, 4/16/416 | | | 115,081 | | | | 17,287 | |
| Series 2017-136,Cl. LI, 6.676%, 9/16/476 | | | 390,568 | | | | 66,632 | |
| Series 2017-149,Cl. GS, 0.00%, 10/16/476,7 | | | 416,221 | | | | 65,007 | |
| | | | | | | 4,822,972 | |
| | | | | | | | | |
| Non-Agency—8.2% | | | | | | | | |
| Commercial—6.0% | | | | | | | | |
| BANK, Interest-Only Stripped Mtg.- Backed Security, Series 2019-BN16, Cl. XA, 10.953%, 2/15/526 | | | 1,577,165 | | | | 116,584 | |
| BCAP LLC Trust, Series 2011-R11, Cl. 18A5, 4.69% [H15T1Y+210], 9/26/353,4 | | | 12,432 | | | | 12,497 | |
| Benchmark Mortgage Trust, Interest- Only Commercial Mtg. Pass-Through Certificates, Series 2018-B1, Cl. XA, 10.798%, 1/15/516 | | | 2,190,262 | | | | 79,254 | |
| CD Mortgage Trust, Interest-Only Commercial Mtg. Pass-Through Certificates, Series 2017-CD6, Cl. XA, 12.599%, 11/13/506 | | | 877,551 | | | | 49,376 | |
| Chase Mortgage Finance Trust, Series 2005-A2, Cl. 1A3, 4.357%, 1/25/3611 | | | 93,368 | | | | 92,518 | |
| Citigroup Commercial Mortgage Trust, Series 2014-GC21, Cl. AAB, 3.477%, 5/10/47 | | | 103,665 | | | | 106,654 | |
| Citigroup Commercial Mortgage Trust, Interest-Only Commercial Mtg. Pass-Through Certificates: | |
| Series 2013-GC17,Cl. XA, 0.00%, 11/10/466,7 | | | 420,697 | | | | 16,419 | |
| Series 2017-C4,Cl. XA, 11.941%, 10/12/506 | | | 2,347,700 | | | | 159,570 | |
| COMM Mortgage Trust: | | | | | | | | |
| Series 2013-CR6,Cl. AM, 3.147%, 3/10/463 | | | 255,000 | | | | 260,802 | |
| Series 2014-CR20,Cl. ASB, 3.305%, 11/10/47 | | | 70,000 | | | | 71,972 | |
| Series 2014-CR21,Cl. AM, 3.987%, 12/10/47 | | | 865,000 | | | | 911,536 | |
| Series 2014-LC15,Cl. AM, 4.198%, 4/10/47 | | | 140,000 | | | | 148,713 | |
| Series 2014-UBS6,Cl. AM, 4.048%, 12/10/47 | | | 495,000 | | | | 518,297 | |
| | | | | | | | |
| | | Principal
Amount | | | Value |
| Commercial (Continued) | | | | | | | | |
| COMM Mortgage Trust, Interest-Only Stripped Mtg.-Backed Security, Series 2012-CR5, Cl. XA, 21.61%, 12/10/456 | | $ | 315,520 | | | $ | 14,044 | |
| Connecticut Avenue Securities: | | | | | | | | |
| Series 2014-C01,Cl. M2, 6.804% [US0001M+440], 1/25/244 | | | 285,000 | | | | 311,760 | |
| Series 2014-C02,Cl. 1M2, 5.004% [US0001M+260], 5/25/244 | | | 114,923 | | | | 118,866 | |
| Series 2014-C03,Cl. 1M2, 5.404% [US0001M+300], 7/25/244 | | | 297,605 | | | | 312,305 | |
| Series 2014-C03,Cl. 2M2, 5.304% [US0001M+290], 7/25/244 | | | 32,576 | | | | 33,987 | |
| Series 2014-C04,Cl. 2M2, 7.404% [US0001M+500], 11/25/244 | | | 341,194 | | | | 373,768 | |
| Series 2016-C02,Cl. 1M2, 8.404% [US0001M+600], 9/25/284 | | | 270,275 | | | | 298,984 | |
| Series 2016-C03,Cl. 1M1, 4.404% [US0001M+200], 10/25/284 | | | 38,562 | | | | 38,838 | |
| Series 2017-C03,Cl. 1M1, 3.354% [US0001M+95], 10/25/294 | | | 81,430 | | | | 81,671 | |
| Series 2018-C01,Cl. 1M1, 3.004% [US0001M+60], 7/25/304 | | | 382,221 | | | | 382,145 | |
| Series 2018-C03,Cl. 1M1, 3.084% [US0001M+68], 10/25/304 | | | 247,840 | | | | 247,977 | |
| Series 2018-C05,Cl. 1M1, 3.124% [US0001M+72], 1/25/314 | | | 100,353 | | | | 100,419 | |
| Series 2018-C06,Cl. 2M1, 2.954% [US0001M+55], 3/25/314 | | | 36,325 | | | | 36,324 | |
| CSMC Mortgage-Backed Trust, Series 2006-6, Cl. 1A4, 6.00%, 7/25/36 | | | 113,310 | | | | 93,673 | |
| First Horizon Alternative Mortgage Securities Trust, Series 2005-FA8, Cl. 1A6, 3.054% [US0001M+65], 11/25/354 | | | 70,673 | | | | 49,366 | |
| FREMF Mortgage Trust: | | | | | | | | |
| Series 2010-K6,Cl. B, 5.553%, 12/25/463,11 | | | 60,000 | | | | 60,738 | |
| Series 2012-K711,Cl. B, 3.576%, 8/25/453,11 | | | 15,000 | | | | 14,972 | |
| Series 2012-K711,Cl. C, 3.576%, 8/25/453,11 | | | 135,000 | | | | 134,734 | |
| Series 2013-K25,Cl. C, 3.744%, 11/25/453,11 | | | 60,000 | | | | 61,333 | |
| Series 2013-K26,Cl. C, 3.721%, 12/25/453,11 | | | 40,000 | | | | 40,884 | |
| Series 2013-K27,Cl. C, 3.615%, 1/25/463,11 | | | 110,000 | | | | 112,182 | |
| Series 2013-K28,Cl. C, 3.609%, 6/25/463,11 | | | 450,000 | | | | 459,347 | |
| Series 2013-K712,Cl. C, 3.454%, 5/25/453,11 | | | 75,000 | | | | 75,027 | |
| Series 2013-K713,Cl. C, 3.263%, 4/25/463,11 | | | 275,000 | | | | 275,376 | |
| Series 2014-K715,Cl. C, 4.258%, 2/25/463,11 | | | 180,000 | | | | 183,262 | |
| GS Mortgage Securities Trust: | | | | | | | | |
| Series 2012-GC6,Cl. A3, 3.482%, 1/10/45 | | | 54,793 | | | | 56,088 | |
| Series 2013-GC12,Cl. AAB, 2.678%, 6/10/46 | | | 27,182 | | | | 27,299 | |
| Series 2013-GC16,Cl. AS, 4.649%, 11/10/46 | | | 65,000 | | | | 70,725 | |
| Series 2014-GC18,Cl. AAB, 3.648%, 1/10/47 | | | 82,813 | | | | 85,133 | |
| GSMSC Pass-Through Trust, Series 2009-3R, Cl. 1A2, 6.00%, 4/25/373,11 | | | 179,596 | | | | 174,211 | |
| JP Morgan Chase Commercial Mortgage Securities Trust: | |
| Series 2013-C10,Cl. AS, 3.372%, 12/15/47 | | | 325,000 | | | | 332,863 | |
10 INVESCO OPPENHEIMER V.I. CONSERVATIVE BALANCED FUND
| | | | | | | | |
| | | Principal
Amount | | | Value |
| Commercial (Continued) | | | | | | | | |
| JP Morgan Chase Commercial Mortgage Securities Trust: (Continued) | |
| Series 2013-C16,Cl. AS, 4.517%, 12/15/46 | | $ | 330,000 | | | $ | 353,975 | |
| Series 2013-LC11,Cl. AS, 3.216%, 4/15/46 | | | 78,000 | | | | 79,432 | |
| Series 2014-C20,Cl. AS, 4.043%, 7/15/47 | | | 245,000 | | | | 258,615 | |
| Series 2016-JP3,Cl. A2, 2.435%, 8/15/49 | | | 198,070 | | | | 198,236 | |
| JP Morgan Mortgage Trust, Series 2007-A1, Cl. 5A1, 4.697%, 7/25/3511 | | | 64,919 | | | | 67,678 | |
| JP Morgan Resecuritization Trust, Series 2009-5, Cl. 1A2, 4.992%, 7/26/363,11 | | | 90,309 | | | | 91,656 | |
| JPMBB Commercial Mortgage Securities Trust: | |
| Series 2014-C18,Cl. A3, 3.578%, 2/15/47 | | | 45,436 | | | | 46,129 | |
| Series 2014-C24,Cl. B, 4.116%, 11/15/4711 | | | 270,000 | | | | 282,384 | |
| Series 2014-C25,Cl. AS, 4.065%, 11/15/47 | | | 105,000 | | | | 111,118 | |
| JPMBB Commercial Mortgage Securities Trust., Interest-Only Stripped Mtg.-Backed Security, Series 2015-C27, Cl. XA, 24.187%, 2/15/486 | | | 2,910,822 | | | | 129,335 | |
| MASTR Adjustable Rate Mortgages Trust, Series 2004-13, Cl. 2A2, 4.837%, 4/21/3411 | | | 22,130 | | | | 22,955 | |
| Morgan Stanley Bank of America Merrill Lynch Trust: | |
| Series 2013-C9,Cl. AS, 3.456%, 5/15/46 | | | 240,000 | | | | 247,855 | |
| Series 2014-C19,Cl. AS, 3.832%, 12/15/47 | | | 720,000 | | | | 756,179 | |
| Morgan Stanley Capital I Trust, Series 2011-C2, Cl. A4, 4.661%, 6/15/443 | | | 70,000 | | | | 72,473 | |
| Morgan Stanley Capital I, Inc., Interest- Only Commercial Mtg. Pass-Through Certificates, Series 2017-HR2, Cl. XA, 10.514%, 12/15/506 | | | 769,206 | | | | 42,244 | |
| Morgan Stanley Re-Remic Trust, Series 2012-R3, Cl. 1B, 3.612%, 11/26/363,11 | | | 237,548 | | | | 226,191 | |
| Morgan Stanley Resecuritization Trust, Series 2013-R9, Cl. 3A, 4.076%, 6/26/463,11 | | | 48,304 | | | | 48,699 | |
| RBSSP Resecuritization Trust, Series 2010-1, Cl. 2A1, 4.73%, 7/26/453,11 | | | 10,290 | | | | 10,616 | |
| Structured Adjustable Rate Mortgage Loan Trust, Series 2004-10, Cl. 2A, 4.472%, 8/25/3411 | | | 116,694 | | | | 118,491 | |
| UBS Commercial Mortgage Trust, Interest-Only Commercial Mtg. Pass- Through Certificates, Series 2017-C5, Cl. XA, 14.709%, 11/15/506 | | | 1,513,626 | | | | 91,647 | |
| Wells Fargo Commercial Mortgage Trust, Series 2015-NXS1, Cl. ASB, 2.934%, 5/15/48 | | | 355,000 | | | | 361,013 | |
| Wells Fargo Commercial Mortgage Trust, Interest-Only Commercial Mtg. Pass-Through Certificates, Series 2017- C42, Cl. XA, 10.479%, 12/15/506 | | | 1,073,182 | | | | 67,322 | |
| Wells Fargo Mortgage Backed Securities Trust, Series 2019-1, Cl. A7, 4.00%, 11/25/483,11 | | | 128,928 | | | | 131,006 | |
| WF-RBS Commercial Mortgage Trust: | |
| Series 2013-C14,Cl. AS, 3.488%, 6/15/46 | | | 155,000 | | | | 160,138 | |
| Series 2014-C20,Cl. AS, 4.176%, 5/15/47 | | | 150,000 | | | | 158,856 | |
| Series 2014-C22,Cl. A3, 3.528%, 9/15/57 | | | 45,000 | | | | 45,987 | |
| | | | | | | | |
| | | Principal
Amount | | | Value |
| Commercial (Continued) | | | | | |
| WF-RBS Commercial Mortgage Trust: (Continued) | |
| Series 2014-LC14,Cl. AS, 4.351%, 3/15/4711 | | $ | 165,000 | | | $ | 176,024 | |
| WF-RBS Commercial Mortgage Trust, Interest-Only Commercial Mtg. Pass- Through Certificates, Series 2011-C3, Cl. XA, 31.714%, 3/15/443,6 | | | 2,014,161 | | | | 38,100 | |
| | | | | | | 11,596,847 | |
| | | | | | | | | |
| Residential—2.2% | | | | | | | | |
| Alternative Loan Trust, Series 2005- 29CB, Cl. A4, 5.00%, 7/25/35 | | | 179,465 | | | | 157,936 | |
| Banc of America Funding Trust: | | | | | |
| Series 2007-1,Cl. 1A3, 6.00%, 1/25/37 | | | 39,581 | | | | 37,590 | |
| Series 2007-C,Cl. 1A4, 4.597%, 5/20/3611 | | | 13,146 | | | | 13,188 | |
| Series 2014-R7,Cl. 3A1, 4.991%, 3/26/363,11 | | | 25,977 | | | | 26,062 | |
| Banc of America Mortgage Trust, Series 2004-E, Cl. 2A6, 4.776%, 6/25/3411 | | | 39,130 | | | | 39,566 | |
| Bear Stearns ARM Trust: | | | | | | | | |
| Series 2005-9,Cl. A1, 4.77% [H15T1Y+230], 10/25/354 | | | 294,470 | | | | 302,850 | |
| Series 2006-1,Cl. A1, 4.95% [H15T1Y+225], 2/25/364 | | | 100,864 | | | | 103,690 | |
| CHL Mortgage Pass-Through Trust: | | | | | |
| Series 2005-26,Cl. 1A8, 5.50%, 11/25/35 | | | 52,447 | | | | 49,165 | |
| Series 2006-6,Cl. A3, 6.00%, 4/25/36 | | | 33,651 | | | | 27,935 | |
| Citigroup Mortgage Loan Trust, Inc., Series 2006-AR1, Cl. 1A1, 4.70% [H15T1Y+240], 10/25/354 | | | 257,951 | | | | 264,786 | |
| Connecticut Avenue Securities Trust, Series 2019-R02, Cl. 1M1, 3.254% [US0001M+85], 8/25/313,4 | | | 301,021 | | | | 301,957 | |
| GSR Mortgage Loan Trust, Series 2005- AR4, Cl. 6A1, 4.664%, 7/25/3511 | | | 13,201 | | | | 13,538 | |
| HomeBanc Mortgage Trust, Series 2005-3, Cl. A2, 2.714% [US0001M+31], 7/25/354 | | | 15,238 | | | | 15,261 | |
| RALI Trust, Series 2006-QS13, Cl. 1A8, 6.00%, 9/25/36 | | | 7,352 | | | | 6,698 | |
| STACR Trust: | | | | | | | | |
| Series 2018-DNA2,Cl. M1, 3.204% [US0001M+80], 12/25/303,4 | | | 397,684 | | | | 398,545 | |
| Series 2018-DNA3,Cl. M1, 3.154% [US0001M+75], 9/25/483,4 | | | 71,027 | | | | 71,115 | |
| Series 2018-HRP2,Cl. M2, 3.654% [US0001M+125], 2/25/473,4 | | | 215,000 | | | | 216,043 | |
| Structured Agency Credit Risk Debt Nts.: | | | | | |
| Series 2014-DN1,Cl. M2, 4.604% [US0001M+220], 2/25/244 | | | 34,532 | | | | 35,132 | |
| Series 2014-DN3,Cl. M3, 6.404% [US0001M+400], 8/25/244 | | | 180,688 | | | | 192,951 | |
| Series 2014-HQ2,Cl. M3, 6.154% [US0001M+375], 9/25/244 | | | 335,000 | | | | 365,521 | |
| Series 2015-HQA2,Cl. M2, 5.204% [US0001M+280], 5/25/284 | | | 3,190 | | | | 3,236 | |
| Series 2016-DNA1,Cl. M2, 5.304% [US0001M+290], 7/25/284 | | | 23,755 | | | | 24,042 | |
| Series 2017-HQA1,Cl. M1, 3.604% [US0001M+120], 8/25/294 | | | 303,402 | | | | 304,481 | |
| Series 2018-DNA1,Cl. M1, 2.854% [US0001M+45], 7/25/304 | | | 572,222 | | | | 571,260 | |
| WaMu Mortgage Pass-Through Certificates Trust: | |
| Series 2003-AR10,Cl. A7, 4.486%, 10/25/3311 | | | 63,221 | | | | 65,070 | |
| Series 2005-AR14,Cl. 1A4, 4.181%, 12/25/3511 | | | 64,706 | | | | 64,558 | |
11 INVESCO OPPENHEIMER V.I. CONSERVATIVE BALANCED FUND
STATEMENT OF INVESTMENTSUnaudited / Continued
| | | | | | | | |
| | | Principal
Amount | | | Value |
| Residential (Continued) | | | | | | | | |
| WaMu Mortgage Pass-Through Certificates Trust: (Continued) | |
| Series 2005-AR16,Cl. 1A1, 4.243%, 12/25/3511 | | $ | 63,092 | | | $ | 63,067 | |
| Wells Fargo Mortgage-Backed Securities Trust: | |
| Series 2005-AR1,Cl. 1A1, 5.081%, 2/25/3511 | | | 9,236 | | | | 9,614 | |
| Series 2005-AR15,Cl. 1A2, 4.665%, 9/25/3511 | | | 71,604 | | | | 71,374 | |
| Series 2005-AR15,Cl. 1A6, 4.665%, 9/25/3511 | | | 137,224 | | | | 136,784 | |
| Series 2005-AR4,Cl. 2A2, 5.095%, 4/25/3511 | | | 112,418 | | | | 114,706 | |
| Series 2006-AR10,Cl. 1A1, 5.008%, 7/25/3611 | | | 29,105 | | | | 29,697 | |
| Series 2006-AR10,Cl. 5A5, 4.992%, 7/25/3611 | | | 102,182 | | | | 104,034 | |
| Series 2006-AR2,Cl. 2A3, 4.991%, 3/25/3611 | | | 12,171 | | | | 12,491 | |
| Series 2006-AR7,Cl. 2A4, 5.088%, 5/25/3611 | | | 75,757 | | | | 78,963 | |
| Series 2007-16,Cl. 1A1, 6.00%, 12/28/37 | | | 20,928 | | | | 21,009 | |
| | | | | | | 4,313,915 | |
| Total Mortgage-Backed Obligations (Cost $61,407,853) | | | | | | | 61,370,311 | |
| | | | | | | | | |
| Non-Convertible Corporate Bonds and Notes—30.9% | |
| Consumer Discretionary—4.7% | | | | | |
| Automobiles—1.2% | | | | | | | | |
| Daimler Finance North America LLC, 3.75% Sr. Unsec. Nts., 11/5/213 | | | 279,000 | | | | 286,117 | |
| General Motors Co., 6.25% Sr. Unsec. Nts., 10/2/43 | | | 82,000 | | | | 87,339 | |
| General Motors Financial Co., Inc.: 4.15% Sr. Unsec. Nts., 6/19/23 | | | 310,000 | | | | 319,516 | |
| 4.20% Sr. Unsec. Nts., 11/6/21 | | | 259,000 | | | | 266,778 | |
| Harley-Davidson Financial Services, Inc., 2.40% Sr. Unsec. Nts., 6/15/203 | | | 337,000 | | | | 335,933 | |
| Hyundai Capital America, 4.125% Sr. Unsec. Nts., 6/8/233 | | | 336,000 | | | | 348,692 | |
| Nissan Motor Acceptance Corp., 3.65% Sr. Unsec. Nts., 9/21/213 | | | 326,000 | | | | 333,862 | |
| Volkswagen Group of America Finance LLC, 4.00% Sr. Unsec. Nts., 11/12/213 | | | 311,000 | | | | 321,008 | |
| | | | | | | 2,299,245 | |
| | | | | | | | | |
| Diversified Consumer Services—0.2% | |
| Service Corp. International, 4.625% Sr. Unsec. Nts., 12/15/27 | | | 322,000 | | | | 330,050 | |
| Entertainment—0.2% | | | | | | | | |
| Fox Corp., 3.666% Sr. Unsec. Nts., 1/25/223 | | | 245,000 | | | | 253,206 | |
| Viacom, Inc., 4.375% Sr. Unsec. Nts., 3/15/43 | | | 105,000 | | | | 102,823 | |
| | | | | | | 356,029 | |
| | | | | | | | | |
| Hotels, Restaurants & Leisure—0.1% | |
| Aramark Services, Inc., 5.00% Sr. | | | | | | | | |
| Unsec. Nts., 4/1/253 | | | 88,000 | | | | 89,540 | |
| | | | | | | | | |
| Household Durables—0.8% | | | | | | | | |
| DR Horton, Inc., 2.55% Sr. Unsec. Nts., 12/1/20 | | | 334,000 | | | | 334,160 | |
| Lennar Corp., 4.75% Sr. Unsec. Nts., 5/30/25 | | | 343,000 | | | | 364,866 | |
| Newell Brands, Inc.: | | | | | | | | |
| 5.00% Sr. Unsec. Nts., 11/15/23 | | | 194,000 | | | | 199,207 | |
| 5.50% Sr. Unsec. Nts., 4/1/46 | | | 106,000 | | | | 103,858 | |
| | | | | | | | |
| | | Principal
Amount | | | Value |
| Household Durables (Continued) | | | | | |
| PulteGroup, Inc., 5.00% Sr. Unsec. Nts., 1/15/27 | | $ | 237,000 | | | $ | 249,397 | |
| Toll Brothers Finance Corp.: | | | | | |
| 4.375% Sr. Unsec. Nts., 4/15/23 | | | 298,000 | | | | 309,548 | |
| 4.875% Sr. Unsec. Nts., 3/15/27 | | | 45,000 | | | | 47,432 | |
| | | | | | | 1,608,468 | |
| | | | | | | | | |
| Internet & Catalog Retail—0.3% | | | | | |
| Amazon.com, Inc., 4.95% Sr. Unsec. Nts., 12/5/44 | | | 107,000 | | | | 134,595 | |
| QVC, Inc., 4.45% Sr. Sec. Nts., 2/15/25 | | | 505,000 | | | | 508,710 | |
| | | | | | | 643,305 | |
| | | | | | | | | |
| Media—1.0% | | | | | | | | |
| CBS Corp., 4.20% Sr. Unsec. Nts., 6/1/29 | | | 159,000 | | | | 167,683 | |
| Charter Communications Operating LLC/Charter Communications Operating Capital, 5.125% Sr. Sec. Nts., 7/1/499 | | | 84,000 | | | | 85,803 | |
| Comcast Corp., 4.00% Sr. Unsec. Nts., 3/1/48 | | | 86,000 | | | | 91,027 | |
| Discovery Communications LLC, 4.125% Sr. Unsec. Nts., 5/15/29 | | | 189,000 | | | | 196,794 | |
| Interpublic Group of Cos., Inc. (The): | |
| 3.75% Sr. Unsec. Nts., 10/1/21 | | | 265,000 | | | | 271,951 | |
| 4.20% Sr. Unsec. Nts., 4/15/24 | | | 330,000 | | | | 355,376 | |
| Time Warner Cable LLC, 4.50% Sr. Sec. Nts., 9/15/42 | | | 111,000 | | | | 104,521 | |
| Virgin Media Secured Finance plc, 5.25% Sr. Sec. Nts., 1/15/263 | | | 318,000 | | | | 327,050 | |
| WPP Finance 2010, 3.75% Sr. Unsec. Nts., 9/19/24 | | | 322,000 | | | | 333,419 | |
| | | | | | | 1,933,624 | |
| | | | | | | | | |
| Specialty Retail—0.6% | | | | | | | | |
| AutoNation, Inc., 5.50% Sr. Unsec. Nts., 2/1/20 | | | 306,000 | | | | 310,425 | |
| Penske Truck Leasing Co. LP/PTL Finance Corp., 3.65% Sr. Unsec. Nts., 7/29/213 | | | 110,000 | | | | 112,489 | |
| Ross Stores, Inc., 3.375% Sr. Unsec. Nts., 9/15/24 | | | 344,000 | | | | 357,362 | |
| Signet UK Finance plc, 4.70% Sr. Unsec. Nts., 6/15/24 | | | 356,000 | | | | 297,260 | |
| | | | | | | 1,077,536 | |
| | | | | | | | | |
| Textiles, Apparel & Luxury Goods—0.3% | |
| Hanesbrands, Inc., 4.875% Sr. Unsec. Nts., 5/15/263 | | | 320,000 | | | | 333,565 | |
| Levi Strauss & Co., 5.00% Sr. Unsec. Nts., 5/1/25 | | | 302,000 | | | | 314,080 | |
| | | | | | | 647,645 | |
| | | | | | | | | |
| Consumer Staples—3.2% | | | | | | | | |
| Beverages—0.7% | | | | | | | | |
| Anheuser-Busch InBev Worldwide, Inc., 8.20% Sr. Unsec. Nts., 1/15/39 | | | 197,000 | | | | 297,173 | |
| Bacardi Ltd., 4.70% Sr. Unsec. Nts., 5/15/283 | | | 171,000 | | | | 183,014 | |
| Keurig Dr Pepper, Inc., 4.057% Sr. Unsec. Nts., 5/25/23 | | | 305,000 | | | | 320,302 | |
| Molson Coors Brewing Co., 2.10% Sr. Unsec. Nts., 7/15/21 | | | 324,000 | | | | 322,150 | |
| Pernod Ricard SA, 4.25% Sr. Unsec. Nts., 7/15/223 | | | 299,000 | | | | 313,666 | |
| | | | | | | 1,436,305 | |
| | | | | | | | | |
| Food & Staples Retailing—0.2% | | | | | |
| Kroger Co. (The), 4.45% Sr. Unsec. Nts., 2/1/47 | | | 93,000 | | | | 90,860 | |
12 INVESCO OPPENHEIMER V.I. CONSERVATIVE BALANCED FUND
| | | | | | | | |
| | | Principal
Amount | | | Value |
| Food & Staples Retailing (Continued) | |
| Walgreen Co., 3.10% Sr. Unsec. Nts., 9/15/22 | | $ | 295,000 | | | $ | 300,157 | |
| | | | | | | 391,017 | |
| | | | | | | | | |
| Food Products—1.6% | |
| Bunge Ltd. Finance Corp.: | | | | | |
| 3.25% Sr. Unsec. Nts., 8/15/26 | | | 232,000 | | | | 224,397 | |
| 3.50% Sr. Unsec. Nts., 11/24/20 | | | 311,000 | | | | 313,939 | |
| Conagra Brands, Inc.: | | | | | | | | |
| 3.80% Sr. Unsec. Nts., 10/22/21 | | | 252,000 | | | | 259,001 | |
| 4.60% Sr. Unsec. Nts., 11/1/25 | | | 317,000 | | | | 345,157 | |
| Kraft Heinz Foods Co., 4.375% Sr. Unsec. Nts., 6/1/46 | | | 204,000 | | | | 193,956 | |
| Lamb Weston Holdings, Inc., 4.875% Sr. Unsec. Nts., 11/1/263 | | | 306,000 | | | | 319,770 | |
| Mondelez International Holdings | | | | | | | | |
| Netherlands BV, 2.00% Sr. Unsec. Nts., 10/28/213 | | | 339,000 | | | | 335,837 | |
| Smithfield Foods, Inc.: | | | | | | | | |
| 2.70% Sr. Unsec. Nts., 1/31/203 | | | 148,000 | | | | 147,710 | |
| 3.35% Sr. Unsec. Nts., 2/1/223 | | | 183,000 | | | | 182,601 | |
| 5.20% Sr. Unsec. Nts., 4/1/293 | | | 252,000 | | | | 274,795 | |
| Tyson Foods, Inc.: | | | | | | | | |
| 3.90% Sr. Unsec. Nts., 9/28/23 | | | 271,000 | | | | 285,644 | |
| 5.10% Sr. Unsec. Nts., 9/28/48 | | | 88,000 | | | | 99,401 | |
| | | | | | | 2,982,208 | |
| | | | | | | | | |
| Tobacco—0.7% | |
| Altria Group, Inc., 3.49% Sr. Unsec. Nts., 2/14/22 | | | 206,000 | | | | 211,867 | |
| BAT Capital Corp., 3.557% Sr. Unsec. Nts., 8/15/27 | | | 177,000 | | | | 176,294 | |
| BAT International Finance plc, 3.25% Sr. Unsec. Nts., 6/7/223 | | | 318,000 | | | | 322,610 | |
| Imperial Brands Finance plc, 3.75% Sr. Unsec. Nts., 7/21/223 | | | 328,000 | | | | 337,688 | |
| Imperial Tobacco Finance plc, 2.95% Sr. Unsec. Nts., 7/21/203 | | | 230,000 | | | | 230,656 | |
| | | | | | | 1,279,115 | |
| | | | | | | | | |
| Energy—2.7% | |
| Energy Equipment & Services—0.2% | |
| Halliburton Co., 5.00% Sr. Unsec. Nts., 11/15/45 | | | 75,000 | | | | 81,863 | |
| Schlumberger Holdings Corp., 4.00% Sr. Unsec. Nts., 12/21/253 | | | 196,000 | | | | 207,509 | |
| | | | | | | 289,372 | |
| | | | | | | | | |
| Oil, Gas & Consumable Fuels—2.5% | |
| Anadarko Petroleum Corp., 4.50% Sr. Unsec. Nts., 7/15/44 | | | 72,000 | | | | 73,781 | |
| Andeavor Logistics LP/Tesoro Logistics Finance Corp., 4.25% Sr. Unsec. Nts., 12/1/27 | | | 192,000 | | | | 203,072 | |
| Apache Corp., 4.375% Sr. Unsec. Nts., 10/15/28 | | | 251,000 | | | | 262,398 | |
| Cenovus Energy, Inc., 4.25% Sr. Unsec. Nts., 4/15/27 | | | 184,000 | | | | 190,442 | |
| Cimarex Energy Co., 4.375% Sr. Unsec. Nts., 3/15/29 | | | 158,000 | | | | 167,828 | |
| Columbia Pipeline Group, Inc., 3.30% Sr. Unsec. Nts., 6/1/20 | | | 324,000 | | | | 326,221 | |
| Devon Energy Corp., 4.75% Sr. Unsec. Nts., 5/15/42 | | | 63,000 | | | | 69,046 | |
| Energy Transfer Operating LP: | | | | | |
| 4.25% Sr. Unsec. Nts., 3/15/23 | | | 260,000 | | | | 271,542 | |
| 5.30% Sr. Unsec. Nts., 4/15/47 | | | 100,000 | | | | 104,366 | |
| Enterprise Products Operating LLC: | | | | | |
| 3.125% Sr. Unsec. Nts., 7/31/299 | | | 94,000 | | | | 94,498 | |
| 4.20% Sr. Unsec. Nts., 1/31/509 | | | 113,000 | | | | 116,214 | |
| | | | | | | | |
| | | Principal
Amount | | | Value |
| Oil, Gas & Consumable Fuels (Continued) | |
| EQT Corp., 2.50% Sr. Unsec. Nts., 10/1/20 | | $ | 353,000 | | | $ | 352,091 | |
| Kinder Morgan Energy Partners LP, 5.80% Sr. Unsec. Nts., 3/1/21 | | | 132,000 | | | | 138,955 | |
| Kinder Morgan, Inc., 5.20% Sr. Unsec. Nts., 3/1/48 | | | 217,000 | | | | 245,303 | |
| Marathon Petroleum Corp., 4.50% Sr. Unsec. Nts., 4/1/48 | | | 69,000 | | | | 69,368 | |
| Midwest Connector Capital Co. LLC, 3.625% Sr. Unsec. Nts., 4/1/223 | | | 310,000 | | | | 317,651 | |
| Newfield Exploration Co., 5.75% Sr. Unsec. Nts., 1/30/22 | | | 288,000 | | | | 308,527 | |
| ONEOK, Inc., 4.35% Sr. Unsec. Nts., 3/15/29 | | | 156,000 | | | | 166,845 | |
| Rockies Express Pipeline LLC, 4.95% Sr. Unsec. Nts., 7/15/293 | | | 162,000 | | | | 167,546 | |
| Sabine Pass Liquefaction LLC: | | | | | |
| 4.20% Sr. Sec. Nts., 3/15/28 | | | 180,000 | | | | 189,124 | |
| 5.625% Sr. Sec. Nts., 2/1/21 | | | 294,000 | | | | 305,377 | |
| Sunoco Logistics Partners Operations LP, 4.00% Sr. Unsec. Nts., 10/1/27 | | | 207,000 | | | | 213,351 | |
| Valero Energy Corp., 4.00% Sr. Unsec. Nts., 4/1/29 | | | 154,000 | | | | 161,290 | |
| Williams Cos., Inc. (The), 3.70% Sr. Unsec. Nts., 1/15/23 | | | 334,000 | | | | 345,305 | |
| | | | | | | 4,860,141 | |
| | | | | | | | | |
| Financials—8.9% | |
| Capital Markets—1.6% | |
| Blackstone Holdings Finance Co. LLC, 3.15% Sr. Unsec. Nts., 10/2/273 | | | 117,000 | | | | 117,468 | |
| Brookfield Asset Management, Inc., 4.00% Sr. Unsec. Nts., 1/15/25 | | | 250,000 | | | | 260,577 | |
| Credit Suisse AG (New York), 3.625% Sr. Unsec. Nts., 9/9/24 | | | 197,000 | | | | 207,424 | |
| Credit Suisse Group Funding Guernsey Ltd., 4.55% Sr. Unsec. Nts., 4/17/26 | | | 154,000 | | | | 167,555 | |
| E*TRADE Financial Corp., 5.875% [US0003M+443.5] Jr. Sub. Perpetual Bonds4,12 | | | 307,000 | | | | 322,350 | |
| Goldman Sachs Group, Inc. (The): | |
| 3.50% Sr. Unsec. Nts., 11/16/26 | | | 166,000 | | | | 170,203 | |
| 3.75% Sr. Unsec. Nts., 2/25/26 | | | 163,000 | | | | 170,215 | |
| 4.017% [US0003M+137.3] Sr. Unsec. Nts., 10/31/384 | | | 144,000 | | | | 148,516 | |
| Morgan Stanley: | | | | | | | | |
| 4.431% [US0003M+162.8] Sr. Unsec. Nts., 1/23/304 | | | 235,000 | | | | 260,371 | |
| 5.00% Sub. Nts., 11/24/25 | | | 257,000 | | | | 284,570 | |
| MSCI, Inc., 4.75% Sr. Unsec. Nts., 8/1/263 | | | 121,000 | | | | 125,840 | |
| Northern Trust Corp., 3.375% [US0003M+113.1] Sub. Nts., 5/8/324 | | | 115,000 | | | | 116,003 | |
| Plains All American Pipeline LP/PAA Finance Corp., 4.50% Sr. Unsec. Nts., 12/15/26 | | | 191,000 | | | | 203,084 | |
| Raymond James Financial, Inc., 3.625% Sr. Unsec. Nts., 9/15/26 | | | 153,000 | | | | 157,413 | |
| UBS Group Funding Switzerland AG: | |
| 4.125% Sr. Unsec. Nts., 4/15/263 | | | 160,000 | | | | 171,007 | |
| 4.253% Sr. Unsec. Nts., 3/23/283 | | | 147,000 | | | | 157,940 | |
| | | | | | | 3,040,536 | |
| | | | | | | | | |
| Commercial Banks—4.8% | |
| ABN AMRO Bank NV, 4.40% [USSW5+219.7] Sub. Nts., 3/27/284,13 | | | 329,000 | | | | 339,700 | |
| Bank of America Corp.: | |
| 3.248% Sr. Unsec. Nts., 10/21/27 | | | 258,000 | | | | 264,448 | |
13 INVESCO OPPENHEIMER V.I. CONSERVATIVE BALANCED FUND
STATEMENT OF INVESTMENTSUnaudited / Continued
| | | | | | | | |
| | | Principal
Amount | | | Value |
| Commercial Banks (Continued) | | | | | | | | |
| Bank of America Corp.: (Continued) | | | | | |
| 3.366% [US0003M+81] Sr. Unsec. Nts., 1/23/264 | | $ | 286,000 | | | $ | 295,177 | |
| 3.824% [US0003M+157.5] Sr. Unsec. Nts., 1/20/284 | | | 191,000 | | | | 202,270 | |
| 4.271% [US0003M+131] Sr. Unsec. Nts., 7/23/294 | | | 154,000 | | | | 168,250 | |
| 7.75% Sub. Nts., 5/14/38 | | | 226,000 | | | | 333,657 | |
| Bank of Ireland Group plc, 4.50% Sr. Unsec. Nts., 11/25/233 | | | 263,000 | | | | 274,598 | |
| Bank of Montreal, Series E, 3.30% Sr. Unsec. Nts., 2/5/24 | | | 245,000 | | | | 254,179 | |
| BNP Paribas SA, 4.375% [USSW5+148.3] Sub. Nts., 3/1/333,4 | | | 177,000 | | | | 182,414 | |
| BPCE SA, 4.50% Sub. Nts., 3/15/253 | | | 184,000 | | | | 193,962 | |
| Canadian Imperial Bank of Commerce, 3.10% Sr. Unsec. Nts., 4/2/24 | | | 312,000 | | | | 319,068 | |
| Citigroup, Inc.: | | | | | | | | |
| 4.075% [US0003M+119.2] Sr. Unsec. Nts., 4/23/294 | | | 269,000 | | | | 289,010 | |
| 4.281% [US0003M+183.9] Sr. Unsec. Nts., 4/24/484 | | | 356,000 | | | | 398,603 | |
| Citizens Bank NA (Providence RI), 2.65% Sr. Unsec. Nts., 5/26/22 | | | 68,000 | | | | 68,531 | |
| Compass Bank, 2.875% Sr. Unsec. Nts., 6/29/22 | | | 279,000 | | | | 281,577 | |
| Credit Agricole SA, 4.375% Sub. Nts., 3/17/253 | | | 304,000 | | | | 318,933 | |
| Fifth Third Bank (Cincinnati OH), 3.85% Sub. Nts., 3/15/26 | | | 160,000 | | | | 168,973 | |
| First Republic Bank, 4.375% Sub. Nts., 8/1/46 | | | 127,000 | | | | 131,528 | |
| Fortis, Inc., 3.055% Sr. Unsec. Nts., 10/4/26 | | | 123,000 | | | | 122,151 | |
| HSBC Holdings plc: | | | | | | | | |
| 3.95% [US0003M+98.72] Sr. Unsec. Nts., 5/18/244 | | | 109,000 | | | | 114,059 | |
| 4.041% [US0003M+154.6] Sr. Unsec. Nts., 3/13/284 | | | 135,000 | | | | 141,864 | |
| 4.583% [US0003M+153.46] Sr. Unsec. Nts., 6/19/294 | | | 183,000 | | | | 199,983 | |
| Huntington Bancshares, Inc., 4.00% Sr. Unsec. Nts., 5/15/25 | | | 334,000 | | | | 356,351 | |
| JPMorgan Chase & Co.: | | | | | | | | |
| 3.54% [US0003M+138] Sr. Unsec. Nts., 5/1/284 | | | 252,000 | | | | 262,406 | |
| 3.782% [US0003M+133.7] Sr. Unsec. Nts., 2/1/284 | | | 332,000 | | | | 352,086 | |
| 3.797% [US0003M+89] Sr. Unsec. Nts., 7/23/244 | | | 335,000 | | | | 351,525 | |
| KeyCorp, 4.15% Sr. Unsec. Nts., 10/29/25 | | | 106,000 | | | | 114,859 | |
| Lloyds Banking Group plc, 6.657% [US0003M+127] Jr. Sub. Perpetual Bonds3,4,12 | | | 300,000 | | | | 317,250 | |
| Nordea Bank Abp, 4.625% [USSW5+169] Sub. Nts., 9/13/333,4 | | | 118,000 | | | | 124,629 | |
| PNC Financial Services Group, Inc. (The), 3.15% Sr. Unsec. Nts., 5/19/27 | | | 253,000 | | | | 261,408 | |
| Regions Financial Corp., 2.75% Sr. Unsec. Nts., 8/14/22 | | | 175,000 | | | | 176,266 | |
| Royal Bank of Canada, 3.70% Sr. Unsec. Nts., 10/5/23 | | | 290,000 | | | | 305,625 | |
| Santander Holdings USA, Inc., 3.50% Sr. Unsec. Nts., 6/7/24 | | | 248,000 | | | | 251,934 | |
| Societe Generale SA, 3.875% Sr. Unsec. Nts., 3/28/243 | | | 250,000 | | | | 258,662 | |
| | | | | | | | |
| | | Principal
Amount | | | Value |
| Commercial Banks (Continued) | | | | | |
| SunTrust Bank (Atlanta GA): | | | | | | | | |
| 3.30% Sub. Nts., 5/15/26 | | $ | 112,000 | | | $ | 114,098 | |
| 4.05% Sr. Unsec. Nts., 11/3/25 | | | 141,000 | | | | 152,117 | |
| Synovus Financial Corp., 3.125% Sr. Unsec. Nts., 11/1/22 | | | 177,000 | | | | 178,016 | |
| US Bancorp, 3.10% Sub. Nts., 4/27/26 | | | 199,000 | | | | 203,394 | |
| Wells Fargo & Co.: | | | | | | | | |
| 3.584% [US0003M+131] Sr. Unsec. Nts., 5/22/284 | | | 248,000 | | | | 259,252 | |
| 4.75% Sub. Nts., 12/7/46 | | | 157,000 | | | | 178,917 | |
| | | | | | | 9,281,730 | |
| | | | | | | | | |
| Consumer Finance—0.4% | | | | | |
| American Express Co., 3.125% Sr. Unsec. Nts., 5/20/26 | | | 189,000 | | | | 194,144 | |
| Capital One Financial Corp.: | | | | | | | | |
| 3.75% Sr. Unsec. Nts., 3/9/27 | | | 111,000 | | | | 114,639 | |
| 3.80% Sr. Unsec. Nts., 1/31/28 | | | 92,000 | | | | 95,124 | |
| Discover Bank, 4.65% Sr. Unsec. Nts., 9/13/28 | | | 122,000 | | | | 133,520 | |
| Discover Financial Services, 3.75% Sr. Unsec. Nts., 3/4/25 | | | 108,000 | | | | 111,693 | |
| Synchrony Financial, 4.25% Sr. Unsec. Nts., 8/15/24 | | | 248,000 | | | | 258,444 | |
| | | | | | | 907,564 | |
| | | | | | | | | |
| Diversified Financial Services—0.3% | |
| Berkshire Hathaway Energy Co., 3.80% Sr. Unsec. Nts., 7/15/48 | | | 81,000 | | | | 82,510 | |
| Peachtree Corners Funding Trust, 3.976% Sr. Unsec. Nts., 2/15/253 | | | 126,000 | | | | 131,182 | |
| Voya Financial, Inc., 5.65% [US0003M+358] Jr. Sub. Nts., 5/15/534 | | | 315,000 | | | | 327,121 | |
| | | | | | | 540,813 | |
| | | | | | | | | |
| Insurance—1.3% | | | | | | | | |
| Aflac, Inc., 4.75% Sr. Unsec. Nts., 1/15/49 | | | 109,000 | | | | 128,915 | |
| AXA Equitable Holdings, Inc., 4.35% Sr. Unsec. Nts., 4/20/28 | | | 163,000 | | | | 171,474 | |
| Boardwalk Pipelines LP, 4.95% Sr. Unsec. Nts., 12/15/24 | | | 162,000 | | | | 172,796 | |
| Brighthouse Financial, Inc., 3.70% Sr. Unsec. Nts., 6/22/27 | | | 68,000 | | | | 64,747 | |
| CNA Financial Corp., 3.45% Sr. Unsec. Nts., 8/15/27 | | | 231,000 | | | | 234,556 | |
| Hartford Financial Services Group, Inc. (The), 4.40% Sr. Unsec. Nts., 3/15/48 | | | 192,000 | | | | 209,400 | |
| Lincoln National Corp., 3.80% Sr. Unsec. Nts., 3/1/28 | | | 188,000 | | | | 197,432 | |
| Manulife Financial Corp., 4.061% [USISDA05+164.7] Sub. Nts., 2/24/324 | | | 191,000 | | | | 194,970 | |
| Marsh & McLennan Cos., Inc., 4.35% Sr. Unsec. Nts., 1/30/47 | | | 113,000 | | | | 122,566 | |
| Principal Financial Group, Inc., 3.70% Sr. Unsec. Nts., 5/15/29 | | | 192,000 | | | | 200,891 | |
| Prudential Financial, Inc.: | | | | | | | | |
| 4.35% Sr. Unsec. Nts., 2/25/50 | | | 124,000 | | | | 139,392 | |
| 5.20% [US0003M+304] Jr. Sub. Nts., 3/15/444 | | | 246,000 | | | | 256,302 | |
| Swiss Re Finance Luxembourg SA, 5.00% [H15T5Y+358.2] Sub. Nts., 4/2/493,4 | | | 382,000 | | | | 410,077 | |
| | | | | | | 2,503,518 | |
| | | | | | | | | |
| Real Estate Investment Trusts (REITs)—0.5% | |
| American Tower Corp.: | | | | | | | | |
| 3.00% Sr. Unsec. Nts., 6/15/23 | | | 274,000 | | | | 276,742 | |
| 4.00% Sr. Unsec. Nts., 6/1/25 | | | 169,000 | | | | 178,246 | |
14 INVESCO OPPENHEIMER V.I. CONSERVATIVE BALANCED FUND
| | | | | | | | |
| | | Principal
Amount | | | Value |
| Real Estate Investment Trusts (REITs) (Continued) | |
| Crown Castle International Corp., 3.65% Sr. Unsec. Nts., 9/1/27 | | $ | 176,000 | | | $ | 181,325 | |
| VEREIT Operating Partnership LP, 4.625% Sr. Unsec. Nts., 11/1/25 | | | 300,000 | | | | 323,124 | |
| | | | | | | 959,437 | |
| | | | | | | | | |
| Health Care—2.7% | |
| Biotechnology—0.8% | |
| AbbVie, Inc.: | | | | | | | | |
| 3.75% Sr. Unsec. Nts., 11/14/23 | | | 329,000 | | | | 343,249 | |
| 4.875% Sr. Unsec. Nts., 11/14/48 | | | 133,000 | | | | 140,139 | |
| Amgen, Inc., 4.563% Sr. Unsec. Nts., 6/15/48 | | | 87,000 | | | | 94,535 | |
| Biogen, Inc., 5.20% Sr. Unsec. Nts., 9/15/45 | | | 97,000 | | | | 109,075 | |
| Gilead Sciences, Inc., 4.75% Sr. Unsec. Nts., 3/1/46 | | | 128,000 | | | | 145,478 | |
| Shire Acquisitions Investments Ireland DAC, 2.40% Sr. Unsec. Nts., 9/23/21 | | | 627,000 | | | | 625,914 | |
| | | | | | | 1,458,390 | |
| | | | | | | | | |
| Health Care Equipment & Supplies—0.4% | |
| Becton Dickinson & Co., 3.70% Sr. Unsec. Nts., 6/6/27 | | | 175,000 | | | | 182,944 | |
| Boston Scientific Corp., 4.00% Sr. Unsec. Nts., 3/1/28 | | | 300,000 | | | | 322,531 | |
| Hologic, Inc., 4.375% Sr. Unsec. Nts., 10/15/253 | | | 310,000 | | | | 315,813 | |
| | | | | | | 821,288 | |
| | | | | | | | | |
| Health Care Providers & Services—0.6% | |
| Cigna Corp., 4.125% Sr. Unsec. Nts., 11/15/253 | | | 250,000 | | | | 265,715 | |
| CVS Health Corp.: | | | | | | | | |
| 2.125% Sr. Unsec. Nts., 6/1/21 | | | 356,000 | | | | 353,700 | |
| 5.05% Sr. Unsec. Nts., 3/25/48 | | | 196,000 | | | | 208,780 | |
| Fresenius Medical Care US Finance II, Inc., 5.875% Sr. Unsec. Nts., 1/31/223 | | | 291,000 | | | | 310,929 | |
| | | | | | | 1,139,124 | |
| | | | | | | | | |
| Life Sciences Tools & Services—0.3% | |
| IQVIA, Inc., 5.00% Sr. Unsec. Nts., 10/15/263 | | | 308,000 | | | | 320,320 | |
| Life Technologies Corp., 6.00% Sr. Unsec. Nts., 3/1/20 | | | 259,000 | | | | 264,518 | |
| | | | | | | 584,838 | |
| | | | | | | | | |
| Pharmaceuticals—0.6% | |
| Bayer US Finance II LLC, 3.875% Sr. Unsec. Nts., 12/15/233 | | | 335,000 | | | | 347,322 | |
| Bristol-Myers Squibb Co., 3.40% Sr. Unsec. Nts., 7/26/293 | | | 226,000 | | | | 236,737 | |
| Elanco Animal Health, Inc., 4.90% Sr. Unsec. Nts., 8/28/283 | | | 145,000 | | | | 161,998 | |
| Mylan NV, 3.15% Sr. Unsec. Nts., 6/15/21 | | | 319,000 | | | | 319,086 | |
| Takeda Pharmaceutical Co. Ltd., 5.00% Sr. Unsec. Nts., 11/26/283 | | | 160,000 | | | | 181,304 | |
| | | | | | | 1,246,447 | |
| | | | | | | | | |
| Industrials—1.9% | |
| Aerospace & Defense—0.7% | |
| BAE Systems Holdings, Inc., 3.85% Sr. Unsec. Nts., 12/15/253 | | | 245,000 | | | | 256,156 | |
| Huntington Ingalls Industries, Inc., 3.483% Sr. Unsec. Nts., 12/1/27 | | | 180,000 | | | | 183,222 | |
| L3 Technologies, Inc., 3.85% Sr. Unsec. Nts., 6/15/23 | | | 335,000 | | | | 349,641 | |
| Northrop Grumman Corp., 4.75% Sr. Unsec. Nts., 6/1/43 | | | 190,000 | | | | 220,499 | |
| United Technologies Corp.: | | | | | | | | |
| 3.35% Sr. Unsec. Nts., 8/16/21 | | | 82,000 | | | | 83,828 | |
| | | | | | | | |
| | | Principal
Amount | | | Value |
| Aerospace & Defense (Continued) | |
| United Technologies Corp.: (Continued) | |
| 3.95% Sr. Unsec. Nts., 8/16/25 | | $ | 205,000 | | | $ | 221,149 | |
| | | | | | | 1,314,495 | |
| | | | | | | | | |
| Building Products—0.2% | |
| Fortune Brands Home & Security, Inc., 4.00% Sr. Unsec. Nts., 9/21/23 | | | 313,000 | | | | 329,541 | |
| | | | | | | | | |
| Electrical Equipment—0.1% | |
| Sensata Technologies BV, 5.00% Sr. Unsec. Nts., 10/1/253 | | | 170,000 | | | | 178,075 | |
| | | | | | | | | |
| Industrial Conglomerates—0.0% | |
| GE Capital International Funding Co. Unlimited Co., 3.373% Sr. Unsec. Nts., 11/15/25 | | | 100,000 | | | | 101,255 | |
| | | | | | | | | |
| Machinery—0.2% | |
| Ingersoll-Rand Luxembourg Finance SA, 3.80% Sr. Unsec. Nts., 3/21/29 | | | 154,000 | | | | 161,622 | |
| nVent Finance Sarl, 4.55% Sr. Unsec. Nts., 4/15/28 | | | 176,000 | | | | 178,895 | |
| | | | | | | 340,517 | |
| | | | | | | | | |
| Professional Services—0.1% | |
| IHS Markit Ltd., 4.125% Sr. Unsec. Nts., 8/1/23 | | | 211,000 | | | | 219,619 | |
| | | | | | | | | |
| Road & Rail—0.3% | |
| Penske Truck Leasing Co. LP/PTL Finance Corp., 3.40% Sr. Unsec. Nts., 11/15/263 | | | 269,000 | | | | 268,884 | |
| Ryder System, Inc., 3.75% Sr. Unsec. Nts., 6/9/23 | | | 335,000 | | | | 348,709 | |
| | | | | | | 617,593 | |
| | | | | | | | | |
| Trading Companies & Distributors—0.3% | |
| Air Lease Corp.: | | | | | | | | |
| 3.25% Sr. Unsec. Nts., 3/1/25 | | | 108,000 | | | | 108,687 | |
| 3.625% Sr. Unsec. Nts., 4/1/27 | | | 102,000 | | | | 102,573 | |
| GATX Corp., 3.50% Sr. Unsec. Nts., 3/15/28 | | | 197,000 | | | | 197,937 | |
| Mitsubishi UFJ Financial Group, Inc., 3.741% Sr. Unsec. Nts., 3/7/29 | | | 194,000 | | | | 208,249 | |
| | | | | | | 617,446 | |
| | | | | | | | | |
| Information Technology—2.3% | |
| Communications Equipment—0.1% | |
| Motorola Solutions, Inc., 4.60% Sr. Unsec. Nts., 2/23/28 | | | 256,000 | | | | 268,700 | |
| | | | | | | | | |
| Electronic Equipment, Instruments, & Components—0.4% | |
| Arrow Electronics, Inc., 3.875% Sr. Unsec. Nts., 1/12/28 | | | 248,000 | | | | 246,024 | |
| FLIR Systems, Inc., 3.125% Sr. Unsec. Nts., 6/15/21 | | | 307,000 | | | �� | 310,018 | |
| Tech Data Corp., 4.95% Sr. Unsec. Nts., 2/15/27 | | | 271,000 | | | | 283,729 | |
| | | | | | | 839,771 | |
| | | | | | | | | |
| IT Services—0.5% | |
| DXC Technology Co., 4.75% Sr. Unsec. Nts., 4/15/27 | | | 246,000 | | | | 261,835 | |
| Fidelity National Information Services, Inc., 4.25% Sr. Unsec. Nts., 5/15/28 | | | 159,000 | | | | 173,429 | |
| Fiserv, Inc., 3.50% Sr. Unsec. Nts., 7/1/29 | | | 224,000 | | | | 230,318 | |
| VeriSign, Inc.: | | | | | | | | |
| 4.75% Sr. Unsec. Nts., 7/15/27 | | | 189,000 | | | | 197,505 | |
| 5.25% Sr. Unsec. Nts., 4/1/25 | | | 105,000 | | | | 112,481 | |
| | | | | | | 975,568 | |
15 INVESCO OPPENHEIMER V.I. CONSERVATIVE BALANCED FUND
STATEMENT OF INVESTMENTSUnaudited / Continued
| | | | | | | | |
| | | Principal
Amount | | | Value |
| Semiconductors & Semiconductor Equipment—0.8% | |
| Broadcom, Inc.: | | | | | | | | |
| 3.125% Sr. Unsec. Nts., 4/15/213 | | $ | 313,000 | | | $ | 315,131 | |
| 4.25% Sr. Unsec. Nts., 4/15/263 | | | 252,000 | | | | 255,509 | |
| Microchip Technology, Inc., 3.922% Sr. Sec. Nts., 6/1/21 | | | 335,000 | | | | 341,078 | |
| NXP BV/NXP Funding LLC, 4.125% Sr. Unsec. Nts., 6/1/213 | | | 304,000 | | | | 311,782 | |
| NXP BV/NXP Funding LLC/NXP USA, Inc., 3.875% Sr. Unsec. Nts., 6/18/263 | | | 198,000 | | | | 203,344 | |
| | | | | | | 1,426,844 | |
| | | | | | | | | |
| Software—0.2% | |
| Autodesk, Inc., 4.375% Sr. Unsec. Nts., 6/15/25 | | | 104,000 | | | | 110,611 | |
| Open Text Corp., 5.625% Sr. Unsec. Nts., 1/15/233 | | | 155,000 | | | | 160,038 | |
| VMware, Inc., 3.90% Sr. Unsec. Nts., 8/21/27 | | | 170,000 | | | | 172,325 | |
| | | | | | | 442,974 | |
| | | | | | | | | |
| Technology Hardware, Storage & Peripherals—0.3% | |
| Apple, Inc., 4.375% Sr. Unsec. Nts., 5/13/45 | | | 186,000 | | | | 212,057 | |
| Dell International LLC/EMC Corp., 5.30% Sr. Sec. Nts., 10/1/293 | | | 312,000 | | | | 328,632 | |
| | | | | | | 540,689 | |
| | | | | | | | | |
| Materials—1.7% | |
| Chemicals—0.6% | |
| Dow Chemical Co. (The), 3.625% Sr. Unsec. Nts., 5/15/263 | | | 206,000 | | | | 213,751 | |
| DowDuPont, Inc., 5.419% Sr. Unsec. Nts., 11/15/48 | | | 125,000 | | | | 152,172 | |
| Eastman Chemical Co., 3.50% Sr. Unsec. Nts., 12/1/21 | | | 130,000 | | | | 132,993 | |
| Nutrien Ltd.: | | | | | | | | |
| 4.875% Sr. Unsec. Nts., 3/30/20 | | | 40,000 | | | | 40,691 | |
| 5.00% Sr. Unsec. Nts., 4/1/49 | | | 85,000 | | | | 96,442 | |
| RPM International, Inc., 3.45% Sr. Unsec. Nts., 11/15/22 | | | 329,000 | | | | 335,099 | |
| Yara International ASA, 4.75% Sr. Unsec. Nts., 6/1/283 | | | 165,000 | | | | 177,943 | |
| | | | | | | 1,149,091 | |
| | | | | | | | | |
| Construction Materials—0.2% | |
| James Hardie International Finance DAC, 4.75% Sr. Unsec. Nts., 1/15/253 | | | 191,000 | | | | 195,775 | |
| Martin Marietta Materials, Inc., 3.50% Sr. Unsec. Nts., 12/15/27 | | | 171,000 | | | | 170,788 | |
| | | | | | | 366,563 | |
| | | | | | | | | |
| Containers & Packaging—0.4% | |
| Packaging Corp. of America, 3.65% Sr. Unsec. Nts., 9/15/24 | | | 274,000 | | | | 283,987 | |
| Silgan Holdings, Inc., 4.75% Sr. Unsec. Nts., 3/15/25 | | | 290,000 | | | | 293,625 | |
| WRKCo, Inc., 3.90% Sr. Unsec. Nts., 6/1/28 | | | 189,000 | | | | 194,025 | |
| | | | | | | 771,637 | |
| | | | | | | | | |
| Metals & Mining—0.4% | |
| Anglo American Capital plc, 3.625% Sr. Unsec. Nts., 9/11/243 | | | 86,000 | | | | 87,864 | |
| ArcelorMittal, 6.125% Sr. Unsec. Nts., 6/1/25 | | | 280,000 | | | | 318,374 | |
| Steel Dynamics, Inc., 4.125% Sr. Unsec. Nts., 9/15/25 | | | 316,000 | | | | 316,000 | |
| | | | | | | 722,238 | |
| | | | | | | | | |
| Paper & Forest Products—0.1% | |
| Louisiana-Pacific Corp., 4.875% Sr. Unsec. Nts., 9/15/24 | | | 199,000 | | | | 202,731 | |
| | | | | | | | |
| | | Principal
Amount | | | Value |
| Telecommunication Services—1.3% | |
| Diversified Telecommunication Services—1.1% | |
| AT&T, Inc.: | | | | | | | | |
| 4.30% Sr. Unsec. Nts., 2/15/30 | | $ | 331,000 | | | $ | 353,771 | |
| 4.35% Sr. Unsec. Nts., 6/15/45 | | | 48,000 | | | | 47,859 | |
| 4.50% Sr. Unsec. Nts., 3/9/48 | | | 142,000 | | | | 145,714 | |
| British Telecommunications plc: | | | | | |
| 4.50% Sr. Unsec. Nts., 12/4/23 | | | 202,000 | | | | 216,261 | |
| 9.625% Sr. Unsec. Nts., 12/15/30 | | | 272,000 | | | | 409,992 | |
| Deutsche Telekom International Finance BV, 4.375% Sr. Unsec. Nts., 6/21/283 | | | 146,000 | | | | 159,150 | |
| Telefonica Emisiones SA: | | | | | |
| 4.103% Sr. Unsec. Nts., 3/8/27 | | | 85,000 | | | | 90,339 | |
| 5.213% Sr. Unsec. Nts., 3/8/47 | | | 123,000 | | | | 135,664 | |
| T-Mobile USA, Inc., 6.50% Sr. Unsec. Nts., 1/15/26 | | | 280,000 | | | | 303,397 | |
| Verizon Communications, Inc.: | | | | | |
| 4.125% Sr. Unsec. Nts., 8/15/46 | | | 140,000 | | | | 146,202 | |
| 4.522% Sr. Unsec. Nts., 9/15/48 | | | 173,000 | | | | 193,516 | |
| | | | | | | 2,201,865 | |
| | | | | | | | | |
| Wireless Telecommunication Services—0.2% | |
| Vodafone Group plc, 3.75% Sr. Unsec. Nts., 1/16/24 | | | 332,000 | | | | 347,790 | |
| | | | | | | | | |
| Utilities—1.5% | |
| Electric Utilities—1.2% | |
| AEP Texas, Inc., 3.95% Sr. Unsec. Nts., 6/1/283 | | | 172,000 | | | | 183,908 | |
| Duke Energy Corp., 3.75% Sr. Unsec. Nts., 9/1/46 | | | 69,000 | | | | 67,579 | |
| Edison International, 2.125% Sr. Unsec. Nts., 4/15/20 | | | 60,000 | | | | 59,742 | |
| EDP Finance BV, 3.625% Sr. Unsec. Nts., 7/15/243 | | | 231,000 | | | | 238,144 | |
| Emera US Finance LP, 2.70% Sr. Unsec. Nts., 6/15/21 | | | 179,000 | | | | 179,623 | |
| Enel Finance International NV, 2.875% Sr. Unsec. Nts., 5/25/223 | | | 313,000 | | | | 315,494 | |
| Exelon Corp.: | | | | | | | | |
| 2.45% Sr. Unsec. Nts., 4/15/21 | | | 165,000 | | | | 164,968 | |
| 4.45% Sr. Unsec. Nts., 4/15/46 | | | 87,000 | | | | 92,619 | |
| FirstEnergy Corp., 3.90% Sr. Unsec. Nts., 7/15/27 | | | 184,000 | | | | 193,162 | |
| Mid-Atlantic Interstate Transmission LLC, 4.10% Sr. Unsec. Nts., 5/15/283 | | | 171,000 | | | | 182,128 | |
| NextEra Energy Operating Partners LP, 4.25% Sr. Unsec. Nts., 9/15/243 | | | 314,000 | | | | 316,842 | |
| PPL WEM Ltd./Western Power Distribution Ltd., 5.375% Sr. Unsec. Nts., 5/1/213 | | | 317,000 | | | | 328,105 | |
| | | | | | | 2,322,314 | |
| | | | | | | | | |
| Independent Power and Renewable Electricity Producers—0.1% | |
| NRG Energy, Inc., 4.45% Sr. Sec. Nts., 6/15/293 | | | 156,000 | | | | 162,477 | |
| | | | | | | | | |
| Multi-Utilities—0.2% | |
| CenterPoint Energy, Inc., 4.25% Sr. Unsec. Nts., 11/1/28 | | | 147,000 | | | | 158,924 | |
| Dominion Energy, Inc., 2.715% Jr. Sub. Nts., 8/15/2111 | | | 197,000 | | | | 197,311 | |
| | | | | | | 356,235 | |
| Total Non-Convertible Corporate Bonds and Notes (Cost $56,959,695) | | | | | | | 59,523,313 | |
16 INVESCO OPPENHEIMER V.I. CONSERVATIVE BALANCED FUND
| | | | | | | | |
| | | Shares | | | Value | |
| Investment Company—2.8% | | | | | |
| Invesco Oppenheimer Institutional Government Money Market Fund, Cl. IN, 2.37%14(Cost $5,367,607) | | | 5,367,607 | | | $ | 5,367,607 | |
Total Investments, at Value (Cost
$197,251,754) | | | 109.7% | | | | 211,652,932 | |
| Net Other Assets (Liabilities) | | | (9.7 | ) | | | (18,790,136 | ) |
| Net Assets | | | 100.0% | | | $ | 192,862,796 | |
| | | | |
Footnotes to Statement of Investments
1. Non-income producing security.
2. Security is a Master Limited Partnership.
3. Represents securities sold under Rule 144A, which are exempt from registration under the Securities Act of 1933, as amended. These securities have been determined to be liquid under guidelines established by the Board of Trustees. These securities amount to $30,687,286 or 15.91% of the Fund’s net assets at period end.
4. Represents the current interest rate for a variable or increasing rate security, which may be fixed for a predetermined period. The interest rate is, or will be as of an established date, determined as [Referenced Rate + Basis-point spread].
5. Restricted security. The aggregate value of restricted securities at period end was $170,540, which represents 0.09% of the Fund’s net assets. Information concerning restricted securities is as follows:
| | | | | | | | | | | | | | | | |
| Security | | Acquisition
Dates | | | Cost | | | Value | | | Unrealized Appreciation/
(Depreciation) | |
| GLS Auto Receivables Trust, Series 2018-1A, Cl. A, 2.82%, 7/15/22 | | | 1/30/18 | | | $ | 170,275 | | | $ | 170,540 | | | $ | 265 | |
6. Interest-Only Strips represent the right to receive the monthly interest payments on an underlying pool of mortgage loans. These securities typically decline in price as interest rates decline. Most other fixed income securities increase in price when interest rates decline. The principal amount of the underlying pool represents the notional amount on which current interest is calculated. The price of these securities is typically more sensitive to changes in prepayment rates than traditional mortgage-backed securities (for example, GNMA pass-throughs). Interest rates disclosed represent current yields based upon the current cost basis and estimated timing and amount of future cash flows. These securities amount to $2,410,497 or 1.25% of the Fund’s net assets at period end.
7. Interest rate is less than 0.0005%.
8. Principal-Only Strips represent the right to receive the monthly principal payments on an underlying pool of mortgage loans. The value of these securities generally increases as interest rates decline and prepayment rates rise. The price of these securities is typically more volatile than that of coupon-bearing bonds of the same maturity. Interest rates disclosed represent current yields based upon the current cost basis and estimated timing of future cash flows. These securities amount to $32,195 or 0.02% of the Fund’s net assets at period end.
9. All or a portion of the security position is when-issued or delayed delivery to be delivered and settled after period end. See Note 1N of the accompanying Notes.
10. The current amortization rate of the security’s cost basis exceeds the future interest payments currently estimated to be received. Both the amortization rate and interest payments are contingent on future mortgage pre-payment speeds and are therefore subject to change.
11. This interest rate resets periodically. Interest rate shown reflects the rate in effect at period end. The rate on this variable rate security is not based on a published reference rate and spread but is determined by the issuer or agent based on current market conditions.
12. This bond has no contractual maturity date, is not redeemable and contractually pays an indefinite stream of interest.
13. Represents securities sold under Regulation S, which are exempt from registration under the Securities Act of 1933, as amended. These securities may not be offered or sold in the United States without and exemption from, or in a transaction not subject to, the registration requirements of the Securities Act of 1933. These securities amount to $339,700 or 0.18% of the Fund’s net assets at period end.
14. The money market fund and the Fund are affiliated by having the same investment adviser. The rate shown is the 7-day SEC standardized yield as of June 30, 2019.
| | | | | | | | | | | | | | | | | | | | | | | | |
| Futures Contracts as of June 30, 2019 | | | | | | | | | | | | | | | | | |
| Description | | Buy/Sell | | | Expiration Date | | | Number of
Contracts | | | Notional Amount (000’s) | | | Value | | | Unrealized Appreciation/ (Depreciation) |
| United States Treasury Long Bonds | | | Buy | | | | 9/19/19 | | | | 22 | | | | USD 3,390 | | | $ | 3,423,062 | | | $ | 32,703 | |
| United States Treasury Nts., 10 yr. | | | Buy | | | | 9/19/19 | | | | 32 | | | | USD 4,072 | | | | 4,095,000 | | | | 23,158 | |
| United States Treasury Nts., 2 yr. | | | Sell | | | | 9/30/19 | | | | 38 | | | | USD 8,172 | | | | 8,176,828 | | | | (4,948 | ) |
| United States Treasury Nts., 5 yr. | | | Sell | | | | 9/30/19 | | | | 28 | | | | USD 3,268 | | | | 3,308,375 | | | | (40,471 | ) |
| United States Ultra Bonds | | | Buy | | | | 9/19/19 | | | | 62 | | | | USD 10,604 | | | | 11,008,875 | | | | 405,352 | |
| | | | | | | | | | | | | | | | | | | | | | $ | 415,794 | |
| | | | | | | | | | | | | | | | | | | | | | | | |
| | | | | | | | | | | | | | | | | | | | | | | | | | | | |
| Over-the-Counter Total Return Swaps at June 30, 2019 | |
| Reference Asset | | Counterparty | | | Pay/Receive Total
Return* | | | Floating Rate | | | Maturity Date | | | Notional Amount (000’s) | | | Value | | | Unrealized
Appreciation/
(Depreciation) | |
| iBoxx USD Liquid IG Series 1 Version 1 | | | GSCO-OT | | | | Pay | | | | USD BBA LIBOR | | | | 9/26/19 | | | | USD 5,237 | | | $ | (402,869 | ) | | $ | (402,869) | |
* Fund will pay or receive the total return of the reference asset depending on whether the return is positive or negative. For contracts where the Fund has elected to receive the total return of the reference asset if positive, it will be responsible for paying the floating rate and the total return of the reference asset if negative. If the Fund has elected to pay the total return of the reference asset if positive, it will receive the floating rate and the total return of the reference asset if negative.
Glossary:
17 INVESCO OPPENHEIMER V.I. CONSERVATIVE BALANCED FUND
STATEMENT OF INVESTMENTSUnaudited / Continued
Counterparty Abbreviations
| | |
| GSCO-OT | | Goldman Sachs Bank USA |
| |
| Definitions | | |
| BBA LIBOR | | British Bankers’ Association London - Interbank Offered Rate |
| H15T5Y | | US Treasury Yield Curve Rate T Note Constant Maturity 5 Year |
| H15T1Y | | US Treasury Yield Curve Rate T Note Constant Maturity 1 Year |
| ICE LIBOR | | Intercontinental Exchange London Interbank Offered Rate |
| LIBOR01M | | ICE LIBOR USD 1 Month |
| US0001M | | ICE LIBOR USD 1 Month |
| US0003M | | ICE LIBOR USD 3 Month |
| USISDA05 | | USD ICE Swap Rate 11:00am NY 5 Year |
| USSW5 | | USD Swap Semi 30/360 5 Year |
See accompanying Notes to Financial Statements.
18 INVESCO OPPENHEIMER V.I. CONSERVATIVE BALANCED FUND
STATEMENT OF ASSETS AND LIABILITIESJune 30, 2019 Unaudited
| | | | |
| Assets | | | | |
| Investments, at value—see accompanying statement of investments: | | | | |
| Unaffiliated companies (cost $191,884,147) | | $ | 206,285,325 | |
| Affiliated companies (cost $5,367,607) | | | 5,367,607 | |
| | | | 211,652,932 | |
| Cash | | | 21,721,620 | |
| Cash used for collateral on futures | | | 420,000 | |
| Receivables and other assets: | | | | |
| Investments sold (including $12,630,649 sold on a when-issued or delayed delivery basis) | | | 13,415,190 | |
| Interest and dividends | | | 743,234 | |
| Variation margin receivable | | | 2,915 | |
| Shares of beneficial interest sold | | | 1,106 | |
| Other | | | 111,610 | |
| Total assets | | | 248,068,607 | |
| Liabilities | | | | |
| Swaps, at value | | | 402,869 | |
| Payables and other liabilities: | | | | |
| Investments purchased (including $54,410,706 purchased on a when-issued or delayed delivery basis) | | | 54,497,725 | |
| Shares of beneficial interest redeemed | | | 90,962 | |
| Trustees’ compensation | | | 56,453 | |
| Administration fee | | | 26,767 | |
| Variation margin payable | | | 12,974 | |
| Management fee | | | 11,835 | |
| Distribution and service plan fees | | | 9,344 | |
| Shareholder communications | | | 6,274 | |
| Transfer and shareholder servicing agent fees | | | 4,374 | |
| Other | | | 86,234 | |
| Total liabilities | | | 55,205,811 | |
| Net Assets | | $ | 192,862,796 | |
| | | | |
| | | | |
| Composition of Net Assets | | | | |
| Shares of beneficial interest | | $ | 175,147,102 | |
| Total distributable earnings | | | 17,715,694 | |
| Net Assets | | $ | 192,862,796 | |
| | | | |
| | | | |
| Net Asset Value Per Share | | | | |
| Series I Shares: | | | | |
| Net asset value, redemption price per share and offering price per share (based on net assets of $146,951,297 and 9,458,944 shares of beneficial interest outstanding) | | | $15.54 | |
| Series II Shares: | | | | |
| Net asset value, redemption price per share and offering price per share (based on net assets of $45,911,499 and 2,991,566 shares of beneficial interest outstanding) | | | $15.35 | |
See accompanying Notes to Financial Statements.
19 INVESCO OPPENHEIMER V.I. CONSERVATIVE BALANCED FUND
STATEMENT OF OPERATIONSFor the Six Months Ended June 30, 2019 Unaudited
| | | | |
| Investment Income | | | | |
| Interest | | $ | 2,048,624 | |
| Dividends: | | | | |
| Unaffiliated companies (net of foreign withholding taxes of $4,042) | | | 595,311 | |
| Affiliated companies | | | 63,265 | |
Total investment income | | | 2,707,200 | |
| Expenses | | | | |
| Management fees | | | 707,216 | |
| Administration fees | | | 28,965 | |
| Distribution and service plan fees — Series II shares | | | 55,732 | |
| Transfer and shareholder servicing agent fees: | | | | |
| Series I shares | | | 72,374 | |
| Series II shares | | | 22,249 | |
| Shareholder communications: | | | | |
| Series I shares | | | 17,648 | |
| Series II shares | | | 5,451 | |
| Custodian fees and expenses | | | 26,507 | |
| Trustees’ compensation | | | 5,787 | |
| Borrowing fees | | | 2,380 | |
| Other | | | 36,235 | |
| Total expenses | | | 980,544 | |
| Less reduction to custodian expenses | | | (1,041) | |
| Less waivers and reimbursements of expenses | | | (287,297) | |
Net expenses | | | 692,206 | |
Net Investment Income | | | 2,014,994 | |
| Realized and Unrealized Gain (Loss) | | | | |
| Net realized gain on: | | | | |
| Investment transactions (includes net losses from securities sold to affiliates of $107,880) | | | 944,599 | |
| Futures contracts | | | 930,865 | |
| Foreign currency transactions | | | 2,170 | |
| Swap contracts | | | 36,858 | |
| Net realized gain | | | 1,914,492 | |
| Net change in unrealized appreciation/(depreciation) on: | | | | |
| Investment transactions | | | 17,783,294 | |
| Translation of assets and liabilities denominated in foreign currencies | | | (14) | |
| Futures contracts | | | 69,523 | |
| Swap contracts | | | (402,869) | |
Net change in unrealized appreciation/(depreciation) | | | 17,449,934 | |
| Net Increase in Net Assets Resulting from Operations | | $ | 21,379,420 | |
| | | | |
See accompanying Notes to Financial Statements.
20 INVESCO OPPENHEIMER V.I. CONSERVATIVE BALANCED FUND
STATEMENTS OF CHANGES IN NET ASSETS
| | | | | | | | |
| | | Six Months Ended
June 30, 2019
(Unaudited) | | Year Ended
December 31, 2018 | |
| Operations | | | | | | | | |
| Net investment income | | $ | 2,014,994 | | | $ | 4,046,190 | |
| Net realized gain | | | 1,914,492 | | | | 3,099,921 | |
| Net change in unrealized appreciation/(depreciation) | | | 17,449,934 | | | | (17,786,939) | |
Net increase (decrease) in net assets resulting from operations | | | 21,379,420 | | | | (10,640,828) | |
| Dividends and/or Distributions to Shareholders | | | | | | | | |
| Distributions to shareholders from distributable earnings: | | | | | | | | |
| Series I shares | | | (5,596,424 | ) | | | (6,688,120) | |
| Series II shares | | | (1,648,251 | ) | | | (1,986,593) | |
Total distributions from distributable earnings | | | (7,244,675 | ) | | | (8,674,713) | |
| Beneficial Interest Transactions | | | | | | | | |
| Net increase (decrease) in net assets resulting from beneficial interest transactions: | | | | | | | | |
| Series I shares | | | (4,134,573 | ) | | | (10,990,551) | |
| Series II shares | | | (456,529 | ) | | | (4,022,754) | |
Total beneficial interest transactions | | | (4,591,102 | ) | | | (15,013,305) | |
| Net Assets | | | | | | | | |
| Total increase (decrease) | | | 9,543,643 | | | | (34,328,846) | |
| Beginning of period | | | 183,319,153 | | | | 217,647,999 | |
| End of period | | $ | 192,862,796 | | | $ | 183,319,153 | |
| | | | | | | | |
See accompanying Notes to Financial Statements.
21 INVESCO OPPENHEIMER V.I. CONSERVATIVE BALANCED FUND
FINANCIAL HIGHLIGHTS
| | | | | | | | | | | | | | | | | | | | | | | | |
| Series I Shares | | Six Months Ended June 30, 2019 (Unaudited) | | | Year Ended
December 31, 2018 | | | Year Ended December 31,
2017 | | | Year Ended
December 31,
2016 | | | Year Ended
December 31,
2015 | | | Year Ended
December 31,
2014 | |
| Per Share Operating Data | | | | | | | | | | | | | | | | | | | | | | | | |
| Net asset value, beginning of period | | | $14.43 | | | | $15.92 | | | | $14.86 | | | | $14.46 | | | | $14.67 | | | | $13.84 | |
| Income (loss) from investment operations: | | | | | | | | | | | | | | | | | | | | | | | | |
| Net investment income1 | | | 0.17 | | | | 0.32 | | | | 0.27 | | | | 0.26 | | | | 0.31 | | | | 0.29 | |
| Net realized and unrealized gain (loss) | | | 1.55 | | | | (1.13) | | | | 1.09 | | | | 0.49 | | | | (0.18) | | | | 0.83 | |
| Total from investment operations | | | 1.72 | | | | (0.81) | | | | 1.36 | | | | 0.75 | | | | 0.13 | | | | 1.12 | |
| Dividends and/or distributions to shareholders: | | | | | | | | | | | | | | | | | | | | | | | | |
| Dividends from net investment income | | | (0.36) | | | | (0.31) | | | | (0.30) | | | | (0.35) | | | | (0.34) | | | | (0.29) | |
| Distributions from net realized gain | | | (0.25) | | | | (0.37) | | | | 0.00 | | | | 0.00 | | | | 0.00 | | | | 0.00 | |
| Total dividends and/or distributions to shareholders | | | (0.61) | | | | (0.68) | | | | (0.30) | | | | (0.35) | | | | (0.34) | | | | (0.29) | |
| Net asset value, end of period | | | $15.54 | | | | $14.43 | | | | $15.92 | | | | $14.86 | | | | $14.46 | | | | $14.67 | |
| | | | | | | | | | | | | | | | | | | | | | | | |
| | | | | | | | | | | | | | | | | | | | | | | | |
| Total Return, at Net Asset Value2 | | | 11.97% | | | | (5.32)% | | | | 9.25% | | | | 5.26% | | | | 0.83% | | | | 8.20% | |
| | | | | | | | | | | | | | | | | | | | | | | | |
| Ratios/Supplemental Data | | | | | | | | | | | | | | | | | | | | | | | | |
| Net assets, end of period (in thousands) | | | $146,951 | | | | $140,290 | | | | $166,015 | | | | $172,573 | | | | $182,406 | | | | $203,684 | |
| Average net assets (in thousands) | | | $145,927 | | | | $155,024 | | | | $170,438 | | | | $177,368 | | | | $194,208 | | | | $208,556 | |
| Ratios to average net assets:3 | | | | | | | | | | | | | | | | | | | | | | | | |
| Net investment income | | | 2.19% | | | | 2.05% | | | | 1.74% | | | | 1.78% | | | | 2.09% | | | | 2.03% | |
| Expenses excluding specific expenses listed below | | | 0.98% | | | | 0.98% | | | | 0.94% | | | | 0.94% | | | | 0.91% | | | | 0.90% | |
| Interest and fees from borrowings | | | 0.00%4 | | | | 0.00%4 | | | | 0.00%4 | | | | 0.00%4 | | | | 0.00%4 | | | | 0.00% | |
| Total expenses5 | | | 0.98% | | | | 0.98% | | | | 0.94% | | | | 0.94% | | | | 0.91% | | | | 0.90% | |
| Expenses after payments, waivers and/or reimbursements and reduction to custodian expenses | | | 0.67% | | | | 0.67% | | | | 0.67% | | | | 0.67% | | | | 0.67% | | | | 0.67% | |
| Portfolio turnover rate6 | | | 31% | | | | 60% | | | | 76% | | | | 68% | | | | 68% | | | | 98% | |
1. Per share amounts calculated based on the average shares outstanding during the period.
2. Assumes an initial investment on the business day before the first day of the fiscal period, with all dividends and distributions reinvested in additional shares on the reinvestment date, and redemption at the net asset value calculated on the last business day of the fiscal period. Total returns are not annualized for periods less than one full year. Total return information does not reflect expenses that apply at the separate account level or to related insurance products. Inclusion of these charges would reduce the total return figures for all periods shown. Returns do not reflect the deduction of taxes that a shareholder would pay on fund distributions or the redemption of fund shares.
3. Annualized for periods less than one full year.
4. Less than 0.005%.
5. Total expenses including indirect expenses from affiliated fund fees and expenses were as follows:
| | | | | | | | |
| | Six Months Ended June 30, 2019 | | | 0.98 | % | | |
| | Year Ended December 31, 2018 | | | 0.98 | % | | |
| | Year Ended December 31, 2017 | | | 0.94 | % | | |
| | Year Ended December 31, 2016 | | | 0.94 | % | | |
| | Year Ended December 31, 2015 | | | 0.91 | % | | |
| | Year Ended December 31, 2014 | | | 0.90 | % | | |
6.The portfolio turnover rate excludes purchase and sale transactions of To Be Announced (TBA) mortgage-related securities as follows:
| | | | | | | | |
| | | Purchase Transactions | | | Sale Transactions | |
| Six Months Ended June 30, 2019 | | | $308,723,575 | | | | $305,434,198 | |
| Year Ended December 31, 2018 | | | $685,887,902 | | | | $703,549,464 | |
| Year Ended December 31, 2017 | | | $729,295,309 | | | | $711,803,922 | |
| Year Ended December 31, 2016 | | | $737,550,642 | | | | $742,753,245 | |
| Year Ended December 31, 2015 | | | $829,988,104 | | | | $849,696,153 | |
| Year Ended December 31, 2014 | | | $697,503,637 | | | | $678,765,376 | |
See accompanying Notes to Financial Statements.
22 INVESCO OPPENHEIMER V.I. CONSERVATIVE BALANCED FUND
| | | | | | | | | | | | | | | | | | | | | | | | |
| Series II Shares | | Six Months
Ended
June 30, 2019
(Unaudited) | | | Year Ended
December 31,
2018 | | | Year Ended
December 31,
2017 | | | Year Ended
December 31,
2016 | | | Year Ended
December 31,
2015 | | | Year Ended
December 31,
2014 | |
| Per Share Operating Data | | | | | | | | | | | | | | | | | | | | | | | | |
| Net asset value, beginning of period | | | $14.24 | | | | $15.71 | | | | $14.67 | | | | $14.28 | | | | $14.49 | | | | $13.66 | |
| Income (loss) from investment operations: | | | | | | | | | | | | | | | | | | | | | | | | |
| Net investment income1 | | | 0.15 | | | | 0.27 | | | | 0.23 | | | | 0.22 | | | | 0.27 | | | | 0.25 | |
| Net realized and unrealized gain (loss) | | | 1.53 | | | | (1.10) | | | | 1.07 | | | | 0.48 | | | | (0.18) | | | | 0.84 | |
| Total from investment operations | | | 1.68 | | | | (0.83) | | | | 1.30 | | | | 0.70 | | | | 0.09 | | | | 1.09 | |
| Dividends and/or distributions to shareholders: | | | | | | | | | | | | | | | | | | | | | | | | |
| Dividends from net investment income | | | (0.32) | | | | (0.27) | | | | (0.26) | | | | (0.31) | | | | (0.30) | | | | (0.26) | |
| Distributions from net realized gain | | | (0.25) | | | | (0.37) | | | | 0.00 | | | | 0.00 | | | | 0.00 | | | | 0.00 | |
| Total dividends and/or distributions to shareholders | | | (0.57) | | | | (0.64) | | | | (0.26) | | | | (0.31) | | | | (0.30) | | | | (0.26) | |
| Net asset value, end of period | | | $15.35 | | | | $14.24 | | | | $15.71 | | | | $14.67 | | | | $14.28 | | | | $14.49 | |
| | | | | | | | | | | | | | | | | | | | | | | | |
| | | | | | | | | | | | | | | | | | | | | | | | |
| Total Return, at Net Asset Value2 | | | 11.82% | | | | (5.53)% | | | | 8.95% | | | | 4.96% | | | | 0.57% | | | | 8.02% | |
| | | | | | | | | | | | | | | | | | | | | | | | |
| Ratios/Supplemental Data | | | | | | | | | | | | | | | | | | | | | | | | |
| Net assets, end of period (in thousands) | | | $45,911 | | | | $43,029 | | | | $51,633 | | | | $51,743 | | | | $52,226 | | | | $63,880 | |
| Average net assets (in thousands) | | | $44,964 | | | | $48,109 | | | | $51,345 | | | | $53,914 | | | | $59,085 | | | | $65,450 | |
| Ratios to average net assets:3 | | | | | | | | | | | | | | | | | | | | | | | | |
| Net investment income | | | 1.94% | | | | 1.80% | | | | 1.49% | | | | 1.53% | | | | 1.84% | | | | 1.78% | |
| Expenses excluding specific expenses listed below | | | 1.23% | | | | 1.23% | | | | 1.19% | | | | 1.19% | | | | 1.16% | | | | 1.15% | |
| Interest and fees from borrowings | | | 0.00%4 | | | | 0.00%4 | | | | 0.00%4 | | | | 0.00%4 | | | | 0.00%4 | | | | 0.00% | |
| Total expenses5 | | | 1.23% | | | | 1.23% | | | | 1.19% | | | | 1.19% | | | | 1.16% | | | | 1.15% | |
| Expenses after payments, waivers and/or reimbursements and reduction to custodian expenses | | | 0.92% | | | | 0.92% | | | | 0.92% | | | | 0.92% | | | | 0.92% | | | | 0.92% | |
| Portfolio turnover rate6 | | | 31% | | | | 60% | | | | 76% | | | | 68% | | | | 68% | | | | 98% | |
1. Per share amounts calculated based on the average shares outstanding during the period.
2. Assumes an initial investment on the business day before the first day of the fiscal period, with all dividends and distributions reinvested in additional shares on the reinvestment date, and redemption at the net asset value calculated on the last business day of the fiscal period. Total returns are not annualized for periods less than one full year. Total return information does not reflect expenses that apply at the separate account level or to related insurance products. Inclusion of these charges would reduce the total return figures for all periods shown. Returns do not reflect the deduction of taxes that a shareholder would pay on fund distributions or the redemption of fund shares.
3. Annualized for periods less than one full year.
4. Less than 0.005%.
5. Total expenses including indirect expenses from affiliated fund fees and expenses were as follows:
| | | | | | | | |
| | Six Months Ended June 30, 2019 | | | 1.23 | % | | |
| | Year Ended December 31, 2018 | | | 1.23 | % | | |
| | Year Ended December 31, 2017 | | | 1.19 | % | | |
| | Year Ended December 31, 2016 | | | 1.19 | % | | |
| | Year Ended December 31, 2015 | | | 1.16 | % | | |
| | Year Ended December 31, 2014 | | | 1.15 | % | | |
6. The portfolio turnover rate excludes purchase and sale transactions of To Be Announced (TBA) mortgage-related securities as follows:
| | | | | | | | |
| | | Purchase Transactions | | | Sale Transactions | |
| Six Months Ended June 30, 2019 | | | $308,723,575 | | | | $305,434,198 | |
| Year Ended December 31, 2018 | | | $685,887,902 | | | | $703,549,464 | |
| Year Ended December 31, 2017 | | | $729,295,309 | | | | $711,803,922 | |
| Year Ended December 31, 2016 | | | $737,550,642 | | | | $742,753,245 | |
| Year Ended December 31, 2015 | | | $829,988,104 | | | | $849,696,153 | |
| Year Ended December 31, 2014 | | | $697,503,637 | | | | $678,765,376 | |
See accompanying Notes to Financial Statements.
23 INVESCO OPPENHEIMER V.I. CONSERVATIVE BALANCED FUND
NOTES TO FINANCIAL STATEMENTS June 30, 2019 Unaudited
Note 1 -Significant Accounting Policies
Invesco Oppenheimer V.I. Conservative Balanced Fund (the “Fund”) is a series portfolio of is a series portfolio of AIM Variable Insurance Funds (Invesco Variable Insurance Funds) (the “Trust”). The Trust is a Delaware statutory trust registered under the Investment Company Act of 1940, as amended (the “1940 Act”), as an open-end series management investment company authorized to issue an unlimited number of shares of beneficial interest. Information presented in these financial statements pertains only to the Fund. Matters affecting the Fund or each class will be voted on exclusively by the shareholders of such Fund or each class.
Prior to the close of business on May 24, 2019, the Fund operated as Oppenheimer Conservative Balanced Fund/VA (the “Acquired Fund” or “Predecessor Fund”). The Acquired Fund was reorganized after the close of business on May 24, 2019 (the “Reorganization Date”) through the transfer of all of its assets and liabilities to the Fund (the “Reorganization”).
Upon closing of the Reorganization, holders of the Acquired Fund’s Non-Service and Service shares received Series I and Series II shares of the Fund, respectively. Information for the Acquired Fund’s Non-Service and Service shares prior to the Reorganization is included with Series I and Series II, respectively, throughout this report.
The Fund’s investment objective is to seek total return.
The Fund currently offers two classes of shares, Series I and Series II, both of which are offered to insurance company separate accounts funding variable annuity contracts and variable life insurance policies (“variable products”).
The Fund is an investment company and accordingly follows the investment company accounting and reporting guidance in accordance with Financial Accounting Standards Board Accounting Standards Codification Topic 946, Financial Services – Investment Companies.
The following is a summary of the significant accounting policies followed by the Fund in the preparation of its financial statements.
| A. | Security Valuations - Securities, including restricted securities, are valued according to the following policy. |
Debt obligations (including convertible securities) and unlisted equities are fair valued using an evaluated quote provided by an independent pricing service. Evaluated quotes provided by the pricing service may be determined without exclusive reliance on quoted prices, and may reflect appropriate factors such as institution-size trading in similar groups of securities, developments related to specific securities, dividend rate (for unlisted equities), yield (for debt obligations), quality, type of issue, coupon rate (for debt obligations), maturity (for debt obligations), individual trading characteristics and other market data. Pricing services generally value debt obligations assuming orderly transactions of institutional round lot size, but a fund may hold or transact in the same securities in smaller, odd lot sizes. Odd lots often trade at lower prices than institutional round lots. Debt obligations are subject to interest rate and credit risks. In addition, all debt obligations involve some risk of default with respect to interest and/or principal payments.
A security listed or traded on an exchange (except convertible securities) is valued at its last sales price or official closing price as of the close of the customary trading session on the exchange where the security is principally traded, or lacking any sales or official closing price on a particular day, the security may be valued at the closing bid price on that day. Securities traded in the over-the-counter market are valued based on prices furnished by independent pricing services or market makers. When such securities are valued by an independent pricing service they may be considered fair valued. Futures contracts are valued at the final settlement price set by an exchange on which they are principally traded. Listed options are valued at the mean between the last bid and asked prices from the exchange on which they are principally traded. Options not listed on an exchange are valued by an independent source at the mean between the last bid and asked prices. For purposes of determining net asset value (“NAV”) per share, futures and option contracts generally are valued 15 minutes after the close of the customary trading session of the New York Stock Exchange (“NYSE”).
Investments in open-end and closed-end registered investment companies that do not trade on an exchange are valued at the end-of-day net asset value per share. Investments in open-end and closed-end registered investment companies that trade on an exchange are valued at the last sales price or official closing price as of the close of the customary trading session on the exchange where the security is principally traded.
Swap agreements are fair valued using an evaluated quote, if available, provided by an independent pricing service. Evaluated quotes provided by the pricing service are valued based on a model which may include end-of-day net present values, spreads, ratings, industry, company performance and returns of referenced assets. Centrally cleared swap agreements are valued at the daily settlement price determined by the relevant exchange or clearinghouse.
Foreign securities’ (including foreign exchange contracts) prices are converted into U.S. dollar amounts using the applicable exchange rates as of the close of the NYSE. If market quotations are available and reliable for foreign exchange-traded equity securities, the securities will be valued at the market quotations. Because trading hours for certain foreign securities end before the close of the NYSE, closing market quotations may become unreliable. If between the time trading ends on a particular security and the close of the customary trading session on the NYSE, events occur that the investment adviser determines are significant and make the closing price unreliable, the Fund may fair value the security. If the event is likely to have affected the closing price of the security, the security will be valued at fair value in good faith using procedures approved by the Board of Trustees. Adjustments to closing prices to reflect fair value may also be based on a screening process of an independent pricing service to indicate the degree of certainty, based on historical data, that the closing price in the principal market where a foreign security trades is not the current value as of the close of the NYSE. Foreign securities’ prices meeting the approved degree of certainty that the price is not reflective of current value will be priced at the indication of fair value from the independent pricing service. Multiple factors may be considered by the independent pricing service in determining adjustments to reflect fair value and may include information relating to sector indices, American Depositary Receipts and domestic and foreign index futures. Foreign securities may have additional risks including exchange rate changes, potential for sharply devalued currencies and high inflation, political and economic upheaval, the relative lack of issuer information, relatively low market liquidity and the potential lack of strict financial and accounting controls and standards.
Securities for which market prices are not provided by any of the above methods may be valued based upon quotes furnished by independent sources. The last bid price may be used to value equity securities. The mean between the last bid and asked prices is used to value debt obligations,
24 INVESCO OPPENHEIMER V.I. CONSERVATIVE BALANCED FUND
Note 1 -Significant Accounting Policies (continued)
including corporate loans.
Securities for which market quotations are not readily available or became unreliable are valued at fair value as determined in good faith by or under the supervision of the Trust’s officers following procedures approved by the Board of Trustees. Issuer specific events, market trends, bid/ asked quotes of brokers and information providers and other market data may be reviewed in the course of making a good faith determination of a security’s fair value.
The Fund may invest in securities that are subject to interest rate risk, meaning the risk that the prices will generally fall as interest rates rise and, conversely, the prices will generally rise as interest rates fall. Specific securities differ in their sensitivity to changes in interest rates depending on their individual characteristics. Changes in interest rates may result in increased market volatility, which may affect the value and/or liquidity of certain Fund investments.
Valuations change in response to many factors including the historical and prospective earnings of the issuer, the value of the issuer’s assets, general economic conditions, interest rates, investor perceptions and market liquidity. Because of the inherent uncertainties of valuation, the values reflected in the financial statements may materially differ from the value received upon actual sale of those investments.
| B. | Securities Transactions and Investment Income -Securities transactions are accounted for on a trade date basis. Realized gains or losses on sales are computed on the basis of specific identification of the securities sold. Interest income (net of withholding tax, if any) is recorded on the accrual basis from settlement date. Bond premiums and discounts are amortized and/or accreted over the lives of the respective securities. Pay-in-kind interest income and non-cash dividend income received in the form of securities in-lieu of cash are recorded at the fair value of the securities received. Paydown gains and losses on mortgage and asset-backed securities are recorded as adjustments to interest income. Dividend income (net of withholding tax, if any) is recorded on the ex-dividend date. The Fund may periodically participate in litigation related to Fund investments. As such, the Fund may receive proceeds from litigation settlements. Any proceeds received are included in the Statement of Operations as realized gain (loss) for investments no longer held and as unrealized gain (loss) for investments still held. |
Brokerage commissions and mark ups are considered transaction costs and are recorded as an increase to the cost basis of securities purchased and/or a reduction of proceeds on a sale of securities. Such transaction costs are included in the determination of net realized and unrealized gain (loss) from investment transactions reported in the Statement of Operations and the Statement of Changes in Net Assets and the net realized and unrealized gains (losses) on securities per share in the Financial Highlights. Transaction costs are included in the calculation of the Fund’s net asset value and, accordingly, they reduce the Fund’s total returns. These transaction costs are not considered operating expenses and are not reflected in net investment income reported in the Statement of Operations and the Statement of Changes in Net Assets, or the net investment income per share and the ratios of expenses and net investment income reported in the Financial Highlights, nor are they limited by any expense limitation arrangements between the Fund and the investment adviser.
The Fund allocates income and realized and unrealized capital gains and losses to a class based on the relative net assets of each class.
| C. | Country Determination- For the purposes of making investment selection decisions and presentation in the Schedule of Investments, the investment adviser may determine the country in which an issuer is located and/or credit risk exposure based on various factors. These factors include the laws of the country under which the issuer is organized, where the issuer maintains a principal office, the country in which the issuer derives 50% or more of its total revenues and the country that has the primary market for the issuer’s securities, as well as other criteria. Among the other criteria that may be evaluated for making this determination are the country in which the issuer maintains 50% or more of its assets, the type of security, financial guarantees and enhancements, the nature of the collateral and the sponsor organization. Country of issuer and/or credit risk exposure has been determined to be the United States of America, unless otherwise noted. |
| D. | Distributions - Dividends and distributions to shareholders, which are determined in accordance with income tax regulations and may differ from U.S. GAAP, are recorded on the ex-dividend date. Income and capital gain distributions, if any, are declared and paid annually or at other times as determined necessary by the Adviser. |
The tax character of distributions is determined as of the Fund’s fiscal year end. Therefore, a portion of the Fund’s distributions made to shareholders prior to the Fund’s fiscal year end may ultimately be categorized as a tax return of capital.
| E. | Master Limited Partnerships - The Fund invests in Master Limited Partnerships (“MLPs”). MLPs are publicly traded partnerships and limited liability companies taxed as partnerships under the Internal Revenue Code of 1986, as amended (the “Internal Revenue Code”). The Fund invests in MLPs engaged in, among other things, the transportation, storage, processing, refining, marketing, exploration, production and mining of minerals and natural resources. The Fund is a partner in each MLP; accordingly, the Fund is required to take into account the Fund’s allocable share of income, gains, losses, deductions, expenses, and tax credits recognized by each MLP. |
MLP’s may be less liquid and subject to more abrupt or erratic price movements than conventional publicly traded securities.
| F. | Return of Capital -Distributions received from the Fund’s investments in MLPs generally are comprised of income and return of capital. The Fund records investment income and return of capital based on estimates made at the time such distributions are received. The return of capital portion of the distribution is a reduction to investment income that results in an equivalent reduction in the cost basis of the associated investments and increases net realized gains (losses) and change in unrealized appreciation (depreciation). Such estimates are based on historical information available from each MLP and other industry sources. These estimates will subsequently be revised and may materially differ primarily based on information received from the MLPs after their tax reporting periods are concluded. |
| G. | Federal Income Taxes -The Fund intends to comply with provisions of the Internal Revenue Code applicable to regulated investment companies and to distribute substantially all of its investment company taxable income to shareholders. Therefore, no federal income or excise tax provision is required. The Fund files income tax returns in U.S. federal and applicable state jurisdictions. The statute of limitations on the Fund’s tax return filings generally remains open for the three preceding fiscal reporting period ends. The Fund has analyzed its tax positions for the fiscal year ended December |
25 INVESCO OPPENHEIMER V.I. CONSERVATIVE BALANCED FUND
NOTES TO FINANCIAL STATEMENTSUnaudited / Continued
Note 1 -Significant Accounting Policies (continued)
31, 2018, including open tax years, and does not believe there are any uncertain tax positions requiring recognition in the Fund’s financial statements.
During the fiscal year ended December 31, 2018, the Fund or did not utilize any capital loss carryforwards to offset capital gains realized in that fiscal year.
At period end, it is estimated that the capital loss carryforwards would be zero. The estimated capital loss carryforward represents the carryforward as of the end of the last fiscal year, increased or decreased by capital losses or gains realized in the first six months of the current fiscal year. During the reporting period, it is estimated that the Fund will not utilize any capital loss carryforward to offset realized capital gains.
Net investment income (loss) and net realized gain (loss) may differ for financial statement and tax purposes. The character of dividends and distributions made during the fiscal year from net investment income or net realized gains are determined in accordance with federal income tax requirements, which may differ from the character of net investment income or net realized gains presented in those financial statements in accordance with U.S. GAAP. Also, due to timing of dividends and distributions, the fiscal year in which amounts are distributed may differ from the fiscal year in which the income or net realized gain was recorded by the Fund.
The aggregate cost of securities and other investments and the composition of unrealized appreciation and depreciation of securities and other investments for federal income tax purposes at period end are noted in the following table. The primary difference between book and tax appreciation or depreciation of securities and other investments, if applicable, is attributable to the tax deferral of losses or tax realization of financial statement unrealized gain or loss.
| | | | |
| Federal tax cost of securities | | $ | 197,338,566 | |
| Federal tax cost of other investments | | | 6,625,940 | |
| | | | |
| Total federal tax cost | | $ | 203,964,506 | |
| | | | |
| Gross unrealized appreciation | | $ | 18,399,142 | |
| Gross unrealized depreciation | | | (4,072,400 | ) |
| | | | |
| Net unrealized appreciation | | $ | 14,326,742 | |
| | | | |
| H. | Expenses -Fees provided for under the Rule 12b-1 plan of a particular class of each Fund and which are directly attributable to that class are charged to the operations of such class. All other expenses of each respective Fund are allocated among the classes of such Fund based on relative net assets. |
| I. | Accounting Estimates -The financial statements are prepared on a basis in conformity with accounting principles generally accepted in the United States of America (“GAAP”), which requires management to make estimates and assumptions that affect the reported amounts of assets and liabilities at the date of the financial statements and the reported amounts of revenues and expenses during the reporting period including estimates and assumptions related to taxation. Actual results could differ from those estimates by a significant amount. In addition, the Fund monitors for material events or transactions that may occur or become known after the period-end date and before the date the financial statements are released to print. |
| J. | Indemnifications -Under the Trust’s organizational documents, each Trustee, officer, employee or other agent of the Trust is indemnified against certain liabilities that may arise out of the performance of their duties to the Fund. Additionally, in the normal course of business, the Fund enters into contracts, including the Fund’s servicing agreements, that contain a variety of indemnification clauses. The Fund’s maximum exposure under these arrangements is unknown as this would involve future claims that may be made against the Fund that have not yet occurred. The risk of material loss as a result of such indemnification claims is considered remote. |
| K. | Foreign Currency Translations -Foreign currency is valued at the close of the NYSE based on quotations posted by banks and major currency dealers. Portfolio securities and other assets and liabilities denominated in foreign currencies are translated into U.S. dollar amounts at the date of valuation. Purchases and sales of portfolio securities (net of foreign taxes withheld on disposition) and income items denominated in foreign currencies are translated into U.S. dollar amounts on the respective dates of such transactions. The Fund does not separately account for the portion of the results of operations resulting from changes in foreign exchange rates on investments and the fluctuations arising from changes in market prices of securities held. The combined results of changes in foreign exchange rates and the fluctuation of market prices on investments (net of estimated foreign tax withholding) are included with the net realized and unrealized gain or loss from investments transactions in the Statement of Operations. Reported net realized foreign currency gains or losses arise from (1) sales of foreign currencies, (2) currency gains or losses realized between the trade and settlement dates on securities transactions, and (3) the difference between the amounts of dividends, interest, and foreign withholding taxes recorded on the Fund’s books and the U.S. dollar equivalent of the amounts actually received or paid. Net unrealized foreign currency gains and losses arise from changes in the fair values of assets and liabilities, other than investments in securities at fiscal period end, resulting from changes in exchange rates. The Fund may invest in foreign securities, which may be subject to foreign taxes on income, gains on investments or currency repatriation, a portion of which may be recoverable. Foreign taxes, if any, are recorded based on the tax regulations and rates that exist in the foreign markets in which the Fund invests and are shown in the Statement of Operations. |
| L. | Futures -The Fund may enter into futures contracts to manage exposure to interest rate, equity and market price movements and/or currency risks. A futures contract is an agreement between Counterparties to purchase or sell a specified underlying security, currency or commodity (or delivery of a cash settlement price, in the case of an index future) for a fixed price at a future date. The Fund currently invests only in exchange-traded futures and they are standardized as to maturity date and underlying financial instrument. Initial margin deposits required upon entering into futures contracts are satisfied by the segregation of specific securities or cash as collateral at the futures commission merchant (broker). During the period the futures contracts are open, changes in the value of the contracts are recognized as unrealized gains or losses by recalculating the value of the contracts on a daily basis. Subsequent or variation margin payments are received or made depending upon whether unrealized gains or losses are incurred. |
26 INVESCO OPPENHEIMER V.I. CONSERVATIVE BALANCED FUND
Note 1 -Significant Accounting Policies (continued)
These amounts are reflected as receivables or payables on the Statement of Assets and Liabilities. When the contracts are closed or expire, the Fund recognizes a realized gain or loss equal to the difference between the proceeds from, or cost of, the closing transaction and the Fund’s basis in the contract. The net realized gain (loss) and the change in unrealized gain (loss) on futures contracts held during the period is included on the Statement of Operations. The primary risks associated with futures contracts are market risk and the absence of a liquid secondary market. If the Fund were unable to liquidate a futures contract and/or enter into an offsetting closing transaction, the Fund would continue to be subject to market risk with respect to the value of the contracts and continue to be required to maintain the margin deposits on the futures contracts. Futures contracts have minimal Counterparty risk since the exchange’s clearinghouse, as Counterparty to all exchange-traded futures, guarantees the futures against default. Risks may exceed amounts recognized in the Statement of Assets and Liabilities.
| M. | Swap Agreements - The Fund may enter into various swap transactions, including interest rate, total return, index, currency and credit default swap contracts (“CDS”) for investment purposes or to manage interest rate, currency or credit risk. Such transactions are agreements between Counterparties. A swap agreement may be negotiated bilaterally and traded over-the-counter (“OTC”) between two parties (“uncleared/OTC”) or, in some instances, must be transacted through a future commission merchant (“FCM”) and cleared through a clearinghouse that serves as a central Counterparty (“centrally cleared swap”). These agreements may contain among other conditions, events of default and termination events, and various covenants and representations such as provisions that require the Fund to maintain a pre-determined level of net assets, and/or provide limits regarding the decline of the Fund’s NAV over specific periods of time. If the Fund were to trigger such provisions and have open derivative positions at that time, the Counterparty may be able to terminate such agreement and request immediate payment in an amount equal to the net liability positions, if any. |
Interest rate, total return, index, and currency swap agreements are two-party contracts entered into primarily to exchange the returns (or differentials in rates of returns) earned or realized on particular predetermined investments or instruments. The gross returns to be exchanged or “swapped” between the parties are calculated with respect to a notional amount, i.e., the return on or increase in value of a particular dollar amount invested at a particular interest rate or return of an underlying asset, in a particular foreign currency, or in a “basket” of securities representing a particular index.
In a centrally cleared swap, the Fund’s ultimate Counterparty is a central clearinghouse. The Fund initially will enter into centrally cleared swaps through an executing broker. When a fund enters into a centrally cleared swap, it must deliver to the central Counterparty (via the FCM) an amount referred to as “initial margin.” Initial margin requirements are determined by the central Counterparty, but an FCM may require additional initial margin above the amount required by the central Counterparty. Initial margin deposits required upon entering into centrally cleared swaps are satisfied by cash or securities as collateral at the FCM. Securities deposited as initial margin are designated on the Schedule of Investments and cash deposited is recorded on the Statement of Assets and Liabilities. During the term of a cleared swap agreement, a “variation margin” amount may be required to be paid by the Fund or may be received by the Fund, based on the daily change in price of the underlying reference instrument subject to the swap agreement and is recorded as a receivable or payable for variation margin in the Statement of Assets and Liabilities until the centrally cleared swap is terminated at which time a realized gain or loss is recorded.
A CDS is an agreement between Counterparties to exchange the credit risk of an issuer. A buyer of a CDS is said to buy protection by paying a fixed payment over the life of the agreement and in some situations an upfront payment to the seller of the CDS. If a defined credit event occurs (such as payment default or bankruptcy), the Fund as a protection buyer would cease paying its fixed payment, the Fund would deliver eligible bonds issued by the reference entity to the seller, and the seller would pay the full notional value, or the “par value”, of the referenced obligation to the Fund. A seller of a CDS is said to sell protection and thus would receive a fixed payment over the life of the agreement and an upfront payment, if applicable. If a credit event occurs, the Fund as a protection seller would cease to receive the fixed payment stream, the Fund would pay the buyer “par value” or the full notional value of the referenced obligation, and the Fund would receive the eligible bonds issued by the reference entity. In turn, these bonds may be sold in order to realize a recovery value. Alternatively, the seller of the CDS and its Counterparty may agree to net the notional amount and the market value of the bonds and make a cash payment equal to the difference to the buyer of protection. If no credit event occurs, the Fund receives the fixed payment over the life of the agreement. As the seller, the Fund would effectively add leverage to its portfolio because, in addition to its total net assets, the Fund would be subject to investment exposure on the notional amount of the CDS. In connection with these agreements, cash and securities may be identified as collateral in accordance with the terms of the respective swap agreements to provide assets of value and recourse in the event of default under the swap agreement or bankruptcy/insolvency of a party to the swap agreement. If a Counterparty becomes bankrupt or otherwise fails to perform its obligations due to financial difficulties, the Fund may experience significant delays in obtaining any recovery in a bankruptcy or other reorganization proceeding. The Fund may obtain only limited recovery or may obtain no recovery in such circumstances. The Fund’s maximum risk of loss from Counterparty risk, either as the protection seller or as the protection buyer, is the value of the contract. The risk may be mitigated by having a master netting arrangement between the Fund and the Counterparty and by the designation of collateral by the Counterparty to cover the Fund’s exposure to the Counterparty.
Implied credit spreads represent the current level at which protection could be bought or sold given the terms of the existing CDS contract and serve as an indicator of the current status of the payment/performance risk of the CDS. An implied spread that has widened or increased since entry into the initial contract may indicate a deteriorating credit profile and increased risk of default for the reference entity. A declining or narrowing spread may indicate an improving credit profile or decreased risk of default for the reference entity. Alternatively, credit spreads may increase or decrease reflecting the general tolerance for risk in the credit markets.
An interest rate swap is an agreement between Counterparties pursuant to which the parties exchange a floating rate payment for a fixed rate payment based on a specified notional amount.
Changes in the value of centrally cleared and OTC swap agreements are recognized as unrealized gains (losses) in the Statement of Operations
27 INVESCO OPPENHEIMER V.I. CONSERVATIVE BALANCED FUND
NOTES TO FINANCIAL STATEMENTSUnaudited / Continued
Note 1 -Significant Accounting Policies (continued)
by “marking to market” on a daily basis to reflect the value of the swap agreement at the end of each trading day. Payments received or paid at the beginning of the agreement are reflected as such on the Statement of Assets and Liabilities and may be referred to as upfront payments. The Fund accrues for the fixed payment stream and amortizes upfront payments, if any, on swap agreements on a daily basis with the net amount, recorded as a component of realized gain (loss) on the Statement of Operations. A liquidation payment received or made at the termination of a swap agreement is recorded as realized gain (loss) on the Statement of Operations. The Fund segregates cash or liquid securities having a value at least equal to the amount of the potential obligation of a Fund under any swap transaction. Cash held as collateral is recorded as deposits with brokers on the Statement of Assets and Liabilities. Entering into these agreements involves, to varying degrees, lack of liquidity and elements of credit, market, and Counterparty risk in excess of amounts recognized on the Statement of Assets and Liabilities. Such risks involve the possibility that a swap is difficult to sell or liquidate; the Counterparty does not honor its obligations under the agreement and unfavorable interest rates and market fluctuations. It is possible that developments in the swaps market, including potential government regulation, could adversely affect the Fund’s ability to terminate existing swap agreements or to realize amounts to be received under such agreements. A short position in a security poses more risk than holding the same security long. As there is no limit on how much the price of the security can increase, the Fund’s exposure is unlimited.
| N. | Securities on a When-Issued or Delayed Delivery Basis -The Fund may purchase securities on a “when-issued” basis, and may purchase or sell securities on a “delayed delivery” basis, with payment and delivery scheduled for a future date. No income accrues to the Fund on the securities in connection with such transactions prior to the date the Fund actually takes delivery of the securities. These transactions are subject to market fluctuations and are subject to the risk that the value at delivery may be more or less than the trade date purchase price. Although the Fund will generally purchase these securities with the intention on acquiring such securities, they may sell such securities prior to the settlement date. |
| O. | Dollar Rolls and Forward Commitment Transactions -The Fund may enter into dollar roll transactions to enhance the Fund’s performance. The Fund executes its dollar roll transactions in the to be announced (“TBA”) market whereby the Fund makes a forward commitment to purchase a security and, instead of accepting delivery, the position is offset by the sale of the security with a simultaneous agreement to repurchase at a future date. |
The Fund accounts for dollar roll transactions as purchases and sales and realizes gains and losses on these transactions. The Fund will segregate liquid assets in an amount equal to its dollar roll commitments. Dollar roll transactions involve the risk that a Counterparty to the transaction may fail to complete the transaction. If this occurs, the Fund may lose the opportunity to purchase or sell the security at the agreed upon price. Dollar roll transactions also involve the risk that the value of the securities retained by the Fund may decline below the price of the securities that the Fund has sold but is obligated to purchase under the agreement. Dollar roll transactions covered in this manner are not treated as senior securities for purposes of a Fund’s fundamental investment limitation on senior securities and borrowings.
| P. | Leverage Risk- Leverage exists when the Fund can lose more than it originally invests because it purchases or sells an instrument or enters into a transaction without investing an amount equal to the full economic exposure of the instrument or transaction. |
| Q. | Collateral- To the extent the Fund has designated or segregated a security as collateral and that security is subsequently sold, it is the Fund’s practice to replace such collateral no later than the next business day. |
Note 2 - Advisory Fees and Other Fees Paid to Affiliates
The Trust has entered into a master investment advisory agreement with Invesco Advisers, Inc. (the “Adviser” or “Invesco”). Under the terms of the investment advisory agreement, the Fund accrues daily and pays monthly an advisory fee to the Adviser based on the annual rate of the Fund’s average daily net assets as follows:
| | | | |
| Fee Schedule* | | |
| Up to $200 million | | | 0.75 | % |
| Next $200 million | | | 0.72 | |
| Next $200 million | | | 0.69 | |
| Next $200 million | | | 0.66 | |
| Over $800 million | | | 0.60 | |
* The advisory fee paid by the Fund shall be reduced by any amounts paid by the Fund under the administrative services agreement with the Adviser.
For the six months ended June 30, 2019, the effective advisory fees incurred by the Fund were 0.75%.
From the beginning of the fiscal period until the date of the Reorganization, the Acquired Fund paid $564,060 in advisory fees to OFI Global Asset Management, Inc. based on the annual rates above of the Acquired Fund’s average daily net assets.
Under the terms of a master sub-advisory agreement between the Adviser and each of Invesco Asset Management Deutschland GmbH, Invesco Asset Management Limited, Invesco Asset Management (Japan) Limited, Invesco Hong Kong Limited, Invesco Senior Secured Management, Inc. and Invesco Canada Ltd. and separate sub-advisory agreements with Invesco Capital Management LLC, and Invesco Asset Management (India) Private Limited (collectively, the “Affiliated Sub-Advisers”) the Adviser, not the Fund, will pay 40% of the fees paid to the Adviser to any such Affiliated Sub-Adviser(s) that provide(s) discretionary investment management services to the Fund based on the percentage of assets allocated to such Sub-Adviser(s). Invesco has also entered into a Sub-Advisory Agreement with OppenheimerFunds, Inc. to provide discretionary management services to the Funds.
Effective on the Reorganization Date, the Adviser has contractually agreed, through at least May 31, 2021, to waive advisory fees and/or reimburse expenses of all shares to the to the extent necessary to limit the total annual fund operating expenses after fee waiver and/or expense reimbursement (excluding certain items discussed below) of Series I and Series II shares to 0.67% and 0.92%, respectively, of the Fund’s average daily net assets (the
28 INVESCO OPPENHEIMER V.I. CONSERVATIVE BALANCED FUND
Note 2 - Advisory Fees and Other Fees Paid to Affiliates (continued)
“expense limits”). In determining the Adviser’s obligation to waive advisory fees and/or reimburse expenses, the following expenses are not taken into account, and could cause total annual fund operating expenses after fee waivers and/or expense reimbursement to exceed the numbers reflected above: (1) interest; (2) taxes; (3) dividend expenses on short sales; (4) extraordinary or non-routine items, including litigation expenses; and (5) expenses that the Fund has incurred but did not actually pay because of an expense offset arrangement. Unless Invesco continues the fee waiver agreement, it will terminate May 31, 2021. During its term, the fee waiver agreement cannot be terminated or amended to increase the expense limits or reduce the advisory fee waiver without approval of the Board of Trustees.
Further, the Adviser has contractually agreed, through at least June 30, 2021, to waive the advisory fee payable by the Fund in an amount equal to 100% of the net advisory fees the Adviser receives from the affiliated money market funds on investments by the Fund of uninvested cash in such affiliated money market funds.
For the six months ended June 30, 2019, the Adviser waived advisory fees of $2,663 and reimbursed fund expenses of $217,533, and $67,101 of Series I and Series II shares, respectively.
Prior to the Reorganization, the OFI Global Asset Management, Inc. had contractually agreed to waive fees and/or reimburse expenses of Series I and Series II shares to 0.67% and 0.92%, respectively, of the Acquired Fund’s average daily net assets.
The Trust has entered into a master administrative services agreement with Invesco pursuant to which the Fund has agreed to pay Invesco for certain administrative costs incurred in providing accounting services to the Fund. For the six months ended June 30, 2019, expenses incurred under the agreement are shown in the Statement of Operations as Administration fees. Additionally, Invesco has entered into service agreements whereby JPMorgan Chase Bank serves as custodian to the Fund. Prior to the Reorganization, the Acquired Fund paid administrative fees to OFI Global Asset Management, Inc.
The Trust has entered into a transfer agency and service agreement with Invesco Investment Services, Inc. (“IIS”) pursuant to which the Fund has agreed to pay IIS a fee for providing transfer agency and shareholder services to the Fund and reimburse IIS for certain expenses incurred by IIS in the course of providing such services. IIS may make payments to intermediaries that provide omnibus account services, sub-accounting services and/or networking services. All fees payable by IIS to intermediaries that provide omnibus account services or sub-accounting services are charged back to the Fund, subject to certain limitations approved by the Trust’s Board of Trustees. Prior to the Reorganization, the Acquired Fund paid transfer agent fees to OFI Global Asset Management, Inc. and Shareholder Services, Inc. For the six months ended June 30, 2019, expenses incurred under these agreements are shown in the Statement of Operations as Transfer and shareholder servicing agent fees.
The Trust has entered into master distribution agreements with Invesco Distributors, Inc. (“IDI”) to serve as the distributor for the Service II shares of the Fund. The Trust has adopted a plan pursuant to Rule 12b-1 under the 1940 Act with respect to the Fund’s Service II shares (the “Plan”). The Fund, pursuant to the Plan, pays IDI at an annual rate of 0.25% of the average daily net assets of Service II shares. The fees are accrued daily and paid monthly. Of the Plan payments, up to 0.25% of the average daily net assets of the class of shares may be paid to furnish continuing personal shareholder services to customers who purchase and own shares of such class. Any amounts not paid as a service fee under the Plan would constitute an asset-based sales charge. Rules of the Financial Industry Regulatory Authority (“FINRA”) impose a cap on the total sales charges, including asset-based sales charges, that may be paid by any class of shares of the Fund plans. Prior to the Reorganization, the Acquired Fund paid distribution fees to OppenheimerFunds Distributor, Inc. For the six months ended June 30, 2019, expenses incurred under the plans are shown in the Statement of Operations as Distribution and service plan fees.
Certain officers and trustees of the Trust are officers and directors of the Adviser, IIS and/or IDI.
Note 3 - Additional Valuation Information
GAAP defines fair value as the price that would be received to sell an asset or paid to transfer a liability in an orderly transaction between market participants at the measurement date, under current market conditions. GAAP establishes a hierarchy that prioritizes the inputs to valuation methods, giving the highest priority to readily available unadjusted quoted prices in an active market for identical assets (Level 1) and the lowest priority to significant unobservable inputs (Level 3), generally when market prices are not readily available or are unreliable. Based on the valuation inputs, the securities or other investments are tiered into one of three levels. Changes in valuation methods may result in transfers in or out of an investment’s assigned level:
Level 1 — Prices are determined using quoted prices in an active market for identical assets.
Level 2 — Prices are determined using other significant observable inputs. Observable inputs are inputs that other market participants may use in pricing a security. These may include quoted prices for similar securities, interest rates, prepayment speeds, credit risk, yield curves, loss severities, default rates, discount rates, volatilities and others.
Level 3 — Prices are determined using significant unobservable inputs. In situations where quoted prices or observable inputs are unavailable (for example, when there is little or no market activity for an investment at the end of the period), unobservable inputs may be used. Unobservable inputs reflect the Fund’s own assumptions about the factors market participants would use in determining fair value of the securities or instruments and would be based on the best available information.
The following is a summary of the tiered valuation input levels, as of June 30, 2019. The level assigned to the securities valuations may not be an indication of the risk or liquidity associated with investing in those securities. Because of the inherent uncertainties of valuation, the values reflected in the financial statements may materially differ from the value received upon actual sale of those investments.
29 INVESCO OPPENHEIMER V.I. CONSERVATIVE BALANCED FUND
NOTES TO FINANCIAL STATEMENTSUnaudited / Continued
Note 3 - Additional Valuation Information (continued)
| | | | | | | | | | | | | | | | |
| | | Level 1—
Unadjusted
Quoted Prices | | | Level 2— Other Significant Observable Inputs | | | Level 3—
Significant
Unobservable
Inputs | | | Value |
| Assets Table | | | | | | | | | | | | | | | | |
| Investments, at Value: | | | | | | | | | | | | | | | | |
| Common Stocks | | | | | | | | | | | | | | | | |
Consumer Discretionary | | $ | 11,212,122 | | | $ | — | | | $ | — | | | $ | 11,212,122 | |
Consumer Staples | | | 3,703,206 | | | | — | | | | — | | | | 3,703,206 | |
Energy | | | 3,487,382 | | | | — | | | | — | | | | 3,487,382 | |
Financials | | | 12,307,840 | | | | — | | | | — | | | | 12,307,840 | |
Health Care | | | 8,811,352 | | | | — | | | | — | | | | 8,811,352 | |
Industrials | | | 6,725,260 | | | | — | | | | — | | | | 6,725,260 | |
Information Technology | | | 14,839,775 | | | | — | | | | — | | | | 14,839,775 | |
Materials | | | 1,368,840 | | | | — | | | | — | | | | 1,368,840 | |
Telecommunication Services | | | 1,918,446 | | | | — | | | | — | | | | 1,918,446 | |
Utilities | | | 2,619,909 | | | | — | | | | — | | | | 2,619,909 | |
| Asset-Backed Securities | | | — | | | | 18,397,569 | | | | — | | | | 18,397,569 | |
| Mortgage-Backed Obligations | | | — | | | | 61,370,311 | | | | — | | | | 61,370,311 | |
| Non-Convertible Corporate Bonds and Notes | | | — | | | | 59,523,313 | | | | — | | | | 59,523,313 | |
| Investment Company | | | 5,367,607 | | | | — | | | | — | | | | 5,367,607 | |
| | | | |
| Total Investments, at Value | | | 72,361,739 | | | | 139,291,193 | | | | — | | | | 211,652,932 | |
| Other Financial Instruments: | | | | | | | | | | | | | | | | |
| Futures contracts | | | 461,213 | | | | — | | | | — | | | | 461,213 | |
| | | | |
| Total Assets | | $ | 72,822,952 | | | $ | 139,291,193 | | | $ | — | | | $ | 212,114,145 | |
| | | | |
| | | | |
| Liabilities Table | | | | | | | | | | | | | | | | |
| Other Financial Instruments: | | | | | | | | | | | | | | | | |
| Swaps, at value | | $ | — | | | $ | (402,869 | ) | | $ | — | | | $ | (402,869) | |
| Futures contracts | | | (45,419 | ) | | | — | | | | — | | | | (45,419) | |
| | | | |
| Total Liabilities | | $ | (45,419 | ) | | $ | (402,869 | ) | | $ | — | | | $ | (448,288) | |
| | | | |
Forward currency exchange contracts and futures contracts, if any, are reported at their unrealized appreciation/depreciation at measurement date, which represents the change in the contract’s value from trade date. All additional assets and liabilities included in the above table are reported at their market value at measurement date.
Note 4 - Security Transactions with Affiliated Funds
The Fund is permitted to purchase or sell securities from or to certain other Invesco Funds under specified conditions outlined in procedures adopted by the Board of Trustees of the Trust. The procedures have been designed to ensure that any purchase or sale of securities by the Fund from or to another fund or portfolio that is or could be considered an affiliate by virtue of having a common investment adviser (or affiliated investment advisers), common Trustees and/or common officers complies with Rule 17a-7 of the 1940 Act. Further, as defined under the procedures, each transaction is effected at the current market price. Pursuant to these procedures for the period January 1, 2019 to May 24, 2019, the Predecessor Fund engaged in transactions with affiliates as listed: Securities purchases of $135,577 and securities sales of $533,049, which resulted in net realized gains (losses) of $(107,880). For the period May 25, 2019 to June 30, 2019, the Fund did not engage in transactions with affiliates.
Note 5 - Derivative Investments
The Fund may enter into an International Swaps and Derivatives Association Master Agreement (“ISDA Master Agreement”) under which a fund may trade OTC derivatives. An OTC transaction entered into under an ISDA Master Agreement typically involves a collateral posting arrangement, payment netting provisions and close-out netting provisions. These netting provisions allow for reduction of credit risk through netting of contractual obligations. The enforceability of the netting provisions of the ISDA Master Agreement depends on the governing law of the ISDA Master Agreement, among other factors. For financial reporting purposes, the Fund does not offset OTC derivative assets or liabilities that are subject to ISDA Master Agreements in the Statement of Assets and Liabilities.
Offsetting Assets and Liabilities
The table below reflects the Fund’s exposure to Counterparties subject to either an ISDA Master Agreement or other agreement for OTC derivative liability transactions as of June 30, 2019:
30 INVESCO OPPENHEIMER V.I. CONSERVATIVE BALANCED FUND
Note 5 - Derivative Investments (continued)
| | | | | | | | | | | | | | | | | | | | |
| | | | | | Gross Amounts Not Offset in the Statement of Assets & Liabilities | | | | |
| Counterparty | | Gross
Amounts
Not Offset in
the Statement
of Assets & Liabilities* | | | Financial
Instruments
Available
for Offset | | | Financial
Instruments
Collateral
Pledged** | | | Cash Collateral Pledged** | | | Net Amount | |
| Goldman Sachs Bank USA | | $ | (402,869 | ) | | $ | – | | | $ | – | | | $ | – | | | $ | (402,869 | ) |
Value of Derivative Instruments at Period-End
The table below reflects the Fund’s exposure to Counterparties subject to either an ISDA Master Agreement or other agreement for OTC derivative liability transactions as of June 30, 2019:
| | | | | | | | | | | | | | | | | | |
| | | Asset Derivatives | | | | | | | | Liability Derivatives | |
Derivatives Not Accounted for as Hedging Instruments | | Statement of Assets and Liabilities Location | | | Value | | | | | Statement of Assets and Liabilities Location | | | Value | |
| Credit contracts | | | | | | | | | | Swaps, at value | | | $ | 402,869 | |
| Interest rate contracts Variation margin receivable | | | $ | 2,915* | | | | | | Variation margin payable | | | | 12,974* | |
| | | | | | | | | | | | | | | | | | |
| Total | | | | | | $ | 2,915 | | | | | | | | | $ | 415,843 | |
| | | | | | | | | | | | | | | | | | |
*Includes only the current day’s variation margin. Prior variation margin movements have been reflected in cash on the Statement of Assets and Liabilities upon receipt or payment.
Effect of Derivative Investments for the Six Months Ended June 30, 2019
The tables below summarizes the gains (losses) on derivative investments, detailed by primary risk exposure, recognized in earnings during the period:
| | | | | | | | | | | | |
Amount of Realized Gain or (Loss) Recognized on Derivatives | |
Derivatives Not Accounted for as Hedging Instruments | | Futures contracts | | | Swap contracts | | | Total | |
| Credit contracts | | $ | — | | | $ | 36,858 | | | $ | 36,858 | |
| Interest rate contracts | | | 930,865 | | | | — | | | | 930,865 | |
| | | | | | | | | | | | |
| Total | | $ | 930,865 | | | $ | 36,858 | | | $ | 967,723 | |
| | | | | | | | | | | | |
|
| Amount of Change in Unrealized Gain or (Loss) Recognized on Derivatives | |
Derivatives Not Accounted for as Hedging Instruments | | Futures
contracts | | | Swap contracts | | | Total | |
| Credit contracts | | $ | — | | | $ | (402,869 | ) | | $ | (402,869 | ) |
| Interest rate contracts | | | 69,523 | | | | — | | | | 69,523 | |
| Total | | $ | 69,523 | | | $ | (402,869 | ) | | $ | (333,346 | ) |
| | | | | | | | | | | | |
The table below summarizes the six months ended average notional value of swap agreements and futures during the period.
| | | | | | | | |
Futures contracts | | | Swap
Agreements | |
| Average notional value | | $ | 29,265,534 | | | $ | 5,236,910 | |
Note 6 - Expense Offset Arrangement
The expense offset arrangement is comprised of custodian credits which result from periodic overnight cash balances at the custodian. For the six months ended June 30, 2019, the Fund received credits from this arrangement, which resulted in the reduction of the Fund’s total expenses of $1,041.
Note 7 - Trustee and Officer Fees and Benefits
Certain trustees have executed a Deferred Compensation Agreement pursuant to which they have the option to elect to defer receipt of all or a portion of the annual compensation they are entitled to receive from the Fund. For purposes of determining the amount owed to the Trustees under the plan, deferred amounts are treated as though equal dollar amounts had been invested in shares of the Fund or in other Invesco and/or Invesco Oppenheimer
31 INVESCO OPPENHEIMER V.I. CONSERVATIVE BALANCED FUND
NOTES TO FINANCIAL STATEMENTSUnaudited / Continued
Note 7 - Trustee and Officer Fees and Benefits (continued)
funds selected by the Trustees. The Fund purchases shares of the funds selected for deferral by the Trustees in amounts equal to his or her deemed investment, resulting in a Fund asset equal to the deferred compensation liability. Such assets are included as a component of “Other” within the asset section of the Statement of Assets and Liabilities. Deferral of Trustees’ fees under the plan will not affect the net assets of the Fund and will not materially affect the Fund’s assets, liabilities or net investment income per share. Amounts will be deferred until distributed in accordance with the compensation deferral plan.
Note 8 - Cash Balances
The Fund is permitted to temporarily carry a negative or overdrawn balance in its account with JPMorgan Chase Bank, the custodian bank. Such balances, if any at period-end, are shown in the Statement of Assets and Liabilities under the payable caption Amount due custodian. To compensate the custodian bank for such overdrafts, the overdrawn Fund may either (1) leave funds as a compensating balance in the account so the custodian bank can be compensated by earning the additional interest; or (2) compensate by paying the custodian bank at a rate agreed upon by the custodian bank and Invesco, not to exceed the contractually agreed upon rate.
Note 9- Investment Transactions
The aggregate amount of investment securities (other than short-term securities, U.S. Treasury obligations and money market funds, if any) purchased and sold by the Fund during the six months ended June 30, 2019 was $52,777,598 and $78,656,055, respectively.
Note 10 - Share Information
Transactions in shares of beneficial interest were as follows:
| | | | | | | | | | | | | | | | |
| | | Six Months Ended June 30, 20191 | | | Year Ended December 31, 2018 | |
| | | Shares | | | Amount | | | Shares | | | Amount | |
| Series I Shares | | | | | | | | | | | | | | | | |
| Sold | | | 76,217 | | | $ | 1,178,492 | | | | 165,620 | | | $ | 2,527,555 | |
| Dividends and/or distributions reinvested | | | 362,933 | | | | 5,596,424 | | | | 439,719 | | | | 6,688,120 | |
| Redeemed | | | (705,386 | ) | | | (10,909,489 | ) | | | (1,310,778 | ) | | | (20,206,226 | ) |
| | | | |
| Net decrease | | | (266,236 | ) | | $ | (4,134,573 | ) | | | (705,439 | ) | | $ | (10,990,551 | ) |
| | | | |
| | | | | | | | | | | | | | | | | |
| Series II Shares | | | | | | | | | | | | | | | | |
| Sold | | | 103,468 | | | $ | 1,578,840 | | | | 158,863 | | | $ | 2,411,795 | |
| Dividends and/or distributions reinvested | | | 108,224 | | | | 1,648,251 | | | | 132,175 | | | | 1,986,593 | |
| Redeemed | | | (242,626 | ) | | | (3,683,620 | ) | | | (554,938 | ) | | | (8,421,142 | ) |
| | | | | | | | | | | | | | | | |
| Net decrease | | | (30,934 | ) | | $ | (456,529 | ) | | | (263,900 | ) | | $ | (4,022,754 | ) |
| | | | | | | | | | | | | | | | |
1. There are entities that are record owners of more than 5% of the outstanding shares of the Fund and own 42% of the outstanding shares of the Fund. The Fund and the Fund’s principal underwriter or adviser, are parties to participation agreements with these entities whereby these entities sell units of interest in separate accounts funding variable products that are invested in the Fund. The Fund, Invesco and/or Invesco affiliates may make payments to these entities, which are considered to be related to the Fund, for providing services to the Fund, Invesco and/or Invesco affiliates, including, but not limited to services such as securities brokerage, distribution, third party record keeping and account servicing. The Fund has no knowledge as to whether all or any portion of the shares owned of record by these entities are also owned beneficially.
In addition, 34% of the outstanding shares of the Fund are owned by the Adviser or an affiliate of the Adviser.
Note 11 - Borrowings
Joint Credit Facility.A number of mutual funds managed by the Adviser participate in a $1.95 billion revolving credit facility (the “Facility”) intended to provide short-term financing, if necessary, subject to certain restrictions in connection with atypical redemption activity. Expenses and fees related to the Facility are paid by the participating funds and are disclosed separately or as other expenses on the Statement of Operations. The Fund did not utilize the Facility during the reporting period. The Facility terminated May 24, 2019.
Note 12 - Independent Registered Public Accounting Firm
The Audit Committee of the Board of Trustees appointed, and the Board of Trustees ratified and approved, PricewaterhouseCoopers LLP (“PWC”) as the independent registered public accounting firm of the Fund for the fiscal periods ending after May 24, 2019. Prior to the close of business on May 24, 2019, the Predecessor Fund was a separate series of an unaffiliated investment company and its financial statements were audited by a different independent registered public accounting firm (the “Prior Auditor”).
32 INVESCO OPPENHEIMER V.I. CONSERVATIVE BALANCED FUND
Note 12 - Independent Registered Public Accounting Firm (continued)
Effective after the close of business on May 24, 2019, the Prior Auditor resigned as the independent registered public accounting firm of the Fund. The Prior Auditor’s report on the financial statements of the Predecessor Fund for the past two fiscal years did not contain an adverse or disclaimer of opinion, and was not qualified or modified as to uncertainty, audit scope or accounting principles. During the Predecessor Fund’s two most recent fiscal years and through the close of business on May 24, 2019, there were no (1) disagreements with the Prior Auditor on any matter of accounting principles or practices, financial statement disclosure, or auditing scope or procedure, which disagreements, if not resolved to the Prior Auditor’s satisfaction, would have caused it to make reference to that matter in connection with its report; or (2) “reportable events,” as that term is defined in Item 304(a)(1)(v) of Regulation S-K under the Securities Exchange Act of 1934.
33 INVESCO OPPENHEIMER V.I. CONSERVATIVE BALANCED FUND
APPROVAL OF THE INVESTMENT ADVISORY AND SUB-ADVISORY CONTRACTSUnaudited
At meetings held on December 14, 2018, the Board of Trustees (the Board or the Trustees) of AIM Variable Insurance Funds (Invesco Variable Insurance Funds) (the Trust) as a whole, and the independent Trustees, who comprise over 75% of the Board, voting separately, approved (i) an amendment to the Trust’s Master Investment Advisory Agreement with Invesco Advisers, Inc. (Invesco Advisers and the investment advisory agreement) to add Invesco Oppenheimer V.I. Conservative Balanced Fund (the Fund), (ii) an amendment to the Master Intergroup Sub-Advisory Contract for Mutual Funds with Invesco Asset Management Deutschland GmbH, Invesco Asset Management Limited, Invesco Asset Management (Japan) Limited, Invesco Hong Kong Limited, Invesco Senior Secured Management, Inc. and Invesco Canada Ltd. to add the Fund, (iii) an amendment to the separate sub-advisory contract with Invesco Capital Management LLC to add the Fund, (iv) an amendment to the separate sub-advisory contract with Invesco Asset Management (India) Private Limited to add the Fund, and (v) an initial sub-advisory contract with OppenheimerFunds, Inc. (collectively, the Affiliated Sub-Advisers and the sub-advisory contracts). Additionally, on March 26, 2019, the Board re-approved an initial sub-advisory contract with OppenheimerFunds, Inc. following its change of control as a result of the acquisition of OppenheimerFunds, Inc. and its subsidiaries, including the Oppenheimer mutual funds (each, an Oppenheimer Fund), by Invesco Ltd. (the OFI Transaction). After evaluating the factors discussed below, among others, the Board approved the Fund’s investment advisory agreement and the sub-advisory contracts and determined that the compensation payable by the Fund to Invesco Advisers and by Invesco Advisers to the Affiliated Sub-Advisers is fair and reasonable.
The Board’s Evaluation Process
The Board noted that it had previously approved establishing the Fund at the Board meeting held on October 23, 2018 and that the Fund was formed to acquire the assets and liabilities of an Oppenheimer Fund (the Acquired Fund) with the same investment objective and substantially similar principal investment strategies and risks. At the time of approval, the Fund had no assets and no performance history and the portfolio managers were not employed by Invesco Advisers or any of the Affiliated Sub-Advisers except OppenheimerFunds, Inc., which was not affiliated with Invesco at that time.
In approving the investment advisory agreement and sub-advisory contracts, the Board followed a process similar to the process that it follows in annually reviewing and approving investment advisory agreements and sub-advisory contracts for the series portfolios of funds advised by Invesco Advisers and considered the information provided in the most recent annual review process for those funds as well as the information provided with respect to the Fund. As part of the approval process, the Board reviewed and considered information provided in response to detailed requests for information submitted to management by the independent Trustees with assistance from legal counsel to the independent Trustees. The Board reviewed comparative investment performance and fee data prepared by Invesco Advisers and an independent mutual fund data provider. The Board was assisted in its review by the Senior Officer, an officer of the Invesco Funds who reports directly to the independent Trustees, and by independent legal counsel.
The discussion below serves as a summary of the material factors and related conclusions that formed the basis for the Board’s approval of the Fund’s investment advisory agreement and sub-advisory contracts. The Trustees’ review and conclusions are based on the comprehensive consideration of all information presented to them and are not the result of any single determinative factor. Moreover, one Trustee may have weighed a particular piece of information or factor differently than another Trustee. This information is current as of December 14, 2018 and March 26, 2019 for the sub-advisory contract with OppenheimerFunds, Inc.
Factors and Conclusions and Summary of Independent Written Fee Evaluation
A. Nature, Extent and Quality of Services Provided by Invesco Advisers and the Affiliated Sub-Advisers
The Board reviewed the nature, extent and quality of the advisory services to be provided to the Fund by Invesco Advisers under the Fund’s investment advisory agreement, and the credentials and experience of the officers and employees of Invesco Advisers who will provide these services. The Board’s review included consideration of the investment process oversight and structure, credit analysis and investment risk management to be employed in providing advisory services to the Fund. The Board also considered non-advisory services that Invesco Advisers and its affiliates provide to the Invesco Funds and will provide to the Fund, such as various back office support functions, third party oversight, internal audit, valuation, portfolio trading and legal and compliance. The Board also received and reviewed information about Invesco Advisers’ role as administrator of the Invesco Funds’ liquidity risk management program. The Board also reviewed and considered the benefits to shareholders of investing in a fund that is part of the Invesco family of funds under the umbrella of Invesco Ltd., Invesco Advisers’ parent company, and noted Invesco Ltd.’s depth and experience in conducting an investment management business, as well as its commitment of financial and other resources to such business. The Board reviewed and considered information about the resources that Invesco Advisers intends to continue to commit to managing the Invesco family of funds, including the Fund, following the OFI Transaction. The Board concluded that the nature, extent and quality of the services to be provided to the Fund by Invesco Advisers are appropriate and satisfactory.
The Board reviewed the services that may be provided by the Affiliated Sub-Advisers under the sub-advisory contracts and the credentials and experience of the officers and employees of the Affiliated Sub-Advisers who provide these services. The Board noted the Affiliated Sub-Advisers’ expertise with respect to certain asset classes and that the Affiliated Sub-Advisers have offices and personnel that are located in financial centers around the world. As a result, the Board noted that the Affiliated Sub-Advisers can provide research and investment analysis on the markets and economies of various countries in which the Fund may invest, make recommendations regarding securities and assist with security trades. The Board concluded that the sub-advisory contracts may benefit the Fund and its shareholders by permitting Invesco Advisers to use the resources and talents of the Affiliated Sub-Advisers in managing the Fund. The Board concluded that the nature, extent and quality of the services that may be provided by the Affiliated Sub-Advisers are appropriate and satisfactory.
34 INVESCO OPPENHEIMER V.I. CONSERVATIVE BALANCED FUND
APPROVAL OF THE INVESTMENT ADVISORY AND SUB-ADVISORY CONTRACTSUnaudited / Continued
B. Fund Investment Performance
The Board noted that the Fund would continue the historical performance information of the Acquired Fund following the consummation of the OFI Transaction. The Board considered the performance of the Acquired Fund and the fact that, at the closing of the OFI Transaction, management anticipates that the Fund will be managed pursuant to substantially similar investment strategies and by substantially the same portfolio management team as managed the Acquired Fund. The Board did not view Fund performance as a relevant factor in considering whether to approve the sub-advisory contracts for the Fund, as no Affiliated Sub-Adviser currently manages assets of the Fund.
The Board compared the Fund’s investment performance over multiple time periods ending December 31, 2017 to the performance of funds in the Morningstar performance universe and against the Fund’s benchmark index. The Trustees also reviewed more recent Fund performance and this review did not change their conclusions.
C. Advisory and Sub-Advisory Fees and Fund Expenses
The Board compared the Fund’s contractual management fee rate to the contractual management fee rates of funds in the Fund’s Morningstar expense group. The Board also considered comparative information regarding the Fund’s total expense ratio and its various components.
The Board noted that Invesco Advisers has contractually agreed to waive fees and/or limit expenses of the Fund for at least two years from the closing date of the OFI Transaction in an amount necessary to limit total annual operating expenses to a specified percentage of average daily net assets for each class of the Fund.
The Board noted that Invesco Advisers and the Affiliated Sub-Advisers do not manage other similarly managed mutual funds or client accounts.
The Board also considered the services that may be provided by the Affiliated Sub-Advisers pursuant to the sub-advisory contracts, as well as the fees payable by Invesco Advisers to the Affiliated Sub-Advisers pursuant to the sub-advisory contracts.
D. Economies of Scale and Breakpoints
The Board considered the extent to which there may be economies of scale in the provision of advisory services to the Fund. The Board considered Invesco’s reinvestment in its business, including investments in business infrastructure and cybersecurity. The Board also considered that the Fund may benefit from economies of scale through contractual breakpoints in the Fund’s advisory fee schedule, which generally operate to reduce the Fund’s expense ratio as it grows in size. The Board noted that the Fund will share directly in economies of scale through lower fees charged by third party service providers based on the combined size of the Invesco Funds. The Board noted that the Fund may also benefit from economies of scale through initial fee setting, fee waivers and expense reimbursements.
E. Profitability and Financial Resources
The Board reviewed information from the 2018 contract renewal process provided by Invesco Advisers concerning the costs of the advisory and other services that Invesco Advisers and its affiliates provide to the Invesco Funds and the profitability of Invesco Advisers and its affiliates in providing these services. The Board considered the methodology used for calculating profitability and noted the periodic review of such methodology by an independent consultant. The Board noted that Invesco Advisers will continue to operate at a net profit from services Invesco Advisers and its affiliates provide to the Invesco Funds. The Board did not deem the level of profits realized by Invesco Advisers and its affiliates from providing services to the Invesco Funds, and the profits estimated to be realized by the Fund, to be excessive given the nature, extent and quality of the services provided. The Board received information from Invesco Advisers demonstrating that Invesco Advisers and the Affiliated Sub-Advisers are financially sound and have the resources necessary to perform their obligations under the investment advisory agreement and sub-advisory contracts.
F. Collateral Benefits to Invesco Advisers and its Affiliates
The Board considered various other benefits to be received by Invesco Advisers and its affiliates from the relationship with the Fund, including the fees to be received for providing administrative, transfer agency and distribution services to the Fund. The Board considered the performance of Invesco Advisers and its affiliates in providing these services to other Invesco Funds and the organizational structure employed to provide these services. The Board also considered that these services will be provided to the Fund pursuant to written contracts that are reviewed and approved on an annual basis by the Board; and that the services are required for the operation of the Fund.
The Board considered the benefits realized by Invesco Advisers and the Affiliated Sub-Advisers as a result of portfolio brokerage transactions executed through “soft dollar” arrangements. The Board noted that soft dollar arrangements may result in the Fund bearing costs to purchase research that may be used by Invesco Advisers or the Affiliated Sub-Advisers with other clients and may reduce Invesco Advisers’ or the Affiliated Sub-Advisers’ expenses. The Board also considered that it will receive periodic reports from Invesco representing that these arrangements are consistent with regulatory requirements. The Board did not deem the soft dollar arrangements to be inappropriate.
The Board considered that the Fund’s uninvested cash and cash collateral from any securities lending arrangements may be invested in money market funds advised by Invesco Advisers pursuant to procedures approved by the Board. The Board considered that Invesco Advisers will receive advisory fees from these affiliated money market funds attributable to such investments, although Invesco Advisers has contractually agreed to waive through varying periods the advisory fees payable by the Invesco Funds with respect to certain investments in the affiliated money market funds. The waiver is in an amount equal to 100% of the net advisory fee Invesco Advisers will receive from the affiliated money market funds with respect to the Fund’s investment
35 INVESCO OPPENHEIMER V.I. CONSERVATIVE BALANCED FUND
APPROVAL OF THE INVESTMENT ADVISORY AND SUB-ADVISORY CONTRACTSUnaudited / Continued
in the affiliated money market funds of uninvested cash, but not cash collateral. The Board concluded that the amount of advisory fees to be received by Invesco Advisers from the Fund’s investment of cash collateral from any securities lending arrangements in the affiliated money market funds is fair and reasonable.
The Board also considered that an affiliated broker may receive commissions for executing certain trades for the Fund. Invesco Advisers and the Affiliated Sub-Advisers may use the affiliated broker to, among other things, control order routing and minimize information leakage, and the Board was be advised that such trades will be executed in compliance with rules under the federal securities laws and consistent with best execution obligations.
36 INVESCO OPPENHEIMER V.I. CONSERVATIVE BALANCED FUND
PORTFOLIO PROXY VOTING POLICIES AND GUIDELINES; UPDATES TO STATEMENT OF INVESTMENTSUnaudited
Go paperless with eDelivery
Visit invesco.com/edelivery to enjoy the convenience and security of anytime electronic access to your investment documents.
With eDelivery, you can elect to have any or all of the following materials delivered straight to your inbox to download, save and print from your own computer:
| ● | | Fund reports and prospectuses |
Invesco mailing information
Send general correspondence to Invesco Investment Services, Inc., P.O. Box 219078, Kansas City, MO 64121-9078.
Important notice regarding delivery of security holder documents
To reduce Fund expenses, only one copy of most shareholder documents may be mailed to shareholders with multiple accounts at the same address (Householding). Mailing of your shareholder documents may be householded indefinitely unless you instruct us otherwise. If you do not want the mailing of these documents to be combined with those for other members of your household, please contact Invesco Investment Services, Inc. at 800 959 4246 or contact your financial institution. We will begin sending you individual copies for each account within 30 days after receiving your request.
Fund holdings and proxy voting information
The Fund provides a complete list of its holdings four times in each fiscal year, at the quarter ends. For the second and fourth quarters, the lists appear in the Fund’s semiannual and annual reports to shareholders. For the first and third quarters, the Fund files the lists with the Securities and Exchange Commission (SEC) on Form N-Q (or any successor Form). The most recent list of portfolio holdings is available at invesco.com/completeqtrholdings. Shareholders can also look up the Fund’s Forms N-Q (or any successor Form) on the SEC website at sec.gov.
A description of the policies and procedures that the Fund uses to determine how to vote proxies relating to portfolio securities is available without charge, upon request, from our Client Services department at 800 959 4246 or at invesco.com/proxyguidelines. The information is also available on the SEC website, sec.gov.
Information regarding how the Fund voted proxies related to its portfolio securities during the most recent 12-month period ended June 30 is available at invesco.com/proxysearch. The information is also available on the SEC website, sec.gov.
Invesco Advisers, Inc. is an investment adviser; it provides investment advisory services to individual and institutional clients and does not sell securities. Invesco Distributors, Inc. is the US distributor for Invesco Ltd.’s retail mutual funds, exchange-traded funds and institutional money market funds. Both are wholly owned, indirect subsidiaries of Invesco Ltd.
37 INVESCO OPPENHEIMER V.I. CONSERVATIVE BALANCED FUND
SHAREHOLDER PROXYUnaudited
A Special Meeting (“Meeting”) of Shareholders of Invesco Oppenheimer V.I. Conservative Balanced Fund was held on April 12, 2019. The Meeting was held for the following purpose:
(1) Approval of an Agreement and Plan of Reorganization that provides for the reorganization of Oppenheimer Conservative Balanced Fund/VA into Invesco Oppenheimer V.I. Conservative Balanced Fund.
The results of the voting on the above matter was as follows:
| | | | | | | | | | | | | | | | |
| | | Votes | | | Votes | | | Votes | | | Broker | |
| Matter | | For | | | Against | | | Abstain | | | Non-Votes | |
| (1) Approval of an Agreement and Plan of Reorganization | | | 11,114,709 | | | | 436,720 | | | | 822,699 | | | | 0 | |
38 INVESCO OPPENHEIMER V.I. CONSERVATIVE BALANCED FUND
THIS PAGE INTENTIONALLY LEFT BLANK.

| | | | |

| | Semiannual Report | | 6/30/2019 |
| | | | |
| | | | |
| | | | |
| | |
| | Invesco Oppenheimer V.I. Discovery Mid Cap Growth Fund* The Fund provides a complete list of its holdings four times in each fiscal year, at the quarter ends. For the second and fourth quarters, the lists appear in the Fund’s semi annual and annual reports to shareholders. For the first and third quarters, the Fund files the lists with the Securities and Exchange Commission (SEC) on FormN-Q (or any successor Form). The Fund’s FormN-Q (or any successor Form) filings are available on the SEC website, sec.gov. The Fund’s most recent portfolio holdings, as filed on FormN-Q (or any successor Form), have also been made available to insurance companies issuing variable annuity contracts and variable life insurance policies (“variable products”) that invest in the Fund. A description of the policies and procedures that the Fund uses to determine how to vote proxies relating to portfolio securities is available without charge, upon request, from our Client Services department at 800 959 4246 or at invesco.com/proxyguidelines. The information is also available on the SEC website, sec.gov. Information regarding how the Fund voted proxies related to its portfolio securities during the most recent12-month period ended June 30 is available at invesco.com/proxysearch. The information is also available on the SEC website, sec.gov. Invesco Advisers, Inc. is an investment adviser; it provides investment advisory services to individual and institutional clients and does not sell securities. Invesco Distributors, Inc. is the US distributor for Invesco Ltd.’s retail mutual funds, exchange-traded funds and institutional money market funds. Both are wholly owned, indirect subsidiaries of Invesco Ltd. This report must be accompanied or preceded by a currently effective Fund prospectus and variable product prospectus, which contain more complete information, including sales charges and expenses. Investors should read each carefully before investing. *Prior to the close of business on May 24, 2019, the Fund’s name was Oppenheimer Discovery Mid Cap Growth Fund/VA. See Important Update on the following page for more information. |
Important Update
On October 18, 2018, Massachusetts Mutual Life Insurance Company, an indirect corporate parent of OppenheimerFunds, Inc. and its subsidiaries OFI Global Asset Management, Inc., OFI SteelPath, Inc. and OFI Advisors, LLC, announced that it had entered into an agreement whereby Invesco Ltd., a global investment management company would acquire OppenheimerFunds and its subsidiaries (together, “OppenheimerFunds”). After the close of business on May 24, 2019 Invesco Ltd. completed the acquisition of OppenheimerFunds. This Fund was included in that acquisition and as of that date, became part of the Invesco family of funds. Please visit invesco.com for more information or call Invesco’s Client Services team at800-959-4246.
.
PORTFOLIO MANAGERS: Ronald J. Zibelli, Jr., CFA and Justin Livengood, CFA
AVERAGE ANNUAL TOTAL RETURNS FOR THE PERIODS ENDED 6/30/19
| | | | | | | | | | | | | | | | | | | | | | | | | |
| | | Inception
Date | | 6-Months | | 1-Year | | 5-Year | | 10-Year |
| Series I Shares* | | | | 8/15/86 | | | | | 30.02 | % | | | | 14.99 | % | | | | 12.50 | % | | | | 16.40 | % |
| Series II Shares* | | | | 10/16/00 | | | | | 29.85 | | | | | 14.71 | | | | | 12.22 | | | | | 16.11 | |
| Russell Midcap Growth Index | | | | | | | | | 26.08 | | | | | 13.94 | | | | | 11.10 | | | | | 16.02 | |
Performance quoted is past performance and cannot guarantee comparable future results; current performance may be lower or higher.Visit invesco.com for the most recentmonth-end performance. Performance figures reflect reinvested distributions and changes in net asset value (NAV). Investment return and principal value will vary so that you may have a gain or a loss when you sell shares. Fund returns include changes in share price, reinvested distributions and sales charges except where “without sales charge” is indicated. Effective after the close of business on May 24, 2019, theNon-Service and Service share classes of the predecessor fund were reorganized into Series I and Series II Shares, respectively, of the Fund. Returns shown for Series I and Series II shares are blended returns of the predecessor fund and the Fund. Share class returns will differ from those of the predecessor fund because of different expenses. See Fund prospectuses and summary prospectuses for more information on share classes, sales charges and new fee agreements, if any. Fund literature is available at invesco.com.
The Fund’s performance is compared to the performance of the Russell Midcap Growth Index. The Russell Midcap Growth Index measures the performance of themid-cap growth segment of the U.S. equity universe. It includes those Russell Midcap Index companies with higherprice-to-book ratios and higher forecasted growth values. The Index is unmanaged and cannot be purchased directly by investors. While index comparisons may be useful to provide a benchmark for the Fund’s performance, it must be noted that the Fund’s investments are not limited to the investments comprising the Index. Index performance includes reinvestment of income, but does not reflect transaction costs, fees, expenses or taxes. Index performance is shown for illustrative purposes only as a benchmark for the Fund’s performance, and does not predict or depict performance of the Fund. The Fund’s performance reflects the effects of the Fund’s business and operating expenses.
TOP HOLDINGS AND ALLOCATIONS
TOP TEN COMMON STOCK HOLDINGS
| | | | |
| CoStar Group, Inc. | | | 2.3 | % |
| Roper Technologies, Inc. | | | 2.2 | |
| Synopsys, Inc. | | | 2.1 | |
| O’Reilly Automotive, Inc. | | | 2.0 | |
| MSCI, Inc., Cl. A | | | 2.0 | |
| Total System Services, Inc. | | | 2.0 | |
| RingCentral, Inc., Cl. A | | | 2.0 | |
| Waste Connections, Inc. | | | 2.0 | |
| Bright Horizons Family Solutions, Inc. | | | 2.0 | |
| lululemon athletica, Inc. | | | 1.9 | |
Portfolio holdings and allocations are subject to change. Percentages are as of June 30, 2019, and are based on net assets.
SECTOR ALLOCATION
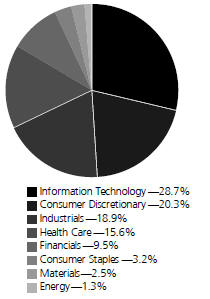
Portfolio holdings and allocations are subject to change. Percentages are as of June 30, 2019, and are based on the total market value of common stocks.
For more current Fund holdings, please visit invesco.com.
|
| 3 INVESCO OPPENHEIMER V.I. DISCOVERY MID CAP GROWTH FUND |
*Effective after the close of business on May 24, 2019, theNon-Service and Service share classes of the predecessor fund were reorganized into Series I and Series II Shares, respectively, of the Fund. Returns shown for Series I and Series II shares are blended returns of the predecessor fund and the Fund. Share class returns will differ from those of the predecessor fund because of different expenses.
Before investing, investors should carefully read the prospectus and/or summary prospectus and carefully consider the investment objectives, risks, charges and expenses. For this and more complete information about the fund(s), investors should ask their advisors for a prospectus/summary prospectus or visit invesco.com/fundprospectus.
Shares of Invesco funds are not deposits or obligations of any bank, are not guaranteed by any bank, are not insured by the FDIC or any other agency, and involve investment risks, including the possible loss of the principal amount invested.
|
| 4 INVESCO OPPENHEIMER V.I. DISCOVERY MID CAP GROWTH FUND |
Fund Expenses
Fund Expenses.As a shareholder of the Fund, you incur two types of costs: (1) transaction costs and (2) ongoing costs, including management fees; distribution and service fees; and other Fund expenses. These examples are intended to help you understand your ongoing costs (in dollars) of investing in the Fund and to compare these costs with the ongoing costs of investing in other mutual funds.
The examples are based on an investment of $1,000.00 invested at the beginning of the period and held for the entire6-month period ended June 30, 2019.
Actual Expenses. The first section of the table provides information about actual account values and actual expenses. You may use the information in this section for the class of shares you hold, together with the amount you invested, to estimate the expense that you paid over the period. Simply divide your account value by $1,000.00 (for example, an $8,600.00 account value divided by $1,000.00 = 8.60), then multiply the result by the number in the first section under the heading entitled “Expenses Paid During 6 Months Ended June 30, 2019” to estimate the expenses you paid on your account during this period.
Hypothetical Example for Comparison Purposes.
The second section of the table provides information about hypothetical account values and hypothetical expenses based on the Fund’s actual expense ratio for each class of shares, and an assumed rate of return of 5% per year for each class before expenses, which is not the actual return. The hypothetical account values and expenses may not be used to estimate the actual ending account balance or expenses you paid for the period. You may use this information to compare the ongoing costs of investing in the Fund and other funds. To do so, compare this 5% hypothetical example for the class of shares you hold with the 5% hypothetical examples that appear in the shareholder reports of the other funds.
Please note that the expenses shown in the table are meant to highlight your ongoing costs only and do not reflect any charges associated with the separate accounts that offer this Fund. Therefore, the “hypothetical” lines of the table are useful in comparing ongoing costs only, and will not help you determine the relative total costs of owning different funds. In addition, if these separate account charges were included your costs would have been higher.
| | | | | | | | | | | | | | | | |
Actual | | Beginning Account Value January 1, 2019 | | | Ending Account Value June 30, 2019 | | | Expenses Paid During 6 Months Ended June 30, 2019 | | | | |
Series I shares | | $ | 1,000.00 | | | $ | 1,300.20 | | | $ | 4.57 | | | | | |
Series II shares | | | 1,000.00 | | | | 1,298.50 | | | | 6.00 | | | | | |
| | | | |
Hypothetical (5% return before expenses) | | | | | | | | | | | | | | | | |
Series I shares | | | 1,000.00 | | | | 1,020.83 | | | | 4.02 | | | | | |
Series II shares | | | 1,000.00 | | | | 1,019.59 | | | | 5.27 | | | | | |
Expenses are equal to the Fund’s annualized expense ratio for that class, multiplied by the average account value over the period, multiplied by 181/365 (to reflect theone-half year period). Those annualized expense ratios, excluding indirect expenses from affiliated funds, based on the6-month period ended June 30, 2019 are as follows:
| | | | | |
| Class | | Expense Ratios |
| Series I shares | | | | 0.80 | % |
| Series II shares | | | | 1.05 | |
The expense ratios reflect voluntary and/or contractual waivers and/or reimbursements of expenses by the Fund’s Manager. Some of these undertakings may be modified or terminated at any time, as indicated in the Fund’s prospectus. The “Financial Highlights” tables in the Fund’s financial statements, included in this report, also show the gross expense ratios, without such waivers or reimbursements and reduction to custodian expenses, if applicable.
|
| 5 INVESCO OPPENHEIMER V.I. DISCOVERY MID CAP GROWTH FUND |
STATEMENT OF INVESTMENTSJune 30, 2019Unaudited
| | | | | | | | |
| | | Shares | | | Value | |
| Common Stocks—98.6% | | | | | | | | |
| Consumer Discretionary—20.1% | |
| Distributors—1.8% | | | | | | | | |
| Pool Corp. | | | 70,610 | | | $ | 13,486,510 | |
| | | | | | | | | |
| Diversified Consumer Services—2.0% | | | | | | | | |
| Bright Horizons Family Solutions, Inc.1 | | | 95,090 | | | | 14,346,228 | |
| | | | | | | | | |
| Entertainment—1.5% | | | | | | | | |
| Live Nation Entertainment, Inc.1 | | | 165,660 | | | | 10,974,975 | |
| | | | | | | | | |
| Hotels, Restaurants & Leisure—5.1% | | | | | | | | |
| Chipotle Mexican Grill, Inc., Cl. A1 | | | 13,190 | | | | 9,666,687 | |
| Darden Restaurants, Inc. | | | 46,040 | | | | 5,604,449 | |
| Domino’s Pizza, Inc. | | | 19,900 | | | | 5,537,772 | |
| Hilton Worldwide Holdings, Inc. | | | 58,420 | | | | 5,709,971 | |
| Planet Fitness, Inc., Cl. A1 | | | 150,050 | | | | 10,869,622 | |
| | | | | | | 37,388,501 | |
| | | | | | | | | |
| Interactive Media & Services—1.5% | | | | | | | | |
| IAC/InterActiveCorp1 | | | 51,410 | | | | 11,183,217 | |
| | | | | | | | | |
| Media—0.8% | | | | | | | | |
| Cable One, Inc. | | | 4,870 | | | | 5,702,721 | |
| | | | | | | | | |
| Multiline Retail—0.5% | | | | | | | | |
| Ollie’s Bargain Outlet Holdings, Inc.1 | | | 39,340 | | | | 3,426,908 | |
| | | | | | | | | |
| Specialty Retail—4.7% | | | | | | | | |
| O’Reilly Automotive, Inc.1 | | | 40,580 | | | | 14,987,006 | |
| Tractor Supply Co. | | | 90,190 | | | | 9,812,672 | |
| Ulta Beauty, Inc.1 | | | 28,490 | | | | 9,882,896 | |
| | | | | | | 34,682,574 | |
| | | | | | | | | |
| Textiles, Apparel & Luxury Goods—2.2% | | | | | | | | |
| Levi Strauss & Co., Cl. A1 | | | 116,290 | | | | 2,428,135 | |
| lululemon athletica, Inc.1 | | | 76,430 | | | | 13,773,451 | |
| | | | | | | 16,201,586 | |
| | | | | | | | | |
| Consumer Staples—3.1% | | | | | | | | |
| Beverages—0.8% | | | | | | | | |
| Keurig Dr Pepper, Inc. | | | 206,420 | | | | 5,965,538 | |
| | | | | | | | | |
| Food Products—1.2% | | | | | | | | |
| McCormick & Co., Inc. | | | 55,620 | | | | 8,621,656 | |
| | | | | | | | | |
| Household Products—1.1% | | | | | | | | |
| Church & Dwight Co., Inc. | | | 115,880 | | | | 8,466,193 | |
| | | | | | | | | |
| Energy—1.3% | | | | | | | | |
| Oil, Gas & Consumable Fuels—1.3% | | | | | | | | |
| Cheniere Energy, Inc.1 | | | 67,950 | | | | 4,651,178 | |
| Diamondback Energy, Inc. | | | 44,363 | | | | 4,834,236 | |
| | | | | | | 9,485,414 | |
| | | | | | | | | |
| Financials—9.4% | | | | | | | | |
| Capital Markets—3.7% | | | | | | | | |
| KKR & Co., Inc., Cl. A | | | 153,650 | | | | 3,882,735 | |
| MarketAxess Holdings, Inc. | | | 17,070 | | | | 5,486,639 | |
| MSCI, Inc., Cl. A | | | 62,350 | | | | 14,888,557 | |
| Tradeweb Markets, Inc., Cl. A | | | 70,690 | | | | 3,096,929 | |
| | | | | | | 27,354,860 | |
| | | | | | | | | |
| Commercial Banks—0.5% | | | | | | | | |
| First Republic Bank | | | 37,590 | | | | 3,670,663 | |
| | | | | | | | | |
| Insurance—1.9% | | | | | | | | |
| Arthur J. Gallagher & Co. | | | 121,050 | | | | 10,602,770 | |
| Progressive Corp. (The) | | | 45,000 | | | | 3,596,850 | |
| | | | | | | 14,199,620 | |
| | | | | | | | | |
| Real Estate Investment Trusts (REITs)—2.4% | |
| Alexandria Real Estate Equities, Inc. | | | 39,990 | | | | 5,642,189 | |
| SBA Communications Corp., Cl. A1 | | | 51,820 | | | | 11,651,209 | |
| | | | | | | 17,293,398 | |
| | | | | | | | | |
| Real Estate Management & Development—0.9% | |
| CBRE Group, Inc., Cl. A1 | | | 121,630 | | | | 6,239,619 | |
| | | | | | | | |
| | | Shares | | | Value | |
| Health Care—15.4% | | | | | | | | |
| Biotechnology—1.0% | | | | | | | | |
| Exact Sciences Corp.1 | | | 32,530 | | | $ | 3,839,841 | |
| Sarepta Therapeutics, Inc.1 | | | 24,020 | | | | 3,649,839 | |
| | | | | | | 7,489,680 | |
| | | | | | | | | |
| Health Care Equipment & Supplies—8.4% | | | | | | | | |
| Cooper Cos., Inc. (The) | | | 35,670 | | | | 12,016,866 | |
| DexCom, Inc.1 | | | 64,750 | | | | 9,702,140 | |
| Edwards Lifesciences Corp.1 | | | 33,300 | | | | 6,151,842 | |
| IDEXX Laboratories, Inc.1 | | | 42,590 | | | | 11,726,305 | |
| Masimo Corp.1 | | | 42,570 | | | | 6,335,268 | |
| STERIS plc | | | 49,740 | | | | 7,405,291 | |
| Varian Medical Systems, Inc.1 | | | 28,470 | | | | 3,875,621 | |
| West Pharmaceutical Services, Inc. | | | 38,040 | | | | 4,760,706 | |
| | | | | | | 61,974,039 | |
| | | | | | | | | |
| Health Care Technology—1.0% | | | | | | | | |
| Veeva Systems, Inc., Cl. A1 | | | 45,300 | | | | 7,343,583 | |
| | | | | | | | | |
| Life Sciences Tools & Services—5.0% | | | | | | | | |
| Agilent Technologies, Inc. | | | 51,750 | | | | 3,864,172 | |
| Bio-Rad Laboratories, Inc., Cl. A1 | | | 18,910 | | | | 5,911,077 | |
| Bio-Techne Corp. | | | 17,940 | | | | 3,740,311 | |
| ICON plc1 | | | 68,870 | | | | 10,603,914 | |
| IQVIA Holdings, Inc.1 | | | 76,570 | | | | 12,320,113 | |
| | | | | | | 36,439,587 | |
| | | | | | | | | |
| Industrials—18.6% | | | | | | | | |
| Aerospace & Defense—3.0% | | | | | | | | |
| HEICO Corp. | | | 85,800 | | | | 11,480,898 | |
| TransDigm Group, Inc.1 | | | 21,920 | | | | 10,604,896 | |
| | | | | | | 22,085,794 | |
| | | | | | | | | |
| Airlines—0.5% | | | | | | | | |
| United Continental Holdings, Inc.1 | | | 43,070 | | | | 3,770,778 | |
| | | | | | | | | |
| Building Products—1.0% | | | | | | | | |
| Lennox International, Inc. | | | 13,440 | | | | 3,696,000 | |
| Masco Corp. | | | 95,120 | | | | 3,732,509 | |
| | | | | | | 7,428,509 | |
| | | | | | | | | |
| Commercial Services & Supplies—4.6% | | | | | | | | |
| Cintas Corp. | | | 42,420 | | | | 10,065,842 | |
| Republic Services, Inc., Cl. A | | | 103,870 | | | | 8,999,297 | |
| Waste Connections, Inc. | | | 152,535 | | | | 14,579,295 | |
| | | | | | | 33,644,434 | |
| | | | | | | | | |
| Electrical Equipment—0.7% | | | | | | | | |
| AMETEK, Inc. | | | 55,590 | | | | 5,049,795 | |
| | | | | | | | | |
| Industrial Conglomerates—2.2% | | | | | | | | |
| Roper Technologies, Inc. | | | 43,630 | | | | 15,979,924 | |
| | | | | | | | | |
| Machinery—2.4% | | | | | | | | |
| IDEX Corp. | | | 78,800 | | | | 13,564,632 | |
| Woodward, Inc. | | | 38,780 | | | | 4,388,345 | |
| | | | | | | 17,952,977 | |
| | | | | | | | | |
| Professional Services—4.2% | | | | | | | | |
| CoStar Group, Inc.1 | | | 30,620 | | | | 16,965,317 | |
| IHS Markit Ltd.1 | | | 159,230 | | | | 10,146,136 | |
| TransUnion | | | 54,340 | | | | 3,994,533 | |
| | | | | | | 31,105,986 | |
| | | | | | | | | |
| Information Technology—28.3% | | | | | | | | |
| Communications Equipment—1.5% | | | | | | | | |
| Motorola Solutions, Inc. | | | 65,800 | | | | 10,970,834 | |
| | | | | | | | | |
| Electronic Equipment, Instruments, & Components—3.6% | |
| CDW Corp. | | | 101,430 | | | | 11,258,730 | |
| Keysight Technologies, Inc.1 | | | 108,500 | | | | 9,744,385 | |
| Zebra Technologies Corp., Cl. A1 | | | 27,300 | | | | 5,719,077 | |
| | | | | | | 26,722,192 | |
|
| 6 INVESCO OPPENHEIMER V.I. DISCOVERY MID CAP GROWTH FUND |
| | | | | | | | |
| | | Shares | | | Value | |
| IT Services—7.6% | | | | | | | | |
| Booz Allen Hamilton Holding Corp., Cl. A | | | 125,770 | | | $ | 8,327,232 | |
| Euronet Worldwide, Inc.1 | | | 58,590 | | | | 9,857,181 | |
| Global Payments, Inc. | | | 45,500 | | | | 7,285,915 | |
| Total System Services, Inc. | | | 115,970 | | | | 14,875,472 | |
| Twilio, Inc., Cl. A1 | | | 56,340 | | | | 7,681,959 | |
| WEX, Inc.1 | | | 37,370 | | | | 7,776,697 | |
| | | | | | | 55,804,456 | |
| | | | | | | | | |
| Semiconductors & Semiconductor Equipment—4.5% | |
| Advanced Micro Devices, Inc.1 | | | 207,750 | | | | 6,309,367 | |
| Cree, Inc.1 | | | 48,450 | | | | 2,721,921 | |
| Lam Research Corp. | | | 40,690 | | | | 7,643,210 | |
| Marvell Technology Group Ltd. | | | 192,030 | | | | 4,583,756 | |
| Monolithic Power Systems, Inc. | | | 54,060 | | | | 7,340,267 | |
| Xilinx, Inc. | | | 36,270 | | | | 4,276,958 | |
| | | | | | | 32,875,479 | |
| | | | | | | | | |
| Software—11.1% | | | | | | | | |
| ANSYS, Inc.1 | | | 20,130 | | | | 4,123,026 | |
| Atlassian Corp. plc, Cl. A1 | | | 77,640 | | | | 10,158,418 | |
| Coupa Software, Inc.1 | | | 29,490 | | | | 3,733,729 | |
| Fair Isaac Corp.1 | | | 27,680 | | | | 8,692,074 | |
| Paycom Software, Inc.1 | | | 17,350 | | | | 3,933,592 | |
| | | | | | | | |
| | | Shares | | | Value | |
| Software (Continued) | | | | | | | | |
| RingCentral, Inc., Cl. A1 | | | 127,780 | | | $ | 14,684,478 | |
| ServiceNow, Inc.1 | | | 16,974 | | | | 4,660,551 | |
| Splunk, Inc.1 | | | 43,600 | | | | 5,482,700 | |
| Synopsys, Inc.1 | | | 118,260 | | | | 15,218,880 | |
| Trade Desk, Inc. (The), Cl. A1 | | | 18,270 | | | | 4,161,541 | |
| Zendesk, Inc.1 | | | 80,680 | | | | 7,182,940 | |
| | | | | | | 82,031,929 | |
| | | | | | | | | |
| Materials—2.4% | | | | | | | | |
| Chemicals—0.5% | | | | | | | | |
| Ingevity Corp.1 | | | 38,780 | | | | 4,078,493 | |
| | | | | | | | | |
| Containers & Packaging—1.9% | | | | | | | | |
| Avery Dennison Corp. | | | 38,730 | | | | 4,480,286 | |
| Ball Corp. | | | 131,810 | | | | 9,225,382 | |
| | | | | | | 13,705,668 | |
| Total Common Stocks (Cost $542,223,447) | | | | 725,144,318 | |
| | | | | | | | |
| Investment Company—1.4% | |
| Invesco Oppenheimer Institutional Government Money Market Fund, Cl. IN, 2.37%2(Cost $10,367,967) | | | 10,367,967 | | | | 10,367,967 | |
| Total Investments, at Value (Cost $552,591,414) | | | 100.0 | % | | | 735,512,285 | |
Net Other Assets (Liabilities) | | | 0.0 | | | | (117,741 | ) |
Net Assets | | | 100.0 | % | | $ | 735,394,544 | |
| | | | | | | | |
Footnotes to Statement of Investments
1.Non-income producing security.
2. The money market fund and the Fund are affiliated by having the same investment adviser. The rate shown is the7-day SEC standardized yield as of June 30, 2019.
See accompanying Notes to Financial Statements.
|
| 7 INVESCO OPPENHEIMER V.I. DISCOVERY MID CAP GROWTH FUND |
STATEMENT OF ASSETS AND LIABILITIESJune 30, 2019 Unaudited
| | | | |
|
| |
| Assets | | | | |
| Investments, at value—see accompanying statement of investments: | | | | |
| Unaffiliated companies (cost $542,223,447) | | $ | 725,144,318 | |
| Affiliated companies (cost $10,367,967) | | | 10,367,967 | |
| | | | |
| | | 735,512,285 | |
| |
| Cash | | | 181,220 | |
| |
| Receivables and other assets: | | | | |
| Dividends | | | 255,751 | |
| Shares of beneficial interest sold | | | 29,153 | |
| Other | | | 90,579 | |
| | | | |
| Total assets | | | 736,068,988 | |
|
| |
Liabilities | | | | |
| Payables and other liabilities: | | | | |
| Shares of beneficial interest redeemed | | | 387,742 | |
| Administration fee | | | 99,897 | |
| Trustees’ compensation | | | 78,405 | |
| Management fee | | | 42,319 | |
| Shareholder communications | | | 23,904 | |
| Transfer and shareholder servicing agent fees | | | 11,488 | |
| Distribution and service plan fees | | | 8,860 | |
| Other | | | 21,829 | |
| | | | |
| Total liabilities | | | 674,444 | |
|
| |
Net Assets | | $ | 735,394,544 | |
| | | | |
|
| |
| Composition of Net Assets | | | | |
| Shares of beneficial interest | | $ | 521,820,673 | |
| |
Total distributable earnings | | | 213,573,871 | |
| | | | |
Net Assets | | $ | 735,394,544 | |
| | | | |
|
| |
| Net Asset Value Per Share | | | | |
| Series I Shares: | | | | |
| Net asset value, redemption price per share and offering price per share (based on net assets of $690,799,744 and 8,833,832 shares of beneficial interest outstanding) | | | $78.20 | |
| |
| Series II Shares: | | | | |
| Net asset value, redemption price per share and offering price per share (based on net assets of $44,594,800 and 614,402 shares of beneficial interest outstanding) | | | $72.58 | |
See accompanying Notes to Financial Statements.
|
| 8 INVESCO OPPENHEIMER V.I. DISCOVERY MID CAP GROWTH FUND |
STATEMENT OF OPERATIONSFor the Six Months Ended June 30, 2019 Unaudited
| | | | |
|
| |
| Investment Income | | | | |
| |
Dividends: | |
| Unaffiliated companies (net of foreign withholding taxes of $8,737) | | $ | 2,229,035 | |
| Affiliated companies | | | 155,447 | |
| | | | |
| Total investment income | | | 2,384,482 | |
|
| |
| Expenses | | | | |
| Management fees | | | 2,452,918 | |
| |
| Administration fees | | | 108,135 | |
| |
| Distribution and service plan fees – Series II shares | | | 50,468 | |
| |
| Transfer and shareholder servicing agent fees: | | | | |
| Series I shares | | | 320,241 | |
| Series II shares | | | 19,662 | |
| |
| Shareholder communications: | | | | |
| Series I shares | | | 20,698 | |
| Series II shares | | | 1,274 | |
| |
| Trustees’ compensation | | | 11,665 | |
| |
| Borrowing fees | | | 8,487 | |
| |
| Custodian fees and expenses | | | 2,569 | |
| |
| Other | | | 33,456 | |
| | | | |
| Total expenses | | | 3,029,573 | |
| Less reduction to custodian expenses | | | (2,569) | |
| Less waivers and reimbursements of expenses | | | (202,987) | |
| | | | |
| Net expenses | | | 2,824,017 | |
|
| |
Net Investment Loss | | | (439,535) | |
|
| |
| Realized and Unrealized Gain | | | | |
Net realized gain on investment transactions (includes net losses from securities sold to affiliates of $149,286) | | | 34,589,909 | |
|
| |
Net change in unrealized appreciation/(depreciation) on investment transactions | | | 146,449,070 | |
|
| |
Net Increase in Net Assets Resulting from Operations | | $ | 180,599,444 | |
| | | | |
See accompanying Notes to Financial Statements.
|
| 9 INVESCO OPPENHEIMER V.I. DISCOVERY MID CAP GROWTH FUND |
STATEMENTS OF CHANGES IN NET ASSETS
| | | | | | | | |
| | | Six Months Ended
June 30, 2019
(Unaudited) | | Year Ended
December 31, 2018 | |
|
| |
| Operations | | | | | | | | |
| Net investment loss | | $ | (439,535 | ) | | $ | (1,784,624) | |
| |
| Net realized gain | | | 34,589,909 | | | | 95,224,298 | |
| |
| Net change in unrealized appreciation/(depreciation) | | | 146,449,070 | | | | (128,898,713) | |
| | | | |
| Net increase (decrease) in net assets resulting from operations | | | 180,599,444 | | | | (35,459,039) | |
|
| |
| Dividends and/or Distributions to Shareholders | | | | | | | | |
| Distributions to shareholders from distributable earnings: | | | | | | | | |
| Series I shares | | | (84,658,513 | ) | | | (95,656,703) | |
| Series II shares | | | (5,797,957 | ) | | | (5,963,052) | |
| | | | |
| Total distributions from distributable earnings | | | (90,456,470 | ) | | | (101,619,755) | |
|
| |
| Beneficial Interest Transactions | | | | | | | | |
| Net increase in net assets resulting from beneficial interest transactions: | | | | | | | | |
| Series I shares | | | 18,981,141 | | | | 20,283,999 | |
| Series II shares | | | 4,943,520 | | | | 3,848,119 | |
| | | | |
| Total beneficial interest transactions | | | 23,924,661 | | | | 24,132,118 | |
|
| |
| Net Assets | | | | | | | | |
| Total increase (decrease) | | | 114,067,635 | | | | (112,946,676) | |
| |
| Beginning of period | | | 621,326,909 | | | | 734,273,585 | |
| | | | |
| End of period | | $ | 735,394,544 | | | $ | 621,326,909 | |
| | | | |
See accompanying Notes to Financial Statements.
|
| 10 INVESCO OPPENHEIMER V.I. DISCOVERY MID CAP GROWTH FUND |
FINANCIAL HIGHLIGHTS
| | | | | | | | | | | | | | | | | | | | | | | | |
| Series I Shares | | Six Months
Ended
June 30, 2019
(Unaudited) | | | Year Ended
December 31,
2018 | | | Year Ended
December 31,
2017 | | | Year Ended
December 31,
2016 | | | Year Ended
December 31,
2015 | | | Year Ended
December 31,
2014 | |
| |
| Per Share Operating Data | | | | | | | | | | | | | | | | | | | | | | | | |
| Net asset value, beginning of period | | | $68.65 | | | | $84.21 | | | | $72.65 | | | | $76.85 | | | | $78.82 | | | | $74.51 | |
| |
| Income (loss) from investment operations: | | | | | | | | | | | | | | | | | | | | | | | | |
| Net investment income (loss)1 | | | (0.04) | | | | (0.19) | | | | (0.10) | | | | 0.03 | | | | (0.19) | | | | (0.29) | |
| Net realized and unrealized gain (loss) | | | 20.50 | | | | (3.07) | | | | 20.08 | | | | 1.69 | | | | 5.67 | | | | 4.60 | |
| | | | |
| Total from investment operations | | | 20.46 | | | | (3.26) | | | | 19.98 | | | | 1.72 | | | | 5.48 | | | | 4.31 | |
| |
| Dividends and/or distributions to shareholders: | | | | | | | | | | | | | | | | | | | | | | | | |
| Dividends from net investment income | | | 0.00 | | | | 0.00 | | | | (0.03) | | | | 0.00 | | | | 0.00 | | | | 0.00 | |
| Distributions from net realized gain | | | (10.91) | | | | (12.30) | | | | (8.39) | | | | (5.92) | | | | (7.45) | | | | 0.00 | |
| | | | |
| Total dividends and/or distributions to shareholders | | | (10.91) | | | | (12.30) | | | | (8.42) | | | | (5.92) | | | | (7.45) | | | | 0.00 | |
| |
| Net asset value, end of period | | | $78.20 | | | | $68.65 | | | | $84.21 | | | | $72.65 | | | | $76.85 | | | | $78.82 | |
| | | | |
| | | | |
|
| |
| Total Return, at Net Asset Value2 | | | 30.02% | | | | (6.08)% | | | | 28.79% | | | | 2.34% | | | | 6.61% | | | | 5.78% | |
|
| |
| Ratios/Supplemental Data | | | | | | | | | | | | | | | | | | | | | | | | |
| Net assets, end of period (in thousands) | | | $690,800 | | | | $586,273 | | | | $694,675 | | | | $603,708 | | | | $660,450 | | | | $682,515 | |
| |
| Average net assets (in thousands) | | | $658,381 | | | | $690,497 | | | | $661,192 | | | | $621,110 | | | | $695,736 | | | | $688,259 | |
| |
| Ratios to average net assets:3 | | | | | | | | | | | | | | | | | | | | | | | | |
| Net investment income (loss) | | | (0.11)% | | | | (0.23)% | | | | (0.12)% | | | | 0.04% | | | | (0.24)% | | | | (0.39)% | |
| Expenses excluding specific expenses listed below | | | 0.86% | | | | 0.86% | | | | 0.84% | | | | 0.84% | | | | 0.83% | | | | 0.83% | |
| Interest and fees from borrowings | | | 0.00%4 | | | | 0.00%4 | | | | 0.00%4 | | | | 0.00%4 | | | | 0.00%4 | | | | 0.00% | |
| | | | |
| Total expenses5 | | | 0.86% | | | | 0.86% | | | | 0.84% | | | | 0.84% | | | | 0.83% | | | | 0.83% | |
| Expenses after payments, waivers and/or reimbursements and reduction to custodian expenses | | | 0.80% | | | | 0.80% | | | | 0.80% | | | | 0.80% | | | | 0.80% | | | | 0.80% | |
| |
| Portfolio turnover rate | | | 36% | | | | 104% | | | | 105% | | | | 141% | | | | 81% | | | | 113% | |
1. Per share amounts calculated based on the average shares outstanding during the period.
2. Assumes an initial investment on the business day before the first day of the fiscal period, with all dividends and distributions reinvested in additional shares on the reinvestment date, and redemption at the net asset value calculated on the last business day of the fiscal period. Total returns are not annualized for periods less than one full year. Total return information does not reflect expenses that apply at the separate account level or to related insurance products. Inclusion of these charges would reduce the total return figures for all periods shown. Returns do not reflect the deduction of taxes that a shareholder would pay on fund distributions or the redemption of fund shares.
3. Annualized for periods less than one full year.
4. Less than 0.005%.
5. Total expenses including indirect expenses from affiliated fund fees and expenses were as follows:
| | | | | | | | |
| Six Months Ended June 30, 2019 | | | 0.86% | | | | | |
| Year Ended December 31, 2018 | | | 0.86% | | | | | |
| Year Ended December 31, 2017 | | | 0.84% | | | | | |
| Year Ended December 31, 2016 | | | 0.84% | | | | | |
| Year Ended December 31, 2015 | | | 0.83% | | | | | |
| Year Ended December 31, 2014 | | | 0.83% | | | | | |
See accompanying Notes to Financial Statements.
|
| 11 INVESCO OPPENHEIMER V.I. DISCOVERY MID CAP GROWTH FUND |
FINANCIAL HIGHLIGHTS Continued
| | | | | | | | | | | | | | | | | | | | | | | | |
| Series II Shares | | Six Months
Ended
June 30, 2019
(Unaudited) | | | Year Ended
December 31,
2018 | | | Year Ended
December 31,
2017 | | | Year Ended
December 31,
2016 | | | Year Ended
December 31,
2015 | | | Year Ended
December 31,
2014 | |
| |
| Per Share Operating Data | | | | | | | | | | | | | | | | | | | | | | | | |
Net asset value, beginning of period | | | $64.41 | | | | $79.87 | | | | $69.43 | | | | $73.88 | | | | $76.21 | | | | $72.22 | |
| |
| Income (loss) from investment operations: | | | | | | | | | | | | | | | | | | | | | | | | |
| Net investment loss1 | | | (0.13) | | | | (0.37) | | | | (0.28) | | | | (0.15) | | | | (0.38) | | | | (0.46) | |
| Net realized and unrealized gain (loss) | | | 19.21 | | | | (2.79) | | | | 19.11 | | | | 1.62 | | | | 5.50 | | | | 4.45 | |
| | | | |
| Total from investment operations | | | 19.08 | | | | (3.16) | | | | 18.83 | | | | 1.47 | | | | 5.12 | | | | 3.99 | |
| |
| Dividends and/or distributions to shareholders: | | | | | | | | | | | | | | | | | | | | | | | | |
| Dividends from net investment income | | | 0.00 | | | | 0.00 | | | | 0.00 | | | | 0.00 | | | | 0.00 | | | | 0.00 | |
| Distributions from net realized gain | | | (10.91) | | | | (12.30) | | | | (8.39) | | | | (5.92) | | | | (7.45) | | | | 0.00 | |
| | | | |
| Total dividends and/or distributions to shareholders | | | (10.91) | | | | (12.30) | | | | (8.39) | | | | (5.92) | | | | (7.45) | | | | 0.00 | |
| |
| Net asset value, end of period | | | $72.58 | | | | $64.41 | | | | $79.87 | | | | $69.43 | | | | $73.88 | | | | $76.21 | |
| | | | |
| | | | |
|
| |
| Total Return, at Net Asset Value2 | | | 29.85% | | | | (6.31)% | | | | 28.46% | | | | 2.08% | | | | 6.35% | | | | 5.53% | |
|
| |
| Ratios/Supplemental Data | | | | | | | | | | | | | | | | | | | | | | | | |
| Net assets, end of period (in thousands) | | | $44,595 | | | | $35,054 | | | | $39,599 | | | | $32,252 | | | | $37,029 | | | | $30,964 | |
| |
| Average net assets (in thousands) | | | $40,743 | | | | $40,815 | | | | $35,753 | | | | $33,797 | | | | $32,812 | | | | $32,927 | |
| |
| Ratios to average net assets:3 | | | | | | | | | | | | | | | | | | | | | | | | |
| Net investment loss | | | (0.36)% | | | | (0.48)% | | | | (0.37)% | | | | (0.21)% | | | | (0.49)% | | | | (0.64)% | |
| Expenses excluding specific expenses listed below | | | 1.11% | | | | 1.11% | | | | 1.09% | | | | 1.09% | | | | 1.08% | | | | 1.08% | |
| Interest and fees from borrowings | | | 0.00%4 | | | | 0.00%4 | | | | 0.00%4 | | | | 0.00%4 | | | | 0.00%4 | | | | 0.00% | |
| | | | |
| Total expenses5 | | | 1.11% | | | | 1.11% | | | | 1.09% | | | | 1.09% | | | | 1.08% | | | | 1.08% | |
| Expenses after payments, waivers and/or reimbursements and reduction to custodian expenses | | | 1.05% | | | | 1.05% | | | | 1.05% | | | | 1.05% | | | | 1.05% | | | | 1.05% | |
| |
| Portfolio turnover rate | | | 36% | | | | 104% | | | | 105% | | | | 141% | | | | 81% | | | | 113% | |
1. Per share amounts calculated based on the average shares outstanding during the period.
2. Assumes an initial investment on the business day before the first day of the fiscal period, with all dividends and distributions reinvested in additional shares on the reinvestment date, and redemption at the net asset value calculated on the last business day of the fiscal period. Total returns are not annualized for periods less than one full year. Total return information does not reflect expenses that apply at the separate account level or to related insurance products. Inclusion of these charges would reduce the total return figures for all periods shown. Returns do not reflect the deduction of taxes that a shareholder would pay on fund distributions or the redemption of fund shares.
3. Annualized for periods less than one full year.
4. Less than 0.005%.
5. Total expenses including indirect expenses from affiliated fund fees and expenses were as follows:
| | | | | | | | |
| Six Months Ended June 30, 2019 | | | 1.11% | | | | | |
| Year Ended December 31, 2018 | | | 1.11% | | | | | |
| Year Ended December 31, 2017 | | | 1.09% | | | | | |
| Year Ended December 31, 2016 | | | 1.09% | | | | | |
| Year Ended December 31, 2015 | | | 1.08% | | | | | |
| Year Ended December 31, 2014 | | | 1.08% | | | | | |
See accompanying Notes to Financial Statements.
|
| 12 INVESCO OPPENHEIMER V.I. DISCOVERY MID CAP GROWTH FUND |
NOTES TO FINANCIAL STATEMENTSJune 30, 2019 Unaudited
Note1- Significant Accounting Policies
Invesco Oppenheimer V.I. Discovery Mid Cap Growth Fund (the “Fund”) is a series portfolio of AIM Variable Insurance Funds (Invesco Variable Insurance Funds) (the “Trust”). The Trust is a Delaware statutory trust registered under the Investment Company Act of 1940, as amended (the “1940 Act”), as anopen-end series management investment company authorized to issue an unlimited number of shares of beneficial interest. Information presented in these financial statements pertains only to the Fund. Matters affecting the Fund or each class will be voted on exclusively by the shareholders of such Fund or each class.
Prior to the close of business on May 24, 2019, the Fund operated as Oppenheimer Discovery Mid Cap Growth Fund/VA (the “Acquired Fund” or “Predecessor Fund”). The Acquired Fund was reorganized after the close of business on May 24, 2019 (the “Reorganization Date”) through the transfer of all of its assets and liabilities to the Fund (the “Reorganization”).
Upon closing of the Reorganization, holders of the Acquired Fund’sNon-Service and Service shares received Series I and Series II shares of the Fund, respectively. Information for the Acquired Fund’sNon-Service and Service shares prior to the Reorganization is included with Series I and Series II, respectively, throughout this report.
The Fund’s investment objective is to seek capital appreciation.
The Fund currently offers two classes of shares, Series I and Series II, both of which are offered to insurance company separate accounts funding variable annuity contracts and variable life insurance policies (“variable products”).
The Fund is an investment company and accordingly follows the investment company accounting and reporting guidance in accordance with Financial Accounting Standards Board Accounting Standards Codification Topic 946, Financial Services – Investment Companies.
The following is a summary of the significant accounting policies followed by the Fund in the preparation of its financial statements.
| A. | Security Valuations – Securities, including restricted securities, are valued according to the following policy. |
A security listed or traded on an exchange (except convertible securities) is valued at its last sales price or official closing price as of the close of the customary trading session on the exchange where the security is principally traded, or lacking any sales or official closing price on a particular day, the security may be valued at the closing bid price on that day. Securities traded in theover-the-counter market are valued based on prices furnished by independent pricing services or market makers. When such securities are valued by an independent pricing service they may be considered fair valued. Futures contracts are valued at the final settlement price set by an exchange on which they are principally traded. Listed options are valued at the mean between the last bid and asked prices from the exchange on which they are principally traded. Options not listed on an exchange are valued by an independent source at the mean between the last bid and asked prices. For purposes of determining net asset value (“NAV”) per share, futures and option contracts generally are valued 15 minutes after the close of the customary trading session of the New York Stock Exchange (“NYSE”).
Investments inopen-end andclosed-end registered investment companies that do not trade on an exchange are valued at theend-of-day net asset value per share. Investments inopen-end andclosed-end registered investment companies that trade on an exchange are valued at the last sales price or official closing price as of the close of the customary trading session on the exchange where the security is principally traded.
Debt obligations (including convertible securities) and unlisted equities are fair valued using an evaluated quote provided by an independent pricing service. Evaluated quotes provided by the pricing service may be determined without exclusive reliance on quoted prices, and may reflect appropriate factors such asinstitution-size trading in similar groups of securities, developments related to specific securities, dividend rate (for unlisted equities), yield (for debt obligations), quality, type of issue, coupon rate (for debt obligations), maturity (for debt obligations), individual trading characteristics and other market data. Pricing services generally value debt obligations assuming orderly transactions of institutional round lot size, but a fund may hold or transact in the same securities in smaller, odd lot sizes. Odd lots often trade at lower prices than institutional round lots. Debt obligations are subject to interest rate and credit risks. In addition, all debt obligations involve some risk of default with respect to interest and/or principal payments.
Foreign securities’ (including foreign exchange contracts) prices are converted into U.S. dollar amounts using the applicable exchange rates as of the close of the NYSE. If market quotations are available and reliable for foreign exchange-traded equity securities, the securities will be valued at the market quotations. Because trading hours for certain foreign securities end before the close of the NYSE, closing market quotations may become unreliable. If between the time trading ends on a particular security and the close of the customary trading session on the NYSE, events occur that the investment adviser determines are significant and make the closing price unreliable, the Fund may fair value the security. If the event is likely to have affected the closing price of the security, the security will be valued at fair value in good faith using procedures approved by the Board of Trustees. Adjustments to closing prices to reflect fair value may also be based on a screening process of an independent pricing service to indicate the degree of certainty, based on historical data, that the closing price in the principal market where a foreign security trades is not the current value as of the close of the NYSE. Foreign securities’ prices meeting the approved degree of certainty that the price is not reflective of current value will be priced at the indication of fair value from the independent pricing service. Multiple factors may be considered by the independent pricing service in determining adjustments to reflect fair value and may include information relating to sector indices, American Depositary Receipts and domestic and foreign index futures. Foreign securities may have additional risks including exchange rate changes, potential for sharply devalued currencies and high inflation, political and economic upheaval, the relative lack of issuer information, relatively low market liquidity and the potential lack of strict financial and accounting controls and standards.
Securities for which market prices are not provided by any of the above methods may be valued based upon quotes furnished by independent sources. The last bid price may be used to value equity securities. The mean between the last bid and asked prices is used to value debt obligations, including corporate loans.
Securities for which market quotations are not readily available or became unreliable are valued at fair value as determined in good faith by or under the supervision of the Trust’s officers following procedures approved by the Board of Trustees. Issuer specific events, market trends, bid/asked quotes of brokers and information providers and other market data may be reviewed in the course of making a good faith determination of a
13 INVESCO OPPENHEIMER V.I. DISCOVERY MID CAP GROWTH FUND
NOTES TO FINANCIAL STATEMENTSUnaudited / Continued
Note1- Significant Accounting Policies (continued)
security’s fair value.
The Fund may invest in securities that are subject to interest rate risk, meaning the risk that the prices will generally fall as interest rates rise and, conversely, the prices will generally rise as interest rates fall. Specific securities differ in their sensitivity to changes in interest rates depending on their individual characteristics. Changes in interest rates may result in increased market volatility, which may affect the value and/or liquidity of certain Fund investments.
Valuations change in response to many factors including the historical and prospective earnings of the issuer, the value of the issuer’s assets, general economic conditions, interest rates, investor perceptions and market liquidity. Because of the inherent uncertainties of valuation, the values reflected in the financial statements may materially differ from the value received upon actual sale of those investments.
| B. | Securities Transactions and Investment Income -Securities transactions are accounted for on a trade date basis. Realized gains or losses on sales are computed on the basis of specific identification of the securities sold. Interest income (net of withholding tax, if any) is recorded on the accrual basis from settlement date. Dividend income (net of withholding tax, if any) is recorded on theex-dividend date. |
The Fund may periodically participate in litigation related to Fund investments. As such, the Fund may receive proceeds from litigation settlements. Any proceeds received are included in the Statement of Operations as realized gain (loss) for investments no longer held and as unrealized gain (loss) for investments still held.
Brokerage commissions and mark ups are considered transaction costs and are recorded as an increase to the cost basis of securities purchased and/or a reduction of proceeds on a sale of securities. Such transaction costs are included in the determination of net realized and unrealized gain (loss) from investment securities reported in the Statement of Operations and the Statement of Changes in Net Assets and the net realized and unrealized gains (losses) on securities per share in the Financial Highlights. Transaction costs are included in the calculation of the Fund’s net asset value and, accordingly, they reduce the Fund’s total returns. These transaction costs are not considered operating expenses and are not reflected in net investment income reported in the Statement of Operations and the Statement of Changes in Net Assets, or the net investment income per share and the ratios of expenses and net investment income reported in the Financial Highlights, nor are they limited by any expense limitation arrangements between the Fund and the investment adviser.
The Fund allocates income and realized and unrealized capital gains and losses to a class based on the relative net assets of each class.
| C. | Country Determination- For the purposes of making investment selection decisions and presentation in the Schedule of Investments, the investment adviser may determine the country in which an issuer is located and/or credit risk exposure based on various factors. These factors include the laws of the country under which the issuer is organized, where the issuer maintains a principal office, the country in which the issuer derives 50% or more of its total revenues and the country that has the primary market for the issuer’s securities, as well as other criteria. Among the other criteria that may be evaluated for making this determination are the country in which the issuer maintains 50% or more of its assets, the type of security, financial guarantees and enhancements, the nature of the collateral and the sponsor organization. Country of issuer and/or credit risk exposure has been determined to be the United States of America, unless otherwise noted. |
| D. | Distributions -Dividends and distributions to shareholders, which are determined in accordance with income tax regulations and may differ from U.S. GAAP, are recorded on theex-dividend date. Income and capital gain distributions, if any, are declared and paid annually or at other times as determined necessary by the Adviser. |
The tax character of distributions is determined as of the Fund’s fiscal year end. Therefore, a portion of the Fund’s distributions made to shareholders prior to the Fund’s fiscal year end may ultimately be categorized as a tax return of capital.
| E. | Federal Income Taxes -The Fund intends to comply with provisions of the Internal Revenue Code applicable to regulated investment companies and to distribute substantially all of its investment company taxable income to shareholders. Therefore, no federal income or excise tax provision is required. The Fund files income tax returns in U.S. federal and applicable state jurisdictions. The statute of limitations on the Fund’s tax return filings generally remains open for the three preceding fiscal reporting period ends. The Fund has analyzed its tax positions for the fiscal year ended December 31, 2018, including open tax years, and does not believe there are any uncertain tax positions requiring recognition in the Fund’s financial statements. |
During the fiscal year ended December 31, 2018, the fund did not utilize anycapital loss carryforwards to offset capital gains realized in that fiscal year. Capital losses with no expiration will be carried forward to future years if not offset by gains.
At period end, it is estimated that the capital loss carryforwards would be zero. The estimated capital loss carryforward represents the carryforward as of the end of the last fiscal year, increased or decreased by capital losses or gains realized in the first six months of the current fiscal year. During the reporting period, it is estimated that the Fund will not utilize any capital loss carryforward to offset realized capital gains.
Net investment income (loss) and net realized gain (loss) may differ for financial statement and tax purposes. The character of dividends and distributions made during the fiscal year from net investment income or net realized gains are determined in accordance with federal income tax requirements, which may differ from the character of net investment income or net realized gains presented in those financial statements in accordance with U.S. GAAP. Also, due to timing of dividends and distributions, the fiscal year in which amounts are distributed may differ from the fiscal year in which the income or net realized gain was recorded by the Fund.
The aggregate cost of securities and other investments and the composition of unrealized appreciation and depreciation of securities and other investments for federal income tax purposes at period end are noted in the following table. The primary difference between book and tax appreciation or depreciation of securities and other investments, if applicable, is attributable to the tax deferral of losses or tax realization of financial statement unrealized gain or loss.
|
| 14 INVESCO OPPENHEIMER V.I. DISCOVERY MID CAP GROWTH FUND |
Note1- Significant Accounting Policies (continued)
| | | | |
Total federal tax cost of securities | | $ | 554,199,076 | |
| | | | |
Gross unrealized appreciation | | $ | 181,905,782 | |
Gross unrealized depreciation | | | (592,573) | |
| | | | |
Net unrealized appreciation | | $ | 181,313,209 | |
| | | | |
| F. | Expenses -Fees provided for under the Rule12b-1 plan of a particular class of the Fund are charged to the operations of such class. Transfer agency fees and expenses and other shareholder recordkeeping fees and expenses attributable are allocated to each share class based on relative net assets. Transfer agency fees and expenses and other shareholder recordkeeping fees and expenses relating to all other classes are allocated among those classes based on relative net assets. All other expenses are allocated among the classes based on relative net assets. |
| G. | Accounting Estimates -The financial statements are prepared on a basis in conformity with accounting principles generally accepted in the United States of America (“GAAP”), which requires management to make estimates and assumptions that affect the reported amounts of assets and liabilities at the date of the financial statements and the reported amounts of revenues and expenses during the reporting period including estimates and assumptions related to taxation. Actual results could differ from those estimates by a significant amount. In addition, the Fund monitors for material events or transactions that may occur or become known after theperiod-end date and before the date the financial statements are released to print. |
| H. | Indemnifications -Under the Trust’s organizational documents, each Trustee, officer, employee or other agent of the Trust is indemnified against certain liabilities that may arise out of the performance of their duties to the Fund. Additionally, in the normal course of business, the Fund enters into contracts, including the Fund’s servicing agreements, that contain a variety of indemnification clauses. The Fund’s maximum exposure under these arrangements is unknown as this would involve future claims that may be made against the Fund that have not yet occurred. The risk of material loss as a result of such indemnification claims is considered remote. |
Note2- Advisory Fees and Other Fees Paid to Affiliates
The Trust has entered into a master investment advisory agreement with Invesco Advisers, Inc. (the “Adviser” or “Invesco”). Under the terms of the investment advisory agreement, the Fund accrues daily and pays monthly an advisory fee to the Adviser based on the annual rate of the Fund’s average daily net assets as follows:
| | | | |
| Fee Schedule* | | | |
| |
| Up to $200 million | | | 0.75% | |
| Next $200 million | | | 0.72 | |
| Next $200 million | | | 0.69 | |
| Next $200 million | | | 0.66 | |
| Next $700 million | | | 0.60 | |
| Over $1.5 billion | | | 0.58 | |
* The advisory fee paid by the Fund shall be reduced by any amounts paid by the Fund under the administrative services agreement with the Adviser.
For the six months ended June 30, 2019, the effective advisory fees incurred by the Fund were 0.71%.
From the beginning of the fiscal period until the date of the Reorganization, the Acquired Fund paid $1,948,311in advisory fees to OFI Global Asset Management, Inc. based on the annual rates above of the Acquired Fund’s average daily net assets.
Under the terms of a mastersub-advisory agreement between the Adviser and each of Invesco Asset Management Deutschland GmbH, Invesco Asset Management Limited, Invesco Asset Management (Japan) Limited, Invesco Hong Kong Limited, Invesco Senior Secured Management, Inc. and Invesco Canada Ltd. and separatesub-advisory agreements with Invesco Capital Management LLC, and Invesco Asset Management (India) Private Limited (collectively, the “AffiliatedSub-Advisers”) the Adviser, not the Fund, will pay 40% of the fees paid to the Adviser to any such AffiliatedSub-Adviser(s) that provide(s) discretionary investment management services to the Fund based on the percentage of assets allocated to suchSub-Adviser(s). Invesco has also entered into aSub-Advisory Agreement with OppenheimerFunds, Inc. to provide discretionary management services to the Funds.
Effective on the Reorganization Date, the Adviser has contractually agreed, through at least May 31, 2021, to waive advisory fees and/or reimburse expenses of all shares to the to the extent necessary to limit the total annual fund operating expenses after fee waiver and/or expense reimbursement (excluding certain items discussed below) ofSeries I and Series II shares to0.80% and 1.05%, respectively, of the Fund’s average daily net assets (the “expense limits”). In determining the Adviser’s obligation to waive advisory fees and/or reimburse expenses, the following expenses are not taken into account, and could cause total annual fund operating expenses after fee waivers and/or expense reimbursement to exceed the numbers reflected above: (1) interest; (2) taxes; (3) dividend expenses on short sales; (4) extraordinary ornon-routine items, including litigation expenses; and (5) expenses that the Fund has incurred but did not actually pay because of an expense offset arrangement. Unless Invesco continues the fee waiver agreement, it will terminate May 31, 2021. During its term, the fee waiver agreement cannot be terminated or amended to increase the expense limits or reduce the advisory fee waiver without approval of the Board of Trustees.
Further, the Adviser has contractually agreed, through at least June 30, 2021, to waive the advisory fee payable by the Fund in an amount equal to 100% of the net advisory fees the Adviser receives from the affiliated money market funds on investments by the Fund of uninvested cash in such affiliated money market funds.
For the six months ended June 30, 2019, the Adviser waived advisory fees of $6,487 and reimbursed fund expenses of $184,350 and $12,150 of
|
| 15 INVESCO OPPENHEIMER V.I. DISCOVERY MID CAP GROWTH FUND |
NOTES TO FINANCIAL STATEMENTSUnaudited / Continued
Note2- Advisory Fees and Other Fees Paid to Affiliates (continued)
Series I and Series II, respectively.
Prior to the Reorganization, the OFI Global Asset Management, Inc. had contractually agreed to waive fees and/or reimburse expenses of Series I and Series II shares to 0.80% and 1.05%, respectively, of the Acquired Fund’s average daily net assets.
The Trust has entered into a master administrative services agreement with Invesco pursuant to which the Fund has agreed to pay Invesco for certain administrative costs incurred in providing accounting services to the Fund. For the six months ended June 30, 2019, expenses incurred under the agreement are shown in the Statement of Operations as Administration fees. Additionally, Invesco has entered into service agreements whereby JPMorgan Chase Bank serves as custodian to the Fund. Prior to the Reorganization, the Acquired Fund paid administrative fees to OFI Global Asset Management, Inc.
The Trust has entered into a transfer agency and service agreement with Invesco Investment Services, Inc. (“IIS”) pursuant to which the Fund has agreed to pay IIS a fee for providing transfer agency and shareholder services to the Fund and reimburse IIS for certain expenses incurred by IIS in the course of providing such services. IIS may make payments to intermediaries that provide omnibus account services,sub-accounting services and/or networking services. All fees payable by IIS to intermediaries that provide omnibus account services orsub-accounting services are charged back to the Fund, subject to certain limitations approved by the Trust’s Board of Trustees. Prior to the Reorganization, the Acquired Fund paid transfer agent fees to OFI Global Asset Management, Inc. and Shareholder Services, Inc. For the six monthsended June 30, 2019, expenses incurred under these agreements are shown in the Statement of Operations as Transfer and shareholder servicing agent fees.
The Trust has entered into master distribution agreements with Invesco Distributors, Inc. (“IDI”) to serve as the distributor for the Service II shares of the Fund. The Trust has adopted a plan pursuant to Rule12b-1 under the 1940 Act with respect to the Fund’s Service II shares (the “Plan”). The Fund, pursuant to the Plan, pays IDI at an annual rate of 0.25% of the average daily net assets of Service II shares. The fees are accrued daily and paid monthly. Of the Plan payments, up to 0.25% of the average daily net assets of the class of shares may be paid to furnish continuing personal shareholder services to customers who purchase and own shares of such class. Any amounts not paid as a service fee under the Plan would constitute an asset-based sales charge. Rules of the Financial Industry Regulatory Authority (“FINRA”) impose a cap on the total sales charges, including asset-based sales charges, that may be paid by any class of shares of the Fund plans. Prior to the Reorganization, the Acquired Fund paid distribution fees to OppenheimerFunds Distributor, Inc. For the six months ended June 30, 2019, expenses incurred under the plans are shown in the Statement of Operations as Distribution and service plan fees.
Certain officers and trustees of the Trust are officers and directors of the Adviser, IIS and/or IDI.
Note3- Additional Valuation Information
GAAP defines fair value as the price that would be received to sell an asset or paid to transfer a liability in an orderly transaction between market participants at the measurement date, under current market conditions. GAAP establishes a hierarchy that prioritizes the inputs to valuation methods, giving the highest priority to readily available unadjusted quoted prices in an active market for identical assets (Level 1) and the lowest priority to significant unobservable inputs (Level 3), generally when market prices are not readily available or are unreliable. Based on the valuation inputs, the securities or other investments are tiered into one of three levels. Changes in valuation methods may result in transfers in or out of an investment’s assigned level:
Level 1 — Prices are determined using quoted prices in an active market for identical assets.
Level 2 — Prices are determined using other significant observable inputs. Observable inputs are inputs that other market participants may use in pricing a security. These may include quoted prices for similar securities, interest rates, prepayment speeds, credit risk, yield curves, loss severities, default rates, discount rates, volatilities and others.
Level 3 — Prices are determined using significant unobservable inputs. In situations where quoted prices or observable inputs are unavailable (for example, when there is little or no market activity for an investment at the end of the period), unobservable inputs may be used. Unobservable inputs reflect the Fund’s own assumptions about the factors market participants would use in determining fair value of the securities or instruments and would be based on the best available information.
As of June 30, 2019, all of the securities in this Fund were valued based on Level 1 inputs (see the Schedule of Investments for security categories). The level assigned to the securities valuations may not be an indication of the risk or liquidity associated with investing in those securities. Because of the inherent uncertainties of valuation, the values reflected in the financial statements may materially differ from the value received upon actual sale of those investments.
Forward currency exchange contracts and futures contracts, if any, are reported at their unrealized appreciation/depreciation at measurement date, which represents the change in the contract’s value from trade date. All additional assets and liabilities included in the above table are reported at their market value at measurement date.
Note4- Security Transactions with Affiliated Funds
The Fund is permitted to purchase or sell securities from or to certain other Invesco Funds under specified conditions outlined in procedures adopted by the Board of Trustees of the Trust. The procedures have been designed to ensure that any purchase or sale of securities by the Fund from or to another
|
| 16 INVESCO OPPENHEIMER V.I. DISCOVERY MID CAP GROWTH FUND |
Note4- Security Transactions with Affiliated Funds (continued)
fund or portfolio that is or could be considered an affiliate by virtue of having a common investment adviser (or affiliated investment advisers), common Trustees and/or common officers complies with Rule17a-7 of the 1940 Act. Further, as defined under the procedures, each transaction is effected at the current market price. Pursuant to these procedures for the period January 1, 2019 to May 24, 2019, the Predecessor Fund engaged in transactions with affiliates as listed: Securities purchases of $1,560,045 and securities sales of $1,518,654, which resulted in net realized losses of $149,286. For the period May 25, 2019 to June 30, 2019, the Fund engaged in transactions with affiliates as listed:Securities purchases of $1,770,648, which resulted in net realized gains (losses) of zero.
Note5- Expense Offset Arrangements
The expense offset arrangement is comprised of custodian credits which result from periodic overnight cash balances at the custodian. For the six months ended June 30, 2019, the Fund received credits from this arrangement, which resulted in the reduction of the Acquired Fund’s total expenses of $2,569.
Note6- Trustee and Officer Fees and Benefits
Certain Trustees have executed a Deferred Compensation Agreement pursuant to which they have the option to elect to defer receipt of all or a portion of the annual compensation they are entitled to receive from the Fund. For purposes of determining the amount owed to the Trustees under the plan, deferred amounts are treated as though equal dollar amounts had been invested in shares of the Fund or in other Invesco and/or Invesco Oppenheimer funds selected by the Trustees. The Fund purchases shares of the funds selected for deferral by the Trustees in amounts equal to his or her deemed investment, resulting in a Fund asset equal to the deferred compensation liability. Such assets are included as a component of “Other” within the asset section of the Statement of Assets and Liabilities. Deferral of Trustees’ fees under the plan will not affect the net assets of the Fund and will not materially affect the Fund’s assets, liabilities or net investment income per share. Amounts will be deferred until distributed in accordance with the compensation deferral plan.
Note7- Cash Balances
The Fund is permitted to temporarily carry a negative or overdrawn balance in its account with JP Morgan Chase Bank, the custodian bank. Such balances, if any atperiod-end, are shown in the Statement of Assets and Liabilities under the payable caption Amount due custodian. To compensate the custodian bank for such overdrafts, the overdrawn Fund may either (1) leave funds as a compensating balance in the account so the custodian bank can be compensated by earning the additional interest; or (2) compensate by paying the custodian bank at a rate agreed upon by the custodian bank and Invesco, not to exceed the contractually agreed upon rate.
Note8- Investments Transactions
The aggregate amount of investment securities (other than short-term securities, U.S. Treasury obligations and money market funds, if any) purchased and sold by the Fund during the six months ended June 30, 2019 was $247,276,504 and $292,797,842, respectively.
Note9- Share Information
Transactions in shares of beneficial interest were as follows:
| | | | | | | | | | | | | | | | |
| | | Six Months Ended June 30, 20191 | | | Year Ended December 31, 2018 | |
| | | | |
| | | Shares | | | Amount | | | Shares | | | Amount |
Series I Shares | | | | | | | | | | | | | | | | |
Sold | | | 77,422 | | | $ | 6,215,029 | | | | 349,932 | | | $ | 26,834,584 | |
Dividends and/or distributions reinvested | | | 1,097,324 | | | | 84,658,513 | | | | 1,182,843 | | | | 95,656,703 | |
Redeemed | | | (880,883 | ) | | | (71,892,401 | ) | | | (1,242,422 | ) | | | (102,207,288 | ) |
| | | | |
| Net increase | | | 293,863 | | | $ | 18,981,141 | | | | 290,353 | | | $ | 20,283,999 | |
| | | | |
| | | | |
| | | | | | | | | | | | | | | | |
Series II Shares | | | | | | | | | | | | | | | | |
Sold | | | 46,475 | | | $ | 3,469,507 | | | | 110,486 | | | $ | 8,346,786 | |
Dividends and/or distributions reinvested | | | 80,954 | | | | 5,797,957 | | | | 78,492 | | | | 5,963,052 | |
Redeemed | | | (57,286 | ) | | | (4,323,944 | ) | | | (140,477 | ) | | | (10,461,719 | ) |
| | | | |
| Net increase | | | 70,143 | | | $ | 4,943,520 | | | | 48,501 | | | $ | 3,848,119 | |
| | | | |
| | | | |
|
| 17 INVESCO OPPENHEIMER V.I. DISCOVERY MID CAP GROWTH FUND |
NOTES TO FINANCIAL STATEMENTSUnaudited / Continued
Note9- Share Information (continued)
1.There are entities that are record owners of more than 5% of the outstanding shares of the Fund and own 7% of the outstanding shares of the Fund. The Fund and the Fund’s principal underwriter or adviser, are parties to participation agreements with these entities whereby these entities sell units of interest in separate accounts funding variable products that are invested in the Fund. The Fund, Invesco and/or Invesco affiliates may make payments to these entities, which are considered to be related to the Fund, for providing services to the Fund, Invesco and/or Invesco affiliates, including, but not limited to services such as securities brokerage, distribution, third party record keeping and account servicing. The Fund has no knowledge as to whether all or any portion of the shares owned of record by these entities are also owned beneficially.
In addition, 46% of the outstanding shares of the Fund are owned by the Adviser or an affiliate of the Adviser.
Note10- Borrowings
Joint Credit Facility.A number of mutual funds managed by the Adviser participate in a $1.95 billion revolving credit facility (the “Facility”) intended to provide short-term financing, if necessary, subject to certain restrictions in connection with atypical redemption activity. Expenses and fees related to the Facility are paid by the participating funds and are disclosed separately or as other expenses on the Statement of Operations. The Fund did not utilize the Facility during the reporting period. The Facility terminated May 24, 2019.
Note11- Independent Registered Public Accounting Firm
The Audit Committee of the Board of Trustees appointed, and the Board of Trustees ratified and approved, PricewaterhouseCoopers LLP (“PWC”) as the independent registered public accounting firm of the Fund for the fiscal periods ending after May 24, 2019. Prior to the close of business on May 24, 2019, the Predecessor Fund was a separate series of an unaffiliated investment company and its financial statements were audited by a different independent registered public accounting firm (the “Prior Auditor”).
Effective after the close of business on May 24, 2019, the Prior Auditor resigned as the independent registered public accounting firm of the Fund. The Prior Auditor’s report on the financial statements of the Predecessor Fund for the past two fiscal years did not contain an adverse or disclaimer of opinion, and was not qualified or modified as to uncertainty, audit scope or accounting principles. During the Predecessor Fund’s two most recent fiscal years and through the close of business on May 24, 2019, there were no (1) disagreements with the Prior Auditor on any matter of accounting principles or practices, financial statement disclosure, or auditing scope or procedure, which disagreements, if not resolved to the Prior Auditor’s satisfaction, would have caused it to make reference to that matter in connection with its report; or (2) “reportable events,” as that term is defined in Item 304(a)(1)(v) of RegulationS-K under the Securities Exchange Act of 1934.
|
| 18 INVESCO OPPENHEIMER V.I. DISCOVERY MID CAP GROWTH FUND |
APPROVAL OF THE INVESTMENT ADVISORY ANDSUB-ADVISORY CONTRACTSUnaudited
At meetings held on December 14, 2018, the Board of Trustees (the Board or the Trustees) of AIM Variable Insurance Funds (Invesco Variable Insurance Funds) (the Trust) as a whole, and the independent Trustees, who comprise over 75% of the Board, voting separately, approved (i) an amendment to the Trust’s Master Investment Advisory Agreement with Invesco Advisers, Inc. (Invesco Advisers and the investment advisory agreement) to add Invesco Oppenheimer V.I. Discovery Mid Cap Growth Fund (the Fund), (ii) an amendment to the Master IntergroupSub-Advisory Contract for Mutual Funds with Invesco Asset Management Deutschland GmbH, Invesco Asset Management Limited, Invesco Asset Management (Japan) Limited, Invesco Hong Kong Limited, Invesco Senior Secured Management, Inc. and Invesco Canada Ltd. to add the Fund, (iii) an amendment to the separatesub-advisory contract with Invesco Capital Management LLC to add the Fund, (iv) an amendment to the separatesub-advisory contract with Invesco Asset Management (India) Private Limited to add the Fund, and (v) an initialsub-advisory contract with OppenheimerFunds, Inc. (collectively, the AffiliatedSub-Advisers and thesub-advisory contracts). Additionally, on March 26, 2019, the Boardre-approved an initialsub-advisory contract with OppenheimerFunds, Inc. following its change of control as a result of the acquisition of OppenheimerFunds, Inc. and its subsidiaries, including the Oppenheimer mutual funds (each, an Oppenheimer Fund), by Invesco Ltd. (the OFI Transaction). After evaluating the factors discussed below, among others, the Board approved the Fund’s investment advisory agreement and thesub-advisory contracts and determined that the compensation payable by the Fund to Invesco Advisers and by Invesco Advisers to the AffiliatedSub-Advisers is fair and reasonable.
The Board’s Evaluation Process
The Board noted that it had previously approved establishing the Fund at the Board meeting held on October 23, 2018 and that the Fund was formed to acquire the assets and liabilities of an Oppenheimer Fund (the Acquired Fund) with the same investment objective and substantially similar principal investment strategies and risks. At the time of approval, the Fund had no assets and no performance history and the portfolio managers were not employed by Invesco Advisers or any of the AffiliatedSub-Advisers except OppenheimerFunds, Inc., which was not affiliated with Invesco at that time.
In approving the investment advisory agreement andsub-advisory contracts, the Board followed a process similar to the process that it follows in annually reviewing and approving investment advisory agreements andsub-advisory contracts for the series portfolios of funds advised by Invesco Advisers and considered the information provided in the most recent annual review process for those funds as well as the information provided with respect to the Fund. As part of the approval process, the Board reviewed and considered information provided in response to detailed requests for information submitted to management by the independent Trustees with assistance from legal counsel to the independent Trustees. The Board reviewed comparative investment performance and fee data prepared by Invesco Advisers and an independent mutual fund data provider. The Board was assisted in its review by the Senior Officer, an officer of the Invesco Funds who reports directly to the independent Trustees, and by independent legal counsel.
The discussion below serves as a summary of the material factors and related conclusions that formed the basis for the Board’s approval of the Fund’s investment advisory agreement andsub-advisory contracts. The Trustees’ review and conclusions are based on the comprehensive consideration of all information presented to them and are not the result of any single determinative factor. Moreover, one Trustee may have weighed a particular piece of information or factor differently than another Trustee. This information is current as of December 14, 2018 and March 26, 2019 for thesub-advisory contract with OppenheimerFunds, Inc.
Factors and Conclusions and Summary of Independent Written Fee Evaluation
A. Nature, Extent and Quality of Services Provided by Invesco Advisers and the AffiliatedSub-Advisers
The Board reviewed the nature, extent and quality of the advisory services to be provided to the Fund by Invesco Advisers under the Fund’s investment advisory agreement, and the credentials and experience of the officers and employees of Invesco Advisers who will provide these services. The Board’s review included consideration of the investment process oversight and structure, credit analysis and investment risk management to be employed in providing advisory services to the Fund. The Board also considerednon-advisory services that Invesco Advisers and its affiliates provide to the Invesco Funds and will provide to the Fund, such as various back office support functions, third party oversight, internal audit, valuation, portfolio trading and legal and compliance. The Board also received and reviewed information about Invesco Advisers’ role as administrator of the Invesco Funds’ liquidity risk management program. The Board also reviewed and considered the benefits to shareholders of investing in a fund that is part of the Invesco family of funds under the umbrella of Invesco Ltd., Invesco Advisers’ parent company, and noted Invesco Ltd.’s depth and experience in conducting an investment management business, as well as its commitment of financial and other resources to such business. The Board reviewed and considered information about the resources that Invesco Advisers intends to continue to commit to managing the Invesco family of funds, including the Fund, following the OFI Transaction. The Board concluded that the nature, extent and quality of the services to be provided to the Fund by Invesco Advisers are appropriate and satisfactory.
The Board reviewed the services that may be provided by the AffiliatedSub-Advisers under thesub-advisory contracts and the credentials and experience of the officers and employees of the AffiliatedSub-Advisers who provide these services. The Board noted the AffiliatedSub-Advisers’ expertise with respect to certain asset classes and that the AffiliatedSub-Advisers have offices and personnel that are located in financial centers around the world. As a result, the Board noted that the AffiliatedSub-Advisers can provide research and investment analysis on the markets and economies of various countries in which the Fund may invest, make recommendations regarding securities and assist with security trades. The Board concluded that thesub-advisory contracts may benefit the Fund and its shareholders by permitting Invesco Advisers to use the resources and talents of the AffiliatedSub-Advisers in managing the Fund. The Board concluded that the nature, extent and quality of the services that may be provided by the AffiliatedSub-Advisers are appropriate and satisfactory.
19 INVESCO OPPENHEIMER V.I. DISCOVERY MID CAP GROWTH FUND
APPROVAL OF THE INVESTMENT ADVISORY ANDSUB-ADVISORY CONTRACTSUnaudited / Continued
B. Fund Investment Performance
The Board noted that the Fund would continue the historical performance information of the Acquired Fund following the consummation of the OFI Transaction. The Board considered the performance of the Acquired Fund and the fact that, at the closing of the OFI Transaction, management anticipates that the Fund will be managed pursuant to substantially similar investment strategies and by substantially the same portfolio management team as managed the Acquired Fund. The Board did not view Fund performance as a relevant factor in considering whether to approve thesub-advisory contracts for the Fund, as no AffiliatedSub-Adviser currently manages assets of the Fund.
The Board compared the Fund’s investment performance over multiple time periods ending December 31, 2017 to the performance of funds in the Morningstar performance universe and against the Fund’s benchmark index. The Trustees also reviewed more recent Fund performance and this review did not change their conclusions.
C. Advisory andSub-Advisory Fees and Fund Expenses
The Board compared the Fund’s contractual management fee rate to the contractual management fee rates of funds in the Fund’s Morningstar expense group. The Board also considered comparative information regarding the Fund’s total expense ratio and its various components.
The Board noted that Invesco Advisers has contractually agreed to waive fees and/or limit expenses of the Fund for at least two years from the closing date of the OFI Transaction in an amount necessary to limit total annual operating expenses to a specified percentage of average daily net assets for each class of the Fund.
The Board noted that Invesco Advisers and the AffiliatedSub-Advisers do not manage other similarly managed mutual funds or client accounts.
The Board also considered the services that may be provided by the AffiliatedSub-Advisers pursuant to thesub-advisory contracts, as well as the fees payable by Invesco Advisers to the AffiliatedSub-Advisers pursuant to thesub-advisory contracts.
D. Economies of Scale and Breakpoints
The Board considered the extent to which there may be economies of scale in the provision of advisory services to the Fund. The Board considered Invesco’s reinvestment in its business, including investments in business infrastructure and cybersecurity. The Board also considered that the Fund may benefit from economies of scale through contractual breakpoints in the Fund’s advisory fee schedule, which generally operate to reduce the Fund’s expense ratio as it grows in size. The Board noted that the Fund will share directly in economies of scale through lower fees charged by third party service providers based on the combined size of the Invesco Funds. The Board noted that the Fund may also benefit from economies of scale through initial fee setting, fee waivers and expense reimbursements.
E. Profitability and Financial Resources
The Board reviewed information from the 2018 contract renewal process provided by Invesco Advisers concerning the costs of the advisory and other services that Invesco Advisers and its affiliates provide to the Invesco Funds and the profitability of Invesco Advisers and its affiliates in providing these services. The Board considered the methodology used for calculating profitability and noted the periodic review of such methodology by an independent consultant. The Board noted that Invesco Advisers will continue to operate at a net profit from services Invesco Advisers and its affiliates provide to the Invesco Funds. The Board did not deem the level of profits realized by Invesco Advisers and its affiliates from providing services to the Invesco Funds, and the profits estimated to be realized by the Fund, to be excessive given the nature, extent and quality of the services provided. The Board received information from Invesco Advisers demonstrating that Invesco Advisers and the AffiliatedSub-Advisers are financially sound and have the resources necessary to perform their obligations under the investment advisory agreement andsub-advisory contracts.
F. Collateral Benefits to Invesco Advisers and its Affiliates
The Board considered various other benefits to be received by Invesco Advisers and its affiliates from the relationship with the Fund, including the fees to be received for providing administrative, transfer agency and distribution services to the Fund. The Board considered the performance of Invesco Advisers and its affiliates in providing these services to other Invesco Funds and the organizational structure employed to provide these services. The Board also considered that these services will be provided to the Fund pursuant to written contracts that are reviewed and approved on an annual basis by the Board; and that the services are required for the operation of the Fund.
The Board considered the benefits realized by Invesco Advisers and the AffiliatedSub-Advisers as a result of portfolio brokerage transactions executed through “soft dollar” arrangements. The Board noted that soft dollar arrangements may result in the Fund bearing costs to purchase research that may be used by Invesco Advisers or the AffiliatedSub-Advisers with other clients and may reduce Invesco Advisers’ or the AffiliatedSub-Advisers’ expenses. The Board also considered that it will receive periodic reports from Invesco representing that these arrangements are consistent with regulatory requirements. The Board did not deem the soft dollar arrangements to be inappropriate.
The Board considered that the Fund’s uninvested cash and cash collateral from any securities lending arrangements may be invested in money market funds advised by Invesco Advisers pursuant to procedures approved by the Board. The Board considered that Invesco Advisers will receive advisory fees from these affiliated money market funds attributable to such investments, although Invesco Advisers has contractually agreed to waive through varying periods the advisory fees payable by the Invesco Funds with respect to certain investments in the affiliated money market funds. The waiver is in an amount equal to 100% of the net advisory fee Invesco Advisers will receive from the affiliated money market funds with respect to the Fund’s investment
|
| 20 INVESCO OPPENHEIMER V.I. DISCOVERY MID CAP GROWTH FUND |
APPROVAL OF THE INVESTMENT ADVISORY ANDSUB-ADVISORY CONTRACTSUnaudited / Continued
in the affiliated money market funds of uninvested cash, but not cash collateral. The Board concluded that the amount of advisory fees to be received by Invesco Advisers from the Fund’s investment of cash collateral from any securities lending arrangements in the affiliated money market funds is fair and reasonable.
The Board also considered that an affiliated broker may receive commissions for executing certain trades for the Fund. Invesco Advisers and the AffiliatedSub-Advisers may use the affiliated broker to, among other things, control order routing and minimize information leakage, and the Board was be advised that such trades will be executed in compliance with rules under the federal securities laws and consistent with best execution obligations.
|
| 21 INVESCO OPPENHEIMER V.I. DISCOVERY MID CAP GROWTH FUND |
PORTFOLIO PROXY VOTING POLICIES AND GUIDELINES; UPDATES TO STATEMENT OF INVESTMENTSUnaudited
Go paperless with eDelivery
Visit invesco.com/edelivery to enjoy the convenience and security of anytime electronic access to your investment documents.
With eDelivery, you can elect to have any or all of the following materials delivered straight to your inbox to download, save and print from your own computer:
| ● | | Fund reports and prospectuses |
Invesco mailing information
Send general correspondence to Invesco Investment Services, Inc., P.O. Box 219078, Kansas City, MO 64121-9078.
Important notice regarding delivery of security holder documents
To reduce Fund expenses, only one copy of most shareholder documents may be mailed to shareholders with multiple accounts at the same address (Householding). Mailing of your shareholder documents may be householded indefinitely unless you instruct us otherwise. If you do not want the mailing of these documents to be combined with those for other members of your household, please contact Invesco Investment Services, Inc. at 800 959 4246 or contact your financial institution. We will begin sending you individual copies for each account within 30 days after receiving your request.
Fund holdings and proxy voting information
The Fund provides a complete list of its holdings four times in each fiscal year, at the quarter ends. For the second and fourth quarters, the lists appear in the Fund’s semiannual and annual reports to shareholders. For the first and third quarters, the Fund files the lists with the Securities and Exchange Commission (SEC) on FormN-Q (or any successor Form). The most recent list of portfolio holdings is available at invesco.com/completeqtrholdings. Shareholders can also look up the Fund’s FormsN-Q (or any successor Form) on the SEC website at sec.gov.
A description of the policies and procedures that the Fund uses to determine how to vote proxies relating to portfolio securities is available without charge, upon request, from our Client Services department at 800 959 4246 or at invesco.com/proxyguidelines. The information is also available on the SEC website, sec.gov.
Information regarding how the Fund voted proxies related to its portfolio securities during the most recent12-month period ended June 30 is available at invesco.com/proxysearch. The information is also available on the SEC website, sec.gov.
Invesco Advisers, Inc. is an investment adviser; it provides investment advisory services to individual and institutional clients and does not sell securities. Invesco Distributors, Inc. is the US distributor for Invesco Ltd.’s retail mutual funds, exchange-traded funds and institutional money market funds. Both are wholly owned, indirect subsidiaries of Invesco Ltd.
22 INVESCO OPPENHEIMER V.I. DISCOVERY MID CAP GROWTH FUND
SPECIAL SHAREHOLDER MEETINGUnaudited
A Special Meeting (“Meeting”) of Shareholders of Invesco Oppenheimer V.I. Discovery Mid Cap Growth Fund was held on April 12, 2019. The Meeting was held for the following purpose:
(1) Approval of an Agreement and Plan of Reorganization that provides for the reorganization of Oppenheimer Discovery Mid Cap Growth Fund/VA into Invesco Oppenheimer V.I. Discovery Mid Cap Growth Fund.
The results of the voting on the above matter was as follows:
| | | | | | | | | | | | | | | | |
Matter | | Votes For | | | Votes Against | | | Votes Abstain | | | Broker Non-Votes | |
| (1) Approval of an Agreement and Plan of Reorganization | | | 8,078,539 | | | | 395,025 | | | | 438,097 | | | | 0 | |
23 INVESCO OPPENHEIMER V.I. DISCOVERY MID CAP GROWTH FUND

| | | | |

| | Semiannual Report | | 6/30/2019 |
| | |
| | Invesco Oppenheimer |
| | V.I. Global Fund* |
| | The Fund provides a complete list of its holdings four times in each fiscal year, at the quarter ends. For the second and fourth quarters, the lists appear in the Fund’s semi annual and annual reports to shareholders. For the first and third quarters, the Fund files the lists with the Securities and Exchange Commission (SEC) on FormN-Q (or any successor Form). The Fund’s FormN-Q (or any successor Form) filings are available on the SEC website, sec.gov. The Fund’s most recent portfolio holdings, as filed on FormN-Q (or any successor Form), have also been made available to insurance companies issuing variable annuity contracts and variable life insurance policies (“variable products”) that invest in the Fund. A description of the policies and procedures that the Fund uses to determine how to vote proxies relating to portfolio securities is available without charge, upon request, from our Client Services department at 800 959 4246 or at invesco.com/proxyguidelines. The information is also available on the SEC website, sec.gov. Information regarding how the Fund voted proxies related to its portfolio securities during the most recent12-month period ended June 30 is available at invesco.com/proxysearch. The information is also available on the SEC website, sec.gov. Invesco Advisers, Inc. is an investment adviser; it provides investment advisory services to individual and institutional clients and does not sell securities. Invesco Distributors, Inc. is the US distributor for Invesco Ltd.’s retail mutual funds, exchange- traded funds and institutional money market funds. Both are wholly owned, indirect subsidiaries of Invesco Ltd. This report must be accompanied or preceded by a currently effective Fund prospectus and variable product prospectus, which contain more complete information, including sales charges and expenses. Investors should read each carefully before investing. *Prior to the close of business on May 24, 2019, the Fund’s name was Oppenheimer Global Fund/VA. See Important Update on the following page for more information. |
Important Update
On October 18, 2018, Massachusetts Mutual Life Insurance Company, an indirect corporate parent of OppenheimerFunds, Inc. and its subsidiaries OFI Global Asset Management, Inc., OFI SteelPath, Inc. and OFI Advisors, LLC, announced that it had entered into an agreement whereby Invesco Ltd., a global investment management company would acquire OppenheimerFunds and its subsidiaries (together, “OppenheimerFunds”). After the close of business on May 24, 2019 Invesco Ltd. completed the acquisition of OppenheimerFunds. This Fund was included in that acquisition and as of that date, became part of the Invesco family of funds. Please visit invesco.com for more information or call Invesco’s Client Services team at800-959-4246.
.
PORTFOLIO MANAGERS: John Delano, CFA
AVERAGE ANNUAL TOTAL RETURNS FOR THE PERIODS ENDED 6/30/19
| | | | | | | | | | | | | | | | | | | | |
| | | Inception
Date | | | 6-Months | | | 1-Year | | | 5-Year | | | 10-Year | |
Series I Shares* | | | 11/12/90 | | | | 21.47 | % | | | 3.47 | % | | | 7.96 | % | | | 12.11 | % |
Series II Shares* | | | 7/13/00 | | | | 21.30 | | | | 3.21 | | | | 7.69 | | | | 11.83 | |
MSCI All Country World Index | | | | | | | 16.23 | | | | 5.74 | | | | 6.16 | | | | 10.15 | |
Performance quoted is past performance and cannot guarantee comparable future results; current performance may be lower or higher.Visit invesco.com for the most recentmonth-end performance. Performance figures reflect reinvested distributions and changes in net asset value (NAV). Investment return and principal value will vary so that you may have a gain or a loss when you sell shares. Fund returns include changes in share price, reinvested distributions and sales charges except where “without sales charge” is indicated. Effective after the close of business on May 24, 2019, theNon-Service and Service share classes of the predecessor fund were reorganized into Series I and Series II Shares, respectively, of the Fund. Returns shown for Series I and Series II shares are blended returns of the predecessor fund and the Fund. Share class returns will differ from those of the predecessor fund because of different expenses. See Fund prospectuses and summary prospectuses for more information on share classes, sales charges and new fee agreements, if any. Fund literature is available at invesco.com.
The Fund’s performance is compared to the performance of the MSCI All Country World Index. The MSCI All Country World Index is a free float-adjusted market capitalization weighted index that is designed to measure the equity market performance of developed and emerging markets. The Index is unmanaged and cannot be purchased directly by investors. While index comparisons may be useful to provide a benchmark for the Fund’s performance, it must be noted that the Fund’s investments are not limited to the investments comprising the Index. Index performance includes reinvestment of income, but does not reflect transaction costs, fees, expenses or taxes. Index performance is shown for illustrative purposes only as a benchmark for the Fund’s performance, and does not predict or depict performance of the Fund. The Fund’s performance reflects the effects of the Fund’s business and operating expenses.
TOP HOLDINGS AND ALLOCATIONS
TOP TEN COMMON STOCK HOLDINGS
| | | | |
Alphabet, Inc., Cl. A | | | 6.0% | |
LVMH Moet Hennessy Louis Vuitton SE | | | 4.3 | |
Airbus SE | | | 4.2 | |
Facebook, Inc., Cl. A | | | 3.3 | |
Intuit, Inc. | | | 3.3 | |
Adobe, Inc. | | | 3.2 | |
S&P Global, Inc. | | | 3.1 | |
SAP SE | | | 3.0 | |
Anthem, Inc. | | | 2.6 | |
PayPal Holdings, Inc. | | | 2.5 | |
Portfolio holdings and allocations are subject to change. Percentages are as of June 30, 2019, and are based on net assets.
REGIONAL ALLOCATION

Portfolio holdings and allocations are subject to change. Percentages are as of June 30, 2019, and are based on the total market value of investments.
For more current Fund holdings, please visit invesco.com.
3 INVESCO OPPENHEIMER V.I. GLOBAL FUND
*Effective after the close of business on May 24, 2019, theNon-Service and Service share classes of the predecessor fund were reorganized into Series I and Series II Shares, respectively, of the Fund. Returns shown for Series I and Series II shares are blended returns of the predecessor fund and the Fund. Share class returns will differ from those of the predecessor fund because of different expenses.
Before investing, investors should carefully read the prospectus and/or summary prospectus and carefully consider the investment objectives, risks, charges and expenses. For this and more complete information about the fund(s), investors should ask their advisors for a prospectus/summary prospectus or visit invesco.com/fundprospectus.
Shares of Invesco funds are not deposits or obligations of any bank, are not guaranteed by any bank, are not insured by the FDIC or any other agency, and involve investment risks, including the possible loss of the principal amount invested.
4 INVESCO OPPENHEIMER V.I. GLOBAL FUND
Fund Expenses
Fund Expenses.As a shareholder of the Fund, you incur two types of costs: (1) transaction costs and (2) ongoing costs, including management fees; distribution and service fees; and other Fund expenses. These examples are intended to help you understand your ongoing costs (in dollars) of investing in the Fund and to compare these costs with the ongoing costs of investing in other mutual funds.
The examples are based on an investment of $1,000.00 invested at the beginning of the period and held for the entire6-month period ended June 30, 2019.
Actual Expenses. The first section of the table provides information about actual account values and actual expenses. You may use the information in this section for the class of shares you hold, together with the amount you invested, to estimate the expense that you paid over the period. Simply divide your account value by $1,000.00 (for example, an $8,600.00 account value divided by $1,000.00 = 8.60), then multiply the result by the number in the first section under the heading entitled “Expenses Paid During 6 Months Ended June 30, 2019” to estimate the expenses you paid on your account during this period.
Hypothetical Example for Comparison Purposes.
The second section of the table provides information about hypothetical account values and hypothetical expenses based on the Fund’s actual expense ratio for each class of shares, and an assumed rate of return of 5% per year for each class before expenses, which is not the actual return. The hypothetical account values and expenses may not be used to estimate the actual ending account balance or expenses you paid for the period. You may use this information to compare the ongoing costs of investing in the Fund and other funds. To do so, compare this 5% hypothetical example for the class of shares you hold with the 5% hypothetical examples that appear in the shareholder reports of the other funds.
Please note that the expenses shown in the table are meant to highlight your ongoing costs only and do not reflect any charges associated with the separate accounts that offer this Fund. Therefore, the “hypothetical” lines of the table are useful in comparing ongoing costs only, and will not help you determine the relative total costs of owning different funds. In addition, if these separate account charges were included your costs would have been higher.
| | | | | | | | | | | | | | | | |
| Actual | | Beginning
Account Value
January 1, 2019 | | | Ending
Account
Value
June 30, 2019 | | | Expenses
Paid During
6 Months Ended
June 30, 2019 | | | | |
Series I shares | | $ | 1,000.00 | | | $ | 1,214.70 | | | $ | 4.24 | | | | | |
Series II shares | | | 1,000.00 | | | | 1,213.00 | | | | 5.61 | | | | | |
| | | | |
Hypothetical | | | | | | | | | | | | | | | | |
(5% return before expenses) | | | | | | | | | | | | | | | | |
Series I shares | | | 1,000.00 | | | | 1,020.98 | | | | 3.87 | | | | | |
Series II shares | | | 1,000.00 | | | | 1,019.74 | | | | 5.12 | | | | | |
Expenses are equal to the Fund’s annualized expense ratio for that class, multiplied by the average account value over the period, multiplied by 181/365 (to reflect theone-half year period). Those annualized expense ratios, excluding indirect expenses from affiliated funds, based on the6-month period ended June 30, 2019 are as follows:
| | |
| Class | | Expense Ratios |
Series I shares | | 0.77% |
Series II shares | | 1.02 |
The expense ratios reflect voluntary and/or contractual waivers and/or reimbursements of expenses by the Fund’s Manager. Some of these undertakings may be modified or terminated at any time, as indicated in the Fund’s prospectus. The “Financial Highlights” tables in the Fund’s financial statements, included in this report, also show the gross expense ratios, without such waivers or reimbursements and reduction to custodian expenses, if applicable.
| | |
| 5 INVESCO OPPENHEIMER V.I. GLOBAL FUND |
STATEMENT OF INVESTMENTSJune 30, 2019 Unaudited
| | | | | | | | |
| | | Shares | | | Value | |
Common Stocks—99.2% | |
Consumer Discretionary—26.5% | |
Automobiles—1.2% | |
Bayerische Motoren Werke AG | | | 472,666 | | | $ | 29,344,370 | |
Entertainment—3.3% | |
Capcom Co. Ltd. | | | 631,000 | | | | 12,691,636 | |
Nintendo Co. Ltd. | | | 63,300 | | | | 23,270,982 | |
Walt Disney Co. (The) | | | 319,710 | | | | 44,644,305 | |
| | | | | | | 80,606,923 | |
Hotels, Restaurants & Leisure—0.4% | |
International Game Technology plc | | | 751,631 | | | | 9,748,654 | |
Interactive Media & Services—9.3% | |
Alphabet, Inc., Cl. A1 | | | 135,840 | | | | 147,087,552 | |
Facebook, Inc., Cl. A1 | | | 422,730 | | | | 81,586,890 | |
| | | | | | | 228,674,442 | |
Internet & Catalog Retail—2.8% | |
Amazon.com, Inc.1 | | | 11,769 | | | | 22,286,131 | |
Farfetch Ltd., Cl. A1 | | | 572,410 | | | | 11,906,128 | |
JD.com, Inc., ADR1 | | | 1,128,728 | | | | 34,189,171 | |
| | | | | | | 68,381,430 | |
Specialty Retail—2.6% | |
Industria de Diseno Textil SA | | | 1,226,746 | | | | 36,857,784 | |
Tiffany & Co. | | | 302,710 | | | | 28,345,765 | |
| | | | | | | 65,203,549 | |
Textiles, Apparel & Luxury Goods—6.9% | |
Brunello Cucinelli SpA | | | 170,758 | | | | 5,759,050 | |
Kering SA | | | 101,290 | | | | 59,917,558 | |
LVMH Moet Hennessy Louis Vuitton SE | | | 244,711 | | | | 104,171,370 | |
| | | | | | | 169,847,978 | |
Consumer Staples—4.2% | |
Household Products—2.0% | |
Colgate-Palmolive Co. | | | 679,030 | | | | 48,666,080 | |
Personal Products—2.2% | |
Unilever plc | | | 896,770 | | | | 55,687,538 | |
Energy—0.8% | |
Energy Equipment & Services—0.8% | |
TechnipFMC plc | | | 729,070 | | | | 18,882,828 | |
Financials—16.8% | |
Capital Markets—6.3% | |
Credit Suisse Group AG1 | | | 1,893,507 | | | | 22,720,379 | |
Goldman Sachs Group, Inc. (The) | | | 142,780 | | | | 29,212,788 | |
S&P Global, Inc. | | | 335,650 | | | | 76,457,714 | |
UBS Group AG1 | | | 2,243,658 | | | | 26,664,857 | |
| | | | | | | 155,055,738 | |
Commercial Banks—4.6% | |
Citigroup, Inc. | | | 825,210 | | | | 57,789,456 | |
ICICI Bank Ltd., Sponsored ADR | | | 3,248,634 | | | | 40,900,302 | |
Societe Generale SA | | | 603,899 | | | | 15,281,309 | |
| | | | | | | 113,971,067 | |
Insurance—3.7% | |
Allianz SE | | | 201,179 | | | | 48,487,214 | |
Prudential plc | | | 1,887,647 | | | | 41,114,238 | |
| | | | | | | 89,601,452 | |
Real Estate Management & Development—2.2% | |
DLF Ltd. | | | 20,020,687 | | | | 54,954,600 | |
Health Care—14.4% | |
Biotechnology—7.3% | |
ACADIA Pharmaceuticals, Inc.1 | | | 433,170 | | | | 11,578,634 | |
AnaptysBio, Inc.1 | | | 127,880 | | | | 7,214,990 | |
Bluebird Bio, Inc.1 | | | 106,020 | | | | 13,485,744 | |
Blueprint Medicines Corp.1 | | | 203,430 | | | | 19,189,552 | |
GlycoMimetics, Inc.1 | | | 565,120 | | | | 6,736,230 | |
Incyte Corp.1 | | | 206,260 | | | | 17,523,850 | |
| | | | | | | | |
| | | Shares | | | Value | |
Biotechnology (Continued) | |
Ionis Pharmaceuticals, Inc.1 | | | 240,970 | | | $ | 15,487,142 | |
MacroGenics, Inc.1 | | | 530,500 | | | | 9,002,585 | |
Mirati Therapeutics, Inc.1 | | | 97,333 | | | | 10,025,299 | |
Sage Therapeutics, Inc.1 | | | 171,510 | | | | 31,401,766 | |
Sarepta Therapeutics, Inc.1 | | | 102,540 | | | | 15,580,953 | |
uniQure NV1 | | | 204,850 | | | | 16,009,027 | |
Veracyte, Inc.1 | | | 245,710 | | | | 7,005,192 | |
| | | | | | | 180,240,964 | |
Health Care Equipment & Supplies—0.7% | |
Zimmer Biomet Holdings, Inc. | | | 149,030 | | | | 17,546,792 | |
Health Care Providers & Services—3.4% | |
Anthem, Inc. | | | 229,715 | | | | 64,827,870 | |
Centene Corp.1 | | | 374,680 | | | | 19,648,219 | |
| | | | | | | 84,476,089 | |
Life Sciences Tools & Services—1.3% | |
Agilent Technologies, Inc. | | | 410,110 | | | | 30,622,914 | |
Pharmaceuticals—1.7% | |
Bayer AG | | | 251,153 | | | | 17,444,913 | |
resTORbio, Inc.1 | | | 513,010 | | | | 5,232,702 | |
Takeda Pharmaceutical Co. Ltd. | | | 513,194 | | | | 18,241,490 | |
| | | | | | | 40,919,105 | |
Industrials—15.1% | |
Aerospace & Defense—4.2% | |
Airbus SE | | | 734,200 | | | | 104,105,804 | |
Air Freight & Couriers—1.2% | |
United Parcel Service, Inc., Cl. B | | | 279,020 | | | | 28,814,396 | |
Building Products—1.3% | |
Assa Abloy AB, Cl. B | | | 1,414,001 | | | | 32,010,925 | |
Electrical Equipment—2.3% | |
Nidec Corp. | | | 421,800 | | | | 57,880,414 | |
Industrial Conglomerates—2.3% | |
3M Co. | | | 174,240 | | | | 30,202,762 | |
Siemens AG | | | 215,717 | | | | 25,641,125 | |
| | | | | | | 55,843,887 | |
Machinery—2.6% | |
Atlas Copco AB, Cl. A | | | 687,797 | | | | 21,986,550 | |
FANUC Corp. | | | 132,300 | | | | 24,559,396 | |
Minebea Mitsumi, Inc. | | | 986,000 | | | | 16,770,961 | |
| | | | | | | 63,316,907 | |
Professional Services—1.2% | |
Equifax, Inc. | | | 217,860 | | | | 29,463,387 | |
Information Technology—21.4% | |
Electronic Equipment, Instruments, & Components—6.2% | |
Keyence Corp. | | | 72,422 | | | | 44,506,177 | |
Murata Manufacturing Co. Ltd. | | | 956,500 | | | | 43,136,743 | |
Omron Corp. | | | 496,100 | | | | 25,993,386 | |
TDK Corp. | | | 516,300 | | | | 40,142,610 | |
| | | | | | | 153,778,916 | |
IT Services—2.9% | |
PayPal Holdings, Inc.1 | | | 522,027 | | | | 59,751,210 | |
StoneCo Ltd., Cl. A1 | | | 357,570 | | | | 10,576,921 | |
| | | | | | | 70,328,131 | |
Semiconductors & Semiconductor Equipment—2.3% | |
Maxim Integrated Products, Inc. | | | 932,235 | | | | 55,766,298 | |
Software—10.0% | |
Adobe, Inc.1 | | | 270,733 | | | | 79,771,478 | |
Intuit, Inc. | | | 305,890 | | | | 79,938,234 | |
Microsoft Corp. | | | 93,110 | | | | 12,473,015 | |
SAP SE | | | 531,196 | | | | 73,018,763 | |
| | | | | | | 245,201,490 | |
Total Common Stocks (Cost $1,138,047,753) | | | | 2,438,943,068 | |
| | |
| 6 INVESCO OPPENHEIMER V.I. GLOBAL FUND |
| | | | | | | | |
| | | Shares | | | Value | |
Preferred Stock—0.0% | | | | | | | | |
| Zee Entertainment Enterprises Ltd., 6% Cum.Non-Cv. (Cost $—) | | | 4,053,320 | | | | 305,346 | |
| | | | | | | | |
| | | Shares | | | Value | |
Investment Company—0.7% | |
| Invesco Oppenheimer Institutional Government Money Market Fund, Cl. IN, 2.37%2(Cost $16,376,058) | | | 16,376,058 | | | | 16,376,058 | |
Total Investments, at Value
(Cost $1,154,423,811) | | | 99.9% | | | | 2,455,624,472 | |
Net Other Assets (Liabilities) | | | 0.1 | | | | 2,550,499 | |
Net Assets | | | 100.0% | | | $ | 2,458,174,971 | |
| | | | | | | | |
Footnotes to Statement of Investments
| 1. | Non-income producing security. |
| 2. | The money market fund and the Fund are affiliated by having the same investment adviser. The rate shown is the7-day SEC standardized yield as of June 30, 2019. |
| | | | | | | | |
| Distribution of investments representing geographic holdings, as a percentage of total investments at value, is as follows: | |
| Geographic Holdings | | Value | | | Percent | |
United States | | $ | 1,240,492,606 | | | | 50.5 | % |
Japan | | | 307,193,795 | | | | 12.5 | |
France | | | 283,476,040 | | | | 11.6 | |
Germany | | | 193,936,385 | | | | 7.9 | |
United Kingdom | | | 127,590,732 | | | | 5.2 | |
India | | | 96,160,248 | | | | 3.9 | |
Sweden | | | 53,997,476 | | | | 2.2 | |
Switzerland | | | 49,385,236 | | | | 2.0 | |
Spain | | | 36,857,784 | | | | 1.5 | |
China | | | 34,189,171 | | | | 1.4 | |
Netherlands | | | 16,009,028 | | | | 0.7 | |
Brazil | | | 10,576,921 | | | | 0.4 | |
Italy | | | 5,759,050 | | | | 0.2 | |
Total | | $ | 2,455,624,472 | | | | 100.0 | % |
| | | | | | | | |
See accompanying Notes to Financial Statements.
| | |
| 7 INVESCO OPPENHEIMER V.I. GLOBAL FUND |
STATEMENT OF ASSETS AND LIABILITIESJune 30, 2019 Unaudited
| | | | |
| | |
Assets | | | | |
| |
Investments, at value—see accompanying statement of investments: | | | | |
| |
Unaffiliated companies (cost $1,138,047,753) | | $ | 2,439,248,414 | |
| |
Affiliated companies (cost $16,376,058) | | | 16,376,058 | |
| | | | 2,455,624,472 | |
| |
Cash | | | 1,878,226 | |
| |
Cash—foreign currencies (cost $8) | | | 8 | |
| |
Receivables and other assets: | | | | |
| |
Dividends | | | 5,826,946 | |
| |
Investments sold | | | 297,382 | |
| |
Shares of beneficial interest sold | | | 265,572 | |
| |
Other | | | 205,093 | |
| |
Total assets | | | 2,464,097,699 | |
Liabilities | | | | |
| |
Payables and other liabilities: | | | | |
| |
Shares of beneficial interest redeemed | | | 3,356,920 | |
| |
Investments purchased | | | 1,321,410 | |
| |
Administration fee | | | 332,134 | |
| |
Distribution and service plan fees | | | 225,763 | |
| |
Foreign capital gains tax | | | 194,238 | |
| |
Trustees’ compensation | | | 179,564 | |
| |
Management fee | | | 126,760 | |
| |
Shareholder communications | | | 80,767 | |
| |
Transfer and shareholder servicing agent fees | | | 32,115 | |
| |
Other | | | 73,057 | |
| |
Total liabilities | | | 5,922,728 | |
| |
Net Assets | | $ | 2,458,174,971 | |
| |
| | | | |
| |
| | | | | |
| |
Composition of Net Assets | | | | |
| |
Shares of beneficial interest | | $ | 1,168,369,319 | |
| |
Total distributable earnings | | | 1,289,805,652 | |
| |
Net Assets | | $ | 2,458,174,971 | |
| |
| | | | |
| |
| | | | | |
| |
Net Asset Value Per Share | | | | |
| |
Series I Shares: | | | | |
| |
| Net asset value, redemption price per share and offering price per share (based on net assets of $1,320,411,368 and 33,670,683 shares of beneficial interest outstanding) | | | $39.22 | |
| |
Series II Shares: | | | | |
| |
| Net asset value, redemption price per share and offering price per share (based on net assets of $1,137,763,603 and 29,391,110 shares of beneficial interest outstanding) | | | $38.71 | |
See accompanying Notes to Financial Statements.
8 INVESCO OPPENHEIMER V.I. GLOBAL FUND
STATEMENT OF OPERATIONS For the Six Months Ended June 30, 2019 Unaudited
| | | | |
| | |
Investment Income | | | | |
| |
Dividends: | | | | |
| |
Unaffiliated companies (net of foreign withholding taxes of $2,345,245) | | $ | 23,800,189 | |
| |
Affiliated companies | | | 329,573 | |
| |
Total investment income | | | 24,129,762 | |
Expenses | | | | |
| |
Management fees | | | 7,429,790 | |
| |
Administration fees | | | 359,449 | |
| |
Distribution and service plan fees — Series II shares | | | 1,346,429 | |
| |
Transfer and shareholder servicing agent fees: | | | | |
| |
Series I shares | | | 625,705 | |
| |
Series II shares | | | 526,013 | |
| |
Shareholder communications: | | | | |
| |
Series I shares | | | 45,597 | |
| |
Series II shares | | | 37,896 | |
| |
Custodian fees and expenses | | | 66,844 | |
| |
Trustees’ compensation | | | 29,485 | |
| |
Borrowing fees | | | 29,367 | |
| |
Other | | | 51,982 | |
| |
Total expenses | | | 10,548,557 | |
| |
Less reduction to custodian expenses | | | (16,051) | |
| |
Less waivers and reimbursements of expenses | | | (115,228) | |
| |
Net expenses | | | 10,417,278 | |
| | |
Net Investment Income | | | 13,712,484 | |
Realized and Unrealized Gain (Loss) | | | | |
| |
Net realized loss on Investment transactions in: | | | | |
| |
Investment transactions | | | (2,052,432) | |
| |
Foreign currency transactions | | | (6,275) | |
| |
Net realized loss | | | (2,058,707) | |
| |
Net change in unrealized appreciation/(depreciation) on investment transactions in: | | | | |
| |
Investment transactions (net of foreign capital gains tax of $134,059) | | | 426,546,925 | |
| |
Translation of assets and liabilities denominated in foreign currencies | | | 11,995 | |
| |
Net change in unrealized appreciation/(depreciation) | | | 426,558,920 | |
| | |
Net Increase in Net Assets Resulting from Operations | | $ | 438,212,697 | |
| | | | |
See accompanying Notes to Financial Statements.
9 INVESCO OPPENHEIMER V.I. GLOBAL FUND
STATEMENTS OF CHANGES IN NET ASSETS
| | | | | | | | |
| | | Six Months Ended
June 30, 2019
(Unaudited) | | | Year Ended
December 31, 2018 | |
| | |
Operations | | | | | | | | |
| | |
Net investment income | | $ | 13,712,484 | | | $ | 18,245,651 | |
| | |
Net realized gain (loss) | | | (2,058,707) | | | | 389,171,717 | |
| | |
Net change in unrealized appreciation/(depreciation) | | | 426,558,920 | | | | (723,755,997 | ) |
| | |
Net increase (decrease) in net assets resulting from operations | | | 438,212,697 | | | | (316,338,629 | ) |
| | |
Dividends and/or Distributions to Shareholders | | | | | | | | |
| | |
Distributions to shareholders from distributable earnings: | | | | | | | | |
| | |
Series I shares | | | (194,974,813) | | | | (111,686,198 | ) |
| | |
Series II shares | | | (166,963,633) | | | | (97,522,940 | ) |
| | |
Total distributions from distributable earnings | | | (361,938,446) | | | | (209,209,138 | ) |
| | | |
Beneficial Interest Transactions | | | | | | | | |
| | |
Net increase (decrease) in net assets resulting from beneficial interest transactions: | | | | | | | | |
| | |
Series I shares | | | 111,356,306 | | | | (34,187,598 | ) |
| | |
Series II shares | | | 198,379,862 | | | | (156,723,848 | ) |
| | |
Total beneficial interest transactions | | | 309,736,168 | | | | (190,911,446 | ) |
| | | |
Net Assets | | | | | | | | |
| | |
Total increase (decrease) | | | 386,010,419 | | | | (716,459,213 | ) |
| | |
Beginning of period | | | 2,072,164,552 | | | | 2,788,623,765 | |
| | |
End of period | | $ | 2,458,174,971 | | | $ | 2,072,164,552 | |
| | | | | | | | |
See accompanying Notes to Financial Statements.
| | |
| 10 INVESCO OPPENHEIMER V.I. GLOBAL FUND |
FINANCIAL HIGHLIGHTS
| | | | | | | | | | | | | | | | | | | | | | | | |
| Series I Shares | | Six Months
Ended
June 30, 2019
(Unaudited) | | | Year Ended
December 31,
2018 | | | Year Ended
December 31,
2017 | | | Year Ended
December 31,
2016 | | | Year Ended
December 31,
2015 | | | Year Ended
December 31,
2014 | |
Per Share Operating Data | | | | | | | | | | | | | | | | | | | | | | | | |
| Net asset value, beginning of period | | | $38.00 | | | | $47.42 | | | | $35.02 | | | | $38.00 | | | | $39.50 | | | | $40.86 | |
| Income (loss) from investment operations: | | | | | | | | | | | | | | | | | | | | | | | | |
| Net investment income1 | | | 0.27 | | | | 0.37 | | | | 0.29 | | | | 0.26 | | | | 0.372 | | | | 0.522 | |
| Net realized and unrealized gain (loss) | | | 7.72 | | | | (5.99) | | | | 12.50 | | | | (0.42) | | | | 1.382 | | | | 0.442 | |
| Total from investment operations | | | 7.99 | | | | (5.62) | | | | 12.79 | | | | (0.16) | | | | 1.75 | | | | 0.96 | |
| Dividends and/or distributions to shareholders: | | | | | | | | | | | | | | | | | | | | | | | | |
| Dividends from net investment income | | | (0.40) | | | | (0.47) | | | | (0.39) | | | | (0.38) | | | | (0.54) | | | | (0.46) | |
| Distributions from net realized gain | | | (6.37) | | | | (3.33) | | | | 0.00 | | | | (2.44) | | | | (2.71) | | | | (1.86) | |
| Total dividends and/or distributions to shareholders | | | (6.77) | | | | (3.80) | | | | (0.39) | | | | (2.82) | | | | (3.25) | | | | (2.32) | |
| Net asset value, end of period | | | $39.22 | | | | $38.00 | | | | $47.42 | | | | $35.02 | | | | $38.00 | | | | $39.50 | |
| | | | | | | | | | | | | | | | | | | | | | | | |
| | | | | | | | | | | | | | | | | | | | | | | | | |
| Total Return, at Net Asset Value3 | | | 21.47% | | | | (13.18)% | | | | 36.66% | | | | 0.08% | | | | 3.94% | | | | 2.29% | |
| | | | | | | | | | | | | | | | | | | | | | | | |
| | | | | | | | | | | | | | | | | | | | | | | | | |
| Ratios/Supplemental Data | | | | | | | | | | | | | | | | | | | | | | | | |
| Net assets, end of period (in thousands) | | | $1,320,411 | | | | $1,160,317 | | | | $1,479,034 | | | | $1,245,070 | | | | $1,406,001 | | | | $1,468,107 | |
| Average net assets (in thousands) | | | $1,285,618 | | | | $1,401,836 | | | | $1,379,895 | | | | $1,270,049 | | | | $1,502,338 | | | | $1,532,383 | |
| Ratios to average net assets:4 | | | | | | | | | | | | | | | | | | | | | | | | |
| Net investment income | | | 1.27% | | | | 0.81% | | | | 0.69% | | | | 0.75% | | | | 0.92%2 | | | | 1.30%2 | |
| Expenses excluding specific expenses listed below | | | 0.78% | | | | 0.78% | | | | 0.76% | | | | 0.77% | | | | 0.76% | | | | 0.76% | |
| Interest and fees from borrowings | | | 0.00%5 | | | | 0.00%5 | | | | 0.00%5 | | | | 0.00%5 | | | | 0.00%5 | | | | 0.00% | |
| Total expenses6 | | | 0.78% | | | | 0.78% | | | | 0.76% | | | | 0.77% | | | | 0.76% | | | | 0.76% | |
| Expenses after payments, waivers and/or reimbursements and reduction to custodian expenses | | | 0.77% | | | | 0.78%7 | | | | 0.76%7 | | | | 0.77%7 | | | | 0.76%7 | | | | 0.76%7 | |
Portfolio turnover rate | | | 9% | | | | 16% | | | | 9% | | | | 14% | | | | 14% | | | | 13% | |
1. Per share amounts calculated based on the average shares outstanding during the period.
2. Net investment income per share, net realized and unrealized gain (loss) per share and the net investment income ratio include an adjustment for a prior period reclassification for the years ended December 31, 2014 and 2015.
3. Assumes an initial investment on the business day before the first day of the fiscal period, with all dividends and distributions reinvested in additional shares on the reinvestment date, and redemption at the net asset value calculated on the last business day of the fiscal period. Total returns are not annualized for periods less than one full year. Total return information does not reflect expenses that apply at the separate account level or to related insurance products. Inclusion of these charges would reduce the total return figures for all periods shown. Returns do not reflect the deduction of taxes that a shareholder would pay on fund distributions or the redemption of fund shares.
4. Annualized for periods less than one full year.
5. Less than 0.005%.
6. Total expenses including indirect expenses from affiliated fund fees and expenses were as follows:
| | | | |
Six Months Ended June 30, 2019 | | | 0.78 | % |
Year Ended December 31, 2018 | | | 0.78 | % |
Year Ended December 31, 2017 | | | 0.76 | % |
Year Ended December 31, 2016 | | | 0.77 | % |
Year Ended December 31, 2015 | | | 0.76 | % |
Year Ended December 31, 2014 | | | 0.76 | % |
7. Waiver was less than 0.005%.
See accompanying Notes to Financial Statements.
11 INVESCO OPPENHEIMER V.I. GLOBAL FUND
FINANCIAL HIGHLIGHTSContinued
| | | | | | | | | | | | | | | | | | | | | | | | |
| Series II Shares | | Six Months
Ended
June 30, 2019
(Unaudited) | | | Year Ended
December 31,
2018 | | | Year Ended
December 31,
2017 | | | Year Ended
December 31,
2016 | | | Year Ended
December 31,
2015 | | | Year Ended
December 31,
2014 | |
| Per Share Operating Data | | | | | | | | | | | | | | | | | | | | | | | | |
| Net asset value, beginning of period | | | $37.53 | | | | $46.88 | | | | $34.64 | | | | $37.59 | | | | $39.10 | | | | $40.47 | |
| Income (loss) from investment operations: | | | | | | | | | | | | | | | | | | | | | | | | |
| Net investment income1 | | | 0.22 | | | | 0.26 | | | | 0.18 | | | | 0.17 | | | | 0.282 | | | | 0.422 | |
| Net realized and unrealized gain (loss) | | | 7.61 | | | | (5.92) | | | | 12.36 | | | | (0.41) | | | | 1.362 | | | | 0.422 | |
| Total from investment operations | | | 7.83 | | | | (5.66) | | | | 12.54 | | | | (0.24) | | | | 1.64 | | | | 0.84 | |
| Dividends and/or distributions to shareholders: | | | | | | | | | | | | | | | | | | | | | | | | |
| Dividends from net investment income | | | (0.28) | | | | (0.36) | | | | (0.30) | | | | (0.27) | | | | (0.44) | | | | (0.35) | |
| Distributions from net realized gain | | | (6.37) | | | | (3.33) | | | | 0.00 | | | | (2.44) | | | | (2.71) | | | | (1.86) | |
| Total dividends and/or distributions to shareholders | | | (6.65) | | | | (3.69) | | | | (0.30) | | | | (2.71) | | | | (3.15) | | | | (2.21) | |
| Net asset value, end of period | | | $38.71 | | | | $37.53 | | | | $46.88 | | | | $34.64 | | | | $37.59 | | | | $39.10 | |
| | | | | | | | | | | | | | | | | | | | | | | | |
| | | | | | | | | | | | | | | | | | | | | | | | | |
| Total Return, at Net Asset Value3 | | | 21.30% | | | | (13.39)% | | | | 36.32% | | | | (0.16)% | | | | 3.67% | | | | 2.06% | |
| | | | | | | | | | | | | | | | | | | | | | | | | |
| Ratios/Supplemental Data | | | | | | | | | | | | | | | | | | | | | | | | |
| Net assets, end of period (in thousands) | | | $1,137,764 | | | | $911,848 | | | | $1,309,590 | | | | $1,065,147 | | | | $1,081,711 | | | | $1,204,379 | |
| Average net assets (in thousands) | | | $1,086,542 | | | | $1,215,299 | | | | $1,207,002 | | | | $1,016,772 | | | | $1,219,501 | | | | $1,265,528 | |
| Ratios to average net assets:4 | | | | | | | | | | | | | | | | | | | | | | | | |
| Net investment income | | | 1.03% | | | | 0.56% | | | | 0.43% | | | | 0.49% | | | | 0.70%2 | | | | 1.05%2 | |
| Expenses excluding specific expenses listed below | | | 1.03% | | | | 1.03% | | | | 1.01% | | | | 1.02% | | | | 1.01% | | | | 1.01% | |
| Interest and fees from borrowings | | | 0.00%5 | | | | 0.00%5 | | | | 0.00%5 | | | | 0.00%5 | | | | 0.00%5 | | | | 0.00% | |
| Total expenses6 | | | 1.03% | | | | 1.03% | | | | 1.01% | | | | 1.02% | | | | 1.01% | | | | 1.01% | |
| Expenses after payments, waivers and/or reimbursements and reduction to custodian expenses | | | 1.02% | | | | 1.03%7 | | | | 1.01%7 | | | | 1.02%7 | | | | 1.01%7 | | | | 1.01%7 | |
| Portfolio turnover rate | | | 9% | | | | 16% | | | | 9% | | | | 14% | | | | 14% | | | | 13% | |
1. Per share amounts calculated based on the average shares outstanding during the period.
2. Net investment income per share, net realized and unrealized gain (loss) per share and the net investment income ratio include an adjustment for a prior period reclassification for the years ended December 31, 2014 and 2015.
3. Assumes an initial investment on the business day before the first day of the fiscal period, with all dividends and distributions reinvested in additional shares on the reinvestment date, and redemption at the net asset value calculated on the last business day of the fiscal period. Total returns are not annualized for periods less than one full year. Total return information does not reflect expenses that apply at the separate account level or to related insurance products. Inclusion of these charges would reduce the total return figures for all periods shown. Returns do not reflect the deduction of taxes that a shareholder would pay on fund distributions or the redemption of fund shares.
4. Annualized for periods less than one full year.
5. Less than 0.005%.
6. Total expenses including indirect expenses from affiliated fund fees and expenses were as follows:
| | | | | | |
| | Six Months Ended June 30, 2019 | | | 1.03 | % |
| | Year Ended December 31, 2018 | | | 1.03 | % |
| | Year Ended December 31, 2017 | | | 1.01 | % |
| | Year Ended December 31, 2016 | | | 1.02 | % |
| | Year Ended December 31, 2015 | | | 1.01 | % |
| | Year Ended December 31, 2014 | | | 1.01 | % |
7. Waiver was less than 0.005%.
See accompanying Notes to Financial Statements.
12 INVESCO OPPENHEIMER V.I. GLOBAL FUND
NOTES TO FINANCIAL STATEMENTSJune 30, 2019 Unaudited
Note1- Significant Accounting Policies
Invesco Oppenheimer V.I. Global Fund (the “Fund”) is a series portfolio of AIM Variable Insurance Funds (Invesco Variable Insurance Funds) (the “Trust”). The Trust is a Delaware statutory trust registered under the Investment Company Act of 1940, as amended (the “1940 Act”), as anopen-end series management investment company authorized to issue an unlimited number of shares of beneficial interest. Information presented in these financial statements pertains only to the Fund. Matters affecting the Fund or each class will be voted on exclusively by the shareholders of such Fund or each class.
Prior to the close of business on May 24, 2019, the Fund operated as Oppenheimer Global Fund/VA (the “Acquired Fund” or “Predecessor Fund”). The Acquired Fund was reorganized after the close of business on May 24, 2019 (the “Reorganization Date”) through the transfer of all of its assets and liabilities to the Fund (the “Reorganization”).
Upon closing of the Reorganization, holders of the Acquired Fund’sNon-Service and Service shares received Series I and Series II shares of the Fund, respectively. Information for the Acquired Fund’sNon-Service and Service shares prior to the Reorganization is included with Series I and Series II, respectively, throughout this report.
The Fund’s investment objective is to seek capital appreciation.
The Fund currently offers two classes of shares, Series I and Series II, both of which are offered to insurance company separate accounts funding variable annuity contracts and variable life insurance policies (“variable products”).
The Fund is an investment company and accordingly follows the investment company accounting and reporting guidance in accordance with Financial Accounting Standards Board Accounting Standards Codification Topic 946, Financial Services – Investment Companies.
The following is a summary of the significant accounting policies followed by the Fund in the preparation of its financial statements.
A. Security Valuations– Securities, including restricted securities, are valued according to the following policy.
A security listed or traded on an exchange (except convertible securities) is valued at its last sales price or official closing price as of the close of the customary trading session on the exchange where the security is principally traded, or lacking any sales or official closing price on a particular day, the security may be valued at the closing bid price on that day. Securities traded in theover-the-counter market are valued based on prices furnished by independent pricing services or market makers. When such securities are valued by an independent pricing service they may be considered fair valued. Futures contracts are valued at the final settlement price set by an exchange on which they are principally traded. Listed options are valued at the mean between the last bid and asked prices from the exchange on which they are principally traded. Options not listed on an exchange are valued by an independent source at the mean between the last bid and asked prices. For purposes of determining net asset value (“NAV”) per share, futures and option contracts generally are valued 15 minutes after the close of the customary trading session of the New York Stock Exchange (“NYSE”).
Investments inopen-end andclosed-end registered investment companies that do not trade on an exchange are valued at theend-of-day net asset value per share. Investments inopen-end andclosed-end registered investment companies that trade on an exchange are valued at the last sales price or official closing price as of the close of the customary trading session on the exchange where the security is principally traded.
Debt obligations (including convertible securities) and unlisted equities are fair valued using an evaluated quote provided by an independent pricing service. Evaluated quotes provided by the pricing service may be determined without exclusive reliance on quoted prices, and may reflect appropriate factors such asinstitution-size trading in similar groups of securities, developments related to specific securities, dividend rate (for unlisted equities), yield (for debt obligations), quality, type of issue, coupon rate (for debt obligations), maturity (for debt obligations), individual trading characteristics and other market data. Pricing services generally value debt obligations assuming orderly transactions of institutional round lot size, but a fund may hold or transact in the same securities in smaller, odd lot sizes. Odd lots often trade at lower prices than institutional round lots. Debt obligations are subject to interest rate and credit risks. In addition, all debt obligations involve some risk of default with respect to interest and/or principal payments.
Foreign securities’ (including foreign exchange contracts) prices are converted into U.S. dollar amounts using the applicable exchange rates as of the close of the NYSE. If market quotations are available and reliable for foreign exchange-traded equity securities, the securities will be valued at the market quotations. Because trading hours for certain foreign securities end before the close of the NYSE, closing market quotations may become unreliable. If between the time trading ends on a particular security and the close of the customary trading session on the NYSE, events occur that the investment adviser determines are significant and make the closing price unreliable, the Fund may fair value the security. If the event is likely to have affected the closing price of the security, the security will be valued at fair value in good faith using procedures approved by the Board of Trustees. Adjustments to closing prices to reflect fair value may also be based on a screening process of an independent pricing service to indicate the degree of certainty, based on historical data, that the closing price in the principal market where a foreign security trades is not the current value as of the close of the NYSE. Foreign securities’ prices meeting the approved degree of certainty that the price is not reflective of current value will be priced at the indication of fair value from the independent pricing service. Multiple factors may be considered by the independent pricing service in determining adjustments to reflect fair value and may include information relating to sector indices, American Depositary Receipts and domestic and foreign index futures. Foreign securities may have additional risks including exchange rate changes, potential for sharply devalued currencies and high inflation, political and economic upheaval, the relative lack of issuer information, relatively low market liquidity and the potential lack of strict financial and accounting controls and standards.
Securities for which market prices are not provided by any of the above methods may be valued based upon quotes furnished by independent sources. The last bid price may be used to value equity securities. The mean between the last bid and asked prices is used to value debt obligations, including corporate loans.
Securities for which market quotations are not readily available or became unreliable are valued at fair value as determined in good faith by or under the supervision of the Trust’s officers following procedures approved by the Board of Trustees. Issuer specific events, market trends, bid/asked quotes of brokers and information providers and other market data may be reviewed in the course of making a good faith determination of a
13 INVESCO OPPENHEIMER V.I. GLOBAL FUND
NOTES TO FINANCIAL STATEMENTSUnaudited / Continued
Note 1- Significant Accounting Policies (Continued)
security’s fair value.
The Fund may invest in securities that are subject to interest rate risk, meaning the risk that the prices will generally fall as interest rates rise and, conversely, the prices will generally rise as interest rates fall. Specific securities differ in their sensitivity to changes in interest rates depending on their individual characteristics. Changes in interest rates may result in increased market volatility, which may affect the value and/or liquidity of certain Fund investments.
Valuations change in response to many factors including the historical and prospective earnings of the issuer, the value of the issuer’s assets, general economic conditions, interest rates, investor perceptions and market liquidity. Because of the inherent uncertainties of valuation, the values reflected in the financial statements may materially differ from the value received upon actual sale of those investments.
| B. | Securities Transactions and Investment Income-Securities transactions are accounted for on a trade date basis. Realized gains or losses on sales are computed on the basis of specific identification of the securities sold. Interest income (net of withholding tax, if any) is recorded on the accrual basis from settlement date. Dividend income (net of withholding tax, if any) is recorded on theex-dividend date. |
The Fund may periodically participate in litigation related to Fund investments. As such, the Fund may receive proceeds from litigation settlements. Any proceeds received are included in the Statement of Operations as realized gain (loss) for investments no longer held and as unrealized gain (loss) for investments still held.
Brokerage commissions and mark ups are considered transaction costs and are recorded as an increase to the cost basis of securities purchased and/or a reduction of proceeds on a sale of securities. Such transaction costs are included in the determination of net realized and unrealized gain (loss) from investment securities reported in the Statement of Operations and the Statement of Changes in Net Assets and the net realized and unrealized gains (losses) on securities per share in the Financial Highlights. Transaction costs are included in the calculation of the Fund’s net asset value and, accordingly, they reduce the Fund’s total returns. These transaction costs are not considered operating expenses and are not reflected in net investment income reported in the Statement of Operations and the Statement of Changes in Net Assets, or the net investment income per share and the ratios of expenses and net investment income reported in the Financial Highlights, nor are they limited by any expense limitation arrangements between the Fund and the investment adviser.
The Fund allocates income and realized and unrealized capital gains and losses to a class based on the relative net assets of each class.
| C. | Country Determination- For the purposes of making investment selection decisions and presentation in the Schedule of Investments, the investment adviser may determine the country in which an issuer is located and/or credit risk exposure based on various factors. These factors include the laws of the country under which the issuer is organized, where the issuer maintains a principal office, the country in which the issuer derives 50% or more of its total revenues and the country that has the primary market for the issuer’s securities, as well as other criteria. Among the other criteria that may be evaluated for making this determination are the country in which the issuer maintains 50% or more of its assets, the type of security, financial guarantees and enhancements, the nature of the collateral and the sponsor organization. Country of issuer and/or credit risk exposure has been determined to be the United States of America, unless otherwise noted. |
| D. | Distributions-Dividends and distributions to shareholders, which are determined in accordance with income tax regulations and may differ from U.S. GAAP, are recorded on theex-dividend date. Income and capital gain distributions, if any, are declared and paid annually or at other times as determined necessary by the Adviser. |
The tax character of distributions is determined as of the Fund’s fiscal year end. Therefore, a portion of the Fund’s distributions made to shareholders prior to the Fund’s fiscal year end may ultimately be categorized as a tax return of capital.
| E. | Federal Income Taxes-The Fund intends to comply with provisions of the Internal Revenue Code applicable to regulated investment companies and to distribute substantially all of its investment company taxable income to shareholders. Therefore, no federal income or excise tax provision is required. The Fund files income tax returns in U.S. federal and applicable state jurisdictions. The statute of limitations on the Fund’s tax return filings generally remains open for the three preceding fiscal reporting period ends. The Fund has analyzed its tax positions for the fiscal year ended December 31, 2018, including open tax years, and does not believe there are any uncertain tax positions requiring recognition in the Fund’s financial statements. |
During the fiscal year ended December 31, 2018, the Fund did not utilize any capital loss carryforwards to offset capital gains realized in that fiscal year. Capital loss carryforwards with no expiration, if any, must be utilized prior to those with expiration dates. Capital losses with no expiration will be carried forward to future years if not offset by gains.
At period end, it is estimated that the capital loss carryforwards would be $2,058,707,which will not expire. The estimated capital loss carryforward represents the carryforward as of the end of the last fiscal year, increased or decreased by capital losses or gains realized in the first six months of the current fiscal year. During the reporting period, it is estimated that the Fund will not utilize any capital loss carryforward to offset realized capital gains.
Net investment income (loss) and net realized gain (loss) may differ for financial statement and tax purposes. The character of dividends and distributions made during the fiscal year from net investment income or net realized gains are determined in accordance with federal income tax requirements, which may differ from the character of net investment income or net realized gains presented in those financial statements in accordance with U.S. GAAP. Also, due to timing of dividends and distributions, the fiscal year in which amounts are distributed may differ from the fiscal year in which the income or net realized gain was recorded by the Fund.
The aggregate cost of securities and other investments and the composition of unrealized appreciation and depreciation of securities and other investments for federal income tax purposes at period end are noted in the following table. The primary difference between book and tax appreciation or depreciation of securities and other investments, if applicable, is attributable to the tax deferral of losses or tax realization of financial statement unrealized gain or loss.
14 INVESCO OPPENHEIMER V.I. GLOBAL FUND
Note1- Significant Accounting Policies (Continued)
| | | | |
Federal tax cost of securities | | $ | 1,172,702,183 | |
Federal tax cost of other Investments | | | 8 | |
| | | | |
Total federal tax cost | | $ | 1,172,702,191 | |
| | | | |
Gross unrealized appreciation | | $ | 1,335,362,694 | |
Gross unrealized depreciation | | | (52,823,944) | |
| | | | |
Net unrealized appreciation | | $ | 1,282,538,750 | |
| | | | |
| F. | Expenses-Fees provided for under the Rule12b-1 plan of a particular class of the Fund are charged to the operations of such class. Transfer agency fees and expenses and other shareholder recordkeeping fees and expenses attributable to each share class based on relative net assets. Transfer agency fees and expenses and other shareholder recordkeeping fees and expenses relating to all other classes are allocated among those classes based on relative net assets. All other expenses are allocated among the classes based on relative net assets. |
| G. | Accounting Estimates-The financial statements are prepared on a basis in conformity with accounting principles generally accepted in the United States of America (“GAAP”), which requires management to make estimates and assumptions that affect the reported amounts of assets and liabilities at the date of the financial statements and the reported amounts of revenues and expenses during the reporting period including estimates and assumptions related to taxation. Actual results could differ from those estimates by a significant amount. In addition, the Fund monitors for material events or transactions that may occur or become known after theperiod-end date and before the date the financial statements are released to print. |
| H. | Indemnifications-Under the Trust’s organizational documents, each Trustee, officer, employee or other agent of the Trust is indemnified against certain liabilities that may arise out of the performance of their duties to the Fund. Additionally, in the normal course of business, the Fund enters into contracts, including the Fund’s servicing agreements, that contain a variety of indemnification clauses. The Fund’s maximum exposure under these arrangements is unknown as this would involve future claims that may be made against the Fund that have not yet occurred. The risk of material loss as a result of such indemnification claims is considered remote. |
| I. | Foreign Currency Translations- Foreign currency is valued at the close of the NYSE based on quotations posted by banks and major currency dealers. Portfolio securities and other assets and liabilities denominated in foreign currencies are translated into U.S. dollar amounts at the date of valuation. Purchases and sales of portfolio securities (net of foreign taxes withheld on disposition) and income items denominated in foreign currencies are translated into U.S. dollar amounts on the respective dates of such transactions. The Fund does not separately account for the portion of the results of operations resulting from changes in foreign exchange rates on investments and the fluctuations arising from changes in market prices of securities held. The combined results of changes in foreign exchange rates and the fluctuation of market prices on investments (net of estimated foreign tax withholding) are included with the net realized and unrealized gain or loss from investments in the Statement of Operations. Reported net realized foreign currency gains or losses arise from (1) sales of foreign currencies, (2) currency gains or losses realized between the trade and settlement dates on securities transactions, and (3) the difference between the amounts of dividends, interest, and foreign withholding taxes recorded on the Fund’s books and the U.S. dollar equivalent of the amounts actually received or paid. Net unrealized foreign currency gains and losses arise from changes in the fair values of assets and liabilities, other than investments in securities at fiscal period end, resulting from changes in exchange rates. The Fund may invest in foreign securities, which may be subject to foreign taxes on income, gains on investments or currency repatriation, a portion of which may be recoverable. Foreign taxes, if any, are recorded based on the tax regulations and rates that exist in the foreign markets in which the Fund invests and are shown in the Statement of Operations. |
Note2- Fees and Other Transactions with Affiliates
The Trust has entered into a master investment advisory agreement with Invesco Advisers, Inc. (the “Adviser” or “Invesco”). Under the terms of the investment advisory agreement, the Fund accrues daily and pays monthly an advisory fee to the Adviser based on the annual rate of the Fund’s average daily net assets as follows:
| | | | |
Fee Schedule* | | | | |
Up to $200 million | | | 0.75% | |
Next $200 million | | | 0.72 | |
Next $200 million | | | 0.69 | |
Next $200 million | | | 0.66 | |
Next $4.2 billion | | | 0.60 | |
Over $5 billion | | | 0.58 | |
*The advisory fee paid by the Fund shall be reduced by any amounts paid by the Fund under the administrative service agreement with the advisor.
For the six months ended June 30, 2019, the effective advisory fees incurred by the Fund were 0.63%.
From the beginning of the fiscal period until the date of the Reorganization, the Acquired Fund paid $5,929,412 in advisory fees to OFI Global Asset Management, Inc. based on the annual rates above of the Acquired Fund’s average daily net assets.
Under the terms of a mastersub-advisory agreement between the Adviser and each of Invesco Asset Management Deutschland GmbH, Invesco Asset Management Limited, Invesco Asset Management (Japan) Limited, Invesco Hong Kong Limited, Invesco Senior Secured Management, Inc. and Invesco
15 INVESCO OPPENHEIMER V.I. GLOBAL FUND
NOTES TO FINANCIAL STATEMENTSUnaudited / Continued
Note2- Fees and Other Transactions with Affiliates (Continued)
Canada Ltd. and separatesub-advisory agreements with Invesco Capital Management LLC, and Invesco Asset Management (India) Private Limited (collectively, the “AffiliatedSub-Advisers”) the Adviser, not the Fund, will pay 40% of the fees paid to the Adviser to any such AffiliatedSub-Adviser(s) that provide(s) discretionary investment management services to the Fund based on the percentage of assets allocated to suchSub-Adviser(s). Invesco has also entered into aSub-Advisory Agreement with OppenheimerFunds, Inc. to provide discretionary management services to the Funds.
Effective on the Reorganization Date, the Adviser has contractually agreed, through at least May 31, 2021, to waive advisory fees and/or reimburse expenses of all shares to the to the extent necessary to limit the total annual fund operating expenses after fee waiver and/or expense reimbursement (excluding certain items discussed below) ofSeries I and Series II shares to 0.77% and 1.02%, respectively, of the Fund’s average daily net assets (the “expense limits”). In determining the Adviser’s obligation to waive advisory fees and/or reimburse expenses, the following expenses are not taken into account, and could cause total annual fund operating expenses after fee waivers and/or expense reimbursement to exceed the numbers reflected above: (1) interest; (2) taxes; (3) dividend expenses on short sales; (4) extraordinary ornon-routine items, including litigation expenses; and (5) expenses that the Fund has incurred but did not actually pay because of an expense offset arrangement. Unless Invesco continues the fee waiver agreement, it will terminate May 31, 2021. During its term, the fee waiver agreement cannot be terminated or amended to increase the expense limits or reduce the advisory fee waiver without approval of the Board of Trustees.
Further, the Adviser has contractually agreed, through at least June 30, 2021, to waive the advisory fee payable by the Fund in an amount equal to 100% of the net advisory fees the Adviser receives from the affiliated money market funds on investments by the Fund of uninvested cash in such affiliated money market funds.
For the six monthsended June 30, 2019, the Adviser waived advisory fees of $14,247 and reimbursed fund expenses of $54,728 and $46,253 for Series I and Series II shares, respectively.
The Trust has entered into a master administrative services agreement with Invesco pursuant to which the Fund has agreed to pay Invesco for certain administrative costs incurred in providing accounting services to the Fund. For the six monthsended June 30, 2019, expenses incurred under the agreement are shown in the Statement of Operations as Administration fees. Additionally, Invesco has entered into service agreements whereby JPMorgan Chase Bank serves as custodian to the Fund. Prior to the Reorganization, the Acquired Fund paid administrative fees to OFI Global Asset Management, Inc.
The Trust has entered into a transfer agency and service agreement with Invesco Investment Services, Inc. (“IIS”) pursuant to which the Fund has agreed to pay IIS a fee for providing transfer agency and shareholder services to the Fund and reimburse IIS for certain expenses incurred by IIS in the course of providing such services. IIS may make payments to intermediaries that provide omnibus account services,sub-accounting services and/or networking services. All fees payable by IIS to intermediaries that provide omnibus account services orsub-accounting services are charged back to the Fund, subject to certain limitations approved by the Trust’s Board of Trustees. Prior to the Reorganization, the Acquired Fund paid transfer agent fees to OFI Global Asset Management, Inc. and Shareholder Services, Inc. For the six months ended June 30, 2019, expenses incurred under these agreements are shown in the Statement of Operations as Transfer and shareholder servicing agent fees.
The Trust has entered into master distribution agreements with Invesco Distributors, Inc. (“IDI”) to serve as the distributor for the Service II shares of the Fund. The Trust has adopted a plan pursuant to Rule12b-1 under the 1940 Act with respect to the Fund’s Service II shares (the “Plan”). The Fund, pursuant to the Plan, pays IDI at an annual rate of 0.25% of the average daily net assets of Service II shares. The fees are accrued daily and paid monthly. Of the Plan payments, up to 0.25% of the average daily net assets of the class of shares may be paid to furnish continuing personal shareholder services to customers who purchase and own shares of such class. Any amounts not paid as a service fee under the Plan would constitute an asset-based sales charge. Rules of the Financial Industry Regulatory Authority (“FINRA”) impose a cap on the total sales charges, including asset-based sales charges, that may be paid by any class of shares of the Fund plans. Prior to the Reorganization, the Acquired Fund paid distribution fees to OppenheimerFunds Distributor, Inc. For the six months ended June 30, 2019, expenses incurred under the plans are shown in the Statement of Operations as Distribution and service plan fees.
Certain officers and trustees of the Trust are officers and directors of the Adviser, IIS and/or IDI.
Note3- Additional Valuation Information
GAAP defines fair value as the price that would be received to sell an asset or paid to transfer a liability in an orderly transaction between market participants at the measurement date, under current market conditions. GAAP establishes a hierarchy that prioritizes the inputs to valuation methods, giving the highest priority to readily available unadjusted quoted prices in an active market for identical assets (Level 1) and the lowest priority to significant unobservable inputs (Level 3), generally when market prices are not readily available or are unreliable. Based on the valuation inputs, the securities or other investments are tiered into one of three levels. Changes in valuation methods may result in transfers in or out of an investment’s assigned level:
Level 1 — Prices are determined using quoted prices in an active market for identical assets.
Level 2 — Prices are determined using other significant observable inputs. Observable inputs are inputs that other market participants may use in pricing a security. These may include quoted prices for similar securities, interest rates, prepayment speeds, credit risk, yield curves, loss severities, default rates, discount rates, volatilities and others.
Level 3 — Prices are determined using significant unobservable inputs. In situations where quoted prices or observable inputs are unavailable (for example, when there is little or no market activity for an investment at the end of the period), unobservable inputs may be used. Unobservable inputs reflect the Fund’s own assumptions about the factors market participants would use in determining fair value of the securities or instruments and
16 INVESCO OPPENHEIMER V.I. GLOBAL FUND
Note3- Additional Valuation Information (Continued)
would be based on the best available information.
The following is a summary of the tiered valuation input levels, as of June 30, 2019. The level assigned to the securities valuations may not be an indication of the risk or liquidity associated with investing in those securities. Because of the inherent uncertainties of valuation, the values reflected in the financial statements may materially differ from the value received upon actual sale of those investments.
| | | | | | | | | | | | | | | | |
| | | Level 1—
Unadjusted
Quoted Prices | | | Level 2— Other Significant
Observable Inputs | | | Level 3—
Significant
Unobservable
Inputs | | | Value | |
Assets Table | | | | | | | | | | | | | | | | |
Investments, at Value: | | | | | | | | | | | | | | | | |
Common Stocks | | | | | | | | | | | | | | | | |
Consumer Discretionary | | $ | 379,794,596 | | | $ | 272,012,750 | | | $ | — | | | $ | 651,807,346 | |
Consumer Staples | | | 48,666,080 | | | | 55,687,538 | | | | — | | | | 104,353,618 | |
Energy | | | — | | | | 18,882,828 | | | | — | | | | 18,882,828 | |
Financials | | | 204,360,260 | | | | 209,222,597 | | | | — | | | | 413,582,857 | |
Health Care | | | 318,119,461 | | | | 35,686,403 | | | | — | | | | 353,805,864 | |
Industrials | | | 88,480,545 | | | | 282,955,175 | | | | — | | | | 371,435,720 | |
Information Technology | | | 298,277,156 | | | | 226,797,679 | | | | — | | | | 525,074,835 | |
Preferred Stock | | | 305,346 | | | | — | | | | — | | | | 305,346 | |
Investment Company | | | 16,376,058 | | | | — | | | | — | | | | 16,376,058 | |
| | | | |
Total Assets | | $ | 1,354,379,502 | | | $ | 1,101,244,970 | | | $ | — | | | $ | 2,455,624,472 | |
| | | | |
Forward currency exchange contracts and futures contracts, if any, are reported at their unrealized appreciation/depreciation at measurement date, which represents the change in the contract’s value from trade date. All additional assets and liabilities included in the above table are reported at their market value at measurement date.
Note4- Expense Offset Arrangement
The expense offset arrangement is comprised of custodian credits which result from periodic overnight cash balances at the custodian. For the six monthsended June 30, 2019, the Fund received credits from this arrangement, which resulted in the reduction of the Fund’s total expenses of $16,051.
Note5- Trustee and Officer Fees and Benefits
Certain Trustees have executed a Deferred Compensation Agreement pursuant to which they have the option to elect to defer receipt of all or a portion of the annual compensation they are entitled to receive from the Fund. For purposes of determining the amount owed to the Trustees under the plan, deferred amounts are treated as though equal dollar amounts had been invested in shares of the Fund or in other Invesco and/or Invesco Oppenheimer funds selected by the Trustees. The Fund purchases shares of the funds selected for deferral by the Trustees in amounts equal to his or her deemed investment, resulting in a Fund asset equal to the deferred compensation liability. Such assets are included as a component of “Other” within the asset section of the Statement of Assets and Liabilities. Deferral of Trustees’ fees under the plan will not affect the net assets of the Fund and will not materially affect the Fund’s assets, liabilities or net investment income per share. Amounts will be deferred until distributed in accordance with the compensation deferral plan.
Note6- Cash Balances
The Fund is permitted to temporarily carry a negative or overdrawn balance in its account with JP Morgan Chase Bank, the custodian bank. Such balances, if any atperiod-end, are shown in the Statement of Assets and Liabilities under the payable caption Amount due custodian. To compensate the custodian bank for such overdrafts, the overdrawn Fund may either (1) leave funds as a compensating balance in the account so the custodian bank can be compensated by earning the additional interest; or (2) compensate by paying the custodian bank at a rate agreed upon by the custodian bank and Invesco, not to exceed the contractually agreed upon rate.
Note7- Investment Transactions
The aggregate amount of investment securities (other than short-term securities, U.S. Treasury obligations and money market funds, if any) purchased and sold by the Fund during the six months ended June 30, 2019 was $203,230,588 and $227,747,858, respectively.
17 INVESCO OPPENHEIMER V.I. GLOBAL FUND
NOTES TO FINANCIAL STATEMENTSUnaudited / Continued
Note8- Share Information
Transactions in shares of beneficial interest were as follows:
| | | | | | | | | | | | | | | | | | | | |
| | | Six Months Ended June 30, 20191
| | | | | | Year Ended December 31, 2018 | |
| | | Shares | | | Amount | | | | | | Shares | | | Amount | |
Series I Shares | | | | | | | | | | | | | | | | | | | | |
Sold | | | 410,070 | | | $ | 17,579,913 | | | | | | | | 1,572,044 | | | $ | 70,351,613 | |
Dividends and/or distributions reinvested | | | 5,090,726 | | | | 194,974,813 | | | | | | | | 2,449,259 | | | | 111,686,198 | |
Redeemed | | | (2,361,518 | ) | | | (101,198,420 | ) | | | | | | | (4,681,582 | ) | | | (216,225,409 | ) |
Net increase (decrease) | | | 3,139,278 | | | $ | 111,356,306 | | | | | | | | (660,279 | ) | | $ | (34,187,598 | ) |
| | | | | | | | | | | | | | | | | | | | |
| | | | | | | | | | | | | | | | |
| | | | | |
Series II Shares | | | | | | | | | | | | | | | | | | | | |
Sold | | | 3,577,943 | | | $ | 154,752,464 | | | | | | | | 2,224,972 | | | $ | 100,346,158 | |
Dividends and/or distributions reinvested | | | 4,415,859 | | | | 166,963,633 | | | | | | | | 2,162,851 | | | | 97,522,940 | |
Redeemed | | | (2,897,956 | ) | | | (123,336,235 | ) | | | | | | | (8,029,064 | ) | | | (354,592,946 | ) |
Net increase (decrease) | | | 5,095,846 | | | $ | 198,379,862 | | | | | | | | (3,641,241 | ) | | $ | (156,723,848 | ) |
| | | | | | | | | | | | | | | | | | | | |
1.There are entities that are record owners of more than 5% of the outstanding shares of the Fund and own 30% of the outstanding shares of the Fund. The Fund and the Fund’s principal underwriter or adviser, are parties to participation agreements with these entities whereby these entities sell units of interest in separate accounts funding variable products that are invested in the Fund. The Fund, Invesco and/or Invesco affiliates may make payments to these entities, which are considered to be related to the Fund, for providing services to the Fund, Invesco and/or Invesco affiliates, including, but not limited to services such as securities brokerage, distribution, third party record keeping and account servicing. The Fund has no knowledge as to whether all or any portion of the shares owned of record by these entities are also owned beneficially.
In addition, 10% of the outstanding shares of the Fund are owned by the Adviser or an affiliate of the Adviser.
Note9- Borrowings
Joint Credit Facility.A number of mutual funds managed by the Adviser participate in a $1.95 billion revolving credit facility (the “Facility”) intended to provide short-term financing, if necessary, subject to certain restrictions in connection with atypical redemption activity. Expenses and fees related to the Facility are paid by the participating funds and are disclosed separately or as other expenses on the Statement of Operations. The Fund did not utilize the Facility during the reporting period. The Facility terminated May 24, 2019.
Note10- Independent Registered Public Accounting Firm
The Audit Committee of the Board of Trustees appointed, and the Board of Trustees ratified and approved, PricewaterhouseCoopers LLP (“PWC”) as the independent registered public accounting firm of the Fund for the fiscal periods ending after May 24, 2019. Prior to the close of business on May 24, 2019, the Predecessor Fund was a separate series of an unaffiliated investment company and its financial statements were audited by a different independent registered public accounting firm (the “Prior Auditor”).
Effective after the close of business on May 24, 2019, the Prior Auditor resigned as the independent registered public accounting firm of the Fund. The Prior Auditor’s report on the financial statements of the Predecessor Fund for the past two fiscal years did not contain an adverse or disclaimer of opinion, and was not qualified or modified as to uncertainty, audit scope or accounting principles. During the Predecessor Fund’s two most recent fiscal years and through the close of business on May 24, 2019, there were no (1) disagreements with the Prior Auditor on any matter of accounting principles or practices, financial statement disclosure, or auditing scope or procedure, which disagreements, if not resolved to the Prior Auditor’s satisfaction, would have caused it to make reference to that matter in connection with its report; or (2) “reportable events,” as that term is defined in Item 304(a)(1)(v) of RegulationS-K under the Securities Exchange Act of 1934.
18 INVESCO OPPENHEIMER V.I. GLOBAL FUND
APPROVAL OF THE INVESTMENT ADVISORY ANDSUB-ADVISORY CONTRACTSUnaudited
At meetings held on December 14, 2018, the Board of Trustees (the Board or the Trustees) of AIM Variable Insurance Funds (Invesco Variable Insurance Funds) (the Trust) as a whole, and the independent Trustees, who comprise over 75% of the Board, voting separately, approved (i) an amendment to the Trust’s Master Investment Advisory Agreement with Invesco Advisers, Inc. (Invesco Advisers and the investment advisory agreement) to add Invesco Oppenheimer V.I. Global Fund (the Fund), (ii) an amendment to the Master IntergroupSub-Advisory Contract for Mutual Funds with Invesco Asset Management Deutschland GmbH, Invesco Asset Management Limited, Invesco Asset Management (Japan) Limited, Invesco Hong Kong Limited, Invesco Senior Secured Management, Inc. and Invesco Canada Ltd. to add the Fund, (iii) an amendment to the separatesub-advisory contract with Invesco Capital Management LLC to add the Fund, (iv) an amendment to the separatesub-advisory contract with Invesco Asset Management (India) Private Limited to add the Fund, and (v) an initialsub-advisory contract with OppenheimerFunds, Inc. (collectively, the AffiliatedSub-Advisers and thesub-advisory contracts). Additionally, on March 26, 2019, the Boardre-approved an initialsub-advisory contract with OppenheimerFunds, Inc. following its change of control as a result of the acquisition of OppenheimerFunds, Inc. and its subsidiaries, including the Oppenheimer mutual funds (each, an Oppenheimer Fund), by Invesco Ltd. (the OFI Transaction). After evaluating the factors discussed below, among others, the Board approved the Fund’s investment advisory agreement and thesub-advisory contracts and determined that the compensation payable by the Fund to Invesco Advisers and by Invesco Advisers to the AffiliatedSub-Advisers is fair and reasonable.
The Board’s Evaluation Process
The Board noted that it had previously approved establishing the Fund at the Board meeting held on October 23, 2018 and that the Fund was formed to acquire the assets and liabilities of an Oppenheimer Fund (the Acquired Fund) with the same investment objective and substantially similar principal investment strategies and risks. At the time of approval, the Fund had no assets and no performance history and the portfolio managers were not employed by Invesco Advisers or any of the AffiliatedSub-Advisers except OppenheimerFunds, Inc., which was not affiliated with Invesco at that time.
In approving the investment advisory agreement andsub-advisory contracts, the Board followed a process similar to the process that it follows in annually reviewing and approving investment advisory agreements andsub-advisory contracts for the series portfolios of funds advised by Invesco Advisers and considered the information provided in the most recent annual review process for those funds as well as the information provided with respect to the Fund. As part of the approval process, the Board reviewed and considered information provided in response to detailed requests for information submitted to management by the independent Trustees with assistance from legal counsel to the independent Trustees. The Board reviewed comparative investment performance and fee data prepared by Invesco Advisers and an independent mutual fund data provider. The Board was assisted in its review by the Senior Officer, an officer of the Invesco Funds who reports directly to the independent Trustees, and by independent legal counsel.
The discussion below serves as a summary of the material factors and related conclusions that formed the basis for the Board’s approval of the Fund’s investment advisory agreement andsub-advisory contracts. The Trustees’ review and conclusions are based on the comprehensive consideration of all information presented to them and are not the result of any single determinative factor. Moreover, one Trustee may have weighed a particular piece of information or factor differently than another Trustee. This information is current as of December 14, 2018 and March 26, 2019 for thesub-advisory contract with OppenheimerFunds, Inc.
Factors and Conclusions and Summary of Independent Written Fee Evaluation
A. Nature, Extent and Quality of Services Provided by Invesco Advisers and the AffiliatedSub-Advisers
The Board reviewed the nature, extent and quality of the advisory services to be provided to the Fund by Invesco Advisers under the Fund’s investment advisory agreement, and the credentials and experience of the officers and employees of Invesco Advisers who will provide these services. The Board’s review included consideration of the investment process oversight and structure, credit analysis and investment risk management to be employed in providing advisory services to the Fund. The Board also considerednon-advisory services that Invesco Advisers and its affiliates provide to the Invesco Funds and will provide to the Fund, such as various back office support functions, third party oversight, internal audit, valuation, portfolio trading and legal and compliance. The Board also received and reviewed information about Invesco Advisers’ role as administrator of the Invesco Funds’ liquidity risk management program. The Board also reviewed and considered the benefits to shareholders of investing in a fund that is part of the Invesco family of funds under the umbrella of Invesco Ltd., Invesco Advisers’ parent company, and noted Invesco Ltd.’s depth and experience in conducting an investment management business, as well as its commitment of financial and other resources to such business. The Board reviewed and considered information about the resources that Invesco Advisers intends to continue to commit to managing the Invesco family of funds, including the Fund, following the OFI Transaction. The Board concluded that the nature, extent and quality of the services to be provided to the Fund by Invesco Advisers are appropriate and satisfactory.
The Board reviewed the services that may be provided by the AffiliatedSub-Advisers under thesub-advisory contracts and the credentials and experience of the officers and employees of the AffiliatedSub-Advisers who provide these services. The Board noted the AffiliatedSub-Advisers’ expertise with respect to certain asset classes and that the AffiliatedSub-Advisers have offices and personnel that are located in financial centers around the world. As a result, the Board noted that the AffiliatedSub-Advisers can provide research and investment analysis on the markets and economies of various countries in which the Fund may invest, make recommendations regarding securities and assist with security trades. The Board concluded that thesub-advisory contracts may benefit the Fund and its shareholders by permitting Invesco Advisers to use the resources and talents of the AffiliatedSub-Advisers in managing the Fund. The Board concluded that the nature, extent and quality of the services that may be provided by the AffiliatedSub-Advisers are appropriate and satisfactory.
19 INVESCO OPPENHEIMER V.I. GLOBAL FUND
APPROVAL OF THE INVESTMENT ADVISORY ANDSUB-ADVISORY CONTRACTSUnaudited / Continued
B. Fund Investment Performance
The Board noted that the Fund would continue the historical performance information of the Acquired Fund following the consummation of the OFI Transaction. The Board considered the performance of the Acquired Fund and the fact that, at the closing of the OFI Transaction, management anticipates that the Fund will be managed pursuant to substantially similar investment strategies and by substantially the same portfolio management team as managed the Acquired Fund. The Board did not view Fund performance as a relevant factor in considering whether to approve thesub-advisory contracts for the Fund, as no AffiliatedSub-Adviser currently manages assets of the Fund.
The Board compared the Fund’s investment performance over multiple time periods ending December 31, 2017 to the performance of funds in the Morningstar performance universe and against the Fund’s benchmark index. The Trustees also reviewed more recent Fund performance and this review did not change their conclusions.
C. Advisory andSub-Advisory Fees and Fund Expenses
The Board compared the Fund’s contractual management fee rate to the contractual management fee rates of funds in the Fund’s Morningstar expense group. The Board also considered comparative information regarding the Fund’s total expense ratio and its various components.
The Board noted that Invesco Advisers has contractually agreed to waive fees and/or limit expenses of the Fund for at least two years from the closing date of the OFI Transaction in an amount necessary to limit total annual operating expenses to a specified percentage of average daily net assets for each class of the Fund.
The Board noted that Invesco Advisers and the AffiliatedSub-Advisers do not manage other similarly managed mutual funds or client accounts.
The Board also considered the services that may be provided by the AffiliatedSub-Advisers pursuant to thesub-advisory contracts, as well as the fees payable by Invesco Advisers to the AffiliatedSub-Advisers pursuant to thesub-advisory contracts.
D. Economies of Scale and Breakpoints
The Board considered the extent to which there may be economies of scale in the provision of advisory services to the Fund. The Board considered Invesco’s reinvestment in its business, including investments in business infrastructure and cybersecurity. The Board also considered that the Fund may benefit from economies of scale through contractual breakpoints in the Fund’s advisory fee schedule, which generally operate to reduce the Fund’s expense ratio as it grows in size. The Board noted that the Fund will share directly in economies of scale through lower fees charged by third party service providers based on the combined size of the Invesco Funds. The Board noted that the Fund may also benefit from economies of scale through initial fee setting, fee waivers and expense reimbursements.
E. Profitability and Financial Resources
The Board reviewed information from the 2018 contract renewal process provided by Invesco Advisers concerning the costs of the advisory and other services that Invesco Advisers and its affiliates provide to the Invesco Funds and the profitability of Invesco Advisers and its affiliates in providing these services. The Board considered the methodology used for calculating profitability and noted the periodic review of such methodology by an independent consultant. The Board noted that Invesco Advisers will continue to operate at a net profit from services Invesco Advisers and its affiliates provide to the Invesco Funds. The Board did not deem the level of profits realized by Invesco Advisers and its affiliates from providing services to the Invesco Funds, and the profits estimated to be realized by the Fund, to be excessive given the nature, extent and quality of the services provided. The Board received information from Invesco Advisers demonstrating that Invesco Advisers and the AffiliatedSub-Advisers are financially sound and have the resources necessary to perform their obligations under the investment advisory agreement andsub-advisory contracts.
F. Collateral Benefits to Invesco Advisers and its Affiliates
The Board considered various other benefits to be received by Invesco Advisers and its affiliates from the relationship with the Fund, including the fees to be received for providing administrative, transfer agency and distribution services to the Fund. The Board considered the performance of Invesco Advisers and its affiliates in providing these services to other Invesco Funds and the organizational structure employed to provide these services. The Board also considered that these services will be provided to the Fund pursuant to written contracts that are reviewed and approved on an annual basis by the Board; and that the services are required for the operation of the Fund.
The Board considered the benefits realized by Invesco Advisers and the AffiliatedSub-Advisers as a result of portfolio brokerage transactions executed through “soft dollar” arrangements. The Board noted that soft dollar arrangements may result in the Fund bearing costs to purchase research that may be used by Invesco Advisers or the AffiliatedSub-Advisers with other clients and may reduce Invesco Advisers’ or the AffiliatedSub-Advisers’ expenses. The Board also considered that it will receive periodic reports from Invesco representing that these arrangements are consistent with regulatory requirements. The Board did not deem the soft dollar arrangements to be inappropriate.
The Board considered that the Fund’s uninvested cash and cash collateral from any securities lending arrangements may be invested in money market funds advised by Invesco Advisers pursuant to procedures approved by the Board. The Board considered that Invesco Advisers will receive advisory fees from these affiliated money market funds attributable to such investments, although Invesco Advisers has contractually agreed to waive through varying periods the advisory fees payable by the Invesco Funds with respect to certain investments in the affiliated money market funds. The waiver is in an amount equal to 100% of the net advisory fee Invesco Advisers will receive from the affiliated money market funds with respect to the Fund’s investment
20 INVESCO OPPENHEIMER V.I. GLOBAL FUND
APPROVAL OF THE INVESTMENT ADVISORY ANDSUB-ADVISORY CONTRACTSUnaudited / Continued
in the affiliated money market funds of uninvested cash, but not cash collateral. The Board concluded that the amount of advisory fees to be received by Invesco Advisers from the Fund’s investment of cash collateral from any securities lending arrangements in the affiliated money market funds is fair and reasonable.
The Board also considered that an affiliated broker may receive commissions for executing certain trades for the Fund. Invesco Advisers and the AffiliatedSub-Advisers may use the affiliated broker to, among other things, control order routing and minimize information leakage, and the Board was be advised that such trades will be executed in compliance with rules under the federal securities laws and consistent with best execution obligations.
21 INVESCO OPPENHEIMER V.I. GLOBAL FUND
PORTFOLIO PROXY VOTING POLICIES AND GUIDELINES; UPDATES TO STATEMENT OF INVESTMENTSUnaudited
Go paperless with eDelivery
Visit invesco.com/edelivery to enjoy the convenience and security of anytime electronic access to your investment documents.
With eDelivery, you can elect to have any or all of the following materials delivered straight to your inbox to download, save and print from your own computer:
● Fund reports and prospectuses
● Quarterly statements
● Daily confirmations
● Tax forms
Invesco mailing information
Send general correspondence to Invesco Investment Services, Inc., P.O. Box 219078, Kansas City, MO 64121-9078.
Important notice regarding delivery of security holder documents
To reduce Fund expenses, only one copy of most shareholder documents may be mailed to shareholders with multiple accounts at the same address (Householding). Mailing of your shareholder documents may be householded indefinitely unless you instruct us otherwise. If you do not want the mailing of these documents to be combined with those for other members of your household, please contact Invesco Investment Services, Inc. at 800 959 4246 or contact your financial institution. We will begin sending you individual copies for each account within 30 days after receiving your request.
Fund holdings and proxy voting information
The Fund provides a complete list of its holdings four times in each fiscal year, at the quarter ends. For the second and fourth quarters, the lists appear in the Fund’s semiannual and annual reports to shareholders. For the first and third quarters, the Fund files the lists with the Securities and Exchange Commission (SEC) on FormN-Q (or any successor Form). The most recent list of portfolio holdings is available at invesco.com/completeqtrholdings. Shareholders can also look up the Fund’s FormsN-Q (or any successor Form) on the SEC website at sec.gov.
A description of the policies and procedures that the Fund uses to determine how to vote proxies relating to portfolio securities is available without charge, upon request, from our Client Services department at 800 959 4246 or at invesco.com/proxyguidelines. The information is also available on the SEC website, sec.gov.
Information regarding how the Fund voted proxies related to its portfolio securities during the most recent12-month period ended June 30 is available at invesco.com/proxysearch. The information is also available on the SEC website, sec.gov.
Invesco Advisers, Inc. is an investment adviser; it provides investment advisory services to individual and institutional clients and does not sell securities. Invesco Distributors, Inc. is the US distributor for Invesco Ltd.’s retail mutual funds, exchange-traded funds and institutional money market funds. Both are wholly owned, indirect subsidiaries of Invesco Ltd.
22 INVESCO OPPENHEIMER V.I. GLOBAL FUND
SPECIAL SHAREHOLDER MEETINGUnaudited
A Special Meeting (“Meeting”) of Shareholders of Invesco Oppenheimer V.I. Global Fund was held on April 12, 2019. The Meeting was held for the following purpose:
(1) Approval of an Agreement and Plan of Reorganization that provides for the reorganization of Oppenheimer Global Fund/VA into Invesco Oppenheimer V.I. Global Fund.
The results of the voting on the above matter was as follows:
| | | | | | | | | | | | | | | | |
Matter | |
| Votes
For |
| |
| Votes
Against |
| |
| Votes
Abstain |
| |
| Broker
Non-Votes |
|
| (1) Approval of an Agreement and Plan of Reorganization | | | 37,342,901 | | | | 1,568,124 | | | | 3,585,344 | | | | 0 | |
23 INVESCO OPPENHEIMER V.I. GLOBAL FUND

| | | | |

| | Semiannual Report | | 6/30/2019 |
| | | | |
| | | | |
| | | | |
| | | | |
| | | | |
| | | | |
| |
| | Invesco Oppenheimer V.I. Global Strategic Income Fund* The Fund provides a complete list of its holdings four times in each fiscal year, at the quarter ends. For the second and fourth quarters, the lists appear in the Fund’s semi annual and annual reports to shareholders. For the first and third quarters, the Fund files the lists with the Securities and Exchange Commission (SEC) on Form N-Q (or any successor Form). The Fund’s Form N-Q (or any successor Form) filings are available on the SEC website, sec.gov. The Fund’s most recent portfolio holdings, as filed on Form N-Q (or any successor Form), have also been made available to insurance companies issuing variable annuity contracts and variable life insurance policies (“variable products”) that invest in the Fund. A description of the policies and procedures that the Fund uses to determine how to vote proxies relating to portfolio securities is available without charge, upon request, from our Client Services department at 800 959 4246 or at invesco.com/proxyguidelines. The information is also available on the SEC website, sec.gov. Information regarding how the Fund voted proxies related to its portfolio securities during the most recent 12-month period ended June 30 is available at invesco.com/proxysearch. The information is also available on the SEC website, sec.gov. Invesco Advisers, Inc. is an investment adviser; it provides investment advisory services to individual and institutional clients and does not sell securities. Invesco Distributors, Inc. is the US distributor for Invesco Ltd.’s retail mutual funds, exchange- traded funds and institutional money market funds. Both are wholly owned, indirect subsidiaries of Invesco Ltd. This report must be accompanied or preceded by a currently effective Fund prospectus and variable product prospectus, which contain more complete information, including sales charges and expenses. Investors should read each carefully before investing. *Prior to the close of business on May 24, 2019, the Fund’s name was Oppenheimer Global Strategic Income Fund/VA. See Important Update on the following page for more information. |
Important Update
On October 18, 2018, Massachusetts Mutual Life Insurance Company, an indirect corporate parent of OppenheimerFunds, Inc. and its subsidiaries OFI Global Asset Management, Inc., OFI SteelPath, Inc. and OFI Advisors, LLC, announced that it had entered into an agreement whereby Invesco Ltd., a global investment management company would acquire OppenheimerFunds and its subsidiaries (together, “OppenheimerFunds”). After the close of business on May 24, 2019 Invesco Ltd. completed the acquisition of OppenheimerFunds. This Fund was included in that acquisition and as of that date, became part of the Invesco family of funds. Please visit invesco.com for more information or call Invesco’s Client Services team at 800-959-4246.
PORTFOLIO MANAGERS: Hemant Baijal, Chris Kelly, CFA
AVERAGE ANNUAL TOTAL RETURNS FOR THE PERIODS ENDED 6/30/19
| | | | | | | | | | | | | | | | | | |
| | | Inception
Date | | | 6-Months | | | | 1-Year | | | | 5-Year | | | | 10-Year |
Series I Shares* | | | 5/3/93 | | | 8.57% | | | | 6.97% | | | | 2.50% | | | | 5.70% |
Series II Shares* | | | 3/19/01 | | | 8.23 | | | | 6.68 | | | | 2.23 | | | | 5.42 |
Bloomberg Barclays U.S. Aggregate Bond Index | | | | | | 6.11 | | | | 7.87 | | | | 2.95 | | | | 3.90 |
Performance quoted is past performance and cannot guarantee comparable future results; current performance may be lower or higher.Visit invesco.com for the most recent month-end performance. Performance figures reflect reinvested distributions and changes in net asset value (NAV). Investment return and principal value will vary so that you may have a gain or a loss when you sell shares. Fund returns include changes in share price, reinvested distributions and sales charges except where “without sales charge” is indicated. Effective after the close of business on May 24, 2019, the Non-Service and Service share classes of the predecessor fund were reorganized into Series I and Series II Shares, respectively, of the Fund. Returns shown for Series I and Series II shares are blended returns of the predecessor fund and the Fund. Share class returns will differ from those of the predecessor fund because of different expenses. See Fund prospectuses and summary prospectuses for more information on share classes, sales charges and new fee agreements, if any. Fund literature is available at invesco.com.
The Fund’s performance is compared to the performance of the Bloomberg Barclays U.S. Aggregate Bond Index, an index of U.S. Government and corporate bonds. The Index is unmanaged and cannot be purchased directly by investors. While index comparisons may be useful to provide a benchmark for the Fund’s performance, it must be noted that the Fund’s investments are not limited to the investments comprising the Index. Index performance includes reinvestment of income, but does not reflect transaction costs, fees, expenses or taxes. Index performance is shown for illustrative purposes only as a benchmark for the Fund’s performance, and does not predict or depict performance of the Fund. The Fund’s performance reflects the effects of the Fund’s business and operating expenses.
TOP HOLDINGS AND ALLOCATIONS
PORTFOLIO ALLOCATION
| | | | | | |
Non-Convertible Corporate Bonds and Notes | | | 37.5 | % | | |
Mortgage-Backed Obligations | | | | | | |
Government Agency | | | 12.3 | | | |
Non-Agency | | | 7.2 | | | |
Foreign Government Obligations | | | 18.5 | | | |
Investment Companies | | | 11.6 | | | |
U.S. Government Obligations | | | 7.2 | | | |
Asset-Backed Securities | | | 3.5 | | | |
Over-the-Counter Options Purchased | | | 0.8 | | | |
Structured Securities | | | 0.4 | | | |
Corporate Loans | | | 0.4 | | | |
Over-the-Counter Interest Rate Swaptions Purchased | | | 0.3 | | | |
Short-Term Notes | | | 0.3 | | | |
Exchange-Traded Options Purchased | | | —* | | | |
Rights, Warrants and Certificates | | | —* | | | |
Over-the-Counter Credit Default Swaptions Purchased | | | —* | | | |
Common Stocks | | | —* | | | |
Preferred Stocks | | | —* | | | |
| * | Represents a value of less than 0.05%. |
Portfolio holdings and allocations are subject to change. Percentages are as of June 30, 2019, and are based on total market value of investments.
REGIONAL ALLOCATION
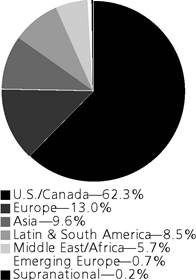
Portfolio holdings and allocations are subject to change. Percentages are as of June 30, 2019, and are based on the total market value of investments.
*Effective after the close of business on May 24, 2019, the Non-Service and Service share classes of the predecessor fund were reorganized into Series I and Series II Shares, respectively, of the Fund. Returns shown for Series I and Series II shares are blended returns of the predecessor fund and the Fund. Share class returns will differ from those of the predecessor fund because of different expenses.
For more current Fund holdings, please visit invesco.com.
| | |
| 3 INVESCO OPPENHEIMER V.I. GLOBAL STRATEGIC INCOME FUND |
Before investing, investors should carefully read the prospectus and/or summary prospectus and carefully consider the investment objectives, risks, charges and expenses. For this and more complete information about the fund(s), investors should ask their advisors for a prospectus/summary prospectus or visit invesco.com/fundprospectus.
Shares of Invesco funds are not deposits or obligations of any bank, are not guaranteed by any bank, are not insured by the FDIC or any other agency, and involve investment risks, including the possible loss of the principal amount invested.
| | |
| 4 INVESCO OPPENHEIMER V.I. GLOBAL STRATEGIC INCOME FUND |
Fund Expenses
Fund Expenses.As a shareholder of the Fund, you incur two types of costs: (1) transaction costs and (2) ongoing costs, including management fees; distribution and service fees; and other Fund expenses. These examples are intended to help you understand your ongoing costs (in dollars) of investing in the Fund and to compare these costs with the ongoing costs of investing in other mutual funds.
The examples are based on an investment of $1,000.00 invested at the beginning of the period and held for the entire 6-month period ended June 30, 2019.
Actual Expenses. The first section of the table provides information about actual account values and actual expenses. You may use the information in this section for the class of shares you hold, together with the amount you invested, to estimate the expense that you paid over the period. Simply divide your account value by $1,000.00 (for example, an $8,600.00 account value divided by $1,000.00 = 8.60), then multiply the result by the number in the first section under the heading entitled “Expenses Paid During 6 Months Ended June 30, 2019” to estimate the expenses you paid on your account during this period.
Hypothetical Example for Comparison Purposes.
The second section of the table provides information about hypothetical account values and hypothetical expenses based on the Fund’s actual expense ratio for each class of shares, and an assumed rate of return of 5% per year for each class before expenses, which is not the actual return. The hypothetical account values and expenses may not be used to estimate the actual ending account balance or expenses you paid for the period. You may use this information to compare the ongoing costs of investing in the Fund and other funds. To do so, compare this 5% hypothetical example for the class of shares you hold with the 5% hypothetical examples that appear in the shareholder reports of the other funds.
Please note that the expenses shown in the table are meant to highlight your ongoing costs only and do not reflect any charges associated with the separate accounts that offer this Fund. Therefore, the “hypothetical” lines of the table are useful in comparing ongoing costs only, and will not help you determine the relative total costs of owning different funds. In addition, if these separate account charges were included your costs would have been higher.
| | | | | | | | | | | | | | | | | | | | | | | | |
| Actual | | Beginning
Account
Value
January 1, 2019 | | | | | | Ending
Account
Value
June 30, 2019 | | | | | | Expenses
Paid During
6 Months Ended
June 30, 2019 | | | | |
Series I shares | | $ | 1,000.00 | | | | | | | $ | 1,085.70 | | | | | | | $ | 4.14 | | | | | |
Series II shares | | | 1,000.00 | | | | | | | | 1,082.30 | | | | | | | | 5.43 | | | | | |
| | | | | | |
Hypothetical (5% return before expenses) | | | | | | | | | | | | | | | | | | |
Series I shares | | | 1,000.00 | | | | | | | | 1,020.83 | | | | | | | | 4.02 | | | | | |
Series II shares | | | 1,000.00 | | | | | | | | 1,019.59 | | | | | | | | 5.27 | | | | | |
Expenses are equal to the Fund’s annualized expense ratio for that class, multiplied by the average account value over the period, multiplied by 181/365 (to reflect the one-half year period). Those annualized expense ratios, excluding indirect expenses from affiliated funds, based on the 6-month period ended June 30, 2019 are as follows:
| | | | | | | | |
| Class | | Expense Ratios | | | | |
Series I shares | | | 0.80% | | | | | |
Series II shares | | | 1.05 | | | | | |
The expense ratios reflect voluntary and/or contractual waivers and/or reimbursements of expenses by the Fund’s Manager. Some of these undertakings may be modified or terminated at any time, as indicated in the Fund’s prospectus. The “Financial Highlights” tables in the Fund’s financial statements, included in this report, also show the gross expense ratios, without such waivers or reimbursements and reduction to custodian expenses, if applicable.
| | |
| 5 INVESCO OPPENHEIMER V.I. GLOBAL STRATEGIC INCOME FUND |
CONSOLIDATED STATEMENT OF INVESTMENTSJune 30, 2019 Unaudited
| | | | | | | | | | |
| | | Principal Amount | | | Value | |
Asset-Backed Securities—3.8% | | | | | | | | | | |
| American Credit Acceptance Receivables Trust: | |
| Series2017-4, Cl. B, 2.61%, 5/10/211 | | $ | | | 7,592 | | | $ | 7,592 | |
| Series2017-4, Cl. C, 2.94%, 1/10/241 | | | | | 510,000 | | | | 510,745 | |
| Series2017-4, Cl. D, 3.57%, 1/10/241 | | | | | 673,000 | | | | 679,894 | |
| Series2018-3, Cl. D, 4.14%, 10/15/241 | | | | | 300,000 | | | | 307,578 | |
| Series2019-2, Cl. D, 3.41%, 6/12/251 | | | | | 1,720,000 | | | | 1,733,435 | |
| AmeriCredit Automobile Receivables Trust: | |
| Series2017-2, Cl. D, 3.42%, 4/18/23 | | | | | 830,000 | | | | 843,678 | |
| Series2017-4, Cl. D, 3.08%, 12/18/23 | | | | | 375,000 | | | | 380,544 | |
| Series2019-2, Cl. C, 2.74%, 4/18/25 | | | | | 1,185,000 | | | | 1,192,297 | |
| Series2019-2, Cl. D, 2.99%, 6/18/25 | | | | | 2,780,000 | | | | 2,797,729 | |
| Capital Auto Receivables Asset Trust, Series2017-1, Cl. D, 3.15%, 2/20/251 | | | | | 110,000 | | | | 110,572 | |
| CarMax Auto Owner Trust: | | | | | | | | | | |
| Series2015-2, Cl. D, 3.04%, 11/15/21 | | | | | 175,000 | | | | 175,002 | |
| Series2015-3, Cl. D, 3.27%, 3/15/22 | | | | | 610,000 | | | | 611,305 | |
| Series2016-1, Cl. D, 3.11%, 8/15/22 | | | | | 465,000 | | | | 465,880 | |
| Series2017-1, Cl. D, 3.43%, 7/17/23 | | | | | 630,000 | | | | 636,517 | |
| Series2017-4, Cl. D, 3.30%, 5/15/24 | | | | | 280,000 | | | | 283,187 | |
| Series2018-1, Cl. D, 3.37%, 7/15/24 | | | | | 195,000 | | | | 197,776 | |
| CCG Receivables Trust: | | | | | | | | | | |
| Series2017-1, Cl. B, 2.75%, 11/14/231 | | | | | 635,000 | | | | 636,241 | |
| Series2018-1, Cl. B, 3.09%, 6/16/251 | | | | | 240,000 | | | | 242,667 | |
| Series2018-1, Cl. C, 3.42%, 6/16/251 | | | | | 70,000 | | | | 71,028 | |
| Series2019-1, Cl. B, 3.22%, 9/14/261 | | | | | 140,000 | | | | 142,788 | |
| Series2019-1, Cl. C, 3.57%, 9/14/261 | | | | | 35,000 | | | | 35,709 | |
| CIG Auto Receivables Trust, Series 2017-1A, Cl. A, 2.71%, 5/15/231 | | | | | 99,265 | | | | 99,208 | |
| CNH Equipment Trust, Series2017-C, Cl. B, 2.54%, 5/15/25 | | | | | 185,000 | | | | 186,288 | |
| CPS Auto Receivables Trust, Series 2018-A, Cl. B, 2.77%, 4/18/221 | | | | | 370,000 | | | | 370,285 | |
| CPS Auto Trust, Series2017-A, Cl. B, 2.68%, 5/17/211 | | | | | 29,031 | | | | 29,029 | |
| Credit Acceptance Auto Loan Trust: | | | | | | | | | | |
| Series2017-3A, Cl. C, 3.48%, 10/15/261 | | | | | 565,000 | | | | 571,180 | |
| Series2018-1A, Cl. B, 3.60%, 4/15/271 | | | | | 1,075,000 | | | | 1,095,635 | |
| Series2018-1A, Cl. C, 3.77%, 6/15/271 | | | | | 510,000 | | | | 518,352 | |
| Series2019-1A, Cl. B, 3.75%, 4/17/281 | | | | | 85,000 | | | | 87,483 | |
| Series2019-1A, Cl. C, 3.94%, 6/15/281 | | | | | 515,000 | | | | 531,089 | |
| CWHEQ Revolving Home Equity Loan Trust: | |
| Series2005-G, Cl. 2A, 2.624% | | | | | | | | | | |
| [US0001M+23], 12/15/352 | | | | | 18,993 | | | | 18,840 | |
| Series2006-H, Cl. 2A1A, 2.544% [US0001M+15], 11/15/362 | | | | | 16,784 | | | | 13,110 | |
| Dell Equipment Finance Trust: | | | | | | | | | | |
| Series2017-2, Cl. B, 2.47%, 10/24/221 | | | | | 190,000 | | | | 189,652 | |
| Series2019-1, Cl. C, 3.14%, 3/22/241 | | | | | 270,000 | | | | 274,375 | |
| Drive Auto Receivables Trust: | |
| Series2016-CA, Cl. D, 4.18%, 3/15/241 | | | | | 430,000 | | | | 436,824 | |
| Series2018-1, Cl. D, 3.81%, 5/15/24 | | | | | 470,000 | | | | 478,440 | |
| Series2018-3, Cl. D, 4.30%, 9/16/24 | | | | | 175,000 | | | | 180,466 | |
| Series2019-3, Cl. C, 2.90%, 8/15/25 | | | | | 2,255,000 | | | | 2,267,460 | |
| Series2019-3, Cl. D, 3.18%, 10/15/26 | | | | | 1,785,000 | | | | 1,797,421 | |
| DT Auto Owner Trust: | | | | | | | | | | |
| Series2016-4A, Cl. E, 6.49%, 9/15/231 | | | | | 200,000 | | | | 208,169 | |
| Series2017-1A, Cl. D, 3.55%, 11/15/221 | | | | | 440,000 | | | | 442,711 | |
| Series2017-1A, Cl. E, 5.79%, 2/15/241 | | | | | 415,000 | | | | 431,605 | |
| Series2017-2A, Cl. D, 3.89%, 1/15/231 | | | | | 495,000 | | | | 498,765 | |
| Series2017-3A, Cl. E, 5.60%, 8/15/241 | | | | | 1,245,000 | | | | 1,301,666 | |
| Series2017-4A, Cl. D, 3.47%, 7/17/231 | | | | | 560,000 | | | | 564,264 | |
| Series2017-4A, Cl. E, 5.15%, 11/15/241 | | | | | 1,950,000 | | | | 2,024,217 | |
| Series2019-2A, Cl. D, 3.48%, 2/18/251 | | | | | 285,000 | | | | 290,535 | |
| Element Rail Leasing I LLC, Series 2014-1A, Cl. A1, 2.299%, 4/19/441 | | | | | 98,826 | | | | 99,005 | |
| Exeter Automobile Receivables Trust: | |
| Series2018-1A, Cl. B, 2.75%, 4/15/221 | | | | | 394,977 | | | | 395,241 | |
| Series2019-1A, Cl. D, 4.13%, 12/16/241 | | | | | 265,000 | | | | 274,240 | |
| | | | | | | | | | |
| | | Principal Amount | | | Value | |
Asset-Backed Securities (Continued) | | | | | |
| Exeter Automobile Receivables Trust: (Continued) | | | | | |
| Series2019-2A, Cl. C, 3.30%, 3/15/241 | | $ | | | 3,731,000 | | | $ | 3,796,281 | |
| Flagship Credit Auto Trust, Series 2016- 1, Cl. C, 6.22%, 6/15/221 | | | | | 980,000 | | | | 1,014,447 | |
| GLS Auto Receivables Trust, Series 2018- 1A, Cl. A, 2.82%, 7/15/223 | | | | | 449,475 | | | | 450,145 | |
| GM Financial Automobile Leasing Trust, Series2017-3, Cl. C, 2.73%, 9/20/21 | | | | | 320,000 | | | | 320,200 | |
| MASTR Asset Backed Securities Trust, Series 2006-WMC3, Cl. A3, 2.504% [US0001M+10], 8/25/362 | | | | | 832,941 | | | | 402,961 | |
| Navistar Financial Dealer Note Master Owner Trust II: | |
| Series2019-1, Cl. C, 3.363% | | | | | | | | | | |
| [US0001M+95], 5/28/241,2 | | | | | 270,000 | | | | 270,328 | |
| Series2019-1, Cl. D, 3.863% | | | | | | | | | | |
| [US0001M+145], 5/28/241,2 | | | | | 255,000 | | | | 255,270 | |
| Santander Drive Auto Receivables Trust: | |
| Series2017-1, Cl. E, 5.05%, 7/15/241 | | | | | 1,110,000 | | | | 1,138,145 | |
| Series2017-2, Cl. D, 3.49%, 7/17/23 | | | | | 190,000 | | | | 192,139 | |
| Series2017-3, Cl. D, 3.20%, 11/15/23 | | | | | 760,000 | | | | 768,252 | |
| Series2018-1, Cl. D, 3.32%, 3/15/24 | | | | | 290,000 | | | | 294,324 | |
| Series2018-2, Cl. D, 3.88%, 2/15/24 | | | | | 145,000 | | | | 148,637 | |
| Series2019-2, Cl. D, 3.22%, 7/15/25 | | | | | 170,000 | | | | 172,509 | |
| Santander Retail Auto Lease Trust, Series2019-A, Cl. C, 3.30%, 5/22/231 | | | | | 260,000 | | | | 262,907 | |
| SLM Student Loan Trust, Series 2004- 5X, Cl. A6, 0.089% [EUR003M+40], 10/25/392,4 | | EUR | | | 10,750,737 | | | | 11,864,958 | |
| TCF Auto Receivables Owner Trust, Series2015-1A, Cl. D, 3.53%, 3/15/221 | | | | | 285,000 | | | | 285,024 | |
| United Auto Credit Securitization Trust: | |
| Series2018-1, Cl. C, 3.05%, 9/10/211 | | | | | 625,000 | | | | 625,468 | |
| Series2019-1, Cl. C, 3.16%, 8/12/241 | | | | | 130,000 | | | | 131,010 | |
| Veros Automobile Receivables Trust, | | | | | | | | | | |
| Series2017-1, Cl. A, 2.84%, 4/17/231 | | | | | 48,845 | | | | 48,817 | |
| Westlake Automobile Receivables Trust: | |
| Series2017-2A, Cl. E, 4.63%, 7/15/241 | | | | | 685,000 | | | | 701,334 | |
| Series2018-1A, Cl. D, 3.41%, 5/15/231 | | | | | 845,000 | | | | 851,486 | |
| Series2019-2A, Cl. C, 2.84%, 7/15/241 | | | | | 2,530,000 | | | | 2,539,021 | |
| World Financial Network Credit Card Master Trust, Series2019-B, Cl. A, 2.49%, 4/15/26 | | | | | 3,155,000 | | | | 3,155,309 | |
| | | | | | | | | | |
| Total Asset-Backed Securities (Cost $57,309,721) | | | | 57,426,691 | |
| |
| | | | | |
| Mortgage-Backed Obligations—21.5% | |
| Government Agency—13.5% | |
| FHLMC/FNMA/FHLB/Sponsored—12.7% | |
| Federal Home Loan Mortgage Corp. Gold Pool: | |
| 5.00%, 9/1/33 | | | | | 188,110 | | | | 204,507 | |
| 5.50%, 9/1/39 | | | | | 205,757 | | | | 222,205 | |
| 6.00%, 11/1/21 | | | | | 19,792 | | | | 21,688 | |
| 6.50%,11/1/22-8/1/32 | | | | | 157,564 | | | | 176,147 | |
| 7.00%,10/1/31-10/1/37 | | | | | 35,049 | | | | 39,760 | |
| 7.50%, 1/1/32 | | | | | 185,586 | | | | 220,613 | |
| Federal Home Loan Mortgage Corp., Interest-Only Stripped Mtg.-Backed Security: | |
| Series 192,Cl. IO, 99.999%, 2/1/285 | | | | | 3,732 | | | | 699 | |
| Series 205,Cl. IO, 69.358%, 9/1/295 | | | | | 22,425 | | | | 4,500 | |
| Series 243,Cl. 6, 2.397%, 12/15/325 | | | | | 49,701 | | | | 9,069 | |
| Federal Home Loan Mortgage Corp., Multifamily Structured Pass-Through Certificates, Interest-Only Stripped Mtg.-Backed Security: | |
| Series K093,Cl. X1, 0.00%, 5/25/295,6 | | | | | 20,120,000 | | | | 1,601,121 | |
| Series K734,Cl. X1, 0.00%, 2/25/265,6 | | | | | 1,679,762 | | | | 63,384 | |
| Federal Home Loan Mortgage Corp., Real Estate Mtg. Investment Conduit Multiclass Pass-Through Certificates: | |
| Series 1360,Cl. PZ, 7.50%, 9/15/22 | | | | | 134,140 | | | | 141,578 | |
| Series 151,Cl. F, 9.00%, 5/15/21 | | | | | 411 | | | | 417 | |
| Series 1674,Cl. Z, 6.75%, 2/15/24 | | | | | 68,238 | | | | 72,665 | |
| Series 1897,Cl. K, 7.00%, 9/15/26 | | | | | 251,366 | | | | 276,479 | |
| | |
| 6 INVESCO OPPENHEIMER V.I. GLOBAL STRATEGIC INCOME FUND |
| | | | | | | | | | | | |
| | | Principal Amount | | | Value | |
FHLMC/FNMA/FHLB/Sponsored (Continued) | |
| Federal Home Loan Mortgage Corp., Real Estate Mtg. Investment Conduit Multiclass Pass-Through Certificates: (Continued) | |
| Series 2043,Cl. ZP, 6.50%, 4/15/28 | | | $ | | | | 120,614 | | | $ | 135,293 | |
| Series 2106,Cl. FG, 2.844% [LIBOR01M+45], 12/15/282 | | | | | | | 207,240 | | | | 208,173 | |
| Series 2122,Cl. F, 2.844% [LIBOR01M+45], 2/15/292 | | | | | | | 5,766 | | | | 5,626 | |
| Series 2148,Cl. ZA, 6.00%, 4/15/29 | | | | | | | 113,668 | | | | 125,456 | |
| Series 2195,Cl. LH, 6.50%, 10/15/29 | | | | | | | 81,638 | | | | 91,123 | |
| Series 2326,Cl. ZP, 6.50%, 6/15/31 | | | | | | | 9,864 | | | | 10,955 | |
| Series 2344,Cl. FP, 3.344% [LIBOR01M+95], 8/15/312 | | | | | | | 55,755 | | | | 57,131 | |
| Series 2368,Cl. PR, 6.50%, 10/15/31 | | | | | | | 39,896 | | | | 45,372 | |
| Series 2412,Cl. GF, 3.344% [LIBOR01M+95], 2/15/322 | | | | | | | 64,759 | | | | 66,397 | |
| Series 2449,Cl. FL, 2.944% [LIBOR01M+55], 1/15/322 | | | | | | | 62,924 | | | | 63,522 | |
| Series 2451,Cl. FD, 3.394% [LIBOR01M+100], 3/15/322 | | | | | | | 29,456 | | | | 30,255 | |
| Series 2461,Cl. PZ, 6.50%, 6/15/32 | | | | | | | 141,375 | | | | 158,297 | |
| Series 2464,Cl. FI, 3.394% [LIBOR01M+100], 2/15/322 | | | | | | | 27,460 | | | | 28,209 | |
| Series 2470,Cl. AF, 3.394% [LIBOR01M+100], 3/15/322 | | | | | | | 50,540 | | | | 51,911 | |
| Series 2470,Cl. LF, 3.394% [LIBOR01M+100], 2/15/322 | | | | | | | 28,102 | | | | 28,868 | |
| Series 2477,Cl. FZ, 2.944% [LIBOR01M+55], 6/15/312 | | | | | | | 109,575 | | | | 110,560 | |
| Series 2517,Cl. GF, 3.394% [LIBOR01M+100], 2/15/322 | | | | | | | 24,433 | | | | 25,099 | |
| Series 2635,Cl. AG, 3.50%, 5/15/32 | | | | | | | 35,529 | | | | 36,597 | |
| Series 2676,Cl. KY, 5.00%, 9/15/23 | | | | | | | 288,302 | | | | 299,670 | |
| Series 3025,Cl. SJ, 15.971% [-3.6667 x LIBOR01M+2,475], 8/15/352 | | | | | | | 69,466 | | | | 103,433 | |
| Series 3848,Cl. WL, 4.00%, 4/15/40 | | | | | | | 82,161 | | | | 83,556 | |
| Series 3857,Cl. GL, 3.00%, 5/15/40 | | | | | | | 4,161 | | | | 4,275 | |
| Series 3917,Cl. BA, 4.00%, 6/15/38 | | | | | | | 53,950 | | | | 56,609 | |
| Series 4221,Cl. HJ, 1.50%, 7/15/23 | | | | | | | 113,367 | | | | 112,269 | |
| Federal Home Loan Mortgage Corp., Real Estate Mtg. Investment Conduit Multiclass Pass-Through Certificates, Interest-Only Stripped Mtg.-Backed Security: | |
| Series 2074,Cl. S, 99.999%, 7/17/285 | | | | | | | 4,894 | | | | 473 | |
| Series 2079,Cl. S, 99.999%, 7/17/285 | | | | | | | 9,207 | | | | 1,076 | |
| Series 2136,Cl. SG, 36.337%, 3/15/295 | | | | | | | 291,602 | | | | 44,462 | |
| Series 2399,Cl. SG, 99.999%, 12/15/265 | | | | | | | 150,601 | | | | 20,376 | |
| Series 2437,Cl. SB, 49.452%, 4/15/325 | | | | | | | 514,381 | | | | 75,182 | |
| Series 2526,Cl. SE, 59.145%, 6/15/295 | | | | | | | 10,462 | | | | 1,895 | |
| Series 2682,Cl. TQ, 99.999%, 10/15/335 | | | | | | | 117,076 | | | | 21,895 | |
| Series 2795,Cl. SH, 58.874%, 3/15/245 | | | | | | | 170,326 | | | | 11,717 | |
| Series 2920,Cl. S, 47.956%, 1/15/355 | | | | | | | 120,502 | | | | 20,607 | |
| Series 2922,Cl. SE, 18.555%, 2/15/355 | | | | | | | 19,664 | | | | 3,223 | |
| Series 2981,Cl. AS, 1.215%, 5/15/355 | | | | | | | 175,825 | | | | 25,633 | |
| Series 2981,Cl. BS, 99.999%, 5/15/355 | | | | | | | 237,787 | | | | 39,966 | |
| Series 3397,Cl. GS, 4.397%, 12/15/375 | | | | | | | 79,376 | | | | 16,606 | |
| Series 3424,Cl. EI, 0.00%, 4/15/385,6 | | | | | | | 23,614 | | | | 2,344 | |
| Series 3450,Cl. BI, 11.942%, 5/15/385 | | | | | | | 134,105 | | | | 22,056 | |
| Series 3606,Cl. SN, 12.583%, 12/15/395 | | | | | | | 39,456 | | | | 6,298 | |
| Federal Home Loan Mortgage Corp., STACR Trust, Series 2019-HRP1, Cl. M2, 3.811% [US0001M+140], 2/25/491,2 | | | | | | | 745,000 | | | | 746,979 | |
| Federal National Mortgage Assn.: | |
| 2.50%, 7/1/347 | | | | | | | 4,425,000 | | | | 4,454,039 | |
| 3.00%, 7/1/34-7/1/467 | | | | | | | 21,745,000 | | | | 21,965,177 | |
| 3.50%, 7/1/497 | | | | | | | 46,255,000 | | | | 47,277,669 | |
| 4.00%, 7/1/497 | | | | | | | 24,055,000 | | | | 24,857,929 | |
| 4.50%, 7/1/497 | | | | | | | 73,600,000 | | | | 76,913,437 | |
| 5.00%, 7/1/497 | | | | | | | 6,045,000 | | | | 6,389,364 | |
| Federal National Mortgage Assn. Pool: | |
| 5.00%, 9/1/19-7/1/33 | | | | | | | 210,060 | | | | 227,219 | |
| 5.50%, 4/1/21-5/1/36 | | | | | | | 115,282 | | | | 126,606 | |
| | | | | | | | | | | | |
| | | Principal Amount | | | Value | |
FHLMC/FNMA/FHLB/Sponsored (Continued) | |
| Federal National Mortgage Assn. Pool: (Continued) | |
| 6.50%, 12/1/29-1/1/34 | | | $ | | | | 341,245 | | | $ | 386,832 | |
| 7.00%, 1/1/30-4/1/34 | | | | | | | 434,893 | | | | 502,220 | |
| 7.50%, 2/1/27-3/1/33 | | | | | | | 583,244 | | | | 686,768 | |
| 8.50%, 7/1/32 | | | | | | | 439 | | | | 444 | |
| Federal National Mortgage Assn., Interest-Only Stripped Mtg.-Backed Security: | |
| Series 214,Cl. 2, 99.999%, 3/25/235 | | | | | | | 45,964 | | | | 4,338 | |
| Series 221,Cl. 2, 99.999%, 5/25/235 | | | | | | | 5,479 | | | | 567 | |
| Series 254,Cl. 2, 99.999%, 1/25/245 | | | | | | | 101,432 | | | | 12,200 | |
| Series 301,Cl. 2, 22.995%, 4/25/295 | | | | | | | 22,235 | | | | 4,311 | |
| Series 313,Cl. 2, 99.999%, 6/25/315 | | | | | | | 243,497 | | | | 50,975 | |
| Series 319,Cl. 2, 0.00%, 2/25/325,6 | | | | | | | 115,635 | | | | 24,322 | |
| Series 321,Cl. 2, 35.763%, 4/25/325 | | | | | | | 35,594 | | | | 7,749 | |
| Series 324,Cl. 2, 0.00%, 7/25/325,6 | | | | | | | 34,732 | | | | 7,502 | |
| Series 328,Cl. 2, 0.00%, 12/25/325,6 | | | | | | | 68,112 | | | | 14,622 | |
| Series 331,Cl. 5, 2.309%, 2/25/335 | | | | | | | 132,329 | | | | 24,833 | |
| Series 332,Cl. 2, 0.00%, 3/25/335,6 | | | | | | | 577,278 | | | | 123,806 | |
| Series 334,Cl. 12, 0.00%, 3/25/335,6 | | | | | | | 107,506 | | | | 22,516 | |
| Series 339,Cl. 15, 8.16%, 10/25/335 | | | | | | | 314,577 | | | | 66,435 | |
| Series 345,Cl. 9, 0.00%, 1/25/345,6 | | | | | | | 100,539 | | | | 19,561 | |
| Series 351,Cl. 10, 0.00%, 4/25/345,6 | | | | | | | 61,252 | | | | 12,392 | |
| Series 351,Cl. 8, 0.00%, 4/25/345,6 | | | | | | | 110,882 | | | | 22,448 | |
| Series 356,Cl. 10, 0.00%, 6/25/355,6 | | | | | | | 78,093 | | | | 14,768 | |
| Series 356,Cl. 12, 0.00%, 2/25/355,6 | | | | | | | 38,691 | | | | 7,425 | |
| Series 362,Cl. 13, 0.00%, 8/25/355,6 | | | | | | | 50,784 | | | | 10,414 | |
| Federal National Mortgage Assn., Real Estate Mtg. Investment Conduit Multiclass Pass-Through Certificates: | |
| Series 1999-54,Cl. LH, 6.50%, 11/25/29 | | | | | | | 70,646 | | | | 78,372 | |
| Series 2001-80,Cl. ZB, 6.00%, 1/25/32 | | | | | | | 60,255 | | | | 66,565 | |
| Series 2002-29,Cl. F, 3.404% [LIBOR01M+100], 4/25/322 | | | | | | | 30,197 | | | | 31,028 | |
| Series 2002-64,Cl. FJ, 3.404% [LIBOR01M+100], 4/25/322 | | | | | | | 9,299 | | | | 9,555 | |
| Series 2002-68,Cl. FH, 2.882% [LIBOR01M+50], 10/18/322 | | | | | | | 20,525 | | | | 20,673 | |
| Series 2002-84,Cl. FB, 3.404% [LIBOR01M+100], 12/25/322 | | | | | | | 127,677 | | | | 131,162 | |
| Series 2002-90,Cl. FH, 2.904% [LIBOR01M+50], 9/25/322 | | | | | | | 71,435 | | | | 71,980 | |
| Series 2003-11,Cl. FA, 3.404% [LIBOR01M+100], 9/25/322 | | | | | | | 127,680 | | | | 131,165 | |
| Series 2003-116,Cl. FA, 2.804% [LIBOR01M+40], 11/25/332 | | | | | | | 13,356 | | | | 13,213 | |
| Series 2005-109,Cl. AH, 5.50%, 12/25/25 | | | | | | | 421,238 | | | | 436,246 | |
| Series 2005-31,Cl. PB, 5.50%, 4/25/35 | | | | | | | 560,000 | | | | 626,214 | |
| Series 2005-71,Cl. DB, 4.50%, 8/25/25 | | | | | | | 57,136 | | | | 58,375 | |
| Series 2006-11,Cl. PS, 15.751%[-3.6667 x LIBOR01M+2,456.67], 3/25/362 | | | | | | | 66,417 | | | | 101,367 | |
| Series 2006-46,Cl. SW, 15.384%[-3.6665 x LIBOR01M+2,419.92], 6/25/362 | | | | | | | 97,712 | | | | 145,679 | |
| Series 2009-113,Cl. DB, 3.00%, 12/25/20 | | | | | | | 2,127 | | | | 2,121 | |
| Series 2009-36,Cl. FA, 3.344% [LIBOR01M+94], 6/25/372 | | | | | | | 14,094 | | | | 14,447 | |
| Series 2009-70,Cl. TL, 4.00%, 8/25/19 | | | | | | | 2 | | | | 2 | |
| Series 2010-43,Cl. KG, 3.00%, 1/25/21 | | | | | | | 3,061 | | | | 3,062 | |
| Series 2011-122,Cl. EC, 1.50%, 1/25/20 | | | | | | | 1,045 | | | | 1,040 | |
| Series 2011-15,Cl. DA, 4.00%, 3/25/41 | | | | | | | 38,731 | | | | 40,190 | |
| Series 2011-3,Cl. EL, 3.00%, 5/25/20 | | | | | | | 1,201 | | | | 1,198 | |
| Series 2011-3,Cl. KA, 5.00%, 4/25/40 | | | | | | | 106,841 | | | | 112,074 | |
| Series 2011-6,Cl. BA, 2.75%, 6/25/20 | | | | | | | 916 | | | | 919 | |
| Series 2011-82,Cl. AD, 4.00%, 8/25/26 | | | | | | | 14,868 | | | | 14,914 | |
| Series 2012-20,Cl. FD, 2.804% [LIBOR01M+40], 3/25/422 | | | | | | | 157,788 | | | | 158,029 | |
| | |
| 7 INVESCO OPPENHEIMER V.I. GLOBAL STRATEGIC INCOME FUND |
CONSOLIDATED STATEMENT OF INVESTMENTSUnaudited / Continued
| | | | | | | | |
| | | Principal Amount | | | Value | |
FHLMC/FNMA/FHLB/Sponsored (Continued) | |
| Federal National Mortgage Assn., Real Estate Mtg. Investment Conduit Multiclass Pass-Through Certificates, Interest-Only Stripped Mtg.-Backed Security: | |
| Series2001-61,Cl. SH, 44.152%, 11/18/315 | | $ | 33,465 | | | $ | 6,605 | |
| Series2001-63,Cl. SD, 52.33%, 12/18/315 | | | 8,324 | | | | 1,320 | |
| Series2001-68,Cl. SC, 38.394%, 11/25/315 | | | 6,207 | | | | 1,153 | |
| Series2001-81,Cl. S, 44.038%, 1/25/325 | | | 7,233 | | | | 1,355 | |
| Series2002-28,Cl. SA, 40.847%, 4/25/325 | | | 5,412 | | | | 1,040 | |
| Series2002-38,Cl. SO, 53.708%, 4/25/325 | | | 36,865 | | | | 6,591 | |
| Series2002-48,Cl. S, 45.654%, 7/25/325 | | | 7,881 | | | | 1,638 | |
| Series2002-52,Cl. SL, 35.407%, 9/25/325 | | | 5,438 | | | | 1,080 | |
| Series2002-56,Cl. SN, 47.059%, 7/25/325 | | | 10,829 | | | | 2,251 | |
| Series2002-77,Cl. IS, 61.64%, 12/18/325 | | | 62,808 | | | | 12,799 | |
| Series2002-77,Cl. SH, 41.241%, 12/18/325 | | | 9,814 | | | | 1,748 | |
| Series2002-9,Cl. MS, 39.75%, 3/25/325 | | | 9,665 | | | | 2,004 | |
| Series2003-13,Cl. IO, 56.418%, 3/25/335 | | | 108,789 | | | | 24,834 | |
| Series2003-26,Cl. DI, 54.663%, 4/25/335 | | | 76,254 | | | | 19,135 | |
| Series2003-33,Cl. SP, 39.736%, 5/25/335 | | | 58,677 | | | | 11,748 | |
| Series2003-4,Cl. S, 38.298%, 2/25/335 | | | 16,368 | | | | 3,358 | |
| Series2004-56,Cl. SE, 5.216%, 10/25/335 | | | 281,224 | | | | 53,697 | |
| Series2005-12,Cl. SC, 27.99%, 3/25/355 | | | 9,161 | | | | 1,432 | |
| Series2005-14,Cl. SE, 42.607%, 3/25/355 | | | 338,955 | | | | 48,192 | |
| Series2005-40,Cl. SA, 46.084%, 5/25/355 | | | 295,885 | | | | 51,132 | |
| Series2005-40,Cl. SB, 99.999%, 5/25/355 | | | 485,052 | | | | 66,808 | |
| Series2005-52,Cl. JH, 27.027%, 5/25/355 | | | 176,704 | | | | 28,800 | |
| Series2005-63,Cl. SA, 44.48%, 10/25/315 | | | 16,194 | | | | 2,483 | |
| Series2006-90,Cl. SX, 99.999%, 9/25/365 | | | 338,248 | | | | 64,790 | |
| Series2007-88,Cl. XI, 0.00%, 6/25/375,6 | | | 316,830 | | | | 56,807 | |
| Series2008-55,Cl. SA, 0.00%, 7/25/385,6 | | | 17,442 | | | | 1,917 | |
| Series2009-8,Cl. BS, 0.00%, 2/25/245,6 | | | 630 | | | | 36 | |
| Series2010-95,Cl. DI, 0.00%, 11/25/205,6 | | | 2,378 | | | | 41 | |
| Series2011-96,Cl. SA, 5.755%, 10/25/415 | | | 134,048 | | | | 22,912 | |
| Series2012-134,Cl. SA, 0.00%, 12/25/425,6 | | | 455,538 | | | | 86,785 | |
| Series2012-40,Cl. PI, 25.421%, 4/25/415 | | | 719,222 | | | | 80,365 | |
| Federal National Mortgage Assn., Stripped Mtg.-Backed Security, Series 302, Cl. 2, 6.00%, 5/1/29 | | | 3 | | | | 0 | |
| | | | | | | | |
| | | | | | | | 193,227,610 | |
| GNMA/Guaranteed—0.8% | | | | | | | | |
| Government National Mortgage Assn. I Pool: | |
| 7.00%,4/15/28-7/15/28 | | | 43,597 | | | | 47,869 | |
| 8.00%, 5/15/26 | | | 7,462 | | | | 7,480 | |
| Government National Mortgage Assn. II Pool: | |
| 3.50%, 7/1/497 | | | 11,310,000 | | | | 11,680,226 | |
| 4.125% [H15T1Y+150], 11/20/252 | | | 1,676 | | | | 1,725 | |
| | | | | | | | |
| | | Principal Amount | | | Value | |
| GNMA/Guaranteed (Continued) | |
| Government National Mortgage Assn., Interest-Only Stripped Mtg.-Backed Security: | |
| Series2007-17,Cl. AI, 37.227%, 4/16/375 | | $ | 179,640 | | | $ | 28,307 | |
| Series2011-52,Cl. HS, 16.739%, 4/16/415 | | | 298,407 | | | | 44,824 | |
| | | | | | | | |
| | | | | | | | 11,810,431 | |
| Non-Agency—8.0% | | | | | | | | |
| Commercial—3.1% | | | | | | | | |
| BCAP LLC Trust, Series2011-R11, Cl. 18A5, 4.69% [H15T1Y+210], 9/26/351,2 | | | 10,274 | | | | 10,327 | |
| Benchmark Mortgage Trust, Interest-Only Commercial Mtg. Pass-Through Certificates, Series2018-B1, Cl. XA, 10.798%, 1/15/515 | | | 5,729,144 | | | | 207,309 | |
| CD Mortgage Trust, Interest-Only Commercial Mtg. Pass-Through Certificates, Series 2017-CD6, Cl. XA, 12.599%, 11/13/505 | | | 2,297,408 | | | | 129,264 | |
| Chase Mortgage Finance Trust, Series 2005-A2, Cl. 1A3, 4.357%, 1/25/368 | | | 10,186 | | | | 10,093 | |
| Citigroup Commercial Mortgage Trust, Series 2014-GC21, Cl. AAB, 3.477%, 5/10/47 | | | 266,566 | | | | 274,252 | |
| Citigroup Commercial Mortgage Trust, Interest-Only Commercial Mtg. Pass-Through Certificates, Series2017-C4, Cl. XA, 11.941%, 10/12/505 | | | 6,106,992 | | | | 415,085 | |
| COMM Mortgage Trust: | | | | | | | | |
| Series2013-CR6,Cl. AM, 3.147%, 3/10/461 | | | 960,000 | | | | 981,843 | |
| Series 2014-CR20,Cl. ASB, 3.305%, 11/10/47 | | | 180,000 | | | | 185,070 | |
| Series 2014-CR21,Cl. AM, 3.987%, 12/10/47 | | | 25,000 | | | | 26,345 | |
| Series 2014-LC15,Cl. AM, 4.198%, 4/10/47 | | | 455,000 | | | | 483,317 | |
| Series 2014-UBS6,Cl. AM, 4.048%, 12/10/47 | | | 1,600,000 | | | | 1,675,305 | |
| COMM Mortgage Trust, Interest-Only Stripped Mtg.-Backed Security, Series2012-CR5, Cl. XA, 20.813%, 12/10/455 | | | 2,510,139 | | | | 111,726 | |
| Connecticut Avenue Securities: | | | | | | | | |
| Series2014-C03,Cl. 1M2, 5.404% | | | | | | | | |
| [US0001M+300], 7/25/242 | | | 781,213 | | | | 819,801 | |
| Series2016-C03,Cl. 1M1, 4.404% | | | | | | | | |
| [US0001M+200], 10/25/282 | | | 96,406 | | | | 97,096 | |
| Series2017-C03,Cl. 1M1, 3.354% | | | | | | | | |
| [US0001M+95], 10/25/292 | | | 725,687 | | | | 727,832 | |
| Series2018-C01,Cl. 1M1, 3.004% | | | | | | | | |
| [US0001M+60], 7/25/302 | | | 719,998 | | | | 719,855 | |
| Series2018-C06,Cl. 2M2, 4.504% | | | | | | | | |
| [US0001M+210], 3/25/312 | | | 1,280,000 | | | | 1,281,393 | |
| DeutscheAlt-B Securities, Inc. Mortgage Loan Trust, Series2006-AB2, Cl. A1, 5.257%, 6/25/368 | | | 42,809 | | | | 41,815 | |
| Deutsche Mortgage Securities, Inc., Series2013-RS1, Cl. 1A2, 2.603% [US0001M+22], 7/22/361,2 | | | 4,054,659 | | | | 3,998,739 | |
| FREMF Mortgage Trust: | | | | | | | | |
| Series2012-K20,Cl. C, 4.006%, 5/25/451,8 | | | 4,165,000 | | | | 4,287,626 | |
| Series2013-K25,Cl. C, 3.744%, 11/25/451,8 | | | 135,000 | | | | 137,999 | |
| Series2013-K26,Cl. C, 3.721%, 12/25/451,8 | | | 95,000 | | | | 97,099 | |
| Series2013-K27,Cl. C, 3.615%, 1/25/461,8 | | | 1,460,000 | | | | 1,488,957 | |
| Series2013-K28,Cl. C, 3.609%, 6/25/461,8 | | | 2,330,000 | | | | 2,378,398 | |
| Series2013-K29,Cl. C, 3.601%, 5/25/461,8 | | | 2,300,000 | | | | 2,345,027 | |
| | |
| 8 INVESCO OPPENHEIMER V.I. GLOBAL STRATEGIC INCOME FUND |
| | | | | | | | |
| | | Principal Amount | | | Value | |
Commercial (Continued) | |
FREMF Mortgage Trust: (Continued) | |
| Series 2013-K713,Cl. C, 3.263%, 4/25/461,8 | | $ | 535,000 | | | $ | 535,732 | |
| Series 2014-K714,Cl. C, 3.986%, 1/25/471,8 | | | 400,000 | | | | 405,802 | |
| Series 2015-K44,Cl. B, 3.807%, 1/25/481,8 | | | 2,310,000 | | | | 2,375,423 | |
| Series 2015-K45,Cl. B, 3.713%, 4/25/481,8 | | | 4,646,000 | | | | 4,780,945 | |
| Series 2017-K62,Cl. B, 4.004%, 1/25/501,8 | | | 280,000 | | | | 290,097 | |
| Series 2017-K724,Cl. B, 3.599%, 11/25/231,8 | | | 1,535,000 | | | | 1,563,194 | |
| GS Mortgage Securities Trust: | | | | | | | | |
| Series 2013-GC12,Cl. AAB, 2.678%, 6/10/46 | | | 73,779 | | | | 74,098 | |
| Series 2013-GC16,Cl. AS, 4.649%, 11/10/46 | | | 160,000 | | | | 174,092 | |
| Series 2014-GC18,Cl. AAB, 3.648%, 1/10/47 | | | 216,234 | | | | 222,292 | |
| JP Morgan Chase Commercial Mortgage Securities Trust: | |
| Series 2013-C10,Cl. AS, 3.372%, 12/15/47 | | | 855,000 | | | | 875,685 | |
| Series 2013-C16,Cl. AS, 4.517%, 12/15/46 | | | 820,000 | | | | 879,574 | |
| Series 2013-LC11,Cl. AS, 3.216%, 4/15/46 | | | 235,000 | | | | 239,313 | |
| Series 2014-C20,Cl. AS, 4.043%, 7/15/47 | | | 630,000 | | | | 665,011 | |
| Series 2016-JP3,Cl. A2, 2.435%, 8/15/49 | | | 516,703 | | | | 517,137 | |
| JP Morgan Mortgage Trust, Series 2007-A1, Cl. 5A1, 4.697%, 7/25/358 | | | 37,502 | | | | 39,096 | |
| JP Morgan Resecuritization Trust, Series 2009- 5, Cl. 1A2, 4.992%, 7/26/361,8 | | | 1,904,267 | | | | 1,857,664 | |
| JPMBB Commercial Mortgage Securities Trust: | |
| Series 2014-C18,Cl. A3, 3.578%, 2/15/47 | | | 116,552 | | | | 118,331 | |
| Series 2014-C24,Cl. B, 4.116%, 11/15/478 | | | 680,000 | | | | 711,190 | |
| Series 2014-C25,Cl. AS, 4.065%, 11/15/47 | | | 1,720,000 | | | | 1,820,216 | |
| Morgan Stanley Bank of America Merrill Lynch Trust: | |
| Series 2013-C9,Cl. AS, 3.456%, 5/15/46 | | | 570,000 | | | | 588,656 | |
| Series 2014-C14,Cl. B, 4.912%, 2/15/478 | | | 240,000 | | | | 259,442 | |
| Morgan Stanley Capital I, Inc., Interest-Only Commercial Mtg. Pass-Through Certificates, Series 2017-HR2, Cl. XA, 10.514%, 12/15/505 | | | 2,009,860 | | | | 110,380 | |
| Morgan Stanley Resecuritization Trust, Series 2013-R9, Cl. 3A, 4.076%, 6/26/461,8 | | | 23,577 | | | | 23,770 | |
| Structured Adjustable Rate Mortgage Loan Trust, Series 2004-10, Cl. 2A, 4.472%, 8/25/348 | | | 1,692,064 | | | | 1,718,123 | |
| UBS Commercial Mortgage Trust, Interest-Only Commercial Mtg. Pass-Through Certificates, Series 2017-C5, Cl. XA, 14.709%, 11/15/505 | | | 3,798,904 | | | | 230,015 | |
| Wells Fargo Commercial Mortgage Trust, Series 2015-NXS1, Cl. ASB, 2.934%, 5/15/48 | | | 940,000 | | | | 955,923 | |
| Wells Fargo Commercial Mortgage Trust, Interest-Only Commercial Mtg. Pass-Through Certificates, Series 2017-C42, Cl. XA, 10.479%, 12/15/505 | | | 2,792,262 | | | | 175,162 | |
| WF-RBS Commercial Mortgage Trust: | | | | | | | | |
| Series 2013-C14,Cl. AS, 3.488%, 6/15/46 | | | 640,000 | | | | 661,213 | |
| Series 2014-C20,Cl. AS, 4.176%, 5/15/47 | | | 490,000 | | | | 518,930 | |
| | | | | | | | |
| | | Principal Amount | | | Value | |
Commercial (Continued) | |
| WF-RBS Commercial Mortgage Trust: (Continued) | |
| Series 2014-C22,Cl. A3, 3.528%, 9/15/57 | | $ | 120,000 | | | $ | 122,631 | |
| Series 2014-LC14,Cl. AS, 4.351%, 3/15/478 | | | 395,000 | | | | 421,391 | |
| WF-RBS Commercial Mortgage Trust, Interest-Only Commercial Mtg. Pass-Through Certificates, Series 2011-C3, Cl. XA, 29.412%, 3/15/441,5 | | | 2,969,380 | | | | 56,169 | |
| | | | | | | | |
| | | | | | | | 46,918,270 | |
| Multi-Family—0.0% | | | | | | | | |
Connecticut Avenue Securities, Series 2017-C04, Cl. 2M1, 3.254% [US0001M+85], 11/25/292 | | | 452,932 | | | | 453,446 | |
| Residential—4.9% | | | | | | | | |
| Alba plc, Series 2007-1, Cl. F, 4.038% [BP0003M+325], 3/17/392,4 | | | 542,755 | | | | 668,338 | |
| Banc of America Funding Trust, Series 2014- R7, Cl. 3A1, 4.991%, 3/26/361,8 | | | 10,447 | | | | 10,482 | |
| Bear Stearns ARM Trust, Series 2006-1, Cl. A1, 4.91% [H15T1Y+225], 2/25/362 | | | 28,505 | | | | 29,304 | |
| CHL Mortgage Pass-Through Trust: | |
| Series 2005-17,Cl. 1A8, 5.50%, 9/25/35 | | | 456,145 | | | | 459,937 | |
| Series 2005-J4,Cl. A7, 5.50%, 11/25/35 | | | 399,280 | | | | 404,407 | |
| Citigroup Mortgage Loan Trust, Inc.: | |
| Series 2005-2,Cl. 1A3, 4.991%, 5/25/358 | | | 468,422 | | | | 478,122 | |
| Series 2006-AR1,Cl. 1A1, 4.70% [H15T1Y+240], 10/25/352 | | | 124,839 | | | | 128,147 | |
| Series 2009-8,Cl. 7A2, 4.991%, 3/25/361,8 | | | 5,600,342 | | | | 5,487,808 | |
| Series 2014-8,Cl. 1A2, 2.673% [US0001M+29], 7/20/361,2 | | | 3,400,000 | | | | 3,366,114 | |
| Connecticut Avenue Securities: | | | | | | | | |
| Series 2017-C01,Cl. 1M2, 5.954% [US0001M+355], 7/25/292 | | | 4,140,000 | | | | 4,386,164 | |
| Series 2017-C02,Cl. 2M1, 3.554% [US0001M+115], 9/25/292 | | | 655,298 | | | | 657,369 | |
| Series 2017-C06,Cl. 1M1, 3.154% [US0001M+75], 2/25/302 | | | 133,845 | | | | 133,872 | |
| Series 2017-C07,Cl. 1M1, 3.054% [US0001M+65], 5/28/302 | | | 437,280 | | | | 437,553 | |
| Series 2017-C07,Cl. 1M2, 4.804% [US0001M+240], 5/28/302 | | | 580,000 | | | | 590,113 | |
| Series 2018-C02,Cl. 2M1, 3.054% [US0001M+65], 8/25/302 | | | 173,237 | | | | 173,328 | |
| GSR Mortgage Loan Trust, Series 2005-AR4, Cl. 6A1, 4.664%, 7/25/358 | | | 7,829 | | | | 8,028 | |
| HomeBanc Mortgage Trust, Series 2005-3, Cl. A2, 2.714% [US0001M+31], 7/25/352 | | | 11,082 | | | | 11,099 | |
| Marble Arch Residential Securitisation No 4 plc, Series 4X, Cl. E1C, 4.682% [BP0003M+390], 3/20/402,4 | | | 1,741,000 | | | | 2,167,378 | |
| RALI Trust, Series 2006-QS13, Cl. 1A8, 6.00%, 9/25/36 | | | 11,637 | | | | 10,602 | |
| Residential Asset Securitization Trust, Series 2005-A6CB, Cl. A7, 6.00%, 6/25/35 | | | 1,616,206 | | | | 1,502,985 | |
| Stratton Mortgage Funding plc, Series 2019-1, Cl. A, 0.00%, 12/20/5018 | | | 6,000,000 | | | | 7,629,087 | |
| Structured Agency Credit Risk Debt Nts.: | | | | | | | | |
| Series 2013-DN2,Cl. M2, 6.654% [US0001M+425], 11/25/232 | | | 845,221 | | | | 914,116 | |
| Series 2014-DN1,Cl. M3, 6.904% [US0001M+450], 2/25/242 | | | 815,000 | | | | 905,681 | |
| Series 2014-DN2,Cl. M3, 6.004% [US0001M+360], 4/25/242 | | | 840,000 | | | | 894,167 | |
| Series 2014-DN3,Cl. M3, 6.404% [US0001M+400], 8/25/242 | | | 2,194,072 | | | | 2,342,977 | |
| | |
| 9 INVESCO OPPENHEIMER V.I. GLOBAL STRATEGIC INCOME FUND |
CONSOLIDATED STATEMENT OF INVESTMENTS Unaudited / Continued
| | | | | | | | | | |
| | | Principal Amount | | | Value | |
Residential (Continued) | | | | | | | | | | |
Structured Agency Credit Risk Debt Nts.: (Continued) | |
| Series 2014-HQ2,Cl. M3, 6.154% [US0001M+375], 9/25/242 | | $ | | | 915,000 | | | $ | 998,363 | |
| Series 2015-HQA2,Cl. M2, 5.204% [US0001M+280], 5/25/282 | | | | | 191,426 | | | | 194,175 | |
| Series 2016-DNA1,Cl. M2, 5.304% [US0001M+290], 7/25/282 | | | | | 213,796 | | | | 216,376 | |
| Series 2016-DNA3,Cl. M3, 7.404% [US0001M+500], 12/25/282 | | | | | 3,845,000 | | | | 4,232,802 | |
| Series 2016-DNA4,Cl. M3, 6.204% [US0001M+380], 3/25/292 | | | | | 5,570,000 | | | | 5,932,317 | |
| Series 2016-HQA3,Cl. M3, 6.254% [US0001M+385], 3/25/292 | | | | | 3,400,000 | | | | 3,639,664 | |
| Series 2016-HQA4,Cl. M3, 6.304% [US0001M+390], 4/25/292 | | | | | 4,580,000 | | | | 4,942,320 | |
| Series 2017-DNA1,Cl. M2, 5.654% [US0001M+325], 7/25/292 | | | | | 1,980,000 | | | | 2,094,991 | |
| Series 2017-HQA1,Cl. M1, 3.604% [US0001M+120], 8/25/292 | | | | | 1,009,640 | | | | 1,013,231 | |
| Series 2017-HQA2,Cl. M1, 3.204% [US0001M+80], 12/25/292 | | | | | 310,113 | | | | 310,298 | |
| Series 2017-HQA3,Cl. M1, 2.954% [US0001M+55], 4/25/302 | | | | | 519,491 | | | | 519,299 | |
| Series 2018-DNA1,Cl. M1, 2.854% [US0001M+45], 7/25/302 | | | | | 1,486,004 | | | | 1,483,504 | |
| Series 2018-DNA1,Cl. M2, 4.204% [US0001M+180], 7/25/302 | | | | | 1,200,000 | | | | 1,195,108 | |
| Towd Point Mortgage Funding 2019-Granite4 plc: | |
| 2.23%, 10/20/51 | | | | | 2,920,000 | | | | 3,721,155 | |
| 2.58%, 10/20/51 | | | | | 4,400,000 | | | | 5,612,039 | |
| WaMu Mortgage Pass-Through Certificates Trust: | |
| Series 2003-AR10,Cl. A7, 4.486%, 10/25/338 | | | | | 45,934 | | | | 47,277 | |
| Series 2005-AR16,Cl. 1A1, 4.243%, 12/25/358 | | | | | 6,725 | | | | 6,723 | |
| Wells Fargo Mortgage-Backed Securities Trust: | |
| Series 2005-AR1,Cl. 1A1, 5.081%, 2/25/358 | | | | | 525,757 | | | | 547,288 | |
| Series 2005-AR15,Cl. 1A2, 4.665%, 9/25/358 | | | | | 96,378 | | | | 96,069 | |
| Series 2005-AR15,Cl. 1A6, 4.665%, 9/25/358 | | | | | 1,183,761 | | | | 1,179,965 | |
| Series 2005-AR4,Cl. 2A2, 5.095%, 4/25/358 | | | | | 4,605 | | | | 4,698 | |
| Series 2006-AR10,Cl. 1A1, 5.008%, 7/25/368 | | | | | 118,006 | | | | 120,407 | |
| Series 2006-AR10,Cl. 5A5, 4.992%, 7/25/368 | | | | | 207,088 | | | | 210,842 | |
| Series 2006-AR2,Cl. 2A3, 4.991%, 3/25/368 | | | | | 922,273 | | | | 946,570 | |
| Series 2006-AR7,Cl. 2A4, 5.088%, 5/25/368 | | | | | 521,353 | | | | 543,415 | |
| | | | | | | | | | |
| | | | | | | | | 73,606,074 | |
| | | | | | | | | | |
| Total Mortgage-Backed Obligations (Cost $320,962,951) | | | | 326,015,831 | |
| | | | | |
U.S. Government Obligations—8.0% | |
United States Treasury Inflation-Protected Securities: | |
1.00%, 2/15/46-2/15/499,16,17
(Cost $114,336,844) | | | | | 114,233,434 | | | | 120,665,372 | |
| | | | | | | | | | |
Foreign Government Obligations—20.5% | |
Angola—0.0% | | | | | | | | | | |
| Republic of Angola, 9.375% Sr. Unsec. Nts., 5/8/481 | | | | | 735,000 | | | | 812,193 | |
Argentina—2.1% | | | | | | | | | | |
Argentine Republic: | | | | | | | | | | |
| Unsec. Nts., 4/30/2010 | | ARS | | | 289,100,000 | | | | 7,749,954 | |
| 0.236% Unsec. Nts., 7/31/2010 | | ARS | | | 550,000,000 | | | | 12,555,012 | |
| | | | | | | | | | | | |
| | | Principal Amount | | | Value | |
Argentina (Continued) | | | | | | | | | | | | |
| Argentine Republic: (Continued) | | | | | |
| 5.625% Sr. Unsec. Nts., 1/26/22 | | | $ | | | | 2,060,000 | | | $ | 1,740,721 | |
| 6.875% Sr. Unsec. Nts., 1/26/27 | | | | | | | 3,025,000 | | | | 2,435,503 | |
| 7.50% Sr. Unsec. Nts., 4/22/26 | | | | | | | 6,535,000 | | | | 5,515,605 | |
| 13.085% Unsec. Nts., 2/28/2010 | | | ARS | | | | 56,000,000 | | | | 1,296,130 | |
| 18.20% Unsec. Nts., 10/3/21 | | | ARS | | | | 9,285,000 | | | | 148,012 | |
| | | | | | | | | | | | |
| | | | | | | | | | | | 31,440,937 | |
| Brazil—0.5% | | | | | | | | | | | | |
| Federative Republic of Brazil: | | | | | |
| 10.00% Unsec. Nts., 1/1/29 | | | BRL | | | | 4,500,000 | | | | 1,368,341 | |
| 13.288% Unsec. Nts., 8/15/50 | | | BRL | | | | 900,000 | | | | 1,058,752 | |
| 18.447% Unsec. Nts., 5/15/45 | | | BRL | | | | 4,650,000 | | | | 5,307,191 | |
| | | | | | | | | | | | |
| | | | | | | | | | | | 7,734,284 | |
| Colombia—0.4% | | | | | | | | | | | | |
| Republic of Colombia: | | | | | | | | | | | | |
| Series B, 6.25% Bonds, 11/26/25 | | | COP | | | | 8,700,000,000 | | | | 2,814,622 | |
| Series B, 10.00% Bonds, 7/24/24 | | | COP | | | | 10,146,000,000 | | | | 3,829,644 | |
| | | | | | | | | | | | |
| | | | | | | | | | | 6,644,266 | |
| Cyprus—0.2% | | | | | | | | | | | | |
Republic of Cyprus, 2.75% Sr. Unsec. Nts., 5/3/494,18 | | | EUR | | | | 1,750,000 | | | | 2,471,272 | |
| Dominican Republic—0.2% | | | | | | | | | | | | |
| Dominican Republic: | | | | | | | | | | | | |
| 6.40% Unsec. Nts., 6/5/491 | | | | | | | 900,000 | | | | 942,792 | |
| 7.50% Sr. Unsec. Nts., 5/6/211 | | | | | | | 2,016,667 | | | | 2,127,583 | |
| | | | | | | | | | | | |
| | | | | | | | | | | | 3,070,375 | |
| Egypt—1.0% | | | | | | | | | | | | |
| Arab Republic of Egypt: | | | | | | | | | | | | |
| 4.75% Sr. Unsec. Nts., 4/16/261 | | | EUR | | | | 1,900,000 | | | | 2,176,434 | |
| 5.577% Sr. Unsec. Nts., 2/21/231 | | | | | | | 3,050,000 | | | | 3,105,791 | |
| 6.125% Sr. Unsec. Nts., 1/31/221 | | | | | | | 3,040,000 | | | | 3,140,761 | |
| 8.50% Sr. Unsec. Nts., 1/31/471 | | | | | | | 1,450,000 | | | | 1,540,616 | |
| 8.70% Sr. Unsec. Nts., 3/1/491 | | | | | | | 1,015,000 | | | | 1,094,586 | |
| 18.15% Unsec. Nts., 12/11/21 | | | EGP | | | | 45,000,000 | | | | 2,786,655 | |
| Series 3YR, 16.00% Unsec. Nts., 12/12/20 | | | EGP | | | | 29,000,000 | | | | 1,719,032 | |
| | | | | | | | | | | | |
| | | | | | | | | | | | 15,563,875 | |
| Fiji—0.1% | | | | | | | | | | | | |
Republic of Fiji, 6.625% Sr. Unsec. Nts., 10/2/204 | | | | | | | 1,535,000 | | | | 1,534,990 | |
| France—0.3% | | | | | | | | | | | | |
French Republic, 3.25% Bonds, 5/25/454 | | | EUR | | | | 2,297,000 | | | | 4,134,772 | |
| Gabon—0.1% | | | | | | | | | | | | |
Gabonese Republic, 6.375% Bonds, 12/12/241 | | | | | | | 1,665,000 | | | | 1,654,011 | |
| Ghana—0.3% | | | | | | | | | | | | |
| Republic of Ghana: | | | | | | | | | | | | |
| 8.125% Sr. Unsec. Nts., 3/26/321 | | | | | | | 2,020,000 | | | | 2,057,461 | |
| 8.627% Sr. Unsec. Nts., 6/16/491 | | | | | | | 1,440,000 | | | | 1,455,876 | |
| 8.95% Sr. Unsec. Nts., 3/26/511 | | | | | | | 870,000 | | | | 903,070 | |
| | | | | | | | | | | | |
| | | | | | | | | | | | 4,416,407 | |
| Greece—2.4% | | | | | | | | | | | | |
| Hellenic Republic: | | | | | | | | | | | | |
| Bonds, 10/15/428 | | | EUR | | | | 30,230,000 | | | | 149,426 | |
| 3.875% Sr. Unsec. Nts., 3/12/291,4 | | | EUR | | | | 4,400,000 | | | | 5,619,900 | |
| 3.90% Bonds, 1/30/334 | | | EUR | | | | 19,690,000 | | | | 25,130,397 | |
| 4.00% Bonds, 1/30/374 | | | EUR | | | | 4,095,000 | | | | 5,267,082 | |
| | | | | | | | | | | | |
| | | | | | | | | | | | 36,166,805 | |
| India—1.6% | | | | | | | | | | | | |
| Republic of India: | | | | | | | | | | | | |
| 7.17% Sr. Unsec. Nts., 1/8/28 | | | INR | | | | 385,000,000 | | | | 5,654,536 | |
| 7.59% Sr. Unsec. Nts., 1/11/26 | | | INR | | | | 600,000,000 | | | | 8,967,296 | |
| 7.72% Sr. Unsec. Nts., 5/25/25 | | | INR | | | | 15,000,000 | | | | 226,062 | |
| 8.20% Sr. Unsec. Nts., 9/24/25 | | | INR | | | | 415,600,000 | | | | 6,391,669 | |
| | |
| 10 INVESCO OPPENHEIMER V.I. GLOBAL STRATEGIC INCOME FUND |
| | | | | | | | | | |
| | | Principal Amount | | | Value | |
| India (Continued) | | | | | | | | | | |
Republic of India: (Continued)
8.24% Sr. Unsec. Nts., 2/15/27 | | INR | | | 215,000,000 | | | $ | 3,336,000 | |
| | | | | | | | | | |
| | | | | | | | | 24,575,563 | |
| Indonesia—2.1% | | | | | | | | | | |
| Perusahaan Penerbit SBSN Indonesia III: | | | | | | | | | | |
| 4.35% Sr. Unsec. Nts., 9/10/241 | | | | | 525,000 | | | | 555,324 | |
4.55% Sr. Unsec. Nts., 3/29/261 | | | | | 790,000 | | | | 845,798 | |
| Republic of Indonesia: | | | | | | | | | | |
| 3.85% Sr. Unsec. Nts., 7/18/271 | | | | | 440,000 | | | | 455,613 | |
| 4.125% Sr. Unsec. Nts., 1/15/251 | | | | | 490,000 | | | | 515,986 | |
| 8.125% Sr. Unsec. Nts., 5/15/24 | | IDR | | | 86,000,000,000 | | | | 6,428,313 | |
| 8.25% Sr. Unsec. Nts., 5/15/29 | | IDR | | | 29,100,000,000 | | | | 2,188,551 | |
| Series FR53, 8.25% Sr. Unsec. Nts., 7/15/21 | | IDR | | | 32,400,000,000 | | | | 2,349,777 | |
| Series FR56, 8.375% Sr. Unsec. Nts., 9/15/26 | | IDR | | | 104,095,000,000 | | | | 7,844,359 | |
| Series FR59, 7.00% Sr. Unsec. Nts., 5/15/27 | | IDR | | | 40,000,000,000 | | | | 2,771,604 | |
| Series FR74, 7.50% Sr. Unsec. Nts., 8/15/32 | | IDR | | | 112,480,000,000 | | | | 7,750,827 | |
| | | | | | | | | | |
| | | | | | | | | 31,706,152 | |
| Italy—1.8% | | | | | | | | | | |
| Italy Buoni Poliennali Del Tesoro: | | | | | | | | | | |
| 3.10% Sr. Unsec. Nts., 3/1/401,4 | | EUR | | | 9,905,000 | | | | 11,838,941 | |
| 4.75% Unsec. Nts., 9/1/441,4 | | EUR | | | 10,100,000 | | | | 15,151,248 | |
| | | | | | | | | | |
| | | | | | | | | 26,990,189 | |
| Ivory Coast—0.2% | | | | | | | | | | |
Republic of Cote d’Ivoire, 5.25% Sr. Unsec. Nts., 3/22/301 | | EUR | | | 2,110,000 | | | | 2,350,748 | |
| Malaysia—0.2% | | | | | | | | | | |
| Federation of Malaysia: | | | | | | | | | | |
| 3.733% Sr. Unsec. Nts., 6/15/28 | | MYR | | | 3,500,000 | | | | 852,866 | |
| 4.127% Sr. Unsec. Nts., 4/15/32 | | MYR | | | 7,600,000 | | | | 1,888,500 | |
| | | | | | | | | | |
| | | | | | | | | 2,741,366 | |
| Mexico—1.2% | | | | | | | | | | |
| United Mexican States: | | | | | | | | | | |
| Series M, 5.75% Bonds, 3/5/26 | | MXN | | | 84,445,000 | | | | 4,004,392 | |
| Series M20, 8.50% Sr. Unsec. Nts., 5/31/29 | | MXN | | | 256,700,000 | | | | 14,233,033 | |
| | | | | | | | | | |
| | | | | | | | | 18,237,425 | |
| Oman—0.4% | | | | | | | | | | |
| Sultanate of Oman: | | | | | | | | | | |
| 3.875% Sr. Unsec. Nts., 3/8/221 | | | | | 2,955,000 | | | | 2,912,516 | |
| 6.75% Sr. Unsec. Nts., 1/17/481 | | | | | 3,185,000 | | | | 2,818,620 | |
| | | | | | | | | | |
| | | | | | | | | 5,731,136 | |
| Panama—0.1% | | | | | | | | | | |
Panama Notas del Tesoro, 3.75% Sr. Unsec. Nts., 4/17/261 | | | | | 2,130,000 | | | | 2,215,632 | |
| Paraguay—0.2% | | | | | | | | | | |
| Republic of Paraguay: | | | | | | | | | | |
| 4.625% Sr. Unsec. Nts., 1/25/231 | | | | | 3,050,000 | | | | 3,211,680 | |
| 5.40% Sr. Unsec. Nts., 3/30/501 | | | | | 530,000 | | | | 589,962 | |
| | | | | | | | | | |
| | | | | | | | | 3,801,642 | |
| Peru—0.0% | | | | | | | | | | |
Republic of Peru, 5.40% Sr. Unsec. Nts., 8/12/341,4 | | PEN | | | 455,000 | | | | 141,304 | |
| Russia—0.2% | | | | | | | | | | |
Russian Federation, 4.875% Sr. Unsec. Nts., 9/16/231 | | | | | 3,050,000 | | | | 3,267,523 | |
| Saudi Arabia—0.1% | | | | | | | | | | |
| Kingdom of Saudi Arabia, 4.375% Sr. Unsec. Nts., 4/16/291 | | | | | 1,345,000 | | | | 1,456,136 | |
| | | | | | | | | | |
| | | Principal Amount | | | Value | |
| Senegal—0.1% | | | | | | | | | | |
| Republic of Senegal: | | | | | | | | | | |
| 6.25% Unsec. Nts., 5/23/331 | | $ | | | 460,000 | | | $ | 446,112 | |
| 6.75% Sr. Unsec. Nts., 3/13/481 | | | | | 835,000 | | | | 786,383 | |
| | | | | | | | | | |
| | | | | | | | | 1,232,495 | |
| Serbia—0.0% | | | | | | | | | | |
| Republic of Serbia, 4.875% Sr. Unsec. Nts., 2/25/201 | | | | | 395,000 | | | | 400,460 | |
| South Africa—2.3% | | | | | | | | | | |
| Republic of South Africa: | | | | | | | | | | |
| Series 2023, 7.75% Sr. Unsec. Nts., 2/28/23 | | ZAR | | | 22,500,000 | | | | 1,622,604 | |
| Series 2030, 8.00% Sr. Unsec. Nts., 1/31/30 | | ZAR | | | 159,100,000 | | | | 10,676,377 | |
| Series 2037, 8.50% Sr. Unsec. Nts., 1/31/37 | | ZAR | | | 107,000,000 | | | | 6,946,546 | |
| Series 2048, 8.75% Sr. Unsec. Nts., 2/28/48 | | ZAR | | | 60,000,000 | | | | 3,841,534 | |
| Series R186, 10.50% Sr. Unsec. Nts., 12/21/26 | | ZAR | | | 133,675,000 | | | | 10,734,809 | |
| Series R214, 6.50% Sr. Unsec. Nts., 2/28/41 | | ZAR | | | 25,000,000 | | | | 1,270,412 | |
| | | | | | | | | | |
| | | | | | | | | 35,092,282 | |
| Spain—0.4% | | | | | | | | | | |
Kingdom of Spain, 0.60% Bonds, 10/31/291,4 | | EUR | | | 4,990,000 | | | | 5,761,697 | |
| Sri Lanka—0.8% | | | | | | | | | | |
| Democratic Socialist Republic of Sri Lanka: | | | | | | | | | | |
| 5.75% Sr. Unsec. Nts., 4/18/231 | | | | | 1,450,000 | | | | 1,439,944 | |
| 5.875% Sr. Unsec. Nts., 7/25/221 | | | | | 1,350,000 | | | | 1,356,530 | |
| 6.25% Sr. Unsec. Nts., 10/4/201 | | | | | 4,760,000 | | | | 4,825,418 | |
| 6.35% Sr. Unsec. Nts., 6/28/241 | | | | | 1,210,000 | | | | 1,209,770 | |
| 7.55% Sr. Unsec. Nts., 3/28/301 | | | | | 1,420,000 | | | | 1,427,520 | |
| 7.85% Sr. Unsec. Nts., 3/14/291 | | | | | 1,135,000 | | | | 1,173,116 | |
| | | | | | | | | | |
| | | | | | | | | 11,432,298 | |
| Thailand—0.5% | | | | | | | | | | |
Kingdom of Thailand, 2.125% Sr. Unsec. Nts., 12/17/26 | | THB | | | 210,000,000 | | | | 6,915,258 | |
| Turkey—0.5% | | | | | | | | | | |
| Republic of Turkey: | | | | | | | | | | |
| 8.50% Bonds, 9/14/22 | | TRY | | | 15,200,000 | | | | 2,092,117 | |
| 10.70% Bonds, 2/17/21 | | TRY | | | 22,045,000 | | | | 3,395,931 | |
| 12.40% Bonds, 3/8/28 | | TRY | | | 13,500,000 | | | | 1,939,729 | |
| | | | | | | | | | |
| | | | | | | | | 7,427,777 | |
| Ukraine—0.2% | | | | | | | | | | |
Ukraine, 7.75% Sr. Unsec. Nts., 9/1/264 | | | | | 2,410,000 | | | | 2,489,340 | |
| Uruguay—0.0% | | | | | | | | | | |
| Oriental Republic of Uruguay, 9.875% Sr. Unsec. Nts., 6/20/221 | | UYU | | | 13,555,000 | | | | 383,378 | |
| | | | | | | | | | |
| Total Foreign Government Obligations (Cost $310,265,930) | | | | 309,993,988 | |
| | | | | | | | | | |
Corporate Loans—0.4% | | | | | | | | | | |
| Albertson’s LLC, Sr. Sec. Credit Facilities 1st Lien Term Loan, Tranche B7, 5.439% [LIBOR12+300], 11/17/252 | | | | | 271,687 | | | | 270,668 | |
| Aleris International, Inc., Sr. Sec. Credit Facilities 1st Lien Term Loan, 7.233% [LIBOR12+475], 2/27/232 | | | | | 544,500 | | | | 545,861 | |
| American Greetings Corp., Sr. Sec. Credit Facilities 1st Lien Term Loan, Tranche B, 6.983% [LIBOR12+450], 4/6/242 | | | | | 539,326 | | | | 538,822 | |
| Claire’s Stores, Inc., Sr. Sec. Credit Facilities Term Loan, 9.938% 10/12/388 | | | | | 37,137 | | | | 37,137 | |
| Dun & Bradstreet Corp. (The), Sr. Sec. Credit Facilities 1st Lien Term Loan, Tranche B, 7.479% 2/6/268 | | | | | 860,000 | | | | 861,346 | |
| | |
| 11 INVESCO OPPENHEIMER V.I. GLOBAL STRATEGIC INCOME FUND |
CONSOLIDATED STATEMENT OF INVESTMENTSUnaudited / Continued
| | | | | | | | | | |
| | | Principal Amount | | | Value | |
Corporate Loans (Continued) | | | | | | | | | | |
| iHeartCommunications, Inc, Sr. Sec. | | | | | | | | | | |
| Credit Facilities 1st Lien Exit Term Loan, 6.579% 5/1/268 | | $ | | | 594,854 | | | $ | 596,297 | |
| KIK Custom Products, Inc., Sr. Sec. Credit Facilities 1st Lien Term Loan, Tranche B, 6.402% [LIBOR12+400], 5/15/232 | | | | | 570,000 | | | | 539,006 | |
| Murray Energy Corp., Sr. Sec. Credit Facilities 1st Lien Term Loan, Tranche B2, 9.772% [LIBOR4+725], 10/17/222 | | | | | 1,567,143 | | | | 1,059,130 | |
| Neiman Marcus Group Ltd. LLC, Sr. Sec. Credit Facilities 1st Lien Term Loan, 8.921% 10/25/238,11 | | | | | 673,522 | | | | 591,016 | |
PetSmart, Inc, Sr. Sec. Credit Facilities 1st Lien Term Loan, Tranche B, 6.72% | | | | | | | | |
| [LIBOR12+400], 3/11/222,7 | | | | | 466,126 | | | | 454,983 | |
| Scientific Games International, Inc., | | | | | | | | | | |
| Sr. Sec. Credit Facilities 1st Lien Term | | | | | | | | | | |
| Loan, Tranche B5,5.189%-5.233% | | | | | | | | | | |
| [LIBOR6+275], 8/14/242 | | | | | 850,693 | | | | 838,936 | |
| Windstream Services LLC, Sr. Sec. Credit | | | | | | | | |
| Facilities Term Loan, Tranche B6, 8.50% | | | | | | | | | | |
| [PRIME4+500], 3/29/212,12 | | | | | 306,086 | | | | 315,651 | |
| | | | | | | | | | |
| Total Corporate Loans (Cost $7,029,845) | | | | | | | | | 6,648,853 | |
| | | | | | | | | | |
| Corporate Bonds and Notes—41.4% | |
| Consumer Discretionary—6.4% | |
| Auto Components—0.3% | |
American Axle & Manufacturing, Inc., 6.25% Sr. Unsec. Nts., 4/1/25 | | | | | 1,245,000 | | | | 1,243,444 | |
Dana Financing Luxembourg Sarl, 6.50% Sr. Unsec. Nts., 6/1/261 | | | | | 705,000 | | | | 744,656 | |
| Delphi Technologies plc, 5.00% Sr. | | | | | | | | | | |
| Unsec. Nts., 10/1/251 | | | | | 285,000 | | | | 254,362 | |
Goodyear Tire & Rubber Co. (The), 5.00% Sr. Unsec. Nts., 5/31/26 | | | | | 520,000 | | | | 514,150 | |
| Grinding Media,Inc./Moly-Cop AltaSteel | | | | | | | | | | |
| Ltd., 7.375% Sr. Sec. Nts., 12/15/231 | | | | | 345,000 | | | | 332,063 | |
| Panther BF Aggregator 2 LP/Panther | | | | | | | | | | |
| Finance Co., Inc.: | | | | | | | | | | |
| 6.25% Sr. Sec. Nts., 5/15/261 | | | | | 265,000 | | | | 275,931 | |
| 8.50% Sr. Unsec. Nts., 5/15/271 | | | | | 570,000 | | | | 588,525 | |
| | | | | | | | | | |
| | | | | | | | | 3,953,131 | |
| Automobiles—0.2% | | | | | | | | | | |
| Ford Motor Credit Co. LLC, 5.75% Sr. | | | | | | | | | | |
| Unsec. Nts., 2/1/21 | | | | | 1,660,000 | | | | 1,728,640 | |
General Motors Financial Co., Inc., 4.20% Sr. Unsec. Nts., 11/6/21 | | | | | 1,460,000 | | | | 1,503,845 | |
Tesla, Inc., 5.30% Sr. Unsec. Nts., 8/15/251 | | | | | 285,000 | | | | 251,156 | |
| | | | | | | | | | |
| | | | | | | | | 3,483,641 | |
| Distributors—0.0% | | | | | | | | | | |
LKQ Corp., 4.75% Sr. Unsec. Nts., 5/15/23 | | | | | 387,000 | | | | 392,805 | |
| Diversified Consumer Services—0.1% | |
| Cengage Learning, Inc., 9.50% Sr. | | | | | | | | | | |
| Unsec. Nts., 6/15/241 | | | | | 140,000 | | | | 134,050 | |
EMC Corp., 2.65% Sr. Unsec. Nts., 6/1/20 | | | | | 420,000 | | | | 417,749 | |
| Service Corp. International, 4.625% Sr. | | | | | | | | | | |
| Unsec. Nts., 12/15/27 | | | | | 290,000 | | | | 297,250 | |
| | | | | | | | | | |
| | | | | | | | | 849,049 | |
| Entertainment—0.3% | | | | | | | | | | |
| AMC Entertainment Holdings, Inc.: | | | | | | | | | | |
| 5.75% Sr. Unsec. Nts., 6/15/25 | | | | | 705,000 | | | | 655,685 | |
| 5.875% Sr. Unsec. Nts., 11/15/26 | | | | | 760,000 | | | | 684,000 | |
| Cinemark USA, Inc., 4.875% Sr. Unsec. Nts., 6/1/23 | | | | | 495,000 | | | | 502,425 | |
| | | | | | | | | | |
| | | Principal Amount | | | Value | |
| Entertainment (Continued) | | | | | | | | | | |
Lions Gate Capital Holdings LLC, 5.875% Sr. Unsec. Nts., 11/1/241 | | $ | | | 930,000 | | | $ | 957,900 | |
| Live Nation Entertainment, Inc., 5.625% | | | | | | | | | | |
| Sr. Unsec. Nts., 3/15/261 | | | | | 550,000 | | | | 578,187 | |
Netflix, Inc., 5.875% Sr. Unsec. Nts., 11/15/28 | | | | | 275,000 | | | | 305,146 | |
| Sirius XM Radio, Inc., 5.375% Sr. Unsec. Nts., 7/15/261 | | | | | 665,000 | | | | 691,600 | |
| | | | | | | | | | |
| | | | | | | | | 4,374,943 | |
| Hotels, Restaurants & Leisure—1.7% | |
| 1011778 B.C. ULC/New Red Finance, Inc.: | | | | | | | | | | |
| 4.25% Sr. Sec. Nts., 5/15/241 | | | | | 785,000 | | | | 795,794 | |
| 5.00% Sec. Nts., 10/15/251 | | | | | 1,335,000 | | | | 1,348,750 | |
| Aramark Services, Inc.: | | | | | | | | | | |
| 4.75% Sr. Unsec. Nts., 6/1/26 | | | | | 745,000 | | | | 759,900 | |
| 5.00% Sr. Unsec. Nts., 2/1/281 | | | | | 815,000 | | | | 840,469 | |
| Boyd Gaming Corp.: | | | | | | | | | | |
| 6.00% Sr. Unsec. Nts., 8/15/26 | | | | | 690,000 | | | | 727,950 | |
| 6.375% Sr. Unsec. Nts., 4/1/26 | | | | | 220,000 | | | | 233,559 | |
| Caesars Resort Collection LLC/CRC | | | | | | | | | | |
| Finco, Inc., 5.25% Sr. Unsec. Nts., 10/15/251 | | | | | 820,000 | | | | 822,050 | |
| CEC Entertainment, Inc., 8.00% Sr. | | | | | | | | | | |
| Unsec. Nts., 2/15/22 | | | | | 385,000 | | | | 389,331 | |
| Cedar Fair LP, 5.25% Sr. Unsec. Nts., 7/15/291 | | | | | 440,000 | | | | 450,252 | |
| Downstream Development Authority of the Quapaw Tribe of Oklahoma, 10.50% | | | | | | | | | | |
| Sr. Sec. Nts., 2/15/231 | | | | | 330,000 | | | | 350,625 | |
| Eldorado Resorts, Inc., 6.00% Sr. Unsec. Nts., 4/1/25 | | | | | 430,000 | | | | 454,187 | |
| Golden Nugget, Inc.: | | | | | | | | | | |
| 6.75% Sr. Unsec. Nts., 10/15/243 | | | | | 1,370,000 | | | | 1,414,525 | |
| 8.75% Sr. Unsec. Nts., 10/1/251 | | | | | 1,160,000 | | | | 1,220,900 | |
| Hilton Domestic Operating Co., Inc.: | | | | | | | | | | |
| 4.25% Sr. Unsec. Nts., 9/1/24 | | | | | 425,000 | | | | 432,437 | |
| 4.875% Sr. Unsec. Nts., 1/15/301 | | | | | 295,000 | | | | 304,367 | |
| 5.125% Sr. Unsec. Nts., 5/1/26 | | | | | 550,000 | | | | 575,437 | |
| Hilton Grand Vacations Borrower LLC/ | | | | | | | | | | |
Hilton Grand Vacations Borrower, Inc., 6.125% Sr. Unsec. Nts., 12/1/24 | | | | | 700,000 | | | | 750,750 | |
International Game Technology plc, 6.25% Sr. Sec. Nts., 2/15/221 | | | | | 2,595,000 | | | | 2,753,944 | |
| IRB Holding Corp., 6.75% Sr. Unsec. | | | | | | | | | | |
| Nts., 2/15/261 | | | | | 270,000 | | | | 269,325 | |
| KFC Holding Co./Pizza Hut Holdings LLC/ Taco Bell of America LLC: | | | | | | | | | | |
| 4.75% Sr. Unsec. Nts., 6/1/271 | | | | | 435,000 | | | | 446,962 | |
| 5.25% Sr. Unsec. Nts., 6/1/261 | | | | | 995,000 | | | | 1,045,984 | |
| Melco Resorts Finance Ltd., 4.875% Sr. | | | | | | | | | | |
| Unsec. Nts., 6/6/251 | | | | | 1,495,000 | | | | 1,488,090 | |
| MGM Growth Properties Operating | | | | | | | | | | |
| Partnership LP/MGP Finance Co.-Issuer, | | | | | | | | | | |
| Inc., 5.625% Sr. Unsec. Nts., 5/1/24 | | | | | 925,000 | | | | 1,000,156 | |
| MGM Resorts International: | �� | | | | | | | | | |
| 5.75% Sr. Unsec. Nts., 6/15/25 | | | | | 510,000 | | | | 557,165 | |
| 6.00% Sr. Unsec. Nts., 3/15/23 | | | | | 775,000 | | | | 841,844 | |
| 6.625% Sr. Unsec. Nts., 12/15/21 | | | | | 405,000 | | | | 438,412 | |
Mohegan Gaming & Entertainment, 7.875% Sr. Unsec. Nts., 10/15/241 | | | | | 700,000 | | | | 688,625 | |
| Penn National Gaming, Inc., 5.625% Sr. | | | | | | | | | | |
| Unsec. Nts., 1/15/271 | | | | | 725,000 | | | | 717,750 | |
| Scientific Games International, Inc.: | | | | | | | | | | |
| 8.25% Sr. Unsec. Nts., 3/15/261 | | | | | 570,000 | | | | 599,919 | |
| 10.00% Sr. Unsec. Nts., 12/1/22 | | | | | 934,000 | | | | 983,035 | |
| Six Flags Entertainment Corp., 4.875% | | | | | | | | | | |
| Sr. Unsec. Nts., 7/31/241 | | | | | 500,000 | | | | 508,750 | |
| | |
| 12 INVESCO OPPENHEIMER V.I. GLOBAL STRATEGIC INCOME FUND |
| | | | | | | | | | |
| | | Principal Amount | | | Value | |
| Hotels, Restaurants & Leisure (Continued) | | | | | |
| Viking Cruises Ltd., 5.875% Sr. Unsec. | | | | | | | | | | |
| Nts., 9/15/271 | | $ | | | 385,000 | | | $ | 390,775 | |
| Wynn Las Vegas LLC/Wynn Las Vegas | | | | | | | | | | |
| Capital Corp.: | | | | | | | | | | |
| 5.25% Sr. Unsec. Nts., 5/15/271 | | | | | 390,000 | | | | 391,950 | |
| 5.50% Sr. Unsec. Nts., 3/1/251 | | | | | 565,000 | | | | 584,945 | |
| Wynn Macau Ltd.: | | | | | | | | | | |
| 4.875% Sr. Unsec. Nts., 10/1/241 | | | | | 285,000 | | | | 280,013 | |
| 5.50% Sr. Unsec. Nts., 10/1/271 | | | | | 135,000 | | | | 131,625 | |
| | | | | | | | | | |
| | | | | | | | | 25,990,552 | |
| Household Durables—0.9% | | | | | | | | | | |
| Ardagh Packaging Finance plc/Ardagh | | | | | | | | | | |
| Holdings USA, Inc.: | | | | | | | | | | |
| 4.25% Sr. Sec. Nts., 9/15/221 | | | | | 365,000 | | | | 369,562 | |
| 4.625% Sr. Sec. Nts., 5/15/231 | | | | | 145,000 | | | | 147,719 | |
| Beazer Homes USA, Inc.: | | | | | | | | | | |
| 5.875% Sr. Unsec. Nts., 10/15/27 | | | | | 365,000 | | | | 318,353 | |
| 6.75% Sr. Unsec. Nts., 3/15/25 | | | | | 1,610,000 | | | | 1,547,612 | |
| 7.25% Sr. Unsec. Nts., 2/1/23 | | | | | 43,000 | | | | 42,355 | |
| Lennar Corp.: | | | | | | | | | | |
| 4.50% Sr. Unsec. Nts., 4/30/24 | | | | | 405,000 | | | | 426,769 | |
| 4.75% Sr. Unsec. Nts., 4/1/21 | | | | | 2,925,000 | | | | 3,009,094 | |
| 4.75% Sr. Unsec. Nts., 5/30/25 | | | | | 1,005,000 | | | | 1,069,069 | |
| 5.00% Sr. Unsec. Nts., 6/15/27 | | | | | 430,000 | | | | 453,650 | |
| 5.25% Sr. Unsec. Nts., 6/1/26 | | | | | 295,000 | | | | 315,281 | |
| LGI Homes, Inc., 6.875% Sr. Unsec. Nts., 7/15/261 | | | | | 285,000 | | | | 292,837 | |
| M/I Homes, Inc., 5.625% Sr. Unsec. Nts., 8/1/25 | | | | | 795,000 | | | | 810,900 | |
| PulteGroup, Inc., 5.50% Sr. Unsec. Nts., 3/1/26 | | | | | 740,000 | | | | 801,975 | |
| Resideo Funding, Inc., 6.125% Sr. Unsec. Nts., 11/1/261 | | | | | 615,000 | | | | 641,138 | |
Taylor Morrison Communities, Inc., 6.625% Sr. Unsec. Nts., 5/15/22 | | | | | 1,240,000 | | | | 1,283,400 | |
| Taylor Morrison Communities, Inc./Taylor Morrison Holdings II, Inc., 5.875% Sr. Unsec. Nts., 4/15/231 | | | | | 560,000 | | | | 590,800 | |
| William Lyon Homes, Inc.: | | | | | | | | | | |
| 5.875% Sr. Unsec. Nts., 1/31/25 | | | | | 775,000 | | | | 769,188 | |
| 6.00% Sr. Unsec. Nts., 9/1/23 | | | | | 550,000 | | | | 561,000 | |
| | | | | | | | | | |
| | | | | | | | | 13,450,702 | |
| Internet & Catalog Retail—0.0% | | | | | | | | | | |
| Getty Images, Inc., 9.75% Sr. Unsec. | | | | | | | | | | |
| Nts., 3/1/271 | | | | | 70,000 | | | | 72,275 | |
| GrubHub Holdings, Inc., 5.50% Sr. | | | | | | | | | | |
| Unsec. Nts., 7/1/271 | | | | | 595,000 | | | | 611,578 | |
| | | | | | | | | | |
| | | | | | | | | 683,853 | |
| Leisure Equipment & Products—0.1% | |
| Mattel, Inc.: | | | | | | | | | | |
| 4.35% Sr. Unsec. Nts., 10/1/20 | | | | | 405,000 | | | | 409,556 | |
| 6.75% Sr. Unsec. Nts., 12/31/251 | | | | | 1,410,000 | | | | 1,454,063 | |
| | | | | | | | | | |
| | | | | | | | | 1,863,619 | |
| Media—2.2% | | | | | | | | | | |
| Altice Financing SA: | | | | | | | | | | |
| 6.625% Sr. Sec. Nts., 2/15/231 | | | | | 205,000 | | | | 210,637 | |
| 7.50% Sr. Sec. Nts., 5/15/261 | | | | | 770,000 | | | | 775,852 | |
| Altice Finco SA, 8.125% Sec. Nts., 1/15/241 | | | | | 695,000 | | | | 719,325 | |
| Altice France SA: | | | | | | | | | | |
| 7.375% Sr. Sec. Nts., 5/1/261 | | | | | 1,025,000 | | | | 1,053,188 | |
| 8.125% Sr. Sec. Nts., 2/1/271 | | | | | 560,000 | | | | 589,400 | |
| Altice Luxembourg SA: | | | | | | | | | | |
| 7.625% Sr. Unsec. Nts., 2/15/251 | | | | | 285,000 | | | | 269,147 | |
| 10.50% Sr. Unsec. Nts., 5/15/271 | | | | | 575,000 | | | | 591,300 | |
| AMC Networks, Inc.: | | | | | | | | | | |
| 4.75% Sr. Unsec. Nts., 8/1/25 | | | | | 530,000 | | | | 539,937 | |
| | | | | | | | | | |
| | | Principal Amount | | | Value | |
| Media (Continued) | | | | | | | | | | |
AMC Networks, Inc.: (Continued) 5.00% Sr. Unsec. Nts., 4/1/24 | | $ | | | 275,000 | | | $ | 282,906 | |
| Belo Corp., 7.75% Sr. Unsec. Nts., 6/1/27 | | | | | 1,362,000 | | | | 1,505,010 | |
| Block Communications, Inc., 6.875% Sr. | | | | | | | | | | |
| Unsec. Nts., 2/15/251 | | | | | 460,000 | | | | 481,850 | |
| Cablevision Systems Corp., 5.875% Sr. | | | | | | | | | | |
| Unsec. Nts., 9/15/22 | | | | | 415,000 | | | | 440,419 | |
| CCO Holdings LLC/CCO Holdings Capital Corp.: | | | | | | | | | | |
| 4.00% Sr. Unsec. Nts., 3/1/231 | | | | | 265,000 | | | | 266,242 | |
| 5.00% Sr. Unsec. Nts., 2/1/281 | | | | | 840,000 | | | | 859,908 | |
| 5.125% Sr. Unsec. Nts., 5/1/231 | | | | | 560,000 | | | | 573,125 | |
| 5.125% Sr. Unsec. Nts., 5/1/271 | | | | | 1,040,000 | | | | 1,079,374 | |
| 5.375% Sr. Unsec. Nts., 5/1/251 | | | | | 205,000 | | | | 212,431 | |
| 5.75% Sr. Unsec. Nts., 2/15/261 | | | | | 1,315,000 | | | | 1,382,394 | |
| 5.875% Sr. Unsec. Nts., 4/1/241 | | | | | 325,000 | | | | 340,438 | |
| 5.875% Sr. Unsec. Nts., 5/1/271 | | | | | 205,000 | | | | 216,787 | |
Clear Channel Commuications, Inc., 9.00% Sr. Nts., 12/15/1912,13 | | | | | 1,455,000 | | | | 0 | |
| Clear Channel International BV, 8.75% | | | | | | | | | | |
| Sr. Unsec. Nts., 12/15/203 | | | | | 265,000 | | | | 272,287 | |
| Clear Channel Worldwide Holdings, | | | | | | | | | | |
| Inc., Series B, 6.50% Sr. Unsec. Nts., 11/15/22 | | | | | 1,465,000 | | | | 1,497,962 | |
| CSC Holdings LLC: | | | | | | | | | | |
| 5.25% Sr. Unsec. Nts., 6/1/24 | | | | | 715,000 | | | | 744,494 | |
| 5.375% Sr. Unsec. Nts., 7/15/231 | | | | | 285,000 | | | | 293,550 | |
| 5.50% Sr. Unsec. Nts., 5/15/261 | | | | | 205,000 | | | | 215,496 | |
| 5.50% Sr. Unsec. Nts., 4/15/271 | | | | | 560,000 | | | | 589,400 | |
| 6.50% Sr. Unsec. Nts., 2/1/291 | | | | | 285,000 | | | | 311,541 | |
| 10.875% Sr. Unsec. Nts., 10/15/251 | | | | | 722,000 | | | | 829,401 | |
Cumulus Media New Holdings, Inc., 6.75% Sr. Sec. Nts., 7/1/261 | | | | | 300,000 | | | | 299,692 | |
| DISH DBS Corp.: | | | | | | | | | | |
| 5.125% Sr. Unsec. Nts., 5/1/20 | | | | | 285,000 | | | | 287,135 | |
| 5.875% Sr. Unsec. Nts., 7/15/22 | | | | | 430,000 | | | | 438,063 | |
| 5.875% Sr. Unsec. Nts., 11/15/24 | | | | | 2,280,000 | | | | 2,166,000 | |
| 6.75% Sr. Unsec. Nts., 6/1/21 | | | | | 285,000 | | | | 299,962 | |
| 7.75% Sr. Unsec. Nts., 7/1/26 | | | | | 250,000 | | | | 245,625 | |
| Gray Television, Inc.: | | | | | | | | | | |
| 5.125% Sr. Unsec. Nts., 10/15/241 | | | | | 745,000 | | | | 760,831 | |
| 5.875% Sr. Unsec. Nts., 7/15/261 | | | | | 1,010,000 | | | | 1,050,400 | |
| iHeartCommunications, Inc.: | | | | | | | | | | |
| 6.375% Sr. Sec. Nts., 5/1/26 | | | | | 135,967 | | | | 144,975 | |
| 8.375% Sr. Unsec. Nts., 5/1/27 | | | | | 246,439 | | | | 259,382 | |
| MDC Partners, Inc., 6.50% Sr. Unsec. | | | | | | | | | | |
| Nts., 5/1/241 | | | | | 255,000 | | | | 235,610 | |
| Nexstar Broadcasting, Inc., 5.625% Sr. | | | | | | | | | | |
| Unsec. Nts., 8/1/241 | | | | | 1,105,000 | | | | 1,147,498 | |
| Nexstar Escrow, Inc., 5.625% Sr. Unsec. | | | | | | | | | | |
| Nts., 7/15/271,7 | | | | | 280,000 | | | | 287,700 | |
| Sinclair Television Group, Inc., 5.625% | | | | | | | | | | |
| Sr. Unsec. Nts., 8/1/241 | | | | | 1,010,000 | | | | 1,035,250 | |
| Sirius XM Radio, Inc.: | | | | | | | | | | |
| 4.625% Sr. Unsec. Nts., 7/15/241,7 | | | | | 580,000 | | | | 593,639 | |
| 5.50% Sr. Unsec. Nts., 7/1/291 | | | | | 655,000 | | | | 672,122 | |
| TEGNA, Inc., 5.50% Sr. Unsec. Nts., 9/15/241 | | | | | 650,000 | | | | 669,500 | |
| Townsquare Media, Inc., 6.50% Sr. | | | | | | | | | | |
| Unsec. Nts., 4/1/231 | | | | | 265,000 | | | | 262,019 | |
| Tribune Media Co., 5.875% Sr. Unsec. | | | | | | | | | | |
| Nts., 7/15/22 | | | | | 725,000 | | | | 741,240 | |
| Univision Communications, Inc.: | | | | | | | | | | |
| 5.125% Sr. Sec. Nts., 5/15/231 | | | | | 245,000 | | | | 240,712 | |
| 5.125% Sr. Sec. Nts., 2/15/251 | | | | | 1,435,000 | | | | 1,372,219 | |
| Virgin Media Secured Finance plc: | | | | | | | | | | |
| 5.25% Sr. Sec. Nts., 1/15/21 | | | | | 415,000 | | | | 434,298 | |
| 5.50% Sr. Sec. Nts., 8/15/261 | | | | | 705,000 | | | | 732,319 | |
| | |
| 13 INVESCO OPPENHEIMER V.I. GLOBAL STRATEGIC INCOME FUND |
CONSOLIDATED STATEMENT OF INVESTMENTSUnaudited / Continued
| | | | | | | | |
| | | Principal Amount | | | Value |
| Media (Continued) | | | | | | | | |
| Virgin Media Secured Finance plc: (Continued) | | | | | | | | |
| 5.50% Sr. Sec. Nts., 5/15/291 | | $ | 295,000 | | | $ | 299,794 | |
Ziggo BV, 5.50% Sr. Sec. Nts., 1/15/271 | | | 1,190,000 | | | | 1,216,430 | |
| | | | | | | | |
| | | | | | | 33,036,216 | |
| | | | | | | | |
| Specialty Retail—0.5% | |
| Freedom Mortgage Corp.: | | | | | | | | |
| 8.125% Sr. Unsec. Nts., 11/15/241 | | | 400,000 | | | | 342,000 | |
| 8.25% Sr. Unsec. Nts., 4/15/251 | | | 825,000 | | | | 713,625 | |
| GameStop Corp., 6.75% Sr. Unsec. Nts., 3/15/211 | | | 1,180,000 | | | | 1,159,350 | |
| L Brands, Inc.: | | | | | | | | |
| 5.25% Sr. Unsec. Nts., 2/1/28 | | | 270,000 | | | | 248,063 | |
| 6.875% Sr. Unsec. Nts., 11/1/35 | | | 1,775,000 | | | | 1,587,489 | |
| 7.50% Sr. Unsec. Nts., 6/15/29 | | | 595,000 | | | | 595,586 | |
| Lithia Motors, Inc., 5.25% Sr. Unsec. Nts., 8/1/251 | | | 530,000 | | | | 547,888 | |
| Michaels Stores, Inc., 8.00% Sr. Unsec. Nts., 7/15/271,7 | | | 585,000 | | | | 584,497 | |
| Party City Holdings, Inc., 6.625% Sr. Unsec. Nts., 8/1/261 | | | 560,000 | | | | 544,600 | |
| PetSmart, Inc.: | | | | | | | | |
| 5.875% Sr. Sec. Nts., 6/1/251 | | | 700,000 | | | | 682,500 | |
| 7.125% Sr. Unsec. Nts., 3/15/231 | | | 285,000 | | | | 268,612 | |
| Sonic Automotive, Inc., 6.125% Sr. Unsec. Nts., 3/15/27 | | | 650,000 | | | | 641,875 | |
| | | | | | | | |
| | | | | | | 7,916,085 | |
| | | | | | | | |
| Textiles, Apparel & Luxury Goods—0.1% | |
| Hanesbrands, Inc.: | | | | | | | | |
| 4.625% Sr. Unsec. Nts., 5/15/241 | | | 380,000 | | | | 396,416 | |
| 4.875% Sr. Unsec. Nts., 5/15/261 | | | 405,000 | | | | 422,168 | |
| William Carter Co. (The), 5.625% Sr. Unsec. Nts., 3/15/271 | | | 285,000 | | | | 299,606 | |
| | | | | | | | |
| | | | | | | 1,118,190 | |
| | | | | | | | |
| Consumer Staples—1.1% | |
| Beverages—0.1% | | | | | | | | |
| Coca-Cola Icecek AS, 4.215% Sr. Unsec. Nts., 9/19/241 | | | 1,510,000 | | | | 1,504,715 | |
| Food & Staples Retailing—0.4% | |
| Albertsons Cos. LLC/Safeway, Inc./New | | | | | | | | |
| Albertsons LP/Albertson’s LLC: | | | | | | | | |
| 5.75% Sr. Unsec. Nts., 3/15/25 | | | 315,000 | | | | 318,937 | |
| 6.625% Sr. Unsec. Nts., 6/15/24 | | | 1,035,000 | | | | 1,077,694 | |
| 7.50% Sr. Unsec. Nts., 3/15/261 | | | 285,000 | | | | 305,662 | |
| Fresh Market, Inc. (The), 9.75% Sr. Sec. Nts., 5/1/231 | | | 820,000 | | | | 561,700 | |
| Ingles Markets, Inc., 5.75% Sr. Unsec. Nts., 6/15/23 | | | 688,000 | | | | 706,920 | |
| Par Pharmaceutical, Inc., 7.50% Sr. Sec. Nts., 4/1/271 | | | 1,430,000 | | | | 1,408,550 | |
| Rite Aid Corp., 6.125% Sr. Unsec. Nts., 4/1/231 | | | 1,345,000 | | | | 1,139,888 | |
| Simmons Foods, Inc.: | | | | | | | | |
| 5.75% Sec. Nts., 11/1/241 | | | 1,145,000 | | | | 1,047,675 | |
| 7.75% Sr. Sec. Nts., 1/15/241 | | | 275,000 | | | | 297,688 | |
| | | | | | | | |
| | | | | | | 6,864,714 | |
| | | | | | | | |
| Food Products—0.4% | | | | | | | | |
| Darling Ingredients, Inc., 5.25% Sr. | | | | | | | | |
| Unsec. Nts., 4/15/271 | | | 285,000 | | | | 297,965 | |
Dean Foods Co., 6.50% Sr. Unsec. Nts., 3/15/231 | | | 105,000 | | | | 56,962 | |
| JBS Investments II GmbH, 7.00% Sr. | | | | | | | | |
| Unsec. Nts., 1/15/261 | | | 430,000 | | | | 466,765 | |
| JBS USA LUX SA/JBS USA Finance, Inc.: | | | | | | | | |
| 5.75% Sr. Unsec. Nts., 6/15/251 | | | 610,000 | | | | 636,688 | |
| 6.75% Sr. Unsec. Nts., 2/15/281 | | | 560,000 | | | | 610,400 | |
| | | | | | | | |
| | | Principal Amount | | | Value |
| Food Products (Continued) | | | | | |
| JBS USA LUX SA/JBS USA Food Co./JBS USA Finance, Inc., 6.50% Sr. Unsec. Nts., 4/15/291 | | $ | 570,000 | | | $ | 620,136 | |
| Lamb Weston Holdings, Inc., 4.625% Sr. Unsec. Nts., 11/1/241 | | | 285,000 | | | | 296,756 | |
| NBM US Holdings, Inc., 7.00% Sr. Unsec. Nts., 5/14/261 | | | 555,000 | | | | 584,025 | |
| Pilgrim’s Pride Corp.: | | | | | | | | |
| 5.75% Sr. Unsec. Nts., 3/15/251 | | | 575,000 | | | | 585,063 | |
| 5.875% Sr. Unsec. Nts., 9/30/271 | | | 265,000 | | | | 275,600 | |
| Post Holdings, Inc.: | | | | | | | | |
| 5.00% Sr. Unsec. Nts., 8/15/261 | | | 325,000 | | | | 330,688 | |
| 5.75% Sr. Unsec. Nts., 3/1/271 | | | 795,000 | | | | 824,813 | |
| | | | | | | | |
| | | | | | | 5,585,861 | |
| Household Products—0.1% | |
| Kronos Acquisition Holdings, Inc., 9.00% Sr. Unsec. Nts., 8/15/231 | | | 645,000 | | | | 568,664 | |
| Spectrum Brands, Inc., 6.125% Sr. Unsec. Nts., 12/15/24 | | | 280,000 | | | | 289,800 | |
| | | | | | | | |
| | | | | | | 858,464 | |
| Personal Products—0.1% | |
| Avon International Operations, Inc., 7.875% Sr. Sec. Nts., 8/15/221 | | | 910,000 | | | | 948,675 | |
| First Quality Finance Co., Inc., 5.00% Sr. Unsec. Nts., 7/1/251 | | | 575,000 | | | | 580,750 | |
| | | | | | | | |
| | | | | | | 1,529,425 | |
| Energy—6.1% | | | | | | | | |
| Energy Equipment & Services—1.1% | | | | | |
| ADES International Holding plc, 8.625% Sr. Sec. Nts., 4/24/241 | | | 700,000 | | | | 696,374 | |
| Basic Energy Services, Inc., 10.75% Sr. Sec. Nts., 10/15/231 | | | 285,000 | | | | 223,725 | |
| Calfrac Holdings LP, 8.50% Sr. Unsec. Nts., 6/15/261 | | | 715,000 | | | | 504,075 | |
| CSI Compressco LP/CSI Compressco Finance, Inc.: | | | | | | | | |
| 7.25% Sr. Unsec. Nts., 8/15/22 | | | 145,000 | | | | 130,862 | |
| 7.50% Sr. Sec. Nts., 4/1/251 | | | 430,000 | | | | 424,087 | |
| Ensco Rowan plc: | | | | | | | | |
| 5.20% Sr. Unsec. Nts., 3/15/25 | | | 505,000 | | | | 373,069 | |
| 7.75% Sr. Unsec. Nts., 2/1/26 | | | 135,000 | | | | 101,250 | |
| Eterna Capital Pte Ltd.: | | | | | | | | |
| 7.50% Sr. Sec. Nts., 12/11/224,11 | | | 1,468,706 | | | | 1,449,434 | |
| 8.00% Sr. Sec. Nts., 12/11/2211 | | | 1,834,162 | | | | 1,533,305 | |
| Exterran Energy Solutions LP/EES | | | | | | | | |
| Finance Corp., 8.125% Sr. Unsec. Nts., 5/1/25 | | | 260,000 | | | | 265,525 | |
McDermott Technology Americas, Inc./McDermott Technology US, Inc., 10.625% Sr. Unsec. Nts., 5/1/241 | | | 2,900,000 | | | | 2,721,447 | |
| Nabors Industries, Inc., 5.75% Sr. Unsec. Nts., 2/1/25 | | | 655,000 | | | | 583,769 | |
| Pertamina Persero PT, 5.625% Sr. Unsec. Nts., 5/20/431 | | | 3,120,000 | | | | 3,445,002 | |
| Precision Drilling Corp., 7.125% Sr. Unsec. Nts., 1/15/261 | | | 480,000 | | | | 466,800 | |
| Rowan Cos., Inc., 7.375% Sr. Unsec. Nts., 6/15/25 | | | 610,000 | | | | 475,800 | |
| Tervita Escrow Corp., 7.625% Sec. Nts., 12/1/211 | | | 275,000 | | | | 281,108 | |
| Transocean Pontus Ltd., 6.125% Sr. Sec. Nts., 8/1/251 | | | 259,875 | | | | 268,971 | |
| Transocean Poseidon Ltd., 6.875% Sr. Sec. Nts., 2/1/271 | | | 145,000 | | | | 153,609 | |
| Transocean Sentry Ltd., 5.375% Sr. Sec. Nts., 5/15/231 | | | 575,000 | | | | 577,156 | |
| Transocean, Inc.: | | | | | | | | |
| 7.50% Sr. Unsec. Nts., 1/15/261 | | | 265,000 | | | | 253,737 | |
| | |
| 14 INVESCO OPPENHEIMER V.I. GLOBAL STRATEGIC INCOME FUND |
| | | | | | | | |
| | | Principal Amount | | | Value |
| Energy Equipment & Services (Continued) | | | | | |
Transocean, Inc.: (Continued) 9.00% Sr. Unsec. Nts., 7/15/231 | | $ | 845,000 | | | $ | 903,094 | |
| Unit Corp., 6.625% Sr. Unsec. Nts., 5/15/21 | | | 285,000 | | | | 258,638 | |
| USA Compression Partners LP/USA Compression Finance Corp., 6.875% Sr. Unsec. Nts., 9/1/271 | | | 430,000 | | | | 453,697 | |
| | | | | | | | |
| | | | | | | | 16,544,534 | |
| Oil, Gas & Consumable Fuels—5.0% | |
| Aker BP ASA, 4.75% Sr. Unsec. Nts., 6/15/241 | | | 300,000 | | | | 309,488 | |
| Antero Resources Corp.: | | | | | | | | |
| 5.125% Sr. Unsec. Nts., 12/1/22 | | | 340,000 | | | | 327,675 | |
| 5.375% Sr. Unsec. Nts., 11/1/21 | | | 285,000 | | | | 282,506 | |
| Ardagh Packaging Finance plc/Ardagh Holdings USA, Inc., 6.00% Sr. Unsec. Nts., 2/15/251 | | | 955,000 | | | | 990,812 | |
| Ascent Resources Utica Holdings LLC/ARU Finance Corp., 10.00% Sr. Unsec. Nts., 4/1/221 | | | 705,000 | | | | 749,873 | |
| Baytex Energy Corp., 5.625% Sr. Unsec. Nts., 6/1/241 | | | 405,000 | | | | 388,800 | |
| Blue Racer Midstream LLC/Blue Racer Finance Corp., 6.625% Sr. Unsec. Nts., 7/15/261 | | | 715,000 | | | | 723,937 | |
| Brazos Valley Longhorn LLC/Brazos Valley Longhorn Finance Corp., 6.875% Sr. Unsec. Nts., 2/1/25 | | | 275,000 | | | | 259,875 | |
| California Resources Corp.: | | | | | | | | |
| 5.00% Sr. Unsec. Nts., 1/15/20 | | | 435,000 | | | | 419,775 | |
| 8.00% Sec. Nts., 12/15/221 | | | 1,078,000 | | | | 817,932 | |
| Callon Petroleum Co., 6.375% Sr. Unsec. Nts., 7/1/26 | | | 1,170,000 | | | | 1,183,163 | |
| Calumet Specialty Products Partners LP/ Calumet Finance Corp.: | | | | | | | | |
| 6.50% Sr. Unsec. Nts., 4/15/21 | | | 415,000 | | | | 415,000 | |
| 7.625% Sr. Unsec. Nts., 1/15/22 | | | 215,000 | | | | 209,087 | |
| Carrizo Oil & Gas, Inc.: | | | | | | | | |
| 6.25% Sr. Unsec. Nts., 4/15/23 | | | 145,000 | | | | 140,469 | |
| 8.25% Sr. Unsec. Nts., 7/15/25 | | | 290,000 | | | | 287,100 | |
| Centennial Resource Production LLC: | | | | | | | | |
| 5.375% Sr. Unsec. Nts., 1/15/261 | | | 145,000 | | | | 138,475 | |
| 6.875% Sr. Unsec. Nts., 4/1/271 | | | 285,000 | | | | 289,275 | |
| Cheniere Corpus Christi Holdings LLC: | | | | | | | | |
| 5.125% Sr. Sec. Nts., 6/30/27 | | | 525,000 | | | | 571,594 | |
| 7.00% Sr. Sec. Nts., 6/30/24 | | | 865,000 | | | | 996,999 | |
| Chesapeake Energy Corp.: | | | | | | | | |
| 7.00% Sr. Unsec. Nts., 10/1/24 | | | 325,000 | | | | 292,906 | |
| 7.50% Sr. Unsec. Nts., 10/1/26 | | | 395,000 | | | | 353,525 | |
| 8.00% Sr. Unsec. Nts., 3/15/261 | | | 316,000 | | | | 288,350 | |
| 8.00% Sr. Unsec. Nts., 6/15/27 | | | 425,000 | | | | 373,736 | |
| CITGO Petroleum Corp., 6.25% Sr. Sec. Nts., 8/15/221 | | | 70,000 | | | | 70,262 | |
| CNX Resources Corp., 5.875% Sr. Unsec. Nts., 4/15/22 | | | 128,000 | | | | 124,800 | |
| Crestwood Midstream Partners LP/ Crestwood Midstream Finance Corp.: | | | | | | | | |
| 5.625% Sr. Unsec. Nts., 5/1/271 | | | 575,000 | | | | 573,964 | |
| 5.75% Sr. Unsec. Nts., 4/1/25 | | | 100,000 | | | | 101,750 | |
| CrownRock LP/CrownRock Finance, Inc., 5.625% Sr. Unsec. Nts., 10/15/251 | | | 720,000 | | | | 722,700 | |
| CVR Refining LLC/Coffeyville Finance, Inc., 6.50% Sr. Unsec. Nts., 11/1/22 | | | 1,155,000 | | | | 1,178,966 | |
| DCP Midstream Operating LP: | | | | | | | | |
| 4.75% Sr. Unsec. Nts., 9/30/211 | | | 285,000 | | | | 292,837 | |
| 5.125% Sr. Unsec. Nts., 5/15/29 | | | 300,000 | | | | 310,547 | |
| Denbury Resources, Inc.: | | | | | | | | |
| 9.00% Sec. Nts., 5/15/211 | | | 555,000 | | | | 549,450 | |
| | | | | | | | |
| | | Principal Amount | | | Value |
| Oil, Gas & Consumable Fuels (Continued) | | | | | |
Denbury Resources, Inc.: (Continued) 9.25% Sec. Nts., 3/31/221 | | $ | 611,000 | | | $ | 575,867 | |
| Energy Transfer Operating LP: | | | | | | | | |
| 5.875% Sr. Unsec. Nts., 1/15/24 | | | 565,000 | | | | 628,409 | |
| 7.50% Sr. Unsec. Nts., 10/15/20 | | | 290,000 | | | | 307,666 | |
| EnLink Midstream LLC, 5.375% Sr. Unsec. Nts., 6/1/29 | | | 145,000 | | | | 149,053 | |
| EnLink Midstream Partners LP: | | | | | | | | |
| 4.40% Sr. Unsec. Nts., 4/1/24 | | | 1,210,000 | | | | 1,228,126 | |
| 5.60% Sr. Unsec. Nts., 4/1/44 | | | 375,000 | | | | 345,938 | |
| Ensign Drilling, Inc., 9.25% Sr. Unsec. Nts., 4/15/241 | | | 570,000 | | | | 560,869 | |
| Enviva Partners LP/Enviva Partners Finance Corp., 8.50% Sr. Unsec. Nts., 11/1/21 | | | 815,000 | | | | 850,656 | |
| EP Energy LLC/Everest Acquisition Finance, Inc.: | | | | | | | | |
| 7.75% Sr. Sec. Nts., 5/15/261 | | | 845,000 | | | | 758,387 | |
| 8.00% Sr. Sec. Nts., 11/29/241 | | | 3,340,000 | | | | 2,304,600 | |
| 9.375% Sec. Nts., 5/1/243 | | | 802,000 | | | | 188,470 | |
| Extraction Oil & Gas, Inc.: | | | | | | | | |
| 5.625% Sr. Unsec. Nts., 2/1/261 | | | 430,000 | | | | 349,375 | |
| 7.375% Sr. Unsec. Nts., 5/15/241 | | | 265,000 | | | | 227,900 | |
| Fortress Transportation & Infrastructure Investors LLC, 6.75% Sr. Unsec. Nts., 3/15/221 | | | 285,000 | | | | 296,756 | |
| Genesis Energy LP/Genesis Energy Finance Corp.: | | | | | | | | |
| 6.25% Sr. Unsec. Nts., 5/15/26 | | | 1,005,000 | | | | 974,850 | |
| 6.50% Sr. Unsec. Nts., 10/1/25 | | | 620,000 | | | | 608,375 | |
| 6.75% Sr. Unsec. Nts., 8/1/22 | | | 115,000 | | | | 116,438 | |
| Gulfport Energy Corp.: | | | | | | | | |
| 6.00% Sr. Unsec. Nts., 10/15/24 | | | 420,000 | | | | 326,550 | |
| 6.375% Sr. Unsec. Nts., 5/15/25 | | | 275,000 | | | | 214,156 | |
| Hess Infrastructure Partners LP/Hess Infrastructure Partners Finance Corp., 5.625% Sr. Unsec. Nts., 2/15/261 | | | 275,000 | | | | 284,281 | |
| HighPoint Operating Corp.: | | | | | | | | |
| 7.00% Sr. Unsec. Nts., 10/15/22 | | | 145,000 | | | | 140,650 | |
| 8.75% Sr. Unsec. Nts., 6/15/25 | | | 188,000 | | | | 180,480 | |
| Hilcorp Energy I LP/Hilcorp Finance Co., 5.75% Sr. Unsec. Nts., 10/1/251 | | | 165,000 | | | | 166,238 | |
| Holly Energy Partners LP/Holly Energy Finance Corp., 6.00% Sr. Unsec. Nts., 8/1/241 | | | 265,000 | | | | 276,925 | |
| Indigo Natural Resources LLC, 6.875% Sr. Unsec. Nts., 2/15/261 | | | 455,000 | | | | 410,638 | |
| KazTransGas JSC, 4.375% Sr. Unsec. Nts., 9/26/271 | | | 1,890,000 | | | | 1,929,049 | |
| Kinder Morgan Energy Partners LP, 3.45% Sr. Unsec. Nts., 2/15/23 | | | 1,455,000 | | | | 1,495,218 | |
| Laredo Petroleum, Inc.: | | | | | | | | |
| 5.625% Sr. Unsec. Nts., 1/15/22 | | | 285,000 | | | | 265,763 | |
| 6.25% Sr. Unsec. Nts., 3/15/23 | | | 115,000 | | | | 107,560 | |
| MEG Energy Corp.: | | | | | | | | |
| 6.50% Sec. Nts., 1/15/251 | | | 715,000 | | | | 721,256 | |
| 7.00% Sr. Unsec. Nts., 3/31/241 | | | 265,000 | | | | 253,075 | |
| Moss Creek Resources Holdings, Inc.: | | | | | | | | |
| 7.50% Sr. Unsec. Nts., 1/15/261 | | | 180,000 | | | | 154,350 | |
| 10.50% Sr. Unsec. Nts., 5/15/271 | | | 575,000 | | | | 552,719 | |
| Murray Energy Corp., 12.00% Sec. Nts., 4/15/241,11 | | | 2,352,945 | | | | 488,236 | |
| Newfield Exploration Co., 5.625% Sr. Unsec. Nts., 7/1/24 | | | 290,000 | | | | 321,560 | |
| NGL Energy Partners LP/NGL Energy Finance Corp.: | | | | | | | | |
| 6.125% Sr. Unsec. Nts., 3/1/25 | | | 1,010,000 | | | | 1,004,950 | |
| 7.50% Sr. Unsec. Nts., 11/1/23 | | | 225,000 | | | | 236,250 | |
| 7.50% Sr. Unsec. Nts., 4/15/261 | | | 515,000 | | | | 537,349 | |
| | |
| 15 INVESCO OPPENHEIMER V.I. GLOBAL STRATEGIC INCOME FUND |
CONSOLIDATED STATEMENT OF INVESTMENTSUnaudited / Continued
| | | | | | | | | | |
| | | Principal Amount | | | Value | |
| Oil, Gas & Consumable Fuels (Continued) | |
| NuStar Logistics LP: | | | | | | | | | | |
| 4.80% Sr. Unsec. Nts., 9/1/20 | | $ | | | 285,000 | | | $ | 290,700 | |
| 6.00% Sr. Unsec. Nts., 6/1/26 | | | | | 300,000 | | | | 311,250 | |
| Oasis Petroleum, Inc., 6.875% Sr. Unsec. Nts., 1/15/23 | | | | | 610,000 | | | | 611,525 | |
| Parkland Fuel Corp., 6.00% Sr. Unsec. Nts., 4/1/261 | | | | | 275,000 | | | | 282,219 | |
| Parsley Energy LLC/Parsley Finance | | | | | | | | | | |
| Corp., 5.625% Sr. Unsec. Nts., 10/15/271 | | | | | 400,000 | | | | 420,000 | |
| PBF Holding Co. LLC/PBF Finance Corp.: | | | | | | | | | | |
| 7.00% Sr. Unsec. Nts., 11/15/23 | | | | | 375,000 | | | | 390,941 | |
| 7.25% Sr. Unsec. Nts., 6/15/25 | | | | | 420,000 | | | | 441,525 | |
| PBF Logistics LP/PBF Logistics Finance Corp., 6.875% Sr. Unsec. Nts., 5/15/23 | | | | | 430,000 | | | | 445,588 | |
| PDC Energy, Inc., 5.75% Sr. Unsec. Nts., 5/15/26 | | | | | 535,000 | | | | 526,975 | |
| Peabody Energy Corp.: | | | | | | | | | | |
| 6.00% Sr. Sec. Nts., 3/31/221 | | | | | 360,000 | | | | 369,900 | |
| 6.375% Sr. Sec. Nts., 3/31/251 | | | | | 560,000 | | | | 568,400 | |
| Petrobras Global Finance BV: | | | | | | | | | | |
| 6.85% Sr. Unsec. Nts., 6/5/15 | | | | | 1,095,000 | | | | 1,137,880 | |
| 6.90% Sr. Unsec. Nts., 3/19/49 | | | | | 1,580,000 | | | | 1,685,860 | |
| Petroleos Mexicanos: | | | | | | | | | | |
| 3.75% Sr. Unsec. Nts., 4/16/264 | | EUR | | | 1,400,000 | | | | 1,525,032 | |
| 4.875% Sr. Unsec. Nts., 1/24/22 | | | | | 535,000 | | | | 534,465 | |
| 6.375% Sr. Unsec. Nts., 2/4/21 | | | | | 3,080,000 | | | | 3,167,780 | |
| 6.375% Sr. Unsec. Nts., 1/23/45 | | | | | 2,855,000 | | | | 2,466,006 | |
| 6.50% Sr. Unsec. Nts., 1/23/29 | | | | | 1,055,000 | | | | 1,023,350 | |
| Puma International Financing SA, 5.00% Sr. Unsec. Nts., 1/24/261 | | | | | 1,045,000 | | | | 909,797 | |
| QEP Resources, Inc.: | | | | | | | | | | |
| 5.625% Sr. Unsec. Nts., 3/1/26 | | | | | 665,000 | | | | 628,425 | |
| 6.875% Sr. Unsec. Nts., 3/1/21 | | | | | 285,000 | | | | 294,263 | |
| Range Resources Corp.: | | | | | | | | | | |
| 5.00% Sr. Unsec. Nts., 3/15/23 | | | | | 285,000 | | | | 269,325 | |
| 5.75% Sr. Unsec. Nts., 6/1/21 | | | | | 285,000 | | | | 289,275 | |
| Reliance Industries Ltd.: | | | | | | | | | | |
| 6.78% Unsec. Nts., 9/16/20 | | INR | | | 70,000,000 | | | | 1,016,055 | |
| 7.00% Unsec. Nts., 8/31/22 | | INR | | | 210,000,000 | | | | 3,054,227 | |
| Repsol International Finance BV, 4.50% [EUSA10+420] Jr. Sub. Nts., 3/25/752,4 | | EUR | | | 1,410,000 | | | | 1,827,122 | |
| Rio Oil Finance Trust Series2014-1, | | | | | | | | | | |
| 9.25% Sr. Sec. Nts., 7/6/241 | | | | | 187,729 | | | | 210,022 | |
| Sanchez Energy Corp.: | | | | | | | | | | |
| 6.125% Sr. Unsec. Nts., 1/15/23 | | | | | 375,000 | | | | 18,750 | |
| 7.25% Sr. Sec. Nts., 2/15/231 | | | | | 147,000 | | | | 112,088 | |
| 7.75% Sr. Unsec. Nts., 6/15/21 | | | | | 445,000 | | | | 24,475 | |
| SemGroup Corp./Rose Rock Finance Corp.: | | | | | | | | | | |
| 5.625% Sr. Unsec. Nts., 7/15/22 | | | | | 315,000 | | | | 312,089 | |
| 5.625% Sr. Unsec. Nts., 11/15/23 | | | | | 545,000 | | | | 523,200 | |
| SM Energy Co.: | | | | | | | | | | |
| 6.625% Sr. Unsec. Nts., 1/15/27 | | | | | 280,000 | | | | 260,400 | |
| 6.75% Sr. Unsec. Nts., 9/15/26 | | | | | 455,000 | | | | 428,838 | |
| Southern Gas Corridor CJSC, 6.875% Sr. Unsec. Nts., 3/24/261 | | | | | 3,065,000 | | | | 3,561,334 | |
| Southwestern Energy Co.: | | | | | | | | | | |
| 6.20% Sr. Unsec. Nts., 1/23/25 | | | | | 137,000 | | | | 126,040 | |
| 7.50% Sr. Unsec. Nts., 4/1/26 | | | | | 560,000 | | | | 533,333 | |
| SRC Energy, Inc., 6.25% Sr. Unsec. Nts., 12/1/25 | | | | | 305,000 | | | | 279,075 | |
| State Oil Co. of the Azerbaijan Republic, | | | | | | | | | | |
| 4.75% Sr. Unsec. Nts., 3/13/234 | | | | | 1,525,000 | | | | 1,590,575 | |
| Summit Midstream Holdings LLC/Summit Midstream Finance Corp., 5.75% Sr. Unsec. Nts., 4/15/25 | | | | | 995,000 | | | | 875,600 | |
| Sunoco LP/Sunoco Finance Corp.: | | | | | | | | | | |
| 4.875% Sr. Unsec. Nts., 1/15/23 | | | | | 335,000 | | | | 342,956 | |
| | | | | | | | | | |
| | | Principal Amount | | | Value |
| Oil, Gas & Consumable Fuels (Continued) | |
| Sunoco LP/Sunoco Finance Corp.: (Continued) | | | | | | | | | | |
| 5.50% Sr. Unsec. Nts., 2/15/26 | | $ | | | 180,000 | | | $ | 187,875 | |
| 5.875% Sr. Unsec. Nts., 3/15/28 | | | | | 404,000 | | | | 419,655 | |
| 6.00% Sr. Unsec. Nts., 4/15/271 | | | | | 285,000 | | | | 299,963 | |
| Tallgrass Energy Partners LP/Tallgrass Energy Finance Corp.: | | | | | | | | | | |
| 5.50% Sr. Unsec. Nts., 9/15/241 | | | | | 555,000 | | | | 575,812 | |
| 5.50% Sr. Unsec. Nts., 1/15/281 | | | | | 335,000 | | | | 340,444 | |
| Targa Resources Partners LP/Targa Resources Partners Finance Corp.: | | | | | | | | | | |
| 5.00% Sr. Unsec. Nts., 1/15/28 | | | | | 610,000 | | | | 613,050 | |
| 5.875% Sr. Unsec. Nts., 4/15/26 | | | | | 550,000 | | | | 585,063 | |
| 6.50% Sr. Unsec. Nts., 7/15/271 | | | | | 285,000 | | | | 311,363 | |
| Transcanada Trust, 5.875% [US0003M+464] Jr. Sub. Nts., 8/15/762 | | | | | 1,455,000 | | | | 1,495,624 | |
| USA Compression Partners LP/USA Compression Finance Corp., 6.875% Sr. Unsec. Nts., 4/1/26 | | | | | 415,000 | | | | 440,896 | |
| Whiting Petroleum Corp.: | | | | | | | | | | |
| 5.75% Sr. Unsec. Nts., 3/15/21 | | | | | 340,000 | | | | 340,425 | |
| 6.625% Sr. Unsec. Nts., 1/15/26 | | | | | 550,000 | | | | 533,156 | |
| WPX Energy, Inc., 8.25% Sr. Unsec. Nts., 8/1/23 | | | | | 285,000 | | | | 326,325 | |
| | | | | | | | | | |
| | | | 75,430,927 | |
| |
| | | | | |
| Financials—12.3% | |
| Capital Markets—1.6% | |
| Banco BTG Pactual SA/Cayman Islands, | | | | | | | | | | |
| 5.50% Sr. Unsec. Nts., 1/31/231 | | | | | 1,525,000 | | | | 1,587,906 | |
| Cornerstone Building Brands, Inc., | | | | | | | | | | |
| 8.00% Sr. Unsec. Nts., 4/15/261 | | | | | 425,000 | | | | 415,437 | |
| Credit Suisse Group AG, 7.50% [USSW5+459.8] Jr. Sub. Perpetual Bonds2,4,14 | | | | | 4,970,000 | | | | 5,480,658 | |
| Diamond Resorts International, Inc.: | | | | | | | | | | |
| 7.75% Sr. Sec. Nts., 9/1/231 | | | | | 265,000 | | | | 273,944 | |
| 10.75% Sr. Unsec. Nts., 9/1/241 | | | | | 255,000 | | | | 252,450 | |
| Eagle Intermediate Global Holding BV/ Ruyi US Finance LLC, 7.50% Sr. Sec. Nts., 5/1/253 | | | | | 285,000 | | | | 271,819 | |
| European Bank for Reconstruction & Development: | | | | | | | | | | |
| 6.85% Sr. Unsec. Nts., 6/21/21 | | IDR | | | 10,600,000,000 | | | | 748,459 | |
| 28.50% Sr. Unsec. Nts., 7/10/19 | | TRY | | | 10,100,000 | | | | 1,744,097 | |
| Flex Acquisition Co., Inc., 6.875% Sr. Unsec. Nts., 1/15/251 | | | | | 630,000 | | | | 573,300 | |
| Icahn Enterprises LP/Icahn Enterprises Finance Corp., 6.375% Sr. Unsec. Nts., 12/15/25 | | | | | 545,000 | | | | 557,698 | |
| Martin Midstream Partners LP/Martin Midstream Finance Corp., 7.25% Sr. Unsec. Nts., 2/15/21 | | | | | 290,000 | | | | 288,898 | |
| MPH Acquisition Holdings LLC, 7.125% Sr. Unsec. Nts., 6/1/241 | | | | | 420,000 | | | | 395,934 | |
| MSCI, Inc., 5.375% Sr. Unsec. Nts., 5/15/271 | | | | | 275,000 | | | | 294,937 | |
| Neptune Energy Bondco plc, 6.625% Sr. Unsec. Nts., 5/15/254 | | | | | 765,000 | | | | 778,579 | |
| Prime Security Services Borrower LLC/ Prime Finance, Inc., 9.25% Sec. Nts., 5/15/231 | | | | | 764,000 | | | | 803,785 | |
| Tempo Acquisition LLC/Tempo Acquisition Finance Corp., 6.75% Sr. Unsec. Nts., 6/1/251 | | | | | 545,000 | | | | 564,075 | |
| TerraForm Power Operating LLC: | | | | | | | | | | |
| 4.25% Sr. Unsec. Nts., 1/31/231 | | | | | 510,000 | | | | 513,187 | |
| 5.00% Sr. Unsec. Nts., 1/31/281 | | | | | 195,000 | | | | 196,463 | |
| Trident Merger Sub, Inc., 6.625% Sr. Unsec. Nts., 11/1/251 | | | | | 550,000 | | | | 515,625 | |
| | |
| 16 INVESCO OPPENHEIMER V.I. GLOBAL STRATEGIC INCOME FUND |
| | | | | | | | | | |
| | | Principal Amount | | | Value | |
| Capital Markets (Continued) | | | | | | | | | | |
UBS Group Funding Switzerland AG: | | | | | | | | | | |
| 6.875% [USISDA05+549.65] Jr. Sub. Perpetual Bonds2,4,14 | | $ | | | 5,655,000 | | | $ | 5,896,604 | |
| 7.125% [USSW5+588.3] Jr. Sub. Perpetual Bonds2,4,14 | | | | | 2,011,000 | | | | 2,116,578 | |
| | | | | | | | | | |
| | | | 24,270,433 | |
| |
| | | | | |
| Commercial Banks—6.1% | |
| ABN AMRO Bank NV, 5.75% [EUSA5+545.2] Jr. Sub. Perpetual Bonds2,4,14 | | EUR | | | 2,050,000 | | | | 2,456,722 | |
| Astana Finance JSC, 9.16% Sr. Unsec. Nts., 12/22/2412,15 | | | | | 315,159 | | | | 0 | |
| Australia & New Zealand Banking Group Ltd. (United Kingdom), 6.75% [USISDA05+516.8] Jr. Sub. Perpetual Bonds1,2,14 | | | | | 105,000 | | | | 115,984 | |
| Banca Monte dei Paschi di Siena SpA, 5.375% [EUSA5+500.5] Sub. Nts., 1/18/282,4 | | EUR | | | 2,795,000 | | | | 1,948,853 | |
| Banco Bilbao Vizcaya Argentaria SA: | | | | | | | | | | |
| 5.875% [EUSA5+566] Jr. Sub. Perpetual Bonds2,4,14 | | EUR | | | 1,550,000 | | | | 1,826,935 | |
| 6.00% [EUSA5+603.9] Jr. Sub. Perpetual Bonds2,4,14 | | EUR | | | 2,895,000 | | | | 3,464,545 | |
| 6.75% [EUSA5+660.4] Jr. Sub. Perpetual Bonds2,4,14 | | EUR | | | 2,290,000 | | | | 2,680,643 | |
| 8.875% [EUSA5+917.7] Jr. Sub. Perpetual Bonds2,4,14 | | EUR | | | 1,695,000 | | | | 2,151,395 | |
| Banco do Brasil SA (Cayman): | | | | | | | | | | |
| 3.875% Sr. Unsec. Nts., 10/10/22 | | | | | 1,370,000 | | | | 1,397,742 | |
| 4.75% Sr. Unsec. Nts., 3/20/241 | | | | | 1,053,000 | | | | 1,102,438 | |
| Banco Mercantil del Norte SA (Grand Cayman), 7.625% [H15T10Y+535.3] Jr. Sub. Perpetual Bonds1,2,14 | | | | | 395,000 | | | | 405,862 | |
| Banco Santander SA: | | | | | | | | | | |
| 5.25% [EUSA5+499.9] Jr. Sub. Perpetual Bonds2,4,14 | | EUR | | | 2,245,000 | | | | 2,602,209 | |
| 6.75% [EUSA5+680.3] Jr. Sub. Perpetual Bonds2,4,14 | | EUR | | | 2,780,000 | | | | 3,452,863 | |
| Bank of China Ltd., 5.00% Sub. Nts., 11/13/241 | | | | | 1,475,000 | | | | 1,588,498 | |
| Bankinter SA, 8.625% [EUSA5+886.7] Jr. Sub. Perpetual Bonds2,4,14 | | EUR | | | 1,345,000 | | | | 1,713,874 | |
| Barclays plc: | | | | | | | | | | |
| 7.875% [USSW5+677.2] Jr. Sub. Perpetual Bonds2,4,14 | | | | | 1,225,000 | | | | 1,284,719 | |
| 8.00% [H15T5Y+567.2] Jr. Sub. Perpetual Bonds2,14 | | | | | 1,632,000 | | | | 1,712,727 | |
| BNP Paribas SA: | | | | | | | | | | |
| 6.625% [USSW5+414.9] Jr. Sub. Perpetual Bonds1,2,14 | | | | | 1,365,000 | | | | 1,427,514 | |
| 7.625% [USSW5+631.4] Jr. Sub. Perpetual Bonds1,2,14 | | | | | 1,125,000 | | | | 1,191,487 | |
| 7.625% [USSW5+631.4] Jr. Sub. Perpetual Bonds2,4,14 | | | | | 3,665,000 | | | | 3,881,602 | |
| CaixaBank SA: | | | | | | | | | | |
| 5.25% [EUSA5+450.4] Jr. Sub. Perpetual Bonds2,4,14 | | EUR | | | 290,000 | | | | 310,572 | |
| 6.75% [EUSA5+649.8] Jr. Sub. Perpetual Bonds2,4,14 | | EUR | | | 3,010,000 | | | | 3,704,812 | |
| CIT Group, Inc.: | | | | | | | | | | |
| 4.125% Sr. Unsec. Nts., 3/9/21 | | | | | 460,000 | | | | 469,913 | |
| 5.00% Sr. Unsec. Nts., 8/15/22 | | | | | 140,000 | | | | 148,400 | |
| 5.25% Sr. Unsec. Nts., 3/7/25 | | | | | 285,000 | | | | 313,144 | |
| Clear Channel Worldwide Holdings, Inc., 9.25% Sr. Unsec. Nts., 2/15/241 | | | | | 570,000 | | | | 619,875 | |
| Cooperatieve Rabobank UA, 6.625% [EUSA5+669.7] Jr. Sub. Perpetual Bonds2,4,14 | | EUR | | | 2,915,000 | | | | 3,676,539 | |
| | | | | | | | | | | | |
| | | Principal Amount | | | Value | |
| Commercial Banks (Continued) | | | | | | | | | | | | |
| Credit Agricole SA: | | | | | | | | | | | | |
| 6.875% [USSW5+431.9] Jr. Sub. Perpetual Bonds1,2,14 | | $ | | | | | 2,290,000 | | | $ | 2,406,137 | |
| 7.875% [USSW5+489.8] Jr. Sub. Perpetual Bonds2,4,14 | | | | | | | 1,460,000 | | | | 1,611,358 | |
| Credit Suisse AG, 6.50% Sub. Nts., 8/8/234 | | | | | | | 2,920,000 | | | | 3,221,125 | |
| Global Bank Corp., 5.25% | | | | | | | | | | | | |
| [US0003M+330] Sr. Unsec. Nts., 4/16/291,2 | | | | | | | 2,100,000 | | | | 2,194,500 | |
| HSBC Holdings plc: | | | | | | | | | | | | |
| 5.25% [EUSA5+438.3] Jr. Sub. Perpetual Bonds2,4,14 | | | EUR | | | | 3,440,000 | | | | 4,225,430 | |
| 6.00% [EUSA5+533.8] Jr. Sub. Perpetual Bonds2,4,14 | | | EUR | | | | 1,880,000 | | | | 2,472,017 | |
| IDBI Bank Ltd.(GIFT-IFC), 5.00% Sr. Unsec. Nts., 9/25/194 | | | | | | | 430,000 | | | | 431,621 | |
| International Finance Corp., 16.721% Sr. Unsec. Nts., 2/15/294,10 | | | TRY | | | | 3,700,000 | | | | 183,556 | |
| Intesa Sanpaolo SpA, 7.70% [USSW5+546.15] Jr. Sub. Perpetual Bonds1,2,14 | | | | | | | 1,454,000 | | | | 1,429,798 | |
| Kenan Advantage Group, Inc. (The), 7.875% Sr. Unsec. Nts., 7/31/231 | | | | | | | 960,000 | | | | 868,800 | |
| Lloyds Bank plc: | | | | | | | | | | | | |
| 7.50% Sr. Unsec. Nts., 4/2/324,8 | | | | | | | 2,825,000 | | | | 2,255,946 | |
| 13.00% [GUKG5+1,340] Jr. Sub. Perpetual Bonds2,14 | | | GBP | | | | 910,000 | | | | 2,000,785 | |
| NatWest Markets plc, 3.625% Sr. Unsec. Nts., 9/29/221 | | | | | | | 2,915,000 | | | | 2,978,541 | |
| Novo Banco SA, 8.50% [EUSA5+823.3] Sub. Nts., 7/6/282,4 | | | EUR | | | | 1,055,000 | | | | 1,242,224 | |
| Royal Bank of Scotland Group plc, 8.625% [USSW5+759.8] Jr. Sub. Perpetual Bonds2,14 | | | | | | | 2,265,000 | | | | 2,446,766 | |
| Societe Generale SA: | | | | | | | | | | | | |
| 7.375% [USSW5+623.8] Jr. Sub. Perpetual Bonds1,2,14 | | | | | | | 5,445,000 | | | | 5,737,941 | |
| 7.875% [USSW5+497.9] Jr. Sub. Perpetual Bonds2,4,14 | | | | | | | 1,020,000 | | | | 1,095,954 | |
| Standard Chartered plc, 7.75% [USSW5+572.3] Jr. Sub. Perpetual Bonds2,4,14 | | | | | | | 3,755,000 | | | | 3,992,372 | |
| Swiss Insured Brazil Power Finance Sarl, 9.85% Sr. Sec. Nts., 7/16/32 | | | BRL | | | | 5,250,000 | | | | 1,497,090 | |
| TBC Bank JSC, 5.75% Sr. Unsec. Nts., 6/19/241 | | | | | | | 1,115,000 | | | | 1,113,576 | |
| UBS Group Funding Switzerland AG: | | | | | | | | | | | | |
| 5.00% [USSW5+243.2] Jr. Sub. Perpetual Bonds2,4,14 | | | | | | | 585,000 | | | | 537,888 | |
| 5.75% [EUSA5+528.7] Jr. Sub. Perpetual Bonds2,4,14 | | | EUR | | | | 1,280,000 | | | | 1,605,115 | |
| UniCredit SpA, 7.50% [EUAMDB05+733.4] Jr. Sub. Perpetual Bonds2,4,14 | | | EUR | | | | 1,455,000 | | | | 1,749,259 | |
| | | | | | | | | | | | |
| | | | 92,947,666 | |
| |
| | | | | |
| Consumer Finance—0.8% | |
| Ahern Rentals, Inc., 7.375% Sec. Nts., 5/15/231 | | | | | | | 605,000 | | | | 539,962 | |
| Ally Financial, Inc.: | | | | | | | | | | | | |
| 3.875% Sr. Unsec. Nts., 5/21/24 | | | | | | | 745,000 | | | | 764,087 | |
| 4.625% Sr. Unsec. Nts., 5/19/22 | | | | | | | 440,000 | | | | 459,800 | |
| 4.625% Sr. Unsec. Nts., 3/30/25 | | | | | | | 287,000 | | | | 303,861 | |
| 5.125% Sr. Unsec. Nts., 9/30/24 | | | | | | | 425,000 | | | | 460,062 | |
| 5.75% Sub. Nts., 11/20/25 | | | | | | | 1,070,000 | | | | 1,187,593 | |
| 8.00% Sr. Unsec. Nts., 11/1/31 | | | | | | | 415,000 | | | | 550,585 | |
| Colfax Corp.: | | | | | | | | | | | | |
| 6.00% Sr. Unsec. Nts., 2/15/241 | | | | | | | 575,000 | | | | 610,219 | |
| 6.375% Sr. Unsec. Nts., 2/15/261 | | | | | | | 290,000 | | | | 311,387 | |
| | |
| 17 INVESCO OPPENHEIMER V.I. GLOBAL STRATEGIC INCOME FUND |
CONSOLIDATED STATEMENT OF INVESTMENTSUnaudited / Continued
| | | | | | | | | | |
| | | Principal Amount | | | Value | |
Consumer Finance (Continued) | | | | | | | | | | |
| Comstock Resources, Inc., 9.75% Sr. | | | | | | | | | | |
| Unsec. Nts., 8/15/26 | | $ | | | 290,000 | | | $ | 224,025 | |
| Dresdner Funding Trust I, 8.151% Jr. | | | | | | | | | | |
| Sub. Nts., 6/30/314 | | | | | 875,000 | | | | 1,181,906 | |
| Lions Gate Capital Holdings LLC, | | | | | | | | | | |
| 6.375% Sr. Unsec. Nts., 2/1/241 | | | | | 285,000 | | | | 300,319 | |
| MGM Growth Properties Operating | | | | | | | | | | |
| Partnership LP/MGP Finance Co.-Issuer, Inc., 5.75% Sr. Unsec. Nts., 2/1/271 | | | | | 285,000 | | | | 307,444 | |
| Navient Corp.: | | | | | | | | | | |
| 5.875% Sr. Unsec. Nts., 10/25/24 | | | | | 790,000 | | | | 802,837 | |
| 6.50% Sr. Unsec. Nts., 6/15/22 | | | | | 535,000 | | | | 569,636 | |
| 6.625% Sr. Unsec. Nts., 7/26/21 | | | | | 505,000 | | | | 535,931 | |
| 6.75% Sr. Unsec. Nts., 6/25/25 | | | | | 685,000 | | | | 710,688 | |
| 6.75% Sr. Unsec. Nts., 6/15/26 | | | | | 415,000 | | | | 431,600 | |
| Springleaf Finance Corp.: | | | | | | | | | | |
| 6.125% Sr. Unsec. Nts., 3/15/24 | | | | | 570,000 | | | | 614,175 | |
| 6.625% Sr. Unsec. Nts., 1/15/28 | | | | | 160,000 | | | | 168,293 | |
| Terraform Global Operating LLC, 6.125% Sr. Unsec. Nts., 3/1/261 | | | | | 820,000 | | | | 826,150 | |
| TMX Finance LLC/TitleMax Finance | | | | | | | | | | |
| Corp., 11.125% Sr. Sec. Nts., 4/1/231 | | | | | 270,000 | | | | 256,163 | |
| Vistra Operations Co. LLC, 5.625% Sr. | | | | | | | | | | |
| Unsec. Nts., 2/15/271 | | | | | 575,000 | | | | 610,938 | |
| | | | | | | | | | |
| | | | 12,727,661 | |
| | | | | |
| Diversified Financial Services—0.3% | |
| Export-Import Bank of India, 7.35% Sr. | | | | | | | | | | |
| Unsec. Nts., 5/18/22 | | INR | | | 70,000,000 | | | | 1,014,743 | |
| Fidelity & Guaranty Life Holdings, Inc., | | | | | | | | | | |
| 5.50% Sr. Unsec. Nts., 5/1/251 | | | | | 385,000 | | | | 401,362 | |
| JP Morgan/Hipotecaria su Casita, | | | | | | | | | | |
| 6.47%, 8/26/351,15 | | MXN | | | 5,808,600 | | | | 31,114 | |
| Rural Electrification Corp. Ltd.: | | | | | | | | | | |
| 7.24% Sr. Unsec. Nts., 10/21/21 | | INR | | | 140,000,000 | | | | 2,024,440 | |
| 7.60% Sr. Unsec. Nts., 4/17/21 | | INR | | | 100,000,000 | | | | 1,457,382 | |
| | | | | | | | | | |
| | | | 4,929,041 | |
| | | | | |
| Insurance—0.9% | |
| AXA SA: | | | | | | | | | | |
| 3.875% [EUSA11+325] Jr. Sub. | | | | | | | | | | |
| Perpetual Bonds2,4,14 | | EUR | | | 1,550,000 | | | | 1,967,914 | |
| 5.125% [US0003M+388.3] Sub. Nts., | | | | | | | | | | |
| 1/17/472,4 | | | | | 2,130,000 | | | | 2,263,197 | |
| Genworth Holdings, Inc.: | | | | | | | | | | |
| 7.625% Sr. Unsec. Nts., 9/24/21 | | | | | 330,000 | | | | 325,050 | |
| 7.70% Sr. Unsec. Nts., 6/15/20 | | | | | 430,000 | | | | 433,849 | |
| NN Group NV, 4.375% [EUR003M+390] | | | | | | | | | | |
| Jr. Sub. Perpetual Bonds2,4,14 | | EUR | | | 1,465,000 | | | | 1,832,095 | |
| Power Finance Corp. Ltd.: | | | | | | | | | | |
| 7.27% Sr. Unsec. Nts., 12/22/21 | | INR | | | 140,000,000 | | | | 2,004,510 | |
| 7.42% Sr. Unsec. Nts., 6/26/20 | | INR | | | 43,000,000 | | | | 622,785 | |
| 7.50% Sr. Unsec. Nts., 8/16/21 | | INR | | | 140,000,000 | | | | 2,006,352 | |
| VIVAT NV, 6.25% [USSW5+417.4] Jr. | | | | | | | | | | |
| Sub. Perpetual Bonds2,4,14 | | | | | 1,465,000 | | | | 1,478,207 | |
| | | | | | | | | | |
| | | | 12,933,959 | |
| | | | | |
| Real Estate Investment Trusts (REITs)—0.8% | |
| Banco Invex SA/Hipotecaria Credito y | | | | | | | | | | |
| Casa SA de CV, 6.45%, 3/13/3412,15,16 | | MXN | | | 4,830,531 | | | | 0 | |
| Brookfield Property REIT, Inc./BPR | | | | | | | | | | |
| Cumulus LLC/BPR Nimbus LLC/GGSI | | | | | | | | | | |
| Sellco LL, 5.75% Sr. Sec. Nts., 5/15/261 | | | | | 630,000 | | | | 651,262 | |
| Brookfield Residential Properties, Inc./ | | | | | | | | | | |
| Brookfield Residential US Corp., 6.125% Sr. Unsec. Nts., 7/1/221 | | | | | 285,000 | | | | 290,700 | |
| CoreCivic, Inc.: | | | | | | | | | | |
| 4.625% Sr. Unsec. Nts., 5/1/23 | | | | | 285,000 | | | | 280,696 | |
| 5.00% Sr. Unsec. Nts., 10/15/22 | | | | | 145,000 | | | | 144,819 | |
| Equinix, Inc.: | | | | | | | | | | |
| 5.375% Sr. Unsec. Nts., 5/15/27 | | | | | 780,000 | | | | 838,087 | |
| | | | | | | | | | |
| | | Principal Amount | | | Value | |
Real Estate Investment Trusts (REITs) (Continued) | | | | | |
| Equinix, Inc.: (Continued) | | | | | | | | | | |
| 5.875% Sr. Unsec. Nts., 1/15/26 | | $ | | | 945,000 | | | $ | 1,002,881 | |
| GLP Capital LP/GLP Financing II, Inc., | | | | | | | | | | |
| 5.375% Sr. Unsec. Nts., 11/1/23 | | | | | 410,000 | | | | 441,131 | |
| Iron Mountain US Holdings, Inc., | | | | | | | | | | |
| 5.375% Sr. Unsec. Nts., 6/1/261 | | | | | 995,000 | | | | 1,003,706 | |
| Iron Mountain, Inc., 4.875% Sr. Unsec. | | | | | | | | | | |
| Nts., 9/15/271 | | | | | 410,000 | | | | 408,463 | |
| iStar, Inc.: | | | | | | | | | | |
| 5.25% Sr. Unsec. Nts., 9/15/22 | | | | | 800,000 | | | | 821,000 | |
| 6.00% Sr. Unsec. Nts., 4/1/22 | | | | | 1,165,000 | | | | 1,197,037 | |
| Lamar Media Corp., 5.75% Sr. Unsec. | | | | | | | | | | |
| Nts., 2/1/26 | | | | | 805,000 | | | | 849,275 | |
| MPT Operating Partnership LP/MPT | | | | | | | | | | |
| Finance Corp.: | | | | | | | | | | |
| 5.00% Sr. Unsec. Nts., 10/15/27 | | | | | 94,000 | | | | 97,055 | |
| 6.375% Sr. Unsec. Nts., 3/1/24 | | | | | 95,000 | | | | 99,631 | |
| Outfront Media Capital LLC/Outfront | | | | | | | | | | |
| Media Capital Corp.: | | | | | | | | | | |
| 5.00% Sr. Unsec. Nts., 8/15/271 | | | | | 75,000 | | | | 76,768 | |
| 5.875% Sr. Unsec. Nts., 3/15/25 | | | | | 720,000 | | | | 747,000 | |
| SBA Communications Corp., 4.00% Sr. | | | | | | | | | | |
| Unsec. Nts., 10/1/22 | | | | | 690,000 | | | | 702,938 | |
| Starwood Property Trust, Inc.: | | | | | | | | | | |
| 4.75% Sr. Unsec. Nts., 3/15/25 | | | | | 805,000 | | | | 815,063 | |
| 5.00% Sr. Unsec. Nts., 12/15/21 | | | | | 760,000 | | | | 782,800 | |
| | | | | | | | | | |
| | | | 11,250,312 | |
| | | | | |
| Real Estate Management & Development—1.3% | |
| Agile Group Holdings Ltd., 9.00% Sr. | | | | | | | | | | |
| Sec. Nts., 5/21/204 | | | | | 2,820,000 | | | | 2,902,238 | |
| China Aoyuan Group Ltd., 7.50% Sr. Sec. Nts., 5/10/214 | | | | | 1,001,000 | | | | 1,034,063 | |
| CIFI Holdings Group Co. Ltd.: | | | | | | | | | | |
| 7.625% Sr. Unsec. Nts., 3/2/214 | | | | | 4,204,000 | | | | 4,357,538 | |
| 7.75% Sr. Unsec. Nts., 6/5/204 | | | | | 971,875 | | | | 993,742 | |
| Country Garden Holdings Co. Ltd., | | | | | | | | | | |
| 7.50% Sr. Sec. Nts., 3/9/204 | | | | | 1,555,000 | | | | 1,585,276 | |
| Forestar Group, Inc., 8.00% Sr. Unsec. | | | | | | | | | | |
| Nts., 4/15/241 | | | | | 285,000 | | | | 300,809 | |
| Greystar Real Estate Partners LLC, | | | | | | | | | | |
| 5.75% Sr. Sec. Nts., 12/1/251 | | | | | 695,000 | | | | 710,638 | |
| Mattamy Group Corp., 6.875% Sr. | | | | | | | | | | |
| Unsec. Nts., 12/15/231 | | | | | 505,000 | | | | 528,356 | |
| New Metro Global Ltd., 6.50% Sr. | | | | | | | | | | |
| Unsec. Nts., 4/23/214 | | | | | 490,000 | | | | 496,160 | |
| Times China Holdings Ltd.: | | | | | | | | | | |
| 6.25% Sr. Sec. Nts., 1/23/204 | | | | | 490,000 | | | | 493,369 | |
| 7.85% Sr. Sec. Nts., 6/4/214 | | | | | 4,982,000 | | | | 5,141,429 | |
| Yuzhou Properties Co. Ltd., 6.375% Sr. | | | | | | | | | | |
| Sec. Nts., 3/6/214 | | | | | 1,001,000 | | | | 1,008,029 | |
| | | | | | | | | | |
| | | | 19,551,647 | |
| | | | | |
| Thrifts & Mortgage Finance—0.5% | |
| Export-Import Bank of India, 8.00% Sr. | | | | | | | | | | |
| Unsec. Nts., 5/27/21 | | INR | | | 280,000,000 | | | | 4,106,939 | |
| LIC Housing Finance Ltd., 7.45% Sr. Sec. Nts., 10/17/22 | | INR | | | 70,000,000 | | | | 1,008,014 | |
| Nationstar Mortgage Holdings, Inc., | | | | | | | | | | |
| 8.125% Sr. Unsec. Nts., 7/15/231 | | | | | 415,000 | | | | 424,338 | |
| Quicken Loans, Inc.: | | | | | | | | | | |
| 5.25% Sr. Unsec. Nts., 1/15/281 | | | | | 690,000 | | | | 689,138 | |
| 5.75% Sr. Unsec. Nts., 5/1/251 | | | | | 615,000 | | | | 636,328 | |
| Radian Group, Inc., 4.50% Sr. Unsec. | | | | | | | | | | |
| Nts., 10/1/24 | | | | | 545,000 | | | | 560,963 | |
| | | | | | | | | | |
| | | | 7,425,720 | |
| |
| | | | | |
| | |
| 18 INVESCO OPPENHEIMER V.I. GLOBAL STRATEGIC INCOME FUND |
| | | | | | | | | | |
| | | Principal Amount | | | Value | |
Health Care—2.4% | | | | | | | | | | |
Biotechnology—0.1% | | | | | | | | | | |
| WeWork Cos, Inc., 7.875% Sr. Unsec. | | | | | | | | | | |
| Nts., 5/1/251 | | $ | | | 855,000 | | | $ | 847,818 | |
| Health Care Equipment & Supplies—0.1% | |
| Hill-Rom Holdings, Inc., 5.75% Sr. Unsec. Nts., 9/1/231 | | | | | 495,000 | | | | 512,845 | |
| Hologic, Inc., 4.375% Sr. Unsec. Nts., 10/15/251 | | | | | 430,000 | | | | 438,062 | |
| | | | | | | | | | |
| | | | 950,907 | |
| |
| | | | | |
| Health Care Providers & Services—1.5% | |
| Acadia Healthcare Co., Inc.: | | | | | | | | | | |
| 5.625% Sr. Unsec. Nts., 2/15/23 | | | | | 305,000 | | | | 311,481 | |
| 6.50% Sr. Unsec. Nts., 3/1/24 | | | | | 250,000 | | | | 261,875 | |
| Centene Corp.: | | | | | | | | | | |
| 4.75% Sr. Unsec. Nts., 5/15/22 | | | | | 655,000 | | | | 671,375 | |
| 5.375% Sr. Unsec. Nts., 6/1/261 | | | | | 825,000 | | | | 869,344 | |
| 6.125% Sr. Unsec. Nts., 2/15/24 | | | | | 565,000 | | | | 592,544 | |
| CHS/Community Health Systems, Inc.: | | | | | | | | | | |
| 6.25% Sr. Sec. Nts., 3/31/23 | | | | | 1,255,000 | | | | 1,212,644 | |
| 6.875% Sr. Unsec. Nts., 2/1/22 | | | | | 404,000 | | | | 274,720 | |
| 8.00% Sr. Sec. Nts., 3/15/261 | | | | | 570,000 | | | | 549,212 | |
| DaVita, Inc.: | | | | | | | | | | |
| 5.00% Sr. Unsec. Nts., 5/1/25 | | | | | 275,000 | | | | 272,525 | |
| 5.125% Sr. Unsec. Nts., 7/15/24 | | | | | 1,775,000 | | | | 1,779,970 | |
| Encompass Health Corp., 5.75% Sr. | | | | | | | | | | |
| Unsec. Nts., 11/1/24 | | | | | 710,000 | | | | 725,655 | |
| Envision Healthcare Corp., 8.75% Sr. | | | | | | | | | | |
| Unsec. Nts., 10/15/261 | | | | | 635,000 | | | | 442,912 | |
| HCA, Inc.: | | | | | | | | | | |
| 4.125% Sr. Sec. Nts., 6/15/29 | | | | | 895,000 | | | | 916,104 | |
| 5.375% Sr. Unsec. Nts., 2/1/25 | | | | | 680,000 | | | | 735,675 | |
| 5.375% Sr. Unsec. Nts., 9/1/26 | | | | | 1,130,000 | | | | 1,220,400 | |
| 5.50% Sr. Sec. Nts., 6/15/47 | | | | | 365,000 | | | | 390,132 | |
| 5.625% Sr. Unsec. Nts., 9/1/28 | | | | | 1,285,000 | | | | 1,394,225 | |
| 5.875% Sr. Unsec. Nts., 2/15/26 | | | | | 275,000 | | | | 304,562 | |
| 7.50% Sr. Unsec. Nts., 2/15/22 | | | | | 1,125,000 | | | | 1,243,125 | |
| OCP SA, 4.50% Sr. Unsec. Nts., 10/22/251 | | | | | 1,570,000 | | | | 1,612,751 | |
| Omnicare, Inc., 4.75% Sr. Unsec. Nts., 12/1/22 | | | | | 1,765,000 | | | | 1,874,839 | |
| RegionalCare Hospital Partners Holdings, Inc./LifePoint Health, Inc., 9.75% Sr. Unsec. Nts., 12/1/261 | | | | | 855,000 | | | | 897,750 | |
| Select Medical Corp., 6.375% Sr. Unsec. Nts., 6/1/21 | | | | | 770,000 | | | | 772,002 | |
| Tenet Healthcare Corp.: | | | | | | | | | | |
| 4.375% Sr. Sec. Nts., 10/1/21 | | | | | 520,000 | | | | 530,400 | |
| 6.00% Sr. Sec. Nts., 10/1/20 | | | | | 385,000 | | | | 398,475 | |
| 6.25% Sec. Nts., 2/1/271 | | | | | 285,000 | | | | 293,906 | |
| 6.75% Sr. Unsec. Nts., 6/15/23 | | | | | 1,150,000 | | | | 1,158,625 | |
| 8.125% Sr. Unsec. Nts., 4/1/22 | | | | | 705,000 | | | | 742,894 | |
| TPC Group, Inc., 8.75% Sr. Sec. Nts., 12/15/201 | | | | | 420,000 | | | | 420,525 | |
| | | | | | | | | | |
| | | | 22,870,647 | |
| |
| | | | | |
| Health Care Technology—0.0% | |
| Telenet Finance Luxembourg Notes Sarl, 5.50% Sr. Sec. Nts., 3/1/281 | | | | | 805,000 | | | | 821,100 | |
Life Sciences Tools & Services—0.0% | |
| West Street Merger Sub, Inc., 6.375% Sr. Unsec. Nts., 9/1/251 | | | | | 415,000 | | | | 385,950 | |
Pharmaceuticals—0.7% | | | | | | | | | | |
| Bausch Health Americas, Inc., 8.50% Sr. Unsec. Nts., 1/31/271 | | | | | 685,000 | | | | 754,884 | |
| Bausch Health Cos, Inc.: | | | | | | | | | | |
| 7.00% Sr. Unsec. Nts., 1/15/281 | | | | | 325,000 | | | | 337,102 | |
| 7.25% Sr. Unsec. Nts., 5/30/291 | | | | | 325,000 | | | | 338,331 | |
| | | | | | | | | | |
| | | Principal Amount | | | Value | |
Pharmaceuticals (Continued) | | | | | | | | | | |
| Bausch Health Cos., Inc.: | | | | | | | | | | |
| 5.50% Sr. Unsec. Nts., 3/1/231 | | | | $ | 71,000 | | | $ | 71,834 | |
| 5.50% Sr. Sec. Nts., 11/1/251 | | | | | 790,000 | | | | 826,538 | |
| 5.75% Sr. Sec. Nts., 8/15/271 | | | | | 285,000 | | | | 300,242 | |
| 5.875% Sr. Unsec. Nts., 5/15/231 | | | | | 204,000 | | | | 207,135 | |
| 6.125% Sr. Unsec. Nts., 4/15/251 | | | | | 625,000 | | | | 639,062 | |
| 7.00% Sr. Sec. Nts., 3/15/241 | | | | | 635,000 | | | | 676,338 | |
| 9.00% Sr. Unsec. Nts., 12/15/251 | | | | | 935,000 | | | | 1,048,182 | |
| Endo Dac/Endo Finance LLC/Endo Finco, Inc.: | | | | | | | | | | |
| 5.875% Sr. Sec. Nts., 10/15/241 | | | | | 275,000 | | | | 262,625 | |
| 6.00% Sr. Unsec. Nts., 7/15/231 | | | | | 1,350,000 | | | | 978,750 | |
| 6.00% Sr. Unsec. Nts., 2/1/251 | | | | | 540,000 | | | | 364,500 | |
| Mallinckrodt International Finance SA/ Mallinckrodt CB LLC: | | | | | | | | | | |
| 4.875% Sr. Unsec. Nts., 4/15/201 | | | | | 535,000 | | | | 518,281 | |
| 5.50% Sr. Unsec. Nts., 4/15/251 | | | | | 570,000 | | | | 384,750 | |
| 5.75% Sr. Unsec. Nts., 8/1/221 | | | | | 455,000 | | | | 393,575 | |
| Prestige Brands, Inc., 6.375% Sr. Unsec. Nts., 3/1/241 | | | | | 325,000 | | | | 341,656 | |
| Teva Pharmaceutical Finance Co. BV, 3.65% Sr. Unsec. Nts., 11/10/21 | | | | | 460,000 | | | | 444,475 | |
| Teva Pharmaceutical Finance | | | | | | | | | | |
| Netherlands III BV: | | | | | | | | | | |
| 1.70% Sr. Unsec. Nts., 7/19/19 | | | | | 235,000 | | | | 234,354 | |
| 3.15% Sr. Unsec. Nts., 10/1/26 | | | | | 275,000 | | | | 214,500 | |
| 6.00% Sr. Unsec. Nts., 4/15/24 | | | | | 875,000 | | | | 828,516 | |
| | | | | | | | | | |
| | | | 10,165,630 | |
| |
| | | | | |
| Industrials—3.2% | |
Aerospace & Defense—0.4% | | | | | | | | | | |
| Arconic, Inc.: | | | | | | | | | | |
| 5.125% Sr. Unsec. Nts., 10/1/24 | | | | | 535,000 | | | | 565,380 | |
| 5.40% Sr. Unsec. Nts., 4/15/21 | | | | | 390,000 | | | | 404,414 | |
| Bombardier, Inc.: | | | | | | | | | | |
| 6.00% Sr. Unsec. Nts., 10/15/221 | | | | | 475,000 | | | | 479,413 | |
| 7.50% Sr. Unsec. Nts., 12/1/241 | | | | | 860,000 | | | | 879,350 | |
| 7.50% Sr. Unsec. Nts., 3/15/251 | | | | | 585,000 | | | | 588,832 | |
| 7.875% Sr. Unsec. Nts., 4/15/271 | | | | | 570,000 | | | | 572,137 | |
| DAE Funding LLC, 4.50% Sr. Unsec. Nts., 8/1/221 | | | | | 590,000 | | | | 600,325 | |
| Embraer Netherlands Finance BV, 5.40% Sr. Unsec. Nts., 2/1/27 | | | | | 609,000 | | | | 677,671 | |
| Kratos Defense & Security Solutions, Inc., 6.50% Sr. Sec. Nts., 11/30/251 | | | | | 400,000 | | | | 431,000 | |
| TransDigm, Inc.: | | | | | | | | | | |
| 6.25% Sr. Sec. Nts., 3/15/261 | | | | | 285,000 | | | | 298,894 | |
| 6.375% Sr. Unsec. Nts., 6/15/26 | | | | | 655,000 | | | | 665,644 | |
| 6.50% Sr. Unsec. Nts., 7/15/24 | | | | | 535,000 | | | | 543,694 | |
| Triumph Group, Inc., 5.25% Sr. Unsec. Nts., 6/1/22 | | | | | 245,000 | | | | 241,325 | |
| | | | | | | | | | |
| | | | 6,948,079 | |
| |
| | | | | |
| Air Freight & Couriers—0.1% | |
| XPO Logistics, Inc.: | | | | | | | | | | |
| 6.125% Sr. Unsec. Nts., 9/1/231 | | | | | 570,000 | | | | 592,087 | |
| 6.75% Sr. Unsec. Nts., 8/15/241 | | | | | 570,000 | | | | 609,188 | |
| | | | | | | | | | |
| | | | 1,201,275 | |
| |
| | | | | |
| Airlines—0.5% | |
| American Airlines Group, Inc.: | | | | | | | | | | |
| 4.625% Sr. Unsec. Nts., 3/1/201 | | | | | 645,000 | | | | 651,450 | |
| 5.00% Sr. Unsec. Nts., 6/1/221 | | | | | 1,190,000 | | | | 1,226,211 | |
| Controladora Mabe SA de CV, 5.60% Sr. Unsec. Nts., 10/23/281 | | | | | 2,285,000 | | | | 2,402,106 | |
| GMR Hyderabad International Airport Ltd., 5.375% Sr. Sec. Nts., 4/10/241 | | | | | 1,525,000 | | | | 1,548,581 | |
| Gol Finance, Inc., 7.00% Sr. Unsec. Nts., 1/31/251 | | | | | 515,000 | | | | 504,700 | |
| | |
| 19 INVESCO OPPENHEIMER V.I. GLOBAL STRATEGIC INCOME FUND |
CONSOLIDATED STATEMENT OF INVESTMENTSUnaudited / Continued
| | | | | | | | | | |
| | | Principal Amount | | | Value | |
| Airlines (Continued) | |
| United Continental Holdings, Inc.: | | | | | | | | | | |
| 4.25% Sr. Unsec. Nts., 10/1/22 | | | | $ | 800,000 | | | $ | 822,000 | |
| 4.875% Sr. Unsec. Nts., 1/15/25 | | | | | 740,000 | | | | 761,508 | |
| | | | | | | | | | |
| | | | | | | | | 7,916,556 | |
| |
| | | | | |
| Building Products—0.1% | |
| Builders FirstSource, Inc., 6.75% Sr. Sec. Nts., 6/1/271 | | | | | 75,000 | | | | 79,410 | |
| Standard Industries, Inc., 5.375% Sr. Unsec. Nts., 11/15/241 | | | | | 915,000 | | | | 950,456 | |
| | | | | | | | | | |
| | | | | | | | | 1,029,866 | |
| | | |
| | | | | | | | | | |
| Commercial Services & Supplies—0.6% | |
| ACCO Brands Corp., 5.25% Sr. Unsec. Nts., 12/15/241 | | | | | 1,575,000 | | | | 1,598,625 | |
| ADT Security Corp. (The), 6.25% Sr. Sec. Nts., 10/15/21 | | | | | 430,000 | | | | 456,875 | |
| Affinion Group, Inc., 12.50% Sr. Unsec. Nts., 11/10/223,11 | | | | | 1,078,936 | | | | 712,098 | |
| ARD Finance SA, 7.125% Sr. Sec. Nts., 9/15/2311 | | | | | 575,000 | | | | 590,812 | |
| Brink’s Co. (The), 4.625% Sr. Unsec. Nts., 10/15/271 | | | | | 870,000 | | | | 871,087 | |
| Clean Harbors, Inc.: | | | | | | | | | | |
| 4.875% Sr. Unsec. Nts., 7/15/271,7 | | | | | 290,000 | | | | 295,467 | |
| 5.125% Sr. Unsec. Nts., 6/1/21 | | | | | 830,000 | | | | 832,075 | |
| Covanta Holding Corp.: | | | | | | | | | | |
| 5.875% Sr. Unsec. Nts., 3/1/24 | | | | | 530,000 | | | | 547,225 | |
| 5.875% Sr. Unsec. Nts., 7/1/25 | | | | | 310,000 | | | | 323,563 | |
| 6.00% Sr. Unsec. Nts., 1/1/27 | | | | | 570,000 | | | | 598,500 | |
| LABL Escrow Issuer LLC, 6.75% Sr. Sec. Nts., 7/15/261,7 | | | | | 290,000 | | | | 293,770 | |
| RR Donnelley & Sons Co., 7.875% Sr. Unsec. Nts., 3/15/21 | | | | | 371,000 | | | | 380,275 | |
| West Corp.: | | | | | | | | | | |
| 5.375% Sr. Unsec. Nts., 7/15/221 | | | | | 685,000 | | | | 695,275 | |
| 8.50% Sr. Unsec. Nts., 10/15/251 | | | | | 665,000 | | | | 585,200 | |
| | | | | | | | | | |
| | | | | | | | | 8,780,847 | |
| Construction & Engineering—0.1% | |
| AECOM, 5.125% Sr. Unsec. Nts., 3/15/27 | | | | | 535,000 | | | | 559,075 | |
| Fideicomiso PA Pacifico Tres, 8.25% Sr. Sec. Nts., 1/15/351 | | | | | 510,000 | | | | 559,725 | |
| New Enterprise Stone & Lime Co., Inc., 6.25% Sr. Sec. Nts., 3/15/261 | | | | | 275,000 | | | | 279,812 | |
| | | | | | | | | | |
| | | | | | | | | 1,398,612 | |
| Electrical Equipment—0.1% | |
| Sensata Technologies BV, 5.625% Sr. Unsec. Nts., 11/1/241 | | | | | 670,000 | | | | 725,275 | |
| Vertiv Group Corp., 9.25% Sr. Unsec. Nts., 10/15/241 | | | | | 670,000 | | | | 644,875 | |
| Vertiv Intermediate Holding Corp., 12.00% Sr. Unsec. Nts., 2/15/221,11 | | | | | 570,000 | | | | 552,187 | |
| | | | | | | | | | |
| | | | | | | | | 1,922,337 | |
| Industrial Conglomerates—0.1% | |
| Icahn Enterprises LP/Icahn Enterprises Finance Corp.: | | | | | | | | | | |
| 5.875% Sr. Unsec. Nts., 2/1/22 | | | | | 385,000 | | | | 390,294 | |
| 6.25% Sr. Unsec. Nts., 5/15/261 | | | | | 585,000 | | | | 592,063 | |
| Wind Tre SpA, 5.00% Sr. Sec. Nts., 1/20/26 | | | | | 805,000 | | | | 783,144 | |
| | | | | | | | | | |
| | | | | | | | | 1,765,501 | |
| Machinery—0.2% | |
| Allison Transmission, Inc.: | | | | | | | | | | |
| 5.00% Sr. Unsec. Nts., 10/1/241 | | | | | 500,000 | | | | 511,875 | |
| 5.875% Sr. Unsec. Nts., 6/1/291 | | | | | 285,000 | | | | 300,377 | |
| Harsco Corp., 5.75% Sr. Unsec. Nts., 7/31/271 | | | | | 300,000 | | | | 312,579 | |
| | | | | | | | | | |
| | | Principal Amount | | | Value | |
| Machinery (Continued) | |
| Icahn Enterprises LP/Icahn Enterprises Finance Corp., 6.75% Sr. Unsec. Nts., 2/1/24 | | | | $ | 570,000 | | | $ | 594,225 | |
| Navistar International Corp., 6.625% Sr. Unsec. Nts., 11/1/251 | | | | | 865,000 | | | | 910,412 | |
| Terex Corp., 5.625% Sr. Unsec. Nts., 2/1/251 | | | | | 525,000 | | | | 532,219 | |
| | | | | | | | | | |
| | | | | | | | | 3,161,687 | |
| | | | | | | | | | |
| Professional Services—0.1% | |
| Brand Industrial Services, Inc., 8.50% Sr. Unsec. Nts., 7/15/251 | | | | | 665,000 | | | | 605,981 | |
| Nielsen Finance LLC/Nielsen Finance Co., 5.00% Sr. Unsec. Nts., 4/15/221 | | | | | 705,000 | | | | 707,644 | |
| | | | | | | | | | |
| | | | | | | | | 1,313,625 | |
| | | | | | | | | | |
| Road & Rail—0.3% | |
| Algeco Global Finance plc, 8.00% Sr. Sec. Nts., 2/15/231 | | | | | 270,000 | | | | 274,387 | |
| Avis Budget Car Rental LLC/Avis Budget Finance, Inc., 5.75% Sr. Unsec. Nts., 7/15/271,7 | | | | | 430,000 | | | | 433,420 | |
| DAE Funding LLC, 4.00% Sr. Unsec. Nts., 8/1/201 | | | | | 265,000 | | | | 265,663 | |
| Hertz Corp. (The): | | | | | | | | | | |
| 5.875% Sr. Unsec. Nts., 10/15/20 | | | | | 660,000 | | | | 661,155 | |
| 7.375% Sr. Unsec. Nts., 1/15/21 | | | | | 265,000 | | | | 265,464 | |
| 7.625% Sec. Nts., 6/1/221 | | | | | 535,000 | | | | 556,400 | |
| Rumo Luxembourg Sarl, 5.875% Sr. Unsec. Nts., 1/18/251 | | | | | 1,525,000 | | | | 1,621,685 | |
| | | | | | | | | | |
| | | | | | | | | 4,078,174 | |
| | | | | | | | | | |
| Trading Companies & Distributors—0.6% | |
| American Builders & Contractors Supply Co., Inc., 5.75% Sr. Unsec. Nts., 12/15/231 | | | | | 340,000 | | | | 353,175 | |
| Fly Leasing Ltd., 5.25% Sr. Unsec. Nts., 10/15/24 | | | | | 530,000 | | | | 543,250 | |
| H&E Equipment Services, Inc., 5.625% Sr. Unsec. Nts., 9/1/25 | | | | | 800,000 | | | | 825,800 | |
| Herc Rentals, Inc., 7.50% Sec. Nts., 6/1/221 | | | | | 473,000 | | | | 491,258 | |
| National Bank for Agriculture & Rural Development, 8.39% Sr. Unsec. Nts., 7/19/21 | | INR | | | 55,000,000 | | | | 811,699 | |
| Rumo Luxembourg Sarl, 7.375% Sr. Unsec. Nts., 2/9/241 | | | | | 1,525,000 | | | | 1,649,684 | |
| Standard Industries, Inc., 6.00% Sr. Unsec. Nts., 10/15/251 | | | | | 740,000 | | | | 789,025 | |
| United Rentals North America, Inc.: | | | | | | | | | | |
| 4.875% Sr. Unsec. Nts., 1/15/28 | | | | | 690,000 | | | | 705,525 | |
| 5.25% Sr. Unsec. Nts., 1/15/30 | | | | | 285,000 | | | | 293,550 | |
| 5.875% Sr. Unsec. Nts., 9/15/26 | | | | | 1,355,000 | | | | 1,448,156 | |
| 6.50% Sr. Unsec. Nts., 12/15/26 | | | | | 570,000 | | | | 618,450 | |
| | | | | | | | | | |
| | | | | | | | | 8,529,572 | |
| | | | | | | | | | |
| Transportation Infrastructure—0.0% | |
| Jasa Marga Persero Tbk PT, 7.50% Sr. Unsec. Nts., 12/11/201 | | IDR | | | 9,160,000,000 | | | | 632,806 | |
| Information Technology—1.8% | |
| Communications Equipment—0.4% | |
| Chaparral Energy, Inc., 8.75% Sr. Unsec. Nts., 7/15/231 | | | | | 430,000 | | | | 268,750 | |
| CommScope Technologies LLC, 6.00% | | | | | | | | | | |
| Sr. Unsec. Nts., 6/15/251 | | | | | 570,000 | | | | 537,060 | |
| HTA Group Ltd., 9.125% Sr. Unsec. Nts., 3/8/223 | | | | | 1,705,000 | | | | 1,794,683 | |
| Hughes Satellite Systems Corp.: | | | | | | | | | | |
| 5.25% Sr. Sec. Nts., 8/1/26 | | | | | 395,000 | | | | 407,344 | |
| 6.625% Sr. Unsec. Nts., 8/1/26 | | | | | 390,000 | | | | 410,962 | |
20 INVESCO OPPENHEIMER V.I. GLOBAL STRATEGIC INCOME FUND
| | | | | | | | |
| | | Principal Amount | | | Value |
| Communications Equipment (Continued) | |
| Infor US, Inc., 6.50% Sr. Unsec. Nts., 5/15/22 | | $ | 920,000 | | | $ | 939,642 | |
| Plantronics, Inc., 5.50% Sr. Unsec. Nts., 5/31/231 | | | 435,000 | | | | 433,912 | |
| Riverbed Technology, Inc., 8.875% Sr. Unsec. Nts., 3/1/231 | | | 215,000 | | | | 144,587 | |
| ViaSat, Inc.: | | | | | | | | |
| 5.625% Sr. Unsec. Nts., 9/15/251 | | | 265,000 | | | | 261,688 | |
| 5.625% Sr. Sec. Nts., 4/15/271 | | | 430,000 | | | | 448,275 | |
| | | | | | | | |
| | | | | | | 5,646,903 | |
| | | | | | | | |
| Electronic Equipment, Instruments, & Components—0.1% | |
| CDW LLC/CDW Finance Corp., 5.00% Sr. Unsec. Nts., 9/1/23 | | | 485,000 | | | | 495,912 | |
| TTM Technologies, Inc., 5.625% Sr. Unsec. Nts., 10/1/251 | | | 800,000 | | | | 784,208 | |
| | | | | | | | |
| | | | | | | 1,280,120 | |
| | | | | | | | |
| Internet Software & Services—0.1% | |
| Rackspace Hosting, Inc., 8.625% Sr. Unsec. Nts., 11/15/241 | | | 1,395,000 | | | | 1,286,888 | |
| IT Services—0.4% | | | | | | | | |
| Alliance Data Systems Corp., 5.375% Sr. Unsec. Nts., 8/1/221 | | | 275,000 | | | | 279,606 | |
| Everi Payments, Inc., 7.50% Sr. Unsec. Nts., 12/15/251 | | | 1,075,000 | | | | 1,126,062 | |
| Exela Intermediate LLC/Exela Finance, Inc., 10.00% Sr. Sec. Nts., 7/15/231 | | | 770,000 | | | | 629,475 | |
| First Data Corp.: | | | | | | | | |
| 5.00% Sr. Sec. Nts., 1/15/241 | | | 455,000 | | | | 466,432 | |
| 5.75% Sec. Nts., 1/15/241 | | | 910,000 | | | | 937,300 | |
| Gartner, Inc., 5.125% Sr. Unsec. Nts., 4/1/251 | | | 780,000 | | | | 806,450 | |
| Harland Clarke Holdings Corp., 6.875% Sr. Sec. Nts., 3/1/201 | | | 530,000 | | | | 524,038 | |
| Sabre GLBL, Inc., 5.25% Sr. Sec. Nts., 11/15/231 | | | 900,000 | | | | 931,500 | |
| VeriSign, Inc., 4.75% Sr. Unsec. Nts., 7/15/27 | | | 590,000 | | | | 616,550 | |
| | | | | | | | |
| | | | | | | 6,317,413 | |
| | | | | | | | |
| Semiconductors & Semiconductor Equipment—0.0% | |
| Qorvo, Inc., 5.50% Sr. Unsec. Nts., 7/15/26 | | | 555,000 | | | | 588,744 | |
| Versum Materials, Inc., 5.50% Sr. Unsec. Nts., 9/30/241 | | | 250,000 | | | | 268,438 | |
| | | | | | | | |
| | | | | | | 857,182 | |
| | | | | | | | |
| Software—0.6% | |
| Dell International LLC/EMC Corp.: | |
| 4.42% Sr. Sec. Nts., 6/15/211 | | | 2,916,000 | | | | 3,003,995 | |
| 7.125% Sr. Unsec. Nts., 6/15/241 | | | 745,000 | | | | 786,518 | |
| Informatica LLC, 7.125% Sr. Unsec. Nts., 7/15/231 | | | 595,000 | | | | 607,001 | |
| j2 Cloud Services LLC/j2 Global Co.- Obligor, Inc., 6.00% Sr. Unsec. Nts., 7/15/251 | | | 790,000 | | | | 830,488 | |
| Symantec Corp.: | | | | | | | | |
| 4.20% Sr. Unsec. Nts., 9/15/20 | | | 365,000 | | | | 370,757 | |
| 5.00% Sr. Unsec. Nts., 4/15/251 | | | 495,000 | | | | 507,664 | |
| TIBCO Software, Inc., 11.375% Sr. Unsec. Nts., 12/1/211 | | | 625,000 | | | | 664,453 | |
| Uber Technologies, Inc.: | | | | | | | | |
| 7.50% Sr. Unsec. Nts., 11/1/231 | | | 285,000 | | | | 302,813 | |
| 8.00% Sr. Unsec. Nts., 11/1/261 | | | 285,000 | | | | 304,272 | |
| Veritas US, Inc./Veritas Bermuda Ltd., 7.50% Sr. Sec. Nts., 2/1/231 | | | 1,125,000 | | | | 1,057,500 | |
| | | | | | | | |
| | | | | | | 8,435,461 | |
| | | | | | | | |
| | | Principal Amount | | | Value |
| Technology Hardware, Storage & Peripherals—0.2% | |
| Banff Merger Sub, Inc., 9.75% Sr. Unsec. Nts., 9/1/261 | | $ | 850,000 | | | $ | 741,625 | |
| Harland Clarke Holdings Corp., 8.375% Sr. Sec. Nts., 8/15/221 | | | 920,000 | | | | 785,450 | |
| NCR Corp., 6.375% Sr. Unsec. Nts., 12/15/23 | | | 520,000 | | | | 537,550 | |
| Western Digital Corp., 4.75% Sr. Unsec. Nts., 2/15/26 | | | 570,000 | | | | 560,623 | |
| Xerox Corp., 2.80% Sr. Unsec. Nts., 5/15/20 | | | 535,000 | | | | 535,107 | |
| | | | | | | | |
| | | | | | | 3,160,355 | |
| | | | | | | | |
| Materials—4.2% | |
| Chemicals—1.3% | |
| Ashland LLC: | | | | | | | | |
| 4.75% Sr. Unsec. Nts., 8/15/22 | | | 285,000 | | | | 298,894 | |
| 6.875% Sr. Unsec. Nts., 5/15/43 | | | 295,000 | | | | 320,812 | |
| Avantor, Inc.: | | | | | | | | |
| 6.00% Sr. Sec. Nts., 10/1/241 | | | 415,000 | | | | 442,597 | |
| 9.00% Sr. Unsec. Nts., 10/1/251 | | | 725,000 | | | | 810,187 | |
| Blue Cube Spinco LLC, 9.75% Sr. Unsec. Nts., 10/15/23 | | | 285,000 | | | | 315,637 | |
| Celanese US Holdings LLC, 5.875% Sr. Unsec. Nts., 6/15/21 | | | 1,419,000 | | | | 1,503,894 | |
| CF Industries, Inc.: | | | | | | | | |
| 3.40% Sr. Sec. Nts., 12/1/211 | | | 2,590,000 | | | | 2,629,486 | |
| 5.15% Sr. Unsec. Nts., 3/15/34 | | | 335,000 | | | | 328,300 | |
| 5.375% Sr. Unsec. Nts., 3/15/44 | | | 405,000 | | | | 381,834 | |
| Chemours Co. (The), 6.625% Sr. Unsec. Nts., 5/15/23 | | | 233,000 | | | | 241,882 | |
| Consolidated Energy Finance SA, 6.50% Sr. Unsec. Nts., 5/15/261 | | | 275,000 | | | | 274,313 | |
| CVR Partners LP/CVR Nitrogen Finance Corp., 9.25% Sec. Nts., 6/15/231 | | | 185,000 | | | | 194,148 | |
| Element Solutions, Inc., 5.875% Sr. Unsec. Nts., 12/1/251 | | | 305,000 | | | | 319,106 | |
| Hexion, Inc.: | | | | | | | | |
| 6.625% Sr. Sec. Nts., 4/15/2012 | | | 1,020,000 | | | | 886,886 | |
| 10.375% Sr. Sec. Nts., 2/1/221,12 | | | 240,000 | | | | 205,598 | |
| Koppers, Inc., 6.00% Sr. Unsec. Nts., 2/15/251 | | | 350,000 | | | | 329,875 | |
| LSB Industries, Inc., 9.625% Sr. Sec. Nts., 5/1/231 | | | 135,000 | | | | 138,038 | |
| Mexichem SAB de CV, 4.875% Sr. Unsec. Nts., 9/19/221 | | | 1,455,000 | | | | 1,529,947 | |
| NOVA Chemicals Corp.: | | | | | | | | |
| 4.875% Sr. Unsec. Nts., 6/1/241 | | | 260,000 | | | | 270,075 | |
| 5.25% Sr. Unsec. Nts., 8/1/231 | | | 340,000 | | | | 345,950 | |
| Olin Corp.: | | | | | | | | |
| 5.00% Sr. Unsec. Nts., 2/1/30 | | | 240,000 | | | | 238,200 | |
| 5.125% Sr. Unsec. Nts., 9/15/27 | | | 300,000 | | | | 309,375 | |
| Petkim Petrokimya Holding AS, 5.875% Sr. Unsec. Nts., 1/26/231 | | | 800,000 | | | | 774,848 | |
| PQ Corp.: | | | | | | | | |
| 5.75% Sr. Unsec. Nts., 12/15/251 | | | 270,000 | | | | 274,388 | |
| 6.75% Sr. Sec. Nts., 11/15/221 | | | 285,000 | | | | 296,141 | |
| Rain CII Carbon LLC/CII Carbon Corp., 7.25% Sec. Nts., 4/1/251 | | | 480,000 | | | | 446,400 | |
| Sociedad Quimica y Minera de Chile SA, 4.25% Sr. Unsec. Nts., 5/7/291 | | | 780,000 | | | | 820,844 | |
| Starfruit Finco BV/Starfruit US Holdco LLC: | | | | | | | | |
| 6.50% Sr. Unsec. Nts., 10/1/261 | | EUR | 1,455,000 | | | | 1,679,221 | |
| 8.00% Sr. Unsec. Nts., 10/1/261 | | | 430,000 | | | | 443,975 | |
| Tronox Finance plc, 5.75% Sr. Unsec. Nts., 10/1/251 | | | 535,000 | | | | 520,956 | |
| Tronox, Inc., 6.50% Sr. Unsec. Nts., 4/15/261 | | | 285,000 | | | | 283,136 | |
21 INVESCO OPPENHEIMER V.I. GLOBAL STRATEGIC INCOME FUND
CONSOLIDATED STATEMENT OF INVESTMENTSUnaudited / Continued
| | | | | | | | | | | | |
| | | Principal Amount | | | Value | |
| Chemicals (Continued) | | | | | | | | | | | | |
| Venator Finance Sarl/Venator Materials LLC, 5.75% Sr. Unsec. Nts., 7/15/251 | | $ | | | | | 610,000 | | | $ | 561,963 | |
| WR Grace & Co.-Conn, 5.125% Sr. Unsec. Nts., 10/1/211 | | | | | | | 1,145,000 | | | | 1,193,663 | |
| | | | | | | | | | | | |
| | | | | | | | | | | | 19,610,569 | |
| Construction Materials—0.2% | | | | | | | | | | | | |
| Cemex Finance LLC, 6.00% Sr. Sec. Nts., 4/1/241 | | | | | | | 1,525,000 | | | | 1,574,562 | |
| CIMPOR Financial Operations BV, 5.75% Sr. Unsec. Nts., 7/17/241 | | | | | | | 1,250,000 | | | | 1,101,563 | |
| US Concrete, Inc., 6.375% Sr. Unsec. Nts., 6/1/24 | | | | | | | 600,000 | | | | 628,500 | |
| | | | | | | | | | | | |
| | | | | | | | | | | | 3,304,625 | |
| Containers & Packaging—0.8% | | | | | |
| ARD Securities Finance Sarl, 8.75% Sr. Sec. Nts., 1/31/231,11 | | | | | | | 889,525 | | | | 900,644 | |
| Ball Corp., 4.375% Sr. Unsec. Nts., 12/15/20 | | | | | | | 1,825,000 | | | | 1,869,712 | |
| Berry Global Escrow Corp.: | | | | | | | | | | | | |
| 4.875% Sr. Sec. Nts., 7/15/261 | | | | | | | 300,000 | | | | 306,733 | |
| 5.625% Sec. Nts., 7/15/271 | | | | | | | 150,000 | | | | 156,102 | |
| BWAY Holding Co.: | | | | | | | | | | | | |
| 5.50% Sr. Sec. Nts., 4/15/241 | | | | | | | 290,000 | | | | 291,269 | |
| 7.25% Sr. Unsec. Nts., 4/15/251 | | | | | | | 555,000 | | | | 536,962 | |
| Cascades, Inc., 5.50% Sr. Unsec. Nts., 7/15/221 | | | | | | | 285,000 | | | | 287,494 | |
| Crown Americas LLC/Crown Americas Capital Corp. IV, 4.50% Sr. Unsec. Nts., 1/15/23 | | | | | | | 605,000 | | | | 631,469 | |
| Flex Acquisition Co., Inc., 7.875% Sr. Unsec. Nts., 7/15/261 | | | | | | | 555,000 | | | | 513,375 | |
| Graphic Packaging International LLC: | | | | | | | | | | | | |
| 4.75% Sr. Unsec. Nts., 4/15/21 | | | | | | | 1,460,000 | | | | 1,491,025 | |
| 4.875% Sr. Unsec. Nts., 11/15/22 | | | | | | | 360,000 | | | | 374,850 | |
| Greif, Inc., 6.50% Sr. Unsec. Nts., 3/1/271 | | | | | | | 285,000 | | | | 294,975 | |
| Intertape Polymer Group, Inc., 7.00% Sr. Unsec. Nts., 10/15/261 | | | | | | | 570,000 | | | | 590,662 | |
| OI European Group BV, 4.00% Sr. Unsec. Nts., 3/15/231 | | | | | | | 535,000 | | | | 539,013 | |
| Owens-Brockway Glass Container, Inc., 5.00% Sr. Unsec. Nts., 1/15/221 | | | | | | | 500,000 | | | | 514,375 | |
| Plastipak Holdings, Inc., 6.25% Sr. Unsec. Nts., 10/15/251 | | | | | | | 800,000 | | | | 728,000 | |
| Reynolds Group Issuer, Inc./Reynolds Group Issuer LLC/Reynolds Group Issuer Luxembourg SA: | | | | | | | | | | | | |
| 5.125% Sr. Sec. Nts., 7/15/231 | | | | | | | 745,000 | | | | 760,831 | |
| 7.00% Sr. Unsec. Nts., 7/15/241 | | | | | | | 995,000 | | | | 1,030,716 | |
| Sealed Air Corp.: | | | | | | | | | | | | |
| 4.875% Sr. Unsec. Nts., 12/1/221 | | | | | | | 585,000 | | | | 615,713 | |
| 6.875% Sr. Unsec. Nts., 7/15/331 | | | | | | | 270,000 | | | | 302,144 | |
| | | | | | | | | | | | |
| | | | | | | | | | | | 12,736,064 | |
| Metals & Mining—1.6% | | | | | |
| AK Steel Corp., 6.375% Sr. Unsec. Nts., 10/15/25 | | | | | | | 405,000 | | | | 326,025 | |
| Alcoa Nederland Holding BV: | | | | | | | | | | | | |
| 6.125% Sr. Unsec. Nts., 5/15/281 | | | | | | | 510,000 | | | | 534,225 | |
| 6.75% Sr. Unsec. Nts., 9/30/241 | | | | | | | 245,000 | | | | 260,006 | |
| 7.00% Sr. Unsec. Nts., 9/30/261 | | | | | | | 240,000 | | | | 258,900 | |
| Aleris International, Inc., 10.75% Sec. Nts., 7/15/231 | | | | | | | 280,000 | | | | 292,950 | |
| Allegheny Technologies, Inc.: | | | | | | | | | | | | |
| 5.95% Sr. Unsec. Nts., 1/15/21 | | | | | | | 285,000 | | �� | | 294,262 | |
| 7.875% Sr. Unsec. Nts., 8/15/23 | | | | | | | 285,000 | | | | 306,460 | |
| Amsted Industries, Inc., 5.625% Sr. Unsec. Nts., 7/1/271 | | | | | | | 300,000 | | | | 313,304 | |
| ArcelorMittal: | | | | | | | | | | | | |
| 6.75% Sr. Unsec. Nts., 3/1/41 | | | | | | | 295,000 | | | | 344,131 | |
| | | | | | | | |
| | | Principal Amount | | | Value |
| Metals & Mining (Continued) | | | | | |
| ArcelorMittal: (Continued) 7.00% Sr. Unsec. Nts., 10/15/39 | | $ | 145,000 | | | $ | 172,190 | |
| Arconic, Inc., 6.15% Sr. Unsec. Nts., 8/15/20 | | | 285,000 | | | | 295,048 | |
| Cleveland-Cliffs, Inc.: | | | | | | | | |
| 5.75% Sr. Unsec. Nts., 3/1/25 | | | 148,000 | | | | 147,630 | |
| 5.875% Sr. Unsec. Nts., 6/1/271 | | | 705,000 | | | | 687,375 | |
| Coeur Mining, Inc., 5.875% Sr. Unsec. Nts., 6/1/24 | | | 575,000 | | | | 562,781 | |
| CSN Resources SA, 7.625% Sr. Unsec. Nts., 2/13/231 | | | 1,210,000 | | | | 1,281,087 | |
| Eldorado Gold Corp., 9.50% Sec. Nts., 6/1/241 | | | 180,000 | | | | 180,900 | |
| Evraz plc, 5.375% Sr. Unsec. Nts., 3/20/231 | | | 2,285,000 | | | | 2,379,005 | |
| Ferroglobe plc/Globe Specialty Metals, Inc., 9.375% Sr. Unsec. Nts., 3/1/221 | | | 750,000 | | | | 654,375 | |
| First Quantum Minerals Ltd.: | | | | | | | | |
| 7.00% Sr. Unsec. Nts., 2/15/211 | | | 76,000 | | | | 77,663 | |
| 7.25% Sr. Unsec. Nts., 4/1/231 | | | 780,000 | | | | 762,450 | |
| FMG Resources August 2006 Pty Ltd., 4.75% Sr. Unsec. Nts., 5/15/221 | | | 285,000 | | | | 295,516 | |
| Freeport-McMoRan, Inc.: | | | | | | | | |
| 3.55% Sr. Unsec. Nts., 3/1/22 | | | 285,000 | | | | 286,069 | |
| 4.00% Sr. Unsec. Nts., 11/14/21 | | | 3,280,000 | | | | 3,349,700 | |
| 4.55% Sr. Unsec. Nts., 11/14/24 | | | 270,000 | | | | 276,683 | |
| 5.40% Sr. Unsec. Nts., 11/14/34 | | | 600,000 | | | | 574,500 | |
| 5.45% Sr. Unsec. Nts., 3/15/43 | | | 350,000 | | | | 322,000 | |
| Hudbay Minerals, Inc., 7.625% Sr. Unsec. Nts., 1/15/251 | | | 520,000 | | | | 539,500 | |
| IAMGOLD Corp., 7.00% Sr. Unsec. Nts., 4/15/251 | | | 225,000 | | | | 234,000 | |
| JSW Steel Ltd.: | | | | | | | | |
| 4.75% Sr. Unsec. Nts., 11/12/194 | | | 950,000 | | | | 952,366 | |
| 5.25% Sr. Unsec. Nts., 4/13/224 | | | 1,600,000 | | | | 1,645,753 | |
| 5.95% Sr. Unsec. Nts., 4/18/244 | | | 975,000 | | | | 1,007,803 | |
| Kinross Gold Corp., 4.50% Sr. Unsec. Nts., 7/15/27 | | | 450,000 | | | | 455,625 | |
| Metinvest BV, 7.75% Sr. Unsec. Nts., 4/23/231 | | | 465,000 | | | | 481,903 | |
| Southern Copper Corp., 7.50% Sr. Unsec. Nts., 7/27/35 | | | 480,000 | | | | 631,200 | |
| SunCoke Energy Partners LP/SunCoke Energy Partners Finance Corp., 7.50% Sr. Unsec. Nts., 6/15/251 | | | 1,490,000 | | | | 1,460,200 | |
| Teck Resources Ltd., 5.20% Sr. Unsec. Nts., 3/1/42 | | | 405,000 | | | | 410,492 | |
| United States Steel Corp.: | | | | | | | | |
| 6.25% Sr. Unsec. Nts., 3/15/26 | | | 140,000 | | | | 125,125 | |
| 6.875% Sr. Unsec. Nts., 8/15/25 | | | 460,000 | | | | 434,700 | |
| Zekelman Industries, Inc., 9.875% Sr. Sec. Nts., 6/15/231 | | | 275,000 | | | | 290,469 | |
| | | | | | | | |
| | | | | | | | 23,904,371 | |
| Paper & Forest Products—0.3% | | | | | |
| Louisiana-Pacific Corp., 4.875% Sr. Unsec. Nts., 9/15/24 | | | 255,000 | | | | 259,781 | |
| Mercer International, Inc.: | | | | | | | | |
| 5.50% Sr. Unsec. Nts., 1/15/26 | | | 250,000 | | | | 249,687 | |
| 6.50% Sr. Unsec. Nts., 2/1/24 | | | 165,000 | | | | 171,394 | |
| Norbord, Inc., 5.75% Sr. Sec. Nts., 7/15/271 | | | 565,000 | | | | 571,520 | |
| Suzano Austria GmbH, 5.00% Sr. Unsec. Nts., 1/15/301 | | | 3,050,000 | | | | 3,085,786 | |
| | | | | | | | |
| | | | | | | | 4,338,168 | |
| Telecommunication Services—2.5% | | | | | |
| Diversified Telecommunication Services—1.3% | | | | | |
| Axtel SAB de CV, 6.375% Sr. Unsec. Nts., 11/14/241 | | | 1,455,000 | | | | 1,487,752 | |
22 INVESCO OPPENHEIMER V.I. GLOBAL STRATEGIC INCOME FUND
| | | | | | | | |
| | | Principal Amount | | | Value |
| Diversified Telecommunication Services (Continued) | |
| CenturyLink, Inc.: | | | | | | | | |
| 5.625% Sr. Unsec. Nts., 4/1/25 | | $ | 785,000 | | | $ | 802,662 | |
| 6.15% Sr. Unsec. Nts., Series Q, 9/15/19 | | | 340,000 | | | | 342,380 | |
| 6.45% Sr. Unsec. Nts., Series S, 6/15/21 | | | 615,000 | | | | 651,900 | |
| 7.50% Sr. Unsec. Nts., Series Y, 4/1/24 | | | 940,000 | | | | 1,042,225 | |
| Cincinnati Bell, Inc., 8.00% Sr. Unsec. Nts., 10/15/251 | | | 265,000 | | | | 226,575 | |
| Digicel International Finance Ltd./Digicel Holdings Bermuda Ltd., 8.75% Sr. Sec. Nts., 5/25/241 | | | 285,000 | | | | 272,175 | |
| Eldorado Resorts, Inc., 6.00% Sr. Unsec. Nts., 9/15/26 | | | 425,000 | | | | 466,437 | |
| Frontier Communications Corp.: | | | | | | | | |
| 8.00% Sr. Sec. Nts., 4/1/271 | | | 855,000 | | | | 891,337 | |
| 8.50% Sec. Nts., 4/1/261 | | | 795,000 | | | | 773,137 | |
| 8.75% Sr. Unsec. Nts., 4/15/22 | | | 590,000 | | | | 380,550 | |
| 10.50% Sr. Unsec. Nts., 9/15/22 | | | 735,000 | | | | 501,637 | |
| 11.00% Sr. Unsec. Nts., 9/15/25 | | | 285,000 | | | | 178,125 | |
| GCI LLC: | | | | | | | | |
| 6.625% Sr. Unsec. Nts., 6/15/241 | | | 150,000 | | | | 157,545 | |
| 6.75% Sr. Unsec. Nts., 6/1/21 | | | 140,000 | | | | 140,175 | |
| Inmarsat Finance plc, 4.875% Sr. Unsec. Nts., 5/15/221 | | | 420,000 | | | | 424,725 | |
| Intelsat Jackson Holdings SA: | | | | | | | | |
| 5.50% Sr. Unsec. Nts., 8/1/23 | | | 255,000 | | | | 233,963 | |
| 8.00% Sr. Sec. Nts., 2/15/241 | | | 615,000 | | | | 642,675 | |
| 8.50% Sr. Unsec. Nts., 10/15/241 | | | 565,000 | | | | 562,175 | |
| 9.75% Sr. Unsec. Nts., 7/15/251 | | | 585,000 | | | | 602,550 | |
| Intelsat Luxembourg SA, 7.75% Sr. Unsec. Nts., 6/1/21 | | | 885,000 | | | | 851,813 | |
| Level 3 Financing, Inc., 5.25% Sr. Unsec. Nts., 3/15/26 | | | 1,175,000 | | | | 1,219,063 | |
| Oi SA, 10.00% Sr. Unsec. Nts., 7/27/2511 | | | 2,500,000 | | | | 2,593,750 | |
| Qwest Corp., 6.875% Sr. Unsec. Nts., 9/15/33 | | | 785,000 | | | | 784,886 | |
| Telecom Italia SpA, 5.303% Sr. Unsec. Nts., 5/30/241 | | | 435,000 | | | | 451,856 | |
| T-Mobile USA, Inc.: | | | | | | | | |
| 4.00% Sr. Unsec. Nts., 4/15/22 | | | 780,000 | | | | 799,500 | |
| 5.125% Sr. Unsec. Nts., 4/15/25 | | | 345,000 | | | | 360,363 | |
| 6.00% Sr. Unsec. Nts., 4/15/24 | | | 710,000 | | | | 741,950 | |
| Windstream Services LLC/Windstream Finance Corp., 8.625% Sr. Sec. Nts., 10/31/2512 | | | 537,000 | | | | 550,425 | |
| Zayo Group LLC/Zayo Capital, Inc., 6.00% Sr. Unsec. Nts., 4/1/23 | | | 815,000 | | | | 837,413 | |
| | | | | | | | |
| | | | | | | 19,971,719 | |
| | | | | | | | |
| Wireless Telecommunication Services—1.2% | |
| Bharti Airtel Ltd., 4.375% Sr. Unsec. Nts., 6/10/251 | | | 250,000 | | | | 252,946 | |
| Fortress Transportation & Infrastructure Investors LLC, 6.50% Sr. Unsec. Nts., 10/1/251 | | | 715,000 | | | | 738,237 | |
| Gogo Intermediate Holdings LLC/Gogo Finance Co., Inc., 9.875% Sr. Sec. Nts., 5/1/241 | | | 285,000 | | | | 293,906 | |
| GTH Finance BV, 7.25% Sr. Unsec. Nts., 4/26/231 | | | 2,250,000 | | | | 2,464,763 | |
| Springleaf Finance Corp.: | | | | | | | | |
| 6.125% Sr. Unsec. Nts., 5/15/22 | | | 785,000 | | | | 845,838 | |
| 6.875% Sr. Unsec. Nts., 3/15/25 | | | 560,000 | | | | 614,589 | |
| 7.125% Sr. Unsec. Nts., 3/15/26 | | | 850,000 | | �� | | 930,495 | |
| 8.25% Sr. Unsec. Nts., 12/15/20 | | | 490,000 | | | | 527,363 | |
| Sprint Capital Corp.: | | | | | | | | |
| 6.875% Sr. Unsec. Nts., 11/15/28 | | | 1,272,158 | | | | 1,319,864 | |
| 8.75% Sr. Unsec. Nts., 3/15/32 | | | 375,000 | | | | 435,000 | |
| Sprint Communications, Inc.: | | | | | | | | |
| 6.00% Sr. Unsec. Nts., 11/15/22 | | | 1,484,000 | | | | 1,550,780 | |
| | | | | | | | | | | | |
| | | Principal Amount | | | Value |
| Wireless Telecommunication Services (Continued) | | | | | |
| Sprint Communications, Inc.: (Continued) | | | | | | | | | | | | |
| 7.00% Sr. Unsec. Nts., 3/1/201 | | | $ | | | | 850,000 | | | $ | 873,375 | |
| Sprint Corp.: | | | | | | | | | | | | |
| 7.125% Sr. Unsec. Nts., 6/15/24 | | | | | | | 1,395,000 | | | | 1,482,606 | |
| 7.625% Sr. Unsec. Nts., 3/1/26 | | | | | | | 830,000 | | | | 886,855 | |
| 7.875% Sr. Unsec. Nts., 9/15/23 | | | | | | | 2,075,000 | | | | 2,261,750 | |
| Telefonica Europe BV, 5.875% [EUSA10+430.1] Jr. Sub. Perpetual Bonds2,4,14 | | | EUR | | | | 1,410,000 | | | | 1,865,101 | |
| Trilogy International Partners LLC/Trilogy International Finance, Inc., 8.875% Sr. Sec. Nts., 5/1/221 | | | | | | | 685,000 | | | | 664,450 | |
| | | | | | | | | | | | |
| | | | | | | | | | | 18,007,918 | |
| | | | | | | | | | | | |
| Utilities—1.4% | | | | | | | | | | | | |
| Electric Utilities—0.1% | | | | | | | | | | | | |
| Inkia Energy Ltd., 5.875% Sr. Unsec. Nts., 11/9/271 | | | | | | | 1,865,000 | | | | 1,920,969 | |
| NextEra Energy Operating Partners LP, 4.50% Sr. Unsec. Nts., 9/15/271 | | | | | | | 125,000 | | | | 123,906 | |
| Talen Energy Supply LLC, 7.25% Sr. Sec. Nts., 5/15/271 | | | | | | | 300,000 | | | | 308,227 | |
| | | | | | | | | | | | |
| | | | | | | | | | | 2,353,102 | |
| | | | | | | | | | | | |
| Gas Utilities—0.5% | | | | | | | | | | | | |
| AmeriGas Partners LP/AmeriGas Finance Corp., 5.50% Sr. Unsec. Nts., 5/20/25 | | | | | | | 550,000 | | | | 581,625 | |
| Empresa de Transmision Electrica SA, 5.125% Sr. Unsec. Nts., 5/2/491 | | | | | | | 750,000 | | | | 822,000 | |
| Naturgy Finance BV, 4.125% [EUSA8+335.3] Jr. Sub. Perpetual Bonds2,4,14 | | | EUR | | | | 1,410,000 | | | | 1,745,884 | |
| Perusahaan Listrik Negara PT, 4.125% Sr. Unsec. Nts., 5/15/271 | | | | | | | 3,045,000 | | | | 3,113,505 | |
| Suburban Propane Partners LP/Suburban Energy Finance Corp., 5.875% Sr. Unsec. Nts., 3/1/27 | | | | | | | 645,000 | | | | 649,838 | |
| Superior Plus LP/Superior General Partner, Inc., 7.00% Sr. Unsec. Nts., 7/15/261 | | | | | | | 275,000 | | | | 285,656 | |
| | | | | | | | | | | | |
| | | | | | | | | | | 7,198,508 | |
| | | | | | | | | | | | |
| Independent Power and Renewable Electricity Producers—0.7% | |
| Adani Green Energy UP Ltd./Prayatna Developers Pvt Ltd./Parampujya Solar Energy, 6.25% Sr. Sec. Nts., 12/10/241 | | | | | | | 1,620,000 | | | | 1,657,471 | |
| AES Andres BV/Dominican Power Partners/Empresa Generadora de Electricidad Itabo SA, 7.95% Sr. Unsec. Nts., 5/11/261 | | | | | | | 490,000 | | | | 532,267 | |
| AES Corp.: | | | | | | | | | | | | |
| 4.00% Sr. Unsec. Nts., 3/15/21 | | | | | | | 275,000 | | | | 280,500 | |
| 6.00% Sr. Unsec. Nts., 5/15/26 | | | | | | | 380,000 | | | | 404,700 | |
| Azure Power Energy Ltd., 5.50% Sr. Sec. Nts., 11/3/221 | | | | | | | 610,000 | | | | 617,131 | |
| Calpine Corp.: | | | | | | | | | | | | |
| 5.25% Sr. Sec. Nts., 6/1/261 | | | | | | | 965,000 | | | | 985,506 | |
| 5.75% Sr. Unsec. Nts., 1/15/25 | | | | | | | 590,000 | | | | 587,787 | |
| 5.875% Sr. Sec. Nts., 1/15/241 | | | | | | | 275,000 | | | | 281,875 | |
| Clearway Energy Operating LLC, 5.75% Sr. Unsec. Nts., 10/15/251 | | | | | | | 285,000 | | | | 290,344 | |
| Drax Finco plc, 6.625% Sr. Sec. Nts., 11/1/251 | | | | | | | 275,000 | | | | 282,444 | |
| Listrindo Capital BV, 4.95% Sr. Unsec. Nts., 9/14/261 | | | | | | | 2,285,000 | | | | 2,262,721 | |
| NRG Energy, Inc.: | | | | | | | | | | | | |
| 3.75% Sr. Sec. Nts., 6/15/241 | | | | | | | 595,000 | | | | 611,774 | |
| 6.625% Sr. Unsec. Nts., 1/15/27 | | | | | | | 665,000 | | | | 724,850 | |
| 7.25% Sr. Unsec. Nts., 5/15/26 | | | | | | | 520,000 | | | | 574,600 | |
| Vistra Operations Co. LLC: | | | | | | | | | | | | |
| 5.00% Sr. Unsec. Nts., 7/31/271 | | | | | | | 595,000 | | | | 616,345 | |
23 INVESCO OPPENHEIMER V.I. GLOBAL STRATEGIC INCOME FUND
CONSOLIDATED STATEMENT OF INVESTMENTSUnaudited / Continued
| | | | | | | | |
| | | Principal Amount | | | Value |
| Independent Power and Renewable Electricity Producers (Continued) | |
Vistra Operations Co. LLC: (Continued) 5.50% Sr. Unsec. Nts., 9/1/261 | | $ | 280,000 | | | $ | 296,450 | |
| | | | | | | | |
| | | | | | | | 11,006,765 | |
| Multi-Utilities—0.1% | | | | | |
| Crestwood Midstream Partners LP/ Crestwood Midstream Finance Corp., 6.25% Sr. Unsec. Nts., 4/1/23 | | | 265,000 | | | | 271,625 | |
| NGPL PipeCo LLC: | | | | | | | | |
| 4.375% Sr. Unsec. Nts., 8/15/223 | | | 340,000 | | | | 351,900 | |
| 4.875% Sr. Unsec. Nts., 8/15/271 | | | 395,000 | | | | 419,687 | |
| Rockpoint Gas Storage Canada Ltd., 7.00% Sr. Sec. Nts., 3/31/231 | | | 365,000 | | | | 371,844 | |
| | | | | | | | |
| | | | | | | 1,415,056 | |
| | | | | | | | |
| Total Corporate Bonds and Notes (Cost $627,325,973) | | | | 627,020,041 | |
| | |
| | | Shares | | | |
| Preferred Stock—0.0% | | | | | |
| Claire’s Holdings LLC, 0.00%, Series A17 (Cost $36,875) | | | 65 | | | | 10,075 | |
| | | | | | | | | |
| Common Stocks—0.0% | | | | | |
| Claire’s Holdings LLC17 | | | 235 | | | | 155,688 | |
| Clear Channel Outdoor Holdings, Inc., Cl. A17 | | | 56,536 | | | | 266,850 | |
| JSC Astana Finance, GDR1,15,17 | | | 446,838 | | | | 0 | |
| Quicksilver Resources, Inc.15,17 | | | 4,151,000 | | | | 0 | |
| Sabine Oil15,17 | | | 837 | | | | 24,273 | |
| | | | | | | | |
| Total Common Stocks (Cost $4,922,789) | | | | 446,811 | |
| | |
| | | Units | | | |
| Rights, Warrants and Certificates—0.0% | | | | | |
| Affinion Group Wts., Strike Price $1, Exp. 11/10/2215,17 | | | 8,816 | | | | 1,234 | |
| | | | | | | | | | | | |
| | | | | | Units | | | Value |
| Rights, Warrants and Certificates (Continued) | |
| Sabine Oil Tranche 1 Wts., Strike Price $4.49, Exp. 8/11/2615,17 | | | | | | | 2,612 | | | $ | 9,142 | |
| Sabine Oil Tranche 2 Wts., Strike Price $2.72, Exp. 8/11/2615,17 | | | | | | | 549 | | | | 1,647 | |
| | | | | | | | | | | | |
| Total Rights, Warrants and Certificates (Cost $420,786) | | | | 12,023 | |
| | | |
| | | | | | Principal Amount | | | |
| Structured Securities—0.5% | | | | | | | | | |
| Deutsche Bank AG, Coriolanus Ltd. Sec. Credit Linked Bonds: | |
| 3.003% Sr. Sec. Nts., 4/30/251,10 | | | | 813,923 | | | | 750,488 | |
| 3.054% Sr. Sec. Nts., 4/30/251,10 | | | | 1,037,064 | | | | 956,237 | |
| 3.098% Sr. Sec. Nts., 4/30/251,10 | | | | 895,338 | | | | 825,558 | |
| 3.131% Sr. Sec. Nts., 4/30/251,10 | | | | 800,320 | | | | 737,944 | |
| 3.179% Sr. Sec. Nts., 4/30/251,10 | | | | 996,463 | | | | 918,800 | |
| 3.231% Sr. Sec. Nts., 4/30/251,10 | | | | 1,137,311 | | | | 1,048,671 | |
| 3.265% Sr. Sec. Nts., 4/30/251,10 | | | | 908,578 | | | | 837,766 | |
| 3.346% Sr. Sec. Nts., 4/30/251,10 | | | | 854,025 | | | | 787,464 | |
| Morgan Stanley, Russian Federation Total Return Linked Bonds, Series 007, Cl. VR, 2.66%, 8/22/3415 | | | RUB | | | | 24,010,354 | | | | 70,119 | |
| | | | | | | | | | | | |
| Total Structured Securities (Cost $7,191,290) | | | | 6,933,047 | |
| Short-Term Note—0.3% | | | | | | | | | |
| Arab Republic of Egypt Treasury Bills, 17.657%, 8/6/1910 (Cost $4,997,275) | | | EGP | | | | 89,700,000 | | | | 5,331,226 | |
| | | |
| | | | | | Shares | | | |
| Investment Companies—12.8% | |
| Invesco Oppenheimer Institutional Government Money Market Fund, Cl. IN, 2.37%19 | | | | 102,169,488 | | | | 102,169,488 | |
| Invesco Oppenheimer Ltd.-Term Bond Fund20 | | | | 1,761,221 | | | | 8,031,169 | |
| Invesco Oppenheimer Master Event-Linked Bond Fund20 | | | | 1,954,233 | | | | 30,147,365 | |
| Invesco Oppenheimer Ultra-Short Duration Fund, Cl. Y20 | | | | 10,376,434 | | | | 51,882,169 | |
| OFI Carlyle Private Credit Fund, Cl. I20 | | | | 135,117 | | | | 1,332,256 | |
| | | | | | | | | | | | |
| Total Investment Companies (Cost $198,268,559) | | | | 193,562,447 | |
| | | | | | | | | | | | | | | | | | | | | | | | | | | | | | | | |
| | | | | | | |
| | | | | | Exercise Price | | | Expiration
Date | | | | | | Contracts | | | Notional
Amount (000’s) | | | Value | |
Exchange-Traded Option Purchased—0.0% | | | | | | | | | | | | | | | | | | | | | | | | | | | | | |
Euro-Bund Futures Put Put (Cost $83,088)17 | | | | EUR | | | | 166.000 | | | | 7/26/19 | | | | EUR | | | | 304 | | | | EUR 50,464 | | | | 3,457 | |
| | | | | | |
| Counterparty | | | Exercise Price | | | Expiration
Date | | | | | | Contracts | | | Notional
Amount (000’s) | | | | |
Over-the-Counter Options Purchased—0.9% | | | | | | | | | | | | | | | | | | | | | | | | | | | | | |
BRL Currency Call17 | | | JPM | | | | BRL | | | | 3.354 | | | | 9/25/19 | | | | BRL | | | | 600,000 | | | | BRL 600 | | | | 16,094 | |
BRL Currency Call17,22 | | | JPM | | | | BRL | | | | 3.200 | | | | 10/17/19 | | | | BRL | | | | 1,414,000 | | | | BRL 1,414 | | | | 14,180 | |
BRL Currency Call17 | | | GSCO-OT | | | | BRL | | | | 3.350 | | | | 12/6/19 | | | | BRL | | | | 586,000 | | | | BRL 586 | | | | 31,004 | |
BRL Currency Call17 | | | GSCO-OT | | | | BRL | | | | 3.400 | | | | 12/10/19 | | | | BRL | | | | 586,000 | | | | BRL 586 | | | | 54,740 | |
BRL Currency Call17 | | | GSCO-OT | | | | BRL | | | | 3.430 | | | | 3/30/20 | | | | BRL | | | | 1,457,000 | | | | BRL 1,457 | | | | 321,085 | |
BRL Currency Call17 | | | GSCO-OT | | | | BRL | | | | 3.430 | | | | 3/30/20 | | | | BRL | | | | 1,457,000 | | | | BRL 1,457 | | | | 321,085 | |
BRL Currency Call17 | | | GSCO-OT | | | | BRL | | | | 3.432 | | | | 3/27/20 | | | | BRL | | | | 1,460,000 | | | | BRL 1,460 | | | | 321,420 | |
CAD Currency Call17 | | | RBC | | | | CAD | | | | 1.302 | | | | 10/1/19 | | | | CAD | | | | 37,900,000 | | | | CAD 37,900 | | | | 251,758 | |
CLP Currency Call17 | | | CITNA-B | | | | CLP | | | | 676.100 | | | | 9/23/19 | | | | CLP | | | | 18,419,000,000 | | | | CLP 18,419,000 | | | | 429,531 | |
CLP Currency Call17 | | | JPM | | | | CLP | | | | 671.000 | | | | 8/1/19 | | | | CLP | | | | 20,331,000,000 | | | | CLP 20,331,000 | | | | 176,270 | |
COP Currency Call17 | | | MSCO | | | | COP | | | | 3256.000 | | | | 8/6/19 | | | | COP | | | | 98,978,000,000 | | | | COP 98,978,000 | | | | 592,878 | |
EUR Currency Call17 | | | JPM | | | | USD | | | | 1.142 | | | | 9/6/19 | | | | EUR | | | | 22,000,000 | | | | EUR 22,000 | | | | 228,865 | |
EUR Currency Call17 | | | BOA | | | | USD | | | | 1.175 | | | | 9/5/19 | | | | EUR | | | | 87,600,000 | | | | EUR 87,600 | | | | 189,142 | |
EUR Currency Call17 | | | CITNA-B | | | | USD | | | | 1.178 | | | | 10/3/19 | | | | EUR | | | | 87,600,000 | | | | EUR 87,600 | | | | 299,729 | |
EUR Currency Call17 | | | JPM | | | | USD | | | | 1.173 | | | | 8/14/19 | | | | EUR | | | | 87,600,000 | | | | EUR 87,600 | | | | 123,298 | |
EUR Currency Put17 | | | BOA | | | | SEK | | | | 9.250 | | | | 4/29/20 | | | | EUR | | | | 2,800,000 | | | | EUR 2,800 | | | | 57,784 | |
EUR Currency Put17 | | | JPM | | | | ZAR | | | | 16.378 | | | | 1/6/20 | | | | EUR | | | | 7,300,000 | | | | EUR 7,300 | | | | 262,126 | |
EUR Currency Put17 | | | GSCO-OT | | | | NOK | | | | 8.360 | | | | 1/6/21 | | | | EUR | | | | 3,650,000 | | | | EUR 3,650 | | | | 162,117 | |
EUR Currency Put17 | | | GSCO-OT | | | | NOK | | | | 8.648 | | | | 1/6/21 | | | | EUR | | | | 3,650,000 | | | | EUR 3,650 | | | | 342,973 | |
| Federal Government of France Bonds Put Put17 | | | MSCO | | | | EUR | | | | 117.630 | | | | 6/14/20 | | | | EUR | | | | 6,666,667 | | | | EUR 6,667 | | | | 312,278 | |
| Federal Republic of Germany Government Bonds Put Put17 | | | MSCO | | | | EUR | | | | 102.742 | | | | 3/27/20 | | | | EUR | | | | 37,762,000 | | | | EUR 37,762 | | | | 17,076 | |
24 INVESCO OPPENHEIMER V.I. GLOBAL STRATEGIC INCOME FUND
| | | | | | | | | | | | | | | | | | | | | | | | | | | | |
| | | Counterparty | | | | Exercise Price | | | Expiration
Date | | | Contracts | | | Notional
Amount
(000’s) | | | Value |
Over-the-Counter Options Purchased (Continued) | | | | | | | | | | | | | | | | | |
INR Currency Put17 | | GSCO-OT | | INR | | | 65.600 | | | | 5/6/20 | | | | INR | | | | 2,280,000 | | | | INR 2,280 | | | $ | 330,790 | |
INR Currency Call17 | | JPM | | INR | | | 66.092 | | | | 4/29/20 | | | | INR | | | | 1,500,000 | | | | INR 1,500 | | | | 280,365 | |
KRW Currency Call17 | | GSCO-OT | | KRW | | | 1125.000 | | | | 7/18/19 | | | | KRW | | | | 16,425,000,000 | | | | KRW 16,425,000 | | | | 8,212 | |
MXN Currency Call17,23 | | CITNA-B | | MXN | | | 18.000 | | | | 10/23/19 | | | | MXN | | | | 750,000 | | | | MXN 750 | | | | 46,986 | |
MXN Currency Call17 | | BOA | | MXN | | | 18.553 | | | | 1/14/20 | | | | MXN | | | | 542,710,000 | | | | MXN 542,710 | | | | 231,650 | |
MXN Currency Call17 | | JPM | | MXN | | | 19.655 | | | | 11/26/19 | | | | MXN | | | | 141,516,000 | | | | MXN 141,516 | | | | 196,116 | |
MXN Currency Call17 | | JPM | | MXN | | | 19.375 | | | | 6/2/20 | | | | MXN | | | | 295,550,000 | | | | MXN 295,550 | | | | 350,108 | |
MXN Currency Call17 | | CITNA-B | | MXN | | | 19.350 | | | | 6/2/20 | | | | MXN | | | | 295,200,000 | | | | MXN 295,200 | | | | 343,076 | |
MXN Currency Call17 | | GSCO-OT | | MXN | | | 19.733 | | | | 3/4/20 | | | | MXN | | | | 384,700,000 | | | | MXN 384,700 | | | | 586,498 | |
MXN Currency Put17 | | JPM | | MXN | | | 19.655 | | | | 11/26/19 | | | | MXN | | | | 141,516,000 | | | | MXN 141,516 | | | | 199,634 | |
PHP Currency Call17 | | GSCO-OT | | PHP | | | 52.000 | | | | 8/12/19 | | | | PHP | | | | 800,000,000 | | | | PHP 800,000 | | | | 239,048 | |
RUB Currecny Call17 | | GSCO-OT | | RUB | | | 60.000 | | | | 12/18/19 | | | | RUB | | | | 1,725,700,000 | | | | RUB 1,725,700 | | | | 83,420 | |
RUB Currency Call17 | | GSCO-OT | | RUB | | | 57.300 | | | | 3/30/20 | | | | RUB | | | | 2,914,000 | | | | RUB 2,914 | | | | 298,217 | |
RUB Currency Call17 | | JPM | | RUB | | | 70.000 | | | | 2/25/21 | | | | RUB | | | | 1,535,200,000 | | | | RUB 1,535,200 | | | | 1,610,716 | |
S&P 500 Index Put17 | | BOA | | USD | | | 2632.590 | | | | 2/21/20 | | | | USD | | | | 10,987 | | | | USD 28,923 | | | | 635,156 | |
S&P 500 Index Put17 | | GSCOI | | USD | | | 2679.690 | | | | 3/13/20 | | | | USD | | | | 20,733 | | | | USD 55,558 | | | | 1,486,517 | |
SGD Currency Put17 | | GSCO-OT | | SGD | | | 5.062 | | | | 9/27/19 | | | | SGD | | | | 23,000,000 | | | | SGD 23,000 | | | | 79,970 | |
ZAR Currency Call17 | | GSCO-OT | | ZAR | | | 13.613 | | | | 1/27/20 | | | | ZAR | | | | 99,512,000 | | | | ZAR 99,512 | | | | 138,000 | |
ZAR Currency Call17 | | GSCO-OT | | ZAR | | | 14.500 | | | | 3/6/20 | | | | ZAR | | | | 477,000,000 | | | | ZAR 477,000 | | | | 1,598,985 | |
| | | | | | | | | | | | | | | | | | | | | | | | | | | | |
TotalOver-the-Counter Options Purchased (Cost $16,292,612) | | | | | | | | | | | | 13,268,897 | |
| | | | | | | | | | | | | | | | | | | | | | |
| | | Counterparty | | Buy /Sell
Protection | | Reference Asset | | Fixed Rate | | | Expiration
Date | | Notional Amount (000’s) | | | |
Over-the-Counter Credit Default Swaptions Purchased—0.0% | | | | | | | | | | |
| Credit Default Swap | | | | | | | | | | | | | | | | | | | | | | |
| Maturing 06/20/24 Call17 | | MSCO | | Sell | | CDX.NA.HY.32 | | | 107.500% | | | 10/16/19 | | USD | | | 14,000 | | | | 59,942 | |
| | | | | | ITRAXX Europe | | | | | | | | | | | | | | | | |
| Credit Default Swap | | | | | | Crossover Series 31 | | | | | | | | | | | | | | | | |
| Maturing 06/20/24 Put17 | | JPM | | Buy | | Version 1 | | | 3.000 | | | 7/17/19 | | EUR | | | 57,500 | | | | 39,719 | |
| | | | | | | | | | | | | | | | | | | | | | |
| TotalOver-the-Counter Credit Default Swaptions Purchased (Cost $272,649) | | | | | | | | | 99,661 | |
| | | | | | | |
| | | Counterparty | | Pay / Receive
Floating Rate | | Floating Rate | | Fixed Rate | | | Expiration
Date | | Notional Amount (000’s) | | | |
Over-the-Counter Interest Rate Swaptions Purchased—0.3% | | | | | |
| | | | | | The greater of: 10 | | | | | | | | | | | | | | | | |
| | | | | | x (minus 0.15% | | | | | | | | | | | | | | | | |
| Interest Rate Floor Maturing | | | | | | minus (CMS10 minus | | | | | | | | | | | | | | | | |
| 10/15/19 Call17 | | GSCO-OT | | Receive | | CMS2)) or Zero | | | 0.000 | | | 10/15/19 | | USD | | | 14,621 | | | | 648 | |
| | | | | | The greater of: 10 | | | | | | | | | | | | | | | | |
| | | | | | x (0.15% minus | | | | | | | | | | | | | | | | |
| Interest Rate Floor Maturing | | | | | | (CMS10 minus | | | | | | | | | | | | | | | | |
| 10/15/19 Call17 | | GSCO-OT | | Receive | | CMS2)) or Zero | | | 15.000 | | | 10/15/19 | | USD | | | 14,621 | | | | 37,095 | |
| | | | | | The greater of: 10 | | | | | | | | | | | | | | | | |
| | | | | | x (0.25% minus | | | | | | | | | | | | | | | | |
| Interest Rate Floor Maturing | | | | | | (CMS10 minus | | | | | | | | | | | | | | | | |
| 4/16/2020 Call17 | | GSCO-OT | | Receive | | CMS2)) or Zero | | | 25.000 | | | 4/16/20 | | USD | | | 14,621 | | | | 92,399 | |
| | | | | | The greater of: 10 | | | | | | | | | | | | | | | | |
| | | | | | x (minus 0.05% | | | | | | | | | | | | | | | | |
| Interest Rate Floor Maturing | | | | | | minus (CMS10 minus | | | | | | | | | | | | | | | | |
| 4/16/2020 Call17 | | GSCO-OT | | Receive | | CMS2)) or Zero | | | 0.000 | | | 4/16/20 | | USD | | | 14,621 | | | | 12,169 | |
| | | | | | MAX [( 0.213% | | | | | | | | | | | | | | | | |
| Interest Rate Floor Maturing | | | | | | minus (CMS10 minus | | | | | | | | | | | | | | | | |
| 4/9/2020 Call17 | | MSCO | | Receive | | CMS2)), 0.00%] * 10 | | | 21.300 | | | 4/13/20 | | USD | | | 74,001 | | | | 381,639 | |
| | | | | | 10 * MAX[0; 0.25% | | | | | | | | | | | | | | | | |
| Interest Rate Floor Maturing | | | | | | minus ([FRO 1] minus | | | | | | | | | | | | | | | | |
| 4/9/2020 Call17 | | JPM | | Receive | | [FRO 2])] | | | 25.000 | | | 4/13/20 | | USD | | | 73,100 | | | | 464,558 | |
| Interest Rate Swap Maturing | | | | | | Three-Month USD | | | | | | | | | | | | | | | | |
| 11/24/2020 Call17 | | JPM | | Receive | | LIBOR BBA | | | 1.913 | | | 11/24/20 | | USD | | | 76,000 | | | | 1,389,579 | |
| Interest Rate Swap Maturing | | | | | | Six-Month EUR | | | | | | | | | | | | | | | | |
| 3/29/2021 Put17 | | JPM | | Receive | | EURIBOR | | | 1.122 | | | 3/29/21 | | EUR | | | 146,200 | | | | 73,126 | |
| Interest Rate Swap Maturing | | | | | | Three-Month CAD BA | | | | | | | | | | | | | | | | |
| 3/30/2020 Put17 | | BOA | | Receive | | CDOR | | | 2.588 | | | 3/30/20 | | CAD | | | 195,000 | | | | 279,153 | |
| Interest Rate Swap Maturing | | | | | | Six-Month EUR | | | | | | | | | | | | | | | | |
| 4/12/2021 Put17 | | JPM | | Receive | | EURIBOR | | | 0.615 | | | 4/12/21 | | EUR | | | 146,250 | | | | 25,070 | |
| Interest Rate Swap | | | | | | Six-Month EUR | | | | | | | | | | | | | | | | |
| Maturing 4/6/2021 Put17 | | JPM | | Receive | | EURIBOR | | | 0.608 | | | 4/6/21 | | EUR | | | 146,000 | | | | 24,562 | |
| Interest Rate Swap Maturing | | | | | | Three-Month USD | | | | | | | | | | | | | | | | |
| 11/17/2020 Call17 | | MSCO | | Pay | | LIBOR BBA | | | 2.000 | | | 11/17/20 | | USD | | | 305,000 | | | | 1,698,584 | |
25 INVESCO OPPENHEIMER V.I. GLOBAL STRATEGIC INCOME FUND
CONSOLIDATED STATEMENT OF INVESTMENTSUnaudited / Continued
| | | | | | | | | | | | | | | | | | | | | | | | | | |
| | | Counterparty | | | Pay / Receive
Floating Rate | | | Floating Rate | | Fixed Rate | | | Expiration
Date | | | Notional Amount (000’s) | | Value |
| Over-the-Counter Interest Rate Swaptions Purchased (Continued) |
| Interest Rate Swap Maturing 8/27/2019 Call17 | | | GSCOI | | | | Pay | | | Three-Month USD
LIBOR BBA | | | 2.200% | | | | 8/27/19 | | | | USD | | | 6,500 | | $ 135,809 |
|
| Interest Rate Swap Maturing 8/30/2019 Call17 | | | MSCO | | | | Pay | | | Three-Month USD
LIBOR-BBA | | | 2.348 | | | | 8/30/19 | | | | USD | | | 10,300 | | 418,057 |
|
| Interest Rate Swap Maturing 8/30/2019 Call17 | | | GSCOI | | | | Pay | | | Three-Month USD
LIBOR BBA | | | 2.325 | | | | 8/30/19 | | | | USD | | | 10,300 | | 382,733 |
| | | | | | | | | | | | | | | | | | | | | | | | | | |
TotalOver-the-Counter Interest Rate Swaptions Purchased (Cost $5,102,688) | | 5,415,181 |
|
| Total Investments, at Value (Cost $1,674,819,875) | | | 110.4% | | 1,672,853,601 |
|
| Net Other Assets (Liabilities) | | | (10.4) | | (157,576,806) |
| | | | | | | | | | | | | | | | | | | | | | | | |
| Net Assets | | | 100.0% | | $ 1,515,276,795 |
| | | | | | | | | | | | | | | | | | | | | | | | |
Consolidated Footnotes to Statement of Investments
1. Represents securities sold under Rule 144A, which are exempt from registration under the Securities Act of 1933, as amended. These securities have been determined to be liquid under guidelines established by the Board of Trustees. These securities amount to $445,398,478 or 29.39% of the Fund’s net assets at period end.
2. Represents the current interest rate for a variable or increasing rate security, which may be fixed for a predetermined period. The interest rate is, or will be as of an established date, determined as [Referenced Rate + Basis-point spread].
3. Restricted security. The aggregate value of restricted securities at period end was $5,455,927, which represents 0.36% of the Fund’s net assets. Information concerning restricted securities is as follows:
| | | | | | | | | | | | | | |
| Security | | Acquisition
Dates | | Cost | | | Value | | | Unrealized
Appreciation/
(Depreciation) | |
| Affinion Group, Inc., 12.50% Sr. Unsec. Nts., 11/10/22 | | 1/15/13 – 5/10/19 | | $ | 961,847 | | | $ | 712,098 | | | $ | (249,749) | |
Clear Channel International BV, 8.75% Sr. Unsec. Nts.,
12/15/20 | | 8/9/17 | | | 267,199 | | | | 272,287 | | | | 5,088 | |
Eagle Intermediate Global Holding BV/Ruyi US Finance
LLC, 7.50% Sr. Sec. Nts., 5/1/25 | | 9/27/18 | | | 280,464 | | | | 271,819 | | | | (8,645) | |
EP Energy LLC/Everest Acquisition Finance, Inc.,
9.375% Sec. Nts., 5/1/24 | | 10/21/16 – 5/21/18 | | | 681,849 | | | | 188,470 | | | | (493,379) | |
GLS Auto Receivables Trust, Series2018-1A, Cl. A,
2.82%, 7/15/22 | | 1/30/18 | | | 449,446 | | | | 450,145 | | | | 699 | |
| Golden Nugget, Inc., 6.75% Sr. Unsec. Nts., 10/15/24 | | 9/20/16 | | | 1,366,024 | | | | 1,414,525 | | | | 48,501 | |
| HTA Group Ltd., 9.125% Sr. Unsec. Nts., 3/8/22 | | 3/1/17 – 5/16/19 | | | 1,763,075 | | | | 1,794,683 | | | | 31,608 | |
| NGPL PipeCo LLC, 4.375% Sr. Unsec. Nts., 8/15/22 | | 4/25/19 | | | 348,437 | | | | 351,900 | | | | 3,463 | |
| | | | | | |
| | | | $ | 6,118,341 | | | $ | 5,455,927 | | | $ | (662,414) | |
| | | | | | |
4. Represents securities sold under Regulation S, which are exempt from registration under the Securities Act of 1933, as amended. These securities may not be offered or sold in the United States without and exemption from, or in a transaction not subject to, the registration requirements of the Securities Act of 1933. These securities amount to $208,638,417 or 13.77% of the Fund’s net assets at period end.
5. Interest-Only Strips represent the right to receive the monthly interest payments on an underlying pool of mortgage loans. These securities typically decline in price as interest rates decline. Most other fixed income securities increase in price when interest rates decline. The principal amount of the underlying pool represents the notional amount on which current interest is calculated. The price of these securities is typically more sensitive to changes in prepayment rates than traditional mortgage-backed securities (for example, GNMA pass-throughs). Interest rates disclosed represent current yields based upon the current cost basis and estimated timing and amount of future cash flows. These securities amount to $4,616,863 or 0.30% of the Fund’s net assets at period end.
6. Interest rate is less than 0.0005%.
7. All or a portion of the security position is when-issued or delayed delivery to be delivered and settled after period end. See Note 1O of the accompanying Consolidated Notes.
8. This interest rate resets periodically. Interest rate shown reflects the rate in effect at period end. The rate on this variable rate security is not based on a published reference rate and spread but is determined by the issuer or agent based on current market conditions.
9. All or a portion of the security position is held in accounts at a futures clearing merchant and pledged to cover margin requirements on open futures contracts and written options on futures, if applicable. The aggregate market value of such securities is $969,184. See Note 1Q of the accompanying Consolidated Notes.
10. Zero coupon bond reflects effective yield on the original acquisition date.
11. Interest or dividend ispaid-in-kind, when applicable.
12. This security is not accruing income because the issuer has missed an interest payment on it and/or is not anticipated to make future interest and or principal payments. The rate shown is the contractual interest rate.
13. Security received as the result of issuer reorganization.
14. This bond has no contractual maturity date, is not redeemable and contractually pays an indefinite stream of interest.
15. The value of this security was determined using significant unobservable inputs. See Note 3 of the accompanying Consolidated Notes.
16. Denotes an inflation-indexed security: coupon or principal are indexed to a consumer price index.
17.Non-income producing security.
18. All or a portion of this security is owned by the subsidiary. See Note 1 of the accompanying Consolidated Notes.
19. The money market fund and the Fund are affiliated by having the same investment adviser. The rate shown is the7-day SEC standardized yield as of June 30, 2019.
20. Is or was an affiliate, as defined in the Investment Company Act of 1940, as amended, at or during the reporting period, by virtue of the Fund owning at least 5% of the voting securities of the issuer or as a result of the Fund and the issuer having the same investment adviser. Transactions during the reporting period in which the issuer was an affiliate are as follows:
| | | | | | | | | | | | | | | | |
| | | Shares
December 31, 2018 | | | Gross
Additions | | | Gross
Reductions | | | Shares
June 30, 2019 | |
Investment Company | | | | | | | | | | | | | | | | |
| Invesco Oppenheimer Limited-Term Bond Fund | | | 1,654,825 | | | | 106,396 | | | | — | | | | 1,761,221 | |
| Invesco Oppenheimer Master Event-Linked Bond Fund, LLC | | | 1,954,233 | | | | — | | | | — | | | | 1,954,233 | |
| Invesco Oppenheimer Master Loan Fund, LLC | | | 8,607,367 | | | | — | | | | 8,607,367 | | | | — | |
| | |
| 26 INVESCO OPPENHEIMER V.I. GLOBAL STRATEGIC INCOME FUND |
Consolidated Footnotes to Statement of Investments (Continued)
| | | | | | | | | | | | | | | | |
| | | Shares
December 31, 2018 | | | Gross Additions | | | Gross
Reductions | | | Shares June 30, 2019 | |
| Invesco Oppenheimer Ultra-Short Duration Fund, Cl. I | | | 10,238,165 | | | | 138,269 | | | | — | | | | 10,376,434 | |
| OFI Carlyle Private Credit Fund, Cl. I | | | — | | | | 135,117 | | | | — | | | | 135,117 | |
| | | | |
| | | Value | | | Income | | | Realized
Gain (Loss) | | | Change in Unrealized
Gain (Loss) | |
| Investment Company | | | | | | | | | | | | | | | | |
| Invesco Oppenheimer Ltd.-Term Bond Fund | | $ | 8,031,169 | | | $ | 120,943 | | | $ | — | | | $ | 185,454 | |
| Invesco Oppenheimer Master Event-Linked Bond Fund | | | 30,147,365 | | | | 1,217,147a | | | | (746,449)a | | | | (55,146)a | |
| Invesco Oppenheimer Master Loan Fund, LLC | | | — | | | | 1,950,687b | | | | (6,354,754)b | | | | 9,620,511b | |
| Invesco Oppenheimer Ultra-Short Duration Fund, Cl. I | | | 51,882,169 | | | | 692,265 | | | | — | | | | 102,382 | |
| OFI Carlyle Private Credit Fund | | | 1,332,256 | | | | 50,373 | | | | — | | | | 8,403 | |
| | | | |
| Total | | $ | 91,392,959 | | | $ | 4,031,415 | | | $ | (7,101,203) | | | $ | 9,861,604 | �� |
| | | | |
a. Represents the amount allocated to the Fund from Invesco Oppenheimer Master Event-Linked Bond Fund, LLC.
b. Represents the amount allocated to the Fund from Invesco Oppenheimer Master Loan Fund, LLC.
21.One-Touch Binary option becomes eligible for exercise if at any time spot rates are less than or equal to 3.2 BRL per 1 USD.
22.One-Touch Binary option becomes eligible for exercise if at any time spot rates are less than or equal to 18 MXN per 1 USD.
Distribution of investments representing geographic holdings, as a percentage of total investments at value, is as follows:
| | | | | | | | |
| Geographic Holdings | | Value | | | Percent | |
United States | | $ | 1,037,201,386 | | | | 62.0% | |
India | | | 52,427,536 | | | | 3.1 | |
United Kingdom | | | 46,495,095 | | | | 2.8 | |
Indonesia | | | 44,142,926 | | | | 2.6 | |
South Africa | | | 36,829,267 | | | | 2.2 | |
Mexico | | | 36,339,472 | | | | 2.2 | |
Greece | | | 36,166,804 | | | | 2.2 | |
Italy | | | 33,353,100 | | | | 2.0 | |
Spain | | | 33,107,651 | | | | 2.0 | |
Brazil | | | 31,779,868 | | | | 1.9 | |
Argentina | | | 31,440,937 | | | | 1.9 | |
France | | | 27,672,742 | | | | 1.7 | |
Egypt | | | 20,895,101 | | | | 1.3 | |
Switzerland | | | 18,857,967 | | | | 1.1 | |
Canada | | | 18,679,144 | | | | 1.1 | |
China | | | 18,441,235 | | | | 1.1 | |
Netherlands | | | 13,124,756 | | | | 0.8 | |
Sri Lanka | | | 11,432,298 | | | | 0.7 | |
Turkey | | | 9,707,340 | | | | 0.6 | |
Colombia | | | 7,796,870 | | | | 0.5 | |
Russia | | | 7,709,000 | | | | 0.5 | |
Luxembourg | | | 7,384,217 | | | | 0.4 | |
Thailand | | | 6,915,258 | | | | 0.4 | |
Peru | | | 6,847,968 | | | | 0.4 | |
Oman | | | 5,731,136 | | | | 0.3 | |
Panama | | | 5,232,132 | | | | 0.3 | |
Azerbaijan | | | 5,151,909 | | | | 0.3 | |
Ghana | | | 4,416,407 | | | | 0.3 | |
Paraguay | | | 3,801,642 | | | | 0.2 | |
Dominican Republic | | | 3,602,642 | | | | 0.2 | |
Ukraine | | | 2,971,242 | | | | 0.2 | |
Ireland | | | 2,838,808 | | | | 0.2 | |
Malaysia | | | 2,741,366 | | | | 0.2 | |
Supranational | | | 2,492,555 | | | | 0.1 | |
Cyprus | | | 2,471,272 | | | | 0.1 | |
Israel | | | 2,441,169 | | | | 0.1 | |
Ivory Coast | | | 2,350,748 | | | | 0.1 | |
Kazakhstan | | | 1,929,049 | | | | 0.1 | |
Bermuda | | | 1,920,969 | | | | 0.1 | |
Eurozone | | | 1,828,511 | | | | 0.1 | |
Mauritius | | | 1,794,683 | | | | 0.1 | |
New Zealand | | | 1,791,547 | | | | 0.1 | |
Cayman Islands | | | 1,738,885 | | | | 0.1 | |
Gabon | | | 1,654,011 | | | | 0.1 | |
Morocco | | | 1,612,751 | | | | 0.1 | |
United Arab Emirates | | | 1,562,362 | | | | 0.1 | |
Fiji | | | 1,534,990 | | | | 0.1 | |
Hong Kong | | | 1,488,090 | | | | 0.1 | |
| | |
| 27 INVESCO OPPENHEIMER V.I. GLOBAL STRATEGIC INCOME FUND |
CONSOLIDATED STATEMENT OF INVESTMENTSUnaudited / Continued
| | | | | | | | |
| Geographic Holdings (Continued) | | Value | | | Percent |
Saudi Arabia | | $ | 1,456,136 | | | | 0.1% | |
Chile | | | 1,426,645 | | | | 0.1 | |
Portugal | | | 1,242,224 | | | | 0.1 | |
Senegal | | | 1,232,495 | | | | 0.1 | |
Germany | | | 1,202,440 | | | | 0.1 | |
Georgia | | | 1,113,576 | | | | 0.1 | |
Singapore | | | 989,766 | | | | 0.1 | |
Belgium | | | 821,100 | | | | 0.1 | |
Angola | | | 812,193 | | | | 0.0 | |
Macau | | | 411,638 | | | | 0.0 | |
Australia | | | 411,500 | | | | 0.0 | |
Serbia | | | 400,460 | | | | 0.0 | |
Uruguay | | | 383,378 | | | | 0.0 | |
Norway | | | 309,488 | | | | 0.0 | |
Trinidad and Tobago | | | 274,312 | | | | 0.0 | |
St. Lucia | | | 272,175 | | | | 0.0 | |
Philippines | | | 239,048 | | | | 0.0 | |
South Korea | | | 8,213 | | | | 0.0 | |
| | | | |
Total | | $ | 1,672,853,601 | | | | 100.0% | |
| | | | |
| | | | | | | | | | | | | | | | | | | | | | | | |
| Forward Currency Exchange Contracts as of June 30, 2019 | |
| Counterparty | | Settlement Month(s) | | | Currency Purchased (000’s) | | | Currency Sold (000’s) | | | Unrealized
Appreciation | | | Unrealized
Depreciation | |
BAC | | | 05/2020 | | | CLP | | | 596,900 | | | USD | | | 871 | | | $ | 9,903 | | | $ | — | |
BAC | | | 09/2019 | | | COP | | | 24,711,600 | | | USD | | | 7,423 | | | | 235,636 | | | | — | |
BAC | | | 08/2019 | | | EUR | | | 8,425 | | | USD | | | 9,499 | | | | 111,696 | | | | — | |
BAC | | | 07/2019 | | | USD | | | 7,443 | | | COP | | | 24,711,600 | | | | — | | | | 242,328 | |
BOA | | | 07/2019 | | | ARS | | | 145,000 | | | USD | | | 3,056 | | | | 357,578 | | | | — | |
BOA | | | 07/2019 - 08/2019 | | | BRL | | | 305,620 | | | USD | | | 79,549 | | | | 8,987 | | | | 69,524 | |
BOA | | | 08/2019 | | | COP | | | 38,203,315 | | | USD | | | 11,626 | | | | 222,660 | | | | — | |
BOA | | | 08/2019 | | | EUR | | | 16,965 | | | USD | | | 19,125 | | | | 226,642 | | | | — | |
BOA | | | 08/2019 | | | IDR | | | 31,705,000 | | | USD | | | 2,191 | | | | 38,891 | | | | — | |
BOA | | | 08/2019 | | | INR | | | 276,100 | | | USD | | | 3,941 | | | | 35,307 | | | | — | |
BOA | | | 08/2019 | | | KRW | | | 4,374,600 | | | USD | | | 3,706 | | | | 79,591 | | | | — | |
BOA | | | 07/2019 | | | USD | | | 3,416 | | | ARS | | | 145,000 | | | | 2,252 | | | | — | |
BOA | | | 07/2019 - 08/2019 | | | USD | | | 56,027 | | | BRL | | | 215,210 | | | | 21,909 | | | | 7,944 | |
BOA | | | 08/2019 | | | USD | | | 6,728 | | | COP | | | 22,109,000 | | | | — | | | | 128,858 | |
BOA | | | 08/2019 | | | USD | | | 1,500 | | | EUR | | | 1,330 | | | | — | | | | 17,664 | |
BOA | | | 08/2019 | | | USD | | | 12,921 | | | GBP | | | 9,860 | | | | 374,977 | | | | — | |
BOA | | | 08/2019 | | | USD | | | 29,953 | | | IDR | | | 433,370,000 | | | | — | | | | 531,595 | |
BOA | | | 08/2019 | | | USD | | | 44,423 | | | INR | | | 3,112,400 | | | | — | | | | 404,014 | |
BOA | | | 08/2019 | | | USD | | | 6,414 | | | PLN | | | 24,400 | | | | — | | | | 129,841 | |
BOA | | | 08/2019 | | | USD | | | 4,352 | | | RUB | | | 276,200 | | | | 4,779 | | | | — | |
BOA | | | 08/2019 | | | USD | | | 166 | | | THB | | | 5,200 | | | | — | | | | 3,516 | |
BOA | | | 08/2019 | | | USD | | | 11,758 | | | TRY | | | 73,280 | | | | — | | | | 565,758 | |
CITNA-B | | | 07/2019 - 09/2019 | | | ARS | | | 460,000 | | | USD | | | 10,194 | | | | — | | | | 27,579 | |
CITNA-B | | | 08/2019 | | | AUD | | | 1,060 | | | USD | | | 743 | | | | 1,968 | | | | — | |
CITNA-B | | | 07/2019 | | | BRL | | | 8,860 | | | USD | | | 2,312 | | | | — | | | | 4,666 | |
CITNA-B | | | 05/2020 | | | CLP | | | 1,950,000 | | | USD | | | 2,847 | | | | 32,249 | | | | — | |
CITNA-B | | | 07/2019 | | | COP | | | 43,700,000 | | | USD | | | 12,966 | | | | 625,672 | | | | — | |
CITNA-B | | | 08/2019 | | | EUR | | | 845 | | | USD | | | 956 | | | | 8,039 | | | | — | |
CITNA-B | | | 08/2019 | | | HUF | | | 12,400 | | | USD | | | 44 | | | | 207 | | | | — | |
CITNA-B | | | 08/2019 | | | MXN | | | 50,343 | | | USD | | | 2,601 | | | | — | | | | 210 | |
CITNA-B | | | 08/2019 | | | PEN | | | 30 | | | USD | | | 9 | | | | 102 | | | | — | |
CITNA-B | | | 08/2019 - 12/2019 | | | RUB | | | 1,375,200 | | | USD | | | 21,073 | | | | 387,839 | | | | — | |
CITNA-B | | | 08/2019 | | | SEK | | | 7,840 | | | USD | | | 826 | | | | 20,717 | | | | — | |
CITNA-B | | | 07/2019 | | | USD | | | 5,383 | | | ARS | | | 230,000 | | | | — | | | | 31,862 | |
CITNA-B | | | 07/2019 | | | USD | | | 2,199 | | | BRL | | | 8,860 | | | | — | | | | 108,592 | |
CITNA-B | | | 07/2019 - 09/2019 | | | USD | | | 13,028 | | | COP | | | 43,700,000 | | | | — | | | | 536,153 | |
CITNA-B | | | 08/2019 | | | USD | | | 2,210 | | | EUR | | | 1,955 | | | | — | | | | 19,340 | |
CITNA-B | | | 08/2019 | | | USD | | | 2,075 | | | GBP | | | 1,630 | | | | 1,381 | | | | — | |
CITNA-B | | | 08/2019 | | | USD | | | 17,447 | | | MXN | | | 337,700 | | | | 3,978 | | | | — | |
CITNA-B | | | 08/2019 - 12/2019 | | | USD | | | 4,697 | | | RUB | | | 302,900 | | | | 23,361 | | | | 4,883 | |
CITNA-B | | | 08/2019 - 10/2019 | | | USD | | | 3,651 | | | TRY | | | 23,350 | | | | — | | | | 166,595 | |
DEU | | | 07/2019 | | | BRL | | | 2,030 | | | USD | | | 530 | | | | — | | | | 1,069 | |
DEU | | | 08/2019 | | | EUR | | | 11,975 | | | USD | | | 13,553 | | | | 112,399 | | | | — | |
DEU | | | 08/2019 | | | NOK | | | 40,000 | | | USD | | | 4,591 | | | | 104,435 | | | | — | |
DEU | | | 07/2019 | | | THB | | | 41,000 | | | USD | | | 1,312 | | | | 24,668 | | | | — | |
DEU | | | 07/2019 | | | USD | | | 524 | | | BRL | | | 2,030 | | | | — | | | | 4,849 | |
| | |
| 28 INVESCO OPPENHEIMER V.I. GLOBAL STRATEGIC INCOME FUND |
| | | | | | | | | | | | | | | | | | | | | | | | |
| Forward Currency Exchange Contracts (Continued) | |
| Counterparty | | Settlement Month(s) | | | Currency Purchased (000’s) | | | Currency Sold (000’s) | | | Unrealized
Appreciation | | | Unrealized
Depreciation | |
DEU | | | 08/2019 | | | USD | | | 525 | | | COP | | | 1,726,000 | | | $ | — | | | $ | 10,636 | |
DEU | | | 08/2019 | | | USD | | | 13,259 | | | EUR | | | 11,755 | | | | — | | | | 150,630 | |
GSCO-OT | | | 07/2019 - 03/2021 | | | BRL | | | 68,500 | | | USD | | | 16,594 | | | | 611,427 | | | | — | |
GSCO-OT | | | 08/2019 | | | CLP | | | 10,607,782 | | | USD | | | 15,680 | | | | 229,991 | | | | 248,226 | |
GSCO-OT | | | 12/2019 - 01/2021 | | | EUR | | | 36,904 | | | USD | | | 43,808 | | | | 155,709 | | | | 667,409 | |
GSCO-OT | | | 05/2020 | | | INR | | | 1,571,866 | | | USD | | | 21,660 | | | | 247,238 | | | | — | |
GSCO-OT | | | 08/2019 | | | MYR | | | 760 | | | USD | | | 182 | | | | 1,923 | | | | — | |
GSCO-OT | | | 08/2019 | | | PLN | | | 24,400 | | | USD | | | 6,557 | | | | — | | | | 13,734 | |
GSCO-OT | | | 02/2021 | | | RUB | | | 690,200 | | | USD | | | 10,140 | | | | — | | | | 53,936 | |
GSCO-OT | | | 08/2019 | | | SEK | | | 80,600 | | | USD | | | 8,465 | | | | 240,565 | | | | — | |
GSCO-OT | | | 07/2019 - 10/2019 | | | TRY | | | 125,370 | | | USD | | | 20,345 | | | | 749,641 | | | | 192,461 | |
GSCO-OT | | | 03/2020 - 03/2021 | | | USD | | | 32,531 | | | BRL | | | 133,434 | | | | — | | | | 1,000,044 | |
GSCO-OT | | | 11/2019 - 05/2020 | | | USD | | | 11,347 | | | CLP | | | 7,838,160 | | | | — | | | | 225,105 | |
GSCO-OT | | | 05/2020 | | | USD | | | 8,686 | | | EUR | | | 7,524 | | | | — | | | | 69,251 | |
GSCO-OT | | | 05/2020 | | | USD | | | 21,682 | | | INR | | | 1,571,966 | | | | — | | | | 226,207 | |
GSCO-OT | | | 01/2021 | | | USD | | | 28,912 | | | NOK | | | 243,000 | | | | 303,723 | | | | — | |
GSCO-OT | | | 12/2019 | | | USD | | | 10,139 | | | RUB | | | 663,300 | | | | 22,586 | | | | 119,723 | |
GSCO-OT | | | 10/2019 - 02/2020 | | | USD | | | 7,079 | | | TRY | | | 50,150 | | | | — | | | | 1,051,145 | |
GSCO-OT | | | 08/2019 - 03/2020 | | | USD | | | 24,383 | | | ZAR | | | 362,924 | | | | 29,745 | | | | 878,315 | |
GSCO-OT | | | 08/2019 - 01/2020 | | | ZAR | | | 265,700 | | | USD | | | 17,650 | | | | 915,246 | | | | — | |
HSBC | | | 07/2019 | | | ARS | | | 85,000 | | | USD | | | 1,782 | | | | 219,004 | | | | — | |
HSBC | | | 08/2019 | | | CAD | | | 515 | | | USD | | | 384 | | | | 9,966 | | | | — | |
HSBC | | | 08/2019 | | | EUR | | | 1,200 | | | USD | | | 1,366 | | | | 3,051 | | | | 211 | |
HSBC | | | 07/2019 | | | USD | | | 2,002 | | | ARS | | | 85,000 | | | | 1,320 | | | | — | |
HSBC | | | 08/2019 | | | USD | | | 1,338 | | | EUR | | | 1,185 | | | | — | | | | 13,932 | |
HSBC | | | 08/2019 | | | USD | | | 232 | | | IDR | | | 3,352,000 | | | | — | | | | 3,947 | |
JPM | | | 07/2019 - 08/2019 | | | BRL | | | 232,482 | | | USD | | | 58,419 | | | | 2,127,828 | | | | 24,342 | |
JPM | | | 05/2020 | | | CLP | | | 975,000 | | | USD | | | 1,423 | | | | 16,177 | | | | — | |
JPM | | | 08/2019 | | | EUR | | | 8,690 | | | USD | | | 9,860 | | | | 57,927 | | | | — | |
JPM | | | 09/2019 | | | IDR | | | 188,087,000 | | | USD | | | 11,898 | | | | 1,298,001 | | | | — | |
JPM | | | 08/2019 | | | INR | | | 339,356 | | | USD | | | 4,814 | | | | 73,453 | | | | — | |
JPM | | | 08/2019 | | | NOK | | | 41,280 | | | USD | | | 4,742 | | | | 103,286 | | | | — | |
JPM | | | 08/2019 | | �� | PLN | | | 370 | | | USD | | | 98 | | | | 1,007 | | | | — | |
JPM | | | 08/2019 - 12/2019 | | | RUB | | | 746,500 | | | USD | | | 11,578 | | | | 1,284 | | | | 43,865 | |
JPM | | | 08/2019 | | | SEK | | | 80,000 | | | USD | | | 8,399 | | | | 241,374 | | | | — | |
JPM | | | 07/2019 | | | USD | | | 53,830 | | | BRL | | | 207,661 | | | | 77,899 | | | | 325,176 | |
JPM | | | 08/2019 | | | USD | | | 6,993 | | | CLP | | | 4,545,900 | | | | 280,879 | | | | — | |
JPM | | | 08/2019 | | | USD | | | 204,103 | | | EUR | | | 180,545 | | | | — | | | | 1,843,981 | |
JPM | | | 08/2019 | | | USD | | | 7,638 | | | GBP | | | 6,005 | | | | — | | | | 2,545 | |
JPM | | | 08/2019 | | | USD | | | 2,591 | | | JPY | | | 285,000 | | | | — | | | | 60,574 | |
JPM | | | 02/2021 | | | USD | | | 10,123 | | | RUB | | | 690,200 | | | | 36,982 | | | | — | |
JPM | | | 07/2019 | | | USD | | | 1,275 | | | THB | | | 40,000 | | | | — | | | | 29,576 | |
JPM | | | 07/2019 - 08/2019 | | | USD | | | 5,147 | | | TRY | | | 32,180 | | | | — | | | | 347,499 | |
JPM | | | 08/2019 | | | USD | | | 350 | | | ZAR | | | 5,160 | | | | — | | | | 14,300 | |
JPM | | | 08/2019 | | | ZAR | | | 44,824 | | | USD | | | 3,039 | | | | 125,411 | | | | — | |
MSCO | | | 08/2019 | | | BRL | | | 28,500 | | | USD | | | 7,402 | | | | — | | | | 2,258 | |
MSCO | | | 05/2020 | | | CLP | | | 978,100 | | | USD | | | 1,423 | | | | 20,799 | | | | — | |
MSCO | | | 07/2019 | | | USD | | | 7,406 | | | BRL | | | 28,500 | | | | 3,446 | | | | — | |
MSCO | | | 08/2019 | | | USD | | | 8,916 | | | CLP | | | 6,241,000 | | | | — | | | | 298,112 | |
MSCO | | | 08/2019 | | | USD | | | 6,649 | | | THB | | | 207,300 | | | | — | | | | 118,926 | |
MSCO | | | 08/2019 | | | USD | | | 33,528 | | | ZAR | | | 499,540 | | | | — | | | | 1,709,597 | |
MSCO | | | 08/2019 | | | ZAR | | | 72,790 | | | USD | | | 4,885 | | | | 249,112 | | | | — | |
RBC | | | 08/2019 | | | EUR | | | 11,585 | | | USD | | | 13,063 | | | | 152,389 | | | | — | |
RBC | | | 08/2019 | | | JPY | | | 285,000 | | | USD | | | 2,628 | | | | 22,664 | | | | — | |
SCB | | | 09/2019 | | | IDR | | | 305,067,000 | | | USD | | | 21,200 | | | | 203,624 | | | | — | |
SCB | | | 09/2019 | | | USD | | | 11,553 | | | IDR | | | 188,087,000 | | | | — | | | | 1,642,961 | |
SCB | | | 08/2019 | | | ZAR | | | 93,000 | | | USD | | | 6,560 | | | | — | | | | 5,042 | |
| | | | | | | | | | | | | | | | | | | | |
Total Unrealized Appreciation and Depreciation | | | $ | 11,912,500 | | | $ | 14,400,506 | |
| | | | | | | | | | | | | | | | | | | | |
| | | | | | | | | | | | | | | | | | | | | | | | | | |
| Futures Contracts as of June 30, 2019 | |
| Description | | Buy/Sell | | | Expiration Date | | | Number of
Contracts | | | Notional
Amount (000’s) | | | Value | | | Unrealized
Appreciation/
(Depreciation) |
| Euro-BTP | | | Sell | | | | 9/06/19 | | | | 341 | | | EUR | | | 50,447 | | | $ | 52,074,969 | | | $ | (1,628,208 | ) |
| Euro-BUND | | | Buy | | | | 9/06/19 | | | | 23 | | | EUR | | | 4,518 | | | | 4,517,721 | | | | (43 | ) |
| Euro-OAT | | | Sell | | | | 9/06/19 | | | | 45 | | | EUR | | | 8,266 | | | | 8,436,315 | | | | (170,445 | ) |
| United States Treasury Long Bonds | | | Buy | | | | 9/19/19 | | | | 2 | | | USD | | | 311 | | | | 311,188 | | | | 128 | |
| | |
| 29 INVESCO OPPENHEIMER V.I. GLOBAL STRATEGIC INCOME FUND |
CONSOLIDATED STATEMENT OF INVESTMENTSUnaudited / Continued
| | | | | | | | | | | | | | | | | | | | | | | | | | | | |
| Futures Contracts (Continued) | |
Description | | Buy/Sell | | | Expiration Date | | | Number of
Contracts | | | | | | Notional Amount (000’s) | | | Value | | | Unrealized
Appreciation/
(Depreciation) |
United States Treasury Long Bonds | | | Sell | | | | 9/19/19 | | | | 261 | | | | USD | | | | 40,047 | | | | $ 40,609,969 | | | $ | (562,622 | ) |
United States Treasury Nts., 10 yr. | | | Buy | | | | 9/19/19 | | | | 55 | | | | USD | | | | 7,031 | | | | 7,038,281 | | | | 7,549 | |
United States Treasury Nts., 10 yr. | | | Sell | | | | 9/19/19 | | | | 39 | | | | USD | | | | 4,948 | | | | 4,990,781 | | | | (43,236 | ) |
United States Treasury Nts., 2 yr. | | | Sell | | | | 9/30/19 | | | | 705 | | | | USD | | | | 151,246 | | | | 151,701,680 | | | | (455,456 | ) |
United States Treasury Nts., 5 yr. | | | Buy | | | | 9/30/19 | | | | 133 | | | | USD | | | | 15,524 | | | | 15,714,781 | | | | 191,202 | |
United States Ultra Bonds | | | Buy | | | | 9/19/19 | | | | 68 | | | | USD | | | | 11,630 | | | | 12,074,250 | | | | 444,567 | |
| | | | | | | | | | | | | | | | | | | | | | | | | | | | |
| | | | | | | | | | | | | | | | | | | | | | | | | | $ | (2,216,564 | ) |
| | | | | | | | | | | | | | | | | | | | | | | | | | | | |
| | | | | | | | | | | | | | | | | | | | | | | | | | | | | | | | | | | | |
| Over-the-Counter Options Written at June 30, 2019 | |
| Description | | Counterparty | | | | | | Exercise Price | | | Expiration Date | | | | | | Number of
Contracts | | | Notional Amount (000’s) | | | Premiums Received | | | Value |
| AUD Currency Put | | | BOA | | | | AUD | | | | 0.693 | | | | 8/7/19 | | | | AUD | | | | (54,870,000) | | | | AUD 54,870 | | | $ | 369,525 | | | $ | (246,584 | ) |
| BRL Currency Put1 | | | GSCO-OT | | | | BRL | | | | 4.500 | | | | 12/6/19 | | | | BRL | | | | (586,000) | | | | BRL 586 | | | | 103,839 | | | | (44,133 | ) |
| BRL Currency Put1 | | | GSCO-OT | | | | BRL | | | | 4.500 | | | | 12/10/19 | | | | BRL | | | | (586,000) | | | | BRL 586 | | | | 121,888 | | | | (45,298 | ) |
| BRL Currency Put2 | | | GSCO-OT | | | | BRL | | | | 4.500 | | | | 3/30/20 | | | | BRL | | | | (1,457,000) | | | | BRL 1,457 | | | | 254,684 | | | | (299,720 | ) |
| BRL Currency Put2 | | | GSCO-OT | | | | BRL | | | | 4.500 | | | | 3/30/20 | | | | BRL | | | | (1,457,000) | | | | BRL 1,457 | | | | 254,684 | | | | (299,720 | ) |
| BRL Currency Put2 | | | GSCO-OT | | | | BRL | | | | 4.500 | | | | 3/27/20 | | | | BRL | | | | (1,460,000) | | | | BRL 1,460 | | | | 254,624 | | | | (302,597 | ) |
| BRL Currency Put3 | | | GSCO-OT | | | | BRL | | | | 4.230 | | | | 3/4/21 | | | | BRL | | | | (61,600,000) | | | | BRL 61,600 | | | | 689,978 | | | | (581,073 | ) |
| BRL Currency Put3 | | | JPM | | | | BRL | | | | 4.250 | | | | 3/4/21 | | | | BRL | | | | (61,900,000) | | | | BRL 61,900 | | | | 653,227 | | | | (567,257 | ) |
| CAD Currency Call | | | RBC | | | | CAD | | | | 1.275 | | | | 10/1/19 | | | | CAD | | | | (37,900,000) | | | | CAD 37,900 | | | | 86,238 | | | | (77,960 | ) |
| CLP Currency Put | | | CITNA-B | | | | CLP | | | | 706.150 | | | | 9/23/19 | | | | CLP | | | | (19,236,800,000) | | | | CLP 19,236,800 | | | | 219,005 | | | | (169,092 | ) |
| CLP Currency Call | | | CITNA-B | | | | CLP | | | | 655.350 | | | | 9/23/19 | | | | CLP | | | | (17,853,000,000) | | | | CLP 17,853,000 | | | | 84,657 | | | | (128,720 | ) |
| CLP Currency Put4 | | | GSCO-OT | | | | CLP | | | | 700.000 | | | | 5/11/20 | | | | CLP | | | | (10,640,000,000) | | | | CLP 10,640,000 | | | | 389,120 | | | | (365,378 | ) |
| CLP Currency Put | | | GSCO-OT | | | | CLP | | | | 713.500 | | | | 11/26/19 | | | | CLP | | | | (11,965,250,000) | | | | CLP 11,965,250 | | | | 275,427 | | | | (154,830 | ) |
| CLP Currency Put | | | JPM | | | | CLP | | | | 703.000 | | | | 8/1/19 | | | | CLP | | | | (21,300,000,000) | | | | CLP 21,300,000 | | | | 233,603 | | | | (64,326 | ) |
| CLP Currency Call | | | JPM | | | | CLP | | | | 648.000 | | | | 8/1/19 | | | | CLP | | | | (19,634,000,000) | | | | CLP 19,634,000 | | | | 106,760 | | | | (14,529 | ) |
| COP Currency Call | | | CITNA-B | | | | COP | | | | 3265.000 | | | | 8/30/19 | | | | COP | | | | (49,830,000,000) | | | | COP 49,830,000 | | | | 93,009 | | | | (363,759 | ) |
| COP Currency Put | | | CITNA-B | | | | COP | | | | 3265.000 | | | | 8/30/19 | | | | COP | | | | (49,830,000,000) | | | | COP 49,830,000 | | | | 607,349 | | | | (175,900 | ) |
| COP Currency Put | | | MSCO | | | | COP | | | | 3429.000 | | | | 8/6/19 | | | | COP | | | | (104,237,000,000) | | | | COP 104,237,000 | | | | 256,899 | | | | (29,186 | ) |
| COP Currency Call | | | MSCO | | | | COP | | | | 3135.000 | | | | 8/6/19 | | | | COP | | | | (95,300,000,000) | | | | COP 95,300,000 | | | | 116,245 | | | | (101,018 | ) |
| COP Currency Put | | | MSCO | | | | COP | | | | 3449.000 | | | | 8/20/19 | | | | COP | | | | (52,550,000,000) | | | | COP 52,550,000 | | | | 171,180 | | | | (21,546 | ) |
| EUR Currency Call | | | BOA | | | | USD | | | | 1.155 | | | | 9/5/19 | | | | EUR | | | | (29,200,000) | | | | EUR 29,200 | | | | 181,749 | | | | (167,794 | ) |
| EUR Currency Call | | | BOA | | | | RUB | | | | 73.558 | | | | 8/5/19 | | | | EUR | | | | (15,100,000) | | | | EUR 15,100 | | | | 76,722 | | | | (96,076 | ) |
| EUR Currency Call | | | CITNA-B | | | | USD | | | | 1.155 | | | | 10/3/19 | | | | EUR | | | | (29,200,000) | | | | EUR 29,200 | | | | 246,014 | | | | (241,536 | ) |
| EUR Currency Call5 | | | GSCO-OT | | | | NOK | | | | 11.000 | | | | 1/6/21 | | | | EUR | | | | (2,925,000) | | | | EUR 2,925 | | | | 586,026 | | | | (381,431 | ) |
| EUR Currency Call6 | | | GSCO-OT | | | | INR | | | | 90.000 | | | | 5/6/20 | | | | EUR | | | | (2,280,000) | | | | EUR 2,280 | | | | 400,486 | | | | (351,669 | ) |
| EUR Currency Call | | | GSCO-OT | | | | KRW | | | | 1303.350 | | | | 9/30/19 | | | | EUR | | | | (21,860,000) | | | | EUR 21,860 | | | | 297,000 | | | | (560,337 | ) |
| EUR Currency Call7 | | | GSCO-OT | | | | ZAR | | | | 20.000 | | | | 3/30/20 | | | | EUR | | | | (2,593,460) | | | | EUR 2,593 | | | | 508,741 | | | | (268,012 | ) |
| EUR Currency Call | | | GSCO-OT | | | | RUB | | | | 78.507 | | | | 12/16/19 | | | | EUR | | | | (27,400,000) | | | | EUR 27,400 | | | | 476,326 | | | | (362,762 | ) |
| EUR Currency Call | | | JPM | | | | USD | | | | 1.153 | | | | 8/14/19 | | | | EUR | | | | (29,200,000) | | | | EUR 29,200 | | | | 123,153 | | | | (133,474 | ) |
| EUR Currency Put | | | JPM | | | | USD | | | | 1.116 | | | | 9/6/19 | | | | EUR | | | | (22,000,000) | | | | EUR 22,000 | | | | 99,880 | | | | (46,911 | ) |
| EUR Currency Call | | | JPM | | | | USD | | | | 1.176 | | | | 9/6/19 | | | | EUR | | | | (22,000,000) | | | | EUR 22,000 | | | | 61,490 | | | | (46,235 | ) |
| EUR Currency Call | | | JPM | | | | INR | | | | 81.050 | | | | 9/11/19 | | | | EUR | | | | (13,110,000) | | | | EUR 13,110 | | | | 108,061 | | | | (94,298 | ) |
| EUR Currency Call | | | JPM | | | | ZAR | | | | 17.825 | | | | 8/13/19 | | | | EUR | | | | (7,300,000) | | | | EUR 7,300 | | | | 135,958 | | | | (12,638 | ) |
| EUR Currency Call | | | JPM | | | | ZAR | | | | 19.700 | | | | 1/6/20 | | | | EUR | | | | (7,300,000) | | | | EUR 7,300 | | | | 268,025 | | | | (54,666 | ) |
| EUR Currency Put | | | JPM | | | | RUB | | | | 73.800 | | | | 8/5/19 | | | | EUR | | | | (14,600,000) | | | | EUR 14,600 | | | | 163,059 | | | | (390,991 | ) |
| EUR Currency Call8 | | | JPM | | | | INR | | | | 90.000 | | | | 4/29/20 | | | | EUR | | | | (1,500,000) | | | | EUR 1,500 | | | | 238,580 | | | | (224,522 | ) |
| Federal Government of Spain Bonds Put | | | MSCO | | | | EUR | | | | 108.380 | | | | 6/14/20 | | | | EUR | | | | (13,000,000) | | | | EUR 13,000 | | | | 211,356 | | | | (186,823 | ) |
| Federal Republic of Germany Government Bonds Call | | | MSCO | | | | EUR | | | | 105.313 | | | | 3/27/20 | | | | EUR | | | | (37,762,000) | | | | EUR 37,762 | | | | 98,856 | | | | (295,246 | ) |
| Federal Republic of Germany Government Bonds Put | | | MSCO | | | | EUR | | | | 104.530 | | | | 6/14/20 | | | | EUR | | | | (12,833,333) | | | | EUR 12,833 | | | | 269,042 | | | | (171,300 | ) |
| IDR Currency Put | | | GSCO-OT | | | | IDR | | | | 15360.000 | | | | 6/18/20 | | | | IDR | | | | (399,000,000,000) | | | | IDR 399,000,000 | | | | 561,094 | | | | (542,640 | ) |
| IDR Currency Put | | | JPM | | | | IDR | | | | 14775.000 | | | | 9/17/19 | | | | IDR | | | | (225,225,000,000) | | | | IDR 225,225,000 | | | | 135,260 | | | | (60,811 | ) |
| KRW Currency Put | | | GSCO-OT | | | | KRW | | | | 1155.000 | | | | 7/18/19 | | | | KRW | | | | (16,863,000,000) | | | | KRW 16,863,000 | | | | 100,740 | | | | (116,355 | ) |
| KRW Currency Call9 | | | GSCO-OT | | | | KRW | | | | 1115.000 | | | | 7/18/19 | | | | KRW | | | | (16,279,000,000) | | | | KRW 16,279,000 | | | | 94,900 | | | | — | |
| MXN Currency Put | | | BOA | | | | MXN | | | | 22.363 | | | | 1/14/20 | | | | MXN | | | | (654,160,000) | | | | MXN 654,160 | | | | 661,254 | | | | (201,566 | ) |
| MXN Currency Put | | | CITNA-B | | | | MXN | | | | 22.940 | | | | 6/2/20 | | | | MXN | | | | (350,000,000) | | | | MXN 350,000 | | | | 332,662 | | | | (220,448 | ) |
| MXN Currency Call | | | GSCO-OT | | | | MXN | | | | 18.099 | | | | 3/4/20 | | | | MXN | | | | (352,820,000) | | | | MXN 352,820 | | | | 173,033 | | | | (107,448 | ) |
| MXN Currency Put | | | GSCO-OT | | | | MXN | | | | 22.562 | | | | 3/4/20 | | | | MXN | | | | (439,800,000) | | | | MXN 439,800 | | | | 431,544 | | | | (186,115 | ) |
| MXN Currency Call | | | JPM | | | | MXN | | | | 20.240 | | | | 5/27/20 | | | | MXN | | | | (182,160,000) | | | | MXN 182,160 | | | | 396,360 | | | | (392,957 | ) |
| MXN Currency Put | | | JPM | | | | MXN | | | | 23.005 | | | | 6/2/20 | | | | MXN | | | | (350,950,000) | | | | MXN 350,950 | | | | 330,279 | | | | (214,988 | ) |
| MXN Currency Put | | | JPM | | | | MXN | | | | 20.240 | | | | 5/27/20 | | | | MXN | | | | (182,160,000) | | | | MXN 182,160 | | | | 396,360 | | | | (398,324 | ) |
| PHP Currency Call | | | GSCO-OT | | | | PHP | | | | 51.200 | | | | 8/12/19 | | | | PHP | | | | (780,000,000) | | | | PHP 780,000 | | | | 27,803 | | | | (82,298 | ) |
| PHP Currency Put | | | GSCO-OT | | | | PHP | | | | 52.950 | | | | 8/12/19 | | | | PHP | | | | (807,500,000) | | | | PHP 807,500 | | | | 41,450 | | | | (9,189 | ) |
| | |
| 30 INVESCO OPPENHEIMER V.I. GLOBAL STRATEGIC INCOME FUND |
| | | | | | | | | | | | | | | | | | | | | | | | | | | | | | |
Over-the-Counter Options Written (Continued) |
| Description | | Counterparty | | | | Exercise Price | | | Expiration Date | | | | | | Number of
Contracts | | | Notional Amount
(000’s) | | | Premiums Received | | | Value |
RUB Currency Call | | CITNA-B | | RUB | | | 63.040 | | | | 12/16/19 | | | | RUB | | | | (1,729,200,000) | | | | RUB 1,729,200 | | | $ | 245,089 | | | $ (381,427) |
RUB Currency Call | | JPM | | RUB | | | 60.000 | | | | 2/25/21 | | | | RUB | | | | (1,315,900,000) | | | | RUB 1,315,900 | | | | 238,945 | | | (230,532) |
RUB Currency Put | | JPM | | RUB | | | 80.000 | | | | 2/25/21 | | | | RUB | | | | (1,754,500,000) | | | | RUB 1,754,500 | | | | 977,717 | | | (530,105) |
S&P 500 Index Put | | BOA | | USD | | | 2355.470 | | | | 2/21/20 | | | | USD | | | | (10,987) | | | | USD 25,879 | | | | 637,475 | | | (278,926) |
S&P 500 Index Put | | GSCO-OT | | USD | | | 2397.620 | | | | 3/13/20 | | | | USD | | | | (20,733) | | | | USD 49,710 | | | | 1,128,715 | | | (673,104) |
SGD Currency Put | | GSCO-OT | | CNY | | | 4.970 | | | | 9/27/19 | | | | SGD | | | | (23,000,000) | | | | SGD 23,000 | | | | 28,905 | | | (21,545) |
SGD Currency Call | | GSCO-OT | | CNY | | | 5.165 | | | | 9/27/19 | | | | SGD | | | | (23,000,000) | | | | SGD 23,000 | | | | 55,770 | | | (50,489) |
THB Currency Put | | SCB | | THB | | | 31.500 | | | | 12/20/19 | | | | THB | | | | (953,700,000) | | | | THB 953,700 | | | | 171,999 | | | (191,150) |
TRY Currency Call | | GSCO-OT | | TRY | | | 6.000 | | | | 8/7/19 | | | | TRY | | | | (182,391,000) | | | | TRY 182,391 | | | | 367,883 | | | (994,611) |
TRY Currency Put | | GSCO-OT | | TRY | | | 6.750 | | | | 1/15/20 | | | | TRY | | | | (98,690,000) | | | | TRY 98,690 | | | | 686,180 | | | (613,012) |
ZAR Currency Put | | GSCO-OT | | ZAR | | | 16.208 | | | | 1/27/20 | | | | ZAR | | | | (118,482,000) | | | | ZAR 118,482 | | | | 214,236 | | | (119,172) |
ZAR Currency Call | | GSCO-OT | | ZAR | | | 13.500 | | | | 3/6/20 | | | | ZAR | | | | (444,000,000) | | | | ZAR 444,000 | | | | 321,456 | | | (606,491) |
ZAR Currency Put | | GSCO-OT | | ZAR | | | 16.500 | | | | 3/6/20 | | | | ZAR | | | | (754,000,000) | | | | ZAR 754,000 | | | | 1,554,794 | | | (819,492) |
| | | | | | | | | | | | | | | | | | | | | | | | | | | |
Total Over-the-Counter Options Written | | | | | | | | | | | | | | | | | | | | | | | | | | $ | 20,204,368 | | | $ (16,182,542) |
| | | | | | | | | | | | | | | | | | | | | | | | | | | |
1.Knock-out option is ineligible for exercise if at any time spot rates are greater than or equal to 3.6 BRL per 1 USD.
2.Knock-out option is ineligible for exercise if at any time spot rates are greater than or equal to 3.7 BRL per 1 USD.
3.Knock-out option is ineligible for exercise if at any time spot rates are greater than or equal to 3.61 BRL per 1 USD.
4.Knock-out option is ineligible for exercise if at any time spot rates are greater than or equal to 650 CLP per 1 USD.
5.Knock-out option is ineligible for exercise if at any time spot rates are greater than or equal to 9.40 NOK per 1 USD.
6.Knock-out option is ineligible for exercise if at any time spot rates are greater than or equal to 75 INR per 1 USD.
7.Knock-out option is ineligible for exercise if at any time spot rates are greater than or equal to 15 ZAR per 1 USD.
8. Upper Barrier: 90 INR/EUR Lower Barrier: 75 INR/EUR Transaction automatically terminated at lower barrier (except in respect of the Premium), provided aKnock-Out event has not occurred. At expiration if spot is at or above upper barrier the option is exercised.
9.AKnock-out option is ineligible for exercise if at any time spot rates are greater than or equal to 1,085.00 KRW per 1 USD.
| | | | | | | | | | | | | | | | | | | | | | | | | | | | | | |
Centrally Cleared Credit Default Swaps at June 30, 2019 | |
| Reference Asset | | | | Buy/Sell
Protection | | Fixed Rate | | Maturity Date | | | | | | Notional Amount
(000’s) | | | Premiums
Received/(Paid) | | Value | | | Unrealized
Appreciation/
(Depreciation) |
Argentine Republic Government | | | | Buy | | 5.000% | | | 6/20/24 | | | | USD | | | | 1,250 | | | $ | (223,472 | ) | | $ | 203,211 | | | $ | (20,261) | |
Argentine Republic Government | | | | Buy | | 5.000 | | | 6/20/24 | | | | USD | | | | 500 | | | | (90,139 | ) | | | 81,284 | | | | (8,855) | |
Brazilian Government International | | | | Buy | | 1.000 | | | 6/20/24 | | | | USD | | | | 1,000 | | | | (23,743 | ) | | | 22,778 | | | | (965) | |
Brazilian Government International | | | | Buy | | 1.000 | | | 6/20/24 | | | | USD | | | | 1,750 | | | | (66,887 | ) | | | 39,861 | | | | (27,026) | |
Brazilian Government International | | | | Buy | | 1.000 | | | 6/20/24 | | | | USD | | | | 1,000 | | | | (23,517 | ) | | | 22,778 | | | | (739) | |
CDX.EM 31 | | | | Buy | | 1.000 | | | 6/20/24 | | | | USD | | | | 1,250 | | | | (42,639 | ) | | | 38,987 | | | | (3,652) | |
CDX.EM 31 | | | | Buy | | 1.000 | | | 6/20/24 | | | | USD | | | | 1,250 | | | | (42,444 | ) | | | 38,987 | | | | (3,457) | |
CDX.EM 31 | | | | Buy | | 1.000 | | | 6/20/24 | | | | USD | | | | 1,250 | | | | (40,139 | ) | | | 38,953 | | | | (1,186) | |
CDX.EM 31 | | | | Buy | | 1.000 | | | 6/20/24 | | | | USD | | | | 1,750 | | | | (88,385 | ) | | | 54,582 | | | | (33,803) | |
CDX.HY 32 | | | | Buy | | 5.000 | | | 6/20/24 | | | | USD | | | | 29,250 | | | | 2,203,825 | | | | (2,239,013) | | | | (35,188) | |
CDX.HY 32 | | | | Buy | | 5.000 | | | 6/20/24 | | | | USD | | | | 30,400 | | | | 2,086,116 | | | | (2,327,042) | | | | (240,926) | |
CDX.HY 32 | | | | Sell | | 5.000 | | | 6/20/24 | | | | USD | | | | 14,000 | | | | (1,019,822 | ) | | | 1,073,609 | | | | 53,787 | |
CDX.HY.32 | | | | Buy | | 5.000 | | | 6/20/24 | | | | USD | | | | 44,000 | | | | 2,633,596 | | | | (3,368,087) | | | | (734,491) | |
Federative Republic of Brazil | | | | Sell | | 1.000 | | | 6/20/22 | | | | USD | | | | 2,500 | | | | 154,768 | | | | 2,168 | | | | 156,936 | |
Intesa Sanpaolo SPA | | | | Sell | | 1.000 | | | 6/20/24 | | | | EUR | | | | 1,750 | | | | 53,556 | | | | (28,342) | | | | 25,214 | |
Mexico Government International | | | | Buy | | 1.000 | | | 6/20/24 | | | | USD | | | | 750 | | | | (16,019 | ) | | | 3,638 | | | | (12,381) | |
Mexico Government International | | | | Buy | | 1.000 | | | 6/20/24 | | | | USD | | | | 3,750 | | | | (80,097 | ) | | | 18,192 | | | | (61,905) | |
Mexico Government International | | | | Buy | | 1.000 | | | 6/20/24 | | | | USD | | | | 1,250 | | | | (11,714 | ) | | | 6,064 | | | | (5,650) | |
Mexico Government International | | | | Buy | | 1.000 | | | 6/20/24 | | | | USD | | | | 1,000 | | | | (7,219 | ) | | | 4,851 | | | | (2,368) | |
Republic Of South Africa Gover | | | | Buy | | 1.000 | | | 6/20/24 | | | | USD | | | | 1,000 | | | | (48,304 | ) | | | 30,852 | | | | (17,452) | |
| | | | | | | | | | | | | | | | | | | | | | |
Total Cleared Credit Default Swaps | | | | | | | | | | | | | | | | | | | | $ | 5,307,321 | | | $ | (6,281,689) | | | $ | (974,368) | |
| | | | | | | | | | | | | | | | | | | | | | |
| | | | | | | | | | | | | | | | | | | | | | | | | | | | | | |
Over-the-Counter Credit Default Swaps at June 30, 2019 | |
| Reference Asset | | Counterparty | | Buy/Sell
Protection | | Fixed Rate | | Maturity Date | | | | | | Notional Amount
(000’s) | | | Premiums
Received/(Paid) | | Value | | | Unrealized
Appreciation/
(Depreciation) |
Hellenic Republic | | BAC | | Sell | | 1.000% | | | 6/20/25 | | | | USD | | | | 1,414 | | | $ | 235,247 | | | $ | (141,597) | | | $ | 93,650 | |
Hellenic Republic | | BAC | | Sell | | 1.000 | | | 6/20/25 | | | | USD | | | | 3,534 | | | | 529,497 | | | | (353,892) | | | | 175,605 | |
Hellenic Republic | | BAC | | Sell | | 1.000 | | | 12/20/25 | | | | USD | | | | 3,400 | | | | 528,719 | | | | (383,595) | | | | 145,124 | |
Hellenic Republic | | BAC | | Sell | | 1.000 | | | 12/20/19 | | | | USD | | | | 2,350 | | | | 35,260 | | | | 5,467 | | | | 40,727 | |
Hellenic Republic | | GSCOI | | Sell | | 1.000 | | | 6/20/25 | | | | USD | | | | 1,410 | | | | 222,469 | | | | (141,196) | | | | 81,273 | |
Hellenic Republic Government B | | BAC | | Sell | | 1.000 | | | 6/20/29 | | | | USD | | | | 3,750 | | | | 721,540 | | | | (679,221) | | | | 42,319 | |
Hellenic Republic Government B | | BAC | | Sell | | 1.000 | | | 6/20/26 | | | | USD | | | | 5,500 | | | | 686,136 | | | | (686,816) | | | | (680) | |
Hellenic Republic Government B | | BAC | | Sell | | 1.000 | | | 6/20/26 | | | | USD | | | | 6,000 | | | | 692,759 | | | | (749,087) | | | | (56,328) | |
Hellenic Republic Government B | | BOA | | Sell | | 1.000 | | | 6/20/24 | | | | USD | | | | 1,500 | | | | 122,900 | | | | (109,604) | | | | 13,296 | |
Intesa Sanpaolo SPA | | BAC | | Sell | | 1.000 | | | 6/20/24 | | | | EUR | | | | 883 | | | | (112,478 | ) | | | 89,493 | | | | (22,985) | |
iTraxx Europe Crossover Series 24 Version 1 | | JPM | | Sell | | 5.000 | | | 12/20/20 | | | | EUR | | | | 2,900 | | | | (272,147 | ) | | | 176,420 | | | | (95,727) | |
Oriental Republic of Uruguay | | BOA | | Sell | | 1.000 | | | 12/20/21 | | | | USD | | | | 2,697 | | | | 48,743 | | | | (38,604) | | | | 10,139 | |
| | |
| 31 INVESCO OPPENHEIMER V.I. GLOBAL STRATEGIC INCOME FUND |
CONSOLIDATED STATEMENT OF INVESTMENTS Unaudited / Continued
| | | | | | | | | | | | | | | | | | | | | | | | | | | | | | | | | | | | | | | | | | | | | | | | |
Over-the-Counter Credit Default Swaps (Continued) | |
| Reference Asset | | Counterparty | | | Buy/Sell
Protection | | | Fixed Rate | | | Maturity Date | | | | | | Notional Amount
(000’s) | | | | | | Premiums
Received/(Paid) | | | | | | Value | | | | | | Unrealized
Appreciation/
(Depreciation) | |
State Bank of India | | | BNP | | | | Sell | | | | 1.000% | | | | 9/20/19 | | | | USD | | | | 1,740 | | | $ | | | | | 71,791 | | | $ | | | | | 4,049 | | | $ | | | | | 75,840 | |
| | | | | | | | | | | | | | | | | | | | | | | | | | | | |
TotalOver-the-Counter Credit Default Swaps | | | | | | | | | | | | | | | ��$ | | | | | 3,510,436 | | | $ | | | | | (3,008,183 | ) | | $ | | | | | 502,253 | |
| | | | | | | | | | | | | | | | | | | | | | | | | | | | |
The table that follows shows the undiscounted maximum potential payment by the Fund related to selling credit protection in credit default swaps:
| | | | | | | | | | | | | | | | | | | | |
Type of Reference Asset on which the Fund Sold Protection | | | | Total Maximum Potential Payments
for Selling Credit Protection
(Undiscounted) | | | | | | | | Amount Recoverable* | | | Reference Asset Rating
Range**(Unaudited) | |
Non Investment Grade Sovereign Debt | | $ | | | 31,358,000 | | | | | | | $ | | | 3,750,000 | | | | BB- to BB | |
Indexes | | | | | | | | | | | | | | | | | | | | |
Non Investment Grade Corporate Debt | | | | | 14,000,000 | | | | | | | | | | 103,650,000 | | | | B | |
Indexes | | | | | | | | | | | | | | | | | | | | |
| Investment Grade Sovereign Debt Indexes | | | | | 2,697,000 | | | | | | | | | | — | | | | BBB | |
| Investment Grade Single Name Corp Debt | | | | | 1,740,000 | | | | | | | | | | — | | | | BBB- | |
Indexes | | | | | | | | | | | | | | | | | | | | |
| Investment Grade Single Name Corp Debt | | | | | 2,633,000 | | | | EUR | | | | | | — | | | | BBB | |
Indexes | | | | | | | | | | | | | | | | | | | | |
Non Investment Grade Corporate Debt | | | | | | | | | EUR | | | | | | | | | | D | |
Indexes | | | | | 2,900,000 | | | | | | | | | | — | | | | | |
| | | | | | | | | | | | | | |
Total USD | | $ | | | 49,795,000 | | | | | | | $ | | | 107,400,000 | | | | | |
| | | | | | | | | | | | | | |
Total EUR | | | | | 5,533,000 | | | | EUR | | | | | | | | | | | |
| | | | | | | | | | | | | | |
*Amounts recoverable includes potential payments from related purchased protection for instances where the Fund is the seller of protection. In addition, the Fund has no recourse provisions under the credit derivatives and holds no collateral which can offset or reduce potential payments under a triggering event.
**The period end reference asset security ratings, as rated by any rating organization, are included in the equivalent Standard & Poor’s rating category. The reference asset rating represents the likelihood of a potential credit event on the reference asset which would result in a related payment by the Fund.
| | | | | | | | | | | | | | | | | | | | | | | | | | | | | | | | | | | | | | | | |
| Centrally Cleared Interest Rate Swaps at June 30, 2019 |
| Counterparty | | Pay/Receive
Floating Rate | | | Floating Rate | | | Fixed Rate | | | Maturity Date | | | | | | Notional
Amount
(000’s) | | | | | Premiums
Received / (Paid) | | | | | Value | | | | | Unrealized
Appreciation/
(Depreciation) |
| | | | | | | Six-Month EUR | | | | | | | | | | | | | | | | | | | | | | | | | | | | | | | | | |
BAC | | | Receive | | | | EURIBOR | | | | 1.123% | | | | 3/8/28 | | | | EUR | | | | 2,475 | | | $ | | | — | | | $ | | | (276,293 | ) | | $ | | (276,293) |
| | | | | | | Six-Month HUF | | | | | | | | | | | | | | | | | | | | | | | | | | | | | | | | | |
BNP | | | Receive | | | | BUBOR Reuters | | | | 3.280 | | | | 10/26/28 | | | | HUF | | | | 475,700 | | | | | | — | | | | | | (252,090 | ) | | | | (252,090) |
| | | | | | | Six-Month HUF | | | | | | | | | | | | | | | | | | | | | | | | | | | | | | | | | |
BNP | | | Pay | | | | BUBOR Reuters | | | | 1.210 | | | | 10/26/20 | | | | HUF | | | | 2,101,000 | | | | | | — | | | | | | 129,885 | | | | | 129,885 |
| | | | | | | Three-Month USD | | | | | | | | | | | | | | | | | | | | | | | | | | | | | | | | | |
BOA | | | Receive | | | | BBA LIBOR | | | | 1.650 | | | | 6/17/22 | | | | USD | | | | 152,000 | | | | | | — | | | | | | (168,240 | ) | | | | (168,240) |
| | | | | | | Three-Month USD | | | | | | | | | | | | | | | | | | | | | | | | | | | | | | | | | |
BOA | | | Receive | | | | BBA LIBOR | | | | 1.850 | | | | 9/25/24 | | | | USD | | | | 105,567 | | | | | | — | | | | | | (613,003 | ) | | | | (613,003) |
| | | | | | | Three-Month USD | | | | | | | | | | | | | | | | | | | | | | | | | | | | | | | | | |
BOA | | | Receive | | | | BBA LIBOR | | | | 1.675 | | | | 6/9/22 | | | | USD | | | | 71,053 | | | | | | — | | | | | | (112,564 | ) | | | | (112,564) |
| | | | | | | Three-Month USD | | | | | | | | | | | | | | | | | | | | | | | | | | | | | | | | | |
BOA | | | Receive | | | | BBA LIBOR | | | | 1.790 | | | | 3/25/25 | | | | USD | | | | 46,000 | | | | | | — | | | | | | (139,277 | ) | | | | (139,277) |
BOA | | | Pay | | | | BZDI | | | | 9.160 | | | | 7/1/22 | | | | BRL | | | | 144,900 | | | | | | — | | | | | | 277,210 | | | | | 277,210 |
| | | | | | | Six-Month HUF | | | | | | | | | | | | | | | | | | | | | | | | | | | | | | | | | |
CITNA-B | | | Pay | | | | BUBOR | | | | 2.205 | | | | 3/8/28 | | | | HUF | | | | 825,000 | | | | | | — | | | | | | 129,636 | | | | | 129,636 |
CITNA-B | | | Pay | | | | COOVIBR | | | | 5.560 | | | | 8/26/26 | | | | COP | | | | 12,803,000 | | | | | | — | | | | | | 168,812 | | | | | 168,812 |
DEU | | | Pay | | | | MXN TIIE BANXICO | | | | 8.120 | | | | 5/5/21 | | | | MXN | | | | 243,190 | | | | | | — | | | | | | 123,714 | | | | | 123,714 |
DEU | | | Pay | | | | MXN TIIE BANXICO | | | | 8.525 | | | | 1/15/24 | | | | MXN | | | | 70,450 | | | | | | — | | | | | | 184,598 | | | | | 184,598 |
| | | | | | | Three-Month ZAR | | | | | | | | | | | | | | | | | | | | | | | | | | | | | | | | | |
DEU | | | Pay | | | | JIBAR SAFEX | | | | 7.675 | | | | 2/21/22 | | | | ZAR | | | | 26,465 | | | | | | — | | | | | | 42,785 | | | | | 42,785 |
DEU | | | Pay | | | | JIBA3M | | | | 8.420 | | | | 8/29/28 | | | | ZAR | | | | 62,800 | | | | | | — | | | | | | 244,359 | | | | | 244,359 |
GSCOI | | | Pay | | | | MXN TIIE BANXICO | | | | 8.120 | | | | 5/5/21 | | | | MXN | | | | 250,790 | | | | | | — | | | | | | 127,580 | | | | | 127,580 |
GSCOI | | | Pay | | | | COOVIBR | | | | 4.610 | | | | 6/7/20 | | | | COP | | | | 20,710,000 | | | | | | — | | | | | | 36,594 | | | | | 36,594 |
GSCOI | | | Receive | | | | WIBR6M | | | | 2.095 | | | | 5/30/24 | | | | PLN | | | | 14,500 | | | | | | — | | | | | | (42,036 | ) | | | | (42,036) |
GSCOI | | | Pay | | | | BZDI | | | | 6.825 | | | | 1/4/21 | | | | BRL | | | | 14,200 | | | | | | — | | | | | | 49,264 | | | | | 49,264 |
GSCOI | | | Pay | | | | MXN TIIE BANXICO | | | | 7.845 | | | | 12/7/23 | | | | MXN | | | | 146,300 | | | | | | — | | | | | | 174,192 | | | | | 174,192 |
| | | | | | | Three-Month COP IBR | | | | | | | | | | | | | | | | | | | | | | | | | | | | | | | | | |
GSCOI | | | Pay | | | | OIS Compound | | | | 6.500 | | | | 11/9/28 | | | | COP | | | | 6,000,000 | | | | | | — | | | | | | 192,380 | | | | | 192,380 |
GSCOI | | | Pay | | | | MXN TIIE BANXICO | | | | 8.055 | | | | 3/2/22 | | | | MXN | | | | 208,200 | | | | | | — | | | | | | 186,206 | | | | | 186,206 |
GSCOI | | | Pay | | | | SORF6M | | | | 1.980 | | | | 3/4/21 | | | | SGD | | | | 50,200 | | | | | | — | | | | | | 176,024 | | | | | 176,024 |
| | | | | | | Six-Month | | | | | | | | | | | | | | | | | | | | | | | | | | | | | | | | | |
GSCOI | | | Pay | | | | GBP-LIBOR-BBA | | | | 3.450 | | | | 10/15/25 | | | | GBP | | | | 6,930 | | | | | | — | | | | | | (9,905 | ) | | | | (9,905) |
GSCOI | | | Receive | | | | SORF6M | | | | 2.073 | | | | 3/4/24 | | | | SGD | | | | 20,600 | | | | | | — | | | | | | (257,682 | ) | | | | (257,682) |
GSCOI | | | Pay | | | | COOVIBR | | | | 4.380 | | | | 2/26/20 | | | | COP | | | | 93,400,000 | | | | | | — | | | | | | 73,093 | | | | | 73,093 |
GSCOI | | | Pay | | | | MXN TIIE BANXICO | | | | 8.620 | | | | 12/26/28 | | | | MXN | | | | 37,300 | | | | | | — | | | | | | 147,950 | | | | | 147,950 |
| | |
| 32 INVESCO OPPENHEIMER V.I. GLOBAL STRATEGIC INCOME FUND |
| | | | | | | | | | | | | | | | | | | | | | | | |
Centrally Cleared Interest Rate Swaps (Continued) | |
| Counterparty | | Pay/Receive
Floating Rate | | Floating Rate | | Fixed Rate | | Maturity Date | | | | Notional
Amount
(000’s) | | Premiums
Received /(Paid) | | | Value | | | Unrealized
Appreciation/
(Depreciation) | |
GSCOI | | Pay | | COOVIBR | | 4.380% | | 1/10/20 | | COP | | 49,450,000 | | $ | — | | | $ | 37,500 | | | $ | 37,500 | |
HSBC | | Pay | | MXN TIIE BANXICO | | 7.950 | | 5/1/24 | | MXN | | 57,400 | | | — | | | | 85,422 | | | | 85,422 | |
HSBC | | Receive | | MXN TIIE BANXICO | | 8.600 | | 1/18/29 | | MXN | | 40,600 | | | — | | | | (158,232) | | | | (158,232) | |
JPM | | Receive | | 1 Time CLP TNA | | 2.280 | | 6/17/20 | | CLP | | 21,331,700 | | | — | | | | (18,088) | | | | (18,088) | |
JPM | | Pay | | 1 Time CLP TNA | | 2.760 | | 6/17/24 | | CLP | | 4,434,000 | | | — | | | | 1,687 | | | | 1,687 | |
JPM | | Pay | | BZDI | | 8.220 | | 7/3/23 | | BRL | | 127,500 | | | — | | | | (62,184) | | | | (62,184) | |
JPM | | Pay | | Three-Month ZAR JIBAR SAFEX | | 7.930 | | 11/27/22 | | ZAR | | 15,000 | | | — | | | | 36,377 | | | | 36,377 | |
JPM | | Receive | | BUBOR06M | | 2.265 | | 1/8/29 | | HUF | | 450,000 | | | — | | | | (73,998) | | | | (73,998) | |
JPM | | Pay | | MXN TIIE BANXICO | | 7.810 | | 12/7/23 | | MXN | | 176,800 | | | — | | | | 197,988 | | | | 197,988 | |
JPM | | Receive | | BZDI | | 2.280 | | 1/4/27 | | BRL | | 46,000 | | | — | | | | 744,241 | | | | 744,241 | |
JPM | | Pay | | MXN TIIE BANXICO | | 8.750 | | 10/29/20 | | MXN | | 649,000 | | | — | | | | 429,216 | | | | 429,216 | |
JPM | | Pay | | BZDI | | 10.940 | | 1/2/23 | | BRL | | 22,770 | | | — | | | | 776,095 | | | | 776,095 | |
JPM | | Pay | | BZDI | | 9.230 | | 7/1/22 | | BRL | | 153,000 | | | — | | | | 303,287 | | | | 303,287 | |
JPM | | Pay | | BZDI | | 9.280 | | 7/1/22 | | BRL | | 119,900 | | | — | | | | 243,593 | | | | 243,593 | |
JPM | | Pay | | COOVIBR | | 4.890 | | 10/17/20 | | COP | | 46,900,000 | | | — | | | | 185,265 | | | | 185,265 | |
JPM | | Pay | | BUBOR06M | | 1.185 | | 1/8/22 | | HUF | | 1,400,000 | | | — | | | | 77,488 | | | | 77,488 | |
MSCO | | Pay | | EUR006M | | 1.282 | | 4/29/49 | | EUR | | 18,725 | | | — | | | | 755,474 | | | | 755,474 | |
MSCO | | Receive | | EUR006M | | 1.060 | | 4/30/59 | | EUR | | 20,805 | | | — | | | | (879,575) | | | | (879,575) | |
SIB | | Pay | | BZDI | | 8.415 | | 1/2/25 | | BRL | | 42,000 | | | — | | | | 584,937 | | | | 584,937 | |
SIB | | Pay | | MXN TIIE BANXICO | | 7.880 | | 6/9/22 | | MXN | | 167,700 | | | — | | | | 129,861 | | | | 129,861 | |
UBS | | Pay | | BBSW3M | | 1.560 | | 3/21/21 | | AUD | | 105,600 | | | — | | | | 705,252 | | | | 705,252 | |
UBS | | Receive | | BBSW6M | | 1.823 | | 3/21/24 | | AUD | | 43,100 | | | — | | | | (840,465) | | | | (840,465) | |
Total of Centrally Cleared Interest Rate Swaps | | $ | — | | | $ | 3,854,333 | | | $ | 3,854,333 | |
| | | | | | | | | | | | | | |
| | | | | | | | | | | | | | | |
Over-the-Counter Interest Rate Swaps at June 30, 2019 | |
| Counterparty | | Pay/Receive
Floating Rate | | Floating Rate | | Fixed Rate | | Maturity Date | | | | Notional
Amount
(000’s) | | Premiums
Received /(Paid) | | | Value | | | Unrealized
Appreciation/
(Depreciation) | |
BOA | | Pay | | Six-Month INR FBIL MIBOR OIS Compound | | 6.330% | | 1/31/22 | | INR | | 210,000 | | $ | — | | | $ | 63,751 | | | $ | 63,751 | |
BOA | | Receive | | Six-Month INR FBIL MIBOR OIS Compound | | 5.740 | | 5/16/21 | | INR | | 1,157,000 | | | — | | | | (74,170) | | | | (74,170) | |
BOA | | Receive | | INR FBIL MIBOR OIS Compound | | 5.670 | | 5/27/21 | | INR | | 1,180,000 | | | — | | | | (32,206) | | | | (32,206) | |
DEU | | Receive | | JIBA3M | | 7.065 | | 5/14/20 | | ZAR | | 1,887,000 | | | — | | | | (124,774) | | | | (124,774) | |
GSCOI | | Receive | | KWCDC | | 1.705 | | 4/25/24 | | KRW | | 34,267,310 | | | — | | | | (392,013) | | | | (392,013) | |
GSCOI | | Pay | | KWCDC | | 1.743 | | 4/25/21 | | KRW | | 84,694,855 | | | — | | | | 314,228 | | | | 314,228 | |
GSCOI | | Pay | | MOSKP3 | | 8.270 | | 5/23/24 | | RUB | | 100,000 | | | — | | | | 21,378 | | | | 21,378 | |
GSCOI | | Pay | | MOSKP3 | | 8.360 | | 6/24/29 | | RUB | | 130,925 | | | — | | | | (9,780) | | | | (9,780) | |
SCB | | Receive | | Six-Month INR FBIL MIBOR OIS Compound | | 6.438 | | 1/10/24 | | INR | | 250,000 | | | — | | | | (134,124) | | | | (134,124) | |
Total ofOver-the-Counter Interest Rate Swaps | | $ | — | | | $ | (367,710) | | | $ | (367,710) | |
| | | | | | | | | | | | | | |
| | | | | | | | | | | | | | | |
| | | | | | | | | | | | | | | | | | | | | | | | |
Over-the-Counter Total Return Swaps at June 30, 2019 | |
| Reference Asset | | Counterparty | | Pay/Receive Total
Return* | | Floating Rate | | Maturity Date | | | | Notional Amount
(000’s) | | | Value | | | Unrealized
Appreciation/
(Depreciation) | |
| iBoxx USD Liquid High Yield Index Series 1 Version 1 | | JPM | | Receive | | USD LIBOR BBA | | 9/26/19 | | USD | | | 15,261 | | | $ | 1,041,994 | | | $ | 1,041,994 | |
| iBoxx USD Liquid High Yield Index Series 1 Version 1 | | JPM | | Receive | | USD LIBOR BBA | | 9/26/19 | | USD | | | 14,000 | | | | 562,684 | | | | 562,684 | |
| TotalOver-the-Counter Total Return Swaps | | | | | | | | | | | | $ | 1,604,678 | | | $ | 1,604,678 | |
| | | | | | | | | | | | | | | | | | | | | | |
*Fund will pay or receive the total return of the reference asset depending on whether the return is positive or negative. For contracts where the Fund has elected to receive the total return of the reference asset if positive, it will be responsible for paying the floating rate and the total return of the reference asset if negative. If the Fund has elected to pay the total return of the reference asset if positive, it will receive the floating rate and the total return of the reference asset if negative.
| | | | | | | | | | | | | | | | | | | | | | | | | | | | | | | | | | | | |
Over-the-Counter Credit Default Swaptions Written at June 30, 2019 | |
| Description | | Counterparty | | | Buy/Sell
Protection | | | Reference Asset | | | Fixed Rate | | | Expiration Date | | | | | | Notional
Amount (000’s) | | | Premiums Received | | | Value | |
Credit Default Swap Maturing 06/20/2024 Put | | | JPM | | | | Sell | | | | CDX.NA.HY.32 | | | | 5.000% | | | | 7/17/19 | | | | USD | | | | 27,977 | | | $ | 139,885 | | | $ | (21,706) | |
| | |
| 33 INVESCO OPPENHEIMER V.I. GLOBAL STRATEGIC INCOME FUND |
CONSOLIDATED STATEMENT OF INVESTMENTSUnaudited / Continued
| | | | | | | | | | | | | | | | | | | | | | | | | | | | | | | | | | |
| Over-the-Counter Credit Default Swaptions Written (Continued) |
| Description | | Counterparty | | | Buy/Sell
Protection | | | Reference Asset | | | Fixed Rate | | | Expiration Date | | | | | | Notional Amount (000’s) | | | Premiums Received | | | Value |
| Credit Default Swap Maturing 06/20/2024 Put | | | JPM | | | | Sell | | | | CDX.NA.HY.32 | | | | 5.000% | | | | 7/17/19 | | | | USD | | | | 60,800 | | | $ | 340,480 | | | $ (47,172) |
|
| Credit Default Swap Maturing 06/20/2024 Put | | | JPM | | | | Sell | | | | CDX.NA.HY.32 | | | | 5.000 | | | | 8/21/19 | | | | USD | | | | 76,000 | | | | 695,400 | | | (136,214) |
|
| Credit Default Swap Maturing 06/20/2024 Put | | | JPM | | | | Sell | | |
| ITRAXX Europe
Crossover Series
31 Version 1 |
| | | 5.000 | | | | 7/17/19 | | | | EUR | | | | 115,000 | | | | 219,449 | | | (44,505) |
|
| Credit Default Swap Maturing 06/20/2024 Put | | | MSCO | | | | Sell | | | | CDX.NA.HY.32 | | | | 5.000 | | | | 10/16/19 | | | | USD | | | | 14,000 | | | | 65,800 | | | (65,251) |
| | | | | | | | | | | | | | | | | | | | | | | | | | | | | | | |
| TotalOver-the-Counter Credit Default Swaptions Written | | | | | | | | | | | | | | | | | | | $ | 1,461,014 | | | $ (314,848) |
| | | | | | | | | | | | | | | | | | | | | | | | | | | | | | | |
| | | | | | | | | | | | | | | | | | | | | | | | | | | | | | | | | | |
| Over-the-Counter Interest Rate Swaptions Written at June 30, 2019 |
| | | | | | | | | |
| Description | | Counterparty | | | Pay/Receive
Floating Rate | | | Floating Rate | | | Fixed Rate | | | Expiration Date | | | | | | Notional Amount (000’s) | | | Premiums Received | | | Value |
| Interest Rate Swap Maturing 6/5/2020 Put | | | BOA | | | | Pay | | |
| Three-Month
USD LIBOR
BBA |
| | | 2.075% | | | | 6/5/20 | | | | USD | | | | 203,007 | | | $ | 520,712 | | | $ (389,448) |
| Interest Rate Swap Maturing 8/14/2019 Call | | | BOA | | | | Receive | | |
| Three-Month
CAD BA CDOR |
| | | 2.000 | | | | 8/14/19 | | | | CAD | | | | 60,875 | | | | 250,849 | | | (751,115) |
| Interest Rate Swap Maturing 6/15/2020 Put | | | BOA | | | | Pay | | |
| Three-Month
USD LIBOR
BBA |
| | | 1.900 | | | | 6/15/20 | | | | USD | | | | 400,000 | | | | 1,476,462 | | | (1,188,336) |
| Interest Rate Swap Maturing 9/4/2019 Put | | | BOA | | | | Pay | | |
| Three-Month
USD LIBOR
BBA |
| | | 2.118 | | | | 9/4/19 | | | | USD | | | | 91,400 | | | | 237,031 | | | (79,812) |
| Interest Rate Floor Maturing 4/14/2020 Call | | | GSCOI | | | | Receive | | |
| The greater of:
10 x (0.10%
minus (CMS10
minus CMS2))
or Zero |
| | | 0.000 | | | | 10/15/19 | | | | USD | | | | 29,242 | | | | 36,553 | | | (11,796) |
| Interest Rate Floor Maturing 4/14/2020 Call | | | GSCOI | | | | Receive | | |
| The greater of:
10 x (0.00%
minus (CMS10
minus CMS2))
or Zero |
| | | 10.000 | | | | 4/16/20 | | | | USD | | | | 29,242 | | | | 102,347 | | | (73,643) |
| Interest Rate Swap Maturing 8/27/2019 Call | | | GSCOI | | | | Receive | | |
| Three-Month
USD LIBOR
BBA |
| | | 1.550 | | | | 8/27/19 | | | | USD | | | | 91,000 | | | | 114,508 | | | (93,140) |
| Interest Rate Swap Maturing 6/15/2020 Put | | | GSCOI | | | | Pay | | |
| Three-Month
RUB
MOSPRIME
NFEA |
| | | 8.080 | | | | 6/15/20 | | | | RUB | | | | 255,500 | | | | 79,463 | | | (126,176) |
| Interest Rate Swap Maturing 8/30/2019 Call | | | GSCOI | | | | Receive | | |
| Three-Month
USD LIBOR
BBA |
| | | 1.550 | | | | 8/30/19 | | | | USD | | | | 229,000 | | | | 171,750 | | | (241,723) |
| Interest Rate Floor Maturing 4/09/2020 Call | | | JPM | | | | Receive | | |
| 10 * MAX [0;
0.00% minus
([FRO 1] minus
[FRO 2])] |
| | | 0.000 | | | | 4/13/20 | | | | USD | | | | 73,100 | | | | 138,890 | | | (89,606) |
| Interest Rate Swap Maturing 6/8/2020 Call | | | JPM | | | | Receive | | |
| Three-Month
USD LIBOR
BBA |
| | | 1.693 | | | | 6/8/20 | | | | USD | | | | 152,000 | | | | 905,160 | | | (962,798) |
| Interest Rate Swap Maturing 6/8/2020 Put | | | JPM | | | | Pay | | |
| Three-Month
USD LIBOR
BBA |
| | | 1.693 | | | | 6/8/20 | | | | USD | | | | 152,000 | | | | 905,160 | | | (692,007) |
| Interest Rate Swap Maturing 9/5/2019 Put | | | JPM | | | | Pay | | |
| Three-Month
USD LIBOR
BBA |
| | | 2.010 | | | | 9/5/19 | | | | USD | | | | 76,000 | | | | 265,240 | | | (125,019) |
| Interest Rate Swap Maturing 11/25/2019 Call | | | JPM | | | | Pay | | |
| Three-Month
USD LIBOR
BBA |
| | | 1.884 | | | | 11/25/19 | | | | USD | | | | 76,000 | | | | 381,900 | | | (984,995) |
| Interest Rate Swap Maturing 5/5/2020 Call | | | JPM | | | | Receive | | |
| Three-Month
USD LIBOR
BBA |
| | | 2.159 | | | | 5/5/20 | | | | USD | | | | 75,530 | | | | 566,475 | | | (2,119,466) |
| Interest Rate Swap Maturing 9/4/2019 Call | | | JPM | | | | Receive | | |
| Three-Month
USD LIBOR
BBA |
| | | 2.400 | | | | 9/4/19 | | | | USD | | | | 73,000 | | | | 306,600 | | | (2,330,605) |
| Interest Rate Swap Maturing 9/3/2019 Call | | | JPM | | | | Receive | | |
| Three-Month
USD LIBOR
BBA |
| | | 2.400 | | | | 9/3/19 | | | | USD | | | | 72,985 | | | | 306,537 | | | (2,328,911) |
| | |
| 34 INVESCO OPPENHEIMER V.I. GLOBAL STRATEGIC INCOME FUND |
| | | | | | | | | | | | | | | | | | | | | | | | | | | | | | | | | | | | | | | | | | | | | | |
Over-the-Counter Interest Rate Swaptions Written (Continued) |
| Description | | Counterparty | | | Pay/Receive
Floating Rate | | | Floating Rate | | | Fixed Rate | | | Expiration
Date | | | | | | | | Notional | | Amount
(000’s) | | | | | | Premiums Received | | | | | | Value |
|
Interest Rate Floor Maturing 4/9/2020 Call | | | MSCO | | | | Receive | | |
| MAX [(
0.013%
minus (CMS10
minus CMS2)),
0.00%] * 10 |
| | | 1.300% | | | | 4/13/20 | | | | | | USD | | | | | | 74,001 | | | $ | | | | | 185,003 | | | $ | | | | (100,087) |
Interest Rate Cap Maturing 4/11/19 Put | | | MSCO | | | | Pay | | |
| MAX [( 0.463%
minus (CMS10
minus CMS2)),
0.00%] * 10 |
| | | 46.300 | | | | 4/13/20 | | | | | | USD | | | | | | 74,001 | | | | | | | | 351,506 | | | | | | | (669,518) |
Interest Rate Swap Maturing 11/18/2019 Call | | | MSCO | | | | Receive | | |
| Three-Month
USD LIBOR
BBA |
| | | 2.000 | | | | 11/18/19 | | | | | | USD | | | | | | 305,000 | | | | | | | | 597,800 | | | | | | | (1,321,602) |
Interest Rate Swap Maturing 8/30/2019 Call | | | MSCO | | | | Receive | | |
| Three-Month
USD LIBOR
BBA |
| | | 1.574 | | | | 8/30/19 | | | | | | USD | | | | | | 229,000 | | | | | | | | 155,720 | | | | | | | (265,196) |
| | | | | | | | | | | | | | | | | | | | | | | | | | | | | | | | | | | |
TotalOver-the-Counter Interest Rate Swaptions Written | | | | | | | | | | | | | | | $ | | | | | 8,055,666 | | | $ | | | | (14,944,999) |
| | | | | | | | | | | | | | | | | | | | | | | | | | | | | | | | | | | |
| | |
| Glossary: | | |
| Counterparty Abbreviations | | |
| BAC | | Barclays Bank plc |
| BNP | | BNP Paribas |
| BOA | | Bank of America NA |
| CITNA-B | | Citibank NA |
| DEU | | Deutsche Bank AG |
| GSCOI | | Goldman Sachs International |
| GSCO-OT | | Goldman Sachs Bank USA |
| HSBC | | HSBC Bank USA NA |
| JPM | | JPMorgan Chase Bank NA |
| MSCO | | Morgan Stanley Capital Services, Inc. |
| RBC | | RBC Dominion Securities |
| SCB | | Standard Chartered Bank |
| SIB | | Banco Santander SA |
| UBS | | UBS AG |
|
| Currency abbreviations indicate amounts reporting in currencies |
| ARS | | Argentine Peso |
| AUD | | Australian Dollar |
| BRL | | Brazilian Real |
| CAD | | Canadian Dollar |
| CLP | | Chilean Peso |
| COP | | Colombian Peso |
| CNY | | Chinese Renminbi |
| EGP | | Egyptian Pounds |
| EUR | | Euro |
| GBP | | British Pound Sterling |
| HUF | | Hungarian Forint |
| IDR | | Indonesian Rupiah |
| INR | | Indian Rupee |
| JPY | | Japanese Yen |
| KRW | | South Korean Won |
| MXN | | Mexican Nuevo Peso |
| MYR | | Malaysian Ringgit |
| NOK | | Norwegian Krone |
| PEN | | Peruvian New Sol |
| PHP | | Philippine Peso |
| PLN | | Polish Zloty |
| RUB | | Russian Ruble |
| SEK | | Swedish Krona |
| SGD | | Singapore Dollar |
| THB | | Thailand Baht |
| TRY | | New Turkish Lira |
| UYU | | Uruguay Peso |
| ZAR | | South African Rand |
| |
| Definitions | | |
| BA CDOR | | Canada Bankers Acceptances Deposit Offering Rate |
| BANXICO | | Banco de Mexico |
| BBA LIBOR | | British Bankers’ Association London - Interbank Offered Rate |
| BBSW3M | | ASX Australian Bank Bill Short Ternm Rate 3 Month Mid |
| | |
| 35 INVESCO OPPENHEIMER V.I. GLOBAL STRATEGIC INCOME FUND |
CONSOLIDATED STATEMENT OF INVESTMENTS Unaudited / Continued
| | |
| Definitions (Continued) | | |
| BBSW6M | | ASX Australian Bank Bill Short Ternm Rate 6 Month Mid |
| BP0003M | | ICE LIBOR GBP 3 Month |
| BTP | | Italian Treasury Bonds |
| BUBOR | | Budapest Interbank Offered Rate |
| BUBOR06M | | Budapest Interbank Offered Rate 6 Month |
| Bund | | German Federal Obligation |
| BZDI | | Brazil Interbank Deposit Rate |
| COOVIBR | | Colombia IBR Overnight Nominal interbank Reference Rate |
| CDX.EM 31 | | Markit CDX Emerging Markets Index |
| CDX.HY 32 | | Markit CDX High Yield Index |
| CDX.NA.HY.32 | | Markit CDX North American High Yield |
| CMS 2 | | Constant Maturity Swap 2 Month |
| CMS 10 | | Constant Maturity Swap 10 Month |
| EUAMDB05 | | Euribor ICE Swap Rate |
| EUR003M | | EURIBOR 3 Month ACT/360 |
| EUR006M | | EURIBOR 6 Month ACT/360 |
| EURIBOR | | Euro Interbank Offered Rate |
| EUSA5 | | EUR Swap Annual 5 Year |
| EUSA8 | | EUR Swap Annual 8 Year |
| EUSA10 | | EUR Swap Annual 10 Year |
| EUSA11 | | EUR Swap Annual 11 Year |
| FBIL | | Financial Benchmarks India Private Ltd. |
| FRO 1 | | Floating Rate Option 30 yr. rate |
| FRO 2 | | Floating Rate Option 10 yr. rate |
| GUKG5 | | UK Government Bonds 5 Year Note Generic Bid Yield |
| H15T5Y | | US Treasury Yield Curve Rate T Note Constant Maturity 5 Year |
| H15T10Y | | US Treasury Yield Curve Rate T Note Constant Maturity 10 Year |
| H15T1Y | | US Treasury Yield Curve Rate T Note Constant Maturity 1 Year |
| IBR | | Indicador Bancario de Referencia |
| iTraxx Europe Crossover Series 24 Version 1 | | Credit Default Swap Trading Index for a Specific Basket of Securities |
| JIBAR SAFEX | | South Africa Johannesburg Interbank Agreed Rate/Futures Exchange |
| JIBA3M | | South Africa Johannesburg Interbank Agreed Rate 3 Month |
| KWCDC | | South Korean Won Index |
| LIBOR01M | | ICE LIBOR USD 1 Month |
| LIBOR4 | | London Interbank Offered Rate-Quarterly |
| LIBOR6 | | London Interbank OfferedRate-Bi-Monthly |
| LIBOR12 | | London Interbank Offered Rate-Monthly |
| MIBOR | | Mumbai Interbank Offered Rate |
| MOSKP3 | | National Finance Assoc. Moscow Prime Offered 3 Month Rate |
| MOSPRIME NFEA | | National Finance Association Moscow Prime Offered Rate |
| OAT | | French Government Bonds |
| OIS | | Overnight Index Swap |
| PRIME4 | | United States Prime Rate-Quarterly |
| S&P | | Standard & Poor’s |
| SORF6M | | Association of Banks in Singapore Swap Offer Rate Fixing 6 Month |
| TIIE | | Interbank Equilibrium Interest Rate |
| TNA | | Non-Deliverable CLP Camara |
| US0001M | | ICE LIBOR USD 1 Month |
| US0003M | | ICE LIBOR USD 3 Month |
| USISDA05 | | USD ICE Swap Rate 11:00am NY 5 Year |
| USSW5 | | USD Swap Semi 30/360 5 Year |
| WIBR6M | | Warsaw Interbank Offered Rate 6 Month |
See accompanying Notes to Consolidated Financial Statements.
| | |
| 36 INVESCO OPPENHEIMER V.I. GLOBAL STRATEGIC INCOME FUND |
CONSOLIDATED STATEMENT OF ASSETS AND LIABILITIES June 30, 2019 Unaudited
| | | | |
| | |
Assets | | | | |
| |
Investments, at value—see accompanying consolidated statement of investments: | | | | |
| |
Unaffiliated companies (cost $1,476,551,316) | | $ | 1,479,291,154 | |
| |
Affiliated companies (cost $198,268,559) | | | 193,562,447 | |
| |
| | | | 1,672,853,601 | |
Cash | | | 33,207,072 | |
| |
Cash—foreign currencies (cost $111,787) | | | 112,851 | |
| |
Cash used for collateral on futures | | | 2,727,000 | |
| |
Cash used for collateral on OTC derivatives | | | 19,134,000 | |
| |
Cash used for collateral on centrally cleared swaps | | | 13,442,804 | |
| |
Cash used for collateral on forward roll transactions | | | 36,000 | |
| |
Unrealized appreciation on forward currency exchange contracts | | | 11,912,500 | |
| |
Swaps, at value (premiums paid $277,574) | | | 2,279,464 | |
| |
Variation margin receivable – centrally cleared swaps | | | 2,904,887 | |
| |
Receivables and other assets: | | | | |
| |
Investments sold (including $19,525,151 sold on a when-issued or delayed delivery basis) | | | 32,149,790 | |
| |
Interest, dividends and principal paydowns | | | 17,266,184 | |
| |
Variation margin receivable - futures | | | 27,858 | |
| |
Shares of beneficial interest sold | | | 7,348 | |
| |
Other | | | 193,190 | |
Total assets | | | 1,808,254,549 | |
Liabilities | | | | |
| |
Unrealized depreciation on forward currency exchange contracts | | | 14,400,506 | |
| |
Options written, at value (premiums received $20,204,368) | | | 16,182,542 | |
| |
Swaps, at value (premiums received $3,788,010) | | | 4,050,679 | |
| |
Swaptions written, at value (premiums received $9,516,680) | | | 15,259,847 | |
| |
Payables and other liabilities: | | | | |
| |
Investments purchased (including $215,132,680 purchased on a when-issued or delayed delivery basis) | | | 240,632,076 | |
| |
Shares of beneficial interest redeemed | | | 1,157,325 | |
| |
Variation margin payable - futures | | | 233,018 | |
| |
Distribution and service plan fees | | | 224,420 | |
| |
Administration fee | | | 211,385 | |
| |
Trustees’ compensation | | | 156,461 | |
| |
Management fee | | | 77,544 | |
| |
Shareholder communications | | | 66,123 | |
| |
Foreign capital gains tax | | | 45,980 | |
| |
Transfer and shareholder servicing agent fees | | | 20,485 | |
| |
Dividends | | | 454 | |
| |
Other | | | 258,909 | |
Total liabilities | | | 292,977,754 | |
Net Assets | | $ | 1,515,276,795 | |
| | | | |
| | | | | |
| |
Composition of Net Assets | | | | |
| |
Shares of beneficial interest | | $ | 1,669,471,320 | |
| |
Total accumulated loss | | | (154,194,525 | ) |
| |
Net Assets | | $ | 1,515,276,795 | |
| | | | |
| | | | | |
Net Asset Value Per Share | | | | |
| |
Series I Shares: | | | | |
| |
| Net asset value, redemption price per share and offering price per share (based on net assets of $413,961,395 and 85,044,916 shares of beneficial interest outstanding) | | | $4.87 | |
| |
Series II Shares: | | | | |
| |
| Net asset value, redemption price per share and offering price per share (based on net assets of $1,101,315,400 and 219,295,995 shares of beneficial interest outstanding) | | | $5.02 | |
See accompanying Notes to Consolidated Financial Statements.
| | |
| 37 INVESCO OPPENHEIMER V.I. GLOBAL STRATEGIC INCOME FUND |
CONSOLIDATED STATEMENT OF OPERATIONS For the Six Months Ended June 30, 2019Unaudited
| | | | |
| | |
Allocation of Income and Expenses from Master Funds1 | | | | |
| |
Net investment income allocated from Invesco Oppenheimer Master Event-Linked Bond Fund, LLC: | | | | |
| |
Interest | | $ | 1,207,929 | |
| |
Dividends | | | 9,218 | |
| |
Net expenses | | | (65,471 | ) |
| |
Net investment income allocated from Invesco Oppenheimer Master Event-Linked Bond Fund, LLC | | | 1,151,676 | |
| |
Net investment income allocated from Invesco Oppenheimer Master Loan Fund, LLC | | | | |
| |
Interest | | | 1,904,571 | |
| |
Dividends | | | 46,116 | |
| |
Net expenses | | | (160,766 | ) |
| |
Net investment income allocated from Invesco Oppenheimer Master Loan Fund, LLC | | | 1,789,921 | |
| |
Total allocation of net investment income from master funds | | | 2,941,597 | |
| |
Investment Income | | | | |
| |
Interest — unaffiliated companies (net of foreign withholding taxes of $212,870) | | | 40,931,414 | |
| |
Fee income on when-issued securities | | | 406,078 | |
| |
Dividends: | | | | |
| |
Unaffiliated companies (net of foreign withholding taxes of $31,298) | | | 319,875 | |
| |
Affiliated companies | | | 1,829,404 | |
| |
Total investment income | | | 43,486,771 | |
| |
Expenses | | | | |
| |
Management fees | | | 4,571,903 | |
| |
Administration fees | | | 228,721 | |
| |
Distribution and service plan fees — Series II shares | | | 1,357,272 | |
| |
Transfer and shareholder servicing agent fees: | | | | |
| |
Series I shares | | | 179,257 | |
| |
Series II shares | | | 533,463 | |
| |
Shareholder communications: | | | | |
| |
Series I shares | | | 29,567 | |
| |
Series II shares | | | 85,880 | |
| |
Custodian fees and expenses | | | 117,511 | |
| |
Trustees’ compensation | | | 26,404 | |
| |
Borrowing fees | | | 18,328 | |
| |
Other | | | 183,626 | |
| |
Total expenses | | | 7,331,932 | |
Less reduction to custodian expenses | | | (88,927 | ) |
| |
Less waivers and reimbursements of expenses | | | (309,717 | ) |
| |
Net expenses | | | 6,933,288 | |
Net Investment Income | | | 39,495,080 | |
| | |
| 38 INVESCO OPPENHEIMER V.I. GLOBAL STRATEGIC INCOME FUND |
| | | | |
| | |
Realized and Unrealized Gain (Loss) | | | | |
| |
Net realized gain (loss) on: | | | | |
| |
| Investment transactions in unaffiliated companies (including premiums on options exercised)(net of foreign capital gains tax of $207,660) | | | (15,630,324 | ) |
| |
Option contracts written | | | 14,307,474 | |
| |
Futures contracts | | | (4,940,863 | ) |
| |
Foreign currency transactions | | | 237,995 | |
| |
Forward currency exchange contracts | | | (3,790,629 | ) |
| |
Swap contracts | | | 4,086,438 | |
| |
Swaption contracts written | | | (10,284,353 | ) |
| |
Net realized loss allocated from: | | | | |
| |
Invesco Oppenheimer Master Event-Linked Bond Fund, LLC | | | (746,449 | ) |
| |
Invesco Oppenheimer Master Loan Fund, LLC | | | (6,354,754 | ) |
| |
Net realized loss | | | (23,115,465 | ) |
| |
Net change in unrealized appreciation/(depreciation) on: | | | | |
| |
Investment transactions in: | | | | |
Unaffiliated companies (net of foreign capital gains tax of $45,980) | | | 83,738,959 | |
Affiliated companies | | | 296,239 | |
| |
Translation of assets and liabilities denominated in foreign currencies | | | 99,536 | |
| |
Forward currency exchange contracts | | | 2,611,611 | |
| |
Futures contracts | | | (1,028,913 | ) |
| |
Option contracts written | | | 1,278,171 | |
| |
Swap contracts | | | 3,096,982 | |
| |
Swaption contracts written | | | 1,593,990 | |
| |
Net change in unrealized appreciation/(depreciation) allocated from: | | | | |
| |
Invesco Oppenheimer Master Event-Linked Bond Fund, LLC | | | (55,146 | ) |
| |
Invesco Oppenheimer Master Loan Fund, LLC | | | 9,620,511 | |
| |
Net change in unrealized appreciation/(depreciation) | | | 101,251,940 | |
Net Increase in Net Assets Resulting from Operations | | $ | 117,631,555 | |
| | | | |
1. The Fund invests in certain affiliated mutual funds that expect to be treated as partnerships for tax purposes.
See accompanying Notes to Consolidated Financial Statements.
| | |
| 39 INVESCO OPPENHEIMER V.I. GLOBAL STRATEGIC INCOME FUND |
CONSOLIDATED STATEMENTS OF CHANGES IN NET ASSETS
| | | | | | | | |
| | | Six Months Ended
June 30, 2019
(Unaudited) | | | Year Ended
December 31, 2018 | |
Operations | | | | | | | | |
Net investment income | | $ | 39,495,080 | | | $ | 77,241,242 | |
Net realized loss | | | (23,115,465) | | | | (30,542,149) | |
Net change in unrealized appreciation/(depreciation) | | | 101,251,940 | | | | (120,343,292) | |
Net increase (decrease) in net assets resulting from operations | | | 117,631,555 | | | | (73,644,199) | |
Dividends and/or Distributions to Shareholders | | | | | | | | |
Distributions to shareholders from distributable earnings: | | | | | | | | |
Series I shares | | | (15,389,942) | | | | (18,866,160) | |
Series II shares | | | (36,879,378) | | | | (54,450,673) | |
Total distributions from distributable earnings | | | (52,269,320) | | | | (73,316,833) | |
Beneficial Interest Transactions | | | | | | | | |
Net increase (decrease) in net assets resulting from beneficial interest transactions: | | | | | | | | |
Series I shares | | | 52,456,453 | | | | (10,549,208) | |
Series II shares | | | (31,081,425) | | | | (84,976,296) | |
Total beneficial interest transactions | | | 21,375,028 | | | | (95,525,504) | |
Net Assets | | | | | | | | |
Total increase (decrease) | | | 86,737,263 | | | | (242,486,536) | |
Beginning of period | | | 1,428,539,532 | | | | 1,671,026,068 | |
End of period | | $ | 1,515,276,795 | | | $ | 1,428,539,532 | |
| | | | | | | | |
See accompanying Notes to Consolidated Financial Statements.
| | |
| 40 INVESCO OPPENHEIMER V.I. GLOBAL STRATEGIC INCOME FUND |
CONSOLIDATED FINANCIAL HIGHLIGHTS
| | | | | | | | | | | | | | | | | | | | | | | | |
| Series I Shares | | Six Months
Ended
June 30, 2019
(Unaudited) | | | Year Ended
December 31,
2018 | | | Year Ended
December 31,
2017 | | | Year Ended
December 31,
2016 | | | Year Ended
December 31,
2015 | | | Year Ended
December 31,
2014 | |
Per Share Operating Data | | | | | | | | | | | | | | | | | | | | | | | | |
Net asset value, beginning of period | | $ | 4.66 | | | $ | 5.13 | | | $ | 4.94 | | | $ | 4.88 | | | $ | 5.30 | | | $ | 5.38 | |
Income (loss) from investment operations: | | | | | | | | | | | | | | | | | | | | | | | | |
Net investment income1 | | | 0.14 | | | | 0.25 | | | | 0.22 | | | | 0.20 | | | | 0.23 | | | | 0.26 | |
Net realized and unrealized gain (loss) | | | 0.26 | | | | (0.47) | | | | 0.09 | | | | 0.11 | | | | (0.34) | | | | (0.11) | |
Total from investment operations | | | 0.40 | | | | (0.22) | | | | 0.31 | | | | 0.31 | | | | (0.11) | | | | 0.15 | |
Dividends and/or distributions to shareholders: | | | | | | | | | | | | | | | | | | | | | | | | |
Dividends from net investment income | | | (0.19) | | | | (0.25) | | | | (0.12) | | | | (0.25) | | | | (0.31) | | | | (0.23) | |
Net asset value, end of period | | $ | 4.87 | | | $ | 4.66 | | | $ | 5.13 | | | $ | 4.94 | | | $ | 4.88 | | | $ | 5.30 | |
| | | | | | | | | | | | | | | | | | | | | | | | |
| | | | | | | | | | | | | | | | | | | | | | | | |
Total Return, at Net Asset Value2 | | | 8.57% | | | | (4.40)% | | | | 6.27% | | | | 6.53% | | | | (2.26)% | | | | 2.84% | |
| | | | | | | | | | | | | | | | | | | |
Ratios/Supplemental Data | | | | | | | | | | | | | | | | | | | | | | | | |
Net assets, end of period (in thousands) | | $ | 413,961 | | | $ | 346,707 | | | $ | 393,337 | | | $ | 401,308 | | | $ | 429,710 | | | $ | 586,951 | |
Average net assets (in thousands) | | $ | 377,799 | | | $ | 385,157 | | | $ | 400,945 | | | $ | 416,054 | | | $ | 510,765 | | | $ | 707,673 | |
Ratios to average net assets:3,4 | | | | | | | | | | | | | | | | | | | | | | | | |
Net investment income | | | 5.60% | | | | 5.07% | | | | 4.40% | | | | 4.00% | | | | 4.51% | | | | 4.73% | |
Expenses excluding specific expenses listed below | | | 0.85% | | | | 0.88% | | | | 0.82% | | | | 0.79% | | | | 0.76% | | | | 0.74% | |
Interest and fees from borrowings | | | 0.00% | 5 | | | 0.00% | 5 | | | 0.00% | 5 | | | 0.00% | 5 | | | 0.00% | 5 | | | 0.00% | |
Total expenses6 | | | 0.85% | | | | 0.88% | | | | 0.82% | | | | 0.79% | | | | 0.76% | | | | 0.74% | |
Expenses after payments, waivers and/or reimbursements and reduction to custodian expenses | | | 0.80% | | | | 0.81% | | | | 0.76% | | | | 0.74% | | | | 0.73% | | | | 0.71% | |
Portfolio turnover rate7 | | | 63% | | | | 68% | | | | 74% | | | | 80% | | | | 79% | | | | 93% | |
1. Per share amounts calculated based on the average shares outstanding during the period.
2. Assumes an initial investment on the business day before the first day of the fiscal period, with all dividends and distributions reinvested in additional shares on the reinvestment date, and redemption at the net asset value calculated on the last business day of the fiscal period. Total returns are not annualized for periods less than one full year. Total return information does not reflect expenses that apply at the separate account level or to related insurance products. Inclusion of these charges would reduce the total return figures for all periods shown. Returns do not reflect the deduction of taxes that a shareholder would pay on fund distributions or the redemption of fund shares.
3. Annualized for periods less than one full year.
4. Includes the Fund’s share of the allocated expenses and/or net investment income from the master funds.
5. Less than 0.005%.
6. Total expenses including indirect expenses from affiliated fund fees and expenses were as follows:
| | | | |
Six Months Ended June 30, 2019 | | | | 0.87% |
Year Ended December 31, 2018 | | | | 0.90% |
Year Ended December 31, 2017 | | | | 0.83% |
Year Ended December 31, 2016 | | | | 0.80% |
Year Ended December 31, 2015 | | | | 0.77% |
Year Ended December 31, 2014 | | | | 0.75% |
7.The portfolio turnover rate excludes purchase and sale transactions of To Be Announced (TBA) mortgage-related securities as follows:
| | | | | | | | | | | | |
| | | | | | Purchase Transactions | | | Sale Transactions | |
Six Months Ended June 30, 2019 | | | | | | | $1,201,016,750 | | | | $1,187,498,605 | |
Year Ended December 31, 2018 | | | | | | | $2,370,164,194 | | | | $2,399,236,376 | |
Year Ended December 31, 2017 | | | | | | | $2,271,944,419 | | | | $2,153,905,799 | |
Year Ended December 31, 2016 | | | | | | | $1,798,210,272 | | | | $1,766,445,159 | |
Year Ended December 31, 2015 | | | | | | | $1,225,140,927 | | | | $1,266,426,777 | |
Year Ended December 31, 2014 | | | | | | | $1,348,552,640 | | | | $1,337,346,996 | |
See accompanying Notes to Consolidated Financial Statements.
| | |
| 41 INVESCO OPPENHEIMER V.I. GLOBAL STRATEGIC INCOME FUND |
CONSOLIDATED FINANCIAL HIGHLIGHTS Continued
| | | | | | | | | | | | | | | | | | | | | | | | |
| Series II Shares | | Six Months
Ended
June 30, 2019
(Unaudited) | | | Year Ended
December 31,
2018 | | | Year Ended
December 31,
2017 | | | Year Ended
December 31,
2016 | | | Year Ended
December 31,
2015 | | | Year Ended
December 31,
2014 | |
Per Share Operating Data | | | | | | | | | | | | | | | | | | | | | | | | |
Net asset value, beginning of period | | | $4.80 | | | | $5.27 | | | | $5.07 | | | | $5.00 | | | | $5.42 | | | | $5.50 | |
Income (loss) from investment operations: | | | | | | | | | | | | | | | | | | | | | | | | |
Net investment income1 | | | 0.13 | | | | 0.24 | | | | 0.22 | | | | 0.19 | | | | 0.23 | | | | 0.25 | |
Net realized and unrealized gain (loss) | | | 0.26 | | | | (0.48) | | | | 0.08 | | | | 0.12 | | | | (0.35) | | | | (0.11) | |
Total from investment operations | | | 0.39 | | | | (0.24) | | | | 0.30 | | | | 0.31 | | | | (0.12) | | | | 0.14 | |
Dividends and/or distributions to shareholders: | | | | | | | | | | | | | | | | | | | | | | | | |
Dividends from net investment income | | | (0.17) | | | | (0.23) | | | | (0.10) | | | | (0.24) | | | | (0.30) | | | | (0.22) | |
Net asset value, end of period | | | $5.02 | | | | $4.80 | | | | $5.27 | | | | $5.07 | | | | $5.00 | | | | $5.42 | |
| | | | | | | | | | | | | | | | | | | | | | | | |
| | | | | | | | | | | | | | | | | | | | | | | | |
Total Return, at Net Asset Value2 | | | 8.23% | | | | (4.54)% | | | | 6.04% | | | | 6.27% | | | | (2.49)% | | | | 2.49% | |
| | | | | | | | | | | | | | | | | | | |
Ratios/Supplemental Data | | | | | | | | | | | | | | | | | | | | | | | | |
Net assets, end of period (in thousands) | | | $1,101,315 | | | | $1,081,833 | | | | $1,277,689 | | | | $1,284,022 | | | | $1,375,143 | | | | $1,551,247 | |
Average net assets (in thousands) | | | $1,095,036 | | | | $1,196,988 | | | | $1,295,999 | | | | $1,332,343 | | | | $1,496,350 | | | | $1,646,615 | |
Ratios to average net assets:3,4 | | | | | | | | | | | | | | | | | | | | | | | | |
Net investment income | | | 5.34% | | | | 4.82% | | | | 4.15% | | | | 3.75% | | | | 4.26% | | | | 4.48% | |
Expenses excluding specific expenses listed below | | | 1.10% | | | | 1.13% | | | | 1.07% | | | | 1.04% | | | | 1.01% | | | | 0.99% | |
Interest and fees from borrowings | | | 0.00%5 | | | | 0.00%5 | | | | 0.00%5 | | | | 0.00%5 | | | | 0.00%5 | | | | 0.00% | |
Total expenses6 | | | 1.10% | | | | 1.13% | | | | 1.07% | | | | 1.04% | | | | 1.01% | | | | 0.99% | |
| Expenses after payments, waivers and/or reimbursements and reduction to custodian expenses | | | 1.05% | | | | 1.06% | | | | 1.01% | | | | 0.99% | | | | 0.98% | | | | 0.96% | |
Portfolio turnover rate7 | | | 63% | | | | 68% | | | | 74% | | | | 80% | | | | 79% | | | | 93% | |
1.Per share amounts calculated based on the average shares outstanding during the period.
2.Assumes an initial investment on the business day before the first day of the fiscal period, with all dividends and distributions reinvested in additional shares on the reinvestment date, and redemption at the net asset value calculated on the last business day of the fiscal period. Total returns are not annualized for periods less than one full year. Total return information does not reflect expenses that apply at the separate account level or to related insurance products. Inclusion of these charges would reduce the total return figures for all periods shown. Returns do not reflect the deduction of taxes that a shareholder would pay on fund distributions or the redemption of fund shares.
3.Annualized for periods less than one full year.
4.Includes the Fund’s share of the allocated expenses and/or net investment income from the master funds.
5.Less than 0.005%.
6.Total expenses including indirect expenses from affiliated fund fees and expenses were as follows:
| | | | | | | | | | | | |
Six Months Ended June 30, 2019 | | | | | | | 1.12 | % | | | | |
Year Ended December 31, 2018 | | | | | | | 1.15 | % | | | | |
Year Ended December 31, 2017 | | | | | | | 1.08 | % | | | | |
Year Ended December 31, 2016 | | | | | | | 1.05 | % | | | | |
Year Ended December 31, 2015 | | | | | | | 1.02 | % | | | | |
Year Ended December 31, 2014 | | | | | | | 1.00 | % | | | | |
7.The portfolio turnover rate excludes purchase and sale transactions of To Be Announced (TBA) mortgage-related securities as follows:
| | | | | | | | | | | | |
| | | | | | Purchase Transactions | | | Sale Transactions | |
Six Months Ended June 30, 2019 | | | | | | | $1,201,016,750 | | | | $1,187,498,605 | |
Year Ended December 31, 2018 | | | | | | | $2,370,164,194 | | | | $2,399,236,376 | |
Year Ended December 31, 2017 | | | | | | | $2,271,944,419 | | | | $2,153,905,799 | |
Year Ended December 31, 2016 | | | | | | | $1,798,210,272 | | | | $1,766,445,159 | |
Year Ended December 31, 2015 | | | | | | | $1,225,140,927 | | | | $1,266,426,777 | |
Year Ended December 31, 2014 | | | | | | | $1,348,552,640 | | | | $1,337,346,996 | |
See accompanying Notes to Consolidated Financial Statements.
| | |
| 42 INVESCO OPPENHEIMER V.I. GLOBAL STRATEGIC INCOME FUND |
NOTES TO CONSOLIDATED FINANCIAL STATEMENTSJune 30, 2019 Unaudited
Note 1 – Significant Accounting Policies
Invesco Oppenheimer V.I. Global Strategic Income Fund (the “Fund”) is a series portfolio of AIM Variable Insurance Funds(Invesco Variable Insurance Funds) (the “Trust”). The Trust is a Delaware statutory trust registered under the Investment Company Act of 1940, as amended (the “1940 Act”), as anopen-end series management investment company authorized to issue an unlimited number of shares of beneficial interest. Information presented in these financial statements pertains only to the Fund. Matters affecting the Fund or each class will be voted on exclusively by the shareholders of such Fund or each class.
Prior to the close of business on May 24, 2019, the Fund operated as Oppenheimer Global Strategic Income Fund/VA(the “Acquired Fund” or “Predecessor Fund”). The Acquired Fund was reorganized after the close of business on May 24, 2019 (the “Reorganization Date”) through the transfer of all of its assets and liabilities to the Fund (the “Reorganization”).
Upon closing of the Reorganization, holders of the Acquired Fund’sNon-Service and Service shares received Series I and Series II shares of the Fund, respectively. Information for the Acquired Fund’sNon-Service and Service shares prior to the Reorganization is included with Series I and Series II, respectively, throughout this report.
The Fund will seek to gain exposure to Regulation S securities primarily through investments in the Invesco Oppenheimer V.I. Global Strategic Income Fund (Cayman) Ltd. (the “Subsidiary”), a wholly-owned and controlled subsidiary by the Fund organized under the laws of the Cayman Islands. The Subsidiary was organized by the Fund to invest in Regulation S securities. The Fund may invest up to 25% of its total assets in the Subsidiary.
The Fund will seek to gain exposure to Regulation S securities primarily through investments in the Invesco Oppenheimer Global High Yield Fund (Cayman) Ltd. (the “Subsidiary”), a wholly-owned and controlled subsidiary by the Fund organized under the laws of the Cayman Islands. The Subsidiary was organized by the Fund to invest in Regulation S securities. The Fund may invest up to 25% of its total assets in the Subsidiary.
The Fund’s investment objective is to seek total return.
The Fund currently consists of two different classes of shares: Series I and Series II, both of which are offered to insurance company separate accounts funding variable annuity contracts and variable life insurance policies (“variable products”).
The Fund is an investment company and accordingly follows the investment company accounting and reporting guidance in accordance with Financial Accounting Standards Board Accounting Standards Codification Topic 946, Financial Services – Investment Companies.
The following is a summary of the significant accounting policies followed by the Fund in the preparation of its financial statements.
| A. | Security Valuations - Securities, including restricted securities, are valued according to the following policy. |
Debt obligations (including convertible securities) and unlisted equities are fair valued using an evaluated quote provided by an independent pricing service. Evaluated quotes provided by the pricing service may be determined without exclusive reliance on quoted prices, and may reflect appropriate factors such asinstitution-size trading in similar groups of securities, developments related to specific securities, dividend rate (for unlisted equities), yield (for debt obligations), quality, type of issue, coupon rate (for debt obligations), maturity (for debt obligations), individual trading characteristics and other market data. Pricing services generally value debt obligations assuming orderly transactions of institutional round lot size, but a fund may hold or transact in the same securities in smaller, odd lot sizes. Odd lots often trade at lower prices than institutional round lots. Debt obligations are subject to interest rate and credit risks. In addition, all debt obligations involve some risk of default with respect to interest and/or principal payments.
A security listed or traded on an exchange (except convertible securities) is valued at its last sales price or official closing price as of the close of the customary trading session on the exchange where the security is principally traded, or lacking any sales or official closing price on a particular day, the security may be valued at the closing bid price on that day. Securities traded in theover-the-counter market are valued based on prices furnished by independent pricing services or market makers. When such securities are valued by an independent pricing service they may be considered fair valued. Futures contracts are valued at the final settlement price set by an exchange on which they are principally traded. Listed options are valued at the mean between the last bid and asked prices from the exchange on which they are principally traded. Options not listed on an exchange are valued by an independent source at the mean between the last bid and asked prices. For purposes of determining net asset value (“NAV”) per share, futures and option contracts generally are valued 15 minutes after the close of the customary trading session of the New York Stock Exchange (“NYSE”).
Investments inopen-end andclosed-end registered investment companies that do not trade on an exchange are valued at theend-of-day net asset value per share. Investments inopen-end andclosed-end registered investment companies that trade on an exchange are valued at the last sales price or official closing price as of the close of the customary trading session on the exchange where the security is principally traded.
Swap agreements are fair valued using an evaluated quote, if available, provided by an independent pricing service. Evaluated quotes provided by the pricing service are valued based on a model which may includeend-of-day net present values, spreads, ratings, industry, company performance and returns of referenced assets. Centrally cleared swap agreements are valued at the daily settlement price determined by the relevant exchange or clearinghouse.
Foreign securities’ (including foreign exchange contracts) prices are converted into U.S. dollar amounts using the applicable exchange rates as of the close of the NYSE. If market quotations are available and reliable for foreign exchange-traded equity securities, the securities will be valued at the market quotations. Because trading hours for certain foreign securities end before the close of the NYSE, closing market quotations may become unreliable. If between the time trading ends on a particular security and the close of the customary trading session on the NYSE, events occur that the investment adviser determines are significant and make the closing price unreliable, the Fund may fair value the security. If the event is likely to have affected the closing price of the security, the security will be valued at fair value in good faith using procedures approved by the Board of Trustees. Adjustments to closing prices to reflect fair value may also be based on a screening process of an independent pricing service to indicate the degree of certainty, based on historical data, that the closing price in the principal market where a foreign security trades is not the current value as of the close of the NYSE. Foreign securities’ prices meeting the approved degree of certainty that the price is not reflective of current value will be priced at the indication of fair value from the independent pricing service. Multiple factors may be considered by the independent pricing service in determining
43 INVESCO OPPENHEIMER V.I. GLOBAL STRATEGIC INCOME FUND
NOTES TO CONSOLIDATED FINANCIAL STATEMENTSUnaudited / Continued
adjustments to reflect fair value and may include information relating to sector indices, American Depositary Receipts and domestic and foreign index futures. Foreign securities may have additional risks including exchange rate changes, potential for sharply devalued currencies and high inflation, political and economic upheaval, the relative lack of issuer information, relatively low market liquidity and the potential lack of strict financial and accounting controls and standards.
Securities for which market prices are not provided by any of the above methods may be valued based upon quotes furnished by independent sources. The last bid price may be used to value equity securities. The mean between the last bid and asked prices is used to value debt obligations, including corporate loans.
Securities for which market quotations are not readily available or became unreliable are valued at fair value as determined in good faith by or under the supervision of the Trust’s officers following procedures approved by the Board of Trustees. Issuer specific events, market trends, bid/ asked quotes of brokers and information providers and other market data may be reviewed in the course of making a good faith determination of a security’s fair value.
The Fund may invest in securities that are subject to interest rate risk, meaning the risk that the prices will generally fall as interest rates rise and, conversely, the prices will generally rise as interest rates fall. Specific securities differ in their sensitivity to changes in interest rates depending on their individual characteristics. Changes in interest rates may result in increased market volatility, which may affect the value and/or liquidity of certain Fund investments.
Valuations change in response to many factors including the historical and prospective earnings of the issuer, the value of the issuer’s assets, general economic conditions, interest rates, investor perceptions and market liquidity. Because of the inherent uncertainties of valuation, the values reflected in the financial statements may materially differ from the value received upon actual sale of those investments.
| B. | Securities Transactions and Investment Income -Securities transactions are accounted for on a trade date basis. Realized gains or losses on sales are computed on the basis of specific identification of the securities sold. Interest income (net of withholding tax, if any) is recorded on the accrual basis from settlement date. Bond premiums and discounts are amortized and/or accreted over the lives of the respective securities.Pay-in-kind interest income andnon-cash dividend income received in the form of securitiesin-lieu of cash are recorded at the fair value of the securities received. Paydown gains and losses on mortgage and asset-backed securities are recorded as adjustments to interest income. Dividend income (net of withholding tax, if any) is recorded on theex-dividend date. The Fund may periodically participate in litigation related to Fund investments. As such, the Fund may receive proceeds from litigation settlements. Any proceeds received are included in the Consolidated Statement of Operations as realized gain (loss) for investments no longer held and as unrealized gain (loss) for investments still held. |
Brokerage commissions and mark ups are considered transaction costs and are recorded as an increase to the cost basis of securities purchased and/or a reduction of proceeds on a sale of securities. Such transaction costs are included in the determination of net realized and unrealized gain (loss) from investment securities reported in the Consolidated Statement of Operations and the Consolidated Statement of Changes in Net Assets and the net realized and unrealized gains (losses) on securities per share in the Consolidated Financial Highlights. Transaction costs are included in the calculation of the Fund’s net asset value and, accordingly, they reduce the Fund’s total returns. These transaction costs are not considered operating expenses and are not reflected in net investment income reported in the Consolidated Statement of Operations and the Consolidated Statement of Changes in Net Assets, or the net investment income per share and the ratios of expenses and net investment income reported in the Consolidated Financial Highlights, nor are they limited by any expense limitation arrangements between the Fund and the investment adviser.
The Fund allocates income and realized and unrealized capital gains and losses to a class based on the relative net assets of each class.
| C. | Country Determination- For the purposes of making investment selection decisions and presentation in the Schedule of Investments, the investment adviser may determine the country in which an issuer is located and/or credit risk exposure based on various factors. These factors include the laws of the country under which the issuer is organized, where the issuer maintains a principal office, the country in which the issuer derives 50% or more of its total revenues and the country that has the primary market for the issuer’s securities, as well as other criteria. Among the other criteria that may be evaluated for making this determination are the country in which the issuer maintains 50% or more of its assets, the type of security, financial guarantees and enhancements, the nature of the collateral and the sponsor organization. Country of issuer and/or credit risk exposure has been determined to be the United States of America, unless otherwise noted. |
| D. | Distributions -Dividends and distributions to shareholders, which are determined in accordance with income tax regulations and may differ from U.S. GAAP, are recorded on theex-dividend date. Income distributions, if any, are declared daily and paid monthly. Capital gain distributions, if any, are declared and paid annually or at other times as determined necessary by the Adviser. |
The tax character of distributions is determined as of the Fund’s fiscal year end. Therefore, a portion of the Fund’s distributions made to shareholders prior to the Fund’s fiscal year end may ultimately be categorized as a tax return of capital.
| E. | Federal Income Taxes -The Fund intends to comply with provisions of the Internal Revenue Code applicable to regulated investment companies and to distribute substantially all of its investment company taxable income to shareholders. Therefore, no federal income or excise tax provision is required. The Fund files income tax returns in U.S. federal and applicable state jurisdictions. The statute of limitations on the Fund’s tax return filings generally remains open for the three preceding fiscal reporting period ends. The Fund has analyzed its tax positions for the fiscal year ended December 31, 2018, including open tax years, and does not believe there are any uncertain tax positions requiring recognition in the Fund’s financial statements. |
Subchapter M requires, among other things, that at least 90% of the Fund’s gross income be derived from securities or derived with respect to its business of investing in securities (typically referred to as “qualifying income”). Income from commodity-linked derivatives may not be treated as “qualifying income” for purposes of the 90% gross income requirement. The Internal Revenue Service (IRS) has previously issued a number of private letter rulings which conclude that income derived from commodity index-linked notes and investments in a wholly-owned subsidiary will be “qualifying income.” As a result, the Fund will gain exposure to commodities through commodity-linked notes and its wholly-owned subsidiary.
The IRS has suspended the granting of private letter rulings pending further review. As a result, there can be no assurance that the IRS will not
| | |
| 44 INVESCO OPPENHEIMER V.I. GLOBAL STRATEGIC INCOME FUND |
change its position with respect to commodity-linked notes and wholly-owned subsidiaries. In addition, future legislation and guidance from the Treasury and the IRS may adversely affect the fund’s ability to gain exposure to commodities through commodity-linked notes and its wholly-owned subsidiary.
The Fund is required to include in income for federal income tax purposes all of the subsidiary’s net income and gains whether or not such income is distributed by the subsidiary. Net income and gains from the subsidiary are generally treated as ordinary income by the Fund, regardless of the character of the subsidiary’s underlying income. Net losses from the subsidiary do not pass through to the Fund for federal income tax purposes.
During the fiscal year ended December 31, 2018, the Fund did not utilize any capital loss carryforwards to offset capital gains realized in that fiscal year. The Fund had straddle losses of $937,101 which were deferred. Capital losses with no expiration will be carried forward to future years if not offset by gains.
At period end, it is estimated that the capital loss carryforwards would be $197,129,151, which will not expire.The estimated capital loss carryforward represents the carryforward as of the end of the last fiscal year, increased or decreased by capital losses or gains realized in the first six months of the current fiscal year. During the reporting period, it is estimated that the Fund will not utilize any capital loss carryforward to offset realized capital gains.
Net investment income (loss) and net realized gain (loss) may differ for financial statement and tax purposes. The character of dividends and distributions made during the fiscal year from net investment income or net realized gains are determined in accordance with federal income tax requirements, which may differ from the character of net investment income or net realized gains presented in those financial statements in accordance with U.S. GAAP. Also, due to timing of dividends and distributions, the fiscal year in which amounts are distributed may differ from the fiscal year in which the income or net realized gain was recorded by the Fund.
The aggregate cost of securities and other investments and the composition of unrealized appreciation and depreciation of securities and other investments for federal income tax purposes at period end are noted in the following table. The primary difference between book and tax appreciation or depreciation of securities and other investments, if applicable, is attributable to the tax deferral of losses or tax realization of financial statement unrealized gain or loss.
| | | | |
Federal tax cost of securities | | $ | 1,675,242,019 | |
Federal tax cost of other investments | | | (254,367,947) | |
| | | | |
Total federal tax cost | | $ | 1,420,874,072 | |
| | | | |
Gross unrealized appreciation | | $ | 82,246,796 | |
Gross unrealized depreciation | | | (86,205,254) | |
| | | | |
Net unrealized depreciation | | $ | (3,958,458) | |
| | | | |
Certain foreign countries impose a tax on capital gains which is accrued by the Fund based on unrealized appreciation, if any, on affected securities. The tax is paid when the gain is realized.
| F. | Expenses -Fees provided for under the Rule12b-1 plan of a particular class of the Fund are charged to the operations of such class. Transfer agency fees and expenses and other shareholder recordkeeping fees and expenses relating to all other classes are allocated among those classes based on relative net assets. All other expenses are allocated among the classes based on relative net assets. |
| G. | Accounting Estimates -The financial statements are prepared on a basis in conformity with accounting principles generally accepted in the United States of America (“GAAP”), which requires management to make estimates and assumptions that affect the reported amounts of assets and liabilities at the date of the financial statements and the reported amounts of revenues and expenses during the reporting period including estimates and assumptions related to taxation. Actual results could differ from those estimates by a significant amount. In addition, the Fund monitors for material events or transactions that may occur or become known after theperiod-end date and before the date the financial statements are released to print. |
| H. | Indemnifications -Under the Trust’s organizational documents, each Trustee, officer, employee or other agent of the Trust is indemnified against certain liabilities that may arise out of the performance of their duties to the Fund. Additionally, in the normal course of business, the Fund enters into contracts, including the Fund’s servicing agreements, that contain a variety of indemnification clauses. The Fund’s maximum exposure under these arrangements is unknown as this would involve future claims that may be made against the Fund that have not yet occurred. The risk of material loss as a result of such indemnification claims is considered remote. |
| I. | Foreign Currency Translations -Foreign currency is valued at the close of the NYSE based on quotations posted by banks and major currency dealers. Portfolio securities and other assets and liabilities denominated in foreign currencies are translated into U.S. dollar amounts at the date of valuation. Purchases and sales of portfolio securities (net of foreign taxes withheld on disposition) and income items denominated in foreign currencies are translated into U.S. dollar amounts on the respective dates of such transactions. The Fund does not separately account for the portion of the results of operations resulting from changes in foreign exchange rates on investments and the fluctuations arising from changes in market prices of securities held. The combined results of changes in foreign exchange rates and the fluctuation of market prices on investments (net of estimated foreign tax withholding) are included with the net realized and unrealized gain or loss from investments in the Consolidated Statement of Operations. Reported net realized foreign currency gains or losses arise from (1) sales of foreign currencies, (2) currency gains or losses realized between the trade and settlement dates on securities transactions, and (3) the difference between the amounts of dividends, interest, and foreign withholding taxes recorded on the Fund’s books and the U.S. dollar equivalent of the amounts actually received or paid. Net unrealized foreign currency gains and losses arise from changes in the fair values of assets and liabilities, other than investments in securities at fiscal period end, resulting from changes in exchange rates. The Fund may invest in foreign securities, which may be subject to foreign taxes on income, gains on investments or currency repatriation, a portion of which may be recoverable. Foreign taxes, if any, are recorded based on the tax regulations and rates that exist in the foreign |
| | |
| 45 INVESCO OPPENHEIMER V.I. GLOBAL STRATEGIC INCOME FUND |
NOTES TO CONSOLIDATED FINANCIAL STATEMENTSUnaudited / Continued
| | markets in which the Fund invests and are shown in the Consolidated Statement of Operations. |
| J. | Forward Foreign Currency Contracts - The Fund may engage in foreign currency transactions either on a spot (i.e. for prompt delivery and settlement) basis, or through forward foreign currency contracts, to manage or minimize currency or exchange rate risk. |
The Fund may also enter into forward foreign currency contracts for the purchase or sale of a security denominated in a foreign currency in order to “lock in” the U.S. dollar price of that security, or the Fund may also enter into forward foreign currency contracts that do not provide for physical settlement of the two currencies, but instead are settled by a single cash payment calculated as the difference between the agreed upon exchange rate and the spot rate at settlement based upon an agreed upon notional amount(non-deliverable forwards). The Fund will set aside liquid assets in an amount equal to the dailymark-to-market obligation for forward foreign currency contracts.
A forward foreign currency contract is an obligation between two parties (“Counterparties”) to purchase or sell a specific currency for an agreed-upon price at a future date. The use of forward foreign currency contracts does not eliminate fluctuations in the price of the underlying securities the Fund owns or intends to acquire but establishes a rate of exchange in advance. Fluctuations in the value of these contracts are measured by the difference in the contract date and reporting date exchange rates and are recorded as unrealized appreciation (depreciation) until the contracts are closed. When the contracts are closed, realized gains (losses) are recorded. Realized and unrealized gains (losses) on the contracts are included in the Consolidated Statement of Operations. The primary risks associated with forward foreign currency contracts include failure of the Counterparty to meet the terms of the contract and the value of the foreign currency changing unfavorably. These risks may be in excess of the amounts reflected in the Consolidated Statement of Assets and Liabilities.
| K. | Futures - The Fund may enter into futures contracts to manage exposure to interest rate, equity and market price movements and/or currency risks. A futures contract is an agreement between Counterparties to purchase or sell a specified underlying security, currency or commodity (or delivery of a cash settlement price, in the case of an index future) for a fixed price at a future date. The Fund currently invests only in exchange-traded futures and they are standardized as to maturity date and underlying financial instrument. Initial margin deposits required upon entering into futures contracts are satisfied by the segregation of specific securities or cash as collateral at the futures commission merchant (broker). During the period the futures contracts are open, changes in the value of the contracts are recognized as unrealized gains or losses by recalculating the value of the contracts on a daily basis. Subsequent or variation margin payments are received or made depending upon whether unrealized gains or losses are incurred. These amounts are reflected as receivables or payables on the Consolidated Statement of Assets and Liabilities. When the contracts are closed or expire, the Fund recognizes a realized gain or loss equal to the difference between the proceeds from, or cost of, the closing transaction and the Fund’s basis in the contract. The net realized gain (loss) and the change in unrealized gain (loss) on futures contracts held during the period is included on the Consolidated Statement of Operations. The primary risks associated with futures contracts are market risk and the absence of a liquid secondary market. If the Fund were unable to liquidate a futures contract and/or enter into an offsetting closing transaction, the Fund would continue to be subject to market risk with respect to the value of the contracts and continue to be required to maintain the margin deposits on the futures contracts. Futures contracts have minimal Counterparty risk since the exchange’s clearinghouse, as Counterparty to all exchange-traded futures, guarantees the futures against default. Risks may exceed amounts recognized in the Consolidated Statement of Assets and Liabilities. |
| L. | Swap Agreements - The Fund may enter into various swap transactions, including interest rate, total return, index, currency and credit default swap contracts (“CDS”) for investment purposes or to manage interest rate, currency or credit risk. Such transactions are agreements between Counterparties. A swap agreement may be negotiated bilaterally and tradedover-the-counter (“OTC”) between two parties (“uncleared/OTC”) or, in some instances, must be transacted through a future commission merchant (“FCM”) and cleared through a clearinghouse that serves as a central Counterparty (“centrally cleared swap”). These agreements may contain among other conditions, events of default and termination events, and various covenants and representations such as provisions that require the Fund to maintain apre-determined level of net assets, and/or provide limits regarding the decline of the Fund’s NAV over specific periods of time. If the Fund were to trigger such provisions and have open derivative positions at that time, the Counterparty may be able to terminate such agreement and request immediate payment in an amount equal to the net liability positions, if any. |
Interest rate, total return, index, and currency swap agreements aretwo-party contracts entered into primarily to exchange the returns (or differentials in rates of returns) earned or realized on particular predetermined investments or instruments. The gross returns to be exchanged or “swapped” between the parties are calculated with respect to a notional amount, i.e., the return on or increase in value of a particular dollar amount invested at a particular interest rate or return of an underlying asset, in a particular foreign currency, or in a “basket” of securities representing a particular index.
In a centrally cleared swap, the Fund’s ultimate Counterparty is a central clearinghouse. The Fund initially will enter into centrally cleared swaps through an executing broker. When a fund enters into a centrally cleared swap, it must deliver to the central Counterparty (via the FCM) an amount referred to as “initial margin.” Initial margin requirements are determined by the central Counterparty, but an FCM may require additional initial margin above the amount required by the central Counterparty. Initial margin deposits required upon entering into centrally cleared swaps are satisfied by cash or securities as collateral at the FCM. Securities deposited as initial margin are designated on the Consolidated Schedule of Investments and cash deposited is recorded on the Consolidated Statement of Assets and Liabilities. During the term of a cleared swap agreement, a “variation margin” amount may be required to be paid by the Fund or may be received by the Fund, based on the daily change in price of the underlying reference instrument subject to the swap agreement and is recorded as a receivable or payable for variation margin in the Consolidated Statement of Assets and Liabilities until the centrally cleared swap is terminated at which time a realized gain or loss is recorded.
A CDS is an agreement between Counterparties to exchange the credit risk of an issuer. A buyer of a CDS is said to buy protection by paying a fixed payment over the life of the agreement and in some situations an upfront payment to the seller of the CDS. If a defined credit event occurs (such as payment default or bankruptcy), the Fund as a protection buyer would cease paying its fixed payment, the Fund would deliver eligible bonds issued by the reference entity to the seller, and the seller would pay the full notional value, or the “par value”, of the referenced obligation to the Fund. A
| | |
| 46 INVESCO OPPENHEIMER V.I. GLOBAL STRATEGIC INCOME FUND |
seller of a CDS is said to sell protection and thus would receive a fixed payment over the life of the agreement and an upfront payment, if applicable. If a credit event occurs, the Fund as a protection seller would cease to receive the fixed payment stream, the Fund would pay the buyer “par value” or the full notional value of the referenced obligation, and the Fund would receive the eligible bonds issued by the reference entity. In turn, these bonds may be sold in order to realize a recovery value. Alternatively, the seller of the CDS and its Counterparty may agree to net the notional amount and the market value of the bonds and make a cash payment equal to the difference to the buyer of protection. If no credit event occurs, the Fund receives the fixed payment over the life of the agreement. As the seller, the Fund would effectively add leverage to its portfolio because, in addition to its total net assets, the Fund would be subject to investment exposure on the notional amount of the CDS. In connection with these agreements, cash and securities may be identified as collateral in accordance with the terms of the respective swap agreements to provide assets of value and recourse in the event of default under the swap agreement or bankruptcy/insolvency of a party to the swap agreement. If a Counterparty becomes bankrupt or otherwise fails to perform its obligations due to financial difficulties, the Fund may experience significant delays in obtaining any recovery in a bankruptcy or other reorganization proceeding. The Fund may obtain only limited recovery or may obtain no recovery in such circumstances. The Fund’s maximum risk of loss from Counterparty risk, either as the protection seller or as the protection buyer, is the value of the contract. The risk may be mitigated by having a master netting arrangement between the Fund and the Counterparty and by the designation of collateral by the Counterparty to cover the Fund’s exposure to the Counterparty.
Implied credit spreads represent the current level at which protection could be bought or sold given the terms of the existing CDS contract and serve as an indicator of the current status of the payment/performance risk of the CDS. An implied spread that has widened or increased since entry into the initial contract may indicate a deteriorating credit profile and increased risk of default for the reference entity. A declining or narrowing spread may indicate an improving credit profile or decreased risk of default for the reference entity. Alternatively, credit spreads may increase or decrease reflecting the general tolerance for risk in the credit markets.
An interest rate swap is an agreement between Counterparties pursuant to which the parties exchange a floating rate payment for a fixed rate payment based on a specified notional amount.
Changes in the value of centrally cleared and OTC swap agreements are recognized as unrealized gains (losses) in the Consolidated Statement of Operations by “marking to market” on a daily basis to reflect the value of the swap agreement at the end of each trading day. Payments received or paid at the beginning of the agreement are reflected as such on the Consolidated Statement of Assets and Liabilities and may be referred to as upfront payments. The Fund accrues for the fixed payment stream and amortizes upfront payments, if any, on swap agreements on a daily basis with the net amount, recorded as a component of realized gain (loss) on the Consolidated Statement of Operations. A liquidation payment received or made at the termination of a swap agreement is recorded as realized gain (loss) on the Consolidated Statement of Operations. The Fund segregates cash or liquid securities having a value at least equal to the amount of the potential obligation of a Fund under any swap transaction. Cash held as collateral is recorded as deposits with brokers on the Consolidated Statement of Assets and Liabilities. Entering into these agreements involves, to varying degrees, lack of liquidity and elements of credit, market, and Counterparty risk in excess of amounts recognized on the Consolidated Statement of Assets and Liabilities. Such risks involve the possibility that a swap is difficult to sell or liquidate; the Counterparty does not honor its obligations under the agreement and unfavorable interest rates and market fluctuations. It is possible that developments in the swaps market, including potential government regulation, could adversely affect the Fund’s ability to terminate existing swap agreements or to realize amounts to be received under such agreements. A short position in a security poses more risk than holding the same security long. As there is no limit on how much the price of the security can increase, the Fund’s exposure is unlimited.
Notional amounts of each individual credit default swap agreement outstanding as of June 30, 2019 for which the Fund is the seller of protection are disclosed in the open swap agreements table. These potential amounts would be partially offset by any recovery values of the respective referenced obligations, upfront payments received upon entering into the agreement, or net amounts received from the settlement of buy protection credit default swap agreements entered into by the Fund for the same referenced entity or entities.
| M. | Put Options Purchased and Written - The Fund may purchase and write put options including options on securities indexes, or foreign currency and/or futures contracts. By purchasing a put option, the Fund obtains the right (but not the obligation) to sell the option’s underlying instrument at a fixed strike price. In return for this right, the Fund pays an option premium. The option’s underlying instrument may be a security, securities index, or a futures contract. |
Additionally, the Fund may enter into an option on a swap agreement, also called a “swaption”. A swaption is an option that gives the buyer the right, but not the obligation, to enter into a swap on a future date in exchange for paying a market-based premium. A receiver swaption gives the owner the right to receive the total return of a specified asset, reference rate or index. Swaptions also include options that allow an existing swap to be terminated or extended by one of the Counterparties.
Put options may be used by the Fund to hedge securities it owns by locking in a minimum price at which the Fund can sell. If security prices fall, the put option could be exercised to offset all or a portion of the Fund’s resulting losses. At the same time, because the maximum the Fund has at risk is the cost of the option, purchasing put options does not eliminate the potential for the Fund to profit from an increase in the value of the underlying portfolio securities. The Fund may write put options to earn additional income in the form of option premiums if it expects the price of the underlying instrument to remain stable or rise during the option period so that the option will not be exercised. The risk in this strategy is that the price of the underlying securities may decline by an amount greater than the premium received. Put options written are reported as a liability in the Consolidated Statement of Assets and Liabilities. Realized and unrealized gains and losses on put options purchased and put options written are included in the Consolidated Statement of Operations as Net realized gain (loss) from and Change in net unrealized appreciation (depreciation) of Investment securities and Option contracts written, respectively. A risk in buying an option is that the Fund pays a premium whether or not the option is exercised. In addition, there can be no assurance that a liquid secondary market will exist for any option purchased.
| N. | Call Options Purchased and Written - The Fund may write call options and/or buy call options. A covered call option gives the purchaser of such |
| | |
| 47 INVESCO OPPENHEIMER V.I. GLOBAL STRATEGIC INCOME FUND |
NOTES TO CONSOLIDATED FINANCIAL STATEMENTSUnaudited / Continued
| | option the right to buy, and the writer the obligation to sell, the underlying security or foreign currency at the stated exercise price during the option period. An uncovered call option exists without the ownership of the underlying security. Options written by the Fund normally will have expiration dates between three and nine months from the date written. The exercise price of a call option may be below, equal to, or above the current market value of the underlying security at the time the option is written. |
Additionally, the Fund may enter into an option on a swap agreement, also called a “swaption”. A swaption is an option that gives the buyer the right, but not the obligation, to enter into a swap on a future date in exchange for paying a market-based premium. A receiver swaption gives the owner the right to receive the total return of a specified asset, reference rate or index. Swaptions also include options that allow an existing swap to be terminated or extended by one of the Counterparties.
When the Fund writes a covered call option, an amount equal to the premium received by the Fund is recorded as an asset and an equivalent liability in the Consolidated Statement of Assets and Liabilities. The amount of the liability is subsequently“marked-to-market” to reflect the current market value of the option written. If a written covered call option expires on the stipulated expiration date, or if the Fund enters into a closing purchase transaction, the Fund realizes a gain (or a loss if the closing purchase transaction exceeds the premium received when the option was written) without regard to any unrealized gain or loss on the underlying security, and the liability related to such option is extinguished. If a written covered call option is exercised, the Fund realizes a gain or a loss from the sale of the underlying security and the proceeds of the sale are increased by the premium originally received. Realized and unrealized gains and losses on call options written are included in the Consolidated Statement of Operations as Net realized gain (loss) from and Change in net unrealized appreciation (depreciation) of Option contracts written. A risk in writing a covered call option is that the Fund gives up the opportunity for profit if the market price of the security increases and the option is exercised. The risk in writing an uncovered call option is that the Fund may incur significant losses if the value of the written security exceeds the exercise price of the option.
When the Fund buys a call option, an amount equal to the premium paid by the Fund is recorded as an investment on the Consolidated Statement of Assets and Liabilities. The amount of the investment is subsequently“marked-to-market” to reflect the current value of the option purchased. Realized and unrealized gains and losses on call options purchased are included in the Consolidated Statement of Operations as Net realized gain (loss) from and Change in net unrealized appreciation (depreciation) of Investment securities. A risk in buying an option is that the Fund pays a premium whether or not the option is exercised. In addition, there can be no assurance that a liquid secondary market will exist for any option purchased.
| O. | Securities on a When-Issued or Delayed Delivery Basis -The Fund may purchase securities on a “when-issued” basis, and may purchase or sell securities on a “delayed delivery” basis, with payment and delivery scheduled for a future date. No income accrues to the Fund on the securities in connection with such transactions prior to the date the Fund actually takes delivery of the securities. These transactions are subject to market fluctuations and are subject to the risk that the value at delivery may be more or less than the trade date purchase price. Although the Fund will generally purchase these securities with the intention on acquiring such securities, they may sell such securities prior to the settlement date. |
| P. | Dollar Rolls and Forward Commitment Transactions -The Fund may enter into dollar roll transactions to enhance the Fund’s performance. The Fund executes its dollar roll transactions in the to be announced (“TBA”) market whereby the Fund makes a forward commitment to purchase a security and, instead of accepting delivery, the position is offset by the sale of the security with a simultaneous agreement to repurchase at a future date. |
The Fund accounts for dollar roll transactions as purchases and sales and realizes gains and losses on these transactions. The Fund will segregate liquid assets in an amount equal to its dollar roll commitments. Dollar roll transactions involve the risk that a Counterparty to the transaction may fail to complete the transaction. If this occurs, the Fund may lose the opportunity to purchase or sell the security at the agreed upon price. Dollar roll transactions also involve the risk that the value of the securities retained by the Fund may decline below the price of the securities that the Fund has sold but is obligated to purchase under the agreement. Dollar roll transactions covered in this manner are not treated as senior securities for purposes of a Fund’s fundamental investment limitation on senior securities and borrowings.
| Q. | Leverage Risk- Leverage exists when the Fund can lose more than it originally invests because it purchases or sells an instrument or enters into a transaction without investing an amount equal to the full economic exposure of the instrument or transaction. |
| R. | Collateral- To the extent the Fund has designated or segregated a security as collateral and that security is subsequently sold, it is the Fund’s practice to replace such collateral no later than the next business day. |
| R. | Other Risk- The Fund may invest in sovereign debt instruments that are subject to the risk that a governmental entity may delay or refuse, or otherwise be unable, to pay interest or repay principal on its sovereign debt. If a governmental entity defaults, it may ask for more time in which to pay or for further loans. There is no legal process for collecting sovereign debt that a government does not pay nor are there bankruptcy proceedings through which all or part of such sovereign debt may be collected. A restructuring or default of sovereign debt may also cause additional impacts to the financial markets, such as downgrades to credit ratings, a flight to quality debt instruments, disruptions in common trading markets or unions, reduced liquidity, increased volatility, and heightened financial sector, foreign securities and currency risk, among others. |
Note 2 — Advisory Fees and Other Fees Paid to Affiliates
The Trust has entered into a master investment advisory agreement with Invesco Advisers, Inc. (the “Adviser” or “Invesco”). Under the terms of the investment advisory agreement, the Fund accrues daily and pays monthly an advisory fee to the Adviser based on the annual rate of the Fund’s average daily net assets as follows:
| | |
| 48 INVESCO OPPENHEIMER V.I. GLOBAL STRATEGIC INCOME FUND |
| | | | |
| Fee Schedule* | | | |
Up to $200 million | | | 0.75% | |
Next $200 million | | | 0.72 | |
Next $200 million | | | 0.69 | |
Next $200 million | | | 0.66 | |
Next $200 million | | | 0.60 | |
Next $4 billion | | | 0.50 | |
Over $5 billion | | | 0.48 | |
* The advisory fee paid by the Fund shall be reduced by any amounts paid by the Fund under the administrative services agreement with the Adviser.
For the six months ended June 30, 2019, the effective advisory fees incurred by the Fund were 0.63%.
From the beginning of the fiscal period until the date of the Reorganization, the Acquired Fund paid $3,631,700 in advisory fees to OFI Global Asset Management, Inc. based on the annual rates above of the Acquired Fund’s average daily net assets.
Under the terms of a mastersub-advisory agreement between the Adviser and each of Invesco Asset Management Deutschland GmbH, Invesco Asset Management Limited, Invesco Asset Management (Japan) Limited, Invesco Hong Kong Limited, Invesco Senior Secured Management, Inc. and Invesco Canada Ltd. and separatesub-advisory agreements with Invesco Capital Management LLC, and Invesco Asset Management (India) Private Limited (collectively, the “AffiliatedSub-Advisers”) the Adviser, not the Fund, will pay 40% of the fees paid to the Adviser to any such AffiliatedSub-Adviser(s) that provide(s) discretionary investment management services to the Fund based on the percentage of assets allocated to suchSub-Adviser(s). Invesco has also entered into aSub-Advisory Agreement with OppenheimerFunds, Inc. to provide discretionary management services to the Funds.
Effective on the Reorganization Date, the Adviser has contractually agreed, through at least May 31, 2021, to waive advisory fees and/or reimburse expenses of all shares to the to the extent necessary to limit the total annual fund operating expenses after fee waiver and/or expense reimbursement (excluding certain items discussed below) of Series I and Series II shares to 0.84% and 1.09%, respectively, of the Fund’s average daily net assets (the “expense limits”). In determining the Adviser’s obligation to waive advisory fees and/or reimburse expenses, the following expenses are not taken into account, and could cause total annual fund operating expenses after fee waivers and/or expense reimbursement to exceed the numbers reflected above: (1) interest; (2) taxes; (3) dividend expenses on short sales; (4) extraordinary ornon-routine items, including litigation expenses; and (5) expenses that the Fund has incurred but did not actually pay because of an expense offset arrangement. Unless Invesco continues the fee waiver agreement, it will terminate May 31, 2021. During its term, the fee waiver agreement cannot be terminated or amended to increase the expense limits or reduce the advisory fee waiver without approval of the Board of Trustees.
Further, the Adviser has contractually agreed, through at least June 30, 2021, to waive the advisory fee payable by the Fund in an amount equal to 100% of the net advisory fees the Adviser receives from the affiliated money market funds on investments by the Fund and the Subsidiary of uninvested cash in such affiliated money market funds.
For the six months ended June 30, 2019, the Adviser waived advisory fees of $309,717.
The Trust has entered into a master administrative services agreement with Invesco pursuant to which the Fund has agreed to pay Invesco for certain administrative costs incurred in providing accounting services to the Fund. For the six months ended June 30, 2019, expenses incurred under the agreement are shown in the Consolidated Statement of Operations as Administration fees. Additionally, Invesco has entered into service agreements whereby JPMorgan Chase Bank serves as custodian to the Fund. Prior to the Reorganization, the Acquired Fund paid administrative fees to OFI Global Asset Management, Inc.
The Trust has entered into a transfer agency and service agreement with Invesco Investment Services, Inc. (“IIS”) pursuant to which the Fund has agreed to pay IIS a fee for providing transfer agency and shareholder services to the Fund and reimburse IIS for certain expenses incurred by IIS in the course of providing such services. IIS may make payments to intermediaries that provide omnibus account services,sub-accounting services and/or networking services. All fees payable by IIS to intermediaries that provide omnibus account services orsub-accounting services are charged back to the Fund, subject to certain limitations approved by the Trust’s Board of Trustees. Prior to the Reorganization, the Acquired Fund paid transfer agent fees to OFI Global Asset Management, Inc. and Shareholder Services, Inc. For the six months ended June 30, 2019, expenses incurred under these agreements are shown in the Consolidated Statement of Operations as Transfer and shareholder servicing agent fees.
The Trust has entered into master distribution agreements with Invesco Distributors, Inc. (“IDI”) to serve as the distributor for the Service II shares of the Fund. The Trust has adopted a plan pursuant to Rule12b-1 under the 1940 Act with respect to the Fund’s Service II shares (the “Plan”). The Fund, pursuant to the Plan, pays IDI at an annual rate of 0.25% of the average daily net assets of Service II shares. The fees are accrued daily and paid monthly. Of the Plan payments, up to 0.25% of the average daily net assets of the class of shares may be paid to furnish continuing personal shareholder services to customers who purchase and own shares of such class. Any amounts not paid as a service fee under the Plan would constitute an asset-based sales charge. Rules of the Financial Industry Regulatory Authority (“FINRA”) impose a cap on the total sales charges, including asset-based sales charges, that may be paid by any class of shares of the Fund plans. Prior to the Reorganization, the Acquired Fund paid distribution fees to OppenheimerFunds Distributor, Inc. For the six months ended June 30, 2019, expenses incurred under the plans are shown in the Consolidated Statement of Operations as Distribution and service plan fees.
Certain officers and trustees of the Trust are officers and directors of the Adviser, IIS and/or IDI.
Note 3 - Additional Valuation Information
GAAP defines fair value as the price that would be received to sell an asset or paid to transfer a liability in an orderly transaction between market participants at the measurement date, under current market conditions. GAAP establishes a hierarchy that prioritizes the inputs to valuation methods,
| | |
| 49 INVESCO OPPENHEIMER V.I. GLOBAL STRATEGIC INCOME FUND |
NOTES TO CONSOLIDATED FINANCIAL STATEMENTSUnaudited / Continued
giving the highest priority to readily available unadjusted quoted prices in an active market for identical assets (Level 1) and the lowest priority to significant unobservable inputs (Level 3), generally when market prices are not readily available or are unreliable. Based on the valuation inputs, the securities or other investments are tiered into one of three levels. Changes in valuation methods may result in transfers in or out of an investment’s assigned level:
Level 1 — Prices are determined using quoted prices in an active market for identical assets.
Level 2 — Prices are determined using other significant observable inputs. Observable inputs are inputs that other market participants may use in pricing a security. These may include quoted prices for similar securities, interest rates, prepayment speeds, credit risk, yield curves, loss severities, default rates, discount rates, volatilities and others.
Level 3 — Prices are determined using significant unobservable inputs. In situations where quoted prices or observable inputs are unavailable (for example, when there is little or no market activity for an investment at the end of the period), unobservable inputs may be used. Unobservable inputs reflect the Fund’s own assumptions about the factors market participants would use in determining fair value of the securities or instruments and would be based on the best available information.
The following is a summary of the tiered valuation input levels, as of June 30, 2019. The level assigned to the securities valuations may not be an indication of the risk or liquidity associated with investing in those securities. Because of the inherent uncertainties of valuation, the values reflected in the financial statements may materially differ from the value received upon actual sale of those investments.
| | | | | | | | | | | | | | | | |
| | | Level 1—
Unadjusted Quoted
Prices | | | Level 2— Other Significant
Observable Inputs | | | Level 3—
Significant
Unobservable
Inputs | | | Value | |
Assets Table | | | | | | | | | | | | | | | | |
Investments, at Value: | | | | | | | | | | | | | | | | |
Asset-Backed Securities | | $ | — | | | $ | 57,426,691 | | | $ | — | | | $ | 57,426,691 | |
Mortgage-Backed Obligations | | | — | | | | 326,015,831 | | | | — | | | | 326,015,831 | |
U.S. Government Obligations | | | — | | | | 120,665,372 | | | | — | | | | 120,665,372 | |
Foreign Government Obligations | | | — | | | | 309,993,988 | | | | — | | | | 309,993,988 | |
Corporate Loans | | | — | | | | 6,648,853 | | | | — | | | | 6,648,853 | |
Corporate Bonds and Notes | | | — | | | | 626,988,927 | | | | 31,114 | | | | 627,020,041 | |
Preferred Stock | | | — | | | | 10,075 | | | | — | | | | 10,075 | |
Common Stocks | | | 266,850 | | | | 155,688 | | | | 24,273 | | | | 446,811 | |
Rights, Warrants and Certificates | | | — | | | | — | | | | 12,023 | | | | 12,023 | |
Structured Securities | | | — | | | | 6,862,928 | | | | 70,119 | | | | 6,933,047 | |
Short-Term Note | | | — | | | | 5,331,226 | | | | — | | | | 5,331,226 | |
Investment Companies | | | 162,082,826 | | | | 31,479,621 | | | | — | | | | 193,562,447 | |
Exchange-Traded Option Purchased | | | 3,457 | | | | — | | | | — | | | | 3,457 | |
Over-the-Counter Options Purchased | | | — | | | | 13,268,897 | | | | — | | | | 13,268,897 | |
Over-the-Counter Credit Default Swaptions Purchased | | | — | | | | 99,661 | | | | — | | | | 99,661 | |
Over-the-Counter Interest Rate Swaptions Purchased | | | — | | | | 5,415,181 | | | | — | | | | 5,415,181 | |
Total Investments, at Value | | | 162,353,133 | | | | 1,510,362,939 | | | | 137,529 | | | | 1,672,853,601 | |
Other Financial Instruments: | | | | | | | | | | | | | | | | |
Swaps, at value | | | — | | | | 2,279,464 | | | | — | | | | 2,279,464 | |
Centrally cleared swaps, at value | | $ | — | | | $ | 9,438,760 | | | $ | — | | | $ | 9,438,760 | |
Futures contracts | | | 643,446 | | | | — | | | | — | | | | 643,446 | |
Forward currency exchange contracts | | | — | | | | 11,912,500 | | | | — | | | | 11,912,500 | |
Total Assets | | $ | 162,996,579 | | | $ | 1,533,993,663 | | | $ | 137,529 | | | $ | 1,697,127,771 | |
| | | | |
Liabilities Table | | | | | | | | | | | | | | | | |
Other Financial Instruments: | | | | | | | | | | | | | | | | |
Swaps, at value | | $ | — | | | $ | (4,050,679 | ) | | $ | — | | | $ | (4,050,679 | ) |
Centrally cleared swaps, at value | | | — | | | | (11,866,116 | ) | | | — | | | | (11,866,116 | ) |
Options written, at value | | | — | | | | (16,182,542 | ) | | | — | | | | (16,182,542 | ) |
Futures contracts | | | (2,860,010 | ) | | | — | | | | — | | | | (2,860,010 | ) |
Forward currency exchange contracts | | | — | | | | (14,400,506 | ) | | | — | | | | (14,400,506 | ) |
Swaptions written, at value | | | — | | | | (15,259,847 | ) | | | — | | | | (15,259,847 | ) |
Total Liabilities | | $ | (2,860,010 | ) | | $ | (61,759,690 | ) | | $ | — | | | $ | (64,619,700 | ) |
Forward currency exchange contracts and futures contracts, if any, are reported at their unrealized appreciation/depreciation at measurement date, which represents the change in the contract’s value from trade date. All additional assets and liabilities included in the above table are reported at their market value at measurement date.
Note 4 - Derivative Investments
The Fund may enter into an International Swaps and Derivatives Association Master Agreement (“ISDA Master Agreement”) under which a fund may trade OTC derivatives. An OTC transaction entered into under an ISDA Master Agreement typically involves a collateral posting arrangement, payment netting provisions andclose-out netting provisions. These netting provisions allow for reduction of credit risk through netting of contractual obligations. The enforceability of the netting provisions of the ISDA Master Agreement depends on the governing law of the ISDA Master Agreement, among other
| | |
| 50 INVESCO OPPENHEIMER V.I. GLOBAL STRATEGIC INCOME FUND |
factors. For financial reporting purposes, the Fund does not offset OTC derivative assets or liabilities that are subject to ISDA Master Agreements in the Consolidated Statement of Assets and Liabilities.
Offsetting Assets and Liabilities
| | | | | | | | | | | | | | | | | | | | |
| The table below reflects the Fund’s exposure to Counterparties subject to either an ISDA Master Agreement or other agreement for OTC derivative asset transactions as of June 30, 2019: | |
| | | | | | Gross Amounts Not Offset in the Consolidated Statement of Assets & Liabilities | | | | |
| Counterparty | | Gross Amounts Not Offset in the
Consolidated
Statement
of Assets &
Liabilities* | | | Financial
Instruments
Available for
Offset | | | Financial
Instruments
Collateral
Received** | | | Cash Collateral
Received** | | | Net Amount | |
Bank of America NA | | $ | 2,830,209 | | | $ | (2,830,209 | ) | | $ | – | | | $ | – | | | $ | – | |
Barclays Bank plc | | | 452,195 | | | | (452,195 | ) | | | – | | | | – | | | | – | |
BNP Paribas | | | 4,049 | | | | – | | | | – | | | | – | | | | 4,049 | |
Citibank NA | | | 2,224,835 | | | | (2,224,835 | ) | | | – | | | | – | | | | – | |
Deutsche Bank AG | | | 241,502 | | | | (241,502 | ) | | | – | | | | – | | | | – | |
Goldman Sachs Bank USA | | | 8,567,669 | | | | (8,567,669 | ) | | | – | | | | – | | | | – | |
Goldman Sachs International | | | 2,340,665 | | | | (1,089,467 | ) | | | – | | | | (880,000 | ) | | | 371,198 | |
HSBC Bank USA NA | | | 233,341 | | | | (18,090 | ) | | | – | | | | – | | | | 215,251 | |
JPMorgan Chase Bank NA | | | 11,696,992 | | | | (11,696,992 | ) | | | – | | | | – | | | | – | |
| Morgan Stanley Capital Services, Inc. | | | 3,753,811 | | | | (3,753,811 | ) | | | – | | | | – | | | | – | |
RBC Dominion Securities | | | 426,811 | | | | (77,960 | ) | | | – | | | | – | | | | 348,851 | |
Standard Chartered Bank | | | 203,624 | | | | (203,624 | ) | | | – | | | | – | | | | – | |
| | | | |
| | $ | 32,975,703 | | | $ | (31,156,354 | ) | | $ | – | | | $ | (880,000 | ) | | $ | 939,349 | |
| | | | |
|
*OTC derivatives are reported gross on the Consolidated Statement of Assets and Liabilities. Exchange traded options and margin related to centrally cleared swaps and futures, if any, are excluded from these reported amounts. | |
**Reported collateral posted for the benefit of the Fund within this table is limited to the net outstanding amount due from an individual counterparty. The collateral posted for the benefit of the Fund may exceed these amounts. | |
| The table below reflects the Fund’s exposure to Counterparties subject to either an ISDA Master Agreement or other agreement for OTC derivative liability transactions as of June 30, 2019: | |
| | | | | | Gross Amounts Not Offset in the Consolidated Statement of Assets & Liabilities | | | | |
| Counterparty | | Gross Amounts
Not Offset in the Consolidated
Statement
of Assets &
Liabilities* | | | Financial Instruments Available for Offset | | | Financial
Instruments
Collateral
Pledged** | | | Cash Collateral
Pledged** | | | Net Amount | |
| Bank of America NA | | $ | (5,512,955 | ) | | $ | 2,830,209 | | | $ | – | | | $ | 2,640,000 | | | $ | (42,746 | ) |
| Barclays Bank plc | | | (3,236,536 | ) | | | 452,195 | | | | – | | | | 2,200,000 | | | | (584,341 | ) |
| Citibank NA | | | (2,580,762 | ) | | | 2,224,835 | | | | – | | | | 355,927 | | | | – | |
| Deutsche Bank AG | | | (291,958 | ) | | | 241,502 | | | | – | | | | – | | | | (50,456 | ) |
| Goldman Sachs Bank USA | | | (13,704,477 | ) | | | 8,567,669 | | | | – | | | | 4,700,000 | | | | (436,808 | ) |
| Goldman Sachs International | | | (1,089,467 | ) | | | 1,089,467 | | | | – | | | | – | | | | – | |
| HSBC Bank USA NA | | | (18,090 | ) | | | 18,090 | | | | – | | | | – | | | | – | |
| JPMorgan Chase Bank NA | | | (16,052,426 | ) | | | 11,696,992 | | | | – | | | | 4,355,434 | | | | – | |
| Morgan Stanley Capital Services, Inc. | | | (5,355,666 | ) | | | 3,753,811 | | | | – | | | | 1,210,000 | | | | (391,855 | ) |
| RBC Dominion Securities | | | (77,960 | ) | | | 77,960 | | | | – | | | | – | | | | – | |
| | |
| 51 INVESCO OPPENHEIMER V.I. GLOBAL STRATEGIC INCOME FUND |
NOTES TO CONSOLIDATED FINANCIAL STATEMENTSUnaudited / Continued
| | | | | | | | | | | | | | | | | | | | |
| | | | | | Gross Amounts Not Offset in the Consolidated Statement of Assets & Liabilities | | | | |
| Counterparty | | Gross Amounts
Not Offset in the Consolidated
Statement
of Assets &
Liabilities* | | | Financial Instruments Available for Offset | | | Financial
Instruments
Collateral
Pledged** | | | Cash Collateral
Pledged** | | | Net Amount | |
| Standard Chartered Bank | | $ | (1,973,277) | | | $ | 203,624 | | | $ | – | | | $ | 1,724,000 | | | $ | (45,653) | |
| | | | |
| | $ | (49,893,574) | | | $ | 31,156,354 | | | $ | – | | | $ | 17,185,361 | | | $ | (1,551,859) | |
| | | | |
*OTC derivatives are reported gross on the Consolidated Statement of Assets and Liabilities. Exchange traded options and margin related to centrally cleared swaps and futures, if any, are excluded from these reported amounts. | |
| **Reported collateral pledged within this table is limited to the net outstanding amount due from the Fund. The securities pledged as collateral by the Fund as reported on the Consolidated Statement of Investments may exceed these amounts. | |
Value of Derivative Instruments atPeriod-End
The table below summarizes the value of the Fund’s derivative investments, detailed by primary risk exposure, held as of June 30, 2019:
| | | | | | | | | | | | | | | | |
| | | Asset Derivatives | | | | | | Liability Derivatives | |
Derivatives Not Accounted for as Hedging Instruments | | Consolidated Statement of Assets and Liabilities Location | | Value | | | | | | Consolidated
Statement of Assets
and Liabilities Location | | Value | |
| Credit contracts | | Swaps, at value | | $ | 1,880,107 | | | | | | | Swaps, at value | | $ | 3,283,612 | |
| Interest rate contracts | | Swaps, at value | | | 399,357 | | | | | | | Swaps, at value | | | 767,067 | |
| Credit rate contracts | | Centrally cleared swaps, at value | | | 1,680,7951 | | | | | | | Centrally cleared swaps, at value | | | 7,962,484 | 1 |
| Interest rate contracts | | Centrally cleared swaps, at value | | | 7,757,9651 | | | | | | | Centrally cleared swaps, at value | | | 3,903,632 | 1 |
| Interest rate contracts | | Variation margin receivable - futures | | | 27,8582 | | | | | | | Variation margin payable - futures | | | 233,018 | 2 |
| Forward currency exchange contracts | | Unrealized appreciation on forward currency exchange contracts | | | 11,912,500 | | | | | | | Unrealized depreciation on forward currency exchange contracts | | | 14,400,506 | |
| Equity contracts | | | | | | | | | | | | Options written, at value | | | 952,030 | |
| Currency contracts | | | | | | | | | | | | Options written, at value | | | 14,577,143 | |
| Interest rate contracts | | | | | | | | | | | | Options written, at value | | | 653,369 | |
| Credit contracts | | | | | | | | | | | | Swaptions written, at value | | | 314,848 | |
| Interest rate contracts | | | | | | | | | | | | Swaptions written, at value | | | 14,944,999 | |
| Credit contracts | | Investments, at value | | | 99,6613 | | | | | | | | | | | |
| Equity contracts | | Investments, at value | | | 2,121,6733 | | | | | | | | | | | |
| Currency contracts | | Investments, at value | | | 10,817,8703 | | | | | | | | | | | |
| Interest rate contracts | | Investments, at value | | | 5,747,9923 | | | | | | | | | | | |
| | | | | | | | | | | | | | | | |
| Total | | | | $ | 42,445,778 | | | | | | | | | $ | 61,992,708 | |
| | | | | | | | | | | | | | | | |
1. The daily variation margin receivable (payable) at period end is recorded in the Consolidated Statement of Assets and Liabilities.
2. Includes only the current day’s variation margin. Prior variation margin movements have been reflected in cash on the Consolidated Statement of Assets and Liabilities upon receipt or payment.
3. Amounts relate to purchased option contracts and purchased swaption contracts, if any.
Effect of Derivative Investments for the Six Months Ended June 30, 2019
The tables below summarizes the gains (losses) on derivative investments, detailed by primary risk exposure, recognized in earnings during the period:
| | | | | | | | | | | | | | | | | | | | | | | | | | | | |
| | | Amount of Realized Gain or (Loss) Recognized on Derivatives | | | | | | | |
Derivatives Not Accounted for as Hedging Instruments | | Investment
transactions
in unaffiliated
companies* | | | Swaption contracts written | | | Option
contracts
written | | | Futures
contracts | | | Forward
currency
exchange
contracts | | | Swap contracts | | | Total | |
| Credit contracts | | $ | (1,468,539) | | | $ | 1,185,587 | | | $ | — | | | $ | — | | | $ | — | | | $ | (858,188) | | | $ | (1,141,140) | |
| Currency contracts | | | (5,128,134) | | | | — | | | | 15,975,710 | | | | — | | | | — | | | | — | | | | 10,847,576 | |
| Equity contracts | | | (219,794) | | | | — | | | | 105,928 | | | | — | | | | — | | | | — | | | | (113,866) | |
| Forward currency exchange contracts | | | — | | | | — | | | | — | | | | — | | | | (3,790,629) | | | | — | | | | (3,790,629) | |
| Interest rate contracts | | | 2,520,297 | | | | (11,469,940) | | | | (1,774,164) | | | | (4,940,863) | | | | — | | | | 4,944,626 | | | | (10,720,044) | |
| | | | |
| Total | | $ | (4,296,170) | | | $ | (10,284,353) | | | $ | 14,307,474 | | | $ | (4,940,863) | | | $ | (3,790,629) | | | $ | 4,086,438 | | | $ | (4,918,103) | |
| | | | |
| | |
| 52 INVESCO OPPENHEIMER V.I. GLOBAL STRATEGIC INCOME FUND |
| | | | | | | | | | | | | | | | | | | | | | | | | | | | | | |
| Amount of Change in Unrealized Gain or (Loss) Recognized on Derivatives | |
Derivatives
Not Accounted
for as Hedging
Instruments | | | | Investment
transactions
in unaffiliated
companies* | | | Swaption
contracts
written | | | Option
contracts
written | | | Futures
contracts | | | Forward
currency
exchange
contracts | | | Swap contracts | | | Total | |
| Credit contracts | | | | $ | (172,988) | | | $ | 1,066,210 | | | $ | — | | | $ | — | | | $ | — | | | $ | 2,400,462 | | | $ | 3,293,684 | |
| Currency contracts | | | | | 645,661 | | | | — | | | | 538,126 | | | | — | | | | — | | | | — | | | | 1,183,787 | |
| Equity contracts | | | | | (1,429,169) | | | | — | | | | 814,160 | | | | — | | | | — | | | | — | | | | (615,009 | ) |
| Forward currency exchange contracts | | | | | — | | | | — | | | | — | | | | — | | | | 2,611,611 | | | | — | | | | 2,611,611 | |
| Interest rate contracts | | | | | (1,729,908) | | | | 527,780 | | | | (74,115 | ) | | | (1,028,913 | ) | | | — | | | | 696,520 | | | | (1,608,636 | ) |
| Total | | | | $ | (2,686,404) | | | $ | 1,593,990 | | | $ | 1,278,171 | | | $ | (1,028,913 | ) | | $ | 2,611,611 | | | $ | 3,096,982 | | | $ | 4,865,437 | |
| | | | | | | | | | | | | | | | | | | | | | | | | | | | | | |
*Includes purchased option contracts and purchased swaption contracts, if any.
The table below summarizes the six months ended average notional value of forward foreign currency contracts and swap agreements and the average value of options purchased and written and swaptions written outstanding during the period.
| | | | | | | | | | | | | | | | | | | | | | | | | | | | |
| | | Futures | | | Purchased index
options | | | Purchased
equity options | | | Purchased FX
options | | | Purchased fixed
income options | | | Purchased
options on a
future | | | Forwards | |
| Notional amount | | $ | 273,733,997 | | | $ | 115,642,624 | | | $ | 1,307,682,506 | | | $ | 153,019,699,116 | | | $ | 5,461,068,244 | | | $ | 56,879,233 | | | $ | 1,137,459,402 | |
| Average contracts | | | | | | | 43,538 | | | | 10,000,000 | | | | | | | | 47,576,133 | | | | 304 | | | | | |
| | | | | | | |
| | | | | | Written Index
Options | | | Written FX options | | | Written fixed
income options | | | Purchased
swaptions | | | Written
swaptions | | | Swaps | |
| Notional amount | | | | | | $ | 103,293,881 | | | $ | 1,046,445,184,005 | | | $ | 5,492,672,043 | | | $ | 1,000,487,765 | | | $ | 1,830,452,213 | | | $ | 1,091,864,427 | |
| Average contracts | | | | | | | 43,538 | | | | | | | | 46,785,867 | | | | | | | | | | | | | |
Note 7 – Expense Offset Arrangement
The expense offset arrangement is comprised of custodian credits which result from periodic overnight cash balances at the custodian. For the six months ended June 30, 2019, the Fund received credits from this arrangement, which resulted in the reduction of the Fund’s total expenses of $88,927.
Note 8 – Trustee and Officer Fees and Benefits
Certain Trustees have executed a Deferred Compensation Agreement pursuant to which they have the option to elect to defer receipt of all or a portion of the annual compensation they are entitled to receive from the Fund. For purposes of determining the amount owed to the Trustees under the plan, deferred amounts are treated as though equal dollar amounts had been invested in shares of the Fund or in other Invesco and/or Invesco Oppenheimer funds selected by the Trustees. The Fund purchases shares of the funds selected for deferral by the Trustees in amounts equal to his or her deemed investment, resulting in a Fund asset equal to the deferred compensation liability. Such assets are included as a component of “Other” within the asset section of the Consolidated Statement of Assets and Liabilities. Deferral of Trustees’ fees under the plan will not affect the net assets of the Fund and will not materially affect the Fund’s assets, liabilities or net investment income per share. Amounts will be deferred until distributed in accordance with the compensation deferral plan.
Note 9 – Cash Balances
The Fund is permitted to temporarily carry a negative or overdrawn balance in its account with Citibank, N.A., the custodian bank. Such balances, if any atperiod-end, are shown in the Consolidated Statement of Assets and Liabilities under the payable caption Amount due custodian. To compensate the custodian bank for such overdrafts, the overdrawn Fund may either (1) leave funds as a compensating balance in the account so the custodian bank can be compensated by earning the additional interest; or (2) compensate by paying the custodian bank at a rate agreed upon by the custodian bank and Invesco, not to exceed the contractually agreed upon rate.
Note 8 – Investment Transactions
The aggregate amount of investment securities (other than short-term securities, U.S. Treasury obligations and money market funds, if any) purchased and sold by the Fund during the six months ended June 30, 2019 was $726,142,662 and $875,543,499, respectively.
Note 9 – Share Information
Transactions in shares of beneficial interest were as follows:
| | |
| 53 INVESCO OPPENHEIMER V.I. GLOBAL STRATEGIC INCOME FUND |
NOTES TO CONSOLIDATED FINANCIAL STATEMENTSUnaudited / Continued
| | | | | | | | | | | | | | | | |
| | | Six Months Ended June 30, 20191
| | | Year Ended December 31, 2018 | |
| | | Shares | | | Amount | | | Shares | | | Amount | |
Series I Shares | | | | | | | | | | | | | | | | |
Sold | | | 16,315,580 | | | $ | 80,367,034 | | | | 8,490,294 | | | $ | 42,380,338 | |
Dividends and/or distributions reinvested | | | 3,199,572 | | | | 15,389,942 | | | | 3,988,617 | | | | 18,866,160 | |
Redeemed | | | (8,827,360 | ) | | | (43,300,523 | ) | | | (14,761,302 | ) | | | (71,795,706 | ) |
Net increase (decrease) | | | 10,687,792 | | | $ | 52,456,453 | | | | (2,282,391 | ) | | $ | (10,549,208 | ) |
| | | | | | | | | | | | | | | | |
| | | | | | | | | | | | | | | | |
Series II Shares | | | | | | | | | | | | | | | | |
Sold | | | 3,723,286 | | | $ | 18,824,195 | | | | 9,208,135 | | | $ | 46,798,575 | |
Dividends and/or distributions reinvested | | | 7,435,358 | | | | 36,879,378 | | | | 11,180,836 | | | | 54,450,673 | |
Redeemed | | | (17,316,326 | ) | | | (86,784,998 | ) | | | (37,228,166 | ) | | | (186,225,544 | ) |
Net decrease | | | (6,157,682 | ) | | $ | (31,081,425 | ) | | | (16,839,195 | ) | | $ | (84,976,296 | ) |
| | | | | | | | | | | | | | | | |
1. There are entities that are record owners of more than 5% of the outstanding shares of the Fund and own 55% of the outstanding shares of the Fund. The Fund and the Fund’s principal underwriter or adviser, are parties to participation agreements with these entities whereby these entities sell units of interest in separate accounts funding variable products that are invested in the Fund. The Fund, Invesco and/or Invesco affiliates may make payments to these entities, which are considered to be related to the Fund, for providing services to the Fund, Invesco and/or Invesco affiliates, including, but not limited to services such as securities brokerage, distribution, third party record keeping and account servicing. The Fund has no knowledge as to whether all or any portion of the shares owned of record by these entities are also owned beneficially.
In addition, 11% of the outstanding shares of the Fund are owned by the Adviser or an affiliate of the Adviser.
Note 10 - Borrowings
Joint Credit Facility.A number of mutual funds managed by the Adviser participate in a $1.95 billion revolving credit facility (the “Facility”) intended to provide short-term financing, if necessary, subject to certain restrictions in connection with atypical redemption activity. Expenses and fees related to the Facility are paid by the participating funds and are disclosed separately or as other expenses on the Consolidated Statement of Operations. The Fund did not utilize the Facility during the reporting period. The Facility terminated May 24, 2019.
Note 11 - Independent Registered Public Accounting Firm
The Audit Committee of the Board of Trustees appointed, and the Board of Trustees ratified and approved, PricewaterhouseCoopers LLP (“PWC”) as the independent registered public accounting firm of the Fund for the fiscal periods ending after May 24, 2019. Prior to the close of business on May 24, 2019, the Predecessor Fund was a separate series of an unaffiliated investment company and its financial statements were audited by a different independent registered public accounting firm (the “Prior Auditor”).
Effective after the close of business on May 24, 2019, the Prior Auditor resigned as the independent registered public accounting firm of the Fund. The Prior Auditor’s report on the financial statements of the Predecessor Fund for the past two fiscal years did not contain an adverse or disclaimer of opinion, and was not qualified or modified as to uncertainty, audit scope or accounting principles. During the Predecessor Fund’s two most recent fiscal years and through the close of business on May 24, 2019, there were no (1) disagreements with the Prior Auditor on any matter of accounting principles or practices, financial statement disclosure, or auditing scope or procedure, which disagreements, if not resolved to the Prior Auditor’s satisfaction, would have caused it to make reference to that matter in connection with its report; or (2) “reportable events,” as that term is defined in Item 304(a)(1)(v) of RegulationS-K under the Securities Exchange Act of 1934.
| | |
| 54 INVESCO OPPENHEIMER V.I. GLOBAL STRATEGIC INCOME FUND |
APPROVAL OF THE INVESTMENT ADVISORY ANDSUB-ADVISORY CONTRACTSUnaudited
At meetings held on December 14, 2018, the Board of Trustees (the Board or the Trustees) of AIM Variable Insurance Funds (Invesco Variable Insurance Funds) (the Trust) as a whole, and the independent Trustees, who comprise over 75% of the Board, voting separately, approved (i) an amendment to the Trust’s Master Investment Advisory Agreement with Invesco Advisers, Inc. (Invesco Advisers and the investment advisory agreement) to add Invesco Oppenheimer V.I. Global Strategic Income Fund (the Fund), (ii) an amendment to the Master IntergroupSub-Advisory Contract for Mutual Funds with Invesco Asset Management Deutschland GmbH, Invesco Asset Management Limited, Invesco Asset Management (Japan) Limited, Invesco Hong Kong Limited, Invesco Senior Secured Management, Inc. and Invesco Canada Ltd. to add the Fund, (iii) an amendment to the separatesub-advisory contract with Invesco Capital Management LLC to add the Fund, (iv) an amendment to the separatesub-advisory contract with Invesco Asset Management (India) Private Limited to add the Fund, and (v) an initialsub-advisory contract with OppenheimerFunds, Inc. (collectively, the AffiliatedSub-Advisers and thesub-advisory contracts). Additionally, on March 26, 2019, the Boardre-approved an initialsub-advisory contract with OppenheimerFunds, Inc. following its change of control as a result of the acquisition of OppenheimerFunds, Inc. and its subsidiaries, including the Oppenheimer mutual funds (each, an Oppenheimer Fund), by Invesco Ltd. (the OFI Transaction). After evaluating the factors discussed below, among others, the Board approved the Fund’s investment advisory agreement and thesub-advisory contracts and determined that the compensation payable by the Fund to Invesco Advisers and by Invesco Advisers to the AffiliatedSub-Advisers is fair and reasonable.
The Board’s Evaluation Process
The Board noted that it had previously approved establishing the Fund at the Board meeting held on October 23, 2018 and that the Fund was formed to acquire the assets and liabilities of an Oppenheimer Fund (the Acquired Fund) with the same investment objective and substantially similar principal investment strategies and risks. At the time of approval, the Fund had no assets and no performance history and the portfolio managers were not employed by Invesco Advisers or any of the AffiliatedSub-Advisers except OppenheimerFunds, Inc., which was not affiliated with Invesco at that time.
In approving the investment advisory agreement andsub-advisory contracts, the Board followed a process similar to the process that it follows in annually reviewing and approving investment advisory agreements andsub-advisory contracts for the series portfolios of funds advised by Invesco Advisers and considered the information provided in the most recent annual review process for those funds as well as the information provided with respect to the Fund. As part of the approval process, the Board reviewed and considered information provided in response to detailed requests for information submitted to management by the independent Trustees with assistance from legal counsel to the independent Trustees. The Board reviewed comparative investment performance and fee data prepared by Invesco Advisers and an independent mutual fund data provider. The Board was assisted in its review by the Senior Officer, an officer of the Invesco Funds who reports directly to the independent Trustees, and by independent legal counsel.
The discussion below serves as a summary of the material factors and related conclusions that formed the basis for the Board’s approval of the Fund’s investment advisory agreement andsub-advisory contracts. The Trustees’ review and conclusions are based on the comprehensive consideration of all information presented to them and are not the result of any single determinative factor. Moreover, one Trustee may have weighed a particular piece of information or factor differently than another Trustee. This information is current as of December 14, 2018 and March 26, 2019 for thesub-advisory contract with OppenheimerFunds, Inc.
Factors and Conclusions and Summary of Independent Written Fee Evaluation
A. Nature, Extent and Quality of Services Provided by Invesco Advisers and the AffiliatedSub-Advisers
The Board reviewed the nature, extent and quality of the advisory services to be provided to the Fund by Invesco Advisers under the Fund’s investment advisory agreement, and the credentials and experience of the officers and employees of Invesco Advisers who will provide these services. The Board’s review included consideration of the investment process oversight and structure, credit analysis and investment risk management to be employed in providing advisory services to the Fund. The Board also considerednon-advisory services that Invesco Advisers and its affiliates provide to the Invesco Funds and will provide to the Fund, such as various back office support functions, third party oversight, internal audit, valuation, portfolio trading and legal and compliance. The Board also received and reviewed information about Invesco Advisers’ role as administrator of the Invesco Funds’ liquidity risk management program. The Board also reviewed and considered the benefits to shareholders of investing in a fund that is part of the Invesco family of funds under the umbrella of Invesco Ltd., Invesco Advisers’ parent company, and noted Invesco Ltd.’s depth and experience in conducting an investment management business, as well as its commitment of financial and other resources to such business. The Board reviewed and considered information about the resources that Invesco Advisers intends to continue to commit to managing the Invesco family of funds, including the Fund, following the OFI Transaction. The Board concluded that the nature, extent and quality of the services to be provided to the Fund by Invesco Advisers are appropriate and satisfactory.
The Board reviewed the services that may be provided by the AffiliatedSub-Advisers under thesub-advisory contracts and the credentials and experience of the officers and employees of the AffiliatedSub-Advisers who provide these services. The Board noted the AffiliatedSub-Advisers’ expertise with respect to certain asset classes and that the AffiliatedSub-Advisers have offices and personnel that are located in financial centers around the world. As a result, the Board noted that the AffiliatedSub-Advisers can provide research and investment analysis on the markets and economies of various countries in which the Fund may invest, make recommendations regarding securities and assist with security trades. The Board concluded that thesub-advisory contracts may benefit the Fund and its shareholders by permitting Invesco Advisers to use the resources and talents of the AffiliatedSub-Advisers in managing the Fund. The Board concluded that the nature, extent and quality of the services that may be provided by the AffiliatedSub-Advisers are appropriate and satisfactory.
| | |
| 55 INVESCO OPPENHEIMER V.I. GLOBAL STRATEGIC INCOME FUND |
APPROVAL OF THE INVESTMENT ADVISORY ANDSUB-ADVISORY CONTRACTSUnaudited / Continued
B. Fund Investment Performance
The Board noted that the Fund would continue the historical performance information of the Acquired Fund following the consummation of the OFI Transaction. The Board considered the performance of the Acquired Fund and the fact that, at the closing of the OFI Transaction, management anticipates that the Fund will be managed pursuant to substantially similar investment strategies and by substantially the same portfolio management team as managed the Acquired Fund. The Board did not view Fund performance as a relevant factor in considering whether to approve thesub-advisory contracts for the Fund, as no AffiliatedSub-Adviser currently manages assets of the Fund.
The Board compared the Fund’s investment performance over multiple time periods ending December 31, 2017 to the performance of funds in the Morningstar performance universe and against the Fund’s benchmark index. The Trustees also reviewed more recent Fund performance and this review did not change their conclusions.
C. Advisory andSub-Advisory Fees and Fund Expenses
The Board compared the Fund’s contractual management fee rate to the contractual management fee rates of funds in the Fund’s Morningstar expense group. The Board also considered comparative information regarding the Fund’s total expense ratio and its various components.
The Board noted that Invesco Advisers has contractually agreed to waive fees and/or limit expenses of the Fund for at least two years from the closing date of the OFI Transaction in an amount necessary to limit total annual operating expenses to a specified percentage of average daily net assets for each class of the Fund.
The Board also considered the fees charged by Invesco Advisers and the AffiliatedSub-Advisers to other similarly managed client accounts. The Board noted that Invesco Advisers or the AffiliatedSub-Advisers may charge lower fees to large institutional clients. Invesco Advisers reviewed with the Board differences in the scope of services it provides to the Invesco Funds relative to certain other types of client accounts, including management of cash flows as a result of redemptions and purchases, necessary infrastructure such as officers, office space, technology, legal and distribution, oversight of service providers, costs and business risks associated with launching new funds and sponsoring and maintaining the product line, preparation of annual registration statement updates and financial information and compliance with federal and state laws and regulations.
The Board also considered the services that may be provided by the AffiliatedSub-Advisers pursuant to thesub-advisory contracts, as well as the fees payable by Invesco Advisers to the AffiliatedSub-Advisers pursuant to thesub-advisory contracts.
D. Economies of Scale and Breakpoints
The Board considered the extent to which there may be economies of scale in the provision of advisory services to the Fund. The Board considered Invesco’s reinvestment in its business, including investments in business infrastructure and cybersecurity. The Board also considered that the Fund may benefit from economies of scale through contractual breakpoints in the Fund’s advisory fee schedule, which generally operate to reduce the Fund’s expense ratio as it grows in size. The Board noted that the Fund will share directly in economies of scale through lower fees charged by third party service providers based on the combined size of the Invesco Funds. The Board noted that the Fund may also benefit from economies of scale through initial fee setting, fee waivers and expense reimbursements.
E. Profitability and Financial Resources
The Board reviewed information from the 2018 contract renewal process provided by Invesco Advisers concerning the costs of the advisory and other services that Invesco Advisers and its affiliates provide to the Invesco Funds and the profitability of Invesco Advisers and its affiliates in providing these services. The Board considered the methodology used for calculating profitability and noted the periodic review of such methodology by an independent consultant. The Board noted that Invesco Advisers will continue to operate at a net profit from services Invesco Advisers and its affiliates provide to the Invesco Funds. The Board did not deem the level of profits realized by Invesco Advisers and its affiliates from providing services to the Invesco Funds, and the profits estimated to be realized by the Fund, to be excessive given the nature, extent and quality of the services provided. The Board received information from Invesco Advisers demonstrating that Invesco Advisers and the AffiliatedSub-Advisers are financially sound and have the resources necessary to perform their obligations under the investment advisory agreement andsub-advisory contracts.
F. Collateral Benefits to Invesco Advisers and its Affiliates
The Board considered various other benefits to be received by Invesco Advisers and its affiliates from the relationship with the Fund, including the fees to be received for providing administrative, transfer agency and distribution services to the Fund. The Board considered the performance of Invesco Advisers and its affiliates in providing these services to other Invesco Funds and the organizational structure employed to provide these services. The Board also considered that these services will be provided to the Fund pursuant to written contracts that are reviewed and approved on an annual basis by the Board; and that the services are required for the operation of the Fund.
The Board considered the benefits realized by Invesco Advisers and the AffiliatedSub-Advisers as a result of portfolio brokerage transactions executed through “soft dollar” arrangements. Invesco Advisers noted that the Fund will not execute brokerage transaction through “soft dollar” arrangements to any significant degree.
The Board considered that the Fund’s uninvested cash and cash collateral from any securities lending arrangements may be invested in money market funds advised by Invesco Advisers pursuant to procedures approved by the Board. The Board considered that Invesco Advisers will receive advisory fees
| | |
| 56 INVESCO OPPENHEIMER V.I. GLOBAL STRATEGIC INCOME FUND |
APPROVAL OF THE INVESTMENT ADVISORY ANDSUB-ADVISORY CONTRACTSUnaudited / Continued
from these affiliated money market funds attributable to such investments, although Invesco Advisers has contractually agreed to waive through varying periods the advisory fees payable by the Invesco Funds with respect to certain investments in the affiliated money market funds. The waiver is in an amount equal to 100% of the net advisory fee Invesco Advisers will receive from the affiliated money market funds with respect to the Fund’s investment in the affiliated money market funds of uninvested cash, but not cash collateral. The Board concluded that the amount of advisory fees to be received by Invesco Advisers from the Fund’s investment of cash collateral from any securities lending arrangements in the affiliated money market funds is fair and reasonable.
| | |
| 57 INVESCO OPPENHEIMER V.I. GLOBAL STRATEGIC INCOME FUND |
PORTFOLIO PROXY VOTING POLICIES AND GUIDELINES; UPDATES TO STATEMENT OF INVESTMENTSUnaudited
Go paperless with eDelivery
Visit invesco.com/edelivery to enjoy the convenience and security of anytime electronic access to your investment documents.
With eDelivery, you can elect to have any or all of the following materials delivered straight to your inbox to download, save and print from your own computer:
● Fund reports and prospectuses
● Quarterly statements
● Daily confirmations
● Tax forms
Invesco mailing information
Send general correspondence to Invesco Investment Services, Inc., P.O. Box 219078, Kansas City, MO 64121-9078.
Important notice regarding delivery of security holder documents
To reduce Fund expenses, only one copy of most shareholder documents may be mailed to shareholders with multiple accounts at the same address (Householding). Mailing of your shareholder documents may be householded indefinitely unless you instruct us otherwise. If you do not want the mailing of these documents to be combined with those for other members of your household, please contact Invesco Investment Services, Inc. at 800 959 4246 or contact your financial institution. We will begin sending you individual copies for each account within 30 days after receiving your request.
Fund holdings and proxy voting information
The Fund provides a complete list of its holdings four times in each fiscal year, at the quarter ends. For the second and fourth quarters, the lists appear in the Fund’s semiannual and annual reports to shareholders. For the first and third quarters, the Fund files the lists with the Securities and Exchange Commission (SEC) on FormN-Q (or any successor Form). The most recent list of portfolio holdings is available at invesco.com/completeqtrholdings. Shareholders can also look up the Fund’s FormsN-Q (or any successor Form) on the SEC website at sec.gov.
A description of the policies and procedures that the Fund uses to determine how to vote proxies relating to portfolio securities is available without charge, upon request, from our Client Services department at 800 959 4246 or at invesco.com/proxyguidelines. The information is also available on the SEC website, sec.gov.
Information regarding how the Fund voted proxies related to its portfolio securities during the most recent12-month period ended June 30 is available at invesco.com/proxysearch. The information is also available on the SEC website, sec.gov.
Invesco Advisers, Inc. is an investment adviser; it provides investment advisory services to individual and institutional clients and does not sell securities. Invesco Distributors, Inc. is the US distributor for Invesco Ltd.’s retail mutual funds, exchange-traded funds and institutional money market funds. Both are wholly owned, indirect subsidiaries of Invesco Ltd.
| | |
| 58 INVESCO OPPENHEIMER V.I. GLOBAL STRATEGIC INCOME FUND |
SHAREHOLDER PROXYUnaudited
A Special Meeting (“Meeting”) of Shareholders of Invesco Oppenheimer V.I. Global Strategic Income Fund was held on April 12, 2019. The Meeting was held for the following purpose:
(1) Approval of an Agreement and Plan of Reorganization that provides for the reorganization of Oppenheimer Global Strategic Income Fund/VA into Invesco Oppenheimer V.I. Global Strategic Income Fund.
The results of the voting on the above matter was as follows:
| | | | | | | | | | | | | | | | |
| Matter | | Votes For | | | Votes
Against | | | Votes
Abstain | | | Broker
Non-Votes | |
| (1) Approval of an Agreement and Plan of Reorganization | | | 156,001,500 | | | | 4,335,181 | | | | 14,057,164 | | | | 0 | |
| | |
| 59 INVESCO OPPENHEIMER V.I. GLOBAL STRATEGIC INCOME FUND |

| | | | |

| | Semiannual Report | | 6/30/2019 |
| | |
| | | | |
| | | | |
| | | | |
| | |
| | Invesco Oppenheimer V.I. Government Money Fund* The Fund provides a complete list of its holdings four times in each fiscal year, at the quarter ends. For the second and fourth quarters, the lists appear in the Fund’s semi annual and annual reports to shareholders. For the first and third quarters, the Fund files the lists with the Securities and Exchange Commission (SEC) on FormN-Q (or any successor Form). The Fund’s FormN-Q (or any successor Form) filings are available on the SEC website, sec.gov. The Fund’s most recent portfolio holdings, as filed on FormN-Q (or any successor Form), have also been made available to insurance companies issuing variable annuity contracts and variable life insurance policies (“variable products”) that invest in the Fund. A description of the policies and procedures that the Fund uses to determine how to vote proxies relating to portfolio securities is available without charge, upon request, from our Client Services department at 800 959 4246 or at invesco.com/proxyguidelines. The information is also available on the SEC website, sec.gov. Information regarding how the Fund voted proxies related to its portfolio securities during the most recent12-month period ended June 30 is available at invesco.com/proxysearch. The information is also available on the SEC website, sec.gov. Invesco Advisers, Inc. is an investment adviser; it provides investment advisory services to individual and institutional clients and does not sell securities. Invesco Distributors, Inc. is the US distributor for Invesco Ltd.’s retail mutual funds, exchange- traded funds and institutional money market funds. Both are wholly owned, indirect subsidiaries of Invesco Ltd. This report must be accompanied or preceded by a currently effective Fund prospectus and variable product prospectus, which contain more complete information, including sales charges and expenses. Investors should read each carefully before investing. *Prior to the close of business on May 24, 2019, the Fund’s name was Oppenheimer Government Money Fund/VA. See Important Update on the following page for more information. |
Important Update
On October 18, 2018, Massachusetts Mutual Life Insurance Company, an indirect corporate parent of OppenheimerFunds, Inc. and its subsidiaries OFI Global Asset Management, Inc., OFI SteelPath, Inc. and OFI Advisors, LLC, announced that it had entered into an agreement whereby Invesco Ltd., a global investment management company would acquire OppenheimerFunds and its subsidiaries (together, “OppenheimerFunds”). After the close of business on May 24, 2019 Invesco Ltd. completed the acquisition of OppenheimerFunds. This Fund was included in that acquisition and as of that date, became part of the Invesco family of funds. Please visit invesco.com for more information or call Invesco’s Client Services team at800-959-4246.
| | | | | | | | | | | | | | | | | | |
Current Yield – Series I* | | | Current Yield – Series II** | |
For the 7-Day Period Ended 6/30/19 | | | For the 7-Day Period Ended 6/30/19 | |
With Compounding | | | 1.90% | | | | | | | With Compounding | | | 1.66% | | | | | |
Without Compounding | | | 1.89% | | | | | | | Without Compounding | | | 1.65% | | | | | |
For the 6-Month Period Ended 6/30/19 | | | | | | | | | | | |
With Compounding | | | 1.95% | | | | | | | | | | | | | | | |
Without Compounding | | | 1.94% | | | | | | | | | | | | | | | |
Performance data quoted represents past performance, which does not guarantee future results. Yields include dividends in a hypothetical investment for the periods shown. Current performance may be lower or higher than the performance quoted. The yields take into account contractual and voluntary fee waivers and/or expense reimbursements, without which yields would have been lower. Some of these undertakings may be modified at any time, as indicated in the prospectus. There is no guarantee that the Fund will maintain a positive yield. The Fund’s performance should not be expected to be the same as the returns of other funds, whether or not both funds have the same portfolio managers and/or similar names. The Fund’s performance does not include the charges associated with the separate account products that offer this Fund. Such performance would have been lower if such charges were taken into account. See Fund prospectuses and summary prospectuses for more information on share classes and sales charges.
| | | | |
PORTFOLIO ALLOCATION | | | | |
Repurchase Agreements | | | 46.5% | |
U.S. Government Obligations | | | 38.2 | |
U.S. Government Agencies | | | 13.9 | |
Investment Companies | | | 1.4 | |
|
| Portfolio holdings and allocations are subject to change. Percentages are as of June 30, 2019, and are based on the total market value of investments. | |
Before investing, investors should carefully read the prospectus and/or summary prospectus and carefully consider the investment objectives, risks, charges and expenses. For this and more complete information about the fund(s), investors should ask their advisors for a prospectus/summary prospectus or visit invesco.com/fundprospectus.
Shares of Invesco funds are not deposits or obligations of any bank, are not guaranteed by any bank, are not insured by the FDIC or any other agency, and involve investment risks, including the possible loss of the principal amount invested.
*Effective after the close of business on May 24, 2019, the Non-Service share class of the predecessor fund was reorganized into Series I Shares, of the Fund. Returns shown for Series I shares are blended returns of the predecessor fund and the Fund. Share class returns will differ from those of the predecessor fund because of different expenses.
**Series II Shares’ performance show prior to the inception date is that of the predecessor fund’s Service Class shares at net asset value (NAV). Service Class shares’ performance reflects any applicable fee waivers and/or expense reimbursements.
For more current Fund holdings, please visit invesco.com.
|
| 3 INVESCO OPPENHEIMER V.I. GOVERNMENT MONEY FUND |
Fund Expenses
Fund Expenses.As a shareholder of the Fund, you incur two types of costs: (1) transaction costs and (2) ongoing costs, including management fees; and other Fund expenses. These examples are intended to help you understand your ongoing costs (in dollars) of investing in the Fund and to compare these costs with the ongoing costs of investing in other mutual funds.
The examples are based on an investment of $1,000.00 invested at the beginning of the period and held for the entire6-month period ended June 30, 2019.
Actual Expenses. The first section of the table provides information about actual account values and actual expenses. You may use the information in this section, together with the amount you invested, to estimate the expense that you paid over the period. Simply divide your account value by $1,000.00 (for example, an $8,600.00 account value divided by $1,000.00 = 8.60), then multiply the result by the number in the first section under the heading entitled “Expenses Paid During 6 Months Ended June 30, 2019” to estimate the expenses you paid on your account during this period.
Hypothetical Example for Comparison Purposes.
The second section of the table provides information about hypothetical account values and hypothetical expenses based on the Fund’s actual expense ratio, and an assumed rate of return of 5% per year before expenses, which is not the actual return. The hypothetical account values and expenses may not be used to estimate the actual ending account balance or expenses you paid for the period. You may use this information to compare the ongoing costs of investing in the Fund and other funds. To do so, compare this 5% hypothetical example with the 5% hypothetical examples that appear in the shareholder reports of the other funds.
Please note that the expenses shown in the table are meant to highlight your ongoing costs only and do not reflect any charges associated with the separate accounts that offer this Fund. Therefore, the “hypothetical” lines of the table are useful in comparing ongoing costs only, and will not help you determine the relative total costs of owning different funds. In addition, if these separate account charges were included your costs would have been higher.
| | | | | | | | | | | | | | | | |
| Actual | | Beginning
Account Value
January 1, 2019 | | | Ending
Account
Value
June 30, 2019 | | | Expenses Paid During 6 Months Ended
June 30, 20191,2 | | | | |
Series I shares | | $ | 1,000.00 | | | $ | 1,009.60 | | | $ | 2.49 | | | | | |
Series II shares | | | 1,000.00 | | | | 1,008.20 | | | | 0.68 | | | | | |
| | | | |
Hypothetical (5% return before expenses) | | | | | | | | | | | | | | | | |
Series I shares | | | 1,000.00 | | | | 1,022.32 | | | | 2.51 | | | | | |
Series II shares | | | 1,000.00 | | | | 1,021.47 | | | | 3.36 | | | | | |
1. Actual expenses paid for Series I are equal to the Fund’s annualized expense ratio for that class, multiplied by the average account value over the period, multiplied by 181/365 (to reflect theone-half year period). Actual expenses paid for Series II are equal to the Fund’s annualized expense ratio for that class, multiplied by the average account value over the period, multiplied by 37/365 to reflect the period from after close of business on May 24, 2019 (inception of offering) to June 30, 2019.
2. Hypothetical expenses paid for all classes are equal to the Fund’s annualized expense ratio for that class, multiplied by the average account value over the period, multiplied by 181/365 (to reflect theone-half year period).
Those annualized expense ratios, excluding indirect expenses from affiliated funds, based on the6-month period ended June 30, 2019 for Series I and for the period from after the close of business May 24, 2019 (inception of offering) to June 30, 2019 for Series II are as follows:
| | | | | |
| Class | | Expense Ratios |
| Series I shares | | | | 0.50 | % |
| Series II shares | | | | 0.67 | |
The expense ratios reflect voluntary and/or contractual waivers and/or reimbursements of expenses by the Fund’s Manager.. Some of these undertakings may be modified or terminated at any time, as indicated in the Fund’s prospectus. The “Financial Highlights” table in the Fund’s financial statements, included in this report, also shows the gross expense ratio, without such waivers or reimbursements and reduction to custodian expenses, if applicable.
|
| 4 INVESCO OPPENHEIMER V.I. GOVERNMENT MONEY FUND |
STATEMENT OF INVESTMENTSJune 30, 2019 Unaudited
| | | | | | | | | | | | | | | | |
| | | Maturity Date* | | | Final Legal Maturity
Date** | | | Principal
Amount | | | Value | |
| U.S. Government Agencies—14.3% | | | | | | | | | | | | | | | | |
Federal Farm Credit Bank: | | | | | | | | | | | | | | | | |
2.327% [US0001M-8.5]1 | | | 7/9/19 | | | | 7/9/19 | | | | $ 1,000,000 | | | | $ 1,000,011 | |
2.341% [US0001M-6]1 | | | 7/14/19 | | | | 8/14/19 | | | | 3,000,000 | | | | 2,999,889 | |
2.355% [US0001M-7.5]1 | | | 7/5/19 | | | | 11/5/19 | | | | 5,000,000 | | | | 4,999,303 | |
2.417% [US0003M-18]1 | | | 7/15/19 | | | | 10/15/19 | | | | 9,500,000 | | | | 9,499,499 | |
| 2.722%2 | | | 10/4/19 | | | | 10/4/19 | | | | 2,000,000 | | | | 1,988,758 | |
Federal Home Loan Bank: | | | | | | | | | | | | | | | | |
2.204%2 | | | 7/12/19 | | | | 7/12/19 | | | | 25,000,000 | | | | 24,983,195 | |
2.281% [US0003M-24]1 | | | 8/25/19 | | | | 11/25/19 | | | | 4,000,000 | | | | 3,999,069 | |
2.297% [US0001M-10.5]1 | | | 7/26/19 | | | | 7/26/19 | | | | 10,000,000 | | | | 9,999,330 | |
2.299% [US0001M-10.5]1 | | | 7/24/19 | | | | 7/24/19 | | | | 1,000,000 | | | | 999,986 | |
2.299% [US0001M-10.5]1 | | | 7/27/19 | | | | 8/27/19 | | | | 4,000,000 | | | | 3,999,645 | |
2.304%2 | | | 7/3/19 | | | | 7/3/19 | | | | 25,000,000 | | | | 24,996,944 | |
2.32% [US0003M-26]1 | | | 7/25/19 | | | | 7/25/19 | | | | 4,000,000 | | | | 3,999,997 | |
2.321% [US0003M-26]1 | | | 7/11/19 | | | | 10/11/19 | | | | 5,000,000 | | | | 4,998,166 | |
2.322% [US0001M-8]1 | | | 7/26/19 | | | | 9/26/19 | | | | 3,000,000 | | | | 2,999,421 | |
2.329% [US0001M-6.5]1 | | | 7/17/19 | | | | 10/17/19 | | | | 2,000,000 | | | | 1,999,805 | |
2.361%2 | | | 8/28/19 | | | | 8/28/19 | | | | 2,000,000 | | | | 1,992,879 | |
2.363%2 | | | 8/30/19 | | | | 8/30/19 | | | | 2,000,000 | | | | 1,992,633 | |
2.432%2 | | | 7/26/19 | | | | 7/26/19 | | | | 5,000,000 | | | | 4,992,361 | |
2.44% [SOFRRATE+2]1 | | | 7/1/19 | | | | 7/17/19 | | | | 1,000,000 | | | | 999,982 | |
2.445%2 | | | 7/15/19 | | | | 7/15/19 | | | | 1,500,000 | | | | 1,498,717 | |
2.45% [SOFRRATE+3]1 | | | 7/1/19 | | | | 12/6/19 | | | | 3,000,000 | | | | 2,999,645 | |
2.45% [SOFRRATE+3]1 | | | 7/1/19 | | | | 10/9/19 | | | | 3,000,000 | | | | 2,999,737 | |
2.455% [SOFRRATE+3.5]1 | | | 7/1/19 | | | | 2/21/20 | | | | 2,500,000 | | | | 2,500,374 | |
2.47% [SOFRRATE+5]1 | | | 7/1/19 | | | | 1/17/20 | | | | 1,000,000 | | | | 999,921 | |
2.481%2 | | | 8/16/19 | | | | 8/16/19 | | | | 3,000,000 | | | | 2,991,528 | |
2.483%2 | | | 9/11/19 | | | | 9/11/19 | | | | 1,500,000 | | | | 1,493,520 | |
2.486%2 | | | 7/31/19 | | | | 7/31/19 | | | | 4,000,000 | | | | 3,992,667 | |
2.494%2 | | | 8/21/19 | | | | 8/21/19 | | | | 4,000,000 | | | | 3,987,477 | |
| 2.494%2 | | | 8/23/19 | | | | 8/23/19 | | | | 3,000,000 | | | | 2,990,239 | |
Federal National Mortgage Assn.: | | | | | | | | | | | | | | | | |
2.21%2 | | | 7/1/19 | | | | 7/1/19 | | | | 10,000,000 | | | | 10,000,000 | |
2.54% [SOFRRATE+12]1 | | | 7/1/19 | | | | 7/30/19 | | | | 6,000,000 | | | | 6,000,576 | |
Total U.S. Government Agencies (Cost $155,888,737) | | | | | | | | | | | | | | | 155,895,274 | |
| | | | |
| | | | | | | | | | | | | | | | |
| U.S. Government Obligations—39.4% | | | | | | | | | | | | | | | | |
United States Treasury Bills: | | | | | | | | | | | | | | | | |
2.116%2 | | | 8/20/19 | | | | 8/20/19 | | | | 35,000,000 | | | | 34,898,403 | |
2.129%2 | | | 8/22/19 | | | | 8/22/19 | | | | 21,000,000 | | | | 20,936,330 | |
2.229%2 | | | 7/23/19 | | | | 7/23/19 | | | | 49,500,000 | | | | 49,437,529 | |
2.25%2 | | | 7/16/19 | | | | 7/16/19 | | | | 50,000,000 | | | | 49,957,318 | |
2.28%2 | | | 7/9/19 | | | | 7/9/19 | | | | 50,000,000 | | | | 49,978,500 | |
2.282%2 | | | 7/25/19 | | | | 7/25/19 | | | | 25,000,000 | | | | 24,967,500 | |
2.297%2 | | | 7/2/19 | | | | 7/2/19 | | | | 50,000,000 | | | | 49,997,305 | |
2.303%2 | | | 7/5/19 | | | | 7/5/19 | | | | 50,000,000 | | | | 49,989,165 | |
2.306%2 | | | 8/8/19 | | | | 8/8/19 | | | | 25,000,000 | | | | 24,945,606 | |
2.314%2 | | | 7/30/19 | | | | 7/30/19 | | | | 25,000,000 | | | | 24,956,853 | |
2.321%2 | | | 7/18/19 | | | | 7/18/19 | | | | 25,000,000 | | | | 24,975,784 | |
2.329%2 | | | 8/1/19 | | | | 8/1/19 | | | | 25,000,000 | | | | 24,956,729 | |
Total U.S. Government Obligations (Cost $429,962,057) | | | | | | | | | | | | | | | 429,997,022 | |
| | | | |
| | | | | | | | | | | | | | | | |
| Repurchase Agreements—48.0% | | | | | | | | | | | | | | | | |
Repurchase Agreements3(Cost $523,600,000) | | | | | | | | | | | 523,600,000 | | | | 523,600,000 | |
| | | | |
| | | | | | | | | Shares | | | | |
| Investment Company—1.4% | | | | | | | | | | | | | | | | |
Invesco Oppenheimer Institutional Government Money Market Fund, Cl. IN, 2.37%4(Cost $15,769,159) | | | | 15,769,159 | | | | 15,769,159 | |
| | | | | | | | | | | | | | | | | |
| Total Investments, at Value (Cost $1,125,219,953) | | | | 103.1% | | | | 1,125,261,455 | |
Net Other Assets (Liabilities) | | | | | | | | | | | (3.1 | ) | | | (34,066,508 | ) |
Net Assets | | | | | | | | | | | 100.0% | | | $ | 1,091,194,947 | |
| | | | | | | | | | | | |
|
| 5 INVESCO OPPENHEIMER V.I. GOVERNMENT MONEY FUND |
STATEMENT OF INVESTMENTSUnaudited / Continued
Footnotes to Statement of Investments
Short-term notes and direct bank obligations are generally traded on a discount basis; the interest rate shown is the discount rate received by the Fund at the time of purchase. Other securities normally bear interest at the rates shown.
*. The Maturity Date represents the date used to calculate the Fund’s weighted average maturity as determined under Rule 2a-7.
**. If different from the Maturity Date, the Final Legal Maturity Date includes any maturity date extensions which may be affected at the option of the issuer or unconditional payments of principal by the issuer which may be affected at the option of the Fund, and represents the date used to calculate the Fund’s weighted average life as determined under Rule 2a-7.
1. Represents the current interest rate for a variable or increasing rate security, which may be fixed for a predetermined period. The interest rate is, or will be as of an established date, determined as [Referenced Rate + Basis-point spread].
2. Zero coupon bond reflects effective yield on the original acquisition date.
3. Repurchase agreements:
| | | | | | | | | | | | | | | | | | | | | | | | | | | | | | |
| | | | | | | | | | | | | | | | | | | | | | | Repurchase | |
| | | | | | | | | | | | | | | | | Collateral | | | Repurchase | | | Agreement | |
| | | Lending | | | Settlement | | | Maturity | | | Principal | | | | | Received, at | | | Agreements, | | | Proceeds to be | |
| Counterparty | | Rate | | | Date | | | Date | | | Amount | | | Collateralized By | | Valuea | | | at Value | | | Receiveda | |
| ASL Capital Markets Inc. | | | 2.60% | | | | 6/28/19 | | | | 7/1/19 | | | | $59,000,000 | | | U.S. Treasury Nts.,1.25%-3.00%,7/15/20-9/30/25 | | | $(60,193,078 | ) | | | $59,000,000 | | | | $59,012,821 | |
| Cantor Fitzgerald Secured, LLC | | | 2.55 | | | | 6/28/19 | | | | 7/1/19 | | | | 135,000,000 | | | U.S. Treasury Nts.,1.25%-2.75%,3/31/21-6/30/25 and U.S. Government Agency Mortgages, 0.00%-7.00%,2/26/20-1/1/49 | | | (139,442,567 | ) | | | 135,000,000 | | | | 135,028,752 | |
| Cantor Fitzgerald Secured, LLC | | | 2.72 | | | | 6/26/19 | | | | 7/3/19 | | | | 3,000,000 | | | U.S. Treasury Bonds, 4.50%, 8/15/39; U.S. Treasury Nts., 1.25%, 10/31/21 and U.S. Government Agency Mortgages,3.00%-5.00%,1/1/31-10/20/48 | | | (3,218,275 | ) | | | 3,000,000 | | | | 3,001,625 | |
| Credit Agricole Corp. & Investment Bank | | | 2.63 | | | | 6/27/19 | | | | 7/5/19 | | | | 5,000,000 | | | U.S. Government Agency Mortgages, 3.00%, 7/1/46 | | | (5,102,981 | ) | | | 5,000,000 | | | | 5,002,923 | |
| RBC Dominion Securities, Inc. | | | 2.46 | | | | 6/28/19 | | | | 7/1/19 | | | | 70,600,000 | | | U.S. Treasury Bills, 0.00%, 11/14/19 and U.S. Treasury Nts.,1.125%-2.875%,12/31/20-4/30/24 | | | (72,026,787 | ) | | | 70,600,000 | | | | 70,614,497 | |
| RBC Dominion Securities, Inc. | | | 2.48 | | | | 6/28/19 | | | | 7/1/19 | | | | 159,000,000 | | | U.S. Treasury Bills, 0.00%, 11/14/19; U.S. Treasury Bonds, 2.875%, 5/15/49; U.S. Treasury Nts.,0.00%-2.75%,2/28/21-8/15/48 and U.S. Government Agency Mortgages,3.00%-4.00%,6/20/47-10/20/48 | | | (162,213,594 | ) | | | 159,000,000 | | | | 159,032,935 | |
| South Street Securities LLC | | | 2.60 | | | | 6/28/19 | | | | 7/1/19 | | | | 74,000,000 | | | U.S. Government Agency Mortgages, 2.127%-5.66%,12/1/21-4/1/49 | | | (75,496,354 | ) | | | 74,000,000 | | | | 74,016,033 | |
| TD Securities (USA) LLC | | | 2.51 | | | | 6/28/19 | | | | 7/1/19 | | | | 18,000,000 | | | U.S. Government Agency Mortgages, 3.50%, 6/1/49 | | | (18,363,841 | ) | | | 18,000,000 | | | | 18,003,765 | |
| | | | | | | | | | | | | | | | | | | | | $(536,057,477 | ) | | | $523,600,000 | | | | $523,713,351 | |
a. Includes accrued interest.
4. The money market fund and the Fund are affiliated by having the same investment adviser. The rate shown is the7-day SEC standardized yield as of June 30, 2019.
Glossary:
| | |
| Definitions | | |
| ICE LIBOR | | Intercontinental Exchange London Interbank Offered Rate |
| SOFRRATE | | United States Secured Overnight Financing Rate |
| US0001M | | ICE LIBOR USD 1 Month |
| US0003M | | ICE LIBOR USD 3 Month |
See accompanying Notes to Financial Statements.
|
| 6 INVESCO OPPENHEIMER V.I. GOVERNMENT MONEY FUND |
STATEMENT OF ASSETS AND LIABILITIESJune 30, 2019 Unaudited
| | | | |
| Assets | | | | |
| Investments, at value—see accompanying statement of investments: | | | | |
| Unaffiliated companies (cost $585,850,794) | | $ | 585,892,296 | |
| Affiliated companies (cost $15,769,159) | | | 15,769,159 | |
| Repurchase agreements (cost $523,600,000) | | | 523,600,000 | |
| | | | |
| | | 1,125,261,455 | |
| Cash | | | 65,850 | |
| Receivables and other assets: | | | | |
| Interest and dividends | | | 329,530 | |
| Shares of beneficial interest sold | | | 139 | |
| Other | | | 156,277 | |
| | | | |
| Total assets | | | 1,125,813,251 | |
| Liabilities | | | | |
| Payables and other liabilities: | | | | |
| Shares of beneficial interest redeemed | | | 33,794,696 | |
| Dividends | | | 424,476 | |
| Administration fee | | | 203,651 | |
| Trustees’ compensation | | | 94,995 | |
| Management fee | | | 41,081 | |
| Investments purchased | | | 30,802 | |
| Transfer and shareholder servicing agent fees | | | 8,582 | |
| Shareholder communications | | | 5,396 | |
| Distribution and service plan fees | | | 2 | |
| Other | | | 14,623 | |
| | | | |
| Total liabilities | | | 34,618,304 | |
Net Assets | | $ | 1,091,194,947 | |
| | | | |
| | | | |
| Composition of Net Assets | | | | |
| Shares of beneficial interest | | $ | 1,091,186,582 | |
| Total distributable earnings | | | 8,365 | |
| | | | |
Net Assets | | $ | 1,091,194,947 | |
| | | | |
| | | | |
| Net Asset Value Per Share | | | | |
| Series I Shares: | | | | |
| Net asset value, redemption price per share and offering price per share (based on net assets of $1,091,184,947 and 1,091,110,339 shares of beneficial interest outstanding) | | | $1.00 | |
| Series II Shares: | | | | |
| Net asset value, redemption price per share and offering price per share (based on net assets of $10,000 and 10,000 shares of beneficial interest outstanding) | | | $1.00 | |
See accompanying Notes to Financial Statements.
|
| 7 INVESCO OPPENHEIMER V.I. GOVERNMENT MONEY FUND |
STATEMENT OF OPERATIONSFor the Six Months Ended June 30, 2019 Unaudited
| | | | |
| Investment Income | | | | |
| Interest from unaffiliated companies | | | $ 20,045,587 | |
| Dividends for affiliated companies | | | 184,669 | |
| | | | |
| Total investment income | | | 20,230,256 | |
| Expenses | | | | |
| Management fees | | | 3,433,176 | |
| Administration fees | | | 218,132 | |
| Distribution and service plan fees — Series II shares | | | 2 | |
| Transfer and shareholder servicing agent fees — Series I shares | | | 864,901 | |
| Shareholder communications — Series I shares | | | 21,210 | |
| Trustees’ compensation | | | 41,225 | |
| Custodian fees and expenses | | | 4,648 | |
| Other | | | 64,164 | |
| | | | |
| Total expenses | | | 4,647,458 | |
| Less reduction to custodian expenses | | | (2,585) | |
| Less waivers and reimbursements of expenses | | | (480,237) | |
| | | | |
| Net expenses | | | 4,164,636 | |
Net Investment Income | | | 16,065,620 | |
| Realized and Unrealized Gain | | | | |
| Realized gain on Investment transactions in unaffiliated companies | | | 7,157 | |
| Net change in unrealized appreciation/(depreciation) on Investment transactions | | | 41,502 | |
Net Increase in Net Assets Resulting from Operations | | | $ 16,114,279 | |
| | | | |
| | | | |
See accompanying Notes to Financial Statements.
|
| 8 INVESCO OPPENHEIMER V.I. GOVERNMENT MONEY FUND |
STATEMENTS OF CHANGES IN NET ASSETS
| | | | | | | | |
| | | Six Months Ended
June 30, 2019
(Unaudited) | | Year Ended
December 31, 2018 | |
| Operations | | | | | | | | |
| Net investment income | | $ | 16,065,620 | | | $ | 14,653,999 | |
| Net realized gain | | | 7,157 | | | | 155 | |
| Net change in unrealized appreciation/(depreciation) | | | 41,502 | | | | — | |
| Net increase in net assets resulting from operations | | | 16,114,279 | | | | 14,654,154 | |
| Dividends and/or Distributions to Shareholders | | | | | | | | |
| Distributions to shareholders from distributable earnings: | | | | | | | | |
| Series I shares | | | (16,064,989 | ) | | | (14,654,285) | |
| Series II shares | | | (15 | ) | | | — | |
| Total distributions from distributable earnings | | | (16,065,004 | ) | | | (14,654,285) | |
| Beneficial Interest Transactions | | | | | | | | |
| Net increase (decrease) in net assets resulting from beneficial interest transactions: | | | | | | | | |
| Series I shares | | | (1,964,589,903 | ) | | | 2,630,121,422 | |
| Series II shares | | | 10,000 | | | | — | |
| Total beneficial interest transactions | | | (1,964,579,903 | ) | | | 2,630,121,422 | |
| Net Assets | | | | | | | | |
| Total increase (decrease) | | | (1,964,530,628 | ) | | | 2,630,121,291 | |
| Beginning of period | | | 3,055,725,575 | | | | 425,604,284 | |
| End of period | | $ | 1,091,194,947 | | | $ | 3,055,725,575 | |
| | | | |
See accompanying Notes to Financial Statements.
|
| 9 INVESCO OPPENHEIMER V.I. GOVERNMENT MONEY FUND |
FINANCIAL HIGHLIGHTS
| | | | | | | | | | | | | | | | | | | | | | | | | | | | | | |
| Series I Shares | | Six Months
Ended
June 30, 2019
(Unaudited) | | Year Ended
December 31,
2018 | | Year Ended
December 31,
2017 | | Year Ended
December 31,
2016 | | Year Ended
December 31,
2015 | | Year Ended
December 31,
2014 |
| Per Share Operating Data | | | | | | | | | | | | | | | | | | | | | | | | | | | | | | |
| Net asset value, beginning of period | | | | $1.00 | | | | | $1.00 | | | | | $1.00 | | | | | $1.00 | | | | | $1.00 | | | | | $1.00 | |
| Income (loss) from investment operations: | | | | | | | | | | | | | | | | | | | | | | | | | | | | | | |
| Net investment income1 | | | | 0.01 | | | | | 0.01 | | | | | 0.002 | | | | | 0.002 | | | | | 0.002 | | | | | 0.002 | |
| Net realized and unrealized gain | | | | 0.002 | | | | | 0.002 | | | | | (0.00)2 | | | | | (0.00)2 | | | | | 0.002 | | | | | 0.002 | |
| | | | | | | | | | | | | | | | | | | | | | | | | | | | | | |
| Total from investment operations | | | | 0.01 | | | | | 0.01 | | | | | 0.002 | | | | | 0.002 | | | | | 0.002 | | | | | 0.002 | |
| Dividends and/or distributions to shareholders: | | | | | | | | | | | | | | | | | | | | | | | | | | | | | | |
| Dividends from net investment income | | | | (0.01) | | | | | (0.01) | | | | | (0.00)2 | | | | | (0.00)2 | | | | | (0.00)2 | | | | | (0.00)2 | |
| Net asset value, end of period | | | | $1.00 | | | | | $1.00 | | | | | $1.00 | | | | | $1.00 | | | | | $1.00 | | | | | $1.00 | |
| | | | | | | | | | | | | | | | | | | | | | | | | | | | | | |
| | | | | | | | | | | | | | | | | | | | | | | | | | | | | | |
| | | | | | | | | | | | | | | | | | | | | | | | | | | | | | |
| Total Return, at Net Asset Value3 | | | | 0.96% | | | | | 1.35% | | | | | 0.39% | | | | | 0.01% | | | | | 0.01% | | | | | 0.01% | |
| | | | | | | | | | | | | | | | | | | | | | | | | | | | | | | |
| Ratios/Supplemental Data | | | | | | | | | | | | | | | | | | | | | | | | | | | | | | |
| Net assets, end of period (in thousands) | | | | $1,091,185 | | | | | $3,055,726 | | | | | $425,604 | | | | | $541,970 | | | | | $2,648,636 | | | | | $515,297 | |
| Average net assets (in thousands) | | | | $1,664,264 | | | | | $952,018 | | | | | $488,532 | | | | | $1,470,447 | | | | | $1,144,581 | | | | | $329,045 | |
| Ratios to average net assets:4 | | | | | | | | | | | | | | | | | | | | | | | | | | | | | | |
| Net investment income | | | | 1.95% | | | | | 1.54% | | | | | 0.39% | | | | | 0.01% | | | | | 0.01% | | | | | 0.01% | |
| Total expenses5 | | | | 0.56% | | | | | 0.56% | | | | | 0.59% | | | | | 0.55% | | | | | 0.53% | | | | | 0.57% | |
| Expenses after payments, waivers and/or reimbursements and reduction to custodian expenses | | | | 0.50% | | | | | 0.50% | | | | | 0.50% | | | | | 0.35% | | | | | 0.19% | | | | | 0.15% | |
1. Per share amounts calculated based on the average shares outstanding during the period.
2. Less than $0.005 per share.
3. Assumes an initial investment on the business day before the first day of the fiscal period, with all dividends and distributions reinvested in additional shares on the reinvestment date, and redemption at the net asset value calculated on the last business day of the fiscal period. Total returns are not annualized for periods less than one full year. Total return information does not reflect expenses that apply at the separate account level or to related insurance products. Inclusion of these charges would reduce the total return figures for all periods shown. Returns do not reflect the deduction of taxes that a shareholder would pay on fund distributions or the redemption of fund shares.
4. Annualized for periods less than one full year.
5. Total expenses including indirect expenses from affiliated fund fees and expenses were as follows:
| | | | | | | | |
| Six Months Ended June 30, 2019 | | | 0.56% | | | | | |
| Year Ended December 31, 2018 | | | 0.56% | | | | | |
| Year Ended December 31, 2017 | | | 0.59% | | | | | |
| Year Ended December 31, 2016 | | | 0.55% | | | | | |
| Year Ended December 31, 2015 | | | 0.53% | | | | | |
| Year Ended December 31, 2014 | | | 0.57% | | | | | |
See accompanying Notes to Financial Statements.
|
| 10 INVESCO OPPENHEIMER V.I. GOVERNMENT MONEY FUND |
| | | | | |
| Series II Shares | | Period Ended
June 30, 2019
(Unaudited)1 |
| Per Share Operating Data | | | | | |
| Net asset value, beginning of period | | | | $1.00 | |
| Income (loss) from investment operations: | | | | | |
| Net investment income2 | | | | 0.003 | |
| Net realized and unrealized gain | | | | 0.003 | |
| Total from investment operations | | | | 0.003 | |
| Dividends and/or distributions to shareholders: | | | | | |
| Dividends from net investment income | | | | (0.00)3 | |
| Net asset value, end of period | | | | $1.00 | |
| | | | | |
| | | | | |
| | | | | | |
| Total Return, at Net Asset Value4 | | | | 0.82% | |
| | | | | | |
| Ratios/Supplemental Data | | | | | |
| Net assets, end of period (in thousands) | | | | $10 | |
| Average net assets (in thousands) | | | | $10 | |
| Ratios to average net assets:5 | | | | | |
| Net investment income | | | | 1.78% | |
| Total expenses6 | | | | 0.78% | |
| Expenses after payments, waivers and/or reimbursements and reduction to custodian expenses | | | | 0.67% | |
1. For the period from after close of business on May 24, 2019 (inception of offering) to June 30, 2019.
2. Per share amounts calculated based on the average shares outstanding during the period.
3. Less than $0.005 per share.
4. Assumes an initial investment on the business day before the first day of the fiscal period, with all dividends and distributions reinvested in additional shares on the reinvestment date, and redemption at the net asset value calculated on the last business day of the fiscal period. Total returns are not annualized for periods less than one full year. Total return information does not reflect expenses that apply at the separate account level or to related insurance products. Inclusion of these charges would reduce the total return figures for all periods shown. Returns do not reflect the deduction of taxes that a shareholder would pay on fund distributions or the redemption of fund shares.
5. Annualized for periods less than one full year.
6. Total expenses including indirect expenses from affiliated fund fees and expenses were as follows:
| | | | | | | | |
| Period Ended June 30, 2019 | | | 0.78% | | | | | |
See accompanying Notes to Financial Statements.
|
| 11 INVESCO OPPENHEIMER V.I. GOVERNMENT MONEY FUND |
NOTES TO FINANCIAL STATEMENTSJune 30, 2019 Unaudited
Note 1 - Significant Accounting Policies
Invesco Oppenheimer V.I. Government Money Fund (the “Fund”) is a series portfolio of AIM Variable Insurance Funds (Invesco Variable Insurance Funds) (the “Trust”). The Trust is a Delaware statutory trust registered under the Investment Company Act of 1940, as amended (the “1940 Act”), as anopen-end series management investment company authorized to issue an unlimited number of shares of beneficial interest. Information presented in these financial statements pertains only to the Fund. Matters affecting the Fund or each class will be voted on exclusively by the shareholders of such Fund or each class.
Prior to the close of business on May 24, 2019, the Fund operated as Oppenheimer Government Money Fund/VA (the “Acquired Fund” or “Predecessor Fund”). The Acquired Fund was reorganized after the close of business on May 24, 2019 (the “Reorganization Date”) through the transfer of all of its assets and liabilities to the Fund (the “Reorganization”).
Upon closing of the Reorganization, holders of the Acquired Fund’sNon-Service shares received Series I shares of the Fund. Information for the Acquired Fund’sNon-Service shares prior to the Reorganization is included with Series I throughout this report. Series II shares commenced operations on the Reorganization Date.
The Fund’s investment objective is to seek income consistent with stability of principal.
The Fund currently offers two classes of shares, Series I and Series II, both of which are offered to insurance company separate accounts funding variable annuity contracts and variable life insurance policies (“variable products”).
The Fund is an investment company and accordingly follows the investment company accounting and reporting guidance in accordance with Financial Accounting Standards Board Accounting Standards Codification Topic 946, Financial Services – Investment Companies.
The following is a summary of the significant accounting policies followed by the Fund in the preparation of its financial statements.
A. Security Valuations – The Fund’s securities are recorded on the basis of amortized cost which approximates value as permitted by Rule 2a-7 under the 1940 Act. This method values a security at its cost on the date of purchase and, thereafter, assumes a constant amortization to maturity of any premiums or accretion of any discounts.
Because of the inherent uncertainties of valuation, the values reflected in the financial statements may materially differ from the value received upon actual sale of those investments.
The Fund may invest in securities that are subject to interest rate risk, meaning the risk that the prices will generally fall as interest rates rise and, conversely, the prices will generally rise as interest rates fall. Specific securities differ in their sensitivity to changes in interest rates depending on their individual characteristics. Changes in interest rates may result in increased market volatility, which may affect the value and/or liquidity of certain Fund investments.
| B. | Securities Transactions and Investment Income -Securities transactions are accounted for on a trade date basis. Realized gains or losses on sales are computed on the basis of specific identification of the securities sold. Interest income (net of withholding tax, if any) is recorded on the accrual basis from settlement date. Bond premiums and discounts are amortized and/or accreted over the lives of the respective securities. |
The Fund may periodically participate in litigation related to Fund investments. As such, the Fund may receive proceeds from litigation settlements. Any proceeds received are included in the Statement of Operations as realized gain (loss) for investments no longer held and as unrealized gain (loss) for investments still held.
Brokerage commissions and mark ups are considered transaction costs and are recorded as an increase to the cost basis of securities purchased and/or a reduction of proceeds on a sale of securities. Such transaction costs are included in the determination of net realized and unrealized gain (loss) from investment securities reported in the Statement of Operations and the Statement of Changes in Net Assets and the net realized and unrealized gains (losses) on securities per share in the Financial Highlights. Transaction costs are included in the calculation of the Fund’s net asset value and, accordingly, they reduce the Fund’s total returns. These transaction costs are not considered operating expenses and are not reflected in net investment income reported in the Statement of Operations and the Statement of Changes in Net Assets, or the net investment income per share and the ratios of expenses and net investment income reported in the Financial Highlights, nor are they limited by any expense limitation arrangements between the Fund and the investment adviser.
The Fund allocates income and realized and unrealized capital gains and losses to a class based on the relative net assets of each class.
| C. | Country Determination- For the purposes of making investment selection decisions and presentation in the Schedule of Investments, the investment adviser may determine the country in which an issuer is located and/or credit risk exposure based on various factors. These factors include the laws of the country under which the issuer is organized, where the issuer maintains a principal office, the country in which the issuer derives 50% or more of its total revenues and the country that has the primary market for the issuer’s securities, as well as other criteria. Among the other criteria that may be evaluated for making this determination are the country in which the issuer maintains 50% or more of its assets, the type of security, financial guarantees and enhancements, the nature of the collateral and the sponsor organization. Country of issuer and/or credit risk exposure has been determined to be the United States of America, unless otherwise noted. |
| D. | Distributions -Dividends and distributions to shareholders, which are determined in accordance with income tax regulations and may differ from U.S. GAAP, are recorded on theex-dividend date. Income distributions, if any, are declared daily and paid monthly. Capital gain distributions, if any, are declared and paid annually but may be paid at other times to maintain the net asset value per share at $1.00. |
The tax character of distributions is determined as of the Fund’s fiscal year end. Therefore, a portion of the Fund’s distributions made to shareholders prior to the Fund’s fiscal year end may ultimately be categorized as a tax return of capital.
| E. | Federal Income Taxes -The Fund intends to comply with provisions of the Internal Revenue Code applicable to regulated investment companies and to distribute substantially all of its investment company taxable income to shareholders. Therefore, no federal income or excise tax provision is required. The Fund files income tax returns in U.S. federal and applicable state jurisdictions. The statute of limitations on the Fund’s tax return filings |
|
| 12 INVESCO OPPENHEIMER V.I. GOVERNMENT MONEY FUND |
| | generally remains open for the three preceding fiscal reporting period ends. The Fund has analyzed its tax positions for the fiscal year ended December 31, 2018, including open tax years, and does not believe there are any uncertain tax positions requiring recognition in the Fund’s financial statements. |
During the fiscal year ended December 31, 2018, the Fund did not utilize any capital loss carryforwards to offset capital gains realized in that fiscal year. Capital losses will be carried forward to future years if not offset by gains.
At period end, it is estimated that the capital loss carryforwards would be zero.The estimated capital loss carryforward represents the carryforward as of the end of the last fiscal year, increased or decreased by capital losses or gains realized in the first six months of the current fiscal year. During the reporting period, it is estimated that the Fund will utilize $426 capital loss carryforward to offset realized capital gains.
Net investment income (loss) and net realized gain (loss) may differ for financial statement and tax purposes. The character of dividends and distributions made during the fiscal year from net investment income or net realized gains are determined in accordance with federal income tax requirements, which may differ from the character of net investment income or net realized gains presented in those financial statements in accordance with U.S. GAAP. Also, due to timing of dividends and distributions, the fiscal year in which amounts are distributed may differ from the fiscal year in which the income or net realized gain was recorded by the Fund.
The aggregate cost of securities and other investments and the composition of unrealized appreciation and depreciation of securities and other investments for federal income tax purposes at period end are noted in the following table. The primary difference between book and tax appreciation or depreciation of securities and other investments, if applicable, is attributable to the tax deferral of losses or tax realization of financial statement unrealized gain or loss.
| | | | |
Federal tax cost of securities | | $ | 1,125,219,953 | |
| | | | |
Gross unrealized appreciation | | $ | 47,080 | |
Gross unrealized depreciation | | | (5,578) | |
| | | | |
Net unrealized appreciation | | $ | 41,502 | |
| | | | |
| F. | Expenses - Fees provided for under the Rule 12b-1 plan of a particular class of each Fund and which are directly attributable to that class are charged to the operations of such class. All other expenses of each respective Fund are allocated among the classes of such Fund based on relative net assets. |
| G. | Accounting Estimates -The financial statements are prepared on a basis in conformity with accounting principles generally accepted in the United States of America (“GAAP”), which requires management to make estimates and assumptions that affect the reported amounts of assets and liabilities at the date of the financial statements and the reported amounts of revenues and expenses during the reporting period including estimates and assumptions related to taxation. Actual results could differ from those estimates by a significant amount. In addition, the Fund monitors for material events or transactions that may occur or become known after theperiod-end date and before the date the financial statements are released to print. |
| H. | Indemnifications -Under the Trust’s organizational documents, each Trustee, officer, employee or other agent of the Trust is indemnified against certain liabilities that may arise out of the performance of their duties to the Fund. Additionally, in the normal course of business, the Fund enters into contracts, including the Fund’s servicing agreements, that contain a variety of indemnification clauses. The Fund’s maximum exposure under these arrangements is unknown as this would involve future claims that may be made against the Fund that have not yet occurred. The risk of material loss as a result of such indemnification claims is considered remote. |
| I. | Repurchase Agreements - In a repurchase transaction, a Fund buys a security and simultaneously sells it back to an approved institution for delivery on an agreed-upon future date. The resale price exceeds the purchase price by an amount that reflects an agreed-upon interest rate effective for the period during which the repurchase agreement is in effect. Approved institutions include U.S. commercial banks, U.S. branches of foreign banks or broker-dealers that have been designated as primary dealers in government securities. They must meet credit requirements set by the investment adviser from time to time. Repurchase agreements must be fully collateralized. However, if the seller fails to pay the repurchase price on the delivery date, a Fund may incur costs in disposing of the collateral and may experience losses if there is any delay in its ability to do so. If the default on the part of the seller is due to its bankruptcy, a Fund’s ability to liquidate the collateral may be delayed or limited. |
The following is a summary by counterparty of the market value of Borrowings and Other Financing Transactions and collateral (received) as of period end:
| | | | | | | | | | | | |
| | | Repurchase Agreement | | | | | | | |
| Counterparty | | Proceeds to be Received 1 | | | Collateral Received1 | | | Net Exposure2 | |
| |
Repurchase Agreements | | | | | | | | | | | | |
ASL Capital Markets Inc. | | | $59,012,821 | | | | $(60,193,078) | | | | $(1,180,257) | |
Cantor Fitzgerald Secured, LLC | | | 138,030,377 | | | | (142,660,842) | | | | (4,630,465) | |
Credit Agricole Corp. & Investment Bank | | | 5,002,923 | | | | (5,102,981) | | | | (100,058) | |
RBC Dominion Securities, Inc. | | | 229,647,432 | | | | (234,240,381) | | | | (4,592,949) | |
South Street Securities LLC | | | 74,016,033 | | | | (75,496,354) | | | | (1,480,321) | |
TD Securities (USA) LLC | | | 18,003,765 | | | | (18,363,841) | | | | (360,076) | |
| | | | | | | | |
| | | $523,713,351 | | | | $(536,057,477) | | | | | |
| | | | | | | | |
1. Includes accrued interest.
2.Net exposure represents the net receivable/payable that would be due from/to the counterparty in the event of default.
|
| 13 INVESCO OPPENHEIMER V.I. GOVERNMENT MONEY FUND |
NOTES TO FINANCIAL STATEMENTSUnaudited / Continued
Note 2 - Advisory Fees and Other Fees Paid to Affiliates
The Trust has entered into a master investment advisory agreement with Invesco Advisers, Inc. (the “Adviser” or “Invesco”). Under the terms of the investment advisory agreement, the Fund accrues daily and pays monthly an advisory fee to the Adviser based on the annual rate of the Fund’s average daily net assets as follows:
| | | | |
Fee Schedule* | | | | |
| |
Up to $500 million | | | 0.450% | |
Next $500 million | | | 0.425 | |
Next $500 million | | | 0.400 | |
Over $1.5 billion | | | 0.375 | |
* The advisory fee paid by the Fund shall be reduced by any amounts paid by the Fund under the administrative services agreement with the Adviser.
For the six monthsended June 30, 2019, the effective advisory fees incurred by the Fund were 0.42%.
From the beginning of the fiscal period until the date of the Reorganization, the Acquired Fund paid $2,933,619in advisory fees to OFI Global Asset Management, Inc. based on the annual rates above of the Acquired Fund’s average daily net assets.
Under the terms of a mastersub-advisory agreement between the Adviser and each of Invesco Asset Management Deutschland GmbH, Invesco Asset Management Limited, Invesco Asset Management (Japan) Limited, Invesco Hong Kong Limited, Invesco Senior Secured Management, Inc. and Invesco Canada Ltd. and separatesub-advisory agreements with Invesco Capital Management LLC, and Invesco Asset Management (India) Private Limited (collectively, the “AffiliatedSub-Advisers”) the Adviser, not the Fund, will pay 40% of the fees paid to the Adviser to any such AffiliatedSub-Adviser(s) that provide(s) discretionary investment management services to the Fund based on the percentage of assets allocated to suchSub-Adviser(s). Invesco has also entered into aSub-Advisory Agreement with OppenheimerFunds, Inc. to provide discretionary management services to the Funds.
Effective on the Reorganization Date, the Adviser has contractually agreed, through at least May 31, 2021, to waive advisory fees and/or reimburse expenses of all shares to the to the extent necessary to limit the total annual fund operating expenses after fee waiver and/or expense reimbursement (excluding certain items discussed below) ofSeries I and Series II shares to0.50% and 0.75%, respectively, of the Fund’s average daily net assets (the “expense limits”). In determining the Adviser’s obligation to waive advisory fees and/or reimburse expenses, the following expenses are not taken into account, and could cause total annual fund operating expenses after fee waivers and/or expense reimbursement to exceed the numbers reflected above: (1) interest; (2) taxes; (3) dividend expenses on short sales; (4) extraordinary ornon-routine items, including litigation expenses; and (5) expenses that the Fund has incurred but did not actually pay because of an expense offset arrangement. Unless Invesco continues the fee waiver agreement, it will terminate May 31, 2021. During its term, the fee waiver agreement cannot be terminated or amended to increase the expense limits or reduce the advisory fee waiver without approval of the Board of Trustees.
Further, the Adviser has contractually agreed, through at least June 30, 2021, to waive the advisory fee payable by the Fund in an amount equal to 100% of the net advisory fees the Adviser receives from the affiliated money market funds on investments by the Fund of uninvested cash in such affiliated money market funds.
For the six monthsended June 30, 2019, the Adviser waived advisory fees of $157,516 and reimbursed fund expenses of $322,721of Series I shares.
Prior to the Reorganization, the OFI Global Asset Management, Inc. had contractually agreed to waive fees and/or reimburse expenses ofNon-service sharesto 0.50%, of the Acquired Fund’s average daily net assets.
The Trust has entered into a master administrative services agreement with Invesco pursuant to which the Fund has agreed to pay Invesco for certain administrative costs incurred in providing accounting services to the Fund. For the six monthsended June 30, 2019, expenses incurred under the agreement are shown in the Statement of Operations as Administration fees. Additionally, Invesco has entered into service agreements whereby JPMorgan Chase Bank serves as custodian to the Fund. Prior to the Reorganization, the Acquired Fund paid administrative fees to OFI Global Asset Management, Inc.
The Trust has entered into a transfer agency and service agreement with Invesco Investment Services, Inc. (“IIS”) pursuant to which the Fund has agreed to pay IIS a fee for providing transfer agency and shareholder services to the Fund and reimburse IIS for certain expenses incurred by IIS in the course of providing such services. IIS may make payments to intermediaries that provide omnibus account services,sub-accounting services and/or networking services. All fees payable by IIS to intermediaries that provide omnibus account services orsub-accounting services are charged back to the Fund, subject to certain limitations approved by the Trust’s Board of Trustees. Prior to the Reorganization, the Acquired Fund paid transfer agent fees to OFI Global Asset Management, Inc. and Shareholder Services, Inc. For the six months ended June 30, 2019, expenses incurred under these agreements are shown in the Statement of Operations as Transfer and shareholder servicing agent fees.
Certain officers and trustees of the Trust are officers and directors of the Adviser, IIS and/or IDI.
Note 3 - Additional Valuation Information
GAAP defines fair value as the price that would be received to sell an asset or paid to transfer a liability in an orderly transaction between market participants at the measurement date, under current market conditions. GAAP establishes a hierarchy that prioritizes the inputs to valuation methods, giving the highest priority to readily available unadjusted quoted prices in an active market for identical assets (Level 1) and the lowest priority to significant unobservable inputs (Level 3), generally when market prices are not readily available or are unreliable. Based on the valuation inputs, the securities or other investments are tiered into one of three levels. Changes in valuation methods may result in transfers in or out of an investment’s
|
| 14 INVESCO OPPENHEIMER V.I. GOVERNMENT MONEY FUND |
assigned level:
Level 1 — Prices are determined using quoted prices in an active market for identical assets.
Level 2 — Prices are determined using other significant observable inputs. Observable inputs are inputs that other market participants may use in pricing a security. These may include quoted prices for similar securities, interest rates, prepayment speeds, credit risk, yield curves, loss severities, default rates, discount rates, volatilities and others.
Level 3 — Prices are determined using significant unobservable inputs. In situations where quoted prices or observable inputs are unavailable (for example, when there is little or no market activity for an investment at the end of the period), unobservable inputs may be used. Unobservable inputs reflect the Fund’s own assumptions about the factors market participants would use in determining fair value of the securities or instruments and would be based on the best available information.
As of June 30, 2019, all of the securities in this Fund were valued based on Level 2 inputs (see the Schedule of Investments for security categories). The level assigned to the securities valuations may not be an indication of the risk or liquidity associated with investing in those securities. Because of the inherent uncertainties of valuation, the values reflected in the financial statements may materially differ from the value received upon actual sale of those investments.
| | | | | | | | | | | | | | | | |
| | | | | | | | | Level 3— | | | | |
| | | Level 1— | | | Level 2— | | | Significant | | | | |
| | | Unadjusted | | | Other Significant | | | Unobservable | | | | |
| | | Quoted Prices | | | Observable Inputs | | | Inputs | | | Value | |
| |
Assets Table | | | | | | | | | | | | | | | | |
Investments, at Value: | | | | | | | | | | | | | | | | |
U.S. Government Agency | | $ | — | | | $ | 155,895,274 | | | $ | — | | | $ | 155,895,274 | |
U.S. Government Obligation | | | — | | | | 429,997,022 | | | | — | | | | 429,997,022 | |
Investment Company | | | 15,769,159 | | | | — | | | | — | | | | 15,769,159 | |
Repurchase Agreement | | | — | | | | 523,600,000 | | | | — | | | | 523,600,000 | |
| | | | |
Total Assets | | $ | 15,769,159 | | | $ | 1,109,492,296 | | | $ | — | | | $ | 1,125,261,455 | |
| | | | |
Forward currency exchange contracts and futures contracts, if any, are reported at their unrealized appreciation/depreciation at measurement date, which represents the change in the contract’s value from trade date. All additional assets and liabilities included in the above table are reported at their market value at measurement date.
Note 4 - Expense Offset Arrangement
The expense offset arrangement is comprised of custodian credits which result from periodic overnight cash balances at the custodian. For the six monthsended June 30, 2019, the Fund received credits from this arrangement, which resulted in the reduction of the Fund’s total expenses of $2,585.
Note 5 - Trustee and Officer Fees and Benefits
Certain Trustees have executed a Deferred Compensation Agreement pursuant to which they have the option to elect to defer receipt of all or a portion of the annual compensation they are entitled to receive from the Fund. For purposes of determining the amount owed to the Trustees under the plan, deferred amounts are treated as though equal dollar amounts had been invested in shares of the Fund or in other Invesco and/or Invesco Oppenheimer funds selected by the Trustees. The Fund purchases shares of the funds selected for deferral by the Trustees in amounts equal to his or her deemed investment, resulting in a Fund asset equal to the deferred compensation liability. Such assets are included as a component of “Other” within the asset section of the Statement of Assets and Liabilities. Deferral of Trustees’ fees under the plan will not affect the net assets of the Fund and will not materially affect the Fund’s assets, liabilities or net investment income per share. Amounts will be deferred until distributed in accordance with the compensation deferral plan.
Note 6 - Cash Balances
The Fund is permitted to temporarily carry a negative or overdrawn balance in its account with JP Morgan Chase Bank, the custodian bank. Such balances, if any atperiod-end, are shown in the Statement of Assets and Liabilities under the payable caption Amount due custodian. To compensate the custodian bank for such overdrafts, the overdrawn Fund may either (1) leave funds as a compensating balance in the account so the custodian bank can be compensated by earning the additional interest; or (2) compensate by paying the custodian bank at a rate agreed upon by the custodian bank and Invesco, not to exceed the contractually agreed upon rate.
Note 7 - Share Information
Transactions in shares of beneficial interest were as follows:
|
| 15 INVESCO OPPENHEIMER V.I. GOVERNMENT MONEY FUND |
NOTES TO FINANCIAL STATEMENTSUnaudited / Continued
| | | | | | | | | | | | | | | | |
| | | Six Months Ended June 30, 20191 | | | Year Ended December 31, 2018 | |
| | | Shares | | | Amount | | | Shares | | | Amount | |
Series I Shares | | | | | | | | | | | | | | | | |
Sold | | | 1,152,539,933 | | | $ | 1,152,539,933 | | | | 3,403,573,875 | | | $ | 3,403,573,875 | |
Dividends and/or distributions reinvested | | | 16,064,989 | | | | 16,064,989 | | | | 12,421,877 | | | | 12,421,877 | |
Redeemed | | | (3,133,194,825) | | | | (3,133,194,825) | | | | (785,874,330) | | | | (785,874,330) | |
| | | | |
Net increase (decrease) | | | (1,964,589,903) | | | $ | (1,964,589,903) | | | | 2,630,121,422 | | | $ | 2,630,121,422 | |
| | | | |
| | | | | | | | | | | | | | | | |
Series II Shares2 | | | | | | | | | | | | | | | | |
Sold | | | 10,000 | | | $ | 10,000 | | | | — | | | $ | — | |
Dividends and/or distributions reinvested | | | — | | | | — | | | | — | | | | — | |
Redeemed | | | — | | | | — | | | | — | | | | — | |
| | | | |
Net increase | | | 10,000 | | | $ | 10,000 | | | | — | | | $ | — | |
| | | | |
1.There are entities that are record owners of more than 5% of the outstanding shares of the Fund and own 95% of the outstanding shares of the Fund. The Fund and the Fund’s principal underwriter or adviser, are parties to participation agreements with these entities whereby these entities sell units of interest in separate accounts funding variable products that are invested in the Fund. The Fund, Invesco and/or Invesco affiliates may make payments to these entities, which are considered to be related to the Fund, for providing services to the Fund, Invesco and/or Invesco affiliates, including, but not limited to services such as securities brokerage, distribution, third party record keeping and account servicing. The Fund has no knowledge as to whether all or any portion of the shares owned of record by these entities are also owned beneficially.
2.Commencement date after the close of business on May 24, 2019.
Note 8 - Independent Registered Public Accounting Firm
The Audit Committee of the Board of Trustees appointed, and the Board of Trustees ratified and approved, PricewaterhouseCoopers LLP (“PWC”) as the independent registered public accounting firm of the Fund for the fiscal periods ending after May 24, 2019. Prior to the close of business on May 24, 2019, the Predecessor Fund was a separate series of an unaffiliated investment company and its financial statements were audited by a different independent registered public accounting firm (the “Prior Auditor”).
Effective after the close of business on May 24, 2019, the Prior Auditor resigned as the independent registered public accounting firm of the Fund. The Prior Auditor’s report on the financial statements of the Predecessor Fund for the past two fiscal years did not contain an adverse or disclaimer of opinion, and was not qualified or modified as to uncertainty, audit scope or accounting principles. During the Predecessor Fund’s two most recent fiscal years and through the close of business on May 24, 2019, there were no (1) disagreements with the Prior Auditor on any matter of accounting principles or practices, financial statement disclosure, or auditing scope or procedure, which disagreements, if not resolved to the Prior Auditor’s satisfaction, would have caused it to make reference to that matter in connection with its report; or (2) “reportable events,” as that term is defined in Item 304(a)(1)(v) of RegulationS-K under the Securities Exchange Act of 1934.
|
| 16 INVESCO OPPENHEIMER V.I. GOVERNMENT MONEY FUND |
APPROVAL OF THE INVESTMENT ADVISORY ANDSUB-ADVISORY CONTRACTSUnaudited
At meetings held on December 14, 2018, the Board of Trustees (the Board or the Trustees) of AIM Variable Insurance Funds (Invesco Variable Insurance Funds) (the Trust) as a whole, and the independent Trustees, who comprise over 75% of the Board, voting separately, approved (i) an amendment to the Trust’s Master Investment Advisory Agreement with Invesco Advisers, Inc. (Invesco Advisers and the investment advisory agreement) to add Invesco Oppenheimer V.I. Government Money Fund (the Fund), (ii) an amendment to the Master IntergroupSub-Advisory Contract for Mutual Funds with Invesco Asset Management Deutschland GmbH, Invesco Asset Management Limited, Invesco Asset Management (Japan) Limited, Invesco Hong Kong Limited, Invesco Senior Secured Management, Inc. and Invesco Canada Ltd. to add the Fund, (iii) an amendment to the separatesub-advisory contract with Invesco Capital Management LLC to add the Fund, (iv) an amendment to the separatesub-advisory contract with Invesco Asset Management (India) Private Limited to add the Fund, and (v) an initialsub-advisory contract with OppenheimerFunds, Inc. (collectively, the AffiliatedSub-Advisers and thesub-advisory contracts). Additionally, on March 26, 2019, the Boardre-approved an initialsub-advisory contract with OppenheimerFunds, Inc. following its change of control as a result of the acquisition of OppenheimerFunds, Inc. and its subsidiaries, including the Oppenheimer mutual funds (each, an Oppenheimer Fund), by Invesco Ltd. (the OFI Transaction). After evaluating the factors discussed below, among others, the Board approved the Fund’s investment advisory agreement and thesub-advisory contracts and determined that the compensation payable by the Fund to Invesco Advisers and by Invesco Advisers to the AffiliatedSub-Advisers is fair and reasonable.
The Board’s Evaluation Process
The Board noted that it had previously approved establishing the Fund at the Board meeting held on October 23, 2018 and that the Fund was formed to acquire the assets and liabilities of an Oppenheimer Fund (the Acquired Fund) with the same investment objective and substantially similar principal investment strategies and risks. At the time of approval, the Fund had no assets and no performance history and the portfolio managers were not employed by Invesco Advisers or any of the AffiliatedSub-Advisers except OppenheimerFunds, Inc., which was not affiliated with Invesco at that time.
In approving the investment advisory agreement andsub-advisory contracts, the Board followed a process similar to the process that it follows in annually reviewing and approving investment advisory agreements andsub-advisory contracts for the series portfolios of funds advised by Invesco Advisers and considered the information provided in the most recent annual review process for those funds as well as the information provided with respect to the Fund. As part of the approval process, the Board reviewed and considered information provided in response to detailed requests for information submitted to management by the independent Trustees with assistance from legal counsel to the independent Trustees. The Board reviewed comparative investment performance and fee data prepared by Invesco Advisers and an independent mutual fund data provider. The Board was assisted in its review by the Senior Officer, an officer of the Invesco Funds who reports directly to the independent Trustees, and by independent legal counsel.
The discussion below serves as a summary of the material factors and related conclusions that formed the basis for the Board’s approval of the Fund’s investment advisory agreement andsub-advisory contracts. The Trustees’ review and conclusions are based on the comprehensive consideration of all information presented to them and are not the result of any single determinative factor. Moreover, one Trustee may have weighed a particular piece of information or factor differently than another Trustee. This information is current as of December 14, 2018 and March 26, 2019 for thesub-advisory contract with OppenheimerFunds, Inc.
Factors and Conclusions and Summary of Independent Written Fee Evaluation
A. Nature, Extent and Quality of Services Provided by Invesco Advisers and the AffiliatedSub-Advisers
The Board reviewed the nature, extent and quality of the advisory services to be provided to the Fund by Invesco Advisers under the Fund’s investment advisory agreement, and the credentials and experience of the officers and employees of Invesco Advisers who will provide these services. The Board’s review included consideration of the investment process oversight and structure, credit analysis and investment risk management to be employed in providing advisory services to the Fund. The Board also considerednon-advisory services that Invesco Advisers and its affiliates provide to the Invesco Funds and will provide to the Fund, such as various back office support functions, third party oversight, internal audit, valuation, portfolio trading and legal and compliance. The Board also reviewed and considered the benefits to shareholders of investing in a fund that is part of the Invesco family of funds under the umbrella of Invesco Ltd., Invesco Advisers’ parent company, and noted Invesco Ltd.’s depth and experience in conducting an investment management business, as well as its commitment of financial and other resources to such business. The Board reviewed and considered information about the resources that Invesco Advisers intends to continue to commit to managing the Invesco family of funds, including the Fund, following the OFI Transaction. The Board concluded that the nature, extent and quality of the services to be provided to the Fund by Invesco Advisers are appropriate and satisfactory.
The Board reviewed the services that may be provided by the AffiliatedSub-Advisers under thesub-advisory contracts and the credentials and experience of the officers and employees of the AffiliatedSub-Advisers who provide these services. The Board noted the AffiliatedSub-Advisers’ expertise with respect to certain asset classes and that the AffiliatedSub-Advisers have offices and personnel that are located in financial centers around the world. As a result, the Board noted that the AffiliatedSub-Advisers can provide research and investment analysis on the markets and economies of various countries in which the Fund may invest, make recommendations regarding securities and assist with security trades. The Board concluded that thesub-advisory contracts may benefit the Fund and its shareholders by permitting Invesco Advisers to use the resources and talents of the AffiliatedSub-Advisers in managing the Fund. The Board concluded that the nature, extent and quality of the services that may be provided by the AffiliatedSub-Advisers are appropriate and satisfactory.
17 OPPENHEIMER GOVERNMENT MONEY FUND/VA
APPROVAL OF THE INVESTMENT ADVISORY ANDSUB-ADVISORY CONTRACTSUnaudited / Continued
B. Fund Investment Performance
The Board noted that the Fund would continue the historical performance information of the Acquired Fund following the consummation of the OFI Transaction. The Board considered the performance of the Acquired Fund and the fact that, at the closing of the OFI Transaction, management anticipates that the Fund will be managed pursuant to substantially similar investment strategies and by substantially the same portfolio management team as managed the Acquired Fund. The Board did not view Fund performance as a relevant factor in considering whether to approve thesub-advisory contracts for the Fund, as no AffiliatedSub-Adviser currently manages assets of the Fund.
The Board compared the Fund’s investment performance over multiple time periods ending December 31, 2017 to the performance of funds in the Morningstar performance universe. The Trustees also reviewed more recent Fund performance and this review did not change their conclusions.
C. Advisory andSub-Advisory Fees and Fund Expenses
The Board compared the Fund’s contractual management fee rate to the contractual management fee rates of funds in the Fund’s Morningstar expense group. The Board also considered comparative information regarding the Fund’s total expense ratio and its various components.
The Board noted that Invesco Advisers has contractually agreed to waive fees and/or limit expenses of the Fund for at least two years from the closing date of the OFI Transaction in an amount necessary to limit total annual operating expenses to a specified percentage of average daily net assets for each class of the Fund.
The Board also considered the fees charged by Invesco Advisers and the AffiliatedSub-Advisers to other similarly managed client accounts. The Board noted that Invesco Advisers or the AffiliatedSub-Advisers may charge lower fees to large institutional clients. Invesco Advisers reviewed with the Board differences in the scope of services it provides to the Invesco Funds relative to certain other types of client accounts, including management of cash flows as a result of redemptions and purchases, necessary infrastructure such as officers, office space, technology, legal and distribution, oversight of service providers, costs and business risks associated with launching new funds and sponsoring and maintaining the product line, preparation of annual registration statement updates and financial information and compliance with federal and state laws and regulations.
The Board also considered the services that may be provided by the AffiliatedSub-Advisers pursuant to thesub-advisory contracts, as well as the fees payable by Invesco Advisers to the AffiliatedSub-Advisers pursuant to thesub-advisory contracts.
D. Economies of Scale and Breakpoints
The Board considered the extent to which there may be economies of scale in the provision of advisory services to the Fund. The Board considered Invesco’s reinvestment in its business, including investments in business infrastructure and cybersecurity. The Board also considered that the Fund may benefit from economies of scale through contractual breakpoints in the Fund’s advisory fee schedule, which generally operate to reduce the Fund’s expense ratio as it grows in size. The Board noted that the Fund will share directly in economies of scale through lower fees charged by third party service providers based on the combined size of the Invesco Funds. The Board noted that the Fund may also benefit from economies of scale through initial fee setting, fee waivers and expense reimbursements.
E. Profitability and Financial Resources
The Board reviewed information from the 2018 contract renewal process provided by Invesco Advisers concerning the costs of the advisory and other services that Invesco Advisers and its affiliates provide to the Invesco Funds and the profitability of Invesco Advisers and its affiliates in providing these services. The Board considered the methodology used for calculating profitability and noted the periodic review of such methodology by an independent consultant. The Board noted that Invesco Advisers will continue to operate at a net profit from services Invesco Advisers and its affiliates provide to the Invesco Funds. The Board did not deem the level of profits realized by Invesco Advisers and its affiliates from providing services to the Invesco Funds, and the profits estimated to be realized by the Fund, to be excessive given the nature, extent and quality of the services provided. The Board received information from Invesco Advisers demonstrating that Invesco Advisers and the AffiliatedSub-Advisers are financially sound and have the resources necessary to perform their obligations under the investment advisory agreement andsub-advisory contracts.
F. Collateral Benefits to Invesco Advisers and its Affiliates
The Board considered various other benefits to be received by Invesco Advisers and its affiliates from the relationship with the Fund, including the fees to be received for providing administrative, transfer agency and distribution services to the Fund. The Board considered the performance of Invesco Advisers and its affiliates in providing these services to other Invesco Funds and the organizational structure employed to provide these services. The Board also considered that these services will be provided to the Fund pursuant to written contracts that are reviewed and approved on an annual basis by the Board; and that the services are required for the operation of the Fund.
|
| 18 OPPENHEIMER GOVERNMENT MONEY FUND/VA |
PORTFOLIO PROXY VOTING POLICIES AND GUIDELINES; UPDATES TO STATEMENT OF INVESTMENTSUnaudited
Go paperless with eDelivery
Visit invesco.com/edelivery to enjoy the convenience and security of anytime electronic access to your investment documents.
With eDelivery, you can elect to have any or all of the following materials delivered straight to your inbox to download, save and print from your own computer:
| ● | | Fund reports and prospectuses |
Invesco mailing information
Send general correspondence to Invesco Investment Services, Inc., P.O. Box 219078, Kansas City, MO 64121-9078.
Important notice regarding delivery of security holder documents
To reduce Fund expenses, only one copy of most shareholder documents may be mailed to shareholders with multiple accounts at the same address (Householding). Mailing of your shareholder documents may be householded indefinitely unless you instruct us otherwise. If you do not want the mailing of these documents to be combined with those for other members of your household, please contact Invesco Investment Services, Inc. at 800 959 4246 or contact your financial institution. We will begin sending you individual copies for each account within 30 days after receiving your request.
Fund holdings and proxy voting information
The Fund provides a complete list of its holdings four times in each fiscal year, at the quarter ends. For the second and fourth quarters, the lists appear in the Fund’s semiannual and annual reports to shareholders. For the first and third quarters, the Fund files the lists with the Securities and Exchange Commission (SEC) on FormN-Q (or any successor Form). The most recent list of portfolio holdings is available at invesco.com/completeqtrholdings. Shareholders can also look up the Fund’s FormsN-Q (or any successor Form) on the SEC website at sec.gov.
A description of the policies and procedures that the Fund uses to determine how to vote proxies relating to portfolio securities is available without charge, upon request, from our Client Services department at 800 959 4246 or at invesco.com/proxyguidelines. The information is also available on the SEC website, sec.gov.
Information regarding how the Fund voted proxies related to its portfolio securities during the most recent12-month period ended June 30 is available at invesco.com/proxysearch. The information is also available on the SEC website, sec.gov.
Invesco Advisers, Inc. is an investment adviser; it provides investment advisory services to individual and institutional clients and does not sell securities. Invesco Distributors, Inc. is the US distributor for Invesco Ltd.’s retail mutual funds, exchange-traded funds and institutional money market funds. Both are wholly owned, indirect subsidiaries of Invesco Ltd.
|
| 19 INVESCO OPPENHEIMER V.I. GOVERNMENT MONEY FUND |
SHAREHOLDER PROXYUnaudited
A Special Meeting (“Meeting”) of Shareholders of Invesco Oppenheimer V.I. Government Money Fund was held on April 12, 2019. The Meeting was held for the following purpose:
(1) Approval of an Agreement and Plan of Reorganization that provides for the reorganization of Oppenheimer Government Money Fund/VA Fund into Invesco Oppenheimer V.I. Government Money Fund.
The results of the voting on the above matter was as follows:
| | | | | | | | |
| Matter | | Votes For | | Votes Against | | Votes Abstain | | Broker Non-Votes |
| (1) Approval of an Agreement and Plan of Reorganization | | 2,685,035,397 | | 99,107,075 | | 353,966,884 | | 0 |
|
| 20 INVESCO OPPENHEIMER V.I. GOVERNMENT MONEY FUND |
THIS PAGE INTENTIONALLY LEFT BLANK.
THIS PAGE INTENTIONALLY LEFT BLANK.
THIS PAGE INTENTIONALLY LEFT BLANK.

| | |
 | | Semiannual Report 6/30/2019 |
| | |
| | |
| | |
| | |
| | |
| | |
| | |
| | |
| | |
| | |
| |
| | Invesco Oppenheimer |
| | V.I. International Growth Fund* |
| |
| | The Fund provides a complete list of its holdings four times in each fiscal year, at the quarter ends. For the second and fourth quarters, the lists appear in the Fund’s semi annual and annual reports to shareholders. For the first and third quarters, the Fund files the lists with the Securities and Exchange Commission (SEC) on FormN-Q (or any successor Form). The Fund’s FormN-Q (or any successor Form) filings are available on the SEC website, sec.gov. The Fund’s most recent portfolio holdings, as filed on FormN-Q (or any successor Form), have also been made available to insurance companies issuing variable annuity contracts and variable life insurance policies (“variable products”) that invest in the Fund. |
| |
| | A description of the policies and procedures that the Fund uses to determine how to vote proxies relating to portfolio securities is available without charge, upon request, from our Client Services department at 800 959 4246 or at invesco.com/proxyguidelines. The information is also available on the SEC website, sec.gov. |
| |
| | Information regarding how the Fund voted proxies related to its portfolio securities during the most recent12-month period ended June 30 is available at invesco.com/proxysearch. The information is also available on the SEC website, sec.gov. |
| |
| | Invesco Advisers, Inc. is an investment adviser; it provides investment advisory services to individual and institutional clients and does not sell securities. Invesco Distributors, Inc. is the US distributor for Invesco Ltd.’s retail mutual funds, exchange- traded funds and institutional money market funds. Both are wholly owned, indirect subsidiaries of Invesco Ltd. |
| |
| | This report must be accompanied or preceded by a currently effective Fund prospectus and variable product prospectus, which contain more complete information, including sales charges and expenses. Investors should read each carefully before investing. |
| |
| | * Prior to the close of business on May 24, 2019, the Fund’s name was Oppenheimer International Growth Fund/VA. See Important Update on the following page for more information. |
Important Update
On October 18, 2018, Massachusetts Mutual Life Insurance Company, an indirect corporate parent of OppenheimerFunds, Inc. and its subsidiaries OFI Global Asset Management, Inc., OFI SteelPath, Inc. and OFI Advisors, LLC, announced that it had entered into an agreement whereby Invesco Ltd., a global investment management company would acquire OppenheimerFunds and its subsidiaries (together, “OppenheimerFunds”). After the close of business on May 24, 2019 Invesco Ltd. completed the acquisition of OppenheimerFunds. This Fund was included in that acquisition and as of that date, became part of the Invesco family of funds. Please visit invesco.com for more information or call Invesco’s Client Services team at 800-959-4246.
PORTFOLIO MANAGERS:George R. Evans, CFA, and Robert B. Dunphy, CFA
AVERAGE ANNUAL TOTAL RETURNS FOR THE PERIODS ENDED 6/30/19
| | | | | | | | | | | | | | | | | | | | |
| | | Inception Date | | | 6-Months | | 1-Year | | 5-Year | | 10-Year |
| Series I Shares* | | | 5/13/92 | | | | 17.58 | % | | | -2.58 | % | | | 1.88 | % | | | 8.62 | % |
| Series II Shares* | | | 3/19/01 | | | | 17.46 | | | | -2.35 | | | | 1.65 | | | | 8.37 | |
| MSCI AC WorldEx-U.S. Index | | | | | | | 13.60 | | | | 1.29 | | | | 2.16 | | | | 6.54 | |
Performance quoted is past performance and cannot guarantee comparable future results; current performance may be lower or higher.Visit invesco.com for the most recentmonth-end performance. Performance figures reflect reinvested distributions and changes in net assetvalue (NAV). Investment return and principal value will vary so that you may have a gain or a loss when you sell shares. Fund returns include changes in share price, reinvested distributions and sales charges except where “without sales charge” is indicated. Effective after the close of business on May 24, 2019, theNon-Service and Service share classes of the predecessor fund were reorganized into Series I and Series II Shares, respectively, of the Fund. Returns shown for Series I and Series II shares are blended returns of the predecessor fund and the Fund. Share class returns will differ from those of the predecessor fund because of different expenses. See Fund prospectuses and summary prospectuses for more information on share classes, sales charges and new fee agreements, if any. Fund literature is available at invesco.com.
The Fund’s performance is compared to the performance of the MSCI AC Worldex-U.S. Index. The MSCI AC Worldex-U.S. Index is designed to measure the equity market performance of developed and emerging markets and excludes the U.S. The Index is unmanaged and cannot be purchased directly by investors. While index comparisons may be useful to provide a benchmark for the Fund’s performance, it must be noted that the Fund’s investments are not limited to the investments comprising the Index. Index performance includes reinvestment of income, but does not reflect transaction costs, fees, expenses or taxes. Index performance is shown for illustrative purposes only as a benchmark for the Fund’s performance, and does not predict or depict performance of the Fund. The Fund’s performance reflects the effects of the Fund’s business and operating expenses.
TOP HOLDINGS AND ALLOCATIONS
TOP TEN COMMON STOCK HOLDINGS
| | | | |
| SAP SE | | | 3.0 | % |
| Hermes International | | | 2.3 | |
| ASML Holding NV | | | 2.3 | |
| Hitachi Ltd. | | | 2.2 | |
| Infineon Technologies AG | | | 2.1 | |
| Keyence Corp. | | | 2.1 | |
| Edenred | | | 2.1 | |
| Temenos AG | | | 2.0 | |
| Grifols SA | | | 1.9 | |
| ICICI Bank Ltd., Sponsored ADR | | | 1.9 | |
Portfolio holdings and allocations are subject to change. Percentages are as of June 30, 2019, and are based on net assets.
REGIONAL ALLOCATION
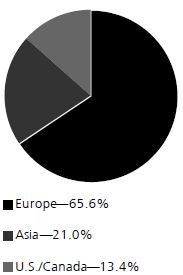
Portfolio holdings and allocations are subject to change. Percentages are as of June 30, 2019, and are based on the total market value of investments.
For more current Fund holdings, please visit invesco.com.
3 INVESCO OPPENHEIMER V.I. INTERNATIONAL GROWTH FUND
*Effective after the close of business on May 24, 2019, theNon-Service and Service share classes of the predecessor fund were reorganized into Series I and Series II Shares, respectively, of the Fund. Returns shown for Series I and Series II shares are blended returns of the predecessor fund and the Fund. Share class returns will differ from those of the predecessor fund because of different expenses.
Before investing, investors should carefully read the prospectus and/or summary prospectus and carefully consider the investment objectives, risks, charges and expenses. For this and more complete information about the fund(s), investors should ask their advisors for a prospectus/summary prospectus or visit invesco.com/fundprospectus.
Shares of Invesco funds are not deposits or obligations of any bank, are not guaranteed by any bank, are not insured by the FDIC or any other agency, and involve investment risks, including the possible loss of the principal amount invested.
4 INVESCO OPPENHEIMER V.I. INTERNATIONAL GROWTH FUND
Fund Expenses
Fund Expenses.As a shareholder of the Fund, you incur two types of costs: (1) transaction costs and (2) ongoing costs, including management fees;distribution and service fees; and other Fund expenses. These examples are intended to help you understand your ongoing costs (in dollars) of investing in the Fund and to compare these costs with the ongoing costs of investing in other mutual funds.
The examples are based on an investment of $1,000.00 invested at the beginning of the period and held for the entire6-month period ended June 30, 2019.
Actual Expenses.The first section of the table provides information about actual account values and actual expenses. You may use the information inthis section for the class of shares you hold, together with the amount you invested, to estimate the expense that you paid over the period. Simply divide your account value by $1,000.00 (for example, an $8,600.00 account value divided by $1,000.00 = 8.60), then multiply the result by the number in the first section under the heading entitled “Expenses Paid During 6 Months Ended June 30, 2019” to estimate the expenses you paid on your account during this period.
Hypothetical Example for Comparison Purposes.
The second section of the table provides information about hypothetical account values and hypothetical expenses based on the Fund’s actual expense ratio for each class of shares, and an assumed rate of return of 5% per year for each class before expenses, which is not the actual return. The hypothetical account values and expenses may not be used to estimate the actual ending account balance or expenses you paid for the period. You may use this information to compare the ongoing costs of investing in the Fund and other funds. To do so, compare this 5% hypothetical example for the class of shares you hold with the 5% hypothetical examples that appear in the shareholder reports of the other funds.
Please note that the expenses shown in the table are meant to highlight your ongoing costs only and do not reflect any charges associated with the separate accounts that offer this Fund. Therefore, the “hypothetical” lines of the table are useful in comparing ongoing costs only, and will not help you determine the relative total costs of owning different funds. In addition, if these separate account charges were included your costs would have been higher.
| | | | | | | | | | | | | | | | | | | | | | | | |
| Actual | | Beginning Account Value January 1, 2019 | | | | | | Ending Account Value June 30, 2019 | | | | | | Expenses Paid During 6 Months Ended June 30, 2019 | | | | |
| Series I shares | | $ | 1,000.00 | | | | | | | $ | 1,175.80 | | | | | | | $ | 5.41 | | | | | |
| Series II shares | | | 1,000.00 | | | | | | | | 1,174.60 | | | | | | | | 6.76 | | | | | |
| | | | | | |
| Hypothetical | | | | | | | | | | | | | | | | | | |
| (5% return before expenses) | | | | | | | | | | | | | | | | | | |
| Series I shares | | | 1,000.00 | | | | | | | | 1,019.84 | | | | | | | | 5.02 | | | | | |
| Series II shares | | | 1,000.00 | | | | | | | | 1,018.60 | | | | | | | | 6.28 | | | | | |
Expenses are equal to the Fund’s annualized expense ratio for that class, multiplied by the average account value over the period, multiplied by 181/365 (to reflect theone-half year period). Those annualized expense ratios, excluding indirect expenses from affiliated funds, based on the6-month period ended June 30, 2019 are as follows:
| | | | |
| Class | | Expense Ratios |
| Series I shares | | | 1.00 | % |
| Series II shares | | | 1.25 | |
The expense ratios reflect voluntary and/or contractual waivers and/or reimbursements of expenses by the Fund’s Manager. Some of these undertakings may be modified or terminated at any time, as indicated in the Fund’s prospectus. The “Financial Highlights” tables in the Fund’s financial statements, included in this report, also show the gross expense ratios, without such waivers or reimbursements and reduction to custodian expenses, if applicable.
5 INVESCO OPPENHEIMER V.I. INTERNATIONAL GROWTH FUND
STATEMENT OF INVESTMENTSJune 30, 2019 Unaudited
| | | | | | |
| | | Shares | | | Value |
| Common Stocks—95.5% | | | | | | |
| Consumer Discretionary—16.5% | | | | | | |
| Auto Components—3.6% | | | | | | |
| Continental AG | | | 28,449 | | | $ 4,147,681 |
| Koito Manufacturing Co. Ltd. | | | 129,900 | | | 6,952,828 |
| Valeo SA | | | 161,693 | | | 5,259,879 |
| | | | | | 16,360,388 |
| Entertainment—1.0% | | | | | | |
| Ubisoft Entertainment SA1 | | | 58,880 | | | 4,616,201 |
| Hotels, Restaurants & Leisure—1.7% | | | |
| Carnival Corp. | | | 96,338 | | | 4,484,534 |
| Whitbread plc | | | 59,846 | | | 3,520,340 |
| | | | | | 8,004,874 |
| Household Durables—1.7% | | | | | | |
| SEB SA | | | 4,120 | | | 740,797 |
| SEB SA1 | | | 850 | | | 152,835 |
| SEB SA, Prime1 | | | 39,200 | | | 7,048,362 |
| | | | | | 7,941,994 |
| Internet & Catalog Retail—1.1% | | | | | | |
| Alibaba Group Holding Ltd., Sponsored ADR1 | | | 29,334 | | | 4,970,646 |
| Media—0.0% | | | | | | |
| SES SA, Cl. A, FDR | | | 4,010 | | | 62,792 |
| Multiline Retail—1.1% | | | | | | |
| Dollarama, Inc. | | | 137,748 | | | 4,845,978 |
| Specialty Retail—1.2% | | | | | | |
| Nitori Holdings Co. Ltd. | | | 42,000 | | | 5,572,586 |
| Textiles, Apparel & Luxury Goods—5.1% | | | |
| Cie Financiere Richemont SA | | | 63,277 | | | 5,370,572 |
| Hermes International | | | 14,806 | | | 10,678,663 |
| LVMH Moet Hennessy Louis Vuitton SE | | | 17,260 | | | 7,347,434 |
| | | | | | 23,396,669 |
| Consumer Staples—10.3% | | | | | | |
| Beverages—2.7% | | | | | | |
| Heineken NV | | | 54,322 | | | 6,063,427 |
| Pernod Ricard SA | | | 33,560 | | | 6,184,317 |
| | | | | | 12,247,744 |
| Food & Staples Retailing—3.0% | | | | | | |
| Alimentation Couche-Tard, Inc., Cl. B | | | 126,820 | | | 7,980,784 |
| CP ALL PCL | | | 2,135,700 | | | 5,989,604 |
| | | | | | 13,970,388 |
| Food Products—3.8% | | | | | | |
| Barry Callebaut AG | | | 2,880 | | | 5,777,099 |
| Saputo, Inc. | | | 139,840 | | | 4,185,963 |
| WH Group Ltd.2 | | | 7,483,000 | | | 7,618,031 |
| | | | | | 17,581,093 |
| Tobacco—0.8% | | | | | | |
| Swedish Match AB | | | 85,242 | | | 3,602,687 |
| Energy—1.3% | | | | | | |
| Energy Equipment & Services—1.3% | | | |
| TechnipFMC plc | | | 223,372 | | | 5,785,309 |
| Financials—4.5% | | | | | | |
| Commercial Banks—1.9% | | | | | | |
| ICICI Bank Ltd., Sponsored ADR | | | 692,603 | | | 8,719,872 |
| Insurance—2.6% | | | | | | |
| Legal & General Group plc | | | 1,490,396 | | | 5,101,495 |
| Prudential plc | | | 311,755 | | | 6,790,236 |
| | | | | | 11,891,731 |
| Health Care—16.1% | | | | | | |
| Biotechnology—4.1% | | | | | | |
| Ascendis Pharma AS, ADR1 | | | 11,050 | | | 1,272,407 |
| CSL Ltd. | | | 48,043 | | | 7,268,180 |
| | | | | | |
| | | Shares | | | Value |
| Biotechnology (Continued) | | | | | | |
| Galapagos NV1 | | | 12,079 | | | $ 1,558,015 |
| Grifols SA | | | 298,478 | | | 8,819,582 |
| | | | | | 18,918,184 |
| Health Care Equipment & Supplies—5.1% | | | |
| Hoya Corp. | | | 111,293 | | | 8,548,749 |
| LivaNova plc1 | | | 18,990 | | | 1,366,520 |
| Medtronic plc | | | 37,060 | | | 3,609,274 |
| ResMed, Inc. | | | 30,070 | | | 3,669,442 |
| Siemens Healthineers AG2 | | | 148,845 | | | 6,280,928 |
| | | | | | 23,474,913 |
| Health Care Providers & Services—1.0% | | | |
| Fresenius Medical Care AG & Co. KGaA | | | 59,963 | | | 4,704,029 |
| Life Sciences Tools & Services—1.9% | | | | | | |
| Lonza Group AG1 | | | 25,649 | | | 8,655,889 |
| Pharmaceuticals—4.0% | | | | | | |
| Bayer AG | | | 64,077 | | | 4,450,744 |
| Novo Nordisk AS, Cl. B | | | 151,256 | | | 7,715,535 |
| Roche Holding AG | | | 21,279 | | | 5,987,193 |
| | | | | | 18,153,472 |
| Industrials—18.2% | | | | | | |
| Aerospace & Defense—1.7% | | | | | | |
| Airbus SE | | | 55,230 | | | 7,831,331 |
| Commercial Services & Supplies—3.5% | | | |
| Edenred | | | 184,187 | | | 9,396,769 |
| Prosegur Cash SA2 | | | 1,259,740 | | | 2,494,235 |
| Prosegur Cia de Seguridad SA | | | 847,849 | | | 3,986,920 |
| | | | | | 15,877,924 |
| Construction & Engineering—0.5% | | | | | | |
| Boskalis Westminster | | | 102,424 | | | 2,365,788 |
| Electrical Equipment—3.6% | | | | | | |
| Legrand SA | | | 78,690 | | | 5,766,118 |
| Melrose Industries plc | | | 1,605,327 | | | 3,694,884 |
| Nidec Corp. | | | 52,100 | | | 7,149,288 |
| | | | | | 16,610,290 |
| Machinery—6.7% | | | | | | |
| Aalberts NV | | | 114,454 | | | 4,499,715 |
| Atlas Copco AB, Cl. A | | | 213,135 | | | 6,813,207 |
| Epiroc AB, Cl. A | | | 376,549 | | | 3,920,764 |
| Kubota Corp. | | | 293,500 | | | 4,893,656 |
| VAT Group AG1,2 | | | 55,328 | | | 6,816,482 |
| Weir Group plc (The) | | | 176,276 | | | 3,462,700 |
| | | | | | 30,406,524 |
| Professional Services—0.9% | | | | | | |
| Intertek Group plc | | | 59,180 | | | 4,146,000 |
| Trading Companies & Distributors—1.3% | | | |
| Bunzl plc | | | 107,816 | | | 2,848,699 |
| Ferguson plc | | | 44,226 | | | 3,152,385 |
| | | | | | 6,001,084 |
| Information Technology—24.4% | | | | | | |
| Communications Equipment—1.9% | | | | | | |
| Nokia OYJ | | | 1,727,992 | | | 8,586,996 |
| Electronic Equipment, Instruments, & Components—4.3% |
| Hitachi Ltd. | | | 276,600 | | | 10,165,598 |
| Keyence Corp. | | | 15,712 | | | 9,655,644 |
| | | | | | 19,821,242 |
| IT Services—3.6% | | | | | | |
| Amadeus IT Group SA | | | 60,698 | | | 4,803,402 |
| Atos SE | | | 36,170 | | | 3,024,229 |
| EPAM Systems, Inc.1 | | | 33,630 | | | 5,821,353 |
| Worldline SA1,2 | | | 42,366 | | | 3,083,601 |
| | | | | | 16,732,585 |
6 INVESCO OPPENHEIMER V.I. INTERNATIONAL GROWTH FUND
| | | | | | |
| | | Shares | | | Value |
| Semiconductors & Semiconductor Equipment—6.8% |
| ams AG1 | | | 79,387 | | | $ 3,113,145 |
| ASML Holding NV | | | 49,221 | | | 10,290,495 |
| Infineon Technologies AG | | | 546,397 | | | 9,655,967 |
| STMicroelectronics NV | | | 448,930 | | | 7,965,468 |
| | | | | | 31,025,075 |
| Software—7.8% | | | | | | |
| Atlassian Corp. plc, Cl. A1 | | | 11,490 | | | 1,503,352 |
| Dassault Systemes SE | | | 30,567 | | | 4,883,562 |
| SAP SE | | | 98,984 | | | 13,606,445 |
| Temenos AG1 | | | 50,218 | | | 8,992,201 |
| Xero Ltd.1 | | | 158,827 | | | 6,679,502 |
| | | | | | 35,665,062 |
| Materials—4.2% | | | | | | |
| Chemicals—1.9% | | | | | | |
| Novozymes AS, Cl. B | | | 11,281 | | | 526,011 |
| Sika AG | | | 47,755 | | | 8,150,848 |
| | | | | | 8,676,859 |
| | | | | | |
| | | Shares | | | Value |
| Construction Materials—0.7% | | | | | | |
| James Hardie Industries plc | | | 226,220 | | | $ 2,975,829 |
| Containers & Packaging—1.6% | | | | | | |
| CCL Industries, Inc., Cl. B | | | 151,232 | | | 7,416,379 |
| Total Common Stocks (Cost $281,121,585) | | | | | | 437,616,407 |
| Preferred Stock—0.0% | | | | | | |
| Zee Entertainment Enterprises Ltd., 6% Cum.Non-Cv. (Cost $—) | | | 599,541 | | | 45,165 |
| Investment Company—3.8% | | | | | | |
| Invesco Oppenheimer Institutional Government Money Market Fund, Cl. IN, 2.37%3 (Cost $17,232,958) | | | 17,232,958 | | | 17,232,958 |
Total Investments, at Value
(Cost $298,354,543) | | | 99.3% | | | 454,894,530 |
| Net Other Assets (Liabilities) | | | 0.7 | | | 3,307,262 |
| Net Assets | | | 100.0% | | | $ 458,201,792 |
| | | | | | |
Footnotes to Statement of Investments
1.Non-income producing security.
2. Represents securities sold under Rule 144A, which are exempt from registration under the Securities Act of 1933, as amended. These securities have been determined to be liquid under guidelines established by the Board of Trustees. These securities amount to $26,293,277 or 5.74% of the Fund’s net assets at period end.
3.The money market fund and the Fund are affiliated by having the same investment adviser. The rate shown is the7-day SEC standardized yield as of June 30, 2019.
Distribution of investments representing geographic holdings, as a percentage of total investments at value, is as follows:
| | | | | | | | |
| Geographic Holdings | | Value | | | Percent | |
| France | | $ | 76,014,098 | | | | 16.7 | % |
| Switzerland | | | 57,715,753 | | | | 12.7 | |
| Japan | | | 52,938,349 | | | | 11.6 | |
| Germany | | | 42,845,794 | | | | 9.4 | |
| United States | | | 36,184,081 | | | | 8.0 | |
| United Kingdom | | | 35,349,664 | | | | 7.8 | |
| Canada | | | 24,429,104 | | | | 5.4 | |
| Netherlands | | | 23,219,425 | | | | 5.1 | |
| Spain | | | 20,104,139 | | | | 4.4 | |
| Sweden | | | 14,336,658 | | | | 3.1 | |
| Denmark | | | 9,513,953 | | | | 2.1 | |
| Australia | | | 8,771,531 | | | | 1.9 | |
| India | | | 8,765,037 | | | | 1.9 | |
| Finland | | | 8,586,996 | | | | 1.9 | |
| Hong Kong | | | 7,618,031 | | | | 1.7 | |
| New Zealand | | | 6,679,502 | | | | 1.5 | |
| Thailand | | | 5,989,604 | | | | 1.3 | |
| China | | | 4,970,646 | | | | 1.1 | |
| Jersey, Channel Islands | | | 3,152,385 | | | | 0.7 | |
| Austria | | | 3,113,145 | | | | 0.7 | |
| Ireland | | | 2,975,829 | | | | 0.7 | |
| Belgium | | | 1,558,015 | | | | 0.3 | |
| Luxembourg | | | 62,791 | | | | 0.0 | |
| Total | | $ | 454,894,530 | | | | 100.0 | % |
| | | | | | | | |
See accompanying Notes to Financial Statements.
7 INVESCO OPPENHEIMER V.I. INTERNATIONAL GROWTH FUND
STATEMENT OF ASSETS AND LIABILITIESJune 30, 2019 Unaudited
| | | | |
| | |
| Assets | | | | |
| Investments, at value—see accompanying statement of investments: | | | | |
| Unaffiliated companies (cost $281,121,585) | | $ | 437,661,572 | |
| |
| Affiliated companies (cost $17,232,958) | | | 17,232,958 | |
| |
| | | | 454,894,530 | |
| |
| Cash | | | 499,593 | |
| |
| Cash—foreign currencies (cost $277) | | | 27 | |
| Receivables and other assets: | | | | |
| Dividends | | | 1,897,731 | |
| Investments sold | | | 1,736,088 | |
| Shares of beneficial interest sold | | | 130,178 | |
| |
| Other | | | 57,101 | |
| Total assets | | | 459,215,248 | |
| | |
| Liabilities | | | | |
| Payables and other liabilities: | | | | |
| Foreign capital gains tax | | | 444,980 | |
| Shares of beneficial interest redeemed | | | 323,209 | |
| Administration fee | | | 61,648 | |
| Distribution and service plan fees | | | 50,621 | |
| Trustees’ compensation | | | 45,084 | |
| Management fee | | | 35,563 | |
| Shareholder communications | | | 12,408 | |
| Transfer and shareholder servicing agent fees | | | 7,945 | |
| |
| Other | | | 31,998 | |
| Total liabilities | | | 1,013,456 | |
| | |
| Net Assets | | $ | 458,201,792 | |
| | | | |
| | | |
| | |
| Composition of Net Assets | | | | |
| |
| Shares of beneficial interest | | $ | 294,527,406 | |
| |
| Total distributable earnings | | | 163,674,386 | |
| Net Assets | | $ | 458,201,792 | |
| | | | |
| | | | |
| | |
| Net Asset Value Per Share | | | | |
| Series I Shares: | | | | |
| |
| Net asset value, redemption price per share and offering price per share (based on net assets of $224,264,112 and 99,956,610 shares of beneficial interest outstanding) | | | $2.24 | |
| Series II Shares: | | | | |
| Net asset value, redemption price per share and offering price per share (based on net assets of $233,937,680 and 99,604,579 shares of beneficial interest outstanding) | | | $2.35 | |
See accompanying Notes to Financial Statements.
8 INVESCO OPPENHEIMER V.I. INTERNATIONAL GROWTH FUND
STATEMENT OF OPERATIONSFor the Six Months EndedJune 30, 2019 Unaudited
| | | | |
| | |
| Investment Income | | | | |
| Dividends: | | | | |
| Unaffiliated companies (net of foreign withholding taxes of $762,413) | | $ | 6,454,388 | |
| |
| Affiliated companies | | | 193,513 | |
| Total investment income | | | 6,647,901 | |
| | | | |
| | |
| Expenses | | | | |
| |
| Management fees | | | 2,264,370 | |
| |
| Administration fees | | | 66,736 | |
| |
| Distribution and service plan fees – Series II shares | | | 274,335 | |
| Transfer and shareholder servicing agent fees: | | | | |
| Series I shares | | | 132,359 | |
| |
| Series II shares | | | 108,336 | |
| Shareholder communications: | | | | |
| Series I shares | | | 5,514 | |
| |
| Series II shares | | | 4,801 | |
| |
| Custodian fees and expenses | | | 25,457 | |
| |
| Trustees’ compensation | | | 9,203 | |
| |
| Borrowing fees | | | 6,284 | |
| |
| Other | | | 30,420 | |
| Total expenses | | | 2,927,815 | |
| Less reduction to custodian expenses | | | (3,799 | ) |
| |
| Less waivers and reimbursements of expenses | | | (261,063 | ) |
| Net expenses | | | 2,662,953 | |
| | | | |
| | |
| Net Investment Income | | | 3,984,948 | |
| | |
| Realized and Unrealized Gain (Loss) | | | | |
| Net realized gain (loss) on: | | | | |
| Investment transactions (net of foreign capital gains tax of $42,231) (includes net gains from securities sold to affiliates of $99,172) | | | 9,451,444 | |
| |
| Foreign currency transactions | | | (36,574 | ) |
| |
| Net realized gain | | | 9,414,870 | |
| Net change in unrealized appreciation/(depreciation) on: | | | | |
| Investment transactions (net of foreign capital gains tax of $200,198) | | | 66,388,559 | |
| |
| Translation of assets and liabilities denominated in foreign currencies | | | 1,989 | |
| Net change in unrealized appreciation/(depreciation) | | | 66,390,548 | |
| | | | |
| | |
| Net Increase in Net Assets Resulting from Operations | | $ | 79,790,366 | |
| | | | |
See accompanying Notes to Financial Statements.
9 INVESCO OPPENHEIMER V.I. INTERNATIONAL GROWTH FUND
STATEMENTS OF CHANGES IN NET ASSETS
| | | | | | | | |
| | | Six Months Ended
June 30, 2019
(Unaudited) | | | Year Ended
December 31, 2018 | |
| | | |
| Operations | | | | | | | | |
| | |
| Net investment income | | $ | 3,984,948 | | | $ | 4,028,652 | |
| | |
| Net realized gain | | | 9,414,870 | | | | 25,026,292 | |
| Net change in unrealized appreciation/(depreciation) | | | 66,390,548 | | | | (139,763,917 | ) |
| | | | |
| Net increase (decrease) in net assets resulting from operations | | | 79,790,366 | | | | (110,708,973 | ) |
| | | |
| Dividends and/or Distributions to Shareholders | | | | | | | | |
| Distributions to shareholders from distributable earnings: | | | | | | | | |
| Series I shares | | | (13,472,374 | ) | | | (9,134,490 | ) |
| Series II shares | | | (12,709,522 | ) | | | (5,690,284 | ) |
| | | | |
| Total distributions from distributable earnings | | | (26,181,896 | ) | | | (14,824,774 | ) |
| | | |
| Beneficial Interest Transactions | | | | | | | | |
| Net increase (decrease) in net assets resulting from beneficial interest transactions: | | | | | | | | |
| Series I shares | | | (74,408,840 | ) | | | (20,815,884 | ) |
| Series II shares | | | 12,146,263 | | | | 13,746,754 | |
| | | | |
| Total beneficial interest transactions | | | (62,262,577 | ) | | | (7,069,130 | ) |
| | | |
| Net Assets | | | | | | | | |
| | |
| Total decrease | | | (8,654,107 | ) | | | (132,602,877 | ) |
| Beginning of period | | | 466,855,899 | | | | 599,458,776 | |
| | | | |
| End of period | | $ | 458,201,792 | | | $ | 466,855,899 | |
| | | | |
See accompanying Notes to Financial Statements.
10 INVESCO OPPENHEIMER V.I. INTERNATIONAL GROWTH FUND
FINANCIAL HIGHLIGHTS
| | | | | | | | | | | | | | | | | | | | | | | | |
| Series I Shares | | Six Months Ended June 30, 2019 (Unaudited) | | | Year Ended December 31, 2018 | | | Year Ended December 31, 2017 | | | Year Ended December 31, 2016 | | | Year Ended December 31, 2015 | | | Year Ended December 31, 2014 | |
| | | | | | | |
| Per Share Operating Data | | | | | | | | | | | | | | | | | | | | | | | | |
| | | | | | |
| Net asset value, beginning of period | | | $2.03 | | | | $2.59 | | | | $2.08 | | | | $2.20 | | | | $2.31 | | | | $2.57 | |
| Income (loss) from investment operations: | | | | | | | | | | | | | | | | | | | | | | | | |
| Net investment income1 | | | 0.02 | | | | 0.02 | | | | 0.02 | | | | 0.03 | | | | 0.03 | | | | 0.03 | |
| Net realized and unrealized gain (loss) | | | 0.33 | | | | (0.51) | | | | 0.52 | | | | (0.08) | | | | 0.06 | | | | (0.21) | |
| | | | | | |
| Total from investment operations | | | 0.35 | | | | (0.49) | | | | 0.54 | | | | (0.05) | | | | 0.09 | | | | (0.18) | |
| Dividends and/or distributions to shareholders: | | | | | | | | | | | | | | | | | | | | | | | | |
| Dividends from net investment income | | | (0.02) | | | | (0.02) | | | | (0.03) | | | | (0.02) | | | | (0.03) | | | | (0.03) | |
| Distributions from net realized gain | | | (0.12) | | | | (0.05) | | | | 0.00 | | | | (0.05) | | | | (0.17) | | | | (0.05) | |
| | | | | | |
| Total dividends and/or distributions to shareholders | | | (0.14) | | | | (0.07) | | | | (0.03) | | | | (0.07) | | | | (0.20) | | | | (0.08) | |
| Net asset value, end of period | | | $2.24 | | | | $2.03 | | | | $2.59 | | | | $2.08 | | | | $2.20 | | | | $2.31 | |
| | | | |
| | | | | | | | | | | | | | | | | | | | | | | | |
| | | | | | | |
| Total Return, at Net Asset Value2 | | | 17.58% | | | | (19.42)% | | | | 26.29% | | | | (2.12)% | | | | 3.43% | | | | (7.22)% | |
| | | | | | | | | | | | | | | | | | | | | | | | |
| | | | | | | |
| Ratios/Supplemental Data | | | | | | | | | | | | | | | | | | | | | | | | |
| | | | | | |
| Net assets, end of period (in thousands) | | | $224,264 | | | | $267,220 | | | | $360,417 | | | | $301,559 | | | | $317,547 | | | | $358,756 | |
| | | | | | |
| Average net assets (in thousands) | | | $259,051 | | | | $325,080 | | | | $339,999 | | | | $305,269 | | | | $343,347 | | | | $400,556 | |
| Ratios to average net assets:3 | | | | | | | | | | | | | | | | | | | | | | | | |
| Net investment income | | | 1.78% | | | | 0.83% | | | | 0.87% | | | | 1.24% | | | | 1.08% | | | | 1.13% | |
| Expenses excluding specific expenses listed below | | | 1.12% | | | | 1.10% | | | | 1.08% | | | | 1.09% | | | | 1.08% | | | | 1.07% | |
| Interest and fees from borrowings | | | 0.00%4 | | | | 0.00%4 | | | | 0.00%4 | | | | 0.00%4 | | | | 0.00%4 | | | | 0.00% | |
| Total expenses5 | | | 1.12% | | | | 1.10% | | | | 1.08% | | | | 1.09% | | | | 1.08% | | | | 1.07% | |
| | | | | | |
| Expenses after payments, waivers and/or reimbursements and reduction to custodian expenses | | | 1.00% | | | | 1.00% | | | | 1.00% | | | | 1.00% | | | | 1.00% | | | | 1.00% | |
| Portfolio turnover rate | | | 17% | | | | 25% | | | | 27% | | | | 15% | | | | 24% | | | | 41% | |
1.Per share amounts calculated based on the average shares outstanding during the period.
2. Assumes an initial investment on the business day before the first day of the fiscal period, with all dividends and distributions reinvested in additional shares on the reinvestment date, and redemption at the net asset value calculated on the last business day of the fiscal period. Total returns are not annualized for periods less than one full year. Total return information does not reflect expenses that apply at the separate account level or to related insurance products. Inclusion of these charges would reduce the total return figures for all periods shown. Returns do not reflect the deduction of taxes that a shareholder would pay on fund distributions or the redemption of fund shares.
3.Annualized for periods less than one full year.
4.Less than 0.005%.
5.Total expenses including indirect expenses from affiliated fund fees and expenses were as follows:
| | | | | | |
| | Six Months Ended June 30, 2019 | | | 1.12 | % |
| | Year Ended December 31, 2018 | | | 1.10 | % |
| | | Year Ended December 31, 2017 | | | 1.08 | % |
| | Year Ended December 31, 2016 | | | 1.09 | % |
| | Year Ended December 31, 2015 | | | 1.08 | % |
| | Year Ended December 31, 2014 | | | 1.07 | % |
See accompanying Notes to Financial Statements.
11 INVESCO OPPENHEIMER V.I. INTERNATIONAL GROWTH FUND
FINANCIAL HIGHLIGHTSContinued
| | | | | | | | | | | | | | | | | | | | | | | | |
| Series II Shares | | Six Months Ended June 30, 2019
(Unaudited) | | | Year Ended December 31, 2018 | | | Year Ended December 31, 2017 | | | Year Ended December 31, 2016 | | | Year Ended December 31, 2015 | | | Year Ended December 31, 2014 | |
| | | | | | | |
| Per Share Operating Data | | | | | | | | | | | | | | | | | | | | | | | | |
| | | | | | |
| Net asset value, beginning of period | | | $2.12 | | | | $2.70 | | | | $2.16 | | | | $2.29 | | | | $2.40 | | | | $2.66 | |
| Income (loss) from investment operations: | | | | | | | | | | | | | | | | | | | | | | | | |
| Net investment income1 | | | 0.02 | | | | 0.01 | | | | 0.01 | | | | 0.02 | | | | 0.02 | | | | 0.02 | |
| Net realized and unrealized gain (loss) | | | 0.35 | | | | (0.52) | | | | 0.56 | | | | (0.08) | | | | 0.06 | | | | (0.21) | |
| | | | | | |
| Total from investment operations | | | 0.37 | | | | (0.51) | | | | 0.57 | | | | (0.06) | | | | 0.08 | | | | (0.19) | |
| Dividends and/or distributions to shareholders: | | | | | | | | | | | | | | | | | | | | | | | | |
| Dividends from net investment income | | | (0.02) | | | | (0.02) | | | | (0.03) | | | | (0.02) | | | | (0.02) | | | | (0.02) | |
| Distributions from net realized gain | | | (0.12) | | | | (0.05) | | | | 0.00 | | | | (0.05) | | | | (0.17) | | | | (0.05) | |
| | | | | | |
| Total dividends and/or distributions to shareholders | | | (0.14) | | | | (0.07) | | | | (0.03) | | | | (0.07) | | | | (0.19) | | | | (0.07) | |
| Net asset value, end of period | | | $2.35 | | | | $2.12 | | | | $2.70 | | | | $2.16 | | | | $2.29 | | | | $2.40 | |
| | | | |
| | | | | | | | | | | | | | | | | | | | | | | | |
| | | | | | | |
| Total Return, at Net Asset Value2 | | | 17.46% | | | | (19.55)% | | | | 26.44% | | | | (2.72)% | | | | 3.11% | | | | (7.15)% | |
| | | | | | | | | | | | | | | | | | | | | | | | |
| | | | | | | |
| Ratios/Supplemental Data | | | | | | | | | | | | | | | | | | | | | | | | |
| | | | | | |
| Net assets, end of period (in thousands) | | | $233,938 | | | | $199,636 | | | | $239,042 | | | | $175,633 | | | | $169,292 | | | | $145,515 | |
| | | | | | |
| Average net assets (in thousands) | | | $221,470 | | | | $231,130 | | | | $213,440 | | | | $174,834 | | | | $165,226 | | | | $128,694 | |
| Ratios to average net assets:3 | | | | | | | | | | | | | | | | | | | | | | | | |
| Net investment income | | | 1.55% | | | | 0.58% | | | | 0.60% | | | | 0.99% | | | | 0.79% | | | | 0.85% | |
| Expenses excluding specific expenses listed below | | | 1.36% | | | | 1.35% | | | | 1.33% | | | | 1.34% | | | | 1.33% | | | | 1.32% | |
| Interest and fees from borrowings | | | 0.00%4 | | | | 0.00%4 | | | | 0.00%4 | | | | 0.00%4 | | | | 0.00%4 | | | | 0.00% | |
| Total expenses5 | | | 1.36% | | | | 1.35% | | | | 1.33% | | | | 1.34% | | | | 1.33% | | | | 1.32% | |
| | | | | | |
| Expenses after payments, waivers and/or reimbursements and reduction to custodian expenses | | | 1.25% | | | | 1.25% | | | | 1.25% | | | | 1.25% | | | | 1.25% | | | | 1.25% | |
| Portfolio turnover rate | | | 17% | | | | 25% | | | | 27% | | | | 15% | | | | 24% | | | | 41% | |
1.Per share amounts calculated based on the average shares outstanding during the period.
2. Assumes an initial investment on the business day before the first day of the fiscal period, with all dividends and distributions reinvested in additional shares on the reinvestment date, and redemption at the net asset value calculated on the last business day of the fiscal period. Total returns are not annualized for periods less than one full year. Total return information does not reflect expenses that apply at the separate account level or to related insurance products. Inclusion of these charges would reduce the total return figures for all periods shown. Returns do not reflect the deduction of taxes that a shareholder would pay on fund distributions or the redemption of fund shares.
3.Annualized for periods less than one full year.
4.Less than 0.005%.
5.Total expenses including indirect expenses from affiliated fund fees and expenses were as follows:
| | | | | | |
| | Six Months Ended June 30, 2019 | | | 1.36 | % |
| | Year Ended December 31, 2018 | | | 1.35 | % |
| | | Year Ended December 31, 2017 | | | 1.33 | % |
| | Year Ended December 31, 2016 | | | 1.34 | % |
| | Year Ended December 31, 2015 | | | 1.33 | % |
| | Year Ended December 31, 2014 | | | 1.32 | % |
See accompanying Notes to Financial Statements.
12 INVESCO OPPENHEIMER V.I. INTERNATIONAL GROWTH FUND
NOTES TO FINANCIAL STATEMENTSJune 30, 2019 Unaudited
Note 1 - Significant Accounting Policies
Invesco Oppenheimer V.I. International Growth Fund (the “Fund”) is a series portfolio of AIM Variable Insurance Funds (Invesco Variable Insurance Funds) (the “Trust”). The Trust is a Delaware statutory trust registered under the Investment Company Act of 1940, as amended (the “1940 Act”), as anopen-end series management investment company authorized to issue an unlimited number of shares of beneficial interest. Information presented in these financial statements pertains only to the Fund. Matters affecting the Fund or each class will be voted on exclusively by the shareholders of such Fund or each class.
Prior to the close of business on May 24, 2019, the Fund operated as Oppenheimer International Growth Fund/VA (the “Acquired Fund” “Predecessor Fund”). The Acquired Fund was reorganized after the close of business on May 24, 2019 (the “Reorganization Date”) through the transfer of all of its assets and liabilities to the Fund (the “Reorganization”).
Upon closing of the Reorganization, holders of the Acquired Fund’sNon-Service and Service shares received Series I and Series II shares of the Fund, respectively. Information for the Acquired Fund’sNon-Service and Service shares prior to the Reorganization is included with Series I and Series II, respectively, throughout this report.
The Fund’s investment objective is to seek capital appreciation.
The Fund currently offers two classes of shares, Series I and Series II, both of which are offered to insurance company separate accounts funding variable annuity contracts and variable life insurance policies (“variable products”).
The Fund is an investment company and accordingly follows the investment company accounting and reporting guidance in accordance with Financial Accounting Standards Board Accounting Standards Codification Topic 946, Financial Services – Investment Companies.
The following is a summary of the significant accounting policies followed by the Fund in the preparation of its financial statements.
| A. | | Security Valuations -Securities, including restricted securities, are valued according to the following policy. |
A security listed or traded on an exchange (except convertible securities) is valued at its last sales price or official closing price as of the close of the customary trading session on the exchange where the security is principally traded, or lacking any sales or official closing price on a particular day, the security may be valued at the closing bid price on that day. Securities traded in theover-the-counter market are valued based on prices furnished by independent pricing services or market makers. When such securities are valued by an independent pricing service they may be considered fair valued. Futures contracts are valued at the final settlement price set by an exchange on which they are principally traded. Listed options are valued at the mean between the last bid and asked prices from the exchange on which they are principally traded. Options not listed on an exchange are valued by an independent source at the mean between the last bid and asked prices. For purposes of determining net asset value (“NAV”) per share, futures and option contracts generally are valued 15 minutes after the close of the customary trading session of the New York Stock Exchange (“NYSE”).
Investments inopen-end andclosed-end registered investment companies that do not trade on an exchange are valued at theend-of-day net asset value per share. Investments inopen-end andclosed-end registered investment companies that trade on an exchange are valued at the last sales price or official closing price as of the close of the customary trading session on the exchange where the security is principally traded.
Debt obligations (including convertible securities) and unlisted equities are fair valued using an evaluated quote provided by an independent pricing service. Evaluated quotes provided by the pricing service may be determined without exclusive reliance on quoted prices, and may reflect appropriate factors such asinstitution-size trading in similar groups of securities, developments related to specific securities, dividend rate (for unlisted equities), yield (for debt obligations), quality, type of issue, coupon rate (for debt obligations), maturity (for debt obligations), individual trading characteristics and other market data. Pricing services generally value debt obligations assuming orderly transactions of institutional round lot size, but a fund may hold or transact in the same securities in smaller, odd lot sizes. Odd lots often trade at lower prices than institutional round lots. Debt obligations are subject to interest rate and credit risks. In addition, all debt obligations involve some risk of default with respect to interest and/or principal payments.
Foreign securities’ (including foreign exchange contracts) prices are converted into U.S. dollar amounts using the applicable exchange rates as of the close of the NYSE. If market quotations are available and reliable for foreign exchange-traded equity securities, the securities will be valued at the market quotations. Because trading hours for certain foreign securities end before the close of the NYSE, closing market quotations may become unreliable. If between the time trading ends on a particular security and the close of the customary trading session on the NYSE, events occur that the investment adviser determines are significant and make the closing price unreliable, the Fund may fair value the security. If the event is likely to have affected the closing price of the security, the security will be valued at fair value in good faith using procedures approved by the Board of Trustees. Adjustments to closing prices to reflect fair value may also be based on a screening process of an independent pricing service to indicate the degree of certainty, based on historical data, that the closing price in the principal market where a foreign security trades is not the current value as of the close of the NYSE. Foreign securities’ prices meeting the approved degree of certainty that the price is not reflective of current value will be priced at the indication of fair value from the independent pricing service. Multiple factors may be considered by the independent pricing service in determining adjustments to reflect fair value and may include information relating to sector indices, American Depositary Receipts and domestic and foreign index futures. Foreign securities may have additional risks including exchange rate changes, potential for sharply devalued currencies and high inflation, political and economic upheaval, the relative lack of issuer information, relatively low market liquidity and the potential lack of strict financial and accounting controls and standards.
Securities for which market prices are not provided by any of the above methods may be valued based upon quotes furnished by independent sources. The last bid price may be used to value equity securities. The mean between the last bid and asked prices is used to value debt obligations, including corporate loans.
Securities for which market quotations are not readily available or became unreliable are valued at fair value as determined in good faith by or under the supervision of the Trust’s officers following procedures approved by the Board of Trustees. Issuer specific events, market trends, bid/asked quotes of brokers and information providers and other market data may be reviewed in the course of making a good faith determination of a
13 INVESCO OPPENHEIMER V.I. INTERNATIONAL GROWTH FUND
NOTES TO FINANCIAL STATEMENTSUnaudited / Continued
Note 1 - Significant Accounting Policies (continued)
security’s fair value.
The Fund may invest in securities that are subject to interest rate risk, meaning the risk that the prices will generally fall as interest rates rise and, conversely, the prices will generally rise as interest rates fall. Specific securities differ in their sensitivity to changes in interest rates depending on their individual characteristics. Changes in interest rates may result in increased market volatility, which may affect the value and/or liquidity of certain Fund investments.
Valuations change in response to many factors including the historical and prospective earnings of the issuer, the value of the issuer’s assets, general economic conditions, interest rates, investor perceptions and market liquidity. Because of the inherent uncertainties of valuation, the values reflected in the financial statements may materially differ from the value received upon actual sale of those investments.
| B. | | Securities Transactions and Investment Income -Securities transactions are accounted for on a trade date basis. Realized gains or losses onsales are computed on the basis of specific identification of the securities sold. Interest income (net of withholding tax, if any) is recorded on the accrual basis from settlement date. Dividend income (net of withholding tax, if any) is recorded on theex-dividend date. |
The Fund may periodically participate in litigation related to Fund investments. As such, the Fund may receive proceeds from litigation settlements. Any proceeds received are included in the Statement of Operations as realized gain (loss) for investments no longer held and as unrealized gain (loss) for investments still held.
Brokerage commissions and mark ups are considered transaction costs and are recorded as an increase to the cost basis of securities purchased and/or a reduction of proceeds on a sale of securities. Such transaction costs are included in the determination of net realized and unrealized gain (loss) from investment securities reported in the Statement of Operations and the Statement of Changes in Net Assets and the net realized and unrealized gains (losses) on securities per share in the Financial Highlights. Transaction costs are included in the calculation of the Fund’s net asset value and, accordingly, they reduce the Fund’s total returns. These transaction costs are not considered operating expenses and are not reflected in net investment income reported in the Statement of Operations and the Statement of Changes in Net Assets, or the net investment income per share and the ratios of expenses and net investment income reported in the Financial Highlights, nor are they limited by any expense limitation arrangements between the Fund and the investment adviser.
The Fund allocates income and realized and unrealized capital gains and losses to a class based on the relative net assets of each class.
| C. | | Country Determination- For the purposes of making investment selection decisions and presentation in the Schedule of Investments, theinvestment adviser may determine the country in which an issuer is located and/or credit risk exposure based on various factors. These factors include the laws of the country under which the issuer is organized, where the issuer maintains a principal office, the country in which the issuer derives 50% or more of its total revenues and the country that has the primary market for the issuer’s securities, as well as other criteria. Among the other criteria that may be evaluated for making this determination are the country in which the issuer maintains 50% or more of its assets, the type of security, financial guarantees and enhancements, the nature of the collateral and the sponsor organization. Country of issuer and/or credit risk exposure has been determined to be the United States of America, unless otherwise noted. |
| D. | | Distributions -Dividends and distributions to shareholders, which are determined in accordance with income tax regulations and may differ fromU.S. GAAP, are recorded on theex-dividend date. Income and capital gain distributions, if any, are declared and paid annually or at other times as determined necessary by the Adviser. |
The tax character of distributions is determined as of the Fund’s fiscal year end. Therefore, a portion of the Fund’s distributions made to shareholders prior to the Fund’s fiscal year end may ultimately be categorized as a tax return of capital.
| E. | | Federal Income Taxes -The Fund intends to comply with provisions of the Internal Revenue Code applicable to regulated investment companiesand to distribute substantially all of its investment company taxable income to shareholders. Therefore, no federal income or excise tax provision is required. The Fund files income tax returns in U.S. federal and applicable state jurisdictions. The statute of limitations on the Fund’s tax return filings generally remains open for the three preceding fiscal reporting period ends. The Fund has analyzed its tax positions for the fiscal year ended December 31, 2018, including open tax years, and does not believe there are any uncertain tax positions requiring recognition in the Fund’s financial statements. |
During the fiscal year ended December 31, 2018, the Fund did not utilize any capital loss carryforwards to offset capital gains realized in that fiscal year. Capital loss carryforwards with no expiration, if any, must be utilized prior to those with expiration dates. Capital losses with no expiration will be carried forward to future years if not offset by gains.
At period end, it is estimated that the capital loss carryforwards would be zero. The estimated capital loss carryforward represents the carryforward as of the end of the last fiscal year, increased or decreased by capital losses or gains realized in the first six months of the current fiscal year. During the reporting period, it is estimated that the Fund will not utilize any capital loss carryforward to offset realized capital gains.
Net investment income (loss) and net realized gain (loss) may differ for financial statement and tax purposes. The character of dividends and distributions made during the fiscal year from net investment income or net realized gains are determined in accordance with federal income tax requirements, which may differ from the character of net investment income or net realized gains presented in those financial statements in accordance with U.S. GAAP. Also, due to timing of dividends and distributions, the fiscal year in which amounts are distributed may differ from the fiscal year in which the income or net realized gain was recorded by the Fund.
The aggregate cost of securities and other investments and the composition of unrealized appreciation and depreciation of securities and other investments for federal income tax purposes at period end are noted in the following table. The primary difference between book and tax appreciation or depreciation of securities and other investments, if applicable, is attributable to the tax deferral of losses or tax realization of financial statement unrealized gain or loss.
14 INVESCO OPPENHEIMER V.I. INTERNATIONAL GROWTH FUND
Note 1 - Significant Accounting Policies (continued)
| | | | |
| Federal tax cost of securities | | $ | 303,738,725 | |
| Federal tax cost of other investments | | | 277 | |
| | | | |
| Total federal tax cost | | $ | 303,739,002 | |
| | | | |
| Gross unrealized appreciation | | $ | 174,840,892 | |
| Gross unrealized depreciation | | | (24,150,473 | ) |
| | | | |
| Net unrealized appreciation | | $ | 150,690,419 | |
| | | | |
Certain foreign countries impose a tax on capital gains which is accrued by the Fund based on unrealized appreciation, if any, on affected securities. The tax is paid when the gain is realized.
| F. | | Expenses -Fees provided for under the Rule12b-1 plan of a particular class of the Fund are charged to the operations of such class. Transfer agencyfees and expenses and other shareholder recordkeeping fees and expenses attributable are allocated to each share class based on relative net assets. Transfer agency fees and expenses and other shareholder recordkeeping fees and expenses relating to all other classes are allocated among those classes based on relative net assets. All other expenses are allocated among the classes based on relative net assets. |
| G. | | Accounting Estimates -The financial statements are prepared on a basis in conformity with accounting principles generally accepted in theUnited States of America (“GAAP”), which requires management to make estimates and assumptions that affect the reported amounts of assets and liabilities at the date of the financial statements and the reported amounts of revenues and expenses during the reporting period including estimates and assumptions related to taxation. Actual results could differ from those estimates by a significant amount. In addition, the Fund monitors for material events or transactions that may occur or become known after theperiod-end date and before the date the financial statements are released to print. |
| H. | | Indemnifications -Under the Trust’s organizational documents, each Trustee, officer, employee or other agent of the Trust is indemnified againstcertain liabilities that may arise out of the performance of their duties to the Fund. Additionally, in the normal course of business, the Fund enters into contracts, including the Fund’s servicing agreements, that contain a variety of indemnification clauses. The Fund’s maximum exposure under these arrangements is unknown as this would involve future claims that may be made against the Fund that have not yet occurred. The risk of material loss as a result of such indemnification claims is considered remote. |
| I. | | Foreign Currency Translations -Foreign currency is valued at the close of the NYSE based on quotations posted by banks and major currencydealers. Portfolio securities and other assets and liabilities denominated in foreign currencies are translated into U.S. dollar amounts at the date of valuation. Purchases and sales of portfolio securities (net of foreign taxes withheld on disposition) and income items denominated in foreign currencies are translated into U.S. dollar amounts on the respective dates of such transactions. The Fund does not separately account for the portion of the results of operations resulting from changes in foreign exchange rates on investments and the fluctuations arising from changes in market prices of securities held. The combined results of changes in foreign exchange rates and the fluctuation of market prices on investments (net of estimated foreign tax withholding) are included with the net realized and unrealized gain or loss from investments in the Statement of Operations. Reported net realized foreign currency gains or losses arise from (1) sales of foreign currencies, (2) currency gains or losses realized between the trade and settlement dates on securities transactions, and (3) the difference between the amounts of dividends, interest, and foreign withholding taxes recorded on the Fund’s books and the U.S. dollar equivalent of the amounts actually received or paid. Net unrealized foreign currency gains and losses arise from changes in the fair values of assets and liabilities, other than investments in securities at fiscal period end, resulting from changes in exchange rates. The Fund may invest in foreign securities, which may be subject to foreign taxes on income, gains on investments or currency repatriation, a portion of which may be recoverable. Foreign taxes, if any, are recorded based on the tax regulations and rates that exist in the foreign markets in which the Fund invests and are shown in the Statement of Operations. |
Note 2 - Advisory Fees and Other Fees Paid to Affiliates
The Trust has entered into a master investment advisory agreement with Invesco Advisers, Inc. (the “Adviser” or “Invesco”). Under the terms of the investment advisory agreement, the Fund accrues daily and pays monthly an advisory fee to the Adviser based on the annual rate of the Fund’s average daily net assets as follows:
| | |
| Fee Schedule* | | |
| Up to $250 million | | 1.00% |
| Next $250 million | | 0.90 |
| Next $500 million | | 0.85 |
| Over $1 billion | | 0.82 |
* The advisory fee paid by the Fund shall be reduced by any amounts paid by the Fund under the administrative services agreement with the Adviser.
For the six months ended June 30, 2019, the effective advisory fees incurred by the Fund was 0.95%.
From the beginning of the fiscal period until the date of the Reorganization, the Acquired Fund paid $1,842,903 in advisory fees to OFI Global Asset Management, Inc. based on the annual rates above of the Acquired Fund’s average daily net assets.
Under the terms of a mastersub-advisory agreement between the Adviser and each of Invesco Asset Management Deutschland GmbH, Invesco Asset Management Limited, Invesco Asset Management (Japan) Limited, Invesco Hong Kong Limited, Invesco Senior Secured Management, Inc. and Invesco Canada Ltd. and separatesub-advisory agreements with Invesco Capital Management LLC, and Invesco Asset Management (India) Private Limited
15 INVESCO OPPENHEIMER V.I. INTERNATIONAL GROWTH FUND
NOTES TO FINANCIAL STATEMENTSUnaudited / Continued
Note 2 - Advisory Fees and Other Fees Paid to Affiliates (continued)
(collectively, the “AffiliatedSub-Advisers”) the Adviser, not the Fund, will pay 40% of the fees paid to the Adviser to any such AffiliatedSub-Adviser(s) that provide(s) discretionary investment management services to the Fund based on the percentage of assets allocated to suchSub-Adviser(s). Invesco has also entered into aSub-Advisory Agreement with OppenheimerFunds, Inc. to provide discretionary management services to the Funds.
Effective on the Reorganization Date, the Adviser has contractually agreed, through at least May 31, 2021, to waive advisory fees and/or reimburse expenses of all shares to the to the extent necessary to limit the total annual fund operating expenses after fee waiver and/or expense reimbursement (excluding certain items discussed below) of Series I and Series II shares 1.00% and 1.25%, respectively, of the Fund’s average daily net assets (the “expense limits”). In determining the Adviser’s obligation to waive advisory fees and/or reimburse expenses, the following expenses are not taken into account, and could cause total annual fund operating expenses after fee waivers and/or expense reimbursement to exceed the numbers reflected above: (1) interest; (2) taxes; (3) dividend expenses on short sales; (4) extraordinary ornon-routine items, including litigation expenses; and (5) expenses that the Fund has incurred but did not actually pay because of an expense offset arrangement. Unless Invesco continues the fee waiver agreement, it will terminate May 31, 2021. During its term, the fee waiver agreement cannot be terminated or amended to increase the expense limits or reduce the advisory fee waiver without approval of the Board of Trustees.
Further, the Adviser has contractually agreed, through at least June 30, 2021, to waive the advisory fee payable by the Fund in an amount equal to 100% of the net advisory fees the Adviser receives from the affiliated money market funds on investments by the Fund of uninvested cash in such affiliated money market funds.
For the six months ended June 30, 2019, the Adviser waived advisory fees of $8,458 and reimbursed fund expenses of $130,283 and $122,322 for Series I and Series II shares, respectively.
Prior to the Reorganization, the OFI Global Asset Management, Inc. had contractually agreed to waive fees and/or reimburse expenses of Series I and Series II shares to 1.00% and 1.25%, respectively, of the Acquired Fund’s average daily net assets.
The Trust has entered into a master administrative services agreement with Invesco pursuant to which the Fund has agreed to pay Invesco for certain administrative costs incurred in providing accounting services to the Fund. For the six months ended June 30, 2019, expenses incurred under the agreement are shown in the Statement of Operations as Administration fees. Additionally, Invesco has entered into service agreements whereby JPMorgan Chase Bank serves as custodian to the Fund. Prior to the Reorganization, the Acquired Fund paid administrative fees to OFI Global Asset Management, Inc.
The Trust has entered into a transfer agency and service agreement with Invesco Investment Services, Inc. (“IIS”) pursuant to which the Fund has agreed to pay IIS a fee for providing transfer agency and shareholder services to the Fund and reimburse IIS for certain expenses incurred by IIS in the course of providing such services. IIS may make payments to intermediaries that provide omnibus account services,sub-accounting services and/or networking services. All fees payable by IIS to intermediaries that provide omnibus account services orsub-accounting services are charged back to the Fund, subject to certain limitations approved by the Trust’s Board of Trustees. Prior to the Reorganization, the Acquired Fund paid transfer agent fees to OFI Global Asset Management, Inc. and Shareholder Services, Inc. For the six months ended June 30, 2019, expenses incurred under these agreements are shown in the Statement of Operations as Transfer and shareholder servicing agent fees.
The Trust has entered into master distribution agreements with Invesco Distributors, Inc. (“IDI”) to serve as the distributor for the Service II shares of the Fund. The Trust has adopted a plan pursuant to Rule12b-1 under the 1940 Act with respect to the Fund’s Service II shares (the “Plan”). The Fund, pursuant to the Plan, pays IDI at an annual rate of 0.25% of the average daily net assets of Service II shares. The fees are accrued daily and paid monthly. Of the Plan payments, up to 0.25% of the average daily net assets of the class of shares may be paid to furnish continuing personal shareholder services to customers who purchase and own shares of such class. Any amounts not paid as a service fee under the Plan would constitute an asset-based sales charge. Rules of the Financial Industry Regulatory Authority (“FINRA”) impose a cap on the total sales charges, including asset-based sales charges, that may be paid by any class of shares of the Fund plans. Prior to the Reorganization, the Acquired Fund paid distribution fees to OppenheimerFunds Distributor, Inc. For the six months ended June 30, 2019, expenses incurred under the plans are shown in the Statement of Operations as Distribution and service plan fees.
Certain officers and trustees of the Trust are officers and directors of the Adviser, IIS and/or IDI.
Note 3 - Additional Valuation Information
GAAP defines fair value as the price that would be received to sell an asset or paid to transfer a liability in an orderly transaction between market participants at the measurement date, under current market conditions. GAAP establishes a hierarchy that prioritizes the inputs to valuation methods, giving the highest priority to readily available unadjusted quoted prices in an active market for identical assets (Level 1) and the lowest priority to significant unobservable inputs (Level 3), generally when market prices are not readily available or are unreliable. Based on the valuation inputs, the securities or other investments are tiered into one of three levels. Changes in valuation methods may result in transfers in or out of an investment’s assigned level:
Level 1 — Prices are determined using quoted prices in an active market for identical assets.
Level 2 — Prices are determined using other significant observable inputs. Observable inputs are inputs that other market participants may use in pricing a security. These may include quoted prices for similar securities, interest rates, prepayment speeds, credit risk, yield curves, loss severities, default rates, discount rates, volatilities and others.
Level 3 — Prices are determined using significant unobservable inputs. In situations where quoted prices or observable inputs are unavailable (for example, when there is little or no market activity for an investment at the end of the period), unobservable inputs may be used. Unobservable inputs
16 INVESCO OPPENHEIMER V.I. INTERNATIONAL GROWTH FUND
Note 3 - Additional Valuation Information (continued)
reflect the Fund’s own assumptions about the factors market participants would use in determining fair value of the securities or instruments and would be based on the best available information.
The following is a summary of the tiered valuation input levels, as of June 30, 2019. The level assigned to the securities valuations may not be an indication of the risk or liquidity associated with investing in those securities. Because of the inherent uncertainties of valuation, the values reflected in the financial statements may materially differ from the value received upon actual sale of those investments.
| | | | | | | | | | | | | | | | |
| | | Level 1— Unadjusted Quoted Prices | | | Level 2— Other Significant Observable Inputs | | | Level 3— Significant Unobservable Inputs | | | Value | |
| Assets Table | | | | | | | | | | | | | | | | |
| Investments, at Value: | | | | | | | | | | | | | | | | |
| Common Stocks | | | | | | | | | | | | | | | | |
Consumer Discretionary | | $ | 14,453,993 | | | $ | 61,318,135 | | | $ | — | | | $ | 75,772,128 | |
Consumer Staples | | | 12,166,747 | | | | 35,235,165 | | | | — | | | | 47,401,912 | |
Energy | | | — | | | | 5,785,309 | | | | — | | | | 5,785,309 | |
Financials | | | 8,719,872 | | | | 11,891,731 | | | | — | | | | 20,611,603 | |
Health Care | | | 9,917,643 | | | | 63,988,844 | | | | — | | | | 73,906,487 | |
Industrials | | | — | | | | 83,238,941 | | | | — | | | | 83,238,941 | |
Information Technology | | | 7,324,705 | | | | 104,506,255 | | | | — | | | | 111,830,960 | |
Materials | | | 7,416,379 | | | | 11,652,688 | | | | — | | | | 19,069,067 | |
| Preferred Stock | | | 45,165 | | | | — | | | | — | | | | 45,165 | |
| Investment Company | | | 17,232,958 | | | | — | | | | — | | | | 17,232,958 | |
| | | | |
| Total Assets | | $ | 77,277,462 | | | $ | 377,617,068 | | | $ | — | | | $ | 454,894,530 | |
| | | | |
Forward currency exchange contracts and futures contracts, if any, are reported at their unrealized appreciation/depreciation at measurement date, which represents the change in the contract’s value from trade date. All additional assets and liabilities included in the above table are reported at their market value at measurement date.
Note 4 - Security Transactions with Affiliated Funds
The Fund is permitted to purchase or sell securities from or to certain other Invesco Funds under specified conditions outlined in procedures adopted by the Board of Trustees of the Trust. The procedures have been designed to ensure that any purchase or sale of securities by the Fund from or to another fund or portfolio that is or could be considered an affiliate by virtue of having a common investment adviser (or affiliated investment advisers), common Trustees and/or common officers complies with Rule17a-7 of the 1940 Act. Further, as defined under the procedures, each transaction is effected at the current market price. Pursuant to these procedures for the period January 1, 2019 to May 24, 2019, the Predecessor Fund did not engage in transactions with affiliates. For the period May 25, 2019 to June 30, 2019, the Fund engaged in transactions with affiliates as listed: Securities sales of $462,678, which resulted in net realized gains of $99,172.
Note 5 - Expense Offset Arrangement
The expense offset arrangement is comprised of custodian credits which result from periodic overnight cash balances at the custodian. For the six months ended June 30, 2019, the Fund received credits from this arrangement, which resulted in the reduction of the Fund’s total expenses of $3,799.
Note 6 - Trustee and Officer Fees and Benefits
Certain Trustees have executed a Deferred Compensation Agreement pursuant to which they have the option to elect to defer receipt of all or a portion of the annual compensation they are entitled to receive from the Fund. For purposes of determining the amount owed to the Trustees under the plan, deferred amounts are treated as though equal dollar amounts had been invested in shares of the Fund or in other Invesco and/or Invesco Oppenheimer funds selected by the Trustees. The Fund purchases shares of the funds selected for deferral by the Trustees in amounts equal to his or her deemed investment, resulting in a Fund asset equal to the deferred compensation liability. Such assets are included as a component of “Other” within the asset section of the Statement of Assets and Liabilities. Deferral of Trustees’ fees under the plan will not affect the net assets of the Fund and will not materially affect the Fund’s assets, liabilities or net investment income per share. Amounts will be deferred until distributed in accordance with the compensation deferral plan.
17 INVESCO OPPENHEIMER V.I. INTERNATIONAL GROWTH FUND
NOTES TO FINANCIAL STATEMENTSUnaudited / Continued
Note 7 - Cash Balances
The Fund is permitted to temporarily carry a negative or overdrawn balance in its account with JPMorgan Chase Bank, the custodian bank. Such balances, if any atperiod-end, are shown in the Statement of Assets and Liabilities under the payable caption Amount due custodian. To compensate the custodian bank for such overdrafts, the overdrawn Fund may either (1) leave funds as a compensating balance in the account so the custodian bank can be compensated by earning the additional interest; or (2) compensate by paying the custodian bank at a rate agreed upon by the custodian bank and Invesco, not to exceed the contractually agreed upon rate.
Note 8 - Investments Transactions
The aggregate amount of investment securities (other than short-term securities, U.S. Treasury obligations and money market funds, if any) purchased and sold by the Fund during the six months ended June 30, 2019 was $76,304,957 and $163,665,642, respectively.
Note 9 - Share Information
Transactions in shares of beneficial interest were as follows:
| | | | | | | | | | | | | | | | |
| | | Six Months Ended June 30, 20191 | | Year Ended December 31, 2018 |
| | | | |
| | | Shares | | Amount | | Shares | | Amount |
| Series I Shares | | | | | | | | | | | | | | | | |
| Sold | | | 5,307,408 | | | $ | 11,617,830 | | | | 21,532,426 | | | $ | 51,243,851 | |
| Dividends and/or distributions reinvested | | | 6,179,988 | | | | 13,472,374 | | | | 3,639,212 | | | | 9,134,490 | |
| Redeemed | | | (42,970,025 | ) | | | (99,499,044 | ) | | | (32,856,876 | ) | | | (81,194,225 | ) |
| | | | |
| Net decrease | | | (31,482,629 | ) | | $ | (74,408,840 | ) | | | (7,685,238 | ) | | $ | (20,815,884 | ) |
| | | | |
| | | | | | | | | | | | | | | | | |
| Series II Shares | | | | | | | | | | | | | | | | |
| Sold | | | 6,757,439 | | | $ | 15,561,941 | | | | 19,920,360 | | | $ | 51,115,122 | |
| Dividends and/or distributions reinvested | | | 5,574,352 | | | | 12,709,522 | | | | 2,171,864 | | | | 5,690,284 | |
| Redeemed | | | (6,894,916 | ) | | | (16,125,200 | ) | | | (16,510,354 | ) | | | (43,058,652 | ) |
| | | | |
| Net increase | | | 5,436,875 | | | $ | 12,146,263 | | | | 5,581,870 | | | $ | 13,746,754 | |
| | | | |
1.There are entities that are record owners of more than 5% of the outstanding shares of the Fund and own 34% of the outstanding shares of the Fund. The Fund and the Fund’s principalunderwriter or adviser, are parties to participation agreements with these entities whereby these entities sell units of interest in separate accounts funding variable products that are invested in the Fund. The Fund, Invesco and/or Invesco affiliates may make payments to these entities, which are considered to be related to the Fund, for providing services to the Fund, Invesco and/or Invesco affiliates, including, but not limited to services such as securities brokerage, distribution, third party record keeping and account servicing. The Fund has no knowledge as to whether all or any portion of the shares owned of record by these entities are also owned beneficially.
In addition, 11% of the outstanding shares of the Fund are owned by the Adviser or an affiliate of the Adviser.
Note 10 - Borrowings
Joint Credit Facility.A number of mutual funds managed by the Adviser participate in a $1.95 billion revolving credit facility (the “Facility”) intendedto provide short-term financing, if necessary, subject to certain restrictions in connection with atypical redemption activity. Expenses and fees related to the Facility are paid by the participating funds and are disclosed separately or as other expenses on the Statement of Operations. The Fund did not utilize the Facility during the reporting period. The Facility terminated May 24, 2019.
Note 11 - Independent Registered Public Accounting Firm
The Audit Committee of the Board of Trustees appointed, and the Board of Trustees ratified and approved, PricewaterhouseCoopers LLP (“PWC”) as the independent registered public accounting firm of the Fund for the fiscal periods ending after May 24, 2019. Prior to the close of business on May 24, 2019, the Predecessor Fund was a separate series of an unaffiliated investment company and its financial statements were audited by a different independent registered public accounting firm (the “Prior Auditor”).
Effective after the close of business on May 24, 2019, the Prior Auditor resigned as the independent registered public accounting firm of the Fund. The Prior Auditor’s report on the financial statements of the Predecessor Fund for the past two fiscal years did not contain an adverse or disclaimer of opinion, and was not qualified or modified as to uncertainty, audit scope or accounting principles. During the Predecessor Fund’s two most recent fiscal years and through the close of business on May 24, 2019, there were no (1) disagreements with the Prior Auditor on any matter of accounting principles or practices, financial statement disclosure, or auditing scope or procedure, which disagreements, if not resolved to the Prior Auditor’s satisfaction, would have caused it to make reference to that matter in connection with its report; or (2) “reportable events,” as that term is defined in Item 304(a)(1)(v) of RegulationS-K under the Securities Exchange Act of 1934.
18 INVESCO OPPENHEIMER V.I. INTERNATIONAL GROWTH FUND
APPROVAL OF THE INVESTMENT ADVISORY ANDSUB-ADVISORY CONTRACTSUnaudited
At meetings held on December 14, 2018, the Board of Trustees (the Board or the Trustees) of AIM Variable Insurance Funds (Invesco Variable Insurance Funds) (the Trust) as a whole, and the independent Trustees, who comprise over 75% of the Board, voting separately, approved (i) an amendment to the Trust’s Master Investment Advisory Agreement with Invesco Advisers, Inc. (Invesco Advisers and the investment advisory agreement) to add Invesco Oppenheimer V.I. International Growth Fund (the Fund), (ii) an amendment to the Master IntergroupSub-Advisory Contract for Mutual Funds with Invesco Asset Management Deutschland GmbH, Invesco Asset Management Limited, Invesco Asset Management (Japan) Limited, Invesco Hong Kong Limited, Invesco Senior Secured Management, Inc. and Invesco Canada Ltd. to add the Fund, (iii) an amendment to the separatesub-advisory contract with Invesco Capital Management LLC to add the Fund, (iv) an amendment to the separatesub-advisory contract with Invesco Asset Management (India) Private Limited to add the Fund, and (v) an initialsub-advisory contract with OppenheimerFunds, Inc. (collectively, the AffiliatedSub-Advisers and thesub-advisory contracts). Additionally, on March 26, 2019, the Boardre-approved an initialsub-advisory contract with OppenheimerFunds, Inc. following its change of control as a result of the acquisition of OppenheimerFunds, Inc. and its subsidiaries, including the Oppenheimer mutual funds (each, an Oppenheimer Fund), by Invesco Ltd. (the OFI Transaction). After evaluating the factors discussed below, among others, the Board approved the Fund’s investment advisory agreement and thesub-advisory contracts and determined that the compensation payable by the Fund to Invesco Advisers and by Invesco Advisers to the AffiliatedSub-Advisers is fair and reasonable.
The Board’s Evaluation Process
The Board noted that it had previously approved establishing the Fund at the Board meeting held on October 23, 2018 and that the Fund was formed to acquire the assets and liabilities of an Oppenheimer Fund (the Acquired Fund) with the same investment objective and substantially similar principal investment strategies and risks. At the time of approval, the Fund had no assets and no performance history and the portfolio managers were not employed by Invesco Advisers or any of the AffiliatedSub-Advisers except OppenheimerFunds, Inc., which was not affiliated with Invesco at that time.
In approving the investment advisory agreement andsub-advisory contracts, the Board followed a process similar to the process that it follows in annually reviewing and approving investment advisory agreements andsub-advisory contracts for the series portfolios of funds advised by Invesco Advisers and considered the information provided in the most recent annual review process for those funds as well as the information provided with respect to the Fund. As part of the approval process, the Board reviewed and considered information provided in response to detailed requests for information submitted to management by the independent Trustees with assistance from legal counsel to the independent Trustees. The Board reviewed comparative investment performance and fee data prepared by Invesco Advisers and an independent mutual fund data provider. The Board was assisted in its review by the Senior Officer, an officer of the Invesco Funds who reports directly to the independent Trustees, and by independent legal counsel.
The discussion below serves as a summary of the material factors and related conclusions that formed the basis for the Board’s approval of the Fund’s investment advisory agreement andsub-advisory contracts. The Trustees’ review and conclusions are based on the comprehensive consideration of all information presented to them and are not the result of any single determinative factor. Moreover, one Trustee may have weighed a particular piece of information or factor differently than another Trustee. This information is current as of December 14, 2018 and March 26, 2019 for thesub-advisory contract with OppenheimerFunds, Inc.
Factors and Conclusions and Summary of Independent Written Fee Evaluation
A. Nature, Extent and Quality of Services Provided by Invesco Advisers and the AffiliatedSub-Advisers
The Board reviewed the nature, extent and quality of the advisory services to be provided to the Fund by Invesco Advisers under the Fund’s investment advisory agreement, and the credentials and experience of the officers and employees of Invesco Advisers who will provide these services. The Board’s review included consideration of the investment process oversight and structure, credit analysis and investment risk management to be employed in providing advisory services to the Fund. The Board also considerednon-advisory services that Invesco Advisers and its affiliates provide to the Invesco Funds and will provide to the Fund, such as various back office support functions, third party oversight, internal audit, valuation, portfolio trading and legal and compliance. The Board also received and reviewed information about Invesco Advisers’ role as administrator of the Invesco Funds’ liquidity risk management program. The Board also reviewed and considered the benefits to shareholders of investing in a fund that is part of the Invesco family of funds under the umbrella of Invesco Ltd., Invesco Advisers’ parent company, and noted Invesco Ltd.’s depth and experience in conducting an investment management business, as well as its commitment of financial and other resources to such business. The Board reviewed and considered information about the resources that Invesco Advisers intends to continue to commit to managing the Invesco family of funds, including the Fund, following the OFI Transaction. The Board concluded that the nature, extent and quality of the services to be provided to the Fund by Invesco Advisers are appropriate and satisfactory.
The Board reviewed the services that may be provided by the AffiliatedSub-Advisers under thesub-advisory contracts and the credentials and experience of the officers and employees of the AffiliatedSub-Advisers who provide these services. The Board noted the AffiliatedSub-Advisers’ expertise with respect to certain asset classes and that the AffiliatedSub-Advisers have offices and personnel that are located in financial centers around the world. As a result, the Board noted that the AffiliatedSub-Advisers can provide research and investment analysis on the markets and economies of various countries in which the Fund may invest, make recommendations regarding securities and assist with security trades. The Board concluded that thesub-advisory contracts may benefit the Fund and its shareholders by permitting Invesco Advisers to use the resources and talents of the AffiliatedSub-Advisers in managing the Fund. The Board concluded that the nature, extent and quality of the services that may be provided by the AffiliatedSub-Advisers are appropriate and satisfactory.
19 INVESCO OPPENHEIMER V.I. INTERNATIONAL GROWTH FUND
APPROVAL OF THE INVESTMENT ADVISORY AND SUB-ADVISORY CONTRACTSUnaudited / Continued
B. Fund Investment Performance
The Board noted that the Fund would continue the historical performance information of the Acquired Fund following the consummation of the OFI Transaction. The Board considered the performance of the Acquired Fund and the fact that, at the closing of the OFI Transaction, management anticipates that the Fund will be managed pursuant to substantially similar investment strategies and by substantially the same portfolio management team as managed the Acquired Fund. The Board did not view Fund performance as a relevant factor in considering whether to approve thesub-advisory contracts for the Fund, as no AffiliatedSub-Adviser currently manages assets of the Fund.
The Board compared the Fund’s investment performance over multiple time periods ending December 31, 2017 to the performance of funds in the Morningstar performance universe and against the Fund’s benchmark index. The Trustees also reviewed more recent Fund performance and this review did not change their conclusions.
C. Advisory andSub-Advisory Fees and Fund Expenses
The Board compared the Fund’s contractual management fee rate to the contractual management fee rates of funds in the Fund’s Morningstar expense group. The Board also considered comparative information regarding the Fund’s total expense ratio and its various components.
The Board noted that Invesco Advisers has contractually agreed to waive fees and/or limit expenses of the Fund for at least two years from the closing date of the OFI Transaction in an amount necessary to limit total annual operating expenses to a specified percentage of average daily net assets for each class of the Fund.
The Board also considered the fees charged by Invesco Advisers and the AffiliatedSub-Advisers to other similarly managed client accounts. The Board noted that Invesco Advisers or the AffiliatedSub-Advisers may charge lower fees to large institutional clients. Invesco Advisers reviewed with the Board differences in the scope of services it provides to the Invesco Funds relative to certain other types of client accounts, including management of cash flows as a result of redemptions and purchases, necessary infrastructure such as officers, office space, technology, legal and distribution, oversight of service providers, costs and business risks associated with launching new funds and sponsoring and maintaining the product line, preparation of annual registration statement updates and financial information and compliance with federal and state laws and regulations.
The Board also considered the services that may be provided by the AffiliatedSub-Advisers pursuant to thesub-advisory contracts, as well as the fees payable by Invesco Advisers to the AffiliatedSub-Advisers pursuant to thesub-advisory contracts.
D. Economies of Scale and Breakpoints
The Board considered the extent to which there may be economies of scale in the provision of advisory services to the Fund. The Board considered Invesco’s reinvestment in its business, including investments in business infrastructure and cybersecurity. The Board also considered that the Fund may benefit from economies of scale through contractual breakpoints in the Fund’s advisory fee schedule, which generally operate to reduce the Fund’s expense ratio as it grows in size. The Board noted that the Fund will share directly in economies of scale through lower fees charged by third party service providers based on the combined size of the Invesco Funds. The Board noted that the Fund may also benefit from economies of scale through initial fee setting, fee waivers and expense reimbursements.
E. Profitability and Financial Resources
The Board reviewed information from the 2018 contract renewal process provided by Invesco Advisers concerning the costs of the advisory and other services that Invesco Advisers and its affiliates provide to the Invesco Funds and the profitability of Invesco Advisers and its affiliates in providing these services. The Board considered the methodology used for calculating profitability and noted the periodic review of such methodology by an independent consultant. The Board noted that Invesco Advisers will continue to operate at a net profit from services Invesco Advisers and its affiliates provide to the Invesco Funds. The Board did not deem the level of profits realized by Invesco Advisers and its affiliates from providing services to the Invesco Funds, and the profits estimated to be realized by the Fund, to be excessive given the nature, extent and quality of the services provided. The Board received information from Invesco Advisers demonstrating that Invesco Advisers and the AffiliatedSub-Advisers are financially sound and have the resources necessary to perform their obligations under the investment advisory agreement andsub-advisory contracts.
F. Collateral Benefits to Invesco Advisers and its Affiliates
The Board considered various other benefits to be received by Invesco Advisers and its affiliates from the relationship with the Fund, including the fees to be received for providing administrative, transfer agency and distribution services to the Fund. The Board considered the performance of Invesco Advisers and its affiliates in providing these services to other Invesco Funds and the organizational structure employed to provide these services. The Board also considered that these services will be provided to the Fund pursuant to written contracts that are reviewed and approved on an annual basis by the Board; and that the services are required for the operation of the Fund.
The Board considered the benefits realized by Invesco Advisers and the AffiliatedSub-Advisers as a result of portfolio brokerage transactions executed through “soft dollar” arrangements. The Board noted that soft dollar arrangements may result in the Fund bearing costs to purchase research that may be used by Invesco Advisers or the AffiliatedSub-Advisers with other clients and may reduce Invesco Advisers’ or the AffiliatedSub-Advisers’ expenses. The Board also considered that it will receive periodic reports from Invesco representing that these arrangements are consistent with regulatory requirements. The Board did not deem the soft dollar arrangements to be inappropriate.
20 INVESCO OPPENHEIMER V.I. INTERNATIONAL GROWTH FUND
APPROVAL OF THE INVESTMENT ADVISORY AND SUB-ADVISORY CONTRACTSUnaudited / Continued
The Board considered that the Fund’s uninvested cash and cash collateral from any securities lending arrangements may be invested in money market funds advised by Invesco Advisers pursuant to procedures approved by the Board. The Board considered that Invesco Advisers will receive advisory fees from these affiliated money market funds attributable to such investments, although Invesco Advisers has contractually agreed to waive through varying periods the advisory fees payable by the Invesco Funds with respect to certain investments in the affiliated money market funds. The waiver is in an amount equal to 100% of the net advisory fee Invesco Advisers will receive from the affiliated money market funds with respect to the Fund’s investment in the affiliated money market funds of uninvested cash, but not cash collateral. The Board concluded that the amount of advisory fees to be received by Invesco Advisers from the Fund’s investment of cash collateral from any securities lending arrangements in the affiliated money market funds is fair and reasonable.
The Board also considered that an affiliated broker may receive commissions for executing certain trades for the Fund. Invesco Advisers and the AffiliatedSub-Advisers may use the affiliated broker to, among other things, control order routing and minimize information leakage, and the Board was be advised that such trades will be executed in compliance with rules under the federal securities laws and consistent with best execution obligations.
21 INVESCO OPPENHEIMER V.I. INTERNATIONAL GROWTH FUND
PORTFOLIO PROXY VOTING POLICIES AND GUIDELINES; UPDATES TO STATEMENT OF INVESTMENTSUnaudited
Go paperless with eDelivery
Visit invesco.com/edelivery to enjoy the convenience and security of anytime electronic access to your investment documents.
With eDelivery, you can elect to have any or all of the following materials delivered straight to your inbox to download, save and print from your own computer:
| · | | Fund reports and prospectuses |
Invesco mailing information
Send general correspondence to Invesco Investment Services, Inc., P.O. Box 219078, Kansas City, MO 64121-9078.
Important notice regarding delivery of security holder documents
To reduce Fund expenses, only one copy of most shareholder documents may be mailed to shareholders with multiple accounts at the same address (Householding). Mailing of your shareholder documents may be householded indefinitely unless you instruct us otherwise. If you do not want the mailing of these documents to be combined with those for other members of your household, please contact Invesco Investment Services, Inc. at 800 959 4246 or contact your financial institution. We will begin sending you individual copies for each account within 30 days after receiving your request.
Fund holdings and proxy voting information
The Fund provides a complete list of its holdings four times in each fiscal year, at the quarter ends. For the second and fourth quarters, the lists appear in the Fund’s semiannual and annual reports to shareholders. For the first and third quarters, the Fund files the lists with the Securities and Exchange Commission (SEC) on FormN-Q (or any successor Form). The most recent list of portfolio holdings is available at invesco.com/completeqtrholdings. Shareholders can also look up the Fund’s FormsN-Q (or any successor Form) on the SEC website at sec.gov.
A description of the policies and procedures that the Fund uses to determine how to vote proxies relating to portfolio securities is available without charge, upon request, from our Client Services department at 800 959 4246 or at invesco.com/proxyguidelines. The information is also available on the SEC website, sec.gov.
Information regarding how the Fund voted proxies related to its portfolio securities during the most recent12-month period ended June 30 is available at invesco.com/proxysearch. The information is also available on the SEC website, sec.gov.
Invesco Advisers, Inc. is an investment adviser; it provides investment advisory services to individual and institutional clients and does not sell securities. Invesco Distributors, Inc. is the US distributor for Invesco Ltd.’s retail mutual funds, exchange-traded funds and institutional money market funds. Both are wholly owned, indirect subsidiaries of Invesco Ltd.
22 INVESCO OPPENHEIMER V.I. INTERNATIONAL GROWTH FUND
SHAREHOLDER PROXYUnaudited
A Special Meeting (“Meeting”) of Shareholders of Invesco Oppenheimer V.I. International Growth Fund was held on April 12, 2019. The Meeting was held for the following purpose:
(1) Approval of an Agreement and Plan of Reorganization that provides for the reorganization of Oppenheimer International Growth Fund/VA Fund into Invesco Oppenheimer V.I. International Growth Fund.
The results of the voting on the above matter was as follows:
| | | | | | | | | | | | | | | | |
| Matter | | Votes For | | | Votes
Against | | | Votes Abstain | | | Broker Non-Votes | |
| (1) Approval of an Agreement and Plan of Reorganization | | | 119,060,013 | | | | 2,881,302 | | | | 11,632,923 | | | | 0 | |
23 INVESCO OPPENHEIMER V.I. INTERNATIONAL GROWTH FUND

| | | | |

| | Semiannual Report | | 6/30/2019 |
| | |
| | Invesco Oppenheimer |
| | V.I. Main Street Fund®* |
| |
| | The Fund provides a complete list of its holdings four times in each fiscal year, at the quarter ends. For the second and fourth quarters, the lists appear in the Fund’s semi annual and annual reports to shareholders. For the first and third quarters, the Fund files the lists with the Securities and Exchange Commission (SEC) on FormN-Q (or any successor Form). The Fund’s FormN-Q (or any successor Form) filings are available on the SEC website, sec.gov. The Fund’s most recent portfolio holdings, as filed on FormN-Q (or any successor Form), have also been made available to insurance companies issuing variable annuity contracts and variable life insurance policies (“variable products”) that invest in the Fund. |
| |
| | A description of the policies and procedures that the Fund uses to determine how to vote proxies relating to portfolio securities is available without charge, upon request, from our Client Services department at 800 959 4246 or at invesco.com/proxyguidelines. The information is also available on the SEC website, sec.gov. |
| |
| | Information regarding how the Fund voted proxies related to its portfolio securities during the most recent12-month period ended June 30 is available at invesco.com/proxysearch. The information is also available on the SEC website, sec.gov. |
| |
| | Invesco Advisers, Inc. is an investment adviser; it provides investment advisory services to individual and institutional clients and does not sell securities. Invesco Distributors, Inc. is the US distributor for Invesco Ltd.’s retail mutual funds, exchange-traded funds and institutional money market funds. Both are wholly owned, indirect subsidiaries of Invesco Ltd. |
| |
| | This report must be accompanied or preceded by a currently effective Fund prospectus and variable product prospectus, which contain more complete information, including sales charges and expenses. Investors should read each carefully before investing. |
| |
| | *Prior to the close of business on May 24, 2019, the Fund’s name was Oppenheimer Main Street Fund/VA. See Important Update on the following page for more information. |
Important Update
On October 18, 2018, Massachusetts Mutual Life Insurance Company, an indirect corporate parent of OppenheimerFunds, Inc. and its subsidiaries OFI Global Asset Management, Inc., OFI SteelPath, Inc. and OFI Advisors, LLC, announced that it had entered into an agreement whereby Invesco Ltd., a global investment management company would acquire OppenheimerFunds and its subsidiaries (together, “OppenheimerFunds”). After the close of business on May 24, 2019 Invesco Ltd. completed the acquisition of OppenheimerFunds. This Fund was included in that acquisition and as of that date, became part of the Invesco family of funds. Please visit invesco.com for more information or call Invesco’s Client Services team at800-959-4246.
.
PORTFOLIO MANAGERS:Manind Govil, CFA, Benjamin Ram and Paul Larson
AVERAGE ANNUAL TOTAL RETURNS FOR THE PERIODS ENDED 6/30/19
| | | | | | | | | | | | | | | | | | | | |
| | | Inception | | | | | | | | | | | | | |
| | | Date | | | 6-Months | | | 1-Year | | | 5-Year | | | 10-Year | |
| Series I Shares* | | | 7/5/95 | | | | 21.27% | | | | 11.76 | % | | | 9.44 | % | | | 13.57 | % |
| Series II Shares* | | | 7/13/00 | | | | 21.13 | | | | 11.49 | | | | 9.17 | | | | 13.29 | |
| S&P 500 Index | | | | | | | 18.54 | | | | 10.42 | | | | 10.71 | | | | 14.70 | |
Performance quoted is past performance and cannot guarantee comparable future results; current performance may be lower or higher.Visit invesco.com for the most recentmonth-end performance. Performance figures reflect reinvested distributions and changes in net assetvalue (NAV). Investment return and principal value will vary so that you may have a gain or a loss when you sell shares. Fund returns include changes in share price, reinvested distributions and sales charges except where “without sales charge” is indicated. Effective after the close of business on May 24, 2019, theNon-Service and Service share classes of the predecessor fund were reorganized into Series I and Series II Shares, respectively, of the Fund. Returns shown for Series I and Series II shares are blended returns of the predecessor fund and the Fund. Share class returns will differ from those of the predecessor fund because of different expenses. See Fund prospectuses and summary prospectuses for more information on share classes, sales charges and new fee agreements, if any. Fund literature is available at invesco.com.
The Fund’s performance is compared to the performance of the S&P 500 Index. The S&P 500 Index is a capitalization-weighted index of 500 stocks intended to be a representative sample of leading companies in leading industries within the U.S. economy. The Index is unmanaged and cannot be purchased directly by investors. While index comparisons may be useful to provide a benchmark for the Fund’s performance, it must be noted that the Fund’s investments are not limited to the investments comprising the Index. Index performance includes reinvestment of income, but does not reflect transaction costs, fees, expenses or taxes. Index performance is shown for illustrative purposes only as a benchmark for the Fund’s performance, and does not predict or depict performance of the Fund. The Fund’s performance reflects the effects of the Fund’s business and operating expenses.
TOP HOLDINGS AND ALLOCATIONS
TOP TEN COMMON STOCK HOLDINGS
| | | | |
| Microsoft Corp. | | | 7.1 | % |
| JPMorgan Chase & Co. | | | 4.5 | |
| Amazon.com, Inc. | | | 3.8 | |
| Motorola Solutions, Inc. | | | 3.5 | |
| Lockheed Martin Corp. | | | 3.4 | |
| Facebook, Inc., Cl. A | | | 3.3 | |
| Merck & Co., Inc. | | | 3.2 | |
| Prologis, Inc. | | | 3.1 | |
| UnitedHealth Group, Inc. | | | 2.7 | |
| Philip Morris International, Inc. | | | 2.6 | |
Portfolio holdings and allocations are subject to change. Percentages are as of June 30, 2019, and are based on net assets.
SECTOR ALLOCATION
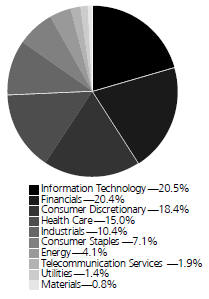
Portfolio holdings and allocations are subject to change. Percentages are as of June 30, 2019, and are based on the total market value of common stocks.
For more current Fund holdings, please visit invesco.com.
3 INVESCO OPPENHEIMER V.I. MAIN STREET FUND
*Effective after the close of business on May 24, 2019, theNon-Service and Service share classes of the predecessor fund were reorganized into Series I and Series II Shares, respectively, of the Fund. Returns shown for Series I and Series II shares are blended returns of the predecessor fund and the Fund. Share class returns will differ from those of the predecessor fund because of different expenses.
Before investing, investors should carefully read the prospectus and/or summary prospectus and carefully consider the investment objectives, risks, charges and expenses. For this and more complete information about the fund(s), investors should ask their advisors for a prospectus/summary prospectus or visit invesco.com/fundprospectus.
Shares of Invesco funds are not deposits or obligations of any bank, are not guaranteed by any bank, are not insured by the FDIC or any other agency, and involve investment risks, including the possible loss of the principal amount invested.
4 INVESCO OPPENHEIMER V.I. MAIN STREET FUND
Fund Expenses
Fund Expenses.As a shareholder of the Fund, you incur two types of costs: (1) transaction costs and (2) ongoing costs, including management fees;distribution and service fees; and other Fund expenses. These examples are intended to help you understand your ongoing costs (in dollars) of investing in the Fund and to compare these costs with the ongoing costs of investing in other mutual funds.
The examples are based on an investment of $1,000.00 invested at the beginning of the period and held for the entire6-month period ended June 30, 2019.
Actual Expenses.The first section of the table provides information about actual account values and actual expenses. You may use the information inthis section for the class of shares you hold, together with the amount you invested, to estimate the expense that you paid over the period. Simply divide your account value by $1,000.00 (for example, an $8,600.00 account value divided by $1,000.00 = 8.60), then multiply the result by the number in the first section under the heading entitled “Expenses Paid During 6 Months Ended June 30, 2019” to estimate the expenses you paid on your account during this period.
Hypothetical Example for Comparison Purposes.
The second section of the table provides information about hypothetical account values and hypothetical expenses based on the Fund’s actual expense ratio for each class of shares, and an assumed rate of return of 5% per year for each class before expenses, which is not the actual return. The hypothetical account values and expenses may not be used to estimate the actual ending account balance or expenses you paid for the period. You may use this information to compare the ongoing costs of investing in the Fund and other funds. To do so, compare this 5% hypothetical example for the class of shares you hold with the 5% hypothetical examples that appear in the shareholder reports of the other funds.
Please note that the expenses shown in the table are meant to highlight your ongoing costs only and do not reflect any charges associated with the separate accounts that offer this Fund. Therefore, the “hypothetical” lines of the table are useful in comparing ongoing costs only, and will not help you determine the relative total costs of owning different funds.
In addition, if these separate account charges were included your costs would have been higher.
| | | | | | | | | | | | |
| Actual | | Beginning Account Value January 1, 2019 | | | Ending Account Value
June 30, 2019 | | | Expenses Paid During 6 Months Ended
June 30, 2019 | |
| Series I shares | | $ | 1,000.00 | | | $ | 1,212.70 | | | $ | 4.40 | |
| Series II shares | | | 1,000.00 | | | | 1,211.30 | | | | 5.77 | |
| | | |
| Hypothetical | | | | | | | | | | | | |
| (5% return before expenses) | | | | | | | | | | | | |
| Series I shares | | | 1,000.00 | | | | 1,020.83 | | | | 4.02 | |
| Series II shares | | | 1,000.00 | | | | 1,019.59 | | | | 5.27 | |
Expenses are equal to the Fund’s annualized expense ratio for that class, multiplied by the average account value over the period, multiplied by 181/365 (to reflect theone-half year period). Those annualized expense ratios, excluding indirect expenses from affiliated funds, based on the6-month period ended June 30, 2019 are as follows:
| | | | |
| Class | | Expense Ratios | |
| Series I shares | | | 0.80% | |
| Series II shares | | | 1.05 | |
The expense ratios reflect voluntary and/or contractual waivers and/or reimbursements of expenses by the Fund’s Manager. Some of these undertakings may be modified or terminated at any time, as indicated in the Fund’s prospectus. The “Financial Highlights” tables in the Fund’s financial statements, included in this report, also show the gross expense ratios, without such waivers or reimbursements and reduction to custodian expenses, if applicable.
5 INVESCO OPPENHEIMER V.I. MAIN STREET FUND
STATEMENT OF INVESTMENTSJune 30, 2019 Unaudited
| | | | | | | | |
| | | Shares | | | Value | |
| Common Stocks—97.4% | | | | | | | | |
| Consumer Discretionary—17.9% | |
| Automobiles—0.7% | | | | | | | | |
| General Motors Co. | | | 224,050 | | | $ | 8,632,647 | |
| Hotels, Restaurants & Leisure—1.9% | |
| Starbucks Corp. | | | 288,780 | | | | 24,208,427 | |
| Household Durables—0.5% | | | | | | | | |
| DR Horton, Inc. | | | 153,640 | | | | 6,626,493 | |
| Interactive Media & Services—3.3% | |
| Facebook, Inc., Cl. A1 | | | 221,310 | | | | 42,712,830 | |
| Internet & Catalog Retail—5.2% | |
| Amazon.com, Inc.1 | | | 25,837 | | | | 48,925,718 | |
| Booking Holdings, Inc.1 | | | 9,790 | | | | 18,353,411 | |
| | | | | | | 67,279,129 | |
| Specialty Retail—6.3% | | | | | | | | |
| Best Buy Co., Inc. | | | 332,690 | | | | 23,198,474 | |
| Home Depot, Inc. (The) | | | 150,630 | | | | 31,326,521 | |
| O’Reilly Automotive, Inc.1 | | | 44,206 | | | | 16,326,160 | |
| Ulta Beauty, Inc.1 | | | 28,630 | | | | 9,931,461 | |
| | | | | | | 80,782,616 | |
| Consumer Staples—6.9% | |
| Beverages—0.7% | | | | | | | | |
| Constellation Brands, Inc., Cl. A | | | 48,920 | | | | 9,634,305 | |
| Household Products—3.6% | | | | | | | | |
| Church & Dwight Co., Inc. | | | 231,860 | | | | 16,939,692 | |
| Procter & Gamble Co. (The) | | | 263,270 | | | | 28,867,555 | |
| | | | | | | 45,807,247 | |
| Tobacco—2.6% | | | | | | | | |
| Philip Morris International, Inc. | | | 417,399 | | | | 32,778,343 | |
| Energy—4.0% | | | | | | | | |
| Energy Equipment & Services—0.7% | |
| Schlumberger Ltd. | | | 218,530 | | | | 8,684,382 | |
| Oil, Gas & Consumable Fuels—3.3% | |
| Magellan Midstream Partners LP2 | | | 194,425 | | | | 12,443,200 | |
| Suncor Energy, Inc. | | | 960,120 | | | | 29,917,339 | |
| | | | | | | 42,360,539 | |
| Financials—19.9% | | | | | | | | |
| Capital Markets—3.8% | | | | | | | | |
| Intercontinental Exchange, Inc. | | | 237,090 | | | | 20,375,514 | |
| S&P Global, Inc. | | | 104,101 | | | | 23,713,167 | |
| Tradeweb Markets, Inc., Cl. A | | | 111,590 | | | | 4,888,758 | |
| | | | | | | 48,977,439 | |
| Commercial Banks—6.8% | | | | | | | | |
| Danske Bank AS | | | 388,473 | | | | 6,142,043 | |
| JPMorgan Chase & Co. | | | 515,530 | | | | 57,636,254 | |
| SunTrust Banks, Inc. | | | 184,260 | | | | 11,580,741 | |
| SVB Financial Group1 | | | 53,330 | | | | 11,977,385 | |
| | | | | | | 87,336,423 | |
| Consumer Finance—0.7% | |
| Capital One Financial Corp. | | | 97,580 | | | | 8,854,409 | |
| Diversified Financial Services—4.4% | |
| AXA Equitable Holdings, Inc. | | | 1,220,236 | | | | 25,502,933 | |
| Berkshire Hathaway, Inc., Cl. B1 | | | 143,270 | | | | 30,540,866 | |
| | | | | | | 56,043,799 | |
| Insurance—1.1% | | | | | | | | |
| Progressive Corp. (The) | | | 182,710 | | | | 14,604,010 | |
| Real Estate Investment Trusts (REITs)—3.1% | |
| Prologis, Inc. | | | 493,843 | | | | 39,556,824 | |
| Health Care—14.6% | | | | | | | | |
| Biotechnology—0.8% | | | | | | | | |
| Gilead Sciences, Inc. | | | 149,810 | | | | 10,121,164 | |
| | | | | | | | |
| | | Shares | | | Value | |
| Health Care Equipment & Supplies—2.1% | |
| Boston Scientific Corp.1 | | | 323,820 | | | $ | 13,917,783 | |
| Zimmer Biomet Holdings, Inc. | | | 113,600 | | | | 13,375,264 | |
| | | | | | | 27,293,047 | |
| Health Care Providers & Services—3.5% | | | | | | | | |
| DaVita, Inc.1 | | | 73,434 | | | | 4,131,397 | |
| Laboratory Corp. of America Holdings1 | | | 33,530 | | | | 5,797,337 | |
| UnitedHealth Group, Inc. | | | 142,080 | | | | 34,668,941 | |
| | | | | | | 44,597,675 | |
| Health Care Technology—0.4% | |
| Cerner Corp. | | | 81,070 | | | | 5,942,431 | |
| Life Sciences Tools & Services—1.6% | | | | | | | | |
| Agilent Technologies, Inc. | | | 273,420 | | | | 20,416,271 | |
| Pharmaceuticals—6.2% | | | | | | | | |
| AstraZeneca plc, Sponsored ADR | | | 281,720 | | | | 11,629,402 | |
| Elanco Animal Health, Inc.1 | | | 807,010 | | | | 27,276,938 | |
| Merck & Co., Inc. | | | 483,350 | | | | 40,528,897 | |
| | | | | | | 79,435,237 | |
| Industrials—10.2% | | | | | | | | |
| Aerospace & Defense—3.4% | |
| Lockheed Martin Corp. | | | 118,420 | | | | 43,050,407 | |
| Commercial Services & Supplies—2.0% | |
| Cintas Corp. | | | 38,090 | | | | 9,038,376 | |
| Republic Services, Inc., Cl. A | | | 190,360 | | | | 16,492,790 | |
| | | | | | | 25,531,166 | |
| Machinery—1.3% | | | | | | | | |
| Illinois Tool Works, Inc. | | | 111,560 | | | | 16,824,364 | |
| Professional Services—0.2% | |
| Nielsen Holdings plc | | | 128,780 | | | | 2,910,428 | |
| Road & Rail—2.2% | | | | | | | | |
| Union Pacific Corp. | | | 168,120 | | | | 28,430,773 | |
| Trading Companies & Distributors—1.1% | |
| Fastenal Co. | | | 412,740 | | | | 13,451,197 | |
| Information Technology—19.9% | |
| Communications Equipment—3.5% | |
| Motorola Solutions, Inc. | | | 266,140 | | | | 44,373,522 | |
| IT Services—3.1% | | | | | | | | |
| Amdocs Ltd. | | | 276,220 | | | | 17,150,500 | |
| DXC Technology Co. | | | 122,670 | | | | 6,765,250 | |
| Visa, Inc., Cl. A | | | 95,480 | | | | 16,570,554 | |
| | | | | | | 40,486,304 | |
| Semiconductors & Semiconductor Equipment—3.9% | |
| Applied Materials, Inc. | | | 465,950 | | | | 20,925,815 | |
| QUALCOMM, Inc. | | | 271,560 | | | | 20,657,569 | |
| Texas Instruments, Inc. | | | 71,080 | | | | 8,157,141 | |
| | | | | | | 49,740,525 | |
| Software—8.0% | | | | | | | | |
| Microsoft Corp. | | | 685,750 | | | | 91,863,070 | |
| ServiceNow, Inc.1 | | | 41,100 | | | | 11,284,827 | |
| | | | | | | 103,147,897 | |
| Technology Hardware, Storage & Peripherals—1.4% | |
| Apple, Inc. | | | 37,616 | | | | 7,444,959 | |
| NetApp, Inc. | | | 172,940 | | | | 10,670,398 | |
| | | | | | | 18,115,357 | |
| Materials—0.8% | | | | | | | | |
| Chemicals—0.8% | | | | | | | | |
| Ecolab, Inc. | | | 50,140 | | | | 9,899,642 | |
| Telecommunication Services—1.8% | |
| Diversified Telecommunication Services—1.8% | |
| Verizon Communications, Inc. | | | 403,305 | | | | 23,040,815 | |
6 INVESCO OPPENHEIMER V.I. MAIN STREET FUND
| | | | | | | | |
| | | Shares | | | Value | |
| Utilities—1.4% | | | | | | | | |
| Electric Utilities—1.4% | | | | | | | | |
| Duke Energy Corp. | | | 202,760 | | | $ | 17,891,543 | |
| Total Common Stocks (Cost $969,322,799) | | | | 1,249,579,627 | |
| | | | | | | | |
| | | Shares | | | Value | |
| Investment Company—1.7% | | | | | | | | |
| Invesco Oppenheimer Institutional | | | | | | | | |
| Government Money Market Fund, Cl. IN, 2.37%3 (Cost $21,703,494) | | | 21,703,494 | | | $ | 21,703,494 | |
Total Investments, at Value
(Cost $991,026,293) | | | 99.1% | | | | 1,271,283,121 | |
| Net Other Assets (Liabilities) | | | 0.9 | | | | 11,478,839 | |
| Net Assets | | | 100.0% | | | $ | 1,282,761,960 | |
| | | | |
Footnotes to Statement of Investments
1.Non-income producing security.
2.Security is a Master Limited Partnership.
3.The money market fund and the Fund are affiliated by having the same investment adviser. The rate shown is the7-day SEC standardized yield as of June 30, 2019.
See accompanying Notes to Financial Statements.
7 INVESCO OPPENHEIMER V.I. MAIN STREET FUND
STATEMENT OF ASSETS AND LIABILITIESJune 30, 2019 Unaudited
| | | | |
| Assets | | | | |
| Investments, at value—see accompanying statement of investments: | | | | |
| Unaffiliated companies (cost $969,322,799) | | $ | 1,249,579,627 | |
| Affiliated companies (cost $21,703,494) | | | 21,703,494 | |
| | | | |
| | | 1,271,283,121 | |
| Cash | | | 750,000 | |
| Receivables and other assets: | | | | |
| Investments sold | | | 17,116,682 | |
| Dividends | | | 1,594,704 | |
| Shares of beneficial interest sold | | | 60,856 | |
| Other | | | 171,766 | |
| | | | |
| Total assets | | | 1,290,977,129 | |
| Liabilities | | | | |
| Payables and other liabilities: | | | | |
| Investments purchased | | | 6,952,280 | |
| Shares of beneficial interest redeemed | | | 639,985 | |
| Administration fee | | | 175,602 | |
| Trustees’ compensation | | | 157,381 | |
| Distribution and service plan fees | | | 146,079 | |
| Management fee | | | 69,179 | |
| Shareholder communications | | | 34,657 | |
| Transfer and shareholder servicing agent fees | | | 18,215 | |
| Other | | | 21,791 | |
| | | | |
| Total liabilities | | | 8,215,169 | |
| Net Assets | | $ | 1,282,761,960 | |
| | | | |
| | | | |
| Composition of Net Assets | | | | |
| Shares of beneficial interest | | $ | 960,944,198 | |
| Total distributable earnings | | | 321,817,762 | |
| | | | |
| Net Assets | | $ | 1,282,761,960 | |
| | | | |
| | | | |
| Net Asset Value Per Share | | | | |
| Series I Shares: | | | | |
| Net asset value, redemption price per share and offering price per share (based on net assets of $555,761,462 and 20,562,344 shares of beneficial interest outstanding) | | | $27.03 | |
| Series II Shares: | | | | |
| Net asset value, redemption price per share and offering price per share (based on net assets of $727,000,498 and 27,223,513 shares of beneficial interest outstanding) | | | $26.70 | |
See accompanying Notes to Financial Statements.
8 INVESCO OPPENHEIMER V.I. MAIN STREET FUND
STATEMENT OF OPERATIONSFor the Six Months Ended June 30, 2019 Unaudited
| | | | |
| Investment Income | | | | |
| Dividends: | | | | |
| Unaffiliated companies (net of foreign withholding taxes of $88,409) | | $ | 11,998,684 | |
| Affiliated companies | | | 274,440 | |
| | | | |
| Total investment income | | | 12,273,124 | |
| Expenses | | | | |
| Management fees | | | 4,078,347 | |
| Administration fees | | | 190,052 | |
| Distribution and service plan fees - Series II shares | | | 876,981 | |
| Transfer and shareholder servicing agent fees: | | | | |
| Series I shares | | | 261,604 | |
| Series II shares | | | 344,092 | |
| Shareholder communications: | | | | |
| Series I shares | | | 14,239 | |
| Series II shares | | | 18,606 | |
| Trustees’ compensation | | | 18,107 | |
| Borrowing fees | | | 15,002 | |
| Custodian fees and expenses | | | 5,548 | |
| Other | | | 50,107 | |
| | | | |
| Total expenses | | | 5,872,685 | |
| Less reduction to custodian expenses | | | (4,880 | ) |
| Less waivers and reimbursements of expenses | | | (67,001 | ) |
| | | | |
| Net expenses | | | 5,800,804 | |
| Net Investment Income | | | 6,472,320 | |
| Realized and Unrealized Gain (Loss) | | | | |
| Net realized gain (loss) on: | | | | |
| Investment transactions (includes net gains from securities sold to affiliates of $1,356,448) | | | 38,975,272 | |
| Foreign currency transactions | | | (1,136 | ) |
| | | | |
| Net realized gain | | | 38,974,136 | |
| Net change in unrealized appreciation/(depreciation) on: | | | | |
| Investment transactions | | | 187,825,971 | |
| Translation of assets and liabilities denominated in foreign currencies | | | 6,310 | |
| | | | |
| Net change in unrealized appreciation/(depreciation) | | | 187,832,281 | |
| Net Increase in Net Assets Resulting from Operations | | $ | 233,278,737 | |
| | | | |
See accompanying Notes to Financial Statements.
9 INVESCO OPPENHEIMER V.I. MAIN STREET FUND
STATEMENTS OF CHANGES IN NET ASSETS
| | | | | | | | |
| | | Six Months Ended June 30, 2019
(Unaudited) | | Year Ended
December 31, 2018 |
| Operations | | | | | | | | |
| Net investment income | | $ | 6,472,320 | | | $ | 11,343,487 | |
| Net realized gain | | | 38,974,136 | | | | 222,465,657 | |
| Net change in unrealized appreciation/(depreciation) | | | 187,832,281 | | | | (328,736,245 | ) |
| | | | |
| Net increase (decrease) in net assets resulting from operations | | | 233,278,737 | | | | (94,927,101 | ) |
| Dividends and/or Distributions to Shareholders | | | | | | | | |
| Distributions to shareholders from distributable earnings: | | | | | | | | |
| Series I shares | | | (93,497,935 | ) | | | (53,341,045 | ) |
| Series II shares | | | (121,555,544 | ) | | | (71,631,264 | ) |
| | | | |
| Total distributions from distributable earnings | | | (215,053,479 | ) | | | (124,972,309 | ) |
| Beneficial Interest Transactions | | | | | | | | |
| Net increase in net assets resulting from beneficial interest transactions: | | | | | | | | |
| Series I shares | | | 62,702,457 | | | | 17,298,831 | |
| Series II shares | | | 85,206,709 | | | | (27,705,526 | ) |
| | | | |
| Total beneficial interest transactions | | | 147,909,166 | | | | (10,406,695 | ) |
| Net Assets | | | | | | | | |
| Total increase (decrease) | | | 166,134,424 | | | | (230,306,105 | ) |
| Beginning of period | | | 1,116,627,536 | | | | 1,346,933,641 | |
| | | | |
| End of period | | $ | 1,282,761,960 | | | $ | 1,116,627,536 | |
| | | | |
See accompanying Notes to Financial Statements.
10 INVESCO OPPENHEIMER V.I. MAIN STREET FUND
FINANCIAL HIGHLIGHTS
| | | | | | | | | | | | | | | | | | | | | | | | |
| Series I Shares | | Six Months
Ended June 30, 2019
(Unaudited) | | Year Ended December 31, 2018 | | Year Ended December 31, 2017 | | Year Ended December 31, 2016 | | Year Ended December 31, 2015 | | Year Ended December 31, 2014 |
| Per Share Operating Data | | | | | | | | | | | | | | | | | | | | | | | | |
| Net asset value, beginning of period | | | $26.82 | | | | $32.25 | | | | $28.41 | | | | $29.24 | | | | $33.61 | | | | $31.24 | |
| Income (loss) from investment operations: | | | | | | | | | | | | | | | | | | | | | | | | |
| Net investment income1 | | | 0.18 | | | | 0.32 | | | | 0.34 | | | | 0.33 | | | | 0.33 | | | | 0.28 | |
| Net realized and unrealized gain (loss) | | | 5.46 | | | | (2.55) | | | | 4.41 | | | | 2.76 | | | | 0.80 | | | | 3.01 | |
| | | | |
| Total from investment operations | | | 5.64 | | | | (2.23) | | | | 4.75 | | | | 3.09 | | | | 1.13 | | | | 3.29 | |
| Dividends and/or distributions to shareholders: | | | | | | | | | | | | | | | | | | | | | | | | |
| Dividends from net investment income | | | (0.34) | | | | (0.38) | | | | (0.39) | | | | (0.34) | | | | (0.32) | | | | (0.27) | |
| Distributions from net realized gain | | | (5.09) | | | | (2.82) | | | | (0.52) | | | | (3.58) | | | | (5.18) | | | | (0.65) | |
| | | | |
| Total dividends and/or distributions to shareholders | | | (5.43) | | | | (3.20) | | | | (0.91) | | | | (3.92) | | | | (5.50) | | | | (0.92) | |
| Net asset value, end of period | | | $27.03 | | | | $26.82 | | | | $32.25 | | | | $28.41 | | | | $29.24 | | | | $33.61 | |
| | | | |
| | | | | | | | | | | | | | | | | | | | | | | | |
| Total Return, at Net Asset Value2 | | | 21.27% | | | | (7.89)% | | | | 16.91% | | | | 11.62% | | | | 3.33% | | | | 10.70% | |
| | | | | | | | | | | | | | | | | | | | | | | | |
| Ratios/Supplemental Data | | | | | | | | | | | | | | | | | | | | | | | | |
| Net assets, end of period (in thousands) | | | $555,761 | | | | $485,230 | | | | $561,555 | | | | $485,196 | | | | $518,456 | | | | $559,933 | |
| Average net assets (in thousands) | | | $538,578 | | | | $543,152 | | | | $535,770 | | | | $502,522 | | | | $541,020 | | | | $554,449 | |
| Ratios to average net assets:3 | | | | | | | | | | | | | | | | | | | | | | | | |
| Net investment income | | | 1.19% | | | | 1.03% | | | | 1.12% | | | | 1.16% | | | | 1.05% | | | | 0.86% | |
| Expenses excluding specific expenses listed below | | | 0.81% | | | | 0.80% | | | | 0.78% | | | | 0.79% | | | | 0.78% | | | | 0.77% | |
| Interest and fees from borrowings | | | 0.00%4 | | | | 0.00%4 | | | | 0.00%4 | | | | 0.00%4 | | | | 0.00%4 | | | | 0.00% | |
| | | | |
| Total expenses5 | | | 0.81% | | | | 0.80% | | | | 0.78% | | | | 0.79% | | | | 0.78% | | | | 0.77% | |
| Expenses after payments, waivers and/or reimbursements and reduction to custodian expenses | | | 0.80% | | | | 0.80%6 | | | | 0.78%6 | | | | 0.79%6 | | | | 0.78%6 | | | | 0.77%6 | |
| Portfolio turnover rate | | | 22% | | | | 65% | | | | 35% | | | | 33% | | | | 44% | | | | 43% | |
1. Per share amounts calculated based on the average shares outstanding during the period.
2. Assumes an initial investment on the business day before the first day of the fiscal period, with all dividends and distributions reinvested in additional shares on the reinvestment date, and redemption at the net asset value calculated on the last business day of the fiscal period. Total returns are not annualized for periods less than one full year. Total return information does not reflect expenses that apply at the separate account level or to related insurance products. Inclusion of these charges would reduce the total return figures for all periods shown. Returns do not reflect the deduction of taxes that a shareholder would pay on fund distributions or the redemption of fund shares.
3. Annualized for periods less than one full year.
4. Less than 0.005%.
5. Total expenses including indirect expenses from affiliated fund fees and expenses were as follows:
| | | | | | | | |
| | Six Months Ended June 30, 2019 | | | 0.81 | % | | |
| | Year Ended December 31, 2018 | | | 0.80 | % | | |
| | Year Ended December 31, 2017 | | | 0.78 | % | | |
| | Year Ended December 31, 2016 | | | 0.79 | % | | |
| | Year Ended December 31, 2015 | | | 0.78 | % | | |
| | Year Ended December 31, 2014 | | | 0.77 | % | | |
6. Waiver was less than 0.005%.
See accompanying Notes to Financial Statements.
11 INVESCO OPPENHEIMER V.I. MAIN STREET FUND
FINANCIAL HIGHLIGHTSContinued
| | | | | | | | | | | | | | | | | | | | | | | | | | | | | | |
| Series II Shares | | Six Months Ended June 30, 2019
(Unaudited) | | Year Ended
December 31, 2018 | | Year Ended December 31, 2017 | | Year Ended December 31, 2016 | | Year Ended December 31, 2015 | | Year Ended December 31, 2014 |
| Per Share Operating Data | | | | | | | | | | | | | | | | | | | | | | | | | | | | | | |
| Net asset value, beginning of period | | | | $26.51 | | | | | $31.91 | | | | | $28.12 | | | | | $28.98 | | | | | $33.33 | | | | | $30.99 | |
| Income (loss) from investment operations: | | | | | | | | | | | | | | | | | | | | | | | | | | | | | | |
| Net investment income1 | | | | 0.14 | | | | | 0.24 | | | | | 0.26 | | | | | 0.26 | | | | | 0.25 | | | | | 0.19 | |
| Net realized and unrealized gain (loss) | | | | 5.40 | | | | | (2.53) | | | | | 4.37 | | | | | 2.72 | | | | | 0.80 | | | | | 2.99 | |
| Total from investment operations | | | | 5.54 | | | | | (2.29) | | | | | 4.63 | | | | | 2.98 | | | | | 1.05 | | | | | 3.18 | |
| Dividends and/or distributions to shareholders: | | | | | | | | | | | | | | | | | | | | | | | | | | | | | | |
| Dividends from net investment income | | | | (0.26) | | | | | (0.29) | | | | | (0.32) | | | | | (0.26) | | | | | (0.22) | | | | | (0.19) | |
| Distributions from net realized gain | | | | (5.09) | | | | | (2.82) | | | | | (0.52) | | | | | (3.58) | | | | | (5.18) | | | | | (0.65) | |
| Total dividends and/or distributions to shareholders | | | | (5.35) | | | | | (3.11) | | | | | (0.84) | | | | | (3.84) | | | | | (5.40) | | | | | (0.84) | |
| Net asset value, end of period | | | | $26.70 | | | | | $26.51 | | | | | $31.91 | | | | | $28.12 | | | | | $28.98 | | | | | $33.33 | |
| | | | | |
| | | | | | | | | | | | | | | | | | | | | | | | | | | | | | | |
| Total Return, at Net Asset Value2 | | | | 21.13% | | | | | (8.10)% | | | | | 16.63% | | | | | 11.30% | | | | | 3.11% | | | | | 10.40% | |
| | | | | | | | | | | | | | | | | | | | | | | | | | | | | | | |
| Ratios/Supplemental Data | | | | | | | | | | | | | | | | | | | | | | | | | | | | | | |
| Net assets, end of period (in thousands) | | | | $727,000 | | | | | $631,398 | | | | | $785,379 | | | | | $772,594 | | | | | $715,328 | | | | | $806,023 | |
| Average net assets (in thousands) | | | | $707,721 | | | | | $740,691 | | | | | $788,342 | | | | | $725,836 | | | | | $757,218 | | | | | $856,467 | |
| Ratios to average net assets:3 | | | | | | | | | | | | | | | | | | | | | | | | | | | | | | |
| Net investment income | | | | 0.94% | | | | | 0.78% | | | | | 0.87% | | | | | 0.94% | | | | | 0.80% | | | | | 0.61% | |
| Expenses excluding specific expenses listed below | | | | 1.06% | | | | | 1.05% | | | | | 1.03% | | | | | 1.04% | | | | | 1.03% | | | | | 1.02% | |
| Interest and fees from borrowings | | | | 0.00%4 | | | | | 0.00%4 | | | | | 0.00%4 | | | | | 0.00%4 | | | | | 0.00%4 | | | | | 0.00% | |
| Total expenses5 | | | | 1.06% | | | | | 1.05% | | | | | 1.03% | | | | | 1.04% | | | | | 1.03% | | | | | 1.02% | |
| Expenses after payments, waivers and/or reimbursements and reduction to custodian expenses | | | | 1.05% | | | | | 1.05%6 | | | | | 1.03%6 | | | | | 1.04%6 | | | | | 1.03%6 | | | | | 1.02%6 | |
| Portfolio turnover rate | | | | 22% | | | | | 65% | | | | | 35% | | | | | 33% | | | | | 44% | | | | | 43% | |
1. Per share amounts calculated based on the average shares outstanding during the period.
2. Assumes an initial investment on the business day before the first day of the fiscal period, with all dividends and distributions reinvested in additional shares on the reinvestment date, and redemption at the net asset value calculated on the last business day of the fiscal period. Total returns are not annualized for periods less than one full year. Total return information does not reflect expenses that apply at the separate account level or to related insurance products. Inclusion of these charges would reduce the total return figures for all periods shown. Returns do not reflect the deduction of taxes that a shareholder would pay on fund distributions or the redemption of fund shares.
3. Annualized for periods less than one full year.
4. Less than 0.005%.
5. Total expenses including indirect expenses from affiliated fund fees and expenses were as follows:
| | | | | | |
| | Six Months Ended June 30, 2019 | | | 1.06 | % |
| | Year Ended December 31, 2018 | | | 1.05 | % |
| | Year Ended December 31, 2017 | | | 1.03 | % |
| | Year Ended December 31, 2016 | | | 1.04 | % |
| | Year Ended December 31, 2015 | | | 1.03 | % |
| | Year Ended December 31, 2014 | | | 1.02 | % |
6. Waiver was less than 0.005%.
See accompanying Notes to Financial Statements.
12 INVESCO OPPENHEIMER V.I. MAIN STREET FUND
NOTES TO FINANCIAL STATEMENTSJune 30, 2019 Unaudited
Note 1 - Organization
Invesco Oppenheimer V.I. Main Street Fund (the “Fund”) is a series portfolio of AIM Variable Insurance Funds (Invesco Variable Insurance Funds) (the “Trust”). The Trust is a Delaware statutory trust registered under the Investment Company Act of 1940, as amended (the “1940 Act”), as anopen-end series management investment company authorized to issue an unlimited number of shares of beneficial interest. Information presented in these financial statements pertains only to the Fund. Matters affecting the Fund or each class will be voted on exclusively by the shareholders of such Fund or each class.
Prior to the close of business on May 24, 2019, the Fund operated as Oppenheimer Main Street Fund/VA (the “Acquired Fund” or “Predecessor Fund”). The Acquired Fund was reorganized after the close of business on May 24, 2019 (the “Reorganization Date”) through the transfer of all of its assets and liabilities to the Fund (the “Reorganization”).
Upon closing of the Reorganization, holders of the Acquired Fund’sNon-Service and Service shares received Series I and Series II shares of the Fund, respectively. Information for the Acquired Fund’sNon-Service and Service shares prior to the Reorganization is included with Series I and Series II, respectively, throughout this report.
The Fund’s investment objective is to seek capital appreciation.
The Fund currently offers two classes of shares, Series I and Series II, both of which are offered to insurance company separate accounts funding variable annuity contracts and variable life insurance policies (“variable products”).
The Fund is an investment company and accordingly follows the investment company accounting and reporting guidance in accordance with Financial Accounting Standards Board Accounting Standards Codification Topic 946, Financial Services – Investment Companies.
The following is a summary of the significant accounting policies followed by the Fund in the preparation of its financial statements.
| A. | | Security Valuations -Securities, including restricted securities, are valued according to the following policy. |
A security listed or traded on an exchange (except convertible securities) is valued at its last sales price or official closing price as of the close of the customary trading session on the exchange where the security is principally traded, or lacking any sales or official closing price on a particular day, the security may be valued at the closing bid price on that day. Securities traded in theover-the-counter market are valued based on prices furnished by independent pricing services or market makers. When such securities are valued by an independent pricing service they may be considered fair valued. Futures contracts are valued at the final settlement price set by an exchange on which they are principally traded. Listed options are valued at the mean between the last bid and asked prices from the exchange on which they are principally traded. Options not listed on an exchange are valued by an independent source at the mean between the last bid and asked prices. For purposes of determining net asset value (“NAV”) per share, futures and option contracts generally are valued 15 minutes after the close of the customary trading session of the New York Stock Exchange (“NYSE”).
Investments inopen-end andclosed-end registered investment companies that do not trade on an exchange are valued at theend-of-day net asset value per share. Investments inopen-end andclosed-end registered investment companies that trade on an exchange are valued at the last sales price or official closing price as of the close of the customary trading session on the exchange where the security is principally traded.
Debt obligations (including convertible securities) and unlisted equities are fair valued using an evaluated quote provided by an independent pricing service. Evaluated quotes provided by the pricing service may be determined without exclusive reliance on quoted prices, and may reflect appropriate factors such asinstitution-size trading in similar groups of securities, developments related to specific securities, dividend rate (for unlisted equities), yield (for debt obligations), quality, type of issue, coupon rate (for debt obligations), maturity (for debt obligations), individual trading characteristics and other market data. Pricing services generally value debt obligations assuming orderly transactions of institutional round lot size, but a fund may hold or transact in the same securities in smaller, odd lot sizes. Odd lots often trade at lower prices than institutional round lots. Debt obligations are subject to interest rate and credit risks. In addition, all debt obligations involve some risk of default with respect to interest and/or principal payments.
Foreign securities’ (including foreign exchange contracts) prices are converted into U.S. dollar amounts using the applicable exchange rates as of the close of the NYSE. If market quotations are available and reliable for foreign exchange-traded equity securities, the securities will be valued at the market quotations. Because trading hours for certain foreign securities end before the close of the NYSE, closing market quotations may become unreliable. If between the time trading ends on a particular security and the close of the customary trading session on the NYSE, events occur that the investment adviser determines are significant and make the closing price unreliable, the Fund may fair value the security. If the event is likely to have affected the closing price of the security, the security will be valued at fair value in good faith using procedures approved by the Board of Trustees. Adjustments to closing prices to reflect fair value may also be based on a screening process of an independent pricing service to indicate the degree of certainty, based on historical data, that the closing price in the principal market where a foreign security trades is not the current value as of the close of the NYSE. Foreign securities’ prices meeting the approved degree of certainty that the price is not reflective of current value will be priced at the indication of fair value from the independent pricing service. Multiple factors may be considered by the independent pricing service in determining adjustments to reflect fair value and may include information relating to sector indices, American Depositary Receipts and domestic and foreign index futures. Foreign securities may have additional risks including exchange rate changes, potential for sharply devalued currencies and high inflation, political and economic upheaval, the relative lack of issuer information, relatively low market liquidity and the potential lack of strict financial and accounting controls and standards.
Securities for which market prices are not provided by any of the above methods may be valued based upon quotes furnished by independent sources. The last bid price may be used to value equity securities. The mean between the last bid and asked prices is used to value debt obligations, including corporate loans.
Securities for which market quotations are not readily available or became unreliable are valued at fair value as determined in good faith by or under the supervision of the Trust’s officers following procedures approved by the Board of Trustees. Issuer specific events, market trends, bid/asked quotes of brokers and information providers and other market data may be reviewed in the course of making a good faith determination of a
13 INVESCO OPPENHEIMER V.I. MAIN STREET FUND
NOTES TO FINANCIAL STATEMENTSUnaudited / Continued
Note 1 - Organization (continued)
security’s fair value.
The Fund may invest in securities that are subject to interest rate risk, meaning the risk that the prices will generally fall as interest rates rise and, conversely, the prices will generally rise as interest rates fall. Specific securities differ in their sensitivity to changes in interest rates depending on their individual characteristics. Changes in interest rates may result in increased market volatility, which may affect the value and/or liquidity of certain Fund investments.
Valuations change in response to many factors including the historical and prospective earnings of the issuer, the value of the issuer’s assets, general economic conditions, interest rates, investor perceptions and market liquidity. Because of the inherent uncertainties of valuation, the values reflected in the financial statements may materially differ from the value received upon actual sale of those investments.
| B. | | Securities Transactions and Investment Income -Securities transactions are accounted for on a trade date basis. Realized gains or losses onsales are computed on the basis of specific identification of the securities sold. Interest income (net of withholding tax, if any) is recorded on the accrual basis from settlement date. Dividend income (net of withholding tax, if any) is recorded on theex-dividend date. |
The Fund may periodically participate in litigation related to Fund investments. As such, the Fund may receive proceeds from litigation settlements. Any proceeds received are included in the Statement of Operations as realized gain (loss) for investments no longer held and as unrealized gain (loss) for investments still held.
Brokerage commissions and mark ups are considered transaction costs and are recorded as an increase to the cost basis of securities purchased and/or a reduction of proceeds on a sale of securities. Such transaction costs are included in the determination of net realized and unrealized gain (loss) from investment securities reported in the Statement of Operations and the Statement of Changes in Net Assets and the net realized and unrealized gains (losses) on securities per share in the Financial Highlights. Transaction costs are included in the calculation of the Fund’s net asset value and, accordingly, they reduce the Fund’s total returns. These transaction costs are not considered operating expenses and are not reflected in net investment income reported in the Statement of Operations and the Statement of Changes in Net Assets, or the net investment income per share and the ratios of expenses and net investment income reported in the Financial Highlights, nor are they limited by any expense limitation arrangements between the Fund and the investment adviser.
The Fund allocates income and realized and unrealized capital gains and losses to a class based on the relative net assets of each class.
| C. | | Country Determination- For the purposes of making investment selection decisions and presentation in the Schedule of Investments, theinvestment adviser may determine the country in which an issuer is located and/or credit risk exposure based on various factors. These factors include the laws of the country under which the issuer is organized, where the issuer maintains a principal office, the country in which the issuer derives 50% or more of its total revenues and the country that has the primary market for the issuer’s securities, as well as other criteria. Among the other criteria that may be evaluated for making this determination are the country in which the issuer maintains 50% or more of its assets, the type of security, financial guarantees and enhancements, the nature of the collateral and the sponsor organization. Country of issuer and/or credit risk exposure has been determined to be the United States of America, unless otherwise noted. |
| D. | | Distributions -Dividends and distributions to shareholders, which are determined in accordance with income tax regulations and may differ fromU.S. GAAP, are recorded on theex-dividend date. Income and capital gain distributions, if any, are declared and paid annually or at other times as determined necessary by the Adviser. |
The tax character of distributions is determined as of the Fund’s fiscal year end. Therefore, a portion of the Fund’s distributions made to shareholders prior to the Fund’s fiscal year end may ultimately be categorized as a tax return of capital.
| E. | | Master Limited Partnerships -The Fund invests in Master Limited Partnerships (“MLPs”). MLPs are publicly traded partnerships and limitedliability companies taxed as partnerships under the Internal Revenue Code of 1986, as amended (the “Internal Revenue Code”). The Fund invests in MLPs engaged in, among other things, the transportation, storage, processing, refining, marketing, exploration, production and mining of minerals and natural resources. The Fund is a partner in each MLP; accordingly, the Fund is required to take into account the Fund’s allocable share of income, gains, losses, deductions, expenses, and tax credits recognized by each MLP. |
MLP’s may be less liquid and subject to more abrupt or erratic price movements than conventional publicly traded securities.
| F. | | Return of Capital -Distributions received from the Fund’s investments in MLPs generally are comprised of income and return of capital. The Fundrecords investment income and return of capital based on estimates made at the time such distributions are received. The return of capital portion of the distribution is a reduction to investment income that results in an equivalent reduction in the cost basis of the associated investments and increases net realized gains (losses) and change in unrealized appreciation (depreciation). Such estimates are based on historical information available from each MLP and other industry sources. These estimates will subsequently be revised and may materially differ primarily based on information received from the MLPs after their tax reporting periods are concluded. |
| G. | | Federal Income Taxes -The Fund intends to comply with provisions of the Internal Revenue Code applicable to regulated investment companiesand to distribute substantially all of its investment company taxable income to shareholders. Therefore, no federal income or excise tax provision is required. The Fund files income tax returns in U.S. federal and applicable state jurisdictions. The statute of limitations on the Fund’s tax return filings generally remains open for the three preceding fiscal reporting period ends. The Fund has analyzed its tax positions for the fiscal year ended December 31, 2018, including open tax years, and does not believe there are any uncertain tax positions requiring recognition in the Fund’s financial statements. |
During the fiscal year ended December 31, 2018, the Fund utilized $16,688 of capital loss carryforwards to offset capital gains realized in that fiscal year. Capital loss carryforwards with no expiration, if any, must be utilized prior to those with expiration dates. Capital losses with no expiration will be carried forward to future years if not offset by gains.
At period end, it is estimated that the capital loss carryforwards would be zero. The estimated capital loss carryforward represents the carryforward as of the end of the last fiscal year, increased or decreased by capital losses or gains realized in the first six months of the current fiscal year. During
14 INVESCO OPPENHEIMER V.I. MAIN STREET FUND
Note 1 - Organization (continued)
the reporting period, it is estimated that the Fund will not utilize any capital loss carryforward to offset realized capital gains.
Net investment income (loss) and net realized gain (loss) may differ for financial statement and tax purposes. The character of dividends and distributions made during the fiscal year from net investment income or net realized gains are determined in accordance with federal income tax requirements, which may differ from the character of net investment income or net realized gains presented in those financial statements in accordance with U.S. GAAP. Also, due to timing of dividends and distributions, the fiscal year in which amounts are distributed may differ from the fiscal year in which the income or net realized gain was recorded by the Fund.
The aggregate cost of securities and other investments and the composition of unrealized appreciation and depreciation of securities and other investments for federal income tax purposes at period end are noted in the following table. The primary difference between book and tax appreciation or depreciation of securities and other investments, if applicable, is attributable to the tax deferral of losses or tax realization of financial statement unrealized gain or loss.
| | | | |
| Total federal tax cost of securities | | $ | 992,609,161 | |
| | | | |
| Gross unrealized appreciation | | $ | 294,262,349 | |
| Gross unrealized depreciation | | | (15,588,389 | ) |
| | | | |
| Net unrealized appreciation | | $ | 278,673,960 | |
| | | | |
| H. | | Expenses -Fees provided for under the Rule12b-1 plan of a particular class of the Fund are charged to the operations of such class. Transfer agencyfees and expenses and other shareholder recordkeeping fees and expenses attributable are allocated to each share class based on relative net assets. Transfer agency fees and expenses and other shareholder recordkeeping fees and expenses relating to all other classes are allocated among those classes based on relative net assets. All other expenses are allocated among the classes based on relative net assets. |
| I. | | Accounting Estimates -The financial statements are prepared on a basis in conformity with accounting principles generally accepted in the UnitedStates of America (“GAAP”), which requires management to make estimates and assumptions that affect the reported amounts of assets and liabilities at the date of the financial statements and the reported amounts of revenues and expenses during the reporting period including estimates and assumptions related to taxation. Actual results could differ from those estimates by a significant amount. In addition, the Fund monitors for material events or transactions that may occur or become known after theperiod-end date and before the date the financial statements are released to print. |
| J. | | Indemnifications -Under the Trust’s organizational documents, each Trustee, officer, employee or other agent of the Trust is indemnified againstcertain liabilities that may arise out of the performance of their duties to the Fund. Additionally, in the normal course of business, the Fund enters into contracts, including the Fund’s servicing agreements, that contain a variety of indemnification clauses. The Fund’s maximum exposure under these arrangements is unknown as this would involve future claims that may be made against the Fund that have not yet occurred. The risk of material loss as a result of such indemnification claims is considered remote. |
| K. | | Foreign Currency Translations -Foreign currency is valued at the close of the NYSE based on quotations posted by banks and major currencydealers. Portfolio securities and other assets and liabilities denominated in foreign currencies are translated into U.S. dollar amounts at the date of valuation. Purchases and sales of portfolio securities (net of foreign taxes withheld on disposition) and income items denominated in foreign currencies are translated into U.S. dollar amounts on the respective dates of such transactions. The Fund does not separately account for the portion of the results of operations resulting from changes in foreign exchange rates on investments and the fluctuations arising from changes in market prices of securities held. The combined results of changes in foreign exchange rates and the fluctuation of market prices on investments (net of estimated foreign tax withholding) are included with the net realized and unrealized gain or loss from investments in the Statement of Operations. Reported net realized foreign currency gains or losses arise from (1) sales of foreign currencies, (2) currency gains or losses realized between the trade and settlement dates on securities transactions, and (3) the difference between the amounts of dividends, interest, and foreign withholding taxes recorded on the Fund’s books and the U.S. dollar equivalent of the amounts actually received or paid. Net unrealized foreign currency gains and losses arise from changes in the fair values of assets and liabilities, other than investments in securities at fiscal period end, resulting from changes in exchange rates. The Fund may invest in foreign securities, which may be subject to foreign taxes on income, gains on investments or currency repatriation, a portion of which may be recoverable. Foreign taxes, if any, are recorded based on the tax regulations and rates that exist in the foreign markets in which the Fund invests and are shown in the Statement of Operations. |
Note 2 - Advisory Fees and Other Fees Paid to Affiliates
The Trust has entered into a master investment advisory agreement with Invesco Advisers, Inc. (the “Adviser” or “Invesco”). Under the terms of the investment advisory agreement, the Fund accrues daily and pays monthly an advisory fee to the Adviser based on the annual rate of the Fund’s average daily net assets as follows:
15 INVESCO OPPENHEIMER V.I. MAIN STREET FUND
NOTES TO FINANCIAL STATEMENTSUnaudited / Continued
Note 2 - Advisory Fees and Other Fees Paid to Affiliates (continued)
| | | | |
| Fee Schedule* | |
| Up to $200 million | | | 0.75 | % |
| Next $200 million | | | 0.72 | |
| Next $200 million | | | 0.69 | |
| Next $200 million | | | 0.66 | |
| Next $200 million | | | 0.60 | |
| Next $4 billion | | | 0.58 | |
| Over $5 billion | | | 0.56 | |
* The advisory fee paid by the Fund shall be reduced by any amounts paid by the Fund under the administrative services agreement with the Adviser.
For the six months ended June 30, 2019, the effective advisory fees incurred by the Fund were 0.66%.
From the beginning of the fiscal period until the date of the Reorganization, the Acquired Fund paid $ 3,249,790 in advisory fees to OFI Global Asset Management, Inc. based on the annual rates above of the Acquired Fund’s average daily net assets.
Under the terms of a mastersub-advisory agreement between the Adviser and each of Invesco Asset Management Deutschland GmbH, Invesco Asset Management Limited, Invesco Asset Management (Japan) Limited, Invesco Hong Kong Limited, Invesco Senior Secured Management, Inc. and Invesco Canada Ltd. and separatesub-advisory agreements with Invesco Capital Management LLC, and Invesco Asset Management (India) Private Limited (collectively, the “AffiliatedSub-Advisers”) the Adviser, not the Fund, will pay 40% of the fees paid to the Adviser to any such AffiliatedSub-Adviser(s) that provide(s) discretionary investment management services to the Fund based on the percentage of assets allocated to suchSub-Adviser(s). Invesco has also entered into aSub-Advisory Agreement with OppenheimerFunds, Inc. to provide discretionary management services to the Funds.
Effective on the Reorganization Date, the Adviser has contractually agreed, through at least May 31, 2021, to waive advisory fees and/or reimburse expenses of all shares to the to the extent necessary to limit the total annual fund operating expenses after fee waiver and/or expense reimbursement (excluding certain items discussed below) of Series I and Series II shares to 0.80% and 1.05%, respectively, of the Fund’s average daily net assets (the “expense limits”). In determining the Adviser’s obligation to waive advisory fees and/or reimburse expenses, the following expenses are not taken into account, and could cause total annual fund operating expenses after fee waivers and/or expense reimbursement to exceed the numbers reflected above: (1) interest; (2) taxes; (3) dividend expenses on short sales; (4) extraordinary ornon-routine items, including litigation expenses; and (5) expenses that the Fund has incurred but did not actually pay because of an expense offset arrangement. Unless Invesco continues the fee waiver agreement, it will terminate May 31, 2021. During its term, the fee waiver agreement cannot be terminated or amended to increase the expense limits or reduce the advisory fee waiver without approval of the Board of Trustees.
Further, the Adviser has contractually agreed, through at least June 30, 2021, to waive the advisory fee payable by the Fund in an amount equal to 100% of the net advisory fees the Adviser receives from the affiliated money market funds on investments by the Fund of uninvested cash in such affiliated money market funds.
For the six months ended June 30, 2019, the Adviser waived advisory fees of $11,733 and reimbursed fund expenses of $18,524 and $36,744 for Series I and Series II shares, respectively.
The Trust has entered into a master administrative services agreement with Invesco pursuant to which the Fund has agreed to pay Invesco for certain administrative costs incurred in providing accounting services to the Fund. For the six months ended June 30, 2019, expenses incurred under the agreement are shown in the Statement of Operations as Administration fees. Additionally, Invesco has entered into service agreements whereby JPMorgan Chase Bank serves as custodian to the Fund. Prior to the Reorganization, the Acquired Fund paid administrative fees to OFI Global Asset Management, Inc.
The Trust has entered into a transfer agency and service agreement with Invesco Investment Services, Inc. (“IIS”) pursuant to which the Fund has agreed to pay IIS a fee for providing transfer agency and shareholder services to the Fund and reimburse IIS for certain expenses incurred by IIS in the course of providing such services. IIS may make payments to intermediaries that provide omnibus account services,sub-accounting services and/or networking services. All fees payable by IIS to intermediaries that provide omnibus account services orsub-accounting services are charged back to the Fund, subject to certain limitations approved by the Trust’s Board of Trustees. Prior to the Reorganization, the Acquired Fund paid transfer agent fees to OFI Global Asset Management, Inc. and Shareholder Services, Inc. For the six months ended June 30, 2019, expenses incurred under these agreements are shown in the Statement of Operations as Transfer and shareholder servicing agent fees.
The Trust has entered into master distribution agreements with Invesco Distributors, Inc. (“IDI”) to serve as the distributor for the Service II shares of the Fund. The Trust has adopted a plan pursuant to Rule12b-1 under the 1940 Act with respect to the Fund’s Service II shares (the “Plan”). The Fund, pursuant to the Plan, pays IDI at an annual rate of 0.25% of the average daily net assets of Service II shares. The fees are accrued daily and paid monthly. Of the Plan payments, up to 0.25% of the average daily net assets of the class of shares may be paid to furnish continuing personal shareholder services to customers who purchase and own shares of such class. Any amounts not paid as a service fee under the Plan would constitute an asset-based sales charge. Rules of the Financial Industry Regulatory Authority (“FINRA”) impose a cap on the total sales charges, including asset-based sales charges, that may be paid by any class of shares of the Fund plans. Prior to the Reorganization, the Acquired Fund paid distribution fees to OppenheimerFunds Distributor, Inc. For the six months ended June 30, 2019, expenses incurred under the plans are shown in the Statement of Operations as Distribution and service plan fees.
Certain officers and trustees of the Trust are officers and directors of the Adviser, IIS and/or IDI.
16 INVESCO OPPENHEIMER V.I. MAIN STREET FUND
Note 3 - Additional Valuation Information
GAAP defines fair value as the price that would be received to sell an asset or paid to transfer a liability in an orderly transaction between market participants at the measurement date, under current market conditions. GAAP establishes a hierarchy that prioritizes the inputs to valuation methods, giving the highest priority to readily available unadjusted quoted prices in an active market for identical assets (Level 1) and the lowest priority to significant unobservable inputs (Level 3), generally when market prices are not readily available or are unreliable. Based on the valuation inputs, the securities or other investments are tiered into one of three levels. Changes in valuation methods may result in transfers in or out of an investment’s assigned level:
Level 1 — Prices are determined using quoted prices in an active market for identical assets.
Level 2 — Prices are determined using other significant observable inputs. Observable inputs are inputs that other market participants may use in pricing a security. These may include quoted prices for similar securities, interest rates, prepayment speeds, credit risk, yield curves, loss severities, default rates, discount rates, volatilities and others.
Level 3 — Prices are determined using significant unobservable inputs. In situations where quoted prices or observable inputs are unavailable (for example, when there is little or no market activity for an investment at the end of the period), unobservable inputs may be used. Unobservable inputs reflect the Fund’s own assumptions about the factors market participants would use in determining fair value of the securities or instruments and would be based on the best available information.
The following is a summary of the tiered valuation input levels, as of June 30, 2019. The level assigned to the securities valuations may not be an indication of the risk or liquidity associated with investing in those securities. Because of the inherent uncertainties of valuation, the values reflected in the financial statements may materially differ from the value received upon actual sale of those investments.
| | | | | | | | | | | | | | | | |
| | | Level 1— Unadjusted Quoted Prices | | Level 2— Other Significant Observable Inputs | | Level 3— Significant Unobservable Inputs | | Value |
| Assets Table | | | | | | | | | | | | | | | | |
| Investments, at Value: | | | | | | | | | | | | | | | | |
| Common Stocks | | | | | | | | | | | | | | | | |
Consumer Discretionary | | $ | 230,242,142 | | | $ | — | | | $ | — | | | $ | 230,242,142 | |
Consumer Staples | | | 88,219,895 | | | | — | | | | — | | | | 88,219,895 | |
Energy | | | 51,044,921 | | | | — | | | | — | | | | 51,044,921 | |
Financials | | | 249,230,861 | | | | 6,142,043 | | | | — | | | | 255,372,904 | |
Health Care | | | 187,805,825 | | | | — | | | | — | | | | 187,805,825 | |
Industrials | | | 130,198,335 | | | | — | | | | — | | | | 130,198,335 | |
Information Technology | | | 255,863,605 | | | | — | | | | — | | | | 255,863,605 | |
Materials | | | 9,899,642 | | | | — | | | | — | | | | 9,899,642 | |
Telecommunication Services | | | 23,040,815 | | | | — | | | | — | | | | 23,040,815 | |
Utilities | | | 17,891,543 | | | | — | | | | — | | | | 17,891,543 | |
| Investment Company | | | 21,703,494 | | | | — | | | | — | | | | 21,703,494 | |
| | | | |
| Total Assets | | $ | 1,265,141,078 | | | $ | 6,142,043 | | | $ | — | | | $ | 1,271,283,121 | |
| | | | |
Forward currency exchange contracts and futures contracts, if any, are reported at their unrealized appreciation/depreciation at measurement date, which represents the change in the contract’s value from trade date. All additional assets and liabilities included in the above table are reported at their market value at measurement date.
Note 4 - Security Transactions with Affiliated Funds
The Fund is permitted to purchase or sell securities from or to certain other Invesco Funds under specified conditions outlined in procedures adopted by the Board of Trustees of the Trust. The procedures have been designed to ensure that any purchase or sale of securities by the Fund from or to another fund or portfolio that is or could be considered an affiliate by virtue of having a common investment adviser (or affiliated investment advisers), common Trustees and/or common officers complies with Rule17a-7 of the 1940 Act. Further, as defined under the procedures, each transaction is effected at the current market price. Pursuant to these procedures for the period January 1, 2019 to May 24, 2019, the Predecessor Fund engaged in transactions with affiliates as listed: Securities sales of $4,383,960, which resulted in net realized gains of $221,208. For the period May 25, 2019 to June 30, 2019, the Fund engaged in transactions with affiliates as listed: Securities sales of $4,858,908, which resulted in net realized gains of $1,135,240.
Note 5 - Expense Offset Arrangement
The expense offset arrangement is comprised of custodian credits which result from periodic overnight cash balances at the custodian. For the six months ended June 30, 2019, the Fund received credits from this arrangement, which resulted in the reduction of the Fund’s total expenses of $4,880.
17 INVESCO OPPENHEIMER V.I. MAIN STREET FUND
NOTES TO FINANCIAL STATEMENTSUnaudited / Continued
Note 6 - Trustee and Officer Fees and Benefits
Certain Trustees have executed a Deferred Compensation Agreement pursuant to which they have the option to elect to defer receipt of all or a portion of the annual compensation they are entitled to receive from the Fund. For purposes of determining the amount owed to the Trustees under the plan, deferred amounts are treated as though equal dollar amounts had been invested in shares of the Fund or in other Invesco and/or Invesco Oppenheimer funds selected by the Trustees. The Fund purchases shares of the funds selected for deferral by the Trustees in amounts equal to his or her deemed investment, resulting in a Fund asset equal to the deferred compensation liability. Such assets are included as a component of “Other” within the asset section of the Statement of Assets and Liabilities. Deferral of Trustees’ fees under the plan will not affect the net assets of the Fund and will not materially affect the Fund’s assets, liabilities or net investment income per share. Amounts will be deferred until distributed in accordance with the compensation deferral plan.
Note 7 - Cash Balances
The Fund is permitted to temporarily carry a negative or overdrawn balance in its account with JP Morgan Chase Bank, the custodian bank. Such balances, if any atperiod-end, are shown in the Statement of Assets and Liabilities under the payable caption Amount due custodian. To compensate the custodian bank for such overdrafts, the overdrawn Fund may either (1) leave funds as a compensating balance in the account so the custodian bank can be compensated by earning the additional interest; or (2) compensate by paying the custodian bank at a rate agreed upon by the custodian bank and Invesco, not to exceed the contractually agreed upon rate.
Note 8 - Investments Transactions
The aggregate amount of investment securities (other than short-term securities, U.S. Treasury obligations and money market funds, if any) purchased and sold by the Fund during the six months ended June 30, 2019 was $264,084,449 and $339,607,020, respectively.
Note 9 - Share Information
Transactions in shares of beneficial interest were as follows:
| | | | | | | | | | | | | | | | |
| | | Six Months Ended June 30, 20191 | | Year Ended December 31, 2018 |
| | | | |
| | | Shares | | Amount | | Shares | | Amount |
| Series I Shares | | | | | | | | | | | | | | | | |
| Sold | | | 348,424 | | | $ | 10,521,024 | | | | 1,272,402 | | | $ | 37,785,582 | |
| Dividends and/or distributions reinvested | | | 3,495,250 | | | | 93,497,935 | | | | 1,802,062 | | | | 53,341,045 | |
| Redeemed | | | (1,376,732 | ) | | | (41,316,502 | ) | | | (2,391,616 | ) | | | (73,827,796 | ) |
| | | | |
| Net increase | | | 2,466,942 | | | $ | 62,702,457 | | | | 682,848 | | | $ | 17,298,831 | |
| | | | |
| | | | | | | | | | | | | | | | | |
| Series II Shares | | | | | | | | | | | | | | | | |
| Sold | | | 1,250,742 | | | $ | 36,629,173 | | | | 2,634,038 | | | $ | 78,888,308 | |
| Dividends and/or distributions reinvested | | | 4,599,150 | | | | 121,555,544 | | | | 2,444,753 | | | | 71,631,264 | |
| Redeemed | | | (2,441,304 | ) | | | (72,978,008 | ) | | | (5,873,057 | ) | | | (178,225,098 | ) |
| | | | |
| Net increase (decrease) | | | 3,408,588 | | | $ | 85,206,709 | | | | (794,266 | ) | | $ | (27,705,526 | ) |
| | | | |
1.There are entities that are record owners of more than 5% of the outstanding shares of the Fund and own 51% of the outstanding shares of the Fund. The Fund and the Fund’s principalunderwriter or adviser, are parties to participation agreements with these entities whereby these entities sell units of interest in separate accounts funding variable products that are invested in the Fund. The Fund, Invesco and/or Invesco affiliates may make payments to these entities, which are considered to be related to the Fund, for providing services to the Fund, Invesco and/or Invesco affiliates, including, but not limited to services such as securities brokerage, distribution, third party record keeping and account servicing. The Fund has no knowledge as to whether all or any portion of the shares owned of record by these entities are also owned beneficially.
In addition, 7% of the outstanding shares of the Fund are owned by the Adviser or an affiliate of the Adviser.
Note 10 - Borrowings
Joint Credit Facility.A number of mutual funds managed by the Adviser participate in a $1.95 billion revolving credit facility (the “Facility”) intendedto provide short-term financing, if necessary, subject to certain restrictions in connection with atypical redemption activity. Expenses and fees related to the Facility are paid by the participating funds and are disclosed separately or as other expenses on the Statement of Operations. The Fund did not utilize the Facility during the reporting period. The Facility terminated May 24, 2019.
18 INVESCO OPPENHEIMER V.I. MAIN STREET FUND
Note 11 - Independent Registered Public Accounting Firm
The Audit Committee of the Board of Trustees appointed, and the Board of Trustees ratified and approved, PricewaterhouseCoopers LLP (“PWC”) as the independent registered public accounting firm of the Fund for the fiscal periods ending after May 24, 2019. Prior to the close of business on May 24, 2019, the Predecessor Fund was a separate series of an unaffiliated investment company and its financial statements were audited by a different independent registered public accounting firm (the “Prior Auditor”).
Effective after the close of business on May 24, 2019, the Prior Auditor resigned as the independent registered public accounting firm of the Fund. The Prior Auditor’s report on the financial statements of the Predecessor Fund for the past two fiscal years did not contain an adverse or disclaimer of opinion, and was not qualified or modified as to uncertainty, audit scope or accounting principles. During the Predecessor Fund’s two most recent fiscal years and through the close of business on May 24, 2019, there were no (1) disagreements with the Prior Auditor on any matter of accounting principles or practices, financial statement disclosure, or auditing scope or procedure, which disagreements, if not resolved to the Prior Auditor’s satisfaction, would have caused it to make reference to that matter in connection with its report; or (2) “reportable events,” as that term is defined in Item 304(a)(1)(v) of RegulationS-K under the Securities Exchange Act of 1934.
19 INVESCO OPPENHEIMER V.I. MAIN STREET FUND
APPROVAL OF THE INVESTMENT ADVISORY ANDSUB-ADVISORY CONTRACTSUnaudited
At meetings held on December 14, 2018, the Board of Trustees (the Board or the Trustees) of AIM Variable Insurance Funds (Invesco Variable Insurance Funds) (the Trust) as a whole, and the independent Trustees, who comprise over 75% of the Board, voting separately, approved (i) an amendment to the Trust’s Master Investment Advisory Agreement with Invesco Advisers, Inc. (Invesco Advisers and the investment advisory agreement) to add Invesco Oppenheimer V.I. Main Street Fund® (the Fund), (ii) an amendment to the Master IntergroupSub-Advisory Contract for Mutual Funds with Invesco Asset Management Deutschland GmbH, Invesco Asset Management Limited, Invesco Asset Management (Japan) Limited, Invesco Hong Kong Limited, Invesco Senior Secured Management, Inc. and Invesco Canada Ltd. to add the Fund, (iii) an amendment to the separatesub-advisory contract with Invesco Capital Management LLC to add the Fund, (iv) an amendment to the separatesub-advisory contract with Invesco Asset Management (India) Private Limited to add the Fund, and (v) an initialsub-advisory contract with OppenheimerFunds, Inc. (collectively, the AffiliatedSub-Advisers and thesub-advisory contracts). Additionally, on March 26, 2019, the Boardre-approved an initialsub-advisory contract with OppenheimerFunds, Inc. following its change of control as a result of the acquisition of OppenheimerFunds, Inc. and its subsidiaries, including the Oppenheimer mutual funds (each, an Oppenheimer Fund), by Invesco Ltd. (the OFI Transaction). After evaluating the factors discussed below, among others, the Board approved the Fund’s investment advisory agreement and thesub-advisory contracts and determined that the compensation payable by the Fund to Invesco Advisers and by Invesco Advisers to the AffiliatedSub-Advisers is fair and reasonable.
The Board’s Evaluation Process
The Board noted that it had previously approved establishing the Fund at the Board meeting held on October 23, 2018 and that the Fund was formed to acquire the assets and liabilities of an Oppenheimer Fund (the Acquired Fund) with the same investment objective and substantially similar principal investment strategies and risks. At the time of approval, the Fund had no assets and no performance history and the portfolio managers were not employed by Invesco Advisers or any of the AffiliatedSub-Advisers except OppenheimerFunds, Inc., which was not affiliated with Invesco at that time.
In approving the investment advisory agreement andsub-advisory contracts, the Board followed a process similar to the process that it follows in annually reviewing and approving investment advisory agreements andsub-advisory contracts for the series portfolios of funds advised by Invesco Advisers and considered the information provided in the most recent annual review process for those funds as well as the information provided with respect to the Fund. As part of the approval process, the Board reviewed and considered information provided in response to detailed requests for information submitted to management by the independent Trustees with assistance from legal counsel to the independent Trustees. The Board reviewed comparative investment performance and fee data prepared by Invesco Advisers and an independent mutual fund data provider. The Board was assisted in its review by the Senior Officer, an officer of the Invesco Funds who reports directly to the independent Trustees, and by independent legal counsel.
The discussion below serves as a summary of the material factors and related conclusions that formed the basis for the Board’s approval of the Fund’s investment advisory agreement andsub-advisory contracts. The Trustees’ review and conclusions are based on the comprehensive consideration of all information presented to them and are not the result of any single determinative factor. Moreover, one Trustee may have weighed a particular piece of information or factor differently than another Trustee. This information is current as of December 14, 2018 and March 26, 2019 for thesub-advisory contract with OppenheimerFunds, Inc.
Factors and Conclusions and Summary of Independent Written Fee Evaluation
A. Nature, Extent and Quality of Services Provided by Invesco Advisers and the AffiliatedSub-Advisers
The Board reviewed the nature, extent and quality of the advisory services to be provided to the Fund by Invesco Advisers under the Fund’s investment advisory agreement, and the credentials and experience of the officers and employees of Invesco Advisers who will provide these services. The Board’s review included consideration of the investment process oversight and structure, credit analysis and investment risk management to be employed in providing advisory services to the Fund. The Board also considerednon-advisory services that Invesco Advisers and its affiliates provide to the Invesco Funds and will provide to the Fund, such as various back office support functions, third party oversight, internal audit, valuation, portfolio trading and legal and compliance. The Board also received and reviewed information about Invesco Advisers’ role as administrator of the Invesco Funds’ liquidity risk management program. The Board also reviewed and considered the benefits to shareholders of investing in a fund that is part of the Invesco family of funds under the umbrella of Invesco Ltd., Invesco Advisers’ parent company, and noted Invesco Ltd.’s depth and experience in conducting an investment management business, as well as its commitment of financial and other resources to such business. The Board reviewed and considered information about the resources that Invesco Advisers intends to continue to commit to managing the Invesco family of funds, including the Fund, following the OFI Transaction. The Board concluded that the nature, extent and quality of the services to be provided to the Fund by Invesco Advisers are appropriate and satisfactory.
The Board reviewed the services that may be provided by the AffiliatedSub-Advisers under thesub-advisory contracts and the credentials and experience of the officers and employees of the AffiliatedSub-Advisers who provide these services. The Board noted the AffiliatedSub-Advisers’ expertise with respect to certain asset classes and that the AffiliatedSub-Advisers have offices and personnel that are located in financial centers around the world. As a result, the Board noted that the AffiliatedSub-Advisers can provide research and investment analysis on the markets and economies of various countries in which the Fund may invest, make recommendations regarding securities and assist with security trades. The Board concluded that thesub-advisory contracts may benefit the Fund and its shareholders by permitting Invesco Advisers to use the resources and talents of the AffiliatedSub-Advisers in managing the Fund. The Board concluded that the nature, extent and quality of the services that may be provided by the AffiliatedSub-Advisers are appropriate and satisfactory.
20 INVESCO OPPENHEIMER V.I. MAIN STREET FUND
APPROVAL OF THE INVESTMENT ADVISORY AND SUB-ADVISORY CONTRACTSUnaudited / Continued
B. Fund Investment Performance
The Board noted that the Fund would continue the historical performance information of the Acquired Fund following the consummation of the OFI Transaction. The Board considered the performance of the Acquired Fund and the fact that, at the closing of the OFI Transaction, management anticipates that the Fund will be managed pursuant to substantially similar investment strategies and by substantially the same portfolio management team as managed the Acquired Fund. The Board did not view Fund performance as a relevant factor in considering whether to approve thesub-advisory contracts for the Fund, as no AffiliatedSub-Adviser currently manages assets of the Fund.
The Board compared the Fund’s investment performance over multiple time periods ending December 31, 2017 to the performance of funds in the Morningstar performance universe and against the Fund’s benchmark index. The Trustees also reviewed more recent Fund performance and this review did not change their conclusions.
C. Advisory andSub-Advisory Fees and Fund Expenses
The Board compared the Fund’s contractual management fee rate to the contractual management fee rates of funds in the Fund’s Morningstar expense group. The Board also considered comparative information regarding the Fund’s total expense ratio and its various components.
The Board noted that Invesco Advisers has contractually agreed to waive fees and/or limit expenses of the Fund for at least two years from the closing date of the OFI Transaction in an amount necessary to limit total annual operating expenses to a specified percentage of average daily net assets for each class of the Fund.
The Board also considered the fees charged by Invesco Advisers and the AffiliatedSub-Advisers to other similarly managed client accounts. The Board noted that Invesco Advisers or the AffiliatedSub-Advisers may charge lower fees to large institutional clients. Invesco Advisers reviewed with the Board differences in the scope of services it provides to the Invesco Funds relative to certain other types of client accounts, including management of cash flows as a result of redemptions and purchases, necessary infrastructure such as officers, office space, technology, legal and distribution, oversight of service providers, costs and business risks associated with launching new funds and sponsoring and maintaining the product line, preparation of annual registration statement updates and financial information and compliance with federal and state laws and regulations.
The Board also considered the services that may be provided by the AffiliatedSub-Advisers pursuant to thesub-advisory contracts, as well as the fees payable by Invesco Advisers to the AffiliatedSub-Advisers pursuant to thesub-advisory contracts.
D. Economies of Scale and Breakpoints
The Board considered the extent to which there may be economies of scale in the provision of advisory services to the Fund. The Board considered Invesco’s reinvestment in its business, including investments in business infrastructure and cybersecurity. The Board also considered that the Fund may benefit from economies of scale through contractual breakpoints in the Fund’s advisory fee schedule, which generally operate to reduce the Fund’s expense ratio as it grows in size. The Board noted that the Fund will share directly in economies of scale through lower fees charged by third party service providers based on the combined size of the Invesco Funds. The Board noted that the Fund may also benefit from economies of scale through initial fee setting, fee waivers and expense reimbursements.
E. Profitability and Financial Resources
The Board reviewed information from the 2018 contract renewal process provided by Invesco Advisers concerning the costs of the advisory and other services that Invesco Advisers and its affiliates provide to the Invesco Funds and the profitability of Invesco Advisers and its affiliates in providing these services. The Board considered the methodology used for calculating profitability and noted the periodic review of such methodology by an independent consultant. The Board noted that Invesco Advisers will continue to operate at a net profit from services Invesco Advisers and its affiliates provide to the Invesco Funds. The Board did not deem the level of profits realized by Invesco Advisers and its affiliates from providing services to the Invesco Funds, and the profits estimated to be realized by the Fund, to be excessive given the nature, extent and quality of the services provided. The Board received information from Invesco Advisers demonstrating that Invesco Advisers and the AffiliatedSub-Advisers are financially sound and have the resources necessary to perform their obligations under the investment advisory agreement andsub-advisory contracts.
F. Collateral Benefits to Invesco Advisers and its Affiliates
The Board considered various other benefits to be received by Invesco Advisers and its affiliates from the relationship with the Fund, including the fees to be received for providing administrative, transfer agency and distribution services to the Fund. The Board considered the performance of Invesco Advisers and its affiliates in providing these services to other Invesco Funds and the organizational structure employed to provide these services. The Board also considered that these services will be provided to the Fund pursuant to written contracts that are reviewed and approved on an annual basis by the Board; and that the services are required for the operation of the Fund.
The Board considered the benefits realized by Invesco Advisers and the AffiliatedSub-Advisers as a result of portfolio brokerage transactions executed through “soft dollar” arrangements. The Board noted that soft dollar arrangements may result in the Fund bearing costs to purchase research that may be used by Invesco Advisers or the AffiliatedSub-Advisers with other clients and may reduce Invesco Advisers’ or the AffiliatedSub-Advisers’ expenses. The Board also considered that it will receive periodic reports from Invesco representing that these arrangements are consistent with regulatory requirements. The Board did not deem the soft dollar arrangements to be inappropriate.
21 INVESCO OPPENHEIMER V.I. MAIN STREET FUND
APPROVAL OF THE INVESTMENT ADVISORY AND SUB-ADVISORY CONTRACTSUnaudited / Continued
The Board considered that the Fund’s uninvested cash and cash collateral from any securities lending arrangements may be invested in money market funds advised by Invesco Advisers pursuant to procedures approved by the Board. The Board considered that Invesco Advisers will receive advisory fees from these affiliated money market funds attributable to such investments, although Invesco Advisers has contractually agreed to waive through varying periods the advisory fees payable by the Invesco Funds with respect to certain investments in the affiliated money market funds. The waiver is in an amount equal to 100% of the net advisory fee Invesco Advisers will receive from the affiliated money market funds with respect to the Fund’s investment in the affiliated money market funds of uninvested cash, but not cash collateral. The Board concluded that the amount of advisory fees to be received by Invesco Advisers from the Fund’s investment of cash collateral from any securities lending arrangements in the affiliated money market funds is fair and reasonable.
The Board also considered that an affiliated broker may receive commissions for executing certain trades for the Fund. Invesco Advisers and the AffiliatedSub-Advisers may use the affiliated broker to, among other things, control order routing and minimize information leakage, and the Board was be advised that such trades will be executed in compliance with rules under the federal securities laws and consistent with best execution obligations.
22 INVESCO OPPENHEIMER V.I. MAIN STREET FUND
PORTFOLIO PROXY VOTING POLICIES AND GUIDELINES; UPDATES TO STATEMENT OF INVESTMENTSUnaudited
Go paperless with eDelivery
Visit invesco.com/edelivery to enjoy the convenience and security of anytime electronic access to your investment documents.
With eDelivery, you can elect to have any or all of the following materials delivered straight to your inbox to download, save and print from your own computer:
| · | | Fund reports and prospectuses |
Invesco mailing information
Send general correspondence to Invesco Investment Services, Inc., P.O. Box 219078, Kansas City, MO 64121-9078.
Important notice regarding delivery of security holder documents
To reduce Fund expenses, only one copy of most shareholder documents may be mailed to shareholders with multiple accounts at the same address (Householding). Mailing of your shareholder documents may be householded indefinitely unless you instruct us otherwise. If you do not want the mailing of these documents to be combined with those for other members of your household, please contact Invesco Investment Services, Inc. at 800 959 4246 or contact your financial institution. We will begin sending you individual copies for each account within 30 days after receiving your request.
Fund holdings and proxy voting information
The Fund provides a complete list of its holdings four times in each fiscal year, at the quarter ends. For the second and fourth quarters, the lists appear in the Fund’s semiannual and annual reports to shareholders. For the first and third quarters, the Fund files the lists with the Securities and Exchange Commission (SEC) on FormN-Q (or any successor Form). The most recent list of portfolio holdings is available at invesco.com/completeqtrholdings. Shareholders can also look up the Fund’s FormsN-Q (or any successor Form) on the SEC website at sec.gov.
A description of the policies and procedures that the Fund uses to determine how to vote proxies relating to portfolio securities is available without charge, upon request, from our Client Services department at 800 959 4246 or at invesco.com/proxyguidelines. The information is also available on the SEC website, sec.gov.
Information regarding how the Fund voted proxies related to its portfolio securities during the most recent12-month period ended June 30 is available at invesco.com/proxysearch. The information is also available on the SEC website, sec.gov.
Invesco Advisers, Inc. is an investment adviser; it provides investment advisory services to individual and institutional clients and does not sell securities. Invesco Distributors, Inc. is the US distributor for Invesco Ltd.’s retail mutual funds, exchange-traded funds and institutional money market funds. Both are wholly owned, indirect subsidiaries of Invesco Ltd.
23 INVESCO OPPENHEIMER V.I. MAIN STREET FUND
SPECIAL SHAREHOLDER MEETINGUnaudited
A Special Meeting (“Meeting”) of Shareholders Invesco Oppenheimer V.I. Main Street Fund® was held on April 12, 2019. The Meeting was held for the following purpose:
(1) Approval of an Agreement and Plan of Reorganization that provides for the reorganization of Oppenheimer Main Street Fund®/VA into Invesco Oppenheimer V.I. Main Street Fund®.
The results of the voting on the above matter was as follows:
| | | | | | | | | | | | | | | | |
Matter | | Votes For | | | Votes
Against | | | Votes
Abstain | | | Broker
Non-Votes | |
| (1) Approval of an Agreement and Plan of Reorganization | | | 32,898,983 | | | | 1,290,052 | | | | 3,005,623 | | | | 0 | |
24 INVESCO OPPENHEIMER V.I. MAIN STREET FUND
THIS PAGE INTENTIONALLY LEFT BLANK.
THIS PAGE INTENTIONALLY LEFT BLANK.
THIS PAGE INTENTIONALLY LEFT BLANK.

| | | | |
 | | Semiannual Report | | 6/30/2019 |
| | |
| | Invesco Oppenheimer V.I. Main Street Small Cap Fund* The Fund provides a complete list of its holdings four times in each fiscal year, at the quarter ends. For the second and fourth quarters, the lists appear in the Fund’s semi annual and annual reports to shareholders. For the first and third quarters, the Fund files the lists with the Securities and Exchange Commission (SEC) on FormN-Q (or any successor Form). The Fund’s FormN-Q (or any successor Form) filings are available on the SEC website, sec.gov. The Fund’s most recent portfolio holdings, as filed on FormN-Q (or any successor Form), have also been made available to insurance companies issuing variable annuity contracts and variable life insurance policies (“variable products”) that invest in the Fund. A description of the policies and procedures that the Fund uses to determine how to vote proxies relating to portfolio securities is available without charge, upon request, from our Client Services department at 800 959 4246 or at invesco.com/proxyguidelines. The information is also available on the SEC website, sec.gov. Information regarding how the Fund voted proxies related to its portfolio securities during the most recent12-month period ended June 30 is available at invesco.com/proxysearch. The information is also available on the SEC website, sec.gov. Invesco Advisers, Inc. is an investment adviser; it provides investment advisory services to individual and institutional clients and does not sell securities. Invesco Distributors, Inc. is the US distributor for Invesco Ltd.’s retail mutual funds, exchange-traded funds and institutional money market funds. Both are wholly owned, indirect subsidiaries of Invesco Ltd. This report must be accompanied or preceded by a currently effective Fund prospectus and variable product prospectus, which contain more complete information, including sales charges and expenses. Investors should read each carefully before investing. *Prior to the close of business on May 24, 2019, the Fund’s name was Oppenheimer Main Street Small Cap Fund/VA. See Important Update on the following page for more information. |
Important Update
On October 18, 2018, Massachusetts Mutual Life Insurance Company, an indirect corporate parent of OppenheimerFunds, Inc. and its subsidiaries OFI Global Asset Management, Inc., OFI SteelPath, Inc. and OFI Advisors, LLC, announced that it had entered into an agreement whereby Invesco Ltd., a global investment management company would acquire OppenheimerFunds and its subsidiaries (together, “OppenheimerFunds”). After the close of business on May 24, 2019 Invesco Ltd. completed the acquisition of OppenheimerFunds. This Fund was included in that acquisition and as of that date, became part of the Invesco family of funds. Please visit invesco.com for more information or call Invesco’s Client Services team at800-959-4246.
PORTFOLIO MANAGERS:Matthew P. Ziehl, CFA, Raymond Anello, CFA, Raman Vardharaj, CFA, Joy Budzinski, Kristin Ketner, Magnus Krantz and AdamWeiner.
AVERAGE ANNUAL TOTAL RETURNS FOR THE PERIODS ENDED 6/30/19
| | | | | | | | | | | | | | | | | | | | |
| | | Inception | | | | | | | | | | | | | |
| | | Date | | | 6-Months | | | 1-Year | | | 5-Year | | | 10-Year | |
| Series I Shares* | | | 5/1/98 | | | | 15.84% | | | | -3.85 | % | | | 7.13 | % | | | 13.63 | % |
| Series II Shares* | | | 7/16/01 | | | | 15.66 | | | | -4.11 | | | | 6.86 | | | | 13.34 | |
| Russell 2000 Index | | | | | | | 16.98 | | | | -3.31 | | | | 7.06 | | | | 13.45 | |
Performance quoted is past performance and cannot guarantee comparable future results; current performance may be lower or higher.Visit invesco.com for the most recentmonth-end performance. Performance figures reflect reinvested distributions and changes in net assetvalue (NAV). Investment return and principal value will vary so that you may have a gain or a loss when you sell shares. Fund returns include changes in share price, reinvested distributions and sales charges except where “without sales charge” is indicated. Effective after the close of business on May 24, 2019, theNon-Service and Service share classes of the predecessor fund were reorganized into Series I and Series II Shares, respectively, of the Fund. Returns shown for Series I and Series II shares are blended returns of the predecessor fund and the Fund. Share class returns will differ from those of the predecessor fund because of different expenses. See Fund prospectuses and summary prospectuses for more information on share classes, sales charges and new fee agreements, if any. Fund literature is available at invesco.com.
The Fund’s performance is compared to the performance of the Russell 2000 Index, which measures the performance of thesmall-cap segment of the U.S. equity universe. The Russell 2000 Index is a subset of the Russell 3000 Index representing approximately 10% of the total market capitalization of that index. It includes approximately 2000 of the smallest securities based on a combination of their market cap and current index membership. The Index is unmanaged and cannot be purchased directly by investors. While index comparisons may be useful to provide a benchmark for the Fund’s performance, it must be noted that the Fund’s investments are not limited to the investments comprising the Index. Index performance includes reinvestment of income, but does not reflect transaction costs, fees, expenses or taxes. Index performance is shown for illustrative purposes only as a benchmark for the Fund’s performance, and does not predict or depict performance of the Fund. The Fund’s performance reflects the effects of the Fund’s business and operating expenses.
TOP HOLDINGS AND ALLOCATIONS
TOP TEN COMMON STOCK HOLDINGS
| | | | |
| Zynga, Inc., Cl. A | | | 2.5 | % |
| Korn Ferry | | | 2.0 | |
| ASGN, Inc. | | | 2.0 | |
| CACI International, Inc., Cl. A | | | 2.0 | |
| WSFS Financial Corp. | | | 1.9 | |
| j2 Global, Inc. | | | 1.9 | |
| Generac Holdings, Inc. | | | 1.8 | |
| Four Corners Property Trust, Inc. | | | 1.8 | |
| National Storage Affiliates Trust | | | 1.7 | |
| LHC Group, Inc. | | | 1.7 | |
Portfolio holdings and allocations are subject to change. Percentages are as of June 30, 2019, and are based on net assets.
SECTOR ALLOCATION
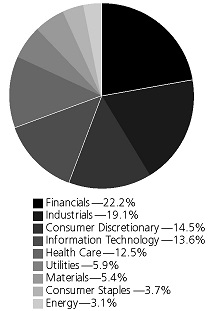
Portfolio holdings and allocations are subject to change. Percentages are as of June 30, 2019, and are based on the total market value of common stocks.
For more current Fund holdings, please visit invesco.com.
3 INVESCO OPPENHEIMER V.I. MAIN STREET SMALL CAP FUND
*Effective after the close of business on May 24, 2019, theNon-Service and Service share classes of the predecessor fund were reorganized into Series I and Series II Shares, respectively, of the Fund. Returns shown for Series I and Series II shares are blended returns of the predecessor fund and the Fund. Share class returns will differ from those of the predecessor fund because of different expenses.
Before investing, investors should carefully read the prospectus and/or summary prospectus and carefully consider the investment objectives, risks, charges and expenses. For this and more complete information about the fund(s), investors should ask their advisors for a prospectus/summary prospectus or visit invesco.com/fundprospectus.
Shares of Invesco funds are not deposits or obligations of any bank, are not guaranteed by any bank, are not insured by the FDIC or any other agency, and involve investment risks, including the possible loss of the principal amount invested.
4 INVESCO OPPENHEIMER V.I. MAIN STREET SMALL CAP FUND
Fund Expenses
Fund Expenses.As a shareholder of the Fund, you incur two types of costs: (1) transaction costs and (2) ongoing costs, including management fees;distribution and service fees; and other Fund expenses. These examples are intended to help you understand your ongoing costs (in dollars) of investing in the Fund and to compare these costs with the ongoing costs of investing in other mutual funds.
The examples are based on an investment of $1,000.00 invested at the beginning of the period and held for the entire6-month period ended June 30, 2019.
Actual Expenses.The first section of the table provides information about actual account values and actual expenses. You may use the information inthis section for the class of shares you hold, together with the amount you invested, to estimate the expense that you paid over the period. Simply divide your account value by $1,000.00 (for example, an $8,600.00 account value divided by $1,000.00 = 8.60), then multiply the result by the number in the first section under the heading entitled “Expenses Paid During 6 Months Ended June 30, 2019” to estimate the expenses you paid on your account during this period.
Hypothetical Example for Comparison Purposes.
The second section of the table provides information about hypothetical account values and hypothetical expenses based on the Fund’s actual expense ratio for each class of shares, and an assumed rate of return of 5% per year for each class before expenses, which is not the actual return. The hypothetical account values and expenses may not be used to estimate the actual ending account balance or expenses you paid for the period. You may use this information to compare the ongoing costs of investing in the Fund and other funds. To do so, compare this 5% hypothetical example for the class of shares you hold with the 5% hypothetical examples that appear in the shareholder reports of the other funds.
Please note that the expenses shown in the table are meant to highlight your ongoing costs only and do not reflect any charges associated with the separate accounts that offer this Fund. Therefore, the “hypothetical” lines of the table are useful in comparing ongoing costs only, and will not help you determine the relative total costs of owning different funds. In addition, if these separate account charges were included your costs would have been higher.
| | | | | | | | | | | | |
| | | Beginning | | | Ending | | | Expenses | |
| | | Account | | | Account | | | Paid During | |
| | | Value | | | Value | | | 6 Months Ended | |
| Actual | | January 1, 2019 | | | June 30, 2019 | | | June 30, 2019 | |
| Series I shares | | $ | 1,000.00 | | | $ | 1,158.40 | | | $ | 4.29 | |
| Series II shares | | | 1,000.00 | | | | 1,156.60 | | | | 5.63 | |
| | | |
Hypothetical (5% return before expenses) | | | | | | | | | | | | |
| Series I shares | | | 1,000.00 | | | | 1,020.83 | | | | 4.02 | |
| Series II shares | | | 1,000.00 | | | | 1,019.59 | | | | 5.27 | |
Expenses are equal to the Fund’s annualized expense ratio for that class, multiplied by the average account value over the period, multiplied by 181/365 (to reflect theone-half year period). Those annualized expense ratios, excluding indirect expenses from affiliated funds, based on the6-month period ended June 30, 2019 are as follows:
| | | | |
| Class | | Expense Ratios | |
| Series I shares | | | 0.80% | |
| Series II shares | | | 1.05 | |
The expense ratios reflect voluntary and/or contractual waivers and/or reimbursements of expenses by the Fund’s Manager. Some of these undertakings may be modified or terminated at any time, as indicated in the Fund’s prospectus. The “Financial Highlights” tables in the Fund’s financial statements, included in this report, also show the gross expense ratios, without such waivers or reimbursements and reduction to custodian expenses, if applicable.
5 INVESCO OPPENHEIMER V.I. MAIN STREET SMALL CAP FUND
STATEMENT OF INVESTMENTSJune 30, 2019 Unaudited
| | | | | | | | |
| | | Shares | | | Value | |
| Common Stocks—99.1% | | | | | | | | |
| Consumer Discretionary—14.3% | | | | | | |
| Auto Components—2.6% | | | | | | |
Dorman Products, Inc.1 | | | 135,020 | | | $ | 11,765,643 | |
Visteon Corp.1 | | | 212,290 | | | | 12,435,948 | |
| | | | | | | 24,201,591 | |
Diversified Consumer Services—0.9% | |
Houghton Mifflin Harcourt Co.1 | | | 1,392,250 | | | | 8,019,360 | |
Entertainment—2.5% | | | | | | | | |
Zynga, Inc., Cl. A1 | | | 3,813,067 | | | | 23,374,101 | |
Hotels, Restaurants & Leisure—3.8% | | | | | | | | |
Jack in the Box, Inc. | | | 147,040 | | | | 11,967,585 | |
Texas Roadhouse, Inc., Cl. A | | | 247,200 | | | | 13,267,224 | |
Wendy’s Co. (The) | | | 517,660 | | | | 10,135,783 | |
| | | | | | | 35,370,592 | |
Household Durables—1.1% | | | | | | | | |
TopBuild Corp.1 | | | 123,280 | | | | 10,202,653 | |
Internet & Catalog Retail—0.9% | | | | | | | | |
Etsy, Inc.1 | | | 143,470 | | | | 8,804,754 | |
Specialty Retail—2.5% | | | | | | | | |
AutoNation, Inc.1 | | | 279,580 | | | | 11,725,585 | |
Monro, Inc. | | | 138,290 | | | | 11,796,137 | |
| | | | | | | 23,521,722 | |
Consumer Staples—3.7% | | | | | | | | |
Food & Staples Retailing—1.5% | | | | | | | | |
BJ’s Wholesale Club Holdings, Inc.1 | | | 516,570 | | | | 13,637,448 | |
Household Products—1.2% | | | | | | | | |
| Energizer Holdings, Inc. | | | 282,970 | | | | 10,933,961 | |
Personal Products—1.0% | | | | | | | | |
| Nu Skin Enterprises, Inc., Cl. A | | | 190,190 | | | | 9,380,171 | |
Energy—3.1% | | | | | | | | |
Oil, Gas & Consumable Fuels—3.1% | | | | | | | | |
Matador Resources Co.1 | | | 588,253 | | | | 11,694,470 | |
Noble Midstream Partners LP2 | | | 236,906 | | | | 7,879,493 | |
Range Resources Corp. | | | 573,960 | | | | 4,006,241 | |
Renewable Energy Group, Inc.1 | | | 339,319 | | | | 5,381,599 | |
| | | | | | | 28,961,803 | |
Financials—21.8% | | | | | | | | |
Capital Markets—2.6% | | | | | | | | |
Federated Investors, Inc., Cl. B | | | 219,460 | | | | 7,132,450 | |
Focus Financial Partners, Inc., Cl. A1 | | | 135,600 | | | | 3,703,236 | |
Stifel Financial Corp. | | | 233,330 | | | | 13,780,470 | |
| | | | | | | 24,616,156 | |
Commercial Banks—7.8% | | | | | | | | |
Bank of NT Butterfield & Son Ltd. (The) | | | 270,800 | | | | 9,196,368 | |
BankUnited, Inc. | | | 137,525 | | | | 4,640,093 | |
Berkshire Hills Bancorp, Inc. | | | 241,770 | | | | 7,589,160 | |
Cathay General Bancorp | | | 170,570 | | | | 6,125,169 | |
Chemical Financial Corp. | | | 216,006 | | | | 8,880,007 | |
Customers Bancorp, Inc.1 | | | 236,910 | | | | 4,975,110 | |
Heritage Financial Corp. | | | 256,240 | | | | 7,569,330 | |
IBERIABANK Corp. | | | 148,100 | | | | 11,233,385 | |
Pacific Premier Bancorp, Inc. | | | 183,180 | | | | 5,656,598 | |
Sterling Bancorp | | | 333,990 | | | | 7,107,307 | |
| | | | | | | 72,972,527 | |
Insurance—1.8% | | | | | | | | |
James River Group Holdings Ltd. | | | 171,592 | | | | 8,047,665 | |
ProAssurance Corp. | | | 244,010 | | | | 8,811,201 | |
| | | | | | | 16,858,866 | |
Real Estate Investment Trusts (REITs)—6.8% | | | | | |
Brandywine Realty Trust | | | 836,490 | | | | 11,978,537 | |
DiamondRock Hospitality Co. | | | 900,530 | | | | 9,311,480 | |
| EPR Properties | | | 121,740 | | | | 9,080,587 | |
| | | | | | | | |
| | | Shares | | | Value | |
| Real Estate Investment Trusts (REITs) (Continued) | | | | | |
| Four Corners Property Trust, Inc. | | | 606,950 | | | $ | 16,587,943 | |
National Storage Affiliates Trust | | | 563,096 | | | | 16,295,998 | |
| | | | | | | 63,254,545 | |
Thrifts & Mortgage Finance—2.8% | | | | | | | | |
OceanFirst Financial Corp. | | | 342,663 | | | | 8,515,175 | |
WSFS Financial Corp. | | | 430,629 | | | | 17,784,978 | |
| | | | | | | 26,300,153 | |
Health Care—12.5% | | | | | | | | |
Biotechnology—3.6% | | | | | | | | |
Emergent BioSolutions, Inc.1 | | | 179,200 | | | | 8,657,152 | |
Ligand Pharmaceuticals, Inc.1 | | | 53,100 | | | | 6,061,365 | |
Repligen Corp.1 | | | 147,750 | | | | 12,699,113 | |
uniQure NV1 | | | 79,800 | | | | 6,236,370 | |
| | | | | | | 33,654,000 | |
Health Care Equipment & Supplies—3.1% | | | | | | | | |
AtriCure, Inc.1 | | | 178,580 | | | | 5,328,827 | |
CryoPort, Inc.1 | | | 219,710 | | | | 4,025,087 | |
Quidel Corp.1 | | | 142,430 | | | | 8,448,948 | |
Senseonics Holdings, Inc.1 | | | 1,047,999 | | | | 2,137,918 | |
Wright Medical Group NV1 | | | 301,670 | | | | 8,995,799 | |
| | | | | | | 28,936,579 | |
Health Care Providers & Services—2.6% | |
Addus HomeCare Corp.1 | | | 110,802 | | | | 8,304,610 | |
LHC Group, Inc.1 | | | 134,910 | | | | 16,132,538 | |
| | | | | | | 24,437,148 | |
Health Care Technology—2.2% | | | | | | | | |
Inspire Medical Systems, Inc.1 | | | 155,623 | | | | 9,438,535 | |
Teladoc Health, Inc.1 | | | 165,080 | | | | 10,962,963 | |
| | | | | | | 20,401,498 | |
Life Sciences Tools & Services—0.2% | | | | | | | | |
Adaptive Biotechnologies Corp.1 | | | 28,686 | | | | 1,385,534 | |
Pharmaceuticals—0.8% | | | | | | | | |
Intersect ENT, Inc.1 | | | 211,020 | | | | 4,802,815 | |
TherapeuticsMD, Inc.1 | | | 1,028,720 | | | | 2,674,672 | |
| | | | | | | 7,477,487 | |
Industrials—18.9% | | | | | | | | |
Airlines—1.0% | | | | | | | | |
Spirit Airlines, Inc.1 | | | 191,450 | | | | 9,137,909 | |
Building Products—1.2% | | | | | | | | |
Masonite International Corp.1 | | | 207,741 | | | | 10,943,796 | |
Commercial Services & Supplies—2.1% | |
ACCO Brands Corp. | | | 1,239,637 | | | | 9,755,943 | |
Advanced Disposal Services, Inc.1 | | | 301,767 | | | | 9,629,385 | |
| | | | | | | 19,385,328 | |
Construction & Engineering—1.4% | | | | | | | | |
| KBR, Inc. | | | 521,971 | | | | 13,017,957 | |
Electrical Equipment—2.6% | | | | | | | | |
Atkore International Group, Inc.1 | | | 288,150 | | | | 7,454,440 | |
Generac Holdings, Inc.1 | | | 246,350 | | | | 17,099,154 | |
| | | | | | | 24,553,594 | |
Machinery—5.2% | | | | | | | | |
EnPro Industries, Inc. | | | 126,280 | | | | 8,061,715 | |
Evoqua Water Technologies Corp.1 | | | 712,210 | | | | 10,141,870 | |
Greenbrier Cos., Inc. (The) | | | 156,420 | | | | 4,755,168 | |
Manitowoc Co., Inc. (The)1 | | | 252,017 | | | | 4,485,903 | |
Navistar International Corp.1 | | | 209,530 | | | | 7,218,309 | |
Rexnord Corp.1 | | | 457,950 | | | | 13,839,249 | |
| | | | | | | 48,502,214 | |
Professional Services—4.0% | | | | | | | | |
ASGN, Inc.1 | | | 302,576 | | | | 18,336,105 | |
Korn Ferry | | | 460,755 | | | | 18,462,453 | |
| | | | | | | 36,798,558 | |
6 INVESCO OPPENHEIMER V.I. MAIN STREET SMALL CAP FUND
| | | | | | | | |
| | | Shares | | | Value | |
| Road & Rail—1.4% | | | | | | |
Genesee & Wyoming, Inc., Cl. A1 | | | 132,630 | | | $ | 13,263,000 | |
Information Technology—13.5% | | | | | | | | |
IT Services—3.1% | | | | | | | | |
CACI International, Inc., Cl. A1 | | | 88,639 | | | | 18,134,653 | |
Perspecta, Inc. | | | 449,354 | | | | 10,519,377 | |
| | | | | | | 28,654,030 | |
Semiconductors & Semiconductor Equipment—4.1% | |
Brooks Automation, Inc. | | | 317,460 | | | | 12,301,575 | |
MKS Instruments, Inc. | | | 185,180 | | | | 14,423,670 | |
Semtech Corp.1 | | | 243,510 | | | | 11,700,656 | |
| | | | | | | 38,425,901 | |
Software—6.3% | | | | | | | | |
Blackline, Inc.1 | | | 96,010 | | | | 5,137,495 | |
Bottomline Technologies DE, Inc.1 | | | 158,940 | | | | 7,031,506 | |
Envestnet, Inc.1 | | | 121,050 | | | | 8,276,188 | |
j2 Global, Inc. | | | 199,253 | | | | 17,711,599 | |
Pagerduty, Inc.1 | | | 26,600 | | | | 1,251,530 | |
Paylocity Holding Corp.1 | | | 99,700 | | | | 9,353,854 | |
Q2 Holdings, Inc.1 | | | 126,580 | | | | 9,665,649 | |
| | | | | | | 58,427,821 | |
Materials—5.4% | | | | | | | | |
Construction Materials—1.3% | | | | | | | | |
| Summit Materials, Inc., Cl. A1 | | | 610,201 | | | | 11,746,369 | |
| | | | | | | | |
| | | Shares | | | Value | |
| Metals & Mining—4.1% | | | | | | |
Allegheny Technologies, Inc.1 | | | 444,828 | | | $ | 11,209,666 | |
Compass Minerals International, Inc. | | | 166,620 | | | | 9,155,769 | |
Kaiser Aluminum Corp. | | | 143,219 | | | | 13,979,606 | |
Mayville Engineering Co., Inc.1 | | | 277,180 | | | | 3,825,084 | |
| | | | | | | 38,170,125 | |
Utilities—5.9% | | | | | | | | |
Gas Utilities—3.4% | | | | | | | | |
South Jersey Industries, Inc. | | | 464,080 | | | | 15,653,418 | |
Suburban Propane Partners LP2 | | | 663,355 | | | | 16,112,893 | |
| | | | | | | 31,766,311 | |
Multi-Utilities—2.5% | | | | | | | | |
Avista Corp. | | | 226,550 | | | | 10,104,130 | |
Black Hills Corp. | | | 84,690 | | | | 6,620,217 | |
NorthWestern Corp. | | | 90,470 | | | | 6,527,411 | |
| | | | | | | 23,251,758 | |
Total Common Stocks (Cost $751,459,885) | | | | 922,747,320 | |
| Investment Company—0.3% | | | | | | | | |
Invesco Oppenheimer Institutional | | | | | | | | |
| Government Money Market Fund, Cl. IN, 2.37%3 (Cost $3,112,966) | | | 3,112,966 | | | | 3,112,966 | |
| Total Investments, at Value (Cost $754,572,851) | | | 99.4% | | | | 925,860,286 | |
Net Other Assets (Liabilities) | | | 0.6 | | | | 5,715,023 | |
Net Assets | | | 100.0% | | | $ | 931,575,309 | |
| | | | |
Footnotes to Statement of Investments
1.Non-income producing security.
2.Security is a Master Limited Partnership.
3.The money market fund and the Fund are affiliated by having the same investment adviser. The rate shown is the7-day SEC standardized yield as of June 30, 2019.
See accompanying Notes to Financial Statements.
7 INVESCO OPPENHEIMER V.I. MAIN STREET SMALL CAP FUND
STATEMENT OF ASSETS AND LIABILITIESJune 30, 2019 Unaudited
| | | | |
Assets | | | | |
| Investments, at value—see accompanying statement of investments: | | | | |
| Unaffiliated companies (cost $751,459,885) | | $ | 922,747,320 | |
| Affiliated companies (cost $3,112,966) | | | 3,112,966 | |
| | | | 925,860,286 | |
| Cash | | | 1,107,786 | |
| Receivables and other assets: | | | | |
| Investments sold | | | 6,123,040 | |
| Dividends | | | 685,912 | |
| Shares of beneficial interest sold | | | 59,676 | |
| Other | | | 97,882 | |
| Total assets | | | 933,934,582 | |
Liabilities | | | | |
| Payables and other liabilities: | | | | |
| Investments purchased | | | 1,314,398 | |
| Shares of beneficial interest redeemed | | | 526,869 | |
| Distribution and service plan fees | | | 165,778 | |
| Administration fee | | | 128,952 | |
| Trustees’ compensation | | | 84,475 | |
| Management fee | | | 52,165 | |
| Shareholder communications | | | 51,946 | |
| Transfer and shareholder servicing agent fees | | | 14,360 | |
| Other | | | 20,330 | |
| Total liabilities | | | 2,359,273 | |
Net Assets | | $ | 931,575,309 | |
| | | | |
| | | | |
Composition of Net Assets | | | | |
| Shares of beneficial interest | | $ | 769,613,723 | |
| Total distributable earnings | | | 161,961,586 | |
| Net Assets | | $ | 931,575,309 | |
| | | | |
| | | | |
Net Asset Value Per Share | | | | |
| Series I Shares: | | | | |
| Net asset value, redemption price per share and offering price per share (based on net assets of $106,512,136 and 4,987,211 shares of beneficial interest outstanding) | | | $21.36 | |
Series II Shares: | | | | |
| Net asset value, redemption price per share and offering price per share (based on net assets of $825,063,173 and 39,302,732 shares of beneficial interest outstanding) | | | $20.99 | |
See accompanying Notes to Financial Statements.
8 INVESCO OPPENHEIMER V.I. MAIN STREET SMALL CAP FUND
STATEMENT OF OPERATIONSFor the Six Months Ended June 30, 2019 Unaudited
| | | | |
| Investment Income | | | | |
| Dividends: | | | | |
| Unaffiliated companies | | $ | 6,963,660 | |
| Affiliated companies | | | 212,804 | |
| Interest | | | 34 | |
| Total investment income | | | 7,176,498 | |
| Expenses | | | | |
Management fees | | | 3,243,990 | |
| Administration fees | | | 139,504 | |
| Distribution and service plan fees — Series II shares | | | 1,019,493 | |
| Transfer and shareholder servicing agent fees: | | | | |
| Series I shares | | | 66,654 | |
| Series II shares | | | 403,107 | |
| Shareholder communications: | | | | |
| Series I shares | | | 8,226 | |
| Series II shares | | | 51,534 | |
| Trustees’ compensation | | | 15,176 | |
| Borrowing fees | | | 11,947 | |
| Custodian fees and expenses | | | 2,483 | |
| Other | | | 38,335 | |
| Total expenses | | | 5,000,449 | |
| Less reduction to custodian expenses | | | (2,483 | ) |
| Less waivers and reimbursements of expenses | | | (195,843 | ) |
| Net expenses | | | 4,802,123 | |
| Net Investment Income | | | 2,374,375 | |
| Realized and Unrealized Gain (Loss) | | | | |
| Net realized loss on investment transactions | | | (9,762,666 | ) |
| Net change in unrealized appreciation/(depreciation) on investment transactions | | | 141,412,486 | |
| Net Increase in Net Assets Resulting from Operations | | $ | 134,024,195 | |
| | | | |
See accompanying Notes to Financial Statements.
9 INVESCO OPPENHEIMER V.I. MAIN STREET SMALL CAP FUND
STATEMENTS OF CHANGES IN NET ASSETS
| | | | | | | | |
| | | Six Months Ended June 30, 2019 (Unaudited) | | Year Ended December 31, 2018 |
| Operations | | | | | | | | |
| Net investment income | | $ | 2,374,375 | | | $ | 713,422 | |
| Net realized gain (loss) | | | (9,762,666 | ) | | | 96,680,460 | |
| Net change in unrealized appreciation/(depreciation) | | | 141,412,486 | | | | (191,923,313 | ) |
| | | | |
| Net increase (decrease) in net assets resulting from operations | | | 134,024,195 | | | | (94,529,431 | ) |
| Dividends and/or Distributions to Shareholders | | | | | | | | |
| Distributions to shareholders from distributable earnings: | | | | | | | | |
| Series I shares | | | (10,160,591 | ) | | | (19,059,602 | ) |
| Series II shares | | | (77,152,079 | ) | | | (117,234,118 | ) |
| | | | |
| Total distributions from distributable earnings | | | (87,312,670 | ) | | | (136,293,720 | ) |
| Beneficial Interest Transactions | | | | | | | | |
| Net increase (decrease) in net assets resulting from beneficial interest transactions: | | | | | | | | |
| Series I shares | | | (25,808,529 | ) | | | 4,916,454 | |
| Series II shares | | | 50,740,950 | | | | (2,571,998 | ) |
| | | | |
| Total beneficial interest transactions | | | 24,932,421 | | | | 2,344,456 | |
| Net Assets | | | | | | | | |
| Total increase (decrease) | | | 71,643,946 | | | | (228,478,695 | ) |
| Beginning of period | | | 859,931,363 | | | | 1,088,410,058 | |
| | | | |
| End of period | | $ | 931,575,309 | | | $ | 859,931,363 | |
| | | | |
See accompanying Notes to Financial Statements.
10 INVESCO OPPENHEIMER V.I. MAIN STREET SMALL CAP FUND
FINANCIAL HIGHLIGHTS
| | | | | | | | | | | | | | | | | | | | | | | | |
| Series I Shares | | Six Months Ended June 30, 2019 (Unaudited) | | | Year Ended December 31, 2018 | | | Year Ended December 31, 2017 | | | Year Ended December 31, 2016 | | | Year Ended December 31, 2015 | | | Year Ended December 31, 2014 |
| Per Share Operating Data | | | | | | | | | | | | | | | | | | | | | | | | |
| Net asset value, beginning of period | | | $20.36 | | | | $25.79 | | | | $24.08 | | | | $21.32 | | | | $26.56 | | | | $27.80 | |
| Income (loss) from investment operations: | | | | | | | | | | | | | | | | | | | | | | | | |
| Net investment income1 | | | 0.08 | | | | 0.07 | | | | 0.07 | | | | 0.16 | | | | 0.12 | | | | 0.26 | |
| Net realized and unrealized gain (loss) | | | 3.13 | | | | (2.07) | | | | 3.22 | | | | 3.55 | | | | (1.28) | | | | 2.74 | |
| Total from investment operations | | | 3.21 | | | | (2.00) | | | | 3.29 | | | | 3.71 | | | | (1.16) | | | | 3.00 | |
| Dividends and/or distributions to shareholders: | | | | | | | | | | | | | | | | | | | | | | | | |
| Dividends from net investment income | | | (0.05) | | | | (0.08) | | | | (0.22) | | | | (0.11) | | | | (0.23) | | | | (0.25) | |
| Distributions from net realized gain | | | (2.16) | | | | (3.35) | | | | (1.36) | | | | (0.84) | | | | (3.85) | | | | (3.99) | |
| Total dividends and/or distributions to shareholders | | | (2.21) | | | | (3.43) | | | | (1.58) | | | | (0.95) | | | | (4.08) | | | | (4.24) | |
| Net asset value, end of period | | | $21.36 | | | | $20.36 | | | | $25.79 | | | | $24.08 | | | | $21.32 | | | | $26.56 | |
| | | | |
| | | | | | | | | | | | | | | | | | | | | | | | |
| Total Return, at Net Asset Value2 | | | 15.84% | | | | (10.32)% | | | | 14.15% | | | | 18.05% | | | | (5.90)% | | | | 11.93% | |
| | | | | | | | | | | | | | | | | | | | | | | | |
| Ratios/Supplemental Data | | | | | | | | | | | | | | | | | | | | | | | | |
| Net assets, end of period (in thousands) | | | $106,512 | | | | $123,962 | | | | $152,617 | | | | $145,428 | | | | $129,104 | | | | $136,402 | |
| Average net assets (in thousands) | | | $132,347 | | | | $150,279 | | | | $150,376 | | | | $130,889 | | | | $134,932 | | | | $133,864 | |
| Ratios to average net assets:3 | | | | | | | | | | | | | | | | | | | | | | | | |
| Net investment income | | | 0.71% | | | | 0.28% | | | | 0.28% | | | | 0.74% | | | | 0.49% | | | | 0.99% | |
| Expenses excluding specific expenses listed below | | | 0.84% | | | | 0.83% | | | | 0.80% | | | | 0.81% | | | | 0.80% | | | | 0.80% | |
| Interest and fees from borrowings | | | 0.00%4 | | | | 0.00%4 | | | | 0.00%4 | | | | 0.00%4 | | | | 0.00%4 | | | | 0.00% | |
| Total expenses5 | | | 0.84% | | | | 0.83% | | | | 0.80% | | | | 0.81% | | | | 0.80% | | | | 0.80% | |
| Expenses after payments, waivers and/or reimbursements and reduction to custodian expenses | | | 0.80% | | | | 0.80% | | | | 0.80%6 | | | | 0.80% | | | | 0.80%6 | | | | 0.79% | |
| Portfolio turnover rate | | | 14% | | | | 45% | | | | 42% | | | | 65% | | | | 43% | | | | 65% | |
1.Per share amounts calculated based on the average shares outstanding during the period.
2. Assumes an initial investment on the business day before the first day of the fiscal period, with all dividends and distributions reinvested in additional shares on the reinvestment date, and redemption at the net asset value calculated on the last business day of the fiscal period. Total returns are not annualized for periods less than one full year. Total return information does not reflect expenses that apply at the separate account level or to related insurance products. Inclusion of these charges would reduce the total return figures for all periods shown. Returns do not reflect the deduction of taxes that a shareholder would pay on fund distributions or the redemption of fund shares.
3.Annualized for periods less than one full year.
4.Less than 0.005%.
5.Total expenses including indirect expenses from affiliated fund fees and expenses were as follows:
| | | | | | |
| | Six Months Ended June 30, 2019 | | | 0.84 | % |
| | Year Ended December 31, 2018 | | | 0.83 | % |
| | Year Ended December 31, 2017 | | | 0.80 | % |
| | Year Ended December 31, 2016 | | | 0.81 | % |
| | Year Ended December 31, 2015 | | | 0.80 | % |
| | Year Ended December 31, 2014 | | | 0.80 | % |
6.Waiver was less than 0.005%.
See accompanying Notes to Financial Statements.
11 INVESCO OPPENHEIMER V.I. MAIN STREET SMALL CAP FUND
FINANCIAL HIGHLIGHTSContinued
| | | | | | | | | | | | | | | | | | | | | | | | |
| | | Six Months | | | | | | | | | | | | | | | |
| | | Ended | | | Year Ended | | | Year Ended | | | Year Ended | | | Year Ended | | | Year Ended |
| Series II Shares | | June 30, 2019 | | | December 31, | | | December 31, | | | December 31, | | | December 31, | | | December 31, |
| | (Unaudited) | | | 2018 | | | 2017 | | | 2016 | | | 2015 | | | 2014 |
| Per Share Operating Data | | | | | | | | | | | | | | | | | | | | | | | | |
| Net asset value, beginning of period | | | $20.03 | | | | $25.42 | | | | $23.75 | | | | $21.05 | | | | $26.26 | | | | $27.53 | |
| Income (loss) from investment operations: | | | | | | | | | | | | | | | | | | | | | | | | |
| Net investment income1 | | | 0.05 | | | | 0.01 | | | | 0.01 | | | | 0.10 | | | | 0.06 | | | | 0.19 | |
| Net realized and unrealized gain (loss) | | | 3.07 | | | | (2.03) | | | | 3.18 | | | | 3.49 | | | | (1.25) | | | | 2.71 | |
| Total from investment operations | | | 3.12 | | | | (2.02) | | | | 3.19 | | | | 3.59 | | | | (1.19) | | | | 2.90 | |
| Dividends and/or distributions to shareholders: | | | | | | | | | | | | | | | | | | | | | | | | |
| Dividends from net investment income | | | 0.00 | | | | (0.02) | | | | (0.16) | | | | (0.05) | | | | (0.17) | | | | (0.18) | |
| Distributions from net realized gain | | | (2.16) | | | | (3.35) | | | | (1.36) | | | | (0.84) | | | | (3.85) | | | | (3.99) | |
| Total dividends and/or distributions to shareholders | | | (2.16) | | | | (3.37) | | | | (1.52) | | | | (0.89) | | | | (4.02) | | | | (4.17) | |
| Net asset value, end of period | | | $20.99 | | | | $20.03 | | | | $25.42 | | | | $23.75 | | | | $21.05 | | | | $26.26 | |
| | | | |
| | | | | | | | | | | | | | | | | | | | | | | | |
| Total Return, at Net Asset Value2 | | | 15.66% | | | | (10.54)% | | | | 13.91% | | | | 17.67% | | | | (6.09)% | | | | 11.66% | |
| | | | | | | | | | | | | | | | | | | | | | | | |
| Ratios/Supplemental Data | | | | | | | | | | | | | | | | | | | | | | | | |
| Net assets, end of period (in thousands) | | | $825,063 | | | | $735,969 | | | | $935,793 | | | | $922,037 | | | | $856,719 | | | | $968,637 | |
| Average net assets (in thousands) | | | $822,748 | | | | $911,784 | | | | $919,475 | | | | $850,883 | | | | $927,514 | | | | $957,874 | |
| Ratios to average net assets:3 | | | | | | | | | | | | | | | | | | | | | | | | |
| Net investment income | | | 0.47% | | | | 0.03% | | | | 0.03% | | | | 0.49% | | | | 0.24% | | | | 0.75% | |
| Expenses excluding specific expenses listed below | | | 1.09% | | | | 1.08% | | | | 1.05% | | | | 1.06% | | | | 1.05% | | | | 1.05% | |
| Interest and fees from borrowings | | | 0.00%4 | | | | 0.00%4 | | | | 0.00%4 | | | | 0.00%4 | | | | 0.00%4 | | | | 0.00% | |
| Total expenses5 | | | 1.09% | | | | 1.08% | | | | 1.05% | | | | 1.06% | | | | 1.05% | | | | 1.05% | |
| Expenses after payments, waivers and/or reimbursements and reduction to custodian expenses | | | 1.05% | | | | 1.05% | | | | 1.05%6 | | | | 1.05% | | | | 1.05%6 | | | | 1.04% | |
| Portfolio turnover rate | | | 14% | | | | 45% | | | | 42% | | | | 65% | | | | 43% | | | | 65% | |
1.Per share amounts calculated based on the average shares outstanding during the period.
2. Assumes an initial investment on the business day before the first day of the fiscal period, with all dividends and distributions reinvested in additional shares on the reinvestment date, and redemption at the net asset value calculated on the last business day of the fiscal period. Total returns are not annualized for periods less than one full year. Total return information does not reflect expenses that apply at the separate account level or to related insurance products. Inclusion of these charges would reduce the total return figures for all periods shown. Returns do not reflect the deduction of taxes that a shareholder would pay on fund distributions or the redemption of fund shares.
3.Annualized for periods less than one full year.
4.Less than 0.005%.
5.Total expenses including indirect expenses from affiliated fund fees and expenses were as follows:
| | | | | | |
| | Six Months Ended June 30, 2019 | | | 1.09 | % |
| | Year Ended December 31, 2018 | | | 1.08 | % |
| | Year Ended December 31, 2017 | | | 1.05 | % |
| | Year Ended December 31, 2016 | | | 1.06 | % |
| | Year Ended December 31, 2015 | | | 1.05 | % |
| | Year Ended December 31, 2014 | | | 1.05 | % |
6.Waiver was less than 0.005%.
See accompanying Notes to Financial Statements.
12 INVESCO OPPENHEIMER V.I. MAIN STREET SMALL CAP FUND
NOTES TO FINANCIAL STATEMENTSJune 30, 2019 Unaudited
Note 1 - Significant Accounting Policies
Invesco Oppenheimer V.I. Main Street Small Cap Fund (the “Fund”) is a series portfolio of AIM Variable Insurance Funds (Invesco Variable Insurance Funds) (the “Trust”). The Trust is a Delaware statutory trust registered under the Investment Company Act of 1940, as amended (the “1940 Act”), as anopen-end series management investment company authorized to issue an unlimited number of shares of beneficial interest. Information presented in these financial statements pertains only to the Fund. Matters affecting the Fund or each class will be voted on exclusively by the shareholders of such Fund or each class.
Prior to the close of business on May 24, 2019, the Fund operated as Oppenheimer Main Street Small Cap Fund/VA (the “Acquired Fund” or “Predecessor Fund”). The Acquired Fund was reorganized after the close of business on May 24, 2019 (the “Reorganization Date”) through the transfer of all of its assets and liabilities to the Fund (the “Reorganization”).
Upon closing of the Reorganization, holders of the Acquired Fund’sNon-Service and Service shares received Series I and Series II shares of the Fund, respectively. Information for the Acquired Fund’sNon-Service and Service shares prior to the Reorganization is included with Series I and Series II, respectively, throughout this report.
The Fund’s investment objective is to seek capital appreciation.
The Fund currently offers two classes of shares, Series I and Series II, both of which are offered to insurance company separate accounts funding variable annuity contracts and variable life insurance policies (“variable products”).
The Fund is an investment company and accordingly follows the investment company accounting and reporting guidance in accordance with Financial Accounting Standards Board Accounting Standards Codification Topic 946, Financial Services – Investment Companies.
The following is a summary of the significant accounting policies followed by the Fund in the preparation of its financial statements.
| A. | | Security Valuations– Securities, including restricted securities, are valued according to the following policy. |
A security listed or traded on an exchange (except convertible securities) is valued at its last sales price or official closing price as of the close of the customary trading session on the exchange where the security is principally traded, or lacking any sales or official closing price on a particular day, the security may be valued at the closing bid price on that day. Securities traded in theover-the-counter market are valued based on prices furnished by independent pricing services or market makers. When such securities are valued by an independent pricing service they may be considered fair valued. Futures contracts are valued at the final settlement price set by an exchange on which they are principally traded. Listed options are valued at the mean between the last bid and asked prices from the exchange on which they are principally traded. Options not listed on an exchange are valued by an independent source at the mean between the last bid and asked prices. For purposes of determining net asset value (“NAV”) per share, futures and option contracts generally are valued 15 minutes after the close of the customary trading session of the New York Stock Exchange (“NYSE”).
Investments inopen-end andclosed-end registered investment companies that do not trade on an exchange are valued at theend-of-day net asset value per share. Investments inopen-end andclosed-end registered investment companies that trade on an exchange are valued at the last sales price or official closing price as of the close of the customary trading session on the exchange where the security is principally traded.
Debt obligations (including convertible securities) and unlisted equities are fair valued using an evaluated quote provided by an independent pricing service. Evaluated quotes provided by the pricing service may be determined without exclusive reliance on quoted prices, and may reflect appropriate factors such asinstitution-size trading in similar groups of securities, developments related to specific securities, dividend rate (for unlisted equities), yield (for debt obligations), quality, type of issue, coupon rate (for debt obligations), maturity (for debt obligations), individual trading characteristics and other market data. Pricing services generally value debt obligations assuming orderly transactions of institutional round lot size, but a fund may hold or transact in the same securities in smaller, odd lot sizes. Odd lots often trade at lower prices than institutional round lots. Debt obligations are subject to interest rate and credit risks. In addition, all debt obligations involve some risk of default with respect to interest and/or principal payments.
Foreign securities’ (including foreign exchange contracts) prices are converted into U.S. dollar amounts using the applicable exchange rates as of the close of the NYSE. If market quotations are available and reliable for foreign exchange-traded equity securities, the securities will be valued at the market quotations. Because trading hours for certain foreign securities end before the close of the NYSE, closing market quotations may become unreliable. If between the time trading ends on a particular security and the close of the customary trading session on the NYSE, events occur that the investment adviser determines are significant and make the closing price unreliable, the Fund may fair value the security. If the event is likely to have affected the closing price of the security, the security will be valued at fair value in good faith using procedures approved by the Board of Trustees. Adjustments to closing prices to reflect fair value may also be based on a screening process of an independent pricing service to indicate the degree of certainty, based on historical data, that the closing price in the principal market where a foreign security trades is not the current value as of the close of the NYSE. Foreign securities’ prices meeting the approved degree of certainty that the price is not reflective of current value will be priced at the indication of fair value from the independent pricing service. Multiple factors may be considered by the independent pricing service in determining adjustments to reflect fair value and may include information relating to sector indices, American Depositary Receipts and domestic and foreign index futures. Foreign securities may have additional risks including exchange rate changes, potential for sharply devalued currencies and high inflation, political and economic upheaval, the relative lack of issuer information, relatively low market liquidity and the potential lack of strict financial and accounting controls and standards.
Securities for which market prices are not provided by any of the above methods may be valued based upon quotes furnished by independent sources. The last bid price may be used to value equity securities. The mean between the last bid and asked prices is used to value debt obligations, including corporate loans.
Securities for which market quotations are not readily available or became unreliable are valued at fair value as determined in good faith by or under the supervision of the Trust’s officers following procedures approved by the Board of Trustees. Issuer specific events, market trends, bid/asked quotes of brokers and information providers and other market data may be reviewed in the course of making a good faith determination of a
13 INVESCO OPPENHEIMER V.I. MAIN STREET SMALL CAP FUND
NOTES TO FINANCIAL STATEMENTSUnaudited / Continued
Note 1 - Significant Accounting Policies (continued)
security’s fair value.
The Fund may invest in securities that are subject to interest rate risk, meaning the risk that the prices will generally fall as interest rates rise and, conversely, the prices will generally rise as interest rates fall. Specific securities differ in their sensitivity to changes in interest rates depending on their individual characteristics. Changes in interest rates may result in increased market volatility, which may affect the value and/or liquidity of certain Fund investments.
Valuations change in response to many factors including the historical and prospective earnings of the issuer, the value of the issuer’s assets, general economic conditions, interest rates, investor perceptions and market liquidity. Because of the inherent uncertainties of valuation, the values reflected in the financial statements may materially differ from the value received upon actual sale of those investments.
| B. | | Securities Transactions and Investment Income -Securities transactions are accounted for on a trade date basis. Realized gains or losses onsales are computed on the basis of specific identification of the securities sold. Interest income (net of withholding tax, if any) is recorded on the accrual basis from settlement date. Dividend income (net of withholding tax, if any) is recorded on theex-dividend date. |
The Fund may periodically participate in litigation related to Fund investments. As such, the Fund may receive proceeds from litigation settlements. Any proceeds received are included in the Statement of Operations as realized gain (loss) for investments no longer held and as unrealized gain (loss) for investments still held.
Brokerage commissions and mark ups are considered transaction costs and are recorded as an increase to the cost basis of securities purchased and/or a reduction of proceeds on a sale of securities. Such transaction costs are included in the determination of net realized and unrealized gain (loss) from investment transactions reported in the Statement of Operations and the Statement of Changes in Net Assets and the net realized and unrealized gains (losses) on securities per share in the Financial Highlights. Transaction costs are included in the calculation of the Fund’s net asset value and, accordingly, they reduce the Fund’s total returns. These transaction costs are not considered operating expenses and are not reflected in net investment income reported in the Statement of Operations and the Statement of Changes in Net Assets, or the net investment income per share and the ratios of expenses and net investment income reported in the Financial Highlights, nor are they limited by any expense limitation arrangements between the Fund and the investment adviser.
The Fund allocates income and realized and unrealized capital gains and losses to a class based on the relative net assets of each class.
| C. | | Country Determination- For the purposes of making investment selection decisions and presentation in the Schedule of Investments, theinvestment adviser may determine the country in which an issuer is located and/or credit risk exposure based on various factors. These factors include the laws of the country under which the issuer is organized, where the issuer maintains a principal office, the country in which the issuer derives 50% or more of its total revenues and the country that has the primary market for the issuer’s securities, as well as other criteria. Among the other criteria that may be evaluated for making this determination are the country in which the issuer maintains 50% or more of its assets, the type of security, financial guarantees and enhancements, the nature of the collateral and the sponsor organization. Country of issuer and/or credit risk exposure has been determined to be the United States of America, unless otherwise noted. |
| D. | | Distributions -Dividends and distributions to shareholders, which are determined in accordance with income tax regulations and may differ fromU.S. GAAP, are recorded on theex-dividend date. Income and capital gain distributions, if any, are declared and paid annually or at other times as determined necessary by the Adviser. |
The tax character of distributions is determined as of the Fund’s fiscal year end. Therefore, a portion of the Fund’s distributions made to shareholders prior to the Fund’s fiscal year end may ultimately be categorized as a tax return of capital.
| E. | | Master Limited Partnerships -The Fund invests in Master Limited Partnerships (“MLPs”). MLPs are publicly traded partnerships and limitedliability companies taxed as partnerships under the Internal Revenue Code of 1986, as amended (the “Internal Revenue Code”). The Fund invests in MLPs engaged in, among other things, the transportation, storage, processing, refining, marketing, exploration, production and mining of minerals and natural resources. The Fund is a partner in each MLP; accordingly, the Fund is required to take into account the Fund’s allocable share of income, gains, losses, deductions, expenses, and tax credits recognized by each MLP. |
MLP’s may be less liquid and subject to more abrupt or erratic price movements than conventional publicly traded securities.
| F. | | Return of Capital -Distributions received from the Fund’s investments in MLPs generally are comprised of income and return of capital. The Fundrecords investment income and return of capital based on estimates made at the time such distributions are received. The return of capital portion of the distribution is a reduction to investment income that results in an equivalent reduction in the cost basis of the associated investments and increases net realized gains (losses) and change in unrealized appreciation (depreciation). Such estimates are based on historical information available from each MLP and other industry sources. These estimates will subsequently be revised and may materially differ primarily based on information received from the MLPs after their tax reporting periods are concluded. |
| G. | | Federal Income Taxes -The Fund intends to comply with provisions of the Internal Revenue Code applicable to regulated investment companiesand to distribute substantially all of its investment company taxable income to shareholders. Therefore, no federal income or excise tax provision is required. The Fund files income tax returns in U.S. federal and applicable state jurisdictions. The statute of limitations on the Fund’s tax return filings generally remains open for the three preceding fiscal reporting period ends. The Fund has analyzed its tax positions for the fiscal year ended December 31, 2018, including open tax years, and does not believe there are any uncertain tax positions requiring recognition in the Fund’s financial statements. |
During the fiscal year ended December 31, 2018, the Fund did not utilize any capital loss carryforwards to offset capital gains realized in that fiscal year.
At period end, it is estimated that the capital loss carryforwards would be $9,762,666, which will not expire. The estimated capital loss carryforward represents the carryforward as of the end of the last fiscal year, increased or decreased by capital losses or gains realized in the first six months of
14 INVESCO OPPENHEIMER V.I. MAIN STREET SMALL CAP FUND
Note 1 - Significant Accounting Policies (continued)
the current fiscal year. During the reporting period, it is estimated that the Fund will not utilize any capital loss carryforward to offset realized capital gains.
Net investment income (loss) and net realized gain (loss) may differ for financial statement and tax purposes. The character of dividends and distributions made during the fiscal year from net investment income or net realized gains are determined in accordance with federal income tax requirements, which may differ from the character of net investment income or net realized gains presented in those financial statements in accordance with U.S. GAAP. Also, due to timing of dividends and distributions, the fiscal year in which amounts are distributed may differ from the fiscal year in which the income or net realized gain was recorded by the Fund.
The aggregate cost of securities and other investments and the composition of unrealized appreciation and depreciation of securities and other investments for federal income tax purposes at period end are noted in the following table. The primary difference between book and tax appreciation or depreciation of securities and other investments, if applicable, is attributable to the tax deferral of losses or tax realization of financial statement unrealized gain or loss.
| | | | |
| Federal tax cost of securities | | $ | 758,921,333 | |
| | | | |
| Gross unrealized appreciation | | $ | 221,841,448 | |
| Gross unrealized depreciation | | | (54,902,495 | ) |
| | | | |
| Net unrealized appreciation | | $ | 166,938,953 | |
| | | | |
| H. | | Expenses -Fees provided for under the Rule12b-1 plan of a particular class of the Fund are charged to the operations of such class. Transfer agencyfees and expenses and other shareholder recordkeeping fees are allocated to each share class based on relative net assets. Transfer agency fees and expenses and other shareholder recordkeeping fees and expenses relating to all other classes are allocated among those classes based on relative net assets. All other expenses are allocated among the classes based on relative net assets. |
| I. | | Accounting Estimates -The financial statements are prepared on a basis in conformity with accounting principles generally accepted in the UnitedStates of America (“GAAP”), which requires management to make estimates and assumptions that affect the reported amounts of assets and liabilities at the date of the financial statements and the reported amounts of revenues and expenses during the reporting period including estimates and assumptions related to taxation. Actual results could differ from those estimates by a significant amount. In addition, the Fund monitors for material events or transactions that may occur or become known after theperiod-end date and before the date the financial statements are released to print. |
| J. | | Indemnifications -Under the Trust’s organizational documents, each Trustee, officer, employee or other agent of the Trust is indemnified againstcertain liabilities that may arise out of the performance of their duties to the Fund. Additionally, in the normal course of business, the Fund enters into contracts, including the Fund’s servicing agreements, that contain a variety of indemnification clauses. The Fund’s maximum exposure under these arrangements is unknown as this would involve future claims that may be made against the Fund that have not yet occurred. The risk of material loss as a result of such indemnification claims is considered remote. |
Note 2 - Advisory Fees and Other Fees Paid to Affiliates
The Trust has entered into a master investment advisory agreement with Invesco Advisers, Inc. (the “Adviser” or “Invesco”). Under the terms of the investment advisory agreement, the Fund accrues daily and pays monthly an advisory fee to the Adviser based on the annual rate of the Fund’s average daily net assets as follows:
| | | | |
| Fee Schedule* | | |
| Up to $200 million | | | 0.75 | % |
| Next $200 million | | | 0.72 | |
| Next $200 million | | | 0.69 | |
| Next $200 million | | | 0.66 | |
| Next $200 million | | | 0.60 | |
| Next $4 billion | | | 0.58 | |
| Over $5 billion | | | 0.56 | |
*The advisory fee paid by the Fund shall be reduced by any amounts paid by the Fund under the administrative services agreement with the Adviser.
For the six months period ended June 30, 2019, the effective advisory fees incurred by the Fund was 0.68%.
From the beginning of the fiscal period until the date of the Reorganization, the Acquired Fund paid $2,608,376 in advisory fees to OFI Global Asset Management, Inc. based on the annual rates above of the Acquired Fund’s average daily net assets.
Under the terms of a mastersub-advisory agreement between the Adviser and each of Invesco Asset Management Deutschland GmbH, Invesco Asset Management Limited, Invesco Asset Management (Japan) Limited, Invesco Hong Kong Limited, Invesco Senior Secured Management, Inc. and Invesco Canada Ltd. and separatesub-advisory agreements with Invesco Capital Management LLC, and Invesco Asset Management (India) Private Limited (collectively, the “AffiliatedSub-Advisers”) the Adviser, not the Fund, will pay 40% of the fees paid to the Adviser to any such AffiliatedSub-Adviser(s) that provide(s) discretionary investment management services to the Fund based on the percentage of assets allocated to suchSub-Adviser(s). Invesco has also entered into aSub-Advisory Agreement with OppenheimerFunds, Inc. to provide discretionary management services to the Funds.
Effective on the Reorganization Date, the Adviser has contractually agreed, through at least May 31, 2021, to waive advisory fees and/or reimburse
15 INVESCO OPPENHEIMER V.I. MAIN STREET SMALL CAP FUND
NOTES TO FINANCIAL STATEMENTSUnaudited / Continued
Note 2 - Advisory Fees and Other Fees Paid to Affiliates (continued)
expenses of all shares to the to the extent necessary to limit the total annual fund operating expenses after fee waiver and/or expense reimbursement (excluding certain items discussed below) of Series I and Series II shares to 0.80% and 1.05%, respectively, of the Fund’s average daily net assets (the “expense limits”). In determining the Adviser’s obligation to waive advisory fees and/or reimburse expenses, the following expenses are not taken into account, and could cause total annual fund operating expenses after fee waivers and/or expense reimbursement to exceed the numbers reflected above:
(1) interest; (2) taxes; (3) dividend expenses on short sales; (4) extraordinary ornon-routine items, including litigation expenses; and (5) expenses that the Fund has incurred but did not actually pay because of an expense offset arrangement. Unless Invesco continues the fee waiver agreement, it will terminate May 31, 2021. During its term, the fee waiver agreement cannot be terminated or amended to increase the expense limits or reduce the advisory fee waiver without approval of the Board of Trustees.
Further, the Adviser has contractually agreed, through at least June 30, 2021, to waive the advisory fee payable by the Fund in an amount equal to 100% of the net advisory fees the Adviser receives from the affiliated money market funds on investments by the Fund of uninvested cash in such affiliated money market funds.
For the six months ended June 30, 2019, the Adviser waived advisory fee of $8,902 and reimbursed fund expenses of $21,768, and $165,173 of Series I and Series II shares, respectively.
Prior to the Reorganization, the OFI Global Asset Management, Inc. had contractually agreed to waive fees and/or reimburse expenses of Series I and Series II Shares to 0.80% and 1.05%, respectively, of the Acquired Fund’s average daily net assets.
The Trust has entered into a master administrative services agreement with Invesco pursuant to which the Fund has agreed to pay Invesco for certain administrative costs incurred in providing accounting services to the Fund. For the six months ended June 30, 2019, expenses incurred under the agreement are shown in the Statement of Operations as Administration fees. Additionally, Invesco has entered into service agreements whereby JPMorgan Chase Bank serves as custodian to the Fund. Prior to the Reorganization, the Acquired Fund paid administrative fees to OFI Global Asset Management, Inc.
The Trust has entered into a transfer agency and service agreement with Invesco Investment Services, Inc. (“IIS”) pursuant to which the Fund has agreed to pay IIS a fee for providing transfer agency and shareholder services to the Fund and reimburse IIS for certain expenses incurred by IIS in the course of providing such services. IIS may make payments to intermediaries that provide omnibus account services,sub-accounting services and/or networking services. All fees payable by IIS to intermediaries that provide omnibus account services orsub-accounting services are charged back to the Fund, subject to certain limitations approved by the Trust’s Board of Trustees. Prior to the Reorganization, the Acquired Fund paid transfer agent fees to OFI Global Asset Management, Inc. and Shareholder Services, Inc. For the six months ended June 30, 2019, expenses incurred under these agreements are shown in the Statement of Operations as Transfer and shareholder servicing agent fees.
The Trust has entered into master distribution agreements with Invesco Distributors, Inc. (“IDI”) to serve as the distributor for the Service II shares of the Fund. The Trust has adopted a plan pursuant to Rule12b-1 under the 1940 Act with respect to the Fund’s Service II shares (the “Plan”). The Fund, pursuant to the Plan, pays IDI at an annual rate of 0.25% of the average daily net assets of Service II shares. The fees are accrued daily and paid monthly. Of the Plan payments, up to 0.25% of the average daily net assets of the class of shares may be paid to furnish continuing personal shareholder services to customers who purchase and own shares of such class. Any amounts not paid as a service fee under the Plan would constitute an asset-based sales charge. Rules of the Financial Industry Regulatory Authority (“FINRA”) impose a cap on the total sales charges, including asset-based sales charges, that may be paid by any class of shares of the Fund plans. Prior to the Reorganization, the Acquired Fund paid distribution fees to OppenheimerFunds Distributor, Inc. For the six months ended June 30, 2019, expenses incurred under the plans are shown in the Statement of Operations as Distribution and service plan fees.
Certain officers and trustees of the Trust are officers and directors of the Adviser, IIS and/or IDI.
Note 3 - Additional Valuation Information
GAAP defines fair value as the price that would be received to sell an asset or paid to transfer a liability in an orderly transaction between market participants at the measurement date, under current market conditions. GAAP establishes a hierarchy that prioritizes the inputs to valuation methods, giving the highest priority to readily available unadjusted quoted prices in an active market for identical assets (Level 1) and the lowest priority to significant unobservable inputs (Level 3), generally when market prices are not readily available or are unreliable. Based on the valuation inputs, the securities or other investments are tiered into one of three levels. Changes in valuation methods may result in transfers in or out of an investment’s assigned level:
Level 1 — Prices are determined using quoted prices in an active market for identical assets.
Level 2 — Prices are determined using other significant observable inputs. Observable inputs are inputs that other market participants may use in pricing a security. These may include quoted prices for similar securities, interest rates, prepayment speeds, credit risk, yield curves, loss severities, default rates, discount rates, volatilities and others.
Level 3 — Prices are determined using significant unobservable inputs. In situations where quoted prices or observable inputs are unavailable (for example, when there is little or no market activity for an investment at the end of the period), unobservable inputs may be used. Unobservable inputs reflect the Fund’s own assumptions about the factors market participants would use in determining fair value of the securities or instruments and would be based on the best available information.
As of June 30, 2019, all of the securities in this Fund were valued based on Level 1 inputs (see the Schedule of Investments for security categories).
16 INVESCO OPPENHEIMER V.I. MAIN STREET SMALL CAP FUND
Note 3 - Additional Valuation Information (continued)
The level assigned to the securities valuations may not be an indication of the risk or liquidity associated with investing in those securities. Because of the inherent uncertainties of valuation, the values reflected in the financial statements may materially differ from the value received upon actual sale of those investments.
Forward currency exchange contracts and futures contracts, if any, are reported at their unrealized appreciation/depreciation at measurement date, which represents the change in the contract’s value from trade date.All additional assets and liabilities included in the above table are reported at their market value at measurement date.
Note 4 - Security Transactions with Affiliated Funds
The Fund is permitted to purchase or sell securities from or to certain other Invesco Funds under specified conditions outlined in procedures adopted by the Board of Trustees of the Trust. The procedures have been designed to ensure that any purchase or sale of securities by the Fund from or to another fund or portfolio that is or could be considered an affiliate by virtue of having a common investment adviser (or affiliated investment advisers), common Trustees and/or common officers complies with Rule17a-7 of the 1940 Act. Further, as defined under the procedures, each transaction is effected at the current market price. Pursuant to these procedures for the period January 1, 2019 to May 24, 2019, the Predecessor Fund engaged in transactions with affiliates as listed: Securities purchases of $126,589 resulted in no net realized gains (losses). For the period May 25, 2019 to June 31, 2019, the Fund did not engage in transactions with affiliates.
Note 5 - Expense Offset Arrangement
The expense offset arrangement is comprised of custodian credits which result from periodic overnight cash balances at the custodian. For the six months ended June 30, 2019, the Fund received credits from this arrangement, which resulted in the reduction of the Fund’s total expenses of $2,483.
Note 6 - Trustee and Officer Fees and Benefits
Certain Trustees have executed a Deferred Compensation Agreement pursuant to which they have the option to elect to defer receipt of all or a portion of the annual compensation they are entitled to receive from the Fund. For purposes of determining the amount owed to the Trustees under the plan, deferred amounts are treated as though equal dollar amounts had been invested in shares of the Fund or in other Invesco and/or Invesco Oppenheimer funds selected by the Trustees. The Fund purchases shares of the funds selected for deferral by the Trustees in amounts equal to his or her deemed investment, resulting in a Fund asset equal to the deferred compensation liability. Such assets are included as a component of “Other” within the asset section of the Statement of Assets and Liabilities. Deferral of Trustees’ fees under the plan will not affect the net assets of the Fund and will not materially affect the Fund’s assets, liabilities or net investment income per share. Amounts will be deferred until distributed in accordance with the compensation deferral plan.
Note 7 - Cash Balances
The Fund is permitted to temporarily carry a negative or overdrawn balance in its account with JP Morgan Chase Bank, the custodian bank. Such balances, if any atperiod-end, are shown in the Statement of Assets and Liabilities under the payable caption Amount due custodian. To compensate the custodian bank for such overdrafts, the overdrawn Fund may either (1) leave funds as a compensating balance in the account so the custodian bank can be compensated by earning the additional interest; or (2) compensate by paying the custodian bank at a rate agreed upon by the custodian bank and Invesco, not to exceed the contractually agreed upon rate.
Note 8 - Investment Transactions
The aggregate amount of investment securities (other than short-term securities, U.S. Treasury obligations and money market funds, if any) purchased and sold by the Fund during the six months ended June 30, 2019 was $132,346,432 and $182,292,890, respectively.
Note 9 - Share Information
Transactions in shares of beneficial interest were as follows:
| | | | | | | | | | | | | | | | | | | | |
| | | Six Months Ended June 30, 20191 | | | | | | Year Ended December 31, 2018 | |
| | | Shares | | | Amount | | | | | | Shares | | | Amount |
| Series I Shares | | | | | | | | | | | | | | | | | | | | |
| Sold | | | 252,272 | | | $ | 5,758,138 | | | | | | | | 877,784 | | | $ | 21,586,667 | |
| Dividends and/or distributions reinvested | | | 480,179 | | | | 10,160,591 | | | | | | | | 754,537 | | | | 19,059,602 | |
| Redeemed | | | (1,832,351 | ) | | | (41,727,258 | ) | | | | | | | (1,462,725 | ) | | | (35,729,815 | ) |
| | | | |
| Net increase (decrease) | | | (1,099,900 | ) | | $ | (25,808,529 | ) | | | | | | | 169,596 | | | $ | 4,916,454 | |
| | | | |
17 INVESCO OPPENHEIMER V.I. MAIN STREET SMALL CAP FUND
NOTES TO FINANCIAL STATEMENTSUnaudited / Continued
Note 9 - Share Information (continued)
| | | | | | | | | | | | | | | | | | | | |
| | | Six Months Ended June 30, 20191 | | | | | | Year Ended December 31, 2018 | |
| | | Shares | | | Amount | | | | | | Shares | | | Amount |
| Series II Shares | | | | | | | | | | | | | | | | | | | | |
| Sold | | | 1,336,870 | | | $ | 29,345,119 | | | | | | | | 2,340,038 | | | $ | 56,752,666 | |
| Dividends and/or distributions reinvested | | | 3,709,234 | | | | 77,152,079 | | | | | | | | 4,711,982 | | | | 117,234,118 | |
| Redeemed | | | (2,482,319 | ) | | | (55,756,248 | ) | | | | | | | (7,125,127 | ) | | | (176,558,782 | ) |
| | | | |
| Net increase (decrease) | | | 2,563,785 | | | $ | 50,740,950 | | | | | | | | (73,107 | ) | | $ | (2,571,998 | ) |
| | | | |
1.There are entities that are record owners of more than 5% of the outstanding shares of the Fund and own 53% of the outstanding shares of the Fund. The Fund and the Fund’s principalunderwriter or adviser, are parties to participation agreements with these entities whereby these entities sell units of interest in separate accounts funding variable products that are invested in the Fund. The Fund, Invesco and/or Invesco affiliates may make payments to these entities, which are considered to be related to the Fund, for providing services to the Fund, Invesco and/or Invesco affiliates, including, but not limited to services such as securities brokerage, distribution, third party record keeping and account servicing. The Fund has no knowledge as to whether all or any portion of the shares owned of record by these entities are also owned beneficially.
Note 10 - Borrowings
Joint Credit Facility.A number of mutual funds managed by the Adviser participate in a $1.95 billion revolving credit facility (the “Facility”) intendedto provide short-term financing, if necessary, subject to certain restrictions in connection with atypical redemption activity. Expenses and fees related to the Facility are paid by the participating funds and are disclosed separately or as other expenses on the Statement of Operations. The Fund did not utilize the Facility during the reporting period. The Facility terminated May 24, 2019.
Note 11 - Independent Registered Public Accounting Firm
The Audit Committee of the Board of Trustees appointed, and the Board of Trustees ratified and approved, PricewaterhouseCoopers LLP (“PWC”) as the independent registered public accounting firm of the Fund for the fiscal periods ending after May 24, 2019. Prior to the close of business on May 24, 2019, the Predecessor Fund was a separate series of an unaffiliated investment company and its financial statements were audited by a different independent registered public accounting firm (the “Prior Auditor”).
Effective after the close of business on May 24, 2019, the Prior Auditor resigned as the independent registered public accounting firm of the Fund. The Prior Auditor’s report on the financial statements of the Predecessor Fund for the past two fiscal years did not contain an adverse or disclaimer of opinion, and was not qualified or modified as to uncertainty, audit scope or accounting principles. During the Predecessor Fund’s two most recent fiscal years and through the close of business on May 24, 2019, there were no (1) disagreements with the Prior Auditor on any matter of accounting principles or practices, financial statement disclosure, or auditing scope or procedure, which disagreements, if not resolved to the Prior Auditor’s satisfaction, would have caused it to make reference to that matter in connection with its report; or (2) “reportable events,” as that term is defined in Item 304(a)(1)(v) of RegulationS-K under the Securities Exchange Act of 1934.
18 INVESCO OPPENHEIMER V.I. MAIN STREET SMALL CAP FUND
APPROVAL OF THE INVESTMENT ADVISORY ANDSUB-ADVISORY CONTRACTSUnaudited
At meetings held on December 14, 2018, the Board of Trustees (the Board or the Trustees) of AIM Variable Insurance Funds (Invesco Variable Insurance Funds) (the Trust) as a whole, and the independent Trustees, who comprise over 75% of the Board, voting separately, approved (i) an amendment to the Trust’s Master Investment Advisory Agreement with Invesco Advisers, Inc. (Invesco Advisers and the investment advisory agreement) to add Invesco Oppenheimer V.I. Main Street Small Cap Fund® (the Fund), (ii) an amendment to the Master IntergroupSub-Advisory Contract for Mutual Funds with Invesco Asset Management Deutschland GmbH, Invesco Asset Management Limited, Invesco Asset Management (Japan) Limited, Invesco Hong Kong Limited, Invesco Senior Secured Management, Inc. and Invesco Canada Ltd. to add the Fund, (iii) an amendment to the separatesub-advisory contract with Invesco Capital Management LLC to add the Fund, (iv) an amendment to the separatesub-advisory contract with Invesco Asset Management (India) Private Limited to add the Fund, and (v) an initialsub-advisory contract with OppenheimerFunds, Inc. (collectively, the AffiliatedSub-Advisers and thesub-advisory contracts). Additionally, on March 26, 2019, the Boardre-approved an initialsub-advisory contract with OppenheimerFunds, Inc. following its change of control as a result of the acquisition of OppenheimerFunds, Inc. and its subsidiaries, including the Oppenheimer mutual funds (each, an Oppenheimer Fund), by Invesco Ltd. (the OFI Transaction). After evaluating the factors discussed below, among others, the Board approved the Fund’s investment advisory agreement and thesub-advisory contracts and determined that the compensation payable by the Fund to Invesco Advisers and by Invesco Advisers to the AffiliatedSub-Advisers is fair and reasonable.
The Board’s Evaluation Process
The Board noted that it had previously approved establishing the Fund at the Board meeting held on October 23, 2018 and that the Fund was formed to acquire the assets and liabilities of an Oppenheimer Fund (the Acquired Fund) with the same investment objective and substantially similar principal investment strategies and risks. At the time of approval, the Fund had no assets and no performance history and the portfolio managers were not employed by Invesco Advisers or any of the AffiliatedSub-Advisers except OppenheimerFunds, Inc., which was not affiliated with Invesco at that time.
In approving the investment advisory agreement andsub-advisory contracts, the Board followed a process similar to the process that it follows in annually reviewing and approving investment advisory agreements andsub-advisory contracts for the series portfolios of funds advised by Invesco Advisers and considered the information provided in the most recent annual review process for those funds as well as the information provided with respect to the Fund. As part of the approval process, the Board reviewed and considered information provided in response to detailed requests for information submitted to management by the independent Trustees with assistance from legal counsel to the independent Trustees. The Board reviewed comparative investment performance and fee data prepared by Invesco Advisers and an independent mutual fund data provider. The Board was assisted in its review by the Senior Officer, an officer of the Invesco Funds who reports directly to the independent Trustees, and by independent legal counsel.
The discussion below serves as a summary of the material factors and related conclusions that formed the basis for the Board’s approval of the Fund’s investment advisory agreement andsub-advisory contracts. The Trustees’ review and conclusions are based on the comprehensive consideration of all information presented to them and are not the result of any single determinative factor. Moreover, one Trustee may have weighed a particular piece of information or factor differently than another Trustee. This information is current as of December 14, 2018 and March 26, 2019 for thesub-advisory contract with OppenheimerFunds, Inc.
Factors and Conclusions and Summary of Independent Written Fee Evaluation
A. Nature, Extent and Quality of Services Provided by Invesco Advisers and the AffiliatedSub-Advisers
The Board reviewed the nature, extent and quality of the advisory services to be provided to the Fund by Invesco Advisers under the Fund’s investment advisory agreement, and the credentials and experience of the officers and employees of Invesco Advisers who will provide these services. The Board’s review included consideration of the investment process oversight and structure, credit analysis and investment risk management to be employed in providing advisory services to the Fund. The Board also considerednon-advisory services that Invesco Advisers and its affiliates provide to the Invesco Funds and will provide to the Fund, such as various back office support functions, third party oversight, internal audit, valuation, portfolio trading and legal and compliance. The Board also received and reviewed information about Invesco Advisers’ role as administrator of the Invesco Funds’ liquidity risk management program. The Board also reviewed and considered the benefits to shareholders of investing in a fund that is part of the Invesco family of funds under the umbrella of Invesco Ltd., Invesco Advisers’ parent company, and noted Invesco Ltd.’s depth and experience in conducting an investment management business, as well as its commitment of financial and other resources to such business. The Board reviewed and considered information about the resources that Invesco Advisers intends to continue to commit to managing the Invesco family of funds, including the Fund, following the OFI Transaction. The Board concluded that the nature, extent and quality of the services to be provided to the Fund by Invesco Advisers are appropriate and satisfactory.
The Board reviewed the services that may be provided by the AffiliatedSub-Advisers under thesub-advisory contracts and the credentials and experience of the officers and employees of the AffiliatedSub-Advisers who provide these services. The Board noted the AffiliatedSub-Advisers’ expertise with respect to certain asset classes and that the AffiliatedSub-Advisers have offices and personnel that are located in financial centers around the world. As a result, the Board noted that the AffiliatedSub-Advisers can provide research and investment analysis on the markets and economies of various countries in which the Fund may invest, make recommendations regarding securities and assist with security trades. The Board concluded that thesub-advisory contracts may benefit the Fund and its shareholders by permitting Invesco Advisers to use the resources and talents of the AffiliatedSub-Advisers in managing the Fund. The Board concluded that the nature, extent and quality of the services that may be provided by the AffiliatedSub-Advisers are appropriate and satisfactory.
19 INVESCO OPPENHEIMER V.I. MAIN STREET SMALL CAP FUND
APPROVAL OF THE INVESTMENT ADVISORY AND SUB-ADVISORY CONTRACTSUnaudited / Continued
B. Fund Investment Performance
The Board noted that the Fund would continue the historical performance information of the Acquired Fund following the consummation of the OFI Transaction. The Board considered the performance of the Acquired Fund and the fact that, at the closing of the OFI Transaction, management anticipates that the Fund will be managed pursuant to substantially similar investment strategies and by substantially the same portfolio management team as managed the Acquired Fund. The Board did not view Fund performance as a relevant factor in considering whether to approve thesub-advisory contracts for the Fund, as no AffiliatedSub-Adviser currently manages assets of the Fund.
The Board compared the Fund’s investment performance over multiple time periods ending December 31, 2017 to the performance of funds in the Morningstar performance universe and against the Fund’s benchmark index. The Trustees also reviewed more recent Fund performance and this review did not change their conclusions.
C. Advisory andSub-Advisory Fees and Fund Expenses
The Board compared the Fund’s contractual management fee rate to the contractual management fee rates of funds in the Fund’s Morningstar expense group. The Board also considered comparative information regarding the Fund’s total expense ratio and its various components.
The Board noted that Invesco Advisers has contractually agreed to waive fees and/or limit expenses of the Fund for at least two years from the closing date of the OFI Transaction in an amount necessary to limit total annual operating expenses to a specified percentage of average daily net assets for each class of the Fund.
The Board also considered the fees charged by Invesco Advisers and the AffiliatedSub-Advisers to other similarly managed client accounts. The Board noted that Invesco Advisers or the AffiliatedSub-Advisers may charge lower fees to large institutional clients. Invesco Advisers reviewed with the Board differences in the scope of services it provides to the Invesco Funds relative to certain other types of client accounts, including management of cash flows as a result of redemptions and purchases, necessary infrastructure such as officers, office space, technology, legal and distribution, oversight of service providers, costs and business risks associated with launching new funds and sponsoring and maintaining the product line, preparation of annual registration statement updates and financial information and compliance with federal and state laws and regulations.
The Board also compared the Fund’s effective advisory fee rate (the advisory fee rate after advisory fee waivers and before other expense limitations/ waivers) to the effective advisory fee rates of other similarly managed third-party mutual funds advised orsub-advised by Invesco Advisers and its affiliates, based on asset balances as of December 31, 2018.
The Board also considered the services that may be provided by the AffiliatedSub-Advisers pursuant to thesub-advisory contracts, as well as the fees payable by Invesco Advisers to the AffiliatedSub-Advisers pursuant to thesub-advisory contracts.
D. Economies of Scale and Breakpoints
The Board considered the extent to which there may be economies of scale in the provision of advisory services to the Fund. The Board considered Invesco’s reinvestment in its business, including investments in business infrastructure and cybersecurity. The Board also considered that the Fund may benefit from economies of scale through contractual breakpoints in the Fund’s advisory fee schedule, which generally operate to reduce the Fund’s expense ratio as it grows in size. The Board noted that the Fund will share directly in economies of scale through lower fees charged by third party service providers based on the combined size of the Invesco Funds. The Board noted that the Fund may also benefit from economies of scale through initial fee setting, fee waivers and expense reimbursements.
E. Profitability and Financial Resources
The Board reviewed information from the 2018 contract renewal process provided by Invesco Advisers concerning the costs of the advisory and other services that Invesco Advisers and its affiliates provide to the Invesco Funds and the profitability of Invesco Advisers and its affiliates in providing these services. The Board considered the methodology used for calculating profitability and noted the periodic review of such methodology by an independent consultant. The Board noted that Invesco Advisers will continue to operate at a net profit from services Invesco Advisers and its affiliates provide to the Invesco Funds. The Board did not deem the level of profits realized by Invesco Advisers and its affiliates from providing services to the Invesco Funds, and the profits estimated to be realized by the Fund, to be excessive given the nature, extent and quality of the services provided. The Board received information from Invesco Advisers demonstrating that Invesco Advisers and the AffiliatedSub-Advisers are financially sound and have the resources necessary to perform their obligations under the investment advisory agreement andsub-advisory contracts.
F. Collateral Benefits to Invesco Advisers and its Affiliates
The Board considered various other benefits to be received by Invesco Advisers and its affiliates from the relationship with the Fund, including the fees to be received for providing administrative, transfer agency and distribution services to the Fund. The Board considered the performance of Invesco Advisers and its affiliates in providing these services to other Invesco Funds and the organizational structure employed to provide these services. The Board also considered that these services will be provided to the Fund pursuant to written contracts that are reviewed and approved on an annual basis by the Board; and that the services are required for the operation of the Fund.
The Board considered the benefits realized by Invesco Advisers and the AffiliatedSub-Advisers as a result of portfolio brokerage transactions executed through “soft dollar” arrangements. The Board noted that soft dollar arrangements may result in the Fund bearing costs to purchase research that may
20 INVESCO OPPENHEIMER V.I. MAIN STREET SMALL CAP FUND
APPROVAL OF THE INVESTMENT ADVISORY AND SUB-ADVISORY CONTRACTSUnaudited / Continued
be used by Invesco Advisers or the AffiliatedSub-Advisers with other clients and may reduce Invesco Advisers’ or the AffiliatedSub-Advisers’ expenses. The Board also considered that it will receive periodic reports from Invesco representing that these arrangements are consistent with regulatory requirements. The Board did not deem the soft dollar arrangements to be inappropriate.
The Board considered that the Fund’s uninvested cash and cash collateral from any securities lending arrangements may be invested in money market funds advised by Invesco Advisers pursuant to procedures approved by the Board. The Board considered that Invesco Advisers will receive advisory fees from these affiliated money market funds attributable to such investments, although Invesco Advisers has contractually agreed to waive through varying periods the advisory fees payable by the Invesco Funds with respect to certain investments in the affiliated money market funds. The waiver is in an amount equal to 100% of the net advisory fee Invesco Advisers will receive from the affiliated money market funds with respect to the Fund’s investment in the affiliated money market funds of uninvested cash, but not cash collateral. The Board concluded that the amount of advisory fees to be received by Invesco Advisers from the Fund’s investment of cash collateral from any securities lending arrangements in the affiliated money market funds is fair and reasonable.
The Board also considered that an affiliated broker may receive commissions for executing certain trades for the Fund. Invesco Advisers and the AffiliatedSub-Advisers may use the affiliated broker to, among other things, control order routing and minimize information leakage, and the Board was be advised that such trades will be executed in compliance with rules under the federal securities laws and consistent with best execution obligations.
21 INVESCO OPPENHEIMER V.I. MAIN STREET SMALL CAP FUND
PORTFOLIO PROXY VOTING POLICIES AND GUIDELINES; UPDATES TO STATEMENT OF INVESTMENTSUnaudited
Go paperless with eDelivery
Visit invesco.com/edelivery to enjoy the convenience and security of anytime electronic access to your investment documents.
With eDelivery, you can elect to have any or all of the following materials delivered straight to your inbox to download, save and print from your own computer:
| · | | Fund reports and prospectuses |
Invesco mailing information
Send general correspondence to Invesco Investment Services, Inc., P.O. Box 219078, Kansas City, MO 64121-9078.
Important notice regarding delivery of security holder documents
To reduce Fund expenses, only one copy of most shareholder documents may be mailed to shareholders with multiple accounts at the same address (Householding). Mailing of your shareholder documents may be householded indefinitely unless you instruct us otherwise. If you do not want the mailing of these documents to be combined with those for other members of your household, please contact Invesco Investment Services, Inc. at 800 959 4246 or contact your financial institution. We will begin sending you individual copies for each account within 30 days after receiving your request.
Fund holdings and proxy voting information
The Fund provides a complete list of its holdings four times in each fiscal year, at the quarter ends. For the second and fourth quarters, the lists appear in the Fund’s semiannual and annual reports to shareholders. For the first and third quarters, the Fund files the lists with the Securities and Exchange Commission (SEC) on FormN-Q (or any successor Form). The most recent list of portfolio holdings is available at invesco.com/completeqtrholdings. Shareholders can also look up the Fund’s FormsN-Q (or any successor Form) on the SEC website at sec.gov.
A description of the policies and procedures that the Fund uses to determine how to vote proxies relating to portfolio securities is available without charge, upon request, from our Client Services department at 800 959 4246 or at invesco.com/proxyguidelines. The information is also available on the SEC website, sec.gov.
Information regarding how the Fund voted proxies related to its portfolio securities during the most recent12-month period ended June 30 is available at invesco.com/proxysearch. The information is also available on the SEC website, sec.gov.
Invesco Advisers, Inc. is an investment adviser; it provides investment advisory services to individual and institutional clients and does not sell securities. Invesco Distributors, Inc. is the US distributor for Invesco Ltd.’s retail mutual funds, exchange-traded funds and institutional money market funds. Both are wholly owned, indirect subsidiaries of Invesco Ltd.
22 INVESCO OPPENHEIMER V.I. MAIN STREET SMALL CAP FUND
SHAREHOLDER PROXYUnaudited
A Special Meeting (“Meeting”) of Shareholders of Invesco Oppenheimer V.I. Main Street Small Cap Fund® was held on April 12, 2019. The Meeting was held for the following purpose:
(1) Approval of an Agreement and Plan of Reorganization that provides for the reorganization of Oppenheimer Main Street Small Cap Fund®/VA into Invesco Oppenheimer V.I. Main Street Small Cap Fund®.
The results of the voting on the above matter was as follows:
| | | | | | | | | | | | | | | | |
| Matter | | Votes For | | | Votes Against | | | Votes Abstain | | | Broker Non-Votes | |
| (1) Approval of an Agreement and Plan of Reorganization | | | 29,988,603 | | | | 1,834,785 | | | | 2,844,879 | | | | 0 | |
23 INVESCO OPPENHEIMER V.I. MAIN STREET SMALL CAP FUND
O-VIMSS-SAR-1
| | | | |
 | | Semiannual Report | | 6/30/2019 |
| | | | |
| | | | |
| | | | |
| | | | |
| | | | |
| | | | |
| | | | |
| |
| | Invesco Oppenheimer V.I. Total Return Bond Fund* The Fund provides a complete list of its holdings four times in each fiscal year, at the quarter ends. For the second and fourth quarters, the lists appear in the Fund’s semiannual and annual reports to shareholders. For the first and third quarters, the Fund files the lists with the Securities and Exchange Commission (SEC) on FormN-Q (or any successor Form). The Fund’s FormN-Q (or any successor Form) filings are available on the SEC website, sec.gov. The Fund’s most recent portfolio holdings, as filed on FormN-Q (or any successor Form), have also been made available to insurance companies issuing variable annuity contracts and variable life insurance policies (“variable products”) that invest in the Fund. A description of the policies and procedures that the Fund uses to determine how to vote proxies relating to portfolio securities is available without charge, upon request, from our Client Services department at 800 959 4246 or at invesco.com/proxyguidelines. The information is also available on the SEC website, sec.gov. Information regarding how the Fund voted proxies related to its portfolio securities during the most recent12-month period ended June 30 is available at invesco.com/proxysearch. The information is also available on the SEC website, sec.gov. Invesco Advisers, Inc. is an investment adviser; it provides investment advisory services to individual and institutional clients and does not sell securities. Invesco Distributors, Inc. is the US distributor for Invesco Ltd.’s retail mutual funds, exchange- traded funds and institutional money market funds. Both are wholly owned, indirect subsidiaries of Invesco Ltd. This report must be accompanied or preceded by a currently effective Fund prospectus and variable product prospectus, which contain more complete information, including sales charges and expenses. Investors should read each carefully before investing. *Prior to the close of business on May 24, 2019, the Fund’s name was Oppenheimer Total Return Bond Fund/VA. See Important Update on the following page for more information. |
Important Update
On October 18, 2018, Massachusetts Mutual Life Insurance Company, an indirect corporate parent of OppenheimerFunds, Inc. and its subsidiaries OFI Global Asset Management, Inc., OFI SteelPath, Inc. and OFI Advisors, LLC, announced that it had entered into an agreement whereby Invesco Ltd., a global investment management company would acquire OppenheimerFunds and its subsidiaries (together, “OppenheimerFunds”). After the close of business on May 24, 2019 Invesco Ltd. completed the acquisition of OppenheimerFunds. This Fund was included in that acquisition and as of that date, became part of the Invesco family of funds. Please visit invesco.com for more information or call Invesco’s Client Services team at800-959-4246.
PORTFOLIO MANAGERS:Michael Hyman1 and Peter A. Strzalkowski, CFA
AVERAGE ANNUAL TOTAL RETURNS FOR THE PERIODS ENDED 6/30/19
| | | | | | | | | | | | | | | | | | | | |
| | | Inception
Date | | | 6-Months | | | 1-Year | | | 5-Year | | | 10-Year | |
Series I Shares2 | | | 4/3/85 | | | | 6.90 | % | | | 8.20 | % | | | 3.24 | % | | | 6.25 | % |
Series II Shares2 | | | 5/1/02 | | | | 6.74 | | | | 7.91 | | | | 2.99 | | | | 6.00 | |
Bloomberg Barclays U.S. Credit Index | | | | | | | 9.35 | | | | 10.34 | | | | 3.92 | | | | 5.77 | |
Bloomberg Barclays U.S. Aggregate Bond Index | | | | | | | 6.11 | | | | 7.87 | | | | 2.95 | | | | 3.90 | |
Citigroup Broad Investment Grade Bond Index | | | | | | | 6.14 | | | | 7.91 | | | | 2.95 | | | | 3.83 | |
Performance quoted is past performance and cannot guarantee comparable future results; current performance may be lower or higher.Visit invesco.com for the most recentmonth-end performance. Performance figures reflect reinvested distributions and changes in net asset value (NAV). Investment return and principal value will vary so that you may have a gain or a loss when you sell shares. Fund returns include changes in share price, reinvested distributions and sales charges except where “without sales charge” is indicated. Effective after the close of business on May 24, 2019, theNon-Service and Service share classes of the predecessor fund were reorganized into Series I and Series II Shares, respectively, of the Fund. Returns shown for Series I and Series II shares are blended returns of the predecessor fund and the Fund. Share class returns will differ from those of the predecessor fund because of different expenses. See Fund prospectuses and summary prospectuses for more information on share classes, sales charges and new fee agreements, if any. Fund literature is available at invesco.com.
The Fund’s performance is compared to the performance of the Bloomberg Barclays Credit Index, an index ofnon-convertible U.S. investment grade corporate bonds; the Bloomberg Barclays U.S. Aggregate Bond Index, an index of U.S. corporate and government bonds and the FTSE US Broad Investment-Grade Bond Index, an index of institutionally traded U.S. Treasury Bonds, government-sponsored bonds, mortgage-backed securities and corporate securities. The indices are unmanaged and cannot be purchased directly by investors. While index comparisons may be useful to provide a benchmark for the Fund’s performance, it must be noted that the Fund’s investments are not limited to the investments comprising the indices.Index performance includes reinvestment of income, but does not reflect transaction costs, fees, expenses or taxes. Index performance is shown for illustrative purposes only as a benchmark for the Fund’s performance, and does not predict or depict performance of the Fund. The Fund’s performance reflects the effects of the Fund’s business and operating expenses
TOP HOLDINGS AND ALLOCATIONS
| | | | |
PORTFOLIO ALLOCATION | | | | |
Mortgage-Backed Obligations | | | | |
Government Agency | | | 27.7 | % |
Non-Agency | | | 8.8 | |
Non-Convertible Corporate Bonds and Notes | | | 34.4 | |
Investment Company | | | 12.7 | |
Asset-Backed Securities | | | 10.3 | |
Short-Term Notes | | | 6.1 | |
|
| Portfolio holdings and allocations are subject to change. Percentages are as of June 30, 2019 and are based on the total market value of investments. | |
| | | | |
CORPORATE BONDS & NOTES - TOP TEN INDUSTRIES | |
Commercial Banks | | | 7.0 | % |
Oil, Gas & Consumable Fuels | | | 3.7 | |
Capital Markets | | | 2.4 | |
Food Products | | | 2.2 | |
Insurance | | | 2.0 | |
Electric Utilities | | | 1.8 | |
Automobiles | | | 1.7 | |
Diversified Telecommunication Services | | | 1.7 | |
Media | | | 1.5 | |
Household Durables | | | 1.2 | |
Portfolio holdings and allocations are subject to change. Percentages are as of June 30, 2019, and are based on net assets.
1. Michael Hyman was named a Portfolio Manager of the Fund effective June 21, 2019.
2. Effective after the close of business on May 24, 2019, theNon-Service and Service share classes of the predecessor fund were reorganized into Series I and Series II Shares, respectively, of the Fund. Returns shown for Series I and Series II shares are blended returns of the predecessor fund and the Fund. Share class returns will differ from those of the predecessor fund because of different expenses.
For more current Fund holdings, please visit invesco.com.
3 INVESCO OPPENHEIMER V.I. TOTAL RETURN BOND FUND
Before investing, investors should carefully read the prospectus and/or summary prospectus and carefully consider the investment objectives, risks, charges and expenses. For this and more complete information about the fund(s), investors should ask their advisors for a prospectus/summary prospectus or visit invesco.com/fundprospectus.
Shares of Invesco funds are not deposits or obligations of any bank, are not guaranteed by any bank, are not insured by the FDIC or any other agency, and involve investment risks, including the possible loss of the principal amount invested.
4 INVESCO OPPENHEIMER V.I. TOTAL RETURN BOND FUND
Fund Expenses
Fund Expenses.As a shareholder of the Fund, you incur two types of costs: (1) transaction costs and (2) ongoing costs, including management fees; distribution and service fees; and other Fund expenses. These examples are intended to help you understand your ongoing costs (in dollars) of investing in the Fund and to compare these costs with the ongoing costs of investing in other mutual funds.
The examples are based on an investment of $1,000.00 invested at the beginning of the period and held for the entire6-month period ended June 30, 2019.
Actual Expenses. The first section of the table provides information about actual account values and actual expenses. You may use the information in this section for the class of shares you hold, together with the amount you invested, to estimate the expense that you paid over the period. Simply divide your account value by $1,000.00 (for example, an $8,600.00 account value divided by $1,000.00 = 8.60), then multiply the result by the number in the first section under the heading entitled “Expenses Paid During 6 Months Ended June 30, 2019” to estimate the expenses you paid on your account during this period.
Hypothetical Example for Comparison Purposes.
The second section of the table provides information about hypothetical account values and hypothetical expenses based on the Fund’s actual expense ratio for each class of shares, and an assumed rate of return of 5% per year for each class before expenses, which is not the actual return. The hypothetical account values and expenses may not be used to estimate the actual ending account balance or expenses you paid for the period. You may use this information to compare the ongoing costs of investing in the Fund and other funds. To do so, compare this 5% hypothetical example for the class of shares you hold with the 5% hypothetical examples that appear in the shareholder reports of the other funds.
Please note that the expenses shown in the table are meant to highlight your ongoing costs only and do not reflect any charges associated with the separate accounts that offer this Fund. Therefore, the “hypothetical” lines of the table are useful in comparing ongoing costs only, and will not help you determine the relative total costs of owning different funds. In addition, if these separate account charges were included your costs would have been higher.
| | | | | | | | | | | | |
| Actual | | Beginning Account Value
January 1, 2019 | | | Ending Account Value
June 30, 2019 | | | Expenses Paid During
6 Months Ended June 30, 2019 |
Series I shares | | | 1,000.00 | | | | 1,069.00 | | | | 3.85 | |
Series II shares | | | 1,000.00 | | | | 1,067.40 | | | | 5.14 | |
| | | |
Hypothetical | | | | | | | | | | | | |
(5% return before expenses) | | | | | | | | | | | | |
Series I shares | | | 1,000.00 | | | | 1,021.08 | | | | 3.77 | |
Series II shares | | | 1,000.00 | | | | 1,019.84 | | | | 5.02 | |
Expenses are equal to the Fund’s annualized expense ratio for that class, multiplied by the average account value over the period, multiplied by 181/365 (to reflect theone-half year period). Those annualized expense ratios, excluding indirect expenses from affiliated funds, based on the6-month period ended June 30, 2019 are as follows:
| | | | | | |
| Class | | Expense Ratios | | |
Series I shares | | | 0.75 | % |
Series II shares | | | 1.00 | |
The expense ratios reflect voluntary and/or contractual waivers and/or reimbursements of expenses by the Fund’s Manager. Some of these undertakings may be modified or terminated at any time, as indicated in the Fund’s prospectus. The “Financial Highlights” tables in the Fund’s financial statements, included in this report, also show the gross expense ratios, without such waivers or reimbursements and reduction to custodian expenses, if applicable.
5 INVESCO OPPENHEIMER V.I. TOTAL RETURN BOND FUND
STATEMENT OF INVESTMENTSJune 30, 2019 Unaudited
| | | | | | | | |
‘ | | Principal Amount | | | Value | |
Asset-Backed Securities—13.7% | |
Auto Loan—11.1% | |
| American Credit Acceptance Receivables Trust: | |
| Series2017-4,Cl. B, 2.61%, 5/10/211 | | $ | 2,699 | | | $ | 2,699 | |
| Series2017-4,Cl. C, 2.94%, 1/10/241 | | | 183,000 | | | | 183,267 | |
| Series2017-4,Cl. D, 3.57%, 1/10/241 | | | 227,000 | | | | 229,325 | |
| Series2018-2,Cl. C, 3.70%, 7/10/241 | | | 255,000 | | | | 257,698 | |
| Series2018-3,Cl. B, 3.49%, 6/13/221 | | | 80,000 | | | | 80,390 | |
| Series2018-3,Cl. D, 4.14%, 10/15/241 | | | 25,000 | | | | 25,631 | |
| Series2018-4,Cl. C, 3.97%, 1/13/251 | | | 180,000 | | | | 183,685 | |
| AmeriCredit Automobile Receivables Trust: | |
| Series2017-2,Cl. D, 3.42%, 4/18/23 | | | 300,000 | | | | 304,944 | |
| Series2017-4,Cl. D, 3.08%, 12/18/23 | | | 190,000 | | | | 192,809 | |
| Series2018-3,Cl. C, 3.74%, 10/18/24 | | | 260,000 | | | | 269,089 | |
| Series2019-2,Cl. C, 2.74%, 4/18/25 | | | 100,000 | | | | 100,616 | |
| Series2019-2,Cl. D, 2.99%, 6/18/25 | | | 235,000 | | | | 236,499 | |
| Capital Auto Receivables Asset Trust: | |
| Series2017-1,Cl. D, 3.15%, 2/20/251 | | | 40,000 | | | | 40,208 | |
| Series2018-2,Cl. B, 3.48%, 10/20/231 | | | 120,000 | | | | 121,755 | |
| Series2018-2,Cl. C, 3.69%, 12/20/231 | | | 115,000 | | | | 116,835 | |
| CarMax Auto Owner Trust: | |
| Series2015-2,Cl. D, 3.04%, 11/15/21 | | | 100,000 | | | | 100,001 | |
| Series2015-3,Cl. D, 3.27%, 3/15/22 | | | 295,000 | | | | 295,631 | |
| Series2016-1,Cl. D, 3.11%, 8/15/22 | | | 185,000 | | | | 185,350 | |
| Series2017-1,Cl. D, 3.43%, 7/17/23 | | | 230,000 | | | | 232,379 | |
| Series2017-4,Cl. D, 3.30%, 5/15/24 | | | 100,000 | | | | 101,138 | |
| Series2018-4,Cl. C, 3.85%, 7/15/24 | | | 85,000 | | | | 88,665 | |
| CIG Auto Receivables Trust, Series2017-1A, Cl. A, 2.71%, 5/15/231 | | | 35,846 | | | | 35,825 | |
| CPS Auto Receivables Trust: | |
| Series2018-A,Cl. B, 2.77%, 4/18/221 | | | 125,000 | | | | 125,096 | |
| Series2018-B,Cl. B, 3.23%, 7/15/221 | | | 150,000 | | | | 150,865 | |
| CPS Auto Trust, Series2017-A, Cl. B, 2.68%, 5/17/211 | | | 14,516 | | | | 14,515 | |
| Credit Acceptance Auto Loan Trust: | |
| Series2017-3A,Cl. C, 3.48%, 10/15/261 | | | 205,000 | | | | 207,242 | |
| Series2018-1A,Cl. B, 3.60%, 4/15/271 | | | 165,000 | | | | 168,167 | |
| Series2018-1A,Cl. C, 3.77%, 6/15/271 | | | 180,000 | | | | 182,948 | |
| Series2018-2A,Cl. C, 4.16%, 9/15/271 | | | 150,000 | | | | 155,952 | |
| Series2018-3A,Cl. C, 4.04%, 12/15/271 | | | 210,000 | | | | 216,249 | |
| Series2019-1A,Cl. B, 3.75%, 4/17/281 | | | 100,000 | | | | 102,921 | |
| Series2019-1A,Cl. C, 3.94%, 6/15/281 | | | 190,000 | | | | 195,936 | |
| Drive Auto Receivables Trust: | |
| Series2016-CA,Cl. D, 4.18%, 3/15/241 | | | 160,000 | | | | 162,539 | |
| Series2017-1,Cl. D, 3.84%, 3/15/23 | | | 225,000 | | | | 227,761 | |
| Series2018-1,Cl. D, 3.81%, 5/15/24 | | | 180,000 | | | | 183,233 | |
| Series2018-2,Cl. D, 4.14%, 8/15/24 | | | 295,000 | | | | 302,249 | |
| Series2018-3,Cl. D, 4.30%, 9/16/24 | | | 200,000 | | | | 206,246 | |
| Series2018-5,Cl. C, 3.99%, 1/15/25 | | | 210,000 | | | | 216,298 | |
| Series2019-1,Cl. C, 3.78%, 4/15/25 | | | 345,000 | | | | 352,069 | |
| Series2019-3,Cl. D, 3.18%, 10/15/26 | | | 150,000 | | | | 151,044 | |
| DT Auto Owner Trust: | |
| Series2016-4A,Cl. E, 6.49%, 9/15/231 | | | 120,000 | | | | 124,901 | |
| Series2017-1A,Cl. D, 3.55%, 11/15/221 | | | 125,000 | | | | 125,770 | |
| Series2017-2A,Cl. D, 3.89%, 1/15/231 | | | 175,000 | | | | 176,331 | |
| Series2017-3A,Cl. D, 3.58%, 5/15/231 | | | 70,000 | | | | 70,720 | |
| Series2017-3A,Cl. E, 5.60%, 8/15/241 | | | 195,000 | | | | 203,875 | |
| Series2017-4A,Cl. D, 3.47%, 7/17/231 | | | 190,000 | | | | 191,447 | |
| Series2017-4A,Cl. E, 5.15%, 11/15/241 | | | 215,000 | | | | 223,183 | |
| Series2018-3A,Cl. B, 3.56%, 9/15/221 | | | 250,000 | | | | 253,190 | |
| Series2018-3A,Cl. C, 3.79%, 7/15/241 | | | 100,000 | | | | 102,038 | |
| Series2019-2A,Cl. D, 3.48%, 2/18/251 | | | 125,000 | | | | 127,428 | |
| Exeter Automobile Receivables Trust: | |
| Series2018-1A,Cl. B, 2.75%, 4/15/221 | | | 136,535 | | | | 136,627 | |
| Series2018-4A,Cl. B, 3.64%, 11/15/221 | | | 210,000 | | | | 212,512 | |
| Series2019-1A,Cl. D, 4.13%, 12/16/241 | | | 195,000 | | | | 201,799 | |
| Series2019-2A,Cl. C, 3.30%, 3/15/241 | | | 317,000 | | | | 322,547 | |
| Flagship Credit Auto Trust, Series2016-1, Cl. C, 6.22%, 6/15/221 | | | 345,000 | | | | 357,127 | |
| | | | | | | | |
| ‘ | | Principal Amount | | | Value | |
Auto Loan (Continued) | |
| GLS Auto Receivables Trust, Series2018-1A, Cl. A, 2.82%, 7/15/222 | | $ | 158,405 | | | $ | 158,642 | |
| GM Financial Automobile Leasing Trust: | |
| Series2017-3,Cl. C, 2.73%, 9/20/21 | | | 120,000 | | | | 120,075 | |
| Series2018-2,Cl. C, 3.50%, 4/20/22 | | | 135,000 | | | | 136,599 | |
| GMF Floorplan Owner Revolving Trust: | |
| Series2018-3,Cl. B, 3.49%, 9/15/221 | | | 240,000 | | | | 243,396 | |
| Series2018-3,Cl. C, 3.68%, 9/15/221 | | | 200,000 | | | | 202,887 | |
| Series2018-4,Cl. B, 3.68%, 9/15/231 | | | 200,000 | | | | 205,127 | |
| Series2018-4,Cl. C, 3.88%, 9/15/231 | | | 250,000 | | | | 256,416 | |
| Navistar Financial Dealer Note Master Owner Trust II: | |
| Series2018-1,Cl. A, 3.034% [US0001M+63], 9/25/231,3 | | | 110,000 | | | | 110,250 | |
| Series2018-1,Cl. B, 3.204% [US0001M+80], 9/25/231,3 | | | 125,000 | | | | 125,233 | |
| Series2019-1,Cl. C, 3.363% [US0001M+95], 5/28/241,3 | | | 25,000 | | | | 25,030 | |
| Series2019-1,Cl. D, 3.863% [US0001M+145], 5/28/241,3 | | | 25,000 | | | | 25,026 | |
| Santander Drive Auto Receivables Trust: | |
| Series2017-1,Cl. E, 5.05%, 7/15/241 | | | 355,000 | | | | 364,001 | |
| Series2017-2,Cl. D, 3.49%, 7/17/23 | | | 70,000 | | | | 70,788 | |
| Series2017-3,Cl. D, 3.20%, 11/15/23 | | | 280,000 | | | | 283,040 | |
| Series2018-1,Cl. D, 3.32%, 3/15/24 | | | 100,000 | | | | 101,491 | |
| Series2018-2,Cl. D, 3.88%, 2/15/24 | | | 165,000 | | | | 169,139 | |
| Series2018-5,Cl. C, 3.81%, 12/16/24 | | | 215,000 | | | | 219,539 | |
| Series2019-2,Cl. D, 3.22%, 7/15/25 | | | 195,000 | | | | 197,878 | |
| Santander Retail Auto Lease Trust, Series2019-A, Cl. C, 3.30%, 5/22/231 | | | 315,000 | | | | 318,522 | |
| TCF Auto Receivables Owner Trust, Series2015-1A, Cl. D, 3.53%, 3/15/221 | | | 160,000 | | | | 160,013 | |
| United Auto Credit Securitization Trust: | |
| Series2018-1,Cl. C, 3.05%, 9/10/211 | | | 255,000 | | | | 255,191 | |
| Series2019-1,Cl. C, 3.16%, 8/12/241 | | | 150,000 | | | | 151,166 | |
| Veros Automobile Receivables Trust, Series2017-1, Cl. A, 2.84%, 4/17/231 | | | 17,762 | | | | 17,752 | |
| Westlake Automobile Receivables Trust: | |
| Series2017-2A,Cl. E, 4.63%, 7/15/241 | | | 305,000 | | | | 312,273 | |
| Series2018-1A,Cl. D, 3.41%, 5/15/231 | | | 160,000 | | | | 161,228 | |
| Series2018-3A,Cl. B, 3.32%, 10/16/231 | | | 245,000 | | | | 247,343 | |
| | | | | | | | |
| | | | 14,173,309 | |
Credit Card—1.4% | |
| GE Capital Credit Card Master Note Trust, Series2012-7, Cl. B, 2.21%, 9/15/22 | | | 185,000 | | | | 184,779 | |
| World Financial Network Credit Card Master Trust: | |
| Series2018-A,Cl. A, 3.07%, 12/16/24 | | | 495,000 | | | | 501,799 | |
| Series2018-B,Cl. A, 3.46%, 7/15/25 | | | 230,000 | | | | 236,521 | |
| Series2018-C,Cl. A, 3.55%, 8/15/25 | | | 470,000 | | | | 484,641 | |
| Series2019-A,Cl. A, 3.14%, 12/15/25 | | | 75,000 | | | | 76,969 | |
| Series2019-B,Cl. A, 2.49%, 4/15/26 | | | 270,000 | | | | 270,026 | |
| | | | | | | | |
| | | | 1,754,735 | |
Equipment—0.7% | |
| CCG Receivables Trust: | |
| Series2017-1,Cl. B, 2.75%, 11/14/231 | | | 230,000 | | | | 230,449 | |
| Series2018-1,Cl. B, 3.09%, 6/16/251 | | | 85,000 | | | | 85,945 | |
| Series2018-1,Cl. C, 3.42%, 6/16/251 | | | 20,000 | | | | 20,294 | |
| Series2018-2,Cl. C, 3.87%, 12/15/251 | | | 60,000 | | | | 61,884 | |
| Series2019-1,Cl. B, 3.22%, 9/14/261 | | | 170,000 | | | | 173,385 | |
| Series2019-1,Cl. C, 3.57%, 9/14/261 | | | 40,000 | | | | 40,810 | |
| CNH Equipment Trust: | |
| Series2017-C,Cl. B, 2.54%, 5/15/25 | | | 65,000 | | | | 65,453 | |
| Series2019-A,Cl. A4, 3.22%, 1/15/26 | | | 125,000 | | | | 129,478 | |
| Dell Equipment Finance Trust, Series2018-1, Cl. B, 3.34%, 6/22/231 | | | 80,000 | | | | 81,366 | |
| | | | | | | | |
| | | | 889,064 | |
6 INVESCO OPPENHEIMER V.I. TOTAL RETURN BOND FUND
| | | | | | | | |
| | | Principal Amount | | | Value | |
Home Equity Loan—0.0% | |
MASTR Asset Backed Securities Trust, Series 2006-WMC3, Cl. A3, 2.504% [US0001M+10], 8/25/363 | | $ | 44,508 | | | $ | 21,532 | |
Loans: Other—0.4% | |
| Ameriquest Mortgage Securities, Inc. Asset- Backed Pass-Through Certificates, Series 2005- R5, Cl. M2, 3.094% [US0001M+69], 7/25/353 | | | 52,271 | | | | 52,468 | |
| Dell Equipment Finance Trust: | |
| Series2017-2,Cl. B, 2.47%, 10/24/221 | | | 70,000 | | | | 69,872 | |
| Series2019-1,Cl. C, 3.14%, 3/22/241 | | | 325,000 | | | | 330,267 | |
| Element Rail Leasing I LLC, Series2014-1A, Cl. A1, 2.299%, 4/19/441 | | | 108,351 | | | | 108,547 | |
| | | | | | | | |
| | | | 561,154 | |
Receivables: Other—0.1% | |
| American Credit Acceptance Receivables Trust, Series2019-2, Cl. D, 3.41%, 6/12/251 | | | 145,000 | | | | 146,133 | |
| | | | | | | | |
| Total Asset-Backed Securities (Cost $17,285,965) | | | | 17,545,927 | |
| | | | | |
Mortgage-Backed Obligations—48.2% | |
Government Agency—36.6% | |
FHLMC/FNMA/FHLB/Sponsored—33.0% | |
| Federal Home Loan Mortgage Corp., Series 2018-HQA2, Cl. M1, 3.154% [US0001M+75], 10/25/481,3 | | | 380,000 | | | | 380,607 | |
| Federal Home Loan Mortgage Corp. Gold Pool: | |
| 5.00%, 12/1/34 | | | 2,982 | | | | 3,226 | |
| 5.50%, 9/1/39 | | | 189,021 | | | | 204,131 | |
| 6.00%,10/1/22-10/1/29 | | | 226,676 | | | | 250,159 | |
| 6.50%,7/1/28-4/1/34 | | | 84,608 | | | | 94,049 | |
| 7.00%,10/1/31-10/1/37 | | | 73,739 | | | | 82,533 | |
| 9.00%,8/1/22-5/1/25 | | | 3,312 | | | | 3,561 | |
| Federal Home Loan Mortgage Corp. Non Gold Pool, 10.50%, 10/1/20 | | | 127 | | | | 128 | |
| Federal Home Loan Mortgage Corp., Interest-Only Stripped Mtg.-Backed Security: | |
| Series 205,Cl. IO, 86.484%, 9/1/294 | | | 3,630 | | | | 728 | |
| Series 206,Cl. IO, 3.777%, 12/15/294 | | | 64,661 | | | | 17,193 | |
| Series 243,Cl. 6, 0.894%, 12/15/324 | | | 40,930 | | | | 7,469 | |
| Series 304,Cl. C31, 9.153%, 12/15/274 | | | 133,628 | | | | 10,552 | |
| Series 304,Cl. C45, 6.694%, 12/15/274 | | | 67,769 | | | | 5,290 | |
| Series 304,Cl. C47, 5.017%, 12/15/274 | | | 62,176 | | | | 5,149 | |
| Federal Home Loan Mortgage Corp., Mtg.- Linked Amortizing Global Debt Securities, Series2012-1, Cl. A10, 2.06%, 1/15/22 | | | 203,897 | | | | 204,093 | |
| Federal Home Loan Mortgage Corp., Multifamily Structured Pass Through Certificates, Interest-Only Stripped Mtg.- Backed Security, Series K093, Cl. X1, 0.00%, 5/25/294,5 | | | 1,695,000 | | | | 134,886 | |
| Federal Home Loan Mortgage Corp., Multifamily Structured Pass-Through Certificates, Interest-Only Stripped Mtg.-Backed Security: | |
| Series K734,Cl. X1, 0.00%, 2/25/264,5 | | | 2,049,709 | | | | 77,344 | |
| Series KC02,Cl. X1, 0.00%, 3/25/244,5 | | | 4,569,137 | | | | 75,618 | |
| Series KC03,Cl. X1, 0.00%, 11/25/244,5 | | | 2,755,000 | | | | 68,709 | |
| Federal Home Loan Mortgage Corp., Principal- Only Stripped Mtg.-Backed Security, Series 176, Cl. PO, 4.108%, 6/1/266 | | | 18,767 | | | | 17,489 | |
| Federal Home Loan Mortgage Corp., Real Estate Mtg. Investment Conduit Multiclass Pass-Through Certificates: | |
| Series 151,Cl. F, 9.00%, 5/15/21 | | | 274 | | | | 278 | |
| Series 1674,Cl. Z, 6.75%, 2/15/24 | | | 5,055 | | | | 5,383 | |
| Series 2034,Cl. Z, 6.50%, 2/15/28 | | | 1,059 | | | | 1,172 | |
| Series 2042,Cl. N, 6.50%, 3/15/28 | | | 2,339 | | | | 2,562 | |
| Series 2043,Cl. ZP, 6.50%, 4/15/28 | | | 135,691 | | | | 152,205 | |
| Series 2046,Cl. G, 6.50%, 4/15/28 | | | 4,509 | | | | 5,055 | |
| Series 2053,Cl. Z, 6.50%, 4/15/28 | | | 1,130 | | | | 1,271 | |
| Series 2066,Cl. Z, 6.50%, 6/15/28 | | | 134,583 | | | | 148,537 | |
| Series 2195,Cl. LH, 6.50%, 10/15/29 | | | 102,116 | | | | 113,979 | |
| | | | | | | | |
| | | Principal Amount | | | Value | |
FHLMC/FNMA/FHLB/Sponsored (Continued) | |
| Federal Home Loan Mortgage Corp., Real Estate Mtg. Investment Conduit Multiclass Pass-Through Certificates: (Continued) | |
| Series 2220,Cl. PD, 8.00%, 3/15/30 | | $ | 810 | | | $ | 951 | |
| Series 2326,Cl. ZP, 6.50%, 6/15/31 | | | 25,647 | | | | 28,483 | |
| Series 2461,Cl. PZ, 6.50%, 6/15/32 | | | 117,366 | | | | 131,414 | |
| Series 2470,Cl. LF, 3.394% [LIBOR01M+100], 2/15/323 | | | 993 | | | | 1,020 | |
| Series 2635,Cl. AG, 3.50%, 5/15/32 | | | 18,356 | | | | 18,907 | |
| Series 3010,Cl. WB, 4.50%, 7/15/20 | | | 1,023 | | | | 1,024 | |
| Series 3025,Cl. SJ, 15.971%[-3.6667 x LIBOR01M+2,475], 8/15/353 | | | 10,393 | | | | 15,474 | |
| Series 3030,Cl. FL, 2.794% [LIBOR01M+40], 9/15/353 | | | 1,581 | | | | 1,582 | |
| Series 3645,Cl. EH, 3.00%, 12/15/20 | | | 2,984 | | | | 2,979 | |
| Series 3822,Cl. JA, 5.00%, 6/15/40 | | | 1,321 | | | | 1,339 | |
| Series 3848,Cl. WL, 4.00%, 4/15/40 | | | 11,184 | | | | 11,374 | |
| Series 3857,Cl. GL, 3.00%, 5/15/40 | | | 2,774 | | | | 2,850 | |
| Series 4221,Cl. HJ, 1.50%, 7/15/23 | | | 43,917 | | | | 43,491 | |
| Federal Home Loan Mortgage Corp., Real Estate Mtg. Investment Conduit Multiclass Pass-Through Certificates, Interest-Only Stripped Mtg.-Backed Security: | |
| Series 2074,Cl. S, 99.999%, 7/17/284 | | | 638 | | | | 62 | |
| Series 2079,Cl. S, 99.999%, 7/17/284 | | | 1,225 | | | | 143 | |
| Series 2130,Cl. SC, 99.999%, 3/15/294 | | | 42,833 | | | | 6,036 | |
| Series 2526,Cl. SE, 75.761%, 6/15/294 | | | 1,703 | | | | 308 | |
| Series 2796,Cl. SD, 99.999%, 7/15/264 | | | 84,759 | | | | 10,307 | |
| Series 2920,Cl. S, 35.504%, 1/15/354 | | | 369,762 | | | | 63,233 | |
| Series 2922,Cl. SE, 18.744%, 2/15/354 | | | 42,450 | | | | 6,959 | |
| Series 2981,Cl. AS, 0.718%, 5/15/354 | | | 52,934 | | | | 7,717 | |
| Series 3004,Cl. SB, 0.00%, 7/15/354,5 | | | 15,914 | | | | 1,755 | |
| Series 3397,Cl. GS, 3.391%, 12/15/374 | | | 8,538 | | | | 1,786 | |
| Series 3424,Cl. EI, 0.00%, 4/15/384,5 | | | 6,099 | | | | 605 | |
| Series 3450,Cl. BI, 10.786%, 5/15/384 | | | 225,398 | | | | 37,070 | |
| Series 3606,Cl. SN, 12.125%, 12/15/394 | | | 57,911 | | | | 9,244 | |
| Series 4057,Cl. QI, 5.422%, 6/15/274 | | | 390,171 | | | | 28,384 | |
| Series 4146,Cl. AI, 10.152%, 12/15/274 | | | 170,968 | | | | 12,877 | |
| Series 4205,Cl. AI, 0.00%, 5/15/284,5 | | | 100,116 | | | | 7,214 | |
| Series 4316,Cl. JS, 0.00%, 1/15/444,5 | | | 174,066 | | | | 25,864 | |
| Series 4818,Cl. BI, 0.00%, 3/15/454,5 | | | 160,607 | | | | 22,181 | |
| Federal Home Loan Mortgage Corp., STACR Trust, Series 2019-HRP1, Cl. M2, 3.811% [US0001M+140], 2/25/491,3 | | | 60,000 | | | | 60,159 | |
| Federal National Mortgage Assn.: | |
| 2.50%, 7/1/347 | | | 1,465,000 | | | | 1,474,614 | |
| 3.00%,7/1/34-7/1/467 | | | 7,175,000 | | | | 7,247,682 | |
| 3.50%, 7/1/497 | | | 14,755,000 | | | | 15,081,224 | |
| 4.00%, 7/1/497 | | | 7,920,000 | | | | 8,184,361 | |
| 4.50%, 7/1/497 | | | 3,445,000 | | | | 3,600,092 | |
| 5.00%, 7/1/497 | | | 2,150,000 | | | | 2,272,478 | |
| Federal National Mortgage Assn. Pool: | |
| 5.00%,3/1/21-7/1/22 | | | 744 | | | | 762 | |
| 5.50%,2/1/35-5/1/36 | | | 89,565 | | | | 99,547 | |
| 6.50%, 1/1/34 | | | 5,587 | | | | 6,358 | |
| 7.00%,1/1/30-12/1/32 | | | 12,757 | | | | 14,906 | |
| 7.50%, 1/1/33 | | | 2,615 | | | | 3,088 | |
| 8.50%, 7/1/32 | | | 2,999 | | | | 3,032 | |
| Federal National Mortgage Assn., Interest-Only Stripped Mtg.-Backed Security: | |
| Series 221,Cl. 2, 99.999%, 5/25/234 | | | 914 | | | | 95 | |
| Series 222,Cl. 2, 99.999%, 6/25/234 | | | 101,866 | | | | 10,151 | |
| Series 252,Cl. 2, 0.00%, 11/25/234,5 | | | 88,870 | | | | 10,017 | |
| Series 294,Cl. 2, 99.999%, 2/25/284 | | | 15,550 | | | | 3,112 | |
| Series 301,Cl. 2, 24.434%, 4/25/294 | | | 1,214 | | | | 235 | |
| Series 303,Cl. IO, 67.28%, 11/25/294 | | | 27,793 | | | | 6,129 | |
| Series 320,Cl. 2, 77.55%, 4/25/324 | | | 117,967 | | | | 26,666 | |
| Series 321,Cl. 2, 32.544%, 4/25/324 | | | 292,587 | | | | 63,697 | |
| Series 324,Cl. 2, 18.762%, 7/25/324 | | | 2,845 | | | | 614 | |
| Series 331,Cl. 5, 0.00%, 2/25/334,5 | | | 4,045 | | | | 759 | |
| Series 331,Cl. 9, 20.994%, 2/25/334 | | | 93,743 | | | | 19,007 | |
| Series 334,Cl. 12, 0.00%, 3/25/334,5 | | | 6,692 | | | | 1,402 | |
7 INVESCO OPPENHEIMER V.I. TOTAL RETURN BOND FUND
STATEMENT OF INVESTMENTSUnaudited / Continued
| | | | | | | | |
| | | Principal Amount | | | Value | |
FHLMC/FNMA/FHLB/Sponsored (Continued) | |
| Federal National Mortgage Assn., Interest-Only Stripped Mtg.-Backed Security: (Continued) | |
| Series 334,Cl. 17, 51.484%, 2/25/334 | | $ | 59,131 | | | $ | 12,517 | |
| Series 339,Cl. 12, 0.00%, 6/25/334,5 | | | 91,177 | | | | 19,202 | |
| Series 339,Cl. 7, 0.00%, 11/25/334,5 | | | 197,203 | | | | 38,546 | |
| Series 343,Cl. 13, 0.00%, 9/25/334,5 | | | 99,391 | | | | 20,275 | |
| Series 343,Cl. 18, 0.00%, 5/25/344,5 | | | 24,112 | | | | 4,697 | |
| Series 345,Cl. 9, 0.00%, 1/25/344,5 | | | 71,808 | | | | 13,971 | |
| Series 351,Cl. 10, 0.00%, 4/25/344,5 | | | 31,198 | | | | 6,312 | |
| Series 351,Cl. 8, 0.00%, 4/25/344,5 | | | 54,413 | | | | 11,016 | |
| Series 356,Cl. 10, 0.00%, 6/25/354,5 | | | 38,183 | | | | 7,221 | |
| Series 356,Cl. 12, 0.00%, 2/25/354,5 | | | 18,874 | | | | 3,622 | |
| Series 362,Cl. 13, 0.00%, 8/25/354,5 | | | 73,478 | | | | 15,067 | |
| Series 364,Cl. 15, 0.00%, 9/25/354,5 | | | 3,893 | | | | 747 | |
| Series 364,Cl. 16, 0.00%, 9/25/354,5 | | | 81,632 | | | | 16,373 | |
| Series 365,Cl. 16, 0.00%, 3/25/364,5 | | | 100,261 | | | | 20,440 | |
| Federal National Mortgage Assn., Real Estate Mtg. Investment Conduit Multiclass Pass-Through Certificates: | |
| Series1993-87,Cl. Z, 6.50%, 6/25/23 | | | 71,248 | | | | 75,516 | |
| Series1998-58,Cl. PC, 6.50%, 10/25/28 | | | 72,787 | | | | 80,769 | |
| Series1998-61,Cl. PL, 6.00%, 11/25/28 | | | 35,691 | | | | 39,546 | |
| Series1999-54,Cl. LH, 6.50%, 11/25/29 | | | 58,672 | | | | 65,089 | |
| Series2001-51,Cl. OD, 6.50%, 10/25/31 | | | 3,628 | | | | 3,869 | |
| Series2001-74,Cl. QE, 6.00%, 12/25/31 | | | 85,640 | | | | 96,288 | |
| Series2003-28,Cl. KG, 5.50%, 4/25/23 | | | 196,431 | | | | 203,203 | |
| Series2005-73,Cl. DF, 2.654% [LIBOR01M+25], 8/25/353 | | | 1,696 | | | | 1,694 | |
| Series2006-11,Cl. PS, 15.751%[-3.6667 x LIBOR01M+2,456.67], 3/25/363 | | | 57,336 | | | | 87,507 | |
| Series2006-46,Cl. SW, 15.384%[-3.6665 x LIBOR01M+2,419.92], 6/25/363 | | | 37,067 | | | | 55,264 | |
| Series2006-50,Cl. KS, 15.384%[-3.6667 x LIBOR01M+2,420], 6/25/363 | | | 47,220 | | | | 70,483 | |
| Series2009-113,Cl. DB, 3.00%, 12/25/20 | | | 1,421 | | | | 1,417 | |
| Series2009-36,Cl. FA, 3.344% [LIBOR01M+94], 6/25/373 | | | 20,622 | | | | 21,138 | |
| Series2010-43,Cl. KG, 3.00%, 1/25/21 | | | 1,172 | | | | 1,172 | |
| Series2011-3,Cl. EL, 3.00%, 5/25/20 | | | 802 | | | | 800 | |
| Series2011-82,Cl. AD, 4.00%, 8/25/26 | | | 5,543 | | | | 5,560 | |
| Federal National Mortgage Assn., Real Estate Mtg. Investment Conduit Multiclass Pass-Through Certificates, Interest-Only Stripped Mtg.-Backed Security: | |
| Series2001-61,Cl. SH, 28.352%, 11/18/314 | | | 3,642 | | | | 719 | |
| Series2001-63,Cl. SD, 48.187%, 12/18/314 | | | 1,159 | | | | 184 | |
| Series2001-65,Cl. S, 42.271%, 11/25/314 | | | 91,390 | | | | 17,587 | |
| Series2001-68,Cl. SC, 55.704%, 11/25/314 | | | 866 | | | | 161 | |
| Series2001-81,Cl. S, 42.155%, 1/25/324 | | | 26,588 | | | | 4,981 | |
| Series2002-28,Cl. SA, 45.692%, 4/25/324 | | | 852 | | | | 164 | |
| Series2002-38,Cl. SO, 99.999%, 4/25/324 | | | 2,619 | | | | 468 | |
| Series2002-39,Cl. SD, 71.063%, 3/18/324 | | | 1,732 | | | | 367 | |
| Series2002-47,Cl. NS, 46.343%, 4/25/324 | | | 84,770 | | | | 16,838 | |
| Series2002-48,Cl. S, 47.352%, 7/25/324 | | | 1,305 | | | | 271 | |
| Series2002-51,Cl. S, 44.97%, 8/25/324 | | | 77,819 | | | | 15,457 | |
| Series2002-52,Cl. SD, 99.999%, 9/25/324 | | | 121,877 | | | | 24,398 | |
| Series2002-52,Cl. SL, 45.301%, 9/25/324 | | | 880 | | | | 175 | |
| Series2002-53,Cl. SK, 94.978%, 4/25/324 | | | 6,033 | | | | 1,306 | |
| | | | | | | | |
| | | Principal Amount | | | Value | |
FHLMC/FNMA/FHLB/Sponsored (Continued) | |
| Federal National Mortgage Assn., Real Estate Mtg. Investment Conduit Multiclass Pass-Through Certificates, Interest-Only Stripped Mtg.-Backed Security: (Continued) | |
| Series2002-56,Cl. SN, 43.614%, 7/25/324 | | $ | 1,779 | | | $ | 370 | |
| Series2002-60,Cl. SM, 22.734%, 8/25/324 | | | 11,218 | | | | 1,968 | |
| Series2002-7,Cl. SK, 30.299%, 1/25/324 | | | 5,313 | | | | 890 | |
| Series2002-77,Cl. BS, 29.221%, 12/18/324 | | | 7,687 | | | | 1,502 | |
| Series2002-77,Cl. IS, 65.79%, 12/18/324 | | | 4,462 | | | | 909 | |
| Series2002-77,Cl. SH, 34.242%, 12/18/324 | | | 34,178 | | | | 6,089 | |
| Series2002-84,Cl. SA, 34.142%, 12/25/324 | | | 85,640 | | | | 17,001 | |
| Series2002-9,Cl. MS, 37.907%, 3/25/324 | | | 1,375 | | | | 285 | |
| Series2002-90,Cl. SN, 22.932%, 8/25/324 | | | 5,771 | | | | 957 | |
| Series2002-90,Cl. SY, 28.44%, 9/25/324 | | | 4,286 | | | | 713 | |
| Series2003-26,Cl. DI, 77.667%, 4/25/334 | | | 3,760 | | | | 944 | |
| Series2003-33,Cl. SP, 33.965%, 5/25/334 | | | 90,044 | | | | 18,028 | |
| Series2003-4,Cl. S, 28.157%, 2/25/334 | | | 54,763 | | | | 11,234 | |
| Series2004-54,Cl. DS, 99.999%, 11/25/304 | | | 79,119 | | | | 11,911 | |
| Series2005-12,Cl. SC, 31.179%, 3/25/354 | | | 19,773 | | | | 3,091 | |
| Series2005-14,Cl. SE, 36.482%, 3/25/354 | | | 62,618 | | | | 8,903 | |
| Series2005-40,Cl. SA, 99.999%, 5/25/354 | | | 181,674 | | | | 31,395 | |
| Series2005-40,Cl. SB, 65.678%, 5/25/354 | | | 8,490 | | | | 1,169 | |
| Series2005-52,Cl. JH, 29.685%, 5/25/354 | | | 47,547 | | | | 7,749 | |
| Series2005-93,Cl. SI, 5.07%, 10/25/354 | | | 136,528 | | | | 21,895 | |
| Series2008-55,Cl. SA, 0.00%, 7/25/384,5 | | | 5,703 | | | | 627 | |
| Series2009-8,Cl. BS, 99.999%, 2/25/244 | | | 637 | | | | 37 | |
| Series2011-96,Cl. SA, 6.115%, 10/25/414 | | | 45,614 | | | | 7,796 | |
| Series2012-121,Cl. IB, 6.891%, 11/25/274 | | | 162,965 | | | | 12,250 | |
| Series2012-134,Cl. SA, 0.00%, 12/25/424,5 | | | 127,071 | | | | 24,208 | |
| Series2012-40,Cl. PI, 27.231%, 4/25/414 | | | 89,903 | | | | 10,046 | |
| Series2015-57,Cl. LI, 6.198%, 8/25/354 | | | 398,503 | | | | 55,768 | |
| Series2016-45,Cl. MI, 8.377%, 7/25/464 | | | 114,549 | | | | 25,443 | |
| Series2017-60,Cl. LI, 0.00%, 8/25/474,5 | | | 247,393 | | | | 28,640 | |
| Series2017-66,Cl. AS, 0.00%, 9/25/474,5 | | | 988,636 | | | | 150,347 | |
| Series2018-16,Cl. NI, 0.00%, 12/25/444,8 | | | 82,455 | | | | 10,607 | |
| Series2018-69,Cl. CI, 0.00%, 10/25/464,5 | | | 180,676 | | | | 12,706 | |
| Federal National Mortgage Assn., Real Estate Mtg. Investment Conduit Multiclass Pass-Through Certificates, Principal-Only Stripped Mtg.-Backed Security, Series1993-184, Cl. M, 5.195%, 9/25/236 | | | 32,599 | | | | 31,099 | |
| | | | | | | | |
| | | | 42,365,150 | |
GNMA/Guaranteed—3.6% | |
| Government National Mortgage Assn. I Pool: | |
| 7.00%,12/15/23-3/15/26 | | | 3,055 | | | | 3,177 | |
8 INVESCO OPPENHEIMER V.I. TOTAL RETURN BOND FUND
| | | | | | | | |
| | | Principal Amount | | | Value | |
GNMA/Guaranteed (Continued) | |
| Government National Mortgage Assn. II Pool, 3.50%, 7/1/497 | | $ | 4,265,000 | | | $ | 4,404,612 | |
| Government National Mortgage Assn., Interest-Only Stripped Mtg.-Backed Security: | |
| Series2002-15,Cl. SM, 99.999%, 2/16/324 | | | 107,490 | | | | 766 | |
| Series2007-17,Cl. AI, 47.513%, 4/16/374 | | | 50,349 | | | | 7,934 | |
| Series2011-52,Cl. HS, 19.273%, 4/16/414 | | | 327,846 | | | | 49,246 | |
| Series2017-136,Cl. LI, 6.675%, 9/16/474 | | | 315,458 | | | | 53,818 | |
| Series2017-149,Cl. GS, 0.00%, 10/16/474,5 | | | 379,852 | | | | 59,327 | |
| | | | | | | | |
| | | | 4,578,880 | |
Non-Agency—11.6% | |
Commercial—8.8% | |
| BANK, Interest-Only Stripped Mtg.-Backed Security, Series 2019-BN16, Cl. XA, 10.953%, 2/15/524 | | | 1,582,156 | | | | 116,953 | |
| BCAP LLC Trust, Series2011-R11, Cl. 18A5, 4.69% [H15T1Y+210], 9/26/351,3 | | | 9,411 | | | | 9,459 | |
| Benchmark Mortgage Trust, Interest-Only Commercial Mtg. Pass-Through Certificates, Series2018-B1, Cl. XA, 10.798%, 1/15/514 | | | 1,781,891 | | | | 64,478 | |
| Capital Lease Funding Securitization LP, Interest-Only Commercial Mtg. Pass-Through Certificates, Series 1997-CTL1, Cl. IO, 0.00%, 6/22/241,4,5,9 | | | 143,465 | | | | 2,555 | |
| CD Mortgage Trust, Interest-Only Commercial Mtg. Pass-Through Certificates, Series 2017-CD6, Cl. XA, 12.599%, 11/13/504 | | | 744,439 | | | | 41,886 | |
| Chase Mortgage Finance Trust, Series 2005-A2, Cl. 1A3, 4.357%, 1/25/3610 | | | 73,460 | | | | 72,791 | |
| Citigroup Commercial Mortgage Trust, Series 2014-GC21, Cl. AAB, 3.477%, 5/10/47 | | | 93,792 | | | | 96,496 | |
| Citigroup Commercial Mortgage Trust, Interest-Only Commercial Mtg. Pass-Through Certificates: | |
| Series 2013-GC17,Cl. XA, 0.00%, 11/10/464,5 | | | 392,013 | | | | 15,299 | |
| Series2017-C4,Cl. XA, 11.941%, 10/12/504 | | | 2,060,429 | | | | 140,045 | |
| COMM Mortgage Trust: | |
| Series2013-CR6,Cl. AM, 3.147%, 3/10/461 | | | 245,000 | | | | 250,575 | |
| Series 2014-CR20,Cl. ASB, 3.305%, 11/10/47 | | | 65,000 | | | | 66,831 | |
| Series 2014-CR21,Cl. AM, 3.987%, 12/10/47 | | | 715,000 | | | | 753,466 | |
| Series 2014-LC15,Cl. AM, 4.198%, 4/10/47 | | | 170,000 | | | | 180,580 | |
| Series 2014-UBS6,Cl. AM, 4.048%, 12/10/47 | | | 475,000 | | | | 497,356 | |
| COMM Mortgage Trust, Interest-Only Stripped Mtg.-Backed Security, Series2012-CR5, Cl. XA, 21.749%, 12/10/454 | | | 1,991,284 | | | | 88,632 | |
| Connecticut Avenue Securities: | |
| Series2014-C01,Cl. M2, 6.804% [US0001M+440], 1/25/243 | | | 280,000 | | | | 306,290 | |
| Series2014-C02,Cl. 1M2, 5.004% [US0001M+260], 5/25/243 | | | 169,886 | | | | 175,715 | |
| Series2014-C03,Cl. 1M2, 5.404% [US0001M+300], 7/25/243 | | | 276,938 | | | | 290,617 | |
| Series2014-C03,Cl. 2M2, 5.304% [US0001M+290], 7/25/243 | | | 50,673 | | | | 52,869 | |
| Series2014-C04,Cl. 2M2, 7.404% [US0001M+500], 11/25/243 | | | 297,451 | | | | 325,849 | |
| Series2016-C02,Cl. 1M2, 8.404% [US0001M+600], 9/25/283 | | | 265,533 | | | | 293,739 | |
| | | | | | | | |
| | | Principal Amount | | | Value | |
Commercial (Continued) | |
| Connecticut Avenue Securities: (Continued) | |
| Series2016-C03,Cl. 1M1, 4.404% [US0001M+200], 10/25/283 | | $ | 38,562 | | | $ | 38,838 | |
| Series2017-C03,Cl. 1M1, 3.354% [US0001M+95], 10/25/293 | | | 328,116 | | | | 329,086 | |
| Series2018-C01,Cl. 1M1, 3.004% [US0001M+60], 7/25/303 | | | 399,999 | | | | 399,920 | |
| Series2018-C03,Cl. 1M1, 3.084% [US0001M+68], 10/25/303 | | | 261,359 | | | | 261,503 | |
| Series2018-C05,Cl. 1M1, 3.124% [US0001M+72], 1/25/313 | | | 95,791 | | | | 95,855 | |
| Series2018-C06,Cl. 2M1, 2.954% [US0001M+55], 3/25/313 | | | 33,023 | | | | 33,022 | |
| CSMC Mortgage-Backed Trust, Series2006-6, Cl. 1A4, 6.00%, 7/25/36 | | | 133,073 | | | | 110,012 | |
| First Horizon Alternative Mortgage Securities Trust, Series2005-FA8, Cl. 1A6, 3.054% [US0001M+65], 11/25/353 | | | 107,080 | | | | 74,797 | |
| FREMF Mortgage Trust: | |
| Series2010-K6,Cl. B, 5.553%, 12/25/461,10 | | | 55,000 | | | | 55,676 | |
| Series 2012-K711,Cl. B, 3.576%, 8/25/451,10 | | | 15,000 | | | | 14,972 | |
| Series 2012-K711,Cl. C, 3.576%, 8/25/451,10 | | | 130,000 | | | | 129,744 | |
| Series2013-K25,Cl. C, 3.744%, 11/25/451,10 | | | 90,000 | | | | 92,000 | |
| Series2013-K26,Cl. C, 3.721%, 12/25/451,10 | | | 60,000 | | | | 61,326 | |
| Series2013-K27,Cl. C, 3.615%, 1/25/461,10 | | | 95,000 | | | | 96,884 | |
| Series2013-K28,Cl. C, 3.609%, 6/25/461,10 | | | 285,000 | | | | 290,920 | |
| Series 2013-K712,Cl. C, 3.454%, 5/25/451,10 | | | 70,000 | | | | 70,025 | |
| Series 2013-K713,Cl. C, 3.263%, 4/25/461,10 | | | 245,000 | | | | 245,335 | |
| Series 2014-K715,Cl. C, 4.258%, 2/25/461,10 | | | 190,000 | | | | 193,443 | |
| GS Mortgage Securities Trust: | |
| Series2012-GC6,Cl. A3, 3.482%, 1/10/45 | | | 59,774 | | | | 61,186 | |
| Series 2013-GC12,Cl. AAB, 2.678%, 6/10/46 | | | 27,182 | | | | 27,299 | |
| Series 2013-GC16,Cl. AS, 4.649%, 11/10/46 | | | 45,000 | | | | 48,963 | |
| Series 2014-GC18,Cl. AAB, 3.648%, 1/10/47 | | | 78,212 | | | | 80,403 | |
| GSMSC Pass-Through Trust, Series2009-3R, Cl. 1A2, 6.00%, 4/25/371,10 | | | 167,102 | | | | 162,092 | |
| JP Morgan Chase Commercial Mortgage Securities Trust: | |
| Series2013-C10,Cl. AS, 3.372%, 12/15/47 | | | 315,000 | | | | 322,621 | |
| Series2013-C16,Cl. AS, 4.517%, 12/15/46 | | | 300,000 | | | | 321,795 | |
| Series 2013-LC11,Cl. AS, 3.216%, 4/15/46 | | | 40,000 | | | | 40,734 | |
| Series2014-C20,Cl. AS, 4.043%, 7/15/47 | | | 220,000 | | | | 232,226 | |
| Series2016-JP3,Cl. A2, 2.435%, 8/15/49 | | | 189,458 | | | | 189,617 | |
| JP Morgan Mortgage Trust, Series2007-A1, Cl. 5A1, 4.697%, 7/25/3510 | | | 46,011 | | | | 47,966 | |
| JP Morgan Resecuritization Trust, Series 2009-5, Cl. 1A2, 4.992%, 7/26/361,10 | | | 144,495 | | | | 146,650 | |
| JPMBB Commercial Mortgage Securities Trust: | |
| Series2014-C18,Cl. A3, 3.578%, 2/15/47 | | | 41,485 | | | | 42,118 | |
9 INVESCO OPPENHEIMER V.I. TOTAL RETURN BOND FUND
STATEMENT OF INVESTMENTSUnaudited / Continued
| | | | | | | | |
| | | Principal Amount | | | Value | |
| Commercial (Continued) | | | | | |
| JPMBB Commercial Mortgage Securities Trust: (Continued) | | | | | | | | |
| Series2014-C24, Cl. B, 4.116%, 11/15/4710 | | $ | 245,000 | | | $ | 256,238 | |
| Series2014-C25, Cl. AS, 4.065%, 11/15/47 | | | 200,000 | | | | 211,653 | |
| JPMBB Commercial Mortgage Securities Trust., | | | | | | | | |
| Interest-Only Stripped Mtg.-Backed Security, Series2015-C27, Cl. XA, 24.187%, 2/15/484 | | | 2,826,041 | | | | 125,568 | |
| LB Commercial Conduit Mortgage Trust, Interest-Only Stripped Mtg.-Backed Security, Series1998-C1, Cl. IO, 0.00%, 2/18/304,5 | | | 61,234 | | | | 5 | |
| Lehman Structured Securities Corp., Series2002-GE1, Cl. A, 0.00%, 7/26/241,9,10 | | | 23,773 | | | | 16,316 | |
| Morgan Stanley Bank of America Merrill Lynch Trust: | | | | | | | | |
| Series2013-C9, Cl. AS, 3.456%, 5/15/46 | | | 225,000 | | | | 232,364 | |
| Series2014-C19, Cl. AS, 3.832%, 12/15/47 | | | 595,000 | | | | 624,898 | |
| Morgan Stanley Capital I Trust, Series2011-C2, Cl. A4, 4.661%, 6/15/441 | | | 75,000 | | | | 77,650 | |
| Morgan Stanley Capital I, Inc., Interest-Only Commercial Mtg. Pass-Through Certificates, Series2017-HR2, Cl. XA, 10.514%, 12/15/504 | | | 679,879 | | | | 37,339 | |
| Morgan Stanley Re-Remic Trust, Series 2012-R3, Cl. 1B, 3.612%, 11/26/361,10 | | | 429,253 | | | | 408,730 | |
| Morgan Stanley Resecuritization Trust, Series2013-R9, Cl. 3A, 4.076%, 6/26/461,10 | | | 26,740 | | | | 26,958 | |
| RBSSP Resecuritization Trust, Series2010-1, Cl. 2A1, 4.73%, 7/26/451,10 | | | 8,124 | | | | 8,381 | |
| UBS Commercial Mortgage Trust, Interest-Only Commercial Mtg. Pass-Through Certificates, Series2017-C5, Cl. XA, 14.709%, 11/15/504 | | | 1,246,515 | | | | 75,474 | |
| Wells Fargo Commercial Mortgage Trust, Series 2015-NXS1, Cl. ASB, 2.934%, 5/15/48 | | | 305,000 | | | | 310,166 | |
| Wells Fargo Commercial Mortgage Trust, Interest-Only Commercial Mtg. Pass-Through Certificates, Series2017-C42, Cl. XA, 10.479%, 12/15/504 | | | 894,319 | | | | 56,102 | |
| Wells Fargo Mortgage Backed Securities Trust, Series2019-1, Cl. A7, 4.00%, 11/25/481,10 | | | 133,087 | | | | 135,232 | |
| WF-RBS Commercial Mortgage Trust: | | | | | | | | |
| Series2013-C14, Cl. AS, 3.488%, 6/15/46 | | | 150,000 | | | | 154,972 | |
| Series2014-C20, Cl. AS, 4.176%, 5/15/47 | | | 130,000 | | | | 137,675 | |
| Series2014-C22, Cl. A3, 3.528%, 9/15/57 | | | 45,000 | | | | 45,987 | |
| Series 2014-LC14, Cl. AS, 4.351%, 3/15/4710 | | | 145,000 | | | | 154,688 | |
| | | | | | | 11,255,905 | |
| Residential—2.8% | | | | | |
| Banc of America Funding Trust: | | | | | | | | |
| Series2007-1, Cl. 1A3, 6.00%, 1/25/37 | | | 73,885 | | | | 70,167 | |
| Series2007-C, Cl. 1A4, 4.597%, 5/20/3610 | | | 25,471 | | | | 25,552 | |
| Series2014-R7, Cl. 3A1, 4.991%, 3/26/361,10 | | | 25,412 | | | | 25,496 | |
| Banc of America Mortgage Trust, Series 2007-1, Cl. 1A24, 6.00%, 3/25/37 | | | 45,885 | | | | 43,499 | |
| Bear Stearns ARM Trust: | | | | | | | | |
| Series2005-9, Cl. A1, 4.73% [H15T1Y+230], 10/25/353 | | | 79,389 | | | | 81,649 | |
| Series2006-1, Cl. A1, 4.91% [H15T1Y+225], 2/25/363 | | | 91,363 | | | | 93,922 | |
| CHL Mortgage Pass-Through Trust: | | | | | | | | |
| Series2005-17, Cl. 1A8, 5.50%, 9/25/35 | | | 9,757 | | | | 9,838 | |
| Series2005-26, Cl. 1A8, 5.50%, 11/25/35 | | | 62,109 | | | | 58,222 | |
| Series2005-J4, Cl. A7, 5.50%, 11/25/35 | | | 7,569 | | | | 7,667 | |
| | | | | | | | |
| | | Principal Amount | | | Value | |
| Residential (Continued) | | | | | |
| Citigroup Mortgage Loan Trust, Inc., Series2006-AR1, Cl. 1A1, 4.97% [H15T1Y+240], 10/25/353 | | $ | 231,253 | | | $ | 237,381 | |
| Connecticut Avenue Securities Trust, Series2019-R02, Cl. 1M1, 3.254% [US0001M+85], 8/25/311,3 | | | 296,166 | | | | 297,086 | |
| GSR Mortgage Loan Trust, Series2005-AR4, Cl. 6A1, 4.664%, 7/25/3510 | | | 37,301 | | | | 38,253 | |
| HomeBanc Mortgage Trust, Series2005-3, Cl. A2, 2.714% [US0001M+31], 7/25/353 | | | 16,070 | | | | 16,094 | |
| RALI Trust: | | | | | | | | |
| Series 2006-QS13, Cl. 1A8, 6.00%, 9/25/36 | | | 582 | | | | 530 | |
| Series2007-QS6, Cl. A28, 5.75%, 4/25/37 | | | 7,119 | | | | 6,743 | |
| STACR Trust: | | | | | | | | |
| Series 2018-DNA2, Cl. M1, 3.204% [US0001M+80], 12/25/301,3 | | | 339,595 | | | | 340,330 | |
| Series 2018-DNA3, Cl. M1, 3.154% [US0001M+75], 9/25/481,3 | | | 66,291 | | | | 66,374 | |
| Series 2018-HRP2, Cl. M2, 3.654% [US0001M+125], 2/25/471,3 | | | 215,000 | | | | 216,043 | |
| Structured Agency Credit Risk Debt Nts.: | | | | | | | | |
| Series2014-DN1, Cl. M2, 4.604% [US0001M+220], 2/25/243 | | | 29,219 | | | | 29,727 | |
| Series2014-DN3, Cl. M3, 6.404% [US0001M+400], 8/25/243 | | | 184,376 | | | | 196,889 | |
| Series2014-HQ2, Cl. M3, 6.154% [US0001M+375], 9/25/243 | | | 335,000 | | | | 365,521 | |
| Series 2015-HQA2, Cl. M2, 5.204% [US0001M+280], 5/25/283 | | | 30,309 | | | | 30,744 | |
| Series 2016-DNA1, Cl. M2, 5.304% [US0001M+290], 7/25/283 | | | 52,789 | | | | 53,426 | |
| Series 2017-HQA1, Cl. M1, 3.604% [US0001M+120], 8/25/293 | | | 328,898 | | | | 330,068 | |
| Series 2018-DNA1, Cl. M1, 2.854% [US0001M+45], 7/25/303 | | | 390,353 | | | | 389,696 | |
| WaMu Mortgage Pass-Through Certificates Trust: | | | | | | | | |
| Series 2003-AR10, Cl. A7, 4.486%, 10/25/3310 | | | 55,812 | | | | 57,445 | |
| Series 2005-AR14, Cl. 1A4, 4.181%, 12/25/3510 | | | 111,669 | | | | 111,414 | |
| Series 2005-AR16, Cl. 1A1, 4.243%, 12/25/3510 | | | 51,807 | | | | 51,787 | |
| Wells Fargo Mortgage-Backed Securities Trust: | | | | | | | | |
| Series 2005-AR15, Cl. 1A2, 4.665%, 9/25/3510 | | | 49,851 | | | | 49,691 | |
| Series 2005-AR15, Cl. 1A6, 4.665%, 9/25/3510 | | | 19,327 | | | | 19,265 | |
| Series2005-AR4, Cl. 2A2, 5.095%, 4/25/3510 | | | 95,587 | | | | 97,533 | |
| Series 2006-AR10, Cl. 1A1, 5.008%, 7/25/3610 | | | 36,513 | | | | 37,256 | |
| Series 2006-AR10, Cl. 5A5, 4.992%, 7/25/3610 | | | 92,645 | | | | 94,324 | |
| Series2006-AR2, Cl. 2A3, 4.991%, 3/25/3610 | | | 38,879 | | | | 39,903 | |
| Series2006-AR7, Cl. 2A4, 5.088%, 5/25/3610 | | | 8,949 | | | | 9,328 | |
| Series2007-16, Cl. 1A1, 6.00%, 12/28/37 | | | 32,017 | | | | 32,141 | |
| | | | | | | 3,631,004 | |
Total Mortgage-Backed Obligations (Cost $62,718,199) | | | | 61,830,939 | |
| | | | | | | | |
| Corporate Bonds and Notes—45.4% | | | | | |
| Consumer Discretionary—6.9% | | | | | |
| Automobiles—1.7% | | | | | |
| Daimler Finance North America LLC, 3.75% Sr. Unsec. Nts., 11/5/211 | | | 269,000 | | | | 275,862 | |
10 INVESCO OPPENHEIMER V.I. TOTAL RETURN BOND FUND
| | | | | | | | |
| | | Principal Amount | | | Value | |
| Automobiles (Continued) | | | | | |
| General Motors Co., 6.25% Sr. Unsec. Nts., 10/2/43 | | $ | 78,000 | | | $ | 83,079 | |
| General Motors Financial Co., Inc.: | | | | | | | | |
| 4.15% Sr. Unsec. Nts., 6/19/23 | | | 310,000 | | | | 319,516 | |
| 4.20% Sr. Unsec. Nts., 11/6/21 | | | 250,000 | | | | 257,508 | |
| Harley-Davidson Financial Services, Inc., 2.40% Sr. Unsec. Nts., 6/15/201 | | | 323,000 | | | | 321,977 | |
| Hyundai Capital America, 4.125% Sr. Unsec. Nts., 6/8/231 | | | 315,000 | | | | 326,898 | |
| Nissan Motor Acceptance Corp., 3.65% Sr. Unsec. Nts., 9/21/211 | | | 310,000 | | | | 317,477 | |
| Volkswagen Group of America Finance LLC, 4.00% Sr. Unsec. Nts., 11/12/211 | | | 298,000 | | | | 307,590 | |
| | | | | | | 2,209,907 | |
| Diversified Consumer Services—0.3% | | | | | |
| Service Corp. International, 4.625% Sr. Unsec. Nts., 12/15/27 | | | 325,000 | | | | 333,125 | |
| Entertainment—0.3% | | | | | |
| Fox Corp., 3.666% Sr. Unsec. Nts., 1/25/221 | | | 250,000 | | | | 258,374 | |
| Viacom, Inc., 4.375% Sr. Unsec. Nts., 3/15/43 | | | 100,000 | | | | 97,926 | |
| | | | | | | 356,300 | |
| Hotels, Restaurants & Leisure—0.1% | | | | | |
| Aramark Services, Inc., 5.00% Sr. Unsec. Nts., 4/1/251 | | | 89,000 | | | | 90,558 | |
| Household Durables—1.2% | | | | | |
| DR Horton, Inc., 2.55% Sr. Unsec. Nts., 12/1/20 | | | 320,000 | | | | 320,153 | |
| Lennar Corp., 4.75% Sr. Unsec. Nts., 5/30/25 | | | 314,000 | | | | 334,017 | |
| Newell Brands, Inc.: | | | | | | | | |
| 5.00% Sr. Unsec. Nts., 11/15/23 | | | 171,000 | | | | 175,590 | |
| 5.50% Sr. Unsec. Nts., 4/1/46 | | | 108,000 | | | | 105,818 | |
| PulteGroup, Inc., 5.00% Sr. Unsec. Nts., 1/15/27 | | | 241,000 | | | | 253,606 | |
| Toll Brothers Finance Corp.: | | | | | | | | |
| 4.375% Sr. Unsec. Nts., 4/15/23 | | | 257,000 | | | | 266,959 | |
| 4.875% Sr. Unsec. Nts., 3/15/27 | | | 75,000 | | | | 79,054 | |
| | | | | | | 1,535,197 | |
| Internet & Catalog Retail—0.5% | | | | | |
| Amazon.com, Inc., 4.95% Sr. Unsec. Nts., 12/5/44 | | | 113,000 | | | | 142,143 | |
| QVC, Inc., 4.45% Sr. Sec. Nts., 2/15/25 | | | 520,000 | | | | 523,819 | |
| | | | | | | 665,962 | |
| Media—1.5% | | | | | |
| CBS Corp., 4.20% Sr. Unsec. Nts., 6/1/29 | | | 160,000 | | | | 168,737 | |
| Charter Communications Operating LLC/Charter Communications Operating Capital, 5.125% Sr. Sec. Nts., 7/1/497 | | | 87,000 | | | | 88,867 | |
| Comcast Corp., 4.00% Sr. Unsec. Nts., 3/1/48 | | | 105,000 | | | | 111,138 | |
| Discovery Communications LLC, 4.125% Sr. Unsec. Nts., 5/15/29 | | | 191,000 | | | | 198,876 | |
| Interpublic Group of Cos., Inc. (The): | | | | | | | | |
| 3.75% Sr. Unsec. Nts., 10/1/21 | | | 251,000 | | | | 257,584 | |
| 4.20% Sr. Unsec. Nts., 4/15/24 | | | 311,000 | | | | 334,915 | |
| Time Warner Cable LLC, 4.50% Sr. Sec. Nts., 9/15/42 | | | 106,000 | | | | 99,813 | |
| Virgin Media Secured Finance plc, 5.25% Sr. Sec. Nts., 1/15/261 | | | 319,000 | | | | 328,079 | |
| WPP Finance 2010, 3.75% Sr. Unsec. Nts., 9/19/24 | | | 321,000 | | | | 332,384 | |
| | | | | | | 1,920,393 | |
| | | | | | | | |
| | | Principal Amount | | | Value | |
| Specialty Retail—0.8% | | | | | |
| AutoNation, Inc., 5.50% Sr. Unsec. Nts., 2/1/20 | | $ | 291,000 | | | $ | 295,208 | |
| Penske Truck Leasing Co. LP/PTL Finance Corp., 3.65% Sr. Unsec. Nts., 7/29/211 | | | 110,000 | | | | 112,488 | |
| Ross Stores, Inc., 3.375% Sr. Unsec. Nts., 9/15/24 | | | 324,000 | | | | 336,586 | |
| Signet UK Finance plc, 4.70% Sr. Unsec. Nts., 6/15/24 | | | 342,000 | | | | 285,570 | |
| | | | | | | 1,029,852 | |
| Textiles, Apparel & Luxury Goods—0.5% | | | | | |
| Hanesbrands, Inc., 4.875% Sr. Unsec. Nts., 5/15/261 | | | 316,000 | | | | 329,395 | |
| Levi Strauss & Co., 5.00% Sr. Unsec. Nts., 5/1/25 | | | 307,000 | | | | 319,280 | |
| | | | | | | 648,675 | |
| Consumer Staples—4.6% | �� | | | | |
| Beverages—1.1% | | | | | |
| Anheuser-Busch InBev Worldwide, Inc., 8.20% Sr. Unsec. Nts., 1/15/39 | | | 186,000 | | | | 280,580 | |
| Bacardi Ltd., 4.70% Sr. Unsec. Nts., 5/15/281 | | | 163,000 | | | | 174,452 | |
| Keurig Dr Pepper, Inc., 4.057% Sr. Unsec. Nts., 5/25/23 | | | 304,000 | | | | 319,251 | |
| Molson Coors Brewing Co., 2.10% Sr. Unsec. Nts., 7/15/21 | | | 311,000 | | | | 309,224 | |
| Pernod Ricard SA, 4.25% Sr. Unsec. Nts., 7/15/221 | | | 307,000 | | | | 322,059 | |
| | | | | | | 1,405,566 | |
| Food & Staples Retailing—0.3% | | | | | |
| Kroger Co. (The), 4.45% Sr. Unsec. Nts., 2/1/47 | | | 89,000 | | | | 86,952 | |
| Walgreen Co., 3.10% Sr. Unsec. Nts., 9/15/22 | | | 303,000 | | | | 308,297 | |
| | | | | | | 395,249 | |
| Food Products—2.2% | | | | | |
| Bunge Ltd. Finance Corp.: | | | | | | | | |
| 3.25% Sr. Unsec. Nts., 8/15/26 | | | 216,000 | | | | 208,921 | |
| 3.50% Sr. Unsec. Nts., 11/24/20 | | | 313,000 | | | | 315,958 | |
| Conagra Brands, Inc.: | | | | | | | | |
| 3.80% Sr. Unsec. Nts., 10/22/21 | | | 240,000 | | | | 246,668 | |
| 4.60% Sr. Unsec. Nts., 11/1/25 | | | 302,000 | | | | 328,825 | |
| Kraft Heinz Foods Co., 4.375% Sr. Unsec. Nts., 6/1/46 | | | 207,000 | | | | 196,808 | |
| Lamb Weston Holdings, Inc., 4.875% Sr. Unsec. Nts., 11/1/261 | | | 308,000 | | | | 321,860 | |
| Mondelez International Holdings Netherlands BV, 2.00% Sr. Unsec. Nts., 10/28/211 | | | 319,000 | | | | 316,024 | |
| Smithfield Foods, Inc.: | | | | | | | | |
| 2.70% Sr. Unsec. Nts., 1/31/201 | | | 137,000 | | | | 136,731 | |
| 3.35% Sr. Unsec. Nts., 2/1/221 | | | 174,000 | | | | 173,621 | |
| 5.20% Sr. Unsec. Nts., 4/1/291 | | | 255,000 | | | | 278,067 | |
| Tyson Foods, Inc.: | | | | | | | | |
| 3.90% Sr. Unsec. Nts., 9/28/23 | | | 255,000 | | | | 268,779 | |
| 5.10% Sr. Unsec. Nts., 9/28/48 | | | 89,000 | | | | 100,530 | |
| | | | | | | 2,892,792 | |
| Tobacco—1.0% | | | | | |
| Altria Group, Inc., 3.49% Sr. Unsec. Nts., 2/14/22 | | | 209,000 | | | | 214,952 | |
| BAT Capital Corp., 3.557% Sr. Unsec. Nts., 8/15/27 | | | 169,000 | | | | 168,326 | |
| BAT International Finance plc, 3.25% Sr. Unsec. Nts., 6/7/221 | | | 314,000 | | | | 318,552 | |
| Imperial Brands Finance plc, 3.75% Sr. Unsec. Nts., 7/21/221 | | | 308,000 | | | | 317,097 | |
11 INVESCO OPPENHEIMER V.I. TOTAL RETURN BOND FUND
STATEMENT OF INVESTMENTSUnaudited / Continued
| | | | | | | | |
| | | Principal Amount | | | Value | |
| Tobacco (Continued) | | | | | | | | |
| Imperial Tobacco Finance plc, 2.95% Sr. Unsec. Nts., 7/21/201 | | $ | 233,000 | | | $ | 233,665 | |
| | | | | | | 1,252,592 | |
| Energy—3.9% | | | | | |
| Energy Equipment & Services—0.2% | | | | | |
| Halliburton Co., 5.00% Sr. Unsec. Nts., 11/15/45 | | | 70,000 | | | | 76,406 | |
| Schlumberger Holdings Corp., 4.00% Sr. Unsec. Nts., 12/21/251 | | | 184,000 | | | | 194,804 | |
| | | | | | | 271,210 | |
| Oil, Gas & Consumable Fuels—3.7% | | | | | |
| Anadarko Petroleum Corp., 4.50% Sr. Unsec. Nts., 7/15/44 | | | 64,000 | | | | 65,583 | |
| Andeavor Logistics LP/Tesoro Logistics Finance Corp., 4.25% Sr. Unsec. Nts., 12/1/27 | | | 195,000 | | | | 206,245 | |
| Apache Corp., 4.375% Sr. Unsec. Nts., 10/15/28 | | | 237,000 | | | | 247,762 | |
| Cenovus Energy, Inc., 4.25% Sr. Unsec. Nts., 4/15/27 | | | 187,000 | | | | 193,547 | |
| Cimarex Energy Co., 4.375% Sr. Unsec. Nts., 3/15/29 | | | 160,000 | | | | 169,952 | |
| Columbia Pipeline Group, Inc., 3.30% Sr. Unsec. Nts., 6/1/20 | | | 302,000 | | | | 304,070 | |
| Devon Energy Corp., 4.75% Sr. Unsec. Nts., 5/15/42 | | | 64,000 | | | | 70,142 | |
| Energy Transfer Operating LP: | | | | | | | | |
| 4.25% Sr. Unsec. Nts., 3/15/23 | | | 245,000 | | | | 255,876 | |
| 5.30% Sr. Unsec. Nts., 4/15/47 | | | 94,000 | | | | 98,104 | |
| Enterprise Products Operating LLC: | | | | | | | | |
| 3.125% Sr. Unsec. Nts., 7/31/297 | | | 96,000 | | | | 96,509 | |
| 4.20% Sr. Unsec. Nts., 1/31/507 | | | 116,000 | | | | 119,299 | |
| EQT Corp., 2.50% Sr. Unsec. Nts., 10/1/20 | | | 340,000 | | | | 339,125 | |
| Kinder Morgan Energy Partners LP, 5.80% Sr. Unsec. Nts., 3/1/21 | | | 124,000 | | | | 130,534 | |
| Kinder Morgan, Inc., 5.20% Sr. Unsec. Nts., 3/1/48 | | | 221,000 | | | | 249,825 | |
| Marathon Petroleum Corp., 4.50% Sr. Unsec. Nts., 4/1/48 | | | 69,000 | | | | 69,368 | |
| Midwest Connector Capital Co. LLC, 3.625% Sr. Unsec. Nts., 4/1/221 | | | 316,000 | | | | 323,799 | |
| Newfield Exploration Co., 5.75% Sr. Unsec. Nts., 1/30/22 | | | 285,000 | | | | 305,313 | |
| ONEOK, Inc., 4.35% Sr. Unsec. Nts., 3/15/29 | | | 161,000 | | | | 172,193 | |
| Rockies Express Pipeline LLC, 4.95% Sr. Unsec. Nts., 7/15/291 | | | 164,000 | | | | 169,615 | |
| Sabine Pass Liquefaction LLC: | | | | | | | | |
| 4.20% Sr. Sec. Nts., 3/15/28 | | | 166,000 | | | | 174,414 | |
| 5.625% Sr. Sec. Nts., 2/1/21 | | | 302,000 | | | | 313,686 | |
| Sunoco Logistics Partners Operations LP, 4.00% Sr. Unsec. Nts., 10/1/27 | | | 194,000 | | | | 199,952 | |
| Valero Energy Corp., 4.00% Sr. Unsec. Nts., 4/1/29 | | | 153,000 | | | | 160,243 | |
| Williams Cos., Inc. (The), 3.70% Sr. Unsec. Nts., 1/15/23 | | | 318,000 | | | | 328,763 | |
| | | | | | | 4,763,919 | |
| Financials—13.2% | | | | | |
| Capital Markets—2.4% | | | | | |
| Blackstone Holdings Finance Co. LLC, 3.15% Sr. Unsec. Nts., 10/2/271 | | | 121,000 | | | | 121,483 | |
| Brookfield Asset Management, Inc., 4.00% Sr. Unsec. Nts., 1/15/25 | | | 252,000 | | | | 262,661 | |
| Credit Suisse AG (New York), 3.625% Sr. Unsec. Nts., 9/9/24 | | | 189,000 | | | | 199,001 | |
| Credit Suisse Group Funding Guernsey Ltd., 4.55% Sr. Unsec. Nts., 4/17/26 | | | 147,000 | | | | 159,939 | |
| | | | | | | | |
| | | Principal Amount | | | Value | |
| Capital Markets (Continued) | | | | | | | | |
| E*TRADE Financial Corp., 5.875% [US0003M+443.5] Jr. Sub. Perpetual Bonds3,11 | | $ | 308,000 | | | $ | 323,400 | |
| Goldman Sachs Group, Inc. (The): | | | | | | | | |
| 3.50% Sr. Unsec. Nts., 11/16/26 | | | 172,000 | | | | 176,355 | |
| 3.75% Sr. Unsec. Nts., 2/25/26 | | | 170,000 | | | | 177,525 | |
| 4.017% [US0003M+137.3] Sr. Unsec. Nts., 10/31/383 | | | 136,000 | | | | 140,266 | |
| Morgan Stanley: | | | | | | | | |
| 4.431% [US0003M+162.8] Sr. Unsec. Nts., 1/23/303 | | | 238,000 | | | | 263,695 | |
| 5.00% Sub. Nts., 11/24/25 | | | 264,000 | | | | 292,320 | |
| MSCI, Inc., 4.75% Sr. Unsec. Nts., 8/1/261 | | | 122,000 | | | | 126,880 | |
| Northern Trust Corp., 3.375% [US0003M+113.1] Sub. Nts., 5/8/323 | | | 119,000 | | | | 120,038 | |
| Plains All American Pipeline LP/PAA Finance Corp., 4.50% Sr. Unsec. Nts., 12/15/26 | | | 195,000 | | | | 207,337 | |
| Raymond James Financial, Inc., 3.625% Sr. Unsec. Nts., 9/15/26 | | | 157,000 | | | | 161,529 | |
| UBS Group Funding Switzerland AG: | | | | | | | | |
| 4.125% Sr. Unsec. Nts., 4/15/261 | | | 153,000 | | | | 163,525 | |
| 4.253% Sr. Unsec. Nts., 3/23/281 | | | 135,000 | | | | 145,047 | |
| | | | | | | 3,041,001 | |
| Commercial Banks—7.0% | | | | | |
| ABN AMRO Bank NV, 4.40% [USSW5+219.7] Sub. Nts., 3/27/283,12 | | | 321,000 | | | | 331,440 | |
| Bank of America Corp.: | | | | | | | | |
| 3.248% Sr. Unsec. Nts., 10/21/27 | | | 262,000 | | | | 268,549 | |
| 3.824% [US0003M+157.5] Sr. Unsec. Nts., 1/20/283 | | | 185,000 | | | | 195,916 | |
| 4.271% [US0003M+131] Sr. Unsec. Nts., 7/23/293 | | | 253,000 | | | | 276,410 | |
| 7.75% Sub. Nts., 5/14/38 | | | 232,000 | | | | 342,516 | |
| Bank of Ireland Group plc, 4.50% Sr. Unsec. Nts., 11/25/231 | | | 250,000 | | | | 261,024 | |
| Bank of Montreal, Series E, 3.30% Sr. Unsec. Nts., 2/5/24 | | | 247,000 | | | | 256,254 | |
| BNP Paribas SA, 4.375% [USSW5+148.3] Sub. Nts., 3/1/331,3 | | | 176,000 | | | | 181,384 | |
| BPCE SA, 4.50% Sub. Nts., 3/15/251 | | | 185,000 | | | | 195,016 | |
| Canadian Imperial Bank of Commerce, 3.10% Sr. Unsec. Nts., 4/2/24 | | | 315,000 | | | | 322,136 | |
| Citigroup, Inc.: | | | | | | | | |
| 4.075% [US0003M+119.2] Sr. Unsec. Nts., 4/23/293 | | | 256,000 | | | | 275,043 | |
| 4.281% [US0003M+183.9] Sr. Unsec. Nts., 4/24/483 | | | 334,000 | | | | 373,970 | |
| Citizens Bank NA (Providence RI), 2.65% Sr. Unsec. Nts., 5/26/22 | | | 65,000 | | | | 65,508 | |
| Compass Bank, 2.875% Sr. Unsec. Nts., 6/29/22 | | | 285,000 | | | | 287,632 | |
| Credit Agricole SA, 4.375% Sub. Nts., 3/17/251 | | | 310,000 | | | | 325,228 | |
| Fifth Third Bank (Cincinnati OH), 3.85% Sub. Nts., 3/15/26 | | | 168,000 | | | | 177,421 | |
| First Republic Bank, 4.375% Sub. Nts., 8/1/46 | | | 127,000 | | | | 131,529 | |
| Fortis, Inc., 3.055% Sr. Unsec. Nts., 10/4/26 | | | 126,000 | | | | 125,130 | |
| HSBC Holdings plc: | | | | | | | | |
| 3.95% [US0003M+98.72] Sr. Unsec. Nts., 5/18/243 | | | 103,000 | | | | 107,781 | |
| 4.041% [US0003M+154.6] Sr. Unsec. Nts., 3/13/283 | | | 125,000 | | | | 131,355 | |
| 4.583% [US0003M+153.46] Sr. Unsec. Nts., 6/19/293 | | | 171,000 | | | | 186,869 | |
12 INVESCO OPPENHEIMER V.I. TOTAL RETURN BOND FUND
| | | | | | | | |
| | | Principal Amount | | | Value | |
| Commercial Banks (Continued) | | | | | | | | |
| Huntington Bancshares, Inc., 4.00% Sr. Unsec. Nts., 5/15/25 | | $ | 317,000 | | | $ | 338,213 | |
| JPMorgan Chase & Co.: | | | | | | | | |
| 3.54% [US0003M+138] Sr. Unsec. Nts., 5/1/283 | | | 259,000 | | | | 269,695 | |
| 3.782% [US0003M+133.7] Sr. Unsec. Nts., 2/1/283 | | | 337,000 | | | | 357,388 | |
| 3.797% [US0003M+89] Sr. Unsec. Nts., 7/23/243 | | | 315,000 | | | | 330,538 | |
| KeyCorp, 4.15% Sr. Unsec. Nts., 10/29/25 | | | 101,000 | | | | 109,441 | |
| Lloyds Banking Group plc, 6.657% [US0003M+127] Jr. Sub. Perpetual Bonds1,3,11 | | | 304,000 | | | | 321,480 | |
| Nordea Bank Abp, 4.625% [USSW5+169] Sub. Nts., 9/13/331,3 | | | 112,000 | | | | 118,292 | |
| PNC Financial Services Group, Inc. (The), 3.15% Sr. Unsec. Nts., 5/19/27 | | | 235,000 | | | | 242,810 | |
| Regions Financial Corp., 2.75% Sr. Unsec. Nts., 8/14/22 | | | 177,000 | | | | 178,280 | |
| Royal Bank of Canada, 3.70% Sr. Unsec. Nts., 10/5/23 | | | 272,000 | | | | 286,656 | |
| Santander Holdings USA, Inc., 3.50% Sr. Unsec. Nts., 6/7/24 | | | 256,000 | | | | 260,060 | |
| Societe Generale SA, 3.875% Sr. Unsec. Nts., 3/28/241 | | | 248,000 | | | | 256,593 | |
| SunTrust Bank (Atlanta GA): | | | | | | | | |
| 3.30% Sub. Nts., 5/15/26 | | | 112,000 | | | | 114,098 | |
| 4.05% Sr. Unsec. Nts., 11/3/25 | | | 135,000 | | | | 145,644 | |
| Synovus Financial Corp., 3.125% Sr. Unsec. Nts., 11/1/22 | | | 180,000 | | | | 181,033 | |
| US Bancorp, 3.10% Sub. Nts., 4/27/26 | | | 204,000 | | | | 208,504 | |
| Wells Fargo & Co.: | | | | | | | | |
| 3.584% [US0003M+131] Sr. Unsec. Nts., 5/22/283 | | | 257,000 | | | | 268,661 | |
| 4.75% Sub. Nts., 12/7/46 | | | 160,000 | | | | 182,336 | |
| | | | | | | 8,987,833 | |
| Consumer Finance—0.7% | | | | | |
| American Express Co., 3.125% Sr. Unsec. Nts., 5/20/26 | | | 190,000 | | | | 195,171 | |
| Capital One Financial Corp.: | | | | | | | | |
| 3.75% Sr. Unsec. Nts., 3/9/27 | | | 103,000 | | | | 106,377 | |
| 3.80% Sr. Unsec. Nts., 1/31/28 | | | 91,000 | | | | 94,090 | |
| Discover Bank, 4.65% Sr. Unsec. Nts., 9/13/28 | | | 116,000 | | | | 126,954 | |
| Discover Financial Services, 3.75% Sr. Unsec. Nts., 3/4/25 | | | 112,000 | | | | 115,829 | |
| Synchrony Financial, 4.25% Sr. Unsec. Nts., 8/15/24 | | | 252,000 | | | | 262,613 | |
| | | | | | | 901,034 | |
| Diversified Financial Services—0.4% | | | | | |
| Berkshire Hathaway Energy Co., 3.80% Sr. Unsec. Nts., 7/15/48 | | | 75,000 | | | | 76,398 | |
| Peachtree Corners Funding Trust, 3.976% Sr. Unsec. Nts., 2/15/251 | | | 121,000 | | | | 125,976 | |
| Voya Financial, Inc., 5.65% [US0003M+358] Jr. Sub. Nts., 5/15/533 | | | 300,000 | | | | 311,544 | |
| | | | | | | 513,918 | |
| Insurance—2.0% | | | | | |
| Aflac, Inc., 4.75% Sr. Unsec. Nts., 1/15/49 | | | 106,000 | | | | 125,367 | |
| AXA Equitable Holdings, Inc., 4.35% Sr. Unsec. Nts., 4/20/28 | | | 165,000 | | | | 173,578 | |
| Boardwalk Pipelines LP, 4.95% Sr. Unsec. Nts., 12/15/24 | | | 156,000 | | | | 166,396 | |
| Brighthouse Financial, Inc., 3.70% Sr. Unsec. Nts., 6/22/27 | | | 67,000 | | | | 63,794 | |
| | | | | | | | |
| | | Principal Amount | | | Value | |
| Insurance (Continued) | | | | | | | | |
| CNA Financial Corp., 3.45% Sr. Unsec. Nts., 8/15/27 | | $ | 239,000 | | | $ | 242,680 | |
| Hartford Financial Services Group, Inc. (The), 4.40% Sr. Unsec. Nts., 3/15/48 | | | 192,000 | | | | 209,400 | |
| Lincoln National Corp., 3.80% Sr. Unsec. Nts., 3/1/28 | | | 193,000 | | | | 202,683 | |
| Manulife Financial Corp., 4.061% [USISDA05+164.7] Sub. Nts., 2/24/323 | | | 193,000 | | | | 197,011 | |
| Marsh & McLennan Cos., Inc., 4.35% Sr. Unsec. Nts., 1/30/47 | | | 106,000 | | | | 114,974 | |
| Principal Financial Group, Inc., 3.70% Sr. Unsec. Nts., 5/15/29 | | | 190,000 | | | | 198,798 | |
| Prudential Financial, Inc.: | | | | | | | | |
| 4.35% Sr. Unsec. Nts., 2/25/50 | | | 125,000 | | | | 140,516 | |
| 5.20% [US0003M+304] Jr. Sub. Nts., 3/15/443 | | | 243,000 | | | | 253,177 | |
| Swiss Re Finance Luxembourg SA, 5.00% [H15T5Y+358.2] Sub. Nts., 4/2/491,3 | | | 387,000 | | | | 415,445 | |
| | | | | | | 2,503,819 | |
| Real Estate Investment Trusts (REITs)—0.7% | | | | | |
| American Tower Corp.: | | | | | | | | |
| 3.00% Sr. Unsec. Nts., 6/15/23 | | | 262,000 | | | | 264,622 | |
| 4.00% Sr. Unsec. Nts., 6/1/25 | | | 168,000 | | | | 177,191 | |
| Crown Castle International Corp., 3.65% Sr. Unsec. Nts., 9/1/27 | | | 170,000 | | | | 175,143 | |
| VEREIT Operating Partnership LP, 4.625% Sr. Unsec. Nts., 11/1/25 | | | 305,000 | | | | 328,510 | |
| | | | | | | 945,466 | |
| Health Care—4.0% | | | | | |
| Biotechnology—1.1% | | | | | | | | |
| AbbVie, Inc.: | | | | | | | | |
| 3.75% Sr. Unsec. Nts., 11/14/23 | | | 312,000 | | | | 325,513 | |
| 4.875% Sr. Unsec. Nts., 11/14/48 | | | 131,000 | | | | 138,032 | |
| Amgen, Inc., 4.563% Sr. Unsec. Nts., 6/15/48 | | | 89,000 | | | | 96,708 | |
| Biogen, Inc., 5.20% Sr. Unsec. Nts., 9/15/45 | | | 98,000 | | | | 110,199 | |
| Gilead Sciences, Inc., 4.75% Sr. Unsec. Nts., 3/1/46 | | | 133,000 | | | | 151,161 | |
| Shire Acquisitions Investments Ireland DAC, 2.40% Sr. Unsec. Nts., 9/23/21 | | | 622,000 | | | | 620,922 | |
| | | | | | | 1,442,535 | |
| Health Care Equipment & Supplies—0.7% | | | | | |
| Becton Dickinson & Co., 3.70% Sr. Unsec. Nts., 6/6/27 | | | 165,000 | | | | 172,490 | |
| Boston Scientific Corp., 4.00% Sr. Unsec. Nts., 3/1/28 | | | 306,000 | | | | 328,982 | |
| Hologic, Inc., 4.375% Sr. Unsec. Nts., 10/15/251 | | | 318,000 | | | | 323,963 | |
| | | | | | | 825,435 | |
| Health Care Providers & Services—0.9% | | | | | |
| Cigna Corp., 4.125% Sr. Unsec. Nts., 11/15/251 | | | 246,000 | | | | 261,464 | |
| CVS Health Corp.: | | | | | | | | |
| 2.125% Sr. Unsec. Nts., 6/1/21 | | | 334,000 | | | | 331,842 | |
| 5.05% Sr. Unsec. Nts., 3/25/48 | | | 201,000 | | | | 214,105 | |
| Fresenius Medical Care US Finance II, Inc., 5.875% Sr. Unsec. Nts., 1/31/221 | | | 295,000 | | | | 315,203 | |
| | | | | | | 1,122,614 | |
| Life Sciences Tools & Services—0.4% | | | | | |
| IQVIA, Inc., 5.00% Sr. Unsec. Nts., 10/15/261 | | | 312,000 | | | | 324,480 | |
| Life Technologies Corp., 6.00% Sr. Unsec. Nts., 3/1/20 | | | 237,000 | | | | 242,050 | |
| | | | | | | 566,530 | |
13 INVESCO OPPENHEIMER V.I. TOTAL RETURN BOND FUND
STATEMENT OF INVESTMENTSUnaudited / Continued
| | | | | | | | |
| | | Principal Amount | | | Value | |
| Pharmaceuticals—0.9% | | | | | | | | |
| Bayer US Finance II LLC, 3.875% Sr. Unsec. Nts., 12/15/231 | | $ | 313,000 | | | $ | 324,513 | |
| Bristol-Myers Squibb Co., 3.40% Sr. Unsec. Nts., 7/26/291 | | | 225,000 | | | | 235,690 | |
| Elanco Animal Health, Inc., 4.90% Sr. Unsec. Nts., 8/28/281 | | | 137,000 | | | | 153,060 | |
| Mylan NV, 3.15% Sr. Unsec. Nts., 6/15/21 | | | 303,000 | | | | 303,081 | |
| Takeda Pharmaceutical Co. Ltd., 5.00% Sr. Unsec. Nts., 11/26/281 | | | 159,000 | | | | 180,171 | |
| | | | | | | 1,196,515 | |
| Industrials—2.8% | | | | | |
| Aerospace & Defense—1.0% | | | | | | | | |
| BAE Systems Holdings, Inc., 3.85% Sr. Unsec. Nts., 12/15/251 | | | 246,000 | | | | 257,202 | |
| Huntington Ingalls Industries, Inc., 3.483% Sr. Unsec. Nts., 12/1/27 | | | 176,000 | | | | 179,150 | |
| L3 Technologies, Inc., 3.85% Sr. Unsec. Nts., 6/15/23 | | | 317,000 | | | | 330,854 | |
| Northrop Grumman Corp., 4.75% Sr. Unsec. Nts., 6/1/43 | | | 175,000 | | | | 203,091 | |
| United Technologies Corp.: | | | | | | | | |
| 3.35% Sr. Unsec. Nts., 8/16/21 | | | 77,000 | | | | 78,717 | |
| 3.95% Sr. Unsec. Nts., 8/16/25 | | | 193,000 | | | | 208,204 | |
| | | | | | | 1,257,218 | |
| Building Products—0.2% | | | | | |
| Fortune Brands Home & Security, Inc., 4.00% Sr. Unsec. Nts., 9/21/23 | | | 297,000 | | | | 312,695 | |
| Electrical Equipment—0.1% | | | | | |
| Sensata Technologies BV, 5.00% Sr. Unsec. Nts., 10/1/251 | | | 170,000 | | | | 178,075 | |
| Industrial Conglomerates—0.1% | | | | | |
| GE Capital International Funding Co. Unlimited Co., 3.373% Sr. Unsec. Nts., 11/15/25 | | | 99,000 | | | | 100,242 | |
| Machinery—0.2% | | | | | |
| Ingersoll-Rand Luxembourg Finance SA, 3.80% Sr. Unsec. Nts., 3/21/29 | | | 152,000 | | | | 159,523 | |
| nVent Finance Sarl, 4.55% Sr. Unsec. Nts., 4/15/28 | | | 162,000 | | | | 164,665 | |
| | | | | | | 324,188 | |
| Professional Services—0.2% | | | | | |
| IHS Markit Ltd., 4.125% Sr. Unsec. Nts., 8/1/23 | | | 198,000 | | | | 206,088 | |
| Road & Rail—0.5% | | | | | |
| Penske Truck Leasing Co. LP/PTL Finance Corp., 3.40% Sr. Unsec. Nts., 11/15/261 | | | 276,000 | | | | 275,881 | |
| Ryder System, Inc., 3.75% Sr. Unsec. Nts., 6/9/23 | | | 314,000 | | | | 326,850 | |
| | | | | | | 602,731 | |
| Trading Companies & Distributors—0.5% | | | | | |
| Air Lease Corp.: | | | | | | | | |
| 3.25% Sr. Unsec. Nts., 3/1/25 | | | 99,000 | | | | 99,629 | |
| 3.625% Sr. Unsec. Nts., 4/1/27 | | | 106,000 | | | | 106,596 | |
| GATX Corp., 3.50% Sr. Unsec. Nts., 3/15/28 | | | 201,000 | | | | 201,956 | |
| Mitsubishi UFJ Financial Group, Inc., 3.741% Sr. Unsec. Nts., 3/7/29 | | | 196,000 | | | | 210,396 | |
| | | | | | | 618,577 | |
| Information Technology—3.4% | | | | | |
| Communications Equipment—0.2% | | | | | |
| Motorola Solutions, Inc., 4.60% Sr. Unsec. Nts., 2/23/28 | | | 241,000 | | | | 252,956 | |
| | | | | | | | |
| | | Principal Amount | | | Value | |
| Electronic Equipment, Instruments, & Components—0.6% | |
| Arrow Electronics, Inc., 3.875% Sr. Unsec. Nts., 1/12/28 | | $ | 232,000 | | | $ | 230,151 | |
| FLIR Systems, Inc., 3.125% Sr. Unsec. Nts., 6/15/21 | | | 308,000 | | | | 311,028 | |
| Tech Data Corp., 4.95% Sr. Unsec. Nts., 2/15/27 | | | 264,000 | | | | 276,400 | |
| | | | | | | 817,579 | |
| IT Services—0.8% | | | | | |
| DXC Technology Co., 4.75% Sr. Unsec. Nts., 4/15/27 | | | 241,000 | | | | 256,513 | |
| Fidelity National Information Services, Inc., 4.25% Sr. Unsec. Nts., 5/15/28 | | | 162,000 | | | | 176,701 | |
| Fiserv, Inc., 3.50% Sr. Unsec. Nts., 7/1/29 | | | 229,000 | | | | 235,459 | |
| VeriSign, Inc.: | | | | | | | | |
| 4.75% Sr. Unsec. Nts., 7/15/27 | | | 190,000 | | | | 198,550 | |
| 5.25% Sr. Unsec. Nts., 4/1/25 | | | 99,000 | | | | 106,054 | |
| | | | | | | 973,277 | |
| Semiconductors & Semiconductor Equipment—1.1% | |
| Broadcom, Inc.: | | | | | | | | |
| 3.125% Sr. Unsec. Nts., 4/15/211 | | | 316,000 | | | | 318,151 | |
| 4.25% Sr. Unsec. Nts., 4/15/261 | | | 255,000 | | | | 258,551 | |
| Microchip Technology, Inc., 3.922% Sr. Sec. Nts., 6/1/21 | | | 316,000 | | | | 321,733 | |
| NXP BV/NXP Funding LLC, 4.125% Sr. Unsec. Nts., 6/1/211 | | | 292,000 | | | | 299,475 | |
| NXP BV/NXP Funding LLC/NXP USA, Inc., 3.875% Sr. Unsec. Nts., 6/18/261 | | | 203,000 | | | | 208,479 | |
| | | | | | | 1,406,389 | |
| Software—0.3% | | | | | |
| Autodesk, Inc., 4.375% Sr. Unsec. Nts., 6/15/25 | | | 98,000 | | | | 104,230 | |
| Open Text Corp., 5.625% Sr. Unsec. Nts., 1/15/231 | | | 158,000 | | | | 163,135 | |
| VMware, Inc., 3.90% Sr. Unsec. Nts., 8/21/27 | | | 161,000 | | | | 163,202 | |
| | | | | | | 430,567 | |
| Technology Hardware, Storage & Peripherals—0.4% | |
| Apple, Inc., 4.375% Sr. Unsec. Nts., 5/13/45 | | | 188,000 | | | | 214,337 | |
| Dell International LLC/EMC Corp., 5.30% Sr. Sec. Nts., 10/1/291 | | | 317,000 | | | | 333,899 | |
| | | | | | | 548,236 | |
| Materials—2.5% | | | | | |
| Chemicals—0.9% | | | | | |
| Dow Chemical Co. (The), 3.625% Sr. Unsec. Nts., 5/15/261 | | | 207,000 | | | | 214,789 | |
| DowDuPont, Inc., 5.419% Sr. Unsec. Nts., 11/15/48 | | | 125,000 | | | | 152,172 | |
| Eastman Chemical Co., 3.50% Sr. Unsec. Nts., 12/1/21 | | | 126,000 | | | | 128,900 | |
| Nutrien Ltd.: | | | | | | | | |
| 4.875% Sr. Unsec. Nts., 3/30/20 | | | 41,000 | | | | 41,708 | |
| 5.00% Sr. Unsec. Nts., 4/1/49 | | | 84,000 | | | | 95,308 | |
| RPM International, Inc., 3.45% Sr. Unsec. Nts., 11/15/22 | | | 335,000 | | | | 341,210 | |
| Yara International ASA, 4.75% Sr. Unsec. Nts., 6/1/281 | | | 165,000 | | | | 177,943 | |
| | | | | | | 1,152,030 | |
| Construction Materials—0.3% | | | | | |
| James Hardie International Finance DAC, 4.75% Sr. Unsec. Nts., 1/15/251 | | | 193,000 | | | | 197,825 | |
| Martin Marietta Materials, Inc., 3.50% Sr. Unsec. Nts., 12/15/27 | | | 161,000 | | | | 160,800 | |
| | | | | | | 358,625 | |
14 INVESCO OPPENHEIMER V.I. TOTAL RETURN BOND FUND
| | | | | | | | |
| | | Principal Amount | | | Value | |
| Containers & Packaging—0.6% | | | | | |
| Packaging Corp. of America, 3.65% Sr. Unsec. Nts., 9/15/24 | | $ | 273,000 | | | $ | 282,951 | |
| Silgan Holdings, Inc., 4.75% Sr. Unsec. Nts., 3/15/25 | | | 270,000 | | | | 273,376 | |
| WRKCo, Inc., 3.90% Sr. Unsec. Nts., 6/1/28 | | | 191,000 | | | | 196,078 | |
| | | | | | | 752,405 | |
| Metals & Mining—0.6% | | | | | |
| Anglo American Capital plc, 3.625% Sr. Unsec. Nts., 9/11/241 | | | 83,000 | | | | 84,799 | |
| ArcelorMittal, 6.125% Sr. Unsec. Nts., 6/1/25 | | | 285,000 | | | | 324,059 | |
| Steel Dynamics, Inc., 4.125% Sr. Unsec. Nts., 9/15/25 | | | 326,000 | | | | 326,000 | |
| | | | | | | 734,858 | |
| Paper & Forest Products—0.1% | | | | | |
| Louisiana-Pacific Corp., 4.875% Sr. Unsec. Nts., 9/15/24 | | | 186,000 | | | | 189,488 | |
| Telecommunication Services—1.9% | | | | | |
| Diversified Telecommunication Services—1.7% | | | | | |
| AT&T, Inc.: | | | | | | | | |
| 4.30% Sr. Unsec. Nts., 2/15/30 | | | 238,000 | | | | 254,373 | |
| 4.35% Sr. Unsec. Nts., 6/15/45 | | | 126,000 | | | | 125,631 | |
| 4.50% Sr. Unsec. Nts., 3/9/48 | | | 135,000 | | | | 138,531 | |
| British Telecommunications plc: | | | | | | | | |
| 4.50% Sr. Unsec. Nts., 12/4/23 | | | 201,000 | | | | 215,190 | |
| 9.625% Sr. Unsec. Nts., 12/15/30 | | | 270,000 | | | | 406,977 | |
| Deutsche Telekom International Finance BV, 4.375% Sr. Unsec. Nts., 6/21/281 | | | 149,000 | | | | 162,420 | |
| Telefonica Emisiones SA: | | | | | | | | |
| 4.103% Sr. Unsec. Nts., 3/8/27 | | | 90,000 | | | | 95,653 | |
| 5.213% Sr. Unsec. Nts., 3/8/47 | | | 79,000 | | | | 87,134 | |
| T-Mobile USA, Inc., 6.50% Sr. Unsec. Nts., 1/15/26 | | | 284,000 | | | | 307,731 | |
| Verizon Communications, Inc.: | | | | | | | | |
| 4.125% Sr. Unsec. Nts., 8/15/46 | | | 133,000 | | | | 138,892 | |
| 4.522% Sr. Unsec. Nts., 9/15/48 | | | 184,000 | | | | 205,821 | |
| | | | | | | 2,138,353 | |
| Wireless Telecommunication Services—0.2% | | | | | |
| Vodafone Group plc, 3.75% Sr. Unsec. Nts., 1/16/24 | | | 313,000 | | | | 327,887 | |
| Utilities—2.2% | | | | | |
| Electric Utilities—1.8% | | | | | | | | |
| AEP Texas, Inc., 3.95% Sr. Unsec. Nts., 6/1/281 | | | 162,000 | | | | 173,216 | |
| Duke Energy Corp., 3.75% Sr. Unsec. Nts., 9/1/46 | | | 65,000 | | | | 63,661 | |
| Edison International, 2.125% Sr. Unsec. Nts., 4/15/20 | | | 57,000 | | | | 56,755 | |
| EDP Finance BV, 3.625% Sr. Unsec. Nts., 7/15/241 | | | 219,000 | | | | 225,773 | |
| Emera US Finance LP, 2.70% Sr. Unsec. Nts., 6/15/21 | | | 168,000 | | | | 168,585 | |
| Enel Finance International NV, 2.875% Sr. Unsec. Nts., 5/25/221 | | | 309,000 | | | | 311,463 | |
| Exelon Corp.: | | | | | | | | |
| 2.45% Sr. Unsec. Nts., 4/15/21 | | | 152,000 | | | | 151,970 | |
| 4.45% Sr. Unsec. Nts., 4/15/46 | | | 89,000 | | | | 94,748 | |
| FirstEnergy Corp., 3.90% Sr. Unsec. Nts., 7/15/27 | | | 175,000 | | | | 183,714 | |
| Mid-Atlantic Interstate Transmission LLC, 4.10% Sr. Unsec. Nts., 5/15/281 | | | 162,000 | | | | 172,542 | |
| NextEra Energy Operating Partners LP, 4.25% Sr. Unsec. Nts., 9/15/241 | | | 324,000 | | | | 326,932 | |
| | | | | | | | |
| | | Principal Amount | | | Value | |
| Electric Utilities (Continued) | | | | | | | | |
| PPL WEM Ltd./Western Power | | | | | | | | |
| Distribution Ltd., 5.375% Sr. Unsec. Nts., 5/1/211 | | $ | 308,000 | | | $ | 318,790 | |
| | | | | | | 2,248,149 | |
| Independent Power and Renewable Electricity Producers—0.1% | |
| NRG Energy, Inc., 4.45% Sr. Sec. Nts., 6/15/291 | | | 158,000 | | | | 164,560 | |
| PSEG Power LLC, 3.00% Sr. Unsec. Nts., 6/15/21 | | | 16,000 | | | | 16,170 | |
| | | | | | | 180,730 | |
| Multi-Utilities—0.3% | | | | | |
| CenterPoint Energy, Inc., 4.25% Sr. | | | | | | | | |
| Unsec. Nts., 11/1/28 | | | 147,000 | | | | 158,924 | |
| Dominion Energy, Inc., 2.715% Jr. Sub. | | | | | | | | |
| Nts., 8/15/2110 | | | 203,000 | | | | 203,320 | |
| | | | | | | 362,244 | |
| Total Corporate Bonds and Notes (Cost $55,760,775) | | | | | | | 58,291,584 | |
| Short-Term Notes—8.1% | | | | | |
| Albemarle Corp., 2.586%, 7/8/191,13,14 | | | 570,000 | | | | 569,557 | |
| Ameren Corp., 2.627%, 7/8/191,13,14 | | | 560,000 | | | | 559,610 | |
| Avery Dennison, 2.564%, 7/10/1913,14 | | | 570,000 | | | | 569,532 | |
| Bell Canada, Inc., 2.535%, 7/17/1913,14 | | | 560,000 | | | | 559,225 | |
| Church & Dwight Co, Inc., 2.626%, 7/8/191,13,14 | | | 570,000 | | | | 569,603 | |
| Clorox Co. (The), 2.606%, 7/2/191,13,14 | | | 560,000 | | | | 559,852 | |
| Duke Energy Corp., 2.544%, 7/2/191,13,14 | | | 250,000 | | | | 249,931 | |
| ERAC USA Finance LLC, 2.606%, 7/18/191,13,14 | | | 570,000 | | | | 569,201 | |
| General Mills, Inc., 2.514%, 7/8/1913,14 | | | 250,000 | | | | 249,826 | |
| Harley-Davidson Financial Services, Inc., 2.566%, 7/9/1913,14 | | | 380,000 | | | | 379,709 | |
| International Paper Co., 2.604%, 7/1/191,13,14 | | | 310,000 | | | | 309,935 | |
| Interpublic Group of Cos., Inc. (The), 2.605%, 7/2/191,13,14 | | | 250,000 | | | | 249,931 | |
| Marriott International, Inc., 2.586%, 7/23/191,13,14 | | | 370,000 | | | | 369,350 | |
| McCormick & Co, Inc., 2.502%, 7/1/191,13,14 | | | 250,000 | | | | 249,945 | |
| Mohawk Industries, Inc., 2.686%, 7/1/191,13,14 | | | 560,000 | | | | 559,883 | |
| NetApp, Inc., 2.576%, 7/2/191,13,14 | | | 500,000 | | | | 499,861 | |
| NextEra Energy Capital Holdings, Inc., 2.586%, 7/11/191,13,14 | | | 560,000 | | | | 559,492 | |
| Puget Sound Energy, Inc., 2.615%, 7/11/1914 | | | 570,000 | | | | 569,483 | |
| Telus Corp., 2.532%, 7/2/191,14 | | | 570,000 | | | | 569,842 | |
| TransCanada PipeLines Ltd, 2.607%, 7/24/191,13,14 | | | 440,000 | | | | 439,196 | |
| UnitedHealth Group, Inc., 2.536%, 7/15/191,13,14 | | | 570,000 | | | | 569,331 | |
| Walgreens Boots Alliance, Inc., 2.606%, 7/24/1914 | | | 570,000 | | | | 568,959 | |
| Total Short-Term Notes (Cost $10,353,318) | | | | | | | 10,351,254 | |
| | |
| | | Shares | | | | |
| Investment Company—16.8% | | | | | |
| Invesco Oppenheimer Institutional Government Money Market Fund, Cl. IN, 2.37%15(Cost $21,493,442) | | | 21,493,442 | | | | 21,493,442 | |
| Total Investments, at Value (Cost $167,611,699) | | | 132.2 | % | | | 169,513,146 | |
| Net Other Assets (Liabilities) | | | (32.2 | ) | | | (41,300,800 | ) |
| Net Assets | | | 100.0 | % | | $ | 128,212,346 | |
| | | | |
15 INVESCO OPPENHEIMER V.I. TOTAL RETURN BOND FUND
STATEMENT OF INVESTMENTSUnaudited / Continued
Footnotes to Statement of Investments
1. Represents securities sold under Rule 144A, which are exempt from registration under the Securities Act of 1933, as amended. These securities have been determined to be liquid under guidelines established by the Board of Trustees. These securities amount to $37,303,448 or 29.10% of the Fund’s net assets at period end.
2. Restricted security. The aggregate value of restricted securities at period end was $158,642, which represents 0.12% of the Fund’s net assets. Information concerning restricted securities is as follows:
| | | | | | | | | | | | | | | | |
| Security | | Acquisition
Dates | | | Cost | | | Value | | | Unrealized
Appreciation/
(Depreciation) | |
| GLS Auto Receivables Trust, Series2018-1A, Cl. A, 2.82%, 7/15/22 | | | 1/30/18 | | | $ | 158,395 | | | $ | 158,642 | | | $ | 247 | |
3. Represents the current interest rate for a variable or increasing rate security, which may be fixed for a predetermined period. The interest rate is, or will be as of an established date, determined as [Referenced Rate + Basis-point spread].
4. Interest-Only Strips represent the right to receive the monthly interest payments on an underlying pool of mortgage loans. These securities typically decline in price as interest rates decline. Most other fixed income securities increase in price when interest rates decline. The principal amount of the underlying pool represents the notional amount on which current interest is calculated. The price of these securities is typically more sensitive to changes in prepayment rates than traditional mortgage-backed securities (for example, GNMA pass-throughs). Interest rates disclosed represent current yields based upon the current cost basis and estimated timing and amount of future cash flows. These securities amount to $2,480,554 or 1.93% of the Fund’s net assets at period end.
5. Interest rate is less than 0.0005%.
6. Principal-Only Strips represent the right to receive the monthly principal payments on an underlying pool of mortgage loans. The value of these securities generally increases as interest rates decline and prepayment rates rise. The price of these securities is typically more volatile than that of coupon-bearing bonds of the same maturity. Interest rates disclosed represent current yields based upon the current cost basis and estimated timing of future cash flows. These securities amount to $48,588 or 0.04% of the Fund’s net assets at period end.
7. All or a portion of the security position is when-issued or delayed delivery to be delivered and settled after period end. See Note 1K of the accompanying Notes.
8. The current amortization rate of the security’s cost basis exceeds the future interest payments currently estimated to be received. Both the amortization rate and interest payments are contingent on future mortgagepre-payment speeds and are therefore subject to change.
9. The value of this security was determined using significant unobservable inputs. See Note 3 of the accompanying Notes.
10. This interest rate resets periodically. Interest rate shown reflects the rate in effect at period end. The rate on this variable rate security is not based on a published reference rate and spread but is determined by the issuer or agent based on current market conditions.
11. This bond has no contractual maturity date, is not redeemable and contractually pays an indefinite stream of interest.
12. Represents securities sold under Regulation S, which are exempt from registration under the Securities Act of 1933, as amended. These securities may not be offered or sold in the United States without and exemption from, or in a transaction not subject to, the registration requirements of the Securities Act of 1933. These securities amount to $331,440 or 0.26% of the Fund’s net assets at period end.
13. Security issued in an exempt transaction without registration under the Securities Act of 1933. Such securities amount to $8,642,970 or 6.74% of the Fund’s net assets, and have been determined to be liquid pursuant to guidelines adopted by the Board of Trustees.
14. Current yield as of period end.
15. The money market fund and the Fund are affiliated by having the same investment adviser. The rate shown is the7-day SEC standardized yield as of June 30, 2019.
| | | | | | | | | | | | | | | | | | | | | | | | | | |
| Futures Contracts as of June 30, 2019 | |
| Description | | Buy/Sell | | Expiration Date | | | Number of
Contracts | | | | | | Notional
Amount
(000’s) | | | Value | | | Unrealized
Appreciation/
(Depreciation) | |
| United States Treasury Long Bonds | | Buy | | | 9/19/19 | | | | 26 | | | | USD | | | | 3,980 | | | $ | 4,045,438 | | | $ | 65,369 | |
| United States Treasury Nts., 10 yr. | | Buy | | | 9/19/19 | | | | 54 | | | | USD | | | | 6,817 | | | | 6,910,313 | | | | 93,264 | |
| United States Treasury Nts., 2 yr. | | Sell | | | 9/30/19 | | | | 36 | | | | USD | | | | 7,742 | | | | 7,746,469 | | | | (4,555) | |
| United States Treasury Nts., 5 yr. | | Sell | | | 9/30/19 | | | | 26 | | | | USD | | | | 3,034 | | | | 3,072,063 | | | | (37,669) | |
| United States Ultra Bonds | | Buy | | | 9/19/19 | | | | 58 | | | | USD | | | | 9,920 | | | | 10,298,625 | | | | 378,139 | |
| | | | | | | | | | | | | | | | | | | | | | | | | | |
| | | | | | | | | | | | | | | | | | | | | | | | $ | 494,548 | |
| | | | | | | | | | | | | | | | | | | | | | | | | | |
| | | | | | | | | | | | | | | | | | | | | | | | | | | | | | | | |
| Over-the-Counter Total Return Swaps at June 30, 2019 | |
| Reference Asset | | Counterparty | | | Pay/Receive Total
Return* | | | Floating Rate | | | Maturity
Date | | | | | | Notional
Amount
(000’s) | | | Value | | | Unrealized
Appreciation/
(Depreciation) | |
| iBoxx USD Liquid IG Series 1 | | | | | | | | | | | | | | | | | | | | | | | | | | | | | | | | |
| Version 1 | | | GSCO-OT | | | | Pay | | | | USD BBA LIBOR | | | | 9/26/19 | | | | USD | | | | 5,189 | | | $ | (399,169 | ) | | $ | (399,169 | ) |
*Fund will pay or receive the total return of the reference asset depending on whether the return is positive or negative. For contracts where the Fund has elected to receive the total return of the reference asset if positive, it will be responsible for paying the floating rate and the total return of the reference asset if negative. If the Fund has elected to pay the total return of the reference asset if positive, it will receive the floating rate and the total return of the reference asset if negative.
| | |
| Glossary: | | |
| Counterparty Abbreviations | | |
| GSCO-OT | | Goldman Sachs Bank USA |
|
| Currency abbreviations indicate amounts reporting in currencies |
| |
| Definitions | | |
| BBA LIBOR | | British Bankers’ Association London - Interbank Offered Rate |
| H15T5Y | | US Treasury Yield Curve Rate T Note Constant Maturity 5 Year |
| H15T1Y | | US Treasury Yield Curve Rate T Note Constant Maturity 1 Year |
| ICE LIBOR | | Intercontinental Exchange Benchmark Administration-London Interbank Offered Rate |
| LIBOR01M | | ICE LIBOR USD 1 Month |
| US0001M | | ICE LIBOR USD 1 Month |
| US0003M | | ICE LIBOR USD 3 Month |
16 INVESCO OPPENHEIMER V.I. TOTAL RETURN BOND FUND
Definitions (Continued)
| | |
| USISDA05 | | USD ICE Swap Rate 11:00am NY 5 Year |
| USSW5 | | USD Swap Semi 30/360 5 Year |
See accompanying Notes to Financial Statements.
17 INVESCO OPPENHEIMER V.I. TOTAL RETURN BOND FUND
STATEMENT OF ASSETS AND LIABILITIESJune 30, 2019 Unaudited
| | | | |
Assets | | | | |
| Investments, at value—see accompanying statement of investments: | | | | |
| Unaffiliated companies (cost $146,118,257) | | $ | 148,019,704 | |
Affiliated companies (cost $21,493,442) | | | 21,493,442 | |
| | | | 169,513,146 | |
| Cash | | | 500,000 | |
| Cash used for collateral on futures | | | 392,000 | |
| Receivables and other assets: | | | | |
| Investments sold (including $12,436,102 sold on a when-issued or delayed delivery basis) | | | 13,023,795 | |
| Interest, dividends and principal paydowns | | | 676,964 | |
| Shares of beneficial interest sold | | | 5,796 | |
| Variation margin receivable - futures | | | 3,094 | |
Other | | | 107,008 | |
Total assets | | | 184,221,803 | |
Liabilities | | | | |
| Swaps, at value | | | 399,169 | |
| Payables and other liabilities: | | | | |
| Investments purchased (including $54,887,060 purchased on a when-issued or delayed delivery basis) | | | 55,317,578 | |
| Shares of beneficial interest redeemed | | | 88,816 | |
| Trustees’ compensation | | | 47,631 | |
| Administration fee | | | 17,836 | |
| Variation margin payable - futures | | | 14,125 | |
| Distribution and service plan fees | | | 11,075 | |
| Shareholder communications | | | 10,843 | |
| Management fee | | | 6,300 | |
| Transfer and shareholder servicing agent fees | | | 3,143 | |
Other | | | 92,941 | |
| Total liabilities | | | 56,009,457 | |
Net Assets | | $ | 128,212,346 | |
| | | | |
| | | | |
Composition of Net Assets | | | | |
| Shares of beneficial interest | | $ | 128,682,277 | |
| Total accumulated loss | | | (469,931 | ) |
Net Assets | | $ | 128,212,346 | |
| | | | |
| | | | |
Net Asset Value Per Share | | | | |
| Series I Shares: | | | | |
| Net asset value, redemption price per share and offering price per share (based on net assets of $73,973,683 and 9,557,769 shares of beneficial interest outstanding) | | | $7.74 | |
| Series II Shares: | | | | |
| Net asset value, redemption price per share and offering price per share (based on net assets of $54,238,663 and 7,099,376 shares of beneficial interest outstanding) | | | $7.64 | |
See accompanying Notes to Financial Statements.
18 INVESCO OPPENHEIMER V.I. TOTAL RETURN BOND FUND
STATEMENT OF OPERATIONSFor the Six Months Ended June 30, 2019 Unaudited
| | | | |
Investment Income | | | | |
| Interest: | | | | |
| Unaffiliated companies | | $ | 2,294,854 | |
| Fee income on when-issued securities | | | 139,372 | |
Dividends — affiliated companies | | | 51,103 | |
| Total investment income | | | 2,485,329 | |
Expenses | | | | |
| Management fees | | | 371,182 | |
| Administration fees | | | 19,301 | |
| Distribution and service plan fees — Series II shares | | | 63,722 | |
| Transfer and shareholder servicing agent fees: | | | | |
| Series I shares | | | 36,841 | |
| Series II shares | | | 25,344 | |
| Shareholder communications: | | | | |
| Series I shares | | | 10,614 | |
| Series II shares | | | 7,274 | |
| Legal, auditing and other professional fees | | | 33,495 | |
| Custodian fees and expenses | | | 25,974 | |
| Trustees’ compensation | | | 5,975 | |
| Borrowing fees | | | 1,537 | |
Other | | | 4,126 | |
| Total expenses | | | 605,385 | |
| Less reduction to custodian expenses | | | (608 | ) |
Less waivers and reimbursements of expenses | | | (75,200 | ) |
| Net expenses | | | 529,577 | |
Net Investment Income | | | 1,955,752 | |
Realized and Unrealized Gain (Loss) | | | | |
| Net realized gain on: | | | | |
| Investment transactions (includes net losses from securities sold to affiliates of $4,165) | | | 1,302,723 | |
| Futures contracts | | | 1,012,261 | |
Swap contracts | | | 36,519 | |
| Net realized gain | | | 2,351,503 | |
| Net change in unrealized appreciation/(depreciation) on: | | | | |
| Investment transactions | | | 4,288,098 | |
| Futures contracts | | | 87,700 | |
Swap contracts | | | (399,169 | ) |
| Net change in unrealized appreciation/(depreciation) | | | 3,976,629 | |
Net Increase in Net Assets Resulting from Operations | | $ | 8,283,884 | |
| | | | |
See accompanying Notes to Financial Statements.
19 INVESCO OPPENHEIMER V.I. TOTAL RETURN BOND FUND
STATEMENTS OF CHANGES IN NET ASSETS
| | | | | | | | |
| | | Six Months Ended
June 30, 2019
(Unaudited) | | Year Ended
December 31, 2018 |
Operations | | | | | | | | |
| Net investment income | | $ | 1,955,752 | | | $ | 4,078,170 | |
| Net realized gain (loss) | | | 2,351,503 | | | | (2,608,541 | ) |
Net change in unrealized appreciation/(depreciation) | | | 3,976,629 | | | | (3,029,473 | ) |
Net increase (decrease) in net assets resulting from operations | | | 8,283,884 | | | | (1,559,844 | ) |
Dividends and/or Distributions to Shareholders | | | | | | | | |
| Distributions to shareholders from distributable earnings: | | | | | | | | |
| Series I shares | | | (2,462,939 | ) | | | (2,617,442 | ) |
| Series II shares | | | (1,702,386 | ) | | | (1,481,742 | ) |
Total distributions from distributable earnings | | | (4,165,325 | ) | | | (4,099,184 | ) |
Beneficial Interest Transactions | | | | | | | | |
| Net increase (decrease) in net assets resulting from beneficial interest transactions: | | | | | | | | |
| Series I shares | | | (3,405,923 | ) | | | (3,043,103 | ) |
Series II shares | | | 6,179,303 | | | | (2,488,899 | ) |
Total beneficial interest transactions | | | 2,773,380 | | | | (5,532,002 | ) |
Net Assets | | | | | | | | |
| Total increase (decrease) | | | 6,891,939 | | | | (11,191,030 | ) |
| Beginning of period | | | 121,320,407 | | | | 132,511,437 | |
End of period | | $ | 128,212,346 | | | $ | 121,320,407 | |
| | | | |
See accompanying Notes to Financial Statements.
20 INVESCO OPPENHEIMER V.I. TOTAL RETURN BOND FUND
FINANCIAL HIGHLIGHTS
| | | | | | | | | | | | | | | | | | | | | | | | |
| Series I Shares | | Six Months
Ended
June 30, 2019
(Unaudited) | | | Year Ended
December 31,
2018 | | | Year Ended
December 31,
2017 | | | Year Ended
December 31,
2016 | | | Year Ended
December 31,
2015 | | | Year Ended
December 31,
2014 | |
Per Share Operating Data | | | | | | | | | | | | | | | | | | | | | | | | |
| Net asset value, beginning of period | | | $7.49 | | | | $7.83 | | | | $7.67 | | | | $7.71 | | | | $7.96 | | | | $7.83 | |
| Income (loss) from investment operations: | | | | | | | | | | | | | | | | | | | | | | | | |
| Net investment income1 | | | 0.12 | | | | 0.25 | | | | 0.19 | | | | 0.23 | | | | 0.27 | | | | 0.30 | |
| Net realized and unrealized gain (loss) | | | 0.40 | | | | (0.33) | | | | 0.16 | | | | 0.02 | | | | (0.19) | | | | 0.26 | |
| Total from investment operations | | | 0.52 | | | | (0.08) | | | | 0.35 | | | | 0.25 | | | | 0.08 | | | | 0.56 | |
| Dividends and/or distributions to shareholders: | | | | | | | | | | | | | | | | | | | | | | | | |
| Dividends from net investment income | | | (0.27) | | | | (0.26) | | | | (0.19) | | | | (0.29) | | | | (0.33) | | | | (0.43) | |
| Net asset value, end of period | | | $7.74 | | | | $7.49 | | | | $7.83 | | | | $7.67 | | | | $7.71 | | | | $7.96 | |
| | | | |
| | | | | | | | | | | | | | | | | | | | | | | | |
| Total Return, at Net Asset Value2 | | | 6.90% | | | | (1.02)% | | | | 4.59% | | | | 3.27% | | | | 0.96% | | | | 7.27% | |
| | | | | | | | | | | | | | | | | | | | | | | | |
| Ratios/Supplemental Data | | | | | | | | | | | | | | | | | | | | | | | | |
| Net assets, end of period (in thousands) | | | $73,974 | | | | $74,929 | | | | $81,481 | | | | $83,405 | | | | $85,160 | | | | $90,757 | |
| Average net assets (in thousands) | | | $73,907 | | | | $77,723 | | | | $83,239 | | | | $87,039 | | | | $89,919 | | | | $94,336 | |
| Ratios to average net assets:3 | | | | | | | | | | | | | | | | | | | | | | | | |
| Net investment income | | | 3.25% | | | | 3.35% | | | | 2.38% | | | | 2.96% | | | | 3.46% | | | | 3.72% | |
| Expenses excluding specific expenses listed below | | | 0.87% | | | | 0.87% | | | | 0.85% | | | | 0.84% | | | | 0.82% | | | | 0.80% | |
| Interest and fees from borrowings | | | 0.00%4 | | | | 0.00%4 | | | | 0.00%4 | | | | 0.00%4 | | | | 0.00%4 | | | | 0.00% | |
| Total expenses5 | | | 0.87% | | | | 0.87% | | | | 0.85% | | | | 0.84% | | | | 0.82% | | | | 0.80% | |
| Expenses after payments, waivers and/or reimbursements and reduction to custodian expenses | | | 0.75% | | | | 0.75% | | | | 0.75% | | | | 0.75% | | | | 0.75% | | | | 0.75% | |
| Portfolio turnover rate6 | | | 36% | | | | 64% | | | | 86% | | | | 79% | | | | 73% | | | | 127% | |
1. Per share amounts calculated based on the average shares outstanding during the period.
2. Assumes an initial investment on the business day before the first day of the fiscal period, with all dividends and distributions reinvested in additional shares on the reinvestment date, and redemption at the net asset value calculated on the last business day of the fiscal period. Total returns are not annualized for periods less than one full year. Total return information does not reflect expenses that apply at the separate account level or to related insurance products. Inclusion of these charges would reduce the total return figures for all periods shown. Returns do not reflect the deduction of taxes that a shareholder would pay on fund distributions or the redemption of fund shares.
3. Annualized for periods less than one full year.
4. Less than 0.005%.
5. Total expenses including indirect expenses from affiliated fund fees and expenses were as follows:
| | | | | | |
| | | | | | |
| | Six Months Ended June 30, 2019 | | | 0.87 | % |
| | Year Ended December 31, 2018 | | | 0.87 | % |
| | Year Ended December 31, 2017 | | | 0.85 | % |
| | Year Ended December 31, 2016 | | | 0.85 | % |
| | Year Ended December 31, 2015 | | | 0.83 | % |
| | Year Ended December 31, 2014 | | | 0.81 | % |
6. The portfolio turnover rate excludes purchase and sale transactions of To Be Announced (TBA) mortgage-related securities as follows:
| | | | | | | | |
| | | Purchase Transactions | | | Sale Transactions | |
Six Months Ended June 30, 2019 | | | $309,131,258 | | | | $305,683,016 | |
Year Ended December 31, 2018 | | | $641,318,699 | | | | $653,537,737 | |
Year Ended December 31, 2017 | | | $679,964,368 | | | | $662,714,451 | |
Year Ended December 31, 2016 | | | $672,031,328 | | | | $673,808,454 | |
Year Ended December 31, 2015 | | | $697,962,198 | | | | $709,720,690 | |
Year Ended December 31, 2014 | | | $560,409,975 | | | | $543,669,748 | |
See accompanying Notes to Financial Statements.
21 INVESCO OPPENHEIMER V.I. TOTAL RETURN BOND FUND
FINANCIAL HIGHLIGHTSContinued
| | | | | | | | | | | | | | | | | | | | | | | | |
| Series II Shares | | Six Months Ended
June 30, 2019
(Unaudited) | | | Year Ended
December 31,
2018 | | | Year Ended
December 31,
2017 | | | Year Ended
December 31,
2016 | | | Year Ended
December 31,
2015 | | | Year Ended
December 31,
2014 | |
Per Share Operating Data | | | | | | | | | | | | | | | | | | | | | | | | |
| Net asset value, beginning of period | | | $7.39 | | | | $7.73 | | | | $7.57 | | | | $7.61 | | | | $7.86 | | | | $7.74 | |
| Income (loss) from investment operations: | | | | | | | | | | | | | | | | | | | | | | | | |
| Net investment income1 | | | 0.11 | | | | 0.23 | | | | 0.16 | | | | 0.21 | | | | 0.25 | | | | 0.27 | |
| Net realized and unrealized gain (loss) | | | 0.39 | | | | (0.33) | | | | 0.17 | | | | 0.02 | | | | (0.19) | | | | 0.26 | |
| Total from investment operations | | | 0.50 | | | | (0.10) | | | | 0.33 | | | | 0.23 | | | | 0.06 | | | | 0.53 | |
| Dividends and/or distributions to shareholders: | | | | | | | | | | | | | | | | | | | | | | | | |
| Dividends from net investment income | | | (0.25) | | | | (0.24) | | | | (0.17) | | | | (0.27) | | | | (0.31) | | | | (0.41) | |
| Net asset value, end of period | | | $7.64 | | | | $7.39 | | | | $7.73 | | | | $7.57 | | | | $7.61 | | | | $7.86 | |
| | | | |
| | | | | | | | | | | | | | | | | | | | | | | | |
| Total Return, at Net Asset Value2 | | | 6.74% | | | | (1.31)% | | | | 4.38% | | | | 3.05% | | | | 0.70% | | | | 6.93% | |
| | | | | | | | | | | | | | | | | | | | | | | | |
| Ratios/Supplemental Data | | | | | | | | | | | | | | | | | | | | | | | | |
| Net assets, end of period (in thousands) | | | $54,239 | | | | $46,391 | | | | $51,030 | | | | $53,350 | | | | $52,519 | | | | $52,675 | |
| Average net assets (in thousands) | | | $51,396 | | | | $47,731 | | | | $52,525 | | | | $52,738 | | | | $54,016 | | | | $55,215 | |
| Ratios to average net assets:3 | | | | | | | | | | | | | | | | | | | | | | | | |
| Net investment income | | | 3.00% | | | | 3.10% | | | | 2.13% | | | | 2.70% | | | | 3.21% | | | | 3.47% | |
| Expenses excluding specific expenses listed below | | | 1.12% | | | | 1.12% | | | | 1.10% | | | | 1.09% | | | | 1.07% | | | | 1.04% | |
| Interest and fees from borrowings | | | 0.00%4 | | | | 0.00%4 | | | | 0.00%4 | | | | 0.00%4 | | | | 0.00%4 | | | | 0.00% | |
| Total expenses5 | | | 1.12% | | | | 1.12% | | | | 1.10% | | | | 1.09% | | | | 1.07% | | | | 1.04% | |
| Expenses after payments, waivers and/or reimbursements and reduction to custodian expenses | | | 1.00% | | | | 1.00% | | | | 1.00% | | | | 1.00% | | | | 1.00% | | | | 1.00% | |
| Portfolio turnover rate6 | | | 36% | | | | 64% | | | | 86% | | | | 79% | | | | 73% | | | | 127% | |
1. Per share amounts calculated based on the average shares outstanding during the period.
2. Assumes an initial investment on the business day before the first day of the fiscal period, with all dividends and distributions reinvested in additional shares on the reinvestment date, and redemption at the net asset value calculated on the last business day of the fiscal period. Total returns are not annualized for periods less than one full year. Total return information does not reflect expenses that apply at the separate account level or to related insurance products. Inclusion of these charges would reduce the total return figures for all periods shown. Returns do not reflect the deduction of taxes that a shareholder would pay on fund distributions or the redemption of fund shares.
3. Annualized for periods less than one full year.
4. Less than 0.005%.
5. Total expenses including indirect expenses from affiliated fund fees and expenses were as follows:
| | | | | | |
| | | | | |
| | Six Months Ended June 30, 2019 | | | 1.12 | % |
| | Year Ended December 31, 2018 | | | 1.12 | % |
| | Year Ended December 31, 2017 | | | 1.10 | % |
| | Year Ended December 31, 2016 | | | 1.10 | % |
| | Year Ended December 31, 2015 | | | 1.08 | % |
| | Year Ended December 31, 2014 | | | 1.05 | % |
6. The portfolio turnover rate excludes purchase and sale transactions of To Be Announced (TBA) mortgage-related securities as follows:
| | | | | | | | |
| | | Purchase Transactions | | | Sale Transactions | |
Six Months Ended June 30, 2019 | | | $309,131,258 | | | | $305,683,016 | |
Year Ended December 31, 2018 | | | $641,318,699 | | | | $653,537,737 | |
Year Ended December 31, 2017 | | | $679,964,368 | | | | $662,714,451 | |
Year Ended December 31, 2016 | | | $672,031,328 | | | | $673,808,454 | |
Year Ended December 31, 2015 | | | $697,962,198 | | | | $709,720,690 | |
Year Ended December 31, 2014 | | | $560,409,975 | | | | $543,669,748 | |
See accompanying Notes to Financial Statements.
22 INVESCO OPPENHEIMER V.I. TOTAL RETURN BOND FUND
NOTES TO FINANCIAL STATEMENTSJune 30, 2019 Unaudited
Note 1 - Significant Accounting Policies
Invesco Oppenheimer V.I. Total Return Bond Fund (the “Fund”) is a series portfolio of AIM Variable Insurance Funds (Invesco Variable Insurance Funds) (the “Trust”). The Trust is a Delaware statutory trust registered under the Investment Company Act of 1940, as amended (the “1940 Act”), as anopen-end series management investment company authorized to issue an unlimited number of shares of beneficial interest. Information presented in these financial statements pertains only to the Fund. Matters affecting the Fund or each class will be voted on exclusively by the shareholders of such Fund or each class.
Prior to the close of business on May 24, 2019, the Fund operated as Invesco Oppenheimer Total Return Bond Fund/VA (the “Acquired Fund” or “Predecessor Fund”). The Acquired Fund was reorganized after the close of business on May 24, 2019 (the “Reorganization Date”) through the transfer of all of its assets and liabilities to the Fund (the “Reorganization”).
Upon closing of the Reorganization, holders of the Acquired Fund’sNon-Service and Service shares received Series I and Series II shares of the Fund, respectively. Information for the Acquired Fund’sNon-Service and Service shares prior to the Reorganization is included with Series I and Series II, respectively, throughout this report.
The Fund’s investment objective is to seek total return.
The Fund currently offers two classes of shares, Series I and Series II, both of which are offered to insurance company separate accounts funding variable annuity contracts and variable life insurance policies (“variable products”).
The Fund is an investment company and accordingly follows the investment company accounting and reporting guidance in accordance with Financial Accounting Standards Board Accounting Standards Codification Topic 946, Financial Services – Investment Companies.
The following is a summary of the significant accounting policies followed by the Fund in the preparation of its financial statements.
A. Security Valuations - Securities, including restricted securities, are valued according to the following policy.
Debt obligations (including convertible securities) and unlisted equities are fair valued using an evaluated quote provided by an independent pricing service. Evaluated quotes provided by the pricing service may be determined without exclusive reliance on quoted prices, and may reflect appropriate factors such asinstitution-size trading in similar groups of securities, developments related to specific securities, dividend rate (for unlisted equities), yield (for debt obligations), quality, type of issue, coupon rate (for debt obligations), maturity (for debt obligations), individual trading characteristics and other market data. Pricing services generally value debt obligations assuming orderly transactions of institutional round lot size, but a fund may hold or transact in the same securities in smaller, odd lot sizes. Odd lots often trade at lower prices than institutional round lots. Debt obligations are subject to interest rate and credit risks. In addition, all debt obligations involve some risk of default with respect to interest and/or principal payments.
A security listed or traded on an exchange (except convertible securities) is valued at its last sales price or official closing price as of the close of the customary trading session on the exchange where the security is principally traded, or lacking any sales or official closing price on a particular day, the security may be valued at the closing bid price on that day. Securities traded in theover-the-counter market are valued based on prices furnished by independent pricing services or market makers. When such securities are valued by an independent pricing service they may be considered fair valued. Futures contracts are valued at the final settlement price set by an exchange on which they are principally traded. Listed options are valued at the mean between the last bid and asked prices from the exchange on which they are principally traded. Options not listed on an exchange are valued by an independent source at the mean between the last bid and asked prices. For purposes of determining net asset value (“NAV”) per share, futures and option contracts generally are valued 15 minutes after the close of the customary trading session of the New York Stock Exchange (“NYSE”).
Investments inopen-end andclosed-end registered investment companies that do not trade on an exchange are valued at theend-of-day net asset value per share. Investments inopen-end andclosed-end registered investment companies that trade on an exchange are valued at the last sales price or official closing price as of the close of the customary trading session on the exchange where the security is principally traded.
Swap agreements are fair valued using an evaluated quote, if available, provided by an independent pricing service. Evaluated quotes provided by the pricing service are valued based on a model which may includeend-of-day net present values, spreads, ratings, industry, company performance and returns of referenced assets. Centrally cleared swap agreements are valued at the daily settlement price determined by the relevant exchange or clearinghouse.
Foreign securities’ (including foreign exchange contracts) prices are converted into U.S. dollar amounts using the applicable exchange rates as of the close of the NYSE. If market quotations are available and reliable for foreign exchange-traded equity securities, the securities will be valued at the market quotations. Because trading hours for certain foreign securities end before the close of the NYSE, closing market quotations may become unreliable. If between the time trading ends on a particular security and the close of the customary trading session on the NYSE, events occur that the investment adviser determines are significant and make the closing price unreliable, the Fund may fair value the security. If the event is likely to have affected the closing price of the security, the security will be valued at fair value in good faith using procedures approved by the Board of Trustees. Adjustments to closing prices to reflect fair value may also be based on a screening process of an independent pricing service to indicate the degree of certainty, based on historical data, that the closing price in the principal market where a foreign security trades is not the current value as of the close of the NYSE. Foreign securities’ prices meeting the approved degree of certainty that the price is not reflective of current value will be priced at the indication of fair value from the independent pricing service. Multiple factors may be considered by the independent pricing service in determining adjustments to reflect fair value and may include information relating to sector indices, American Depositary Receipts and domestic and foreign index futures. Foreign securities may have additional risks including exchange rate changes, potential for sharply devalued currencies and high inflation, political and economic upheaval, the relative lack of issuer information, relatively low market liquidity and the potential lack of strict financial and accounting controls and standards.
Securities for which market prices are not provided by any of the above methods may be valued based upon quotes furnished by independent sources. The last bid price may be used to value equity securities. The mean between the last bid and asked prices is used to value debt obligations,
23 INVESCO OPPENHEIMER V.I. TOTAL RETURN BOND FUND
NOTES TO FINANCIAL STATEMENTSUnaudited / Continued
including corporate loans.
Securities for which market quotations are not readily available or became unreliable are valued at fair value as determined in good faith by or under the supervision of the Trust’s officers following procedures approved by the Board of Trustees. Issuer specific events, market trends, bid/ asked quotes of brokers and information providers and other market data may be reviewed in the course of making a good faith determination of a security’s fair value.
The Fund may invest in securities that are subject to interest rate risk, meaning the risk that the prices will generally fall as interest rates rise and, conversely, the prices will generally rise as interest rates fall. Specific securities differ in their sensitivity to changes in interest rates depending on their individual characteristics. Changes in interest rates may result in increased market volatility, which may affect the value and/or liquidity of certain Fund investments.
Valuations change in response to many factors including the historical and prospective earnings of the issuer, the value of the issuer’s assets, general economic conditions, interest rates, investor perceptions and market liquidity. Because of the inherent uncertainties of valuation, the values reflected in the financial statements may materially differ from the value received upon actual sale of those investments.
B. Securities Transactions and Investment Income -Securities transactions are accounted for on a trade date basis. Realized gains or losses on sales are computed on the basis of specific identification of the securities sold. Interest income (net of withholding tax, if any) is recorded on the accrual basis from settlement date. Bond premiums and discounts are amortized and/or accreted over the lives of the respective securities.Pay-in-kind interest income andnon-cash dividend income received in the form of securitiesin-lieu of cash are recorded at the fair value of the securities received. Paydown gains and losses on mortgage and asset-backed securities are recorded as adjustments to interest income. Dividend income (net of withholding tax, if any) is recorded on theex-dividend date. The Fund may periodically participate in litigation related to Fund investments. As such, the Fund may receive proceeds from litigation settlements. Any proceeds received are included in the Statement of Operations as realized gain (loss) for investments no longer held and as unrealized gain (loss) for investments still held.
Brokerage commissions and mark ups are considered transaction costs and are recorded as an increase to the cost basis of securities purchased and/or a reduction of proceeds on a sale of securities. Such transaction costs are included in the determination of net realized and unrealized gain (loss) from investment securities reported in the Statement of Operations and the Statement of Changes in Net Assets and the net realized and unrealized gains (losses) on securities per share in the Financial Highlights. Transaction costs are included in the calculation of the Fund’s net asset value and, accordingly, they reduce the Fund’s total returns. These transaction costs are not considered operating expenses and are not reflected in net investment income reported in the Statement of Operations and the Statement of Changes in Net Assets, or the net investment income per share and the ratios of expenses and net investment income reported in the Financial Highlights, nor are they limited by any expense limitation arrangements between the Fund and the investment adviser.
The Fund allocates income and realized and unrealized capital gains and losses to a class based on the relative net assets of each class.
C. Country Determination- For the purposes of making investment selection decisions and presentation in the Schedule of Investments, the investment adviser may determine the country in which an issuer is located and/or credit risk exposure based on various factors. These factors include the laws of the country under which the issuer is organized, where the issuer maintains a principal office, the country in which the issuer derives 50% or more of its total revenues and the country that has the primary market for the issuer’s securities, as well as other criteria. Among the other criteria that may be evaluated for making this determination are the country in which the issuer maintains 50% or more of its assets, the type of security, financial guarantees and enhancements, the nature of the collateral and the sponsor organization. Country of issuer and/or credit risk exposure has been determined to be the United States of America, unless otherwise noted.
D. Distributions -Dividends and distributions to shareholders, which are determined in accordance with income tax regulations and may differ from U.S. GAAP, are recorded on theex-dividend date. Income distributions, if any, are declared daily and paid monthly. Capital gain distributions, if any, are declared and paid annually or at other times as determined necessary by the Adviser.
The tax character of distributions is determined as of the Fund’s fiscal year end. Therefore, a portion of the Fund’s distributions made to shareholders prior to the Fund’s fiscal year end may ultimately be categorized as a tax return of capital.
E. Federal Income Taxes -The Fund intends to comply with provisions of the Internal Revenue Code applicable to regulated investment companies and to distribute substantially all of its investment company taxable income to shareholders. Therefore, no federal income or excise tax provision is required. The Fund files income tax returns in U.S. federal and applicable state jurisdictions. The statute of limitations on the Fund’s tax return filings generally remains open for the three preceding fiscal reporting period ends. The Fund has analyzed its tax positions for the fiscal year ended December 31, 2018, including open tax years, and does not believe there are any uncertain tax positions requiring recognition in the Fund’s financial statements.
During the fiscal year ended December 31, 2018, the Fund did not utilize anycapital loss carryforwards to offset capital gains realized in that fiscal year. Capital losses will be carried forward to future years if not offset by gains.
At period end, it is estimated that the capital loss carryforwards would be $3,920,769, which will not expire. The estimated capital loss carryforward represents the carryforward as of the end of the last fiscal year, increased or decreased by capital losses or gains realized in the first six months of the current fiscal year. During the reporting period, it is estimated that the Fund will utilize $2,351,503 capital loss carryforward to offset realized capital gains.
Net investment income (loss) and net realized gain (loss) may differ for financial statement and tax purposes. The character of dividends and distributions made during the fiscal year from net investment income or net realized gains are determined in accordance with federal income tax requirements, which may differ from the character of net investment income or net realized gains presented in those financial statements in accordance with U.S. GAAP. Also, due to timing of dividends and distributions, the fiscal year in which amounts are distributed may differ from the fiscal year in which the income or net realized gain was recorded by the Fund.
The aggregate cost of securities and other investments and the composition of unrealized appreciation and depreciation of securities and other
24 INVESCO OPPENHEIMER V.I. TOTAL RETURN BOND FUND
investments for federal income tax purposes at period end are noted in the following table. The primary difference between book and tax appreciation or depreciation of securities and other investments, if applicable, is attributable to the tax deferral of losses or tax realization of financial statement unrealized gain or loss.
| | | | |
| Federal tax cost of securities | | $ | 167,627,166 | |
| Federal tax cost of other investments | | | 9,941,296 | |
| | | | |
| Total federal tax cost | | $ | 177,568,462 | |
| | | | |
| Gross unrealized appreciation | | $ | 4,438,275 | |
| Gross unrealized depreciation | | | (2,456,916) | |
| | | | |
| Net unrealized appreciation | | $ | 1,981,359 | |
| | | | |
F. Expenses -Fees provided for under the Rule12b-1 plan of a particular class of the Fund are charged to the operations of such class.. Transfer agency fees and expenses and other shareholder recordkeeping fees and expenses relating to all other classes are allocated among those classes based on relative net assets. All other expenses are allocated among the classes based on relative net assets.
G. Accounting Estimates -The financial statements are prepared on a basis in conformity with accounting principles generally accepted in the United States of America (“GAAP”), which requires management to make estimates and assumptions that affect the reported amounts of assets and liabilities at the date of the financial statements and the reported amounts of revenues and expenses during the reporting period including estimates and assumptions related to taxation. Actual results could differ from those estimates by a significant amount. In addition, the Fund monitors for material events or transactions that may occur or become known after theperiod-end date and before the date the financial statements are released to print.
H. Indemnifications -Under the Trust’s organizational documents, each Trustee, officer, employee or other agent of the Trust is indemnified against certain liabilities that may arise out of the performance of their duties to the Fund. Additionally, in the normal course of business, the Fund enters into contracts, including the Fund’s servicing agreements, that contain a variety of indemnification clauses. The Fund’s maximum exposure under these arrangements is unknown as this would involve future claims that may be made against the Fund that have not yet occurred. The risk of material loss as a result of such indemnification claims is considered remote.
I. Futures -The Fund may enter into futures contracts to manage exposure to interest rate, equity and market price movements and/or currency risks. A futures contract is an agreement between Counterparties to purchase or sell a specified underlying security, currency or commodity (or delivery of a cash settlement price, in the case of an index future) for a fixed price at a future date. The Fund currently invests only in exchange-traded futures and they are standardized as to maturity date and underlying financial instrument. Initial margin deposits required upon entering into futures contracts are satisfied by the segregation of specific securities or cash as collateral at the futures commission merchant (broker). During the period the futures contracts are open, changes in the value of the contracts are recognized as unrealized gains or losses by recalculating the value of the contracts on a daily basis. Subsequent or variation margin payments are received or made depending upon whether unrealized gains or losses are incurred. These amounts are reflected as receivables or payables on the Statement of Assets and Liabilities. When the contracts are closed or expire, the Fund recognizes a realized gain or loss equal to the difference between the proceeds from, or cost of, the closing transaction and the Fund’s basis in the contract. The net realized gain (loss) and the change in unrealized gain (loss) on futures contracts held during the period is included on the Statement of Operations. The primary risks associated with futures contracts are market risk and the absence of a liquid secondary market. If the Fund were unable to liquidate a futures contract and/or enter into an offsetting closing transaction, the Fund would continue to be subject to market risk with respect to the value of the contracts and continue to be required to maintain the margin deposits on the futures contracts. Futures contracts have minimal Counterparty risk since the exchange’s clearinghouse, as Counterparty to all exchange-traded futures, guarantees the futures against default. Risks may exceed amounts recognized in the Statement of Assets and Liabilities.
J. Swap Agreements - The Fund may enter into various swap transactions, including interest rate, total return, index, currency and credit default swap contracts (“CDS”) for investment purposes or to manage interest rate, currency or credit risk. Such transactions are agreements between Counterparties. A swap agreement may be negotiated bilaterally and tradedover-the-counter (“OTC”) between two parties (“uncleared/OTC”) or, in some instances, must be transacted through a future commission merchant (“FCM”) and cleared through a clearinghouse that serves as a central Counterparty (“centrally cleared swap”). These agreements may contain among other conditions, events of default and termination events, and various covenants and representations such as provisions that require the Fund to maintain apre-determined level of net assets, and/or provide limits regarding the decline of the Fund’s NAV over specific periods of time. If the Fund were to trigger such provisions and have open derivative positions at that time, the Counterparty may be able to terminate such agreement and request immediate payment in an amount equal to the net liability positions, if any.
Interest rate, total return, index, and currency swap agreements aretwo-party contracts entered into primarily to exchange the returns (or differentials in rates of returns) earned or realized on particular predetermined investments or instruments. The gross returns to be exchanged or “swapped” between the parties are calculated with respect to a notional amount, i.e., the return on or increase in value of a particular dollar amount invested at a particular interest rate or return of an underlying asset, in a particular foreign currency, or in a “basket” of securities representing a particular index.
In a centrally cleared swap, the Fund’s ultimate Counterparty is a central clearinghouse. The Fund initially will enter into centrally cleared swaps through an executing broker. When a fund enters into a centrally cleared swap, it must deliver to the central Counterparty (via the FCM) an amount referred to as “initial margin.” Initial margin requirements are determined by the central Counterparty, but an FCM may require additional initial margin above the amount required by the central Counterparty. Initial margin deposits required upon entering into centrally cleared swaps are satisfied by cash or securities as collateral at the FCM. Securities deposited as initial margin are designated on the Schedule of Investments and cash
25 INVESCO OPPENHEIMER V.I. TOTAL RETURN BOND FUND
NOTES TO FINANCIAL STATEMENTSUnaudited / Continued
deposited is recorded on the Statement of Assets and Liabilities. During the term of a cleared swap agreement, a “variation margin” amount may be required to be paid by the Fund or may be received by the Fund, based on the daily change in price of the underlying reference instrument subject to the swap agreement and is recorded as a receivable or payable for variation margin in the Statement of Assets and Liabilities until the centrally cleared swap is terminated at which time a realized gain or loss is recorded.
A CDS is an agreement between Counterparties to exchange the credit risk of an issuer. A buyer of a CDS is said to buy protection by paying a fixed payment over the life of the agreement and in some situations an upfront payment to the seller of the CDS. If a defined credit event occurs (such as payment default or bankruptcy), the Fund as a protection buyer would cease paying its fixed payment, the Fund would deliver eligible bonds issued by the reference entity to the seller, and the seller would pay the full notional value, or the “par value”, of the referenced obligation to the Fund. A seller of a CDS is said to sell protection and thus would receive a fixed payment over the life of the agreement and an upfront payment, if applicable. If a credit event occurs, the Fund as a protection seller would cease to receive the fixed payment stream, the Fund would pay the buyer “par value” or the full notional value of the referenced obligation, and the Fund would receive the eligible bonds issued by the reference entity. In turn, these bonds may be sold in order to realize a recovery value. Alternatively, the seller of the CDS and its Counterparty may agree to net the notional amount and the market value of the bonds and make a cash payment equal to the difference to the buyer of protection. If no credit event occurs, the Fund receives the fixed payment over the life of the agreement. As the seller, the Fund would effectively add leverage to its portfolio because, in addition to its total net assets, the Fund would be subject to investment exposure on the notional amount of the CDS. In connection with these agreements, cash and securities may be identified as collateral in accordance with the terms of the respective swap agreements to provide assets of value and recourse in the event of default under the swap agreement or bankruptcy/insolvency of a party to the swap agreement. If a Counterparty becomes bankrupt or otherwise fails to perform its obligations due to financial difficulties, the Fund may experience significant delays in obtaining any recovery in a bankruptcy or other reorganization proceeding. The Fund may obtain only limited recovery or may obtain no recovery in such circumstances. The Fund’s maximum risk of loss from Counterparty risk, either as the protection seller or as the protection buyer, is the value of the contract. The risk may be mitigated by having a master netting arrangement between the Fund and the Counterparty and by the designation of collateral by the Counterparty to cover the Fund’s exposure to the Counterparty.
Implied credit spreads represent the current level at which protection could be bought or sold given the terms of the existing CDS contract and serve as an indicator of the current status of the payment/performance risk of the CDS. An implied spread that has widened or increased since entry into the initial contract may indicate a deteriorating credit profile and increased risk of default for the reference entity. A declining or narrowing spread may indicate an improving credit profile or decreased risk of default for the reference entity. Alternatively, credit spreads may increase or decrease reflecting the general tolerance for risk in the credit markets.
An interest rate swap is an agreement between Counterparties pursuant to which the parties exchange a floating rate payment for a fixed rate payment based on a specified notional amount.
Changes in the value of centrally cleared and OTC swap agreements are recognized as unrealized gains (losses) in the Statement of Operations by “marking to market” on a daily basis to reflect the value of the swap agreement at the end of each trading day. Payments received or paid at the beginning of the agreement are reflected as such on the Statement of Assets and Liabilities and may be referred to as upfront payments. The Fund accrues for the fixed payment stream and amortizes upfront payments, if any, on swap agreements on a daily basis with the net amount, recorded as a component of realized gain (loss) on the Statement of Operations. A liquidation payment received or made at the termination of a swap agreement is recorded as realized gain (loss) on the Statement of Operations. The Fund segregates cash or liquid securities having a value at least equal to the amount of the potential obligation of a Fund under any swap transaction. Cash held as collateral is recorded as deposits with brokers on the Statement of Assets and Liabilities. Entering into these agreements involves, to varying degrees, lack of liquidity and elements of credit, market, and Counterparty risk in excess of amounts recognized on the Statement of Assets and Liabilities. Such risks involve the possibility that a swap is difficult to sell or liquidate; the Counterparty does not honor its obligations under the agreement and unfavorable interest rates and market fluctuations. It is possible that developments in the swaps market, including potential government regulation, could adversely affect the Fund’s ability to terminate existing swap agreements or to realize amounts to be received under such agreements. A short position in a security poses more risk than holding the same security long. As there is no limit on how much the price of the security can increase, the Fund’s exposure is unlimited.
Notional amounts of each individual credit default swap agreement outstanding as of June 30, 2019 for which the Fund is the seller of protection are disclosed in the open swap agreements table. These potential amounts would be partially offset by any recovery values of the respective referenced obligations, upfront payments received upon entering into the agreement, or net amounts received from the settlement of buy protection credit default swap agreements entered into by the Fund for the same referenced entity or entities.
K. Securities on a When-Issued or Delayed Delivery Basis -The Fund may purchase securities on a “when-issued” basis, and may purchase or sell securities on a “delayed delivery” basis, with payment and delivery scheduled for a future date. No income accrues to the Fund on the securities in connection with such transactions prior to the date the Fund actually takes delivery of the securities. These transactions are subject to market fluctuations and are subject to the risk that the value at delivery may be more or less than the trade date purchase price. Although the Fund will generally purchase these securities with the intention on acquiring such securities, they may sell such securities prior to the settlement date.
L. Dollar Rolls and Forward Commitment Transactions -The Fund may enter into dollar roll transactions to enhance the Fund’s performance. The Fund executes its dollar roll transactions in the to be announced (“TBA”) market whereby the Fund makes a forward commitment to purchase a security and, instead of accepting delivery, the position is offset by the sale of the security with a simultaneous agreement to repurchase at a future date.
The Fund accounts for dollar roll transactions as purchases and sales and realizes gains and losses on these transactions. The Fund will segregate liquid assets in an amount equal to its dollar roll commitments. Dollar roll transactions involve the risk that a Counterparty to the transaction may fail to complete the transaction. If this occurs, the Fund may lose the opportunity to purchase or sell the security at the agreed upon price. Dollar roll
26 INVESCO OPPENHEIMER V.I. TOTAL RETURN BOND FUND
transactions also involve the risk that the value of the securities retained by the Fund may decline below the price of the securities that the Fund has sold but is obligated to purchase under the agreement. Dollar roll transactions covered in this manner are not treated as senior securities for purposes of a Fund’s fundamental investment limitation on senior securities and borrowings.
M. Leverage Risk -Leverage exists when the Fund can lose more than it originally invests because it purchases or sells an instrument or enters into a transaction without investing an amount equal to the full economic exposure of the instrument or transaction.
N. Collateral- To the extent the Fund has designated or segregated a security as collateral and that security is subsequently sold, it is the Fund’s practice to replace such collateral no later than the next business day.
Note 2 - Advisory Fees and Other Fees Paid to Affiliates
The Trust has entered into a master investment advisory agreement with Invesco Advisers, Inc. (the “Adviser” or “Invesco”). Under the terms of the investment advisory agreement, the Fund accrues daily and pays monthly an advisory fee to the Adviser based on the annual rate of the Fund’s average daily net assets as follows:
| | | | |
| Fee Schedule* | | | |
| Up to $1 billion | | | 0.60% | |
| Over $1 billion | | | 0.50 | |
* The advisory fee paid by the Fund shall be reduced by any amounts paid by the Fund under the administrative services agreement with the Adviser.
For the six months ended June 30, 2019, the effective advisory fees incurred by the Fund were 0.60%.
From the beginning of the fiscal period until the date of the Reorganization, the Acquired Fund paid $295,210in advisory fees to OFI Global Asset Management, Inc. based on the annual rates above of the Acquired Fund’s average daily net assets.
Under the terms of a mastersub-advisory agreement between the Adviser and each of Invesco Asset Management Deutschland GmbH, Invesco Asset Management Limited, Invesco Asset Management (Japan) Limited, Invesco Hong Kong Limited, Invesco Senior Secured Management, Inc. and Invesco Canada Ltd. and separatesub-advisory agreements with Invesco Capital Management LLC, and Invesco Asset Management (India) Private Limited (collectively, the “AffiliatedSub-Advisers”) the Adviser, not the Fund, will pay 40% of the fees paid to the Adviser to any such AffiliatedSub-Adviser(s) that provide(s) discretionary investment management services to the Fund based on the percentage of assets allocated to suchSub-Adviser(s). Invesco has also entered into aSub-Advisory Agreement with OppenheimerFunds, Inc. to provide discretionary management services to the Funds.
Effective on the Reorganization Date, the Adviser has contractually agreed, through at least May 31, 2021, to waive advisory fees and/or reimburse expenses of all shares to the to the extent necessary to limit the total annual fund operating expenses after fee waiver and/or expense reimbursement (excluding certain items discussed below) ofSeries I and Series II shares to 0.75% and 1.00%, respectively, of the Fund’s average daily net assets (the “expense limits”). In determining the Adviser’s obligation to waive advisory fees and/or reimburse expenses, the following expenses are not taken into account, and could cause total annual fund operating expenses after fee waivers and/or expense reimbursement to exceed the numbers reflected above: (1) interest; (2) taxes; (3) dividend expenses on short sales; (4) extraordinary ornon-routine items, including litigation expenses; and (5) expenses that the Fund has incurred but did not actually pay because of an expense offset arrangement. Unless Invesco continues the fee waiver agreement, it will terminate May 31, 2021. During its term, the fee waiver agreement cannot be terminated or amended to increase the expense limits or reduce the advisory fee waiver without approval of the Board of Trustees.
Further, the Adviser has contractually agreed, through at least June 30, 2021, to waive the advisory fee payable by the Fund in an amount equal to 100% of the net advisory fees the Adviser receives from the affiliated money market funds on investments by the Fund of uninvested cash in such affiliated money market funds.
For the six monthsended June 30, 2019, the Adviser waived advisory fees of $2,218 and reimbursed fund expenses of $42,666 and $30,316 of Series I and Series II shares, respectively.
Prior to the Reorganization, the OFI Global Asset Management, Inc. had contractually agreed to waive fees and/or reimburse expenses of Series I and Series II shares to 0.75% and 1.00%,respectively, of the Acquired Fund’s average daily net assets.
The Trust has entered into a master administrative services agreement with Invesco pursuant to which the Fund has agreed to pay Invesco for certain administrative costs incurred in providing accounting services to the Fund. For the six months ended June 30, 2019, expenses incurred under the agreement are shown in the Statement of Operations as Administration fees. Additionally, Invesco has entered into service agreements whereby JPMorgan Chase Bank serves as custodian to the Fund. Prior to the Reorganization, the Acquired Fund paid administrative fees to OFI Global Asset Management, Inc.
The Trust has entered into a transfer agency and service agreement with Invesco Investment Services, Inc. (“IIS”) pursuant to which the Fund has agreed to pay IIS a fee for providing transfer agency and shareholder services to the Fund and reimburse IIS for certain expenses incurred by IIS in the course of providing such services. IIS may make payments to intermediaries that provide omnibus account services,sub-accounting services and/or networking services. All fees payable by IIS to intermediaries that provide omnibus account services orsub-accounting services are charged back to the Fund, subject to certain limitations approved by the Trust’s Board of Trustees. Prior to the Reorganization, the Acquired Fund paid transfer agent fees to OFI Global Asset Management, Inc. and Shareholder Services, Inc. For the six months ended June 30, 2019, expenses incurred under these agreements are shown in the Statement of Operations as Transfer and shareholder servicing agent fees.
The Trust has entered into master distribution agreements with Invesco Distributors, Inc. (“IDI”) to serve as the distributor for the Service II shares of the Fund. The Trust has adopted a plan pursuant to Rule12b-1 under the 1940 Act with respect to the Fund’s Service II shares (the “Plan”). The
27 INVESCO OPPENHEIMER V.I. TOTAL RETURN BOND FUND
NOTES TO FINANCIAL STATEMENTSUnaudited / Continued
Fund, pursuant to the Plan, pays IDI at an annual rate of 0.25% of the average daily net assets of Service II shares. The fees are accrued daily and paid monthly. Of the Plan payments, up to 0.25% of the average daily net assets of the class of shares may be paid to furnish continuing personal shareholder services to customers who purchase and own shares of such class. Any amounts not paid as a service fee under the Plan would constitute an asset-based sales charge. Rules of the Financial Industry Regulatory Authority (“FINRA”) impose a cap on the total sales charges, including asset-based sales charges, that may be paid by any class of shares of the Fund plans. Prior to the Reorganization, the Acquired Fund paid distribution fees to OppenheimerFunds Distributor, Inc. For the six months ended June 30, 2019, expenses incurred under the plans are shown in the Statement of Operations as Distribution and service plan fees.
Certain officers and trustees of the Trust are officers and directors of the Adviser, IIS and/or IDI.
Note 3 - Additional Valuation Information
GAAP defines fair value as the price that would be received to sell an asset or paid to transfer a liability in an orderly transaction between market participants at the measurement date, under current market conditions. GAAP establishes a hierarchy that prioritizes the inputs to valuation methods, giving the highest priority to readily available unadjusted quoted prices in an active market for identical assets (Level 1) and the lowest priority to significant unobservable inputs (Level 3), generally when market prices are not readily available or are unreliable. Based on the valuation inputs, the securities or other investments are tiered into one of three levels. Changes in valuation methods may result in transfers in or out of an investment’s assigned level:
Level 1 — Prices are determined using quoted prices in an active market for identical assets.
Level 2 — Prices are determined using other significant observable inputs. Observable inputs are inputs that other market participants may use in pricing a security. These may include quoted prices for similar securities, interest rates, prepayment speeds, credit risk, yield curves, loss severities, default rates, discount rates, volatilities and others.
Level 3 — Prices are determined using significant unobservable inputs. In situations where quoted prices or observable inputs are unavailable (for example, when there is little or no market activity for an investment at the end of the period), unobservable inputs may be used. Unobservable inputs reflect the Fund’s own assumptions about the factors market participants would use in determining fair value of the securities or instruments and would be based on the best available information.
The following is a summary of the tiered valuation input levels, as of June 30, 2019. The level assigned to the securities valuations may not be an indication of the risk or liquidity associated with investing in those securities. Because of the inherent uncertainties of valuation, the values reflected in the financial statements may materially differ from the value received upon actual sale of those investments.
| | | | | | | | | | | | | | | | |
| | | Level 1— Unadjusted
Quoted Prices | | | Level 2—
Other Significant
Observable Inputs | | | Level 3— Significant
Unobservable
Inputs | | | Value | |
| Assets Table | | | | | | | | | | | | | | | | |
| Investments, at Value: | | | | | | | | | | | | | | | | |
| Asset-Backed Securities | | $ | — | | | $ | 17,545,927 | | | $ | — | | | $ | 17,545,927 | |
| Mortgage-Backed Obligations | | | — | | | | 61,812,068 | | | | 18,871 | | | | 61,830,939 | |
| Corporate Bonds and Notes | | | — | | | | 58,291,584 | | | | — | | | | 58,291,584 | |
| Short-Term Notes | | | — | | | | 10,351,254 | | | | — | | | | 10,351,254 | |
| Investment Company | | | 21,493,442 | | | | — | | | | — | | | | 21,493,442 | |
| Total Investments, at Value | | | 21,493,442 | | | | 148,000,833 | | | | 18,871 | | | | 169,513,146 | |
| Other Financial Instruments: | | | | | | | | | | | | | | | | |
| Futures contracts | | | 536,772 | | | | — | | | | — | | | | 536,772 | |
| Total Assets | | $ | 22,030,214 | | | $ | 148,000,833 | | | $ | 18,871 | | | $ | 170,049,918 | |
| | | | |
| Liabilities Table | | | | | | | | | | | | | | | | |
| Other Financial Instruments: | | | | | | | | | | | | | | | | |
| Swaps, at value | | $ | — | | | $ | (399,169 | ) | | $ | — | | | $ | (399,169 | ) |
| Futures contracts | | | (42,224 | ) | | | — | | | | — | | | | (42,224 | ) |
| Total Liabilities | | $ | (42,224 | ) | | $ | (399,169 | ) | | $ | — | | | $ | (441,393 | ) |
Forward currency exchange contracts and futures contracts, if any, are reported at their unrealized appreciation/depreciation at measurement date, which represents the change in the contract’s value from trade date. All additional assets and liabilities included in the above table are reported at their market value at measurement date.
Note 4 - Security Transactions with Affiliated Funds
The Fund is permitted to purchase or sell securities from or to certain other Invesco Funds under specified conditions outlined in procedures adopted by the Board of Trustees of the Trust. The procedures have been designed to ensure that any purchase or sale of securities by the Fund from or to another fund or portfolio that is or could be considered an affiliate by virtue of having a common investment adviser (or affiliated investment advisers), common Trustees and/or common officers complies with Rule17a-7 of the 1940 Act. Further, as defined under the procedures, each transaction is effected at the current market price. Pursuant to these procedures for the period January 1, 2019 to May 24, 2019,the Predecessor Fund engaged in transactions with affiliates as listed: Securities purchases of $239,711 and securities sales of $119,907, which resulted in net realized losses of $4,165. For the period May
28 INVESCO OPPENHEIMER V.I. TOTAL RETURN BOND FUND
25, 2019 to June 30, 2019, the Fund did not engage in transactions with affiliates.
Note 5 - Derivative Investments
The Fund may enter into an International Swaps and Derivatives Association Master Agreement (“ISDA Master Agreement”) under which a fund may trade OTC derivatives. An OTC transaction entered into under an ISDA Master Agreement typically involves a collateral posting arrangement, payment netting provisions andclose-out netting provisions. These netting provisions allow for reduction of credit risk through netting of contractual obligations. The enforceability of the netting provisions of the ISDA Master Agreement depends on the governing law of the ISDA Master Agreement, among other factors. For financial reporting purposes, the Fund does not offset OTC derivative assets or liabilities that are subject to ISDA Master Agreements in the Statement of Assets and Liabilities.
Offsetting Assets and Liabilities
The table below reflects the Fund’s exposure to Counterparties subject to either an ISDA Master Agreement or other agreement for OTC derivative liability transactions as of June 30, 2019:
| | | | | | | | | | | | | | | | | | | | |
| | | | | | Gross Amounts Not Offset in the Statement of Assets & Liabilities | | | | |
| Counterparty | | Gross Amounts
Not Offset in
the Statement
of Assets &
Liabilities* | | | Financial
Instruments
Available for
Offset | | | Financial
Instruments
Collateral
Pledged** | | | Cash Collateral
Pledged** | | | Net Amount | |
| Goldman Sachs Bank USA | | $ | (399,169 | ) | | $ | – | | | $ | – | | | $ | – | | | $ | (399,169 | ) |
*OTC derivatives are reported gross on the Statement of Assets and Liabilities. Exchange traded options and margin related to centrally cleared swaps and futures, if any, are excluded from these reported amounts.
**Reported collateral pledged within this table is limited to the net outstanding amount due from the Fund. The securities pledged as collateral by the Fund as reported on the Statement of Investments may exceed these amounts.
Value of Derivative Instruments atPeriod-End
The table below reflects the Fund’s exposure to Counterparties subject to either an ISDA Master Agreement or other agreement for OTC derivative liability transactions as of June 30, 2019:
| | | | | | | | | | | | | | |
| | | Asset Derivatives | | | Liability Derivatives | |
Derivatives Not Accounted for as Hedging Instruments | | Statement of Assets and Liabilities Location | | Value | | | Statement of Assets
and Liabilities Location | | | Value | |
| | | | | | | Swaps, at value | | | $ | 399,169 | |
| Interest Rate contracts Variation margin receivable | | $ | 3,094 | * | | | Variation margin payable | | | | 14,125 | * |
| Total | | $ | 3,094 | | | | | | | $ | 413,294 | |
| | | | | | | | | | | | |
*Includes only the current day’s variation margin. Prior variation margin movements have been reflected in cash on the Statement of Assets and Liabilities upon receipt or payment.
Effect of Derivative Investments for the Six Months Ended June 30, 2019
The tables below summarizes the gains (losses) on derivative investments, detailed by primary risk exposure, recognized in earnings during the period:
| | | | | | | | | | | | |
| Amount of Realized Gain or (Loss) Recognized on Derivatives | |
Derivatives Not Accounted for as Hedging Instruments | | Futures
contracts | | | Swap contracts | | | Total | |
| Credit contracts | | $ | — | | | $ | 36,519 | | | $ | 36,519 | |
| Interest rate contracts | | | 1,012,261 | | | | — | | | | 1,012,261 | |
| Total | | $ | 1,012,261 | | | $ | 36,519 | | | $ | 1,048,780 | |
| | | | | | | | | | | | |
29 INVESCO OPPENHEIMER V.I. TOTAL RETURN BOND FUND
NOTES TO FINANCIAL STATEMENTSUnaudited / Continued
| | | | | | | | | | | | |
| Amount of Change in Unrealized Gain or (Loss) Recognized on Derivatives | |
Derivatives Not Accounted for as Hedging Instruments | | Futures
contracts | | | Swap
contracts | | | Total | |
| Credit contracts | | $ | — | | | $ | (399,169) | | | $ | (399,169) | |
| Interest rate contracts | | | 87,700 | | | | — | | | | 87,700 | |
| Total | | $ | 87,700 | | | $ | (399,169) | | | $ | (311,469) | |
| | | | | | | | | | | | |
The table below summarizes the six month average notional value of futures contracts and the four month average notional value of swap contracts outstanding during the period.
| | | | | | | | |
| | | Futures
contracts | | | Swap
contracts | |
| Average notional value | | $ | 29,502,702 | | | $ | 5,188,809 | |
Note 6 - Expense Offset Arrangement
The expense offset arrangement is comprised of custodian credits which result from periodic overnight cash balances at the custodian. For thesix monthsended June 30, 2019, the Fund received credits from this arrangement, which resulted in the reduction of the Fund’s total expenses of $608.
Note 7 - Trustee and Officer Fees and Benefits
Certain trustees have executed a Deferred Compensation Agreement pursuant to which they have the option to elect to defer receipt of all or a portion of the annual compensation they are entitled to receive from the Fund. For purposes of determining the amount owed to the Trustees under the plan, deferred amounts are treated as though equal dollar amounts had been invested in shares of the Fund or in other Invesco and/or Invesco Oppenheimer funds selected by the Trustees. The Fund purchases shares of the funds selected for deferral by the Trustees in amounts equal to his or her deemed investment, resulting in a Fund asset equal to the deferred compensation liability. Such assets are included as a component of “Other” within the asset section of the Statement of Assets and Liabilities. Deferral of Trustees’ fees under the plan will not affect the net assets of the Fund and will not materially affect the Fund’s assets, liabilities or net investment income per share. Amounts will be deferred until distributed in accordance with the compensation deferral plan.
Note 8 - Cash Balances
The Fund is permitted to temporarily carry a negative or overdrawn balance in its account with JPMorgan Chase Bank, the custodian bank. Such balances, if any atperiod-end, are shown in the Statement of Assets and Liabilities under the payable caption Amount due custodian. To compensate the custodian bank for such overdrafts, the overdrawn Fund may either (1) leave funds as a compensating balance in the account so the custodian bank can be compensated by earning the additional interest; or (2) compensate by paying the custodian bank at a rate agreed upon by the custodian bank and Invesco, not to exceed the contractually agreed upon rate.
Note 9 - Investment Transactions
The aggregate amount of investment securities (other than short-term securities, U.S. Treasury obligations and money market funds, if any) purchased and sold by the Fund during thesix monthsended June 30, 2019 was $36,463,971 and $54,360,887, respectively.
Note 10 - Share Information
Transactions in shares of beneficial interest were as follows:
| | | | | | | | | | | | | | | | |
| | | Six Months Ended June 30, 20191 | | | Year Ended December 31, 2018 | |
| | | Shares | | | Amount | | | Shares | | | Amount | |
| Series I Shares | | | | | | | | | | | | | | | | |
| Sold | | | 394,029 | | | $ | 3,038,125 | | | | 1,820,955 | | | $ | 14,050,401 | |
| Dividends and/or distributions reinvested | | | 320,278 | | | | 2,462,939 | | | | 353,708 | | | | 2,617,442 | |
| Redeemed | | | (1,160,150 | ) | | | (8,906,987 | ) | | | (2,572,646 | ) | | | (19,710,946 | ) |
| Net decrease | | | (445,843 | ) | | $ | (3,405,923 | ) | | | (397,983 | ) | | $ | (3,043,103 | ) |
| | | | | | | | | | | | | | | | |
| | | | | | | | | | | | | | | | | |
30 INVESCO OPPENHEIMER V.I. TOTAL RETURN BOND FUND
| | | | | | | | | | | | | | | | |
| | | Six Months Ended June 30, 20191 | | | Year Ended December 31, 2018 | |
| | | Shares | | | Amount | | | Shares | | | Amount | |
| Series II Shares | | | | | | | | | | | | | | | | |
| Sold | | | 1,602,922 | | | $ | 12,136,902 | | | | 1,451,512 | | | $ | 10,711,237 | |
| Dividends and/or distributions reinvested | | | 224,294 | | | | 1,702,386 | | | | 202,701 | | | | 1,481,742 | |
| Redeemed | | | (1,007,151 | ) | | | (7,659,985 | ) | | | (1,978,329 | ) | | | (14,681,878 | ) |
| | | | |
Net increase (decrease) | | | 820,065 | | | $ | 6,179,303 | | | | (324,116 | ) | | $ | (2,488,899 | ) |
| | | | |
1. There are entities that are record owners of more than 5% of the outstanding shares of the Fund and own 59% of the outstanding shares of the Fund. The Fund and the Fund’s principal underwriter or adviser, are parties to participation agreements with these entities whereby these entities sell units of interest in separate accounts funding variable products that are invested in the Fund. The Fund, Invesco and/or Invesco affiliates may make payments to these entities, which are considered to be related to the Fund, for providing services to the Fund, Invesco and/or Invesco affiliates, including, but not limited to services such as securities brokerage, distribution, third party record keeping and account servicing. The Fund has no knowledge as to whether all or any portion of the shares owned of record by these entities are also owned beneficially.
In addition, 14% of the outstanding shares of the Fund are owned by the Adviser or an affiliate of the Adviser.
Note 11 - Borrowings
Joint Credit Facility.A number of mutual funds managed by the Adviser participate in a $1.95 billion revolving credit facility (the “Facility”) intended to provide short-term financing, if necessary, subject to certain restrictions in connection with atypical redemption activity. Expenses and fees related to the Facility are paid by the participating funds and are disclosed separately or as other expenses on the Statement of Operations. The Fund did not utilize the Facility during the reporting period. The Facility terminated May 24, 2019.
Note 12 - Independent Registered Public Accounting Firm
The Audit Committee of the Board of Trustees appointed, and the Board of Trustees ratified and approved, PricewaterhouseCoopers LLP (“PWC”) as the independent registered public accounting firm of the Fund for the fiscal periods ending after May 24, 2019. Prior to the close of business on May 24, 2019, the Predecessor Fund was a separate series of an unaffiliated investment company and its financial statements were audited by a different independent registered public accounting firm (the “Prior Auditor”).
Effective after the close of business on May 24, 2019, the Prior Auditor resigned as the independent registered public accounting firm of the Fund. The Prior Auditor’s report on the financial statements of the Predecessor Fund for the past two fiscal years did not contain an adverse or disclaimer of opinion, and was not qualified or modified as to uncertainty, audit scope or accounting principles. During the Predecessor Fund’s two most recent fiscal years and through the close of business on May 24, 2019, there were no (1) disagreements with the Prior Auditor on any matter of accounting principles or practices, financial statement disclosure, or auditing scope or procedure, which disagreements, if not resolved to the Prior Auditor’s satisfaction, would have caused it to make reference to that matter in connection with its report; or (2) “reportable events,” as that term is defined in Item 304(a)(1)(v) of RegulationS-K under the Securities Exchange Act of 1934.
31 INVESCO OPPENHEIMER V.I. TOTAL RETURN BOND FUND
APPROVAL OF INVESTMENT ADVISORY ANDSUB-ADVISORY CONTRACTSUnaudited
At meetings held on December 14, 2018, the Board of Trustees (the Board or the Trustees) of AIM Variable Insurance Funds (Invesco Variable Insurance Funds) (the Trust) as a whole, and the independent Trustees, who comprise over 75% of the Board, voting separately, approved (i) an amendment to the Trust’s Master Investment Advisory Agreement with Invesco Advisers, Inc. (Invesco Advisers and the investment advisory agreement) to add Invesco Oppenheimer V.I. Total Return Bond Fund (the Fund), (ii) an amendment to the Master IntergroupSub-Advisory Contract for Mutual Funds with Invesco Asset Management Deutschland GmbH, Invesco Asset Management Limited, Invesco Asset Management (Japan) Limited, Invesco Hong Kong Limited, Invesco Senior Secured Management, Inc. and Invesco Canada Ltd. to add the Fund, (iii) an amendment to the separatesub-advisory contract with Invesco Capital Management LLC to add the Fund, (iv) an amendment to the separatesub-advisory contract with Invesco Asset Management (India) Private Limited to add the Fund, and (v) an initialsub-advisory contract with OppenheimerFunds, Inc. (collectively, the AffiliatedSub-Advisers and thesub-advisory contracts). Additionally, on March 26, 2019, the Boardre-approved an initialsub-advisory contract with OppenheimerFunds, Inc. following its change of control as a result of the acquisition of OppenheimerFunds, Inc. and its subsidiaries, including the Oppenheimer mutual funds (each, an Oppenheimer Fund), by Invesco Ltd. (the OFI Transaction). After evaluating the factors discussed below, among others, the Board approved the Fund’s investment advisory agreement and thesub-advisory contracts and determined that the compensation payable by the Fund to Invesco Advisers and by Invesco Advisers to the AffiliatedSub-Advisers is fair and reasonable.
The Board’s Evaluation Process
The Board noted that it had previously approved establishing the Fund at the Board meeting held on October 23, 2018 and that the Fund was formed to acquire the assets and liabilities of an Oppenheimer Fund (the Acquired Fund) with the same investment objective and substantially similar principal investment strategies and risks. At the time of approval, the Fund had no assets and no performance history and the portfolio managers were not employed by Invesco Advisers or any of the AffiliatedSub-Advisers except OppenheimerFunds, Inc., which was not affiliated with Invesco at that time.
In approving the investment advisory agreement andsub-advisory contracts, the Board followed a process similar to the process that it follows in annually reviewing and approving investment advisory agreements andsub-advisory contracts for the series portfolios of funds advised by Invesco Advisers and considered the information provided in the most recent annual review process for those funds as well as the information provided with respect to the Fund. As part of the approval process, the Board reviewed and considered information provided in response to detailed requests for information submitted to management by the independent Trustees with assistance from legal counsel to the independent Trustees. The Board reviewed comparative investment performance and fee data prepared by Invesco Advisers and an independent mutual fund data provider. The Board was assisted in its review by the Senior Officer, an officer of the Invesco Funds who reports directly to the independent Trustees, and by independent legal counsel.
The discussion below serves as a summary of the material factors and related conclusions that formed the basis for the Board’s approval of the Fund’s investment advisory agreement andsub-advisory contracts. The Trustees’ review and conclusions are based on the comprehensive consideration of all information presented to them and are not the result of any single determinative factor. Moreover, one Trustee may have weighed a particular piece of information or factor differently than another Trustee. This information is current as of December 14, 2018 and March 26, 2019 for thesub-advisory contract with OppenheimerFunds, Inc.
Factors and Conclusions and Summary of Independent Written Fee Evaluation
A. Nature, Extent and Quality of Services Provided by Invesco Advisers and the AffiliatedSub-Advisers
The Board reviewed the nature, extent and quality of the advisory services to be provided to the Fund by Invesco Advisers under the Fund’s investment advisory agreement, and the credentials and experience of the officers and employees of Invesco Advisers who will provide these services. The Board’s review included consideration of the investment process oversight and structure, credit analysis and investment risk management to be employed in providing advisory services to the Fund. The Board also considerednon-advisory services that Invesco Advisers and its affiliates provide to the Invesco Funds and will provide to the Fund, such as various back office support functions, third party oversight, internal audit, valuation, portfolio trading and legal and compliance. The Board also received and reviewed information about Invesco Advisers’ role as administrator of the Invesco Funds’ liquidity risk management program. The Board also reviewed and considered the benefits to shareholders of investing in a fund that is part of the Invesco family of funds under the umbrella of Invesco Ltd., Invesco Advisers’ parent company, and noted Invesco Ltd.’s depth and experience in conducting an investment management business, as well as its commitment of financial and other resources to such business. The Board reviewed and considered information about the resources that Invesco Advisers intends to continue to commit to managing the Invesco family of funds, including the Fund, following the OFI Transaction. The Board concluded that the nature, extent and quality of the services to be provided to the Fund by Invesco Advisers are appropriate and satisfactory.
The Board reviewed the services that may be provided by the AffiliatedSub-Advisers under thesub-advisory contracts and the credentials and experience of the officers and employees of the AffiliatedSub-Advisers who provide these services. The Board noted the AffiliatedSub-Advisers’ expertise with respect to certain asset classes and that the AffiliatedSub-Advisers have offices and personnel that are located in financial centers around the world. As a result, the Board noted that the AffiliatedSub-Advisers can provide research and investment analysis on the markets and economies of various countries in which the Fund may invest, make recommendations regarding securities and assist with security trades. The Board concluded that thesub-advisory contracts may benefit the Fund and its shareholders by permitting Invesco Advisers to use the resources and talents of the AffiliatedSub-Advisers in managing the Fund. The Board concluded that the nature, extent and quality of the services that may be provided by the AffiliatedSub-Advisers are appropriate and satisfactory.
32 INVESCO OPPENHEIMER V.I. TOTAL RETURN BOND FUND
APPROVAL OF INVESTMENT ADVISORY ANDSUB-ADVISORY CONTRACTSUnaudited / Continued
B. Fund Investment Performance
The Board noted that the Fund would continue the historical performance information of the Acquired Fund following the consummation of the OFI Transaction. The Board considered the performance of the Acquired Fund and the fact that, at the closing of the OFI Transaction, management anticipates that the Fund will be managed pursuant to substantially similar investment strategies and by substantially the same portfolio management team as managed the Acquired Fund. The Board did not view Fund performance as a relevant factor in considering whether to approve thesub-advisory contracts for the Fund, as no AffiliatedSub-Adviser currently manages assets of the Fund.
The Board compared the Fund’s investment performance over multiple time periods ending December 31, 2017 to the performance of funds in the Morningstar performance universe and against the Fund’s benchmark index. The Trustees also reviewed more recent Fund performance and this review did not change their conclusions.
C. Advisory andSub-Advisory Fees and Fund Expenses
The Board compared the Fund’s contractual management fee rate to the contractual management fee rates of funds in the Fund’s Morningstar expense group. The Board also considered comparative information regarding the Fund’s total expense ratio and its various components.
The Board noted that Invesco Advisers has contractually agreed to waive fees and/or limit expenses of the Fund for at least two years from the closing date of the OFI Transaction in an amount necessary to limit total annual operating expenses to a specified percentage of average daily net assets for each class of the Fund.
The Board noted that Invesco Advisers and the AffiliatedSub-Advisers do not manage other similarly managed mutual funds or client accounts.
The Board also considered the services that may be provided by the AffiliatedSub-Advisers pursuant to thesub-advisory contracts, as well as the fees payable by Invesco Advisers to the AffiliatedSub-Advisers pursuant to thesub-advisory contracts.
D. Economies of Scale and Breakpoints
The Board considered the extent to which there may be economies of scale in the provision of advisory services to the Fund. The Board considered Invesco’s reinvestment in its business, including investments in business infrastructure and cybersecurity. The Board also considered that the Fund may benefit from economies of scale through contractual breakpoints in the Fund’s advisory fee schedule, which generally operate to reduce the Fund’s expense ratio as it grows in size. The Board noted that the Fund will share directly in economies of scale through lower fees charged by third party service providers based on the combined size of the Invesco Funds. The Board noted that the Fund may also benefit from economies of scale through initial fee setting, fee waivers and expense reimbursements.
E. Profitability and Financial Resources
The Board reviewed information from the 2018 contract renewal process provided by Invesco Advisers concerning the costs of the advisory and other services that Invesco Advisers and its affiliates provide to the Invesco Funds and the profitability of Invesco Advisers and its affiliates in providing these services. The Board considered the methodology used for calculating profitability and noted the periodic review of such methodology by an independent consultant. The Board noted that Invesco Advisers will continue to operate at a net profit from services Invesco Advisers and its affiliates provide to the Invesco Funds. The Board did not deem the level of profits realized by Invesco Advisers and its affiliates from providing services to the Invesco Funds, and the profits estimated to be realized by the Fund, to be excessive given the nature, extent and quality of the services provided. The Board received information from Invesco Advisers demonstrating that Invesco Advisers and the AffiliatedSub-Advisers are financially sound and have the resources necessary to perform their obligations under the investment advisory agreement andsub-advisory contracts.
F. Collateral Benefits to Invesco Advisers and its Affiliates
The Board considered various other benefits to be received by Invesco Advisers and its affiliates from the relationship with the Fund, including the fees to be received for providing administrative, transfer agency and distribution services to the Fund. The Board considered the performance of Invesco Advisers and its affiliates in providing these services to other Invesco Funds and the organizational structure employed to provide these services. The Board also considered that these services will be provided to the Fund pursuant to written contracts that are reviewed and approved on an annual basis by the Board; and that the services are required for the operation of the Fund.
The Board considered the benefits realized by Invesco Advisers and the AffiliatedSub-Advisers as a result of portfolio brokerage transactions executed through “soft dollar” arrangements. Invesco Advisers noted that the Fund will not execute brokerage transaction through “soft dollar” arrangements to any significant degree.
The Board considered that the Fund’s uninvested cash and cash collateral from any securities lending arrangements may be invested in money market funds advised by Invesco Advisers pursuant to procedures approved by the Board. The Board considered that Invesco Advisers will receive advisory fees from these affiliated money market funds attributable to such investments, although Invesco Advisers has contractually agreed to waive through varying periods the advisory fees payable by the Invesco Funds with respect to certain investments in the affiliated money market funds. The waiver is in an amount equal to 100% of the net advisory fee Invesco Advisers will receive from the affiliated money market funds with respect to the Fund’s investment in the affiliated money market funds of uninvested cash, but not cash collateral. The Board concluded that the amount of advisory fees to be received by Invesco Advisers from the Fund’s investment of cash collateral from any securities lending arrangements in the affiliated money market funds is fair and
33 INVESCO OPPENHEIMER V.I. TOTAL RETURN BOND FUND
APPROVAL OF INVESTMENT ADVISORY ANDSUB-ADVISORY CONTRACTSUnaudited / Continued
reasonable.
34 INVESCO OPPENHEIMER V.I. TOTAL RETURN BOND FUND
PORTFOLIO PROXY VOTING POLICIES AND GUIDELINES; UPDATES TO STATEMENT OF
INVESTMENTSUnaudited
Go paperless with eDelivery
Visit invesco.com/edelivery to enjoy the convenience and security of anytime electronic access to your investment documents.
With eDelivery, you can elect to have any or all of the following materials delivered straight to your inbox to download, save and print from your own computer:
• Fund reports and prospectuses
• Quarterly statements
• Daily confirmations
• Tax forms
Invesco mailing information
Send general correspondence to Invesco Investment Services, Inc., P.O. Box 219078, Kansas City, MO 64121-9078.
Important notice regarding delivery of security holder documents
To reduce Fund expenses, only one copy of most shareholder documents may be mailed to shareholders with multiple accounts at the same address (Householding). Mailing of your shareholder documents may be householded indefinitely unless you instruct us otherwise. If you do not want the mailing of these documents to be combined with those for other members of your household, please contact Invesco Investment Services, Inc. at 800 959 4246 or contact your financial institution. We will begin sending you individual copies for each account within 30 days after receiving your request.
Fund holdings and proxy voting information
The Fund provides a complete list of its holdings four times in each fiscal year, at the quarter ends. For the second and fourth quarters, the lists appear in the Fund’s semiannual and annual reports to shareholders. For the first and third quarters, the Fund files the lists with the Securities and Exchange Commission (SEC) on FormN-Q (or any successor Form). The most recent list of portfolio holdings is available at invesco.com/completeqtrholdings. Shareholders can also look up the Fund’s FormsN-Q (or any successor Form) on the SEC website at sec.gov.
A description of the policies and procedures that the Fund uses to determine how to vote proxies relating to portfolio securities is available without charge, upon request, from our Client Services department at 800 959 4246 or at invesco.com/proxyguidelines. The information is also available on the SEC website, sec.gov.
Information regarding how the Fund voted proxies related to its portfolio securities during the most recent12-month period ended June 30 is available at invesco.com/proxysearch. The information is also available on the SEC website, sec.gov.
Invesco Advisers, Inc. is an investment adviser; it provides investment advisory services to individual and institutional clients and does not sell securities. Invesco Distributors, Inc. is the US distributor for Invesco Ltd.’s retail mutual funds, exchange-traded funds and institutional money market funds. Both are wholly owned, indirect subsidiaries of Invesco Ltd.
35 INVESCO OPPENHEIMER V.I. TOTAL RETURN BOND FUND
SHAREHOLDER PROXYUnaudited
A Special Meeting (“Meeting”) of Shareholders of Invesco Oppenheimer V.I. Total Return Bond Fund was held on April 12, 2019. The Meeting was held for the following purpose:
(1) Approval of an Agreement and Plan of Reorganization that provides for the reorganization of Oppenheimer Total Return Bond Fund/VA into Invesco Oppenheimer Invesco Oppenheimer V.I. Total Return Bond Fund.
The results of the voting on the above matter was as follows:
| | | | | | | | | | | | | | | | |
| Matter | | Votes For | | | Votes
Against | | | Votes
Abstain | | | Broker
Non-Votes | |
| (1) Approval of an Agreement and Plan of Reorganization | | | 11,729,662 | | | | 384,609 | | | | 1,685,025 | | | | 0 | |
36 INVESCO OPPENHEIMER V.I. TOTAL RETURN BOND FUND
THIS PAGE INTENTIONALLY LEFT BLANK.
THIS PAGE INTENTIONALLY LEFT BLANK.
THIS PAGE INTENTIONALLY LEFT BLANK.

Not required for a semi-annual report.
| ITEM 3. | AUDIT COMMITTEE FINANCIAL EXPERT. |
Not applicable.
| ITEM 4. | PRINCIPAL ACCOUNTANT FEES AND SERVICES. |
PricewaterhouseCoopers LLP (“PwC”) informed the Trust that it has identified an issue related to its independence under Rule2-01(c)(1)(ii)(A) of RegulationS-X (referred to as the Loan Rule). The Loan Rule prohibits accounting firms, such as PricewaterhouseCoopers LLP, from being deemed independent if they have certain financial relationships with their audit clients or certain affiliates of those clients. The Trust is required under various securities laws to have its financial statements audited by an independent accounting firm.
The Loan Rule specifically provides that an accounting firm would not be independent if it or certain affiliates and covered persons receives a loan from a lender that is a record or beneficial owner of more than ten percent of an audit client’s equity securities (referred to as a “more than ten percent owner”). For purposes of the Loan Rule, audit clients include the Funds as well as all registered investment companies advised by the Adviser and its affiliates, including other subsidiaries of the Adviser’s parent company, Invesco Ltd. (collectively, the Invesco Fund Complex). PwC informed the Trust it and certain affiliates and covered persons have relationships with lenders who hold, as record owner, more than ten percent of the shares of certain funds within the Invesco Fund Complex.
On June 20, 2016, the SEC Staff issued a“no-action” letter to another mutual fund complex (see Fidelity Management & Research Company et al.,No-Action Letter) related to the audit independence issue described above. In that letter, the SEC confirmed that it would not recommend enforcement action against a fund that relied on audit services performed by an audit firm that was not in compliance with the Loan Rule in certain specified circumstances. On June 18, 2019, the SEC adopted amendments to the Loan Rule (the “Amendments”) addressing many of the issues that led to the issuance of theno-action letter. The Amendments become effective and supersede theno-action letter on October 3, 2019, 90 days after publication in the Federal Register. In connection with prior independence determinations, PwC communicated, as contemplated by theno-action letter, that it believes that it remains objective and impartial and that a reasonable investor possessing all the facts would conclude that PwC is able to exhibit the requisite objectivity and impartiality to report on the Funds’ financial statements as the independent registered public accounting firm. PricewaterhouseCoopers LLP also represented that it has complied with PCAOB Rule 3526(b)(1) and (2), which are conditions to the Funds relying on the no action letter, and affirmed that it is an independent accountant within the meaning of PCAOB Rule 3520. Therefore, the Adviser, the Funds and PwC concluded that PricewaterhouseCoopers LLP could continue as the Funds’ independent registered public accounting firm. The Invesco Fund Complex relied upon theno-action letter in reaching this conclusion.
If in the future the independence of PwC is called into question under the Loan Rule by circumstances that are not addressed in the SEC’sno-action letter, the Funds will need to take other action in order for the Funds’ filings with the SEC containing financial statements to be deemed compliant with applicable securities laws. Such additional actions could result in additional costs, impair the ability of the Funds to issue new shares or have other material adverse effects on the Funds. The SECno-action relief was initially set to expire 18 months from issuance but has been extended by the SEC without an expiration date, except that theno-action letter will be withdrawn upon the effectiveness of the Amendments.
During the reporting period, PwC advised the Audit Committee of the following matter for consideration under the SEC’s auditor independence rules. PwC advised the Audit Committee that a PwC Director held a financial interest in investment companies within the Invesco Fund Complex that was inconsistent with the requirements of Rule2-01(c)(1) of RegulationS-X. PwC noted, among other things, that during the time of its audit, the engagement team was not aware of the investments, the individual was not in the chain of command of the audit or the audit partners of Invesco or the affiliate of the Registrant, the services provided by the individual was not relied upon by the audit engagement team with respect to the audit of the Registrant or its affiliates and the investments was not material to the net worth of the individual or his respective immediate family members which they considered in reaching their conclusion. PwC advised the Audit Committee that it believes its objectivity and impartiality had not been adversely affected by these matters as they related to the audit of the Registrant.
On May 24, 2019, certain investment advisor subsidiaries of Invesco Ltd. assumed management responsibility from Oppenheimer Funds, Inc. (“OFI”) for 83open-end mutual funds and 20 exchange-traded funds (collectively, the “Oppenheimer Funds”). Assumption of management responsibility for the Oppenheimer Funds was accomplished through the reorganization of each Oppenheimer Fund into a new Invesco shell fund (collectively, the “New Invesco Funds”) that did not havepre-existing assets (together, the “Reorganizations”). The Reorganizations were part of the acquisition by Invesco Ltd. (together with its subsidiaries, “Invesco”) of the asset management business of OFI (including the Oppenheimer Funds) from Massachusetts Mutual Life Insurance Company (“MassMutual”), which was also consummated on May 24, 2019 (the “Acquisition”). Subsequent to the Acquisition, MassMutual became a significant shareholder of Invesco, and the Invesco Ltd. board of directors expanded by one director with the addition of a director selected by MassMutual.
Prior to the consummation of the Acquisition and the Reorganizations on May 24, 2019, PwC completed an independence assessment to evaluate the services and relationships with OFI and its affiliates, which became affiliates of Invesco upon the closing of the Acquisition. The assessment identified the following relationship and services that are inconsistent with the auditor independence rules under Rule2-01 of RegulationS-X (“Rule2-01”) if provided to an affiliate of an audit client. A retired PwC partner who receives a benefit from PwC that is not fully funded, served as a member of Audit Committee of the Boards of Trustees of certain Oppenheimer Funds prior to the Acquisition (the“Pre-Reorganization Relationship”). Additionally, PwC provided certainnon-audit services including, expert legal services to one Oppenheimer Fund, custody of client assets in connection with payroll services, anon-audit service performed pursuant to a success-based fee,non-audit services in which PwC acted as an advocate on behalf of a MassMutual foreign affiliate and certain employee activities undertaken in connection with the provision ofnon-audit services for MassMutual and certain MassMutual foreign affiliates (collectively, the“Pre-Reorganization Services”).
PwC and the Audit Committees of the New Invesco Funds each considered the impact that thePre-Reorganization Relationship and Services have on PwC’s independence with respect to the New Invesco Funds. On the basis of the nature of the relationship and services performed, and in particular the mitigating factors described below, PwC concluded that a reasonable investor, possessing knowledge of all the relevant facts and circumstances regarding thePre-Reorganization Relationship and Services, would conclude that thePre-Reorganization Relationship and Services do not impair PwC’s ability to exhibit the requisite objectivity and impartiality to report on the financial statements of the New Invesco Funds for the years ending May 31, 2019 – April 30, 2020 (“PwC’s Conclusion”).
Separately, the Audit Committees of the Boards of Trustees of the New Invesco Funds, based upon PwC’s Conclusion and the concurrence of Invesco, considered the relevant facts and circumstances including the mitigating factors described below and, after careful consideration, concluded that PwC is capable of exercising objective and impartial judgment in connection with its audits of the financial statements of the New Invesco Funds that the respective Boards of Trustees oversees.
Mitigating factors that PwC and the Audit Committees considered in reaching their respective conclusions included, among others, the following factors:
| | • | | none of thePre-Reorganization Relationship or Services created a mutuality of interest between PwC and the New Invesco Funds; |
| | • | | PwC will not act in a management or employee capacity for the New Invesco Funds or their affiliates during any portion of PwC’s professional engagement period; |
| | • | | other than the expert legal services,Pre-Reorganization Services that have been provided to OFI, MassMutual and their affiliates do not have any impact on the financial statements of the New Invesco Funds; |
| | • | | as it relates to the expert legal services, while the service provided by PwC related to litigation involving one Oppenheimer Fund, the impact of the litigation on the Oppenheimer Fund’s financial statements was based upon OFI’s decision, and OFI management represented that the PwC service was not considered a significant component of its decision; |
| | • | | while certain employees of OFI who were involved in the financial reporting process of the Oppenheimer Funds will be employed by Invesco subsequent to the Reorganizations, existing officers of other Invesco Funds will serve as Principal Executive Officer and Principal Financial Officer or equivalent roles for the New Invesco Funds, and are ultimately responsible for the accuracy of all financial statement assertions for the entirety of the financial reporting periods for the New Invesco Funds; |
| | • | | thePre-Reorganization Services giving rise to the lack of independence were provided to, or entered into with, OFI, MassMutual and their affiliates at a time when PwC had no independence restriction with respect to these entities; |
| | • | | with the exception of the expert legal service provided to one Oppenheimer Fund, none of thePre-Reorganization Services affected the operations or financial reporting of the New Invesco Funds; |
| | • | | thePre-Reorganization Services provided by PwC to OFI, MassMutual and their affiliates were performed by persons who were not, and will not be, part of the audit engagement team for the New Invesco Funds; and |
| | • | | the fees associated with thePre-Reorganization Services were not material to MassMutual, Invesco or PwC. |
| ITEM 5. | AUDIT COMMITTEE OF LISTED REGISTRANTS. |
Not applicable.
| ITEM 6. | SCHEDULE OF INVESTMENTS. |
Investments in securities of unaffiliated issuers is included as part of the reports to stockholders filed under Item 1 of this Form.
| ITEM 7. | DISCLOSURE OF PROXY VOTING POLICIES AND PROCEDURES FORCLOSED-END MANAGEMENT INVESTMENT COMPANIES. |
Not applicable.
| ITEM 8. | PORTFOLIO MANAGERS OFCLOSED-END MANAGEMENT COMPANIES. |
Not applicable.
| ITEM 9. | PURCHASES OF EQUITY SECURITIES BYCLOSED-END MANAGEMENT INVESTMENT COMPANY AND AFFILIATED PURCHASERS. |
Not applicable.
| ITEM 10. | SUBMISSION OF MATTERS TO A VOTE OF SECURITY HOLDERS. |
None
| ITEM 11. | CONTROLS AND PROCEDURES. |
| (a) | As of August 13, 2019, an evaluation was performed under the supervision and with the participation of the officers of the Registrant, including the PEO and PFO, to assess the effectiveness of the Registrant’s disclosure controls and procedures, as that term is defined in Rule30a-3(c) under the Investment Company Act of 1940 (the “Act”), as amended. Based on that evaluation, the Registrant’s officers, including the PEO and PFO, concluded that, as of August 13, 2019, the Registrant’s disclosure controls and procedures were reasonably designed to ensure: (1) that information required to be disclosed by the Registrant on FormN-CSR is recorded, processed, summarized and reported within the time periods specified by the rules and forms of the Securities and Exchange Commission; and (2) that material information relating to the Registrant is made known to the PEO and PFO as appropriate to allow timely decisions regarding required disclosure. |
| (b) | There have been no changes in the Registrant’s internal control over financial reporting (as defined in Rule30a-3(d) under the Act) that occurred during the period covered by this report that have materially affected, or are reasonably likely to materially affect, the Registrant’s internal control over financial reporting. |
| ITEM 12. | DISCLOSURE OF SECURITIES LENDING ACTIVITIES FORCLOSED-END MANAGEMENT INVESTMENT COMPANIES. |
Not applicable
ITEM 13. EXHIBITS.
| | |
| |
| 13(a) (1) | | Not applicable. |
| |
| 13(a) (2) | | Certifications of principal executive officer and principal financial officer as required by Rule30a-2(a) under the Investment Company Act of 1940. |
| |
| 13(a) (3) | | Not applicable. |
| |
| 13(a) (4) | | Registrant’s Independent Public Accountant. |
| |
| 13(b) | | Certifications of principal executive officer and principal financial officer as required by Rule30a-2(b) under the Investment Company Act of 1940. |
SIGNATURES
Pursuant to the requirements of the Securities Exchange Act of 1934 and the Investment Company Act of 1940, the Registrant has duly caused this report to be signed on its behalf by the undersigned, thereunto duly authorized.
| Registrant: | AIM Variable Insurance Funds (Invesco Variable Insurance Funds) |
| | |
| By: | | /s/ Sheri Morris |
| | Sheri Morris |
| | Principal Executive Officer |
| |
| Date: | | August 26, 2019 |
Pursuant to the requirements of the Securities and Exchange Act of 1934 and the Investment Company Act of 1940, this report has been signed below by the following persons on behalf of the Registrant and in the capacities and on the dates indicated.
| | |
| By: | | /s/ Sheri Morris |
| | Sheri Morris |
| | Principal Executive Officer |
| |
| Date: | | August 26, 2019 |
| | |
| By: | | /s/ Kelli Gallegos |
| | Kelli Gallegos |
| | Principal Financial Officer |
| |
| Date: | | August 26, 2019 |