Posted March 17, 2015 -- Please note that this presentation should be reviewed with the accompanying audio -- Avid ©2015. Avid Revenue Model March 17, 2015
2 Posted March 17, 2015 -- Please note that this presentation should be reviewed with the accompanying audio -- Avid ©2015. Safe Harbor The information provided in this presentation and the accompanying slides includes forward-looking statements that involve risks and uncertainties, including statements about our anticipated plans, objectives, expectations and intentions. Such statements include, without limitation, statements regarding our recently filed financial statements or other information included herein based upon or otherwise incorporating judgments or estimates relating to future performance such as future earnings, bookings, backlog, bookings conversion rate and timing of revenue recognition and amortization, product mix and free cash flow; our future strategy and business plans; our product plans, including products under development, such as Avid Everywhere. These forward-looking statements are based on expectations as of March 17, 2015 and subject to known and unknown risks and uncertainties that could cause actual results to differ materially from those expressed or implied by such statements, including but not limited to the effect on our sales, operations and financial performance resulting from; our liquidity; our ability to execute our strategic plan (including cost savings initiatives), and meet customer needs; our ability to produce innovative products in response to changing market demand, particularly in the media industry; our ability to successfully accomplish our product development plans; competitive factors; history of losses; fluctuations in our revenue, based on, among other things, our performance and risks in particular geographies or markets, fluctuations in foreign currency exchange rates and seasonal factors; adverse changes in economic conditions; variances in our backlog and the realization thereof; the identified material weaknesses in our internal control over financial reporting; the previously disclosed ongoing SEC and Department of Justice inquiries; pending litigation, including the previously disclosed class action and possibility of further legal proceedings adverse to our company resulting from the restatement or related matters; the costs associated with the restatement. Moreover, the business may be adversely affected by future legislative, regulatory or changes, including tax law changes, as well as other economic, business and/or competitive factors. The risks included above are not exhaustive. Other factors that could adversely affect our business and prospects are described in the filings made by our company with the SEC. We expressly disclaim any obligation or undertaking to update or revise any forward-looking statements whether as a result of new information, future events or otherwise. For an explanation of the operational metrics used herein, please see our previous filings with the SEC, including our current reports on Form 8-K filed on March 16, 2015 and the exhibits thereto.
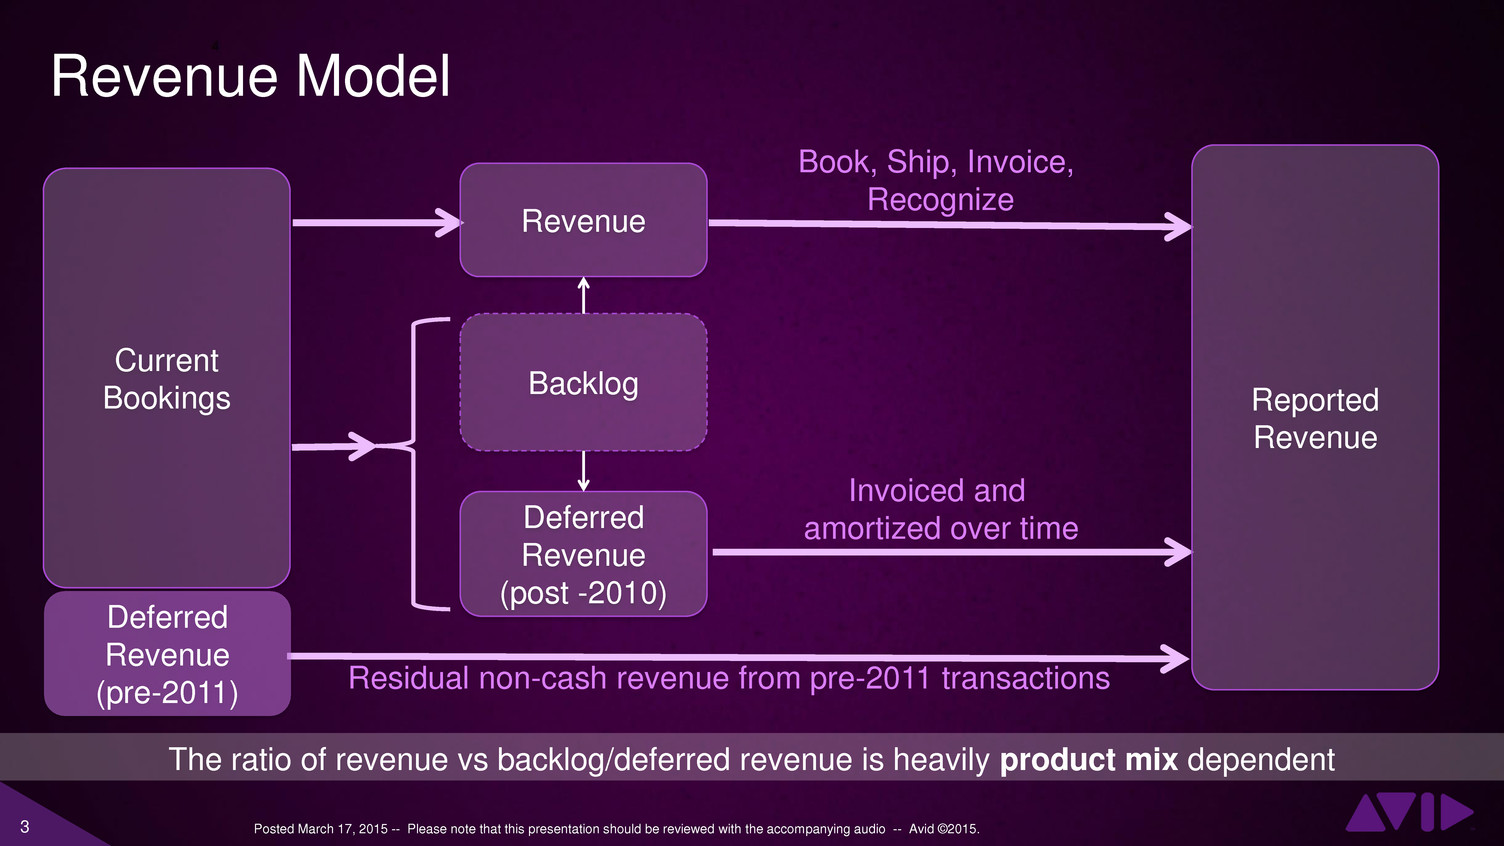
3 Posted March 17, 2015 -- Please note that this presentation should be reviewed with the accompanying audio -- Avid ©2015. Book, Ship, Invoice, Recognize Invoiced and amortized over time Residual non-cash revenue from pre-2011 transactions Current Bookings Deferred Revenue (pre-2011) Revenue Backlog Deferred Revenue (post -2010) Reported Revenue The ratio of revenue vs backlog/deferred revenue is heavily product mix dependent Revenue Model
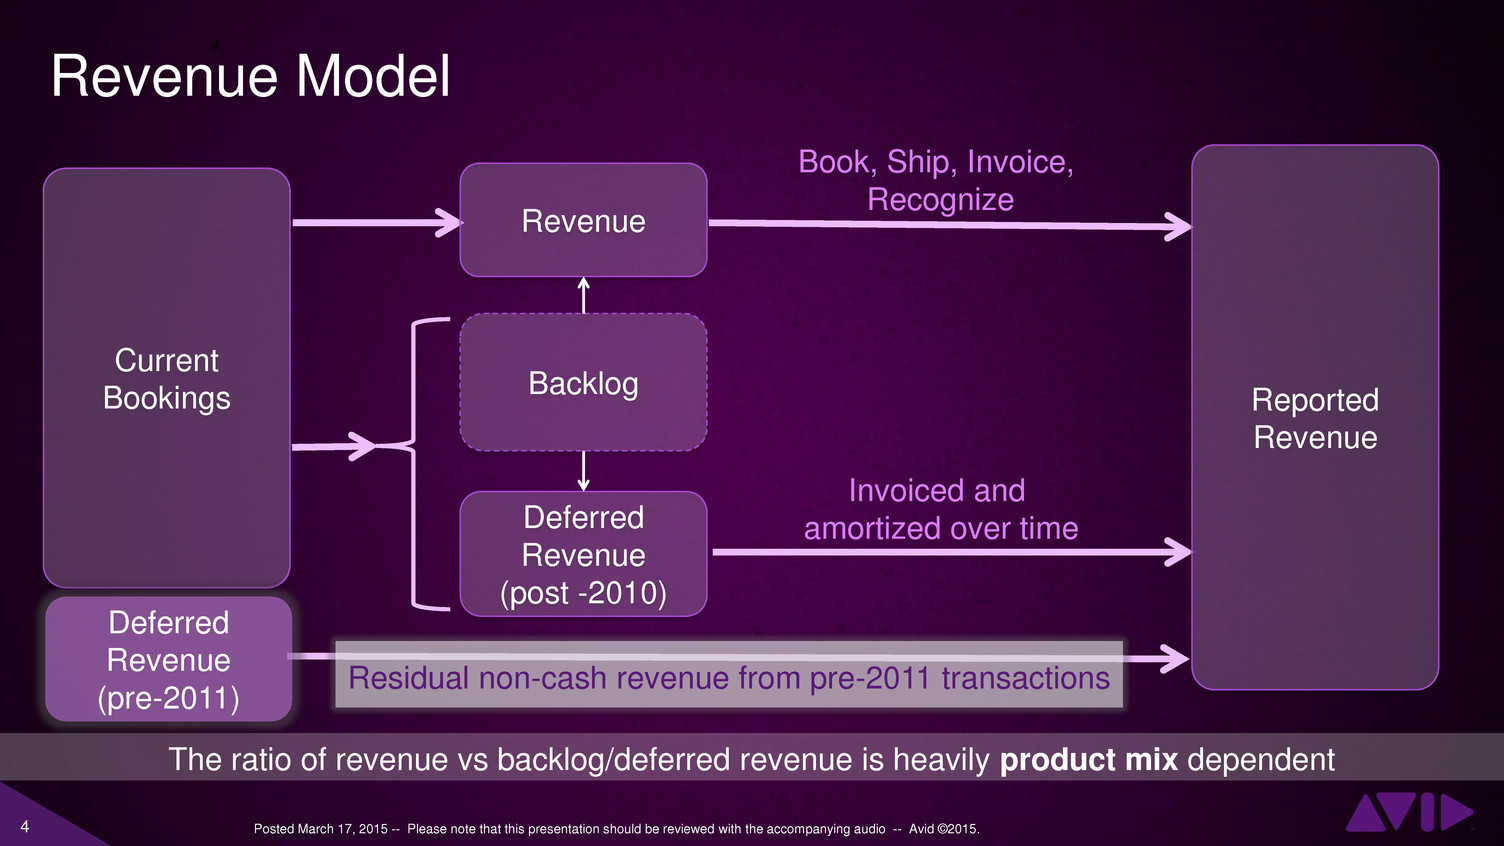
4 Posted March 17, 2015 -- Please note that this presentation should be reviewed with the accompanying audio -- Avid ©2015. Book, Ship, Invoice, Recognize Invoiced and amortized over time Residual non-cash revenue from pre-2011 transactions Current Bookings Deferred Revenue (pre-2011) Revenue Backlog Deferred Revenue (post -2010) Reported Revenue The ratio of revenue vs backlog/deferred revenue is heavily product mix dependent Revenue Model
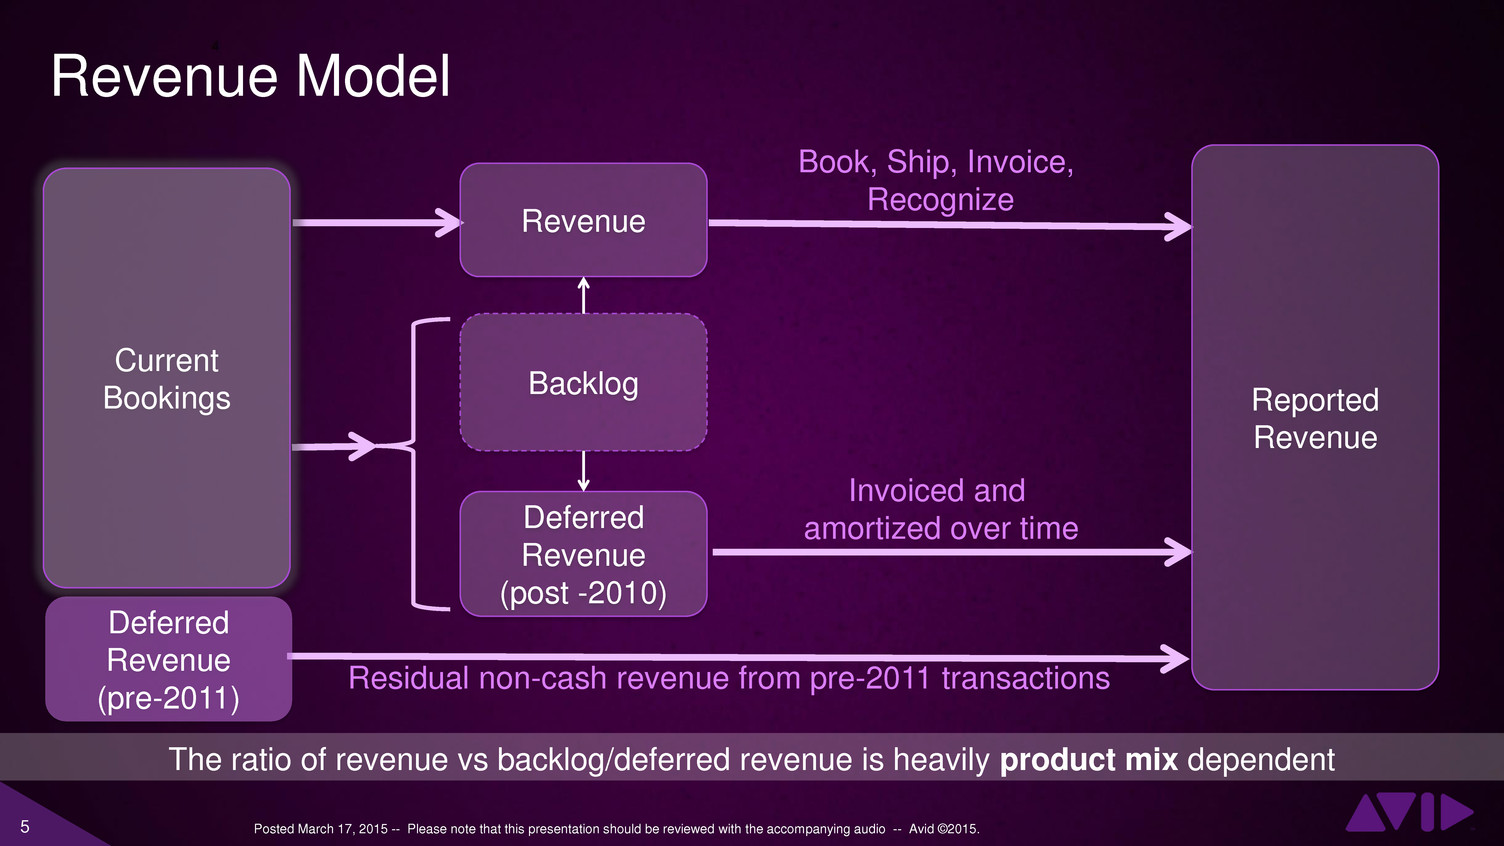
5 Posted March 17, 2015 -- Please note that this presentation should be reviewed with the accompanying audio -- Avid ©2015. Book, Ship, Invoice, Recognize Invoiced and amortized over time Residual non-cash revenue from pre-2011 transactions Current Bookings Deferred Revenue (pre-2011) Revenue Backlog Deferred Revenue (post -2010) Reported Revenue The ratio of revenue vs backlog/deferred revenue is heavily product mix dependent Revenue Model
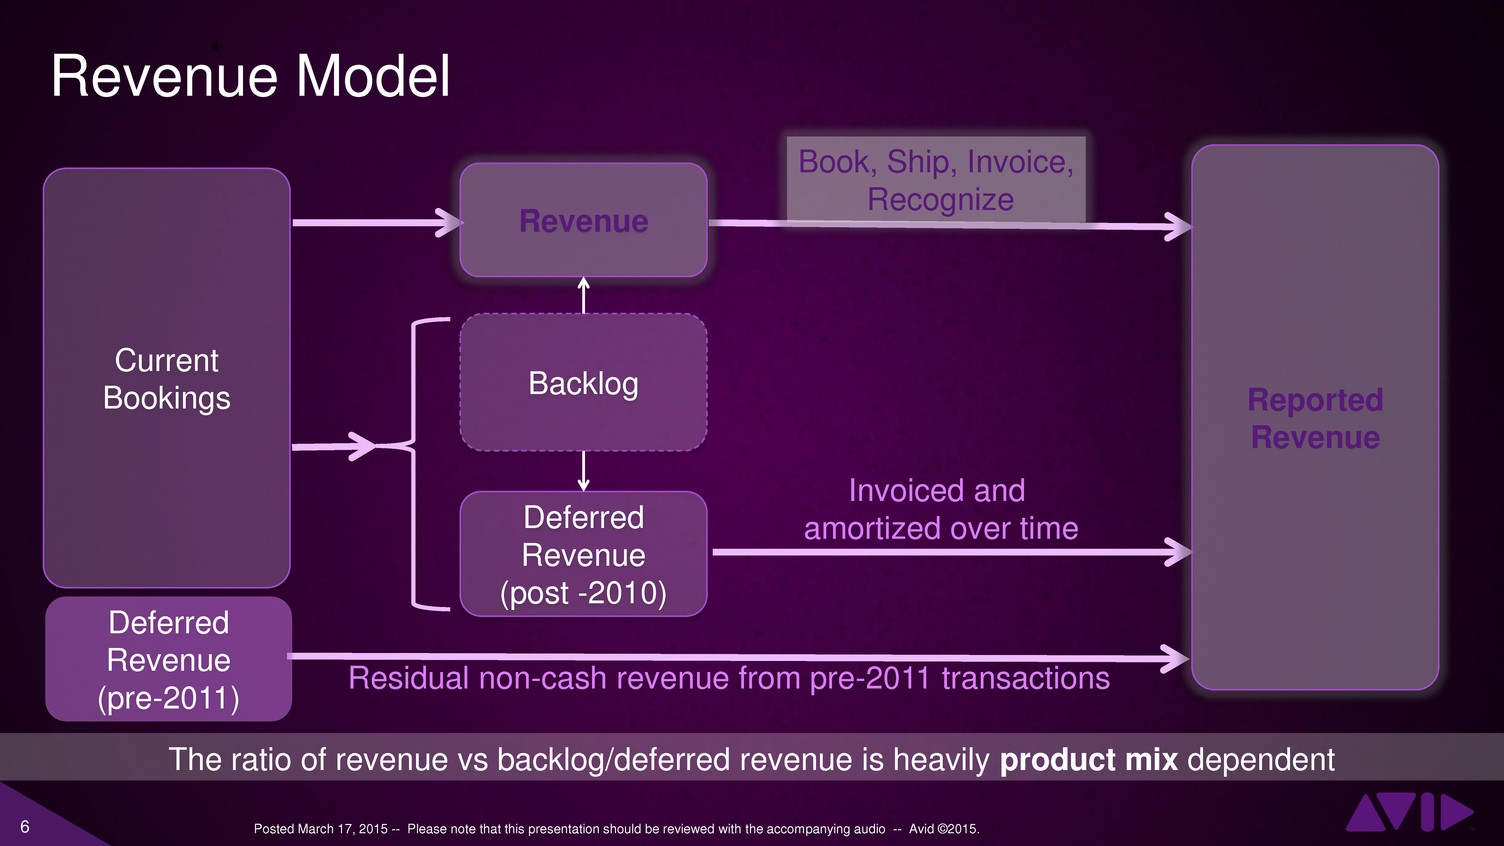
6 Posted March 17, 2015 -- Please note that this presentation should be reviewed with the accompanying audio -- Avid ©2015. Book, Ship, Invoice, Recognize Invoiced and amortized over time Residual non-cash revenue from pre-2011 transactions Current Bookings Deferred Revenue (pre-2011) Revenue Backlog Deferred Revenue (post -2010) Reported Revenue The ratio of revenue vs backlog/deferred revenue is heavily product mix dependent Revenue Model
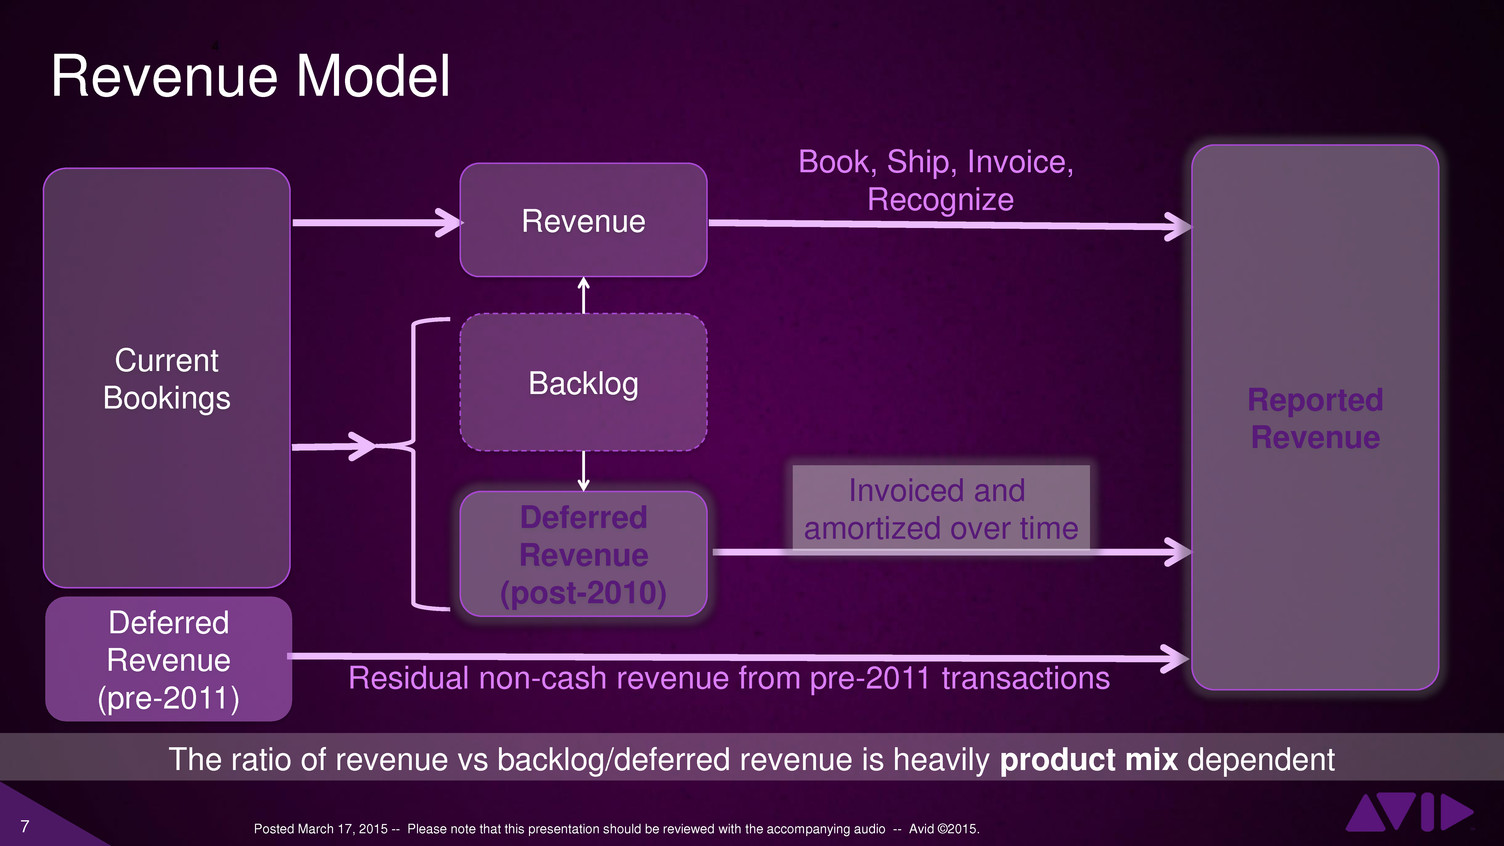
7 Posted March 17, 2015 -- Please note that this presentation should be reviewed with the accompanying audio -- Avid ©2015. Book, Ship, Invoice, Recognize Invoiced and amortized over time Residual non-cash revenue from pre-2011 transactions Current Bookings Deferred Revenue (pre-2011) Revenue Backlog Deferred Revenue (post-2010) Reported Revenue The ratio of revenue vs backlog/deferred revenue is heavily product mix dependent Revenue Model
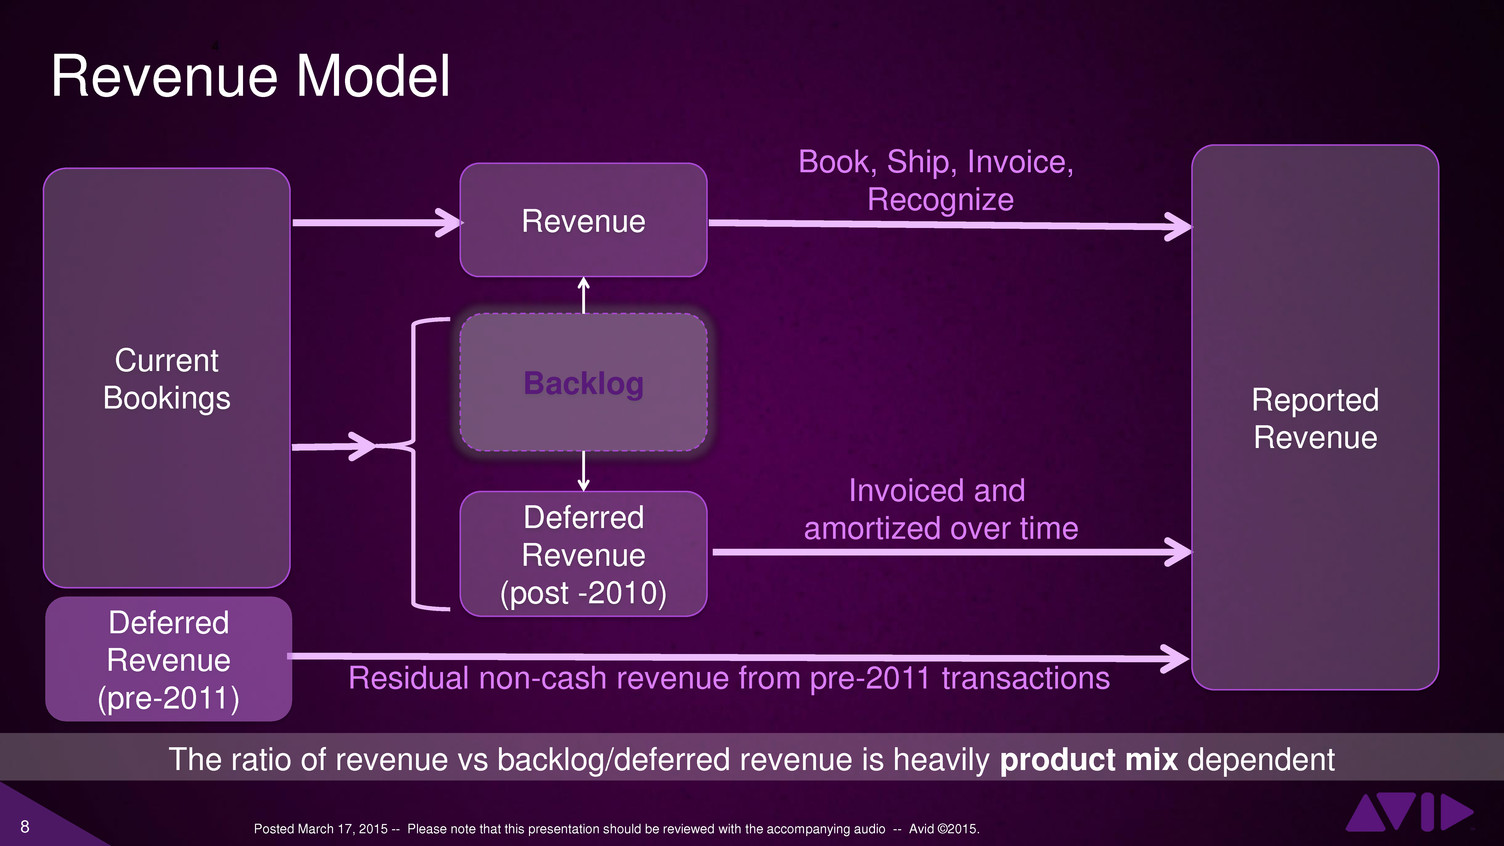
8 Posted March 17, 2015 -- Please note that this presentation should be reviewed with the accompanying audio -- Avid ©2015. Book, Ship, Invoice, Recognize Invoiced and amortized over time Residual non-cash revenue from pre-2011 transactions Current Bookings Deferred Revenue (pre-2011) Revenue Backlog Deferred Revenue (post -2010) Reported Revenue The ratio of revenue vs backlog/deferred revenue is heavily product mix dependent Revenue Model
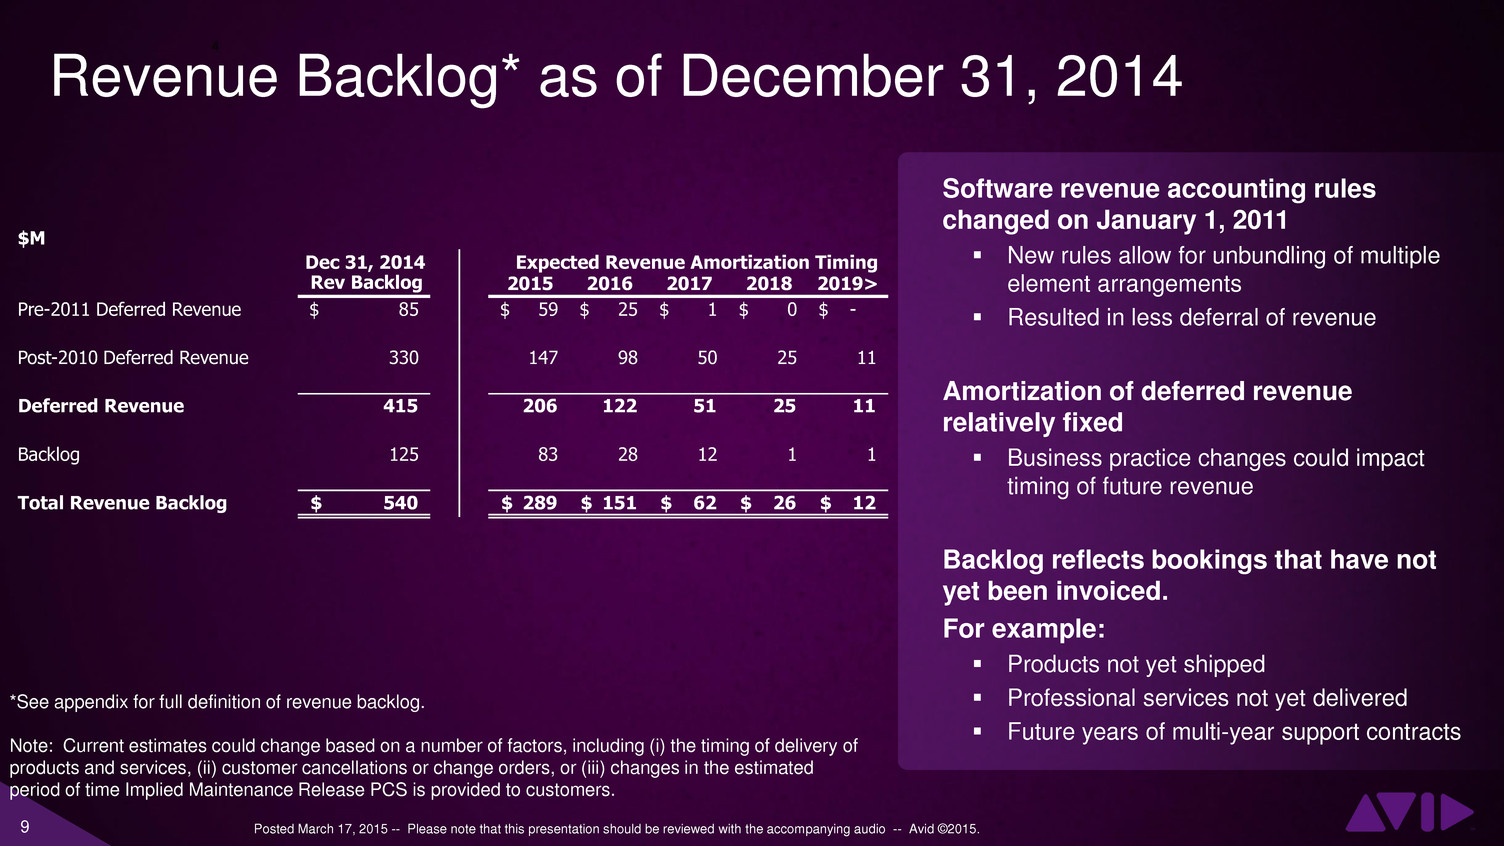
9 Posted March 17, 2015 -- Please note that this presentation should be reviewed with the accompanying audio -- Avid ©2015. Revenue Backlog* as of December 31, 2014 Software revenue accounting rules changed on January 1, 2011 New rules allow for unbundling of multiple element arrangements Resulted in less deferral of revenue Amortization of deferred revenue relatively fixed Business practice changes could impact timing of future revenue Backlog reflects bookings that have not yet been invoiced. For example: Products not yet shipped Professional services not yet delivered Future years of multi-year support contracts *See appendix for full definition of revenue backlog. Note: Current estimates could change based on a number of factors, including (i) the timing of delivery of products and services, (ii) customer cancellations or change orders, or (iii) changes in the estimated period of time Implied Maintenance Release PCS is provided to customers. $M Dec 31, 2014 Rev Backlog 2015 2016 2017 2018 2019> Pre-2011 Deferred Revenue 85 $ 59 $ 25 $ 1 $ 0 $ - $ Post-2010 Deferred Revenue 330 147 98 50 25 11 Deferred Revenue 415 206 122 51 25 11 Backlog 125 83 28 12 1 1 Total Revenue Backlog 540 $ 289 $ 151 $ 62 $ 26 $ 12 $ Expected Revenue Amortization Timing

10 Posted March 17, 2015 -- Please note that this presentation should be reviewed with the accompanying audio -- Avid ©2015. *See appendix for full definition of revenue backlog. Note: Current estimates could change based on a number of factors, including (i) the timing of delivery of products and services, (ii) customer cancellations or change orders, or (iii) changes in the estimated period of time Implied Maintenance Release PCS is provided to customers. Software revenue accounting rules changed on January 1, 2011 New rules allow for unbundling of multiple element arrangements Resulted in less deferral of revenue Amortization of deferred revenue relatively fixed Business practice changes could impact timing of future revenue Backlog reflects bookings that have not yet been invoiced. For example: Products not yet shipped Professional services not yet delivered Future years of multi-year support contracts Revenue Backlog* as of December 31, 2014 $M Dec 31, 2014 Rev Backlog 2015 2016 2017 2018 2019> Pre-2011 Deferred Revenue 85 $ 59 $ 25 $ 1 $ 0 $ - $ Post-2010 Deferred Revenue 330 147 98 50 25 11 Deferred Revenue 415 206 122 51 25 11 Backlog 125 83 28 12 1 1 Total Revenue Backlog 540 $ 289 $ 151 $ 62 $ 26 $ 12 $ Expected Revenue Amortization Timing
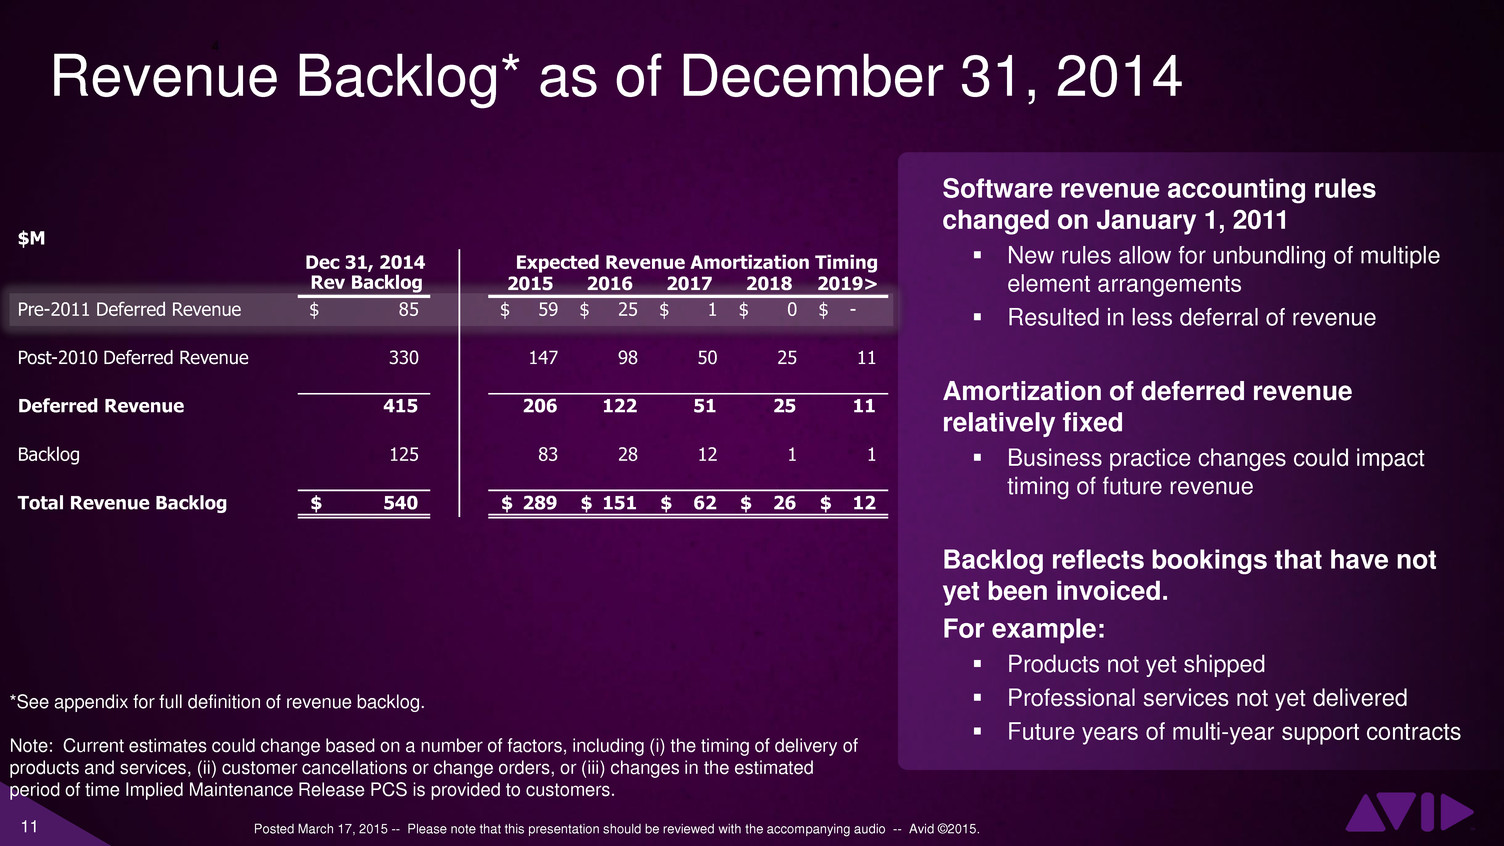
11 Posted March 17, 2015 -- Please note that this presentation should be reviewed with the accompanying audio -- Avid ©2015. Revenue Backlog* as of December 31, 2014 *See appendix for full definition of revenue backlog. Note: Current estimates could change based on a number of factors, including (i) the timing of delivery of products and services, (ii) customer cancellations or change orders, or (iii) changes in the estimated period of time Implied Maintenance Release PCS is provided to customers. Software revenue accounting rules changed on January 1, 2011 New rules allow for unbundling of multiple element arrangements Resulted in less deferral of revenue Amortization of deferred revenue relatively fixed Business practice changes could impact timing of future revenue Backlog reflects bookings that have not yet been invoiced. For example: Products not yet shipped Professional services not yet delivered Future years of multi-year support contracts $M Dec 31, 2014 Rev Backlog 2015 2016 2017 2018 2019> Pre-2011 Deferred Revenue 85 $ 59 $ 25 $ 1 $ 0 $ - $ Post-2010 Deferred Revenue 330 147 98 50 25 11 Deferred Revenue 415 206 122 51 25 11 Backlog 125 83 28 12 1 1 Total Revenue Backlog 540 $ 289 $ 151 $ 62 $ 26 $ 12 $ Expected Revenue Amortization Timing
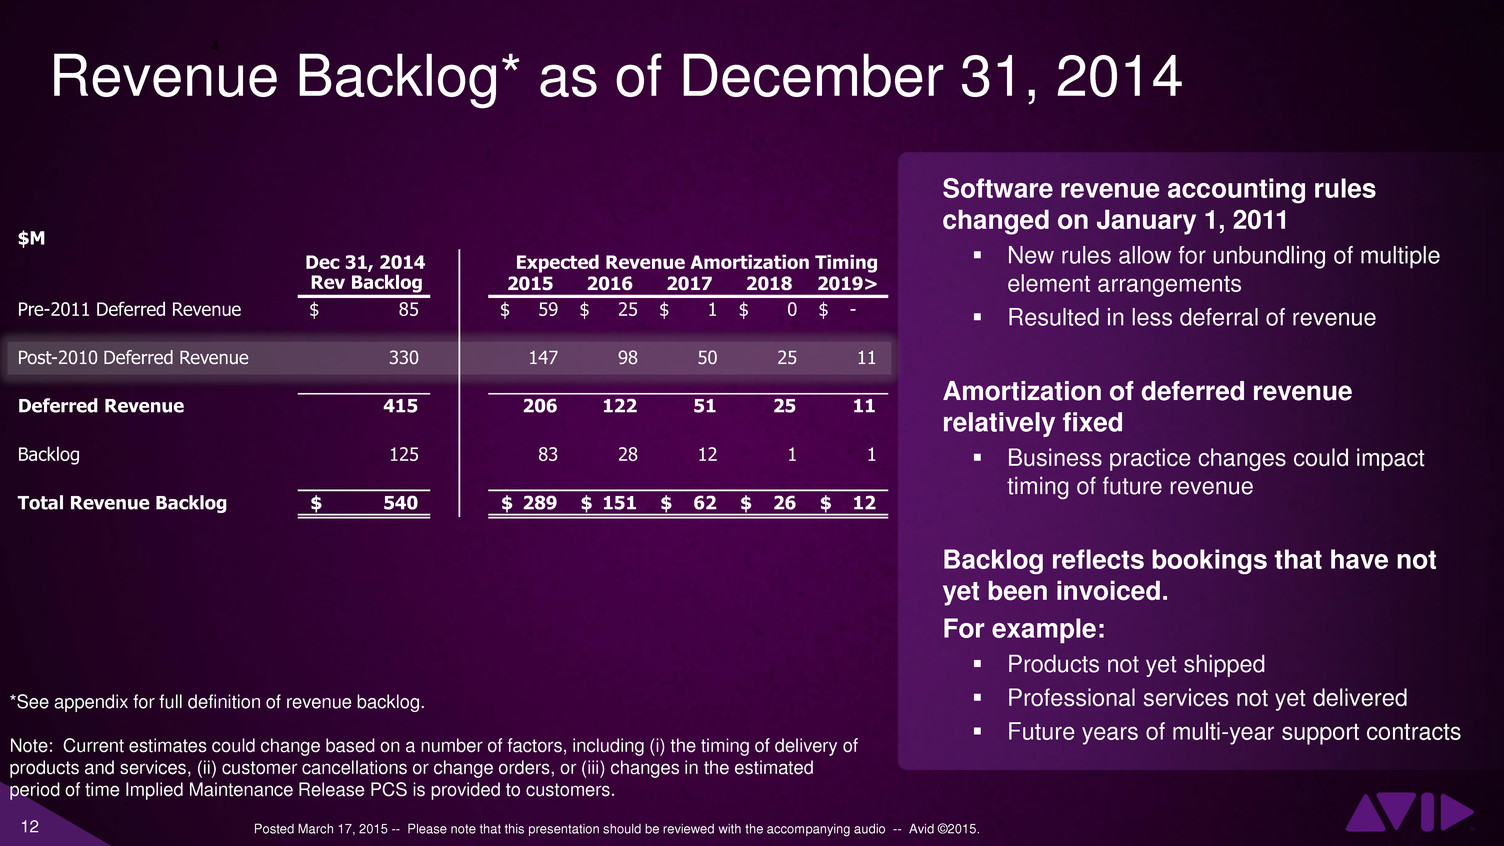
12 Posted March 17, 2015 -- Please note that this presentation should be reviewed with the accompanying audio -- Avid ©2015. Revenue Backlog* as of December 31, 2014 *See appendix for full definition of revenue backlog. Note: Current estimates could change based on a number of factors, including (i) the timing of delivery of products and services, (ii) customer cancellations or change orders, or (iii) changes in the estimated period of time Implied Maintenance Release PCS is provided to customers. Software revenue accounting rules changed on January 1, 2011 New rules allow for unbundling of multiple element arrangements Resulted in less deferral of revenue Amortization of deferred revenue relatively fixed Business practice changes could impact timing of future revenue Backlog reflects bookings that have not yet been invoiced. For example: Products not yet shipped Professional services not yet delivered Future years of multi-year support contracts $M Dec 31, 2014 Rev Backlog 2015 2016 2017 2018 2019> Pre-2011 Deferred Revenue 85 $ 59 $ 25 $ 1 $ 0 $ - $ Post-2010 Deferred Revenue 330 147 98 50 25 11 Deferred Revenue 415 206 122 51 25 11 Backlog 125 83 28 12 1 1 Total Revenue Backlog 540 $ 289 $ 151 $ 62 $ 26 $ 12 $ Expected Revenue Amortization Timing

13 Posted March 17, 2015 -- Please note that this presentation should be reviewed with the accompanying audio -- Avid ©2015. Revenue Backlog* as of December 31, 2014 *See appendix for full definition of revenue backlog. Note: Current estimates could change based on a number of factors, including (i) the timing of delivery of products and services, (ii) customer cancellations or change orders, or (iii) changes in the estimated period of time Implied Maintenance Release PCS is provided to customers. Software revenue accounting rules changed on January 1, 2011 New rules allow for unbundling of multiple element arrangements Resulted in less deferral of revenue Amortization of deferred revenue relatively fixed Business practice changes could impact timing of future revenue Backlog reflects bookings that have not yet been invoiced. For example: Products not yet shipped Professional services not yet delivered Future years of multi-year support contracts $M Dec 31, 2014 Rev Backlog 2015 2016 2017 2018 2019> Pre-2011 Deferred Revenue 85 $ 59 $ 25 $ 1 $ 0 $ - $ Post-2010 Deferred Revenue 330 147 98 50 25 11 Deferred Revenue 415 206 122 51 25 11 Backlog 125 83 28 12 1 1 Total Revenue Backlog 540 $ 289 $ 151 $ 62 $ 26 $ 12 $ Expected Revenue Amortization Timing
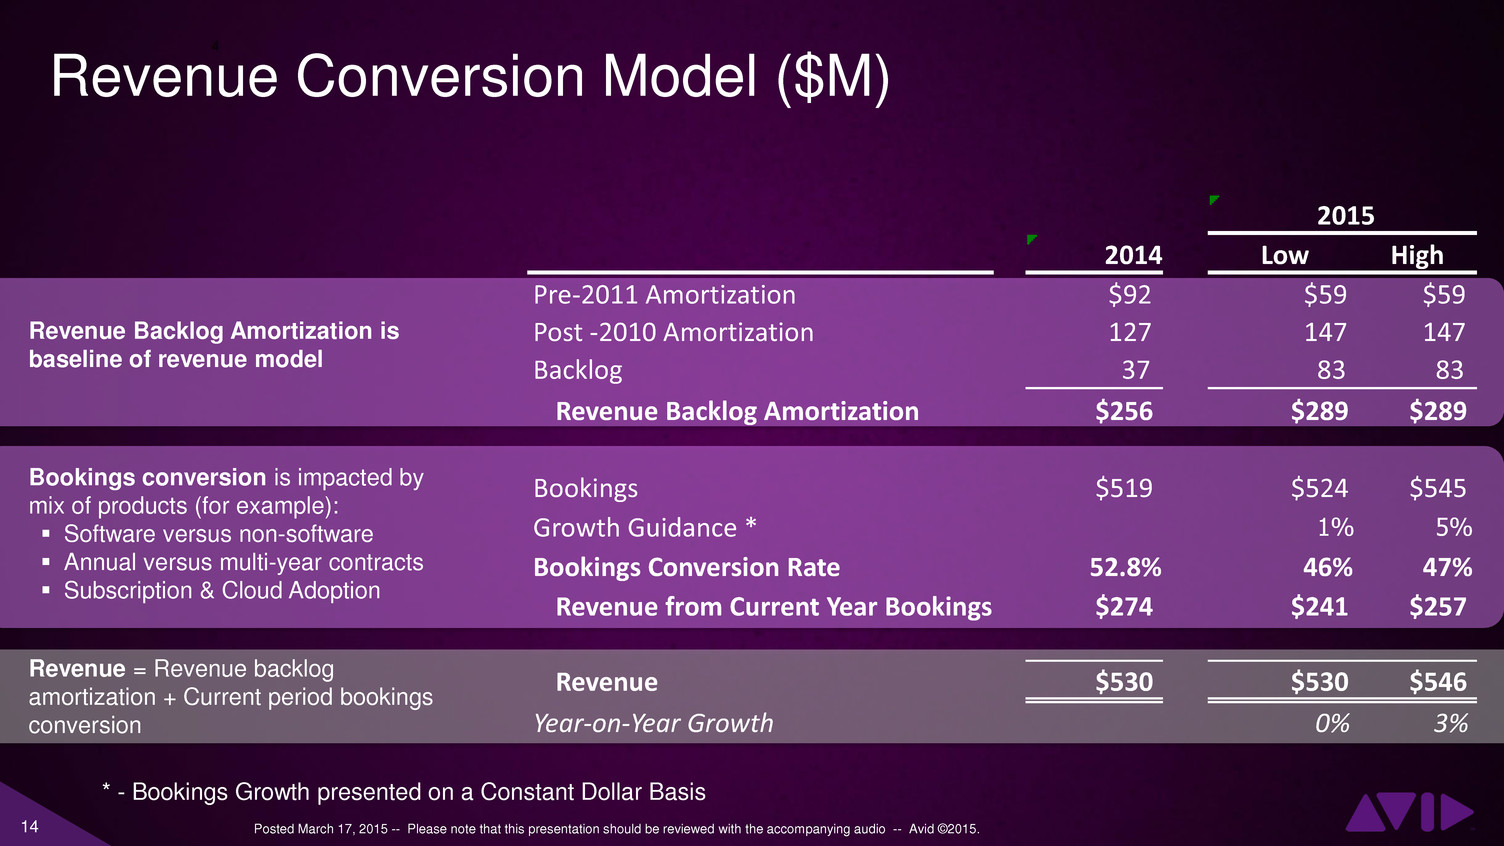
14 Posted March 17, 2015 -- Please note that this presentation should be reviewed with the accompanying audio -- Avid ©2015. Revenue Conversion Model ($M) Revenue Backlog Amortization is baseline of revenue model Bookings conversion is impacted by mix of products (for example): Software versus non-software Annual versus multi-year contracts Subscription & Cloud Adoption Revenue = Revenue backlog amortization + Current period bookings conversion 2014 Low High Pre-2011 Amortization $92 $59 $59 Post -2010 Amortization 127 147 147 Backlog 37 83 83 Revenue Backlog Amortization $256 $289 $289 Bookings $519 $524 $545 Growth Guidance * 1% 5% Bookings Conversion Rate 52.8% 46% 47% Revenue from Current Year Bookings $274 $241 $257 Revenue $530 $530 $546 Year-on-Year Growth 0% 3% 2015 * - Bookings Growth presented on a Constant Dollar Basis
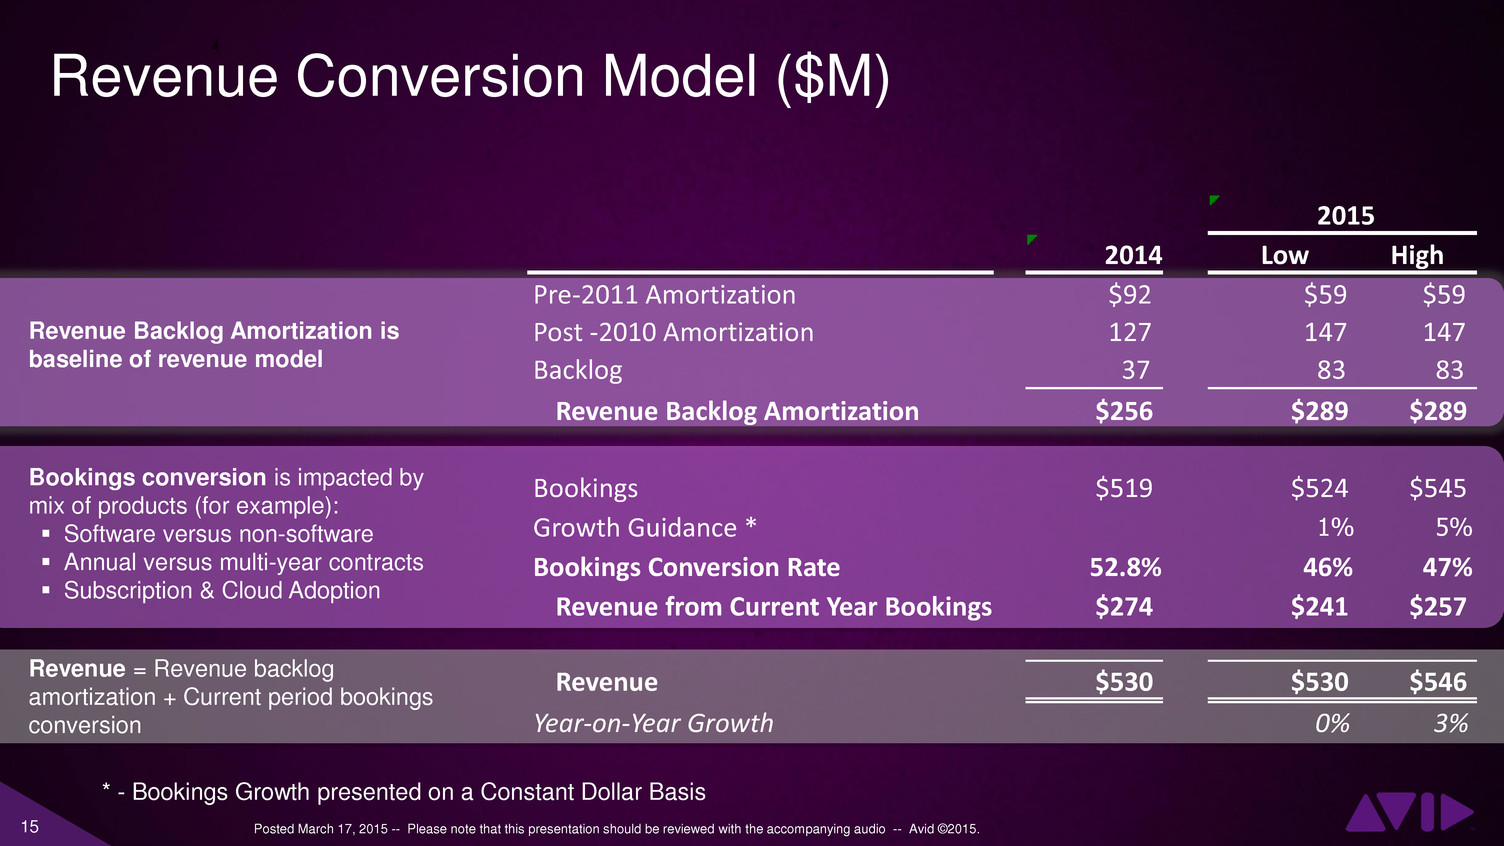
15 Posted March 17, 2015 -- Please note that this presentation should be reviewed with the accompanying audio -- Avid ©2015. Revenue Conversion Model ($M) Revenue Backlog Amortization is baseline of revenue model Bookings conversion is impacted by mix of products (for example): Software versus non-software Annual versus multi-year contracts Subscription & Cloud Adoption Revenue = Revenue backlog amortization + Current period bookings conversion 2014 Low High Pre-2011 Amortization $92 $59 $59 Post -2010 Amortization 127 147 147 Backlog 37 83 83 Revenue Backlog Amortization $256 $289 $289 Bookings $519 $524 $545 Growth Guidance * 1% 5% Bookings Conversion Rate 52.8% 46% 47% Revenue from Current Year Bookings $274 $241 $257 Revenue $530 $530 $546 Year-on-Year Growth 0% 3% 2015 * - Bookings Growth presented on a Constant Dollar Basis
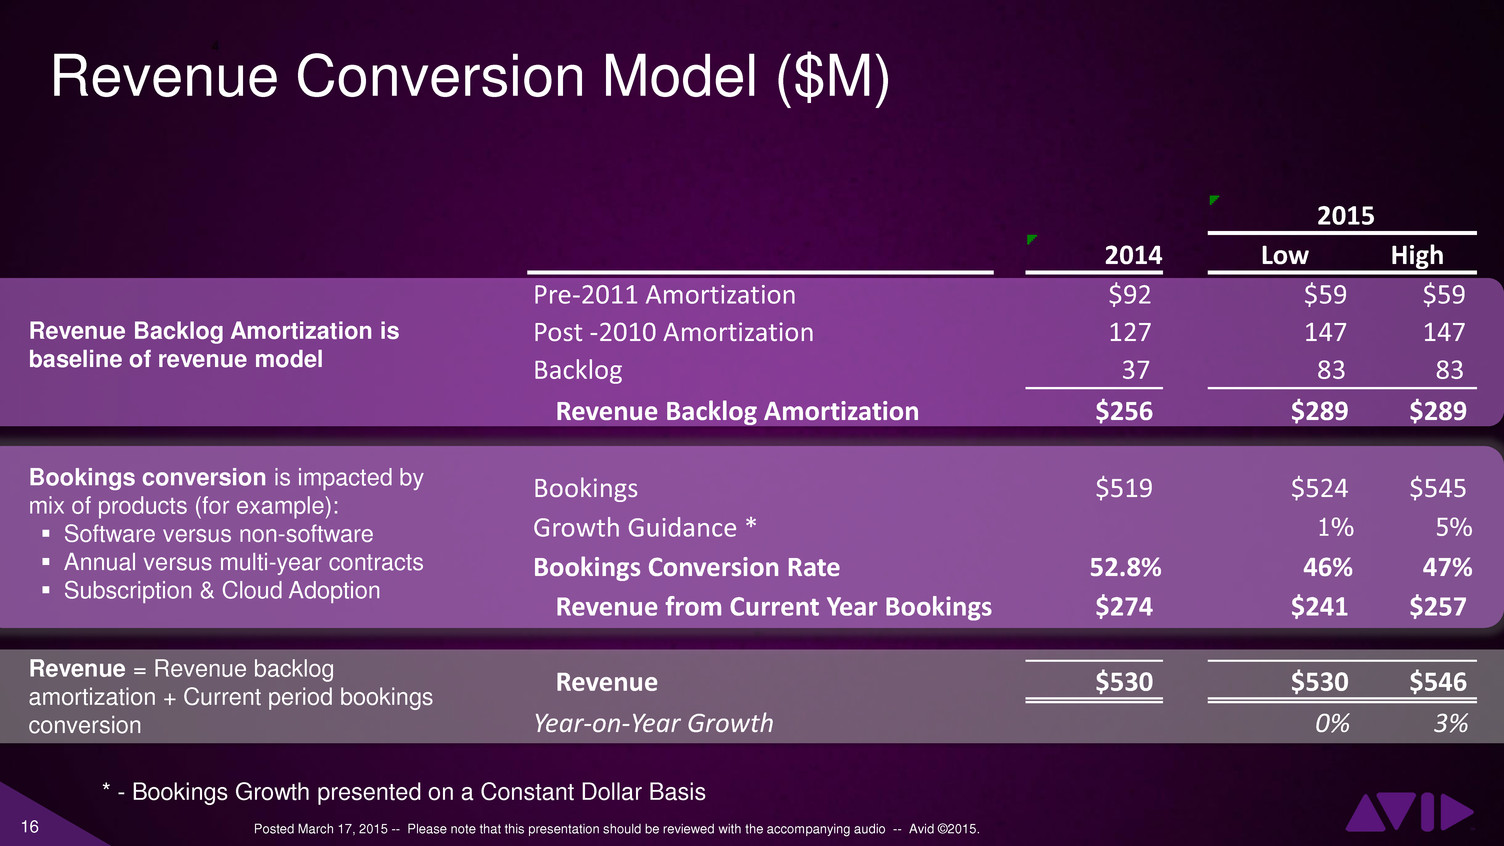
16 Posted March 17, 2015 -- Please note that this presentation should be reviewed with the accompanying audio -- Avid ©2015. Revenue Conversion Model ($M) Revenue Backlog Amortization is baseline of revenue model Bookings conversion is impacted by mix of products (for example): Software versus non-software Annual versus multi-year contracts Subscription & Cloud Adoption Revenue = Revenue backlog amortization + Current period bookings conversion 2014 Low High Pre-2011 Amortization $92 $59 $59 Post -2010 Amortization 127 147 147 Backlog 37 83 83 Revenue Backlog Amortization $256 $289 $289 Bookings $519 $524 $545 Growth Guidance * 1% 5% Bookings Conversion Rate 52.8% 46% 47% Revenue from Current Year Bookings $274 $241 $257 Revenue $530 $530 $546 Year-on-Year Growth 0% 3% 2015 * - Bookings Growth presented on a Constant Dollar Basis
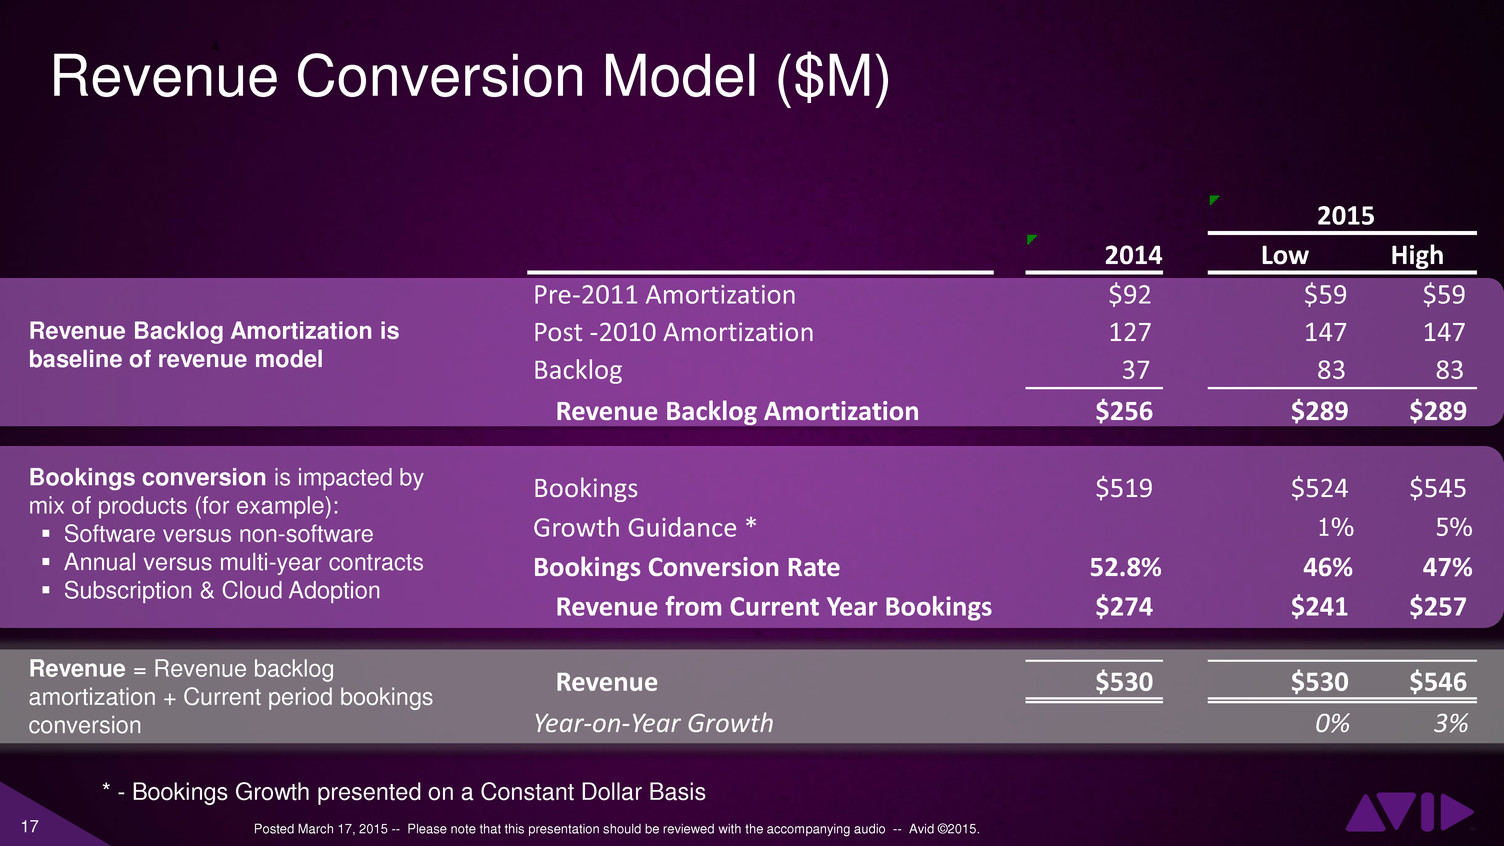
17 Posted March 17, 2015 -- Please note that this presentation should be reviewed with the accompanying audio -- Avid ©2015. Revenue Conversion Model ($M) Revenue Backlog Amortization is baseline of revenue model Bookings conversion is impacted by mix of products (for example): Software versus non-software Annual versus multi-year contracts Subscription & Cloud Adoption Revenue = Revenue backlog amortization + Current period bookings conversion 2014 Low High Pre-2011 Amortization $92 $59 $59 Post -2010 Amortization 127 147 147 Backlog 37 83 83 Revenue Backlog Amortization $256 $289 $289 Bookings $519 $524 $545 Growth Guidance * 1% 5% Bookings Conversion Rate 52.8% 46% 47% Revenue from Current Year Bookings $274 $241 $257 Revenue $530 $530 $546 Year-on-Year Growth 0% 3% 2015 * - Bookings Growth presented on a Constant Dollar Basis
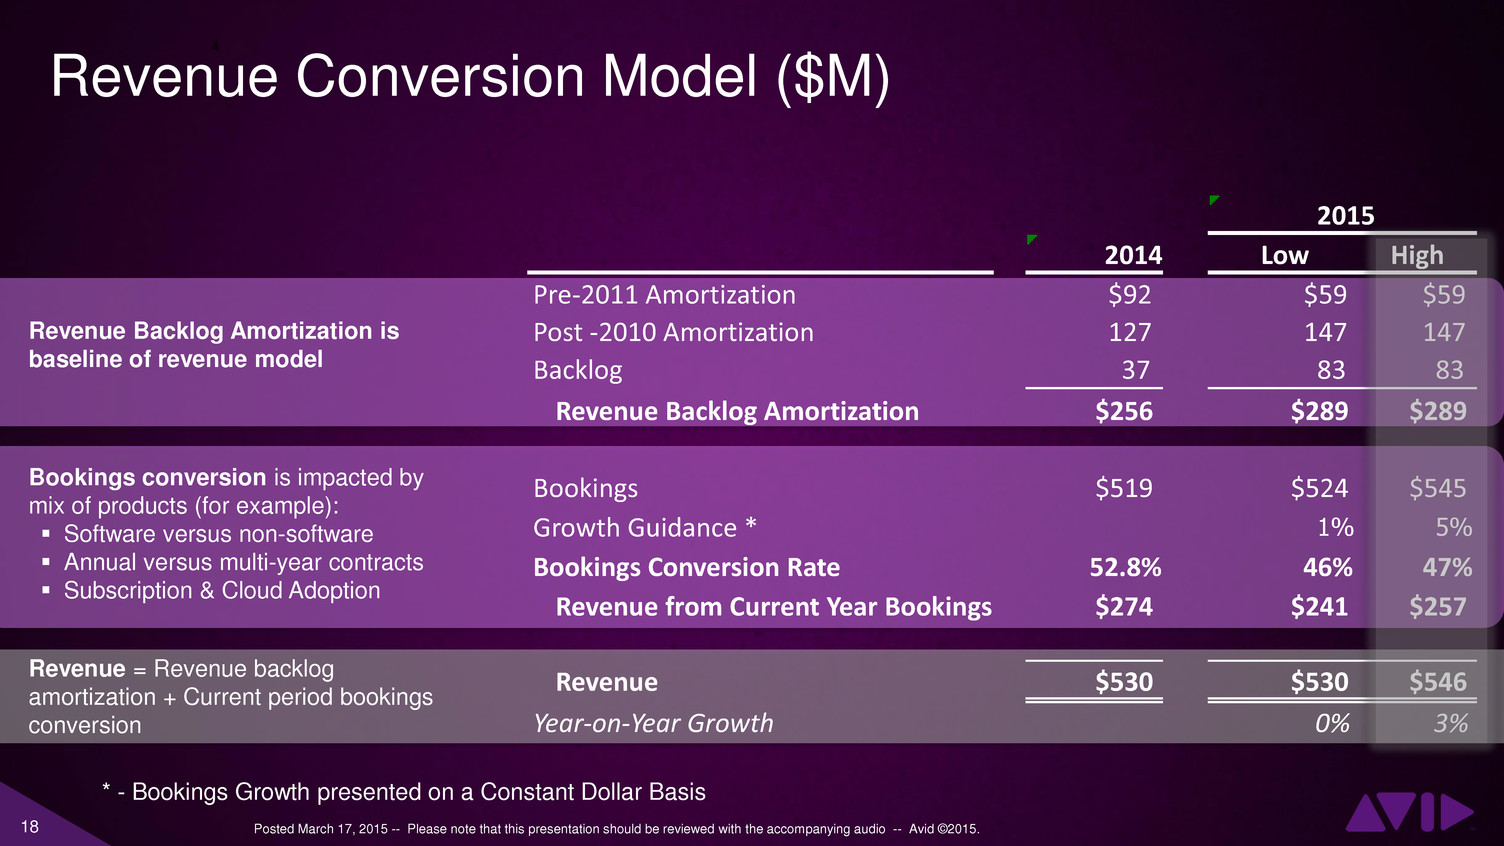
18 Posted March 17, 2015 -- Please note that this presentation should be reviewed with the accompanying audio -- Avid ©2015. Revenue Conversion Model ($M) Revenue Backlog Amortization is baseline of revenue model Bookings conversion is impacted by mix of products (for example): Software versus non-software Annual versus multi-year contracts Subscription & Cloud Adoption Revenue = Revenue backlog amortization + Current period bookings conversion 2014 Low High Pre-2011 Amortization $92 $59 $59 Post -2010 Amortization 127 147 147 Backlog 37 83 83 Revenue Backlog Amortization $256 $289 $289 Bookings $519 $524 $545 Growth Guidance * 1% 5% Bookings Conversion Rate 52.8% 46% 47% Revenue from Current Year Bookings $274 $241 $257 Revenue $530 $530 $546 Year-on-Year Growth 0% 3% 2015 * - Bookings Growth presented on a Constant Dollar Basis
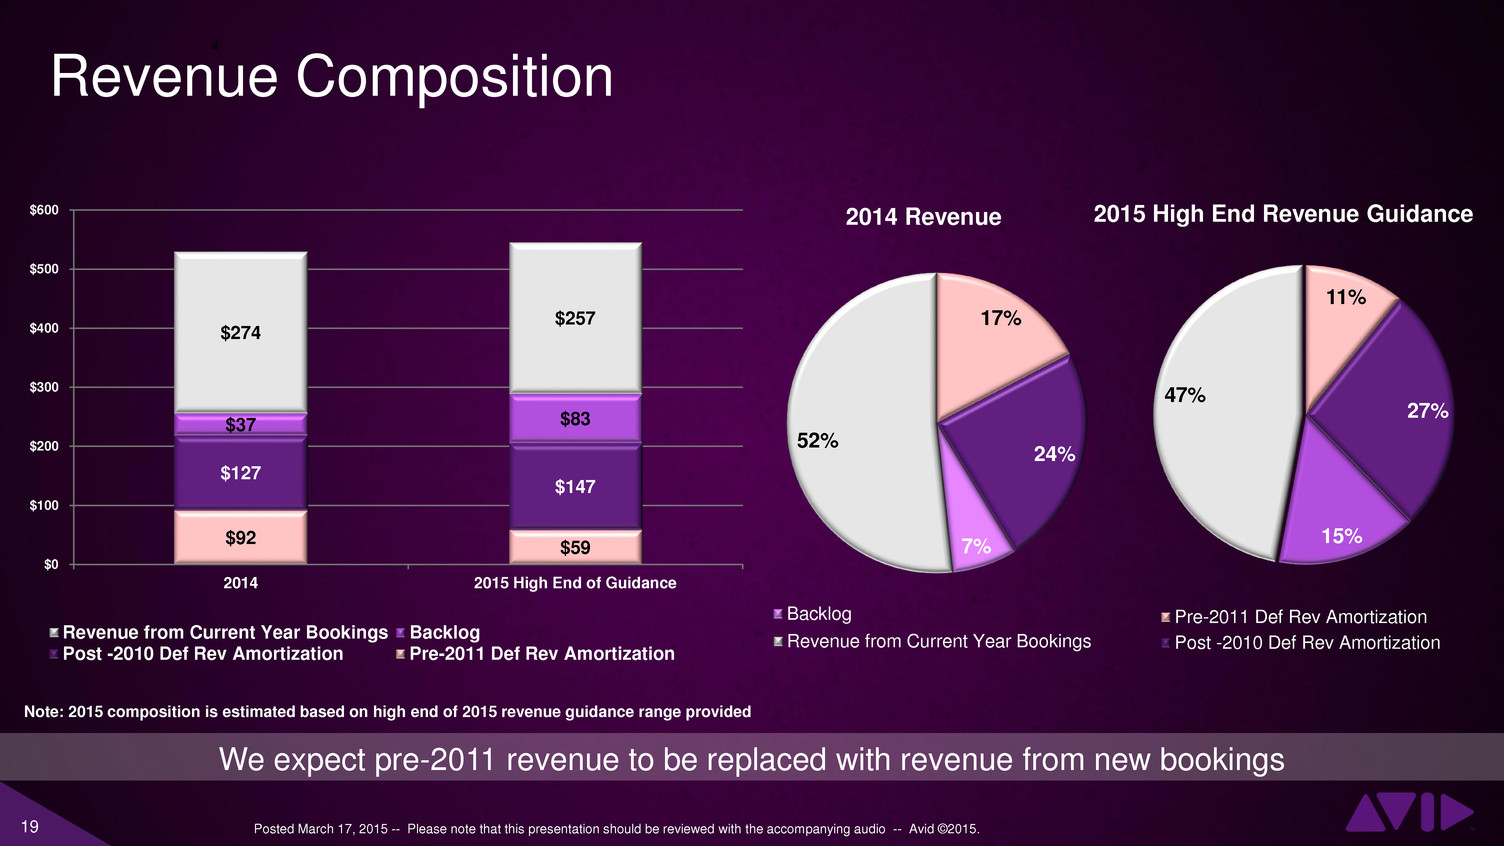
19 Posted March 17, 2015 -- Please note that this presentation should be reviewed with the accompanying audio -- Avid ©2015. Revenue Composition 11% 27% 15% 47% 2015 High End Revenue Guidance Pre-2011 Def Rev Amortization Post -2010 Def Rev Amortization We expect pre-2011 revenue to be replaced with revenue from new bookings Note: 2015 composition is estimated based on high end of 2015 revenue guidance range provided 17% 24% 7% 52% 2014 Revenue Backlog Revenue from Current Year Bookings $92 $59 $127 $147 $37 $83 $274 $257 $0 $100 $200 $300 $400 $500 $600 2014 2015 High End of Guidance Revenue from Current Year Bookings Backlog Post -2010 Def Rev Amortization Pre-2011 Def Rev Amortization
20 Posted March 17, 2015 -- Please note that this presentation should be reviewed with the accompanying audio -- Avid ©2015. Revenue Composition 11% 27% 15% 47% 2015 High End Revenue Guidance Pre-2011 Def Rev Amortization Post -2010 Def Rev Amortization We expect pre-2011 revenue to be replaced with revenue from new bookings Note: 2015 composition is estimated based on high end of 2015 revenue guidance range provided 17% 24% 7% 52% 2014 Revenue Backlog Revenue from Current Year Bookings $92 $59 $127 $147 $37 $83 $274 $257 $0 $100 $200 $300 $400 $500 $600 2014 2015 High End of Guidance Revenue from Current Year Bookings Backlog Post -2010 Def Rev Amortization Pre-2011 Def Rev Amortization
21 Posted March 17, 2015 -- Please note that this presentation should be reviewed with the accompanying audio -- Avid ©2015. Revenue Composition 11% 27% 15% 47% 2015 High End Revenue Guidance Pre-2011 Def Rev Amortization Post -2010 Def Rev Amortization We expect pre-2011 revenue to be replaced with revenue from new bookings Note: 2015 composition is estimated based on high end of 2015 revenue guidance range provided 17% 24% 7% 52% 2014 Revenue Backlog Revenue from Current Year Bookings $92 $59 $127 $147 $37 $83 $274 $257 $0 $100 $200 $300 $400 $500 $600 2014 2015 High End of Guidance Revenue from Current Year Bookings Backlog Post -2010 Def Rev Amortization Pre-2011 Def Rev Amortization
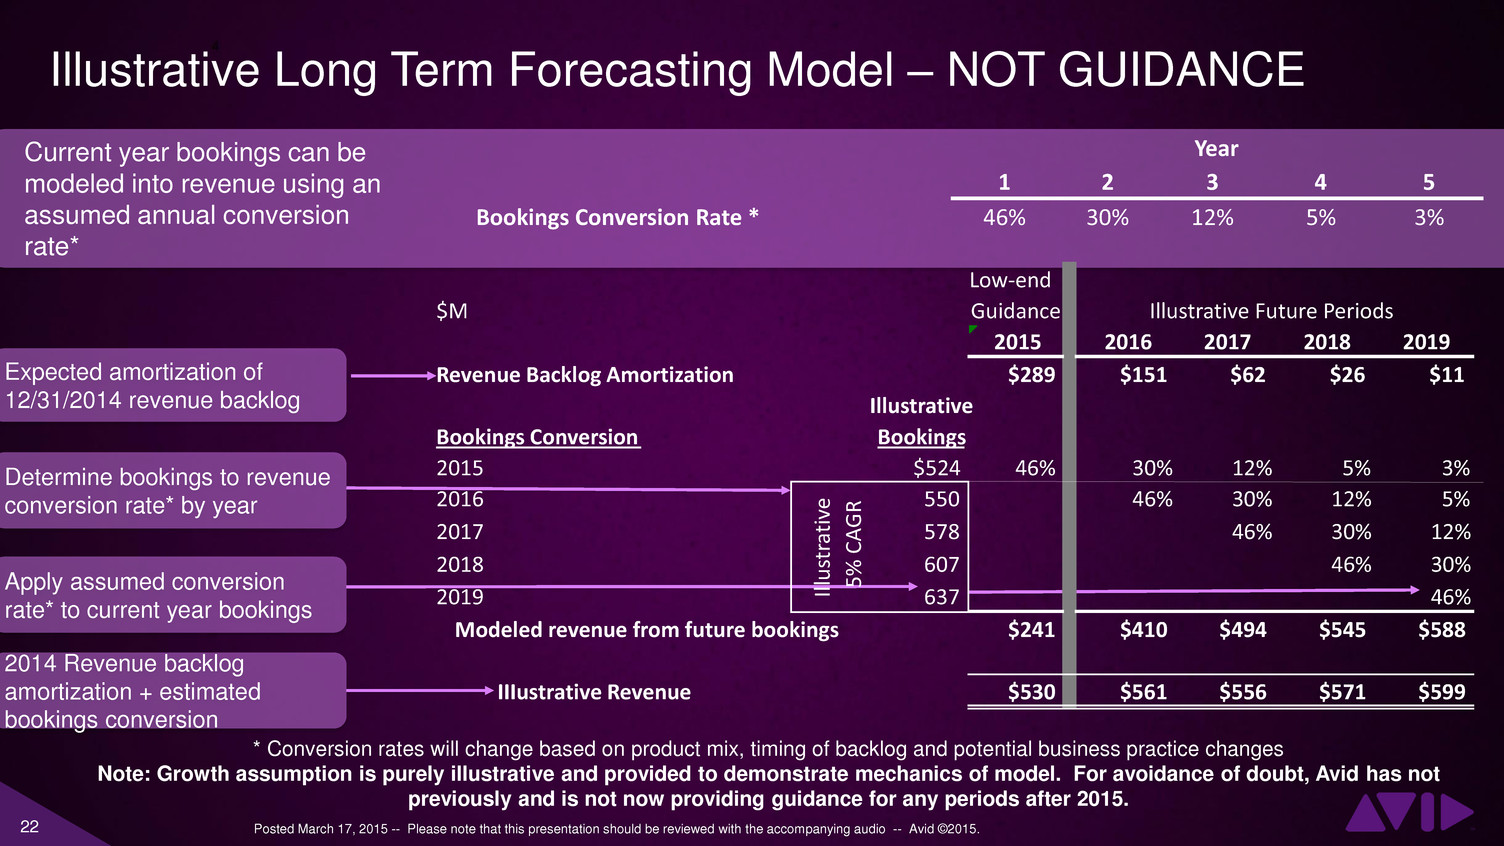
22 Posted March 17, 2015 -- Please note that this presentation should be reviewed with the accompanying audio -- Avid ©2015. Illustrative Long Term Forecasting Model – NOT GUIDANCE Expected amortization of 12/31/2014 revenue backlog Determine bookings to revenue conversion rate* by year 2014 Revenue backlog amortization + estimated bookings conversion Current year bookings can be modeled into revenue using an assumed annual conversion rate* Apply assumed conversion rate* to current year bookings * Conversion rates will change based on product mix, timing of backlog and potential business practice changes Note: Growth assumption is purely illustrative and provided to demonstrate mechanics of model. For avoidance of doubt, Avid has not previously and is not now providing guidance for any periods after 2015. Low-end $M Guidance 2015 2016 2017 2018 2019 Revenue Backlog Amortization $289 $151 $62 $26 $11 Illustrative Bookings Conversion Bookings 2015 $524 46% 30% 12% 5% 3% 2016 550 46% 30% 12% 5% 2017 578 46% 30% 12% 2018 607 46% 30% 2019 637 46% Modeled revenue from future bookings $241 $410 $494 $545 $588 IIIustrative Revenue $530 $561 $556 $571 $599 Ill u st ra ti ve 5% C A G R Illustrative Future Periods 1 2 3 4 5 Bookings Conversion Rate * 46% 30% 12% 5% 3% Year
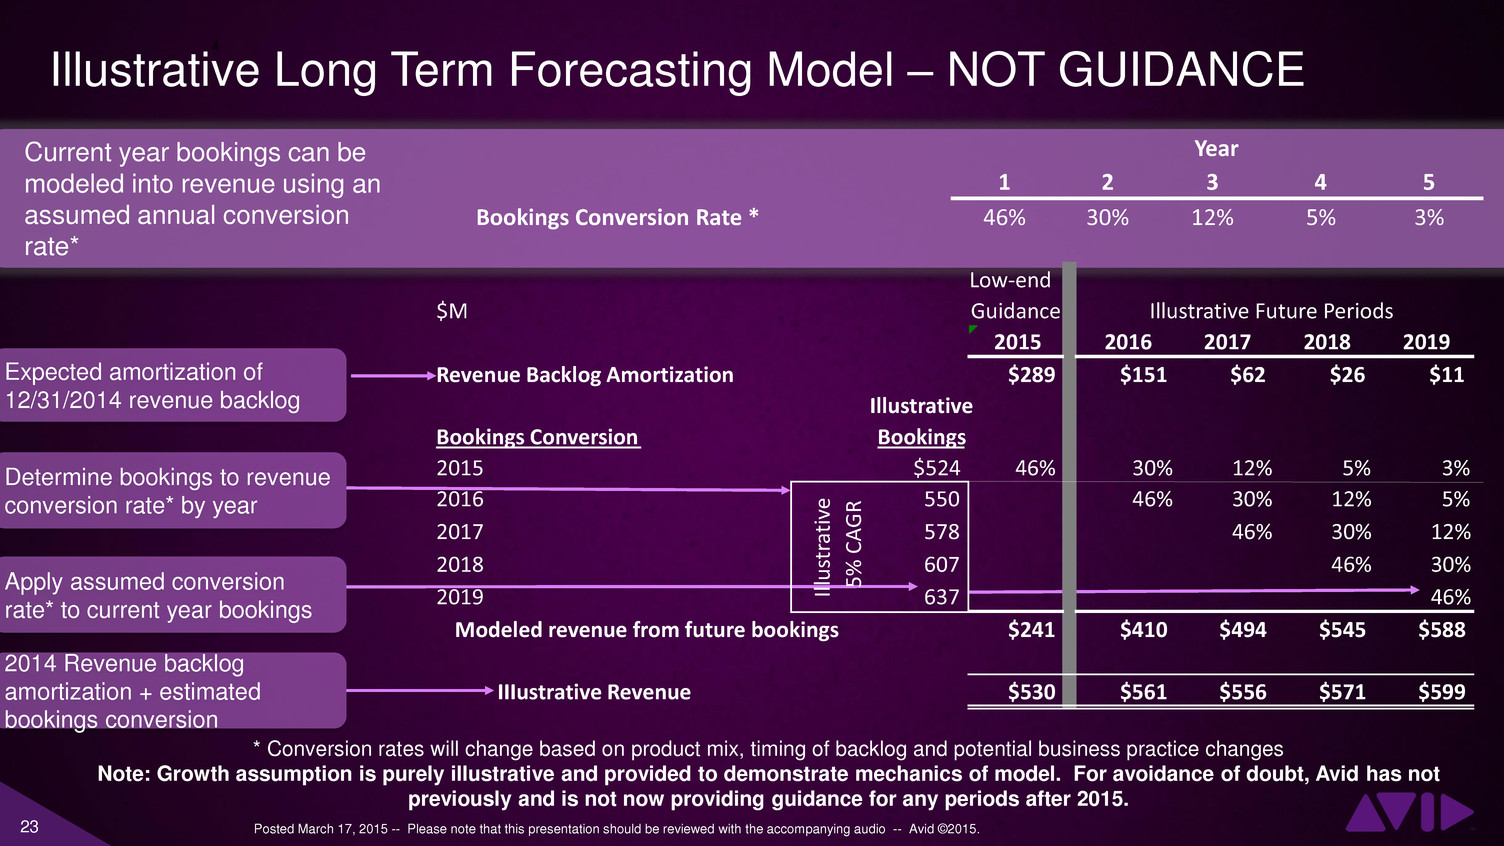
23 Posted March 17, 2015 -- Please note that this presentation should be reviewed with the accompanying audio -- Avid ©2015. Illustrative Long Term Forecasting Model – NOT GUIDANCE Expected amortization of 12/31/2014 revenue backlog Determine bookings to revenue conversion rate* by year 2014 Revenue backlog amortization + estimated bookings conversion Current year bookings can be modeled into revenue using an assumed annual conversion rate* Apply assumed conversion rate* to current year bookings * Conversion rates will change based on product mix, timing of backlog and potential business practice changes Note: Growth assumption is purely illustrative and provided to demonstrate mechanics of model. For avoidance of doubt, Avid has not previously and is not now providing guidance for any periods after 2015. Low-end $M Guidance 2015 2016 2017 2018 2019 Revenue Backlog Amortization $289 $151 $62 $26 $11 Illustrative Bookings Conversion Bookings 2015 $524 46% 30% 12% 5% 3% 2016 550 46% 30% 12% 5% 2017 578 46% 30% 12% 2018 607 46% 30% 2019 637 46% Modeled revenue from future bookings $241 $410 $494 $545 $588 IIIustrative Revenue $530 $561 $556 $571 $599 Ill u st ra ti ve 5% C A G R Illustrative Future Periods 1 2 3 4 5 Bookings Conversion Rate * 46% 30% 12% 5% 3% Year
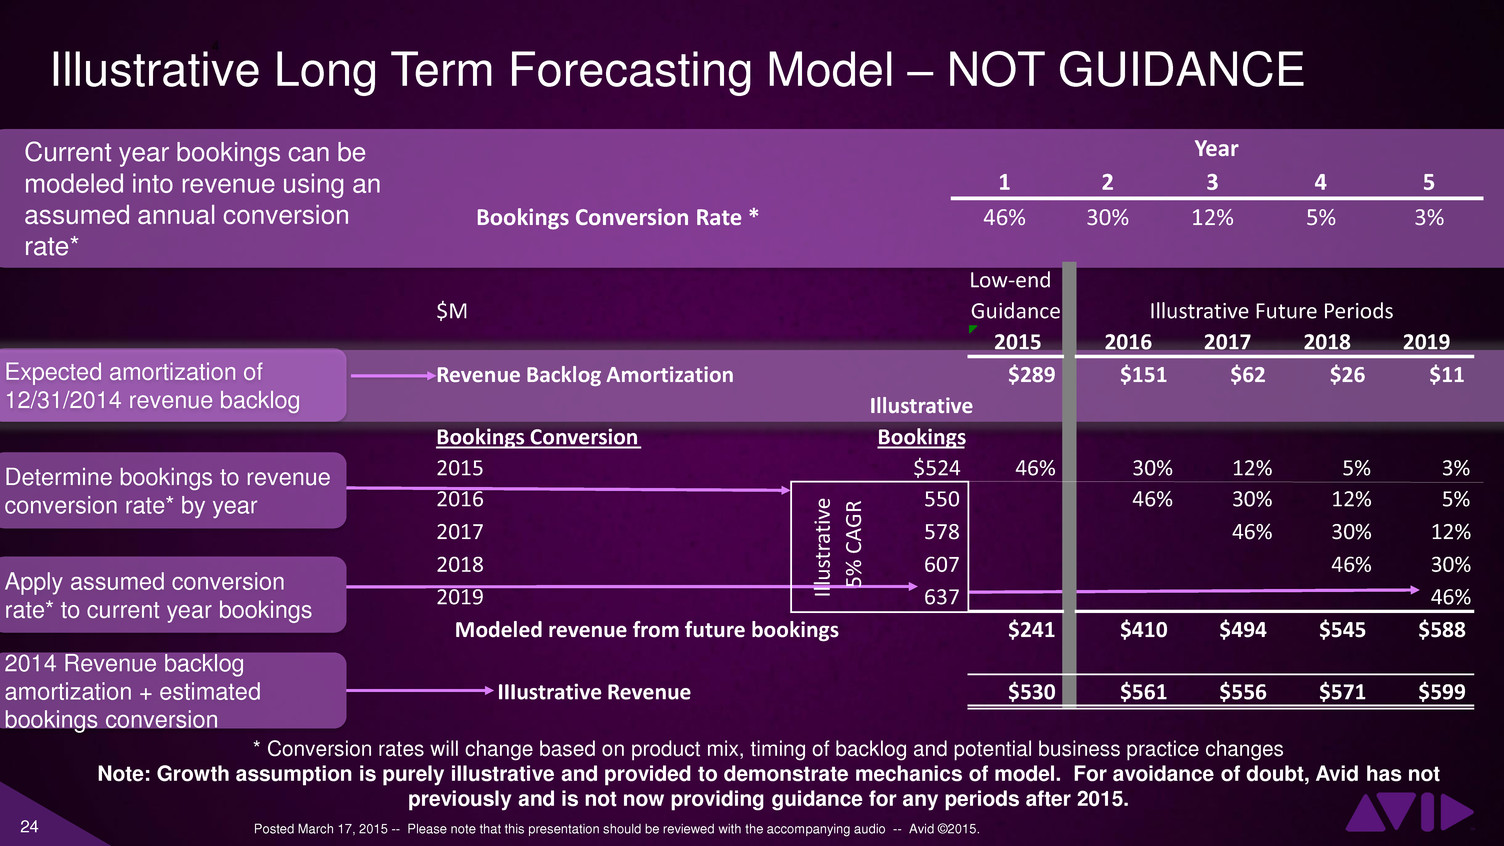
24 Posted March 17, 2015 -- Please note that this presentation should be reviewed with the accompanying audio -- Avid ©2015. Illustrative Long Term Forecasting Model – NOT GUIDANCE Expected amortization of 12/31/2014 revenue backlog Determine bookings to revenue conversion rate* by year 2014 Revenue backlog amortization + estimated bookings conversion Current year bookings can be modeled into revenue using an assumed annual conversion rate* Apply assumed conversion rate* to current year bookings * Conversion rates will change based on product mix, timing of backlog and potential business practice changes Note: Growth assumption is purely illustrative and provided to demonstrate mechanics of model. For avoidance of doubt, Avid has not previously and is not now providing guidance for any periods after 2015. Low-end $M Guidance 2015 2016 2017 2018 2019 Revenue Backlog Amortization $289 $151 $62 $26 $11 Illustrative Bookings Conversion Bookings 2015 $524 46% 30% 12% 5% 3% 2016 550 46% 30% 12% 5% 2017 578 46% 30% 12% 2018 607 46% 30% 2019 637 46% Modeled revenue from future bookings $241 $410 $494 $545 $588 IIIustrative Revenue $530 $561 $556 $571 $599 Ill u st ra ti ve 5% C A G R Illustrative Future Periods 1 2 3 4 5 Bookings Conversion Rate * 46% 30% 12% 5% 3% Year
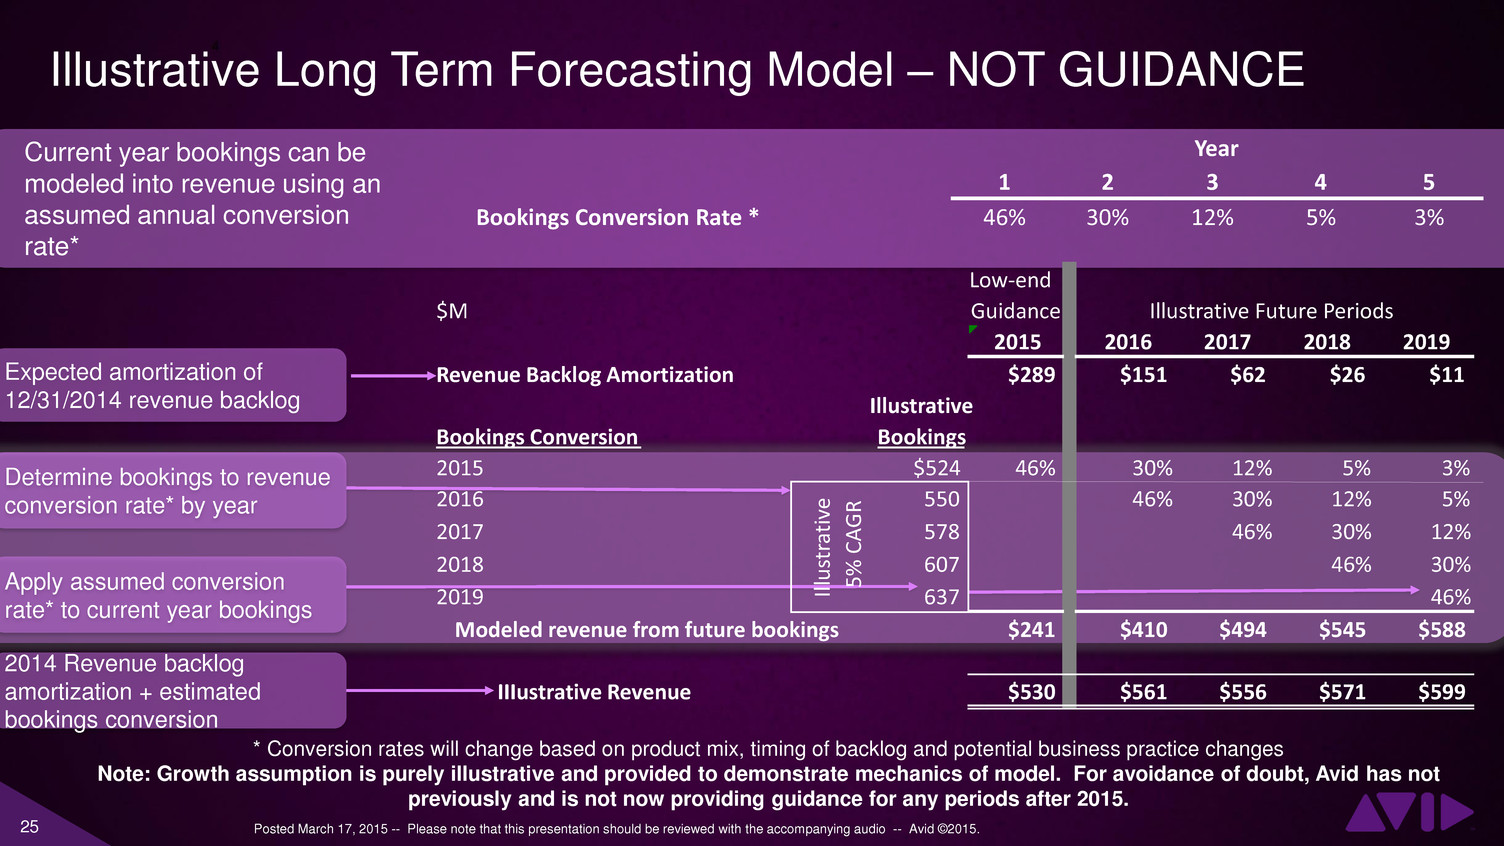
25 Posted March 17, 2015 -- Please note that this presentation should be reviewed with the accompanying audio -- Avid ©2015. Illustrative Long Term Forecasting Model – NOT GUIDANCE Expected amortization of 12/31/2014 revenue backlog Determine bookings to revenue conversion rate* by year 2014 Revenue backlog amortization + estimated bookings conversion Current year bookings can be modeled into revenue using an assumed annual conversion rate* Apply assumed conversion rate* to current year bookings * Conversion rates will change based on product mix, timing of backlog and potential business practice changes Note: Growth assumption is purely illustrative and provided to demonstrate mechanics of model. For avoidance of doubt, Avid has not previously and is not now providing guidance for any periods after 2015. Low-end $M Guidance 2015 2016 2017 2018 2019 Revenue Backlog Amortization $289 $151 $62 $26 $11 Illustrative Bookings Conversion Bookings 2015 $524 46% 30% 12% 5% 3% 2016 550 46% 30% 12% 5% 2017 578 46% 30% 12% 2018 607 46% 30% 2019 637 46% Modeled revenue from future bookings $241 $410 $494 $545 $588 IIIustrative Revenue $530 $561 $556 $571 $599 Ill u st ra ti ve 5% C A G R Illustrative Future Periods 1 2 3 4 5 Bookings Conversion Rate * 46% 30% 12% 5% 3% Year

Avid Investor Relations Tom Fitzsimmons (978) 640-3346 tom.fitzsimmons@avid.com

Posted March 17, 2015 -- Please note that this presentation should be reviewed with the accompanying audio -- Avid ©2015. Appendix
28 Posted March 17, 2015 -- Please note that this presentation should be reviewed with the accompanying audio -- Avid ©2015. Bookings Bookings represent total revenue Avid expects to earn over the term of the agreement for goods and /or services provided Bookings reflect firm orders as documented with persuasive evidence of an agreement and a reasonable assurance that amounts payable under the arrangement are collectable Bookings are subject to cancellations, changes and adjustments and are based on certain assumptions. Bookings may not reflect final revenue earned for a particular arrangement. Bookings do not reflect adjustments related to rebates or other sales incentive programs The material weaknesses in our internal control environment may impact the accuracy of recorded bookings
29 Posted March 17, 2015 -- Please note that this presentation should be reviewed with the accompanying audio -- Avid ©2015. Revenue Backlog We define revenue backlog as firm orders received including (i) orders where the customer has paid in advance of our performance obligations being fulfilled, and (ii) orders for future product deliveries or services that have not yet been invoiced by us. We generally ship our products shortly after the receipt of an order. Orders that may exist at the end of a quarter and have not been shipped are not recognized as revenue and are included in revenue backlog. Certain orders included in revenue backlog may be reduced, canceled or deferred by our customers. The expected timing of the recognition or amortization of revenue backlog into revenue is based on current estimates and could change based on a number of factors, including (i) the timing of delivery of products and services, (ii) customer cancellations or change orders, (iii) changes in the estimated period of time Implied Maintenance Release PCS is provided to customers or (iv) changes in accounting standards or policies. Implied Maintenance Release PCS, as we define it, is the implicit obligation to make software updates available to customers over a period of time which represents implied post-contract customer support and is deemed to be a deliverable in each arrangement and accounted for as a separate element. As there is no industry standard definition of revenue backlog, our reported revenue backlog may not be comparable with other companies. Additional information on our revenue backlog can be found in the section called “Management’s Discussion and Analysis of Financial Condition and Results of Operation” in our Form 10-K for fiscal year ended December 31, 2014 filed with the SEC.


