UNITED STATES SECURITIES AND EXCHANGE COMMISSION
Washington, D.C. 20549
FORM N-CSR
CERTIFIED SHAREHOLDER REPORT OF REGISTERED MANAGEMENT
INVESTMENT COMPANIES
Investment Company Act file number: 811-07460
Exact name of registrant as specified in charter:
Delaware Investments® Dividend and Income Fund, Inc.
Address of principal executive offices:
2005 Market Street
Philadelphia, PA 19103
Name and address of agent for service:
David F. Connor, Esq.
2005 Market Street
Philadelphia, PA 19103
Registrant’s telephone number, including area code: (800) 523-1918
Date of fiscal year end: November 30
Date of reporting period: November 30, 2009
Item 1. Reports to Stockholders
| |
| |
| |
| |
| Annual Report | Delaware
Investments®
Dividend and
Income Fund, Inc. |
| |
| | November 30, 2009 |
| | |
| |
| | |
| |
| |
| |
| |
| |
| |
| | The figures in the annual report for Delaware Investments Dividend and Income Fund, Inc. represent past results, which are not a guarantee of future results. A rise or fall in interest rates can have a significant impact on bond prices. Funds that invest in bonds can lose their value as interest rates rise. |
| |
| |
| |
| |
| | Closed-end fund |
| |
Table of contents
| | > Portfolio management review | | 1 |
| | | |
| > Performance summary | | 4 |
| | | |
| > Security type and top 10 equity holdings | | 6 |
| | | |
| > Statement of net assets | | 8 |
| | | |
| | > Statement of operations | | 17 |
| | | |
| > Statements of changes in net assets | | 18 |
| | | |
| > Statement of cash flows | | 19 |
| | | |
| > Financial highlights | | 20 |
| | | |
| > Notes to financial statements | | 21 |
| | | |
| > Report of independent registered public accounting firm | | 27 |
| | | |
| > Other Fund information | | 28 |
| | | |
| > Board of trustees/directors and officers addendum | | 36 |
| | | |
| > About the organization | | 39 |
On January 4, 2010, Delaware Management Holdings, Inc. and its subsidiaries (collectively known by the marketing name of Delaware Investments) were sold by a subsidiary of Lincoln National Corporation to Macquarie Group Limited, a global provider of banking, financial, advisory, investment and funds management services. Please see recent press releases for more complete information.
Investments in Delaware Investments® Dividend and Income Fund, Inc. are not and will not be deposits with or liabilities of Macquarie Bank Limited ABN 46 008 583 542 and its holding companies, including subsidiaries or related companies, and are subject to investment risk, including possible delays in repayment and loss of income and capital invested. No Macquarie Group company guarantees or will guarantee the performance of the Fund, the repayment of capital from the Fund, or any particular rate of return.
Views expressed herein are current as of Dec. 8, 2009, and are subject to change.
Funds are not FDIC insured and are not guaranteed. It is possible to lose the principal amount invested.
Mutual fund advisory services are provided by Delaware Management Company, a series of Delaware Management Business Trust, which is a registered investment advisor. Delaware Investments is the marketing name of Delaware Management Holdings, Inc. and its subsidiaries. Macquarie Group refers to Macquarie Group Limited and its subsidiaries and affiliates worldwide.
© 2010 Delaware Management Holdings, Inc.
All third-party trademarks cited are the property of their respective owners.
Portfolio management review
Delaware Investments® Dividend and Income Fund, Inc.
Dec. 8, 2009
| Performance preview (for the period ended Nov. 30, 2009) | | | | |
| Delaware Investments Dividend and Income Fund, Inc. @ market price | | 1-year return | | +86.93% |
| Delaware Investments Dividend and Income Fund, Inc. @ NAV | | 1-year return | | +53.26% |
| Lipper Closed-end Income and Preferred Stock Funds Average @ market price | | 1-year return | | +72.45% |
| Lipper Closed-end Income and Preferred Stock Funds Average @ NAV | | 1-year return | | +54.38% |
Past performance does not guarantee future results.
For complete, annualized performance for Delaware Investments Dividend and Income Fund, Inc., please see the table on page 4.
Index performance returns do not reflect any management fees, transaction costs, or expenses. Indices are unmanaged and one cannot invest directly in an index. |
Delaware Investments Dividend and Income Fund, Inc. returned + 53.26% at net asset value and +86.93% at market price (both figures reflect all distributions reinvested) for the fiscal year ended Nov. 30, 2009. Complete, annualized performance information for Delaware Investments Dividend and Income Fund, Inc. is shown in the table on page 4.
Prices of risky assets fell steeply before recovery
The fiscal year was largely a story in two parts. The period began amid the worst economic and financial markets that the portfolio management team has ever witnessed. The latter part of the period, however, featured a considerable recovery, with what the team viewed as attractive opportunities within both the fixed income and equity markets.
At the start of the fiscal period, financial markets were still reacting to the jolt received when storied Wall Street investment bank Lehman Brothers declared bankruptcy in September 2008. The bankruptcy, followed soon after by the federal bailout of insurance giant American International Group (AIG), sent the financial markets into a near panic. Risk aversion had become extreme by late 2008 and investors generally fled “risk” assets for the relative safety of securities issued by the U.S. government and other sovereign entities. Signs of the fallout from the financial crisis were abundant, both in the economy and in the securities markets.
The S&P 500 Index, a measure of the broad stock market in the United States, dropped by March 2009 to its lowest level since September 1996. Meanwhile, high yield bond spreads (which are used to measure a bond’s perceived level of risk) in the U.S. peaked in December 2008 at 21.0% as measured by J.P. Morgan, a level not seen since January 1995. (Source: Bloomberg.)
The prices of energy and commodities also fell sharply during the first half of the year, before starting to recover during the latter half. In early March 2009, the broad-based Thomson Reuters/Jefferies CRB Commodity Index dropped to its lowest level since January 2002 (source: Bloomberg). The price of crude oil also sank, with the West Texas Intermediate (a type of crude oil used as a benchmark in oil pricing) hitting a low of $31 a barrel in late December 2008, a full 78% below its all-time peak price of $145 in early July 2008 (source: Bloomberg).
Global equity and fixed income markets touched lows in March, and then began to recover vigorously for much of the rest of the period. Governments and central banks around the world stressed their intentions of continuing to provide support for economic recovery for as long as necessary, which helped investors become more willing to accept risk. At first, many investors began to reach for risk at the expense of quality, within both the equity and fixed income markets. Lower-rated bonds, for example, significantly outperformed their higher-rated peers during the spring and summer months, while stocks of many companies with questionable fundamentals outpaced those of fundamentally solid companies. As the market recovery matured, however, it broadened to include almost every corner of the market, including higher-quality securities.
Importantly, economies around the world began to show early signs of stabilization and cyclical recovery. During the third calendar quarter of 2009, in fact, the
The views expressed are current as of the date of this report and are subject to change.
(continues) 1
Portfolio management review
Delaware Investments® Dividend and Income Fund, Inc.
U.S. economy expanded by an estimated 2.8%, according to the U.S. Commerce Department’s reading of GDP released in November. It was the fastest growth in the past two years.
Fund positioning
The Fund’s primary objective is to seek high current income, with a secondary objective of capital appreciation. In managing the Fund, we pursue these goals by investing broadly in a range of income-generating securities. These include core fixed income holdings (such as Treasury and agency securities) as well as investment grade and high yield corporate bonds, convertible bonds, real estate investment trusts (REITs), and large-cap value stocks.
Broadly speaking, we positioned the Fund defensively as the period began. When determining the Fund’s asset allocation at a portfolio level, for instance, we placed an emphasis on fixed income securities and convertible bonds over equities and REITs. From a risk-reward perspective, we tended to find fixed income asset classes as more appropriate for the Fund.
Among corporate bonds, for example, yields rose to historically high levels during the opening months of the period. Because prices decline as yields rise, the high yields on corporate bonds reflected the extreme risk aversion by investors at that time, and also highlighted some extraordinary value opportunities in our opinion. Although corporate bonds were affected by the difficult investment climate early in the period, both high yield and investment grade corporate bond positions within the Fund ultimately contributed performance for the fiscal year. Both asset classes performed well during the market’s recovery, and high yield bonds’ rebound was particularly notable.
Within high yield, the Fund generally carried a heavy position in speculative B-rated securities because we believed that the most favorable risk and reward opportunities existed there. Conversely, we maintained less exposure to bonds with a higher BB rating, which is just below investment grade.
Our limited exposure to BB-rated bonds moderated Fund returns, however, because these bonds were among the better-performing bonds within the high yield asset class. (Credit ratings based on Standard & Poor’s opinion.)
The Fund’s increased exposure to convertible bonds also added to its overall performance. We added to convertible bond exposure because we believed the combination of yield, capital structure positioning, and potential upside made them attractive.
Among our REIT holdings, we continued to employ our “bottom up” security selection strategy, in which we evaluate potential investments one by one, based on our assessment of each company’s growth prospects, relative valuation, and balance-sheet quality (among other factors). Given the highly volatile conditions of the fiscal year, however, our approach was more opportunistic than usual, as we sought to take advantage of shifting opportunities in the marketplace.
Early on, as the investment environment deteriorated, we made our REIT holdings more defensive by focusing on companies with longer lease terms, including healthcare and “triple net” REITs. Triple-net leases, in which tenants pay all property maintenance costs in addition to rent, tend to be relatively defensive because they provide a greater income stream to landlords. Simultaneously, we limited our exposure to companies with shorter-duration leases, such as hotel companies, which tend to have uncertain cash flows relative to other sectors. We also looked to avoid stocks of companies with what we believed were significant balance-sheet problems.
This defensive stance was generally beneficial to Fund performance during the downturn. Nonetheless, we calculated that the recovery would be much shorter than it turned out to be when credit markets loosened and the REIT market advanced. In actuality, credit conditions continued to improve, and by summer it was evident that a longer-lived improvement was taking place. Our maintenance of cautious positioning for a time caused the Fund’s REIT positions to trail the broader market gains during some of the rally.
2
The gains made during the fiscal year by the Fund’s large-cap value equity holdings were more subdued than those of its high yield fixed income or REIT holdings. Much of the performance gains (versus the broader equity markets) from this equity allocation relative to the S&P 500 Index came in periods of market decline, such as the first several months of the period and again in October 2009.
This trend has been consistent with the aim of our management approach; through our value-oriented, defensive style, we seek to do well in relative terms in down markets by minimizing losses. The biggest positive for the Fund’s large-cap value holdings came from de-emphasizing the financial sector, the hardest-hit group in the marketplace during the downturn. Fund returns were negatively affected by our holdings in both the materials and industrials sectors, two groups in which our security selection proved disappointing.
We recognize that the recent environment, one in which investors could be rewarded for simply increasing the amount of risk within their portfolios, cannot last forever. With this in mind, the Fund continued at the portfolio level to be positioned generally defensively at fiscal year end, based on our opinion of relative value opportunities among asset classes.
3
Performance summary
Delaware Investments® Dividend and Income Fund, Inc.
The performance data quoted represent past performance; past performance does not guarantee future results. Investment return and principal value will fluctuate so your shares, when sold, may be worth more or less than their original cost. Current performance may be lower or higher than the performance data quoted. Funds that invest in bonds can lose their value as interest rates rise, and an investor can lose principal. Please obtain the performance data for the most recent month end by calling 800 523-1918.
A rise or fall in interest rates can have a significant impact on bond prices and the net asset value (NAV) of the Fund.
| Fund performance | | | | | | | |
| Average annual total returns | | | | | | | |
| Through Nov. 30, 2009 | 1 year | | 5 years | | 10 years | | Lifetime |
| At market price | 86.93% | | 0.13% | | 5.96% | | 5.94% |
| At net asset value | 53.26% | | -0.53% | | 5.14% | | 3.80% |
Instances of high double-digit returns are unusual, cannot be sustained, and were primarily achieved during favorable market conditions.
Diversification may not protect against market risk.
Fixed income securities and bond funds can lose value, and investors can lose principal, as interest rates rise. They also may be affected by economic conditions that hinder an issuer’s ability to make interest and principal payments on its debt. The Fund may also be subject to prepayment risk, the risk that the principal of a fixed income security that is held by the Fund may be prepaid prior to maturity, potentially forcing the Fund to reinvest that money at a lower interest rate. High yielding, noninvestment grade bonds (junk bonds) involve higher risk than investment grade bonds.
Narrowly focused investments may exhibit higher volatility than investments in multiple industry sectors. REIT investments are subject to many of the risks associated with direct real estate ownership, including changes in economic conditions, credit risk, and interest rate fluctuations.
The Fund may invest in derivatives, which may involve additional expenses and are subject to risk, including the risk that an underlying security or securities index moves in the opposite direction from what the portfolio manager anticipated. A derivative transaction depends upon the counterparties’ ability to fulfill their contractual obligations.
The “Fund performance” table and the “Performance of a $10,000 investment” graph do not reflect the deduction of taxes the shareholder would pay on Fund distributions or redemptions of Fund shares.
Returns reflect the reinvestment of all distributions. Dividends and distributions, if any, are assumed, for the purpose of this calculation to be reinvested at prices obtained under the Fund’s dividend reinvestment policy. Shares of the Fund were initially offered with a sales charge of 6%. Performance since inception does not include the sales charge or any other brokerage commission for purchases made since inception. Past performance is not a guarantee of future results.
| Fund basics |
| As of Nov. 30, 2009 |
| |
| Fund objectives |
| The Fund seeks to achieve high current income. Capital appreciation is a secondary objective. |
| |
| Total Fund net assets |
| $66 million |
| |
| Number of holdings |
| 427 |
| Fund start date |
| March 26, 1993 |
| |
| NYSE symbol |
| DDF |
4
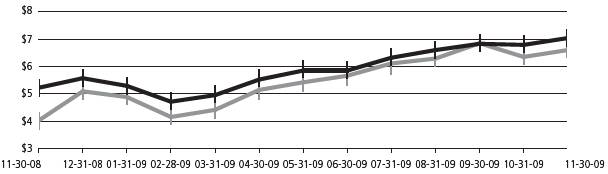
Market price versus net asset value (see notes below)
Nov. 30, 2008, through Nov. 30, 2009
| | | Starting value | | Ending value |
| | | (Nov. 30, 2008) | | (Nov. 30, 2009) |
| | Delaware Investments® Dividend and Income Fund, Inc. @ NAV | $5.22 | | $7.04 |
| | Delaware Investments Dividend and Income Fund, Inc. @ Market price | $4.02 | | $6.60 |
Past performance is not a guarantee of future results.
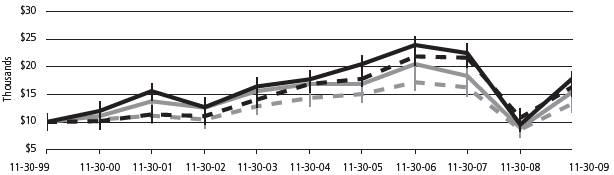
Performance of a $10,000 Investment
Average annual total returns from Nov. 30, 1999, through Nov. 30, 2009
| | | Starting value | | Ending value |
| | | | (Nov. 30, 1999) | | (Nov. 30, 2009) |
| | Delaware Investments Dividend and Income Fund, Inc. @ Market price | $10,000 | | $17,867 |
|
| | Delaware Investments Dividend and Income Fund, Inc. @ NAV | $10,000 | | $16,463 |
| | Lipper Closed-end Income and Preferred Stock Funds Average @ Market price | $10,000 | | $15,411 |
|
| | Lipper Closed-end Income and Preferred Stock Funds Average @ NAV | $10,000 | | $13,327 |
The chart assumes $10,000 invested in the Fund on Nov. 30, 1999, and includes the reinvestment of all distributions at market value. The chart assumes $10,000 invested in the Lipper Closed-end Income and Preferred Stock Funds Average at market price and at NAV. Performance of the Fund and the Lipper class at market value is based on market performance during the period. Performance of the Fund and Lipper class at NAV is based on the fluctuations in NAV during the period. Delaware Investments Dividend and Income Fund, Inc. was initially offered with a sales charge of 6%. Performance shown in both charts above does not include fees, the initial sales charge, or any brokerage commissions for purchases. Investments in the Fund are not available at NAV.
The Lipper Closed-end Income and Preferred Stock Funds Average represents the average return of closed-end income and preferred stock mutual funds tracked by Lipper (source: Lipper).
Market price is the price an investor would pay for shares of the Fund on the secondary market. NAV is the total value of one fund share, generally equal to a fund’s net assets divided by the number of shares outstanding.
Past performance is not a guarantee of future results.
5
Security type and top 10 equity holdings
Delaware Investments® Dividend and Income Fund, Inc.
As of November 30, 2009
Sector designations may be different than the sector designations presented in other Fund materials. The sector designations may represent the investment manager’s internal sector classifications, which may result in the sector designations for one fund being different than another fund’s sector designations.
| Percentage |
| Security Type | of Net Assets |
| Common Stock | 66.34 | % |
| Consumer Discretionary | 3.42 | % |
| Consumer Staples | 10.08 | % |
| Diversified REITs | 0.75 | % |
| Energy | 6.16 | % |
| Financials | 5.18 | % |
| Health Care | 10.84 | % |
| Health Care REITs | 2.76 | % |
| Hotel REITs | 0.37 | % |
| Industrial REITs | 0.34 | % |
| Industrials | 3.50 | % |
| Information Technology | 6.86 | % |
| Mall REITs | 1.60 | % |
| Materials | 1.67 | % |
| Mortgage REITs | 0.50 | % |
| Multifamily REITs | 1.39 | % |
| Office REITs | 1.37 | % |
| Office/Industrial REITs | 0.53 | % |
| Real Estate Operating REITs | 0.47 | % |
| Self-Storage REITs | 0.62 | % |
| Shopping Center REITs | 0.59 | % |
| Specialty REITs | 0.87 | % |
| Telecommunications | 3.12 | % |
| Utilities | 3.35 | % |
| Convertible Preferred Stock | 2.64 | % |
| Preferred Stock | 0.25 | % |
| Convertible Bonds | 14.05 | % |
| Aerospace & Defense | 0.77 | % |
| Automobiles | 0.26 | % |
| Banking, Finance & Insurance | 0.16 | % |
| Basic Materials | 1.01 | % |
| Building & Materials | 0.15 | % |
| Cable, Media & Publishing | 0.24 | % |
| Computers & Technology | 2.31 | % |
| Electronics & Electrical Equipment | 0.13 | % |
| Energy | 0.39 | % |
| Health Care & Pharmaceuticals | 2.59 | % |
| Leisure, Lodging & Entertainment | 0.61 | % |
| Real Estate | 1.74 | % |
| Retail | 0.23 | % |
| Telecommunications | 2.57 | % |
| Transportation | 0.39 | % |
| Utilities | 0.50 | % |
| Corporate Bonds | 43.08 | % |
| Banking | 2.11 | % |
| Basic Industry | 4.76 | % |
| Brokerage | 0.56 | % |
| Capital Goods | 3.29 | % |
| Consumer Cyclical | 5.34 | % |
| Consumer Non-Cyclical | 3.03 | % |
| Energy | 3.99 | % |
| Finance & Investments | 1.26 | % |
| Media | 3.09 | % |
| Real Estate | 0.23 | % |
| Services Cyclical | 4.24 | % |
| Services Non-Cyclical | 1.70 | % |
| Technology & Electronics | 1.34 | % |
| Telecommunications | 6.27 | % |
| Utilities | 1.87 | % |
| Senior Secured Loans | 0.57 | % |
| Exchange Traded Fund | 0.03 | % |
| Limited Partnerships | 0.24 | % |
| Warrant | 0.00 | % |
| Discount Note | 2.39 | % |
| Securities Lending Collateral | 6.11 | % |
| Total Value of Securities | 135.70 | % |
| Obligation to Return Securities Lending Collateral | (6.39 | %) |
| Borrowing Under Line of Credit | (30.45 | %) |
| Receivables and Other Assets Net of Liabilities | 1.14 | % |
| Total Net Assets | 100.00 | % |
6
Holdings are for informational purposes only and are subject to change at any time. They are not a recommendation to buy, sell, or hold any security.
| Percentage |
| Top 10 Equity Holdings | of Net Assets |
| Pfizer | 2.10 | % |
| Merck | 2.09 | % |
| Travelers | 2.00 | % |
| International Business Machines | 1.98 | % |
| Cardinal Health | 1.93 | % |
| Kimberly-Clark | 1.92 | % |
| Intel | 1.82 | % |
| Heinz (H.J.) | 1.75 | % |
| Edison International | 1.74 | % |
| Archer-Daniels-Midland | 1.72 | % |
7
Statement of net assets
Delaware Investments® Dividend and Income Fund, Inc.
November 30, 2009
| | | Number of | | | |
| | | | Shares | | Value |
| Common Stock – 66.34% | | | | | |
| Consumer Discretionary – 3.42% | | | | | |
| =∏† | Avado Brands | | 1,390 | | $ | 0 |
| *† | DIRECTV Class A | | 1,550 | | | 49,027 |
| Lowe’s | | 51,200 | | | 1,116,672 |
| Mattel | | 56,800 | | | 1,105,328 |
| | | | | | 2,271,027 |
| Consumer Staples – 10.08% | | | | | |
| Archer-Daniels-Midland | | 37,100 | | | 1,143,051 |
| CVS Caremark | | 35,900 | | | 1,113,259 |
| Heinz (H.J.) | | 27,400 | | | 1,163,130 |
| Kimberly-Clark | | 19,300 | | | 1,273,221 |
| Kraft Foods Class A | | 37,000 | | | 983,460 |
| Safeway | | 45,400 | | | 1,021,500 |
| | | | | | 6,697,621 |
| Diversified REITs – 0.75% | | | | | |
| Vornado Realty Trust | | 7,638 | | | 499,983 |
| | | | | | 499,983 |
| Energy – 6.16% | | | | | |
| Chevron | | 12,600 | | | 983,304 |
| ConocoPhillips | | 19,500 | | | 1,009,515 |
| Marathon Oil | | 32,500 | | | 1,060,150 |
| National Oilwell Varco | | 24,200 | | | 1,041,084 |
| | | | | | 4,094,053 |
| Financials – 5.18% | | | | | |
| Allstate | | 36,600 | | | 1,039,806 |
| Bank of New York Mellon | | 36,700 | | | 977,688 |
| † | Global Brands Acquisition | | 9,100 | | | 89,271 |
| Travelers | | 25,400 | | | 1,330,706 |
| | | | | | 3,437,471 |
| Health Care – 10.84% | | | | | |
| † | Alliance HealthCare Services | | 5,127 | | | 30,352 |
| † | Bristol-Myers Squibb | | 42,200 | | | 1,068,082 |
| Cardinal Health | | 39,800 | | | 1,282,754 |
| Johnson & Johnson | | 17,000 | | | 1,068,280 |
| Merck | | 38,384 | | | 1,389,890 |
| Pfizer | | 76,789 | | | 1,395,255 |
| Quest Diagnostics | | 16,700 | | | 967,598 |
| | | | | | 7,202,211 |
| Health Care REITs – 2.76% | | | | | |
| HCP | | 15,650 | | | 489,845 |
| Health Care REIT | | 9,060 | | | 403,623 |
| LTC Properties | | 3,800 | | | 97,698 |
| Nationwide Health Properties | | 8,800 | | | 299,288 |
| * | Omega Healthcare Investors | | 7,900 | | | 142,911 |
| Ventas | | 9,375 | | | 402,469 |
| | | | | | 1,835,834 |
| Hotel REITs – 0.37% | | | | | |
| Host Hotels & Resorts | | 23,100 | | | 243,012 |
| | | | | | 243,012 |
| Industrial REITs – 0.34% | | | | | |
| AMB Property | | 1,280 | | | 30,144 |
| ProLogis | | 15,000 | | | 196,200 |
| | | | | | 226,344 |
| Industrials – 3.50% | | | | | |
| † | Delta Air Lines | | 4 | | | 33 |
| † | Flextronics International | | 4,400 | | | 31,108 |
| † | Foster Wheeler | | 2 | | | 60 |
| * | Grupo Aeroportuario del Centro | | | | | |
| Norte ADR | | 5,800 | | | 70,818 |
| *† | Mobile Mini | | 1,651 | | | 25,112 |
| Northrop Grumman | | 19,900 | | | 1,090,520 |
| ∏=† | PT Holdings | | 350 | | | 4 |
| Waste Management | | 33,700 | | | 1,106,707 |
| | | | | | 2,324,362 |
| Information Technology – 6.86% | | | | | |
| Intel | | 63,100 | | | 1,211,520 |
| International Business Machines | | 10,400 | | | 1,314,040 |
| † | Motorola | | 124,800 | | | 999,648 |
| Xerox | | 134,200 | | | 1,033,340 |
| | | | | | 4,558,548 |
| Mall REITs – 1.60% | | | | | |
| † | General Growth Properties | | 6 | | | 39 |
| * | Macerich | | 8,265 | | | 245,966 |
| Simon Property Group | | 11,278 | | | 819,460 |
| | | | | | 1,065,465 |
| Materials – 1.67% | | | | | |
| duPont (E.I.) deNemours | | 32,100 | | | 1,110,018 |
| | | | | | 1,110,018 |
| Mortgage REITs – 0.50% | | | | | |
| Annaly Capital Management | | 2,300 | | | 42,343 |
| Chimera Investment | | 23,800 | | | 95,914 |
| Cypress Sharpridge Investments | | 14,800 | | | 193,880 |
| | | | | | 332,137 |
| Multifamily REITs – 1.39% | | | | | |
| Apartment Investment & | | | | | |
| Management | | 7,968 | | | 107,648 |
| BRE Properties | | 4,600 | | | 144,118 |
| Camden Property Trust | | 3,450 | | | 133,688 |
| Equity Residential | | 16,600 | | | 534,685 |
| | | | | | 920,139 |
| Office REITs – 1.37% | | | | | |
| * | Alexandria Real Estate Equities | | 3,090 | | | 174,183 |
| * | Boston Properties | | 3,000 | | | 200,940 |
| Brandywine Realty Trust | | 11,500 | | | 112,930 |
| Government Properties Income Trust | | 4,800 | | | 119,856 |
| Highwoods Properties | | 5,700 | | | 174,477 |
| Mack-Cali Realty | | 4,250 | | | 130,433 |
| | | | | | 912,819 |
| Office/Industrial REITs – 0.53% | | | | | |
| * | Digital Realty Trust | | 5,550 | | | 270,063 |
| Liberty Property Trust | | 2,700 | | | 80,028 |
| | | | | | 350,091 |
| Real Estate Operating REITs – 0.47% | | | | | |
| Starwood Property Trust | | 16,000 | | | 310,400 |
| | | | | | 310,400 |
8
| | | Number of | | | |
| | Shares | | Value |
| Common Stock (continued) | | | | | |
| Self-Storage REITs – 0.62% | | | | | |
| Public Storage | | 5,150 | | $ | 409,837 |
| | | | | | 409,837 |
| Shopping Center REITs – 0.59% | | | | | |
| Cedar Shopping Centers | | 5,700 | | | 34,428 |
| * | Federal Realty Investment Trust | | 300 | | | 19,296 |
| Kimco Realty | | 20,430 | | | 251,698 |
| Ramco-Gershenson Properties Trust | | 9,200 | | | 83,720 |
| | | | | | 389,142 |
| Specialty REITs – 0.87% | | | | | |
| Entertainment Properties Trust | | 6,320 | | | 199,649 |
| * | Plum Creek Timber | | 6,885 | | | 237,463 |
| * | Potlatch | | 4,825 | | | 142,048 |
| | | | | | 579,160 |
| Telecommunications – 3.12% | | | | | |
| AT&T | | 33,200 | | | 894,408 |
| =† | Century Communications | | 500,000 | | | 0 |
| Frontier Communications | | 24,400 | | | 192,760 |
| † | GeoEye | | 550 | | | 17,144 |
| Verizon Communications | | 30,700 | | | 965,822 |
| | | | | | 2,070,134 |
| Utilities – 3.35% | | | | | |
| Edison International | | 33,900 | | | 1,154,295 |
| † | Mirant | | 189 | | | 2,691 |
| NorthWestern | | 3,300 | | | 85,107 |
| Progress Energy | | 25,100 | | | 981,159 |
| | | | | | 2,223,252 |
| Total Common Stock (cost $47,571,627) | | | | | 44,063,060 |
| |
| Convertible Preferred Stock – 2.64% | | | | | |
| Banking, Finance & Insurance – 0.71% | | | | | |
| Aspen Insurance 5.625% | | | | | |
| exercise price $29.28, | | | | | |
| expiration date 12/31/49 | | 8,800 | | | 470,800 |
| @ | Fannie Mae 8.75% exercise price | | | | | |
| $32.45, expiration date 5/13/11 | | 3,500 | | | 4,900 |
| | | | | | 475,700 |
| Cable, Media & Publishing – 0.37% | | | | | |
| # | Interpublic Group 144A 5.25% | | | | | |
| exercise price $13.66, | | | | | |
| expiration date 12/31/49 | | 360 | | | 246,690 |
| | | | | | 246,690 |
| Energy – 0.46% | | | | | |
| El Paso Energy Capital Trust I | | | | | |
| 4.75% exercise price $41.59, | | | | | |
| expiration date 3/31/28 | | 5,250 | | | 176,715 |
| Whiting Petroleum 6.25% | | | | | |
| exercise price $43.42, | | | | | |
| expiration date 12/31/49 | | 800 | | | 128,768 |
| | | | | | 305,483 |
| Health Care & Pharmaceuticals – 0.37% | | | | | |
| Mylan 6.50% exercise price $17.08, | | | | | |
| expiration date 11/15/10 | | 220 | | | 245,630 |
| | | | | | 245,630 |
| Telecommunications – 0.73% | | | | | |
| Crown Castle International | | | | | |
| 6.50% exercise price $36.88, | | | | | |
| expiration date 8/15/12 | | 4,450 | | | 256,988 |
| Lucent Technologies Capital Trust I | | | | | |
| 7.75% exercise price $24.80, | | | | | |
| expiration date 3/15/17 | | 305 | | | 225,776 |
| | | | | | 482,764 |
| Total Convertible Preferred Stock | | | | | |
| (cost $1,963,794) | | | | | 1,756,267 |
| |
| Preferred Stock – 0.25% | | | | | |
| Banking, Finance & Insurance – 0.22% | | | | | |
| Bank of America | | | | | |
| 8.00% | | 150,000 | | | 130,834 |
| ·8.125% | | 15,000 | | | 13,084 |
| | | | | | 143,918 |
| Industrials – 0.00% | | | | | |
| †= | Port Townsend | | 70 | | | 0 |
| | | | | | 0 |
| Real Estate – 0.03% | | | | | |
| W2007 Grace Acquisitions I 8.75% | | 34,400 | | | 20,640 |
| | | | | | 20,640 |
| Total Preferred Stock (cost $1,079,051) | | | | | 164,558 |
| |
| | Principal | | | |
| | Amount | | | |
| Convertible Bonds – 14.05% | | | | | |
| Aerospace & Defense – 0.77% | | | | | |
| # | AAR 144A 1.75% exercise price | | | | | |
| | $29.43, expiration date 1/1/26 | $ | 260,000 | | | 240,825 |
| # | L-3 Communications Holdings 144A | | | | | |
| 3.00% exercise price $100.14, | | | | | |
| expiration date 8/1/35 | | 265,000 | | | 272,288 |
| | | | | | 513,113 |
| Automobiles – 0.26% | | | | | |
| Ford Motor 4.25% exercise price | | | | | |
| | $9.30, expiration date 11/15/16 | | 150,000 | | | 171,563 |
| | | | | | 171,563 |
| Banking, Finance & Insurance – 0.16% | | | | | |
| Jefferies Group 3.875% exercise | | | | | |
| price $39.20, expiration | | | | | |
| date 11/1/29 | | 115,000 | | | 107,238 |
| | | | | | 107,238 |
| Basic Materials – 1.01% | | | | | |
| Century Aluminum 1.75% exercise | | | | | |
| price $30.54, expiration | | | | | |
| date 8/1/24 | | 20,000 | | | 18,575 |
| Rayonier TRS Holdings 3.75% exercise | | | | | |
| price $54.82, expiration | | | | | |
| date 10/15/12 | | 345,000 | | | 361,387 |
| # | Sino-Forest 144A 5.00% exercise price | | | | | |
| | $20.29, expiration date 8/1/13 | | 255,000 | | | 290,063 |
| | | | | | 670,025 |
(continues) 9
Statement of net assets
Delaware Investments® Dividend and Income Fund, Inc.
| | | Principal | | | |
| | Amount | | Value |
| Convertible Bonds (continued) | | | | | |
| Building & Materials – 0.15% | | | | | |
| Beazer Homes USA 4.625% | | | | | |
| exercise price $49.64, | | | | | |
| expiration date 6/15/24 | $ | 110,000 | | $ | 100,925 |
| | | | | | 100,925 |
| Cable, Media & Publishing – 0.24% | | | | | |
| Interpublic Group 4.25% | | | | | |
| | exercise price $12.42, | | | | | |
| expiration date 3/15/23 | | 75,000 | | | 73,313 |
| VeriSign 3.25% exercise price | | | | | |
| $34.37, expiration date 8/15/37 | | 105,000 | | | 87,937 |
| | | | | | 161,250 |
| Computers & Technology – 2.31% | | | | | |
| Advanced Micro Devices | | | | | |
| 6.00% exercise price $28.08, | | | | | |
| expiration date 5/1/15 | | 70,000 | | | 61,775 |
| #144A 6.00% exercise price | | | | | |
| $28.08, expiration date 5/1/15 | | 450,000 | | | 397,125 |
| Euronet Worldwide 3.50% | | | | | |
| exercise price $40.48, | | | | | |
| expiration date 10/15/25 | | 435,000 | | | 402,918 |
| Hutchinson Technology 3.25% | | | | | |
| exercise price $36.43, | | | | | |
| expiration date 1/14/26 | | 340,000 | | | 257,975 |
| # | Intel 144A 3.25% exercise price | | | | | |
| $22.68, expiration date 8/1/39 | | 70,000 | | | 77,788 |
| Linear Technology 3.125% | | | | | |
| exercise price $47.33, | | | | | |
| expiration date 5/1/27 | | 120,000 | | | 117,150 |
| SanDisk 1.00% exercise price | | | | | |
| $82.35, expiration date 5/15/13 | | 280,000 | | | 220,500 |
| | | | | | 1,535,231 |
| Electronics & Electrical Equipment – 0.13% | | | | | |
| Flextronics International 1.00% | | | | | |
| exercise price $15.53, | | | | | |
| expiration date 8/1/10 | | 85,000 | | | 83,831 |
| | | | | | 83,831 |
| Energy – 0.39% | | | | | |
| Chesapeake Energy 2.25% | | | | | |
| exercise price $85.89, | | | | | |
| expiration date 12/15/38 | | 220,000 | | | 164,175 |
| Peabody Energy 4.75% exercise price | | | | | |
| $58.44, expiration date 12/15/41 | | 100,000 | | | 98,500 |
| | | | | | 262,675 |
| Health Care & Pharmaceuticals – 2.59% | | | | | |
| # | Allergan 144A 1.50% exercise price | | | | | |
| $63.33, expiration date 4/1/26 | | 415,000 | | | 466,874 |
| Amgen | | | | | |
| 0.375% exercise price $79.48, | | | | | |
| expiration date 2/1/13 | | 235,000 | | | 235,000 |
| #144A 0.375% exercise price | | | | | |
| $79.48, expiration date 2/1/13 | | 165,000 | | | 165,000 |
| Φ | Hologic 2.00% exercise price | | | | | |
| $38.59, expiration date 12/15/37 | | 280,000 | | | 228,200 |
| Inverness Medical Innovations 9.00% | | | | | |
| Series B exercise price $43.98, | | | | | |
| expiration date 5/15/16 | | 215,000 | | | 246,981 |
| LifePoint Hospitals 3.50% | | | | | |
| exercise price $51.79, | | | | | |
| expiration date 5/14/14 | | 110,000 | | | 98,863 |
| Medtronic 1.65% exercise price | | | | | |
| $55.41, expiration date 4/15/13 | | 275,000 | | | 280,844 |
| | | | | | 1,721,762 |
| Leisure, Lodging & Entertainment – 0.61% | | | | | |
| # | Gaylord Entertainment 144A 3.75% | | | | | |
| exercise price $27.25, expiration | | | | | |
| date 9/29/14 | | 220,000 | | | 208,450 |
| # | International Game Technology 144A | | | | | |
| 3.25% exercise price $19.97, | | | | | |
| expiration date 5/1/14 | | 160,000 | | | 196,400 |
| | | | | | 404,850 |
| Real Estate – 1.74% | | | | | |
| # | Corporate Office Properties 144A | | | | | |
| 3.50% exercise price $53.12, | | | | | |
| expiration date 9/15/26 | | 195,000 | | | 184,763 |
| Developers Diversified Realty | | | | | |
| 3.00% exercise price $74.75, | | | | | |
| expiration date 3/15/12 | | 65,000 | | | 59,719 |
| *# | Digital Realty Trust 144A 5.50% | | | | | |
| exercise price $43.00, expiration | | | | | |
| date 4/15/29 | | 220,000 | | | 282,974 |
| @ | MeriStar Hospitality 9.50% | | | | | |
| exercise price $10.18, | | | | | |
| expiration date 4/1/10 | | 230,000 | | | 236,095 |
| National Retail Properties | | | | | |
| 5.125% exercise price $25.42, | | | | | |
| expiration date 6/15/28 | | 210,000 | | | 216,038 |
| | Vornado Realty Trust 2.85% | | | | | |
| exercise price $159.04, | | | | | |
| expiration date 3/15/27 | | 175,000 | | | 175,875 |
| | | | | | 1,155,464 |
| Retail – 0.23% | | | | | |
| Pantry 3.00% exercise price $50.09, | | | | | |
| expiration date 11/15/12 | | 180,000 | | | 151,425 |
| | | | | | 151,425 |
| Telecommunications – 2.57% | | | | | |
| Alaska Communications System | | | | | |
| Group 5.75% exercise price | | | | | |
| $12.90, expiration date 3/1/13 | | 260,000 | | | 235,300 |
| Leap Wireless International 4.50% | | | | | |
| exercise price $93.21, expiration | | | | | |
| date 7/15/14 | | 120,000 | | | 94,800 |
| Level 3 Communications 5.25% | | | | | |
| exercise price $3.98, expiration | | | | | |
| date 12/15/11 | | 180,000 | | | 164,250 |
| NII Holdings 3.125% exercise price | | | | | |
| $118.32, expiration date 6/15/12 | | 410,000 | | | 372,587 |
| Qwest Communications International | | | | | |
| 3.50% exercise price $5.01, | | | | | |
| expiration date 11/15/25 | | 400,000 | | | 401,499 |
| # | SBA Communications 144A 4.00% | | | | | |
| exercise price $30.38, expiration | | | | | |
| date 10/1/14 | | 165,000 | | | 207,488 |
10
| | | Principal | | | |
| | Amount | | Value |
| Convertible Bonds (continued) | | | | | |
| Telecommunications (continued) | | | | | |
| # | Virgin Media 144A 6.50% exercise | | | | | |
| price $19.22, expiration | | | | | |
| | date 11/15/16 | $ | 198,000 | | $ | 231,165 |
| | | | | | 1,707,089 |
| Transportation – 0.39% | | | | | |
| Bristow Group 3.00% exercise price | | | | | |
| | $77.34, expiration date 6/14/38 | | 300,000 | | | 259,500 |
| | | | | | 259,500 |
| Utilities – 0.50% | | | | | |
| Dominion Resources 2.125% | | | | | |
| exercise price $36.14, expiration | | | | | |
| date 12/15/23 | | 290,000 | | | 329,150 |
| | | | | | 329,150 |
| Total Convertible Bonds | | | | | |
| (cost $9,073,391) | | | | | 9,335,091 |
| |
| Corporate Bonds – 43.08% | | | | | |
| Banking – 2.11% | | | | | |
| · | BAC Capital Trust XIV 5.63% 12/31/49 | | 215,000 | | | 143,513 |
| Capital One Capital V 10.25% 8/15/39 | | 135,000 | | | 148,870 |
| · | Citigroup Capital XXI 8.30% 12/21/57 | | 65,000 | | | 58,175 |
| # | GMAC 144A | | | | | |
| 6.00% 12/15/11 | | 71,000 | | | 67,539 |
| 6.625% 5/15/12 | | 85,000 | | | 81,281 |
| 6.875% 9/15/11 | | 174,000 | | | 169,215 |
| 6.875% 8/28/12 | | 196,000 | | | 187,670 |
| JPMorgan Chase Capital XXV | | | | | |
| 6.80% 10/1/37 | | 20,000 | | | 19,788 |
| @ | Popular North America Capital Trust I | | | | | |
| 6.564% 9/15/34 | | 70,000 | | | 51,479 |
| ·# | Rabobank 144A 11.00% 12/29/49 | | 150,000 | | | 185,984 |
| USB Capital IX 6.189% 10/29/49 | | 115,000 | | | 90,850 |
| Zions Bancorporation | | | | | |
| 5.50% 11/16/15 | | 57,000 | | | 39,661 |
| 6.00% 9/15/15 | | 141,000 | | | 98,232 |
| 7.75% 9/23/14 | | 65,000 | | | 57,906 |
| | | | | | 1,400,163 |
| Basic Industry – 4.76% | | | | | |
| # | Algoma Acquisition 144A | | | | | |
| 9.875% 6/15/15 | | 115,000 | | | 98,325 |
| California Steel Industries | | | | | |
| 6.125% 3/15/14 | | 113,000 | | | 105,655 |
| Century Aluminum 7.50% 8/15/14 | | 115,000 | | | 106,375 |
| ·# | Cognis GmbH 144A 2.299% 9/15/13 | | 75,000 | | | 69,000 |
| # | Drummond 144A 9.00% 10/15/14 | | 145,000 | | | 148,625 |
| # | Evraz Group 144A 9.50% 4/24/18 | | 195,000 | | | 196,462 |
| # | FMG Finance 144A 10.625% 9/1/16 | | 90,000 | | | 98,550 |
| Freeport McMoRan Copper & Gold | | | | | |
| 8.25% 4/1/15 | | 120,000 | | | 128,839 |
| 8.375% 4/1/17 | | 10,000 | | | 10,802 |
| * | Hexion US Finance 9.75% 11/15/14 | | 121,000 | | | 116,765 |
| # | Innophos Holdings 144A | | | | | |
| 9.50% 4/15/12 | | 115,000 | | | 115,575 |
| International Coal Group | | | | | |
| 10.25% 7/15/14 | | 163,000 | | | 158,925 |
| # | MacDermid 144A 9.50% 4/15/17 | | 188,000 | | | 187,059 |
| # | Momentive Performance Material | | | | | |
| 144A 12.50% 6/15/14 | | 70,000 | | | 77,000 |
| # | Murray Energy 144A 10.25% 10/15/15 | | 115,000 | | | 113,275 |
| # | NewPage144A 11.375% 12/31/14 | | 145,000 | | | 143,550 |
| · | Noranda Aluminum Acquisition | | | | | |
| PIK 5.274 % 5/15/15 | | 151,023 | | | 110,247 |
| Norske Skog Canada 8.625% 6/15/11 | | 61,000 | | | 45,598 |
| Novelis | | | | | |
| 7.25% 2/15/15 | | 50,000 | | | 45,375 |
| | #144A 11.50% 2/15/15 | | 72,000 | | | 75,240 |
| =@ | Port Townsend 7.32% 8/27/12 | | 102,592 | | | 74,379 |
| Potlatch 12.50% 12/1/09 | | 250,000 | | | 249,999 |
| Ryerson | | | | | |
| ·7.656% 11/1/14 | | 99,000 | | | 87,863 |
| 12.25% 11/1/15 | | 40,000 | | | 40,900 |
| # | Sappi Papier Holding 144A | | | | | |
| 6.75% 6/15/12 | | 101,000 | | | 94,036 |
| # | Steel Capital 144A 9.75% 7/29/13 | | 100,000 | | | 101,125 |
| # | Steel Dynamics 144A 8.25% 4/15/16 | | 127,000 | | | 128,905 |
| # | Teck Resources 144A | | | | | |
| 10.25% 5/15/16 | | 38,000 | | | 43,130 |
| 10.75% 5/15/19 | | 75,000 | | | 87,938 |
| # | Vedanta Resources 144A | | | | | |
| 9.50% 7/18/18 | | 100,000 | | | 99,750 |
| | | | | | 3,159,267 |
| Brokerage – 0.56% | | | | | |
| E Trade Financial PIK | | | | | |
| 12.50% 11/30/17 | | 116,875 | | | 132,069 |
| LaBranche 11.00% 5/15/12 | | 252,000 | | | 243,180 |
| | | | | | 375,249 |
| Capital Goods – 3.29% | | | | | |
| AMH Holdings 11.25% 3/1/14 | | 60,000 | | | 56,550 |
| Associated Materials | | | | | |
| 9.75% 4/15/12 | | 42,000 | | | 42,683 |
| | #144A 9.875% 11/15/16 | | 15,000 | | | 15,750 |
| Building Materials Corporation of | | | | | |
| America 7.75% 8/1/14 | | 104,000 | | | 103,480 |
| # | BWAY 144A 10.00% 4/15/14 | | 123,000 | | | 129,458 |
| ·# | C8 Capital 144A 6.64% 12/31/49 | | 100,000 | | | 70,715 |
| # | CPM Holdings 144A 10.625% 9/1/14 | | 28,000 | | | 29,400 |
| Eastman Kodak 7.25% 11/15/13 | | 99,000 | | | 79,200 |
| * | Graham Packaging Capital I | | | | | |
| 9.875% 10/15/14 | | 123,000 | | | 125,460 |
| # | Graphic Packaging International | | | | | |
| 144A 9.50% 6/15/17 | | 126,000 | | | 133,560 |
| Intertape Polymer 8.50% 8/1/14 | | 100,000 | | | 78,500 |
| JSG Funding 7.75% 4/1/15 | | 210,000 | | | 201,599 |
| # | Plastipak Holdings 144A | | | | | |
| 8.50% 12/15/15 | | 66,000 | | | 66,248 |
| 10.625% 8/15/19 | | 71,000 | | | 78,455 |
(continues) 11
Statement of net assets
Delaware Investments® Dividend and Income Fund, Inc.
| | | Principal | | | |
| | Amount | | Value |
| Corporate Bonds (continued) | | | | | |
| Capital Goods (continued) | | | | | |
| Pregis 13.375% 10/15/13 | $ | 222,000 | | $ | 212,009 |
| * | RBS Global/Rexnord 11.75% 8/1/16 | | 183,000 | | | 180,254 |
| # | Reynolds Group Issuer 144A | | | | | |
| 7.75% 10/15/16 | | 100,000 | | | 101,500 |
| * | Sally Holdings Capital | | | | | |
| 10.50% 11/15/16 | | 75,000 | | | 80,625 |
| * | Solo Cup 8.50% 2/15/14 | | 134,000 | | | 129,645 |
| Thermadyne Holdings 10.50% 2/1/14 | | 137,000 | | | 119,875 |
| USG | | | | | |
| 6.30% 11/15/16 | | 127,000 | | | 110,808 |
| | #144A 9.75% 8/1/14 | | 35,000 | | | 36,838 |
| | | | | | 2,182,612 |
| Consumer Cyclical – 5.34% | | | | | |
| # | Allison Transmission 144A | | | | | |
| 11.00% 11/1/15 | | 220,000 | | | 228,799 |
| * | ArvinMeritor 8.125% 9/15/15 | | 165,000 | | | 150,975 |
| Beazer Homes USA 8.625% 5/15/11 | | 138,000 | | | 134,550 |
| Burlington Coat Factory Investment | | | | | |
| Holdings 14.50% 10/15/14 | | 225,000 | | | 226,687 |
| * | Burlington Coat Factory Warehouse | | | | | |
| 11.125% 4/15/14 | | 70,000 | | | 72,800 |
| Carrols 9.00% 1/15/13 | | 33,000 | | | 33,330 |
| Denny’s Holdings 10.00% 10/1/12 | | 57,000 | | | 58,425 |
| Ford Motor 7.45% 7/16/31 | | 174,000 | | | 148,988 |
| Ford Motor Credit 12.00% 5/15/15 | | 260,000 | | | 299,935 |
| Goodyear Tire & Rubber | | | | | |
| 10.50% 5/15/16 | | 2,000 | | | 2,160 |
| Interface | | | | | |
| 9.50% 2/1/14 | | 19,000 | | | 18,929 |
| | #144A 11.375% 11/1/13 | | 50,000 | | | 54,938 |
| # | Invista 144A 9.25% 5/1/12 | | 118,000 | | | 120,360 |
| K Hovnanian Enterprises | | | | | |
| 6.25% 1/15/15 | | 40,000 | | | 29,000 |
| 7.50% 5/15/16 | | 70,000 | | | 50,750 |
| | #144A 10.625% 10/15/16 | | 70,000 | | | 71,750 |
| # | Landry’s Restaurants 144A | | | | | |
| 11.625% 12/1/15 | | 220,000 | | | 224,399 |
| M/I Homes 6.875% 4/1/12 | | 75,000 | | | 70,125 |
| Macy’s Retail Holdings | | | | | |
| 6.375% 3/15/37 | | 110,000 | | | 93,500 |
| 6.70% 7/15/34 | | 15,000 | | | 12,750 |
| 7.875% 8/15/36 | | 50,000 | | | 44,000 |
| Meritage Homes | | | | | |
| 6.25% 3/15/15 | | 24,000 | | | 21,960 |
| 7.00% 5/1/14 | | 108,000 | | | 103,140 |
| Mobile Mini 6.875% 5/1/15 | | 119,000 | | | 111,860 |
| Navistar International 8.25% 11/1/21 | | 145,000 | | | 143,188 |
| Norcraft Holdings Capital 9.75% 9/1/12 | | 150,000 | | | 143,250 |
| OSI Restaurant Partners | | | | | |
| 10.00% 6/15/15 | | 83,000 | | | 72,210 |
| Quiksilver 6.875% 4/15/15 | | 200,000 | | | 154,000 |
| Rite Aid 9.375% 12/15/15 | | 190,000 | | | 160,075 |
| # | Standard Pacific Escrow | | | | | |
| 144A 10.75% 9/15/16 | | 75,000 | | | 74,625 |
| * | Tenneco Automotive 8.625% 11/15/14 | | 146,000 | | | 143,810 |
| # | Toys R Us Property 144A | | | | | |
| 10.75% 7/15/17 | | 66,000 | | | 70,785 |
| *# | TRW Automotive 144A | | | | | |
| 7.00% 3/15/14 | | 210,000 | | | 199,763 |
| | | | | | 3,545,816 |
| Consumer Non-Cyclical – 3.03% | | | | | |
| Accellent 10.50% 12/1/13 | | 105,000 | | | 101,588 |
| # | Alliance One International 144A | | | | | |
| 10.00% 7/15/16 | | 133,000 | | | 140,315 |
| Bausch & Lomb 9.875% 11/1/15 | | 137,000 | | | 141,453 |
| # | Cott Beverages 144A | | | | | |
| 8.375% 11/15/17 | | 90,000 | | | 90,225 |
| DJO Finance 10.875% 11/15/14 | | 80,000 | | | 84,600 |
| # | Dole Food 144A | | | | | |
| 8.00% 10/1/16 | | 30,000 | | | 30,450 |
| 13.875% 3/15/14 | | 62,000 | | | 73,160 |
| # | Ingles Markets 144A 8.875% 5/15/17 | | 75,000 | | | 77,438 |
| Inverness Medical Innovations | | | | | |
| 9.00% 5/15/16 | | 104,000 | | | 105,820 |
| # | JBS USA Finance 144A | | | | | |
| 11.625% 5/1/14 | | 113,000 | | | 126,136 |
| # | JohnsonDiversey Holdings 144A | | | | | |
| 10.50% 5/15/20 | | 305,000 | | | 301,187 |
| LVB Acquisition | | | | | |
| PIK 10.375% 10/15/17 | | 57,000 | | | 61,418 |
| 11.625% 10/15/17 | | 75,000 | | | 81,938 |
| # | M-Foods Holdings 144A | | | | | |
| 9.75% 10/1/13 | | 42,000 | | | 43,890 |
| Smithfield Foods | | | | | |
| 7.75% 5/15/13 | | 155,000 | | | 144,537 |
| | #144A 10.00% 7/15/14 | | 38,000 | | | 39,995 |
| # | Tops Markets 144A 10.125% 10/15/15 | | 140,000 | | | 144,200 |
| Universal Hospital Services PIK | | | | | |
| 8.50% 6/1/15 | | 80,000 | | | 79,200 |
| Yankee Acquisition 9.75% 2/15/17 | | 150,000 | | | 144,000 |
| | | | | | 2,011,550 |
| Energy – 3.99% | | | | | |
| # | Antero Resources Finance 144A | | | | | |
| 9.375% 12/1/17 | | 115,000 | | | 115,863 |
| Chesapeake Energy 9.50% 2/15/15 | | 24,000 | | | 25,260 |
| Complete Production Service | | | | | |
| 8.00% 12/15/16 | | 77,000 | | | 75,845 |
| Copano Energy Finance 7.75% 6/1/18 | | 94,000 | | | 94,000 |
| Denbury Resources | | | | | |
| 7.50% 4/1/13 | | 15,000 | | | 15,075 |
| 9.75% 3/1/16 | | 66,000 | | | 70,125 |
| Dynegy Holdings 7.75% 6/1/19 | | 162,000 | | | 133,245 |
| El Paso | | | | | |
| 6.875% 6/15/14 | | 47,000 | | | 46,530 |
| 7.00% 6/15/17 | | 52,000 | | | 51,220 |
| # | El Paso Performance-Linked Trust 144A | | | | | |
| 7.75% 7/15/11 | | 33,000 | | | 33,700 |
12
| | | Principal | | | |
| | Amount | | Value |
| Corporate Bonds (continued) | | | | | |
| Energy (continued) | | | | | |
| · | Enterprise Products Operating | | | | | |
| 8.375% 8/1/66 | $ | 30,000 | | $ | 29,249 |
| Forest Oil 7.25% 6/15/19 | | 94,000 | | | 89,535 |
| *# | Headwaters 144A 11.375% 11/1/14 | | 145,000 | | | 148,987 |
| # | Helix Energy Solutions Group 144A | | | | | |
| 9.50% 1/15/16 | | 156,000 | | | 158,729 |
| # | Hercules Offshore 144A | | | | | |
| 10.50% 10/15/17 | | 145,000 | | | 147,175 |
| # | Hilcorp Energy I 144A | | | | | |
| 7.75% 11/1/15 | | 47,000 | | | 45,473 |
| 9.00% 6/1/16 | | 94,000 | | | 94,705 |
| # | Holly 144A 9.875% 6/15/17 | | 121,000 | | | 126,143 |
| * | Key Energy Services 8.375% 12/1/14 | | 141,000 | | | 138,356 |
| Mariner Energy 8.00% 5/15/17 | | 118,000 | | | 112,100 |
| MarkWest Energy Partners/Finance | | | | | |
| 8.75% 4/15/18 | | 130,000 | | | 131,625 |
| OPTI Canada | | | | | |
| 7.875% 12/15/14 | | 116,000 | | | 92,800 |
| 8.25% 12/15/14 | | 67,000 | | | 53,935 |
| PetroHawk Energy | | | | | |
| 7.875% 6/1/15 | | 80,000 | | | 80,200 |
| 9.125% 7/15/13 | | 52,000 | | | 54,210 |
| Petroleum Development | | | | | |
| 12.00% 2/15/18 | | 118,000 | | | 119,770 |
| Plains Exploration & Production | | | | | |
| 8.625% 10/15/19 | | 40,000 | | | 40,300 |
| Quicksilver Resources | | | | | |
| 7.125% 4/1/16 | | 115,000 | | | 104,363 |
| 11.75% 1/1/16 | | 33,000 | | | 36,836 |
| Regency Energy Partners | | | | | |
| 8.375% 12/15/13 | | 57,000 | | | 58,853 |
| # | SandRidge Energy 144A | | | | | |
| 9.875% 5/15/16 | | 123,000 | | | 126,690 |
| | | | | | 2,650,897 |
| Finance & Investments – 1.26% | | | | | |
| ·# | C5 Capital 144A 6.196% 12/31/49 | | 100,000 | | | 69,663 |
| Cardtronics 9.25% 8/15/13 | | 130,000 | | | 132,926 |
| International Lease Finance | | | | | |
| 5.25% 1/10/13 | | 85,000 | | | 68,553 |
| 5.35% 3/1/12 | | 15,000 | | | 12,801 |
| 5.55% 9/5/12 | | 50,000 | | | 40,295 |
| 5.625% 9/20/13 | | 120,000 | | | 94,515 |
| 6.375% 3/25/13 | | 25,000 | | | 20,139 |
| 6.625% 11/15/13 | | 70,000 | | | 56,547 |
| ·# | MetLife Capital Trust X 144A | | | | | |
| | 9.25% 4/8/38 | | 100,000 | | | 105,000 |
| @# | Nuveen Investments 144A | | | | | |
| 10.50% 11/15/15 | | 269,000 | | | 238,064 |
| | | | | | 838,503 |
| Media – 3.09% | | | | | |
| Affinion Group I 11.50% 10/15/15 | | 70,000 | | | 73,150 |
| # | Cablevision Systems 144A | | | | | |
| 8.625% 9/15/17 | | 80,000 | | | 82,400 |
| # | Cengage Learning Acquisitions 144A | | | | | |
| 10.50% 1/15/15 | | 85,000 | | | 79,263 |
| # | Charter Communications | | | | | |
| Operating 144A | | | | | |
| 10.00% 4/30/12 | | 33,000 | | | 33,743 |
| 10.375% 4/30/14 | | 66,000 | | | 67,485 |
| 12.875% 9/15/14 | | 273,000 | | | 305,418 |
| # | Columbus International 144A | | | | | |
| 11.50% 11/20/14 | | 135,000 | | | 138,888 |
| # | DISH DBS 144A 7.875% 9/1/19 | | 150,000 | | | 151,874 |
| # | MDC Partners 144A 11.00% 11/1/16 | | 70,000 | | | 70,350 |
| # | Mediacom Capital 144A | | | | | |
| 9.125% 8/15/19 | | 95,000 | | | 96,900 |
| Nielsen Finance | | | | | |
| | W12.50% 8/1/16 | | 66,000 | | | 58,080 |
| 10.00% 8/1/14 | | 75,000 | | | 77,813 |
| 11.50% 5/1/16 | | 35,000 | | | 37,800 |
| 11.625% 2/1/14 | | 2,000 | | | 2,160 |
| | #144A 11.625% 2/1/14 | | 40,000 | | | 43,200 |
| *# | Sinclair Television Group 144A | | | | | |
| 9.25% 11/1/17 | | 110,000 | | | 112,063 |
| # | Terremark Worldwide 144A | | | | | |
| 12.00% 6/15/17 | | 66,000 | | | 72,353 |
| # | Univision Communications 144A | | | | | |
| 12.00% 7/1/14 | | 103,000 | | | 112,528 |
| # | UPC Holding 144A 9.875% 4/15/18 | | 100,000 | | | 104,500 |
| # | XM Satellite Radio 144A | | | | | |
| 13.00% 8/1/13 | | 130,000 | | | 135,525 |
| XM Satellite Radio Holdings PIK | | | | | |
| 10.00% 6/1/11 | | 203,000 | | | 194,879 |
| | | | | | 2,050,372 |
| Real Estate – 0.23% | | | | | |
| Developers Diversified Realty | | | | | |
| 9.625% 3/15/16 | | 25,000 | | | 26,062 |
| # | Felcor Lodging 144A | | | | | |
| 10.00% 10/1/14 | | 130,000 | | | 127,400 |
| | | | | | 153,462 |
| Services Cyclical – 4.24% | | | | | |
| * | ARAMARK 8.50% 2/1/15 | | 87,000 | | | 87,653 |
| # | Ashtead Capital 144A 9.00% 8/15/16 | | 100,000 | | | 98,500 |
| Avis Budget Car Rental | | | | | |
| 7.625% 5/15/14 | | 190,000 | | | 175,750 |
| 7.75% 5/15/16 | | 80,000 | | | 72,000 |
| Delta Air Lines | | | | | |
| 7.92% 11/18/10 | | 61,000 | | | 61,000 |
| | #144A 9.50% 9/15/14 | | 65,000 | | | 66,300 |
| # | Galaxy Entertainment Finance 144A | | | | | |
| 9.875% 12/15/12 | | 240,000 | | | 242,399 |
| Gaylord Entertainment | | | | | |
| 6.75% 11/15/14 | | 66,000 | | | 60,060 |
| # | General Maritime 144A | | | | | |
| 12.00% 11/15/17 | | 85,000 | | | 88,613 |
| Global Cash Access 8.75% 3/15/12 | | 41,000 | | | 40,334 |
(continues) 13
Statement of net assets
Delaware Investments® Dividend and Income Fund, Inc.
| | | Principal | | | |
| | Amount | | Value |
| Corporate Bonds (continued) | | | | | |
| Services Cyclical (continued) | | | | | |
| # | Harrah’s Operating 144A | | | | | |
| 10.00% 12/15/18 | $ | 289,000 | | $ | 221,084 |
| * | Hertz 10.50% 1/1/16 | | 91,000 | | | 95,095 |
| # | Kansas City Southern de Mexico 144A | | | | | |
| 12.50% 4/1/16 | | 100,000 | | | 114,500 |
| MGM MIRAGE | | | | | |
| | *6.625% 7/15/15 | | 42,000 | | | 31,500 |
| 7.50% 6/1/16 | | 42,000 | | | 32,025 |
| | *7.625% 1/15/17 | | 145,000 | | | 110,925 |
| 13.00% 11/15/13 | | 101,000 | | | 115,014 |
| | #144A 11.375% 3/1/18 | | 75,000 | | | 65,063 |
| Mohegan Tribal Gaming Authority | | | | | |
| 7.125% 8/15/14 | | 100,000 | | | 63,500 |
| *# | NCL 144A 11.75% 11/15/16 | | 75,000 | | | 74,344 |
| @‡ | Northwest Airlines 10.00% 2/1/10 | | 55,000 | | | 413 |
| PHH 7.125% 3/1/13 | | 140,000 | | | 131,250 |
| Pinnacle Entertainment 7.50% 6/15/15 | | 226,000 | | | 202,269 |
| Royal Caribbean Cruises | | | | | |
| 6.875% 12/1/13 | | 80,000 | | | 75,600 |
| RSC Equipment Rental | | | | | |
| 9.50% 12/1/14 | | 202,000 | | | 198,718 |
| | #144A 10.25% 11/15/19 | | 15,000 | | | 14,625 |
| # | ServiceMaster PIK 144A | | | | | |
| 10.75% 7/15/15 | | 155,000 | | | 157,324 |
| # | Shingle Springs Tribal Gaming | | | | | |
| Authority 144A 9.375% 6/15/15 | | 171,000 | | | 124,830 |
| | | | | | 2,820,688 |
| Services Non-Cyclical – 1.70% | | | | | |
| # | Alliance HealthCare Services 144A | | | | | |
| 8.00% 12/1/16 | | 70,000 | | | 69,300 |
| Casella Waste Systems 9.75% 2/1/13 | | 137,000 | | | 134,260 |
| Community Health Systems | | | | | |
| 8.875% 7/15/15 | | 62,000 | | | 63,395 |
| Cornell 10.75% 7/1/12 | | 52,000 | | | 53,300 |
| HCA PIK 9.625% 11/15/16 | | 255,000 | | | 272,531 |
| Psychiatric Solutions | | | | | |
| 7.75% 7/15/15 | | 94,000 | | | 91,180 |
| | #144A 7.75% 7/15/15 | | 42,000 | | | 39,690 |
| Select Medical 7.625% 2/1/15 | | 179,000 | | | 172,288 |
| Tenet Healthcare 7.375% 2/1/13 | | 70,000 | | | 69,300 |
| · | US Oncology Holdings PIK | | | | | |
| 6.428% 3/15/12 | | 180,000 | | | 162,900 |
| | | | | | 1,128,144 |
| Technology & Electronics – 1.34% | | | | | |
| # | Advanced Micro Devices 144A | | | | | |
| 8.125% 12/15/17 | | 30,000 | | | 28,463 |
| Avago Technologies Finance | | | | | |
| 10.125% 12/1/13 | | 75,000 | | | 79,031 |
| First Data 9.875% 9/24/15 | | 295,000 | | | 264,025 |
| * | Freescale Semiconductor | | | | | |
| 8.875% 12/15/14 | | 173,000 | | | 147,915 |
| Sanmina-SCI 8.125% 3/1/16 | | 154,000 | | | 150,535 |
| * | SunGard Data Systems 10.25% 8/15/15 | | 138,000 | | | 142,140 |
| # | Unisys 144A 12.75% 10/15/14 | | 71,000 | | | 79,520 |
| | | | | | 891,629 |
| Telecommunications – 6.27% | | | | | |
| Cincinnati Bell 8.25% 10/15/17 | | 105,000 | | | 104,738 |
| # | Clearwire Communications 144A | | | | | |
| 12.00% 12/1/15 | | 295,000 | | | 290,788 |
| * | Cricket Communications | | | | | |
| 9.375% 11/1/14 | | 222,000 | | | 214,785 |
| # | Digicel Group 144A | | | | | |
| 8.25% 9/1/17 | | 110,000 | | | 108,075 |
| | *8.875% 1/15/15 | | 100,000 | | | 97,500 |
| # | DigitalGlobe 144A 10.50% 5/1/14 | | 61,000 | | | 65,575 |
| # | GCI 144A 8.625% 11/15/19 | | 145,000 | | | 145,725 |
| # | GeoEye 144A 9.625% 10/1/15 | | 65,000 | | | 67,763 |
| # | Global Crossing 144A 12.00% 9/15/15 | | 135,000 | | | 144,450 |
| Hughes Network Systems | | | | | |
| 9.50% 4/15/14 | | 127,000 | | | 128,905 |
| # | Intelsat Bermuda 144A | | | | | |
| 11.25% 2/4/17 | | 283,000 | | | 281,584 |
| Intelsat Jackson Holdings | | | | | |
| 11.25% 6/15/16 | | 236,000 | | | 253,109 |
| Level 3 Financing | | | | | |
| 9.25% 11/1/14 | | 66,000 | | | 58,575 |
| 12.25% 3/15/13 | | 66,000 | | | 69,218 |
| Lucent Technologies 6.45% 3/15/29 | | 156,000 | | | 120,900 |
| * | MetroPCS Wireless 9.25% 11/1/14 | | 214,000 | | | 215,605 |
| # | NII Capital 144A 10.00% 8/15/16 | | 138,000 | | | 146,970 |
| # | Nordic Telephone Holdings 144A | | | | | |
| 8.875% 5/1/16 | | 75,000 | | | 79,125 |
| PAETEC Holding 8.875% 6/30/17 | | 71,000 | | | 70,823 |
| # | Qwest 144A 8.375% 5/1/16 | | 5,000 | | | 5,250 |
| Qwest Communications International | | | | | |
| 7.50% 2/15/14 | | 61,000 | | | 60,695 |
| Sprint Capital | | | | | |
| 6.00% 12/1/16 | | 94,000 | | | 81,545 |
| 6.875% 11/15/28 | | 65,000 | | | 49,075 |
| 8.75% 3/15/32 | | 305,000 | | | 262,680 |
| # | Telcordia Technologies 144A | | | | | |
| 10.00% 3/15/13 | | 85,000 | | | 70,975 |
| Telesat Canada | | | | | |
| 11.00% 11/1/15 | | 80,000 | | | 85,000 |
| 12.50% 11/1/17 | | 94,000 | | | 101,520 |
| US West Capital Funding | | | | | |
| 7.75% 2/15/31 | | 80,000 | | | 65,200 |
| US West Communications | | | | | |
| 7.25% 9/15/25 | | 90,000 | | | 79,650 |
| # | Viasat 144A 8.875% 9/15/16 | | 75,000 | | | 76,031 |
| # | VimpelCom 144A 9.125% 4/30/18 | | 150,000 | | | 158,250 |
| Virgin Media Finance 8.375% 10/15/19 | | 100,000 | | | 100,500 |
| West 11.00% 10/15/16 | | 110,000 | | | 111,375 |
| # | Wind Acquisition Finance 144A | | | | | |
| 10.75% 12/1/15 | | 75,000 | | | 80,625 |
| 11.75% 7/15/17 | | 100,000 | | | 111,500 |
| | | | | | 4,164,084 |
14
| | | Principal | | | | |
| | Amount | | Value |
| Corporate Bonds (continued) | | | | | | |
| Utilities – 1.87% | | | | | | |
| AES | | | | | | |
| 7.75% 3/1/14 | $ | 83,000 | | $ | 83,623 | |
| 8.00% 10/15/17 | | 47,000 | | | 47,118 | |
| * | Edison Mission Energy 7.00% 5/15/17 | | 125,000 | | | 91,875 | |
| Elwood Energy 8.159% 7/5/26 | | 167,845 | | | 151,422 | |
| Energy Future Holdings | | | | | | |
| 10.875% 11/1/17 | | 66,000 | | | 46,695 | |
| * | Mirant Americas Generation | | | | | | |
| 8.50% 10/1/21 | | 200,000 | | | 181,999 | |
| w | Mirant Mid Atlantic Pass Through | | | | | | |
| Trust Series A 8.625% 6/30/12 | | 59,067 | | | 60,027 | |
| NRG Energy | | | | | | |
| 7.375% 2/1/16 | | 144,000 | | | 143,640 | |
| 7.375% 1/15/17 | | 45,000 | | | 44,775 | |
| Orion Power Holdings 12.00% 5/1/10 | | 116,000 | | | 119,770 | |
| · | Puget Sound Energy 6.974% 6/1/67 | | 110,000 | | | 97,200 | |
| * | Texas Competitive Electric Holdings | | | | | | |
| 10.50% 11/1/15 | | 141,000 | | | 100,815 | |
| TXU 5.55% 11/15/14 | | 105,000 | | | 72,975 | |
| | | | | | 1,241,934 | |
| Total Corporate Bonds | | | | | | |
| (cost $26,905,306) | | | | | 28,614,370 | |
| | |
| «Senior Secured Loans – 0.57% | | | | | | |
| Chester Downs & Marina Term | | | | | | |
| Tranche Loan 12.375% 12/31/16 | | 72,000 | | | 72,180 | |
| PQ Term Tranche Loan 6.79% 7/30/15 | | 170,000 | | | 142,658 | |
| Texas Competitive Electric Holdings | | | | | | |
| Term Tranche Loan B2 | | | | | | |
| 3.742% 10/10/14 | | 115,414 | | | 86,550 | |
| Univision Communications Term | | | | | | |
| Tranche Loan B 2.533% 9/29/14 | | 90,000 | | | 74,318 | |
| Total Senior Secured Loans | | | | | | |
| (cost $341,745) | | | | | 375,706 | |
| | |
| | Number of | | | | |
| | Shares | | | | |
| Exchange Traded Fund – 0.03% | | | | | | |
| Equity Fund – 0.03% | | | | | | |
| *ProShares UltraShort Real Estate | | 2,400 | | | 20,904 | |
| Total Exchange Traded Fund | | | | | | |
| (cost $59,893) | | | | | 20,904 | |
| | |
| Limited Partnerships – 0.24% | | | | | | |
| Blackstone Group | | 3,000 | | | 41,520 | |
| Brookfield Infrastructure Partners | | 7,600 | | | 117,040 | |
| Total Limited Partnerships | | | | | | |
| (cost $184,721) | | | | | 158,560 | |
| | |
| Warrant – 0.00% | | | | | | |
| =† | Port Townsend | | 70 | | | 1 | |
| Total Warrant (cost $1,680) | | | | | 1 | |
| | | | | | | |
| | Principal | | | | |
| | Amount | | |
| ¹Discount Note – 2.39% | | | | | | |
| Federal Home Loan Bank | | | | | | |
| 0.02% 12/1/09 | $ | 1,587,002 | | $ | 1,587,002 | |
| Total Discount Note (cost $1,587,002) | | | | | 1,587,002 | |
| |
| Total Value of Securities Before | | | | | | |
| Securities Lending Collateral – 129.59% | | | | |
| (cost $88,768,210) | | | | | 86,075,519 | |
| |
| | Number of | | | | |
| | Shares | | | | |
| Securities Lending Collateral** – 6.11% | | | | | | |
| Investment Companies | | | | | | |
| Mellon GSL DBT II Collateral Fund | | 1,228,217 | | | 1,228,217 | |
| BNY Mellon SL DBT II | | | | | | |
| Liquidating Fund | | 2,855,882 | | | 2,824,753 | |
| @†Mellon GSL Reinvestment Trust II | | 163,237 | | | 6,938 | |
| Total Securities Lending Collateral | | | | | | |
| (cost $4,247,336) | | | | | 4,059,908 | |
| |
| Total Value of Securities – 135.70% | | | | | | |
| (cost $93,015,546) | | | | | 90,135,427 | © |
| Obligation to Return Securities | | | | | | |
| Lending Collateral** – (6.39%) | | | | | (4,247,336 | ) |
| Borrowing Under Line of Credit – (30.45%) | | | (20,225,000 | ) |
| Receivables and Other Assets | | | | | | |
| Net of Liabilities – 1.14% | | | | | 757,501 | |
| Net Assets Applicable to 9,439,043 | | | | | | |
| Shares Outstanding; Equivalent to | | | | | | |
| | $7.04 Per Share – 100.00% | | | | $ | 66,420,592 | |
| |
| Components of Net Assets at November 30, 2009: | | | | |
| Common stock, $0.01 par value, | | | | | | |
| 500,000,000 shares authorized to the Fund | | $ | 97,186,304 | |
| Distributions in excess of net investment income | | | (66,931 | ) |
| Accumulated net realized loss on investments | | | (27,818,662 | ) |
| Net unrealized depreciation of investments | | | | | | |
| and foreign currencies | | | | | (2,880,119 | ) |
| Total net assets | | | | $ | 66,420,592 | |
| † | Non income producing security. |
| ‡ | Non income producing security. Security is currently in default. |
| · | Variable rate security. The rate shown is the rate as of November 30, 2009. |
| ¹ | The rate shown is the effective yield at the time of purchase. |
| @ | Illiquid security. At November 30, 2009, the aggregate amount of illiquid securities was $612,268, which represented 0.92% of the Fund’s net assets. See Note 10 in “Notes to financial statements.” |
| ∏ | Restricted Security. These investments are in securities not registered under the Securities Act of 1933, as amended, and have certain restrictions on resale which may limit their liquidity. At November 30, 2009, the aggregate amount of the restricted securities was $4 or 0.00% of the Fund’s net assets. See Note 10 in “Notes to financial statements.” |
(continues) 15
Statement of net assets
Delaware Investments® Dividend and Income Fund, Inc.
| | |
| = | Security is being fair valued in accordance with the Fund’s fair valuation policy. At November 30, 2009, the aggregate amount of fair valued securities was $74,384, which represented 0.11% of the Fund’s net assets. See Note 1 in “Notes to financial statements.” |
| # | Security exempt from registration under Rule 144A of the Securities Act of 1933, as amended. At November 30, 2009, the aggregate amount of Rule 144A securities was $15,370,289, which represented 23.14% of the Fund’s net assets. See Note 10 in “Notes to financial statements.” |
| « | Senior Secured Loans generally pay interest at rates which are periodically redetermined by reference to a base lending rate plus a premium. These base lending rates are generally: (i) the prime rate offered by one or more United States banks, (ii) the lending rate offered by one or more European banks such as the London Inter-Bank Offered Rate (LIBOR), and (iii) the certificate of deposit rate. Senior Secured Loans may be subject to restrictions on resale. Stated rate in effect at November 30, 2009. |
| W | Step coupon bond. Indicates security that has a zero coupon that remains in effect until a predetermined date at which time the stated interest rate becomes effective. |
| Φ | Step coupon bond. Coupon increases/decreases periodically based on a predetermined schedule. Stated rate in effect at November 30, 2009. |
| w | Pass Through Agreement. Security represents the contractual right to receive a proportionate amount of underlying payments due to the counterparty pursuant to various agreements related to the rescheduling of obligations and the exchange of certain notes. |
| * | Fully or partially on loan. |
| ** | See Note 9 in “Notes to financial statements.” |
| © | Includes $4,253,690 of securities loaned. |
Summary of Abbreviations:
ADR — American Depositary Receipts
PIK — Pay-in-kind
REIT — Real Estate Investment Trust
See accompanying notes
16
Statement of operations
Delaware Investments® Dividend and Income Fund, Inc.
Year Ended November 30, 2009
| Investment Income: | | | | | | |
| Dividends | $ | 1,756,045 | | | | |
| Interest | | 3,270,000 | | | | |
| Securities lending income | | 36,455 | | $ | 5,062,500 | |
| |
| Expenses: | | | | | | |
| Management fees | | 424,571 | | | | |
| Reports to shareholders | | 122,610 | | | | |
| Dividend disbursing and transfer agent fees and expenses | | 94,780 | | | | |
| Legal fees | | 45,510 | | | | |
| Accounting and administration expenses | | 30,879 | | | | |
| NYSE fees | | 23,750 | | | | |
| Leverage expenses | | 18,958 | | | | |
| Audit and tax | | 16,363 | | | | |
| Pricing fees | | 15,128 | | | | |
| Dues and services | | 6,895 | | | | |
| Directors’ fees | | 4,004 | | | | |
| Custodian fees | | 3,931 | | | | |
| Insurance fees | | 1,668 | | | | |
| Consulting fees | | 783 | | | | |
| Registration fees | | 643 | | | | |
| Directors’ expenses | | 277 | | | 810,750 | |
| Less expense paid indirectly | | | | | (274 | ) |
| Total operating expenses (before interest expense) | | | | | 810,476 | |
| Interest expense | | | | | 230,345 | |
| Total operating expenses (after interest expense) | | | | | 1,040,821 | |
| Net Investment Income | | | | | 4,021,679 | |
| |
| Net Realized and Unrealized Gain (Loss) on Investments and Foreign Currencies: | | | | | | |
| Net realized loss on: | | | | | | |
| Investments | | | | | (10,717,121 | ) |
| Swap contracts | | | | | (5,260 | ) |
| Foreign currencies | | | | | (249 | ) |
| Net realized loss | | | | | (10,722,630 | ) |
| Net change in unrealized appreciation/depreciation of investments and foreign currencies | | | | | 31,142,775 | |
| Net Realized and Unrealized Gain on Investments and Foreign Currencies | | | | | 20,420,145 | |
| |
| Net Increase in Net Assets Resulting from Operations | | | | $ | 24,441,824 | |
See accompanying notes
17
Statements of changes in net assets
Delaware Investments® Dividend and Income Fund, Inc.
| Year Ended |
| 11/30/09 | | 11/30/08 |
| Increase (Decrease) in Net Assets from Operations: | | | | | | | |
| Net investment income | $ | 4,021,679 | | | $ | 5,021,360 | |
| Net realized loss on investments | | (10,722,630 | ) | | | (16,172,098 | ) |
| Net change in unrealized appreciation/depreciation of investments | | 31,142,775 | | | | (46,110,238 | ) |
| Net increase (decrease) in net assets resulting from operations | | 24,441,824 | | | | (57,260,976 | ) |
| |
| Dividends and Distributions to Shareholders from:1 | | | | | | | |
| Net investment income | | (3,988,862 | ) | | | (5,710,800 | ) |
| Tax return of capital | | (2,947,565 | ) | | | (4,120,447 | ) |
| | | (6,936,427 | ) | | | (9,831,247 | ) |
| Capital Share Transactions: | | | | | | | |
| Cost of shares repurchased2 | | (2,916,169 | ) | | | (5,004,526 | ) |
| Decrease in net assets derived from capital share transactions | | (2,916,169 | ) | | | (5,004,526 | ) |
| Net Increase (Decrease) in Net Assets | | 14,589,228 | | | | (72,096,749 | ) |
| |
| Net Assets: | | | | | | | |
| Beginning of year | | 51,831,364 | | | | 123,928,113 | |
| End of year (including distributions in excess of | | | | | | | |
| net investment income of $66,931 and $156,700, respectively) | $ | 66,420,592 | | | $ | 51,831,364 | |
1See Note 4 in “Notes to financial statements.”
2See Note 6 in “Notes to financial statements.”
See accompanying notes
18
Statement of cash flows
Delaware Investments® Dividend and Income Fund, Inc.
Year Ended November 30, 2009
| Net Cash Provided by Operating Activities: | | | |
| Net increase in net assets resulting from operations | $ | 24,441,824 | |
| |
| Adjustments to reconcile net decrease in net assets from | | | |
| operations to cash provided by operating activities: | | | |
| Amortization of premium and discount on investments purchased | | (392,275 | ) |
| Purchase of investment securities | | (48,237,972 | ) |
| Proceeds from disposition of investment securities | | 51,950,262 | |
| Proceeds from disposition of short-term investment securities, net | | 2,652,908 | |
| Net realized loss from investment transactions | | 10,948,938 | |
| Net change in net unrealized appreciation/depreciation of investments and foreign currencies | | (31,142,775 | ) |
| Decrease in receivable for investments sold | | 121,116 | |
| Decrease in interest and dividends receivable and other assets | | 107,091 | |
| Increase in payable for investments purchased | | 254,540 | |
| Decrease in interest payable | | (11,965 | ) |
| Decrease in accrued expenses | | (47,269 | ) |
| Total adjustments | | (13,797,401 | ) |
| Net cash provided by operating activities | | 10,644,423 | |
| |
| Cash Flows Used for Financing Activities: | | | |
| Cash dividends and distributions paid | | (6,936,427 | ) |
| Purchase of fund shares (tender offer) | | (2,916,169 | ) |
| Net cash used for financing activities | | (9,852,596 | ) |
| Net increase in cash | | 791,827 | |
| Cash (overdraft) at beginning of year | | (774,889 | ) |
| Cash at end of year | $ | 16,938 | |
| |
| Cash paid for interest expense for leverage | $ | 242,310 | |
See accompanying notes
19
Financial highlights
Delaware Investments® Dividend and Income Fund, Inc.
Selected data for each share of the Fund outstanding throughout each period were as follows:
| | Year Ended |
| | 11/30/09 | | | 11/30/08 | | | 11/30/07 | | | 11/30/06 | | | 11/30/05 | |
| Net asset value, beginning of period | | $5.220 | | | $11.850 | | | $14.200 | | | $12.650 | | | $12.960 | |
| |
| Income (loss) from investment operations: | | | | | | | | | | | | | | | |
| Net investment income1 | | 0.413 | | | 0.490 | | | 0.408 | | | 0.470 | | | 0.623 | |
| Net realized and unrealized gain (loss) on investments | | | | | | | | | | | | | | | |
| and foreign currencies | | 2.120 | | | (6.160 | ) | | (0.640 | ) | | 2.150 | | | 0.027 | |
| Total from investment operations | | 2.533 | | | (5.670 | ) | | (0.232 | ) | | 2.620 | | | 0.650 | |
| |
| Less dividends and distributions from: | | | | | | | | | | | | | | | |
| Net investment income | | (0.410 | ) | | (0.558 | ) | | (0.553 | ) | | (0.486 | ) | | (0.722 | ) |
| Net realized gain on investments | | — | | | — | | | (0.912 | ) | | (0.584 | ) | | (0.238 | ) |
| Return of capital | | (0.303 | ) | | (0.402 | ) | | (0.653 | ) | | — | | | — | |
| Total dividends and distributions | | (0.713 | ) | | (0.960 | ) | | (2.118 | ) | | (1.070 | ) | | (0.960 | ) |
| |
| Net asset value, end of period | | $7.040 | | | $5.220 | | | $11.850 | | | $14.200 | | | $12.650 | |
| |
| Market value, end of period | | $6.600 | | | $4.020 | | | $10.660 | | | $13.460 | | | $12.550 | |
| |
| Total return based on:2 | | | | | | | | | | | | | | | |
| Net asset value | | 53.26% | | | (50.35% | ) | | (0.94% | ) | | 22.41% | | | 5.44% | |
| Market value | | 86.93% | | | (57.51% | ) | | (5.99% | ) | | 16.96% | | | 15.38% | |
| |
| Ratios and supplemental data: | | | | | | | | | | | | | | | |
| Net assets, end of period (000 omitted) | | $66,421 | | | $51,831 | | | $123,928 | | | $156,324 | | | $146,638 | |
| Ratio of expenses to average net assets | | 1.83% | | | 2.39% | | | 2.71% | | | 2.71% | | | 2.20% | |
| Ratio of expenses to adjusted average net assets | | | | | | | | | | | | | | | |
| (before interest expense)3 | | 1.05% | | | 0.88% | | | 0.84% | | | 0.88% | | | 0.91% | |
| Ratio of interest expense to adjusted average net assets3 | | 0.30% | | | 0.80% | | | 1.25% | | | 1.19% | | | 0.78% | |
| Ratio of net investment income to average net assets | | 7.06% | | | 5.12% | | | 2.92% | | | 3.59% | | | 4.81% | |
| Ratio of net investment income to adjusted average net assets3 | | 5.21% | | | 3.59% | | | 2.27% | | | 2.74% | | | 3.70% | |
| Portfolio turnover | | 65% | | | 64% | | | 49% | | | 63% | | | 94% | |
| |
| Leverage Analysis: | | | | | | | | | | | | | | | |
| Debt outstanding at end of period at par (000 omitted) | | $20,225 | | | $20,225 | | | $44,000 | | | $44,000 | | | $48,000 | |
| Asset coverage per $1,000 of debt outstanding at end of period | | $4,284 | | | $3,563 | | | $3,820 | | | $4,577 | | | $4,073 | |
| |
| 1 The average shares outstanding method has been applied for per share information. |
| 2 Total investment return is calculated assuming a purchase of common stock on the opening of the first day and a sale on the closing of the last day of each period reported. Dividends and distributions, if any, are assumed for the purposes of this calculation, to be reinvested at prices obtained under the Fund’s dividend reinvestment plan. Generally, total investment return based on net asset value will be higher than total investment return based on market value in periods where there is an increase in the discount or decrease in the premium of the market value to the net asset value from the beginning to the end of such periods. Conversely, total investment return based on net asset value will be lower than total investment return based on market value in periods where there is a decrease in the discount or an increase in the premium of the market value to the net asset value from the beginning to the end of such periods. |
| 3 Adjusted average net assets excludes debt outstanding. |
See accompanying notes
20
Notes to financial statements
Delaware Investments® Dividend and Income Fund, Inc.
November 30, 2009
Delaware Investments Dividend and Income Fund, Inc. (Fund) is organized as a Maryland corporation and is a diversified closed-end management investment company under the Investment Company Act of 1940, as amended. The Fund’s shares trade on the New York Stock Exchange (NYSE) under the symbol DDF.
The investment objective of the Fund is to seek high current income. Capital appreciation is a secondary objective.
1. Significant Accounting Policies
The following accounting policies are in accordance with U.S. generally accepted accounting principles (GAAP) and are consistently followed by the Fund.
Security Valuation — Equity securities, except those traded on the Nasdaq Stock Market, Inc. (Nasdaq), are valued at the last quoted sales price as of the time of the regular close of the NYSE on the valuation date. Securities traded on the Nasdaq are valued in accordance with the Nasdaq Official Closing Price, which may not be the last sales price. If on a particular day an equity security does not trade, then the mean between the bid and ask prices will be used. Securities listed on a foreign exchange are valued at the last quoted sales price on the valuation date. U.S. government and agency securities are valued at the mean between the bid and ask prices. Other debt securities, credit default swap (CDS) contracts and interest rate swap contracts are valued by an independent pricing service or broker. To the extent current market prices are not available, the pricing service may take into account developments related to the specific security, as well as transactions in comparable securities. Investment companies are valued at net asset value per share. Foreign currency exchange contracts are valued at the mean between the bid and ask prices. Interpolated values are derived when the settlement date of the contract is an interim date for which quotations are not available. Generally, other securities and assets for which market quotations are not readily available are valued at fair value as determined in good faith under the direction of the Fund’s Board of Directors (Board). In determining whether market quotations are readily available or fair valuation will be used, various factors will be taken into consideration, such as market closures or suspension of trading in a security. The Fund may use fair value pricing more frequently for securities traded primarily in non-U.S. markets because, among other things, most foreign markets close well before the Fund values its securities at 4:00 p.m. Eastern time. The earlier close of these foreign markets gives rise to the possibility that significant events, including broad market moves, government actions or pronouncements, aftermarket trading, or news events may have occurred in the interim. To account for this, the Fund may frequently value foreign securities using fair value prices based on third-party vendor modeling tools (international fair value pricing).
Federal Income Taxes — No provision for federal income taxes has been made as the Fund intends to continue to qualify for federal income tax purposes as a regulated investment company under Subchapter M of the Internal Revenue Code of 1986, as amended, and make the requisite distributions to shareholders. The Fund evaluates tax positions taken or expected to be taken in the course of preparing the Fund’s tax returns to determine whether the tax positions are “more-likely-than-not” of being sustained by the applicable tax authority. Tax positions not deemed to meet the more-likely-than-not threshold are recorded as a tax benefit or expense in the current year. Management has analyzed the Fund’s tax positions taken on federal income tax returns for all open tax years (tax years ended November 30, 2006 – November 30, 2009), and has concluded that no provision for federal income tax is required in the Fund’s financial statements.
Distributions — The Fund has a managed distribution policy. Under the policy, the Fund declares and pays monthly distributions and is managed with a goal of generating as much of the distribution as possible from ordinary income (net investment income and short-term capital gains). The balance of the distribution then comes from long-term capital gains to the extent permitted and, if necessary, a return of capital.
Repurchase Agreements — The Fund may invest in a pooled cash account along with members of the Delaware Investments Family of Funds pursuant to an exemptive order issued by the Securities and Exchange Commission. The aggregate daily balance of the pooled cash account is invested in repurchase agreements secured by obligations of the U.S. government. The respective collateral is held by the Fund’s custodian bank until the maturity of the respective repurchase agreements. Each repurchase agreement is at least 102% collateralized. However, in the event of default or bankruptcy by the counterparty to the agreement, realization of the collateral may be subject to legal proceedings. At November 30, 2009, the Fund held no investments in repurchase agreements.
Foreign Currency Transactions — Transactions denominated in foreign currencies are recorded at the prevailing exchange rates on the valuation date. The value of all assets and liabilities denominated in foreign currencies is translated into U.S. dollars at the exchange rate of such currencies against the U.S. dollar daily. Transaction gains or losses resulting from changes in exchange rates during the reporting period or upon settlement of the foreign currency transaction are reported in operations for the current period. The Fund isolates that portion of realized gains and losses on investments in debt securities, which is due to changes in foreign exchange rates from that which is due to changes in market prices of debt securities. For foreign equity securities, these changes are included in realized gains (losses) on investments. The Fund reports certain foreign currency related transactions as components of realized gains (losses) for financial reporting purposes, whereas such components are treated as ordinary income (loss) for federal income tax purposes.
Use of Estimates — The preparation of financial statements in conformity with U.S. GAAP requires management to make estimates and assumptions that affect the reported amounts of assets and liabilities at the date of the financial statements and the reported amounts of revenues and expenses during the reporting period. Actual results could differ from those estimates.
Other — Expenses directly attributable to the Fund are charged directly to the Fund. Other expenses common to various funds within the Delaware Investments Family of Funds are generally allocated amongst such funds on the basis of average net assets. Management fees and some other expenses are paid monthly. Security transactions are recorded on the date the securities are purchased or sold (trade date) for financial reporting purposes. Costs used in calculating realized gains and losses on the sale of investment securities are those of the specific securities sold. Dividend income is recorded on the ex-dividend date and interest income is recorded on the accrual basis. Discounts and premiums on non-convertible bonds are amortized to interest income over the lives of the respective securities. Distributions received from investments in
(continues) 21
Notes to financial statements
Delaware Investments® Dividend and Income Fund, Inc.
1. Significant Accounting Policies (continued)
Real Estate Investment Trusts (REITs) are recorded as dividend income on the ex-dividend date, subject to reclassification upon notice of the character of such distributions by the issuer.
Subject to seeking best execution, the Fund may direct certain security trades to brokers who have agreed to rebate a portion of the related brokerage commission to the Fund in cash. In general, best execution refers to many factors, including the price paid or received for a security, the commission charged, the promptness and reliability of execution, the confidentiality and placement accorded the order, and other factors affecting the overall benefit obtained by the Fund on the transaction. DMC, as defined below, and its affiliates have previously and may in the future act as an investment advisor to mutual funds or separate accounts affiliated with the administrator of the commission recapture program described above. In addition, affiliates of the administrator act as consultants in helping institutional clients choose investment advisors and may also participate in other types of business and provide other services in the investment management industry. There were no commission rebates the year ended November 30, 2009.
The Fund receives earnings credits from its custodian when positive cash balances are maintained, which are used to offset custody fees. The expense paid under this arrangement is included in custodian fees on the Statement of operations with the corresponding expense offset shown as “expense paid indirectly.”
On July 1, 2009, the Financial Accounting Standards Board (FASB) issued the FASB Accounting Standards Codification (Codification). The Codification became the single source of authoritative nongovernmental U.S. GAAP, superseding existing literature of the FASB, American Institute of Certified Public Accountants, Emerging Issues Task Force and other sources. The Codification is effective for interim and annual periods ending after September 15, 2009. The Fund adopted the codification for the year ended November 30, 2009. There was no impact to financial statements as the Codification requirements are disclosure-only in nature.
Management has evaluated whether any events or transactions occurred subsequent to November 30, 2009 through January 21, 2010, the date of issuance of the Fund’s financial statements, and determined that there were no material events or transactions that would require recognition or disclosure in the Fund’s financial statements.
2. Investment Management, Administration Agreements and Other Transactions with Affiliates
In accordance with the terms of its investment management agreement, the Fund pays Delaware Management Company (DMC), a series of Delaware Management Business Trust and the investment manager, an annual fee of 0.55% (calculated daily) of the adjusted average weekly net assets of the Fund. For purposes of the calculation of investment management fees, adjusted average weekly net assets excludes the line of credit liability.
Delaware Service Company, Inc. (DSC), an affiliate of DMC, provides fund accounting and financial administration oversight services to the Fund. For these services, the Fund pays DSC fees based on the aggregate daily net assets of the Delaware Investments Family of Funds at the following annual rate: 0.0050% of the first $30 billion; 0.0045% of the next $10 billion; 0.0040% of the next $10 billion; and 0.0025% of aggregate average daily net assets in excess of $50 billion. The fees payable to DSC under the service agreement described above are allocated among all Funds in the Delaware Investments Family of Funds on a relative net asset value basis. For the year ended November 30, 2009 the Fund was charged $3,860 for these services.
At November 30, 2009, the Fund had liabilities payable to affiliates as follows:
| Investment management fee payable to DMC | $ | 39,437 |
| Fees and expenses payable to DSC | | 354 |
| Other expenses payable to DMC and affiliates* | | 2,720 |
*DMC, as part of its administrative services, pays operating expenses on behalf of the Fund and is reimbursed on a periodic basis. Such expenses include items such as printing of shareholder reports, fees for audit, legal and tax services, stock exchange fees, custodian fees and Directors’ fees.
As provided in the investment management agreement, the Fund bears the cost of certain legal and tax services, including internal legal and tax services provided to the Fund by DMC and/or its affiliates’ employees. For the year ended November 30, 2009, the Fund was charged 4,876 for internal legal and tax services provided by DMC and/or its affiliates’ employees.
Directors’ fees include expenses accrued by the Fund for each Directors’ retainer and per meeting fees. Certain officers of DMC and DSC are officers and/or directors of the Fund. These officers and directors are paid no compensation by the Fund.
3. Investments
For the year ended November 30, 2009, the Fund made purchases of $48,237,972 and sales of $51,950,262 of investment securities other than short-term investments.
At November 30, 2009, the cost of investments for federal income tax purposes was $93,395,806. At November 30, 2009, net unrealized depreciation was $3,260,379, of which $6,026,772 related to unrealized appreciation of investments and $9,287,151 related to unrealized depreciation of investments.
The Fund applies the provisions, as amended to date, of Accounting Standards Codification 820 (ASC 820), Fair Value Measurements and Disclosures. ASC 820 defines fair value as the price that the Fund would receive to sell an asset or pay to transfer a liability in an orderly transaction between market participants at the measurement date under current market conditions. ASC 820 also establishes a framework for measuring fair value, and a three level hierarchy for fair value measurements based upon the transparency of inputs to the valuation of an asset or liability. Inputs may be observable or unobservable and refer broadly to the assumptions that market participants would use in pricing the asset or liability. Observable inputs reflect the assumptions market participants would use in pricing the asset or liability based on market data obtained from sources independent of the reporting entity. Unobservable inputs reflect the reporting entity’s own assumptions about the assumptions that market participants would use in pricing the asset or liability developed based on the best information available under the
22
circumstances. The Fund’s investment in its entirety is assigned a level based upon the observability of the inputs which are significant to the overall valuation. The three-tier hierarchy of inputs is summarized below.
Level 1 – inputs are quoted prices in active markets
Level 2 – inputs are observable, directly or indirectly
Level 3 – inputs are unobservable and reflect assumptions on the part of the reporting entity
The following table summarizes the valuation of the Fund’s investments by ASC 820 fair value hierarchy levels as of November 30, 2009:
| Level 1 | | Level 2 | | Level 3 | | Total |
| Common Stock | $ | 44,063,017 | | $ | — | | $ | 43 | | $ | 44,063,060 |
| Corporate Debt | | — | | | 40,007,055 | | | 74,379 | | | 40,081,434 |
| Investment | | | | | | | | | | | |
| Companies | | 20,904 | | | — | | | — | | | 20,904 |
| Short-Term | | — | | | 1,587,002 | | | — | | | 1,587,002 |
| Securities Lending | | | | | | | | | | | |
| Collateral | | 1,228,217 | | | 2,824,753 | | | 6,938 | | | 4,059,908 |
| Other | | 158,560 | | | 143,918 | | | 20,641 | | | 323,119 |
| Total | $ | 45,470,698 | | $ | 44,562,728 | | $ | 102,001 | | $ | 90,135,427 |
The following is a reconciliation of investments in which significant unobservable inputs (Level 3) were used in determining fair value:
| | | | | | | | | Securities | | | | | | | | |
| Corporate | | Common | | Lending | | | | | | | | |
| Debt | | Stock | | Collateral | | Other | | Total Fund |
| Balance as of | | | | | | | | | | | | | | | | | | | |
| 11/30/08 | $ | 362,100 | | | $ | 4 | | | $ | 13,385 | | | $ | 525,893 | | | $ | 901,382 | |
| Net purchases, | | | | | | | | | | | | | | | | | | | |
| sales, and | | | | | | | | | | | | | | | | | | | |
| settlements | | (498,263 | ) | | | — | | | | — | | | | (533,793 | ) | | | (1,032,056 | ) |
| Net realized loss | | — | | | | — | | | | — | | | | (427,726 | ) | | | (427,726 | ) |
| Net change in | | | | | | | | | | | | | | | | | | | |
| unrealized | | | | | | | | | | | | | | | | | | | |
| appreciation/ | | | | | | | | | | | | | | | | | | | |
| depreciation | | 210,542 | | | | 39 | | | | (6,447 | ) | | | 456,267 | | | | 660,401 | |
| Balance as of | | | | | | | | | | | | | | | | | | | |
| 11/30/09 | $ | 74,379 | | | $ | 43 | | | $ | 6,938 | | | $ | 20,641 | | | $ | 102,001 | |
| |
| Net change in | | | | | | | | | | | | | | | | | | | |
| unrealized | | | | | | | | | | | | | | | | | | | |
| appreciation/ | | | | | | | | | | | | | | | | | | | |
| depreciation | | | | | | | | | | | | | | | | | | | |
| from | | | | | | | | | | | | | | | | | | | |
| investments | | | | | | | | | | | | | | | | | | | |
| still held as | | | | | | | | | | | | | | | | | | | |
| of 11/30/09 | $ | (25,970 | ) | | $ | 39 | | | $ | (6,447 | ) | | $ | (82,407 | ) | | $ | (114,785 | ) |
4. Dividend and Distribution Information
Income and long-term capital gain distributions are determined in accordance with federal income tax regulations, which may differ from U.S. GAAP. Additionally, distributions from net gains on foreign currency transactions and net short-term gains on sales of investment securities are treated as ordinary income for federal income tax purposes. The tax character of dividends and distributions paid during the years ended November 30, 2009 and 2008 was as follows:
| Year Ended |
| 2009 | | 2008 |
| Ordinary income | $ | 3,988,862 | | $ | 5,710,800 |
| Return of capital | | 2,947,565 | | | 4,120,447 |
| Total | $ | 6,936,427 | | $ | 9,831,247 |
5. Components of Net Assets on a Tax Basis
As of November 30, 2009, the components of net assets on a tax basis were as follows:
| Shares of beneficial interest | $ | 97,186,304 | |
| Capital loss carryforwards | | (27,438,402 | ) |
| Unrealized depreciation of investments | | | |
| and foreign currencies | | (3,260,379 | ) |
| Other temporary differences | | (66,931 | ) |
| Net assets | $ | 66,420,592 | |
The differences between book basis and tax basis components of net assets are primarily attributable to tax deferral of losses on wash sales, contingent payment debt instruments, tax treatment of partnership income and market discount and premium on debt instruments.
For financial reporting purposes, capital accounts are adjusted to reflect the tax character of permanent book/tax differences. Reclassifications are primarily due to tax treatment of dividends and distributions, partnership income, gain (loss) on foreign currency transactions, market discount and premium on certain debt instruments, REITs and CDS contracts. Results of operations and net assets were not affected by these classifications. For the year ended November 30, 2009, the Fund recorded the following reclassifications.
| Distributions in excess of net investment income | $ | 56,952 | |
| Accumulated net realized loss | | 120,223 | |
| Paid-in capital | | (177,175 | ) |
For federal income tax purposes, capital loss carryforwards may be carried forward and applied against future capital gains. Capital loss carryforwards remaining at November 30, 2009 will expire as follows: $16,115,503 expires in 2016 and $11,322,899 expires in 2017.
6. Capital Stock
Shares obtained under the Fund’s dividend reinvestment plan are purchased by the Fund’s transfer agent, The Bank of New York Mellon (BNY Mellon) Shareowner Services, in the open market. There were no shares issued under the Fund’s dividend reinvestment plan for the years ended November 30, 2009 and 2008.
(continues) 23
Notes to financial statements
Delaware Investments® Dividend and Income Fund, Inc.
6. Capital Stock (continued)
On May 21, 2009, the Fund’s Board approved a tender offer for shares of the Fund’s common stock. The tender offer authorized the Fund to purchase up to 5% of its issued and outstanding shares at a price equal to the Fund’s net asset value at the close of business on the NYSE on June 29, 2009, the first business day following the expiration of the offer. The tender offer commenced on June 1, 2009 and expired on June 26, 2009.
In connection with the tender offer, the Fund purchased 496,792 shares of capital stock at a total cost of approximately $2,916,169. The tender offer was oversubscribed, and all tenders of shares were subject to proration (at a ratio of approximately 0.879434237) in accordance with the terms of the tender offer.
On May 22, 2008, the Fund’s Board approved a tender offer for shares of the Fund’s common stock. The tender offer authorized the Fund to purchase up to 5% of its issued and outstanding shares at a price equal to the Fund’s net asset value at the close of business on the NYSE on June 30, 2008, the first business day following the expiration of the offer. The tender offer commenced on May 30, 2008 and expired on June 27, 2008. In connection with the tender offer, the Fund purchased 522,939 shares of capital stock at a total cost of $5,004,526.
The Fund did not repurchase any shares under the Share Repurchase Program during the years ended November 30, 2009 and 2008.
7. Line of Credit
Effective November 17, 2009, the Fund borrowed money pursuant to a $ 30,000,000 Credit Agreement with BNY Mellon that expires on November 15, 2010. Prior to November 17, 2009, the Credit Agreement was $44,000,000. Depending on market conditions, the amount borrowed by the Fund pursuant to the Credit Agreement may be reduced or possibly increased in the future.
At November 30, 2009, the par value of loans outstanding was $20,225,000 at a variable interest rate of 1.38%. During the year ended November 30, 2009, the average daily balance of loans outstanding was $20,225,000 at a weighted average interest rate of approximately 1.14%. Interest on borrowings is based on a variable short-term rate plus an applicable margin. The commitment fee is computed at a rate of 0.25% per annum on the unused balance. The loan is collateralized by the Fund’s portfolio.
8. Swap Contracts
The Fund may enter into interest rate swap contracts, index swap contracts and CDS contracts in accordance with its investment objectives. The Fund may use interest rate swaps to adjust the Fund’s sensitivity to interest rates or to hedge against changes in interest rates. Index swaps may be used to gain exposure to markets that the Fund invests in, such as the corporate bond market. The Fund may also use index swaps as a substitute for futures or options contracts if such contracts are not directly available to the Fund on favorable terms. The Fund may enter into CDS contracts in order to hedge against a credit event, to enhance total return or to gain exposure to certain securities or markets.
Interest rate swaps. An interest rate swap is an exchange of interest rates between counterparties. In one instance, an interest rate swap involves payments received by the Fund from another party based on a variable or floating interest rate, in return for making payments based on a fixed interest rate. An interest rate swap can also work in reverse with the Fund receiving payments based on a fixed interest rate and making payments based on a variable or floating interest rate. Interest rate swaps may be used to adjust the Fund’s sensitivity to interest rates or to hedge against changes in interest rates. Periodic payments on such contracts are accrued daily and recorded as unrealized appreciation/depreciation on swap contracts. Upon periodic payment/receipt or termination of the contract, such amounts are recorded as realized gains or losses on swap contracts. A Fund’s maximum risk of loss from counterparty credit risk is the discounted net value of the cash flows to be received from/paid to the counterparty over the interest rate swap contract’s remaining life, to the extent that the amount is positive. This risk is mitigated by having a netting arrangement between the Fund and the counterparty and by the posting of collateral by the counterparty to the Fund to cover the Fund’s exposure to the counterparty.
Index swaps. Index swaps involve commitments to pay interest in exchange for a market linked return based on a notional amount. To the extent the total return of the security, instrument or basket of instruments underlying the transaction exceeds the offsetting interest obligation, the Fund will receive a payment from the counterparty. To the extent the total return of the security, instrument or basket of instruments underlying the transaction falls short of the offsetting interest obligation, the Fund will make a payment to the counterparty. The change in value of swap contracts outstanding, if any, is recorded as unrealized appreciation or depreciation daily. A realized gain or loss is recorded on maturity or termination of the swap contract. A Fund’s maximum risk of loss from counterparty credit risk is the discounted net value of the cash flows to be received from/paid to the counterparty over the index swap contract’s remaining life, to the extent that the amount is positive. This risk is mitigated by having a netting arrangement between the Fund and the counterparty and by the posting of collateral by the counterparty to the Fund to cover the Fund’s exposure to the counterparty.
Credit default swaps. A CDS contract is a risk-transfer instrument through which one party (purchaser of protection) transfers to another party (seller of protection) the financial risk of a credit event (as defined in the CDS agreement), as it relates to a particular reference security or basket of securities (such as an index). In exchange for the protection offered by the seller of protection, the purchaser of protection agrees to pay the seller of protection a periodic amount at a stated rate that is applied to the notional amount of the CDS contract. In addition, an upfront payment may be made or received by the Fund in connection with an unwinding or assignment of a CDS contract. Upon the occurrence of a credit event, the seller of protection would pay the par (or other agreed-upon) value of the referenced security (or basket of securities) to the counterparty.
During the year ended November 30, 2009, the Fund did not enter into CDS contracts as a purchaser or seller of protection. Periodic payments on such contracts are accrued daily and recorded as unrealized losses on swap contracts. Upon payment, such amounts are recorded as realized losses on swap contracts. Upfront payments made or received in connection with CDS contracts are amortized over the expected life of the CDS contracts as unrealized losses on swap contracts. The change in value of CDS contracts is recorded as unrealized appreciation or depreciation daily. A realized gain or loss is recorded upon a credit event (as defined in the CDS agreement) or the maturity or termination of the agreement. There were no outstanding credit default swap contracts at November 30, 2009.
24
Credit default swaps may involve greater risks than if the Fund had invested in the referenced obligation directly. Credit default swaps are subject to general market risk, liquidity risk, counterparty risk and credit risk. The Fund’s maximum risk of loss from counterparty is mitigated by having a netting arrangement between the Fund and the counterparty and by posting of collateral by the counterparty to the Fund to cover the Fund’s exposure to the counterparty. If the Fund enters into a CDS contract as a purchaser of protection and no credit event occurs, its exposure is limited to the periodic payments previously made to the counterparty.
Swaps generally. Because there is no organized market for swap contracts, the value of open swaps may differ from that which would be realized in the event the Fund terminated its position in the agreement. Risks of entering into these contracts include the potential inability of the counterparty to meet the terms of the contracts. This type of risk is generally limited to the amount of favorable movement in the value of the underlying security, instrument or basket of instruments, if any, at the day of default. Risks also arise from potential losses from adverse market movements and such losses could exceed the unrealized amounts shown on the statement of net assets.
9. Securities Lending
The Fund, along with other funds in the Delaware Investments® Family of Funds, may lend its securities pursuant to a security lending agreement (Lending Agreement) with BNY Mellon. With respect to each loan, if the aggregate market value of securities collateral held plus cash collateral received on any business day is less than the aggregate market value of the securities which are the subject of such loan, the borrower will be notified to provide additional collateral not less than the applicable collateral requirements. Cash collateral received is generally invested in the Mellon GSL DBT II Collateral Fund (Collective Trust) established by BNY Mellon for the purpose of investment on behalf of clients participating in its securities lending programs. The Collective Trust may invest in fixed income securities, with a weighted average maturity not to exceed 90 days, rated in one of the top three tiers by Standard & Poor’s Ratings Group (S&P) or Moody’s Investors Service, Inc. (Moody’s) or repurchase agreements collateralized by such securities. The Collective Trust seeks to maintain a net asset value per unit of $1.00, but there can be no assurance that it will always be able to do so. At November 30, 2009, the Collective Trust held only cash and assets with a maturity of one business day or less (Cash/Overnight Assets). The Fund may incur investment losses as a result of investing securities lending collateral in the Collective Trust. This could occur if an investment in the Collective Trust defaulted or if it were necessary to liquidate assets in the Collective Trust to meet returns on outstanding security loans at a time when the Collective Trust’s net asset value per unit was less than $1.00. Under those circumstances, the Fund may not receive an amount from the Collective Trust that is equal in amount to the collateral the Fund would be required to return to the borrower of the securities and the Fund would be required to make up for this shortfall. Effective April 20, 2009, BNY Mellon transferred the assets of the Collective Trust other than the Cash/Overnight Assets to the BNY Mellon SL DBT II Liquidating Fund (Liquidating Fund), effectively bifurcating the collateral investment pool. The Fund’s exposure to the Liquidating Fund is expected to decrease as the Liquidating Fund’s assets mature or are sold. In October 2008, BNY Mellon transferred certain distressed securities from the Collective Trust into the Mellon GSL Reinvestment Trust II.
The Fund can also accept U.S. government securities and letters of credit (non-cash collateral) in connection with securities loans. In the event of default or bankruptcy by the lending agent, realization and/or retention of the collateral may be subject to legal proceedings. In the event the borrower fails to return loaned securities and the collateral received is insufficient to cover the value of the loaned securities and provided such collateral shortfall is not the result of investment losses, the lending agent has agreed to pay the amount of the shortfall to the Fund, or at the discretion of the lending agent, replace the loaned securities. The Fund continues to record dividends or interest, as applicable, on the securities loaned and is subject to change in value of the securities loaned that may occur during the term of the loan. The Fund has the right under the Lending Agreement to recover the securities from the borrower on demand. With respect to security loans collateralized by non-cash collateral, the Fund receives loan premiums paid by the borrower. With respect to security loans collateralized by cash collateral, the earnings from the collateral investments are shared among the Fund, the security lending agent and the borrower. The Fund records security lending income net of allocations to the security lending agent and the borrower.
At November 30, 2009, the value of the securities on loan was $4,253,690, for which the Fund received collateral, comprised of securities collateral valued at $113,400, and cash collateral of $4,247,336. At November 30, 2009, the value of invested collateral was $4,059,908. Investments purchased with cash collateral are presented on the statement of net assets under the caption “Securities Lending Collateral.”
10. Credit and Market Risks
The Fund borrows through its line of credit for purposes of leveraging. Leveraging may result in higher degrees of volatility because the Fund’s net asset value could be subject to fluctuations in short-term interest rates and changes in market value of portfolio securities attributable to the leverage.
The Fund invests a portion of its assets in high yield fixed income securities, which carry ratings of BB or lower by S&P and/or Ba or lower by Moody’s. Investments in these higher yielding securities are generally accompanied by a greater degree of credit risk than higher rated securities. Additionally, lower rated securities may be more susceptible to adverse economic and competitive industry conditions than investment grade securities.
The Fund invests in REITs and is subject to some of the risks associated with that industry. If the Fund holds real estate directly as a result of defaults or receives rental income directly from real estate holdings, its tax status as a regulated investment company may be jeopardized. There were no direct real estate holdings during the year ended November 30, 2009. The Fund’s REIT holdings are also affected by interest rate changes, particularly if the REITs it holds use floating rate debt to finance their ongoing operations.
The Fund may invest up to 10% of its net assets in illiquid securities, which may include securities with contractual restrictions on resale, securities exempt from registration under Rule 144A of the Securities Act of 1933, as amended, and other securities which may not be readily marketable. The relative illiquidity of these securities may impair the Fund from disposing of them in a timely manner and at a fair price when it is necessary or desirable to do so. While maintaining oversight, the Fund’s Board has delegated to DMC the day-to-day functions of determining whether individual securities are liquid for purposes of the
(continues) 25
Notes to financial statements
Delaware Investments® Dividend and Income Fund, Inc.
10. Credit and Market Risks (continued)
Fund’s limitation on investments in illiquid assets. Securities eligible for resale pursuant to Rule 144A, which are determined to be liquid, are not subject to the 10% limit on investments in illiquid securities. Rule 144A and illiquid securities have been identified on the statement of net assets.
11. Contractual Obligations
The Fund enters into contracts in the normal course of business that contain a variety of indemnifications. The Fund’s maximum exposure under these arrangements is unknown. However, the Fund has not had prior claims or losses pursuant to these contracts. Management has reviewed the Fund’s existing contracts and expects the risk of loss to be remote.
12. Sale of Delaware Investments to Macquarie Group
On August 18, 2009, Lincoln National Corporation (parent company of Delaware Investments) and Macquarie Group (Macquarie) entered into an agreement pursuant to which Delaware Investments, including DMC and DSC, would be acquired by Macquarie, an Australia-based global provider of banking, financial, advisory, investment and funds management services (Transaction). The Transaction was completed on January 4, 2010. DMC and DSC are now wholly owned subsidiaries of Macquarie.
The Transaction resulted in a change of control of DMC which, in turn, caused the termination of the investment advisory agreement between DMC and the Fund. On January 4, 2010, the new investment advisory agreement between DMC and the Fund that was approved by the shareholders became effective.
13. Tax Information (Unaudited)
The information set forth below is for the Fund’s fiscal year as required by federal income tax laws. Shareholders, however, must report distributions on a calendar year basis for income tax purposes, which may include distributions for portions of two fiscal years of a fund. Accordingly, the information needed by shareholders for income tax purposes will be sent to them in January of each year. Please consult your tax advisor for proper treatment of this information.
For the fiscal year ended November 30, 2009, the Fund designates distributions paid during the year as follows:
| (A) | | (B) | | | | | | |
| Long-Term | | Ordinary | | (C) | | | | |
| Capital Gain | | Income | | Return | | Total | | (D) |
| Distributions | | Distributions* | | of Capital | | Distributions | | Qualifying |
| (Tax Basis) | | (Tax Basis) | | (Tax Basis) | | (Tax Basis) | | Dividends1 |
| — | | 57.51% | | 42.49% | | 100.00% | | 23.87% |
| (A), (B) and (C) are based on a percentage of the Fund’s total distributions. |
| (D) is based on percentage of ordinary income distributions of the Fund. |
| 1 Qualifying dividends represent dividends, which qualify for the corporate dividends received deduction. |
| * For the fiscal year ended November 30, 2009, certain dividends paid by the Fund may be subject to a maximum tax rate of 15%, as provided for by the Jobs and Growth Tax Relief Reconciliation Act of 2003. The Fund intends to designate up to a maximum amount of $ 954,309 to be taxed at maximum rate of 15%. Complete information will be computed and reported in conjunction with your 2009 Form 1099-DIV. |
26
Report of independent
registered public accounting firm
To the Shareholders and Board of Directors
Delaware Investments® Dividend and Income Fund, Inc.
We have audited the accompanying statement of net assets of Delaware Investments Dividend and Income Fund, Inc. (the “Fund”) as of November 30, 2009, and the related statements of operations and cash flows for the year then ended, the statements of changes in net assets for each of the two years in the period then ended, and the financial highlights for each of the five years in the period then ended. These financial statements and financial highlights are the responsibility of the Fund’s management. Our responsibility is to express an opinion on these financial statements and financial highlights based on our audits.
We conducted our audits in accordance with the standards of the Public Company Accounting Oversight Board (United States). Those standards require that we plan and perform the audit to obtain reasonable assurance about whether the financial statements and financial highlights are free of material misstatement. We were not engaged to perform an audit of the Fund’s internal control over financial reporting. Our audits included consideration of internal control over financial reporting as a basis for designing audit procedures that are appropriate in the circumstances, but not for the purpose of expressing an opinion on the effectiveness of the Fund’s internal control over financial reporting. Accordingly, we express no such opinion. An audit also includes examining, on a test basis, evidence supporting the amounts and disclosures in the financial statements and financial highlights, assessing the accounting principles used and significant estimates made by management, and evaluating the overall financial statement presentation. Our procedures included confirmation of securities owned as of November 30, 2009 by correspondence with the custodian and brokers or by other appropriate auditing procedures where replies from brokers were not received. We believe that our audits provide a reasonable basis for our opinion.
In our opinion, the financial statements and financial highlights referred to above present fairly, in all material respects, the financial position of the Delaware Investments Dividend and Income Fund, Inc. at November 30, 2009, the results of its operations and cash flows for the year then ended, the changes in its net assets for each of the two years in the period then ended, and its financial highlights for each of the five years in the period then ended, in conformity with U.S. generally accepted accounting principles.
Philadelphia, Pennsylvania
January 21, 2010
27
Other Fund information
(Unaudited)
Delaware Investments® Dividend and Income Fund, Inc.
Proxy Results
Annual Meeting
The Fund held its Annual Meeting of Shareholders on August 19, 2009. At the Annual Meeting, the Fund’s shareholders elected nine Directors. The results of the voting at the meeting were as follows:
| | | | | | No Ballot |
| Nominee | | | Shares Voted For | | Shares Withheld | | Received |
| Patrick P. Coyne | | 9,021,001.85 | | 295,749.00 | | 619,083.15 |
| Thomas L. Bennett | | 9,046,287.40 | | 270,463.45 | | 619,083.15 |
| John A. Fry | | 9,018,095.95 | | 298,654.90 | | 619,083.15 |
| Anthony D. Knerr | | 8,992,984.26 | | 323,766.59 | | 619,083.15 |
| Lucinda S. Landreth | | 9,039,017.00 | | 277,733.85 | | 619,083.15 |
| Ann R. Leven | | 9,013,650.87 | | 303,099.98 | | 619,083.15 |
| Thomas F. Madison | | 8,991,631.65 | | 325,119.20 | | 619,083.15 |
| Janet L. Yeomans | | 9,024,478.77 | | 292,272.08 | | 619,083.15 |
| J. Richard Zecher | | 9,045,289.36 | | 271,461.49 | | 619,083.15 |
Investment Management Agreement
The Fund held a Special Meeting of Shareholders on November 12, 2009. At the meeting, the Fund’s shareholders approved a new investment advisory agreement between the Fund and Delaware Management Company, a series of Delaware Management Business Trust. The results of the meeting were as follows:
| Shares Voted For | 4,425,276.247 |
| Shares Voted Against or Withheld | 329,615.530 |
| No Vote | 4,684,150.223 |
The meeting was held in connection with the Transaction described in Note 12 above.
Corporate Governance
The Fund’s audit committee charter is available on its web site at www.delawareinvestments.com, and the charter is also available in print to any shareholder who requests it. The Fund submitted its Annual CEO certification for 2009 to the New York Stock Exchange (“NYSE”) on September 16, 2009 stating that the CEO was not aware of any violation by the Fund of the NYSE’s corporate governance listing standards. In addition, the Fund had filed the required CEO/CFO certifications regarding the quality of the Fund’s public disclosure as exhibits to the Forms N-CSR and Forms N-Q filed by the Fund over the past fiscal year. The Fund’s Form N-CSR and Form N-Q filings are available on the Commission’s web site at www.sec.gov.
Changes to Portfolio Management Team
Kristen E. Bartholdson was appointed co-portfolio manager of the Fund on Dec. 8, 2008. Ms. Bartholdson joined Babak Zenouzi, Damon J. Andres, D. Tysen Nutt Jr., Anthony A. Lombardi, Robert Vogel Jr., Nikhil G. Lalvani, Nashira S. Wynn, Thomas H. Chow, Roger A. Early, and Kevin P. Loome in making day-to-day decisions for the Fund.
Fund management
Babak “Bob” Zenouzi
Senior Vice President, Senior Portfolio Manager
Bob Zenouzi is the lead manager for the domestic and global REIT effort at Delaware Investments, which includes the team, its process, and its institutional and retail products, which he created during his prior time with the firm. He also focuses on opportunities in Japan, Singapore, and Malaysia for the firm’s global REIT product. Additionally, he serves as lead portfolio manager for the firm’s Dividend Income products, which he helped to create in the 1990s. He is also a member of the firm’s asset allocation committee, which is responsible for building and managing multi-asset class portfolios. He rejoined Delaware Investments in May 2006 as senior portfolio manager and head of real estate securities. In his first term with the firm, he spent seven years as an analyst and portfolio manager, leaving in 1999 to work at Chartwell Investment Partners, where from 1999 to 2006 he was a partner and senior portfolio manager on Chartwell’s Small-Cap Value portfolio. He began his career with The Boston Company, where he held several positions in accounting and financial analysis. Zenouzi earned a master’s degree in finance from Boston College and a bachelor’s degree from Babson College. He is a member of the National Association of Real Estate Investment Trusts and the Urban Land Institute.
28
Damon J. Andres, CFA
Vice President, Senior Portfolio Manager
Damon J. Andres, who joined Delaware Investments in 1994 as an analyst, currently serves as a portfolio manager for REIT investments and convertibles. He also serves as a portfolio manager for the firm’s Dividend Income products. From 1991 to 1994, he performed investment-consulting services as a consulting associate with Cambridge Associates. Andres earned a bachelor’s degree in business administration with an emphasis in finance and accounting from the University of Richmond.
Kristen E. Bartholdson
Vice President, Portfolio Manager
Kristen E. Bartholdson is a portfolio manager with the firm’s Large-Cap Value Focus team. Prior to joining the firm in 2006 as an associate portfolio manager, she worked at Susquehanna International Group from 2004 to 2006, where she was an equity research salesperson. From 2000 to 2004 she worked in equity research at Credit Suisse, most recently as an associate analyst in investment strategy. Bartholdson earned her bachelor’s degree in economics from Princeton University.
Thomas H. Chow, CFA
Senior Vice President, Senior Portfolio Manager
Thomas H. Chow is a member of the firm’s taxable fixed income portfolio management team, with primary responsibility for portfolio construction and strategic asset allocation in investment grade credit exposures. He is the lead portfolio manager for Delaware Corporate Bond Fund and Delaware Extended Duration Bond Fund, as well as several institutional mandates. His experience includes significant exposure to asset liability management strategies and credit risk opportunities. Prior to joining Delaware Investments in 2001 as a portfolio manager working on the Lincoln General Account, he was a trader of high grade and high yield securities, and was involved in the portfolio management of collateralized bond obligations (CBOs) and insurance portfolios at SunAmerica/AIG from 1997 to 2001. Before that, he was an analyst, trader, and portfolio manager at Conseco Capital Management from 1989 to 1997. Chow received a bachelor’s degree in business analysis from Indiana University, and he is a Fellow of Life Management Institute.
Roger A. Early, CPA, CFA, CFP
Senior Vice President, Co-Chief Investment Officer – Total Return Fixed Income Strategy
Roger A. Early rejoined Delaware Investments in March 2007 as a member of the firm’s taxable fixed income portfolio management team, with primary responsibility for portfolio construction and strategic asset allocation. During his previous time at the firm, from 1994 to 2001, he was a senior portfolio manager in the same area, and he left Delaware Investments as head of its U.S. investment grade fixed income group. In recent years, Early was a senior portfolio manager at Chartwell Investment Partners and Rittenhouse Financial and served as the chief investment officer for fixed income at Turner Investments. Prior to joining Delaware Investments in 1994, he worked for more than 10 years at Federated Investors where he managed more than $25 billion in mutual fund and institutional portfolios in the short-term and investment grade markets. He left the firm as head of institutional fixed income management. Earlier in his career, he held management positions with the Federal Reserve Bank, PNC Financial, Touche Ross, and Rockwell International. Early earned his bachelor’s degree in economics from The Wharton School of the University of Pennsylvania and an MBA with concentrations in finance and accounting from the University of Pittsburgh. He is a member of the CFA Society of Philadelphia.
Nikhil G. Lalvani, CFA
Vice President, Portfolio Manager
Nikhil G. Lalvani is a portfolio manager with the firm’s Large-Cap Value Focus team. At Delaware Investments, Lalvani has served as both a fundamental and quantitative analyst. Prior to joining the firm in 1997 as an account analyst, he was a research associate with Bloomberg. Lalvani holds a bachelor’s degree in finance from The Pennsylvania State University. He is a member of the CFA Institute and the CFA Society of Philadelphia.
Anthony A. Lombardi, CFA
Vice President, Senior Portfolio Manager
Anthony A. Lombardi is a senior portfolio manager for the firm’s Large-Cap Value Focus strategy. Prior to joining the firm in 2004 in his current role, Lombardi was a director at Merrill Lynch Investment Managers. He joined Merrill Lynch Investment Managers’ Capital Management Group in 1998 and last served as a portfolio manager for the U.S. Active Large-Cap Value team, managing mutual funds and separate accounts for institutions and private clients. From 1990 to 1997, he worked at Dean Witter Reynolds as a sell-side equity research analyst. He began his career as an investment analyst with Crossland Savings. Lombardi graduated from Hofstra University, receiving a bachelor’s degree in finance and an MBA with a concentration in finance. He is a member of the New York Society of Security Analysts and the CFA Institute.
(continues) 29
Other Fund information
(Unaudited)
Delaware Investments® Dividend and Income Fund, Inc.
Fund management (continued)
Kevin P. Loome, CFA
Senior Vice President, Senior Portfolio Manager, Head of High Yield Investments
Kevin P. Loome is head of the High Yield fixed income team, responsible for portfolio construction and strategic asset allocation of all high yield fixed income assets. Prior to joining Delaware Investments in August 2007 in his current position, Loome spent 11 years at T. Rowe Price, starting as an analyst and leaving the firm as a portfolio manager. He began his career with Morgan Stanley as a corporate finance analyst in the New York and London offices. Loome received his bachelor’s degree in commerce from the University of Virginia and earned an MBA from the Tuck School of Business at Dartmouth.
D. Tysen Nutt Jr.
Senior Vice President, Senior Portfolio Manager, Team Leader – Large-Cap Value Focus Equity
D. Tysen Nutt Jr. joined Delaware Investments in 2004 as senior vice president and senior portfolio manager for the firm’s Large-Cap Value Focus strategy. Before joining the firm, Nutt led the U.S. Active Large-Cap Value team within Merrill Lynch Investment Managers, where he managed mutual funds and separate accounts for institutions and private clients. He departed Merrill Lynch Investment Managers as a managing director. Prior to joining Merrill Lynch Investment Managers in 1994, Nutt was with Van Deventer & Hoch (V&H) where he managed large-cap value portfolios for institutions and private clients. He began his investment career at Dean Witter Reynolds, where he eventually became vice president, investments. Nutt earned his bachelor’s degree from Dartmouth College, and he is a member of the New York Society of Security Analysts and the CFA Institute.
Robert A. Vogel Jr., CFA
Vice President, Senior Portfolio Manager
Robert A. Vogel Jr. joined Delaware Investments in 2004 as a vice president, senior portfolio manager for the firm’s Large-Cap Value Focus strategy. He previously worked at Merrill Lynch Investment Managers for more than seven years, where he rose to the position of director and portfolio manager within the U.S. Active Large-Cap Value team. He began his career in 1992 as a financial consultant at Merrill Lynch Investment Managers. Vogel graduated from Loyola College in Maryland, earning both bachelor’s and master’s degrees in finance. He also earned an MBA with a concentration in finance from The Wharton School of the University of Pennsylvania. Vogel is a member of the New York Society of Security Analysts, the CFA Institute, and the CFA Society of Philadelphia.
Nashira S. Wynn
Vice President, Portfolio Manager
Nashira S. Wynn is a portfolio manager with the firm’s Large-Cap Value Focus team. Prior to joining Delaware Investments in 2004 as a senior equity analyst, she was an equity research analyst for Merrill Lynch Investment Managers, starting there in July 2001. Wynn earned a bachelor’s degree in finance, with a minor in economics, from The College of New Jersey, and she attended England’s Oxford University as a Presidential Scholar.
30
Distribution Information
Shareholders were sent monthly notices from the Fund that set forth estimates, on a book basis, of the source or sources from which monthly distributions were paid. Subsequently, certain of these estimates have been corrected in part. Listed below is a written statement of the sources of these monthly distributions on a book basis.
| | | | | | Long Term | | Total |
| | Investment | | Return of | | Capital | | Distribution |
| | Income | | Capital | | Gain(Loss) | | Amount |
| Month | | | per Share | | per Share | | per Share | | per Share |
| December 2008 | | $ | 0.0480 | | | | $ | 0.0320 | | | | $ | — | | | | $ | 0.0800 | |
| January 2009 | | $ | 0.0295 | | | | $ | 0.0280 | | | | | — | | | | $ | 0.0575 | |
| February 2009 | | $ | 0.0299 | | | | $ | 0.0276 | | | | | — | | | | $ | 0.0575 | |
| March 2009 | | $ | 0.0334 | | | | $ | 0.0241 | | | | | — | | | | $ | 0.0575 | |
| April 2009 | | $ | 0.0222 | | | | $ | 0.0353 | | | | | — | | | | $ | 0.0575 | |
| May 2009 | | $ | 0.0348 | | | | $ | 0.0227 | | | | | — | | | | $ | 0.0575 | |
| June 2009 | | $ | 0.0259 | | | | $ | 0.0316 | | | | | — | | | | $ | 0.0575 | |
| July 2009 | | $ | 0.0314 | | | | $ | 0.0261 | | | | | — | | | | $ | 0.0575 | |
| August 2009 | | $ | 0.0355 | | | | $ | 0.0220 | | | | | — | | | | $ | 0.0575 | |
| September 2009 | | $ | 0.0370 | | | | $ | 0.0205 | | | | | — | | | | $ | 0.0575 | |
| October 2009 | | $ | 0.0285 | | | | $ | 0.0290 | | | | | — | | | | $ | 0.0575 | |
| November 2009 | | $ | 0.0446 | | | | $ | 0.0129 | | | | | — | | | | $ | 0.0575 | |
| | $ | 0.4007 | | | | $ | 0.3118 | | | | $ | 0.0000 | | | | $ | 0.7125 | |
Please note that the information in the preceding chart is for book purposes only. Shareholders should be aware the tax treatment of distributions may differ from their book treatment. The tax treatment of distributions will be set forth in a Form 1099-DIV.
In January 2009, the Fund reduced the monthly distribution amount from $0.08 per share to $0.0575 per share. The Fund continues to evaluate its monthly distribution in light of ongoing economic and market conditions and may change the amount of the monthly distributions in the future.
Tender Offer
As described in Note 6 to the Financial Statements, the Fund conducted a tender offer in 2009. There can be no assurance that a tender offer will reduce or eliminate any spread between market price and the net asset value of the Fund’s shares. The market price of the shares will, among other things, be determined by the relative demand for and supply of shares in the market, the Fund’s investment performance, the Fund’s dividends and yields, and investor perception of the Fund’s overall attractiveness as an investment as compared with other investment alternatives. Nevertheless, the fact that a tender offer may be conducted may result in more of a reduction in the spread between market price and net asset value than might otherwise be the case. The Fund’s Board of Directors, consistent with its fiduciary obligations, may explore alternatives to a tender offer to reduce or eliminate the Fund’s potential market value discount from net asset value. Therefore, the Fund cannot provide assurance that it will make tender offers in the future.
Since the Fund’s organization in 1993, the Fund has consummated six tender offers, including tender offers in 2000, 2005, 2006, 2007, 2008, and 2009.
Dividend Reinvestment Plan
The Fund offers an automatic dividend reinvestment program (“Plan”). Shareholders who have shares registered in their own names are automatically considered participants in the Plan, unless they elect to withdraw from the Plan. Shareholders who hold their shares through a bank, broker, or other nominee should request the bank, broker, or nominee to participate in the Plan on their behalf. This can be done as long as the bank, broker, or nominee provides a dividend reinvestment service for the Fund. If the bank, broker, or nominee does not provide this service, such shareholders must have their shares taken out of “street” or nominee name and re-registered in their own name in order to participate in the Plan.
BNY Mellon Shareowner Services will apply all cash dividends, capital gains and other distributions (collectively, “Distributions”) on the Fund’s shares of common stock which become payable to each Plan participant to the purchase of outstanding shares of the Fund’s common stock for such participant. These purchases may be made on a securities exchange or in the over-the-counter market, and may be subject to such terms of price, delivery, and related matters to which BNY Mellon Shareowner Services may agree. The Fund will not issue new shares in connection with the Plan.
Distributions reinvested for participants are subject to income taxes just as if they had been paid directly to the shareholder in cash. Participants will receive a year-end statement showing distributions reinvested, and any brokerage commissions paid on such participant’s behalf.
Shareholders holding shares of the Fund in their own names who wish to terminate their participation in the Plan may do so by sending written instruction to BNY Mellon Shareowner Services so that BNY Mellon Shareowner Services receives such instructions at least 10 days prior to the Distribution record date. Shareholders with shares held in account by a bank, broker, or other nominee should contact such bank, broker, or other nominee to determine the procedure for withdrawal from the Plan.
(continues) 31
Other Fund information
(Unaudited)
Delaware Investments® Dividend and Income Fund, Inc.
Dividend Reinvestment Plan (continued)
If written instructions are not received by BNY Mellon Shareowner Services at least 10 days prior to the record date for a particular Distribution, that Distribution may be reinvested at the sole discretion of BNY Mellon Shareowner Services. After a shareholder’s instructions to terminate participation in the Plan become effective, Distributions will be paid to shareholders in cash. Upon termination, a shareholder may elect to receive either stock or cash for all the full shares in the account. If cash is elected, BNY Mellon Shareowner Services will sell such shares at the then current market value and then send the net proceeds to the shareholder, after deducting brokerage commissions and related expenses. Any fractional shares at the time of termination will be paid in cash at the current market price, less brokerage commissions and related expenses, if any. Shareholders may at any time request a full or partial withdrawal of shares from the Plan, without terminating participation in the Plan. When shares outside of the Plan are liquidated, Distributions on shares held under the Plan will continue to be reinvested unless BNY Mellon Shareowner Services is notified of the shareholder’s withdrawal from the Plan.
An investor holding shares that participate in the Plan in a brokerage account may not be able to transfer the shares to another broker and continue to participate in the Plan. Please contact your broker/dealer for additional details.
BNY Mellon Shareowner Services will charge participants their proportional share of brokerage commissions on market purchases. Participants may obtain a certificate or certificates for all or part of the full shares credited to their accounts at any time by making a request in writing to BNY Mellon Shareowner Services. A fee may be charged to the participant for each certificate issuance.
If you have any questions and shares are registered in your name, contact BNY Mellon Shareowner Services at 800 851-9677. If you have any questions and shares are registered in “street” name, contact the broker/dealer holding the shares or your financial advisor.
Effective August 1, 2008, the Dividend Reinvestment Plan may be amended by the Fund upon twenty days written notice to the Plan’s participants.
Board Consideration of New Investment Advisory Agreement
At a meeting held on September 3, 2009 (the “Meeting”), the Board of Directors of the Delaware Investments Family of Funds (the “Board”), including the independent Directors, unanimously approved a new investment advisory agreement between each registrant on behalf of each series (each, a “Fund” and together, the “Funds”) and Delaware Management Company (“DMC”) in connection with the sale of Delaware Investments’ advisory business to Macquarie Bank Limited (the “Macquarie Group”) (the “Transaction”). In making its decision, the Board considered information furnished specifically in connection with the approval of the new investment advisory agreements with DMC (the “New Investment Advisory Agreements”), which included extensive materials about the Transaction and matters related to the proposed approvals. To assist the Board in considering the New Investment Advisory Agreements, Macquarie Group provided materials and information about Macquarie Group, including detailed written responses to the questions posed by the independent Directors. DMC also provided materials and information about the Transaction, including detailed written responses to the questions posed by the independent Directors.
At the Meeting, the Directors discussed the Transaction with DMC management and with key Macquarie Group representatives. The Meeting included discussions of the strategic rationale for the Transaction and Macquarie Group’s general plans and intentions regarding the Funds and DMC. The Board members also inquired about the plans for, and anticipated roles and responsibilities of, key employees and officers of Delaware Management Holdings Inc. and DMC in connection with the Transaction.
In connection with the Directors’ review of the New Investment Advisory Agreements for the Funds, DMC and/or Macquarie Group emphasized that:
- They expected that there would be no adverse changes as a result of the Transaction, in the nature, quality, or extent of services currently provided to the Funds and their shareholders, including investment management, distribution, or other shareholder services.
- No material changes in personnel or operations were contemplated in the operation of DMC under Macquarie Group as a result of the Transaction and no material changes were currently contemplated in connection with third party service providers to the Funds.
- Macquarie Group had no intention to cause DMC to alter the voluntary expense waivers and reimbursements currently in effect for the Funds.
- Under the agreement between Macquarie Group and Lincoln National Corporation (“LNC”) (the “Transaction Agreement”), Macquarie Group has agreed to conduct, and to cause its affiliates to conduct, their respective businesses in compliance with the conditions of Section 15(f) of the Investment Company Act of 1940 (the “1940 Act”) with respect to the Funds, to the extent within its control, including maintaining Board composition of at least 75% of the Board members qualifying as independent Directors and not imposing any “unfair burden” on the Funds for at least two years from the closing of the Transaction (the “Closing”).
In addition to the information provided by DMC and Macquarie Group as described above, the Directors also considered all other factors they believed to be relevant to evaluating the New Investment Advisory Agreements, including the specific matters discussed below. In their deliberations, the Directors did not identify any particular information that was controlling, and different Directors may have attributed different weights to the various factors. However, for each Fund, the Directors determined that the overall arrangements between the Fund and DMC, as provided in the respective
32
New Investment Advisory Agreement, including the proposed advisory fee and the related administration arrangements between the Fund and DMC, were fair and reasonable in light of the services to be performed, expenses incurred, and such other matters as the Directors considered relevant. Factors evaluated included:
- The potential for expanding distribution of Fund shares through access to Macquarie Group’s existing distribution channels;
- Delaware Investments’ acquisition of an exclusive wholesaling sales force from a subsidiary of LNC;
- The reputation, financial strength, and resources of Macquarie Group as well as its historic and ongoing commitment to the asset management business in Australia as well as other parts of the world;
- The terms and conditions of the New Investment Advisory Agreements, including that each Fund’s total contractual fee rate under the New Investment Advisory Agreement will remain the same;
- The Board’s full annual review (or initial approval) of the current investment advisory agreements at their in-person meeting in May 2009 as required by the 1940 Act and its determination that (i) DMC had the capabilities, resources, and personnel necessary to provide the satisfactory advisory and administrative services currently provided to each Fund and (ii) the advisory and/or management fees paid by each Fund, taking into account any applicable fee waivers and breakpoints, represented reasonable compensation to DMC in light of the services provided, the costs to DMC of providing those services, economies of scale, and the fees and other expenses paid by similar funds and such other matters that the Board considered relevant in the exercise of its reasonable judgment;
- The portfolio management teams for the Funds are not currently expected to change as a result of the Transaction;
- LNC and Macquarie Group were expected to execute a reimbursement agreement pursuant to which LNC and Macquarie Group would agree to pay (or reimburse) all reasonable out-of-pocket costs and expenses of the Funds in connection with the Board’s consideration of the Transaction, the New Investment Advisory Agreements and related agreements, and all costs related to the proxy solicitation (the “Expense Agreement”);
- The likelihood that Macquarie Group would invest additional amounts in Delaware Investments, including DMC, which could result in increased assets under management, which in turn would allow some Funds the potential opportunity to achieve economies of scale and lower fees payable by Fund shareholders; and
- The compliance and regulatory history of Macquarie Group and its affiliates.
In making their decision relating to the approval of each Fund’s New Investment Advisory Agreement, the independent Directors gave attention to all information furnished. The following discussion, however, identifies the primary factors taken into account by the Directors and the conclusions reached in approving the New Investment Advisory Agreements.
Nature, Extent, and Quality of Service. The Directors considered the services historically provided by DMC to the Funds and their shareholders. In reviewing the nature, extent, and quality of services, the Board considered that the New Investment Advisory Agreements would be substantially similar to the current investment advisory agreements between the Funds and DMC (the “Current Investment Advisory Agreements”), and they, therefore, considered the many reports furnished to them throughout 2008 and 2009 at regular Board meetings covering matters such as the relative performance of the Funds; the compliance of portfolio managers with the investment policies, strategies, and restrictions for the Funds; the compliance of management personnel with the code of ethics adopted throughout the Delaware Investments Family of Funds complex; and the adherence to fair value pricing procedures as established by the Board. The Directors were pleased with the current staffing of DMC and the emphasis placed on research and risk management in the investment process. Favorable consideration was given to DMC’s efforts to maintain expenditures and, in some instances, increase financial and human resources committed to Fund matters.
The Board was assured that shareholders would continue to receive the benefits provided to Fund shareholders by being part of the Delaware Investments Family of Funds. Based on the information provided by DMC and Macquarie Group, including that Macquarie Group and DMC currently expected no material changes as a result of the Transaction in (i) personnel or operations of DMC or (ii) third party service providers to the Funds, the Board concluded that the satisfactory nature, extent, and quality of services currently provided to the Funds and their shareholders were very likely to continue under the New Investment Advisory Agreements. The Board also concluded that it was very unlikely that any “unfair burden” would be imposed on any of the Funds for the first two years following the Closing as a result of the Transaction. Consequently, the Board concluded that it did not expect the Transaction to result in any adverse changes in the nature, quality, or extent of services (including investment management, distribution or other shareholder services) currently provided to the Funds and their shareholders.
Investment Performance. The Board considered the overall investment performance of DMC and the Funds. The Directors placed significant emphasis on the investment performance of the Funds in view of its importance to shareholders. Although the Directors gave appropriate consideration to performance reports and discussions with portfolio managers at Board meetings throughout the year, the Directors gave particular weight to their review of investment performance in connection with the approval of the Current Investment Advisory Agreements at the Board meeting held in May 2009. At that meeting, the Directors reviewed reports prepared by Lipper, Inc., an independent statistical compilation organization (“Lipper”) which showed
(continues) 33
Other Fund information
Unaudited
Delaware Investments® Dividend and Income Fund, Inc.
Board Consideration of New Investment Advisory Agreement (continued)
each Fund’s investment performance as of December 31, 2008 in comparison to a group of funds selected by Lipper as being similar to the Fund (the “Performance Universe”). During the May 2009 agreement review process, the Directors observed the significant improvements to relative investment performance of the Funds as compared to the Funds’ performance as of December 31, 2007.
At their meeting on September 3, 2009, the Directors, including the independent Directors in consultation with their independent counsel, reviewed the investment performance of each Fund. The Directors compared the performance of each Fund relative to that of its respective Performance Universe for the 1-, 3-, 5-, and 10-year periods ended June 30, 2009 and compared its relative investment performance against the corresponding relative investment performance of each Fund for such time periods ended December 31, 2008, to the extent applicable. As of June 30, 2009, 30 of the Funds had investment performance relative to that of the respective Performance Universe that was better than the corresponding relative investment performance at December 31, 2008 for all applicable time periods. At June 30, 2009, an additional 6 Funds had investment performance relative to that of their respective Performance Universe that was better than the corresponding relative investment performance at December 31, 2008 for a majority of the applicable time periods. At June 30, 2009, 15 additional Funds had investment performance relative to that of their respective Performance Universe that was better than the corresponding relative performance at December 31, 2008 and only 29 Funds had poorer relative investment performance at June 30, 2009 compared to that at December 31, 2008. The Board therefore concluded that the investment performance of the Funds on an aggregate basis had continued to improve relative to their respective Performance Universe since the data reviewed at the May 2009 meeting.
The Performance Universe for the Delaware Investments Dividend and Income Fund, Inc. consisted of the Fund and all leveraged closed–end income and preferred stock funds as selected by Lipper. The Lipper report comparison showed that the Fund’s total return for the one-, three- and five-year periods was in the second quartile. The report further showed that the Fund’s total return for the ten-year period was in the third quartile. The Board was satisfied with performance.
Based on information provided by DMC and Macquarie Group, the Board concluded that neither the Transaction nor the New Investment Advisory Agreement would likely have an adverse effect on the investment performance of any Fund because (i) DMC and Macquarie Group did not currently expect the Transaction to cause any material change to the Funds’ portfolio management teams responsible for investment performance, which the Board found to be satisfactory and improving; and (ii) as discussed in more detail below, the Funds’ expenses were not expected to increase as a result of the Transaction.
Comparative Expenses. The Directors also considered expense comparison data for the Funds previously provided in May 2009. At that meeting, DMC had provided the Board with information on pricing levels and fee structures for the Funds and comparative funds. The Directors focused on the comparative analysis of the effective management fees and total expense ratios of each Fund versus the effective management fees and expense ratios of a group of funds selected by Lipper as being similar to each Fund (the “Expense Group”). In reviewing comparative costs, each Fund’s contractual management fee and the actual management fee incurred by the Fund were compared with the contractual management fees (assuming all funds in the Expense Group were similar in size to the Fund) and actual management fees (as reported by each fund) of other funds within the Expense Group, taking into account any applicable breakpoints and fee limitations. Each Fund’s total expenses were also compared with those of its Expense Group. The Directors also considered fees paid to Delaware Investments for nonmanagement services. At the September 3, 2009 meeting, DMC advised the Board that the more recent comparative expenses for the Funds remained consistent with the previous review in May 2009 and, consequently, the Directors concluded that expenses of the Funds were satisfactory.
The Board also considered the Expense Agreement under negotiation in evaluating Fund expenses. The Directors expected that the Expense Agreement would provide that LNC and Macquarie Group would pay or reimburse the Funds for all reasonable out-of-pocket costs and expenses in connection with the Transaction and the consideration of the New Investment Advisory Agreements (subject to certain limited exceptions).
Based on information provided by DMC and Macquarie Group, the Board concluded that neither the Transaction nor the New Investment Advisory Agreements likely would have an adverse effect on the Funds’ expenses because (i) each Fund’s contractual fee rates under the New Investment Advisory Agreement would remain the same; (ii) under the Expense Agreement, the Funds would be reimbursed for all reasonable out-of-pocket costs and expenses in connection with the Transaction and the related proxy solicitation (subject to certain limited exceptions); and (iii) the expense ratios of certain Funds might decline as a result of the possible increased investment in Delaware Investments by Macquarie Group, as discussed below under “Economies of Scale.”
Management Profitability. At their meeting on September 3, 2009, the Board evaluated DMC’s profitability in connection with the operation of the Funds. The Board had previously considered DMC’s profitability in connection with the operation of the Funds at its May 2009 meeting. At that meeting, the Board reviewed an analysis that addressed the overall profitability of Delaware Investments’ business in providing management and other services to each of the Funds and the Delaware Investments Family of Funds as a whole. Specific attention was given to the methodology followed in allocating costs for the purpose of determining profitability.
At the May 2009 meeting, representatives of DMC had stated that the level of profits of DMC, to a certain extent, reflect operational cost savings and efficiencies initiated by Delaware Investments (including DMC and its affiliates that provide services to the Funds). The Board considered Delaware Investments’ efforts to improve services provided to Fund shareholders and to meet additional regulatory and compliance requirements resulting from recent industry-wide U.S. Securities and Exchange Commission initiatives. At that meeting, the Board found that the management fees were reasonable in light of the services rendered and the level of profitability of DMC. At the September 3, 2009 meeting, DMC advised the
34
Board that DMC did not expect the Transaction to affect materially the profitability of Delaware Investments compared to the level of profitability considered during the May 2009 review. Moreover, the Directors reviewed pro forma balance sheets of certain key companies in Delaware Investments as of June 30, 2009 (which were provided by Macquarie Group and DMC in response to the Directors’ requests) and evaluated the projections of Delaware Investments’ capitalization following the Transaction for purposes of evaluating the financial ability of Delaware Investments to continue to provide the nature, extent, and quality of services as it had under the Current Investment Advisory Agreement.
Based on information provided by DMC and Macquarie Group, the Board concluded that DMC and Delaware Investments would be sufficiently capitalized following the Transaction to continue the same level and quality of services to the Funds under the New Investment Advisory Agreements as was the case under the Current Investment Advisory Agreements. The Board also concluded that Macquarie Group had sufficient financial strength and resources, as well as an ongoing commitment to a global asset management business, to continue investing in Delaware Investments, including DMC, to the extent that Macquarie Group determined it was appropriate. Finally, because services and costs were expected to be substantially the same (and DMC had represented that, correspondingly, profitability would be about the same), under the New Investment Advisory Agreements as under the Current Investment Advisory Agreements, the Directors concluded that the profitability of Delaware Investments would not result in an inequitable charge on the Funds or their shareholders. Accordingly, the Board concluded that the fees charged under the New Investment Advisory Agreements would be reasonable in light of the services to be provided and the expected profitability of DMC.
Economies of Scale. As a closed-end fund, the Funds do not issue shares on a continuous basis. Fund assets increase only to the extent that the values of the underlying securities in the Fund increase. Accordingly, the Board determined that the Funds were not likely to experience significant economies of scale due to asset growth and, therefore, a fee schedule with breakpoints to pass the benefit of economies of scale on to shareholders was not likely to provide the intended effect.
The Board also acknowledged Macquarie Group’s statement that the Transaction would not by itself immediately provide additional economies of scale given Macquarie Group’s limited presence in the U.S. mutual fund market. Nonetheless, the Directors concluded that additional economies of scale could potentially be achieved in the future if DMC were owned by Macquarie Group as a result of Macquarie Group’s willingness to invest further in Delaware Investments if appropriate opportunities arise.
Fall-Out Benefits. The Board acknowledged that DMC would continue to benefit from soft dollar arrangements using portfolio brokerage of each Fund that invests in equity securities and that DMC’s profitability would likely be somewhat lower without the benefit of practices with respect to allocating Fund portfolio brokerage for brokerage and research services. The Board also considered that Macquarie Group and Delaware Investments may derive reputational, strategic, and other benefits from their association with the Delaware Investments Family of Funds, and evaluated the extent to which Delaware Investments might derive ancillary benefits from Fund operations, including the potential for procuring additional business as a result of the prestige and visibility associated with its role as service provider to the Delaware Investments Family of Funds and the benefits from allocation of Fund brokerage to improve trading efficiencies. However, the Board concluded that (i) any such benefits under the New Investment Advisory Agreements would not be dissimilar from those existing under the Current Investment Advisory Agreements; (ii) such benefits did not impose a cost or burden on the Funds or their shareholders; and (iii) such benefits would probably have an indirectly beneficial effect on the Funds and their shareholders because of the added importance that DMC and Macquarie Group might attach to the Funds as a result of the fall-out benefits that the Funds conveyed.
Board Review of Macquarie Group. The Directors reviewed detailed information supplied by Macquarie Group about its operations as well as other information regarding Macquarie Group provided by independent legal counsel to the independent Directors. Based on this review, the Directors concluded that Delaware Investments would continue to have the financial ability to maintain the high quality of services required by the Funds. The Directors noted that there would be a limited transition period during which some services previously provided by LNC to Delaware Investments would continue to be provided by LNC after the Closing, and concluded that this arrangement would help minimize disruption in Delaware Investments’ provision of services to the Funds following the Transaction.
The Board considered Macquarie Group’s current intention to leave the Funds’ other service providers in place. The Board also considered Macquarie Group’s current strategic plans to increase its asset management activities, one of its core businesses, particularly in North America, and its statement that its acquisition of DMC is an important component of this strategic growth and the establishment of a significant presence in the United States. Based in part on the information provided by DMC and Macquarie Group, the Board concluded that Macquarie Group’s acquisition of Delaware Investments could potentially enhance the nature, quality, and extent of services provided to the Funds and their shareholders.
Conclusion. The Board concluded that the advisory fee rate under each New Investment Advisory Agreement was reasonable in relation to the services provided and that execution of the New Investment Advisory Agreement would be in the best interests of the shareholders. For each Fund, the Directors noted that they had concluded in their most recent advisory agreement continuance considerations in May 2009 that the management fees and total expense ratios were at acceptable levels in light of the quality of services provided to the Funds and in comparison to those of the Funds’ respective peer groups; that the advisory fee schedule would not be increased and would stay the same for all of the Funds; that the total expense ratio had not changed materially since that determination; and that DMC had represented that the overall expenses for each Fund were not expected to be adversely affected by the Transaction. The Directors also noted, with respect to the Funds that currently had the benefit of voluntary fee limitations, that Macquarie Group had no present intention to cause DMC to alter any voluntary expense limitations or reimbursements currently in effect. On that basis, the Trustees concluded that the total expense ratios and proposed advisory fees for the Funds anticipated to result from the Transaction were acceptable. In approving each New Investment Advisory Agreement, the Board stated that it anticipated reviewing the continuance of the New Investment Advisory Agreement in advance of the expiration of the initial two-year period.
35
Board of trustees/directors
and officers addendum
Delaware Investments® Family of Funds
A fund is governed by a Board of Trustees/Directors (“Trustees”), which has oversight responsibility for the management of a fund’s business affairs. Trustees establish procedures and oversee and review the performance of the investment manager and others who perform services for the fund. The independent fund trustees, in particular, are advocates for shareholder interests. Each trustee has served in that capacity since he or she was elected to or appointed to the Board of Trustees, and will continue to serve until his or her retirement or the election of a new trustee in his or her place. The following is a list of the Trustees and Officers with certain background and related information.
| | | | Number of | |
| | | | Portfolios in Fund | Other |
| Name, | | | | Complex Overseen | Directorships |
| Address, | Position(s) | Length of | Principal Occupation(s) | by Trustee | Held by |
| and Birth Date | Held with Fund(s) | Time Served | During Past 5 Years | or Officer | Trustee or Officer |
| Interested Trustees | | | | | |
| Patrick P. Coyne1 | Chairman, | Chairman and Trustee | Patrick P. Coyne has served in | 80 | Director — |
| 2005 Market Street | President, | since August 2006 | various executive capacities | | Kaydon Corp. |
| Philadelphia, PA | Chief Executive | | at different times at | | |
| 19103 | Officer, and | President and | Delaware Investments.2 | | |
| Trustee | Chief Executive Officer | | | |
| April 1963 | | since August 2006 | | | |
| Independent Trustees | | | | | |
| Thomas L. Bennett | Trustee | Since | Private Investor — | 80 | Director — |
| 2005 Market Street | | March 2005 | (March 2004–Present) | | Bryn Mawr |
| Philadelphia, PA | | | | | Bank Corp. (BMTC) |
| 19103 | | | | | (April 2007–Present) |
| | | | | |
| October 1947 | | | | | |
| John A. Fry | Trustee | Since | President — | 80 | Director — |
| 2005 Market Street | | January 2001 | Franklin & Marshall College | | Community Health |
| Philadelphia, PA | | | (June 2002–Present) | | Systems |
| 19103 | | | | | |
| | | | | |
| May 1960 | | | | | |
| | | | | |
| Anthony D. Knerr | Trustee | Since | Founder and Managing Director — | 80 | None |
| 2005 Market Street | | April 1990 | Anthony Knerr & Associates | | |
| Philadelphia, PA | | | (Strategic Consulting) | | |
| 19103 | | | (1990–Present) | | |
| | | | | | |
| December 1938 | | | | | |
| Lucinda S. Landreth | Trustee | Since | Chief Investment Officer — | 80 | None |
| 2005 Market Street | | March 2005 | Assurant, Inc. | | |
| Philadelphia, PA | | | (Insurance) | | |
| 19103 | | | (2002–2004) | | |
| | | | | | |
| June 1947 | | | | | |
| Ann R. Leven | Trustee | Since | Consultant — | 80 | None |
| 2005 Market Street | | October 1989 | ARL Associates | | |
| Philadelphia, PA | | | (Financial Planning) | | |
| 19103 | | | (1983–Present) | | |
| | | | | | |
| November 1940 | | | | | |
36
| | | | | Number of | |
| | | | | Portfolios in Fund | Other |
| Name, | | | | Complex Overseen | Directorships |
| Address, | Position(s) | Length of | Principal Occupation(s) | by Trustee | Held by |
| and Birth Date | Held with Fund(s) | Time Served | During Past 5 Years | or Officer | Trustee or Officer |
| Independent Trustees (continued) | | | | |
| Thomas F. Madison | Trustee | Since | President and Chief | 80 | Director and Chair of |
| 2005 Market Street | | May 19973 | Executive Officer — | | Compensation |
| Philadelphia, PA | | | MLM Partners, Inc. | | Committee, |
| 19103 | | | (Small Business Investing | | Governance Committee |
| | | and Consulting) | | Member |
| February 1936 | | | (January 1993–Present) | | — CenterPoint Energy |
| | | | | |
| | | | | Lead Director and Chair |
| | | | | of Audit |
| | | | | and Governance |
| | | | | Committees, |
| | | | | Member of |
| | | | | Compensation |
| | | | | Committee — Digital |
| | | | | River, Inc. |
| | | | | |
| | | | | Director and Chair of |
| | | | | Governance |
| | | | | Committee, Audit |
| | | | | Committee Member — |
| | | | | Rimage Corporation |
| | | | | |
| | | | | Director and Chair of |
| | | | | Compensation |
| | | | | Committee — Spanlink |
| | | | | Communications |
| | | | | |
| | | | | Lead Director and Chair |
| | | | | of Compensation and |
| | | | | Governance |
| | | | | Committees — |
| | | | | Valmont Industries, Inc. |
| Janet L. Yeomans | Trustee | Since | Vice President and Treasurer | 80 | None |
| 2005 Market Street | | April 1999 | (January 2006–Present) | | |
| Philadelphia, PA | | | Vice President — Mergers & Acquisitions | | |
| 19103 | | | (January 2003–January 2006), and | | |
| | | Vice President | | |
| July 1948 | | | (July 1995–January 2003) | | |
| | | 3M Corporation | | |
| J. Richard Zecher | Trustee | Since | Founder — | 80 | Director and Audit |
| 2005 Market Street | | March 2005 | Investor Analytics | | Committee Member — |
| Philadelphia, PA | | | (Risk Management) | | Investor Analytics |
| 19103 | | | (May 1999–Present) | | |
| | | | | | |
| July 1940 | | | Founder — | | |
| | | Sutton Asset Management | | |
| | | (Hedge Fund) | | |
| | | (September 1996–Present) | | |
(continues) 37
| | | | Number of | |
| | | | Portfolios in Fund | Other |
| Name, | | | | Complex Overseen | Directorships |
| Address, | Position(s) | Length of | Principal Occupation(s) | by Trustee | Held by |
| and Birth Date | Held with Fund(s) | Time Served | During Past 5 Years | or Officer | Trustee or Officer |
| Officers | | | | | |
| David F. Connor | Vice President, | Vice President since | David F. Connor has served as | 80 | None4 |
| 2005 Market Street | Deputy General | September 2000 | Vice President and Deputy | | |
| Philadelphia, PA | Counsel, and Secretary | and Secretary | General Counsel of | | |
| 19103 | | since | Delaware Investments | | |
| | October 2005 | since 2000. | | |
| December 1963 | | | | | |
| Daniel V. Geatens | Vice President | Treasurer | Daniel V. Geatens has served | 80 | None4 |
| 2005 Market Street | and Treasurer | since | in various capacities at | | |
| Philadelphia, PA | | October 2007 | different times at | | |
| 19103 | | | Delaware Investments. | | |
| October 1972 | | | | | |
| David P. O’Connor | Senior Vice | Senior Vice President, | David P. O’Connor has served in | 80 | None4 |
| 2005 Market Street | President, | General Counsel, and | various executive and legal | | |
| Philadelphia, PA | General Counsel, | Chief Legal Officer | capacities at different times | | |
| 19103 | and Chief | since | at Delaware Investments. | | |
| Legal Officer | October 2005 | | | |
| February 1966 | | | | | |
| Richard Salus | Senior | Chief Financial | Richard Salus has served in | 80 | None4 |
| 2005 Market Street | Vice President | Officer since | various executive capacities | | |
| Philadelphia, PA | and | November 2006 | at different times at | | |
| 19103 | Chief Financial | | Delaware Investments. | | |
| Officer | | | | |
| October 1963 | | | | | |
| 1 Patrick P. Coyne is considered to be an “Interested Trustee” because he is an executive officer of the Fund’s(s’) investment advisor. |
| 2 Delaware Investments is the marketing name for Delaware Management Holdings, Inc. and its subsidiaries, including the Fund’s(s’) investment advisor and administrator. |
| 3 In 1997, several funds managed by Voyageur Fund Managers, Inc. (the “Voyageur Funds”) were incorporated into the Delaware Investments Family of Funds. Mr. Madison served as a director of the Voyageur Funds from 1993 until 1997. |
| 4 David F. Connor, Daniel V. Geatens, David P. O’Connor, and Richard Salus serve in similar capacities for the six portfolios of the Optimum Fund Trust, which have the same investment advisor and administrator as the Fund. |
38
About the organization
This annual report is for the information of Delaware Investments® Dividend and Income Fund, Inc. shareholders. The figures in this report represent past results that are not a guarantee of future results. The return and principal value of an investment in the Fund will fluctuate so that shares, when sold, may be worth more or less than their original cost.
Notice is hereby given in accordance with Section 23(c) of the Investment Company Act of 1940 that the Fund may, from time to time, purchase shares of its common stock on the open market at market prices. Your Fund’s Board of Directors approved a share repurchase program in 1994 that authorizes the Fund to purchase up to 10% of its outstanding shares on the floor of the New York Stock Exchange.
Board of Directors Patrick P. Coyne
Chairman, President,
and Chief Executive Officer
Delaware Investments Family of Funds
Philadelphia, PA Thomas L. Bennett†
Private Investor
Rosemont, PA John A. Fry†
President
Franklin & Marshall College
Lancaster, PA Anthony D. Knerr
Founder and Managing Director
Anthony Knerr & Associates
New York, NY Lucinda S. Landreth
Former Chief Investment Officer
Assurant Inc.
Philadelphia, PA Ann R. Leven
Consultant
ARL Associates
New York, NY Thomas F. Madison†
President and Chief Executive Officer
MLM Partners Inc.
Minneapolis, MN Janet L. Yeomans
Vice President and Treasurer
3M Corporation
St. Paul, MN J. Richard Zecher
Founder
Investor Analytics
Scottsdale, AZ †Audit committee member | | Affiliated officers David F. Connor
Vice President, Deputy General Counsel,
and Secretary
Delaware Investments Family of Funds
Philadelphia, PA Daniel V. Geatens
Vice President and Treasurer
Delaware Investments Family of Funds
Philadelphia, PA David P. O’Connor
Senior Vice President, General Counsel,
and Chief Legal Officer
Delaware Investments Family of Funds
Philadelphia, PA Richard Salus
Senior Vice President and
Chief Financial Officer
Delaware Investments Family of Funds
Philadelphia, PA The Fund files its complete schedule of portfolio holdings with the Securities and Exchange Commission for the first and third quarters of each fiscal year on Form N-Q. The Fund’s Forms N-Q, as well as a description of the policies and procedures that the Fund uses to determine how to vote proxies (if any) relating to portfolio securities is available without charge (i) upon request, by calling 800 523-1918; (ii) on the Fund’s Web site at http://www.delawareinvestments.com; and (iii) on the Commission’s Web site at http://www.sec.gov. The Fund’s Forms N-Q may be reviewed and copied at the Commission’s Public Reference Room in Washington, DC; information on the operation of the Public Reference Room may be obtained by calling 800 SEC-0330. Information (if any) regarding how the Fund voted proxies relating to portfolio securities during the most recently disclosed 12-month period ended June 30 is available without charge (i) through the Fund’s Web site at http://www.delawareinvestments.com; and (ii) on the Commission’s Web site at http://www.sec.gov. | | Contact information Investment manager
Delaware Management Company a series of Delaware Management Business Trust
Philadelphia, PA Principal office of the Fund
2005 Market Street
Philadelphia, PA 19103-7094 Independent registered public
accounting firm
Ernst & Young LLP
2001 Market Street
Philadelphia, PA 19103 Registrar and stock transfer
agent
BNY Mellon Shareowner Services
480 Washington Blvd.
Jersey City, NJ 07310
800 851-9677 For securities dealers and financial institutions representatives
800 362-7500 Web site
www.delawareinvestments.com Delaware Investments is the marketing name of Delaware Management Holdings, Inc. and its subsidiaries. Your reinvestment options Delaware Investments Dividend and Income Fund, Inc. offers an automatic dividend reinvestment program. If you would like to reinvest dividends, and shares are registered in your name, contact BNY Mellon Shareowner Services at 800 851-9677. You will be asked to put your request in writing. If you have shares registered in “street” name, contact the broker/dealer holding the shares or your financial advisor. |
39
Item 2. Code of Ethics
The registrant has adopted a code of ethics that applies to the registrant’s principal executive officer, principal financial officer, principal accounting officer or controller, or persons performing similar functions, regardless of whether these individuals are employed by the registrant or a third party. A copy of the registrant’s Code of Business Ethics has been posted on the Delaware Investments Internet Web site at www.delawareinvestments.com. Any amendments to the Code of Business Ethics, and information on any waiver from its provisions granted by the registrant, will also be posted on this Web site within five business days of such amendment or waiver and will remain on the Web site for at least 12 months.
Item 3. Audit Committee Financial Expert
The registrant’s Board of Trustees/Directors has determined that each member of the registrant’s Audit Committee is an audit committee financial expert, as defined below. For purposes of this item, an “audit committee financial expert” is a person who has the following attributes:
a. An understanding of generally accepted accounting principles and financial statements;
b. The ability to assess the general application of such principles in connection with the accounting for estimates, accruals, and reserves;
c. Experience preparing, auditing, analyzing, or evaluating financial statements that present a breadth and level of complexity of accounting issues that are generally comparable to the breadth and complexity of issues that can reasonably be expected to be raised by the registrant’s financial statements, or experience actively supervising one or more persons engaged in such activities;
d. An understanding of internal controls and procedures for financial reporting; and
e. An understanding of audit committee functions.
An “audit committee financial expert” shall have acquired such attributes through:
a. Education and experience as a principal financial officer, principal accounting officer, controller, public accountant, or auditor or experience in one or more positions that involve the performance of similar functions;
b. Experience actively supervising a principal financial officer, principal accounting officer, controller, public accountant, auditor, or person performing similar functions;
c. Experience overseeing or assessing the performance of companies or public accountants with respect to the preparation, auditing, or evaluation of financial statements; or
d. Other relevant experience.
The registrant’s Board of Trustees/Directors has also determined that each member of the registrant’s Audit Committee is independent. In order to be “independent” for purposes of this item, the Audit Committee member may not: (i) other than in his or her capacity as a member of the Board of Trustees/Directors or any committee thereof, accept directly or indirectly any consulting, advisory or other compensatory fee from the issuer; or (ii) be an “interested person” of the registrant as defined in Section 2(a)(19) of the Investment Company Act of 1940.
The names of the audit committee financial experts on the registrant’s Audit Committee are set forth below:
Thomas L. Bennett 1
John A. Fry
Thomas F. Madison
J. Richard Zecher
Item 4. Principal Accountant Fees and Services
(a) Audit fees.
The aggregate fees billed for services provided to the registrant by its independent auditors for the audit of the registrant’s annual financial statements and for services normally provided by the independent auditors in connection with statutory and regulatory filings or engagements were $11,638 for the fiscal year ended November 30, 2009.
_______________________
1 The instructions to Form N-CSR require disclosure on the relevant experience of persons who qualify as audit committee financial experts based on “other relevant experience.” The Board of Trustees/Directors has determined that Mr. Bennett qualifies as an audit committee financial expert by virtue of his education, Chartered Financial Analyst designation, and his experience as a credit analyst, portfolio manager and the manager of other credit analysts and portfolio managers.
The aggregate fees billed for services provided to the registrant by its independent auditors for the audit of the registrant’s annual financial statements and for services normally provided by the independent auditors in connection with statutory and regulatory filings or engagements were $13,100 for the fiscal year ended November 30, 2008.
(b) Audit-related fees.
The aggregate fees billed by the registrant’s independent auditors for services relating to the performance of the audit of the registrant’s financial statements and not reported under paragraph (a) of this Item were $0 for the fiscal year ended November 30, 2009.
The aggregate fees billed by the registrant’s independent auditors for services relating to the performance of the audit of the financial statements of the registrant’s investment adviser and other service providers under common control with the adviser and that relate directly to the operations or financial reporting of the registrant were $19,074 for the registrant’s fiscal year ended November 30, 2009. The percentage of these fees relating to services approved by the registrant’s Audit Committee pursuant to the de minimis exception from the pre-approval requirement in Rule 2-01(c)(7)(i)(C) of Regulation S-X was 0%. These audit-related services were as follows: issuance of report concerning transfer agent's system of internal accounting control pursuant to Rule 17Ad-13 of the Securities Exchange Act.
The aggregate fees billed by the registrant’s independent auditors for services relating to the performance of the audit of the registrant’s financial statements and not reported under paragraph (a) of this Item were $0 for the fiscal year ended November 30, 2009.
The aggregate fees billed by the registrant’s independent auditors for services relating to the performance of the audit of the financial statements of the registrant’s investment adviser and other service providers under common control with the adviser and that relate directly to the operations or financial reporting of the registrant were $19,074 for the registrant’s fiscal year ended November 30, 2008. The percentage of these fees relating to services approved by the registrant’s Audit Committee pursuant to the de minimis exception from the pre-approval requirement in Rule 2-01(c)(7)(i)(C) of Regulation S-X was 0%. These audit-related services were as follows: issuance of report concerning transfer agent's system of internal accounting control pursuant to Rule 17Ad-13 of the Securities Exchange Act.
(c) Tax fees.
The aggregate fees billed by the registrant’s independent auditors for tax-related services provided to the registrant were $2,850 for the fiscal year ended November 30, 2009. The percentage of these fees relating to services approved by the registrant’s Audit Committee pursuant to the de minimis exception from the pre-approval requirement in Rule 2-01(c)(7)(i)(C) of Regulation S-X was 0%. These tax-related services were as follows: review of income tax returns and review of annual excise distribution calculations.
The aggregate fees billed by the registrant’s independent auditors for tax-related services provided to the registrant’s investment adviser and other service providers under common control with the adviser and that relate directly to the operations or financial reporting of the registrant were $0 for the registrant’s fiscal year ended November 30, 2009.
The aggregate fees billed by the registrant’s independent auditors for tax-related services provided to the registrant were $3,250 for the fiscal year ended November 30, 2008. The percentage of these fees relating to services approved by the registrant’s Audit Committee pursuant to the de minimis exception from the pre-approval requirement in Rule 2-01(c)(7)(i)(C) of Regulation S-X was 0%. These tax-related services were as follows: review of income tax returns and review of annual excise distribution calculations.
The aggregate fees billed by the registrant’s independent auditors for tax-related services provided to the registrant’s adviser and other service providers under common control with the adviser and that relate directly to the operations or financial reporting of the registrant were $0 for the registrant’s fiscal year ended November 30, 2008.
(d) All other fees.
The aggregate fees billed for all services provided by the independent auditors to the registrant other than those set forth in paragraphs (a), (b) and (c) of this Item were $0 for the fiscal year ended November 30, 2009.
The aggregate fees billed for all services other than those set forth in paragraphs (b) and (c) of this Item provided by the registrant’s independent auditors to the registrant’s adviser and other service providers under common control with the adviser and that relate directly to the operations or financial reporting of the registrant were $0 for the registrant’s fiscal year ended November 30, 2009.
The aggregate fees billed for all services provided by the independent auditors to the registrant other than those set forth in paragraphs (a), (b) and (c) of this Item were $0 for the fiscal year ended November 30, 2008.
The aggregate fees billed for all services other than those set forth in paragraphs (b) and (c) of this Item provided by the registrant’s independent auditors to the registrant’s adviser and other service providers under common control with the adviser and that relate directly to the operations or financial reporting of the registrant were $0 for the registrant’s fiscal year ended November 30, 2008.
(e) The registrant’s Audit Committee has established pre-approval policies and procedures as permitted by Rule 2-01(c)(7)(i)(B) of Regulation S-X (the “Pre-Approval Policy”) with respect to services provided by the registrant’s independent auditors. Pursuant to the Pre-Approval Policy, the Audit Committee has pre-approved the services set forth in the table below with respect to the registrant up to the specified fee limits. Certain fee limits are based on aggregate fees to the registrant and other registrants within the Delaware Investments® Family of Funds.
| Service | Range of Fees |
| Audit Services | |
| Statutory audits or financial audits for new Funds | up to $25,000 per Fund |
| Services associated with SEC registration statements (e.g., Form N-1A, Form N-14, etc.), periodic reports and other documents filed with the SEC or other documents issued in connection with securities offerings (e.g., comfort letters for closed-end Fund offerings, consents), and assistance in responding to SEC comment letters | up to $10,000 per Fund |
| Consultations by Fund management as to the accounting or disclosure treatment of transactions or events and/or the actual or potential impact of final or proposed rules, standards or interpretations by the SEC, FASB, or other regulatory or standard-setting bodies (Note: Under SEC rules, some consultations may be considered “audit-related services” rather than “audit services”) | up to $25,000 in the aggregate |
| Audit-Related Services | |
| Consultations by Fund management as to the accounting or disclosure treatment of transactions or events and /or the actual or potential impact of final or proposed rules, standards or interpretations by the SEC, FASB, or other regulatory or standard-setting bodies (Note: Under SEC rules, some consultations may be considered “audit services” rather than “audit-related services”) | up to $25,000 in the aggregate |
| Tax Services | |
| U.S. federal, state and local and international tax planning and advice (e.g., consulting on statutory, regulatory or administrative developments, evaluation of Funds’ tax compliance function, etc.) | up to $25,000 in the aggregate |
| U.S. federal, state and local tax compliance (e.g., excise distribution reviews, etc.) | up to $5,000 per Fund |
| Review of federal, state, local and international income, franchise and other tax returns | up to $5,000 per Fund |
Under the Pre-Approval Policy, the Audit Committee has also pre-approved the services set forth in the table below with respect to the registrant’s investment adviser and other entities controlling, controlled by or under common control with the investment adviser that provide ongoing services to the registrant (the “Control Affiliates”) up to the specified fee limit. This fee limit is based on aggregate fees to the investment adviser and its Control Affiliates.
| Service | Range of Fees |
| Non-audit Services | |
| Services associated with periodic reports and other documents filed with the SEC and assistance in responding to SEC comment letters | up to $10,000 in the aggregate |
The Pre-Approval Policy requires the registrant’s independent auditors to report to the Audit Committee at each of its regular meetings regarding all services initiated since the last such report was rendered, including those services authorized by the Pre-Approval Policy.
(f) Not applicable.
(g) The aggregate non-audit fees billed by the registrant’s independent auditors for services rendered to the registrant and to its investment adviser and other service providers under common control with the adviser were $202,564 and $257,252 for the registrant’s fiscal years ended November 30, 2009 and November 30, 2008, respectively.
(h) In connection with its selection of the independent auditors, the registrant’s Audit Committee has considered the independent auditors’ provision of non-audit services to the registrant’s investment adviser and other service providers under common control with the adviser that were not required to be pre-approved pursuant to Rule 2-01(c)(7)(ii) of Regulation S-X. The Audit Committee has determined that the independent auditors’ provision of these services is compatible with maintaining the auditors’ independence.
Item 5. Audit Committee of Listed Registrants
The registrant has a separately-designated standing Audit Committee established in accordance with Section 3(a)(58)(A) of the Securities Exchange Act of 1934. The members of the registrant’s Audit Committee are Thomas L. Bennett, John A. Fry, Thomas F. Madison and J. Richard Zecher.
Item 6. Investments
(a) Included as part of report to shareholders filed under Item 1 of this Form N-CSR.
(b) Divestment of securities in accordance with Section 13(c) of the Investment Company Act of 1940.
Not applicable.
Item 7. Disclosure of Proxy Voting Policies and Procedures for Closed-End Management Investment Companies
The registrant has formally delegated to its investment adviser(s) (the “Adviser”) the ability to make all proxy voting decisions in relation to portfolio securities held by the registrant. If and when proxies need to be voted on behalf of the registrant, the Adviser will vote such proxies pursuant to its Proxy Voting Policies and Procedures (the “Procedures”). The Adviser has established a Proxy Voting Committee (the “Committee”) which is responsible for overseeing the Adviser’s proxy voting process for the registrant. One of the main responsibilities of the Committee is to review and approve the Procedures to ensure that the Procedures are designed to allow the Adviser to vote proxies in a manner consistent with the goal of voting in the best interests of the registrant.
In order to facilitate the actual process of voting proxies, the Adviser has contracted with Institutional Shareholder Services (“ISS”), a wholly owned subsidiary of RiskMetrics Group ("RiskMetrics"), to analyze proxy statements on behalf of the registrant and other Adviser clients and vote proxies generally in accordance with the Procedures. The Committee is responsible for overseeing ISS/RiskMetrics’s proxy voting activities. If a proxy has been voted for the registrant, ISS/RiskMetrics will create a record of the vote. By no later than August 31 of each year, information (if any) regarding how the registrant voted proxies relating to portfolio securities during the most recently disclosed 12-month period ended June 30 is available without charge (i) through the registrant’s Web site at http://www.delawareinvestments.com; and (ii) on the Commission’s Web site at http://www.sec.gov.
The Procedures contain a general guideline that recommendations of company management on an issue (particularly routine issues) should be given a fair amount of weight in determining how proxy issues should be voted. However, the Adviser will normally vote against management’s position when it runs counter to its specific Proxy Voting Guidelines (the “Guidelines”), and the Adviser will also vote against management’s recommendation when it believes that such position is not in the best interests of the registrant.
As stated above, the Procedures also list specific Guidelines on how to vote proxies on behalf of the registrant. Some examples of the Guidelines are as follows: (i) generally vote for shareholder proposals asking that a majority or more of directors be independent; (ii) generally vote against proposals to require a supermajority shareholder vote; (iii) votes on mergers and acquisitions should be considered on a case-by-case basis, determining whether the transaction enhances shareholder value; (iv) generally vote against proposals to create a new class of common stock with superior voting rights; (v) generally vote re-incorporation proposals on a case-by-case basis; (vi) votes with respect to equity-based compensation plans are generally determined on a case-by-case basis; and (vii) generally vote for proposals requesting reports on the level of greenhouse gas emissions from a company’s operations and products.
Because the registrant has delegated proxy voting to the Adviser, the registrant is not expected to encounter any conflict of interest issues regarding proxy voting and therefore does not have procedures regarding this matter. However, the Adviser does have a section in its Procedures that addresses the possibility of conflicts of interest. Most proxies which the Adviser receives on behalf of the registrant are voted by ISS/RiskMetrics in accordance with the Procedures. Because almost all registrant proxies are voted by ISS/RiskMetrics pursuant to the pre-determined Procedures, it normally will not be necessary for the Adviser to make an actual determination of how to vote a particular proxy, thereby largely eliminating conflicts of interest for the Adviser during the proxy voting process. In the very limited instances where the Adviser is considering voting a proxy contrary to ISS/RiskMetrics’s recommendation, the Committee will first assess the issue to see if there is any possible conflict of interest involving the Adviser or affiliated persons of the Adviser. If a member of the Committee has actual knowledge of a conflict of interest, the Committee will normally use another independent third party to do additional research on the particular proxy issue in order to make a recommendation to the Committee on how to vote the proxy in the best interests of the registrant. The Committee will then review the proxy voting materials and recommendation provided by ISS/RiskMetrics and the independent third party to determine how to vote the issue in a manner which the Committee believes is consistent with the Procedures and in the best interests of the registrant.
Item 8. Portfolio Managers of Closed-End Management Investment Companies
The following chart lists certain information about types of other accounts for which the portfolio managers are primarily responsible as of November 30, 2009. Any accounts managed in a personal capacity appear under “Other Accounts” along with other accounts managed on a professional basis. The personal account information is current as of the most recent calendar quarter-end for which account statements are available.
| | | | Total Assets |
| | | | in Accounts with |
| | | No. of Accounts with | Performance- |
| No. of | Total Assets | Performance-Based | Based |
| Accounts | in Accounts Fee | Fees | Fee |
| Damon J. Andres | | | | |
| Registered | 11 | $596.0 million | 0 | $0 |
| Investment | | | | |
| Companies | | | | |
| Other pooled | 0 | $0 | 0 | $0 |
| Investment Vehicles | | | | |
| Other Accounts | 4 | $72.1 million | 0 | $0 |
| Kristen E. Bartholdson | | | | |
| Registered | 13 | $1.9 billion | 0 | $0 |
| Investment | | | | |
| Companies | | | | |
| Other pooled | 0 | $0 | 0 | $0 |
| Investment Vehicles | | | | |
| Other Accounts | 21 | $2.5 billion | 2 | $590.0 million |
| Thomas H. Chow | | | | |
| Registered | 12 | $10.9 billion | 0 | $0 |
| Investment | | | | |
| Companies | | | | |
| Other pooled | 0 | $0 | 0 | $0 |
| Investment Vehicles | | | | |
| Other Accounts | 13 | $1.3 billion | 0 | $0 |
| Roger A. Early | | | | |
| Registered | 20 | $13.1 billion | 0 | $0 |
| Investment | | | | |
| Companies | | | | |
| Other pooled | 0 | $0 | 0 | $0 |
| Investment Vehicles | | | | |
| Other Accounts | 37 | $4.6 billion | 0 | $0 |
| Nikhil G. Lalvani | | | | |
| Registered | 13 | $1.9 billion | 0 | $0 |
| Investment | | | | |
| Companies | | | | |
| Other pooled | 0 | $0 | 0 | $0 |
| Investment Vehicles | | | | |
| Other Accounts | 23 | $2.5 billion | 2 | $590.0 million |
| Anthony A. Lombardi | | | | |
| Registered | 13 | $1.9 billion | 0 | $0 |
| Investment | | | | |
| Companies | | | | |
| Other pooled | 0 | $0 | 0 | $0 |
| Investment Vehicles | | | | |
| Other Accounts | 26 | $2.5 billion | 2 | $590.0 million |
| Kevin P. Loome | | | | |
| Registered | 18 | $10.1 billion | 0 | $0 |
| Investment | | | | |
| Companies | | | | |
| Other pooled | 0 | $0 | 0 | $0 |
| Investment Vehicles | | | | |
| Other Accounts | 11 | $1.4 billion | 0 | $0 |
| D. Tysen Nutt, Jr. | | | | |
| Registered | 13 | $1.9 billion | 0 | $0 |
| Investment | | | | |
| Companies | | | | |
| Other pooled | 0 | $0 | 0 | $0 |
| Investment Vehicles | | | | |
| Other Accounts | 28 | $2.5 billion | 2 | $590.0 million |
| Robert A. Vogel, Jr. | | | | |
| Registered | 13 | $1.9 billion | 0 | $0 |
| Investment | | | | |
| Companies | | | | |
| Other pooled | 0 | $0 | 0 | $0 |
| Investment Vehicles | | | | |
| Other Accounts | 29 | $2.5 billion | 2 | $590.0 million |
| Nashira Wynn | | | | |
| Registered | 13 | $1.9 billion | 0 | $0 |
| Investment | | | | |
| Companies | | | | |
| Other pooled | 0 | $0 | 0 | $0 |
| Investment Vehicles | | | | |
| Other Accounts | 24 | $2.5 billion | 2 | $590.0 million |
| Babak Zenouzi | | | | |
| Registered | 11 | $596.0 million | 0 | $0 |
| Investment | | | | |
| Companies | | | | |
| Other pooled | 0 | $0 | 0 | $0 |
| Investment Vehicles | | | | |
| Other Accounts | 3 | $72.0 million | 0 | $0 |
DESCRIPTION OF MATERIAL CONFLICTS OF INTEREST
Individual portfolio managers may perform investment management services for other funds or accounts similar to those provided to the Funds and the investment action for such other fund or account and the Funds may differ. For example, an account or fund may be selling a security, while another account or Fund may be purchasing or holding the same security. As a result, transactions executed for one fund or account may adversely affect the value of securities held by another fund, account or Fund. Additionally, the management of multiple other funds or accounts and the Funds may give rise to potential conflicts of interest, as a portfolio manager must allocate time and effort to multiple funds or accounts and the Funds. A portfolio manager may discover an investment opportunity that may be suitable for more than one account or fund. The investment opportunity may be limited, however, so that all funds or accounts for which the investment would be suitable may not be able to participate. The Manager has adopted procedures designed to allocate investments fairly across multiple funds or accounts.
Two of the accounts managed by the portfolio managers has a performance-based fee. This compensation structure presents a potential conflict of interest. The portfolio manager has an incentive to manage this account so as to enhance its performance, to the possible detriment of other accounts for which the investment manager does not receive a performance-based fee.
A portfolio manager’s management of personal accounts also may present certain conflicts of interest. While Delaware’s code of ethics is designed to address these potential conflicts, there is no guarantee that it will do so.
Compensation Structure
Each portfolio’s manager’s compensation consists of the following:
Base Salary - Each named portfolio manager receives a fixed base salary. Salaries are determined by a comparison to industry data prepared by third parties to ensure that portfolio manager salaries are in line with salaries paid at peer investment advisory firms.
Bonus - (Mr. Nutt, Ms. Bartholdson, Mr. Lalvani, Mr. Lombardi, Mr. Vogel and Ms. Wynn only) Each named portfolio manager is eligible to receive an annual cash bonus. The bonus pool is determined by the revenues associated with the products a portfolio manager manages. Delaware keeps a percentage of the revenues and the remaining percentage of revenues (minus appropriate expenses associated with relevant product and the investment management team) create the "bonus pool" for the product. Various members of the team have the ability to earn a percentage of the bonus pool with the most senior contributor having the largest share. The pool is allotted based on subjective factors and objective factors. The primary objective factor is the performance of the funds managed relative to the performance of the appropriate Lipper peer groups and the performance of institutional composites relative to the appropriate indices. Performance is measured as the result of one's standing in the Lipper peer groups on a one-year, three-year and five-year basis. Three-year and five-year performance is weighted more heavily and there is no objective award for a fund whose performance falls below the 50th percentile for a given time period.
Individual allocations of the bonus pool are based on individual performance measurements, both objective and subjective, as determined by senior management.
(Mr. Andres and Mr. Zenouzi only) Each named portfolio manager is eligible to receive an annual cash bonus. The bonus pool is determined by the revenues associated with the products a portfolio manager manages. Delaware keeps a percentage of the revenues and the remaining percentage of revenues (minus appropriate expenses associated with relevant product and the investment management team) create the "bonus pool" for the product. Various members of the team have the ability to earn a percentage of the bonus pool with the most senior contributor having the largest share. The pool is allotted based on subjective factors (50%) and objective factors (50%). The primary objective factor is the performance of the funds managed relative to the performance of the appropriate Lipper peer groups and the performance of institutional composites relative to the appropriate indices. Performance is measured as the result of one’s standing in the Lipper peer groups on a one-year, three-year and five-year basis. Three-year and five-year performance is weighed more heavily and there is no objective award for a fund whose performance falls below the 50th percentile for a given time period.
Individual allocations of the bonus pool are based on individual performance measurements, both objective and subjective, as determined by senior management.
(Mr. Chow, Mr. Early and Mr. Loome only) Due to transitioning of responsibilities of our fixed income managers over the past year, some of the managers’ bonuses may have been guaranteed for the past year. It is anticipated that going forward an objective component will be added to the bonus for each manager that is reflective of account performance relative to an appropriate peer group or database. The following paragraph describes the structure of the non-guaranteed bonus.
Each portfolio manager is eligible to receive an annual cash bonus, which is based on quantitative and qualitative factors. There is one pool for bonus payments for the fixed income department. The amount of the pool for bonus payments is determined by assets managed (including investment companies, insurance product-related accounts and other separate accounts), management fees and related expenses (including fund waiver expenses) for registered investment companies, pooled vehicles, and managed separate accounts. Generally, 60%-75% of the bonus is quantitatively determined. For more senior portfolio managers, a higher percentage of the bonus is quantitatively determined. For investment companies, each manager is compensated according the Fund’s Lipper or Morningstar peer group percentile ranking on a one-year, three-year, and five-year basis, with longer-term performance more heavily weighted. For managed separate accounts the portfolio managers are compensated according to the composite percentile ranking against the Frank Russell and Callan Associates databases (or similar sources of relative performance data) on a one-year, three-year, and five-year basis, with longer term performance more heavily weighted. There is no objective award for a fund that falls below the 50th percentile, but incentives reach maximum potential at the 25th-30th percentile. There is a sliding scale for investment companies that are ranked above the 50th percentile. The remaining 25%-40% portion of the bonus is discretionary as determined by Delaware Investments and takes into account subjective factors.
For new and recently transitioned portfolio managers, the compensation may be weighted more heavily towards a portfolio manager’s actual contribution and ability to influence performance, rather than longer-term performance. Management intends to move the compensation structure towards longer-term performance for these portfolio managers over time.
Deferred Compensation – Each named portfolio manager is eligible to participate in the Lincoln National Corporation Executive Deferred Compensation & Supplemental/Excess Retirement Plan, which is available to all employees whose base salaries or established compensation exceed a designated threshold. The Plan is a non-qualified unfunded deferred compensation plan that permits participating employees to defer the receipt of a portion of their cash compensation.
Stock Option Incentive Plan/Equity Compensation Plan - Portfolio managers may be awarded options, stock appreciation rights, restricted stock awards and restricted stock units (collectively, “Awards”) relating to the underlying shares of common stock of Delaware Investments U.S., Inc. pursuant to the terms of the Amended and Restated Delaware Investments U.S., Inc. Incentive Compensation Plan.
The Amended and Restated Delaware Investments U.S., Inc. Incentive Compensation Plan was established in 2001 in order to: attract, retain and reward key employees of the company; enable such employees to acquire or increase an equity interest in the company in order to align the interest of such employees and the company; and provide such employees with incentives to expend their maximum efforts. Subject to the terms of the plan and applicable award agreements, Awards typically vest in 25% increments on a four-year schedule, and shares of common stock underlying the Awards are issued after vesting. Awards are granted under the plan from time to time by the company. Awards may be based in part on seniority. The fair market value of the shares of Delaware Investments U.S., Inc., is normally determined as of each March 31, June 30, September 30 and December 31. The fair market value of shares of common stock underlying Awards granted on or after December 26, 2008 is determined by an independent appraiser utilizing an appraisal valuation methodology in compliance with Section 409A of the Internal Revenue Code of 1986, as amended and the regulations promulgated thereunder. The fair market value of shares of common stock underlying Awards granted prior to December 26, 2008 is determined by an independent appraiser utilizing a formula based valuation methodology. Shares issued typically must be held for six months and one day, after which time the stockholder may put them back to the company and the shares may be called back from the stockholder by the company from time to time, as the case may be.
Other Compensation - Portfolio managers may also participate in benefit plans and programs available generally to all employees.
Ownership of Securities
As of November 30, 2009, the portfolio managers did not own any shares of the Fund.
Item 9. Purchases of Equity Securities by Closed-End Management Investment Companies and Affiliated Purchasers
Not applicable.
Item 10. Submission of Matters to a Vote of Security Holders
Not applicable.
Item 11. Controls and Procedures
The registrant’s principal executive officer and principal financial officer have evaluated the registrant’s disclosure controls and procedures within 90 days of the filing of this report and have concluded that they are effective in providing reasonable assurance that the information required to be disclosed by the registrant in its reports or statements filed under the Securities Exchange Act of 1934 is recorded, processed, summarized and reported within the time periods specified in the rules and forms of the Securities and Exchange Commission.
There were no significant changes in the registrant’s internal control over financial reporting that occurred during the second fiscal quarter of the period covered by the report to stockholders included herein (i.e., the registrant’s fourth fiscal quarter) that have materially affected, or are reasonably likely to materially affect, the registrant’s internal control over financial reporting.
Item 12. Exhibits
| (a) | (1) | Code of Ethics |
| | | |
| | Not applicable. |
| | | |
| (2) | Certifications of Principal Executive Officer and Principal Financial Officer pursuant to Rule 30a-2 under the Investment Company Act of 1940 are attached hereto as Exhibit 99.CERT. |
| | | |
| (3) | Written solicitations to purchase securities pursuant to Rule 23c-1 under the Securities Exchange Act of 1934. |
| | | |
| | Not applicable. |
| | | |
| (b) | Certifications pursuant to Section 906 of the Sarbanes-Oxley Act of 2002 are furnished herewith as Exhibit 99.906CERT. |
SIGNATURES
Pursuant to the requirements of the Securities Exchange Act of 1934 and the Investment Company Act of 1940, the registrant has duly caused this report to be signed on its behalf, by the undersigned, thereunto duly authorized.
Name of Registrant: Delaware Investments® Dividend and Income Fund, Inc.
| PATRICK P. COYNE |
| By: Patrick P. Coyne |
| Title: Chief Executive Officer |
| Date: February 3, 2010 |
Pursuant to the requirements of the Securities Exchange Act of 1934 and the Investment Company Act of 1940, this report has been signed below by the following persons on behalf of the registrant and in the capacities and on the dates indicated.
| PATRICK P. COYNE |
| By: Patrick P. Coyne |
| Title: Chief Executive Officer |
| Date: February 3, 2010 |
| RICHARD SALUS |
| By: Richard Salus |
| Title: Chief Financial Officer |
| Date: February 3, 2010 |