Item 1. Reports to Stockholders
Annual report
Closed-end fund
Delaware Investments® Dividend and Income Fund, Inc.
November 30, 2019
|
Beginning on or about June 1, 2021, as permitted by regulations adopted by the Securities and Exchange Commission, paper copies of your Fund’s shareholder reports will no longer be sent to you by mail, unless you specifically request them from the Fund or from your financial intermediary, such as a broker/dealer, bank, or insurance company. Instead, you will be notified by mail each time a report is posted on the website and provided with a link to access the report. If you already elected to receive shareholder reports electronically, you will not be affected by this change and you do not need to take any action. You may elect to receive shareholder reports and other communications from the Fund electronically by logging into your Investor Center account at computershare.com/investor and going to “Communication Preferences” or by calling Computershare and speaking to a representative. You may elect to receive paper copies of all future shareholder reports free of charge. You can inform the Fund that you wish to continue receiving paper copies of your shareholder reports by contacting us at 866437-0252. If you own these shares through a financial intermediary, you may contact your financial intermediary to elect to continue to receive paper copies of your shareholder reports. Your election to receive reports in paper will apply to all funds held with the Delaware Funds®by Macquarie or your financial intermediary. |
The figures in the annual report for Delaware Investments Dividend and Income Fund, Inc. represent past results, which are not a guarantee of future results. A rise or fall in interest rates can have a significant impact on bond prices. Funds that invest in bonds can lose their value as interest rates rise.
Table of contents
Delaware Investments® Dividend and Income Fund, Inc. (“DDF” or the “Fund”), acting pursuant to a Securities and Exchange Commission (“SEC”) exemptive order and with the approval of the Fund’s Board of Trustees (the “Board”), has adopted a managed distribution policy (the “Plan”). Effective as of March 29, 2018, the Fund makes monthly distributions to common shareholders at a targeted annual distribution rate of 10% of the Fund’s average net asset value (“NAV”) per share. The Fund will calculate the average NAV per share from the previous three full months immediately prior to the distribution based on the number of business days in those three months on which the NAV is calculated. The distribution will be calculated as 10% of the prior three months’ average NAV per share, divided by 12. This distribution methodology is intended to provide shareholders with a consistent, but not guaranteed, income stream and a targeted annual distribution rate and is intended to narrow any discount between the market price and the NAV of the Fund’s common shares, but there is no assurance that the policy will be successful in doing so.
Under the Plan, the Fund is managed with a goal of generating as much of the distribution as possible from net investment income and short-term capital gains. The balance of the distribution will then come from long-term capital gains to the extent permitted, and if necessary, a return of capital. The Fund will generally distribute amounts necessary to satisfy the terms of the Fund’s Plan and the requirements prescribed by excise tax rules and Subchapter M of the Internal Revenue Code (the “Code”). Each monthly distribution to shareholders is expected to be at the fixed percentage described above, except for extraordinary distributions and potential distribution rate increases or decreases to enable the Fund to comply with the distribution requirements imposed by the Code.
The Board may amend, suspend, or terminate the Fund’s Plan at any time without prior notice if it deems such action to be in the best interest of the Fund or its shareholders. The methodology for determining monthly distributions under the Plan will be reviewed at least annually by the Fund’s Board, and the Fund will continue to evaluate its distribution in light of ongoing market conditions. The suspension or termination of the Plan could have the effect of creating a trading discount (if the Fund’s stock is trading at or above NAV) or widening an existing trading discount. The Fund is subject to risks that could have an adverse impact on its ability to maintain distributions under the Plan. Examples of potential risks include, but are not limited to, economic downturns impacting the markets, increased market volatility, portfolio companies suspending or decreasing corporate dividend distributions, and changes in the Code.
Shareholders should not draw any conclusions about the Fund’s investment performance from the amounts of these distributions or from the terms of the Plan. The Fund’s total investment return on NAV is presented in its financial highlights table.
A cumulative summary of the Section 19(a) notices for the Fund’s current fiscal period, if applicable, is included in Other Fund Information. Section 19(a) notices for the Fund, as applicable, are available on the Fund’s website atdelawarefunds.com/closed-end/performance/fund-distributions.
Macquarie Asset Management (MAM) offers a diverse range of products including securities investment management, infrastructure and real asset management, and fund and equity-based structured products. Macquarie Investment Management (MIM) is the marketing name for certain companies comprising the asset management division of Macquarie Group. These include the following investment advisors: Macquarie Investment Management Business Trust (MIMBT), Macquarie Funds Management Hong Kong Limited, Macquarie Investment Management Austria Kapitalanlage AG, Macquarie Investment Management Global Limited, Macquarie Investment Management Europe Limited, Macquarie Capital Investment Management LLC, and Macquarie Investment Management Europe S.A. For more information, including press releases, please visitdelawarefunds.com/closed-end.
Unless otherwise noted, views expressed herein are current as of Nov. 30, 2019, and subject to change for events occurring after such date.
The Fund is not FDIC insured and is not guaranteed. It is possible to lose the principal amount invested.
Advisory services provided by Delaware Management Company, a series of MIMBT, a US registered investment advisor. Other than Macquarie Bank Limited (MBL), none of the entities noted are authorized deposit-taking institutions for the purposes of the Banking Act 1959 (Commonwealth of Australia). The obligations of these entities do not represent deposits or other liabilities of MBL. MBL does not guarantee or otherwise provide assurance in respect of the obligations of these entities, unless noted otherwise. The Fund is governed by US laws and regulations.
All third-party marks cited are the property of their respective owners.
© 2020 Macquarie Management Holdings, Inc.
Portfolio management review (Unaudited)
Delaware Investments®Dividend and Income Fund, Inc.
December 10, 2019
Performance preview (for the year ended November 30, 2019)
| | | | | | | | |
| | | |
Delaware Investments Dividend and Income Fund, Inc. @ market price | | | 1-year return | | | | +23.07 | % |
| | |
Delaware Investments Dividend and Income Fund, Inc. @ NAV | | | 1-year return | | | | +7.51 | % |
| | |
LipperClosed-end Income and Preferred Stock Funds Average @ market price | | | 1-year return | | | | +21.98 | % |
| | |
LipperClosed-end Income and Preferred Stock Funds Average @ NAV | | | 1-year return | | | | +12.79 | % |
Past performance does not guarantee future results.
For complete, annualized performance for Delaware Investments Dividend and Income Fund, Inc., please see the table on page 3.
Index performance returns do not reflect any management fees, transaction costs, or expenses. Indices are unmanaged and one cannot invest directly in an index.
For the fiscal year ended Nov. 30, 2019, Delaware Investments Dividend and Income Fund, Inc. returned +7.51% at net asset value (NAV) and +23.07% at market price (both figures reflect all distributions reinvested). Complete annualized performance for the Fund is shown in the table on page 3.
A shifting monetary backdrop
The Fund’s fiscal year ended Nov. 30, 2019, began with a sharp downturn, with most financial assets experiencing steep valuation drops. These asset-price declines primarily reflected investors’ worries about rising interest rates amid mounting global economic uncertainty.
By the first quarter of 2019, however, conditions for most asset classes had turned significantly positive and generally remained that way for the rest of the fiscal year. Global financial markets marched ahead, as central banks globally signaled their intent to provide monetary support for their respective economies.
These central banks included the US Federal Reserve, which gradually shifted from a policy of raising interest rates to one of cutting them. The shift took place against a backdrop of consistent US economic growth with few signs of inflation. In December 2018, the Fed raised its benchmark short-term interest rate by 0.25 percentage points – it was the central bank’s seventh such rate increase in the previous two years. The Fed then kept the federal funds rate steady until late July, when it initiated its first of three successive0.25-percentage-point rate cuts. By fiscal year end, the federal funds rate was within a range of 1.50% to 1.75%, where it had been inmid-2018.
The Fed’s monetary policy shift came amid the US economy’s weakest quarterly performance of the fiscal year. US gross domestic product (GDP), a measure of national economic output, grew by an annualized rate of just 1.1% in the final three months of 2018. By the first quarter of 2019, however, US annual GDP growth accelerated to 3.1%. The national economy subsequently expanded by 2.0% and an estimated 2.1% in the year’s second and third quarters, respectively. Meanwhile, the US unemployment rate declined further, reaching 3.5% in November 2019 – the lowest
since 1969. (Sources: US Bureau of Economic Analysis and US Bureau of Labor Statistics.)
Favorable market conditions
The shift in Fed interest rate policy was the main driver behind the favorable results seen across all of the Fund’s asset classes, as financial markets benefited strongly from the increase in global liquidity.
For the fiscal year ended Nov. 30, 2019, USlarge-cap value stocks, as measured by the Russell 1000® Value Index, gained 11.33%, as the equity market recovered from a December 2018 market correction to produce steady gains throughout the rest of the12-month period.
High yield corporate bonds gained 9.68%, as reflected in the performance of the Bloomberg Barclays US Corporate High-Yield Index. During the fiscal year, high yield bonds benefited from narrowing credit spreads, indicating that investors were willing to accept gradually less income in exchange for taking on credit risk.
Meanwhile, convertible securities, as measured by the ICE BofA US Convertible Index, gained 14.53%, while US real estate securities, as indicated by the FTSE Nareit Equity REITs Index, gained 16.33%.
Individual contributors and detractors
Within the USlarge-cap value equity subportfolio, we saw subpar results from several energy stocks, especiallyHalliburton Co.,an energy-services provider, andMarathon Oil Corp.andOccidental Petroleum Corp.,both exploration and production (E&P) companies.
Halliburton continued to face difficult business conditions, as the company has had to adjust to declining North American investment activity and its increasingly returns-focused business model. Marathon Oil struggled due to its sensitivity to changes in the price of oil, which often leads to exaggerated moves in the company’s stock price. Finally, shares of Occidental Petroleum came under pressure following its decision to acquire Anadarko Petroleum at what investors viewed was too high a price. Investors also appeared to dislike the terms of the deal’s financing.
Portfolio management review (Unaudited)
Delaware Investments® Dividend and Income Fund, Inc.
In contrast, several defense-related companies within the industrials sector contributed to the Fund’s relative performance, especiallyNorthrop Grumman Corp.andRaytheon Co.We believe defense-company stocks generally fared well due to rising geopolitical tensions and potentially weaker fundamentals weighing on stocks in many other areas of the industrials sector.
Sticking to our strategy
We regularly invest across multiple asset classes, searching for securities that offer a competitive yield and the opportunity for dividend growth. We also prioritize managing downside risk while seeking to limit potential capital losses.
Throughout the fiscal year, consistent with our income-oriented focus, we maintained a relatively consistent asset mix. The Fund’s largest allocation remained inlarge-cap value equities, which expanded incrementally from 59% of the portfolio in December 2018 to 60% at fiscal year end. USlarge-cap stocks remained the largest allocation in the Fund’s portfolio, reflecting our view that the asset class offered investors a favorable combination of yield and upside potential following the market’s sharp correction in late 2018.
The Fund’s largest asset shift reflected an increase in exposure to convertible securities, which moved from 1% of the portfolio at the start of the12-month period to about 4% at fiscal year end. This corresponded to a three-percentage-point decrease in the Fund’s exposure to high yield bonds, which moved from 31% to 28% of the Fund. Meanwhile, the Fund’s weighting in real estate investment trusts (REITs) declined minimally, from about 9% to about 8%.
During the fiscal year, the Fund used foreign currency exchange contracts to facilitate the purchase and sale of securities, and written option contracts to manage the Fund’s exposure to changes in securities prices caused by interest rates or market conditions. These derivative securities did not have a material effect on performance during the fiscal year.
A final note: The Fund’s use of leverage – a portfolio management tool designed to obtain a potentially higher return on the Fund’s investments – added to performance in light of the stock market’s increase. Leverage magnifies the effect of gains and losses. As a result, leverage added to the Fund’s results in what was a positive market environment.
Monitoring market conditions
We continue to believe that income-generating securities, such aslarge-cap value equities, REITs, convertibles, and high yield bonds, have the potential to perform well as markets remain uneven and volatile.
We will continue to closely monitor market conditions as we seek to provide a favorable total return to investors while managing downside risk and seeking potential upside via income-generating securities across multiple asset classes and regions. We also may seek to take advantage of market shifts to increase or decrease exposure to certain asset classes as relative value opportunities emerge.
Unless otherwise noted, views expressed herein are current as of Nov. 30, 2019, and subject to change.
2
Performance summary (Unaudited)
Delaware Investments® Dividend and Income Fund, Inc.
The performance quoted represents past performance and does not guarantee future results. Investment return and principal value of an investment will fluctuate so that shares, when redeemed, may be worth more or less than their original cost. Current performance may be lower or higher than the performance quoted. Please obtain the most recent performance data by calling 866437-0252 or visiting our website atdelawarefunds.com/closed-end.
Fund performance
| | | | | | | | |
Average annual total returns through November 30, 2019 | | 1 year | | 5 years | | 10 years | | Lifetime |
At market price (inception date March 26, 1993) | | +23.07% | | +15.15% | | +16.50% | | +9.78% |
At net asset value (inception date March 26, 1993) | | +7.51% | | +7.34% | | +12.91% | | +9.03% |
Diversification may not protect against market risk.
Fixed income securities and bond funds can lose value, and investors can lose principal, as interest rates rise. They also may be affected by economic conditions that hinder an issuer’s ability to make interest and principal payments on its debt.
The Fund may also be subject to prepayment risk, the risk that the principal of a bond that is held by a portfolio will be prepaid prior to maturity, at the time when interest rates are lower than what the bond was paying. A portfolio may then have to reinvest that money at a lower interest rate.
High yielding,non-investment-grade bonds (junk bonds) involve higher risk than investment grade bonds.
Narrowly focused investments may exhibit higher volatility than investments in multiple industry sectors.
REIT investments are subject to many of the risks associated with direct real estate ownership, including changes in economic conditions, credit risk, and interest rate fluctuations.
The Fund may invest in derivatives, which may involve additional expenses and are subject to risk, including the risk that an underlying security or securities index moves in the opposite direction from what the portfolio manager anticipated. A derivatives transaction depends upon the counterparties’ ability to fulfill their contractual obligations.
The Fund may experience portfolio turnover in excess of 100%, which could result in higher transaction costs and tax liability.
If and when the Fund invests in forward foreign currency contracts or uses other investments to hedge against currency risks, the Fund will be subject to special risks, including counterparty risk.
The Fund borrows through a line of credit for purposes of leveraging. Leveraging may result in higher degrees of volatility because the Fund’s net asset value could be subject to fluctuations in short-term interest rates and changes in market value of portfolio securities attributable to leverage. Leverage magnifies the potential for gain and the risk of loss. As a result, a relatively small decline in the value of the underlying investments could result in a relatively large loss. In addition, the leverage through the line of credit is dependent on the credit provider’s ability to fulfill its contractual obligations.
Closed-end fund shares do not represent a deposit or obligation of, and are not guaranteed or endorsed by, any bank or other insured depository institution, and are not federally insured by the Federal Deposit Insurance Corporation or any other government agency.Closed-end funds, unlikeopen-end funds, are not continuously offered. After being issued during aone-time-only public offering, shares ofclosed-end funds are sold in the open market through a securities exchange. Net asset value (NAV) is calculated by subtracting total liabilities by total assets, then dividing by the number of shares outstanding. At the time of sale, your shares may have a market price that is above or below NAV, and may be worth more or less than your original investment.
The Fund may make distributions of ordinary income and capital gains at calendar year end. Those distributions may temporarily cause extraordinarily high yields. There is no assurance that a Fund will repeat that yield in the future. Subsequent monthly distributions that do not include ordinary income or capital gains in the form of dividends will likely be lower.
The “Fund performance” table and the “Performance of a $10,000 investment” graph do not reflect the deduction of taxes the shareholder would pay on Fund distributions or redemptions of Fund shares.
Returns reflect the reinvestment of all distributions. Dividends and distributions, if any, are assumed, for the purpose of this calculation to be reinvested at prices obtained under the Fund’s dividend reinvestment policy. Shares of the Fund were initially offered with a sales charge of 6%. Performance since inception does not include the sales charge or any other brokerage commission for purchases made since inception.
Past performance is not a guarantee of future results.
Performance summary (Unaudited)
Delaware Investments® Dividend and Income Fund, Inc.
Fund basics
As of November 30, 2019
| | |
| Fund objectives | | Fund start date |
| The Fund’s primary investment objective is to seek high current income; capital appreciation is a secondary objective. | | March 26, 1993 |
| | |
| Total Fund net assets | | NYSE symbol |
| $84 million | | DDF |
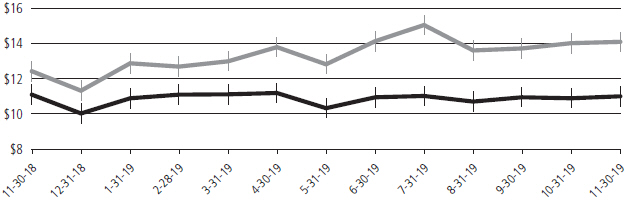
Market price versus net asset value(see notes below and on next page)
November 30, 2018 through November 30, 2019
| | | | | | |
Starting value (Nov. 30, 2018) | | Ending value (Nov. 30, 2019) |
| | | |

| | Delaware Investments Dividend and Income Fund, Inc. @ market price | | $12.42 | | $14.09 |
| | | |

| | Delaware Investments Dividend and Income Fund, Inc. @ NAV | | $11.09 | | $10.99 |
Past performance is not a guarantee of future results.
4
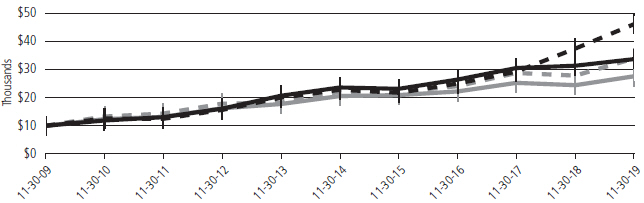
Performance of a $10,000 investment
Average annual total returns from November 30, 2009 through November 30, 2019
| | | | | | | | |
| Starting value (Nov. 30, 2009) Ending value (Nov. 30, 2019) |
| | | |

| | Delaware Investments®Dividend and Income Fund, Inc. @ market price | | $ | 10,000 | | | $46,054 |
| | | |

| | LipperClosed-end Income and Preferred Stock Funds Average @ market price | | $ | 10,000 | | | $33,931 |
| | | |

| | Delaware Investments Dividend and Income Fund, Inc. @ NAV | | $ | 10,000 | | | $33,676 |
| | | |

| | LipperClosed-end Income and Preferred Stock Funds Average @ NAV | | $ | 10,000 | | | $27,580 |
The “Performance of a $10,000 investment” graph assumes $10,000 invested in the Fund on Nov. 30, 2009, and includes the reinvestment of all distributions at market value. The graph assumes $10,000 in the LipperClosed-end Income and Preferred Stock Funds Average at market price and at NAV. Performance of the Fund and the Lipper class at market value is based on market performance during the period. Performance of the Fund and Lipper class at NAV is based on the fluctuations in NAV during the period. Delaware Investments Dividend and Income Fund, Inc. was initially offered with a sales charge of 6%. For market price, performance shown in both graphs above does not include fees, the initial sales charge, or any brokerage commissions on purchases. For NAV, performance shown in both graphs above includes fees, but does not include the initial sales charge or any brokerage commissions for purchases. Investments in the Fund are not available at NAV.
The LipperClosed-end Income and Preferred Stock Funds Average represents the average return ofclosed-end funds that normally seek a high level of current income through investing in income-producing stocks, bonds, and money market instruments, or funds that invest primarily in preferred securities, often considering tax code implications (source: Lipper).
The Russell 1000 Value Index, mentioned on page 1, measures the performance of thelarge-cap value segment of the US equity universe. It includes those Russell 1000 companies with lowerprice-to-book ratios and lower forecasted growth values.
The Bloomberg Barclays US Corporate High-Yield Index, mentioned on page 1, is composed of US dollar-denominated, noninvestment-grade corporate bonds for which the middle rating among Moody’s Investors Service, Inc., Fitch, Inc., and Standard & Poor’s is Ba1/BB+/BB+ or below.
The ICE BofA US Convertible Index, mentioned on page 1, tracks the performance of publicly issued US dollar-denominated convertible securities of US companies. Qualifying securities must have at least $50 million face amount outstanding and at least one month remaining to the final conversion date.
The FTSE Nareit Equity REITs Index, mentioned on page 1, contains alltax-qualified real estate investment trusts (REITs) traded on US exchanges excluding timber and infrastructure REITs, with more than 50% of total assets in qualifying real estate assets other than mortgages secured by real property that also meet minimum size and liquidity criteria.
Frank Russell Company is the source and owner of the trademarks, service marks and copyrights related to the Russell Indexes. Russell® is a trademark of Frank Russell Company.
Performance summary (Unaudited)
Delaware Investments® Dividend and Income Fund, Inc.
Gross domestic product is a measure of all goods and services produced by a nation in a year.
Market price is the price an investor would pay for shares of the Fund on the secondary market.
NAV is the total value of one fund share, generally equal to a fund’s net assets divided by the number of shares outstanding.
Past performance is not a guarantee of future results.
6
Security type / sector allocations and
top 10 equity holdings
Delaware Investments® Dividend and Income Fund, Inc.
As of November 30, 2019 (Unaudited)
Sector designations may be different than the sector designations presented in other Fund materials. The sector designations may represent the investment manager’s internal sector classifications.
| | | | |
| Security type / sector | | Percentage
of net assets | |
Common Stock | | | 91.47% | |
Communication Services | | | 5.03% | |
Consumer Discretionary | | | 4.89% | |
Consumer Staples | | | 8.05% | |
Energy | | | 5.78% | |
Financials | | | 13.99% | |
Healthcare | | | 21.99% | |
Industrials | | | 7.94% | |
Information Technology | | | 10.27% | |
Materials | | | 2.13% | |
REIT Diversified | | | 0.16% | |
REIT Healthcare | | | 0.92% | |
REIT Hotel | | | 0.81% | |
REIT Industrial | | | 0.20% | |
REIT Mall | | | 0.21% | |
REIT Manufactured Housing | | | 0.33% | |
REIT Mortgage | | | 0.43% | |
REIT Multifamily | | | 4.05% | |
REIT Office | | | 0.83% | |
REIT Self-Storage | | | 0.21% | |
REIT Shopping Center | | | 0.47% | |
REIT Single Tenant | | | 0.43% | |
Utilities | | | 2.35% | |
Convertible Preferred Stock | | | 1.07% | |
Convertible Bonds | | | 5.18% | |
Capital Goods | | | 0.32% | |
Communications | | | 0.69% | |
Consumer Cyclical | | | 0.27% | |
ConsumerNon-Cyclical | | | 0.86% | |
Electric | | | 0.17% | |
Energy | | | 0.69% | |
Financials | | | 0.29% | |
Industrials | | | 0.21% | |
REIT | | | 0.17% | |
Technology | | | 1.51% | |
| | | | |
| Security type / sector | | Percentage
of net assets | |
Corporate Bonds | | | 36.59% | |
Automotive | | | 0.55% | |
Banking | | | 1.69% | |
Basic Industry | | | 4.42% | |
Capital Goods | | | 2.57% | |
Communications | | | 2.62% | |
Consumer Cyclical | | | 2.34% | |
ConsumerNon-Cyclical | | | 2.24% | |
Energy | | | 4.13% | |
Financials | | | 0.92% | |
Healthcare | | | 3.35% | |
Insurance | | | 0.96% | |
Media | | | 4.40% | |
Real Estate Investment Trusts | | | 0.94% | |
Services | | | 1.18% | |
Technology & Electronics | | | 2.31% | |
Transportation | | | 0.33% | |
Utilities | | | 1.64% | |
Preferred Stock | | | 0.50% | |
Exchange-Traded Fund | | | 1.92% | |
Rights | | | 0.00% | |
Short-Term Investments | | | 7.32% | |
Total Value of Securities | | | 144.05% | |
Borrowing Under Line of Credit | | | (41.43%) | |
Liabilities Net of Receivables and Other Assets | | | (2.62%) | |
Total Net Assets | | | 100.00% | |
Security type / sector allocations and
top 10 equity holdings
Delaware Investments® Dividend and Income Fund, Inc.
Holdings are for informational purposes only and are subject to change at any time. They are not a recommendation to buy, sell, or hold any security.
| | |
| Top 10 Equity Holdings | | Percentage of net assets |
CVS Health | | 3.26% |
ConocoPhillips | | 3.01% |
Cigna | | 3.01% |
Allstate | | 2.95% |
Brookdale Senior Living | | 2.92% |
BB&T | | 2.89% |
Marsh & McLennan | | 2.87% |
Lowe’s | | 2.83% |
Intel | | 2.81% |
Occidental Petroleum | | 2.78% |
8
Schedule of investments
Delaware Investments® Dividend and Income Fund, Inc.
November 30, 2019
| | | | | | | | |
| | | Number of
shares | | | Value (US $) | |
| |
Common Stock – 91.47% | | | | | | | | |
| |
Communication Services – 5.03% | | | | | |
AT&T | | | 58,000 | | | $ | 2,168,040 | |
Century Communications =† | | | 500,000 | | | | 0 | |
Verizon Communications | | | 34,600 | | | | 2,084,304 | |
| | | | | | | | |
| | | | | | | 4,252,344 | |
| | | | | | | | |
Consumer Discretionary – 4.89% | | | | | |
Dollar Tree † | | | 19,000 | | | | 1,737,740 | |
Lowe’s | | | 20,400 | | | | 2,393,124 | |
| | | | | | | | |
| | | | | | | 4,130,864 | |
| | | | | | | | |
Consumer Staples – 8.05% | | | | | |
Archer-Daniels-Midland | | | 46,700 | | | | 2,004,831 | |
Coca-Cola | | | 14,546 | | | | 776,756 | |
Conagra Brands | | | 69,763 | | | | 2,014,058 | |
Mondelez International Class A | | | 38,100 | | | | 2,001,774 | |
| | | | | | | | |
| | | | | | | 6,797,419 | |
| | | | | | | | |
Energy – 5.78% | | | | | |
ConocoPhillips | | | 42,400 | | | | 2,541,456 | |
Occidental Petroleum | | | 60,800 | | | | 2,345,056 | |
| | | | | | | | |
| | | | | | | 4,886,512 | |
| | | | | | | | |
Financials – 13.99% | | | | | |
Allstate | | | 22,400 | | | | 2,494,240 | |
American International Group | | | 39,900 | | | | 2,101,134 | |
Bank of New York Mellon | | | 46,200 | | | | 2,262,414 | |
BB&T | | | 44,600 | | | | 2,440,512 | |
Hercules Capital | | | 7,218 | | | | 103,434 | |
Marsh & McLennan | | | 22,400 | | | | 2,420,768 | |
| | | | | | | | |
| | | | | | | 11,822,502 | |
| | | | | | | | |
Healthcare – 21.99% | | | | | |
Abbott Laboratories | | | 24,700 | | | | 2,110,615 | |
Brookdale Senior Living † | | | 345,252 | | | | 2,465,099 | |
Cardinal Health | | | 40,400 | | | | 2,223,212 | |
Cigna | | | 12,708 | | | | 2,540,583 | |
CVS Health | | | 36,600 | | | | 2,754,882 | |
Johnson & Johnson | | | 15,000 | | | | 2,062,350 | |
Merck & Co. | | | 25,500 | | | | 2,223,090 | |
Pfizer | | | 57,089 | | | | 2,199,068 | |
| | | | | | | | |
| | | | | | | 18,578,899 | |
| | | | | | | | |
Industrials – 7.94% | | | | | |
Northrop Grumman | | | 6,200 | | | | 2,180,974 | |
Raytheon | | | 10,600 | | | | 2,304,652 | |
| | | | | | | | |
| | | Number of
shares | | | Value (US $) | |
| |
Common Stock (continued) | | | | | | | | |
| |
Industrials (continued) | | | | | | | | |
Waste Management | | | 19,700 | | | $ | 2,224,327 | |
| | | | | | | | |
| | | | | | | 6,709,953 | |
| | | | | | | | |
Information Technology – 10.27% | | | | | |
Broadcom | | | 7,100 | | | | 2,245,091 | |
Cisco Systems | | | 39,200 | | | | 1,776,152 | |
Intel | | | 40,900 | | | | 2,374,245 | |
Oracle | | | 40,700 | | | | 2,284,898 | |
| | | | | | | | |
| | | | | | | 8,680,386 | |
| | | | | | | | |
Materials – 2.13% | | | | | |
DuPont de Nemours | | | 27,732 | | | | 1,797,311 | |
| | | | | | | | |
| | | | | | | 1,797,311 | |
| | | | | | | | |
REIT Diversified – 0.16% | | | | | |
Fibra Uno Administracion | | | 88,100 | | | | 135,161 | |
| | | | | | | | |
| | | | | | | 135,161 | |
| | | | | | | | |
REIT Healthcare – 0.92% | | | | | |
Assura | | | 269,626 | | | | 264,330 | |
Healthpeak Properties | | | 6,400 | | | | 223,232 | |
Sabra Health Care REIT | | | 3,000 | | | | 66,840 | |
Welltower | | | 2,592 | | | | 219,205 | |
| | | | | | | | |
| | | | | | | 773,607 | |
| | | | | | | | |
REIT Hotel – 0.81% | | | | | |
MGM Growth Properties Class A | | | 6,299 | | | | 195,206 | |
Service Properties Trust | | | 4,700 | | | | 109,463 | |
Summit Hotel Properties | | | 14,547 | | | | 176,310 | |
VICI Properties | | | 8,069 | | | | 199,546 | |
| | | | | | | | |
| | | | | | | 680,525 | |
| | | | | | | | |
REIT Industrial – 0.20% | | | | | |
Liberty Property Trust | | | 2,700 | | | | 166,374 | |
| | | | | | | | |
| | | | | | | 166,374 | |
| | | | | | | | |
REIT Mall – 0.21% | | | | | |
Simon Property Group | | | 1,193 | | | | 180,394 | |
| | | | | | | | |
| | | | | | | 180,394 | |
| | | | | | | | |
REIT Manufactured Housing – 0.33% | | | | | |
Sun Communities | | | 1,689 | | | | 278,195 | |
| | | | | | | | |
| | | | | | | 278,195 | |
| | | | | | | | |
REIT Mortgage – 0.43% | | | | | |
Annaly Capital Management | | | 38,832 | | | | 362,303 | |
| | | | | | | | |
| | | | | | | 362,303 | |
| | | | | | | | |
REIT Multifamily – 4.05% | | | | | |
Bluerock Residential Growth REIT | | | 11,500 | | | | 140,990 | |
Brookfield Property Partners | | | 2 | | | | 38 | |
Schedule of investments
Delaware Investments® Dividend and Income Fund, Inc.
| | | | | | | | |
| | | Number of
shares | | | Value (US $) | |
| |
Common Stock (continued) | | | | | | | | |
| |
REIT Multifamily (continued) | | | | | | | | |
Equity Residential | | | 26,557 | | | $ | 2,260,001 | |
Essential Properties Realty Trust | | | 23,600 | | | | 615,724 | |
Grainger | | | 34,875 | | | | 127,919 | |
Invitation Homes | | | 4,300 | | | | 131,279 | |
NexPoint Residential Trust | | | 3,000 | | | | 143,550 | |
| | | | | | | | |
| | | | | | | 3,419,501 | |
| | | | | | | | |
REIT Office – 0.83% | | | | | | | | |
Alpine Income Property Trust † | | | 13,727 | | | | 257,656 | |
Postal Realty Trust Class A | | | 12,497 | | | | 198,202 | |
VEREIT | | | 25,000 | | | | 244,000 | |
| | | | | | | | |
| | | | | | | 699,858 | |
| | | | | | | | |
REIT Self-Storage – 0.21% | | | | | | | | |
National Storage Affiliates Trust | | | 5,361 | | | | 179,594 | |
| | | | | | | | |
| | | | | | | 179,594 | |
| | | | | | | | |
REIT Shopping Center – 0.47% | | | | | |
Brixmor Property Group | | | 10,282 | | | | 225,587 | |
First Capital Realty | | | 5,504 | | | | 89,420 | |
SITE Centers | | | 5,722 | | | | 82,912 | |
| | | | | | | | |
| | | | | | | 397,919 | |
| | | | | | | | |
REIT Single Tenant – 0.43% | | | | | | | | |
Spirit Realty Capital | | | 2,140 | | | | 112,136 | |
STORE Capital | | | 6,200 | | | | 252,402 | |
| | | | | | | | |
| | | | | | | 364,538 | |
| | | | | | | | |
Utilities – 2.35% | | | | | | | | |
Edison International | | | 28,700 | | | | 1,983,170 | |
| | | | | | | | |
| | | | | | | 1,983,170 | |
| | | | | | | | |
Total Common Stock
(cost $59,299,522) | | | | | | | 77,277,329 | |
| | | | | | | | |
| | | | | | | | |
| |
Convertible Preferred Stock – 1.07% | | | | | |
| |
A Schulman 6.00% exercise price $52.33y | | | 199 | | | | 204,451 | |
AMG Capital Trust II 5.15% exercise price $195.47, maturity date 10/15/37 | | | 2,953 | | | | 143,350 | |
Bank of America 7.25% exercise price $50.00y | | | 118 | | | | 174,640 | |
El Paso Energy Capital Trust I 4.75% exercise price $34.49, maturity date 3/31/28 | | | 4,121 | | | | 203,619 | |
| | | | | | | | |
| | | Number of
shares | | | Value (US $) | |
| |
Convertible Preferred Stock (continued) | |
| |
QTS Realty Trust 6.50% exercise price $46.99y | | | 1,420 | | | $ | 179,247 | |
| | | | | | | | |
| |
Total Convertible Preferred Stock
(cost $764,060) | | | | 905,307 | |
| | | | | | | | |
| | |
| | | Principal
amount° | | | | |
| |
Convertible Bonds – 5.18% | | | | | | | | |
| |
Capital Goods – 0.32% | | | | | | | | |
Aerojet Rocketdyne Holdings 2.25% exercise price $26.00, maturity date 12/15/23 | | | 51,000 | | | | 90,113 | |
Cemex 3.72% exercise price $10.88, maturity date 3/15/20 | | | 180,000 | | | | 180,678 | |
| | | | | | | | |
| | | | | | | 270,791 | |
| | | | | | | | |
Communications – 0.69% | | | | | | | | |
DISH Network 2.375% exercise price $82.22, maturity date 3/15/24 | | | 181,000 | | | | 164,088 | |
GCI Liberty 144A 1.75% exercise price $370.52, maturity date 9/30/46 # | | | 146,000 | | | | 196,286 | |
InterDigital 144A 2.00% exercise price $81.29, maturity date 6/1/24 # | | | 126,000 | | | | 126,905 | |
Liberty Media 2.25% exercise price $34.28, maturity date 9/30/46 | | | 170,000 | | | | 96,178 | |
| | | | | | | | |
| | | | | | | 583,457 | |
| | | | | | | | |
Consumer Cyclical – 0.27% | | | | | | | | |
Meritor 3.25% exercise price $39.92, maturity date 10/15/37 | | | 75,000 | | | | 80,353 | |
Team 5.00% exercise price $21.70, maturity date 8/1/23 | | | 140,000 | | | | 146,745 | |
| | | | | | | | |
| | | | | | | 227,098 | |
| | | | | | | | |
ConsumerNon-Cyclical – 0.86% | |
BioMarin Pharmaceutical 0.599% exercise price $124.67, maturity date 8/1/24 | | | 105,000 | | | | 108,273 | |
Chefs’ Warehouse 144A 1.875% exercise price $44.20, maturity date 12/1/24 # | | | 61,000 | | | | 63,474 | |
Medicines 2.75% exercise price $48.97, maturity date 7/15/23 | | | 100,000 | | | | 173,254 | |
Paratek Pharmaceuticals 4.75% exercise price $15.90, maturity date 5/1/24 | | | 177,000 | | | | 109,233 | |
Vector Group 1.75% exercise price $20.27, maturity date 4/15/20● | | | 262,000 | | | | 272,316 | |
| | | | | | | | |
| | | | | | | 726,550 | |
| | | | | | | | |
10
| | | | | | | | |
| | | Principal
amount° | | | Value (US $) | |
| |
Convertible Bonds (continued) | | | | | |
| |
Electric – 0.17% | | | | | | | | |
NRG Energy 2.75% exercise price $47.74, maturity date 6/1/48 | | | 128,000 | | | $ | 144,522 | |
| | | | | | | | |
| | | | | | | 144,522 | |
| | | | | | | | |
Energy – 0.69% | | | | | |
Cheniere Energy 4.25% exercise price $138.38, maturity date 3/15/45 | | | 259,000 | | | | 204,616 | |
Helix Energy Solutions Group 4.25% exercise price $13.89, maturity date 5/1/22 | | | 218,000 | | | | 223,698 | |
PDC Energy 1.125% exercise price $85.39, maturity date 9/15/21 | | | 172,000 | | | | 158,646 | |
| | | | | | | | |
| | | | | | | 586,960 | |
| | | | | | | | |
Financials – 0.29% | | | | | |
FTI Consulting 2.00% exercise price $101.38, maturity date 8/15/23 | | | 89,000 | | | | 111,028 | |
GAIN Capital Holdings 5.00% exercise price $8.20, maturity date 8/15/22 | | | 154,000 | | | | 135,005 | |
| | | | | | | | |
| | | | | | | 246,033 | |
| | | | | | | | |
Industrials – 0.21% | | | | | |
Chart Industries 144A 1.00% exercise price $58.73, maturity date 11/15/24 # | | | 85,000 | | | | 98,285 | |
Dycom Industries 0.75% exercise price $96.89, maturity date 9/15/21 | | | 80,000 | | | | 77,959 | |
| | | | | | | | |
| | | | | | | 176,244 | |
| | | | | | | | |
REIT – 0.17% | | | | | |
Blackstone Mortgage Trust 4.75% exercise price $36.23, maturity date 3/15/23 | | | 134,000 | | | | 142,215 | |
| | | | | | | | |
| | | | | | | 142,215 | |
| | | | | | | | |
Technology – 1.51% | | | | | |
Boingo Wireless 1.00% exercise price $42.32, maturity date 10/1/23 | | | 169,000 | | | | 148,951 | |
CSG Systems International 4.25% exercise price $56.87, maturity date 3/15/36 | | | 139,000 | | | | 164,045 | |
Knowles 3.25% exercise price $18.43, maturity date 11/1/21 | | | 103,000 | | | | 137,659 | |
Ligand Pharmaceuticals 0.75% exercise price $248.48, maturity date 5/15/23 | | | 87,000 | | | | 75,977 | |
Pluralsight 144A 0.375% exercise price $38.76, maturity date 3/1/24 # | | | 163,000 | | | | 141,052 | |
| | | | | | | | |
| | | Principal
amount° | | | Value (US $) | |
| |
Convertible Bonds (continued) | | | | | | | | |
| |
Technology (continued) | | | | | | | | |
Quotient Technology 1.75% exercise price $17.36, maturity date 12/1/22 | | | 127,000 | | | $ | 124,897 | |
Retrophin 2.50% exercise price $38.80, maturity date 9/15/25 | | | 129,000 | | | | 100,830 | |
Synaptics 0.50% exercise price $73.02, maturity date 6/15/22 | | | 120,000 | | | | 124,967 | |
Verint Systems 1.50% exercise price $64.46, maturity date 6/1/21 | | | 140,000 | | | | 144,275 | |
Vishay Intertechnology 2.25% exercise price $31.45, maturity date 6/15/25 | | | 113,000 | | | | 110,659 | |
| | | | | | | | |
| | | | | | | 1,273,312 | |
| | | | | | | | |
| |
Total Convertible Bonds
(cost $4,198,645) | | | | 4,377,182 | |
| | | | | | | | |
|
| |
Corporate Bonds – 36.59% | | | | | | | | |
| |
Automotive – 0.55% | | | | | | | | |
Allison Transmission 144A 5.875% 6/1/29 # | | | 430,000 | | | | 464,861 | |
| | | | | | | | |
| | | | | | | 464,861 | |
| | | | | | | | |
Banking – 1.69% | | | | | |
Ally Financial 5.75% 11/20/25 | | | 435,000 | | | | 480,131 | |
Credit Suisse Group 144A 6.25% #µy | | | 200,000 | | | | 216,289 | |
Popular 6.125% 9/14/23 | | | 280,000 | | | | 301,116 | |
Royal Bank of Scotland Group 8.625% µy | | | 400,000 | | | | 432,792 | |
| | | | | | | | |
| | | | | | | 1,430,328 | |
| | | | | | | | |
Basic Industry – 4.42% | | | | | |
BMC East 144A 5.50% 10/1/24 # | | | 125,000 | | | | 130,208 | |
Boise Cascade 144A 5.625% 9/1/24 # | | | 275,000 | | | | 286,802 | |
Builders FirstSource 144A 5.625% 9/1/24 # | | | 148,000 | | | | 154,289 | |
Chemours 5.375% 5/15/27 | | | 190,000 | | | | 160,080 | |
FMG Resources August 2006 | | | | | | | | |
144A 4.75% 5/15/22 # | | | 105,000 | | | | 107,887 | |
144A 5.125% 5/15/24 # | | | 180,000 | | | | 189,299 | |
Freeport-McMoRan | | | | | | | | |
4.55% 11/14/24 | | | 170,000 | | | | 179,088 | |
5.45% 3/15/43 | | | 185,000 | | | | 178,081 | |
HD Supply 144A 5.375% 10/15/26 # | | | 170,000 | | | | 180,595 | |
Hudbay Minerals 144A 7.625% 1/15/25 # | | | 180,000 | | | | 180,898 | |
Joseph T Ryerson & Son 144A 11.00% 5/15/22 # | | | 110,000 | | | | 116,544 | |
Schedule of investments
Delaware Investments® Dividend and Income Fund, Inc.
| | | | | | | | |
| | | Principal
amount° | | | Value (US $) | |
| |
Corporate Bonds (continued) | | | | | |
| |
Basic Industry (continued) | | | | | |
Koppers 144A 6.00% 2/15/25 # | | | 215,000 | | | $ | 218,223 | |
Lennar | | | | | | | | |
4.50% 4/30/24 | | | 195,000 | | | | 207,318 | |
4.75% 5/30/25 | | | 95,000 | | | | 102,271 | |
5.875% 11/15/24 | | | 80,000 | | | | 89,433 | |
M/I Homes 5.625% 8/1/25 | | | 20,000 | | | | 20,808 | |
NOVA Chemicals 144A 5.00% 5/1/25 # | | | 130,000 | | | | 130,974 | |
Novelis 144A 6.25%
8/15/24 # | | | 116,000 | | | | 122,267 | |
Olin | | | | | | | | |
5.00% 2/1/30 | | | 175,000 | | | | 174,129 | |
5.125% 9/15/27 | | | 195,000 | | | | 202,765 | |
PulteGroup 5.00% 1/15/27 | | | 100,000 | | | | 109,232 | |
Standard Industries 144A 6.00% 10/15/25 # | | | 50,000 | | | | 52,437 | |
Steel Dynamics 5.00% 12/15/26 | | | 280,000 | | | | 298,101 | |
Univar Solutions USA 144A 5.125% 12/1/27 # | | | 140,000 | | | | 143,528 | |
| | | | | | | | |
| | | | | | | 3,735,257 | |
| | | | | | | | |
Capital Goods – 2.57% | | | | | | | | |
Ardagh Packaging Finance 144A 6.00% 2/15/25 # | | | 240,000 | | | | 252,600 | |
Ashtead Capital 144A 5.25% 8/1/26 # | | | 530,000 | | | | 567,613 | |
Bombardier 144A 6.00% 10/15/22 # | | | 325,000 | | | | 326,625 | |
Crown Americas 4.75% 2/1/26 | | | 285,000 | | | | 299,705 | |
Mauser Packaging Solutions Holding | | | | | | | | |
144A 5.50% 4/15/24 # | | | 310,000 | | | | 317,747 | |
144A 7.25% 4/15/25 # | | | 105,000 | | | | 99,749 | |
TransDigm 144A 6.25% 3/15/26 # | | | 125,000 | | | | 134,453 | |
Zekelman Industries 144A 9.875% 6/15/23 # | | | 165,000 | | | | 174,178 | |
| | | | | | | | |
| | | | | | | 2,172,670 | |
| | | | | | | | |
Communications – 2.62% | | | | | | | | |
Altice France 144A 7.375% 5/1/26 # | | | 420,000 | | | | 449,412 | |
Level 3 Financing 144A 3.875% 11/15/29 # | | | 267,000 | | | | 269,213 | |
SBA Communications 4.875% 9/1/24 | | | 345,000 | | | | 358,688 | |
Sprint | | | | | | | | |
7.125% 6/15/24 | | | 190,000 | | | | 205,200 | |
7.625% 3/1/26 | | | 10,000 | | | | 10,937 | |
7.875% 9/15/23 | | | 103,000 | | | | 113,493 | |
Sprint Communications 7.00% 8/15/20 | | | 136,000 | | | | 139,468 | |
| | | | | | | | |
| | | Principal
amount° | | | Value (US $) | |
| |
Corporate Bonds (continued) | | | | | |
| |
Communications (continued) | | | | | |
T-Mobile USA | | | | | | | | |
6.375% 3/1/25 = | | | 85,000 | | | $ | 0 | |
6.50% 1/15/26 | | | 305,000 | | | | 327,120 | |
6.50% 1/15/26 = | | | 220,000 | | | | 0 | |
Zayo Group | | | | | | | | |
144A 5.75% 1/15/27 # | | | 75,000 | | | | 76,714 | |
6.375% 5/15/25 | | | 250,000 | | | | 257,810 | |
| | | | | | | | |
| | | | | | | 2,208,055 | |
| | | | | | | | |
Consumer Cyclical – 2.34% | | | | | |
AMC Entertainment Holdings 6.125% 5/15/27 | | | 290,000 | | | | 261,732 | |
KAR Auction Services 144A 5.125% 6/1/25 # | | | 95,000 | | | | 96,780 | |
Levi Strauss & Co. 5.00% 5/1/25 | | | 190,000 | | | | 196,254 | |
MGM Resorts International 5.75% 6/15/25 | | | 180,000 | | | | 201,373 | |
Penn National Gaming 144A 5.625% 1/15/27 # | | | 215,000 | | | | 223,675 | |
Scientific Games International | | | | | | | | |
144A 8.25% 3/15/26 # | | | 290,000 | | | | 314,497 | |
10.00% 12/1/22 | | | 290,000 | | | | 297,975 | |
Yum! Brands 144A 4.75% 1/15/30 # | | | 370,000 | | | | 383,884 | |
| | | | | | | | |
| | | | | | | 1,976,170 | |
| | | | | | | | |
ConsumerNon-Cyclical – 2.24% | | | | | |
Aramark Services 144A 5.00% 2/1/28 # | | | 345,000 | | | | 363,121 | |
Cott Holdings 144A 5.50% 4/1/25 # | | | 260,000 | | | | 272,997 | |
JBS USA | | | | | | | | |
144A 5.75% 6/15/25 # | | | 170,000 | | | | 176,871 | |
144A 6.50% 4/15/29 # | | | 160,000 | | | | 177,656 | |
144A 6.75% 2/15/28 # | | | 20,000 | | | | 22,130 | |
Pilgrim’s Pride | | | | | | | | |
144A 5.75% 3/15/25 # | | | 315,000 | | | | 327,597 | |
144A 5.875% 9/30/27 # | | | 65,000 | | | | 70,351 | |
Post Holdings | | | | | | | | |
144A 5.00% 8/15/26 # | | | 100,000 | | | | 105,230 | |
144A 5.625% 1/15/28 # | | | 180,000 | | | | 192,568 | |
144A 5.75% 3/1/27 # | | | 170,000 | | | | 182,511 | |
| | | | | | | | |
| | | | | | | 1,891,032 | |
| | | | | | | | |
Energy – 4.13% | | | | | | | | |
AmeriGas Partners | | | | | | | | |
5.625% 5/20/24 | | | 10,000 | | | | 10,700 | |
5.875% 8/20/26 | | | 160,000 | | | | 175,972 | |
12
| | | | | | | | |
| | | Principal
amount° | | | Value (US $) | |
| |
Corporate Bonds (continued) | | | | | |
| |
Energy (continued) | | | | | | | | |
Cheniere Corpus Christi Holdings | | | | | | | | |
5.125% 6/30/27 | | | 40,000 | | | $ | 43,921 | |
5.875% 3/31/25 | | | 80,000 | | | | 89,616 | |
7.00% 6/30/24 | | | 200,000 | | | | 229,968 | |
Cheniere Energy Partners 5.25% 10/1/25 | | | 175,000 | | | | 180,686 | |
Crestwood Midstream Partners 6.25% 4/1/23 | | | 225,000 | | | | 226,123 | |
Energy Transfer Operating 5.50% 6/1/27 | | | 115,000 | | | | 127,288 | |
Genesis Energy | | | | | | | | |
6.50% 10/1/25 | | | 40,000 | | | | 36,299 | |
6.75% 8/1/22 | | | 174,000 | | | | 170,410 | |
Hilcorp Energy I 144A 5.00% 12/1/24 # | | | 97,000 | | | | 86,651 | |
Murphy Oil | | | | | | | | |
5.875% 12/1/27 | | | 214,000 | | | | 215,382 | |
6.875% 8/15/24 | | | 145,000 | | | | 152,125 | |
Murphy Oil USA 5.625% 5/1/27 | | | 415,000 | | | | 448,604 | |
Newfield Exploration 5.375% 1/1/26 | | | 275,000 | | | | 295,326 | |
NuStar Logistics 5.625% 4/28/27 | | | 160,000 | | | | 165,572 | |
Precision Drilling 144A 7.125% 1/15/26 # | | | 40,000 | | | | 35,086 | |
Southwestern Energy 7.75% 10/1/27 | | | 220,000 | | | | 191,681 | |
Summit Midstream Holdings 5.75% 4/15/25 | | | 10,000 | | | | 7,579 | |
Targa Resources Partners | | | | | | | | |
5.375% 2/1/27 | | | 300,000 | | | | 305,947 | |
5.875% 4/15/26 | | | 20,000 | | | | 21,081 | |
Transocean 144A 9.00% 7/15/23 # | | | 200,000 | | | | 204,560 | |
Transocean Proteus 144A 6.25% 12/1/24 # | | | 67,500 | | | | 68,372 | |
| | | | | | | | |
| | | | | | | 3,488,949 | |
| | | | | | | | |
Financials – 0.92% | | | | | |
AerCap Global Aviation Trust 144A 6.50% 6/15/45 #µ | | | 200,000 | | | | 220,020 | |
DAE Funding 144A 5.75% 11/15/23 # | | | 350,000 | | | | 369,395 | |
E*TRADE Financial
5.875% µy | | | 180,000 | | | | 188,718 | |
| | | | | | | | |
| | | | | | | 778,133 | |
| | | | | | | | |
Healthcare – 3.35% | | | | | |
Bausch Health 144A 5.50% 11/1/25 # | | | 465,000 | | | | 487,088 | |
Charles River Laboratories International | | | | | | | | |
144A 4.25% 5/1/28 # | | | 140,000 | | | | 141,400 | |
144A 5.50% 4/1/26 # | | | 330,000 | | | | 352,216 | |
| | | | | | | | |
| | | Principal
amount° | | | Value (US $) | |
| |
Corporate Bonds (continued) | | | | | |
| |
Healthcare (continued) | | | | | | | | |
Encompass Health | | | | | | | | |
5.75% 11/1/24 | | | 173,000 | | | $ | 175,810 | |
5.75% 9/15/25 | | | 120,000 | | | | 126,350 | |
HCA | | | | | | | | |
5.375% 2/1/25 | | | 405,000 | | | | 448,533 | |
5.875% 2/15/26 | | | 165,000 | | | | 186,660 | |
7.58% 9/15/25 | | | 80,000 | | | | 95,900 | |
Hill-Rom Holdings 144A 5.00% 2/15/25 # | | | 180,000 | | | | 188,175 | |
Hologic 144A 4.625% 2/1/28 # | | | 160,000 | | | | 169,256 | |
Tenet Healthcare | | | | | | | | |
5.125% 5/1/25 | | | 175,000 | | | | 180,250 | |
8.125% 4/1/22 | | | 255,000 | | | | 279,225 | |
| | | | | | | | |
| | | | | | | 2,830,863 | |
| | | | | | | | |
Insurance – 0.96% | | | | | |
HUB International 144A 7.00% 5/1/26 # | | | 210,000 | | | | 215,780 | |
USI 144A 6.875% 5/1/25 # | | | 295,000 | | | | 297,210 | |
WellCare Health Plans 144A 5.375% 8/15/26 # | | | 275,000 | | | | 293,514 | |
| | | | | | | | |
| | | | | | | 806,504 | |
| | | | | | | | |
Media – 4.40% | | | | | |
AMC Networks 4.75% 8/1/25 | | | 370,000 | | | | 368,150 | |
CCO Holdings | | | | | | | | |
144A 5.125% 5/1/27 # | | | 120,000 | | | | 127,503 | |
144A 5.375% 6/1/29 # | | | 170,000 | | | | 182,542 | |
144A 5.50% 5/1/26 # | | | 30,000 | | | | 31,720 | |
144A 5.75% 2/15/26 # | | | 160,000 | | | | 169,365 | |
144A 5.875% 5/1/27 # | | | 190,000 | | | | 202,791 | |
CSC Holdings | | | | | | | | |
6.75% 11/15/21 | | | 230,000 | | | | 248,055 | |
144A 7.75% 7/15/25 # | | | 200,000 | | | | 215,000 | |
Gray Television | | | | | | | | |
144A 5.875% 7/15/26 # | | | 290,000 | | | | 308,176 | |
144A 7.00% 5/15/27 # | | | 55,000 | | | | 61,040 | |
Lamar Media | | | | | | | | |
5.375% 1/15/24 | | | 190,000 | | | | 194,748 | |
5.75% 2/1/26 | | | 167,000 | | | | 177,984 | |
Netflix 5.875% 11/15/28 | | | 365,000 | | | | 399,684 | |
Sinclair Television Group 144A 5.125% 2/15/27 # | | | 195,000 | | | | 197,505 | |
Sirius XM Radio | | | | | | | | |
144A 5.00% 8/1/27 # | | | 395,000 | | | | 416,735 | |
144A 5.375% 4/15/25 # | | | 205,000 | | | | 212,685 | |
VTR Finance 144A 6.875% 1/15/24 # | | | 200,000 | | | | 205,333 | |
| | | | | | | | |
| | | | | | | 3,719,016 | |
| | | | | | | | |
Schedule of investments
Delaware Investments® Dividend and Income Fund, Inc.
| | | | | | | | |
| | | Principal
amount° | | | Value (US $) | |
| |
Corporate Bonds (continued) | |
| |
Real Estate Investment Trusts – 0.94% | |
CyrusOne 5.375% 3/15/27 | | | 170,000 | | | $ | 187,484 | |
ESH Hospitality | | | | | | | | |
144A 4.625% 10/1/27 # | | | 90,000 | | | | 90,659 | |
144A 5.25% 5/1/25 # | | | 290,000 | | | | 300,150 | |
GLP Capital 5.375% 4/15/26 | | | 110,000 | | | | 121,468 | |
MGM Growth Properties Operating Partnership 144A 5.75% 2/1/27 # | | | 85,000 | | | | 95,306 | |
| | | | | | | | |
| | | | | | | 795,067 | |
| | | | | | | | |
Services – 1.18% | | | | | |
Advanced Disposal Services 144A 5.625% 11/15/24 # | | | 215,000 | | | | 225,033 | |
Covanta Holding 5.875% 7/1/25 | | | 210,000 | | | | 220,062 | |
Prime Security Services Borrower | | | | | | | | |
144A 5.75% 4/15/26 # | | | 220,000 | | | | 230,207 | |
144A 9.25% 5/15/23 # | | | 146,000 | | | | 153,756 | |
Service Corp. International 4.625% 12/15/27 | | | 159,000 | | | | 165,332 | |
| | | | | | | | |
| | | | | | | 994,390 | |
| | | | | | | | |
Technology & Electronics – 2.31% | | | | | |
CDK Global | | | | | | | | |
5.00% 10/15/24 | | | 175,000 | | | | 189,656 | |
5.875% 6/15/26 | | | 236,000 | | | | 252,773 | |
CDW Finance 5.00% 9/1/25 | | | 95,000 | | | | 99,274 | |
CommScope Technologies 144A 5.00% 3/15/27 # | | | 100,000 | | | | 88,006 | |
Infor US 6.50% 5/15/22 | | | 185,000 | | | | 188,939 | |
Iron Mountain US Holdings 144A 5.375% 6/1/26 # | | | 357,000 | | | | 372,297 | |
RP Crown Parent 144A 7.375% 10/15/24 # | | | 20,000 | | | | 20,758 | |
Sensata Technologies UK Financing 144A 6.25% 2/15/26 # | | | 200,000 | | | | 215,339 | |
SS&C Technologies 144A 5.50% 9/30/27 # | | | 490,000 | | | | 525,194 | |
| | | | | | | | |
| | | | | | | 1,952,236 | |
| | | | | | | | |
Transportation – 0.33% | | | | | |
Avis Budget Car Rental 144A 6.375% 4/1/24 # | | | 65,000 | | | | 67,871 | |
XPO Logistics 144A 6.125%
9/1/23 # | | | 201,000 | | | | 208,033 | |
| | | | | | | | |
| | | | | | | 275,904 | |
| | | | | | | | |
Utilities – 1.64% | | | | | |
AES | | | | | | | | |
5.50% 4/15/25 | | | 160,000 | | | | 166,190 | |
6.00% 5/15/26 | | | 25,000 | | | | 26,745 | |
| | | | | | | | |
| | | Principal
amount° | | | Value (US $) | |
| |
Corporate Bonds (continued) | |
| |
Utilities (continued) | |
Calpine | | | | | | | | |
144A 5.25% 6/1/26 # | | | 190,000 | | | $ | 199,016 | |
144A 5.875% 1/15/24 # | | | 85,000 | | | | 86,948 | |
Emera 6.75% 6/15/76 µ | | | 180,000 | | | | 202,774 | |
Enel 144A 8.75% 9/24/73 #µ | | | 200,000 | | | | 234,520 | |
Vistra Energy 144A 8.00% 1/15/25 # | | | 158,000 | | | | 165,505 | |
Vistra Operations | | | | | | | | |
144A 5.50% 9/1/26 # | | | 205,000 | | | | 216,239 | |
144A 5.625% 2/15/27 # | | | 85,000 | | | | 89,464 | |
| | | | | | | | |
| | | | | | | 1,387,401 | |
| | | | | | | | |
Total Corporate Bonds
(cost $29,752,664) | | | | | | | 30,906,836 | |
| | | | | | | | |
| | |
| | | Number of shares | | | | |
| |
Preferred Stock – 0.50% | | | | | |
| |
Bank of America 6.50% µ | | | 220,000 | | | | 249,307 | |
GMAC Capital Trust I 7.695% (LIBOR03M + 5.785%) 2/15/40● | | | 2,000 | | | | 51,860 | |
Washington Prime Group 6.875% | | | 5,800 | | | | 120,125 | |
| | | | | | | | |
Total Preferred Stock
(cost $401,122) | | | | | | | 421,292 | |
| | | | | | | | |
|
| |
Exchange-Traded Fund – 1.92% | |
| |
VanEck Vectors Oil Services ETF | | | 138,800 | | | | 1,622,572 | |
| | | | | | | | |
Total Exchange-Traded Fund
(cost $1,648,208) | | | | 1,622,572 | |
| | | | | | | | |
|
| |
Rights – 0.00% | | | | | |
| |
DISH Network† | | | 119 | | | | 81 | |
| | | | | | | | |
Total Right(cost $0) | | | | | | | 81 | |
| | | | | | | | |
|
| |
Short-Term Investments – 7.32% | |
| |
Money Market Mutual Funds – 7.32% | |
BlackRock FedFund – Institutional Shares(seven-day effective yield 1.55%) | | | 1,236,558 | | | | 1,236,558 | |
Fidelity Investments Money Market Government Portfolio – Class I(seven-day effective yield 1.53%) | | | 1,236,558 | | | | 1,236,558 | |
14
| | | | | | | | |
| | | Number of
shares | | | Value
(US $) | |
| |
Short-Term Investments (continued) | | | | | |
| |
Money Market Mutual Funds (continued) | |
GS Financial Square Government Fund
– Institutional Shares(seven-day effective yield 1.54%) | | | 1,236,558 | | | $ | 1,236,558 | |
Morgan Stanley Government Portfolio – Institutional Share Class(seven-day effective yield 1.52%) | | | 1,236,558 | | | | 1,236,558 | |
State Street Institutional US Government Money Market Fund – Investor Class(seven-day effective yield 1.51%) | | | 1,236,558 | | | | 1,236,558 | |
| | | | | | | | |
Total Short-Term Investments
(cost $6,182,790) | | | | | | | 6,182,790 | |
| | | | | | | | |
Total Value of Securities – 144.05% (cost $102,247,011) | | | | | | $ | 121,693,389 | |
| | | | | | | | |
| # | Security exempt from registration under Rule 144A of the Securities Act of 1933, as amended. At Nov. 30, 2019, the aggregate value of Rule 144A securities was $17,942,694, which represents 21.24% of the Fund’s net assets. See Note 10 in “Notes to financial statements.” |
| = | The value of this security was determined using significant unobservable inputs and is reported as a Level 3 security in the disclosure table located in Note 3 in “Notes to financial statements.” |
| ° | Principal amount shown is stated in USD unless noted that the security is denominated in another currency. |
| µ | Fixed to variable rate investment. The rate shown reflects the fixed rate in effect at Nov. 30, 2019. Rate will reset at a future date. |
| y | No contractual maturity date. |
| † | Non-income producing security. |
| ● | Variable rate investment. Rates reset periodically. Rate shown reflects the rate in effect at Nov. 30, 2019. For securities based on a published reference rate and spread, the reference rate and spread are indicated in their description above. The reference rate descriptions (i.e. LIBOR03M, LIBOR06M, etc.) used in this report are identical for different securities, but the underlying reference rates may differ due to the timing of the reset period. Certain variable rate securities are not based on a published reference rate and spread but are determined by the issuer or agent and are based on current market conditions, or for mortgage-backed securities, are impacted by the individual mortgages which are paying off over time. These securities do not indicate a reference rate and spread in their description above. |
Summary of abbreviations:
ETF – Exchange-Traded Fund
GS – Goldman Sachs
ICE – Intercontinental Exchange
LIBOR – London Interbank Offered Rate
LIBOR03M – ICE LIBOR USD 3 Month
LIBOR06M – ICE LIBOR USD 6 Month
REIT – Real Estate Investment Trust
USD – US Dollar
See accompanying notes, which are an integral part of the financial statements.
Statement of assets and liabilities
Delaware Investments® Dividend and Income Fund, Inc.
November 30, 2019
| | | | |
Assets: | | | | |
Investments, at value1 | | $ | 121,693,389 | |
Foreign currencies, at value2 | | | 237,751 | |
Receivable for securities sold | | | 863,993 | |
Dividends and interest receivable | | | 685,077 | |
Foreign tax reclaims receivable | | | 4,812 | |
| | | | |
Total assets | | | 123,485,022 | |
| | | | |
Liabilities: | | | | |
Borrowing under line of credit | | | 35,000,000 | |
Payable for securities purchased | | | 3,816,947 | |
Other accrued expenses | | | 104,052 | |
Investment management fees payable to affiliates | | | 54,221 | |
Interest expense payable on line of credit | | | 18,285 | |
Legal fees payable to affiliates | | | 8,890 | |
Accounting and administration expenses payable to affiliates | | | 657 | |
Reports and statements to shareholders expenses payable to affiliates | | | 48 | |
Cash due to custodian | | | 585 | |
Directors’ fees and expenses payable to affiliates | | | 1 | |
| | | | |
Total liabilities | | | 39,003,686 | |
| | | | |
Total Net Assets | | $ | 84,481,336 | |
| | | | |
| |
Net Assets Consist of: | | | | |
Common stock, $0.01 par value, 500,000,000 shares authorized to the Fund | | $ | 65,099,486 | |
Total distributable earnings (loss) | | | 19,381,850 | |
| | | | |
Total Net Assets | | $ | 84,481,336 | |
| | | | |
| |
Net Asset Value | | | | |
| |
Common Shares | | | | |
Net assets | | $ | 84,481,336 | |
Shares of beneficial interest outstanding | | | 7,688,159 | |
Net asset value per share | | $ | 10.99 | |
| | | | |
1Investments, at cost | | $ | 102,247,011 | |
2Foreign currencies, at cost | | | 241,918 | |
See accompanying notes, which are an integral part of the financial statements.
16
Statement of operations
Delaware Investments® Dividend and Income Fund, Inc.
Year ended November 30, 2019
| | | | |
Investment Income: | | | | |
Interest | | $ | 2,739,424 | |
Dividends | | | 2,296,163 | |
Foreign tax withheld | | | (4,074 | ) |
| | | | |
| | | 5,031,513 | |
| | | | |
Expenses: | | | | |
Interest expense | | | 1,126,431 | |
Management fees | | | 652,803 | |
Legal fees | | | 397,029 | |
Reports and statements to shareholders expenses | | | 158,273 | |
Dividend disbursing and transfer agent fees and expenses | | | 86,170 | |
Accounting and administration expenses | | | 64,459 | |
Audit and tax fees | | | 47,221 | |
Custodian fees | | | 5,909 | |
Directors’ fees and expenses | | | 4,919 | |
Registration fees | | | 288 | |
Other expenses | | | 83,130 | |
| | | | |
| | | 2,626,632 | |
Less expenses paid indirectly | | | (522 | ) |
| | | | |
Total operating expenses | | | 2,626,110 | |
| | | | |
Net Investment Income | | | 2,405,403 | |
| | | | |
| |
Net Realized and Unrealized Gain (Loss): | | | | |
Net realized gain (loss) on: | | | | |
Investments* | | | 4,860,667 | |
Foreign currencies | | | (8,263 | ) |
Foreign currency exchange contracts | | | (1,177 | ) |
Options written | | | 589,991 | |
| | | | |
Net realized gain | | | 5,441,218 | |
| | | | |
| |
Net change in unrealized appreciation (depreciation) of: | | | | |
Investments | | | (223,163 | ) |
Foreign currencies | | | 5,801 | |
| | | | |
Net change in unrealized appreciation (depreciation) | | | (217,362 | ) |
| | | | |
Net Realized and Unrealized Gain | | | 5,223,856 | |
| | | | |
| |
Net Increase in Net Assets Resulting from Operations | | $ | 7,629,259 | |
| | | | |
*Includes $151,801 related to General Motors term loan litigation. See Note 12 in “Notes to financial statements.”
See accompanying notes, which are an integral part of the financial statements.
Statements of changes in net assets
Delaware Investments® Dividend and Income Fund, Inc.
| | | | | | | | |
| | | Year ended | |
| | | 11/30/19 | | | 11/30/18 | |
Increase (Decrease) in Net Assets from Operations: | | | | | | | | |
Net investment income | | $ | 2,405,403 | | | $ | 2,117,294 | |
Net realized gain | | | 5,441,218 | | | | 6,206,741 | |
Net change in unrealized appreciation (depreciation) | | | (217,362 | ) | | | (6,079,580 | ) |
| | | | | | | | |
Net increase in net assets resulting from operations | | | 7,629,259 | | | | 2,244,455 | |
| | | | | | | | |
| | |
Dividends and Distributions to Shareholders from: | | | | | | | | |
Distributable earnings | | | (8,391,625 | ) | | | (9,916,955 | ) |
| | | | | | | | |
| | | (8,391,625 | ) | | | (9,916,955 | ) |
| | | | | | | | |
| | |
Net Decrease in Net Assets | | | (762,366 | ) | | | (7,672,500 | ) |
| | |
Net Assets: | | | | | | | | |
Beginning of year | | | 85,243,702 | | | | 92,916,202 | |
| | | | | | | | |
End of year | | $ | 84,481,336 | | | $ | 85,243,702 | |
| | | | | | | | |
See accompanying notes, which are an integral part of the financial statements.
18
Statement of cash flows
Delaware Investments® Dividend and Income Fund, Inc.
Year ended November 30, 2019
| | | | |
Net Cash (including Foreign Currency) Provided by (Used for) Operating Activities: | | | | |
Net increase in net assets resulting from operations | | $ | 7,629,259 | |
| | | | |
| |
Adjustments to reconcile net increase (decrease) in net assets from operations to cash provided by (used for) operating activities: | | | | |
Amortization of premium and accretion of discount on investments, net | | | (654,509 | ) |
Proceeds from disposition of investment securities | | | 67,622,029 | |
Purchase of investment securities | | | (60,238,441 | ) |
(Purchase) Proceeds from disposition of short-term investment securities, net | | | (329,221 | ) |
Net realized (gain) loss on investments | | | (4,860,667 | ) |
Net realized (gain) loss on options written | | | (589,991 | ) |
Net change in unrealized (appreciation) depreciation of investments | | | 223,163 | |
Net change in unrealized (appreciation) depreciation of foreign currencies | | | (5,801 | ) |
Purchases in options written | | | 594,410 | |
Sales in options written | | | (4,419 | ) |
(Increase) Decrease in receivable for securities sold | | | (846,061 | ) |
(Increase) Decrease in dividends and interest receivable | | | (6,392 | ) |
Return of capital distributions on investments | | | 298,618 | |
Proceeds from GM litigation | | | 151,801 | |
(Increase) Decrease in foreign tax reclaims receivable | | | 1,532 | |
Increase (Decrease) in payable for securities purchased | | | 3,629,504 | |
Increase (Decrease) in Directors’ fees and expenses payable to affiliates | | | (676 | ) |
Increase (Decrease) in accounting and administration expenses payable to affiliates | | | (62 | ) |
Increase (Decrease) in investment management fees payable to affiliates | | | (2,234 | ) |
Increase (Decrease) in reports and statements to shareholders expenses payable to affiliates | | | (25 | ) |
Increase (Decrease) in legal fees payable to affiliates | | | 163 | |
Increase (Decrease) in other accrued expenses | | | 16,468 | |
Increase (Decrease) in other assets | | | 65,058 | |
Increase (Decrease in other liabilities | | | (216,859 | ) |
Increase (Decrease) in interest expense payable on line of credit | | | (2,715 | ) |
| | | | |
Total adjustments | | | 4,844,673 | |
| | | | |
Net cash provided by (used for) operating activities | | | 12,473,932 | |
| | | | |
| |
Cash provided by (used for) financing activities: | | | | |
Decrease in borrowing under line of credit | | | (5,000,000 | ) |
Cash dividends and distributions paid to shareholders | | | (8,391,625 | ) |
| | | | |
Net cash provided by (used for) financing activities | | | (13,391,625 | ) |
| | | | |
Effect of exchange rates on cash | | | 5,801 | |
| | | | |
Net increase (decrease) in cash | | | (911,892 | ) |
Cash at beginning of year | | | 1,149,058 | |
| | | | |
Cash at end of year | | $ | 237,166 | |
| | | | |
| |
Cash paid for interest expense on line of credit | | $ | 1,129,146 | |
| | | | |
Statement of cash flows
Year ended November 30, 2019
| | | | |
| The following table provides a reconciliation of cash, foreign currencies, and restricted cash reported within the statement of financial position that sum to the total of the same amounts shown on the previous page at November 30, 2019: | | | | |
Cash | | $ | (585 | ) |
Foreign currencies, at value | | | 237,751 | |
| | | | |
Total cash, foreign currencies, and restricted cash at end of year | | $ | 237,166 | |
| | | | |
See accompanying notes, which are an integral part of the financial statements.
20
Financial highlights
Delaware Investments® Dividend and Income Fund, Inc.
Selected data for each share of the Fund outstanding throughout each period were as follows:
| | | | | | | | | | | | | | | | | | | | |
| | | Year ended | |
| | | | | |
| | | 11/30/19 | | | 11/30/18 | | | 11/30/17 | | | 11/30/16 | | | 11/30/15 | |
Net asset value, beginning of period | | $ | 11.09 | | | $ | 12.09 | | | $ | 10.96 | | | $ | 10.20 | | | $ | 11.14 | |
| | | | | |
Income (loss) from investment operations: | | | | | | | | | | | | | | | | | | | | |
Net investment income1 | | | 0.31 | | | | 0.28 | | | | 0.34 | | | | 0.38 | | | | 0.44 | |
Net realized and unrealized gain (loss) | | | 0.68 | | | | 0.01 | | | | 1.27 | | | | 0.97 | | | | (0.75 | ) |
| | | | | | | | | | | | | | | | | | | | |
Total from investment operations | | | 0.99 | | | | 0.29 | | | | 1.61 | | | | 1.35 | | | | (0.31 | ) |
| | | | | | | | | | | | | | | | | | | | |
| | | | | |
Less dividends and distributions from: | | | | | | | | | | | | | | | | | | | | |
Net investment income | | | (1.09 | ) | | | (0.95 | ) | | | (0.48 | ) | | | (0.59 | ) | | | (0.63 | ) |
Net realized gain | | | — | | | | (0.34 | ) | | | — | | | | — | | | | — | |
| | | | | | | | | | | | | | | | | | | | |
Total dividends and distributions | | | (1.09 | ) | | | (1.29 | ) | | | (0.48 | ) | | | (0.59 | ) | | | (0.63 | ) |
| | | | | | | | | | | | | | | | | | | | |
| | | | | |
Net asset value, end of period | | $ | 10.99 | | | $ | 11.09 | | | $ | 12.09 | | | $ | 10.96 | | | $ | 10.20 | |
| | | | | | | | | | | | | | | | | | | | |
| | | | | |
Market value, end of period | | $ | 14.09 | | | $ | 12.42 | | | $ | 10.85 | | | $ | 9.70 | | | $ | 9.00 | |
| | | | | | | | | | | | | | | | | | | | |
| | | | | |
Total return based on2: | | | | | | | | | | | | | | | | | | | | |
Net asset value | | | 7.51% | 3 | | | 2.55% | | | | 15.49% | | | | 14.50% | | | | (2.26% | ) |
Market value | | | 23.07% | | | | 27.97% | | | | 17.11% | | | | 14.85% | | | | (4.41% | ) |
| | | | | |
Ratios and supplemental data: | | | | | | | | | | | | | | | | | | | | |
Net assets, end of period (000 omitted) | | $ | 84,481 | | | $ | 85,244 | | | $ | 92,916 | | | $ | 88,664 | | | $ | 86,919 | |
Ratio of expenses to average net assets4,5,6 | | | 3.15% | | | | 2.48% | | | | 2.09% | | | | 1.95% | | | | 1.71% | |
Ratio of net investment income to average net assets7 | | | 2.88% | | | | 2.37% | | | | 2.94% | | | | 3.68% | | | | 4.03% | |
Portfolio turnover | | | 52% | | | | 29% | | | | 36% | | | | 47% | | | | 43% | |
| | | | | |
Leverage analysis: | | | | | | | | | | | | | | | | | | | | |
Debt outstanding at end of period at par (000 omitted) | | $ | 35,000 | | | $ | 40,000 | | | $ | 40,000 | | | $ | 40,000 | | | $ | 38,000 | |
Asset coverage per $1,000 of debt outstanding at end of period | | $ | 3,414 | | | $ | 3,131 | | | $ | 3,323 | | | $ | 3,217 | | | $ | 3,287 | |
| 1 | The average shares outstanding method has been applied for per share information. |
| 2 | Total return is calculated assuming a purchase of common stock on the opening of the first day and a sale on the closing of the last day of each period reported. Dividends and distributions, if any, are assumed for the purpose of this calculation, to be reinvested at prices obtained under the Fund’s dividend reinvestment plan. Generally, total investment return based on net asset value will be higher than total investment return based on market value in periods where there is an increase in the discount or decrease in the premium of the market value to the net asset value from the beginning to the end of such periods. Conversely, total return based on net asset value will be lower than total return based on market value in periods where there is a decrease in the discount or an increase in the premium of the market value to the net asset value from the beginning to the end of such periods. |
| 3 | General Motors term loan litigation was included in total return. If excluded, the impact on the total return would be 0.18% lower. See Note 12 in “Notes to financial statements.” |
| 4 | The ratio of interest expense to adjusted average net assets (excluding debt outstanding) for the years ended Nov. 30, 2019, 2018, 2017, 2016, and 2015 were 0.95%, 0.85%, 0.58%, 0.41%, and 0.32%, respectively. |
| 5 | The ratio of interest expense to average net assets for the years ended Nov. 30, 2019, 2018, 2017, 2016, and 2015 were 1.35%, 1.23%, 0.84%, 0.59%, and 0.45%, respectively. |
| 6 | The ratio of expenses before interest expense to adjusted average net assets (excluding debt outstanding) for the years ended Nov. 30, 2019, 2018, 2017, 2016, and 2015 were 1.26%, 0.86%, 0.87%, 0.95%, and 0.89%, respectively. |
| 7 | The ratio of net investment income to adjusted average net assets (excluding debt outstanding) for the years ended Nov. 30, 2019, 2018, 2017, 2016, and 2015 were 2.03%, 1.64%, 2.05%, 2.56%, and 2.85%, respectively. |
See accompanying notes, which are an integral part of the financial statements.
Notes to financial statements
Delaware Investments® Dividend and Income Fund, Inc.
November 30, 2019
Delaware Investments Dividend and Income Fund, Inc. (Fund) is organized as a Maryland corporation and is a diversifiedclosed-end management investment company under the Investment Company Act of 1940, as amended (1940 Act). The Fund’s shares trade on the New York Stock Exchange (NYSE) under the symbol DDF.
The Fund’s primary investment objective is to seek high current income; capital appreciation is a secondary objective.
1. Significant Accounting Policies
The Fund follows accounting and reporting guidance under Financial Accounting Standards Board (FASB) Accounting Standards Codification Topic 946, Financial Services – Investment Companies. The following accounting policies are in accordance with US generally accepted accounting principles (US GAAP) and are consistently followed by the Fund.
Security Valuation —Equity securities and exchange-traded funds (ETFs), except those traded on the Nasdaq Stock Market LLC (Nasdaq), are valued at the last quoted sales price as of the time of the regular close of the NYSE on the valuation date. Equity securities and ETFs traded on the Nasdaq are valued in accordance with the Nasdaq Official Closing Price, which may not be the last sales price. If, on a particular day, an equity security or ETF does not trade, the mean between the bid and ask prices will be used, which approximates fair value. Equity securities listed on a foreign exchange are normally valued at the last quoted sales price on the valuation date. US government and agency securities are valued at the mean between the bid and ask prices, which approximates fair value. Other debt securities are valued based upon valuations provided by an independent pricing service or broker and reviewed by management. To the extent current market prices are not available, the pricing service may take into account developments related to the specific security, as well as transactions in comparable securities. Valuations for fixed income securities utilize matrix systems, which reflect such factors as security prices, yields, maturities, and ratings, and are supplemented by dealer and exchange quotations.Open-end investment companies are valued at their published net asset value (NAV). Foreign currency exchange contracts are valued at the mean between the bid and ask prices, which approximates fair value. Interpolated values are derived when the settlement date of the contract is an interim date for which quotations are not available. Investments in repurchase agreements are generally valued at par, which approximates fair value, each business day. Generally, other securities and assets for which market quotations are not readily available are valued at fair value as determined in good faith under the direction of the Fund’s Board of Trustees (Board). In determining whether market quotations are readily available or fair valuation will be used, various factors will be taken into consideration, such as market closures or suspension of trading in a security. The Fund may use fair value pricing more frequently for securities traded primarily innon-US markets because, among other things, most foreign markets close well before the Fund values its securities, generally as of 4:00pm Eastern time. The earlier close of these foreign markets gives rise to the possibility that significant events, including broad market moves, government actions or pronouncements, aftermarket trading, or news events may have occurred in the interim. Whenever such a significant event occurs, the Fund may value foreign securities using fair value prices based on third-party vendor modeling tools (international fair value pricing). Restricted securities and private placements are valued at fair value using methods approved by the Board.
Federal and Foreign Income Taxes— No provision for federal income taxes has been made as the Fund intends to continue to qualify for federal income tax purposes as a regulated investment company under Subchapter M of the Internal Revenue Code of 1986, as amended, and make the requisite distributions to shareholders. The Fund evaluates tax positions taken or expected to be taken in the course of preparing the Fund’s tax returns to determine whether the tax positions are“more-likely-than-not” of being sustained by the applicable tax authority. Tax positions not deemed to meet the“more-likely-than-not” threshold are recorded as a tax benefit or expense in the current year. Management has analyzed the Fund’s tax positions taken or expected to be taken on the Fund’s federal income tax returns through the year ended Nov. 30, 2019 and for all open tax years (years ended Nov. 30, 2016–Nov. 30, 2018), and has concluded that no provision for federal income tax is required in the Fund’s financial statements. In regard to foreign taxes only, the Fund has open tax years in certain foreign countries in which it invests that may date back to the inception of the Fund. If applicable, the Fund recognizes interest accrued on unrecognized tax benefits in interest expense and penalties in “Other expenses” on the “Statement of operations.” During the year ended Nov. 30, 2019, the Fund did not incur any interest or tax penalties.
Repurchase Agreements— The Fund may purchase certain US government securities subject to the counterparty’s agreement to repurchase them at an agreed upon date and price. The counterparty will be required on a daily basis to maintain the value of the collateral subject to the agreement at not less than the repurchase price (including accrued interest). The agreements are conditioned upon the collateral being deposited under the Federal Reserve book-entry system with the Fund’s custodian or a third-partysub-custodian. In the event of default
22
or bankruptcy by the other party to the agreement, retention of the collateral may be subject to legal proceedings. At Nov. 30, 2019, the Fund held no investments in repurchase agreements.
Cash and Cash Equivalents— Cash and cash equivalents include deposits held at financial institutions, which are available for the Fund’s use with no restrictions, with original maturities of 90 days or less.
Distributions— The Fund has implemented a managed distribution policy. Under the policy, the Fund is managed with a goal of generating as much of the distribution as possible from net investment income and short-term capital gains. The balance of the distribution will then come from long-term capital gains to the extent permitted, and if necessary, a return of capital. A return of capital may occur for example, when some or all of the money that you invested in the Fund is paid back to you. A return of capital distribution does not necessarily reflect the Fund’s investment performance and should not be confused with “yield” or “income.” Even though the Fund may realize current year capital gains, such gains may be offset, in whole or in part, by the Fund’s capital loss carryovers from prior years. The Fund’s managed distribution policy is described in more detail on the inside front cover of this report.
Foreign Currency Transactions— Transactions denominated in foreign currencies are recorded at the prevailing exchange rates on the valuation date in accordance with the Fund’s prospectus. The value of all assets and liabilities denominated in foreign currencies is translated daily into US dollars at the exchange rate of such currencies against the US dollar. Transaction gains or losses resulting from changes in exchange rates during the reporting period or upon settlement of the foreign currency transaction are reported in operations for the current period. The Fund generally bifurcates that portion of realized gains and losses on investments in debt securities which is due to changes in foreign exchange rates from that which is due to changes in market prices of debt securities. That portion of gains (losses), which is due to changes in foreign exchange rates, is included on the “Statement of operations” under “Net realized gain (loss) on foreign currencies.” For foreign equity securities, these changes are included on the “Statement of operations” under “Net realized gain (loss) on investments.” The Fund reports certain foreign currency related transactions as components of realized gains (losses) for financial reporting purposes, whereas such components are treated as ordinary income (loss) for federal income tax purposes.
Use of Estimates— The preparation of financial statements in conformity with US GAAP requires management to make estimates and assumptions that affect the fair value of investments, the reported amounts of assets and liabilities and disclosure of contingent assets and liabilities at the date of the financial statements, and the reported amounts of revenues and expenses during the reporting period. Actual results could differ from those estimates and the differences could be material.
Other— Expenses directly attributable to the Fund are charged directly to the Fund. Other expenses common to various funds within the Delaware Funds® by Macquarie (Delaware Funds) are generally allocated among such funds on the basis of average net assets. Management fees and certain other expenses are paid monthly. Security transactions are recorded on the date the securities are purchased or sold (trade date) for financial reporting purposes. Costs used in calculating realized gains and losses on the sale of investment securities are those of the specific securities sold. Dividend income is recorded on theex-dividend date and interest income is recorded on the accrual basis. Discounts and premiums on debt securities are accreted or amortized to interest income, respectively, over the lives of the respective securities using the effective interest method. Distributions received from investments in real estate investment trusts (REITs) are recorded as dividend income on theex-dividend date, subject to reclassification upon notice of the character of such distributions by the issuer. Distributions received from investments in master limited partnerships are recorded as return of capital on theex-dividend date. Foreign dividends are also recorded on theex-dividend date or as soon after theex-dividend date that the Fund is aware of such dividends, net of all tax withholdings, a portion of which may be reclaimable. Withholding taxes and reclaims on foreign dividends have been recorded in accordance with the Fund’s understanding of the applicable country’s tax rules and rates.
The Fund receives earnings credits from its custodian when positive cash balances are maintained, which may be used to offset custody fees. The expenses paid under this arrangement are included on the “Statement of operations” under “Custodian fees” with the corresponding expenses offset included under “Less expenses paid indirectly.” For the year ended Nov. 30, 2019, the Fund earned $522 under this arrangement.
2. Investment Management, Administration Agreements, and Other Transactions with Affiliates
In accordance with the terms of its investment management agreement, the Fund pays Delaware Management Company (DMC), a series of Macquarie Investment Management Business Trust and the investment manager, an annual fee of 0.55%, calculated daily and paid monthly, of the adjusted average daily net assets of the Fund. For purposes of the calculation of investment management fees, adjusted average daily net assets exclude the line of credit liability.
Notes to financial statements
Delaware Investments® Dividend and Income Fund, Inc.
2. Investment Management, Administration Agreements, and Other Transactions with Affiliates (continued)
Effective Sept. 23, 2019, DMC may permit its affiliates, Macquarie Investment Management Global Limited (MIMGL) and Macquarie Funds Management Hong Kong Limited (together, the “AffiliatedSub-Advisors”), to execute Fund equity security trades on behalf of the Manager. The Manager may also seek quantitative support from MIMGL. Although the AffiliatedSub-Advisors serve assub-advisors, DMC has ultimate responsibility for all investment advisory services. For these services, DMC, not the Fund, may pay each AffiliatedSub-Advisor a portion of its investment management fee.
Delaware Investments Fund Services Company (DIFSC), an affiliate of DMC provides fund accounting and financial administrative oversight services to the Fund. For these services, DIFSC’s fees are calculated daily and paid monthly based on the aggregate daily net assets (excluding the line of credit liability) of all funds within the Delaware Funds at the following annual rates: 0.00475% of the first $35 billion; 0.0040% of the next $10 billion; and 0.0025% of aggregate average daily net assets in excess of $45 billion (Total Fee). Each fund in the Delaware Funds pays a minimum of $4,000, which, in aggregate, is subtracted from the Total Fee. Each fund then pays its portion of the remainder of the Total Fee on a relative NAV basis. This amount is included on the “Statement of operations” under “Accounting and administration expenses.” For the year ended Nov. 30, 2019, the Fund was charged $8,405 for these services.
As provided in the investment management agreement, the Fund bears a portion of the cost of certain resources shared with DMC, including the cost of internal personnel of DMC and/or its affiliates that provide legal, tax, and regulatory reporting services to the Fund. This amount is included on the “Statement of operations” under “Legal fees.” For the year ended Nov. 30, 2019, the Fund was charged $68,290 for internal legal, tax, and regulatory reporting services provided by DMC and/or its affiliates’ employees.
Directors’ fees include expenses accrued by the Fund for each Director’s retainer and meeting fees. Certain officers of DMC and DIFSC are officers and/or Directors of the Fund. These officers and Directors are paid no compensation by the Fund.
In addition to the management fees and other expenses of the Fund, the Fund indirectly bears the investment management fees and other expenses of the investment companies (Underlying Funds) in which it invests. The amount of these fees and expenses incurred indirectly by the Fund will vary based upon the expense and fee levels of the Underlying Funds and the amount of shares that are owned of the Underlying Funds at different times.
3. Investments
For the year ended Nov. 30, 2019, the Fund made purchases and sales of investment securities other than short-term investments as follows:
| | | | |
Purchases | | $ | 60,238,441 | |
Sales | | | 67,622,029 | |
The tax cost of investments includes adjustments to net unrealized appreciation (depreciation) which may not necessarily be final tax cost basis adjustments, but approximate the tax basis unrealized gains and losses that may be realized and distributed to shareholders. At Nov. 30, 2019, the cost and unrealized appreciation (depreciation) of investments for federal income tax purposes for the Fund were as follows:
| | | | |
Cost of investments | | $ | 102,560,245 | |
| | | | |
Aggregate unrealized appreciation of investments | | $ | 22,181,141 | |
Aggregate unrealized depreciation of investments | | | (3,047,997 | ) |
| | | | |
Net unrealized appreciation of investments | | $ | 19,133,144 | |
| | | | |
US GAAP defines fair value as the price that the Fund would receive to sell an asset or pay to transfer a liability in an orderly transaction between market participants at the measurement date under current market conditions. A three-level hierarchy for fair value measurements has been established based upon the transparency of inputs to the valuation of an asset or liability. Inputs may be observable or unobservable and refer broadly to the assumptions that market participants would use in pricing the asset or liability. Observable inputs reflect the assumptions market participants would use in pricing the asset or liability based on market data obtained from sources independent of the reporting entity. Unobservable inputs reflect the reporting entity’s own assumptions about the assumptions that market participants would use in pricing the asset or liability based on the best information available under the circumstances. The Fund’s investment in its entirety is assigned a level based upon the observability of the inputs which are significant to the overall valuation. The three-level hierarchy of inputs is summarized on the next page.
24
| | | | |
| | |
| Level 1 | | – | | Inputs are quoted prices in active markets for identical investments. (Examples: equity securities,open-end investment companies, futures contracts, and exchange-traded options contracts) |
| | |
| Level 2 | | – | | Other observable inputs, including, but not limited to: quoted prices for similar assets or liabilities in markets that are active, quoted prices for identical or similar assets or liabilities in markets that are not active, inputs other than quoted prices that are observable for the assets or liabilities (such as interest rates, yield curves, volatilities, prepayment speeds, loss severities, credit risks, and default rates) or other market-corroborated inputs. (Examples: debt securities, government securities, swap contracts, foreign currency exchange contracts, foreign securities utilizing international fair value pricing, broker-quoted securities, and fair valued securities) |
| | |
| Level 3 | | – | | Significant unobservable inputs, including the Fund’s own assumptions used to determine the fair value of investments. (Examples: broker-quoted securities and fair valued securities) |
Level 3 investments are valued using significant unobservable inputs. The Fund may also use an income-based valuation approach in which the anticipated future cash flows of the investment are discounted to calculate fair value. Discounts may also be applied due to the nature or duration of any restrictions on the disposition of the investments. Valuations may also be based upon current market prices of securities that are comparable in coupon, rating, maturity, and industry. The derived value of a Level 3 investment may not represent the value which is received upon disposition and this could impact the results of operations.
The following table summarizes the valuation of the Fund’s investments by fair value hierarchy levels as of Nov. 30, 2019:
| | | | | | | | | | | | | | | | | | | | |
Securities | | Level 1 | | Level 2 | | Level 3 | | Total |
Assets: | | | | | | | | | | | | | | | | | | | | |
Common Stock | | | $ | 77,277,329 | | | | $ | — | | | | $ | — | | | | $ | 77,277,329 | |
Convertible Preferred Stock2 | | | | 557,506 | | | | | 347,801 | | | | | — | | | | | 905,307 | |
Corporate Debt1 | | | | — | | | | | 35,284,018 | | | | | — | | | | | 35,284,018 | |
Preferred Stock2 | | | | 171,985 | | | | | 249,307 | | | | | — | | | | | 421,292 | |
Exchange-Traded Fund | | | | 1,622,572 | | | | | — | | | | | — | | | | | 1,622,572 | |
Right | | | | 81 | | | | | — | | | | | — | | | | | 81 | |
Short-Term Investments | | | | 6,182,790 | | | | | — | | | | | — | | | | | 6,182,790 | |
| | | | | | | | | | | | | | | | | | | | |
Total Value of Securities | | | $ | 85,812,263 | | | | $ | 35,881,126 | | | | $ | — | | | | $ | 121,693,389 | |
| | | | | | | | | | | | | | | | | | | | |
1The securities that have been valued at zero on the “Schedule of investments” are considered to be a Level 3 investment in this table.
2Security type is valued across multiple levels. Level 1 investments represent exchange-traded investments and Level 2 investments represent investments with observable inputs or matrix-price investments. The amounts attributed to Level 1 investments and Level 2 investments represent the following percentages of the total value of this security type:
| | | | | | | | | | | | | | | | | | | | |
| | | Level 1 | | | | | | Level 2 | | | | | | Total | |
Convertible Preferred Stock | | | 61.58 | % | | | | | | | 38.42 | % | | | | | | | 100.00 | % |
Preferred Stock | | | 40.82 | % | | | | | | | 59.18 | % | | | | | | | 100.00 | % |
During the year ended Nov. 30, 2019, there were no transfers between Level 1 investments, Level 2 investments, or Level 3 investments that had a significant impact to the Fund. This does not include transfers between Level 1 investments and Level 2 investments due to the Fund utilizing international fair value pricing during the period. In accordance with the fair valuation procedures described in Note 1, international fair value pricing of securities in the Fund occurs when market volatility exceeds an established rolling threshold. If the threshold is exceeded on a given date, then prices of international securities (those that traded on exchanges that close at a different time than the time that the Fund’s NAV is determined) are established using a separate pricing feed from a third party vendor designed to establish a price for each such security as of the time that the Fund’s NAV is determined. Further, international fair value pricing uses other observable market-based inputs in place of the closing exchange price due to the events occurring after the close of the exchange or market on which the investment is principally traded, causing a change in classification between levels. The Fund’s policy is to recognize transfers between levels based on fair value at the beginning of the reporting period.
Notes to financial statements
Delaware Investments® Dividend and Income Fund, Inc.
3. Investments (continued)
A reconciliation of Level 3 investments is presented when the Fund has a significant amount of Level 3 investments at the beginning, interim, or end of the period in relation to the Fund’s net assets. Management has determined not to provide a reconciliation of Level 3 investments as the Level 3 investments were not considered significant to the Fund’s net assets at the beginning, interim, or end of the year. Management has determined not to provide additional disclosure on Level 3 investments since the Level 3 investments are not considered significant to the Fund’s net assets at the end of the year.
4. Dividend and Distribution Information
Income and long-term capital gain distributions are determined in accordance with federal income tax regulations, which may differ from US GAAP. Additionally, distributions from net gains on foreign currency transactions and net short-term gains on sales of investment securities are treated as ordinary income for federal income tax purposes. The tax character of dividends and distributions paid during the years ended Nov. 30, 2019 and 2018 was as follows:
| | | | | | | | |
| | | Year ended | |
| | | 11/30/19 | | | 11/30/18 | |
Ordinary income | | $ | 1,784,345 | | | $ | 2,204,452 | |
Long-term capital gains | | | 6,607,280 | | | | 7,712,503 | |
| | | | | | | | |
Total | | $ | 8,391,625 | | | $ | 9,916,955 | |
| | | | | | | | |
5. Components of Net Assets on a Tax Basis
As of Nov. 30, 2019, the components of net assets on a tax basis were as follows:
| | | | |
Shares of beneficial interest | | $ | 65,099,486 | |
Undistributed long-term capital gains | | | 248,706 | |
Net unrealized appreciation of investments and foreign currencies | | | 19,133,144 | |
| | | | |
Net assets | | $ | 84,481,336 | |
| | | | |
The differences between book basis and tax basis components of net assets are primarily attributable to tax deferral of losses on wash sales, tax treatment of contingent payment on debt instruments, partnership income, trust preferred securities, deemed dividend income, and market discount and premium on debt instruments.
6. Capital Stock
Shares obtained under the Fund’s dividend reinvestment plan are purchased by the Fund’s transfer agent, Computershare, Inc., in the open market. There were no shares issued under the Fund’s dividend reinvestment plan for the years ended Nov. 30, 2019 and 2018.
The Fund’s Board authorized management to implement a new open-market share repurchase program pursuant to which the Fund may purchase up to 10% of the Fund’s shares, from time to time, in open-market transactions, at the discretion of management. The new share repurchase program commenced on Aug. 1, 2017 and has no stated expiration date.
The Fund did not repurchase shares under any share repurchase program during the years ended Nov. 30, 2019 and 2018.
7. Line of Credit
For the year ended Nov. 30, 2019, the Fund borrowed a portion of the money available to it pursuant to a $40,000,000 Amended and Restated Credit Agreement with The Bank of New York Mellon (BNY Mellon) that expired on June 14, 2019. Effective June 14, 2019, the Fund entered into Amendment No. 4 to the Amended and Restated Credit Agreement that is scheduled to terminate on June 12, 2020. Depending on market conditions and amount borrowed, the amount borrowed by the Fund pursuant to the Credit Agreement may be reduced or possibly increased in the future.
At Nov. 30, 2019, the par value of loans outstanding was $35,000,000, at a variable interest rate of 2.45%. The carrying value of the loan approximates fair value. During the year ended Nov. 30, 2019, the average daily balance of loans outstanding was $35,246,575, at a
26
weighted average interest rate of approximately 3.15%. On Dec. 19, 2018, the Fund repaid $5,000,000. Interest on borrowing is based on a variable short-term rate plus an applicable margin. The commitment fee under the Amended and Restated Credit Agreement was computed at a rate of 0.15% per annum on the unused balance. The rate under Amendment No. 4 to the Amended and Restated Credit Agreement is computed at a rate of 0.15% per annum on the unused balance. The loan is collateralized by the Fund’s portfolio.
8. Derivatives
US GAAP requires disclosures that enable investors to understand: (1) how and why an entity uses derivatives; (2) how they are accounted for; and (3) how they affect an entity’s results of operations and financial position.
Foreign Currency Exchange Contracts— The Fund may enter into foreign currency exchange contracts as a way of managing foreign exchange rate risk. The Fund may enter into these contracts to fix the US dollar value of a security that it has agreed to buy or sell for the period between the date the trade was entered into and the date the security is delivered and paid for. The Fund may also use these contracts to hedge the US dollar value of securities it already owns that are denominated in foreign currencies. In addition, the Fund may enter into these contracts to facilitate or expedite the settlement of portfolio transactions. The change in value is recorded as an unrealized gain or loss. When the contract is closed, a realized gain or loss is recorded equal to the difference between the value of the contract at the time it was opened and the value at the time it was closed.
The use of foreign currency exchange contracts does not eliminate fluctuations in the underlying prices of the securities, but does establish a rate of exchange that can be achieved in the future. Although foreign currency exchange contracts limit the risk of loss due to an unfavorable change in the value of the hedged currency, they also limit any potential gain that might result should the value of the currency change favorably. In addition, the Fund could be exposed to risks if the counterparties to the contracts are unable to meet the terms of their contracts. The Fund’s maximum risk of loss from counterparty credit risk is the value of its currency exchanged with the counterparty. The risk is generally mitigated by having a netting arrangement between the Fund and the counterparty and by the posting of collateral by the counterparty to the Fund to cover the Fund’s exposure to the counterparty. No foreign currency exchange contracts were outstanding at Nov. 30, 2019.
During the year ended Nov. 30, 2019, the Fund entered into foreign currency exchange contracts to fix the US dollar value of a security between trade date and settlement date.
During the year ended Nov. 30, 2019, the Fund experienced net realized gains attributable to foreign currency holdings, which are reflected on the “Statement of operations” under “Net realized gain (loss) on foreign currency exchange contracts.”
Options Contracts— The Fund may enter into options contracts in the normal course of pursuing its investment objectives. The Fund may buy or write options contracts for any number of reasons, including without limitation: to manage the Fund’s exposure to changes in securities prices caused by interest rates or market conditions and foreign currencies; to earn income; as an efficient means of adjusting the Fund’s overall exposure to certain markets; to protect the value of portfolio securities; and as a cash management tool. The Fund may buy or write call or put options on securities. When the Fund buys an option, a premium is paid and an asset is recorded and adjusted on a daily basis to reflect the current market value of the options purchased. When the Fund writes an option, a premium is received and a liability is recorded and adjusted on a daily basis to reflect the current market value of the options written. Premiums received from writing options that expire unexercised are treated by the Fund on the expiration date as realized gains. The difference between the premium received and the amount paid on effecting a closing purchase transaction, including brokerage commissions, is treated as realized gain or loss. If a call option is exercised, the premium is added to the proceeds from the sale of the underlying security in determining whether the Fund has a realized gain or loss. If a put option is exercised, the premium reduces the cost basis of the securities purchased by the Fund. The Fund, as writer of an option, bears the market risk of an unfavorable change in the price of the security underlying the written option. When writing options, the Fund is subject to minimal counterparty risk because the counterparty is only obligated to pay premiums and does not bear the market risk of an unfavorable market change. No options contracts were outstanding at Nov. 30, 2019.
During the year ended Nov. 30, 2019, the Fund entered into written option contracts to manage the Fund’s exposure to changes in securities prices caused by interest rates or market conditions.
During the year ended Nov. 30, 2019, the Fund experienced net realized gains attributable to options written, which are reflected on the “Statement of operations” under “Net realized gain (loss) on options written.”
Notes to financial statements
Delaware Investments® Dividend and Income Fund, Inc.
8. Derivatives (continued)
The effect of derivative instruments on the “Statement of operations” for the year ended Nov. 30, 2019 was as follows:
| | | | | | | | | | | | | | | |
| | | Net Realized Gain (Loss) on: |
| | | Foreign
Currency
Exchange
Contracts | | Options
Written | | Total |
Foreign currency exchange contracts | | | $ | (1,177 | ) | | | $ | — | | | | $ | (1,177 | ) |
Equity contracts | | | | — | | | | | 589,991 | | | | | 589,991 | |
| | | | | | | | | | | | | | | |
Total | | | $ | (1,177 | ) | | | $ | 589,991 | | | | $ | 588,814 | |
| | | | | | | | | | | | | | | |
Derivatives Generally. The table below summarizes the average balance of derivative holdings by the Fund during the year ended Nov. 30, 2019:
| | | | | | | | | | |
| | | Long
Derivative
Volume | | Short
Derivative
Volume |
Foreign currency exchange contracts (average cost) | | | $ | 217 | | | | $ | 4,597 | |
Options contracts (average notional value) | | | | — | | | | | 28,874 | |
9. Securities Lending
The Fund, along with other funds in the Delaware Funds, may lend its securities pursuant to a security lending agreement (Lending Agreement) with BNY Mellon. At the time a security is loaned, the borrower must post collateral equal to the required percentage of the market value of the loaned security, including any accrued interest. The required percentage is: (1) 102% with respect to US securities and foreign securities that are denominated and payable in US dollars; and (2) 105% with respect to foreign securities. With respect to each loan, if on any business day, the aggregate market value of securities collateral plus cash collateral held is less than the aggregate market value of the securities which are the subject of such loan, the borrower will be notified to provide additional collateral by the end of the following business day, which, together with the collateral already held, will be not less than the applicable initial collateral requirements for such security loan. If the aggregate market value of securities collateral and cash collateral held with respect to a security loan exceeds the applicable initial collateral requirement, upon request of the borrower, BNY Mellon must return enough collateral to the borrower by the end of the following business day to reduce the value of the remaining collateral to the applicable initial collateral requirement for such security loan. As a result of the foregoing, the value of the collateral held with respect to a loaned security on any particular day, may be more or less than the value of the security on loan. The collateral percentage with respect to the market value of the loaned securities is determined by the security lending agent.
Cash collateral received by the Fund is generally invested in a series of individual separate accounts, each corresponding to a fund. The investment guidelines permit each separate account to hold certain securities that would be considered eligible securities for a money market fund. Cash collateral received is generally invested in government securities; certain obligations issued by government sponsored enterprises; repurchase agreements collateralized by US Treasury securities; obligations issued by the central government of any Organization for Economic Cooperation and Development (OECD) country or its agencies, instrumentalities or establishments; obligations of supranational organizations; commercial paper, notes, bonds and other debt obligations; certificates of deposit, time deposits, and other bank obligations; and asset-backed securities. The Fund can also accept US government securities and letters of credit(non-cash collateral) in connection with securities loans.
In the event of default or bankruptcy by the lending agent, realization and/or retention of the collateral may be subject to legal proceedings. In the event the borrower fails to return loaned securities and the collateral received is insufficient to cover the value of the loaned securities and provided such collateral shortfall is not the result of investment losses, the lending agent has agreed to pay the amount of the shortfall to the Fund or, at the discretion of the lending agent, replace the loaned securities. The Fund continues to record dividends or interest, as applicable, on the securities loaned and is subject to changes in value of the securities loaned that may occur during the term of the loan. The Fund has the right under the Lending Agreement to recover the securities from the borrower on demand. With respect to security loans collateralized bynon-cash collateral, the Fund receives loan premiums paid by the borrower. With respect to security loans collateralized by cash collateral, the
28
earnings from the collateral investments are shared among the Fund, the security lending agent, and the borrower. The Fund records security lending income net of allocations to the security lending agent and the borrower.
The Fund may incur investment losses as a result of investing securities lending collateral. This could occur if an investment in the collateral investment account defaulted or became impaired. Under those circumstances, the value of the Fund’s cash collateral account may be less than the amount the Fund would be required to return to the borrowers of the securities and the Fund would be required to make up for this shortfall.
During the year ended Nov. 30, 2019, the Fund had no securities out on loan.
10. Credit and Market Risk
When interest rates rise, fixed income securities (i.e. debt obligations) generally will decline in value. These declines in value are greater for fixed income securities with longer maturities or durations.
The Fund borrows through its line of credit for purposes of leveraging. Leveraging may result in higher degrees of volatility because the Fund’s NAV could be subject to fluctuations in short-term interest rates and changes in market value of portfolio securities attributable to the leverage. Leverage magnifies the potential for gain and the risk of loss. As a result, a relatively small decline in the value of the underlying investments could result in a relatively large loss. In addition, the leverage through the line of credit is dependent on the credit provider’s ability to fulfill its contractual obligations.
Some countries in which the Fund may invest require governmental approval for the repatriation of investment income, capital, or the proceeds of sales of securities by foreign investors. In addition, if there is deterioration in a country’s balance of payments or for other reasons, a country may impose temporary restrictions on foreign capital remittances abroad.
The securities exchanges of certain foreign markets are substantially smaller, less liquid, and more volatile than the major securities markets in the United States. Consequently, acquisition and disposition of securities by the Fund may be inhibited. In addition, a significant portion of the aggregate market value of equity securities listed on the major securities exchanges in emerging markets is held by a smaller number of investors. This may limit the number of shares available for acquisition or disposition by the Fund.
The Fund invests a portion of its assets in high yield fixed income securities, which are securities rated BB or lower by Standard & Poor’s Financial Services LLC and Ba or lower by Moody’s Investors Service Inc., or similarly rated by another nationally recognized statistical rating organization. Investments in these higher yielding securities are generally accompanied by a greater degree of credit risk than higher rated securities. Additionally, lower rated securities may be more susceptible to adverse economic and competitive industry conditions than investment grade securities.
The Fund invests in certain obligations that may have liquidity protection designed to ensure that the receipt of payments due on the underlying security is timely. Such protection may be provided through guarantees, insurance policies, or letters of credit obtained by the issuer or sponsor through third parties, through various means of structuring the transaction or through a combination of such approaches. The Fund will not pay any additional fees for such credit support, although the existence of credit support may increase the price of a security.
The Fund invests in REITs and is subject to the risks associated with that industry. If the Fund holds real estate directly as a result of defaults or receives rental income directly from real estate holdings, its tax status as a regulated investment company may be jeopardized. There were no direct real estate holdings during the year ended Nov. 30, 2019. The Fund’s REIT holdings are also affected by interest rate changes, particularly if the REITs it holds use floating-rate debt to finance their ongoing operations.
The Fund invests in bank loans and other securities that may subject it to direct indebtedness risk, the risk that the Fund will not receive payment of principal, interest, and other amounts due in connection with these investments and will depend primarily on the financial condition of the borrower. Loans that are fully secured offer the Fund more protection than unsecured loans in the event of nonpayment of scheduled interest or principal, although there is no assurance that the liquidation of collateral from a secured loan would satisfy the corporate borrower’s obligation, or that the collateral can be liquidated. Some loans or claims may be in default at the time of purchase. Certain of the loans and the other direct indebtedness acquired by the Fund may involve revolving credit facilities or other standby financing commitments that obligate the Fund to pay additional cash on a certain date or on demand. These commitments may require the Fund to increase its investment in a company at a time when the Fund might not otherwise decide to do so (including at a time when the company’s financial condition makes it unlikely that such amounts will be repaid). To the extent that the Fund is committed to advance additional funds, it will at all times hold and maintain cash or other high grade debt obligations in an amount sufficient to meet such commitments. When a loan agreement is purchased, the Fund may
Notes to financial statements
Delaware Investments® Dividend and Income Fund, Inc.
10. Credit and Market Risk (continued)
pay an assignment fee. On an ongoing basis, the Fund may receive a commitment fee based on the undrawn portion of the underlying line of credit portion of a loan agreement. Prepayment penalty fees are received upon the prepayment of a loan agreement by a borrower. Prepayment penalty, facility, commitment, consent, and amendment fees are recorded to income as earned or paid.
As the Fund may be required to rely upon another lending institution to collect and pass on to the Fund amounts payable with respect to the loan and to enforce the Fund’s rights under the loan and other direct indebtedness, an insolvency, bankruptcy, or reorganization of the lending institution may delay or prevent the Fund from receiving such amounts. The highly leveraged nature of many loans may make them especially vulnerable to adverse changes in economic or market conditions. Investments in such loans and other direct indebtedness may involve additional risk to the Fund.
The Fund may invest up to 10% of its net assets in illiquid securities, which may include securities with contractual restrictions on resale, securities exempt from registration under Rule 144A promulgated under the Securities Act of 1933, as amended, and other securities which may not be readily marketable. The relative illiquidity of these securities may impair the Fund from disposing of them in a timely manner and at a fair price when it is necessary or desirable to do so. While maintaining oversight, the Board has delegated to DMC, theday-to-day functions of determining whether individual securities are liquid for purposes of the Fund’s limitation on investments in illiquid securities. Securities eligible for resale pursuant to Rule 144A, which are determined to be liquid, are not subject to the Fund’s 10% limit on investments in illiquid securities. Rule 144A securities have been identified on the “Schedule of investments.” Restricted securities are valued pursuant to the security valuation procedures described in Note 1.
11. Contractual Obligations
The Fund enters into contracts in the normal course of business that contain a variety of indemnifications. The Fund’s maximum exposure under these arrangements is unknown. However, the Fund has not had prior claims or losses pursuant to these contracts. Management has reviewed the Fund’s existing contracts and expects the risk of loss to be remote.
12. General Motors Term Loan Litigation
The Fund received notice of a litigation proceeding related to a General Motors Corporation (G.M.) term loan participation previously held by the Fund in 2009. Because it was believed that the Fund was a secured creditor, the Fund received the full principal on the loans in 2009 after the G.M. bankruptcy. However, based upon a US Court of Appeals ruling, the Motors Liquidation Company Avoidance Action Trust sought to recover such amounts arguing that the Fund was an unsecured creditor and, as an unsecured creditor, the Fund should not have received payment in full. Based upon available information related to the litigation and the Fund’s potential exposure, the Fund recorded a contingent liability of $65,058 and an asset of $216,859 based on the potential recoveries by the estate that resulted in a net decrease in the Fund’s NAV to reflect this potential recovery.
During the year, the plaintiff and the term loan lenders, which included the Fund, reached an agreement that resolved the disputes. The parties agreed to terms on a settlement agreement and presented the settlement agreement to the court for approval at a hearing on June 12, 2019. The court approved the settlement documentation and dismissed the case on July 2, 2019. The court’s approval of the settlement and dismissal of the case with prejudice became final on July 16, 2019.
The contingent liability and other asset were removed in connection with the case being settled, which resulted in the Fund recognizing a gain in the amount of the liability reversed.
13. Recent Accounting Pronouncements
In March 2017, the FASB issued an Accounting Standards Update (ASU), ASU2017-08, Receivables — Nonrefundable Fees and Other Costs (Subtopic310-20), Premium Amortization on Purchased Callable Debt Securities which amends the amortization period for certain callable debt securities purchased at a premium, shortening such period to the earliest call date. The ASU2017-08 does not require any accounting change for debt securities held at a discount; the discount continues to be amortized to maturity. The ASU2017-08 is effective for fiscal years, and interim periods within those fiscal years, beginning after Dec. 15, 2018. At this time, management is evaluating the implications of these changes on the financial statements.
30
In August 2018, the FASB issued an ASU2018-13, which changes certain fair value measurement disclosure requirements. The ASU2018-13, in addition to other modifications and additions, removes the requirement to disclose the amount and reasons for transfers between Level 1 and Level 2 of the fair value hierarchy, the policy for the timing of transfers between levels and the valuation process for Level 3 fair value measurements. The ASU2018-13 is effective for fiscal years, and interim periods within those fiscal years, beginning after Dec. 15, 2019. At this time, management is evaluating the implications of these changes on the financial statements.
14. Subsequent Events
Management has determined that no material events or transactions occurred subsequent to Nov. 30, 2019, that would require recognition or disclosure in the Fund’s financial statements.
Report of independent
registered public accounting firm
To the Board of Directors and Shareholders of Delaware Investments® Dividend and Income Fund, Inc.
Opinion on the Financial Statements
We have audited the accompanying statement of assets and liabilities, including the schedule of investments, of Delaware Investments® Dividend and Income Fund, Inc. (the “Fund”) as of November 30, 2019, the related statements of operations and of cash flows for the year ended November 30, 2019, the statement of changes in net assets for each of the two years in the period ended November 30, 2019, including the related notes, and the financial highlights for each of the five years in the period ended November 30, 2019 (collectively referred to as the “financial statements”). In our opinion, the financial statements present fairly, in all material respects, the financial position of the Fund as of November 30, 2019, the results of its operations and its cash flows for the year then ended, the changes in its net assets for each of the two years in the period ended November 30, 2019 and the financial highlights for each of the five years in the period ended November 30, 2019 in conformity with accounting principles generally accepted in the United States of America.
Basis for Opinion
These financial statements are the responsibility of the Fund’s management. Our responsibility is to express an opinion on the Fund’s financial statements based on our audits. We are a public accounting firm registered with the Public Company Accounting Oversight Board (United States) (PCAOB) and are required to be independent with respect to the Fund in accordance with the U.S. federal securities laws and the applicable rules and regulations of the Securities and Exchange Commission and the PCAOB.
We conducted our audits of these financial statements in accordance with the standards of the PCAOB. Those standards require that we plan and perform the audit to obtain reasonable assurance about whether the financial statements are free of material misstatement, whether due to error or fraud.
Our audits included performing procedures to assess the risks of material misstatement of the financial statements, whether due to error or fraud, and performing procedures that respond to those risks. Such procedures included examining, on a test basis, evidence regarding the amounts and disclosures in the financial statements. Our audits also included evaluating the accounting principles used and significant estimates made by management, as well as evaluating the overall presentation of the financial statements. Our procedures included confirmation of securities owned as of November 30, 2019 by correspondence with the custodian, transfer agents and brokers; when replies were not received from brokers, we performed other auditing procedures. We believe that our audits provide a reasonable basis for our opinion.
/s/PricewaterhouseCoopers LLP
Philadelphia, Pennsylvania
January 22, 2020
We have served as the auditor of one or more investment companies in Delaware Funds® by Macquarie since 2010.
32
Other Fund information (Unaudited)
Delaware Investments® Dividend and Income Fund, Inc.
Proxy results
Annual meeting
The Fund held its Annual Meeting of Shareholders (the “Annual Meeting”) on Aug. 21, 2019. At the Annual Meeting, the Fund’s shareholders elected 11 Directors. The results of the voting at the meeting were as follows:
| | | | | | |
Nominee | | Shares Voted For | | Shares Withheld | | No Ballot
Received |
Shawn K. Lytle | | 4,448,473 | | 147,560 | | 3,090,689 |
Jerome D. Abernathy | | 4,443,268 | | 152,765 | | 3,090,689 |
Thomas L. Bennett | | 4,439,554 | | 156,479 | | 3,090,689 |
Ann D. Borowiec | | 4,442,865 | | 153,168 | | 3,090,689 |
Joseph W. Chow | | 4,445,735 | | 150,298 | | 3,090,689 |
John A. Fry | | 4,438,190 | | 157,843 | | 3,090,689 |
Lucinda S. Landreth | | 4,438,105 | | 157,928 | | 3,090,689 |
Francis A. Sevilla-Sacasa | | 4,438,452 | | 157,581 | | 3,090,689 |
Thomas K. Whitford | | 4,443,681 | | 152,352 | | 3,090,689 |
Christianna Wood | | 4,450,108 | | 145,925 | | 3,090,689 |
Janet L. Yeomans | | 4,442,286 | | 153,747 | | 3,090,689 |
At the Annual Meeting, shareholders also voted to approvesub-advisory agreements between Delaware Management Company and each of Macquarie Investment Management Europe Limited, Macquarie Investment Management Global Limited, Macquarie Investment Management Austria Kapitalanlage AG, and Macquarie Funds Management Hong Kong Limited.
The results of the vote on the shareholder proposal were as follows:
Vote on shareholder proposal
| | | | | | | | |
For | | Against | | | Abstain | |
2,706,285 | | | 52,545 | | | | 124,349 | |
Fund management
On Oct. 31, 2018 the Fund announced that D. Tysen Nutt Jr., senior portfolio manager and team leader for Delaware Management Company’sLarge-Cap Value team, would retire on July 15, 2019. The Fund also announced that Nikhil G. Lalvani, CFA would succeed Mr. Nutt as theLarge-Cap Value team leader, effective as of the same date. Listed below are the biographies for each member of the portfolio management team.
Babak “Bob” Zenouzi*
Managing Director, Chief Investment Officer — Real Estate Securities and Income Solutions (RESIS)
Bob Zenouzi is the lead manager for the real estate securities and income solutions (RESIS) group at Macquarie Investment Management (MIM). Zenouzi created this team, including its process and its institutional and retail products, during his prior time with the firm. He also focuses on opportunities in Japan, Singapore, and Malaysia for the firm’s global real estate securities strategy. He is also a member of the firm’s asset allocation committee, which is responsible for building and managing multi-asset class portfolios. He rejoined the firm in May 2006 as senior portfolio manager and head of real estate securities. In his first term with the firm, he spent seven years as an analyst and portfolio manager, leaving in 1999 to work at Chartwell Investment Partners, where from 1999 to 2006 he was a partner and senior portfolio manager on Chartwell’sSmall-Cap Value portfolio. He began his career with The Boston Company, where he held several positions in accounting and financial analysis. Zenouzi earned a master’s degree in finance from Boston College and a bachelor’s degree in finance from Babson College. He is a member of the National Association of Real Estate Investment Trusts and the Urban Land Institute.
Mr. Zenouzi has been aco-portfolio manager of the Fund since May 2006.
*Lead portfolio manager.
Other Fund information (Unaudited)
Delaware Investments® Dividend and Income Fund, Inc.
Fund management (continued)
Damon J. Andres, CFA*
Senior Vice President, Senior Portfolio Manager
Damon J. Andres joined Macquarie Investment Management (MIM) in 1994 as an analyst, and is currently a senior portfolio manager for the firm’s real estate securities and income solutions (RESIS) group. From 1991 to 1994, he performed investment-consulting services as a consulting associate with Cambridge Associates. Andres earned a bachelor’s degree in business administration with an emphasis in finance and accounting from the University of Richmond.
Mr. Andres has been aco-portfolio manager of the Fund since January 2001.
Wayne A. Anglace, CFA
Managing Director, Senior Portfolio Manager
Wayne A. Anglace currently serves as a senior portfolio manager for the firm’s corporate and convertible bond strategies. Prior to joining Macquarie Investment Management (MIM) in March 2007 as a research analyst for the firm’s high grade, high yield, and convertible bond portfolios, he spent more than two years as a research analyst at Gartmore Global Investments for its convertible bond strategy. From 2000 to 2004, Anglace worked in private client research at Deutsche Bank Alex. Brown in Baltimore, where he focused on equity research, and he started his financial services career with Ashbridge Investment Management in 1999. Prior to moving to the financial industry, Anglace worked as a professional civil engineer. He earned his bachelor’s degree in civil engineering from Villanova University and an MBA with a concentration in finance from Saint Joseph’s University, and he is a member of the CFA Society of Philadelphia.
Mr. Anglace has been aco-portfolio manager of the Fund since March 2010.
Kristen E. Bartholdson
Managing Director, Senior Portfolio Manager
Kristen E. Bartholdson is a senior portfolio manager for the firm’s US Large Cap Value Equity team. Prior to joining Macquarie Investment Management (MIM) in 2006 as an associate portfolio manager, she worked at Susquehanna International Group from 2004 to 2006, where she was an equity research salesperson. From 2000 to 2004, she worked in equity research at Credit Suisse, most recently as an associate analyst in investment strategy. Bartholdson earned her bachelor’s degree in economics from Princeton University.
Ms. Bartholdson has been aco-portfolio manager of the Fund since December 2008.
Adam H. Brown, CFA
Managing Director, Senior Portfolio Manager
Adam H. Brown is a senior portfolio manager for the firm’s high yield strategies. He manages the bank loan portfolios and is aco-portfolio manager for the high yield, fixed rate multisector, and core plus strategies. Brown joined Macquarie Investment Management (MIM) in April 2011 as part of the firm’s integration of Macquarie Four Corners Capital Management, where he had worked since 2002. At Four Corners, he was aco-portfolio manager on the firm’s collateralized loan obligations (CLOs) and a senior research analyst supporting noninvestment grade portfolios. Before that, Brown was with the predecessor of Wells Fargo Securities, where he worked in the leveraged finance group arranging senior secured bank loans and high yield bond financings for financial sponsors and corporate issuers. He earned a bachelor’s degree in accounting from the University of Florida and an MBA from the A.B. Freeman School of Business at Tulane University.
Mr. Brown has been aco-portfolio manager of the Fund since July 2016.
*Lead portfolio manager.
34
Craig C. Dembek, CFA
Senior Managing Director, Head of Credit Research
Craig C. Dembek is head of credit research and a senior research analyst on the firm’s taxable fixed income team with primary responsibility for banks, brokers, and real estate investment trusts (REITs). He rejoined Macquarie Investment Management (MIM) in March 2007. During his previous time at the firm, from April 1999 to January 2001, he was a senior investment grade credit analyst. Most recently, he spent four years at Chartwell Investment Partners as a senior fixed income analyst and Turner Investment Partners as a senior fixed income analyst and portfolio manager. Dembek also spent two years at Stein, Roe & Farnham as a senior fixed income analyst. Earlier in his career, he worked for two years as a lead bank analyst at the Federal Reserve Bank of Boston. Dembek earned a bachelor’s degree in finance from Michigan State University and an MBA with a concentration in finance from the University of Vermont.
Mr. Dembek has been aco-portfolio manager of the Fund since December 2012.
Roger A. Early, CPA, CFA
Senior Managing Director, Chief Investment Officer – US Fixed Income
Roger A. Early is chief investment officer of the US fixed income business. He rejoined Macquarie Investment Management (MIM) in March 2007 as a member of the firm’s taxable fixed income portfolio management team, with primary responsibility for portfolio construction and strategic asset allocation. He became head of fixed income investments in the Americas in February 2015. During his previous time at the firm, from 1994 to 2001, he was a senior portfolio manager in the same area, and he left the firm as head of its US investment grade fixed income group. In recent years, Early was a senior portfolio manager at Chartwell Investment Partners and Rittenhouse Financial and was the chief investment officer for fixed income at Turner Investments. Prior to joining the firm in 1994, he worked for more than 10 years at Federated Investors where he managed more than $25 billion in mutual fund and institutional portfolios in the short-term and investment grade markets. He left the firm as head of institutional fixed income management. Earlier in his career, he held management positions with the Federal Reserve Bank, PNC Financial, Touche Ross, and Rockwell International. Early earned his bachelor’s degree in economics from The Wharton School of the University of Pennsylvania and an MBA with concentrations in finance and accounting from the University of Pittsburgh. He is a member of the CFA Society of Philadelphia.
Mr. Early has been aco-portfolio manager of the Fund since January 2008.
Nikhil G. Lalvani, CFA
Managing Director, Senior Portfolio Manager, Team Leader
Nikhil G. Lalvani is a senior portfolio manager for the firm’s US Large Cap Value Equity team and assumed the role of team leader in October 2018. At Macquarie Investment Management (MIM), Lalvani has worked as both a fundamental and quantitative analyst. Prior to joining the firm in 1997 as an account analyst, he was a research associate with Bloomberg. Lalvani holds a bachelor’s degree in finance from The Pennsylvania State University. He is a member of the CFA Institute and the CFA Society of Philadelphia.
Mr. Lalvani has been aco-portfolio manager of the Fund since October 2006.
Paul A. Matlack, CFA
Managing Director, Senior Client Portfolio Manager
Paul A. Matlack is a strategist and senior portfolio manager for the firm’s fixed income team. Matlack rejoined the firm in May 2010. During his previous time at Macquarie Investment Management from September 1989 to October 2000, he was senior credit analyst, senior portfolio manager, and left the firm asco-head of the high yield group. Most recently, he worked at Chartwell Investment Partners from September 2003 to April 2010 as senior portfolio manager in fixed income, where he managed core, core plus, and high yield strategies. Prior to that, Matlack held senior roles at Turner Investment Partners, PNC Bank, and Mellon Bank. He earned a bachelor’s degree in international relations from the University of Pennsylvania and an MBA with a concentration in finance from George Washington University.
Mr. Matlack has been aco-portfolio manager of the Fund since December 2012.
Other Fund information (Unaudited)
Delaware Investments® Dividend and Income Fund, Inc.
Fund management (continued)
John P. McCarthy, CFA
Managing Director, Senior Portfolio Manager
John P. McCarthy is a senior portfolio manager for the firm’s high yield strategies, a role he assumed in July 2016. From December 2012 to June 2016, he wasco-head of credit research on the firm’s taxable fixed income team. McCarthy rejoined Macquarie Investment Management (MIM) in March 2007 as a senior research analyst, after he worked in the firm’s fixed income area from 1990 to 2000 as a senior high yield analyst and high yield trader, and from 2001 to 2002 as a municipal bond trader. Prior to rejoining the firm, he was a senior high yield analyst/ trader at Chartwell Investment Partners. McCarthy earned a bachelor’s degree in business administration from Babson College, and he is a member of the CFA Society of Philadelphia.
Mr. McCarthy has been aco-portfolio manager of the Fund since December 2012.
Robert A. Vogel Jr., CFA
Managing Director, Senior Portfolio Manager
Robert A. Vogel Jr. is a senior portfolio manager for the firm’s US Large Cap Value Equity team. Prior to joining Macquarie Investment Management (MIM) in 2004 as vice president and senior portfolio manager, he worked at Merrill Lynch Investment Managers for more than seven years, where he rose to the position of director and portfolio manager within the US ActiveLarge-Cap Value team. He began his career in 1992 as a financial consultant at Merrill Lynch. Vogel graduated from Loyola University Maryland, earning both bachelor’s and master’s degrees in finance. He also earned an MBA with a concentration in finance from The Wharton School of the University of Pennsylvania. Vogel is a member of the CFA Society New York, the CFA Institute, and the CFA Society of Philadelphia.
Mr. Vogel has been aco-portfolio manager of the Fund since March 2005.
Dividend reinvestment plan
The Fund offers an automatic dividend reinvestment program (“Plan”). Shareholders who have shares registered in their own names are automatically considered participants in the Plan, unless they elect to withdraw from the Plan. Shareholders who hold their shares through a bank, broker, or other nominee should request the bank, broker, or nominee to participate in the Plan on their behalf. This can be done as long as the bank, broker, or nominee provides a dividend reinvestment service for the Fund. If the bank, broker, or nominee does not provide this service, such shareholders must have their shares taken out of “street” or nominee name andre-registered in their own name in order to participate in the Plan.
Computershare Trust Company, N.A. (“Computershare”) will apply all cash dividends, capital gains and other distributions (collectively, “Distributions”) on the Fund’s shares of common stock which become payable to each Plan participant to the purchase of outstanding shares of the Fund’s common stock for such participant. These purchases may be made on a securities exchange or in theover-the-counter market, and may be subject to such terms of price, delivery, and related matters to which Computershare may agree. The Fund will not issue new shares in connection with the Plan.
Distributions reinvested for participants are subject to income taxes just as if they had been paid directly to the shareholder in cash. Participants will receive ayear-end statement showing distributions reinvested, and any brokerage commissions paid on such participant’s behalf.
Shareholders holding shares of the Fund in their own names who wish to terminate their participation in the Plan may do so by sending written instruction to Computershare so that Computershare receives such instructions by the Distribution record date. Shareholders with shares held in account by a bank, broker, or other nominee should contact such bank, broker, or other nominee to determine the procedure for withdrawal from the Plan.
If written instructions are not received by Computershare by the record date for a particular Distribution, that Distribution may be reinvested at the sole discretion of Computershare. After a shareholder’s instructions to terminate participation in the Plan become effective, Distributions will be paid to shareholders in cash. Upon termination, a shareholder may elect to receive either stock or cash for all the full shares in the account. If cash is elected, Computershare will sell such shares at the weighted average sale price obtained by Computershare’s broker for all shares sold on such batch on the applicable trade date or dates and then send the net proceeds to the shareholder, after deducting any applicable
36
transaction fees, per share fees, and related expenses. Any fractional shares at the time of termination will be paid in cash at the current market price, less any applicable transaction fees, per share fees, and related expenses, if any. Shareholders may at any time request a full or partial withdrawal of shares from the Plan, without terminating participation in the Plan. When shares outside of the Plan are liquidated, Distributions on shares held under the Plan will continue to be reinvested unless Computershare is notified of the shareholder’s withdrawal from the Plan.
An investor holding shares that participate in the Plan in a brokerage account may not be able to transfer the shares to another broker and continue to participate in the Plan. Please contact your broker/dealer for additional details.
Computershare will charge participants their proportional share of the per share fees on market purchases. Participants may obtain a certificate or certificates for all or part of the full shares credited to their accounts at any time by making a request in writing to Computershare. A fee may be charged to the participant for each certificate issuance.
If you have any questions and shares are registered in your name, contact Computershare at 866437-0252 or P.O. Box 505000,
Louisville, KY 40233-5000. If you have any questions and shares are registered in “street” name, contact the broker/dealer holding the shares or your financial advisor.
Effective Aug. 1, 2008, the Dividend Reinvestment Plan may be amended by the Fund upon 20 days written notice to the Plan’s participants.
Other Fund information (Unaudited)
Delaware Investments® Dividend and Income Fund, Inc.
Section 19(a) notices
The following table sets forth the estimated amount of the sources of distribution for purposes of Section 19 of the 1940 Act, as amended, and the related rules adopted thereunder. The Fund estimates the following percentages, of the total distribution amount per share, attributable to (i) net investment income, (ii) net realized short-term capital gain, (iii) net realized long-term capital gain, and (iv) return of capital or other capital source. These percentages are disclosed for the fiscalyear-to-date cumulative distribution amount per share for the Fund.
The amounts and sources of distributions reported in these 19(a) notices are only estimates and not being provided for tax reporting purposes. The actual amounts and sources of the amounts for tax reporting purposes will depend upon the Fund’s investment experience during the remainder of its fiscal year and may be subject to changes based on tax regulations. Shareholders will receive a Form1099-DIV for the calendar year that will tell you how to report these distributions for federal income tax purposes.
| | | | | | | | |
| Total Cumulative Distributions for the year ended November 30, 2019 |
| | | Net Realized | | Net Realized | | | | Total Per |
| | | Short-Term | | Long-Term | | Return of | | Common |
| Net Investment Income | | Capital Gains | | Capital Gains | | Capital | | Share |
$0.2564 | | $0.0000 | | $0.7643 | | $0.0708 | | $1.0915 |
| | | | | | | | |
| Percentage Breakdown of the Total Cumulative Distributions for the year ended November 30, 2019 |
| | | Net Realized | | Net Realized | | | | Total Per |
| | | Short-Term | | Long-Term | | Return of | | Common |
| Net Investment Income | | Capital Gains | | Capital Gains | | Capital | | Share |
23.50% | | — | | 70.00% | | 6.50% | | 100.00% |
Shareholders should not draw any conclusions about the Fund’s investment performance from the amount of these distributions or from the terms of the Fund’s managed distribution policy. The Fund estimates (as of the date hereof) that it has distributed more than its income and net realized capital gains for the current fiscal year; therefore, a portion of your distribution may be a return of capital. A return of capital may occur for example, when some or all of the money that you invested in the Fund is paid back to you. A return of capital distribution does not necessarily reflect the Fund’s investment performance and should not be confused with “yield” or “income.” The Fund’s managed distribution policy is described in more detail on the inside front cover of this report.
Presented below are return figures, based on the change in the Fund’s net asset value per share (“NAV”), compared to the annualized distribution rate as a percentage of the NAV as of Nov. 30, 2019.
Fund Performance and Distribution Information
| | | | |
Fiscal Year (12/1/18 through 11/30/19) | | | | |
Annualized Distribution Rate as a Percentage of NAV^ | | | 9.95 | % |
Cumulative Distribution Rate on NAV^^ | | | 9.93 | % |
Cumulative Total Return on NAV* for fiscal year ended 11/30/19 | | | 7.51 | % |
| |
Average Annual Total Return on NAV for the5-Year Period Ending 11/30/19** | | | 7.34 | % |
^ Based on the Fund’s December 2019 distribution as a percentage of the Fund’s NAV as of Nov. 30, 2019.
^^ Cumulative distribution rate is the cumulative amount of distributions paid during the Fund’s fiscal year ending Nov. 30, 2019 based on the Fund’s NAV as of Nov. 30, 2019.
*Cumulative total return is based on the change in NAV including distributions paid and assuming reinvestment of these distributions for the period Dec. 1, 2018 through Nov. 30, 2019.
38
**The5-year average annual total return is based on change in NAV including distributions paid and assuming reinvestment of these distributions and is through the last business day of the month prior to the month of the current distribution record date.
While the NAV performance may be indicative of the Fund’s investment performance, it does not measure the value of a shareholder’s investment in the Fund. The value of a shareholder’s investment in the Fund is determined by the Fund’s market price, which is based on the supply and demand for the Fund’s shares in the open market.
Tax information
The information set forth below is for the Fund’s fiscal year as required by federal income tax laws. Shareholders, however, must report distributions on a calendar year basis for income tax purposes, which may include distributions for portions of two fiscal years of the Fund. Accordingly, the information needed by shareholders for income tax purposes will be sent to them in January of each year. Please consult your tax advisor for proper treatment of this information.
All disclosures are based on financial information available as of the date of this annual report and, accordingly are subject to change. For any and all items requiring reporting, it is the intention of the Fund to report the maximum amount permitted under the Internal Revenue Code and the regulations thereunder.
For the fiscal year ended Nov. 30, 2019, the Fund reports distributions paid during the year as follows:
| | | | | | | | | | | | | | |
| (A) | | | (B) | | | | | | | |
| Long-Term | | | Ordinary | | | | | | | |
| Capital Gain | | | Income | | | | | | (C) | |
| Distributions | | | Distributions | | | Total | | | Qualifying | |
(Tax Basis) | | | (Tax Basis)* | | | Distributions | | | Dividends1 | |
| | 78.74% | | | | 21.26% | | | | 100.00% | | | | 96.61% | |
(A) and (B) are based on a percentage of the Fund’s total distributions.
(C) is based on a percentage of the Fund’s ordinary income distributions.
1Qualifying dividends represent dividends which qualify for the corporate dividends received deduction.
*For the fiscal year ended Nov. 30, 2019, certain dividends paid by the Fund may be subject to a maximum tax rate of 20%. The percentage of dividends paid by the Fund from ordinary income reported as qualified dividend income is 99.01%. Complete information will be computed and reported in conjunction with your 2019 Form1099-DIV.
Board consideration of Investment Advisory andSub-Advisory agreements for Delaware Investments Dividend and Income Fund, Inc. at a meeting held August21-22, 2019
At a meeting held on Aug.21-22, 2019 (the “Annual Meeting”), the Board of Directors (the “Board”), including a majority of disinterested or independent Directors, approved the renewal of the Investment Advisory andSub-Advisory Agreements for Delaware Investments Dividend and Income Fund, Inc. (the “Fund”). In making its decision, the Board considered information furnished at regular quarterly Board meetings, including reports detailing Fund performance, investment strategies, and expenses, as well as information prepared specifically in connection with the renewal of the investment advisory andsub-advisory contracts. Information furnished specifically in connection with the renewal of the Investment Management Agreement with Delaware Management Company (“DMC”), a series of Macquarie Investment Management Business Trust (“MIMBT”), and theSub-Advisory Agreements with Macquarie Investment Management Global Limited (“MIMGL”), Macquarie Funds Management Hong Kong Limited (“MFMHK”), and Macquarie Investment Management Europe Limited (“MIMEL”) included materials provided by DMC and its affiliates (collectively, “Macquarie Investment Management”), MIMGL, MFMHK, and MIMEL concerning, among other things, the nature, extent, and quality of services provided to the Fund; the costs of such services to the Fund; economies of scale; and the investment manager’s financial condition and profitability. In addition, in connection with the Annual Meeting, materials were provided to the Trustees in May 2019, including reports provided by Broadridge Financial Solutions (“Broadridge”). The Broadridge reports compared the Fund’s investment performance and expenses with those of other comparable mutual funds. The Independent Directors reviewed and discussed the Broadridge reports with independent legal counsel to the Independent Directors. In addition to the information noted above, the Board also requested and received information regarding DMC’s policy with respect to advisory fee levels and its breakpoint philosophy; the structure of portfolio manager compensation; comparative client fee information; and any constraints or limitations on the availability of securities for
Other Fund information (Unaudited)
Delaware Investments® Dividend and Income Fund, Inc.
Board consideration of Investment Advisory andSub-Advisory agreements for Delaware Investments Dividend and Income Fund, Inc. at a meeting held August21-22, 2019 (continued)
certain investment styles, which had in the past year inhibited, or which were likely in the future to inhibit, the investment manager’s ability to invest fully in accordance with Fund policies.
In considering information relating to the approval of the Fund’s investment advisory andsub-advisory agreements, the Independent Directors received assistance and advice from and met separately with independent legal counsel to the Independent Directors and also received assistance and advice from an experienced and knowledgeable independent fund consultant, JDL Consultants, LLC (“JDL”). Although the Board gave attention to all information furnished, the following discussion identifies, under separate headings, the primary factors taken into account by the Board during its contract renewal considerations.
Nature, extent, and quality of services.The Board considered the services provided by DMC to the Fund and its shareholders. In reviewing the nature, extent, and quality of services, the Board considered reports furnished to it throughout the year, which covered matters such as the relative performance of the Fund; compliance of portfolio managers with the investment policies, strategies, and restrictions for the Fund; compliance by DMC (“Management”) personnel with the Code of Ethics adopted throughout the Delaware Funds® by Macquarie (“Delaware Funds”); and adherence to fair value pricing procedures as established by the Board. The Board was pleased with the current staffing of DMC and the emphasis placed on research in the investment process. The Board recognized DMC’s receipt of certain favorable industry distinctions during the past several years. The Board gave favorable consideration to DMC’s efforts to control expenses while maintaining service levels committed to Fund matters. The Board was satisfied with the nature, extent, and quality of the overall services provided by DMC.
Nature, extent, and quality of services.The Board considered the services provided by MIMGL, MFMHK, and MIMEL to the Fund and its shareholders. In reviewing the nature, extent, and quality of services, the Board considered reports furnished to it throughout the year at regular Board Meetings covering matters such as relative performance of the Fund; compliance of portfolio managers with the investment policies, strategies, and restrictions for the Fund, the compliance of MIMGL, MFMHK, and MIMEL personnel with its Code of Ethics; and adherence to fair value pricing procedures as established by the Board. The Board was pleased with the current staffing of MIMGL, MFMHK, and MIMEL and the emphasis placed on research in the investment process. The Board was satisfied with the nature, extent, and quality of the overall services provided by MIMGL, MFMHK, and MIMEL.
Investment performance.The Board placed significant emphasis on the investment performance of the Fund in view of the importance of investment performance to shareholders. Although the Board considered performance reports and discussions with portfolio managers at Board meetings throughout the year, the Board gave particular weight to the Broadridge reports furnished for the Annual Meeting. The Broadridge reports prepared for the Fund showed the investment performance of its shares in comparison to a group of similar funds as selected by Broadridge (the “Performance Universe”). A fund with the highest performance ranked first, and a fund with the lowest ranked last. The highest/best performing 25% of funds in the Performance Universe make up the first quartile; the next 25%, the second quartile; the next 25%, the third quartile; and the lowest/worst performing 25% of funds in the Performance Universe make up the fourth quartile. Comparative annualized performance for the Fund was shown for the past1-,3-,5-, and10-year periods, to the extent applicable, ended Jan. 31, 2019. The Board’s objective is that the Fund’s performance for the1-,3-, and5-year periods be at or above the median of its Performance Universe.
The Performance Universe for the Fund consisted of the Fund and all leveragedclosed-end income and preferred stock funds as selected by Broadridge. The Broadridge report comparison showed that the Fund’s total return for the1-year period was in the third quartile of its Performance Universe. The report further showed that the Fund’s total return for the3-year period was in the first quartile of its Performance Universe and the Fund’s total return for the5- and10-year periods was in the second quartile of its Performance Universe. The Board was satisfied with performance.
Comparative expenses.The Board considered expense data for the Delaware Funds. Management provided the Board with information on pricing levels and fee structures for the Fund as of its most recently completed fiscal year. The Board also focused on the comparative analysis of effective management fees and total expense ratios of the Fund versus effective management fees and expense ratios of a group of similarclosed-end funds as selected by Broadridge (the “Expense Group”). In reviewing comparative costs, the Fund’s contractual management fee and the actual management fee incurred by the Fund were compared with the contractual management fees (assuming all funds in the Expense Group were similar in size to the Fund) and actual management fees (as reported by each fund) within the Expense Group, taking into account
40
any applicable breakpoints and fee waivers. The Fund’s total expenses were also compared with those of its Expense Group. The Board’s objective is for each Fund’s total expense ratio to be competitive with those of the peer funds within its Expense Group.
The expense comparisons for the Fund showed that its actual management fee was in the quartile with the lowest expenses of its Expense Group and its total expenses were in the quartile with the second lowest expenses of its Expense Group. The Board was satisfied with the management fee and total expenses of the Fund in comparison to those of its Expense Group.
Management profitability.The Board considered the level of profits, if any, realized by DMC in connection with the operation of the Fund. In this respect, the Board reviewed the Investment Management Profitability Analysis that addressed the overall profitability of DMC’s business in providing management and other services to each of the individual funds and the Delaware Funds as a whole. Specific attention was given to the methodology used by DMC in allocating costs for the purpose of determining profitability. Management stated that the level of profits of DMC, to a certain extent, reflects recent operational cost savings and efficiencies initiated by DMC. The Board considered DMC’s efforts to improve services provided to Fund shareholders and to meet additional regulatory and compliance requirements resulting from recent industry-wide Securities and Exchange Commission initiatives. The Board also considered the extent to which DMC might derive ancillary benefits from fund operations, including the potential for procuring additional business as a result of the prestige and visibility associated with its role as service provider to the Delaware Funds and the benefits from allocation of fund brokerage to improve trading efficiencies. As part of its work, the Board also reviewed a report prepared by JDL regarding MIMBT profitability as compared to certain peer fund complexes and the Independent Directors discussed with JDL personnel regarding DMC’s profitability in such context. The Board found that the management fees were reasonable in light of the services rendered and the profitability of DMC.
Economies of scale.As aclosed-end fund, the Fund does not issue shares on a continuous basis. Fund assets, therefore, increase primarily as a result of the increase in value of the underlying securities in the Fund. Accordingly, the Board determined that the Fund was not likely to experience significant economies of scale due to asset growth and, therefore, a fee schedule with breakpoints to pass the benefit of economies of scale on to shareholders was not likely to provide the intended effect.
Board of trustees / directors and officers addendum
Delaware Funds® by Macquarie
A fund is governed by a Board of Trustees / Directors (“Trustees”), which has oversight responsibility for the management of a fund’s business affairs. Trustees establish procedures and oversee and review the performance of the investment manager and others who perform services for the fund. The independent fund trustees, in particular, are advocates for shareholder interests. Each trustee has served in that capacity since he or she was elected to or appointed to the Board of Trustees, and will continue to serve until his or her retirement or the election of a new trustee in his or her place. The following is a list of the Trustees and Officers with certain background and related information.
| | | | | | | | | | |
Name, Address, and Birth Date | | Position(s) Held with Fund(s) | | Length of Time
Served | | Principal
Occupation(s)
During the Past Five Years | | Number of
Portfolios in Fund
Complex Overseen
by Trustee or Officer | | Other Directorships Held by Trustee or Officer |
| Interested Trustee |
Shawn K. Lytle1 2005 Market Street Philadelphia, PA 19103 February 1970 | | President, Chief Executive Officer, and Trustee | | President and Chief Executive Officer since August 2015 Trustee since September 2015 | | President — Macquarie Investment Management2 (June2015-Present) Regional Head of Americas — UBS Global Asset Management
(April 2010-May 2015) | | 95 | | Trustee — UBS Relationship Funds, SMA Relationship Trust, and UBS Funds (May 2010–April 2015) |
| Independent Trustees |
Thomas L. Bennett | | Chair and Trustee | | Trustee since | | Private Investor | | 95 | | None |
2005 Market Street | | | | March 2005 | | (March 2004–Present) | | | | |
Philadelphia, PA 19103 | | | | | | | | | | |
October 1947 | | | | | | | | | | |
| | | | | Chair since March 2015 | | | | | | |
Jerome D. Abernathy 2005 Market Street Philadelphia, PA 19103 July 1959 | | Trustee | | Since January 2019 | | Managing Member, Stonebrook Capital Management, LLC (financial technology: macro factors and databases) (January 1993-Present) | | 95 | | None |
Ann D. Borowiec | | Trustee | | Since March 2015 | | Chief Executive Officer, | | 95 | | Director — |
2005 Market Street | | | | | | Private Wealth Management | | | | Banco Santander |
Philadelphia, PA 19103 November 1958 | | | | | | (2011–2013) and Market Manager, | | | | International |
| | | | | | New Jersey Private Bank (2005–2011) — | | | | (October 2016–December |
| | | | | | J.P. Morgan Chase & Co. | | | | 2019) |
| | | | | |
| | | | | | | | | | Director — |
| | | | | | | | | | Santander Bank, N.A. |
| | | | | | | | | | (December |
| | | | | | | | | | | 2016–December 2019) |
Joseph W. Chow | | Trustee | | Since January 2013 | | Private Investor | | 95 | | Director and Audit |
2005 Market Street | | | | | | (April 2011–Present) | | | | Committee |
Philadelphia, PA 19103 | | | | | | | | | | Member — Hercules |
January 1953 | | | | | | | | | | Technology Growth |
| | | | | | | | | | Capital, Inc. |
| | | | | | | | | | (July 2004–July 2014) |
| | | | | | | | | | |
Name, Address, and Birth Date | | Position(s) Held with Fund(s) | | Length of Time
Served | | Principal
Occupation(s)
During the Past Five Years | | Number of
Portfolios in Fund
Complex Overseen
by Trustee or
Officer | | Other Directorships Held by Trustee or Officer |
| Independent Trustees (continued) | | | | | | | | |
John A. Fry 2005 Market Street Philadelphia, PA 19103 May 1960 | | Trustee | | Since January 2001 | | President —
Drexel University (August 2010–Present) President — Franklin & Marshall College (July 2002–June 2010) | | 95 | | Director; Compensation Committee and Governance Committee Member — Community Health Systems (May 2004–Present) |
| | | | | | | | | | Director — Drexel Morgan & Co. (2015–Present) |
| | | | | | | | | | Director and Audit Committee Member — vTv Therapeutics LLC (2017–Present) |
| | | | | | | | | | Director and Audit Committee Member — FS Credit Real Estate Income Trust, Inc. (2018–Present) |
| | | | | | | | | | | Director — Federal Reserve Bank of Philadelphia (January 2020–Present) |
Lucinda S. Landreth 2005 Market Street Philadelphia, PA 19103 June 1947 | | Trustee | | Since March 2005 | | Private Investor
(2004–Present) | | 95 | | None |
Frances A. Sevilla-Sacasa 2005 Market Street Philadelphia, PA 19103 January 1956 | | Trustee | | Since September 2011 | | Private Investor
(January 2017–Present) Chief Executive Officer — Banco Itaú International
(April 2012–December 2016) Executive Advisor to Dean (August 2011–March 2012) and Interim Dean (January 2011–July 2011) — University of Miami School of Business Administration President — U.S. Trust, Bank of America Private Wealth Management (Private Banking)(July 2007-December 2008) | | 95 | | Trust Manager and Audit Committee Chair — Camden Property Trust (August 2011–Present) Director; Strategic Planning and Reserves Committee and Nominating and Governance Committee Member — Callon Petroleum Company (December 2019–Present) Director; Audit Committee Member — Carrizo Oil & Gas, Inc. (March 2018–December 2019) |
Board of trustees / directors and officers addendum
Delaware Funds® by Macquarie
| | | | | | | | | | |
Name, Address, and Birth Date | | Position(s) Held with Fund(s) | | Length of Time
Served | | Principal
Occupation(s)
During the Past Five Years | | Number of
Portfolios in Fund
Complex Overseen
by Trustee
or Officer | | Other Directorships Held by Trustee or Officer |
Thomas K. Whitford 2005 Market Street Philadelphia, PA 19103 March 1956 | | Trustee | | Since January 2013 | | Vice Chairman (2010–April 2013) — PNC Financial Services Group | | 95 | | Director — HSBC North America Holdings Inc. (December 2013–Present) Director — HSBC USA Inc. (July 2014–Present) Director — HSBC Bank USA, National Association (July 2014–March 2017) Director — HSBC Finance Corporation (December 2013–April 2018) |
Christianna Wood 2005 Market Street Philadelphia, PA 19103 August 1959 | | Trustee | | Since January 2019 | | Chief Executive Officer and President — Gore Creek Capital, Ltd. (August 2009–Present) | | 95 | | Director; Finance Committee and Audit Committee Member — H&R Block Corporation (July 2008–Present) Director; Chair of Investments Committee and Audit Committee Member — Grange Insurance (2013–Present) Trustee; Chair of Nominating and Governance Committee and Audit Committee Member — The Merger Fund (2013–Present), The Merger Fund VL (2013–Present); WCM Alternatives: Event-Driven Fund (2013–Present), and WCM Alternatives: Credit Event Fund (December 2017–Present) Director; Chair of Governance Committee and Audit Committee Member — International Securities Exchange (2010–2016) |
44
| | | | | | | | | | |
Name, Address, and Birth Date | | Position(s) Held with Fund(s) | | Length of Time
Served | | Principal
Occupation(s)
During the Past Five Years | | Number of
Portfolios in Fund
Complex Overseen
by Trustee
or Officer | | Other Directorships Held by Trustee or Officer |
Janet L. Yeomans 2005 Market Street Philadelphia, PA 19103 July 1948 | | Trustee | | Since April 1999 | | Vice President and Treasurer (January 2006–July 2012), Vice President — Mergers & Acquisitions (January 2003–January 2006), and Vice President and Treasurer (July 1995–January 2003) — 3M Company | | 95 | | Director; Personnel and Compensation Committee Chair; Member of Nominating, Investments, and Audit Committees for various periods throughout directorship — Okabena Company (2009–2017) |
| Officers | | | | | | | | | | |
David F. Connor 2005 Market Street Philadelphia, PA 19103 December 1963 | | Senior Vice President, General Counsel, and Secretary | | Senior Vice President, since May 2013; General Counsel since May 2015; Secretary since October 2005 | | David F. Connor has served in various capacities at different times at Macquarie Investment Management. | | 95 | | None3 |
Daniel V. Geatens 2005 Market Street Philadelphia, PA 19103 October 1972 | | Vice President and Treasurer | | Vice President and Treasurer since October 2007 | | Daniel V. Geatens has served in various capacities at different times at Macquarie Investment Management. | | 95 | | None3 |
Richard Salus 2005 Market Street Philadelphia, PA 19103 October 1963 | | Senior Vice President and Chief Financial Officer | | Senior Vice President and Chief Financial Officer since November 2006 | | Richard Salus has served in various capacities at different times at Macquarie Investment Management. | | 95 | | None |
| 1 | Shawn K. Lytle is considered to be an “Interested Trustee” because he is an executive officer of the Fund’s(s’) investment advisor. |
| 2 | Macquarie Investment Management is the marketing name for Macquarie Management Holdings, Inc. and its subsidiaries, including the Fund’s investment manager. |
| 3 | David F. Connor and Daniel V. Geatens serve in similar capacities for the six portfolios of the Optimum Fund Trust, which have the same investment advisor as the registrant. Mr. Geatens also serves as the Chief Financial Officer of the Optimum Fund Trust and he is the Chief Financial Officer and Treasurer for Macquarie Global Infrastructure Total Return Fund Inc. |
About the organization
This annual report is for the information of Delaware Investments® Dividend and Income Fund, Inc. shareholders. The figures in this report represent past results that are not a guarantee of future results. The return and principal value of an investment in the Fund will fluctuate so that shares, when sold, may be worth more or less than their original cost.
Notice is hereby given in accordance with Section 23(c) of the Investment Company Act of 1940 that the Fund may, from time to time, purchase shares of its common stock on the open market at market prices. The Fund may purchase up to 10% of its outstanding shares.
Board of directors/trustees
Shawn K. Lytle
President and
Chief Executive Officer
Delaware Funds®by Macquarie
Philadelphia, PA
Thomas L. Bennett
Chairman of the Board
Delaware Funds by Macquarie
Private Investor
Rosemont, PA
Jerome D. Abernathy†
Managing Member
Stonebrook Capital
Management, LLC
Jersey City, NJ
Ann D. Borowiec
Former Chief Executive Officer
Private Wealth Management
J.P. Morgan Chase & Co.
New York, NY
Joseph W. Chow
Former Executive Vice President
State Street Corporation
Boston, MA
John A. Fry†
President
Drexel University
Philadelphia, PA
Lucinda S. Landreth
Former Chief Investment Officer
Assurant, Inc.
New York, NY
Frances A. Sevilla-Sacasa
Former Chief Executive Officer
Banco Itaú International
Miami, FL
Thomas K. Whitford†
Former Vice Chairman
PNC Financial Services Group
Pittsburgh, PA
†Audit committee member
Christianna Wood†
Chief Executive Officer and President
Gore Creek Capital, Ltd.
Golden, CO
Janet L. Yeomans
Former Vice President and Treasurer
3M Company
St. Paul, MN
Affiliated officers
David F. Connor
Senior Vice President,
General Counsel, and Secretary
Delaware Funds by Macquarie
Philadelphia, PA
Daniel V. Geatens
Vice President and Treasurer
Delaware Funds by Macquarie
Philadelphia, PA
Richard Salus
Senior Vice President and
Chief Financial Officer
Delaware Funds by Macquarie
Philadelphia, PA
The Fund files its complete schedule of portfolio holdings with the Securities and Exchange Commission (SEC) for the first and third quarters of each fiscal year on FormN-Q or FormN-PORT (available for filings after March 31, 2019). The Fund’s FormsN-Q or FormsN-PORT, as well as a description of the policies and procedures that the Fund uses to determine how to vote proxies (if any) relating to portfolio securities are available without charge (i) upon request, by calling 866437-0252; and (ii) on the SEC’s website at sec.gov. In addition, a description of the policies and procedures that the Fund uses to determine how to vote proxies (if any) relating to portfolio securities and the Schedule of Investments included in the Fund’s most recent FormN-Q or FormN-PORT are available without charge on the Fund’s website atdelawarefunds.com/closed-end/literature. The Fund’s FormsN-Q and FormsN-PORT may be reviewed and copied at the SEC’s Public Reference Room in Washington, D.C.; information on the operation of the Public Reference Room may be obtained by calling 800SEC-0330.
Information (if any) regarding how the Fund voted proxies relating to portfolio securities during the most recently disclosed12-month period ended June 30 is available without charge (i) through the Fund’s website at delawarefunds.com/proxy; and (ii) on the
SEC’s website at sec.gov.
Investment manager
Delaware Management Company, a series of Macquarie Investment Management Business Trust (MIMBT) Philadelphia, PA
Principal office of the Fund
2005 Market Street
Philadelphia, PA 19103-7094
Independent registered public
accounting firm
PricewaterhouseCoopers LLP
Two Commerce Square
Suite 1800
2001 Market Street
Philadelphia, PA 19103-7042
Registrar and stock transfer agent
Computershare, Inc.
480 Washington Blvd.
Jersey City, NJ 07310
866437-0252
computershare.com/investor
Website
delawarefunds.com/closed-end
Your reinvestment options
Delaware Investments Dividend and
Income Fund, Inc. offers an automatic dividend reinvestment program. If you would like to change your reinvestment option, and shares are registered in your name, contact Computershare, Inc. at 866437-0252. You will be asked to put your request in writing. If you have shares registered in “street” name, contact the broker/dealer holding the shares or your financial advisor.
If you choose to receive your dividends in cash, you may now elect to receive them by ACH transfer. Contact Computershare at the phone number above for more information.
46
Item 2. Code of Ethics
Item 3. Audit Committee Financial Expert
The registrant’s Board of Directors has determined that certain members of the registrant’s Audit Committee are audit committee financial experts, as defined below. For purposes of this item, an “audit committee financial expert” is a person who has the following attributes:
a. An understanding of generally accepted accounting principles and financial statements;
b. The ability to assess the general application of such principles in connection with the accounting for estimates, accruals, and reserves;
c. Experience preparing, auditing, analyzing, or evaluating financial statements that present a breadth and level of complexity of accounting issues that are generally comparable to the breadth and complexity of issues that can reasonably be expected to be raised by the registrant’s financial statements, or experience actively supervising one or more persons engaged in such activities;
d. An understanding of internal controls and procedures for financial reporting; and
e. An understanding of audit committee functions.
An “audit committee financial expert” shall have acquired such attributes through:
a. Education and experience as a principal financial officer, principal accounting officer, controller, public accountant, or auditor or experience in one or more positions that involve the performance of similar functions;
b. Experience actively supervising a principal financial officer, principal accounting officer, controller, public accountant, auditor, or person performing similar functions;
c. Experience overseeing or assessing the performance of companies or public accountants with respect to the preparation, auditing, or evaluation of financial statements; or
d. Other relevant experience.
The registrant’s Board of Directors has also determined that each member of the registrant’s Audit Committee is independent. In order to be “independent” for purposes of this item, the Audit Committee member may not: (i) other than in his or her capacity as a member of the Board of Directors or any committee thereof, accept directly or indirectly any consulting, advisory or other compensatory fee from the issuer; or (ii) be an “interested person” of the registrant as defined in Section 2(a)(19) of the Investment Company Act of 1940.
The names of the audit committee financial experts on the registrant’s Audit Committee are set forth below:
Jerome D. Abernathy
John A. Fry
Thomas K. Whitford, Chair
Christianna Wood
Item 4. Principal Accountant Fees and Services
The aggregate fees billed for services provided to the registrant by its independent auditors for the audit of the registrant’s annual financial statements and for services normally provided by the independent auditors in connection with statutory and regulatory filings or engagements were $37,830 for the fiscal year ended November 30, 2019.
The aggregate fees billed for services provided to the registrant by its independent auditors for the audit of the registrant’s annual financial statements and for services normally provided by the independent auditors in connection with statutory and regulatory filings or engagements were $37,090 for the fiscal year ended November 30, 2018.
The aggregate fees billed by the registrant’s independent auditors for services relating to the performance of the audit of the registrant’s financial statements and not reported under paragraph (a) of this Item were $0 for the fiscal year ended November 30, 2019.
The aggregate fees billed by the registrant’s independent auditors for services relating to the performance of the audit of the registrant’s financial statements and not reported under paragraph (a) of this Item were $0 for the fiscal year ended November 30, 2018.
The aggregate fees billed by the registrant’s independent auditors for tax-related services provided to the registrant’s investment adviser and other service providers under common control with the adviser and that relate directly to the operations or financial reporting of the registrant were $0 for the registrant’s fiscal year ended November 30, 2019.
The aggregate fees billed by the registrant’s independent auditors for tax-related services provided to the registrant’s investment adviser and other service providers under common control with the adviser and that relate directly to the operations or financial reporting of the registrant were $0 for the registrant’s fiscal year ended November 30, 2018.
The aggregate fees billed for all services provided by the independent auditors to the registrant other than those set forth in paragraphs (a), (b) and (c) of this Item were $0 for the fiscal year ended November 30, 2019.
The aggregate fees billed for all services provided by the independent auditors to the registrant other than those set forth in paragraphs (a), (b) and (c) of this Item were $0 for the fiscal year ended November 30, 2018.
Under the Pre-Approval Policy, the Audit Committee has also pre-approved the services set forth in the table below with respect to the registrant’s investment adviser and other entities controlling, controlled by or under common control with the investment adviser that provide ongoing services to the registrant (the “Control Affiliates”) up to the specified fee limit. This fee limit is based on aggregate fees to the investment adviser and its Control Affiliates.
The Pre-Approval Policy requires the registrant’s independent auditors to report to the Audit Committee at each of its regular meetings regarding all services initiated since the last such report was rendered, including those services authorized by the Pre-Approval Policy.
(f) Not applicable.
(g) The aggregate non-audit fees billed by the registrant’s independent auditors for services rendered to the registrant and to its investment adviser and other service providers under common control with the adviser were $4,687,000 and $11,748,000 for the registrant’s fiscal years ended November 30, 2019 and November 30, 2018, respectively.
(h) In connection with its selection of the independent auditors, the registrant’s Audit Committee has considered the independent auditors’ provision of non-audit services to the registrant’s investment adviser and other service providers under common control with the adviser that were not required to be pre-approved pursuant to Rule 2-01(c)(7)(ii) of Regulation S-X. The Audit Committee has determined that the independent auditors’ provision of these services is compatible with maintaining the auditors’ independence.
Item 5. Audit Committee of Listed Registrants
The registrant has a separately-designated standing Audit Committee established in accordance with Section 3(a)(58)(A) of the Securities Exchange Act of 1934. The members of the registrant’s Audit Committee are Jerome D. Abernathy, John A. Fry, Thomas K. Whitford and Christianna Wood.
Item 6. Investments
(a) Included as part of report to shareholders filed under Item 1 of this Form N-CSR.
(b) Divestment of securities in accordance with Section 13(c) of the Investment Company Act of 1940.
Not applicable.
Item 7. Disclosure of Proxy Voting Policies and Procedures for Closed-End Management Investment Companies
The registrant has formally delegated to its investment adviser (the “Adviser”) the responsibility for making all proxy voting decisions in relation to portfolio securities held by the registrant. If and when proxies need to be voted on behalf of the registrant, the Adviser will vote such proxies pursuant to its Proxy Voting Policies and Procedures (the “Procedures”). The Adviser has established a Proxy Voting Committee (the “Committee”), which is responsible for overseeing the Adviser’s proxy voting process for the registrant. One of the main responsibilities of the Committee is to review and approve the Procedures to ensure that the Procedures are designed to allow the Adviser to vote proxies in a manner consistent with the goal of voting in the best interests of the registrant.
In order to facilitate the actual process of voting proxies, the Adviser has contracted with Institutional Shareholder Services Inc. (“ISS”) to analyze proxy statements on behalf of the registrant and other Adviser clients and vote proxies generally in accordance with the Procedures. The Committee is responsible for overseeing ISS’s proxy voting activities. If a proxy has been voted for the registrant, ISS will create a record of the vote. By no later than August 31 of each year, information (if any) regarding how the registrant voted proxies relating to portfolio securities during the most recently disclosed 12-month period ended June 30 is available without charge (i) through the registrant’s website at delawarefunds.com/proxy; and (ii) on the Securities and Exchange Commission’s website at sec.gov.
The Procedures contain a general guideline stating that recommendations of company management on an issue (particularly routine issues) should be given a fair amount of weight in determining how proxy issues should be voted. However, the Adviser will normally vote against management’s position when it runs counter to its specific Proxy Voting Guidelines (the “Guidelines”), and the Adviser will also vote against management’s recommendation when it believes that such position is not in the best interests of the registrant.
As stated above, the Procedures also list specific Guidelines on how to vote proxies on behalf of the registrant. Some examples of the Guidelines are as follows: (i) generally vote for shareholder proposals asking that a majority or more of directors be independent; (ii) generally vote against proposals to require a supermajority shareholder vote; (iii) votes on mergers and acquisitions should be considered on a case-by-case basis; (iv) generally vote against proposals at companies with more than one class of common stock to increase the number of authorized shares of the class that has superior voting rights; (v) generally vote re-incorporation proposals on a case-by-case basis; (vi) votes with respect to equity-based compensation plans are generally determined on a case-by-case basis; and (vii) generally vote for requests for reports on the feasibility of developing renewable energy resources unless the report is duplicative of existing disclosure or irrelevant to the company’s line of business.
Because the registrant has delegated proxy voting to the Adviser, the registrant is not expected to encounter any conflict of interest issues regarding proxy voting and therefore does not have procedures regarding this matter. However, the Adviser does have a section in its Procedures that addresses the possibility of conflicts of interest. Most proxies that the Adviser receives on behalf of the registrant are voted by ISS in accordance with the Procedures. Because almost all of the registrant proxies are voted by ISS pursuant to the predetermined Procedures, it normally will not be necessary for the Adviser to make an actual determination of how to vote a particular proxy, thereby largely eliminating conflicts of interest for the Adviser during the proxy voting process. In the very limited instances where the Adviser is considering voting a proxy contrary to ISS’s recommendation, the Committee will first assess the issue to see if there is any possible conflict of interest involving the Adviser or affiliated persons of the Adviser. If a member of the Committee has actual knowledge of a conflict of interest, the Committee will normally use another independent third party to do additional research on the particular proxy issue in order to make a recommendation to the Committee on how to vote the proxy in the best interests of the registrant. The Committee will then review the proxy voting materials and recommendation provided by ISS and the independent third party to determine how to vote the issue in a manner that the Committee believes is consistent with the Procedures and in the best interests of the registrant.
Item 8. Portfolio Managers of Closed-End Management Investment Companies
The information in the annual report under “Other Fund information – Fund management” is incorporated by reference into this Item 8.
The following chart lists certain information about types of other accounts for which each Fund manager is primarily responsible as of November 30, 2019. Any accounts managed in a personal capacity appear under “Other Accounts” along with the other accounts managed on a professional basis. The personal account information is current as of June 30, 2019.
Individual portfolio managers may perform investment management services for other funds or accounts similar to those provided to the Funds and the investment action for such other fund or account and the Funds may differ. For example, an account or fund may be selling a security, while another account or fund may be purchasing or holding the same security. As a result, transactions executed for one fund or account may adversely affect the value of securities held by another fund, account or the Funds. Additionally, the management of multiple other funds or accounts and the Funds may give rise to potential conflicts of interest, as a portfolio manager must allocate time and effort to multiple other funds or accounts and the Funds. A portfolio manager may discover an investment opportunity that may be suitable for more than one account or fund. The investment opportunity may be limited, however, so that all funds or accounts for which the investment would be suitable may not be able to participate. The Adviser has adopted procedures designed to allocate investments fairly across multiple funds or accounts.
Some of the accounts managed by the portfolio managers have a performance-based fee. This compensation structure presents a potential conflict of interest. The portfolio manager has an incentive to manage this account so as to enhance its performance, to the possible detriment of other accounts for which the investment manager does not receive a performance-based fee.
A portfolio manager’s management of personal accounts also may present certain conflicts of interest. While Delaware’s code of ethics is designed to address these potential conflicts, there is no guarantee that it will do so.
Individual allocations of the bonus pool are based on individual performance measurements, both objective and subjective, as determined by senior management.
Individual allocations of the bonus pool are based on individual performance measurements, both objective and subjective, as determined by senior management.
Each portfolio manager is eligible to receive an annual cash bonus, which is based on quantitative and qualitative factors. There is one pool for bonus payments for the fixed income department. The pool is allotted based on subjective factors and objective factors. The amount of the pool for bonus payments is determined by assets managed (including investment companies, insurance product-related accounts and other separate accounts), management fees and related expenses (including fund waiver expenses) for registered investment companies, pooled vehicles, and managed separate accounts. For investment companies, each manager is compensated according to the Fund’s Broadridge or Morningstar peer group percentile ranking on a 1-, 3-, and 5-year basis, with longer term performance more heavily weighted. For managed separate accounts the portfolio managers are compensated according to the composite percentile ranking against the eVestment Alliance database (or similar sources of relative performance data) on a one-, three-, and five-year basis, with longer term performance more heavily weighted; composite performance relative to the benchmark is also evaluated for the same time periods. Incentives reach maximum potential at the top 25th-30th percentile. The remaining portion of the bonus is discretionary as determined by Macquarie Investment Management and takes into account subjective factors.
For new and recently transitioned portfolio managers, the compensation may be weighted more heavily towards a portfolio manager’s actual contribution and ability to influence performance, rather than longer-term performance. Management intends to move the compensation structure towards longer-term performance for these portfolio managers over time.
Portfolio managers participate in retention programs, including the Macquarie Investment Management Notional Investment Plan and the Macquarie Group Employee Retained Equity Plan, for alignment of interest purposes.
As of November 30, 2019, the portfolio managers did not own any shares of the Fund.
Item 9. Purchases of Equity Securities by Closed-End Management Investment Company and Affiliated Purchasers.
Item 10. Submission of Matters to a Vote of Security Holders
Not applicable.
Item 11. Controls and Procedures
The registrant’s principal executive officer and principal financial officer have evaluated the registrant’s disclosure controls and procedures within 90 days of the filing of this report and have concluded that they are effective in providing reasonable assurance that the information required to be disclosed by the registrant in its reports or statements filed under the Securities Exchange Act of 1934 is recorded, processed, summarized and reported within the time periods specified in the rules and forms of the Securities and Exchange Commission.
There were no significant changes in the registrant’s internal control over financial reporting that occurred during the period covered by the report to stockholders included herein that have materially affected, or are reasonably likely to materially affect, the registrant’s internal control over financial reporting.
Item 12. Disclosure of Securities Lending Activities for Closed-End Management Investment Companies
Not applicable.
Item 13. Exhibits
Not applicable.
(2) Certifications of Principal Executive Officer and Principal Financial Officer pursuant to Rule 30a-2 under the Investment Company Act of 1940 are attached hereto as Exhibit 99.CERT.
(3) Written solicitations to purchase securities pursuant to Rule 23c-1 under the Securities Exchange Act of 1934.
Not applicable.
Pursuant to the requirements of the Securities Exchange Act of 1934 and the Investment Company Act of 1940, the registrant has duly caused this report to be signed on its behalf, by the undersigned, thereunto duly authorized.
Pursuant to the requirements of the Securities Exchange Act of 1934 and the Investment Company Act of 1940, this report has been signed below by the following persons on behalf of the registrant and in the capacities and on the dates indicated.