INVESTMENT ADVISOR NAME CHANGE
Effective January 1, 2011, Nuveen Asset Management, the Funds’ investment adviser, has changed its name to Nuveen Fund Advisors, Inc. (“Nuveen Fund Advisors”). Concurrently, Nuveen Fund Advisors has formed a wholly-owned subsidiary, Nuveen Asset Management, LLC, to house its portfolio management capabilities. Nuveen Asset Management, LLC now serves as the Funds’ sub-adviser, and the Funds’ portfolio managers have become employees of Nuveen Asset Management, LLC rather than Nuveen Fund Advisors. Nuveen Fund Advisors will compensate Nuveen Asset Management, LLC for the portfolio management services it provides to the Funds from the Funds’ management fee, which will not change as a result of this reorganization. Nuveen Fund Advisors and Nuveen Asset Management, LLC retain the right to reallocate investment advisory responsibilities and fees between themselves in the future.
NUVEEN INVESTMENTS COMPLETES STRATEGIC COMBINATION WITH FAF ADVISORS
On January 3, 2011, Nuveen Investments announced the completion of the strategic combination with FAF Advisors and Nuveen Asset Management LLC, the largest investment affiliate of Nuveen Investments. As part of this transaction, U.S. Bancorp–the parent of FAF Advisors—received a 9.5% stake in Nuveen Investments as well as additional cash consideration in exchange for the long term investment business of FAF Advisors, including investment-management responsibilities for the mutual funds of the First American Funds family.
The approximately $27 billion of mutual fund and institutional assets managed by FAF Advisors, along with the investment professionals managing these assets and most other key personnel, have become part of Nuveen Asset Management LLC. With these additions to Nuveen Asset Management LLC, this affiliate now manages more than $100 billion of assets across a broad range of strategies from municipal and taxable fixed income to traditional and specialized equity investments.
This combination does not affect the investment objectives or strategies of the Funds in this report. Over time, Nuveen Investments expects that the combination will provide even more ways to meet the needs of investors who work with financial advisors and consultants by enhancing the multi-boutique model of Nuveen Investments, which also includes highly respected investment teams at Hyde Park, NWQ Investment Management, Santa Barbara Asset Management, Symphony Asset Management, Tradewinds Global Investors and Winslow Capital. Nuveen Investments managed approximately $195 billion of assets as of December 31, 2010.
Chairman’s
Letter to Shareholders
Dear Shareholders,
The global economy recorded another year of recovery from the financial and economic crises of 2008, but many of the factors that caused the crises still weigh on the prospects for continued recovery. In the U.S., ongoing weakness in housing values is putting pressure on homeowners and mortgage lenders. Similarly, the strong earnings recovery for corporations and banks has not been translated into increased hiring or more active lending. Globally, deleveraging by private and public borrowers is inhibiting economic growth and this process is far from complete.
Encouragingly, a variety of constructive actions are being taken by governments around the world to stimulate further recovery. In the U.S., the recent passage of a stimulatory tax bill relieves some of the pressure on the Federal Reserve System to promote economic expansion through quantitative easing and offers the promise of faster economic growth. A number of European governments are undertaking programs that could significantly reduce their budget deficits. Governments across the emerging markets are implementing various steps to deal with global capital flows without undermining international trade and investment.
The success of these government actions could have an important impact on whether 2011 brings further economic recovery and financial market progress. One risk associated with the extraordinary efforts to strengthen U.S. economic growth is that the debt of the U.S. government will continue to grow to unprecedented levels. Another risk is that over time there could be upward pressures on asset values in the U.S. and abroad, because what happens in the U.S. impacts the rest of the world economy. We must hope that the progress made on the fiscal front in 2010 will continue into 2011. In this environment, your Nuveen investment team continues to seek sustainable investment opportunities and to remain alert to potential risks in a recovery still facing many headwinds. On your behalf, we monitor their activities to assure they maintain their investment disciplines.
As you will note elsewhere in this report, on January 1, 2011, Nuveen Investments completed the acquisition of FAF Advisors, Inc., the manager of the First American Funds. The acquisition adds highly respected and distinct investment teams to meet the needs of investors and their advisors and is designed to benefit all fund shareholders by creating a fund organization with the potential for further economies of scale and the ability to draw from even greater talent and expertise to meet these investor needs.
As always, I encourage you to contact your financial consultant if you have any questions about your investment in a Nuveen fund. On behalf of the other members of your Fund Board, we look forward to continuing to earn your trust in the months and years ahead.
Sincerely,
Robert P. Bremner
Chairman of the Board
January 21, 2011
Nuveen Investments 1
Portfolio Managers’ Comments
Nuveen Connecticut Premium Income Municipal Fund (NTC)
Nuveen Connecticut Dividend Advantage Municipal Fund (NFC)
Nuveen Connecticut Dividend Advantage Municipal Fund 2 (NGK)
Nuveen Connecticut Dividend Advantage Municipal Fund 3 (NGO)
Nuveen Massachusetts Premium Income Municipal Fund (NMT)
Nuveen Massachusetts Dividend Advantage Municipal Fund (NMB)
Nuveen Insured Massachusetts Tax-Free Advantage Municipal Fund (NGX)
Nuveen Missouri Premium Income Municipal Fund (NOM)
Recently, portfolio managers Cathryn Steeves and Scott Romans discuss key investment strategies and the six-month performance of these eight Nuveen funds. Cathryn, who joined Nuveen in 1996, has managed the Connecticut and Massachusetts Funds since 2006. Scott, who has been with Nuveen since 2000, assumed portfolio management responsibility for NOM in 2003.
In January 2011, after the close of this reporting period, Michael Hamilton assumed management responsibility for the Connecticut and Massachusetts Funds and Christopher Drahn assumed responsibility for the Missouri Fund. Michael has 18 years and Christopher has 22 years of portfolio management experience.
What key strategies were used to manage these Funds during the six-month reporting period ended November 30, 2010?
During this period, the combination of strong demand and tighter supply of new tax-exempt municipal issuance continued to create favorable conditions. One reason for the decline in new tax-exempt supply was the considerable issuance of taxable municipal debt under the Build America Bond (BAB) program. These bonds, first issued in April 2009, offer municipal issuers a federal subsidy equal to 35% of a security’s interest payments, providing issuers with an alternative to traditional tax-exempt debt. For the six months ended November 30, 2010, taxable Build America Bond issuance totaled $57.5 billion, representing approximately 26% of new bonds in the municipal marketplace nationwide. In Connecticut and Massachusetts during this period, Build America Bonds accounted for 26% of municipa l supply, while in Missouri, 22.5% of municipal bonds were issued as Build America Bonds. This meaningfully impacted tax-exempt supply in all three states, especially Connecticut and Missouri, where total municipal issuance was already lower than in Massachusetts. Since interest payments from Build America Bonds represent taxable income, we do not view these bonds as good investment opportunities for these Funds.
In addition, the severe decline in insured issuance made finding appropriate bonds for the insured NGX Fund more of a challenge. Through November 2010, new insured paper
Certain statements in this report are forward-looking statements. Discussions of specific investments are for illustration only and are not intended as recommendations of individual investments. The forward-looking statements and other views expressed herein are those of the portfolio managers as of the date of this report. Actual future results or occurrences may differ significantly from those anticipated in any forward-looking statements, and the views expressed herein are subject to change at any time, due to numerous market and other factors. The Funds disclaim any obligation to update publicly or revise any forward-looking statements or views expressed herein.
Any reference to credit ratings for portfolio holdings denotes the highest rating assigned by a Nationally Recognized Statistical Rating Organization (NRSRO) such as Standard & Poor’s, Moody’s or Fitch. AAA, AA, A and BBB ratings are investment grade; BB, B, CCC, CC, C and D ratings are below investment grade. Holdings and ratings may change over time.
2 Nuveen Investments
accounted for less than 7% of national issuance, compared with 10% during the first eleven months of 2009 and historical levels of approximately 50%. In Massachusetts, no new insured bonds were issued during 2010, according to our research. Although NGX can invest up to 20% of its net assets in uninsured investment-grade credits rated BBB- or higher, the Fund had already reached that limit prior to this reporting period.
In this environment of constrained tax-exempt municipal bond issuance, we continued to take a bottom-up approach in attempting to discover undervalued sectors and individual credits with the potential to perform well over the long term. For the most part, all of the Funds focused on bonds with coupons of at least 5% and maturities between 20 and 30 years. During this period, the Connecticut Funds found value in health care, including bonds issued for Stamford Hospital and student loan credits. When in-state issues became especially scarce, the Connecticut Funds took advantage of their ability to invest up to 20% of their assets in out-of-state credits, buying Virgin Islands bonds and a New York hospital credit in order to keep the Funds as fully invested as possible. In the uninsured Massa chusetts Funds, our purchases included higher education and port authority bonds, while NGX added insured water and sewer bonds and housing credits purchased in the secondary market and a new insured Guam issue. During this period, NOM found opportunities in the high-yield segment of the health care sector, purchasing bonds in both the primary and secondary markets. These bonds offered attractive yields and helped to replace some of the health care bonds called from our portfolio.
Some of our investment activity resulted from opportunities created by the provisions of the Build America Bond program. For example, tax-exempt supply was more plentiful in the health care and higher education sectors because, as 501(c)(3) (nonprofit) organizations, hospitals and private universities generally did not qualify for the Build America Bond program and continued to issue bonds in the tax-exempt municipal market. Bonds with proceeds earmarked for refundings, working capital, and private activities also were not covered by the Build America Bond program, and this resulted in attractive opportunities in various other sectors of the market.
The impact of the Build America Bond program also was evident in the area of longer-term issuance, as municipal issuers sought to take full advantage of the attractive financing terms offered by these bonds. Approximately 70% of Build America Bonds were issued with maturities of at least 30 years. Even though this significantly reduced the availability of tax-exempt credits with longer maturities, we continued to find good opportunities to purchase longer-term bonds for these Funds. The issuance of Build America Bonds ended on December 31, 2010.
Cash for new purchases during this period was generated primarily by the proceeds from bond calls and maturing bonds, which we worked to redeploy to keep the Funds fully invested. Although NOM sold a modest number of bonds, selling was relatively minimal, as the bonds in our portfolios generally offered higher yields than those available in the current marketplace.
As of November 30, 2010, all eight of these Funds continued to use inverse floating rate securities.1 We employ inverse floaters as a form of leverage for a variety of reasons, including duration management, income enhancement and total return enhancement.
| 1 | An inverse floating rate security, also known as an inverse floater, is a financial instrument designed to pay long-term interest at a rate that varies inversely with a short-term interest rate index. For the Nuveen Funds, the index typically used is the Securities Industry and Financial Markets Association (SIFMA) Municipal Swap Index. Inverse floaters, including those inverse floating rate securities in which the Funds invested during this reporting period, are further defined within the Notes to Financial Statements and Glossary of Terms Used in this Report sections of this report. |
Nuveen Investments 3
How did the Funds perform?
Individual results for these Nuveen Funds, as well as relevant index and peer group information, are presented in the accompanying table.
Average Annual Total Returns on Common Share Net Asset Value*
For periods ended 11/30/10
| Fund | 6-Month | | 1-Year | | 5-Year | | 10-Year |
| Connecticut Funds | | | | | | | |
| NTC | 1.03% | | 6.27% | | 4.64% | | 6.06% |
| NFC | 0.45% | | 4.85% | | 4.83% | | N/A |
| NGK | 0.67% | | 5.03% | | 4.91% | | N/A |
| NGO | 0.80% | | 5.49% | | 4.47% | | N/A |
| | | | | | | | |
Standard & Poor’s (S&P) Connecticut Municipal Bond Index2 | 1.24% | | 3.74% | | 4.42% | | 5.08% |
Standard & Poor’s (S&P) National Municipal Bond Index3 | 1.09% | | 5.06% | | 4.44% | | 5.27% |
Lipper Other States Municipal Debt Funds Average4 | 0.78% | | 6.04% | | 4.23% | | 5.85% |
| | | | | | | | |
| Massachusetts Funds | | | | | | | |
| NMT | 1.27% | | 6.26% | | 4.71% | | 5.85% |
| NMB | 0.74% | | 4.95% | | 4.08% | | N/A |
| | | | | | | | |
Standard & Poor’s (S&P) Massachusetts Municipal Bond Index2 | 1.07% | | 4.13% | | 4.91% | | 5.50% |
Standard & Poor’s (S&P) National Municipal Bond Index3 | 1.09% | | 5.06% | | 4.44% | | 5.27% |
Lipper Other States Municipal Debt Funds Average4 | 0.78% | | 6.04% | | 4.23% | | 5.85% |
| | | | | | | | |
| Missouri Fund | | | | | | | |
| NOM | 1.05% | | 6.71% | | 3.62% | | 5.62% |
| | | | | | | | |
Standard & Poor’s (S&P) Missouri Municipal Bond Index2 | 1.39% | | 5.00% | | 4.51% | | 5.41% |
Standard & Poor’s (S&P) National Municipal Bond Index3 | 1.09% | | 5.06% | | 4.44% | | 5.27% |
Lipper Other States Municipal Debt Funds Average4 | 0.78% | | 6.04% | | 4.23% | | 5.85% |
| | | | | | | | |
| Insured Massachusetts Fund | | | | | | | |
| NGX | 0.68% | | 4.89% | | 4.74% | | N/A |
| | | | | | | | |
Standard & Poor’s (S&P) Massachusetts Municipal Bond Index2 | 1.07% | | 4.13% | | 4.91% | | 5.50% |
Standard & Poor’s (S&P) Insured Municipal Bond Index5 | 0.90% | | 4.84% | | 4.37% | | 5.35% |
Lipper Single-State Insured Municipal Debt Funds Average6 | 0.55% | | 6.36% | | 4.20% | | 5.62% |
For the six months ended November 30, 2010, the cumulative returns on common share net asset value (NAV) for NMT exceeded the return for the Standard & Poor’s (S&P) Massachusetts Municipal Bond Index, while the remaining six non-insured Funds underperformed the return for their respective state’s S&P Municipal Bond Index. NMT also exceeded the return for the Standard & Poor’s (S&P) National Municipal Bond Index, NTC and NOM performed in line with the national index and NFC, NGK, NGO and NMB trailed this index. NTC, NGO, NMT and NOM outperformed the average return for the Lipper Other States Municipal Debt Funds Average, NGK and NMB performed in line
| * | Six-month returns are cumulative; all other returns are annualized. |
| | Past performance is not predictive of future results. Current performance may be higher or lower than the data shown. Returns do not reflect the deduction of taxes that shareholders may have to pay on Fund distributions or upon the sale of Fund shares. |
| | For additional information, see the individual Performance Overview for your Fund in this report. |
| 2 | The Standard & Poor’s (S&P) Municipal Bond Indexes for Connecticut, Massachusetts and Missouri are unleveraged, market value-weighted indexes designed to measure the performance of the tax-exempt, investment-grade municipal bond markets in Connecticut, Massachusetts and Missouri, respectively. These indexes do not reflect any initial or ongoing expenses and are not available for direct investment. |
| 3 | The Standard & Poor’s (S&P) National Municipal Bond Index is an unleveraged, market value-weighted index designed to measure the performance of the tax-exempt, investment-grade U.S. municipal bond market. This index does not reflect any initial or ongoing expenses and is not available for direct investment. |
| 4 | The Lipper Other States Municipal Debt Funds Average is calculated using the returns of all leveraged and unleveraged closed-end funds in this category for each period as follows: 6-month, 46 funds; 1-year, 46 funds; 5-year, 46 funds; and 10-year, 20 funds. Lipper returns account for the effects of management fees and assume reinvestment of dividends, but do not reflect any applicable sales charges. The Lipper average is not available for direct investment. Shareholders should note that the performance of the Lipper Other States category represents the overall average of returns for funds from ten different states with a wide variety of municipal market conditions, making direct comparisons less meaningful. |
| 5 | The Standard & Poor’s (S&P) Insured Municipal Bond Index is a national unlever-aged, market value-weighted index designed to measure the performance of the insured U.S. municipal bond market. This index does not reflect any initial or ongoing expenses and is not available for direct investment. |
| 6 | The Lipper Single-State Insured Municipal Debt Funds Average is calculated using the returns of all closed-end funds in this category for each period as follows: 6-month, 44 funds; 1-year, 44 funds; 5-year, 44 funds; and 10-year, 24 funds. The performance of the Lipper Single-State Insured Municipal Debt Funds Average represents the overall average of returns for funds from eight different states with a wide variety of municipal market conditions. Fund and Lipper returns assume reinvestment of dividends. Lipper returns account for the effects of management fees and assume reinvestment of dividends, but do not reflect any applicable sales charges. The Lipper average is not available for direct investment. |
4 Nuveen Investments
with this Lipper average, while NFC lagged this measure. For the same period, NGX outperformed the Lipper Single-State Insured Municipal Debt Funds Average and underperformed the Standard & Poor’s (S&P) Massachusetts Municipal Bond Index and the national Standard & Poor’s (S&P) Insured Municipal Bond Index. Shareholders should note that the performance of the Lipper Other States Average represents the overall average of returns for funds from ten different states with a wide variety of municipal market conditions, making direct comparisons less meaningful.
Key management factors that influenced the Funds’ returns during this period included duration and yield curve positioning, credit exposure and sector allocation. The use of financial leverage also factored into the Funds’ performance. Leverage is discussed in more detail on page six.
During this period, municipal bonds with intermediate maturities generally outperformed other maturities, with credits at both the shortest and longest ends of the municipal yield curve posting the weakest returns. On the whole, duration and yield curve positioning were net positive contributors to the performance of all of the Funds in this report. NTC, NGK, NGO, NMB and NOM benefited from both their overweighting in the outperforming intermediate-maturity sector and their underexposure to the underperforming long part of the curve. Although NFC, NMT and NGX were underweighted in the intermediate part of the curve, this was offset to some degree by their underexposure to longer bonds, which was positive for their performance.
Credit exposure also played a role in the performance of these Funds. For the period, bonds rated AA generally performed poorly, while those rated BBB or below and non-rated bonds posted stronger returns. All of the non-insured Funds tended to be overweighted in lower-rated and non-rated bonds and underweighted in bonds rated AA, which benefited their performance for this period. In the insured NGX, the Fund’s heavier weighting in non-rated bonds helped to compensate for its underexposure to bonds rated BBB and lower.
Holdings that positively contributed to the Funds’ returns during this period included housing, utilities and health care bonds. In general, all of these Funds were overweighted in the housing and health care sectors relative to the overall municipal market, which was positive for their performance. NMT and NMB, in particular, received a boost from their heavier health care exposure. The positive impact of the housing and health care holdings was offset to a slight degree in all of the Funds by their underweighting of the utilities sector.
In contrast, the education and water and sewer sectors turned in relatively weak performance and zero coupon bonds trailed the municipal market by the widest margin. The transportation sector also failed to keep pace with the municipal market return for the six months. An overexposure to education credits detracted from the performance of the Connecticut and Massachusetts Funds, and NOM was negatively impacted by its holdings in the “other revenue” category, specifically tax increment financing and
Nuveen Investments 5
community redevelopment bonds. All of the Funds were underweighted in transportation, which lessened the negative impact of this sector.
IMPACT OF THE FUNDS’ LEVERAGE STRATEGIES ON PERFORMANCE
One important factor impacting the returns of most of these Funds relative to the comparative indexes was the Funds’ use of financial leverage. The Funds use leverage because their managers believe that, over time, leveraging provides opportunities for additional income and total return for common shareholders. However, use of leverage also can expose common shareholders to additional volatility. For example, as the prices of securities held by a Fund decline, the negative impact of these valuation changes on common share net asset value and common shareholder total return is magnified by the use of leverage. Conversely, leverage may enhance common share returns during periods when the prices of securities held by a Fund generally are rising. Leverage made a positive contribution to the performance of these Funds over this reporting period.
RECENT DEVELOPMENTS REGARDING THE FUNDS’ LEVERAGED CAPITAL STRUCTURE
Shortly after their respective inception, each of the Funds issued auction rate preferred shares (ARPS) to create financial leverage. As noted in past shareholder reports, the ARPS issued by many closed-end funds, including these Funds, have been hampered by a lack of liquidity since February 2008. Since that time, more ARPS have been submitted for sale in each of their regularly scheduled auctions than there have been offers to buy. In fact, offers to buy have been almost completely non-existent since late February 2008. This means that these auctions have “failed to clear,” and that many, or all, of the ARPS shareholders who wanted to sell their shares in these auctions were unable to do so. This lack of liquidity in ARPS did not lower the credit quality of these shares, and ARPS shareholders unable to sell their shares continued to receive distributions at the “maximum rate” applicable to failed auctions, as calculated in accordance with the pre-established terms of the ARPS. In the recent market, with short-term rates at multi-generational lows, those maximum rates also have been low.
One continuing implication for common shareholders from the auction failures is that each Fund’s cost of leverage likely has been incrementally higher at times than it otherwise might have been had the auctions continued to be successful. As a result, each Fund’s common share earnings likely have been incrementally lower at times than they otherwise might have been.
As noted in past shareholder reports, the Nuveen funds’ Board of Directors/Trustees authorized several methods that can be used separately or in combination to refinance a portion of the Nuveen funds’ outstanding ARPS. Some funds have utilized tender option bonds (TOBs), also known as inverse floating rate securities, for leverage purposes. The amount of TOBs that a fund may use varies according to the composition of each fund’s
6 Nuveen Investments
portfolio. Some funds have a greater ability to use TOBs than others. Some funds have issued Variable Rate Demand Preferred (VRDP) Shares, a floating rate form of preferred stock. Some funds have issued MuniFund Term Preferred (MTP) Shares, a fixed rate form of preferred stock with a mandatory redemption period of five years.
While all these efforts have reduced the total amount of outstanding ARPS issued by the Nuveen funds, the funds cannot provide any assurance on when the remaining outstanding ARPS might be redeemed.
During 2010, and as of the time this report was prepared, 33 Nuveen leveraged closed-end funds (excluding all of the Funds included in this report) received a demand letter from a law firm on behalf of purported holders of common shares of each such fund, alleging that Nuveen and the funds’ officers and Board of Directors/ Trustees breached their fiduciary duties related to the redemption at par of the funds’ ARPS. In response, the Board established an ad hoc Demand Committee consisting of certain of its disinterested and independent Board members to investigate the claims. The Demand Committee retained independent counsel to assist it in conducting an extensive investigation. Based upon its investigation, the Demand Committee found that it was not in the best interests of each fund or its shareholders to take the actions suggested in the demand letters, and recommended that the full Board reject the demands made in the demand letters. After reviewing the findings and recommendation of the Demand Committee, the full Board of each fund unanimously adopted the Demand Committee’s recommendation.
Subsequently, 26 of the funds that received demand letters, were named as nominal defendants in a putative shareholder derivative action complaint captioned Safier and Smith v. Nuveen Asset Management, et al. that was filed in the Circuit Court of Cook County, Illinois, Chancery Division (the “Cook County Chancery Court”) on July 27, 2010. Three additional funds were named as nominal defendants in a similar complaint captioned Curbow v. Nuveen Asset Management, et al. filed in the Cook County Chancery Court on August 12, 2010, and three additional funds were named as nominal defendants in a similar complaint captioned Beidler v. Nuveen Asset Management, et al. filed in the Cook County Chancery Court on September 21, 2010 (collectively, the “Complaints”). The Complaints, filed on behalf of purported holders of each fund’s common shares, also name Nuveen Asset Management as a defendant, together with current and former Officers and interested Director/Trustees of each of the funds (together with the nominal defendants, collectively, the “Defendants”). The Complaints contain the same basic allegations contained in the demand letters. The suits seek a declaration that the Defendants have breached their fiduciary duties, an order directing the Defendants not to redeem any ARPS at their liquidation value using fund assets, indeterminate monetary damages in favor of the funds and an award of plaintiffs’ costs and disbursements in pursuing the action. Nuveen Asset Management believes that the Complaints are without merit, and intends to defend vigorously against these charges.
Nuveen Investments 7
As of November 30, 2010, the amount of ARPS redeemed by the Funds are as shown in the accompanying table.
| Fund | | Auction Rate Preferred Shares Redeemed | | % of Original Auction Rate Preferred Shares |
| NTC | | $ | 22,575,000 | | | 58.9 | % |
| NFC | | $ | 19,500,000 | | | 100.0 | % |
| NGK | | $ | 17,500,000 | | | 100.0 | % |
| NGO | | $ | 32,000,000 | | | 100.0 | % |
| NMT | | $ | 19,600,000 | | | 57.7 | % |
| NMB | | $ | 15,000,000 | | | 100.0 | % |
| NGX | | $ | 20,500,000 | | | 100.0 | % |
| NOM | | $ | 16,000,000 | * | | 100.0 | % |
* Includes ARPS noticed for redemption at the end of the reporting period.
MTP
As of November 30, 2010, the following Funds have issued and outstanding MTP Shares, at liquidation value, as shown in the accompanying table.
| Fund | | MTP Shares at Liquidation Value | |
| NTC | | $ | 18,300,000 | |
| NFC | | $ | 20,470,000 | |
| NGK | | $ | 16,950,000 | |
| NGO | | $ | 32,000,000 | |
| NMT | | $ | 20,210,000 | |
| NMB | | $ | 14,725,000 | |
| NGX | | $ | 22,075,000 | |
| NOM | | $ | 17,880,000 | |
During the current reporting period, NOM completed the issuance of $17.9 million of 2.10% Series 2015 MTP. The net proceeds from this offering was used to refinance the Fund’s outstanding ARPS at par. The newly-issued MTP shares trade on the New York Stock Exchange (NYSE) under the symbol “NOM Pr C.” MTP is a fixed-rate form of preferred stock with a mandatory redemption period, in this case, of five years. By issuing MTP, the Fund seeks to take advantage of the current historically low interest rate environment to lock in an attractive federally tax-exempt cost of leverage for a period as long as the term of the MTP. The Fund’s managers believe that issuing MTP may help the Fund mitigate the risk of a significant increase in its cost of leverage should short term i nterest rates rise sharply in the coming years.
8 Nuveen Investments
Subsequent to the reporting period, NTC completed the issuance of $17.78 million of 2.55%, Series 2016 MTP. The newly issued MTP shares trade on the NYSE under the symbol “NTC Pr D.” The net proceeds from this offering were used to refinance the Fund’s remaining outstanding ARPS at par. Immediately following its MTP issuance, NTC noticed for redemption at par its remaining $15.725 million ARPS outstanding using the MTP proceeds.
Subsequent to the reporting period, NMT completed the issuance of $14.94 million of 2.75% Series 2016 MTP. The newly issued MTP shares trade on the NYSE under the symbol “NMT Pr D.” The net proceeds from this offering were used to refinance the Fund’s remaining outstanding ARPS at par.
(Refer to Notes to Financial Statements, Footnote 1 – General Information and Significant Accounting Policies and Footnote 4 – Fund Shares for further details on MTP shares.)
As of November 30, 2010, all 84 of the Nuveen closed-end municipal funds that had issued ARPS have redeemed at par all or a portion of these shares. These redemptions bring the total amount of Nuveen’s municipal closed-end funds’ ARPS redemptions to approximately $5.8 billion of the approximately $11.0 billion originally outstanding.
For up-to-date information, please visit the Nuveen CEF Auction Rate Preferred Resource Center at: http://www.nuveen.com/arps.
Nuveen Investments 9
Common Share Dividend and
Share Price Information
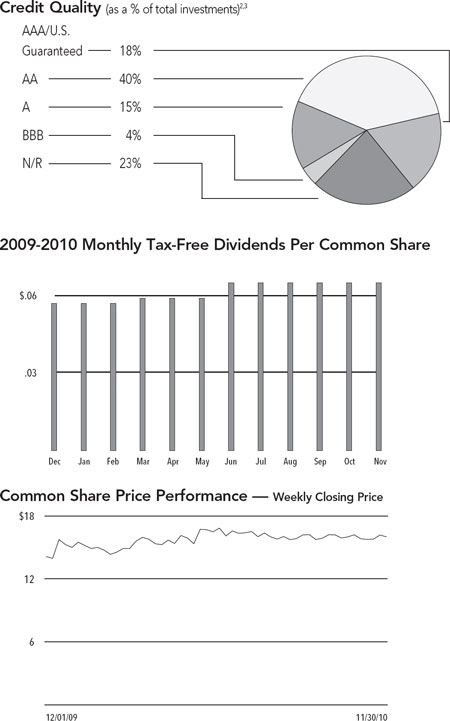
The monthly dividends of all eight Funds in this report remained stable throughout the six-month reporting period ended November 30, 2010. In addition, NOM had a dividend increase that was declared just prior to the start of this reporting period and took effect in June 2010.
All of the Funds in this report seek to pay stable dividends at rates that reflect each Fund’s past results and projected future performance. During certain periods, each Fund may pay dividends at a rate that may be more or less than the amount of net investment income actually earned by the Fund during the period. If a Fund has cumulatively earned more than it has paid in dividends, it holds the excess in reserve as undistributed net investment income (UNII) as part of the Fund’s NAV. Conversely, if a Fund has cumulatively paid dividends in excess of its earnings, the excess constitutes negative UNII that is likewise reflected in the Fund’s NAV. Each Fund will, over time, pay all of its net investment income as dividends to shareholders. As of November 30, 2010, all eigh t of the Funds in this report had positive UNII balances, based upon our best estimates, for tax purposes and positive UNII balances for financial reporting purposes.
COMMON SHARE REPURCHASES AND SHARE PRICE INFORMATION
Since the inception of the Funds’ repurchase program, the Funds have not repurchased any of their outstanding common shares.
10 Nuveen Investments
As of November 30, 2010, the Funds’ common share prices were trading at (+)premiums or (-)discounts to their common share NAVs as shown in the accompanying table.
| Fund | 11/30/10 (+)Premium/(-)Discount | 6-Month Average (+)Premium/(-)Discount |
| NTC | -5.43% | -3.92% |
| NFC | -3.01% | +0.50% |
| NGK | -0.27% | +4.65% |
| NGO | -3.87% | -2.51% |
| NMT | +0.35% | +2.78% |
| NMB | +0.21% | +3.60% |
| NGX | -1.32% | +5.76% |
| NOM | +20.29% | +17.56% |
Nuveen Investments 11
| NTC | | Nuveen Connecticut |
| Performance | | Premium Income |
| OVERVIEW | | Municipal Fund |
as of November 30, 2010
| Fund Snapshot | | | | |
| Common Share Price | | $ | 13.58 | |
| Common Share Net Asset Value (NAV) | | $ | 14.36 | |
| Premium/(Discount) to NAV | | | -5.43 | % |
| Market Yield | | | 5.21 | % |
Taxable-Equivalent Yield1 | | | 7.62 | % |
| Net Assets Applicable to Common Shares ($000) | | $ | 77,025 | |
Average Annual Total Return
(Inception 5/20/93)
| | | On Share Price | | On NAV | |
| 6-Month (Cumulative) | | | -0.11 | % | | 1.03 | % |
| 1-Year | | | 3.28 | % | | 6.27 | % |
| 5-Year | | | 4.03 | % | | 4.64 | % |
| 10-Year | | | 4.80 | % | | 6.06 | % |
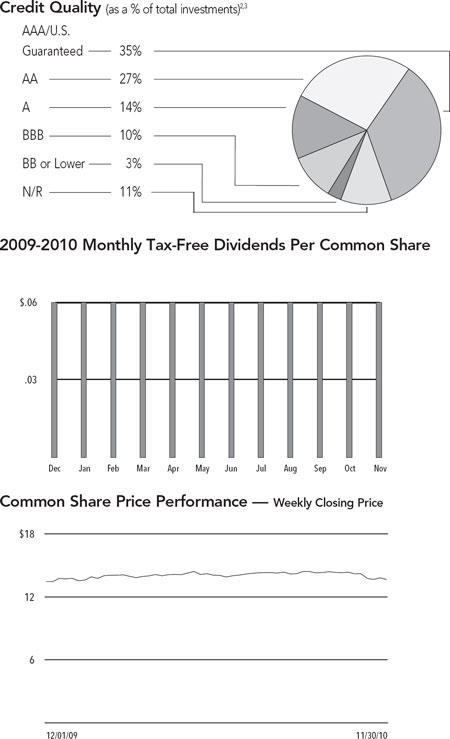
Portfolio Composition4
(as a % of total investments)
| Education and Civic Organizations | 25.9% |
| Tax Obligation/Limited | 14.0% |
| Health Care | 13.3% |
| Tax Obligation/General | 12.4% |
| U.S. Guaranteed | 8.8% |
| Water and Sewer | 8.2% |
| Housing/Single Family | 6.6% |
| Utilities | 5.7% |
| Other | 5.1% |
| | Refer to the Glossary of Terms used in this Report for further definition of the terms used within this Fund’s Performance Overview page. |
| 1 | Taxable-Equivalent Yield represents the yield that must be earned on a fully taxable investment in order to equal the yield of the Fund on an after-tax basis. It is based on a combined federal and state income tax rate of 31.6%. When comparing this Fund to investments that generate qualified dividend income, the Taxable-Equivalent Yield is lower. |
| 2 | Ratings shown are the highest of Standard & Poor’s Group, Moody’s Investor Service, Inc. or Fitch, Inc. AAA includes bonds with an implied AAA rating since they are backed by U.S. Government or agency securities. AAA, AA, A and BBB ratings are investment grade; BB, B, CCC, CC, C and D ratings are below-investment grade. Holdings designated N/R are not rated by any of these national rating agencies. |
| 3 | The Fund paid shareholders capital gains distributions in December 2009 of $0.0041 per share. |
| 4 | Holdings are subject to change. |
12 Nuveen Investments
| NFC | | Nuveen Connecticut |
| Performance | | Dividend Advantage |
| OVERVIEW | | Municipal Fund |
as of November 30, 2010
| Fund Snapshot | | | | |
| Common Share Price | | $ | 14.16 | |
| Common Share Net Asset Value (NAV) | | $ | 14.60 | |
| Premium/(Discount) to NAV | | | -3.01 | % |
| Market Yield | | | 5.42 | % |
Taxable-Equivalent Yield1 | | | 7.92 | % |
| Net Assets Applicable to Common Shares ($000) | | $ | 37,754 | |
Average Annual Total Return
(Inception 1/26/01)
| | | On Share Price | | On NAV | |
| 6-Month (Cumulative) | | | -4.98 | % | | 0.45 | % |
| 1-Year | | | 3.90 | % | | 4.85 | % |
| 5-Year | | | 2.96 | % | | 4.83 | % |
| Since Inception | | | 4.79 | % | | 5.79 | % |
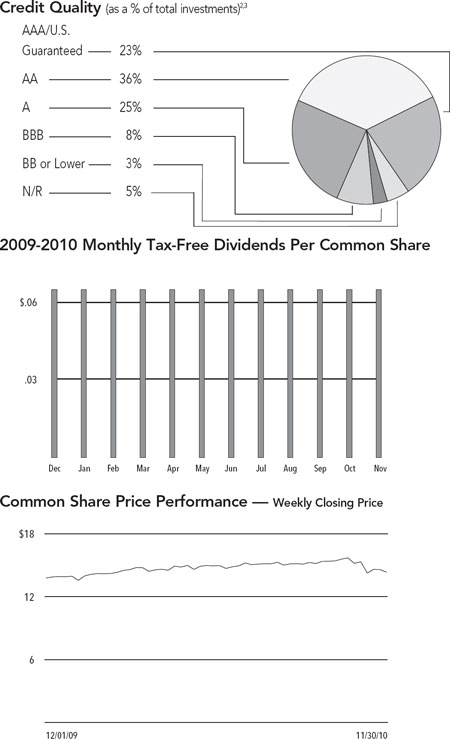
Portfolio Composition3
(as a % of total investments)
| Education and Civic Organizations | 23.2% |
| U.S. Guaranteed | 17.0% |
| Tax Obligation/Limited | 16.9% |
| Health Care | 12.3% |
| Water and Sewer | 8.5% |
| Housing/Single Family | 5.9% |
| Tax Obligation/General | 5.5% |
| Other | 10.7% |
| | Refer to the Glossary of Terms used in this Report for further definition of the terms used within this Fund’s Performance Overview page. |
| 1 | Taxable-Equivalent Yield represents the yield that must be earned on a fully taxable investment in order to equal the yield of the Fund on an after-tax basis. It is based on a combined federal and state income tax rate of 31.6%. When comparing this Fund to investments that generate qualified dividend income, the Taxable-Equivalent Yield is lower. |
| 2 | Ratings shown are the highest of Standard & Poor’s Group, Moody’s Investor Service, Inc. or Fitch, Inc. AAA includes bonds with an implied AAA rating since they are backed by U.S. Government or agency securities. AAA, AA, A and BBB ratings are investment grade; BB, B, CCC, CC, C and D ratings are below-investment grade. Holdings designated N/R are not rated by any of these national rating agencies. |
| 3 | Holdings are subject to change. |
Nuveen Investments 13
| NGK | | Nuveen Connecticut |
| Performance | | Dividend Advantage |
| OVERVIEW | | Municipal Fund 2 |
as of November 30, 2010
Fund Snapshot | | | | |
| Common Share Price | | $ | 14.69 | |
| Common Share Net Asset Value (NAV) | | $ | 14.73 | |
| Premium/(Discount) to NAV | | | -0.27 | % |
| Market Yield | | | 5.39 | % |
Taxable-Equivalent Yield1 | | | 7.88 | % |
| Net Assets Applicable to Common Shares ($000) | | $ | 34,174 | |
Average Annual Total Return
(Inception 3/25/02)
| | | On Share Price | | | On NAV | |
| 6-Month (Cumulative) | | | -6.93 | % | | 0.67 | % |
| 1-Year | | | 6.71 | % | | 5.03 | % |
| 5-Year | | | 4.11 | % | | 4.91 | % |
| Since Inception | | | 5.40 | % | | 6.05 | % |
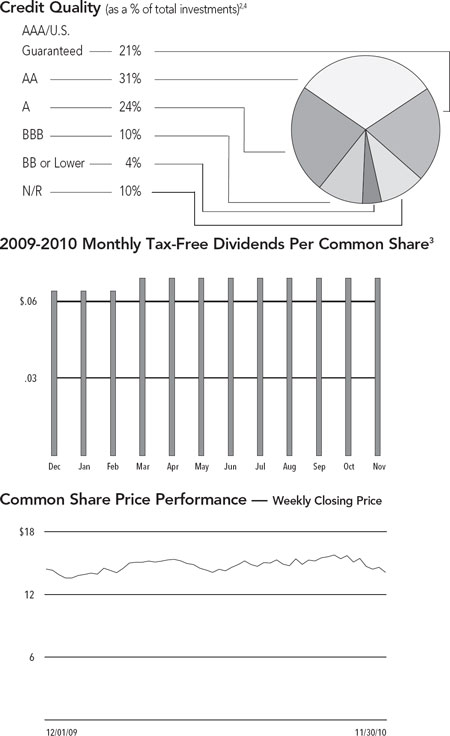
Portfolio Composition3
(as a % of total investments)
| Education and Civic Organizations | 22.6% |
| U.S. Guaranteed | 21.8% |
| Health Care | 14.0% |
| Tax Obligation/Limited | 9.8% |
| Water and Sewer | 7.1% |
| Housing/Single Family | 5.5% |
| Tax Obligation/General | 5.3% |
| Utilities | 5.2% |
| Other | 8.7% |
| | Refer to the Glossary of Terms used in this Report for further definition of the terms used within this Fund’s Performance Overview page. |
| 1 | Taxable-Equivalent Yield represents the yield that must be earned on a fully taxable investment in order to equal the yield of the Fund on an after-tax basis. It is based on a combined federal and state income tax rate of 31.6%. When comparing this Fund to investments that generate qualified dividend income, the Taxable-Equivalent Yield is lower. |
| 2 | Ratings shown are the highest of Standard & Poor’s Group, Moody’s Investor Service, Inc. or Fitch, Inc. AAA includes bonds with an implied AAA rating since they are backed by U.S. Government or agency securities. AAA, AA, A and BBB ratings are investment grade; BB, B, CCC, CC, C and D ratings are below-investment grade. Holdings designated N/R are not rated by any of these national rating agencies. |
| 3 | Holdings are subject to change. |
14 Nuveen Investments
| NGO | | Nuveen Connecticut |
| Performance | | Dividend Advantage |
| OVERVIEW | | Municipal Fund 3 |
as of November 30, 2010
| Fund Snapshot | | | | |
| Common Share Price | | $ | 13.65 | |
| Common Share Net Asset Value (NAV) | | $ | 14.20 | |
| Premium/(Discount) to NAV | | | -3.87 | % |
| Market Yield | | | 5.27 | % |
Taxable-Equivalent Yield1 | | | 7.70 | % |
| Net Assets Applicable to Common Shares ($000) | | $ | 62,016 | |
Average Annual Total Return
(Inception 9/26/02)
| | | On Share Price | | On NAV | |
| 6-Month (Cumulative) | | | -0.42 | % | | 0.80 | % |
| 1-Year | | | 7.99 | % | | 5.49 | % |
| 5-Year | | | 3.17 | % | | 4.47 | % |
| Since Inception | | | 3.86 | % | | 4.83 | % |
Portfolio Composition3
(as a % of total investments)
| Education and Civic Organizations | 19.2% |
| U.S. Guaranteed | 18.9% |
| Health Care | 12.3% |
| Tax Obligation/Limited | 11.4% |
| Water and Sewer | 9.6% |
| Long-Term Care | 7.6% |
| Tax Obligation/General | 7.0% |
| Utilities | 5.2% |
| Housing/Single Family | 5.2% |
| Other | 3.6% |
| | Refer to the Glossary of Terms used in this Report for further definition of the terms used within this Fund’s Performance Overview page. |
| 1 | Taxable-Equivalent Yield represents the yield that must be earned on a fully taxable investment in order to equal the yield of the Fund on an after-tax basis. It is based on a combined federal and state income tax rate of 31.6%. When comparing this Fund to investments that generate qualified dividend income, the Taxable-Equivalent Yield is lower. |
| 2 | Ratings shown are the highest of Standard & Poor’s Group, Moody’s Investor Service, Inc. or Fitch, Inc. AAA includes bonds with an implied AAA rating since they are backed by U.S. Government or agency securities. AAA, AA, A and BBB ratings are investment grade; BB, B, CCC, CC, C and D ratings are below-investment grade. Holdings designated N/R are not rated by any of these national rating agencies. |
| 3 | Holdings are subject to change. |
Nuveen Investments 15
| NMT | | Nuveen Massachusetts |
| Performance | | Premium Income |
| OVERVIEW | | Municipal Fund |
as of November 30, 2010
| Fund Snapshot | | | | |
| Common Share Price | | $ | 14.33 | |
| Common Share Net Asset Value (NAV) | | $ | 14.28 | |
| Premium/(Discount) to NAV | | | 0.35 | % |
| Market Yield | | | 5.44 | % |
Taxable-Equivalent Yield1 | | | 7.98 | % |
| Net Assets Applicable to Common Shares ($000) | | $ | 68,190 | |
Average Annual Total Return
(Inception 3/18/93)
| | | On Share Price | | On NAV | |
| 6-Month (Cumulative) | | | -1.44 | % | | 1.27 | % |
| 1-Year | | | 10.39 | % | | 6.26 | % |
| 5-Year | | | 2.84 | % | | 4.71 | % |
| 10-Year | | | 5.53 | % | | 5.85 | % |
Portfolio Composition3
(as a % of total investments)
| Education and Civic Organizations | 21.7% |
| Health Care | 16.8% |
| Tax Obligation/General | 11.2% |
| U.S. Guaranteed | 11.0% |
| Tax Obligation/Limited | 9.3% |
| Water and Sewer | 7.9% |
| Transportation | 7.2% |
| Other | 14.9% |
| | Refer to the Glossary of Terms used in this Report for further definition of the terms used within this Fund’s Performance Overview page. |
| 1 | Taxable-Equivalent Yield represents the yield that must be earned on a fully taxable investment in order to equal the yield of the Fund on an after-tax basis. It is based on a combined federal and state income tax rate of 31.8%. When comparing this Fund to investments that generate qualified dividend income, the Taxable-Equivalent Yield is lower. |
| 2 | Ratings shown are the highest of Standard & Poor’s Group, Moody’s Investor Service, Inc. or Fitch, Inc. AAA includes bonds with an implied AAA rating since they are backed by U.S. Government or agency securities. AAA, AA, A and BBB ratings are investment grade; BB, B, CCC, CC, C and D ratings are below-investment grade. Holdings designated N/R are not rated by any of these national rating agencies. |
| 3 | Holdings are subject to change. |
16 Nuveen Investments
| NMB | | Nuveen Massachusetts |
| Performance | | Dividend Advantage |
| OVERVIEW | | Municipal Fund |
as of November 30, 2010
| Fund Snapshot | | | | |
| Common Share Price | | $ | 14.11 | |
| Common Share Net Asset Value (NAV) | | $ | 14.08 | |
| Premium/(Discount) to NAV | | | 0.21 | % |
| Market Yield | | | 5.87 | % |
Taxable-Equivalent Yield1 | | | 8.61 | % |
| Net Assets Applicable to Common Shares ($000) | | $ | 27,663 | |
Average Annual Total Return
(Inception 1/30/01)
| | | On Share Price | | On NAV | |
| 6-Month (Cumulative) | | | 2.96 | % | | 0.74 | % |
| 1-Year | | | 3.89 | % | | 4.95 | % |
| 5-Year | | | 2.70 | % | | 4.08 | % |
| Since Inception | | | 5.11 | % | | 5.79 | % |
Portfolio Composition4
(as a % of total investments)
| Education and Civic Organizations | | | 29.8 | % |
| Health Care | | | 18.0 | % |
| U.S. Guaranteed | | | 11.0 | % |
| Tax Obligation/Limited | | | 7.7 | % |
| Housing/Multifamily | | | 7.6 | % |
| Water and Sewer | | | 5.8 | % |
| Long-Term Care | | | 5.7 | % |
| Other | | | 14.4 | % |
| | Refer to the Glossary of Terms used in this Report for further definition of the terms used within this Fund’s Performance Overview page. |
| 1 | Taxable-Equivalent Yield represents the yield that must be earned on a fully taxable investment in order to equal the yield of the Fund on an after-tax basis. It is based on a combined federal and state income tax rate of 31.8%. When comparing this Fund to investments that generate qualified dividend income, the Taxable-Equivalent Yield is lower. |
| 2 | Ratings shown are the highest of Standard & Poor’s Group, Moody’s Investor Service, Inc. or Fitch, Inc. AAA includes bonds with an implied AAA rating since they are backed by U.S. Government or agency securities. AAA, AA, A and BBB ratings are investment grade; BB, B, CCC, CC, C and D ratings are below-investment grade. Holdings designated N/R are not rated by any of these national rating agencies. |
| 3 | The Fund paid shareholders net ordinary income distributions in December 2009 of $0.0283 per share. |
| 4 | Holdings are subject to change. |
Nuveen Investments 17
| NGX | | Nuveen Insured |
| Performance | | Massachusetts Tax-Free |
| OVERVIEW | | Advantage Municipal Fund |
as of November 30, 2010
| Fund Snapshot | | | | |
| Common Share Price | | $ | 14.25 | |
| Common Share Net Asset Value (NAV) | | $ | 14.44 | |
| Premium/(Discount) to NAV | | | -1.32 | % |
| Market Yield | | | 5.31 | % |
Taxable-Equivalent Yield3 | | | 7.79 | % |
| Net Assets Applicable to Common Shares ($000) | | $ | 39,384 | |
Average Annual Total Return
(Inception 11/21/02)
| | | On Share Price | | On NAV | |
| 6-Month (Cumulative) | | | -7.47 | % | | 0.68 | % |
| 1-Year | | | 1.58 | % | | 4.89 | % |
| 5-Year | | | 3.32 | % | | 4.74 | % |
| Since Inception | | | 4.41 | % | | 5.27 | % |
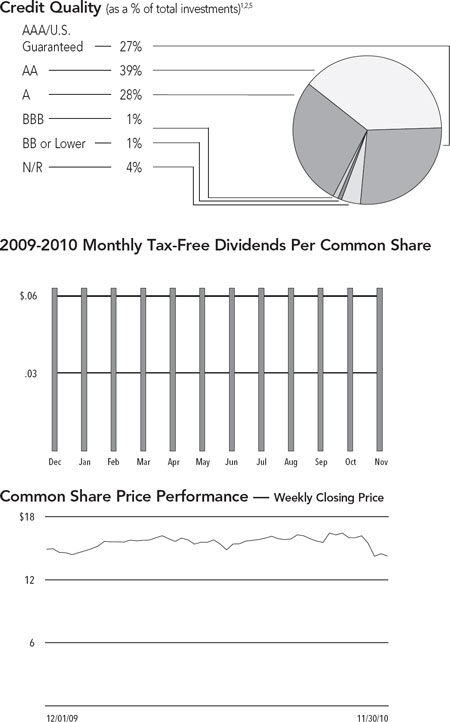
Portfolio Composition5
(as a % of total investments)
| U.S. Guaranteed | 22.6% |
| Education and Civic Organizations | 16.7% |
| Water and Sewer | 12.1% |
| Tax Obligation/Limited | 11.4% |
| Health Care | 10.8% |
| Tax Obligation/General | 8.2% |
| Housing/Multifamily | 7.3% |
| Other | 10.9% |
Insurers5
(as a % of total Insured investments)
NPFG4 | 35.1% |
| AMBAC | 20.9% |
| FGIC | 18.0% |
| AGM | 11.0% |
| AGC | 9.3% |
| SYNCORA | 5.7% |
| | Refer to the Glossary of Terms used in this Report for further definition of the terms used within this Fund’s Performance Overview page. |
| 1 | The Fund intends to invest at least 80% of its managed assets in municipal securities that are covered by insurance guaranteeing the timely payment of principal and interest. See Notes to Financial Statements, Footnote 1 – General Information and Significant Accounting Policies, Insurance, for more information. At the end of the reporting period, 83% of the Fund’s total investments are invested in Insured Securities. |
| 2 | Ratings shown are the highest of Standard & Poor’s Group, Moody’s Investor Service, Inc. or Fitch, Inc. AAA includes bonds with an implied AAA rating since they are backed by U.S. Government or agency securities. AAA, AA, A and BBB ratings are investment grade; BB, B, CCC, CC, C and D ratings are below-investment grade. Holdings designated N/R are not rated by any of these national rating agencies. |
| 3 | Taxable-Equivalent Yield represents the yield that must be earned on a fully taxable investment in order to equal the yield of the Fund on an after-tax basis. It is based on a combined federal and state income tax rate of 31.8%. When comparing this Fund to investments that generate qualified dividend income, the Taxable-Equivalent Yield is lower. |
| 4 | MBIA’s public finance subsidiary. |
| 5 | Holdings are subject to change. |
18 Nuveen Investments
| NOM | | Nuveen Missouri |
| Performance | | Premium Income |
| | Municipal Fund |
| | | as of November 30, 2010 |
| Fund Snapshot | | | | |
| Common Share Price | | $ | 16.01 | |
| Common Share Net Asset Value (NAV) | | $ | 13.31 | |
| Premium/(Discount) to NAV | | | 20.29 | % |
| Market Yield | | | 4.87 | % |
Taxable-Equivalent Yield1 | | | 7.19 | % |
| Net Assets Applicable to Common Shares ($000) | | $ | 30,836 | |
Average Annual Total Return
(Inception 5/20/93)
| | | On Share Price | | On NAV | |
| 6-Month (Cumulative) | | | -0.51 | % | | 1.05 | % |
| 1-Year | | | 20.92 | % | | 6.71 | % |
| 5-Year | | | 3.55 | % | | 3.62 | % |
| 10-Year | | | 7.51 | % | | 5.62 | % |
Portfolio Composition3
(as a % of total investments)
| Tax Obligation/General | 19.9% |
| Health Care | 19.3% |
| Tax Obligation/Limited | 14.0% |
| U.S. Guaranteed | 13.6% |
| Transportation | 11.0% |
| Water and Sewer | 6.3% |
| Long-Term Care | 5.3% |
| Other | 10.6% |
| | Refer to the Glossary of Terms used in this Report for further definition of the terms used within this Fund’s Performance Overview page. |
| 1 | Taxable-Equivalent Yield represents the yield that must be earned on a fully taxable investment in order to equal the yield of the Fund on an after-tax basis. It is based on a combined federal and state income tax rate of 32.3%. When comparing this Fund to investments that generate qualified dividend income, the Taxable-Equivalent Yield is lower. |
| 2 | Ratings shown are the highest of Standard & Poor’s Group, Moody’s Investor Service, Inc. or Fitch, Inc. AAA includes bonds with an implied AAA rating since they are backed by U.S. Government or agency securities. AAA, AA, A and BBB ratings are investment grade; BB, B, CCC, CC, C and D ratings are below-investment grade. Holdings designated N/R are not rated by any of these national rating agencies. |
| 3 | Holdings are subject to change. |
Nuveen Investments 19
| NTC | | Shareholder Meeting Report |
| NFC | | |
| NGK | | The annual meeting of shareholders was held in the offices of Nuveen Investments on November 16, 2010; at this meeting the shareholders were asked to vote on the election of Board Members, the elimination of Fundamental Investment Policies and the approval of new Fundamental Investment Policies. The meeting for NOM was subsequently adjourned to January 6, 2011. |
| | | NTC | | NFC | | NGK | |
| | | Common and Preferred shares voting together as a class | | | Preferred shares voting together as a class | | | Common and Preferred shares voting together as a class | | | Preferred shares voting together as a class | | | Common and Preferred shares voting together as a class | | | Preferred shares voting together as a class | |
| To approve the elimination of the Fund’s fundamental policy relating to investments in municipal securities and below investment grade securities. | | | | | | | | | | | | | | | | | | |
| For | | — | | | — | | | — | | | — | | | — | | | — | |
| Against | | — | | | — | | | — | | | — | | | — | | | — | |
| Abstain | | — | | | — | | | — | | | — | | | — | | | — | |
| Broker Non-Votes | | — | | | — | | | — | | | — | | | — | | | — | |
| Total | | — | | | — | | | — | | | — | | | — | | | — | |
| To approve the new fundamental policy relating to investments in municipal securities for the Fund. | | | | | | | | | | | | | | | | | | |
| For | | — | | | — | | | — | | | — | | | — | | | — | |
| Against | | — | | | — | | | — | | | — | | | — | | | — | |
| Abstain | | — | | | — | | | — | | | — | | | — | | | — | |
| Broker Non-Votes | | — | | | — | | | — | | | — | | | — | | | — | |
| Total | | — | | | — | | | — | | | — | | | — | | | — | |
| To approve the elimination of the fundamental policy prohibiting investment in other investment companies. | | | | | | | | | | | | | | | | | | |
| For | | — | | | — | | | — | | | — | | | — | | | — | |
| Against | | — | | | — | | | — | | | — | | | — | | | — | |
| Abstain | | — | | | — | | | — | | | — | | | — | | | — | |
| Broker Non-Votes | | — | | | — | | | — | | | — | | | — | | | — | |
| Total | | — | | | — | | | — | | | — | | | — | | | — | |
| To approve the elimination of the fundamental policy relating to derivatives and short sales. | | | | | | | | | | | | | | | | | | |
| For | | — | | | — | | | — | | | — | | | — | | | — | |
| Against | | — | | | — | | | — | | | — | | | — | | | — | |
| Abstain | | — | | | — | | | — | | | — | | | — | | | — | |
| Broker Non-Votes | | — | | | — | | | — | | | — | | | — | | | — | |
| Total | | — | | | — | | | — | | | — | | | — | | | — | |
| To approve the elimination of the fundamental policy relating to commodities. | | | | | | | | | | | | | | | | | | |
| For | | — | | | — | | | �� | | | — | | | — | | | — | |
| Against | | — | | | — | | | — | | | — | | | — | | | — | |
| Abstain | | — | | | — | | | — | | | — | | | — | | | — | |
| Broker Non-Votes | | — | | | — | | | — | | | — | | | — | | | — | |
| Total | | — | | | — | | | — | | | — | | | — | | | — | |
| To approve the new fundamental policy relating to commodities. | | | | | | | | | | | | | | | | | | |
| For | | — | | | — | | | — | | | — | | | — | | | — | |
| Against | | — | | | — | | | — | | | — | | | — | | | — | |
| Abstain | | — | | | — | | | — | | | — | | | — | | | — | |
| Broker Non-Votes | | — | | | — | | | — | | | — | | | — | | | — | |
| Total | | — | | | — | | | — | | | — | | | — | | | — | |
20 Nuveen Investments
| | | NTC | | | NFC | | | NGK | |
| | | Common and Preferred shares voting together as a class | | | Preferred shares voting together as a class | | | Common and Preferred shares voting together as a class | | | Preferred shares voting together as a class | | | Common and Preferred shares voting together as a class | | | Preferred shares voting together as a class | |
| Approval of the Board Members was reached as follows: | | | | | | | | | | | | | | | | | | |
| William C. Hunter | | | | | | | | | | | | | | | | | | |
| For | | — | | | 1,701,826 | | | — | | | 1,643,413 | | | — | | | 1,493,325 | |
| Withhold | | — | | | 2,204 | | | — | | | 66,991 | | | — | | | 2,100 | |
| Total | | — | | | 1,704,030 | | | — | | | 1,710,404 | | | — | | | 1,495,425 | |
| William J. Schneider | | | | | | | | | | | | | | | | | | |
| For | | — | | | 1,701,826 | | | — | | | 1,643,413 | | | — | | | 1,493,325 | |
| Withhold | | — | | | 2,204 | | | — | | | 66,991 | | | — | | | 2,100 | |
| Total | | — | | | 1,704,030 | | | — | | | 1,710,404 | | | — | | | 1,495,425 | |
| Judith M. Stockdale | | | | | | | | | | | | | | | | | | |
| For | | 6,564,442 | | | — | | | 4,017,538 | | | — | | | 3,647,151 | | | — | |
| Withhold | | 155,787 | | | — | | | 163,161 | | | — | | | 81,255 | | | — | |
| Total | | 6,720,229 | | | — | | | 4,180,699 | | | — | | | 3,728,406 | | | — | |
| Carole E. Stone | | | | | | | | | | | | | | | | | | |
| For | | 6,570,131 | | | — | | | 4,019,238 | | | — | | | 3,649,651 | | | — | |
| Withhold | | 150,098 | | | — | | | 161,461 | | | — | | | 78,755 | | | — | |
| Total | | 6,720,229 | | | — | | | 4,180,699 | | | — | | | 3,728,406 | | | — | |
Nuveen Investments 21
| NGO | | Shareholder Meeting Report (continued) |
| NMT | | |
| NMB | | |
| | | | NGO | | | NMT | | | NMB | |
| | | | Common and Preferred shares voting together as a class | | | Preferred shares voting together as a class | | | Common and Preferred shares voting together as a class | | | Preferred shares voting together as a class | | | Common and Preferred shares voting together as a class | | | Preferred shares voting together as a class | |
| To approve the elimination of the Fund’s fundamental policy relating to investments in municipal securities and below investment grade securities. | | | | | | | | | | | | | | | | | | | |
| For | | | — | | | — | | | — | | | — | | | — | | | — | |
| Against | | | — | | | — | | | — | | | — | | | — | | | — | |
| Abstain | | | — | | | — | | | — | | | — | | | — | | | — | |
| Broker Non-Votes | | | — | | | — | | | — | | | — | | | — | | | — | |
| Total | | | — | | | — | | | — | | | — | | | — | | | — | |
| To approve the new fundamental policy relating to investments in municipal securities for the Fund. | | | | | | | | | | | | | | | | | | | |
| For | | | — | | | — | | | — | | | — | | | — | | | — | |
| Against | | | — | | | — | | | — | | | — | | | — | | | — | |
| Abstain | | | — | | | — | | | — | | | — | | | — | | | — | |
| Broker Non-Votes | | | — | | | — | | | — | | | — | | | — | | | — | |
| Total | | | — | | | — | | | — | | | — | | | — | | | — | |
| To approve the elimination of the fundamental policy prohibiting investment in other investment companies. | | | | | | | | | | | | | | | | | | | |
| For | | | — | | | — | | | — | | | — | | | — | | | — | |
| Against | | | — | | | — | | | — | | | — | | | — | | | — | |
| Abstain | | | — | | | — | | | — | | | — | | | — | | | — | |
| Broker Non-Votes | | | — | | | — | | | — | | | — | | | — | | | — | |
| Total | | | — | | | — | | | — | | | — | | | — | | | — | |
| To approve the elimination of the fundamental policy relating to derivatives and short sales. | | | | | | | | | | | | | | | | | | | |
| For | | | — | | | — | | | — | | | — | | | — | | | — | |
| Against | | | — | | | — | | | — | | | — | | | — | | | — | |
| Abstain | | | — | | | — | | | — | | | — | | | — | | | — | |
| Broker Non-Votes | | | — | | | — | | | — | | | — | | | — | | | — | |
| Total | | | — | | | — | | | — | | | — | | | — | | | — | |
| To approve the elimination of the fundamental policy relating to commodities. | | | | | | | | | | | | | | | | | | | |
| For | | | — | | | — | | | — | | | — | | | — | | | — | |
| Against | | | — | | | — | | | — | | | — | | | — | | | — | |
| Abstain | | | — | | | — | | | — | | | — | | | — | | | — | |
| Broker Non-Votes | | | — | | | — | | | — | | | — | | | — | | | — | |
| Total | | | — | | | — | | | — | | | — | | | — | | | — | |
| To approve the new fundamental policy relating to commodities. | | | | | | | | | | | | | | | | | | | |
| For | | | — | | | — | | | — | | | — | | | — | | | — | |
| Against | | | — | | | — | | | — | | | — | | | — | | | — | |
| Abstain | | | — | | | — | | | — | | | — | | | — | | | — | |
| Broker Non-Votes | | | — | | | — | | | — | | | — | | | — | | | — | |
| Total | | | — | | | — | | | — | | | — | | | — | | | — | |
22 Nuveen Investments
| | | | NGO | | | NMT | | | NMB | |
| | | | Common and Preferred shares voting together as a class | | | Preferred shares voting together as a class | | | Common and Preferred shares voting together as a class | | | Preferred shares voting together as a class | | | Common and Preferred shares voting together as a class | | | Preferred shares voting together as a class | |
| Approval of the Board Members was reached as follows: | | | | | | | | | | | | | | | | | | | |
| William C. Hunter | | | | | | | | | | | | | | | | | | | |
| For | | | — | | | 2,946,120 | | | — | | | 1,904,421 | | | — | | | 1,426,148 | |
| Withhold | | | — | | | 2,000 | | | — | | | 7,650 | | | — | | | — | |
| Total | | | — | | | 2,948,120 | | | — | | | 1,912,071 | | | — | | | 1,426,148 | |
| William J. Schneider | | | | | | | | | | | | | | | | | | | |
| For | | | — | | | 2,946,120 | | | — | | | 1,904,421 | | | — | | | 1,426,148 | |
| Withhold | | | — | | | 2,000 | | | — | | | 7,650 | | | — | | | — | |
| Total | | | — | | | 2,948,120 | | | — | | | 1,912,071 | | | — | | | 1,426,148 | |
| Judith M. Stockdale | | | | | | | | | | | | | | | | | | | |
| For | | | 6,884,664 | | | — | | | 6,372,919 | | | — | | | 3,270,396 | | | — | |
| Withhold | | | 148,425 | | | — | | | 92,814 | | | — | | | 33,092 | | | — | |
| Total | | | 7,033,089 | | | — | | | 6,465,733 | | | — | | | 3,303,488 | | | — | |
| Carole E. Stone | | | | | | | | | | | | | | | | | | | |
| For | | | 6,887,964 | | | — | | | 6,378,358 | | | — | | | 3,271,739 | | | — | |
| Withhold | | | 145,125 | | | — | | | 87,375 | | | — | | | 31,749 | | | — | |
| Total | | | 7,033,089 | | | — | | | 6,465,733 | | | — | | | 3,303,488 | | | — | |
Nuveen Investments 23
| NGX | | Shareholder Meeting Report (continued) |
| NOM | | |
| | | | NGX | | | NOM | |
| | | | Common and Preferred shares voting together as a class | | | Preferred shares voting together as a class | | | Common and Preferred shares voting together as a class | | | Preferred shares voting together as a class | |
| To approve the elimination of the Fund’s fundamental policy relating to investments in municipal securities and below investment grade securities. | | | | | | | | | | | | | |
| For | | | — | | | — | | | 1,184,693 | | | 473 | |
| Against | | | — | | | — | | | 357,437 | | | 5 | |
| Abstain | | | — | | | — | | | 25,656 | | | — | |
| Broker Non-Votes | | | — | | | — | | | 199,217 | | | — | |
| Total | | | — | | | — | | | 1,767,003 | | | 478 | |
| To approve the new fundamental policy relating to investments in municipal securities for the Fund. | | | | | | | | | | | | | |
| For | | | — | | | — | | | 1,189,274 | | | 473 | |
| Against | | | — | | | — | | | 352,931 | | | 5 | |
| Abstain | | | — | | | — | | | 25,581 | | | — | |
| Broker Non-Votes | | | — | | | — | | | 199,217 | | | — | |
| Total | | | — | | | — | | | 1,767,003 | | | 478 | |
| To approve the elimination of the fundamental policy prohibiting investment in other investment companies. | | | | | | | | | | | | | |
| For | | | — | | | — | | | 1,187,943 | | | 473 | |
| Against | | | — | | | — | | | 354,192 | | | 5 | |
| Abstain | | | — | | | — | | | 25,651 | | | — | |
| Broker Non-Votes | | | — | | | — | | | 199,217 | | | — | |
| Total | | | — | | | — | | | 1,767,003 | | | 478 | |
| To approve the elimination of the fundamental policy relating to derivatives and short sales. | | | | | | | | | | | | | |
| For | | | — | | | — | | | 1,175,820 | | | 473 | |
| Against | | | — | | | — | | | 352,105 | | | 5 | |
| Abstain | | | — | | | — | | | 39,861 | | | — | |
| Broker Non-Votes | | | — | | | — | | | 199,217 | | | — | |
| Total | | | — | | | — | | | 1,767,003 | | | 478 | |
| To approve the elimination of the fundamental policy relating to commodities. | | | | | | | | | | | | | |
| For | | | — | | | — | | | 1,441,507 | | | 473 | |
| Against | | | — | | | — | | | 81,331 | | | 5 | |
| Abstain | | | — | | | — | | | 44,948 | | | — | |
| Broker Non-Votes | | | — | | | — | | | 199,217 | | | — | |
| Total | | | — | | | — | | | 1,767,003 | | | 478 | |
| To approve the new fundamental policy relating to commodities. | | | | | | | | | | | | | |
| For | | | — | | | — | | | 1,442,477 | | | 473 | |
| Against | | | — | | | — | | | 79,931 | | | 5 | |
| Abstain | | | — | | | — | | | 45,378 | | | — | |
| Broker Non-Votes | | | — | | | — | | | 199,217 | | | — | |
| Total | | | — | | | — | | | 1,767,003 | | | 478 | |
24 Nuveen Investments
| | | | NGX | | | NOM | |
| | | | Common and Preferred shares voting together as a class | | | Preferred shares voting together as a class | | | Common and Preferred shares voting together as a class | | | Preferred shares voting together as a class | |
| Approval of the Board Members was reached as follows: | | | | | | | | | | | | | |
| William C. Hunter | | | | | | | | | | | | | |
| For | | | — | | | 1,985,869 | | | — | | | 451 | |
| Withhold | | | — | | | 118,276 | | | — | | | 27 | |
| Total | | | — | | | 2,104,145 | | | — | | | 478 | |
| William J. Schneider | | | | | | | | | | | | | |
| For | | | — | | | 1,985,869 | | | — | | | 451 | |
| Withhold | | | — | | | 118,276 | | | — | | | 27 | |
| Total | | | — | | | 2,104,145 | | | — | | | 478 | |
| Judith M. Stockdale | | | | | | | | | | | | | |
| For | | | 4,533,719 | | | — | | | 1,665,698 | | | — | |
| Withhold | | | 184,185 | | | — | | | 101,305 | | | — | |
| Total | | | 4,717,904 | | | — | | | 1,767,003 | | | — | |
| Carole E. Stone | | | | | | | | | | | | | |
| For | | | 4,538,746 | | | — | | | 1,674,534 | | | — | |
| Withhold | | | 179,158 | | | — | | | 92,469 | | | — | |
| Total | | | 4,717,904 | | | — | | | 1,767,003 | | | — | |
Nuveen Investments 25
| | | Nuveen Connecticut Premium Income Municipal Fund |
| NTC | | Portfolio of Investments |
November 30, 2010 (Unaudited)
| | Principal | | | Optional Call | | | | |
| | Amount (000) | | Description (1) | Provisions (2) | Ratings (3) | | Value | |
| | | | Consumer Staples – 1.6% (1.1% of Total Investments) | | | | | |
| $ | 1,300 | | Puerto Rico, The Children’s Trust Fund, Tobacco Settlement Asset-Backed Refunding Bonds, Series 2002, 5.375%, 5/15/33 | 5/12 at 100.00 | BBB | $ | 1,261,221 | |
| | | | Education and Civic Organizations – 38.9% (25.9% of Total Investments) | | | | | |
| | 925 | | Connecticut Health and Educational Facilities Authority, Revenue Bonds, Brunswick School, Series 2003B, 5.000%, 7/01/33 – NPFG Insured | 7/13 at 100.00 | A | | 925,629 | |
| | 500 | | Connecticut Health and Educational Facilities Authority, Revenue Bonds, Canterbury School, Series 2006B, 5.000%, 7/01/36 – RAAI Insured | 7/16 at 100.00 | N/R | | 446,370 | |
| | 305 | | Connecticut Health and Educational Facilities Authority, Revenue Bonds, Chase Collegiate School, Series 2007A, 5.000%, 7/01/27 – RAAI Insured | 7/17 at 100.00 | N/R | | 287,267 | |
| | 1,000 | | Connecticut Health and Educational Facilities Authority, Revenue Bonds, Fairfield University, Series 2010-O, 5.000%, 7/01/40 | 7/20 at 100.00 | A– | | 1,002,980 | |
| | 750 | | Connecticut Health and Educational Facilities Authority, Revenue Bonds, Horace Bushnell Memorial Hall, Series 1999A, 5.625%, 7/01/29 – NPFG Insured | 1/11 at 100.50 | Baa1 | | 755,798 | |
| | 800 | | Connecticut Health and Educational Facilities Authority, Revenue Bonds, Loomis Chaffee School, Series 2005F, 5.250%, 7/01/19 – AMBAC Insured | No Opt. Call | A2 | | 915,792 | |
| | 1,000 | | Connecticut Health and Educational Facilities Authority, Revenue Bonds, Quinnipiac University, Series 2006H, 5.000%, 7/01/36 – AMBAC Insured | 7/16 at 100.00 | A– | | 1,005,760 | |
| | 1,595 | | Connecticut Health and Educational Facilities Authority, Revenue Bonds, Quinnipiac University, Series 2007-I, 5.000%, 7/01/25 – NPFG Insured | 7/17 at 100.00 | A | | 1,649,150 | |
| | 270 | | Connecticut Health and Educational Facilities Authority, Revenue Bonds, Renbrook School, Series 2007A, 5.000%, 7/01/37 – AMBAC Insured | 7/17 at 100.00 | N/R | | 252,852 | |
| | 1,375 | | Connecticut Health and Educational Facilities Authority, Revenue Bonds, Trinity College, Series 2004H, 5.000%, 7/01/21 – NPFG Insured | 7/14 at 100.00 | A+ | | 1,458,765 | |
| | 2,000 | | Connecticut Health and Educational Facilities Authority, Revenue Bonds, University of Hartford, Series 2002E, 5.250%, 7/01/32 – RAAI Insured | 7/12 at 101.00 | BBB– | | 1,865,440 | |
| | 1,050 | | Connecticut Health and Educational Facilities Authority, Revenue Bonds, University of Hartford, Series 2006G, 5.250%, 7/01/36 – RAAI Insured | 7/16 at 100.00 | BBB– | | 940,065 | |
| | 800 | | Connecticut Health and Educational Facilities Authority, Revenue Bonds, Wesleyan University, Series 2010G, 5.000%, 7/01/35 | 7/20 at 100.00 | AA | | 824,864 | |
| | 1,500 | | Connecticut Health and Educational Facilities Authority, Revenue Bonds, Yale University, Series 2003X-1, 5.000%, 7/01/42 (UB) | 7/13 at 100.00 | AAA | | 1,524,840 | |
| | 3,550 | | Connecticut Health and Educational Facilities Authority, Revenue Bonds, Yale University, Series 2007Z-1, 5.000%, 7/01/42 (UB) | 7/16 at 100.00 | AAA | | 3,678,368 | |
| | 6,150 | | Connecticut Health and Educational Facilities Authority, Revenue Bonds, Yale University, Series 2007Z-3, 5.050%, 7/01/42 (UB) | 7/17 at 100.00 | AAA | | 6,424,475 | |
| | 245 | | Connecticut Higher Education Supplemental Loan Authority, Revenue Bonds, Family Education Loan Program, Series 1999A, 6.000%, 11/15/18 – AMBAC Insured (Alternative Minimum Tax) | 5/11 at 101.00 | AAA | | 247,857 | |
| | 610 | | Connecticut Higher Education Supplemental Loan Authority, Revenue Bonds, Family Education Loan Program, Series 2001A, 5.250%, 11/15/18 – NPFG Insured (Alternative Minimum Tax) | 11/11 at 100.00 | Aa2 | | 617,881 | |
| | 1,000 | | University of Connecticut, General Obligation Bonds, Series 2004A, 5.000%, 1/15/18 – NPFG Insured | 1/14 at 100.00 | AA | | 1,080,310 | |
| | 1,220 | | University of Connecticut, General Obligation Bonds, Series 2005A, 5.000%, 2/15/17 – AGM Insured | 2/15 at 100.00 | AA+ | | 1,383,553 | |
| | 685 | | University of Connecticut, General Obligation Bonds, Series 2006A, 5.000%, 2/15/23 – FGIC Insured | 2/16 at 100.00 | AA | | 736,875 | |
| | 535 | | University of Connecticut, General Obligation Bonds, Series 2010A, 5.000%, 2/15/28 | 2/20 at 100.00 | AA | | 578,624 | |
| | 225 | | University of Connecticut, Student Fee Revenue Bonds, Refunding Series 2010A, 5.000%, 11/15/27 | 11/19 at 100.00 | Aa2 | | 244,179 | |
| | 1,000 | | University of Connecticut, Student Fee Revenue Refunding Bonds, Series 2002A, 5.250%, 11/15/19 – FGIC Insured | 11/12 at 101.00 | Aa2 | | 1,082,940 | |
| | 29,090 | | Total Education and Civic Organizations | | | | 29,930,634 | |
26 Nuveen Investments
| | Principal | | | Optional Call | | | | |
| | Amount (000) | | Description (1) | Provisions (2) | Ratings (3) | | Value | |
| | | | Health Care – 20.0% (13.3% of Total Investments) | | | | | |
| | | | Connecticut Health and Educational Facilities Authority, Revenue Bonds, Bristol Hospital, Series 2002B: | | | | | |
| $ | 500 | | 5.500%, 7/01/21 – RAAI Insured | 7/12 at 101.00 | N/R | $ | 474,955 | |
| | 700 | | 5.500%, 7/01/32 – RAAI Insured | 7/12 at 101.00 | N/R | | 632,079 | |
| | 645 | | Connecticut Health and Educational Facilities Authority, Revenue Bonds, Eastern Connecticut Health Network, Series 2000A, 6.000%, 7/01/25 – RAAI Insured | 7/11 at 100.00 | N/R | | 644,336 | |
| | | | Connecticut Health and Educational Facilities Authority, Revenue Bonds, Griffin Hospital, Series 2005B: | | | | | |
| | 800 | | 5.000%, 7/01/20 – RAAI Insured | 7/15 at 100.00 | N/R | | 789,192 | |
| | 500 | | 5.000%, 7/01/23 – RAAI Insured | 7/15 at 100.00 | N/R | | 470,980 | |
| | | | Connecticut Health and Educational Facilities Authority, Revenue Bonds, Hospital For Special Care, Series 2007C: | | | | | |
| | 385 | | 5.250%, 7/01/32 – RAAI Insured | 7/17 at 100.00 | BBB– | | 354,212 | |
| | 150 | | 5.250%, 7/01/37 – RAAI Insured | 7/17 at 100.00 | BBB– | | 134,771 | |
| | 2,620 | | Connecticut Health and Educational Facilities Authority, Revenue Bonds, Middlesex Hospital, Series 2006, 5.000%, 7/01/32 – AGM Insured | 7/16 at 100.00 | Aa3 | | 2,628,122 | |
| | 400 | | Connecticut Health and Educational Facilities Authority, Revenue Bonds, Stamford Hospital, Series 2010-I, 5.000%, 7/01/30 | 7/20 at 10.00 | A | | 404,540 | |
| | 1,395 | | Connecticut Health and Educational Facilities Authority, Revenue Bonds, Yale-New Haven Hospital, Series 2006J-1, 5.000%, 7/01/31 – AMBAC Insured | 7/16 at 100.00 | Aa3 | | 1,405,407 | |
| | 3,000 | | Connecticut Health and Educational Facilities Authority, Revenue Refunding Bonds, Middlesex Health Services, Series 1997H, 5.125%, 7/01/27 – NPFG Insured | 1/11 at 100.00 | A2 | | 2,865,900 | |
| | 1,000 | | Connecticut Health and Educational Facilities Authority, Revenue Bonds, Ascension Health Series 2010A, 5.000%, 11/15/40 | 11/19 at 100.00 | Aa1 | | 1,012,950 | |
| | 350 | | Connecticut Health and Educational Facilities Authority, Revenue Bonds, Catholic Health East Series 2010, 4.750%, 11/15/29 | 11/20 at 100.00 | A1 | | 344,407 | |
| | 3,050 | | Monroe County Industrial Development Corporation, New York, FHA Insured Mortgage Revenue Bonds, Unity Hospital of Rochester Project, Series 2010, 5.500%, 8/15/40 | 2/21 at 100.00 | Aa2 | | 3,224,002 | |
| | 15,495 | | Total Health Care | | | | 15,385,853 | |
| | | | Housing/Multifamily – 1.2% (0.8% of Total Investments) | | | | | |
| | 960 | | Connecticut Housing Finance Authority, Multifamily Housing Mortgage Finance Program Bonds, Series 2006G-2, 4.800%, 11/15/27 (Alternative Minimum Tax) | 11/15 at 100.00 | AAA | | 957,110 | |
| | | | Housing/Single Family – 9.9% (6.6% of Total Investments) | | | | | |
| | | | Connecticut Housing Finance Authority, Housing Mortgage Finance Program Bonds, Series 2001C: | | | | | |
| | 1,000 | | 5.300%, 11/15/33 (Alternative Minimum Tax) | 5/11 at 100.00 | AAA | | 999,990 | |
| | 500 | | 5.450%, 11/15/43 (Alternative Minimum Tax) | 5/11 at 100.00 | AAA | | 500,020 | |
| | 1,675 | | Connecticut Housing Finance Authority, Housing Mortgage Finance Program Bonds, Series 2004-A5, 5.050%, 11/15/34 | 5/13 at 100.00 | AAA | | 1,696,172 | |
| | | | Connecticut Housing Finance Authority, Housing Mortgage Finance Program Bonds, Series 2006-A1: | | | | | |
| | 205 | | 4.700%, 11/15/26 (Alternative Minimum Tax) | 11/15 at 100.00 | AAA | | 202,300 | |
| | 220 | | 4.800%, 11/15/31 (Alternative Minimum Tax) | 11/15 at 100.00 | AAA | | 213,765 | |
| | 2,045 | | Connecticut Housing Finance Authority, Housing Mortgage Finance Program Bonds, Series 2006D, 4.650%, 11/15/27 | 5/16 at 100.00 | AAA | | 2,051,012 | |
| | 2,000 | | Connecticut Housing Finance Authority, Single Family Housing Mortgage Finance Program Bonds, Series 2010-A2, 4.500%, 11/15/30 | 11/19 at 100.00 | AAA | | 1,989,540 | |
| | 7,645 | | Total Housing/Single Family | | | | 7,652,799 | |
| | | | Long-Term Care – 3.7% (2.5% of Total Investments) | | | | | |
| | 320 | | Connecticut Development Authority, First Mortgage Gross Revenue Refunding Healthcare Bonds, Church Homes Inc. – Congregational Avery Heights, Series 1997, 5.700%, 4/01/12 | 4/11 at 100.00 | BBB– | | 320,483 | |
| | 540 | | Connecticut Development Authority, First Mortgage Gross Revenue Refunding Healthcare Bonds, Connecticut Baptist Homes Inc., Series 1999, 5.500%, 9/01/15 – RAAI Insured | 3/11 at 101.00 | BBB– | | 544,509 | |
Nuveen Investments 27
| | | Nuveen Connecticut Premium Income Municipal Fund (continued) |
| NTC | | Portfolio of Investments November 30, 2010 (Unaudited) |
| | Principal | | | Optional Call | | | | |
| | Amount (000) | | Description (1) | Provisions (2) | Ratings (3) | | Value | |
| | | | Long-Term Care (continued) | | | | | |
| | | | Connecticut Development Authority, Revenue Refunding Bonds, Duncaster Inc., Series 1999A: | | | | | |
| $ | 1,000 | | 5.250%, 8/01/19 – RAAI Insured | 2/11 at 101.00 | BBB | $ | 1,007,460 | |
| | 1,000 | | 5.375%, 8/01/24 – RAAI Insured | 2/11 at 101.00 | BBB | | 1,002,040 | |
| | 2,860 | | Total Long-Term Care | | | | 2,874,492 | |
| | | | Tax Obligation/General – 18.7% (12.4% of Total Investments) | | | | | |
| | 750 | | Bridgeport, Connecticut, General Obligation Refunding Bonds, Series 2002A, 5.375%, 8/15/19 – FGIC Insured | 8/12 at 100.00 | A1 | | 776,153 | |
| | 1,110 | | Connecticut State, General Obligation Bonds, Series 2004C, 5.000%, 4/01/23 – FGIC Insured | 4/14 at 100.00 | AA | | 1,187,001 | |
| | 2,000 | | Connecticut State, General Obligation Bonds, Series 2006A, 4.750%, 12/15/24 | 12/16 at 100.00 | AA | | 2,121,180 | |
| | 1,300 | | Connecticut State, General Obligation Bonds, Series 2006C, 5.000%, 6/01/23 – AGM Insured | 6/16 at 100.00 | AA+ | | 1,398,046 | |
| | 500 | | Connecticut State, General Obligation Bonds, Series 2006E, 5.000%, 12/15/20 | 12/16 at 100.00 | AA | | 561,365 | |
| | | | Hartford, Connecticut, General Obligation Bonds, Series 2005A: | | | | | |
| | 775 | | 5.000%, 8/01/20 – AGM Insured | 8/15 at 100.00 | AA+ | | 841,472 | |
| | 525 | | 4.375%, 8/01/24 – AGM Insured | 8/15 at 100.00 | AA+ | | 534,560 | |
| | 500 | | New Haven, Connecticut, General Obligation Bonds, Series 2006, 5.000%, 11/01/17 – AMBAC Insured | 11/16 at 100.00 | A1 | | 560,420 | |
| | 500 | | North Haven, Connecticut, General Obligation Bonds, Series 2006, 5.000%, 7/15/24 | No Opt. Call | Aa1 | | 579,525 | |
| | 1,860 | | Puerto Rico, General Obligation and Public Improvement Bonds, Series 2002A, 5.500%, 7/01/20 – NPFG Insured | No Opt. Call | A | | 1,983,318 | |
| | 1,420 | | Regional School District 16, Connecticut, General Obligation Bonds, Series 2003, 5.000%, 3/15/16 – AMBAC Insured | 3/13 at 101.00 | A1 | | 1,543,554 | |
| | | | Suffield, Connecticut, General Obligation Bonds, Series 2005: | | | | | |
| | 465 | | 5.000%, 6/15/17 | No Opt. Call | AA+ | | 552,959 | |
| | 460 | | 5.000%, 6/15/19 | No Opt. Call | AA+ | | 546,899 | |
| | 1,000 | | 5.000%, 6/15/21 | No Opt. Call | AA+ | | 1,178,500 | |
| | 13,165 | | Total Tax Obligation/General | | | | 14,364,952 | |
| | | | Tax Obligation/Limited – 21.1% (14.0% of Total Investments) | | | | | |
| | | | Connecticut Health and Educational Facilities Authority, Child Care Facilities Program RevenueBonds, Series 2006F: | | | | | |
| | 1,300 | | 5.000%, 7/01/31 – AGC Insured | 7/16 at 100.00 | AA+ | | 1,330,771 | |
| | 1,000 | | 5.000%, 7/01/36 – AGC Insured | 7/16 at 100.00 | AA+ | | 1,013,810 | |
| | 1,945 | | Connecticut Health and Educational Facilities Authority, Revenue Bonds, Child Care Facilities Program, Series 1999C, 5.625%, 7/01/29 – AMBAC Insured | 1/11 at 101.00 | N/R | | 1,946,342 | |
| | 500 | | Connecticut, Special Tax Obligation Transportation Infrastructure Purpose Bonds, Series 2003B, 5.000%, 1/01/23 – FGIC Insured | 1/14 at 100.00 | AA | | 534,130 | |
| | 1,750 | | Connecticut, Special Tax Obligation Transportation Infrastructure Purpose Revenue Bonds, Series 2007A, 5.000%, 8/01/27 – AMBAC Insured | 8/17 at 100.00 | AA | | 1,858,308 | |
| | 1,100 | | Harbor Point Infrastructure Improvement District, Connecticut, Special Obligation Revenue Bonds, Harbor Point Project, Series 2010A, 7.875%, 4/01/39 | 4/20 at 100.00 | N/R | | 1,152,954 | |
| | | | Puerto Rico Infrastructure Financing Authority, Special Tax Revenue Bonds, Series 2005A: | | | | | |
| | 960 | | 0.000%, 7/01/32 – FGIC Insured | No Opt. Call | A3 | | 236,534 | |
| | 2,615 | | 0.000%, 7/01/33 – FGIC Insured | No Opt. Call | A3 | | 596,482 | |
| | 2,000 | | Puerto Rico Municipal Finance Agency, Series 2002A, 5.250%, 8/01/21 – AGM Insured | 8/12 at 100.00 | AA+ | | 2,075,300 | |
| | 2,400 | | Puerto Rico Municipal Finance Agency, Series 2005C, 5.000%, 8/01/16 – AGM Insured | 8/15 at 100.00 | AA+ | | 2,579,736 | |
| | 975 | | Puerto Rico Sales Tax Financing Corporation, Sales Tax Revenue Bonds, First Subordinate Series 2010A, 5.375%, 8/01/39 | 2/20 at 100.00 | A+ | | 979,475 | |
| | 1,000 | | Virgin Islands Public Finance Authority, Gross Receipts Taxes Loan Note, Series 2003, 5.250%, 10/01/19 – AGM Insured | 10/14 at 100.00 | AA+ | | 1,066,700 | |
| | 895 | | Virgin Islands Public Finance Authority, Matching Fund Loan Notes Revenue Bonds, Senior Lien Series 2010A, 5.000%, 10/01/29 | 10/20 at 100.00 | BBB | | 879,928 | |
| | 18,440 | | Total Tax Obligation/Limited | | | | 16,250,470 | |
28 Nuveen Investments
| | Principal | | | Optional Call | | | | |
| | Amount (000) | | Description (1) | Provisions (2) | Ratings (3) | | Value | |
| | | | Transportation – 1.0% (0.7% of Total Investments) | | | | | |
| $ | 750 | | Connecticut, General Airport Revenue Bonds, Bradley International Airport, Series 2001A, 5.125%, 10/01/26 – NPFG Insured (Alternative Minimum Tax) | 4/11 at 101.00 | A | $ | 753,405 | |
| | | | U.S. Guaranteed – 13.3% (8.8% of Total Investments) (4) | | | | | |
| | 650 | | Connecticut Health and Educational Facilities Authority, Revenue Bonds, Loomis Chaffee School, Series 2001D, 5.500%, 7/01/23 (Pre-refunded 7/01/11) | 7/11 at 101.00 | N/R (4) | | 676,208 | |
| | 40 | | Connecticut, General Obligation Bonds, Series 1993E, 6.000%, 3/15/12 (ETM) | No Opt. Call | AA (4) | | 42,865 | |
| | 1,500 | | Connecticut, General Obligation Bonds, Series 2002B, 5.500%, 6/15/21 (Pre-refunded 6/15/12) | 6/12 at 100.00 | AA (4) | | 1,615,815 | |
| | | | Connecticut, Special Tax Obligation Transportation Infrastructure Purpose Bonds, Series 2002B: | | | | | |
| | 2,000 | | 5.000%, 12/01/20 (Pre-refunded 12/01/12) – AMBAC Insured | 12/12 at 100.00 | AA (4) | | 2,173,720 | |
| | 1,000 | | 5.000%, 12/01/21 (Pre-refunded 12/01/12) – AMBAC Insured | 12/12 at 100.00 | AA (4) | | 1,086,860 | |
| | 600 | | Guam Economic Development Authority, Tobacco Settlement Asset-Backed Bonds, Series 2001B, 5.500%, 5/15/41 (Pre-refunded 5/15/11) | 5/11 at 100.00 | N/R (4) | | 613,800 | |
| | 1,100 | | University of Connecticut, General Obligation Bonds, Series 2003A, 5.125%, 2/15/21 (Pre-refunded 2/15/13) – NPFG Insured | 2/13 at 100.00 | AA (4) | | 1,207,745 | |
| | 1,000 | | Waterbury, Connecticut, General Obligation Bonds, Series 2002A, 5.375%, 4/01/17 (Pre-refunded 4/01/12) – AGM Insured | 4/12 at 100.00 | AA+ (4) | | 1,062,680 | |
| | 1,500 | | West Hartford, Connecticut, General Obligation Bonds, Series 2005B, 5.000%, 10/01/18 (Pre-refunded 10/01/15) | 10/15 at 100.00 | AAA | | 1,736,400 | |
| | 9,390 | | Total U.S. Guaranteed | | | | 10,216,093 | |
| | | | Utilities – 8.5% (5.7% of Total Investments) | | | | | |
| | 1,150 | | Bristol Resource Recovery Facility Operating Committee, Connecticut, Solid Waste Revenue Bonds, Covanta Bristol Inc., Series 2005, 5.000%, 7/01/12 – AMBAC Insured | No Opt. Call | AA | | 1,221,542 | |
| | 1,000 | | Connecticut Development Authority, Pollution Control Revenue Refunding Bonds, Connecticut Light and Power Company, Series 1993A, 5.850%, 9/01/28 | 4/11 at 101.00 | Baa1 | | 1,010,440 | |
| | 1,070 | | Connecticut Development Authority, Solid Waste Disposal Facilities Revenue Bonds, PSEG Power LLC Project, Series 2007A, 5.750%, 11/01/37 (Alternative Minimum Tax) | 11/12 at 100.00 | Baa1 | | 1,054,100 | |
| | 1,750 | | Connecticut Resource Recovery Authority, Revenue Bonds, American Ref-Fuel Company of Southeastern Connecticut LP, Series 1998A-I, 5.500%, 11/15/15 (Alternative Minimum Tax) | 12/11 at 102.00 | Ba1 | | 1,726,270 | |
| | | | Eastern Connecticut Resource Recovery Authority, Solid Waste Revenue Bonds, Wheelabrator Lisbon Project, Series 1993A: | | | | | |
| | 260 | | 5.500%, 1/01/14 (Alternative Minimum Tax) | 1/11 at 100.00 | BBB | | 260,738 | |
| | 1,290 | | 5.500%, 1/01/20 (Alternative Minimum Tax) | 1/11 at 100.00 | BBB | | 1,290,232 | |
| | 6,520 | | Total Utilities | | | | 6,563,322 | |
| | | | Water and Sewer – 12.3% (8.2% of Total Investments) | | | | | |
| | 500 | | Connecticut Development Authority, Water Facility Revenue Bonds, Aquarion Water Company Project, Series 2007, 5.100%, 9/01/37 – SYNCORA GTY Insured (Alternative Minimum Tax) | 9/17 at 100.00 | N/R | | 440,075 | |
| | 1,185 | | Connecticut, State Revolving Fund General Revenue Bonds, Series 2003A, 5.000%, 10/01/16 | 10/13 at 100.00 | AAA | | 1,307,624 | |
| | | | Greater New Haven Water Pollution Control Authority, Connecticut, Regional Wastewater System Revenue Bonds, Series 2005A: | | | | | |
| | 1,520 | | 5.000%, 11/15/30 – NPFG Insured | 11/15 at 100.00 | A1 | | 1,543,286 | |
| | 2,260 | | 5.000%, 8/15/35 – NPFG Insured | 11/15 at 100.00 | A1 | | 2,268,814 | |
| | 725 | | Guam Government Waterworks Authority, Water and Wastewater System Revenue Bonds, Series 2010, 5.625%, 7/01/40 | 7/20 at 100.00 | Ba2 | | 681,718 | |
| | | | South Central Connecticut Regional Water Authority, Water System Revenue Bonds, Eighteenth Series 2003A: | | | | | |
| | 1,000 | | 5.000%, 8/01/20 – NPFG Insured | 8/13 at 100.00 | Aa3 | | 1,040,710 | |
| | 1,075 | | 5.000%, 8/01/33 – NPFG Insured | 8/13 at 100.00 | Aa3 | | 1,084,277 | |
Nuveen Investments 29
| | | Nuveen Connecticut Premium Income Municipal Fund (continued) |
| NTC | | Portfolio of Investments November 30, 2010 (Unaudited) |
| | Principal | | | Optional Call | | | | |
| | Amount (000) | | Description (1) | Provisions (2) | Ratings (3) | | Value | |
| | | | Water and Sewer (continued) | | | | | |
| $ | 1,100 | | Stamford, Connecticut, Water Pollution Control System and Facility Revenue Bonds, Series 2003A, 5.000%, 11/15/32 | 11/13 at 100.00 | AA+ | $ | 1,139,677 | |
| | 9,365 | | Total Water and Sewer | | | | 9,506,181 | |
| $ | 114,980 | | Total Investments (cost $114,202,210) – 150.2% | | | | 115,716,532 | |
| | | | Floating Rate Obligations – (10.3)% | | | | (7,965,000 | ) |
| | | | MuniFund Term Preferred Shares, at Liquidation Value – (23.8)% (5) | | | | (18,300,000 | ) |
| | | | Other Assets Less Liabilities – 4.3% | | | | 3,298,413 | |
| | | | Auction Rate Preferred Shares, at Liquidation Value – (20.4)% (5) | | | | (15,725,000 | ) |
| | | | Net Assets Applicable to Common Shares – 100% | | | $ | 77,024,945 | |
| (1) | | All percentages shown in the Portfolio of Investments are based on net assets applicable to Common shares unless otherwise noted. |
| (2) | | Optional Call Provisions: Dates (month and year) and prices of the earliest optional call or redemption. There may be other call provisions at varying prices at later dates. Certain mortgage-backed securities may be subject to periodic principal paydowns. |
| (3) | | Ratings: Using the highest of Standard & Poor’s Group (“Standard & Poor’s”), Moody’s Investor Service, Inc. (“Moody’s”) or Fitch, Inc. (“Fitch”) rating. Ratings below BBB by Standard & Poor’s, Baa by Moody’s or BBB by Fitch are considered to be below investment grade. Holdings designated N/R are not rated by any of these national rating agencies. |
| (4) | | Backed by an escrow or trust containing sufficient U.S. Government or U.S. Government agency securities, which ensure the timely payment of principal and interest. Such investments are normally considered to be equivalent to AAA rated securities. |
| (5) | | MuniFund Term Preferred Shares and Auction Rate Preferred Shares, at Liquidation Value as a percentage of Total Investments are 15.8% and 13.6%, respectively. |
| N/R | | Not rated. |
| (ETM) | | Escrowed to maturity. |
| (UB) | | Underlying bond of an inverse floating rate trust reflected as a financing transaction. See Notes to Financial Statements, Footnote 1 – General Information and Significant Accounting Policies, Inverse Floating Rate Securities for more information. |
See accompanying notes to financial statements.
30 Nuveen Investments
| | | Nuveen Connecticut Dividend Advantage Municipal Fund |
| NFC | | Portfolio of Investments |
November 30, 2010 (Unaudited)
| | Principal | | | Optional Call | | | | |
| | Amount (000) | | Description (1) | Provisions (2) | Ratings (3) | | Value | |
| | | | Education and Civic Organizations – 37.1% (23.2% of Total Investments) | | | | | |
| $ | 250 | | Connecticut Health and Educational Facilities Authority, Revenue Bonds, Canterbury School, Series 2006B, 5.000%, 7/01/36 – RAAI Insured | 7/16 at 100.00 | N/R | $ | 223,185 | |
| | 150 | | Connecticut Health and Educational Facilities Authority, Revenue Bonds, Chase Collegiate School, Series 2007A, 5.000%, 7/01/27 – RAAI Insured | 7/17 at 100.00 | N/R | | 141,279 | |
| | 500 | | Connecticut Health and Educational Facilities Authority, Revenue Bonds, Fairfield University, Series 2010-O, 5.000%, 7/01/40 | 7/20 at 100.00 | A– | | 501,490 | |
| | 440 | | Connecticut Health and Educational Facilities Authority, Revenue Bonds, Loomis Chaffee School, Series 2005F, 5.250%, 7/01/18 – AMBAC Insured | No Opt. Call | A2 | | 506,392 | |
| | 795 | | Connecticut Health and Educational Facilities Authority, Revenue Bonds, Quinnipiac University, Series 2007-I, 5.000%, 7/01/25 – NPFG Insured | 7/17 at 100.00 | A | | 821,990 | |
| | 130 | | Connecticut Health and Educational Facilities Authority, Revenue Bonds, Renbrook School, Series 2007A, 5.000%, 7/01/37 – AMBAC Insured | 7/17 at 100.00 | N/R | | 121,744 | |
| | 50 | | Connecticut Health and Educational Facilities Authority, Revenue Bonds, Sacred Heart University, Series 1998E, 5.000%, 7/01/28 – RAAI Insured | 1/11 at 100.00 | Baa2 | | 47,636 | |
| | 350 | | Connecticut Health and Educational Facilities Authority, Revenue Bonds, Trinity College, Series 2004H, 5.000%, 7/01/17 – NPFG Insured | 7/14 at 100.00 | A+ | | 388,465 | |
| | 1,000 | | Connecticut Health and Educational Facilities Authority, Revenue Bonds, University of Hartford, Series 2002E, 5.250%, 7/01/32 – RAAI Insured | 7/12 at 101.00 | BBB– | | 932,720 | |
| | 500 | | Connecticut Health and Educational Facilities Authority, Revenue Bonds, University of Hartford, Series 2006G, 5.250%, 7/01/36 – RAAI Insured | 7/16 at 100.00 | BBB– | | 447,650 | |
| | 1,600 | | Connecticut Health and Educational Facilities Authority, Revenue Bonds, Wesleyan University, Series 2010G, 5.000%, 7/01/35 | 7/20 at 100.00 | AA | | 1,649,727 | |
| | 500 | | Connecticut Health and Educational Facilities Authority, Revenue Bonds, Yale University, Series 2003X-1, 5.000%, 7/01/42 (UB) | 7/13 at 100.00 | AAA | | 508,280 | |
| | 1,800 | | Connecticut Health and Educational Facilities Authority, Revenue Bonds, Yale University, Series 2007Z-1, 5.000%, 7/01/42 (UB) | 7/16 at 100.00 | AAA | | 1,865,088 | |
| | 3,050 | | Connecticut Health and Educational Facilities Authority, Revenue Bonds, Yale University, Series 2007Z-3, 5.050%, 7/01/42 (UB) | 7/17 at 100.00 | AAA | | 3,186,122 | |
| | 475 | | Connecticut Higher Education Supplemental Loan Authority, Revenue Bonds, Family Education Loan Program, Series 2001A, 5.250%, 11/15/18 – NPFG Insured (Alternative Minimum Tax) | 11/11 at 100.00 | Aa2 | | 481,137 | |
| | | | Puerto Rico Industrial, Tourist, Educational, Medical and Environmental Control Facilities Financing Authority, Higher Education Revenue Bonds, Ana G. Mendez University System, Series 1999: | | | | | |
| | 125 | | 5.375%, 2/01/19 | 2/11 at 100.00 | BBB– | | 125,081 | |
| | 270 | | 5.375%, 2/01/29 | 2/11 at 100.00 | BBB– | | 259,243 | |
| | 485 | | University of Connecticut, General Obligation Bonds, Series 2006A, 5.000%, 2/15/23 – FGIC Insured | 2/16 at 100.00 | AA | | 521,729 | |
| | 1,070 | | University of Connecticut, General Obligation Bonds, Series 2010A, 5.000%, 2/15/28 | 2/20 at 100.00 | AA | | 1,157,248 | |
| | 115 | | University of Connecticut, Student Fee Revenue Bonds, Refunding Series 2010A, 5.000%, 11/15/27 | 11/19 at 100.00 | Aa2 | | 124,803 | |
| | 13,655 | | Total Education and Civic Organizations | | | | 14,011,009 | |
| | | | Health Care – 19.7% (12.3% of Total Investments) | | | | | |
| | 1,400 | | Connecticut Health and Educational Facilities Authority, Revenue Bonds, Bristol Hospital, Series 2002B, 5.500%, 7/01/32 – RAAI Insured | 7/12 at 101.00 | N/R | | 1,264,158 | |
| | 25 | | Connecticut Health and Educational Facilities Authority, Revenue Bonds, Danbury Hospital, Series 1999G, 5.700%, 7/01/22 – AMBAC Insured | 1/11 at 100.50 | N/R | | 25,101 | |
| | 840 | | Connecticut Health and Educational Facilities Authority, Revenue Bonds, Eastern Connecticut Health Network, Series 2005, 5.000%, 7/01/25 – RAAI Insured | 7/15 at 100.00 | N/R | | 750,784 | |
Nuveen Investments 31
| | | Nuveen Connecticut Dividend Advantage Municipal Fund (continued) |
| NFC | | Portfolio of Investments November 30, 2010 (Unaudited) |
| | Principal | | | Optional Call | | | | |
| | Amount (000) | | Description (1) | Provisions (2) | Ratings (3) | | Value | |
| | | | Health Care (continued) | | | | | |
| | | | Connecticut Health and Educational Facilities Authority, Revenue Bonds, Griffin Hospital, Series 2005B: | | | | | |
| $ | 500 | | 5.000%, 7/01/20 – RAAI Insured | 7/15 at 100.00 | N/R | $ | 493,245 | |
| | 250 | | 5.000%, 7/01/23 – RAAI Insured | 7/15 at 100.00 | N/R | | 235,490 | |
| | 185 | | Connecticut Health and Educational Facilities Authority, Revenue Bonds, Hospital For Special Care, Series 2007C, 5.250%,
7/01/32 – RAAI Insured | 7/17 at 100.00 | BBB– | | 170,206 | |
| | 60 | | Connecticut Health and Educational Facilities Authority, Revenue Bonds, Middlesex Hospital, Series 2006, 5.000%, 7/01/32 – AGM Insured | 7/16 at 100.00 | Aa3 | | 60,186 | |
| | 200 | | Connecticut Health and Educational Facilities Authority, Revenue Bonds, Stamford Hospital, Series 2010-I, 5.000%, 7/01/30 | 7/20 at 100.00 | A | | 202,270 | |
| | 1,870 | | Connecticut Health and Educational Facilities Authority, Revenue Bonds, Yale-New Haven Hospital, Series 2006J-1, 5.000%, 7/01/31 – AMBAC Insured | 7/16 at 100.00 | Aa3 | | 1,883,949 | |
| | 500 | | Connecticut Health and Educational Facilities Authority, Revenue Bonds, Ascension Health Series 2010A, 5.000%, 11/15/40 | 11/19 at 100.00 | Aa1 | | 506,475 | |
| | 175 | | Connecticut Health and Educational Facilities Authority, Revenue Bonds, Catholic Health East Series 2010, 4.750%, 11/15/29 | 11/20 at 100.00 | A1 | | 172,204 | |
| | 1,600 | | Monroe County Industrial Development Corporation, New York, FHA Insured Mortgage Revenue Bonds, Unity Hospital of Rochester Project, Series 2010, 5.500%, 8/15/40 | 2/21 at 100.00 | Aa2 | | 1,691,279 | |
| | 7,605 | | Total Health Care | | | | 7,455,347 | |
| | | | Housing/Multifamily – 1.3% (0.8% of Total Investments) | | | | | |
| | 480 | | Connecticut Housing Finance Authority, Multifamily Housing Mortgage Finance Program Bonds, Series 2006G-2, 4.800%, 11/15/27 (Alternative Minimum Tax) | 11/15 at 100.00 | AAA | | 478,555 | |
| | | | Housing/Single Family – 9.4% (5.9% of Total Investments) | | | | | |
| | | | Connecticut Housing Finance Authority, Housing Mortgage Finance Program Bonds, Series 2001C: | | | | | |
| | 1,000 | | 5.300%, 11/15/33 (Alternative Minimum Tax) | 5/11 at 100.00 | AAA | | 999,990 | |
| | 250 | | 5.450%, 11/15/43 (Alternative Minimum Tax) | 5/11 at 100.00 | AAA | | 250,010 | |
| | 800 | | Connecticut Housing Finance Authority, Housing Mortgage Finance Program Bonds, Series 2004-A5, 5.050%, 11/15/34 | 5/13 at 100.00 | AAA | | 810,112 | |
| | 685 | | Connecticut Housing Finance Authority, Housing Mortgage Finance Program Bonds, Series 2006D, 4.650%, 11/15/27 | 5/16 at 100.00 | AAA | | 687,014 | |
| | 800 | | Connecticut Housing Finance Authority, Single Family Housing Mortgage Finance Program Bonds, Series 2010-A2, 4.750%, 11/15/35 | 11/19 at 100.00 | AAA | | 805,208 | |
| | 3,535 | | Total Housing/Single Family | | | | 3,552,334 | |
| | | | Long-Term Care – 2.0% (1.2% of Total Investments) | | | | | |
| | 300 | | Connecticut Development Authority, First Mortgage Gross Revenue Healthcare Bonds, Elim Park Baptist Home Inc., Series 2003, 5.750%, 12/01/23 | 12/11 at 102.00 | BBB+ | | 304,026 | |
| | 110 | | Connecticut Development Authority, First Mortgage Gross Revenue Refunding Healthcare Bonds, Church Homes Inc. –
Congregational Avery Heights, Series 1997, 5.800%, 4/01/21 | 4/11 at 100.00 | BBB– | | 109,148 | |
| | 250 | | Connecticut State Development Authority, Health Facilities Revenue Bonds, Alzheimer’s Resource Center of Connecticut, Inc., Series 2007, 5.500%, 8/15/27 | 8/17 at 100.00 | N/R | | 222,618 | |
| | 105 | | Hamden, Connecticut, Facility Revenue Bonds, Whitney Center Project, Series 2009A, 7.625%, 1/01/30 | 1/20 at 100.00 | N/R | | 110,522 | |
| | 765 | | Total Long-Term Care | | | | 746,314 | |
32 Nuveen Investments
| | Principal | | | Optional Call | | | | |
| | Amount (000) | | Description (1) | Provisions (2) | Ratings (3) | | Value | |
| | | | Tax Obligation/General – 8.8% (5.5% of Total Investments) | | | | | |
| $ | 560 | | Connecticut State, General Obligation Bonds, Series 2004C, 5.000%, 4/01/23 – FGIC Insured | 4/14 at 100.00 | AA | $ | 598,847 | |
| | 700 | | Connecticut State, General Obligation Bonds, Series 2006A, 4.750%, 12/15/24 | 12/16 at 100.00 | AA | | 742,413 | |
| | 100 | | Connecticut State, General Obligation Bonds, Series 2006C, 5.000%, 6/01/23 – AGM Insured | 6/16 at 100.00 | AA+ | | 107,542 | |
| | | | Hartford, Connecticut, General Obligation Bonds, Series 2005A: | | | | | |
| | 360 | | 5.000%, 8/01/21 – AGM Insured | 8/15 at 100.00 | AA+ | | 386,075 | |
| | 240 | | 4.375%, 8/01/24 – AGM Insured | 8/15 at 100.00 | AA+ | | 244,370 | |
| | 400 | | North Haven, Connecticut, General Obligation Bonds, Series 2006, 5.000%, 7/15/24 | No Opt. Call | Aa1 | | 463,620 | |
| | | | Suffield, Connecticut, General Obligation Bonds, Series 2005: | | | | | |
| | 335 | | 5.000%, 6/15/17 | No Opt. Call | AA+ | | 398,369 | |
| | 335 | | 5.000%, 6/15/19 | No Opt. Call | AA+ | | 398,285 | |
| | 3,030 | | Total Tax Obligation/General | | | | 3,339,521 | |
| | | | Tax Obligation/Limited – 27.1% (16.9% of Total Investments) | | | | | |
| | | | Connecticut Health and Educational Facilities Authority, Child Care Facilities Program Revenue Bonds, Series 2006F: | | | | | |
| | 650 | | 5.000%, 7/01/31 – AGC Insured | 7/16 at 100.00 | AA+ | | 665,386 | |
| | 500 | | 5.000%, 7/01/36 – AGC Insured | 7/16 at 100.00 | AA+ | | 506,905 | |
| | 1,000 | | Connecticut Health and Educational Facilities Authority, Revenue Bonds, New Opportunities for Waterbury Inc., Series 1998A, 6.750%, 7/01/28 | 1/11 at 103.00 | A | | 1,040,670 | |
| | | | Connecticut, Certificates of Participation, Juvenile Training School, Series 2001: | | | | | |
| | 600 | | 5.000%, 12/15/20 | 12/11 at 101.00 | AA– | | 626,436 | |
| | 1,000 | | 5.000%, 12/15/30 | 12/11 at 101.00 | AA– | | 1,010,700 | |
| | 1,475 | | Connecticut, Special Tax Obligation Transportation Infrastructure Purpose Bonds, Series 1998B, 5.500%, 11/01/12 – AGM Insured | No Opt. Call | AA+ | | 1,611,172 | |
| | 900 | | Connecticut, Special Tax Obligation Transportation Infrastructure Purpose Revenue Bonds, Series 2007A, 5.000%, 8/01/27 – AMBAC Insured | 8/17 at 100.00 | AA | | 955,701 | |
| | 500 | | Harbor Point Infrastructure Improvement District, Connecticut, Special Obligation Revenue Bonds, Harbor Point Project, Series 2010A, 7.875%, 4/01/39 | 4/20 at 100.00 | N/R | | 524,070 | |
| | 600 | | Puerto Rico Highway and Transportation Authority, Highway Revenue Bonds, Series 2007N, 5.250%, 7/01/31 – AMBAC Insured | No Opt. Call | A3 | | 601,470 | |
| | 470 | | Puerto Rico Infrastructure Financing Authority, Special Tax Revenue Bonds, Series 2005A, 0.000%, 7/01/32 – FGIC Insured | No Opt. Call | A3 | | 115,803 | |
| | 1,200 | | Puerto Rico Municipal Finance Agency, Series 2005C, 5.000%, 8/01/16 – AGM Insured | 8/15 at 100.00 | AA+ | | 1,289,868 | |
| | 325 | | Puerto Rico Sales Tax Financing Corporation, Sales Tax Revenue Bonds, First Subordinate Series 2010A, 5.375%, 8/01/39 | 2/20 at 100.00 | A+ | | 326,492 | |
| | 750 | | Virgin Islands Public Finance Authority, Gross Receipts Taxes Loan Note, Series 1999A, 6.375%, 10/01/19 | 4/11 at 101.00 | BBB+ | | 758,955 | |
| | 210 | | Virgin Islands Public Finance Authority, Matching Fund Loan Notes Revenue Bonds, Senior Lien Series 2010A, 5.000%, 10/01/29 | 10/20 at 100.00 | BBB | | 206,464 | |
| | 10,180 | | Total Tax Obligation/Limited | | | | 10,240,092 | |
| | | | Transportation – 6.7% (4.2% of Total Investments) | | | | | |
| | 2,500 | | Connecticut, General Airport Revenue Bonds, Bradley International Airport, Series 2001A, 5.125%, 10/01/26 – NPFG Insured (Alternative Minimum Tax) | 4/11 at 101.00 | A | | 2,511,349 | |
Nuveen Investments 33
| | | Nuveen Connecticut Dividend Advantage Municipal Fund (continued) |
| NFC | | Portfolio of Investments November 30, 2010 (Unaudited) |
| | Principal | | | Optional Call | | | | |
| | Amount (000) | | Description (1) | Provisions (2) | Ratings (3) | | Value | |
| | | | U.S. Guaranteed – 27.3% (17.0% of Total Investments) (4) | | | | | |
| $ | 1,000 | | Connecticut Health and Educational Facilities Authority, Revenue Bonds, Loomis Chaffee School, Series 2001D, 5.500%, 7/01/23 (Pre-refunded 7/01/11) | 7/11 at 101.00 | N/R (4) | $ | 1,040,320 | |
| | 2,000 | | Connecticut, Clean Water Fund Revenue Bonds, Series 2001, 5.500%, 10/01/20 (Pre-refunded 10/01/11) | 10/11 at 100.00 | AAA | | 2,086,339 | |
| | 500 | | Connecticut, General Obligation Bonds, Series 2002B, 5.500%, 6/15/21 (Pre-refunded 6/15/12) | 6/12 at 100.00 | AA (4) | | 538,605 | |
| | 500 | | East Lyme, Connecticut, General Obligation Bonds, Series 2001, 5.125%, 7/15/20 (Pre-refunded 7/15/11) – FGIC Insured | 7/11 at 102.00 | Aa2 (4) | | 525,270 | |
| | | | Guam Economic Development Authority, Tobacco Settlement Asset-Backed Bonds, Series 2001A: | | | | | |
| | 25 | | 5.000%, 5/15/22 (Pre-refunded 5/15/11) | 5/11 at 100.00 | N/R (4) | | 25,518 | |
| | 500 | | 5.400%, 5/15/31 (Pre-refunded 5/15/11) | 5/11 at 100.00 | N/R (4) | | 510,450 | |
| | 1,270 | | Guam Economic Development Authority, Tobacco Settlement Asset-Backed Bonds, Series 2001B, 5.500%, 5/15/41 (Pre-refunded 5/15/11) | 5/11 at 100.00 | N/R (4) | | 1,299,210 | |
| | 220 | | New Haven, Connecticut, General Obligation Bonds, Series 2001A, 5.000%, 11/01/20 (Pre-refunded 11/01/11) – FGIC Insured | 11/11 at 100.00 | A1 (4) | | 223,065 | |
| | | | University of Connecticut, General Obligation Bonds, Series 2001A: | | | | | |
| | 1,000 | | 4.750%, 4/01/20 (Pre-refunded 4/01/11) | 4/11 at 101.00 | AA (4) | | 1,024,980 | |
| | 1,000 | | 4.750%, 4/01/21 (Pre-refunded 4/01/11) | 4/11 at 101.00 | AA (4) | | 1,024,980 | |
| | 1,000 | | Waterbury, Connecticut, General Obligation Bonds, Series 2002A, 5.375%, 4/01/17 (Pre-refunded 4/01/12) – AGM Insured | 4/12 at 100.00 | AA+ (4) | | 1,062,680 | |
| | 810 | | West Hartford, Connecticut, General Obligation Bonds, Series 2005B, 5.000%, 10/01/18 (Pre-refunded 10/01/15) | 10/15 at 100.00 | AAA | | 937,656 | |
| | 9,825 | | Total U.S. Guaranteed | | | | 10,299,073 | |
| | | | Utilities – 7.2% (4.5% of Total Investments) | | | | | |
| | 500 | | Connecticut Development Authority, Pollution Control Revenue Refunding Bonds, Connecticut Light and Power Company, Series 1993A, 5.850%, 9/01/28 | 4/11 at 101.00 | Baa1 | | 505,220 | |
| | 560 | | Connecticut Development Authority, Solid Waste Disposal Facilities Revenue Bonds, PSEG Power LLC Project, Series 2007A, 5.750%, 11/01/37 (Alternative Minimum Tax) | 11/12 at 100.00 | Baa1 | | 551,678 | |
| | 1,000 | | Connecticut Resource Recovery Authority, Revenue Bonds, American Ref-Fuel Company of Southeastern Connecticut LP, Series 1998A-I, 5.500%, 11/15/15 (Alternative Minimum Tax) | 12/11 at 102.00 | Ba1 | | 986,440 | |
| | 665 | | Eastern Connecticut Resource Recovery Authority, Solid Waste Revenue Bonds, Wheelabrator Lisbon Project, Series 1993A, 5.500%, 1/01/14 (Alternative Minimum Tax) | 1/11 at 100.00 | BBB | | 666,889 | |
| | 2,725 | | Total Utilities | | | | 2,710,227 | |
| | | | Water and Sewer – 13.6% (8.5% of Total Investments) | | | | | |
| | 255 | | Connecticut Development Authority, Water Facility Revenue Bonds, Aquarion Water Company Project, Series 2007, 5.100%, 9/01/37 – SYNCORA GTY Insured (Alternative Minimum Tax) | 9/17 at 100.00 | N/R | | 224,438 | |
| | 1,185 | | Connecticut, State Revolving Fund General Revenue Bonds, Series 2003A, 5.000%, 10/01/16 | 10/13 at 100.00 | AAA | | 1,307,624 | |
| | | | Greater New Haven Water Pollution Control Authority, Connecticut, Regional Wastewater System Revenue Bonds, Series 2005A: | | | | | |
| | 720 | | 5.000%, 11/15/30 – NPFG Insured | 11/15 at 100.00 | A1 | | 731,030 | |
| | 1,110 | | 5.000%, 8/15/35 – NPFG Insured | 11/15 at 100.00 | A1 | | 1,114,329 | |
| | 140 | | Guam Government Waterworks Authority, Water and Wastewater System Revenue Bonds, Series 2005, 6.000%, 7/01/25 | 7/15 at 100.00 | Ba2 | | 141,750 | |
34 Nuveen Investments
| | Principal | | | Optional Call | | | | |
| | Amount (000) | | Description (1) | Provisions (2) | Ratings (3) | | Value | |
| | | | Water and Sewer (continued) | | | | | |
| $ | 375 | | Guam Government Waterworks Authority, Water and Wastewater System Revenue Bonds, Series 2010, 5.625%, 7/01/40 | 7/20 at 100.00 | Ba2 | $ | 352,613 | |
| | | | South Central Connecticut Regional Water Authority, Water System Revenue Bonds, Eighteenth Series 2003A: | | | | | |
| | 750 | | 5.000%, 8/01/20 – NPFG Insured | 8/13 at 100.00 | Aa3 | | 780,533 | |
| | 470 | | 5.000%, 8/01/33 – NPFG Insured | 8/13 at 100.00 | Aa3 | | 474,056 | |
| | 5,005 | | Total Water and Sewer | | | | 5,126,373 | |
| $ | 59,305 | | Total Investments (cost $59,731,487) – 160.2% | | | | 60,470,194 | |
| | | | Floating Rate Obligations – (10.1)% | | | | (3,820,000 | ) |
| | | | MuniFund Term Preferred Shares, at Liquidation Value – (54.2)% (5) | | | | (20,470,000 | ) |
| | | | Other Assets Less Liabilities – 4.1% | | | | 1,573,417 | |
| | | | Net Assets Applicable to Common Shares – 100% | | | $ | 37,753,611 | |
| (1) | | All percentages shown in the Portfolio of Investments are based on net assets applicable to Common shares unless otherwise noted. |
| (2) | | Optional Call Provisions: Dates (month and year) and prices of the earliest optional call or redemption. There may be other call provisions at varying prices at later dates. Certain mortgage-backed securities may be subject to periodic principal paydowns. |
| (3) | | Ratings: Using the highest of Standard & Poor’s Group (“Standard & Poor’s”), Moody’s Investor Service, Inc. (“Moody’s”) or Fitch, Inc. (“Fitch”) rating. Ratings below BBB by Standard & Poor’s, Baa by Moody’s or BBB by Fitch are considered to be below investment grade. Holdings designated N/R are not rated by any of these national rating agencies. |
| (4) | | Backed by an escrow or trust containing sufficient U.S. Government or U.S. Government agency securities, which ensure the timely payment of principal and interest. Such investments are normally considered to be equivalent to AAA rated securities. |
| (5) | | MuniFund Term Preferred Shares, at Liquidation Value as a percentage of Total Investments is 33.9%. |
| N/R | | Not rated. |
| (UB) | | Underlying bond of an inverse floating rate trust reflected as a financing transaction. See Notes to Financial Statements, Footnote 1 – General Information and Significant Accounting Policies, Inverse Floating Rate Securities for more information. |
See accompanying notes to financial statements.
Nuveen Investments 35
| | | Nuveen Connecticut Dividend Advantage Municipal Fund 2 |
| NGK | | Portfolio of Investments |
November 30, 2010 (Unaudited)
| | Principal | | | Optional Call | | | | |
| | Amount (000) | | Description (1) | Provisions (2) | Ratings (3) | | Value | |
| | | | Consumer Staples – 1.9% (1.2% of Total Investments) | | | | | |
| $ | 655 | | Puerto Rico, The Children’s Trust Fund, Tobacco Settlement Asset-Backed Refunding Bonds, Series 2002, 5.375%, 5/15/33 | 5/12 at 100.00 | BBB | $ | 635,461 | |
| | | | Education and Civic Organizations – 34.8% (22.6% of Total Investments) | | | | | |
| | 200 | | Connecticut Health and Educational Facilities Authority, Revenue Bonds, Canterbury School, Series 2006B, 5.000%, 7/01/36 – RAAI Insured | 7/16 at 100.00 | N/R | | 178,548 | |
| | 135 | | Connecticut Health and Educational Facilities Authority, Revenue Bonds, Chase Collegiate School, Series 2007A, 5.000%, 7/01/27 – RAAI Insured | 7/17 at 100.00 | N/R | | 127,151 | |
| | 500 | | Connecticut Health and Educational Facilities Authority, Revenue Bonds, Fairfield University, Series 2010-O, 5.000%, 7/01/40 | 7/20 at 100.00 | A– | | 501,490 | |
| | 310 | | Connecticut Health and Educational Facilities Authority, Revenue Bonds, Loomis Chaffee School, Series 2005F, 5.250%, 7/01/19 – AMBAC Insured | No Opt. Call | A2 | | 354,869 | |
| | 715 | | Connecticut Health and Educational Facilities Authority, Revenue Bonds, Quinnipiac University, Series 2007-I, 5.000%, 7/01/25 – NPFG Insured | 7/17 at 100.00 | A | | 739,274 | |
| | 120 | | Connecticut Health and Educational Facilities Authority, Revenue Bonds, Renbrook School, Series 2007A, 5.000%, 7/01/37 – AMBAC Insured | 7/17 at 100.00 | N/R | | 112,379 | |
| | | | Connecticut Health and Educational Facilities Authority, Revenue Bonds, University of Hartford, Series 2002E: | | | | | |
| | 590 | | 5.500%, 7/01/22 – RAAI Insured | 7/12 at 101.00 | BBB– | | 600,414 | |
| | 1,000 | | 5.250%, 7/01/32 – RAAI Insured | 7/12 at 101.00 | BBB– | | 932,720 | |
| | 500 | | Connecticut Health and Educational Facilities Authority, Revenue Bonds, University of Hartford, Series 2006G, 5.250%, 7/01/36 – RAAI Insured | 7/16 at 100.00 | BBB– | | 447,650 | |
| | 800 | | Connecticut Health and Educational Facilities Authority, Revenue Bonds, Wesleyan University, Series 2010G, 5.000%, 7/01/35 | 7/20 at 100.00 | AA | | 824,864 | |
| | 500 | | Connecticut Health and Educational Facilities Authority, Revenue Bonds, Yale University, Series 2003X-1, 5.000%, 7/01/42 (UB) | 7/13 at 100.00 | AAA | | 508,280 | |
| | 1,600 | | Connecticut Health and Educational Facilities Authority, Revenue Bonds, Yale University, Series 2007Z-1, 5.000%, 7/01/42 (UB) | 7/16 at 100.00 | AAA | | 1,657,856 | |
| | 2,750 | | Connecticut Health and Educational Facilities Authority, Revenue Bonds, Yale University, Series 2007Z-3, 5.050%, 7/01/42 (UB) | 7/17 at 100.00 | AAA | | 2,872,733 | |
| | | | University of Connecticut, General Obligation Bonds, Series 2006A: | | | | | |
| | 450 | | 5.000%, 2/15/19 – FGIC Insured | 2/16 at 100.00 | AA | | 503,739 | |
| | 490 | | 5.000%, 2/15/23 – FGIC Insured | 2/16 at 100.00 | AA | | 527,108 | |
| | 460 | | University of Connecticut, General Obligation Bonds, Series 2010A, 5.000%, 2/15/28 | 2/20 at 100.00 | AA | | 497,508 | |
| | 500 | | University of Connecticut, Student Fee Revenue Refunding Bonds, Series 2002A, 5.250%, 11/15/22 – FGIC Insured | 11/12 at 101.00 | Aa2 | | 524,290 | |
| | 11,620 | | Total Education and Civic Organizations | | | | 11,910,873 | |
| | | | Health Care – 21.7% (14.0% of Total Investments) | | | | | |
| | 300 | | Connecticut Health and Educational Facilities Authority, Revenue Bonds, Bristol Hospital, Series 2002B, 5.500%, 7/01/32 – RAAI Insured | 7/12 at 101.00 | N/R | | 270,891 | |
| | | | Connecticut Health and Educational Facilities Authority, Revenue Bonds, Eastern Connecticut Health Network, Series 2000A: | | | | | |
| | 20 | | 6.125%, 7/01/20 – RAAI Insured | 7/11 at 100.00 | N/R | | 20,091 | |
| | 315 | | 6.000%, 7/01/25 – RAAI Insured | 7/11 at 100.00 | N/R | | 314,676 | |
| | | | Connecticut Health and Educational Facilities Authority, Revenue Bonds, Griffin Hospital, Series 2005B: | | | | | |
| | 400 | | 5.000%, 7/01/15 – RAAI Insured | No Opt. Call | N/R | | 421,220 | |
| | 300 | | 5.000%, 7/01/20 – RAAI Insured | 7/15 at 100.00 | N/R | | 295,947 | |
| | 300 | | 5.000%, 7/01/23 – RAAI Insured | 7/15 at 100.00 | N/R | | 282,588 | |
| | 170 | | Connecticut Health and Educational Facilities Authority, Revenue Bonds, Hospital For Special Care, Series 2007C, 5.250%,
7/01/32 – RAAI Insured | 7/17 at 100.00 | BBB– | | 156,405 | |
| | 1,190 | | Connecticut Health and Educational Facilities Authority, Revenue Bonds, Middlesex Hospital, Series 2006, 5.000%, 7/01/32 – AGM Insured | 7/16 at 100.00 | Aa3 | | 1,193,689 | |
36 Nuveen Investments
| | Principal | | | Optional Call | | | | |
| | Amount (000) | | Description (1) | Provisions (2) | Ratings (3) | | Value | |
| | | | Health Care (continued) | | | | | |
| $ | 1,000 | | Connecticut Health and Educational Facilities Authority, Revenue Bonds, St. Francis Hospital and Medical Center, Series 2002D, 5.000%, 7/01/22 – RAAI Insured | 7/12 at 101.00 | N/R | $ | 906,410 | |
| | 200 | | Connecticut Health and Educational Facilities Authority, Revenue Bonds, Stamford Hospital, Series 2010-I, 5.000%, 7/01/30 | 7/20 at 100.00 | A | | 202,270 | |
| | 1,170 | | Connecticut Health and Educational Facilities Authority, Revenue Bonds, Yale-New Haven Hospital, Series 2006J-1, 5.000%, 7/01/31 – AMBAC Insured | 7/16 at 100.00 | Aa3 | | 1,178,728 | |
| | 500 | | Connecticut Health and Educational Facilities Authority, Revenue Bonds, Ascension Health Series 2010A, 5.000%, 11/15/40 | 11/19 at 100.00 | Aa1 | | 506,475 | |
| | 175 | | Connecticut Health and Educational Facilities Authority, Revenue Bonds, Catholic Health East Series 2010, 4.750%, 11/15/29 | 11/20 at 100.00 | A1 | | 172,204 | |
| | 1,400 | | Monroe County Industrial Development Corporation, New York, FHA Insured Mortgage Revenue Bonds, Unity Hospital of Rochester Project, Series 2010, 5.500%, 8/15/40 | 2/21 at 100.00 | Aa2 | | 1,479,870 | |
| | 7,440 | | Total Health Care | | | | 7,401,464 | |
| | | | Housing/Multifamily – 1.4% (0.9% of Total Investments) | | | | | |
| | 480 | | Connecticut Housing Finance Authority, Multifamily Housing Mortgage Finance Program Bonds, Series 2006G-2, 4.800%, 11/15/27 (Alternative Minimum Tax) | 11/15 at 100.00 | AAA | | 478,555 | |
| | | | Housing/Single Family – 8.4% (5.5% of Total Investments) | | | | | |
| | 250 | | Connecticut Housing Finance Authority, Housing Mortgage Finance Program Bonds, Series 2001C, 5.450%, 11/15/43 (Alternative Minimum Tax) | 5/11 at 100.00 | AAA | | 250,010 | |
| | 700 | | Connecticut Housing Finance Authority, Housing Mortgage Finance Program Bonds, Series 2004-A5, 5.050%, 11/15/34 | 5/13 at 100.00 | AAA | | 708,848 | |
| | | | Connecticut Housing Finance Authority, Housing Mortgage Finance Program Bonds, Series 2006-A1: | | | | | |
| | 305 | | 4.700%, 11/15/26 (Alternative Minimum Tax) | 11/15 at 100.00 | AAA | | 300,983 | |
| | 330 | | 4.800%, 11/15/31 (Alternative Minimum Tax) | 11/15 at 100.00 | AAA | | 320,648 | |
| | 585 | | Connecticut Housing Finance Authority, Housing Mortgage Finance Program Bonds, Series 2006D, 4.650%, 11/15/27 | 5/16 at 100.00 | AAA | | 586,720 | |
| | 700 | | Connecticut Housing Finance Authority, Single Family Housing Mortgage Finance Program Bonds, Series 2010-A2, 4.750%, 11/15/35 | 11/19 at 100.00 | AAA | | 704,557 | |
| | 2,870 | | Total Housing/Single Family | | | | 2,871,766 | |
| | | | Long-Term Care – 3.7% (2.4% of Total Investments) | | | | | |
| | 320 | | Connecticut Development Authority, First Mortgage Gross Revenue Healthcare Bonds, Elim Park Baptist Home Inc., Series 2003, 5.750%, 12/01/23 | 12/11 at 102.00 | BBB+ | | 324,294 | |
| | 140 | | Connecticut Development Authority, First Mortgage Gross Revenue Refunding Healthcare Bonds, Church Homes Inc. –
Congregational Avery Heights, Series 1997, 5.700%, 4/01/12 | 4/11 at 100.00 | BBB– | | 140,211 | |
| | 450 | | Connecticut Health and Educational Facilities Authority, Revenue Bonds, Village for Families and Children Inc., Series 2002A, 5.000%, 7/01/19 – AMBAC Insured | 7/12 at 101.00 | N/R | | 451,931 | |
| | 250 | | Connecticut State Development Authority, Health Facilities Revenue Bonds, Alzheimer’s Resource Center of Connecticut, Inc., Series 2007, 5.500%, 8/15/27 | 8/17 at 100.00 | N/R | | 222,618 | |
| | 105 | | Hamden, Connecticut, Facility Revenue Bonds, Whitney Center Project, Series 2009A, 7.625%, 1/01/30 | 1/20 at 100.00 | N/R | | 110,522 | |
| | 1,265 | | Total Long-Term Care | | | | 1,249,576 | |
| | | | Tax Obligation/General – 8.2% (5.3% of Total Investments) | | | | | |
| | 600 | | Connecticut State, General Obligation Bonds, Series 2006A, 4.750%, 12/15/24 | 12/16 at 100.00 | AA | | 636,354 | |
| | 400 | | Connecticut State, General Obligation Bonds, Series 2006C, 5.000%, 6/01/23 – AGM Insured | 6/16 at 100.00 | AA+ | | 430,168 | |
| | | | Hartford, Connecticut, General Obligation Bonds, Series 2005A: | | | | | |
| | 360 | | 5.000%, 8/01/21 – AGM Insured | 8/15 at 100.00 | AA+ | | 386,075 | |
| | 140 | | 4.375%, 8/01/24 – AGM Insured | 8/15 at 100.00 | AA+ | | 142,549 | |
| | 650 | | New Haven, Connecticut, General Obligation Bonds, Series 2006, 5.000%, 11/01/17 – AMBAC Insured | 11/16 at 100.00 | A1 | | 728,546 | |
| | 400 | | Suffield, Connecticut, General Obligation Bonds, Series 2005, 5.000%, 6/15/21 | No Opt. Call | AA+ | | 471,400 | |
| | 2,550 | | Total Tax Obligation/General | | | | 2,795,092 | |
| | | Nuveen Connecticut Dividend Advantage Municipal Fund 2 (continued) |
| NGK | | Portfolio of Investments November 30, 2010 (Unaudited) |
| | Principal | | | Optional Call | | | | |
| | Amount (000) | | Description (1) | Provisions (2) | Ratings (3) | | Value | |
| | | | Tax Obligation/Limited – 15.2% (9.8% of Total Investments) | | | | | |
| | | | Connecticut Health and Educational Facilities Authority, Child Care Facilities Program Revenue Bonds, Series 2006F: | | | | | |
| $ | 575 | | 5.000%, 7/01/31 – AGC Insured | 7/16 at 100.00 | AA+ | $ | 588,610 | |
| | 500 | | 5.000%, 7/01/36 – AGC Insured | 7/16 at 100.00 | AA+ | | 506,905 | |
| | 500 | | Connecticut, Special Tax Obligation Transportation Infrastructure Purpose Bonds, Series 2001B, 5.375%, 10/01/13 – AGM Insured | 10/11 at 100.00 | AA+ | | 519,640 | |
| | 850 | | Connecticut, Special Tax Obligation Transportation Infrastructure Purpose Revenue Bonds, Series 2007A, 5.000%, 8/01/27 – AMBAC Insured | 8/17 at 100.00 | AA | | 902,607 | |
| | 500 | | Harbor Point Infrastructure Improvement District, Connecticut, Special Obligation Revenue Bonds, Harbor Point Project, Series 2010A, 7.875%, 4/01/39 | 4/20 at 100.00 | N/R | | 524,070 | |
| | 500 | | Puerto Rico Highway and Transportation Authority, Highway Revenue Bonds, Series 2007N, 5.250% , 7/01/31 – AMBAC Insured | No Opt. Call | A3 | | 501,225 | |
| | 430 | | Puerto Rico Infrastructure Financing Authority, Special Tax Revenue Bonds, Series 2005A, 0.000%, 7/01/32 – FGIC Insured | No Opt. Call | A3 | | 105,948 | |
| | 750 | | Puerto Rico Municipal Finance Agency, Series 2005C, 5.000%, 8/01/16 – AGM Insured | 8/15 at 100.00 | AA+ | | 806,168 | |
| | 325 | | Puerto Rico Sales Tax Financing Corporation, Sales Tax Revenue Bonds, First Subordinate Series 2010A, 5.375%, 8/01/39 | 2/20 at 100.00 | A+ | | 326,492 | |
| | 420 | | Virgin Islands Public Finance Authority, Matching Fund Loan Notes Revenue Bonds, Senior Lien Series 2010A, 5.000%, 10/01/29 | 10/20 at 100.00 | BBB | | 412,927 | |
| | 5,350 | | Total Tax Obligation/Limited | | | | 5,194,592 | |
| | | | Transportation – 6.5% (4.2% of Total Investments) | | | | | |
| | 1,950 | | New Haven, Connecticut, Revenue Refunding Bonds, Air Rights Parking Facility, Series 2002, 5.375%, 12/01/15 – AMBAC Insured | No Opt. Call | N/R | | 2,234,720 | |
| | | | U.S. Guaranteed – 33.7% (21.8% of Total Investments) (4) | | | | | |
| | 2,250 | | Connecticut Health and Educational Facilities Authority, Revenue Bonds, Connecticut State University System, Series 2002D-2, 5.000%, 11/01/21 (Pre-refunded 11/01/11) – AGM Insured | 11/11 at 100.00 | AA+ (4) | | 2,348,254 | |
| | 400 | | Connecticut Health and Educational Facilities Authority, Revenue Bonds, Greenwich Academy, Series 2001B, 5.000%, 3/01/32 (Pre-refunded 3/01/11) – AGM Insured | 3/11 at 101.00 | AA+ (4) | | 408,820 | |
| | 1,625 | | Connecticut, Special Tax Obligation Transportation Infrastructure Purpose Bonds, Series 2002A, 5.375%, 7/01/20 (Pre-refunded 7/01/12) – AGM Insured | 7/12 at 100.00 | AA+ (4) | | 1,748,776 | |
| | | | Farmington, Connecticut, General Obligation Bonds, Series 2002: | | | | | |
| | 1,000 | | 5.000%, 9/15/20 (Pre-refunded 9/15/12) | 9/12 at 101.00 | Aaa | | 1,088,440 | |
| | 1,450 | | 5.000%, 9/15/21 (Pre-refunded 9/15/12) | 9/12 at 101.00 | Aaa | | 1,578,238 | |
| | 250 | | Guam Economic Development Authority, Tobacco Settlement Asset-Backed Bonds, Series 2001B, 5.500%, 5/15/41 (Pre-refunded 5/15/11) | 5/11 at 100.00 | N/R (4) | | 255,750 | |
| | 1,305 | | Hartford County Metropolitan District, Connecticut, General Obligation Bonds, Series 2002, 5.000%, 4/01/22 (Pre-refunded 4/01/12) | 4/12 at 101.00 | AA+ (4) | | 1,397,250 | |
| | 1,535 | | Regional School District 8, Andover, Hebron and Marlborough, Connecticut, General Obligation Bonds, Series 2002, 5.000%, 5/01/22 (Pre-refunded 5/01/11) – AGM Insured | 5/11 at 101.00 | Aa3 (4) | | 1,581,050 | |
| | 500 | | Waterbury, Connecticut, General Obligation Bonds, Series 2002A, 5.375%, 4/01/17 (Pre-refunded 4/01/12) – AGM Insured | 4/12 at 100.00 | AA+ (4) | | 531,340 | |
| | 500 | | West Hartford, Connecticut, General Obligation Bonds, Series 2005B, 5.000%, 10/01/17 (Pre-refunded 10/01/15) | 10/15 at 100.00 | AAA | | 578,800 | |
| | 10,815 | | Total U.S. Guaranteed | | | | 11,516,718 | |
| | | | Utilities – 7.9% (5.2% of Total Investments) | | | | | |
| | 500 | | Connecticut Development Authority, Pollution Control Revenue Refunding Bonds, Connecticut Light and Power Company, Series 1993A, 5.850%, 9/01/28 | 4/11 at 101.00 | Baa1 | | 505,220 | |
| | 470 | | Connecticut Development Authority, Solid Waste Disposal Facilities Revenue Bonds, PSEG Power LLC Project, Series 2007A, 5.750%, 11/01/37 (Alternative Minimum Tax) | 11/12 at 100.00 | Baa1 | | 463,016 | |
| | 1,000 | | Connecticut Resource Recovery Authority, Revenue Bonds, American Ref-Fuel Company of Southeastern Connecticut LP, Series 1998A-II, 5.500%, 11/15/15 (Alternative Minimum Tax) | 12/11 at 102.00 | Ba1 | | 988,940 | |
38 Nuveen Investments
| | Principal | | | Optional Call | | | | |
| | Amount (000) | | Description (1) | Provisions (2) | Ratings (3) | | Value | |
| | | | Utilities (continued) | | | | | |
| | | | Eastern Connecticut Resource Recovery Authority, Solid Waste Revenue Bonds, Wheelabrator Lisbon Project, Series 1993A: | | | | | |
| $ | 250 | | 5.500%, 1/01/15 (Alternative Minimum Tax) | 1/11 at 100.00 | BBB | $ | 250,298 | |
| | 510 | | 5.500%, 1/01/20 (Alternative Minimum Tax) | 1/11 at 100.00 | BBB | | 510,092 | |
| | 2,730 | | Total Utilities | | | | 2,717,566 | |
| | | | Water and Sewer – 10.9% (7.1% of Total Investments) | | | | | |
| | 220 | | Connecticut Development Authority, Water Facility Revenue Bonds, Aquarion Water Company Project, Series 2007, 5.100%, 9/01/37 – SYNCORA GTY Insured (Alternative Minimum Tax) | 9/17 at 100.00 | N/R | | 193,633 | |
| | 785 | | Connecticut, State Revolving Fund General Revenue Bonds, Series 2003A, 5.000%, 10/01/16 | 10/13 at 100.00 | AAA | | 866,232 | |
| | | | Greater New Haven Water Pollution Control Authority, Connecticut, Regional Wastewater System Revenue Bonds, Series 2005A: | | | | | |
| | 690 | | 5.000%, 11/15/30 – NPFG Insured | 11/15 at 100.00 | A1 | | 700,571 | |
| | 320 | | 5.000%, 8/15/35 – NPFG Insured | 11/15 at 100.00 | A1 | | 321,248 | |
| | 130 | | Guam Government Waterworks Authority, Water and Wastewater System Revenue Bonds, Series 2005, 6.000%, 7/01/25 | 7/15 at 100.00 | Ba2 | | 131,625 | |
| | 350 | | Guam Government Waterworks Authority, Water and Wastewater System Revenue Bonds, Series 2010, 5.625%, 7/01/40 | 7/20 at 100.00 | Ba2 | | 329,105 | |
| | | | South Central Connecticut Regional Water Authority, Water System Revenue Bonds, Eighteenth Series 2003A: | | | | | |
| | 750 | | 5.000%, 8/01/20 – NPFG Insured | 8/13 at 100.00 | Aa3 | | 780,533 | |
| | 410 | | 5.000%, 8/01/33 – NPFG Insured | 8/13 at 100.00 | Aa3 | | 413,538 | |
| | 3,655 | | Total Water and Sewer | | | | 3,736,485 | |
| $ | 51,380 | | Total Investments (cost $51,683,828) – 154.3% | | | | 52,742,868 | |
| | | | Floating Rate Obligations – (10.1)% | | | | (3,460,000 | ) |
| | | | MuniFund Term Preferred Shares, at Liquidation Value – (49.6)% (5) | | | | (16,950,000 | ) |
| | | | Other Assets Less Liabilities – 5.4% | | | | 1,841,036 | |
| | | | Net Assets Applicable to Common Shares – 100% | | | $ | 34,173,904 | |
| (1) | | All percentages shown in the Portfolio of Investments are based on net assets applicable to Common shares unless otherwise noted. |
| (2) | | Optional Call Provisions: Dates (month and year) and prices of the earliest optional call or redemption. There may be other call provisions at varying prices at later dates. Certain mortgage-backed securities may be subject to periodic principal paydowns. |
| (3) | | Ratings: Using the highest of Standard & Poor’s Group (“Standard & Poor’s”), Moody’s Investor Service, Inc. (“Moody’s”) or Fitch, Inc. (“Fitch”) rating. Ratings below BBB by Standard & Poor’s, Baa by Moody’s or BBB by Fitch are considered to be below investment grade. Holdings designated N/R are not rated by any of these national rating agencies. |
| (4) | | Backed by an escrow or trust containing sufficient U.S. Government or U.S. Government agency securities, which ensure the timely payment of principal and interest. Such investments are normally considered to be equivalent to AAA rated securities. |
| (5) | | MuniFund Term Preferred Shares, at Liquidation Value as a percentage of Total Investments is 32.1%. |
| N/R | | Not rated. |
| (UB) | | Underlying bond of an inverse floating rate trust reflected as a financing transaction. See Notes to Financial Statements, Footnote 1 – General Information and Significant Accounting Policies, Inverse Floating Rate Securities for more information. |
See accompanying notes to financial statements.
Nuveen Investments 39
| | | Nuveen Connecticut Dividend Advantage Municipal Fund 3 |
| NGO | | Portfolio of Investments |
November 30, 2010 (Unaudited)
| | Principal | | | Optional Call | | | | |
| | Amount (000) | | Description (1) | Provisions (2) | Ratings (3) | | Value | |
| | | | Consumer Staples – 3.3% (2.1% of Total Investments) | | | | | |
| $ | 2,090 | | Puerto Rico, The Children’s Trust Fund, Tobacco Settlement Asset-Backed Refunding Bonds, Series 2002, 5.375%, 5/15/33 | 5/12 at 100.00 | BBB | $ | 2,027,655 | |
| | | | Education and Civic Organizations – 30.0% (19.2% of Total Investments) | | | | | |
| | 350 | | Connecticut Health and Educational Facilities Authority, Revenue Bonds, Canterbury School, Series 2006B, 5.000%, 7/01/36 – RAAI Insured | 7/16 at 100.00 | N/R | | 312,459 | |
| | 250 | | Connecticut Health and Educational Facilities Authority, Revenue Bonds, Chase Collegiate School, Series 2007A, 5.000%, 7/01/27 – RAAI Insured | 7/17 at 100.00 | N/R | | 235,465 | |
| | 1,000 | | Connecticut Health and Educational Facilities Authority, Revenue Bonds, Connecticut College, Series 2007G, 4.500%, 7/01/37 – NPFG Insured | 7/17 at 100.00 | A | | 933,130 | |
| | 800 | | Connecticut Health and Educational Facilities Authority, Revenue Bonds, Fairfield University, Series 2010-O, 5.000%, 7/01/35 | 7/20 at 100.00 | A– | | 807,248 | |
| | 400 | | Connecticut Health and Educational Facilities Authority, Revenue Bonds, Loomis Chaffee School, Series 2005F, 5.250%, 7/01/19 – AMBAC Insured | No Opt. Call | A2 | | 457,896 | |
| | 1,000 | | Connecticut Health and Educational Facilities Authority, Revenue Bonds, Quinnipiac University, Series 2006H, 5.000%, 7/01/36 – AMBAC Insured | 7/16 at 100.00 | A– | | 1,005,760 | |
| | 1,300 | | Connecticut Health and Educational Facilities Authority, Revenue Bonds, Quinnipiac University, Series 2007-I, 5.000%, 7/01/25 – NPFG Insured | 7/17 at 100.00 | A | | 1,344,135 | |
| | 215 | | Connecticut Health and Educational Facilities Authority, Revenue Bonds, Renbrook School, Series 2007A, 5.000%, 7/01/37 – AMBAC Insured | 7/17 at 100.00 | N/R | | 201,345 | |
| | 750 | | Connecticut Health and Educational Facilities Authority, Revenue Bonds, University of Hartford, Series 2002E, 5.500%, 7/01/22 – RAAI Insured | 7/12 at 101.00 | BBB– | | 763,238 | |
| | 650 | | Connecticut Health and Educational Facilities Authority, Revenue Bonds, University of Hartford, Series 2006G, 5.250%, 7/01/36 – RAAI Insured | 7/16 at 100.00 | BBB– | | 581,945 | |
| | 800 | | Connecticut Health and Educational Facilities Authority, Revenue Bonds, Wesleyan University, Series 2010G, 5.000%, 7/01/35 | 7/20 at 100.00 | AA | | 824,864 | |
| | 3,000 | | Connecticut Health and Educational Facilities Authority, Revenue Bonds, Yale University, Series 2007Z-1, 5.000%, 7/01/42 (UB) | 7/16 at 100.00 | AAA | | 3,108,480 | |
| | 5,050 | | Connecticut Health and Educational Facilities Authority, Revenue Bonds, Yale University, Series 2007Z-3, 5.050%, 7/01/42 (UB) | 7/17 at 100.00 | AAA | | 5,275,382 | |
| | | | University of Connecticut, General Obligation Bonds, Series 2006A: | | | | | |
| | 850 | | 5.000%, 2/15/19 – FGIC Insured | 2/16 at 100.00 | AA | | 951,507 | |
| | 490 | | 5.000%, 2/15/23 – FGIC Insured | 2/16 at 100.00 | AA | | 527,108 | |
| | 535 | | University of Connecticut, General Obligation Bonds, Series 2010A, 5.000%, 2/15/28 | 2/20 at 100.00 | AA | | 578,624 | |
| | 175 | | University of Connecticut, Student Fee Revenue Bonds, Refunding Series 2010A, 5.000%, 11/15/27 | 11/19 at 100.00 | Aa2 | | 189,917 | |
| | 500 | | University of Connecticut, Student Fee Revenue Refunding Bonds, Series 2002A, 5.250%, 11/15/22 – FGIC Insured | 11/12 at 101.00 | Aa2 | | 524,290 | |
| | 18,115 | | Total Education and Civic Organizations | | | | 18,622,793 | |
| | | | Health Care – 19.2% (12.3% of Total Investments) | | | | | |
| | | | Connecticut Health and Educational Facilities Authority, Revenue Bonds, Bristol Hospital, Series 2002B: | | | | | |
| | 500 | | 5.500%, 7/01/21 – RAAI Insured | 7/12 at 101.00 | N/R | | 474,955 | |
| | 600 | | 5.500%, 7/01/32 – RAAI Insured | 7/12 at 101.00 | N/R | | 541,782 | |
| | 750 | | Connecticut Health and Educational Facilities Authority, Revenue Bonds, Eastern Connecticut Health Network, Series 2000A, 6.000%, 7/01/25 – RAAI Insured | 7/11 at 100.00 | N/R | | 749,228 | |
| | | | Connecticut Health and Educational Facilities Authority, Revenue Bonds, Griffin Hospital, Series 2005B: | | | | | |
| | 490 | | 5.000%, 7/01/15 – RAAI Insured | No Opt. Call | N/R | | 515,995 | |
| | 800 | | 5.000%, 7/01/20 – RAAI Insured | 7/15 at 100.00 | N/R | | 789,192 | |
40 Nuveen Investments
| | Principal | | | Optional Call | | | | |
| | Amount (000) | | Description (1) | Provisions (2) | Ratings (3) | | Value | |
| | | | Health Care (continued) | | | | | |
| | | | Connecticut Health and Educational Facilities Authority, Revenue Bonds, Hospital For Special Care, Series 2007C: | | | | | |
| $ | 310 | | 5.250%, 7/01/32 – RAAI Insured | 7/17 at 100.00 | BBB– | $ | 285,209 | |
| | 150 | | 5.250%, 7/01/37 – RAAI Insured | 7/17 at 100.00 | BBB– | | 134,771 | |
| | 2,130 | | Connecticut Health and Educational Facilities Authority, Revenue Bonds, Middlesex Hospital, Series 2006, 5.000%, 7/01/32 – AGM Insured | 7/16 at 100.00 | Aa3 | | 2,136,602 | |
| | 300 | | Connecticut Health and Educational Facilities Authority, Revenue Bonds, Stamford Hospital, Series 2010-I, 5.000%, 7/01/30 | 7/20 at 100.00 | A | | 303,405 | |
| | 1,325 | | Connecticut Health and Educational Facilities Authority, Revenue Bonds, Yale-New Haven Hospital, Series 2006J-1, 5.000%, 7/01/31 – AMBAC Insured | 7/16 at 100.00 | Aa3 | | 1,334,885 | |
| | 1,500 | | Connecticut Health and Educational Facilities Authority, Revenue Bonds, Ascension Health Series 2010A, 5.000%, 11/15/40 | 11/19 at 100.00 | Aa1 | | 1,519,425 | |
| | 300 | | Connecticut Health and Educational Facilities Authority, Revenue Bonds, Catholic Health East Series 2010, 4.750%, 11/15/29 | 11/20 at 100.00 | A1 | | 295,206 | |
| | 200 | | Connecticut Health and Educational Facilities Authority, Revenue Bonds, Danbury Hospital, Series 2006H, 4.500%, 7/01/33 – AMBAC Insured | 1/16 at 100.00 | N/R | | 154,728 | |
| | 2,550 | | Monroe County Industrial Development Corporation, New York, FHA Insured Mortgage Revenue Bonds, Unity Hospital of Rochester Project, Series 2010, 5.500%, 8/15/40 | 2/21 at 100.00 | Aa2 | | 2,695,477 | |
| | 11,905 | | Total Health Care | | | | 11,930,860 | |
| | | | Housing/Multifamily – 1.5% (1.0% of Total Investments) | | | | | |
| | 960 | | Connecticut Housing Finance Authority, Multifamily Housing Mortgage Finance Program Bonds, Series 2006G-2, 4.800%, 11/15/27 (Alternative Minimum Tax) | 11/15 at 100.00 | AAA | | 957,110 | |
| | | | Housing/Single Family – 8.1% (5.2% of Total Investments) | | | | | |
| | 750 | | Connecticut Housing Finance Authority, Housing Mortgage Finance Program Bonds, Series 2001C, 5.450%, 11/15/43 (Alternative Minimum Tax) | 5/11 at 100.00 | AAA | | 750,030 | |
| | 1,300 | | Connecticut Housing Finance Authority, Housing Mortgage Finance Program Bonds, Series 2004-A5, 5.050%, 11/15/34 | 5/13 at 100.00 | AAA | | 1,316,432 | |
| | | | Connecticut Housing Finance Authority, Housing Mortgage Finance Program Bonds, Series 2006-A1: | | | | | |
| | 435 | | 4.700%, 11/15/26 (Alternative Minimum Tax) | 11/15 at 100.00 | AAA | | 429,271 | |
| | 465 | | 4.800%, 11/15/31 (Alternative Minimum Tax) | 11/15 at 100.00 | AAA | | 451,822 | |
| | 585 | | Connecticut Housing Finance Authority, Housing Mortgage Finance Program Bonds, Series 2006D, 4.650%, 11/15/27 | 5/16 at 100.00 | AAA | | 586,720 | |
| | 1,500 | | Connecticut Housing Finance Authority, Single Family Housing Mortgage Finance Program Bonds, Series 2010-A2, 4.500%, 11/15/30 | 11/19 at 100.00 | AAA | | 1,492,155 | |
| | 5,035 | | Total Housing/Single Family | | | | 5,026,430 | |
| | | | Long-Term Care – 12.0% (7.6% of Total Investments) | | | | | |
| | 500 | | Connecticut Development Authority, First Mortgage Gross Revenue Healthcare Bonds, Elim Park Baptist Home Inc., Series 2003, 5.750%, 12/01/23 | 12/11 at 102.00 | BBB+ | | 506,710 | |
| | 260 | | Connecticut Development Authority, First Mortgage Gross Revenue Refunding Healthcare Bonds, Church Homes
Inc. – Congregational Avery Heights, Series 1997, 5.700%, 4/01/12 | 4/11 at 100.00 | BBB– | | 260,393 | |
| | | | Connecticut Development Authority, Revenue Bonds, Duncaster Inc., Series 2002: | | | | | |
| | 650 | | 5.125%, 8/01/22 – RAAI Insured | 8/12 at 101.00 | BBB | | 608,407 | |
| | 1,025 | | 4.750%, 8/01/32 – RAAI Insured | 8/12 at 101.00 | BBB | | 819,980 | |
| | | | Connecticut Health and Educational Facilities Authority, Revenue Bonds, Village for Families and Children Inc., Series 2002A: | | | | | |
| | 430 | | 5.000%, 7/01/18 – AMBAC Insured | 7/12 at 101.00 | N/R | | 434,339 | |
| | 475 | | 5.000%, 7/01/20 – AMBAC Insured | 7/12 at 101.00 | N/R | | 475,095 | |
| | 260 | | 5.000%, 7/01/23 – AMBAC Insured | 7/12 at 101.00 | N/R | | 251,615 | |
| | 1,000 | | 5.000%, 7/01/32 – AMBAC Insured | 7/12 at 101.00 | N/R | | 882,000 | |
| | | | Connecticut Housing Finance Authority, Special Needs Housing Mortgage Finance Program Special Obligation Bonds, Series 2002SNH-1: | | | | | |
| | 1,000 | | 5.000%, 6/15/22 – AMBAC Insured | 6/12 at 101.00 | N/R | | 1,013,240 | |
| | 1,500 | | 5.000%, 6/15/32 – AMBAC Insured | 6/12 at 101.00 | N/R | | 1,502,370 | |
Nuveen Investments 41
| | | Nuveen Connecticut Dividend Advantage Municipal Fund 3 (continued) |
| NGO | | Portfolio of Investments November 30, 2010 (Unaudited) |
| | Principal | | | Optional Call | | | | |
| | Amount (000) | | Description (1) | Provisions (2) | Ratings (3) | | Value | |
| | | | Long-Term Care (continued) | | | | | |
| $ | 500 | | Connecticut State Development Authority, Health Facilities Revenue Bonds, Alzheimer’s Resource Center of Connecticut, Inc., Series 2007, 5.500%, 8/15/27 | 8/17 at 100.00 | N/R | $ | 445,235 | |
| | 210 | | Hamden, Connecticut, Facility Revenue Bonds, Whitney Center Project, Series 2009A, 7.625%, 1/01/30 | 1/20 at 100.00 | N/R | | 221,044 | |
| | 7,810 | | Total Long-Term Care | | | | 7,420,428 | |
| | | | Tax Obligation/General – 10.9% (7.0% of Total Investments) | | | | | |
| | 1,200 | | Connecticut State, General Obligation Bonds, Series 2006A, 4.750%, 12/15/24 | 12/16 at 100.00 | AA | | 1,272,708 | |
| | 1,500 | | Connecticut State, General Obligation Bonds, Series 2006E, 5.000%, 12/15/20 | 12/16 at 100.00 | AA | | 1,684,095 | |
| | 600 | | Hartford, Connecticut, General Obligation Bonds, Series 2005A, 5.000%, 8/01/21 – AGM Insured | 8/15 at 100.00 | AA+ | | 643,458 | |
| | 1,000 | | New Haven, Connecticut, General Obligation Bonds, Series 2006, 5.000%, 11/01/17 – AMBAC Insured | 11/16 at 100.00 | A1 | | 1,120,840 | |
| | | | Stratford, Connecticut, General Obligation Bonds, Series 2002: | | | | | |
| | 1,375 | | 4.000%, 2/15/19 – AGM Insured | 2/12 at 100.00 | AA+ | | 1,401,221 | |
| | 630 | | 4.125%, 2/15/20 – AGM Insured | 2/12 at 100.00 | AA+ | | 640,905 | |
| | 6,305 | | Total Tax Obligation/General | | | | 6,763,227 | |
| | | | Tax Obligation/Limited – 17.9% (11.4% of Total Investments) | | | | | |
| | 930 | | Connecticut Health and Educational Facilities Authority, Child Care Facilities Program Revenue Bonds, Series 2006F, 5.000%, 7/01/36 – AGC Insured | 7/16 at 100.00 | AA+ | | 942,843 | |
| | 40 | | Connecticut, Special Tax Obligation Transportation Infrastructure Purpose Bonds, Series 1992B, 6.125%, 9/01/12 | No Opt. Call | AA | | 42,204 | |
| | 1,000 | | Connecticut, Special Tax Obligation Transportation Infrastructure Purpose Bonds, Series 2002B,5.000%, 12/01/22 – AMBAC Insured | 12/12 at 100.00 | AA | | 1,038,100 | |
| | 500 | | Connecticut, Special Tax Obligation Transportation Infrastructure Purpose Bonds, Series 2003B, 5.000%, 1/01/23 – FGIC Insured | 1/14 at 100.00 | AA | | 534,130 | |
| | 1,500 | | Connecticut, Special Tax Obligation Transportation Infrastructure Purpose Revenue Bonds, Series 2007A, 5.000%, 8/01/27 – AMBAC Insured | 8/17 at 100.00 | AA | | 1,592,835 | |
| | 900 | | Harbor Point Infrastructure Improvement District, Connecticut, Special Obligation Revenue Bonds, Harbor Point Project, Series 2010A, 7.875%, 4/01/39 | 4/20 at 100.00 | N/R | | 943,326 | |
| | 1,000 | | Puerto Rico Highway and Transportation Authority, Highway Revenue Bonds, Series 2007N, 5.250%, 7/01/31 – AMBAC Insured | No Opt. Call | A3 | | 1,002,450 | |
| | | | Puerto Rico Infrastructure Financing Authority, Special Tax Revenue Bonds, Series 2005A: | | | | | |
| | 780 | | 0.000%, 7/01/32 – FGIC Insured | No Opt. Call | A3 | | 192,184 | |
| | 2,120 | | 0.000%, 7/01/33 – FGIC Insured | No Opt. Call | A3 | | 483,572 | |
| | | | Puerto Rico Public Buildings Authority, Guaranteed Government Facilities Revenue Bonds, Series 2002G: | | | | | |
| | 890 | | 5.250%, 7/01/17 | 7/12 at 100.00 | A3 | | 904,721 | |
| | 1,000 | | 5.250%, 7/01/20 | 7/12 at 100.00 | A3 | | 1,006,750 | |
| | 1,045 | | 5.250%, 7/01/21 | 7/12 at 100.00 | A3 | | 1,049,285 | |
| | 650 | | Puerto Rico Sales Tax Financing Corporation, Sales Tax Revenue Bonds, First Subordinate Series 2010A, 5.375%, 8/01/39 | 2/20 at 100.00 | A+ | | 652,984 | |
| | 735 | | Virgin Islands Public Finance Authority, Matching Fund Loan Notes Revenue Bonds, Senior Lien Series 2010A, 5.000%, 10/01/29 | 10/20 at 100.00 | BBB | | 722,623 | |
| | 13,090 | | Total Tax Obligation/Limited | | | | 11,108,007 | |
| | | | Transportation – 0.8% (0.5% of Total Investments) | | | | | |
| | 415 | | New Haven, Connecticut, Revenue Refunding Bonds, Air Rights Parking Facility, Series 2002, 5.375%, 12/01/15 – AMBAC Insured | No Opt. Call | N/R | | 475,594 | |
42 Nuveen Investments
| | Principal | | | Optional Call | | | | |
| | Amount (000) | | Description (1) | Provisions (2) | Ratings (3) | | Value | |
| | | | U.S. Guaranteed – 29.7% (18.9% of Total Investments) (4) | | | | | |
| | | | Bethel, Connecticut, General Obligation Bonds, Series 2002: | | | | | |
| $ | 525 | | 5.000%, 11/01/18 (Pre-refunded 11/01/12) – FGIC Insured | 11/12 at 100.00 | Aa2 (4) | $ | 567,315 | |
| | 525 | | 5.000%, 11/01/19 (Pre-refunded 11/01/12) – FGIC Insured | 11/12 at 100.00 | Aa2 (4) | | 567,315 | |
| | 525 | | 5.000%, 11/01/20 (Pre-refunded 11/01/12) – FGIC Insured | 11/12 at 100.00 | Aa2 (4) | | 567,315 | |
| | 525 | | 5.000%, 11/01/21 (Pre-refunded 11/01/12) – FGIC Insured | 11/12 at 100.00 | Aa2 (4) | | 567,315 | |
| | 525 | | 5.000%, 11/01/22 (Pre-refunded 11/01/12) – FGIC Insured | 11/12 at 100.00 | Aa2 (4) | | 567,315 | |
| | 500 | | Bridgeport, Connecticut, General Obligation Bonds, Series 2003A, 5.250%, 9/15/23 (Pre-refunded 9/15/13) – AGM Insured | 9/13 at 100.00 | AA+ (4) | | 562,260 | |
| | 3,100 | | Connecticut Health and Educational Facilities Authority, Revenue Bonds, Trinity College, Series 2001G, 5.000%, 7/01/21 (Pre-refunded 7/01/11) – AMBAC Insured | 7/11 at 101.00 | N/R (4) | | 3,215,906 | |
| | | | Connecticut, Special Tax Obligation Transportation Infrastructure Purpose Bonds, Series 2002B: | | | | | |
| | 2,810 | | 5.000%, 12/01/20 (Pre-refunded 12/01/12) – AMBAC Insured | 12/12 at 100.00 | AA (4) | | 3,054,076 | |
| | 1,000 | | 5.000%, 12/01/21 (Pre-refunded 12/01/12) – AMBAC Insured | 12/12 at 100.00 | AA (4) | | 1,086,860 | |
| | 450 | | Farmington, Connecticut, General Obligation Bonds, Series 2002, 5.000%, 9/15/20 (Pre-refunded 9/15/12) | 9/12 at 101.00 | Aaa | | 489,798 | |
| | | | New Canaan, Connecticut, General Obligation Bonds, Series 2002A: | | | | | |
| | 950 | | 4.500%, 5/01/19 (Pre-refunded 5/01/11) | 5/11 at 100.00 | Aaa | | 966,483 | |
| | 900 | | 4.600%, 5/01/20 (Pre-refunded 5/01/11) | 5/11 at 100.00 | Aaa | | 915,993 | |
| | 500 | | 4.700%, 5/01/21 (Pre-refunded 5/01/11) | 5/11 at 100.00 | Aaa | | 509,095 | |
| | 40 | | New Haven, Connecticut, General Obligation Bonds, Series 2002A, 5.250%, 11/01/17 – AMBAC Insured (ETM) | 11/11 at 101.00 | A1 (4) | | 42,121 | |
| | 1,010 | | Puerto Rico Public Finance Corporation, Commonwealth Appropriation Bonds, Series 1998A, 5.125%, 6/01/24 – AMBAC Insured | No Opt. Call | AAA | | 1,135,422 | |
| | 195 | | Puerto Rico Public Finance Corporation, Commonwealth Appropriation Bonds, Series 2002E, 5.500%, 8/01/29 (Pre-refunded 2/01/12) | 2/12 at 100.00 | AAA | | 205,916 | |
| | | | Southbury, Connecticut, General Obligation Bonds, Series 2002: | | | | | |
| | 500 | | 4.875%, 12/15/20 (Pre-refunded 12/15/11) | 12/11 at 101.00 | Aa2 (4) | | 528,860 | |
| | 500 | | 4.875%, 12/15/21 (Pre-refunded 12/15/11) | 12/11 at 101.00 | Aa2 (4) | | 528,860 | |
| | 500 | | 5.000%, 12/15/22 (Pre-refunded 12/15/11) | 12/11 at 101.00 | Aa2 (4) | | 529,510 | |
| | 1,100 | | University of Connecticut, General Obligation Bonds, Series 2003A, 5.125%, 2/15/21 (Pre-refunded 2/15/13) – NPFG Insured | 2/13 at 100.00 | AA (4) | | 1,207,745 | |
| | 500 | | West Hartford, Connecticut, General Obligation Bonds, Series 2005B, 5.000%, 10/01/18 (Pre-refunded 10/01/15) | 10/15 at 100.00 | AAA | | 578,800 | |
| | 17,180 | | Total U.S. Guaranteed | | | | 18,394,280 | |
| | | | Utilities – 8.1% (5.2% of Total Investments) | | | | | |
| | 720 | | Connecticut Development Authority, Pollution Control Revenue Refunding Bonds, Connecticut Light and Power Company, Series 1993A, 5.850%, 9/01/28 | 4/11 at 101.00 | Baa1 | | 727,517 | |
| | 860 | | Connecticut Development Authority, Solid Waste Disposal Facilities Revenue Bonds, PSEG Power LLC Project, Series 2007A, 5.750%, 11/01/37 (Alternative Minimum Tax) | 11/12 at 100.00 | Baa1 | | 847,220 | |
| | 2,000 | | Connecticut Resource Recovery Authority, Revenue Bonds, American Ref-Fuel Company of Southeastern Connecticut LP, Series 1998A-I, 5.500%, 11/15/15 (Alternative Minimum Tax) | 12/11 at 102.00 | Ba1 | | 1,972,880 | |
| | | | Eastern Connecticut Resource Recovery Authority, Solid Waste Revenue Bonds, Wheelabrator Lisbon Project, Series 1993A: | | | | | |
| | 665 | | 5.500%, 1/01/14 (Alternative Minimum Tax) | 1/11 at 100.00 | BBB | | 666,889 | |
| | 305 | | 5.500%, 1/01/20 (Alternative Minimum Tax) | 1/11 at 100.00 | BBB | | 305,055 | |
| | 530 | | Puerto Rico Electric Power Authority, Power Revenue Bonds, Series 2010XX, 5.250%, 7/01/40 | 7/20 at 100.00 | A3 | | 524,477 | |
| | 5,080 | | Total Utilities | | | | 5,044,038 | |
Nuveen Investments 43
| | | Nuveen Connecticut Dividend Advantage Municipal Fund 3 (continued) |
| NGO | | Portfolio of Investments November 30, 2010 (Unaudited) |
| | Principal | | | Optional Call | | | | |
| | Amount (000) | | Description (1) | Provisions (2) | Ratings (3) | | Value | |
| | | | Water and Sewer – 15.1% (9.6% of Total Investments) | | | | | |
| $ | 400 | | Connecticut Development Authority, Water Facility Revenue Bonds, Aquarion Water Company Project, Series 2007, 5.100%, 9/01/37 – SYNCORA GTY Insured (Alternative Minimum Tax) | 9/17 at 100.00 | N/R | $ | 352,060 | |
| | 1,185 | | Connecticut, State Revolving Fund General Revenue Bonds, Series 2003A, 5.000%, 10/01/16 | 10/13 at 100.00 | AAA | | 1,307,624 | |
| | | | Greater New Haven Water Pollution Control Authority, Connecticut, Regional Wastewater System Revenue Bonds, Series 2005A: | | | | | |
| | 1,230 | | 5.000%, 11/15/30 – NPFG Insured | 11/15 at 100.00 | A1 | | 1,248,844 | |
| | 640 | | 5.000%, 8/15/35 – NPFG Insured | 11/15 at 100.00 | A1 | | 642,496 | |
| | 230 | | Guam Government Waterworks Authority, Water and Wastewater System Revenue Bonds, Series 2005, 6.000%, 7/01/25 | 7/15 at 100.00 | Ba2 | | 232,875 | |
| | 600 | | Guam Government Waterworks Authority, Water and Wastewater System Revenue Bonds, Series 2010, 5.625%, 7/01/40 | 7/20 at 100.00 | Ba2 | | 564,180 | |
| | | | South Central Connecticut Regional Water Authority, Water System Revenue Bonds, Eighteenth Series 2003A: | | | | | |
| | 2,050 | | 5.000%, 8/01/20 – NPFG Insured | 8/13 at 100.00 | Aa3 | | 2,133,455 | |
| | 590 | | 5.000%, 8/01/33 – NPFG Insured | 8/13 at 100.00 | Aa3 | | 595,092 | |
| | 1,840 | | South Central Connecticut Regional Water Authority, Water System Revenue Bonds, Twentieth Series, 2007A, 5.000%, 8/01/30 – NPFG Insured | 8/16 at 100.00 | Aa3 | | 1,890,103 | |
| | 350 | | Stamford, Connecticut, Water Pollution Control System and Facility Revenue Bonds, Series 2003A, 5.000%, 11/15/32 | 11/13 at 100.00 | AA+ | | 362,625 | |
| | 9,115 | | Total Water and Sewer | | | | 9,329,354 | |
| $ | 97,100 | | Total Investments (cost $96,554,649) – 156.6% | | | | 97,099,776 | |
| | | | Floating Rate Obligations – (9.3)% | | | | (5,780,000 | ) |
| | | | MuniFund Term Preferred Shares, at Liquidation Value – (51.6)% (5) | | | | (32,000,000 | ) |
| | | | Other Assets Less Liabilities – 4.3% | | | | 2,696,534 | |
| | | | Net Assets Applicable to Common Shares – 100% | | | $ | 62,016,310 | |
| (1) | | All percentages shown in the Portfolio of Investments are based on net assets applicable to Common shares unless otherwise noted. |
| (2) | | Optional Call Provisions: Dates (month and year) and prices of the earliest optional call or redemption. There may be other call provisions at varying prices at later dates. Certain mortgage-backed securities may be subject to periodic principal paydowns. |
| (3) | | Ratings: Using the highest of Standard & Poor’s Group (“Standard & Poor’s”), Moody’s Investor Service, Inc. (“Moody’s”) or Fitch, Inc. (“Fitch”) rating. Ratings below BBB by Standard & Poor’s, Baa by Moody’s or BBB by Fitch are considered to be below investment grade. Holdings designated N/R are not rated by any of these national rating agencies. |
| (4) | | Backed by an escrow or trust containing sufficient U.S. Government or U.S. Government agency securities, which ensure the timely payment of principal and interest. Such investments are normally considered to be equivalent to AAA rated securities. |
| (5) | | MuniFund Term Preferred Shares, at Liquidation Value as a percentage of Total Investments is 33.0%. |
| N/R | | Not rated. |
| (ETM) | | Escrowed to maturity. |
| (UB) | | Underlying bond of an inverse floating rate trust reflected as a financing transaction. See Notes to Financial Statements, Footnote 1 – General Information and Significant Accounting Policies, Inverse Floating Rate Securities for more information. |
See accompanying notes to financial statements.
44 Nuveen Investments
| | | Nuveen Massachusetts Premium Income Municipal Fund |
| NMT | | Portfolio of Investments |
November 30, 2010 (Unaudited)
| | Principal | | | Optional Call | | | | |
| | Amount (000) | | Description (1) | Provisions (2) | Ratings (3) | | Value | |
| | | | Consumer Discretionary – 1.1% (0.7% of Total Investments) | | | | | |
| $ | 1,425 | | Boston Industrial Development Financing Authority, Massachusetts, Senior Revenue Bonds, Crosstown Center Project, Series 2002, 6.500%, 9/01/35 (Alternative Minimum Tax) | 9/12 at 102.00 | Caa3 | $ | 744,748 | |
| | | | Education and Civic Organizations – 33.1% (21.7% of Total Investments) | | | | | |
| | 375 | | Massachusetts Development Finance Agency, Revenue Bonds, Boston University, Series 2009V-1, 5.000%, 10/01/29 | 10/19 at 100.00 | A | | 378,709 | |
| | 1,000 | | Massachusetts Development Finance Agency, Revenue Bonds, Emerson College, Series 2010A, 5.000%, 1/01/40 | 1/20 at 100.00 | A– | | 950,030 | |
| | 1,045 | | Massachusetts Development Finance Agency, Revenue Bonds, Worcester Polytechnic Institute, Series 2007, 5.000%, 9/01/37 – NPFG Insured | 9/17 at 100.00 | A+ | | 1,035,783 | |
| | 830 | | Massachusetts Development Finance Authority, Revenue Bonds, Curry College, Series 2000A, 6.000%, 3/01/20 – ACA Insured | 3/11 at 100.00 | BBB | | 832,424 | |
| | 1,745 | | Massachusetts Development Finance Authority, Revenue Bonds, Massachusetts College of Pharmacy and Allied Health Sciences, Series 2005D, 5.000%, 7/01/27 – AGC Insured | 7/15 at 100.00 | AA+ | | 1,798,589 | |
| | 1,500 | | Massachusetts Development Finance Authority, Revenue Bonds, WGBH Educational Foundation, Series 2002A, 5.750%, 1/01/42 – AMBAC Insured | No Opt. Call | A | | 1,610,625 | |
| | 4,900 | | Massachusetts Development Finance Authority, Revenue Bonds, WGBH Educational Foundation, 5.000%, 1/01/42 – AGC Insured (UB) | 1/18 at 100.00 | AA+ | | 4,842,621 | |
| | 1,090 | | Massachusetts Development Finance Authority, Revenue Refunding Bonds, Boston University, Series 1999P, 6.000%, 5/15/29 | No Opt. Call | A2 | | 1,259,593 | |
| | 1,550 | | Massachusetts Educational Finance Authority, Educational Loan Revenue Bonds, Series 2002A, 5.000%, 1/01/13 – AMBAC Insured (Alternative Minimum Tax) | 1/12 at 100.00 | AA | | 1,590,471 | |
| | 2,000 | | Massachusetts Health and Educational Facilities Authority, Revenue Bonds, Boston College, Series 2003N, 5.250%, 6/01/18 | 6/13 at 100.00 | AA– | | 2,180,300 | |
| | 1,000 | | Massachusetts Health and Educational Facilities Authority, Revenue Bonds, Springfield College, Series 2010, 5.500%, 10/15/31 | 10/19 at 100.00 | Baa1 | | 1,023,190 | |
| | 500 | | Massachusetts Health and Educational Facilities Authority, Revenue Bonds, Wellesley College, Series 2003H, 5.000%, 7/01/26 | 7/13 at 100.00 | Aaa | | 520,450 | |
| | 555 | | Massachusetts Health and Educational Facilities Authority, Revenue Bonds, Williams College, Series 2003H, 5.000%, 7/01/21 | 7/13 at 100.00 | AAA | | 600,948 | |
| | 1,380 | | Massachusetts Health and Educational Facilities Authority, Revenue Bonds, Williams College, Series 2007L, 5.000%, 7/01/31 | 7/16 at 100.00 | AAA | | 1,417,812 | |
| | 500 | | Massachusetts Health and Educational Facilities Authority, Revenue Bonds, Worcester State College, Series 2002, 5.000%, 11/01/32 – AMBAC Insured | 11/12 at 100.00 | A2 | | 489,550 | |
| | 1,645 | | Massachusetts Industrial Finance Agency, Revenue Bonds, Whitehead Institute for Biomedical Research, Series 1993, 5.125%, 7/01/26 | 1/11 at 100.00 | Aa1 | | 1,646,217 | |
| | 375 | | Puerto Rico Industrial, Tourist, Educational, Medical and Environmental Control Facilities Financing Authority, Higher Education Revenue Bonds, Ana G. Mendez University System, Series 1999, 5.375%, 2/01/19 | 2/11 at 100.00 | BBB– | | 375,244 | |
| | 21,990 | | Total Education and Civic Organizations | | | | 22,552,556 | |
| | | | Health Care – 25.6% (16.8% of Total Investments) | | | | | |
| | 1,250 | | Massachusetts Health and Educational Facilities Authority, Revenue Bonds, Berkshire Health System, Series 2001E, 6.250%, 10/01/31 | 10/11 at 101.00 | BBB+ | | 1,262,775 | |
| | 1,000 | | Massachusetts Health and Educational Facilities Authority, Revenue Bonds, Cape Cod Health Care Inc., Series 2001C, 5.250%, 11/15/31 – RAAI Insured | 11/11 at 101.00 | BBB | | 916,750 | |
| | | | Massachusetts Health and Educational Facilities Authority, Revenue Bonds, Caregroup Inc., Series B1 Capital Asset Program Converted June 13,2008: | | | | | |
| | 2,300 | | 5.375%, 2/01/26 – NPFG Insured | 8/18 at 100.00 | A | | 2,346,736 | |
| | 770 | | 5.375%, 2/01/28 – NPFG Insured | 8/18 at 100.00 | A | | 779,833 | |
| | 1,500 | | Massachusetts Health and Educational Facilities Authority, Revenue Bonds, Caregroup Inc., Series B2, Capital Asset Program, Converted June 9, 2009, 5.375%, 2/01/27 – NPFG Insured | 8/18 at 100.00 | A | | 1,521,045 | |
Nuveen Investments 45
| | | Nuveen Massachusetts Premium Income Municipal Fund (continued) |
| NMT | | Portfolio of Investments November 30, 2010 (Unaudited) |
| | Principal | | | Optional Call | | | | |
| | Amount (000) | | Description (1) | Provisions (2) | Ratings (3) | | Value | |
| | | | Health Care (continued) | | | | | |
| $ | 1,000 | | Massachusetts Health and Educational Facilities Authority, Revenue Bonds, Children’s Hospital, Series 2009M, 5.500%, 12/01/39 | 12/19 at 100.00 | AA | $ | 1,045,480 | |
| | 935 | | Massachusetts Health and Educational Facilities Authority, Revenue Bonds, Emerson Hospital, Series 2005E, 5.000%, 8/15/35 – RAAI Insured | 8/15 at 100.00 | N/R | | 750,908 | |
| | 1,000 | | Massachusetts Health and Educational Facilities Authority, Revenue Bonds, Lahey Clinic Medical Center, Series 2005C, 5.000%, 8/15/21 – FGIC Insured | 8/15 at 100.00 | A+ | | 1,024,350 | |
| | 2,000 | | Massachusetts Health and Educational Facilities Authority, Revenue Bonds, Lahey Medical Center, Series 2007D, 5.250%, 8/15/28 | 8/17 at 100.00 | A+ | | 2,015,580 | |
| | 585 | | Massachusetts Health and Educational Facilities Authority, Revenue Bonds, Milford Regional Medical Center, Series 2007E, 5.000%, 7/15/32 | 7/17 at 100.00 | BBB– | | 495,197 | |
| | 1,000 | | Massachusetts Health and Educational Facilities Authority, Revenue Bonds, Milton Hospital Project, Series 2005D, 5.250%, 7/01/30 | 7/15 at 100.00 | BB– | | 752,550 | |
| | 750 | | Massachusetts Health and Educational Facilities Authority, Revenue Bonds, New England Medical Center Hospitals, Series 1993G-1, 5.375%, 7/01/24 – NPFG Insured | 1/11 at 100.00 | A | | 746,745 | |
| | 75 | | Massachusetts Health and Educational Facilities Authority, Revenue Bonds, Partners HealthCare System Inc., Series 2001C, 5.750%, 7/01/32 | 7/11 at 101.00 | AA | | 76,242 | |
| | 375 | | Massachusetts Health and Educational Facilities Authority, Revenue Bonds, UMass Memorial Health Care, Series 2001C, 6.625%, 7/01/32 | 7/11 at 100.00 | BBB+ | | 377,591 | |
| | 1,445 | | Massachusetts Health and Educational Facilities Authority, Revenue Bonds, UMass Memorial Health Care, Series 2005D, 5.000%, 7/01/33 | 7/15 at 100.00 | BBB+ | | 1,353,907 | |
| | 2,000 | | Massachusetts State, Health and Educational Facilities Authority, Partners HealthCare System Inc., Series 2007G, 5.000%, 7/01/32 | 7/17 at 100.00 | AA | | 2,006,580 | |
| | 17,985 | | Total Health Care | | | | 17,472,269 | |
| | | | Housing/Multifamily – 6.9% (4.5% of Total Investments) | | | | | |
| | 1,315 | | Massachusetts Development Finance Authority, Multifamily Housing Revenue Bonds, Emerson Manor Project, Series 2007, 4.800%, 7/20/48 | 7/17 at 100.00 | BB | | 1,262,992 | |
| | 1,755 | | Massachusetts Development Financing Authority, Assisted Living Revenue Bonds, Prospect House Apartments, Series 1999, 7.000%, 12/01/31 | 12/10 at 101.00 | N/R | | 1,664,688 | |
| | 500 | | Massachusetts Housing Finance Agency, Housing Revenue Bonds, Series 2003S, 5.050%, 12/01/23 (Alternative Minimum Tax) | 6/13 at 100.00 | AA– | | 501,630 | |
| | 215 | | Massachusetts Housing Finance Agency, Rental Housing Mortgage Revenue Bonds, Series 1999D, 5.500%, 7/01/13 – AMBAC Insured (Alternative Minimum Tax) | 7/12 at 100.00 | N/R | | 217,483 | |
| | 1,000 | | Somerville Housing Authority, Massachusetts, GNMA Collateralized Mortgage Revenue Bonds, Clarendon Hill Towers, Series 2002, 5.200%, 11/20/22 | 5/12 at 103.00 | N/R | | 1,043,670 | |
| | 4,785 | | Total Housing/Multifamily | | | | 4,690,463 | |
| | | | Housing/Single Family – 3.6% (2.4% of Total Investments) | | | | | |
| | 1,500 | | Massachusetts Housing Finance Agency, Single Family Housing Revenue Bonds, Series 2006-126, 4.625%, 6/01/32 (Alternative Minimum Tax) | 6/16 at 100.00 | AA | | 1,400,175 | |
| | 985 | | Massachusetts Housing Finance Agency, Single Family Housing Revenue Bonds, Series 2008, Trust 3145, 14.149%, 6/01/16 (IF) | No Opt. Call | Aa2 | | 1,070,547 | |
| | 2,485 | | Total Housing/Single Family | | | | 2,470,722 | |
| | | | Industrials – 1.0% (0.6% of Total Investments) | | | | | |
| | 265 | | Massachusetts Development Finance Agency, Pioneer Valley Resource Recovery Revenue Bonds, Eco/Springfield LLC, Series 2006, 5.875%, 7/01/14 (Alternative Minimum Tax) | No Opt. Call | N/R | | 254,135 | |
| | 400 | | Massachusetts Development Finance Agency, Solid Waste Disposal Revenue Bonds, Waste Management Inc., Series 2003, 5.450%, 6/01/14 | No Opt. Call | BBB | | 422,464 | |
| | 665 | | Total Industrials | | | | 676,599 | |
46 Nuveen Investments
| | Principal | | | Optional Call | | | | |
| | Amount (000) | | Description (1) | Provisions (2) | Ratings (3) | | Value | |
| | | | Long-Term Care – 7.2% (4.7% of Total Investments) | | | | | |
| $ | 1,270 | | Boston, Massachusetts, FHA-Insured Mortgage Revenue Bonds, Deutsches Altenheim Inc., Series 1998A, 6.125%, 10/01/31 | 4/11 at 103.00 | AAA | $ | 1,309,154 | |
| | 185 | | Massachusetts Development Finance Agency, Revenue Bonds, Carleton-Willard Village, Series 2010, 5.625%, 12/01/30 | 12/19 at 100.00 | A– | | 184,012 | |
| | 1,685 | | Massachusetts Development Finance Agency, Revenue Bonds, Orchard Cove, Series 2007, 5.250%, 10/01/26 | 10/12 at 102.00 | N/R | | 1,411,659 | |
| | 1,500 | | Massachusetts Development Finance Authority, GNMA Collateralized Assisted Living Facility Revenue Bonds, Arbors at Chicopee, Series 2001A, 6.250%, 9/20/42 (Alternative Minimum Tax) | 3/12 at 105.00 | AAA | | 1,576,350 | |
| | 400 | | Massachusetts Industrial Finance Agency, First Mortgage Revenue Bonds, Berkshire Retirement Community, Series 1994B, 4.750%, 7/01/17 | 1/11 at 101.00 | BBB | | 396,864 | |
| | 5,040 | | Total Long-Term Care | | | | 4,878,039 | |
| | | | Tax Obligation/General – 17.0% (11.2% of Total Investments) | | | | | |
| | 500 | | Ashland, Massachusetts, General Obligation Bonds, Series 2004, 5.250%, 5/15/23 – AMBAC Insured | 5/15 at 100.00 | Aa2 | | 531,470 | |
| | 600 | | Boston, Massachusetts, General Obligation Bonds, Series 2005A, 5.000%, 1/01/17 | 1/15 at 100.00 | Aaa | | 673,536 | |
| | 1,000 | | Fall River, Massachusetts, General Obligation Bonds, Series 2003, 5.000%, 2/01/21 – AGM Insured | 2/13 at 101.00 | AA+ | | 1,037,300 | |
| | 2,500 | | Massachusetts Bay Transportation Authority, General Obligation Transportation System Bonds, Series 1991A, 7.000%, 3/01/21 | No Opt. Call | Aa1 | | 3,050,975 | |
| | 1,275 | | Massachusetts, General Obligation Bonds, Consolidated Loan, Series 2001D, 6.000%, 11/01/13 – NPFG Insured | No Opt. Call | Aa1 | | 1,458,154 | |
| | 980 | | Monson, Massachusetts, General Obligation Bonds, Series 2002, 5.250%, 5/15/22 – AMBAC Insured | 5/12 at 101.00 | A1 | | 1,038,869 | |
| | 1,260 | | Norwell, Massachusetts, General Obligation Bonds, Series 2003, 5.000%, 11/15/20 – FGIC Insured | No Opt. Call | AAA | | 1,487,191 | |
| | 1,000 | | Puerto Rico, General Obligation and Public Improvement Bonds, Series 2002A, 5.500%, 7/01/29 – FGIC Insured | No Opt. Call | A3 | | 1,037,850 | |
| | 1,220 | | Worcester, Massachusetts, General Obligation Bonds, Series 2005A, 5.000%, 7/01/19 – FGIC Insured | 7/15 at 100.00 | A1 | | 1,307,559 | |
| | 10,335 | | Total Tax Obligation/General | | | | 11,622,904 | |
| | | | Tax Obligation/Limited – 14.1% (9.3% of Total Investments) | | | | | |
| | 210 | | Martha’s Vineyard Land Bank, Massachusetts, Revenue Bonds, Series 2004, 5.000%, 5/01/26 – AMBAC Insured | 5/14 at 100.00 | A | | 212,755 | |
| | 975 | | Massachusetts Bay Transportation Authority, Sales Tax Revenue Bonds, Senior Lien Series 2006C, 5.000%, 7/01/26 | 7/18 at 100.00 | AAA | | 1,056,461 | |
| | 385 | | Massachusetts Bay Transportation Authority, Senior Lien Sales Tax Revenue Refunding Bonds, Series 2004C, 5.250%, 7/01/21 | No Opt. Call | AAA | | 456,718 | |
| | 550 | | Massachusetts College Building Authority, Project Revenue Bonds, Series 2004A, 5.000%, 5/01/19 – NPFG Insured | 5/14 at 100.00 | Aa2 | | 599,693 | |
| | 325 | | Massachusetts College Building Authority, Project Revenue Bonds, Series 2006A, 5.000%, 5/01/31 – AMBAC Insured | 5/16 at 100.00 | Aa2 | | 332,647 | |
| | 1,200 | | Massachusetts College Building Authority, Project Revenue Bonds, Series 2008A, 5.000%, 5/01/33 – AGC Insured | 5/18 at 100.00 | AA+ | | 1,231,740 | |
| | 1,000 | | Massachusetts College Building Authority, Project Revenue Refunding Bonds, Series 2003B, 5.375%, 5/01/23 – SYNCORA GTY Insured | No Opt. Call | Aa2 | | 1,155,280 | |
| | 1,300 | | Massachusetts School Building Authority, Dedicated Sales Tax Revenue Bonds, Series 2005A, 5.000%, 8/15/20 – AGM Insured | 8/15 at 100.00 | AA+ | | 1,442,545 | |
| | 540 | | Massachusetts, Special Obligation Dedicated Tax Revenue Bonds, Series 2005, 5.000%, 1/01/20 – FGIC Insured | No Opt. Call | A1 | | 599,454 | |
| | 1,000 | | Massachusetts, Special Obligation Refunding Notes, Federal Highway Grant Anticipation Note Program, Series 2003A, 5.000%, 12/15/13 – AGM Insured | No Opt. Call | AA+ | | 1,113,510 | |
| | 240 | | Puerto Rico Infrastructure Financing Authority, Special Tax Revenue Bonds, Series 2005A, 0.000%, 7/01/43 – AMBAC Insured | No Opt. Call | A3 | | 26,026 | |
| | 1,300 | | Puerto Rico, Highway Revenue Bonds, Highway and Transportation Authority, Series 2003AA, 5.500%, 7/01/19 – NPFG Insured | No Opt. Call | A | | 1,394,562 | |
| | 9,025 | | Total Tax Obligation/Limited | | | | 9,621,391 | |
Nuveen Investments 47
| | | Nuveen Massachusetts Premium Income Municipal Fund (continued) |
| NMT | | Portfolio of Investments November 30, 2010 (Unaudited) |
| | Principal | | | Optional Call | | | | |
| | Amount (000) | | Description (1) | Provisions (2) | Ratings (3) | | Value | |
| | | | Transportation – 11.0% (7.2% of Total Investments) | | | | | |
| $ | 500 | | Massachusetts Port Authority, Airport System Revenue Bonds, Series 2010A, 5.000%, 7/01/30 | 7/20 at 100.00 | AA– | $ | 520,655 | |
| | 2,000 | | Massachusetts Port Authority, Revenue Bonds, Series 2003A, 5.000%, 7/01/33 – NPFG Insured | 7/13 at 100.00 | AA– | | 2,045,060 | |
| | 1,000 | | Massachusetts Port Authority, Special Facilities Revenue Bonds, BOSFUEL Corporation, Series 2007, 5.000%, 7/01/32 – FGIC Insured (Alternative Minimum Tax) | 7/17 at 100.00 | A | | 924,740 | |
| | 225 | | Massachusetts Port Authority, Special Facilities Revenue Bonds, Delta Air Lines Inc., Series 2001A, 5.000%, 1/01/27 – AMBAC
Insured (Alternative Minimum Tax) | 1/11 at 101.00 | N/R | | 180,284 | |
| | 4,000 | | Massachusetts Port Authority, Special Facilities Revenue Bonds, US Airways Group Inc., Series 1996A, 5.750%, 9/01/16 – NPFG Insured (Alternative Minimum Tax) | 3/11 at 100.00 | A | | 3,809,597 | |
| | 7,725 | | Total Transportation | | | | 7,480,336 | |
| | | | U.S. Guaranteed – 16.8% (11.0% of Total Investments) (4) | | | | | |
| | 650 | | Boston, Massachusetts, General Obligation Bonds, Series 2005A, 5.000%, 1/01/17 (Pre-refunded 1/01/15) | 1/15 at 100.00 | N/R (4) | | 748,339 | |
| | 25 | | Massachusetts Bay Transportation Authority, Sales Tax Revenue Bonds, Senior Lien Series 2006C, 5.000%, 7/01/26 (Pre-refunded 7/01/18) | 7/18 at 100.00 | AAA | | 29,953 | |
| | 2,500 | | Massachusetts Development Finance Authority, GNMA Collateralized Revenue Bonds, VOA Concord Assisted Living Inc., Series 2000A, 6.900%, 10/20/41 (Pre-refunded 10/20/11) | 10/11 at 105.00 | N/R (4) | | 2,755,400 | |
| | 500 | | Massachusetts Development Finance Authority, Revenue Bonds, Belmont Hills School, Series 2001, 5.375%, 9/01/23 (Pre-refunded 9/01/11) | 9/11 at 101.00 | A (4) | | 523,965 | |
| | 1,000 | | Massachusetts Development Finance Authority, Revenue Bonds, Massachusetts College of Pharmacy and Allied Health Sciences, Series 2003C, 5.750%, 7/01/33 (Pre-refunded 7/01/13) | 7/13 at 101.00 | A (4) | | 1,138,870 | |
| | 750 | | Massachusetts Development Finance Authority, Revenue Bonds, Milton Academy, Series 2003A, 5.000%, 9/01/19 (Pre-refunded 9/01/13) | 9/13 at 100.00 | AA– (4) | | 834,458 | |
| | 410 | | Massachusetts Health and Educational Facilities Authority, Revenue Bonds, CareGroup Inc., Series 1998A, 5.000%, 7/01/25 (Pre-refunded 7/01/21) – NPFG Insured | 7/21 at 100.00 | A (4) | | 457,084 | |
| | 1,000 | | Massachusetts Health and Educational Facilities Authority, Revenue Bonds, Caritas Christi Obligated Group, Series 2002B, 6.250%, 7/01/22 (Pre-refunded 7/01/12) | 7/12 at 101.00 | Baa2 (4) | | 1,096,520 | |
| | 600 | | Massachusetts Health and Educational Facilities Authority, Revenue Bonds, New England Medical Center Hospitals, Series 2002H, 5.375%, 5/15/19 (Pre-refunded 5/15/12) – FGIC Insured | 5/12 at 100.00 | N/R (4) | | 640,410 | |
| | 1,000 | | Massachusetts Health and Educational Facilities Authority, Revenue Bonds, University of Massachusetts – Worcester Campus, Series 2001B, 5.250%, 10/01/31 (Pre-refunded 10/01/11) – FGIC Insured | 10/11 at 100.00 | A+ (4) | | 1,041,340 | |
| | 420 | | Massachusetts Port Authority, Revenue Bonds, Series 1982, 13.000%, 7/01/13 (ETM) | 1/11 at 100.00 | AAA | | 498,330 | |
| | 1,500 | | Massachusetts, Special Obligation Dedicated Tax Revenue Bonds, Series 2004, 5.250%, 1/01/25 (Pre-refunded
1/01/14) – FGIC Insured | 1/14 at 100.00 | A1 (4) | | 1,685,190 | |
| | 10,355 | | Total U.S. Guaranteed | | | | 11,449,859 | |
| | | | Utilities – 3.0% (2.0% of Total Investments) | | | | | |
| | 1,000 | | Massachusetts Development Finance Agency, Resource Recovery Revenue Bonds, SEMass System, Series 2001A, 5.625%, 1/01/16 – NPFG Insured | 1/12 at 101.00 | A | | 1,029,610 | |
| | 1,000 | | Massachusetts Industrial Finance Agency, Resource Recovery Revenue Refunding Bonds, Ogden Haverhill Project, Series 1998A, 5.600%, 12/01/19 (Alternative Minimum Tax) | 12/10 at 100.00 | BBB | | 1,002,400 | |
| | 2,000 | | Total Utilities | | | | 2,032,010 | |
| | | | Water and Sewer – 12.0% (7.9% of Total Investments) | | | | | |
| | 500 | | Boston Water and Sewerage Commission, Massachusetts, General Revenue Bonds, Senior Lien Refunding Series 2010A, 5.000%, 11/01/30 | 11/19 at 100.00 | AA+ | | 538,155 | |
| | 2,000 | | Boston Water and Sewerage Commission, Massachusetts, General Revenue Bonds, Senior Series 2004A, 5.000%, 11/01/25 | 11/14 at 100.00 | AA+ | | 2,106,300 | |
| | 60 | | Massachusetts Water Pollution Abatement Trust, Pooled Loan Program Bonds, Series 2003-9, 5.000%, 8/01/22 | 8/13 at 100.00 | AAA | | 62,765 | |
| | 285 | | Massachusetts Water Pollution Abatement Trust, Pooled Loan Program Bonds, Series 2004-10, 5.000%, 8/01/26 | 8/14 at 100.00 | AAA | | 288,984 | |
48 Nuveen Investments
| | Principal Amount (000) | | Description (1) | Optional Call Provisions (2) | Ratings (3) | | Value | |
| | | | Water and Sewer (continued) | | | | | |
| $ | 750 | | Massachusetts Water Pollution Abatement Trust, Pooled Loan Program Bonds, Series 2005-11, 4.500%, 8/01/29 | 8/15 at 100.00 | AAA | $ | 754,823 | |
| | 1,000 | | Massachusetts Water Pollution Abatement Trust, Pooled Loan Program Bonds, Series 2006-12, 4.375%, 8/01/31 | 8/16 at 100.00 | AAA | | 991,880 | |
| | 1,250 | | Massachusetts Water Pollution Abatement Trust, Revenue Bonds, MWRA Loan Program, Series 2002A, 5.250%, 8/01/20 | 8/12 at 100.00 | AAA | | 1,332,888 | |
| | 1,500 | | Massachusetts Water Resources Authority, General Revenue Bonds, Series 2005A, 5.000%, 8/01/28 – NPFG Insured | 8/17 at 100.00 | AA+ | | 1,585,620 | |
| | 625 | | Massachusetts Water Resources Authority, General Revenue Bonds, Series 2006A, 4.000%, 8/01/46 | 8/16 at 100.00 | AA+ | | 550,906 | |
| | 7,970 | | Total Water and Sewer | | | | 8,212,321 | |
| $ | 101,785 | | Total Investments (cost $103,055,032) – 152.4% | | | | 103,904,217 | |
| | | | Floating Rate Obligations – (3.6)% | | | | (2,450,000 | ) |
| | | | MuniFund Term Preferred Shares, at Liquidation Value – (29.6)% (5) | | | | (20,210,000 | ) |
| | | | Other Assets Less Liabilities – 1.9% | | | | 1,345,326 | |
| | | | Auction Rate Preferred Shares, at Liquidation Value – (21.1)% (5) | | | | (14,400,000 | ) |
| | | | Net Assets Applicable to Common Shares – 100% | | | $ | 68,189,543 | |
| (1) | | All percentages shown in the Portfolio of Investments are based on net assets applicable to Common shares unless otherwise noted. |
| (2) | | Optional Call Provisions: Dates (month and year) and prices of the earliest optional call or redemption. There may be other call provisions at varying prices at later dates. Certain mortgage-backed securities may be subject to periodic principal paydowns. |
| (3) | | Ratings: Using the highest of Standard & Poor’s Group (“Standard & Poor’s”), Moody’s Investor Service, Inc. (“Moody’s”) or Fitch, Inc. (“Fitch”) rating. Ratings below BBB by Standard & Poor’s, Baa by Moody’s or BBB by Fitch are considered to be below investment grade. Holdings designated N/R are not rated by any of these national rating agencies. |
| (4) | | Backed by an escrow or trust containing sufficient U.S. Government or U.S. Government agency securities, which ensure the timely payment of principal and interest. Such investments are normally considered to be equivalent to AAA rated securities. |
| (5) | | MuniFund Term Preferred Shares and Auction Rate Preferred Shares, at Liquidation Value as a percentage of Total Investments are 19.5% and 13.9%, respectively. |
| N/R | | Not rated. |
| (ETM) | | Escrowed to maturity. |
| (IF) | | Inverse floating rate investment. |
| (UB) | | Underlying bond of an inverse floating rate trust reflected as a financing transaction. See Notes to Financial Statements, Footnote 1 – General Information and Significant Accounting Policies, Inverse Floating Rate Securities for more information. |
See accompanying notes to financial statements.
Nuveen Investments 49
| | | Nuveen Massachusetts Dividend Advantage Municipal Fund |
| NMB | | Portfolio of Investments |
November 30, 2010 (Unaudited)
| | Principal Amount (000) | | Description (1) | Optional Call Provisions (2) | Ratings (3) | | Value | |
| | | | Consumer Discretionary – 0.9% (0.6% of Total Investments) | | | | | |
| $ | 480 | | Boston Industrial Development Financing Authority, Massachusetts, Senior Revenue Bonds, Crosstown Center Project, Series 2002, 6.500%, 9/01/35 (Alternative Minimum Tax) | 9/12 at 102.00 | Caa3 | $ | 250,862 | |
| | | | Education and Civic Organizations – 45.6% (29.8% of Total Investments) | | | | | |
| | 375 | | Massachusetts Development Finance Agency, Revenue Bonds, Boston University, Series 2009V-1, 5.000%, 10/01/29 | 10/19 at 100.00 | A | | 378,709 | |
| | 400 | | Massachusetts Development Finance Agency, Revenue Bonds, Emerson College, Series 2010A, 5.000%, 1/01/40 | 1/20 at 100.00 | A– | | 380,012 | |
| | 450 | | Massachusetts Development Finance Agency, Revenue Bonds, Worcester Polytechnic Institute, Series 2007, 5.000%, 9/01/37 – NPFG Insured | 9/17 at 100.00 | A+ | | 446,031 | |
| | 495 | | Massachusetts Development Finance Authority, Revenue Bonds, Massachusetts College of Pharmacy and Allied Health Sciences, Series 2005D, 5.000%, 7/01/27 – AGC Insured | 7/15 at 100.00 | AA+ | | 510,201 | |
| | 500 | | Massachusetts Development Finance Authority, Revenue Bonds, WGBH Educational Foundation, Series 2002A, 5.750%, 1/01/42 – AMBAC Insured | No Opt. Call | A | | 536,875 | |
| | 2,100 | | Massachusetts Development Finance Authority, Revenue Bonds, WGBH Educational Foundation, 5.000%, 1/01/42 – AGC Insured (UB) | 1/18 at 100.00 | AA+ | | 2,075,409 | |
| | 1,000 | | Massachusetts Development Finance Authority, Revenue Refunding Bonds, Boston University, Series 1999P, 6.000%, 5/15/59 | 5/29 at 105.00 | A2 | | 1,109,710 | |
| | 990 | | Massachusetts Educational Finance Authority, Educational Loan Revenue Bonds, Series 2001E, 5.300%, 1/01/16 – AMBAC Insured (Alternative Minimum Tax) | 1/11 at 100.00 | AA | | 991,643 | |
| | 1,000 | | Massachusetts Health and Educational Facilities Authority, Revenue Bonds, Boston College, Series 2003N, 5.250%, 6/01/18 | 6/13 at 100.00 | AA– | | 1,090,150 | |
| | 500 | | Massachusetts Health and Educational Facilities Authority, Revenue Bonds, Springfield College, Series 2010, 5.500%, 10/15/31 | 10/19 at 100.00 | Baa1 | | 511,595 | |
| | 2,000 | | Massachusetts Health and Educational Facilities Authority, Revenue Bonds, Tufts University, Series 2001I, 5.500%, 2/15/36 | 2/11 at 100.00 | Aa2 | | 2,003,056 | |
| | 1,500 | | Massachusetts Health and Educational Facilities Authority, Revenue Bonds, Wheaton College Issues, Series 2010F, 5.000%, 1/01/41 | No Opt. Call | A2 | | 1,476,990 | |
| | 590 | | Massachusetts Health and Educational Facilities Authority, Revenue Bonds, Williams College, Series 2007L, 5.000%, 7/01/31 | 7/16 at 100.00 | AAA | | 606,166 | |
| | 500 | | Massachusetts Health and Educational Facilities Authority, Revenue Refunding Bonds, Suffolk University Issue, Series 2009A, 5.750%, 7/01/39 | 7/19 at 100.00 | BBB | | 506,900 | |
| | 12,400 | | Total Education and Civic Organizations | | | | 12,623,447 | |
| | | | Health Care – 27.6% (18.0% of Total Investments) | | | | | |
| | 500 | | Massachusetts Health and Educational Facilities Authority Revenue Bonds, Quincy Medical Center Issue, Series 2008A, 6.500%, 1/15/38 | 1/18 at 100.00 | N/R | | 434,080 | |
| | 500 | | Massachusetts Health and Educational Facilities Authority, Revenue Bonds, Berkshire Health System, Series 2001E, 6.250%, 10/01/31 | 10/11 at 101.00 | BBB+ | | 505,110 | |
| | 775 | | Massachusetts Health and Educational Facilities Authority, Revenue Bonds, Caregroup Inc., Series B1 Capital Asset Program Converted June 13,2008, 5.375%, 2/01/26 – NPFG Insured | 8/18 at 100.00 | A | | 790,748 | |
| | 500 | | Massachusetts Health and Educational Facilities Authority, Revenue Bonds, Caregroup Inc., Series B2, Capital Asset Program, Converted June 9, 2009, 5.375%, 2/01/27 – NPFG Insured | 8/18 at 100.00 | A | | 507,015 | |
| | 1,000 | | Massachusetts Health and Educational Facilities Authority, Revenue Bonds, Children’s Hospital, Series 2009M, 5.500%, 12/01/39 | 12/19 at 100.00 | AA | | 1,045,480 | |
| | 295 | | Massachusetts Health and Educational Facilities Authority, Revenue Bonds, Covenant Health Systems Obligated Group, Series 2002, 6.000%, 7/01/31 | 1/12 at 101.00 | A | | 299,640 | |
| | | | Massachusetts Health and Educational Facilities Authority, Revenue Bonds, Emerson Hospital, Series 2005E: | | | | | |
| | 550 | | 5.000%, 8/15/25 – RAAI Insured | 8/15 at 100.00 | N/R | | 482,994 | |
| | 315 | | 5.000%, 8/15/35 – RAAI Insured | 8/15 at 100.00 | N/R | | 252,980 | |
50 Nuveen Investments
| | Principal Amount (000) | | Description (1) | Optional Call Provisions (2) | Ratings (3) | | Value | |
| | | | Health Care (continued) | | | | | |
| $ | 600 | | Massachusetts Health and Educational Facilities Authority, Revenue Bonds, Lahey Clinic Medical Center, Series 2005C, 5.000%, 8/15/21 – FGIC Insured | 8/15 at 100.00 | A+ | $ | 614,610 | |
| | 1,000 | | Massachusetts Health and Educational Facilities Authority, Revenue Bonds, Lahey Medical Center, Series 2007D, 5.250%, 8/15/28 | 8/17 at 100.00 | A+ | | 1,007,790 | |
| | 290 | | Massachusetts Health and Educational Facilities Authority, Revenue Bonds, Milford Regional Medical Center, Series 2007E, 5.000%, 7/15/32 | 7/17 at 100.00 | BBB– | | 245,482 | |
| | 500 | | Massachusetts Health and Educational Facilities Authority, Revenue Bonds, Milton Hospital Project, Series 2005D, 5.250%, 7/01/30 | 7/15 at 100.00 | BB– | | 376,275 | |
| | 500 | | Massachusetts Health and Educational Facilities Authority, Revenue Bonds, Northern Berkshire Community Services Inc., Series 2004B, 6.375%, 7/01/34 | 7/14 at 100.00 | CCC | | 258,650 | |
| | 35 | | Massachusetts Health and Educational Facilities Authority, Revenue Bonds, Partners HealthCare System Inc., Series 2001C, 5.750%, 7/01/32 | 7/11 at 101.00 | AA | | 35,580 | |
| | 500 | | Massachusetts Health and Educational Facilities Authority, Revenue Bonds, UMass Memorial Health Care, Series 2001C, 6.625%, 7/01/32 | 7/11 at 100.00 | BBB+ | | 503,455 | |
| | 285 | | Massachusetts Health and Educational Facilities Authority, Revenue Bonds, UMass Memorial Health Care, Series 2005D, 5.000%, 7/01/33 | 7/15 at 100.00 | BBB+ | | 267,034 | |
| | 8,145 | | Total Health Care | | | | 7,626,923 | |
| | | | Housing/Multifamily – 11.7% (7.6% of Total Investments) | | | | | |
| | 565 | | Massachusetts Development Finance Authority, Multifamily Housing Revenue Bonds, Emerson Manor Project, Series 2007, 4.800%, 7/20/48 | 7/17 at 100.00 | BB | | 542,654 | |
| | 500 | | Massachusetts Housing Finance Agency, Housing Revenue Bonds, Series 2003S, 5.050%, 12/01/23 (Alternative Minimum Tax) | 6/13 at 100.00 | AA– | | 501,630 | |
| | 1,135 | | Massachusetts Housing Finance Agency, Rental Housing Mortgage Revenue Bonds, Series 2001A, 5.850%, 7/01/35 – AMBAC Insured (Alternative Minimum Tax) | 1/11 at 100.00 | N/R | | 1,134,887 | |
| | 1,000 | | Somerville Housing Authority, Massachusetts, GNMA Collateralized Mortgage Revenue Bonds, Clarendon Hill Towers, Series 2002, 5.200%, 11/20/22 | 5/12 at 103.00 | N/R | | 1,043,670 | |
| | 3,200 | | Total Housing/Multifamily | | | | 3,222,841 | |
| | | | Housing/Single Family – 4.1% (2.6% of Total Investments) | | | | | |
| | 650 | | Massachusetts Housing Finance Agency, Single Family Housing Revenue Bonds, Series 2006-126, 4.625%, 6/01/32 (Alternative Minimum Tax) | 6/16 at 100.00 | AA | | 606,743 | |
| | 480 | | Massachusetts Housing Finance Agency, Single Family Housing Revenue Bonds, Series 2008, Trust 3145, 15.203%, 6/01/16 (IF) | No Opt. Call | AA | | 518,539 | |
| | 1,130 | | Total Housing/Single Family | | | | 1,125,282 | |
| | | | Industrials – 1.2% (0.8% of Total Investments) | | | | | |
| | 125 | | Massachusetts Development Finance Agency, Pioneer Valley Resource Recovery Revenue Bonds, Eco/Springfield LLC, Series 2006, 5.875%, 7/01/14 (Alternative Minimum Tax) | No Opt. Call | N/R | | 119,875 | |
| | 200 | | Massachusetts Development Finance Agency, Solid Waste Disposal Revenue Bonds, Waste Management Inc., Series 2003, 5.450%, 6/01/14 | No Opt. Call | BBB | | 211,232 | |
| | 325 | | Total Industrials | | | | 331,107 | |
| | | | Long-Term Care – 8.8% (5.7% of Total Investments) | | | | | |
| | 100 | | Massachusetts Development Finance Agency, Revenue Bonds, Carleton-Willard Village, Series 2010, 5.625%, 12/01/30 | 12/19 at 100.00 | A– | | 99,466 | |
| | 725 | | Massachusetts Development Finance Agency, Revenue Bonds, Orchard Cove, Series 2007, 5.250%, 10/01/26 | 10/12 at 102.00 | N/R | | 607,391 | |
| | 655 | | Massachusetts Development Finance Authority, First Mortgage Revenue Bonds, Berkshire Retirement Community – Edgecombe Project, Series 2001A, 6.750%, 7/01/21 | 7/11 at 102.00 | BBB | | 669,541 | |
| | 1,000 | | Massachusetts Development Finance Authority, GNMA Collateralized Assisted Living Facility Revenue Bonds, Arbors at Chicopee, Series 2001A, 6.250%, 9/20/42 (Alternative Minimum Tax) | 3/12 at 105.00 | AAA | | 1,050,900 | |
| | 2,480 | | Total Long-Term Care | | | | 2,427,298 | |
Nuveen Investments 51
| | | Nuveen Massachusetts Dividend Advantage Municipal Fund (continued) |
| NMB | | Portfolio of Investments November 30, 2010 (Unaudited) |
| | Principal Amount (000) | | Description (1) | Optional Call Provisions (2) | Ratings (3) | | Value | |
| | | | Tax Obligation/General – 6.9% (4.5% of Total Investments) | | | | | |
| $ | 310 | | Ashland, Massachusetts, General Obligation Bonds, Series 2004, 5.250%, 5/15/23 – AMBAC Insured | 5/15 at 100.00 | Aa2 | $ | 329,511 | |
| | 440 | | Fall River, Massachusetts, General Obligation Bonds, Series 2003, 5.000%, 2/01/21 – AGM Insured | 2/13 at 101.00 | AA+ | | 456,412 | |
| | 500 | | Norwell, Massachusetts, General Obligation Bonds, Series 2003, 5.000%, 11/15/20 – FGIC Insured | No Opt. Call | AAA | | 590,155 | |
| | 500 | | Puerto Rico, General Obligation and Public Improvement Bonds, Series 2002A, 5.500%, 7/01/29 – FGIC Insured | No Opt. Call | A3 | | 518,925 | |
| | 1,750 | | Total Tax Obligation/General | | | | 1,895,003 | |
| | | | Tax Obligation/Limited – 11.7% (7.7% of Total Investments) | | | | | |
| | 395 | | Martha’s Vineyard Land Bank, Massachusetts, Revenue Bonds, Series 2004, 5.000%, 5/01/26 – AMBAC Insured | 5/14 at 100.00 | A | | 400,182 | |
| | 385 | | Massachusetts Bay Transportation Authority, Senior Lien Sales Tax Revenue Refunding Bonds, Series 2004C, 5.250%, 7/01/21 | No Opt. Call | AAA | | 456,718 | |
| | 230 | | Massachusetts College Building Authority, Project Revenue Bonds, Series 2004A, 5.000%, 5/01/19 – NPFG Insured | 5/14 at 100.00 | Aa2 | | 250,781 | |
| | 250 | | Massachusetts College Building Authority, Project Revenue Bonds, Series 2006A, 5.000%, 5/01/31 – AMBAC Insured | 5/16 at 100.00 | Aa2 | | 255,883 | |
| | 550 | | Massachusetts College Building Authority, Project Revenue Bonds, Series 2008A, 5.000%, 5/01/33 – AGC Insured | 5/18 at 100.00 | AA+ | | 564,548 | |
| | 500 | | Massachusetts School Building Authority, Dedicated Sales Tax Revenue Bonds, Series 2005A, 5.000%, 8/15/20 – AGM Insured | 8/15 at 100.00 | AA+ | | 554,825 | |
| | 230 | | Massachusetts, Special Obligation Dedicated Tax Revenue Bonds, Series 2005, 5.000%, 1/01/20 – FGIC Insured | No Opt. Call | A1 | | 255,323 | |
| | 500 | | Virgin Islands Public Finance Authority, Gross Receipts Taxes Loan Note, Series 1999A, 6.375%, 10/01/19 | 4/11 at 101.00 | BBB+ | | 505,970 | |
| | 3,040 | | Total Tax Obligation/Limited | | | | 3,244,230 | |
| | | | Transportation – 3.2% (2.1% of Total Investments) | | | | | |
| | 500 | | Massachusetts Port Authority, Airport System Revenue Bonds, Series 2010A, 5.000%, 7/01/30 | 7/20 at 100.00 | AA– | | 520,655 | |
| | 400 | | Massachusetts Port Authority, Special Facilities Revenue Bonds, BOSFUEL Corporation, Series 2007, 5.000%, 7/01/32 – FGIC Insured (Alternative Minimum Tax) | 7/17 at 100.00 | A | | 369,896 | |
| | 900 | | Total Transportation | | | | 890,551 | |
| | | | U.S. Guaranteed – 16.8% (11.0% of Total Investments) (4) | | | | | |
| | 1,000 | | Boston, Massachusetts, General Obligation Bonds, Series 2001A, 5.000%, 2/01/20 (Pre-refunded 2/01/11) | 2/11 at 100.00 | Aaa | | 1,008,060 | |
| | 1,675 | | Lawrence, Massachusetts, General Obligation Bonds, Series 2001, 5.000%, 2/01/21 (Pre-refunded 2/01/11) – AMBAC Insured | 2/11 at 100.00 | Aa2 (4 | ) | 1,688,501 | |
| | 500 | | Massachusetts Development Finance Authority, Revenue Bonds, Milton Academy, Series 2003A, 5.000%, 9/01/19 (Pre-refunded 9/01/13) | 9/13 at 100.00 | AA– (4 | ) | 556,305 | |
| | 250 | | Massachusetts Health and Educational Facilities Authority, Revenue Bonds, Caritas Christi Obligated Group, Series 1999A, 5.625%, 7/01/20 (Pre-refunded 1/01/11) | 1/11 at 100.00 | Baa2 (4 | ) | 251,045 | |
| | 80 | | Massachusetts Health and Educational Facilities Authority, Revenue Bonds, Covenant Health Systems Obligated Group, Series 2002, 6.000%, 7/01/31 (Pre-refunded 1/01/12) | 1/12 at 101.00 | A (4 | ) | 85,550 | |
| | 215 | | Massachusetts Health and Educational Facilities Authority, Revenue Bonds, Partners HealthCare System Inc., Series 2001C, 5.750%, 7/01/32 (Pre-refunded 7/01/11) | 7/11 at 101.00 | AAA | | 223,983 | |
| | 750 | | Massachusetts, Special Obligation Dedicated Tax Revenue Bonds, Series 2004, 5.250%, 1/01/25 (Pre-refunded 1/01/14) – FGIC Insured | 1/14 at 100.00 | A1 (4 | ) | 842,595 | |
| | 4,470 | | Total U.S. Guaranteed | | | | 4,656,039 | |
52 Nuveen Investments
| | Principal Amount (000) | | Description (1) | Optional Call Provisions (2) | Ratings (3) | | Value | |
| | | | Utilities – 5.8% (3.8% of Total Investments) | | | | | |
| $ | 1,070 | | Massachusetts Development Finance Agency, Resource Recovery Revenue Bonds, SEMass System, Series 2001A, 5.625%, 1/01/14 – NPFG Insured | 1/12 at 101.00 | A | $ | 1,102,956 | |
| | 500 | | Massachusetts Industrial Finance Agency, Resource Recovery Revenue Refunding Bonds, Ogden Haverhill Project, Series 1998A, 5.600%, 12/01/19 (Alternative Minimum Tax) | 12/10 at 100.00 | BBB | | 501,200 | |
| | 1,570 | | Total Utilities | | | | 1,604,156 | |
| | | | Water and Sewer – 8.8% (5.8% of Total Investments) | | | | | |
| | 530 | | Boston Water and Sewerage Commission, Massachusetts, General Revenue Bonds, Senior Series 2004A, 5.000%, 11/01/25 | 11/14 at 100.00 | AA+ | | 558,170 | |
| | 125 | | Guam Government Waterworks Authority, Water and Wastewater System Revenue Bonds, Series 2005, 6.000%, 7/01/25 | 7/15 at 100.00 | Ba2 | | 126,563 | |
| | 500 | | Massachusetts Water Pollution Abatement Trust, Pooled Loan Program Bonds, Series 2005-11, 4.500%, 8/01/29 | 8/15 at 100.00 | AAA | | 503,215 | |
| | 400 | | Massachusetts Water Pollution Abatement Trust, Pooled Loan Program Bonds, Series 2006-12, 4.375%, 8/01/31 | 8/16 at 100.00 | AAA | | 396,752 | |
| | 500 | | Massachusetts Water Pollution Abatement Trust, Revenue Bonds, MWRA Loan Program, Series 2002A, 5.250%, 8/01/20 | 8/12 at 100.00 | AAA | | 533,155 | |
| | 105 | | Massachusetts Water Pollution Abatement Trust, Revenue Bonds, MWRA Loan Program, Subordinate Series 1999A, 5.750%, 8/01/29 | 2/11 at 100.00 | AAA | | 105,350 | |
| | 250 | | Massachusetts Water Resources Authority, General Revenue Bonds, Series 2006A, 4.000%, 8/01/46 | 8/16 at 100.00 | AA+ | | 220,363 | |
| | 2,410 | | Total Water and Sewer | | | | 2,443,568 | |
| $ | 42,300 | | Total Investments (cost $42,620,016) – 153.1% | | | | 42,341,307 | |
| | | | Floating Rate Obligations – (3.8)% | | | | (1,050,000 | ) |
| | | | MuniFund Term Preferred Shares, at Liquidation Value – (53.2)% (5) | | | | (14,725,000 | ) |
| | | | Other Assets Less Liabilities – 3.9% | | | | 1,096,394 | |
| | | | Net Assets Applicable to Common Shares – 100% | | | $ | 27,662,701 | |
| (1) | | All percentages shown in the Portfolio of Investments are based on net assets applicable to Common shares unless otherwise noted. |
| (2) | | Optional Call Provisions: Dates (month and year) and prices of the earliest optional call or redemption. There may be other call provisions at varying prices at later dates. Certain mortgage-backed securities may be subject to periodic principal paydowns. |
| (3) | | Ratings: Using the highest of Standard & Poor’s Group (“Standard & Poor’s”), Moody’s Investor Service, Inc. (“Moody’s”) or Fitch, Inc. (“Fitch”) rating. Ratings below BBB by Standard & Poor’s, Baa by Moody’s or BBB by Fitch are considered to be below investment grade. Holdings designated N/R are not rated by any of these national rating agencies. |
| (4) | | Backed by an escrow or trust containing sufficient U.S. Government or U.S. Government agency securities, which ensure the timely payment of principal and interest. Such investments are normally considered to be equivalent to AAA rated securities. |
| (5) | | MuniFund Term Preferred Shares, at Liquidation Value as a percentage of Total Investments is 34.8%. |
| N/R | | Not rated. |
| (IF) | | Inverse floating rate investment. |
| (UB) | | Underlying bond of an inverse floating rate trust reflected as a financing transaction. See Notes to Financial Statements, Footnote 1 – General Information and Significant Accounting Policies, Inverse Floating Rate Securities for more information. |
See accompanying notes to financial statements.
Nuveen Investments 53
| | | Nuveen Insured Massachusetts Tax-Free Advantage Municipal Fund |
| NGX | | Portfolio of Investments |
November 30, 2010 (Unaudited)
| | Principal Amount (000) | | Description (1) | Optional Call Provisions (2) | Ratings (3) | | Value | |
| | | | Education and Civic Organizations – 26.2% (16.7% of Total Investments) | | | | | |
| $ | 1,135 | | Massachusetts Development Finance Agency, Revenue Bonds, Boston University, Series 2005T-1, 5.000%, 10/01/39 – AMBAC Insured | 10/15 at 100.00 | A | $ | 1,135,885 | |
| | 600 | | Massachusetts Development Finance Agency, Revenue Bonds, Worcester Polytechnic Institute, Series 2007, 5.000%, 9/01/37 – NPFG Insured | 9/17 at 100.00 | A+ | | 594,708 | |
| | 1,250 | | Massachusetts Development Finance Authority, Revenue Bonds, Middlesex School, Series 2003, 5.000%, 9/01/33 | 9/13 at 100.00 | A1 | | 1,257,088 | |
| | 1,000 | | Massachusetts Development Finance Authority, Revenue Bonds, WGBH Educational Foundation, Series 2002A, 5.750%, 1/01/42 – AMBAC Insured | No Opt. Call | A | | 1,073,750 | |
| | 3,000 | | Massachusetts Development Finance Authority, Revenue Bonds, WGBH Educational Foundation, 5.000%, 1/01/42 – AGC Insured (UB) | 1/18 at 100.00 | AA+ | | 2,964,870 | |
| | 1,750 | | Massachusetts Health and Educational Facilities Authority, Revenue Bonds, Boston College, Series 2003N, 5.125%, 6/01/37 | 6/13 at 100.00 | AA– | | 1,801,450 | |
| | 1,500 | | Massachusetts Health and Educational Facilities Authority, Revenue Bonds, Worcester State College, Series 2002, 5.000%, 11/01/32 – AMBAC Insured | 11/12 at 100.00 | A2 | | 1,468,650 | |
| | 10,235 | | Total Education and Civic Organizations | | | | 10,296,401 | |
| | | | Health Care – 16.9% (10.8% of Total Investments) | | | | | |
| | 500 | | Massachusetts Health and Educational Facilities Authority, Revenue Bonds, Cape Cod Healthcare Obligated Group, Series 2004D, 5.125%, 11/15/35 – AGC Insured | 11/19 at 100.00 | AA+ | | 496,505 | |
| | 455 | | Massachusetts Health and Educational Facilities Authority, Revenue Bonds, CareGroup Inc., Series 1998A, 5.000%, 7/01/25 – NPFG Insured | 1/11 at 100.00 | A | | 446,669 | |
| | | | Massachusetts Health and Educational Facilities Authority, Revenue Bonds, Caregroup Inc., Series B1 Capital Asset Program Converted June 13,2008: | | | | | |
| | 450 | | 5.375%, 2/01/26 – NPFG Insured | 8/18 at 100.00 | A | | 459,144 | |
| | 600 | | 5.375%, 2/01/27 – NPFG Insured | 8/18 at 100.00 | A | | 608,418 | |
| | 1,500 | | Massachusetts Health and Educational Facilities Authority, Revenue Bonds, Caregroup Inc., Series B2, Capital Asset Program, Converted June 9, 2009, 5.375%, 2/01/28 – NPFG Insured | 8/18 at 100.00 | A | | 1,519,155 | |
| | 585 | | Massachusetts Health and Educational Facilities Authority, Revenue Bonds, Milford Regional Medical Center, Series 2007E, 5.000%, 7/15/32 | 7/17 at 100.00 | BBB– | | 495,197 | |
| | 200 | | Massachusetts Health and Educational Facilities Authority, Revenue Bonds, Milton Hospital Project, Series 2005D, 5.250%, 7/01/30 | 7/15 at 100.00 | BB– | | 150,510 | |
| | 2,400 | | Massachusetts Health and Educational Facilities Authority, Revenue Bonds, New England Medical Center Hospitals, Series 2002H, 5.000%, 5/15/25 – FGIC Insured | 5/12 at 100.00 | N/R | | 2,247,888 | |
| | 250 | | Massachusetts Health and Educational Facilities Authority, Revenue Bonds, UMass Memorial Health Care, Series 2005D, 5.000%, 7/01/33 | 7/15 at 100.00 | BBB+ | | 234,240 | |
| | 6,940 | | Total Health Care | | | | 6,657,726 | |
| | | | Housing/Multifamily – 11.5% (7.3% of Total Investments) | | | | | |
| | 500 | | Boston Housing Authority, Massachusetts, Capital Program Revenue Bonds, Series 2008, 5.000%, 4/01/20 – AGM Insured | 4/18 at 100.00 | AA+ | | 532,635 | |
| | 760 | | Massachusetts Development Finance Authority, Multifamily Housing Revenue Bonds, Emerson Manor Project, Series 2007, 4.800%, 7/20/48 | 7/17 at 100.00 | BB | | 729,942 | |
| | 2,000 | | Massachusetts Housing Finance Agency, Housing Bonds, Series 2003H, 5.125%, 6/01/43 | 12/12 at 100.00 | AA– | | 2,001,500 | |
| | 1,265 | | Massachusetts Housing Finance Agency, Rental Housing Mortgage Revenue Bonds, Series 2002H, 5.200%, 7/01/42 – AGM Insured | 7/12 at 100.00 | AA+ | | 1,267,416 | |
| | 4,525 | | Total Housing/Multifamily | | | | 4,531,493 | |
| | | | Industrials – 7.3% (4.7% of Total Investments) | | | | | |
| | | | Massachusetts Development Finance Authority, Revenue Bonds, 100 Cambridge Street Redevelopment, M/SRBC Project, Series 2002A: | | | | | |
| | 1,475 | | 5.125%, 8/01/28 – NPFG Insured | 2/12 at 100.00 | A | | 1,468,112 | |
| | 1,500 | | 5.125%, 2/01/34 – NPFG Insured | 2/12 at 100.00 | A | | 1,422,000 | |
| | 2,975 | | Total Industrials | | | | 2,890,112 | |
54 Nuveen Investments
| | Principal Amount (000) | | Description (1) | Optional Call Provisions (2) | Ratings (3) | | Value | |
| | | | Long-Term Care – 4.8% (3.1% of Total Investments) | | | | | |
| $ | 1,750 | | Massachusetts Development Finance Authority, GNMA Collateralized Revenue Bonds, Neville Communities, Series 2002A, 6.000%, 6/20/44 | 12/12 at 105.00 | AAA | $ | 1,888,968 | |
| | | | Tax Obligation/General – 12.8% (8.2% of Total Investments) | | | | | |
| | 1,280 | | Littleton, Massachusetts, General Obligation Bonds, Series 2003, 5.000%, 1/15/21 – FGIC Insured | 1/13 at 101.00 | AA | | 1,329,178 | |
| | 1,500 | | Massachusetts, General Obligation Bonds, Consolidated Loan, Series 2004B, 5.250%, 8/01/21 – AGM Insured | No Opt. Call | AA+ | | 1,771,560 | |
| | 1,705 | | North Attleborough, Massachusetts, General Obligation Bonds, Series 2004, 5.000%, 7/15/15 – FGIC Insured | 7/14 at 101.00 | Aa2 | | 1,936,556 | |
| | 4,485 | | Total Tax Obligation/General | | | | 5,037,294 | |
| | | | Tax Obligation/Limited – 17.8% (11.4% of Total Investments) | | | | | |
| | 3,000 | | Martha’s Vineyard Land Bank, Massachusetts, Revenue Bonds, Series 2002, 5.000%, 5/01/32 – AMBAC Insured | 5/13 at 100.00 | A | | 3,015,480 | |
| | 750 | | Massachusetts College Building Authority, Project Revenue Bonds, Series 2008A, 5.000%, 5/01/33 – AGC Insured | 5/18 at 100.00 | AA+ | | 769,838 | |
| | 2,790 | | Massachusetts College Building Authority, Project Revenue Refunding Bonds, Series 2003A, 5.250%, 5/01/22 – SYNCORA GTY Insured | 5/13 at 100.00 | Aa2 | | 2,898,754 | |
| | 300 | | Massachusetts, Special Obligation Dedicated Tax Revenue Bonds, Series 2005, 5.000%, 1/01/20 – FGIC Insured | No Opt. Call | A1 | | 333,030 | |
| | 6,840 | | Total Tax Obligation/Limited | | | | 7,017,102 | |
| | | | Transportation – 2.6% (1.7% of Total Investments) | | | | | |
| | 1,000 | | Massachusetts Port Authority, Revenue Bonds, Series 2003A, 5.000%, 7/01/33 – NPFG Insured | 7/13 at 100.00 | AA– | | 1,022,530 | |
| | | | U.S. Guaranteed – 35.3% (22.6% of Total Investments) (4) | | | | | |
| | 2,000 | | Massachusetts Bay Transportation Authority, Sales Tax Revenue Bonds, Senior Lien Series 2002A, 5.000%, 7/01/27 (Pre-refunded 7/01/12) – FGIC Insured | 7/12 at 100.00 | AAA | | 2,141,180 | |
| | 500 | | Massachusetts Development Finance Authority, Revenue Bonds, Massachusetts College of Pharmacy and Allied Health Sciences, Series 2003C, 6.375%, 7/01/23 (Pre-refunded 7/01/13) | 7/13 at 101.00 | A (4 | ) | 577,430 | |
| | 100 | | Massachusetts Health and Educational Facilities Authority, Revenue Bonds, New England Medical Center Hospitals, Series 2002H, 5.000%, 5/15/25 (Pre-refunded 5/15/12) – FGIC Insured | 5/12 at 100.00 | N/R (4 | ) | 106,192 | |
| | 415 | | Massachusetts Port Authority, Revenue Bonds, Series 1982, 13.000%, 7/01/13 (ETM) | 1/11 at 100.00 | AAA | | 492,398 | |
| | 2,000 | | Massachusetts, General Obligation Bonds, Consolidated Loan, Series 2001D, 5.000%, 11/01/20 (Pre-refunded 11/01/11) – NPFG Insured | 11/11 at 100.00 | Aa1 (4 | ) | 2,084,880 | |
| | 1,000 | | Massachusetts, Special Obligation Dedicated Tax Revenue Bonds, Series 2004, 5.250%, 1/01/21 (Pre-refunded 1/01/14) – FGIC Insured | 1/14 at 100.00 | A1 (4 | ) | 1,123,460 | |
| | 1,500 | | Pittsfield, Massachusetts, General Obligation Bonds, Series 2002, 5.000%, 4/15/18 (Pre-refunded 4/15/12) – NPFG Insured | 4/12 at 101.00 | Aa2 (4 | ) | 1,606,815 | |
| | 3,000 | | Springfield, Massachusetts, General Obligation Bonds, Series 2003, 5.250%, 1/15/22 (Pre-refunded 1/15/13) – NPFG Insured | 1/13 at 100.00 | AA– (4 | ) | 3,286,377 | |
| | 2,140 | | University of Massachusetts Building Authority, Senior Lien Project Revenue Bonds, Series 2004-1, 5.375%, 11/01/21 (Pre-refunded 11/01/14) – AMBAC Insured | 11/14 at 100.00 | A+ (4 | ) | 2,491,859 | |
| | 12,655 | | Total U.S. Guaranteed | | | | 13,910,591 | |
| | | | Utilities – 2.2% (1.4% of Total Investments) | | | | | |
| | 900 | | Guam Power Authority, Revenue Bonds, Series 2010A, 5.000%, 10/01/37 – AGM Insured | 10/20 at 100.00 | AA+ | | 872,784 | |
| | | | Water and Sewer – 19.0% (12.1% of Total Investments) | | | | | |
| | 1,900 | | Lynn Water and Sewer Commission, Massachusetts, General Revenue Bonds, Series 2003A, 5.000%, 12/01/32 – NPFG Insured | 12/13 at 100.00 | A1 | | 1,901,045 | |
| | 600 | | Massachusetts Water Pollution Abatement Trust, Pooled Loan Program Bonds, Series 2006-12, 4.375%, 8/01/31 | 8/16 at 100.00 | AAA | | 595,128 | |
| | 1,000 | | Massachusetts Water Resources Authority, General Revenue Bonds, Series 2002J, 5.250%, 8/01/19 – AGM Insured | No Opt. Call | AA+ | | 1,195,890 | |
Nuveen Investments 55
| | | Nuveen Insured Massachusetts Tax-Free Advantage Municipal Fund (continued) |
| NGX | | Portfolio of Investments November 30, 2010 (Unaudited) |
| | Principal Amount (000) | | Description (1) | Optional Call Provisions (2) | Ratings (3) | | Value | |
| | | | Water and Sewer (continued) | | | | | |
| $ | 1,000 | | Massachusetts Water Resources Authority, General Revenue Bonds, Series 2004D, 5.000%, 8/01/24 – NPFG Insured | 8/13 at 100.00 | AA+ | $ | 1,065,070 | |
| | | | Massachusetts Water Resources Authority, General Revenue Bonds, Series 2006A: | | | | | |
| | 1,500 | | 5.000%, 8/01/31 – AMBAC Insured | 8/16 at 100.00 | AA+ | | 1,554,150 | |
| | 125 | | 4.000%, 8/01/46 | 8/16 at 100.00 | AA+ | | 110,181 | |
| | 500 | | Springfield Water and Sewerage Commission, Massachusetts, General Revenue Bonds, Refunding Series 2010B, 5.000%, 11/15/30 – AGC Insured | No Opt. Call | AA+ | | 528,310 | |
| | 495 | | Springfield Water and Sewerage Commission, Massachusetts, General Revenue Bonds, Series 2003A, 5.000%, 7/01/16 – NPFG Insured | 7/14 at 100.00 | A+ | | 541,456 | |
| | 7,120 | | Total Water and Sewer | | | | 7,491,230 | |
| $ | 59,425 | | Total Investments (cost $60,155,255) – 156.4% | | | | 61,616,231 | |
| | | | Floating Rate Obligations – (3.8)% | | | | (1,500,000 | ) |
| | | | MuniFund Term Preferred Shares, at Liquidation Value – (56.1)% (5) | | | | (22,075,000 | ) |
| | | | Other Assets Less Liabilities – 3.5% | | | | 1,343,243 | |
| | | | Net Assets Applicable to Common Shares – 100% | | | $ | 39,384,474 | |
| | | The Fund intends to invest at least 80% of its managed assets in municipal securities that are covered by insurance guaranteeing the timely payment of principal and interest. See Notes to Financial Statements, Footnote 1 – General Information and Significant Accounting Policies, Insurance, for more information. |
| (1) | | All percentages shown in the Portfolio of Investments are based on net assets applicable to Common shares unless otherwise noted. |
| (2) | | Optional Call Provisions: Dates (month and year) and prices of the earliest optional call or redemption. There may be other call provisions at varying prices at later dates. Certain mortgage-backed securities may be subject to periodic principal paydowns. |
| (3) | | Ratings: Using the highest of Standard & Poor’s Group (“Standard & Poor’s”), Moody’s Investor Service, Inc. (“Moody’s”) or Fitch, Inc. (“Fitch”) rating. Ratings below BBB by Standard & Poor’s, Baa by Moody’s or BBB by Fitch are considered to be below investment grade. Holdings designated N/R are not rated by any of these national rating agencies. |
| (4) | | Backed by an escrow or trust containing sufficient U.S. Government or U.S. Government agency securities, which ensure the timely payment of principal and interest. Such investments are normally considered to be equivalent to AAA rated securities. |
| (5) | | MuniFund Term Preferred Shares, at Liquidation Value as a percentage of Total Investments is 35.8%. |
| N/R | | Not rated. |
| (ETM) | | Escrowed to maturity. |
| (UB) | | Underlying bond of an inverse floating rate trust reflected as a financing transaction. See Notes to Financial Statements, Footnote 1 – General Information and Significant Accounting Policies, Inverse Floating Rate Securities for more information. |
See accompanying notes to financial statements.
56 Nuveen Investments
| | | Nuveen Missouri Premium Income Municipal Fund |
| NOM | | Portfolio of Investments |
November 30, 2010 (Unaudited)
| | Principal Amount (000) | | Description (1) | Optional Call Provisions (2) | Ratings (3) | | Value | |
| | | | Consumer Staples – 3.3% (2.1% of Total Investments) | | | | | |
| $ | 1,000 | | Missouri Development Finance Board, Solid Waste Disposal Revenue Bonds, Procter and Gamble Inc., Series 1999, 5.200%, 3/15/29 (Alternative Minimum Tax) | No Opt. Call | AA– | $ | 1,011,130 | |
| | | | Education and Civic Organizations – 2.0% (1.3% of Total Investments) | | | | | |
| | 250 | | Lincoln University, Missouri, Auxiliary System Revenue Bonds, Series 2007, 5.125%, 6/01/37 – AGC Insured | 6/17 at 100.00 | AA+ | | 250,138 | |
| | 365 | | Missouri Health and Educational Facilities Authority, Revenue Bonds, Webster University, Series 2001, 5.500%, 4/01/18 – NPFG Insured | 4/11 at 100.00 | A3 | | 367,712 | |
| | 615 | | Total Education and Civic Organizations | | | | 617,850 | |
| | | | Health Care – 29.9% (19.3% of Total Investments) | | | | | |
| | 760 | | Cape Girardeau County Industrial Development Authority, Missouri, Health Facilities Revenue Bonds, Southeast Missouri Hospital Association, Series 2007, 5.000%, 6/01/27 | 6/17 at 100.00 | N/R | | 703,585 | |
| | 930 | | Cass County, Missouri, Hospital Revenue Bonds, Series 2007, 5.625%, 5/01/38 | 11/16 at 100.00 | N/R | | 815,712 | |
| | 480 | | Clinton County Industrial Development Authority, Missouri, Revenue Bonds, Cameron Regional Medical Center, Series 2007, 5.000%, 12/01/37 | 12/17 at 100.00 | N/R | | 335,213 | |
| | 750 | | Joplin Industrial Development Authority, Missouri, Health Facilities Revenue Bonds, Freeman Health System, Series 2004, 5.500%, 2/15/29 | 2/15 at 102.00 | BBB+ | | 723,203 | |
| | 500 | | Missouri Health & Educational Facilities Authority, St. Luke’s Episcopal – Presbyterian Hospitals Revenue Bonds, Series 2001, 5.250%, 12/01/26 – AGM Insured | 6/11 at 101.00 | AA+ | | 503,045 | |
| | 2,000 | | Missouri Health and Educational Facilities Authority, Health Facility Revenue Bonds, St. Lukes’s Health System, Series 2010A, 5.000%, 11/15/30 | 11/20 at 100.00 | A+ | | 1,980,020 | |
| | | | Missouri Health and Educational Facilities Authority, Revenue Bonds, BJC Health System, Series 2003: | | | | | |
| | 1,500 | | 5.125%, 5/15/25 | 5/13 at 100.00 | AA | | 1,523,655 | |
| | 1,155 | | 5.250%, 5/15/32 | 5/13 at 100.00 | AA | | 1,158,927 | |
| | 500 | | Missouri Health and Educational Facilities Authority, Revenue Bonds, Lake Regional Health System, Series 2003, 5.700%, 2/15/34 | 2/14 at 100.00 | BBB+ | | 503,150 | |
| | 720 | | Saline County Industrial Development Authority, Missouri, Health Facilities Revenue Bonds, John Fitzgibbon Memorial Hospital Inc., Series 2010, 5.600%, 12/01/28 | 12/20 at 100.00 | N/R | | 678,737 | |
| | 350 | | St. Louis County Industrial Development Authority, Missouri, Healthcare Facilities Revenue Bonds, Ranken-Jordan Project, Refunding Series 2007, 5.000%, 11/15/27 | 11/16 at 100.00 | N/R | | 298,249 | |
| | 9,645 | | Total Health Care | | | | 9,223,496 | |
| | | | Housing/Multifamily – 3.4% (2.2% of Total Investments) | | | | | |
| | 385 | | Jefferson County Industrial Development Authority, Missouri, Multifamily Housing Revenue Bonds, Lakewood Apartments Project, Series 2001B, 5.750%, 11/01/34 (Mandatory put 11/01/16) (Alternative Minimum Tax) | 12/11 at 100.00 | N/R | | 385,296 | |
| | 165 | | Missouri Housing Development Commission, Multifamily Housing Revenue Bonds, Series 2001II, 5.250%, 12/01/16 | 12/11 at 100.00 | AA | | 168,587 | |
| | 500 | | St. Charles County Industrial Development Authority, Missouri, FHA-Insured Multifamily Housing Revenue Bonds, Ashwood Apartments, Series 1998A, 5.600%, 4/01/30 – AGM Insured (Alternative Minimum Tax) | 4/11 at 100.00 | AAA | | 500,160 | |
| | 1,050 | | Total Housing/Multifamily | | | | 1,054,043 | |
Nuveen Investments 57
| | | Nuveen Missouri Premium Income Municipal Fund (continued) |
| NOM | | Portfolio of Investments November 30, 2010 (Unaudited) |
| | Principal Amount (000) | | Description (1) | Optional Call Provisions (2) | Ratings (3) | | Value | |
| | | | Housing/Single Family – 4.0% (2.5% of Total Investments) | | | | | |
| $ | 60 | | Missouri Housing Development Commission, Single Family Mortgage Revenue Bonds, Homeownership Loan Program, Series 2000B-1, 6.250%, 3/01/31 (Alternative Minimum Tax) | 3/11 at 100.00 | AAA | $ | 61,225 | |
| | 430 | | Missouri Housing Development Commission, Single Family Mortgage Revenue Bonds, Homeownership Loan Program, Series 2007A-1, 4.700%, 9/01/27 (Alternative Minimum Tax) | 9/16 at 100.00 | AAA | | 428,147 | |
| | 755 | | Missouri Housing Development Commission, Single Family Mortgage Revenue Bonds, Homeownership Loan Program, Series 2007C-1, 4.800%, 9/01/38 (Alternative Minimum Tax) | 3/17 at 100.00 | AAA | | 725,842 | |
| | 1,245 | | Total Housing/Single Family | | | | 1,215,214 | |
| | | | Long-Term Care – 8.3% (5.3% of Total Investments) | | | | | |
| | 1,750 | | Cole County Industrial Development Authority, Missouri, Revenue Bonds, Lutheran Senior Services – Heisinger Project, Series 2004, 5.500%, 2/01/35 | 2/14 at 100.00 | N/R | | 1,675,485 | |
| | 475 | | Lees Summit Industrial Development Authority, Missouri, Revenue Bonds, John Knox Village Obligated Group, Series 2007A, 5.125%, 8/15/32 | 8/17 at 100.00 | N/R | | 412,438 | |
| | 500 | | St. Louis County Industrial Development Authority, Missouri, Revenue Bonds, Friendship Village of West County, Series 2007A, 5.500%, 9/01/28 | 9/17 at 100.00 | N/R | | 466,155 | |
| | 2,725 | | Total Long-Term Care | | | | 2,554,078 | |
| | | | Materials – 2.2% (1.4% of Total Investments) | | | | | |
| | 750 | | Sugar Creek, Missouri, Industrial Development Revenue Bonds, Lafarge North America Inc., Series 2003A, 5.650%, 6/01/37 (Alternative Minimum Tax) | 6/13 at 101.00 | BBB– | | 679,718 | |
| | | | Tax Obligation/General – 30.8% (19.9% of Total Investments) | | | | | |
| | 1,500 | | Camdenton Reorganized School District R3, Camden County, Missouri, General Obligation Bonds, Series 2005, 5.250%, 3/01/24 – AGM Insured (4) | No Opt. Call | AA+ | | 1,631,925 | |
| | 1,685 | | Independence School District, Jackson County, Missouri, General Obligation Bonds, Series 2010, 5.000%, 3/01/27 | 3/20 at 100.00 | AA+ | | 1,833,853 | |
| | 500 | | Jackson County School District R-7, Lees Summit, Missouri, General Obligation Refunding and Improvement Bonds, Series 2002, 5.250%, 3/01/18 – AGM Insured | 3/12 at 100.00 | AA+ | | 525,215 | |
| | 500 | | Missouri School Boards Association, Lease Participation Certificates, Clay County School District 53 Liberty, Series 2007, 5.250%, 3/01/27 – AGM Insured | 3/17 at 100.00 | AA+ | | 528,435 | |
| | 1,630 | | North Kansas City School District, Missouri, General Obligation Bonds, Series 2003A, 5.000%, 3/01/23 | 3/13 at 100.00 | AA+ | | 1,740,384 | |
| | 1,000 | | Puerto Rico, General Obligation and Public Improvement Bonds, Series 2002A, 5.500%, 7/01/20 – NPFG Insured | No Opt. Call | A | | 1,066,300 | |
| | 1,800 | | Ritenour Consolidated School District, St. Louis County, Missouri, General Obligation Bonds, Series 1995, 7.375%, 2/01/12 – FGIC Insured | No Opt. Call | Aa2 | | 1,877,382 | |
| | 270 | | St. Louis County Pattonville School District R3, Missouri, General Obligation Bonds, Series 2004, 5.250%, 3/01/20 – AGM Insured | 3/14 at 100.00 | AA+ | | 296,239 | |
| | 8,885 | | Total Tax Obligation/General | | | | 9,499,733 | |
| | | | Tax Obligation/Limited – 21.7% (14.0% of Total Investments) | | | | | |
| | 600 | | Chesterfield, Missouri, Certificates of Participation, Series 2005, 5.000%,
12/01/24 – FGIC Insured | 12/15 at 100.00 | Aa1 | | 617,634 | |
| | 80 | | Cottleville, Missouri, Certificates of Participation, Series 2006, 5.250%, 8/01/31 | 8/14 at 100.00 | N/R | | 69,858 | |
| | 320 | | Fenton, Missouri, Tax Increment Revenue Bonds, Gravois Bluffs Redevelopment Project, Series 2006, 4.500%, 4/01/21 | 4/14 at 100.00 | N/R | | 311,213 | |
| | 315 | | Fulton, Missouri, Tax Increment Revenue Bonds, Fulton Commons Redevelopment Project, Series 2006, 5.000%, 6/01/28 | 6/16 at 100.00 | N/R | | 246,919 | |
| | 475 | | Kansas City Tax Increment Financing District, Missouri, Tax Increment Revenue Bonds, Briarcliff West Project, Series 2006A, 5.400%, 6/01/24 | 6/14 at 102.00 | N/R | | 402,306 | |
58 Nuveen Investments
| | Principal Amount (000) | | Description (1) | Optional Call Provisions (2) | Ratings (3) | | Value | |
| | | | Tax Obligation/Limited (continued) | | | | | |
| $ | 360 | | Missouri Development Finance Board, Infrastructure Facilities Revenue Bonds, Branson Landing Project, Series 2005A, 5.000%, 6/01/35 | 6/15 at 100.00 | A | $ | 334,105 | |
| | 415 | | Missouri Development Finance Board, Infrastructure Facilities Revenue Bonds, City of Independence, Crackerneck Creek Project, Series 2006C, 5.000%, 3/01/28 | 3/16 at 100.00 | A | | 403,745 | |
| | 450 | | Monarch-Chesterfield Levee District, St. Louis County, Missouri, Levee District Improvement Bonds, Series 1999, 5.750%, 3/01/19 – NPFG Insured | 3/11 at 100.00 | A | | 454,464 | |
| | 500 | | Osage Beach, Missouri, Tax Increment Revenue Bonds, Prewitts Point Transportation Development District, Series 2006, 5.000%, 5/01/23 | 5/12 at 102.00 | N/R | | 412,455 | |
| | 600 | | Riverside, Missouri, L-385 Levee Redevelopment Plan Tax Increment Revenue Bonds, Series 2004, 5.250%, 5/01/20 | 5/15 at 100.00 | A | | 615,174 | |
| | 2,000 | | Springfield Public Building Corporation, Missouri, Lease Revenue Bonds, Jordan Valley Park Projects, Series 2000A, 6.125%, 6/01/21 – AMBAC Insured | 12/10 at 100.00 | N/R | | 2,002,380 | |
| | | | St. Joseph Industrial Development Authority, Missouri, Tax Increment Bonds, Shoppes at North Village Project, Series 2005A: | | | | | |
| | 340 | | 5.375%, 11/01/24 | 11/14 at 100.00 | N/R | | 301,298 | |
| | 400 | | 5.500%, 11/01/27 | 11/14 at 100.00 | N/R | | 347,812 | |
| | 200 | | St. Joseph Industrial Development Authority, Missouri, Tax Increment Bonds, Shoppes at North Village Project, Series 2005B, 5.500%, 11/01/27 | 11/14 at 100.00 | N/R | | 171,218 | |
| | 7,055 | | Total Tax Obligation/Limited | | | | 6,690,581 | |
| | | | Transportation – 17.1% (11.0% of Total Investments) | | | | | |
| | 500 | | Kansas City, Missouri, Passenger Facility Charge Revenue Bonds, Kansas City International Airport, Series 2001, 5.000%, 4/01/23 – AMBAC Insured (Alternative Minimum Tax) | 4/11 at 101.00 | A | | 501,715 | |
| | 1,000 | | St. Louis Land Clearance Redevelopment Authority, Missouri, Revenue Refunding and Improvement Bonds, LCRA Parking Facilities, Series 1999C, 7.000%, 9/01/19 | 3/11 at 101.00 | N/R | | 999,920 | |
| | 1,000 | | St. Louis, Missouri, Airport Revenue Bonds, Lambert-St. Louis International Airport, Series 2005, 5.500%, 7/01/18 – NPFG Insured | No Opt. Call | A | | 1,088,750 | |
| | 2,500 | | St. Louis, Missouri, Airport Revenue Bonds, Lambert-St. Louis International Airport, Series 2007A, 5.000%, 7/01/21 – AGM Insured | 7/17 at 100.00 | AA+ | | 2,692,900 | |
| | 5,000 | | Total Transportation | | | | 5,283,285 | |
| | | | U.S. Guaranteed – 21.1% (13.6% of Total Investments) (5) | | | | | |
| | 685 | | Fenton, Missouri, Tax Increment Refunding and Improvement Revenue Bonds, Gravois Bluffs Redevelopment Project, Series 2002, 6.125%, 10/01/21 (Pre-refunded 10/01/12) | 10/12 at 100.00 | N/R (5 | ) | 748,369 | |
| | 2,500 | | Missouri Health and Educational Facilities Authority, Revenue Bonds, SSM Healthcare System, Series 2001A, 5.250%, 6/01/28 (Pre-refunded 6/01/11) – AMBAC Insured | 6/11 at 101.00 | AA– (5 | ) | 2,585,500 | |
| | 1,380 | | Springfield Center City Development Corporation, Missouri, Lease Revenue Bonds, Jordan Valley Park Parking Garage, Series 2002D, 5.000%, 11/01/22 (Pre-refunded 11/01/11) – AMBAC Insured | 11/11 at 100.00 | Aa3 (5 | ) | 1,437,518 | |
| | 80 | | St. Louis County Pattonville School District R3, Missouri, General Obligation Bonds, Series 2004, 5.250%, 3/01/20 (Pre-refunded 3/01/14) – AGM Insured | 3/14 at 100.00 | AA+ (5 | ) | 90,867 | |
| | 500 | | St. Louis County, Missouri, GNMA Collateralized Mortgage Revenue Bonds, Series 1993D, 5.650%, 7/01/20 (Alternative Minimum Tax) (ETM) | No Opt. Call | AAA | | 578,945 | |
| | 1,000 | | St. Louis Municipal Finance Corporation, Missouri, Leasehold Revenue Bonds, Carnahan Courthouse, Series 2002A, 5.750%, 2/15/16 (Pre-refunded 2/15/12) – FGIC Insured | 2/12 at 100.00 | N/R (5 | ) | 1,063,030 | |
| | 6,145 | | Total U.S. Guaranteed | | | | 6,504,229 | |
| | | | Utilities – 1.7% (1.1% of Total Investments) | | | | | |
| | 530 | | Puerto Rico Electric Power Authority, Power Revenue Bonds, Series 2010XX, 5.250%, 7/01/40 | 7/20 at 100.00 | A3 | | 524,477 | |
Nuveen Investments 59
| | | Nuveen Missouri Premium Income Municipal Fund (continued) |
| NOM | | Portfolio of Investments November 30, 2010 (Unaudited) |
| | Principal Amount (000) | | Description (1) | Optional Call Provisions (2) | Ratings (3) | | Value | |
| | | | Water and Sewer – 9.7% (6.3% of Total Investments) | | | | | |
| $ | 2,965 | | Missouri Environmental Improvement and Energy Resources Authority, Water Facility Revenue Bonds, Missouri-American Water Company, Series 2006, 4.600%, 12/01/36 – BHAC Insured (Alternative Minimum Tax) (UB) | 12/16 at 100.00 | AA+ | $ | 2,629,214 | |
| | 350 | | Missouri Environmental Improvement and Energy Resources Authority, Water Pollution Control Revenue Bonds, State Revolving Fund Program – Kansas City Project, Series 1997C, 6.750%, 1/01/12 | No Opt. Call | Aaa | | 372,652 | |
| | 3,315 | | Total Water and Sewer | | | | 3,001,866 | |
| $ | 47,960 | | Total Investments (cost $48,314,693) – 155.2% | | | | 47,859,700 | |
| | | | Floating Rate Obligations – (7.2)% | | | | (2,225,000 | ) |
| | | | MuniFund Term Preferred Shares, at Liquidation Value – (58.0)% (6) | | | | (17,880,000 | ) |
| | | | Other Assets Less Liabilities – 10.0% | | | | 3,081,222 | |
| | | | Net Assets Applicable to Common Shares – 100% | | | $ | 30,835,922 | |
| (1) | | All percentages shown in the Portfolio of Investments are based on net assets applicable to Common shares unless otherwise noted. |
| (2) | | Optional Call Provisions: Dates (month and year) and prices of the earliest optional call or redemption. There may be other call provisions at varying prices at later dates. Certain mortgage-backed securities may be subject to periodic principal paydowns. |
| (3) | | Ratings: Using the highest of Standard & Poor’s Group (“Standard & Poor’s”), Moody’s Investor Service, Inc. (“Moody’s”) or Fitch, Inc. (“Fitch”) rating. Ratings below BBB by Standard & Poor’s, Baa by Moody’s or BBB by Fitch are considered to be below investment grade. Holdings designated N/R are not rated by any of these national rating agencies. |
| (4) | | Investment, or portion of investment, has been pledged to collateralize the net payment obligations for investments in inverse floating rate transactions. |
| (5) | | Backed by an escrow or trust containing sufficient U.S. Government or U.S. Government agency securities, which ensure the timely payment of principal and interest. Such investments are normally considered to be equivalent to AAA rated securities. |
| (6) | | MuniFund Term Preferred Shares, at Liquidation Value as a percentage of Total Investments is 37.4%. |
| N/R | | Not rated. |
| (ETM) | | Escrowed to maturity. |
| (UB) | | Underlying bond of an inverse floating rate trust reflected as a financing transaction. See Notes to Financial Statements, Footnote 1 – General Information and Significant Accounting Policies, Inverse Floating Rate Securities for more information. |
See accompanying notes to financial statements.
60 Nuveen Investments
| | | Statement of |
| | | Assets & Liabilities |
November 30, 2010 (Unaudited)
| | | Connecticut Premium Income (NTC | ) | Connecticut Dividend Advantage (NFC | ) | Connecticut Dividend Advantage 2 (NGK | ) | Connecticut Dividend Advantage 3 (NGO | ) |
| Assets | | | | | | | | | | | | | |
| Investments, at value (cost $114,202,210, $59,731,487, $51,683,828 and $96,554,649, respectively) | | $ | 115,716,532 | | $ | 60,470,194 | | $ | 52,742,868 | | $ | 97,099,776 | |
| Cash | | | 739,835 | | | 691,495 | | | 1,062,668 | | | 1,212,235 | |
| Cash equivalents | | | — | | | — | | | — | | | — | |
| Receivables: | | | | | | | | | | | | | |
| Interest | | | 1,693,241 | | | 824,454 | | | 718,709 | | | 1,432,700 | |
| Investments sold | | | 1,006,028 | | | — | | | — | | | — | |
| Deferred offering costs | | | 459,521 | | | 491,051 | | | 436,667 | | | 630,553 | |
| Other assets | | | 21,510 | | | 9,422 | | | 31,358 | | | 11,134 | |
| Total assets | | | 119,636,667 | | | 62,486,616 | | | 54,992,270 | | | 100,386,398 | |
| Liabilities | | | | | | | | | | | | | |
| Cash overdraft | | | — | | | — | | | — | | | — | |
| Floating rate obligations | | | 7,965,000 | | | 3,820,000 | | | 3,460,000 | | | 5,780,000 | |
| Payables: | | | | | | | | | | | | | |
| Auction Rate Preferred shares noticed for redemption, at liquidation value | | | — | | | — | | | — | | | — | |
| Auction Rate Preferred share dividends | | | 1,268 | | | — | | | — | | | — | |
| Common share dividends | | | 285,293 | | | 155,189 | | | 146,152 | | | 238,883 | |
| Interest | | | 40,415 | | | 44,348 | | | 36,722 | | | 70,674 | |
| Offering costs | | | 199,815 | | | 202,286 | | | 192,286 | | | 215,182 | |
| MuniFund Term Preferred shares, at liquidation value | | | 18,300,000 | | | 20,470,000 | | | 16,950,000 | | | 32,000,000 | |
| Accrued expenses: | | | | | | | | | | | | | |
| Management fees | | | 60,497 | | | 29,081 | | | 23,364 | | | 51,015 | |
| Other | | | 34,434 | | | 12,101 | | | 9,842 | | | 14,334 | |
| Total liabilities | | | 26,886,722 | | | 24,733,005 | | | 20,818,366 | | | 38,370,088 | |
| Auction Rate Preferred shares, at liquidation value | | | 15,725,000 | | | — | | | — | | | — | |
| Net assets applicable to Common shares | | $ | 77,024,945 | | $ | 37,753,611 | | $ | 34,173,904 | | $ | 62,016,310 | |
| Common shares outstanding | | | 5,365,029 | | | 2,586,033 | | | 2,320,177 | | | 4,367,134 | |
| Net asset value per Common share outstanding (net assets applicable to Common shares, divided by Common shares outstanding) | | $ | 14.36 | | $ | 14.60 | | $ | 14.73 | | $ | 14.20 | |
| Net assets applicable to Common shares consist of: | | | | | | | | | | | | | |
| Common shares, $.01 par value per share | | $ | 53,650 | | $ | 25,860 | | $ | 23,202 | | $ | 43,671 | |
| Paid-in surplus | | | 74,482,375 | | | 36,666,461 | | | 32,838,376 | | | 61,584,748 | |
| Undistributed (Over-distribution of) net investment income | | | 974,470 | | | 356,861 | | | 298,622 | | | 344,448 | |
| Accumulated net realized gain (loss) | | | 128 | | | (34,278 | ) | | (45,336 | ) | | (501,684 | ) |
| Net unrealized appreciation (depreciation) | | | 1,514,322 | | | 738,707 | | | 1,059,040 | | | 545,127 | |
| Net assets applicable to Common shares | | $ | 77,024,945 | | $ | 37,753,611 | | $ | 34,173,904 | | $ | 62,016,310 | |
| Authorized shares: | | | | | | | | | | | | | |
| Common | | | Unlimited | | | Unlimited | | | Unlimited | | | Unlimited | |
| Auction Rate Preferred | | | Unlimited | | | Unlimited | | | Unlimited | | | Unlimited | |
| MuniFund Term Preferred | | | Unlimited | | | Unlimited | | | Unlimited | | | Unlimited | |
See accompanying notes to financial statements.
Nuveen Investments 61
| | | Statement of |
| | | Assets & Liabilities (Unaudited) (continued) |
| | | Massachusetts Premium Income (NMT | ) | Massachusetts Dividend Advantage (NMB | ) | Insured Massachusetts Tax-Free Advantage (NGX | ) | Missouri Premium Income (NOM | ) |
| Assets | | | | | | | | | | | | | |
| Investments, at value (cost $103,055,032, $42,620,016, $60,155,255 and $48,314,693, respectively) | | $ | 103,904,217 | | $ | 42,341,307 | | $ | 61,616,231 | | $ | 47,859,700 | |
| Cash | | | — | | | 211,344 | | | 378,235 | | | 1,276,160 | |
Cash equivalents(1) | | | — | | | — | | | — | | | 16,003,015 | |
| Receivables: | | | | | | | | | | | | | |
| Interest | | | 1,744,893 | | | 775,548 | | | 900,107 | | | 777,801 | |
| Investments sold | | | 20,000 | | | — | | | — | | | 934,294 | |
| Deferred offering costs | | | 483,527 | | | 401,679 | | | 480,165 | | | 591,082 | |
| Other assets | | | 18,484 | | | 7,881 | | | 32,395 | | | 13,279 | |
| Total assets | | | 106,171,121 | | | 43,737,759 | | | 63,407,133 | | | 67,455,331 | |
| Liabilities | | | | | | | | | | | | | |
| Cash overdraft | | | 280,700 | | | — | | | — | | | — | |
| Floating rate obligations | | | 2,450,000 | | | 1,050,000 | | | 1,500,000 | | | 2,225,000 | |
| Payables: | | | | | | | | | | | | | |
| Auction Rate Preferred shares noticed for redemption, at liquidation value | | | — | | | — | | | — | | | 16,000,000 | |
| Auction Rate Preferred share dividends | | | 1,339 | | | — | | | — | | | 969 | |
| Common share dividends | | | 286,010 | | | 131,046 | | | 168,021 | | | 138,363 | |
| Interest | | | 44,634 | | | 31,901 | | | 48,754 | | | 22,946 | |
| Offering costs | | | 229,925 | | | 109,189 | | | 190,950 | | | 317,424 | |
| MuniFund Term Preferred shares, at liquidation value | | | 20,210,000 | | | 14,725,000 | | | 22,075,000 | | | 17,880,000 | |
| Accrued expenses: | | | | | | | | | | | | | |
| Management fees | | | 53,745 | | | 20,417 | | | 28,048 | | | 24,938 | |
| Other | | | 25,225 | | | 7,505 | | | 11,886 | | | 9,769 | |
| Total liabilities | | | 23,581,578 | | | 16,075,058 | | | 24,022,659 | | | 36,619,409 | |
| Auction Rate Preferred shares, at liquidation value | | | 14,400,000 | | | — | | | — | | | — | |
| Net assets applicable to Common shares | | $ | 68,189,543 | | $ | 27,662,701 | | $ | 39,384,474 | | $ | 30,835,922 | |
| Common shares outstanding | | | 4,773,801 | | | 1,965,205 | | | 2,726,864 | | | 2,316,388 | |
| Net asset value per Common share outstanding (net assets applicable to Common shares, divided by Common shares outstanding) | | $ | 14.28 | | $ | 14.08 | | $ | 14.44 | | $ | 13.31 | |
| Net assets applicable to Common shares consist of: | | | | | | | | | | | | | |
| Common shares, $.01 par value per share | | $ | 47,738 | | $ | 19,652 | | $ | 27,269 | | $ | 23,164 | |
| Paid-in surplus | | | 66,246,786 | | | 27,784,843 | | | 38,392,108 | | | 31,059,937 | |
| Undistributed (Over-distribution of) net investment income | | | 932,051 | | | 236,600 | | | 208,839 | | | 520,398 | |
| Accumulated net realized gain (loss) | | | 113,783 | | | (99,685 | ) | | (704,718 | ) | | (312,584 | ) |
| Net unrealized appreciation (depreciation) | | | 849,185 | | | (278,709 | ) | | 1,460,976 | | | (454,993 | ) |
| Net assets applicable to Common shares | | $ | 68,189,543 | | $ | 27,662,701 | | $ | 39,384,474 | | $ | 30,835,922 | |
| Authorized shares: | | | | | | | | | | | | | |
| Common | | | Unlimited | | | Unlimited | | | Unlimited | | | Unlimited | |
| Auction Rate Preferred | | | Unlimited | | | Unlimited | | | Unlimited | | | Unlimited | |
| MuniFund Term Preferred | | | Unlimited | | | Unlimited | | | Unlimited | | | Unlimited | |
(1) Segregated for the payment of Auction Rate Preferred shares noticed for redemption.
See accompanying notes to financial statements.
62 Nuveen Investments
Six Months Ended November 30, 2010 (Unaudited)
| | | Connecticut Premium Income (NTC | ) | Connecticut Dividend Advantage (NFC | ) | Connecticut Dividend Advantage 2 (NGK | ) | Connecticut Dividend Advantage 3 (NGO | ) |
| Investment Income | | $ | 2,712,704 | | $ | 1,455,962 | | $ | 1,257,424 | | $ | 2,248,898 | |
| Expenses | | | | | | | | | | | | | |
| Management fees | | | 373,675 | | | 195,316 | | | 171,559 | | | 309,684 | |
| Auction fees | | | 11,825 | | | — | | | — | | | — | |
| Dividend disbursing agent fees | | | 5,014 | | | — | | | — | | | — | |
| Shareholders’ servicing agent fees and expenses | | | 5,320 | | | 1,899 | | | 1,890 | | | 1,930 | |
| Interest expense and amortization of offering costs | | | 328,821 | | | 337,679 | | | 284,255 | | | 520,138 | |
| Custodian’s fees and expenses | | | 13,215 | | | 8,902 | | | 8,630 | | | 12,435 | |
| Trustees’ fees and expenses | | | 1,360 | | | 826 | | | 731 | | | 1,152 | |
| Professional fees | | | 7,388 | | | 5,334 | | | 5,156 | | | 6,455 | |
| Shareholders’ reports — printing and mailing expenses | | | 18,063 | | | 10,128 | | | 8,358 | | | 17,726 | |
| Stock exchange listing fees | | | 4,559 | | | 179 | | | 161 | | | 303 | |
| Investor relations expense | | | 4,396 | | | 2,137 | | | 1,965 | | | 3,493 | |
| Other expenses | | | 2,573 | | | 11,721 | | | 2,100 | | | 3,691 | |
| Total expenses before custodian fee credit and expense reimbursement | | | 776,209 | | | 574,121 | | | 484,805 | | | 877,007 | |
| Custodian fee credit | | | (2,141 | ) | | (791 | ) | | (800 | ) | | (1,988 | ) |
| Expense reimbursement | | | — | | | (15,420 | ) | | (27,089 | ) | | (25,861 | ) |
| Net expenses | | | 774,068 | | | 557,910 | | | 456,916 | | | 849,158 | |
| Net investment income | | | 1,938,636 | | | 898,052 | | | 800,508 | | | 1,399,740 | |
| Realized and Unrealized Gain (Loss) | | | | | | | | | | | | | |
| Net realized gain (loss) from investments | | | 27,967 | | | (2,130 | ) | | 6,151 | | | (696 | ) |
| Change in net unrealized appreciation (depreciation) of investments | | | (1,115,467 | ) | | (708,410 | ) | | (563,663 | ) | | (869,598 | ) |
| Net realized and unrealized gain (loss) | | | (1,087,500 | ) | | (710,540 | ) | | (557,512 | ) | | (870,294 | ) |
| Distributions to Auction Rate Preferred Shareholders | | | | | | | | | | | | | |
| From net investment income | | | (32,899 | ) | | — | | | — | | | — | |
| Decrease in net assets applicable to Common shares from distributions to Auction Rate Preferred shareholders | | | (32,899 | ) | | — | | | — | | | — | |
| Net increase (decrease) in net assets applicable to Common shares from operations | | $ | 818,237 | | $ | 187,512 | | $ | 242,996 | | $ | 529,446 | |
See accompanying notes to financial statements.
Nuveen Investments 63
| | | Statement of |
| | | Operations (Unaudited) (continued) |
| | | Massachusetts Premium Income (NMT | ) | Massachusetts Dividend Advantage (NMB | ) | Insured Massachusetts Tax-Free Advantage (NGX | ) | Missouri Premium Income (NOM | ) |
| Investment Income | | $ | 2,644,754 | | $ | 1,110,832 | | $ | 1,453,464 | | $ | 1,249,376 | |
| Expenses | | | | | | | | | | | | | |
| Management fees | | | 332,109 | | | 137,213 | | | 193,120 | | | 152,104 | |
| Auction fees | | | 10,830 | | | — | | | — | | | 12,032 | |
| Dividend disbursing agent fees | | | 5,014 | | | — | | | — | | | 5,014 | |
| Shareholders’ servicing agent fees and expenses | | | 3,717 | | | 1,572 | | | 1,621 | | | 1,668 | |
| Interest expense and amortization of offering costs | | | 333,772 | | | 241,257 | | | 353,968 | | | 34,424 | |
| Custodian’s fees and expenses | | | 12,869 | | | 7,015 | | | 7,074 | | | 7,220 | |
| Trustees’ fees and expenses | | | 1,261 | | | 520 | | | 755 | | | 576 | |
| Professional fees | | | 7,145 | | | 4,920 | | | 5,494 | | | 5,476 | |
| Shareholders’ reports — printing and mailing expenses | | | 18,368 | | | 8,310 | | | 10,724 | | | 7,105 | |
| Stock exchange listing fees | | | 4,559 | | | 136 | | | 189 | | | 160 | |
| Investor relations expense | | | 4,112 | | | 1,722 | | | 2,377 | | | 1,983 | |
| Other expenses | | | 3,029 | | | 11,405 | | | 4,355 | | | 5,094 | |
| Total expenses before custodian fee credit and expense reimbursement | | | 736,785 | | | 414,070 | | | 579,677 | | | 232,856 | |
| Custodian fee credit | | | (61 | ) | | (186 | ) | | (798 | ) | | (156 | ) |
| Expense reimbursement | | | — | | | (10,833 | ) | | (24,399 | ) | | — | |
| Net expenses | | | 736,724 | | | 403,051 | | | 554,480 | | | 232,700 | |
| Net investment income | | | 1,908,030 | | | 707,781 | | | 898,984 | | | 1,016,676 | |
| Realized and Unrealized Gain (Loss) | | | | | | | | | | | | | |
| Net realized gain (loss) from investments | | | (77,740 | ) | | (169,511 | ) | | (151 | ) | | 39,938 | |
| Change in net unrealized appreciation (depreciation) of investments | | | (867,405 | ) | | (316,054 | ) | | (593,323 | ) | | (665,680 | ) |
| Net realized and unrealized gain (loss) | | | (945,145 | ) | | (485,565 | ) | | (593,474 | ) | | (625,742 | ) |
| Distributions to Auction Rate Preferred Shareholders | | | | | | | | | | | | | |
| From net investment income | | | (30,127 | ) | | — | | | — | | | (33,474 | ) |
| Decrease in net assets applicable to Common shares from distributions to Auction Rate Preferred shareholders | | | (30,127 | ) | | — | | | — | | | (33,474 | ) |
| Net increase (decrease) in net assets applicable to Common shares from operations | | $ | 932,758 | | $ | 222,216 | | $ | 305,510 | | $ | 357,460 | |
See accompanying notes to financial statements.
64 Nuveen Investments
| | | Statement of |
| | | Changes in Net Assets (Unaudited) |
| | | Connecticut Premium Income (NTC) | | Connecticut Dividend Advantage (NFC) | | Connecticut Dividend Advantage 2 (NGK) | |
| | | Six Months Ended 11/30/10 | | Year Ended 5/31/10 | | Six Months Ended 11/30/10 | | Year Ended 5/31/10 | | Six Months Ended 11/30/10 | | Year Ended 5/31/10 | |
| Operations | | | | | | | | | | | | | | | | | | | |
| Net investment income | | $ | 1,938,636 | | $ | 4,267,900 | | $ | 898,052 | | $ | 2,204,210 | | $ | 800,508 | | $ | 2,000,123 | |
| Net realized gain (loss) from investments | | | 27,967 | | | 60,723 | | | (2,130 | ) | | 10,610 | | | 6,151 | | | 12,514 | |
| Change in net unrealized appreciation (depreciation) of investments | | | (1,115,467 | ) | | 4,700,543 | | | (708,410 | ) | | 1,900,772 | | | (563,663 | ) | | 1,510,001 | |
| Distributions to Auction Rate | | | | | | | | | | | | | | | | | | | |
| Preferred Shareholders: | | | | | | | | | | | | | | | | | | | |
| From net investment income | | | (32,899 | ) | | (119,197 | ) | | — | | | (66,605 | ) | | — | | | (59,765 | ) |
| From accumulated net realized gains | | | — | | | (5,151 | ) | | — | | | — | | | — | | | — | |
| Net increase (decrease) in net assets applicable to Common shares from operations | | | 818,237 | | | 8,904,818 | | | 187,512 | | | 4,048,987 | | | 242,996 | | | 3,462,873 | |
| Distributions to Common Shareholders | | | | | | | | | | | | | | | | | | | |
| From net investment income | | | (1,899,221 | ) | | (3,693,594 | ) | | (992,787 | ) | | (1,898,150 | ) | | (918,611 | ) | | (1,752,532 | ) |
| From accumulated net realized gains | | | — | | | (21,997 | ) | | — | | | — | | | — | | | — | |
| Decrease in net assets applicable to Common shares from distributions to Common shareholders | | | (1,899,221 | ) | | (3,715,591 | ) | | (992,787 | ) | | (1,898,150 | ) | | (918,611 | ) | | (1,752,532 | ) |
| Capital Share Transactions | | | | | | | | | | | | | | | | | | | |
| Net proceeds from Common shares issued to shareholders due to reinvestment of distributions | | | — | | | 15,348 | | | 26,531 | | | 52,783 | | | 16,467 | | | 30,801 | |
| Net increase in net assets applicable to Common shares from capital share transactions | | | — | | | 15,348 | | | 26,531 | | | 52,783 | | | 16,467 | | | 30,801 | |
| Net increase (decrease) in net assets applicable to Common shares | | | (1,080,984 | ) | | 5,204,575 | | | (778,744 | ) | | 2,203,620 | | | (659,148 | ) | | 1,741,142 | |
| Net assets applicable to Common shares at the beginning of period | | | 78,105,929 | | | 72,901,354 | | | 38,532,355 | | | 36,328,735 | | | 34,833,052 | | | 33,091,910 | |
| Net assets applicable to Common shares at the end of period | | $ | 77,024,945 | | $ | 78,105,929 | | $ | 37,753,611 | | $ | 38,532,355 | | $ | 34,173,904 | | $ | 34,833,052 | |
| Undistributed (Over-distribution of) net investment income at the end of period | | $ | 974,470 | | $ | 967,954 | | $ | 356,861 | | $ | 451,596 | | $ | 298,622 | | $ | 416,725 | |
See accompanying notes to financial statements.
Nuveen Investments 65
| | | Statement of |
| | | Changes in Net Assets (Unaudited) (continued) |
| | | Connecticut Dividend Advantage 3 (NGO) | | Massachusetts Premium Income (NMT) | | Massachusetts Dividend Advantage (NMB) | |
| | | Six Months Ended 11/30/10 | | Year Ended 5/31/10 | | Six Months Ended 11/30/10 | | Year Ended 5/31/10 | | Six Months Ended 11/30/10 | | Year Ended 5/31/10 | |
| Operations | | | | | | | | | | | | | | | | | | | |
| Net investment income | | $ | 1,399,740 | | $ | 3,346,745 | | $ | 1,908,030 | | $ | 4,145,590 | | $ | 707,781 | | $ | 1,739,913 | |
| Net realized gain (loss) from investments | | | (696 | ) | | 1,887 | | | (77,740 | ) | | 209,192 | | | (169,511 | ) | | 60,102 | |
| Change in net unrealized appreciation (depreciation) of investments | | | (869,598 | ) | | 3,514,247 | | | (867,405 | ) | | 5,077,663 | | | (316,054 | ) | | 1,496,853 | |
| Distributions to Auction Rate | | | | | | | | | | | | | | | | | | | |
| Preferred Shareholders: | | | | | | | | | | | | | | | | | | | |
| From net investment income | | | — | | | (92,898 | ) | | (30,127 | ) | | (122,559 | ) | | — | | | (45,739 | ) |
| From accumulated net realized gains | | | — | | | — | | | — | | | — | | | — | | | (13,657 | ) |
| Net increase (decrease) in net assets applicable to Common shares from operations | | | 529,446 | | | 6,769,981 | | | 932,758 | | | 9,309,886 | | | 222,216 | | | 3,237,472 | |
| Distributions to Common Shareholders | | | | | | | | | | | | | | | | | | | |
| From net investment income | | | (1,572,168 | ) | | (2,973,311 | ) | | (1,860,834 | ) | | (3,645,432 | ) | | (813,336 | ) | | (1,507,494 | ) |
| From accumulated net realized gains | | | — | | | — | | | — | | | — | | | — | | | (55,550 | ) |
| Decrease in net assets applicable to Common shares from distributions to Common shareholders | | | (1,572,168 | ) | | (2,973,311 | ) | | (1,860,834 | ) | | (3,645,432 | ) | | (813,336 | ) | | (1,563,044 | ) |
| Capital Share Transactions | | | | | | | | | | | | | | | | | | | |
| Net proceeds from Common shares issued to shareholders due to reinvestment of distributions | | | — | | | 17,921 | | | 86,708 | | | 45,881 | | | 18,328 | | | 31,080 | |
| Net increase in net assets applicable to Common shares from capital share transactions | | | — | | | 17,921 | | | 86,708 | | | 45,881 | | | 18,328 | | | 31,080 | |
| Net increase (decrease) in net assets applicable to Common shares | | | (1,042,722 | ) | | 3,814,591 | | | (841,368 | ) | | 5,710,335 | | | (572,792 | ) | | 1,705,508 | |
| Net assets applicable to Common shares at the beginning of period | | | 63,059,032 | | | 59,244,441 | | | 69,030,911 | | | 63,320,576 | | | 28,235,493 | | | 26,529,985 | |
| Net assets applicable to Common shares at the end of period | | $ | 62,016,310 | | $ | 63,059,032 | | $ | 68,189,543 | | $ | 69,030,911 | | $ | 27,662,701 | | $ | 28,235,493 | |
| Undistributed (Over-distribution of) net investment income at the end of period | | $ | 344,448 | | $ | 516,876 | | $ | 932,051 | | $ | 914,982 | | $ | 236,600 | | $ | 342,155 | |
See accompanying notes to financial statements.
66 Nuveen Investments
| | | Insured Massachusetts Tax-Free Advantage (NGX) | | Missouri Premium Income (NOM) | |
| | | Six Months Ended 11/30/10 | | Year Ended 5/31/10 | | Six Months Ended 11/30/10 | | Year Ended 5/31/10 | |
| Operations | | | | | | | | | | | | | |
| Net investment income | | $ | 898,984 | | $ | 2,227,100 | | $ | 1,016,676 | | $ | 1,926,445 | |
| Net realized gain (loss) from investments | | | (151 | ) | | (18,813 | ) | | 39,938 | | | 12,118 | |
| Change in net unrealized appreciation (depreciation) of investments | | | (593,323 | ) | | 2,157,735 | | | (665,680 | ) | | 2,255,157 | |
| Distributions to Auction Rate | | | | | | | | | | | | | |
| Preferred Shareholders: | | | | | | | | | | | | | |
| From net investment income | | | — | | | (68,205 | ) | | (33,474 | ) | | (67,634 | ) |
| From accumulated net realized gains | | | — | | | — | | | — | | | — | |
| Net increase (decrease) in net assets applicable to Common shares from operations | | | 305,510 | | | 4,297,817 | | | 357,460 | | | 4,126,086 | |
| Distributions to Common Shareholders | | | | | | | | | | | | | |
| From net investment income | | | (1,030,608 | ) | | (1,982,428 | ) | | (903,024 | ) | | (1,571,225 | ) |
| From accumulated net realized gains | | | — | | | — | | | — | | | — | |
| Decrease in net assets applicable to Common shares from distributions to Common shareholders | | | (1,030,608 | ) | | (1,982,428 | ) | | (903,024 | ) | | (1,571,225 | ) |
| Capital Share Transactions | | | | | | | | | | | | | |
| Net proceeds from Common shares issued to shareholders due to reinvestment of distributions | | | 14,937 | | | 24,769 | | | 33,782 | | | 58,988 | |
| Net increase in net assets applicable to Common shares from capital share transactions | | | 14,937 | | | 24,769 | | | 33,782 | | | 58,988 | |
| Net increase (decrease) in net assets applicable to Common shares | | | (710,161 | ) | | 2,340,158 | | | (511,782 | ) | | 2,613,849 | |
| Net assets applicable to Common shares at the beginning of period | | | 40,094,635 | | | 37,754,477 | | | 31,347,704 | | | 28,733,855 | |
| Net assets applicable to Common shares at the end of period | | $ | 39,384,474 | | $ | 40,094,635 | | $ | 30,835,922 | | $ | 31,347,704 | |
| Undistributed (Over-distribution of)net investment income at the end of period | | $ | 208,839 | | $ | 340,463 | | $ | 520,398 | | $ | 440,220 | |
See accompanying notes to financial statements.
Nuveen Investments 67
Six Months Ended November 30, 2010 (Unaudited)
| | | Connecticut Premium Income (NTC | ) | Connecticut Dividend Advantage (NFC | ) | Connecticut Dividend Advantage 2 (NGK | ) | Connecticut Dividend Advantage 3 (NGO | ) |
| Cash Flows from Operating Activities: | | | | | | | | | | | | | |
| Net Increase (Decrease) In Net Assets Applicable to Common Shares from Operations | | $ | 818,237 | | $ | 187,512 | | $ | 242,996 | | $ | 529,446 | |
| Adjustments to reconcile the net increase (decrease) in net assets applicable to Common shares from operations to net cash provided by (used in)operating activities: | | | | | | | | | | | | | |
| Purchases of investments | | | (5,530,475 | ) | | (2,554,295 | ) | | (2,817,932 | ) | | (5,086,838 | ) |
| Proceeds from sales and maturities of investments | | | 6,850,500 | | | 3,023,500 | | | 4,206,600 | | | 6,342,500 | |
| Amortization (Accretion) of premiums and discounts, net | | | 132,926 | | | 69,204 | | | 53,531 | | | 108,175 | |
| (Increase) Decrease in receivable for interest | | | 69,745 | | | (16,922 | ) | | 12,381 | | | 37,271 | |
| (Increase) Decrease in receivable for investments sold | | | (606,028 | ) | | 250,000 | | | — | | | — | |
| (Increase) Decrease in other assets | | | (1,005 | ) | | (2,948 | ) | | (492 | ) | | (549 | ) |
| Increase (Decrease) in payable for investments purchased | | | — | | | — | | | — | | | — | |
| Increase (Decrease) in payable for Auction Rate Preferred share dividends | | | 216 | | | — | | | — | | | — | |
| Increase (Decrease) in payable for interest | | | 3 | | | (4 | ) | | (3 | ) | | 7 | |
| Increase (Decrease) in accrued management fees | | | (2,414 | ) | | (1,309 | ) | | (1,069 | ) | | 4,532 | |
| Increase (Decrease) in accrued other liabilities | | | (21,616 | ) | | (17,545 | ) | | (18,201 | ) | | (24,510 | ) |
| Net realized (gain) loss from investments | | | (27,967 | ) | | 2,130 | | | (6,151 | ) | | 696 | |
| Change in net unrealized (appreciation) depreciation of investments | | | 1,115,467 | | | 708,410 | | | 563,663 | | | 869,598 | |
| Taxes paid on undistributed capital gains | | | (17,876 | ) | | (4,173 | ) | | (424 | ) | | — | |
| Net cash provided by (used in) operating activities | | | 2,779,713 | | | 1,643,560 | | | 2,234,899 | | | 2,780,328 | |
| Cash Flows from Financing Activities: | | | | | | | | | | | | | |
| Increase (Decrease) in cash overdraft balance | | | (138,105 | ) | | (10,549 | ) | | (288,379 | ) | | (36,404 | ) |
| (Increase) Decrease in cash equivalents | | | — | | | — | | | — | | | — | |
| Increase (Decrease) in payable for Auction Rate Preferred shares noticed for redemption, at liquidation value | | | — | | | — | | | — | | | — | |
| Increase (Decrease) in MuniFund Term Preferred shares, at liquidation value | | | — | | | — | | | — | | | — | |
| Increase (Decrease) in Auction Rate Preferred shares, at liquidation value | | | — | | | — | | | — | | | — | |
| (Increase) Decrease in deferred offering costs | | | 55,178 | | | 56,767 | | | 50,480 | | | 74,350 | |
| Increase (Decrease) in payable for offering costs | | | (58,050 | ) | | (32,114 | ) | | (32,114 | ) | | (33,725 | ) |
| Cash distributions paid to Common shareholders | | | (1,898,901 | ) | | (966,169 | ) | | (902,218 | ) | | (1,572,314 | ) |
| Net cash provided by (used in) financing activities | | | (2,039,878 | ) | | (952,065 | ) | | (1,172,231 | ) | | (1,568,093 | ) |
| Net Increase (Decrease) in Cash | | | 739,835 | | | 691,495 | | | 1,062,668 | | | 1,212,235 | |
| Cash at the beginning of period | | | — | | | — | | | — | | | — | |
| Cash at the End of Period | | $ | 739,835 | | $ | 691,495 | | $ | 1,062,668 | | $ | 1,212,235 | |
Supplemental Disclosure of Cash Flow Information
Non-cash financing activities not included herein consist of reinvestments of Common share distributions as follows:
| | | | | | | | | | | | | | |
| | | Connecticut Premium Income (NTC | ) | Connecticut Dividend Advantage (NFC | ) | Connecticut Dividend Advantage 2 (NGK | ) | Connecticut Dividend Advantage 3 (NGO | ) |
| | | $ | — | | $ | 26,531 | | $ | 16,467 | | $ | — | |
Cash paid for interest (excluding amortization of offering costs) was as follows:
| | | | | | | | | | | | | | |
| | | Connecticut Premium Income (NTC | ) | Connecticut Dividend Advantage (NFC | ) | Connecticut Dividend Advantage 2 (NGK | ) | Connecticut Dividend Advantage 3 (NGO | ) |
| | | $ | 273,639 | | $ | 280,916 | | $ | 233,778 | | $ | 445,782 | |
See accompanying notes to financial statements.
68 Nuveen Investments
| | | Massachusetts Premium Income (NMT | ) | Massachusetts Dividend Advantage (NMB | ) | Insured Massachusetts Tax-Free Advantage (NGX | ) | Missouri Premium Income (NOM | ) |
| Cash Flows from Operating Activities: | | | | | | | | | | | | | |
| Net Increase (Decrease) In Net Assets Applicable to Common Shares from Operations | | $ | 932,758 | | $ | 222,216 | | $ | 305,510 | | $ | 357,460 | |
| Adjustments to reconcile the net increase (decrease) in net assets applicable to Common shares from operations to net cash provided by (used in)operating activities: | | | | | | | | | | | | | |
| Purchases of investments | | | (1,493,095 | ) | | (917,227 | ) | | (1,944,263 | ) | | (1,018,131 | ) |
| Proceeds from sales and maturities of investments | | | 640,234 | | | 1,080,467 | | | 1,520,000 | | | 1,657,138 | |
| Amortization (Accretion) of premiums and discounts, net | | | 136,445 | | | 39,912 | | | 73,325 | | | 53,098 | |
| (Increase) Decrease in receivable for interest | | | (18,533 | ) | | (48,619 | ) | | 27,505 | | | 40,519 | |
| (Increase) Decrease in receivable for investments sold | | | 105,000 | | | — | | | 110,000 | | | 15,706 | |
| (Increase) Decrease in other assets | | | (1,026 | ) | | (2,887 | ) | | (483 | ) | | (5,410 | ) |
| Increase (Decrease) in payable for investments purchased | | | — | | | — | | | — | | | (1,987,280 | ) |
| Increase (Decrease) in payable for Auction Rate Preferred share dividends | | | 198 | | | — | | | — | | | 220 | |
| Increase (Decrease) in payable for interest | | | 4 | | | (3 | ) | | 5 | | | 22,946 | |
| Increase (Decrease) in accrued management fees | | | (2,028 | ) | | (890 | ) | | (1,218 | ) | | (521 | ) |
| Increase (Decrease) in accrued other liabilities | | | (24,522 | ) | | (18,147 | ) | | (18,347 | ) | | (16,553 | ) |
| Net realized (gain) loss from investments | | | 77,740 | | | 169,511 | | | 151 | | | (39,938 | ) |
| Change in net unrealized (appreciation) depreciation of investments | | | 867,405 | | | 316,054 | | | 593,323 | | | 665,680 | |
| Taxes paid on undistributed capital gains | | | (3,196 | ) | | (19,977 | ) | | (152 | ) | | — | |
| Net cash provided by (used in) operating activities | | | 1,217,384 | | | 820,410 | | | 665,356 | | | (255,066 | ) |
| Cash Flows from Financing Activities: | | | | | | | | | | | | | |
| Increase (Decrease) in cash overdraft balance | | | 280,700 | | | — | | | — | | | — | |
Increase (Decrease) in cash equivalents(1) | | | — | | | — | | | — | | | (16,003,015 | ) |
| Increase (Decrease) in payable for Auction Rate Preferred shares noticed for redemption, at liquidation value | | | — | | | — | | | — | | | 16,000,000 | |
| Increase (Decrease) in MuniFund Term Preferred shares, at liquidation value | | | — | | | — | | | — | | | 17,880,000 | |
| Increase (Decrease) in Auction Rate Preferred shares, at liquidation value | | | — | | | — | | | — | | | (16,000,000 | ) |
| (Increase) Decrease in deferred offering costs | | | 58,060 | | | 46,434 | | | 56,618 | | | (591,082 | ) |
| Increase (Decrease) in payable for offering costs | | | (34,350 | ) | | (110,127 | ) | | (20,625 | ) | | 317,424 | |
| Cash distributions paid to Common shareholders | | | (1,772,446 | ) | | (794,710 | ) | | (1,014,384 | ) | | (856,489 | ) |
| Net cash provided by (used in) financing activities | | | (1,468,036 | ) | | (858,403 | ) | | (978,391 | ) | | 746,838 | |
| Net Increase (Decrease) in Cash | | | (250,652 | ) | | (37,993 | ) | | (313,035 | ) | | 491,772 | |
| Cash at the beginning of period | | | 250,652 | | | 249,337 | | | 691,270 | | | 784,388 | |
| Cash at the End of Period | | $ | — | | $ | 211,344 | | $ | 378,235 | | $ | 1,276,160 | |
Supplemental Disclosure of Cash Flow Information
Non-cash financing activities not included herein consist of reinvestments of Common share distributions as follows:
| | | | | | | | | | | | | | |
| | | Massachusetts Premium Income (NMT | ) | Massachusetts Dividend Advantage (NMB | ) | Insured Massachusetts Tax-Free Advantage (NGX | ) | Missouri Premium Income (NOM | ) |
| | | $ | 86,708 | | $ | 18,328 | | $ | 14,937 | | $ | 33,782 | |
Cash paid for interest (excluding amortization of offering costs) was as follows:
| | | | | | | | | | | | | | |
| | | Massachusetts Premium Income (NMT | ) | Massachusetts Dividend Advantage (NMB | ) | Insured Massachusetts Tax-Free Advantage (NGX | ) | Missouri Premium Income (NOM | ) |
| | | $ | 275,707 | | $ | 194,826 | | $ | 297,345 | | $ | 4,361 | |
(1) Segregated for the payment of Auction Rate Preferred shares noticed for redemption.
See accompanying notes to financial statements.
Nuveen Investments 69
| | | Financial |
| | | Highlights (Unaudited) |
| | | |
| | Selected data for a Common share outstanding throughout each period: |
| | | | | | Investment Operations | | Less Distributions | | | | | | | |
| | | Beginning Common Share Net Asset Value | | Net Investment Income | | Net Realized/ Unrealized Gain (Loss) | | Distributions from Net Investment Income to Auction Rate Preferred Share- holders | (a) | Distributions from Capital Gains to Auction Rate Preferred Share- holders | (a) | Total | | Net Investment Income to Common Share- holders | | Capital Gains to Common Share- holders | | Total | | Ending Common Share Net Asset Value | | Ending Market Value | |
| Connecticut Premium Income (NTC) | | | | | | | | | | | | | | | | | | | | | | |
| Year Ended 5/31: | | | | | | | | | | | | | | | | | | | | | | | | | | | | | | | |
| 2011(f) | | $ | 14.56 | | $ | .36 | | $ | (.20 | ) | $ | (.01 | ) | $ | — | | $ | .15 | | $ | (.35 | ) | $ | — | | $ | (.35 | ) | $ | 14.36 | | $ | 13.58 | |
| 2010 | | | 13.59 | | | .80 | | | .88 | | | (.02 | ) | | — | * | | 1.66 | | | (.69 | ) | | — | * | | (.69 | ) | | 14.56 | | | 13.94 | |
| 2009 | | | 14.25 | | | .84 | | | (.66 | ) | | (.14 | ) | | (.03 | ) | | .01 | | | (.60 | ) | | (.07 | ) | | (.67 | ) | | 13.59 | | | 13.35 | |
| 2008 | | | 14.39 | | | .83 | | | (.09 | ) | | (.22 | ) | | (.01 | ) | | .51 | | | (.62 | ) | | (.03 | ) | | (.65 | ) | | 14.25 | | | 14.08 | |
| 2007 | | | 14.42 | | | .83 | | | .07 | | | (.20 | ) | | (.01 | ) | | .69 | | | (.65 | ) | | (.07 | ) | | (.72 | ) | | 14.39 | | | 14.91 | |
| 2006 | | | 15.26 | | | .84 | | | (.54 | ) | | (.14 | ) | | (.03 | ) | | .13 | | | (.75 | ) | | (.22 | ) | | (.97 | ) | | 14.42 | | | 13.95 | |
| | | | | | | | | | | | | | | | | | | | | | | | | | | | | | | | | | | |
| Connecticut Dividend Advantage (NFC) | | | | | | | | | | | | | | | | | | | | | | |
| Year Ended 5/31: | | | | | | | | | | | | | | | | | | | | | | | | | | | | | | | |
| 2011(f) | | | 14.91 | | | .35 | | | (.28 | ) | | — | | | — | | | .07 | | | (.38 | ) | | — | | | (.38 | ) | | 14.60 | | | 14.16 | |
| 2010 | | | 14.08 | | | .85 | | | .75 | | | (.03 | ) | | — | | | 1.57 | | | (.74 | ) | | — | | | (.74 | ) | | 14.91 | | | 15.29 | |
| 2009 | | | 14.69 | | | .91 | | | (.55 | ) | | (.15 | ) | | (.04 | ) | | .17 | | | (.67 | ) | | (.11 | ) | | (.78 | ) | | 14.08 | | | 13.75 | |
| 2008 | | | 14.76 | | | .91 | | | .01 | | | (.24 | ) | | (.02 | ) | | .66 | | | (.67 | ) | | (.06 | ) | | (.73 | ) | | 14.69 | | | 14.93 | |
| 2007 | | | 14.75 | | | .92 | | | .04 | | | (.22 | ) | | — | | | .74 | | | (.73 | ) | | — | | | (.73 | ) | | 14.76 | | | 16.37 | |
| 2006 | | | 15.39 | | | .93 | | | (.55 | ) | | (.17 | ) | | — | | | .21 | | | (.85 | ) | | — | | | (.85 | ) | | 14.75 | | | 16.26 | |
| | | Auction Rate Preferred Shares at End of Period | | MuniFund Term Preferred Shares at End of Period | | Auction Rate Preferred Shares and MuniFund Term Preferred Shares at End of Period | |
| | | Aggregate Amount Outstanding (000) | | Liquidation Value Per Share | | Asset Coverage Per Share | | Aggregate Amount Outstanding (000) | | Liquidation Value Per Share | | Ending Market Value Per Share | | Average Market Value Per Share | | Asset Coverage Per Share | | Asset Coverage Per $1 Liquidation Preference | |
| Connecticut Premium Income (NTC) | | | | | | | | | | | | | | | | | | | | | | |
| Year Ended 5/31: | | | | | | | | | | | | | | | | | | | | | | | | | | | | |
| 2011(f) | | $ | 15,725 | | $ | 25,000 | | $ | 81,594 | | $ | 18,300 | | $ | 10.00 | | $ | 10.08 | | $ | 10.09 | | $ | 32.64 | | $ | 3.26 | |
| 2010 | | | 15,725 | | | 25,000 | | | 82,389 | | | 18,300 | | | 10.00 | | | 10.00 | | | 10.02 | ∆ | | 32.96 | | | 3.30 | |
| 2009 | | | 34,975 | | | 25,000 | | | 77,110 | | | — | | | — | | | — | | | — | | | — | | | — | |
| 2008 | | | 38,300 | | | 25,000 | | | 74,896 | | | — | | | — | | | — | | | — | | | — | | | — | |
| 2007 | | | 38,300 | | | 25,000 | | | 75,360 | | | — | | | — | | | — | | | — | | | — | | | — | |
| 2006 | | | 38,300 | | | 25,000 | | | 75,443 | | | — | | | — | | | — | | | — | | | — | | | — | |
| | | | | | | | | | | | | | | | | | | | | | | | | | | | | |
| Connecticut Dividend Advantage (NFC) | | | | | | | | | | | | | | | | | | | | | | |
| Year Ended 5/31: | | | | | | | | | | | | | | | | | | | | | | | | | | | | |
| 2011(f) | | | — | | | — | | | — | | | 20,470 | | | 10.00 | | | 10.08 | | | 10.07 | | | 28.44 | | | — | |
| 2010 | | | — | | | — | | | — | | | 20,470 | | | 10.00 | | | 9.98 | | | 9.95 | ∆∆ | | 28.82 | | | — | |
| 2009 | | | 18,000 | | | 25,000 | | | 75,457 | | | — | | | — | | | — | | | — | | | — | | | — | |
| 2008 | | | 19,500 | | | 25,000 | | | 73,556 | | | — | | | — | | | — | | | — | | | — | | | — | |
| 2007 | | | 19,500 | | | 25,000 | | | 73,749 | | | — | | | — | | | — | | | — | | | — | | | — | |
| 2006 | | | 19,500 | | | 25,000 | | | 73,596 | | | — | | | — | | | — | | | — | | | — | | | — | |
70 Nuveen Investments
| | | | | | Ratios/Supplemental Data |
| Total Returns | | | | | Ratios to Average Net Assets Applicable to Common Shares Before Reimbursement(c) | | Ratios to Average Net Assets Applicable to Common Shares After Reimbursement(c)(d) | | | | |
Based on Market Value | (b) | | Based on Common Share Net Asset Value | (b) | Ending Net Assets Applicable to Common Shares (000) | | Expenses Including Interest | (e) | Expenses Excluding Interest | | Net Investment Income | | Expenses Including Interest | (e) | Expenses Excluding Interest | | Net Investment Income | | Portfolio Turnover Rate | |
| | | | | | | | | | | | | | | | | | | | | | | | | | | | | |
| | | | | | | | | | | | | | | | | | | | | | | | | | | | | |
| (.11) | % | | 1.03 | % | $ | 77,025 | | | 1.96 | %** | | 1.27 | %** | | 4.90 | %** | | N/A | | | N/A | | | N/A | | | 5 | % |
| 9.76 | | | 12.49 | | | 78,106 | | | 1.57 | | | 1.25 | | | 5.64 | | | N/A | | | N/A | | | N/A | | | 5 | |
| .32 | | | .45 | | | 72,901 | | | 1.43 | | | 1.32 | | | 6.40 | | | N/A | | | N/A | | | N/A | | | 0 | |
| (1.08) | | | 3.60 | | | 76,441 | | | 1.30 | | | 1.27 | | | 5.82 | | | N/A | | | N/A | | | N/A | | | 22 | |
| 12.33 | | | 4.79 | | | 77,151 | | | 1.24 | | | 1.24 | | | 5.67 | | | N/A | | | N/A | | | N/A | | | 8 | |
| (6.00) | | | .88 | | | 77,278 | | | 1.25 | | | 1.25 | | | 5.66 | | | N/A | | | N/A | | | N/A | | | 16 | |
| | | | | | | | | | | | | | | | | | | | | | | | | | | | | |
| | | | | | | | | | | | | | | | | | | | | | | | | | | | | |
| (4.98) | | | .45% | | | 37,754 | | | 2.95 | ** | | 1.51 | ** | | 4.53 | ** | | 2.87 | %** | | 1.43 | %** | | 4.61 | %** | | 4 | |
| 16.92 | | | 11.34 | | | 38,532 | | | 1.62 | | | 1.31 | | | 5.73 | | | 1.49 | | | 1.18 | | | 5.86 | | | 4 | |
| (2.10) | | | 1.50 | | | 36,329 | | | 1.47 | | | 1.36 | | | 6.45 | | | 1.26 | | | 1.15 | | | 6.66 | | | 0 | |
| (4.10) | | | 4.62 | | | 37,874 | | | 1.33 | | | 1.31 | | | 5.90 | | | 1.05 | | | 1.03 | | | 6.18 | | | 20 | |
| 5.46 | | | 5.05 | | | 38,024 | | | 1.29 | | | 1.29 | | | 5.78 | | | .94 | | | .94 | | | 6.14 | | | 9 | |
| 8.79 | | | 1.38 | | | 37,905 | | | 1.29 | | | 1.29 | | | 5.70 | | | .86 | | | .86 | | | 6.12 | | | 14 | |
| (a) | The amounts shown are based on Common share equivalents. |
| (b) | Total Return Based on Market Value is the combination of changes in the market price per share and the effect of reinvested dividend income and reinvested capital gains distributions, if any, at the average price paid per share at the time of reinvestment. The last dividend declared in the period, which is typically paid on the first business day of the following month, is assumed to be reinvested at the ending market price. The actual reinvestment for the last dividend declared in the period may take place over several days, and in some instances may not be based on the market price, so the actual reinvestment price may be different from the price used in the calculation. Total returns are not annualized. |
| | Total Return Based on Common Share Net Asset Value is the combination of changes in Common share net asset value, reinvested dividend income at net asset value and reinvested capital gains distributions at net asset value, if any. The last dividend declared in the period, which is typically paid on the first business day of the following month, is assumed to be reinvested at the ending net asset value. The actual reinvest price for the last dividend declared in the period may often be based on the Fund’s market price (and not its net asset value), and therefore may be different from the price used in the calculation. Total returns are not annualized. |
| (c) | Ratios do not reflect the effect of dividend payments to Auction Rate Preferred shareholders; Net Investment Income ratios reflect income earned and expenses incurred on assets attributable to Auction Rate Preferred shares and/or MuniFund Term Preferred shares, where applicable. |
| (d) | After expense reimbursement from the Adviser, where applicable. Ratios do not reflect the effect of custodian fee credits earned on the Fund’s net cash on deposit with the custodian bank, where applicable. |
| (e) | The expense ratios reflect, among other things, payments to MuniFund Term Preferred shareholders and/or the interest expense deemed to have been paid by the Fund on the floating rate certificates issued by the special purpose trusts for the self-deposited inverse floaters held by the Fund, where applicable, both as described in Footnote 1 – General Information and Significant Accounting Policies, MuniFund Term Preferred Shares and Inverse Floating Rate Securities, respectively. |
| (f) | For the six months ended November 30, 2010. |
| * | Rounds to less than $.01 per share. |
| ** | Annualized. |
| For the period January 19, 2010 (issuance date of shares) through May 31, 2010. |
| For the period March 31, 2010 (issuance date of shares) through May 31, 2010. |
| N/A | Fund does not have a contractual reimbursement with the Adviser. |
See accompanying notes to financial statements.
Nuveen Investments 71
| | | Financial |
| | | Highlights (Unaudited) (continued) |
Selected data for a Common share outstanding throughout each period:
| | | | | | Investment Operations | | Less Distributions | | | | | | | |
| | | Beginning Common Share Net Asset Value | | Net Investment Income | | Net Realized/ Unrealized Gain (Loss) | | Distributions from Net Investment Income to Auction Rate Preferred Share- holders | (a) | Distributions from Capital Gains to Auction Rate Preferred Share- holders | (a) | Total | | Net Investment Income to Common Share-holders | | Capital Gains to Common Share-holders | | Total | | Ending Common Share Net Asset Value | | Ending Market Value | |
| Connecticut Dividend Advantage 2 (NGK) | | | | | | | | | | | | | | | | | | | | | | | | | |
| Year Ended 5/31: | | | | | | | | | | | | | | | | | | | | | | | | | | | | | | | |
| 2011(f) | | $ | 15.02 | | $ | .35 | | $ | (.24 | ) | $ | — | | $ | — | | $ | .11 | | $ | (.40 | ) | $ | — | | $ | (.40 | ) | $ | 14.73 | | $ | 14.69 | |
| 2010 | | | 14.28 | | | .86 | | | .67 | | | (.03 | ) | | — | | | 1.50 | | | (.76 | ) | | — | | | (.76 | ) | | 15.02 | | | 16.20 | |
| 2009 | | | 14.76 | | | .91 | | | (.43 | ) | | (.14 | ) | | (.04 | ) | | .30 | | | (.66 | ) | | (.12 | ) | | (.78 | ) | | 14.28 | | | 14.30 | |
| 2008 | | | 14.85 | | | .91 | | | (.01 | ) | | (.23 | ) | | (.02 | ) | | .65 | | | (.67 | ) | | (.07 | ) | | (.74 | ) | | 14.76 | | | 15.00 | |
| 2007 | | | 14.86 | | | .91 | | | .08 | | | (.22 | ) | | (.01 | ) | | .76 | | | (.73 | ) | | (.04 | ) | | (.77 | ) | | 14.85 | | | 16.38 | |
| 2006 | | | 15.64 | | | .91 | | | (.60 | ) | | (.17 | ) | | (.01 | ) | | .13 | | | (.83 | ) | | (.08 | ) | | (.91 | ) | | 14.86 | | | 16.60 | |
| | | | | | | | | | | | | | | | | | | | | | | | | | | | | | | | | | | |
| Connecticut Dividend Advantage 3 (NGO) | | | | | | | | | | | | | | | | | | | | | | | | | |
| Year Ended 5/31: | | | | | | | | | | | | | | | | | | | | | | | | | | | | | | | |
| 2011(f) | | | 14.44 | | | .32 | | | (.20 | ) | | — | | | — | | | .12 | | | (.36 | ) | | — | | | (.36 | ) | | 14.20 | | | 13.65 | |
| 2010 | | | 13.57 | | | .77 | | | .80 | | | (.02 | ) | | — | | | 1.55 | | | (.68 | ) | | — | | | (.68 | ) | | 14.44 | | | 14.06 | |
| 2009 | | | 14.08 | | | .84 | | | (.58 | ) | | (.17 | ) | | — | | | .09 | | | (.60 | ) | | — | | | (.60 | ) | | 13.57 | | | 13.04 | |
| 2008 | | | 14.30 | | | .87 | | | (.23 | ) | | (.25 | ) | | — | | | .39 | | | (.61 | ) | | — | | | (.61 | ) | | 14.08 | | | 13.63 | |
| 2007 | | | 14.18 | | | .86 | | | .13 | | | (.23 | ) | | — | | | .76 | | | (.64 | ) | | — | | | (.64 | ) | | 14.30 | | | 14.70 | |
| 2006 | | | 14.78 | | | .84 | | | (.54 | ) | | (.18 | ) | | — | | | .12 | | | (.72 | ) | | — | | | (.72 | ) | | 14.18 | | | 14.09 | |
| | | Auction Rate Preferred Shares at End of Period | | MuniFund Term Preferred Shares at End of Period |
| | | Aggregate Amount Outstanding (000) | | Liquidation Value Per Share | | Asset Coverage Per Share | | Aggregate Amount Outstanding (000) | | Liquidation Value Per Share | | Ending Market Value Per Share | | Average Market Value Per Share | | Asset Coverage Per Share | |
| Connecticut Dividend Advantage 2 (NGK) | | | | | | | | | | | | | | | | | | |
| Year Ended 5/31: | | | | | | | | | | | | | | | | | | | | | | | |
| 2011(f) | | $ | — | | $ | — | | $ | — | | $ | 16,950 | | $ | 10.00 | | $ | 10.05 | | $ | 10.10 | | $ | 30.16 | |
| 2010 | | | — | | | — | | | — | | | 16,950 | | | 10.00 | | | 9.97 | | | 9.96 | ∆ | | 30.55 | |
| 2009 | | | 16,125 | | | 25,000 | | | 76,305 | | | — | | | — | | | — | | | — | | | — | |
| 2008 | | | 17,500 | | | 25,000 | | | 73,840 | | | — | | | — | | | — | | | — | | | — | |
| 2007 | | | 17,500 | | | 25,000 | | | 74,094 | | | — | | | — | | | — | | | — | | | — | |
| 2006 | | | 17,500 | | | 25,000 | | | 74,074 | | | — | | | — | | | — | | | — | | | — | |
| | | | | | | | | | | | | | | | | | | | | | | | | | |
| Connecticut Dividend Advantage 3 (NGO) | | | | | | | | | | | | | | | | | | |
| Year Ended 5/31: | | | | | | | | | | | | | | | | | | | | | | | |
| 2011(f) | | | — | | | — | | | — | | | 32,000 | | | 10.00 | | | 10.09 | | | 10.09 | | | 29.38 | |
| 2010 | | | — | | | — | | | — | | | 32,000 | | | 10.00 | | | 10.00 | | | 9.99 | ∆∆ | | 29.71 | |
| 2009 | | | 30,025 | | | 25,000 | | | 74,329 | | | — | | | — | | | — | | | — | | | — | |
| 2008 | | | 32,000 | | | 25,000 | | | 73,028 | | | — | | | — | | | — | | | — | | | — | |
| 2007 | | | 32,000 | | | 25,000 | | | 73,691 | | | — | | | — | | | — | | | — | | | — | |
| 2006 | | | 32,000 | | | 25,000 | | | 73,302 | | | — | | | — | | | — | | | — | | | — | |
72 Nuveen Investments
| | | | | | Ratios/Supplemental Data |
| Total Returns | | | | | Ratios to Average Net Assets Applicable to Common Shares Before Reimbursement(c) | | Ratios to Average Net Assets Applicable to Common Shares After Reimbursement(c)(d) | | | | |
Based on Market Value | (b) | Based on Common Share Net Asset Value | (b) | Ending Net Assets Applicable to Common Shares (000) | | Expenses Including Interest | (e) | Expenses Excluding Interest | | Net Investment Income | | Expenses Including Interest | (e) | Expenses Excluding Interest | | Net Investment Income | | Portfolio Turnover Rate | |
| | | | | | | | | | | | | | | | | | | | | | | | | | | | | |
| | | | | | | | | | | | | | | | | | | | | | | | | | | | | |
| (6.93) | % | | .67 | % | $ | 34,174 | | | 2.76 | %* | | 1.43 | %* | | 4.40 | %* | | 2.61 | %* | | 1.28 | %* | | 4.55 | %* | | 5 | % |
| 19.15 | | | 10.69 | | | 34,833 | | | 1.61 | | | 1.32 | | | 5.64 | | | 1.40 | | | 1.11 | | | 5.86 | | | 3 | |
| 1.40 | | | 2.52 | | | 33,092 | | | 1.48 | | | 1.37 | | | 6.31 | | | 1.19 | | | 1.08 | | | 6.60 | | | 0 | |
| (3.63) | | | 4.54 | | | 34,188 | | | 1.36 | | | 1.33 | | | 5.79 | | | 1.00 | | | .97 | | | 6.15 | | | 23 | |
| 3.58 | | | 5.13 | | | 34,366 | | | 1.31 | | | 1.31 | | | 5.60 | | | .87 | | | .87 | | | 6.04 | | | 12 | |
| 9.78 | | | .84 | | | 34,352 | | | 1.29 | | | 1.29 | | | 5.51 | | | .84 | | | .84 | | | 5.96 | | | 11 | |
| | | | | | | | | | | | | | | | | | | | | | | | | | | | | |
| | | | | | | | | | | | | | | | | | | | | | | | | | | | | |
| (.42) | | | .80 | | | 62,016 | | | 2.75 | * | | 1.35 | * | | 4.31 | * | | 2.67 | * | | 1.27 | * | | 4.39 | * | | 5 | |
| 13.26 | | | 11.66 | | | 63,059 | | | 1.78 | | | 1.28 | | | 5.28 | | | 1.61 | | | 1.12 | | | 5.45 | | | 3 | |
| .53 | | | .89 | | | 59,244 | | | 1.43 | | | 1.32 | | | 6.12 | | | 1.14 | | | 1.03 | | | 6.41 | | | 0 | |
| (3.07) | | | 2.79 | | | 61,476 | | | 1.29 | | | 1.27 | | | 5.70 | | | .88 | | | .86 | | | 6.11 | | | 24 | |
| 9.15 | | | 5.42 | | | 62,325 | | | 1.26 | | | 1.26 | | | 5.44 | | | .78 | | | .78 | | | 5.92 | | | 15 | |
| 1.84 | | | .83 | | | 61,826 | | | 1.24 | | | 1.24 | | | 5.30 | | | .76 | | | .76 | | | 5.78 | | | 9 | |
| (a) | The amounts shown are based on Common share equivalents. |
| (b) | Total Return Based on Market Value is the combination of changes in the market price per share and the effect of reinvested dividend income and reinvested capital gains distributions, if any, at the average price paid per share at the time of reinvestment. The last dividend declared in the period, which is typically paid on the first business day of the following month, is assumed to be reinvested at the ending market price. The actual reinvestment for the last dividend declared in the period may take place over several days, and in some instances may not be based on the market price, so the actual reinvestment price may be different from the price used in the calculation. |
| | Total returns are not annualized. |
| | Total Return Based on Common Share Net Asset Value is the combination of changes in Common share net asset value, reinvested dividend income at net asset value and reinvested capital gains distributions at net asset value, if any. The last dividend declared in the period, which is typically paid on the first business day of the following month, is assumed to be reinvested at the ending net asset value. The actual reinvest price for the last dividend declared in the period may often be based on the Fund’s market price (and not its net asset value), and therefore may be different from the price used in the calculation. Total returns are not annualized. |
| (c) | Ratios do not reflect the effect of dividend payments to Auction Rate Preferred shareholders; Net Investment Income ratios reflect income earned and expenses incurred on assets attributable to Auction Rate Preferred shares and/or MuniFund Term Preferred shares, where applicable. |
| (d) | After expense reimbursement from the Adviser, where applicable. Ratios do not reflect the effect of custodian fee credits earned on the Fund’s net cash on deposit with the custodian bank, where applicable. As of September 30, 2010, the Adviser is no longer reimbursing Connecticut Dividend Advantage 3 (NGO) for any fees and expenses. |
| (e) | The expense ratios reflect, among other things, payments to MuniFund Term Preferred shareholders and/or the interest expense deemed to have been paid by the Fund on the floating rate certificates issued by the special purpose trusts for the self-deposited inverse floaters held by the Fund, where applicable, both as described in Footnote 1 – General Information and Significant Accounting Policies, MuniFund Term Preferred Shares and Inverse Floating Rate Securities, respectively. |
| (f) | For the six months ended November 30, 2010. |
| * | Annualized. |
| For the period March 31, 2010 (issuance date of shares) through May 31, 2010. |
| For the period February 10, 2010 (issuance date of shares) through May 31, 2010. |
See accompanying notes to financial statements.
Nuveen Investments 73
| | | Financial |
| | | Highlights (Unaudited) (continued) |
Selected data for a Common share outstanding throughout each period:
| | | | | | Investment Operations | | Less Distributions | | | | | | | |
| | | Beginning Common Share Net Asset Value | | Net Investment Income | | Net Realized/ Unrealized Gain (Loss) | | Distributions from Net Investment Income to Auction Rate Preferred Share- holders | (a) | Distributions from Capital Gains to Auction Rate Preferred Share- holders | (a) | Total | | Net Investment Income to Common Share- holders | | Capital Gains to Common Share- holders | | Total | | Ending Common Share Net Asset Value | | Ending Market Value | |
| Massachusetts Premium Income (NMT) | | | | | | | | | | | | | | | | | | | | | | | | | |
| Year Ended 5/31: | | | | | | | | | | | | | | | | | | | | | | | | | | | | | | | |
| 2011(f) | | $ | 14.48 | | $ | .40 | | $ | (.20 | ) | $ | (.01 | ) | $ | — | | $ | .19 | | $ | (.39 | ) | $ | — | | $ | (.39 | ) | $ | 14.28 | | $ | 14.33 | |
| 2010 | | | 13.29 | | | .87 | | | 1.12 | | | (.03 | ) | | — | | | 1.96 | | | (.77 | ) | | — | | | (.77 | ) | | 14.48 | | | 14.93 | |
| 2009 | | | 14.22 | | | .91 | | | (.98 | ) | | (.15 | ) | | (.02 | ) | | (.24 | ) | | (.65 | ) | | (.04 | ) | | (.69 | ) | | 13.29 | | | 13.28 | |
| 2008 | | | 14.56 | | | .88 | | | (.32 | ) | | (.25 | ) | | (.01 | ) | | .30 | | | (.62 | ) | | (.02 | ) | | (.64 | ) | | 14.22 | | | 13.61 | |
| 2007 | | | 14.45 | | | .88 | | | .13 | | | (.23 | ) | | — | * | | .78 | | | (.67 | ) | | — | * | | (.67 | ) | | 14.56 | | | 14.33 | |
| 2006 | | | 15.10 | | | .88 | | | (.50 | ) | | (.18 | ) | | — | | | .20 | | | (.81 | ) | | (.04 | ) | | (.85 | ) | | 14.45 | | | 14.35 | |
| | | | | | | | | | | | | | | | | | | | | | | | | | | | | | | | | | | |
| Massachusetts Dividend Advantage (NMB) | | | | | | | | | | | | | | | | | | | | | | | | | |
| Year Ended 5/31: | | | | | | | | | | | | | | | | | | | | | | | | | | | | | | | |
| 2011(f) | | | 14.38 | | | .36 | | | (.25 | ) | | — | | | — | | | .11 | | | (.41 | ) | | — | | | (.41 | ) | | 14.08 | | | 14.11 | |
| 2010 | | | 13.52 | | | .89 | | | .80 | | | (.02 | ) | | (.01 | ) | | 1.66 | | | (.77 | ) | | (.03 | ) | | (.80 | ) | | 14.38 | | | 14.10 | |
| 2009 | | | 14.36 | | | .95 | | | (.93 | ) | | (.17 | ) | | — | | | (.15 | ) | | (.69 | ) | | — | | | (.69 | ) | | 13.52 | | | 13.83 | |
| 2008 | | | 14.84 | | | .94 | | | (.45 | ) | | (.26 | ) | | (.01 | ) | | .22 | | | (.68 | ) | | (.02 | ) | | (.70 | ) | | 14.36 | | | 14.61 | |
| 2007 | | | 14.83 | | | .93 | | | .08 | | | (.25 | ) | | — | | | .76 | | | (.75 | ) | | — | | | (.75 | ) | | 14.84 | | | 16.28 | |
| 2006 | | | 15.65 | | | .95 | | | (.54 | ) | | (.17 | ) | | (.02 | ) | | .22 | | | (.85 | ) | | (.19 | ) | | (1.04 | ) | | 14.83 | | | 15.53 | |
| | | Auction Rate Preferred Shares at End of Period | | MuniFund Term Preferred Shares at End of Period | | Auction Rate Preferred Shares and MuniFund Term Preferred Shares at End of Period | |
| | | Aggregate Amount Outstanding (000) | | Liquidation Value Per Share | | Asset Coverage Per Share | | Aggregate Amount Outstanding (000) | | Liquidation Value Per Share | | Ending Market Value Per Share | | Average Market Value Per Share | | Asset Coverage Per Share | | Asset Coverage Per $1 Liquidation Preference | |
| Massachusetts Premium Income (NMT) | | | | | | | | | | | | | | | | | | | | | | |
| Year Ended 5/31: | | | | | | | | | | | | | | | | | | | | | | | | | | | | |
| 2011(f) | | $ | 14,400 | | $ | 25,000 | | $ | 74,256 | | $ | 20,210 | | $ | 10.00 | | $ | 10.07 | | $ | 10.09 | | $ | 29.70 | | $ | 2.97 | |
| 2010 | | | 14,400 | | | 25,000 | | | 74,863 | | | 20,210 | | | 10.00 | | | 10.00 | | | 10.00 | ∆ | | 29.95 | | | 2.99 | |
| 2009 | | | 34,000 | | | 25,000 | | | 71,559 | | | — | | | — | | | — | | | — | | | — | | | — | |
| 2008 | | | 34,000 | | | 25,000 | | | 74,794 | | | — | | | — | | | — | | | — | | | — | | | — | |
| 2007 | | | 34,000 | | | 25,000 | | | 75,973 | | | — | | | — | | | — | | | — | | | — | | | — | |
| 2006 | | | 34,000 | | | 25,000 | | | 75,571 | | | — | | | — | | | — | | | — | | | — | | | — | |
| | | | | | | | | | | | | | | | | | | | | | | | | | | | | |
| Massachusetts Dividend Advantage (NMB) | | | | | | | | | | | | | | | | | | | | | | |
| Year Ended 5/31: | | | | | | | | | | | | | | | | | | | | | | | | | | | | |
| 2011(f) | | | — | | | — | | | — | | | 14,725 | | | 10.00 | | | 10.04 | | | 10.07 | | | 28.79 | | | — | |
| 2010 | | | — | | | — | | | — | | | 14,725 | | | 10.00 | | | 9.98 | | | 9.95 | ∆∆ | | 29.18 | | | — | |
| 2009 | | | 14,250 | | | 25,000 | | | 71,544 | | | — | | | — | | | — | | | — | | | — | | | — | |
| 2008 | | | 15,000 | | | 25,000 | | | 71,892 | | | — | | | — | | | — | | | — | | | — | | | — | |
| 2007 | | | 15,000 | | | 25,000 | | | 73,453 | | | — | | | — | | | — | | | — | | | — | | | — | |
| 2006 | | | 15,000 | | | 25,000 | | | 73,340 | | | — | | | — | | | — | | | — | | | — | | | — | |
74 Nuveen Investments
| | | | | | Ratios/Supplemental Data | |
| Total Returns | | | | | Ratios to Average Net Assets Applicable to Common Shares Before Reimbursement(c) | | Ratios to Average Net Assets Applicable to Common Shares After Reimbursement(c)(d) | | | | |
Based on Market Value | (b) | | Based on Common Share Net Asset Value | (b) | | Ending Net Assets Applicable to Common Shares (000) | | | Expenses Including Interest | (e) | | Expenses Excluding Interest | | | Net Investment Income | | | Expenses Including Interest | (e) | | Expenses Excluding Interest | | | Net Investment Income | | | Portfolio Turnover Rate | |
| | | | | | | | | | | | | | | | | | | | |
| | | | | | | | | | | | | | | | | | | | | | | | | | | | | |
| (1.44 | )% | | 1.27 | % | $ | 68,190 | | | 2.10 | %** | | 1.31 | %** | | 5.43 | %** | | N/A | | | N/A | | | N/A | | | 1 | % |
| 18.77 | | | 15.03 | | | 69,031 | | | 1.60 | | | 1.29 | | | 6.21 | | | N/A | | | N/A | | | N/A | | | 3 | |
| 3.54 | | | (1.36 | ) | | 63,321 | | | 1.43 | | | 1.34 | | | 7.01 | | | N/A | | | N/A | | | N/A | | | 1 | |
| (.48 | ) | | 2.08 | | | 67,720 | | | 1.26 | | | 1.26 | | | 6.09 | | | N/A | | | N/A | | | N/A | | | 14 | |
| 4.60 | | | 5.47 | | | 69,323 | | | 1.24 | | | 1.24 | | | 5.97 | | | N/A | | | N/A | | | N/A | | | 9 | |
| (6.14 | ) | | 1.41 | | | 68,776 | | | 1.25 | | | 1.25 | | | 5.98 | | | N/A | | | N/A | | | N/A | | | 13 | |
| | | | | | | | | | | | | | | | | | | | | | | | | | | | | |
| | | | | | | | | | | | | | | | | | | | | | | | | | | | | |
| 2.96 | | | .74 | | | 27,663 | | | 2.90 | ** | | 1.53 | ** | | 4.88 | ** | | 2.82 | %** | | 1.46 | %** | | 4.95 | %** | | 2 | |
| 7.90 | | | 12.50 | | | 28,235 | | | 1.67 | | | 1.38 | | | 6.16 | | | 1.54 | | | 1.25 | | | 6.29 | | | 11 | |
| (.04 | ) | | (.70 | ) | | 26,530 | | | 1.54 | | | 1.44 | | | 7.09 | | | 1.33 | | | 1.23 | | | 7.30 | | | 1 | |
| (5.73 | ) | | 1.55 | | | 28,135 | | | 1.32 | | | 1.32 | | | 6.11 | | | 1.05 | | | 1.05 | | | 6.39 | | | 15 | |
| 10.04 | | | 5.14 | | | 29,072 | | | 1.33 | | | 1.33 | | | 5.84 | | | .97 | | | .97 | | | 6.19 | | | 9 | |
| (5.23 | ) | | 1.49 | | | 29,004 | | | 1.29 | | | 1.29 | | | 5.79 | | | .86 | | | .86 | | | 6.21 | | | 13 | |
| (a) | The amounts shown are based on Common share equivalents. |
| (b) | Total Return Based on Market Value is the combination of changes in the market price per share and the effect of reinvested dividend income and reinvested capital gains distributions, if any, at the average price paid per share at the time of reinvestment. The last dividend declared in the period, which is typically paid on the first business day of the following month, is assumed to be reinvested at the ending market price. The actual reinvestment for the last dividend declared in the period may take place over several days, and in some instances may not be based on the market price, so the actual reinvestment price may be different from the price used in the calculation. Total returns are not annualized. |
| | Total Return Based on Common Share Net Asset Value is the combination of changes in Common share net asset value, reinvested dividend income at net asset value and reinvested capital gains distributions at net asset value, if any. The last dividend declared in the period, which is typically paid on the first business day of the following month, is assumed to be reinvested at the ending net asset value. The actual reinvest price for the last dividend declared in the period may often be based on the Fund’s market price (and not its net asset value), and therefore may be different from the price used in the calculation. Total returns are not annualized. |
| (c) | Ratios do not reflect the effect of dividend payments to Auction Rate Preferred shareholders; Net Investment Income ratios reflect income earned and expenses incurred on assets attributable to Auction Rate Preferred shares and/or MuniFund Term Preferred shares, where applicable. |
| (d) | After expense reimbursement from the Adviser, where applicable. Ratios do not reflect the effect of custodian fee credits earned on the Fund’s net cash on deposit with the custodian bank, where applicable. |
| (e) | The expense ratios reflect, among other things, payments to MuniFund Term Preferred shareholders and/or the interest expense deemed to have been paid by the Fund on the floating rate certificates issued by the special purpose trusts for the self-deposited inverse floaters held by the Fund, where applicable, both as described in Footnote 1 – General Information and Significant Accounting Policies, MuniFund Term Preferred Shares and Inverse Floating Rate Securities, respectively. |
| (f) | For the six months ended November 30, 2010. |
| * | Rounds to less than $.01 per share. |
| ** | Annualized. |
| ∆ | For the period January 21, 2010 (issuance date of shares) through May 31, 2010. |
| For the period March 23, 2010 (issuance date of shares) through May 31, 2010. |
| N/A | Fund does not have a contractual reimbursement with the Adviser. |
See accompanying notes to financial statements.
Nuveen Investments 75
| | | Financial |
| | | Highlights (Unaudited) (continued) |
Selected data for a Common share outstanding throughout each period:
| | | | | | Investment Operations | | Less Distributions | | | | | | | |
| | | Beginning Common Share Net Asset Value | | Net Investment Income | | Net Realized/ Unrealized Gain (Loss) | | Distributions from Net Investment Income to Auction Rate Preferred Share- holders | (a) | Distributions from Capital Gains to Auction Rate Preferred Share- holders | (a) | Total | | Net Investment Income to Common Share- holders | | Capital Gains to Common Share- holders | | Total | | Ending Common Share Net Asset Value | | Ending Market Value | |
| Insured Massachusetts Tax-Free Advantage (NGX) | | | | | | | | | | | | | | | | | | | | | | |
| Year Ended 5/31: | | | | | | | | | | | | | | | | | | | | | | | | | | | | | | | |
| 2011(f) | | $ | 14.71 | | $ | .33 | | $ | (.22 | ) | $ | — | | $ | — | | $ | .11 | | $ | (.38 | ) | $ | — | | $ | (.38 | ) | $ | 14.44 | | $ | 14.25 | |
| 2010 | | | 13.86 | | | .82 | | | .79 | | | (.03 | ) | | — | | | 1.58 | | | (.73 | ) | | — | | | (.73 | ) | | 14.71 | | | 15.79 | |
| 2009 | | | 14.28 | | | .91 | | | (.50 | ) | | (.17 | ) | | — | | | .24 | | | (.66 | ) | | — | | | (.66 | ) | | 13.86 | | | 13.15 | |
| 2008 | | | 14.50 | | | .90 | | | (.21 | ) | | (.26 | ) | | — | | | .43 | | | (.65 | ) | | — | | | (.65 | ) | | 14.28 | | | 14.14 | |
| 2007 | | | 14.39 | | | .90 | | | .08 | | | (.25 | ) | | — | | | .73 | | | (.62 | ) | | — | | | (.62 | ) | | 14.50 | | | 14.45 | |
| 2006 | | | 14.93 | | | .90 | | | (.53 | ) | | (.20 | ) | | — | | | .17 | | | (.71 | ) | | — | | | (.71 | ) | | 14.39 | | | 13.43 | |
| | | | | | | | | | | | | | | | | | | | | | | | | | | | | | | | | | | |
| Missouri Premium Income (NOM) | | | | | | | | | | | | | | | | | | | | | | | | | |
| Year Ended 5/31: | | | | | | | | | | | | | | | | | | | | | | | | | | | | | | | |
| 2011(f) | | | 13.55 | | | .44 | | | (.28 | ) | | (.01 | ) | | — | | | .15 | | | (.39 | ) | | — | | | (.39 | ) | | 13.31 | | | 16.01 | |
| 2010 | | | 12.44 | | | .83 | | | .99 | | | (.03 | ) | | — | | | 1.79 | | | (.68 | ) | | — | | | (.68 | ) | | 13.55 | | | 16.50 | |
| 2009 | | | 13.52 | | | .85 | | | (1.12 | ) | | (.16 | ) | | — | | | (.43 | ) | | (.65 | ) | | — | | | (.65 | ) | | 12.44 | | | 12.90 | |
| 2008 | | | 14.27 | | | .89 | | | (.62 | ) | | (.20 | ) | | (.04 | ) | | .03 | | | (.65 | ) | | (.13 | ) | | (.78 | ) | | 13.52 | | | 14.76 | |
| 2007 | | | 14.40 | | | .90 | | | (.08 | ) | | (.23 | ) | | — | * | | .59 | | | (.72 | ) | | — | * | | (.72 | ) | | 14.27 | | | 16.56 | |
| 2006 | | | 15.11 | | | .92 | | | (.51 | ) | | (.17 | ) | | (.01 | ) | | .23 | | | (.84 | ) | | (.10 | ) | | (.94 | ) | | 14.40 | | | 16.35 | |
| | | Auction Rate Preferred Shares at End of Period | | MuniFund Term Preferred Shares at End of Period | | Auction Rate Preferred Shares and MuniFund Term Preferred Shares at End of Period | |
| | | Aggregate Amount Outstanding (000) | | Liquidation Value Per Share | | Asset Coverage Per Share | | Aggregate Amount Outstanding (000) | | Liquidation Value Per Share | | Ending Market Value Per Share | | Average Market Value Per Share | | Asset Coverage Per Share | | Asset Coverage Per $1 Liquidation Preference | |
| Insured Massachusetts Tax-Free Advantage (NGX) | | | | | | | | | | | | | | | | | | | |
| Year Ended 5/31: | | | | | | | | | | | | | | | | | | | | | | | | | |
| 2011(f) | | $ | — | | $ | — | | $ | — | | $ | 22,075 | | $ | 10.00 | | $ | 10.08 | | $ | 10.10 | | $ | 27.84 | | $ | — | |
| 2010 | | | — | | | — | | | — | | | 22,075 | | | 10.00 | | | 10.00 | | | 9.98 | ∆ | | 28.16 | | | — | |
| 2009 | | | 20,500 | | | 25,000 | | | 71,042 | | | — | | | — | | | — | | | — | | | — | | | — | |
| 2008 | | | 20,500 | | | 25,000 | | | 72,407 | | | — | | | — | | | — | | | — | | | — | | | — | |
| 2007 | | | 20,500 | | | 25,000 | | | 73,120 | | | — | | | — | | | — | | | — | | | — | | | — | |
| 2006 | | | 20,500 | | | 25,000 | | | 72,779 | | | — | | | — | | | — | | | — | | | — | | | — | |
| | | | | | | | | | | | | | | | | | | | | | | | | | | | | |
| Missouri Premium Income (NOM) | | | | | | | | | | | | | | | | | | | | | | |
| Year Ended 5/31: | | | | | | | | | | | | | | | | | | | | | | | | | |
| 2011(f) | | | 16,000 | | | 25,000 | | | 47,754 | | | 17,880 | | | 10.00 | | | 9.95 | | | 9.98 | ∆∆ | | 19.10 | | | 1.91 | |
| 2010 | | | 16,000 | | | 25,000 | | | 73,981 | | | — | | | — | | | — | | | — | | | — | | | — | |
| 2009 | | | 16,000 | | | 25,000 | | | 69,897 | | | — | | | — | | | — | | | — | | | — | | | — | |
| 2008 | | | 16,000 | | | 25,000 | | | 73,703 | | | — | | | — | | | — | | | — | | | — | | | — | |
| 2007 | | | 16,000 | | | 25,000 | | | 76,291 | | | — | | | — | | | — | | | — | | | — | | | — | |
| 2006 | | | 16,000 | | | 25,000 | | | 76,460 | | | — | | | — | | | — | | | — | | | — | | | — | |
76 Nuveen Investments
| | | | | | Ratios/Supplemental Data | |
| Total Returns | | | | | Ratios to Average Net Assets Applicable to Common Shares Before Reimbursement(c) | | Ratios to Average Net Assets Applicable to Common Shares After Reimbursement(c)(d) | | | | |
Based on Market Value | (b) | Based on Common Share Net Asset Value | (b) | Ending Net Assets Applicable to Common Shares (000) | | Expenses Including Interest | (e) | Expenses Excluding Interest | | Net Investment Income | | Expenses Including Interest | (e) | Expenses Excluding Interest | | Net Investment Income | | Portfolio Turnover Rate | |
| | | | | | | | | | | | | | | | | | | | |
| | | | | | | | | | | | | | | | | | | | | | | | | | | | | |
| (7.47 | )% | | .68 | % | $ | 39,384 | | | 2.85 | %** | | 1.39 | %** | | 4.30 | %** | | 2.73 | %** | | 1.27 | %** | | 4.42 | %** | | 2 | % |
| 26.19 | | | 11.61 | | | 40,095 | | | 1.86 | | | 1.38 | | | 5.50 | | | 1.67 | | | 1.19 | | | 5.69 | | | 1 | |
| (2.11 | ) | | 2.00 | | | 37,754 | | | 1.47 | | | 1.38 | | | 6.47 | | | 1.16 | | | 1.06 | | | 6.78 | | | 0 | |
| 2.49 | | | 3.04 | | | 38,873 | | | 1.29 | | | 1.29 | | | 5.82 | | | .85 | | | .85 | | | 6.25 | | | 13 | |
| 12.49 | | | 5.12 | | | 39,458 | | | 1.28 | | | 1.28 | | | 5.67 | | | .79 | | | .79 | | | 6.15 | | | 6 | |
| (11.62 | ) | | 1.20 | | | 39,179 | | | 1.29 | | | 1.29 | | | 5.66 | | | .81 | | | .81 | | | 6.14 | | | 5 | |
| | | | | | | | | | | | | | | | | | | | | | | | | | | | | |
| | | | | | | | | | | | | | | | | | | | | | | | | | | | | |
| (.51 | ) | | 1.05 | | | 30,836 | | | 1.46 | ** | | 1.29 | ** | | 6.38 | ** | | N/A | | | N/A | | | N/A | | | 2 | |
| 34.31 | | | 14.69 | | | 31,348 | | | 1.37 | | | 1.34 | | | 6.37 | | | N/A | | | N/A | | | N/A | | | 7 | |
| (7.83 | ) | | (2.92 | ) | | 28,734 | | | 1.55 | | | 1.42 | | | 6.96 | | | N/A | | | N/A | | | N/A | | | 2 | |
| (5.74 | ) | | .26 | | | 31,170 | | | 1.52 | | | 1.31 | | | 6.43 | | | N/A | | | N/A | | | N/A | | | 5 | |
| 5.98 | | | 4.17 | | | 32,826 | | | 1.39 | | | 1.30 | | | 6.15 | | | N/A | | | N/A | | | N/A | | | 16 | |
| (3.53 | ) | | 1.57 | | | 32,934 | | | 1.29 | | | 1.29 | | | 6.20 | | | N/A | | | N/A | | | N/A | | | 9 | |
| (a) | The amounts shown are based on Common share equivalents. |
| (b) | Total Return Based on Market Value is the combination of changes in the market price per share and the effect of reinvested dividend income and reinvested capital gains distributions, if any, at the average price paid per share at the time of reinvestment. The last dividend declared in the period, which is typically paid on the first business day of the following month, is assumed to be reinvested at the ending market price. The actual reinvestment for the last dividend declared in the period may take place over several days, and in some instances may not be based on the market price, so the actual reinvestment price may be different from the price used in the calculation. Total returns are not annualized. |
| | Total Return Based on Common Share Net Asset Value is the combination of changes in Common share net asset value, reinvested dividend income at net asset value and reinvested capital gains distributions at net asset value, if any. The last dividend declared in the period, which is typically paid on the first business day of the following month, is assumed to be reinvested at the ending net asset value. The actual reinvest price for the last dividend declared in the period may often be based on the Fund’s market price (and not its net asset value), and therefore may be different from the price used in the calculation. Total returns are not annualized. |
| (c) | Ratios do not reflect the effect of dividend payments to Auction Rate Preferred shareholders; Net Investment Income ratios reflect income earned and expenses incurred on assets attributable to Auction Rate Preferred shares and/or MuniFund Term Preferred shares, where applicable. |
| (d) | After expense reimbursement from the Adviser, where applicable. Ratios do not reflect the effect of custodian fee credits earned on the Fund’s net cash on deposit with the custodian bank, where applicable. |
| (e) | The expense ratios reflect, among other things, payments to MuniFund Term Preferred shareholders and/or the interest expense deemed to have been paid by the Fund on the floating rate certificates issued by the special purpose trusts for the self-deposited inverse floaters held by the Fund, where applicable, both as described in Footnote 1 – General Information and Significant Accounting Policies, MuniFund Term Preferred Shares and Inverse Floating Rate Securities, respectively. |
| (f) | For the six months ended November 30, 2010. |
| * | Rounds to less than $.01 per share. |
| ** | Annualized. |
| ∆ | For the period February 9, 2010 (issuance date of shares) through May 31, 2010. |
| ∆∆ | For the period November 9, 2010 (issuance date of shares) through November 30, 2010. |
| N/A | Fund does not have a contractual reimbursement with the Adviser. |
See accompanying notes to financial statements.
Nuveen Investments 77
| | | Notes to |
| | | Financial Statements (Unaudited) |
1. General Information and Significant Accounting Policies
The state funds covered in this report and their corresponding Common share stock exchange symbols are Nuveen Connecticut Premium Income Municipal Fund (NTC), Nuveen Connecticut Dividend Advantage Municipal Fund (NFC), Nuveen Connecticut Dividend Advantage Municipal Fund 2 (NGK), Nuveen Connecticut Dividend Advantage Municipal Fund 3 (NGO), Nuveen Massachusetts Premium Income Municipal Fund (NMT), Nuveen Massachusetts Dividend Advantage Municipal Fund (NMB), Nuveen Insured Massachusetts Tax-Free Advantage Municipal Fund (NGX) and Nuveen Missouri Premium Income Municipal Fund (NOM) (collectively, the “Funds”). Common shares of Connecticut Premium Income (NTC) and Massachusetts Premium Income (NMT) are traded on the New York Stock Exchange (& #8220;NYSE”) while Common shares of Connecticut Dividend Advantage (NFC), Connecticut Dividend Advantage 2 (NGK), Connecticut Dividend Advantage 3 (NGO), Massachusetts Dividend Advantage (NMB), Insured Massachusetts Tax-Free Advantage (NGX) and Missouri Premium Income (NOM) are traded on the NYSE Amex. The Funds are registered under the Investment Company Act of 1940, as amended, as closed-end, registered investment companies.
Each Fund seeks to provide current income exempt from both regular federal and designated state income taxes, and in the case of Insured Massachusetts Tax-Free Advantage (NGX) the alternative minimum tax applicable to individuals, by investing primarily in a portfolio of municipal obligations issued by state and local government authorities within a single state or certain U.S. territories.
The following is a summary of significant accounting policies followed by the Funds in the preparation of their financial statements in accordance with U.S. generally accepted accounting principles (“U.S. GAAP”).
Investment Valuation
Prices of municipal bonds are provided by a pricing service approved by the Funds’ Board of Trustees. These securities are generally classified as Level 2. When price quotes are not readily available (which is usually the case for municipal bonds) the pricing service establishes a security’s fair value using methods that may include consideration of the following: yields or prices of investments of comparable quality, type of issue, coupon, maturity and rating, market quotes or indications of value from security dealers, evaluations of anticipated cash flows or collateral, general market conditions and other information and analysis, including the obligor’s credit characteristics considered relevant. In pricing certain securities, par ticularly less liquid and lower quality securities, the pricing service may consider information about a security, its issuer, or market activity, provided by Nuveen Asset Management (the “Adviser”), a wholly-owned subsidiary of Nuveen Investments, Inc. (“Nuveen”). These securities are generally classified as Level 2 or Level 3 depending on the priority of the significant inputs.
Temporary investments in securities that have variable rate and demand features qualifying them as short-term investments are valued at amortized cost, which approximates market value. These securities are generally classified as Level 1 or Level 2, which is usually the case for municipal bonds.
Certain securities may not be able to be priced by the pre-established pricing methods as described above. Such securities may be valued by the Funds’ Board of Trustees or its designee at fair value. These securities generally include, but are not limited to, restricted securities (securities which may not be publicly sold without registration under the Securities Act of 1933, as amended) for which a pricing service is unable to provide a market price; securities whose trading has been formally suspended; debt securities that have gone into default and for which there is no current market quotation; a security whose market price is not available from a pre-established pricing source; a security with respect to which an event has occurred that is likely to materially affect the value of the security after the market has closed but before the calculation of a Fund’s net asset value (as may be the case in non-U.S. markets on which the security is primarily traded) or make it difficult or impossible to obtain a reliable market quotation; and a security whose price, as provided by the pricing service, is not deemed to reflect the security’s fair value. As a general principle, the fair value of a security would appear to be the amount that the owner might reasonably expect to receive for it in a current sale. A variety of factors may be considered in determining the fair value of such securities, which may include consideration of the following: yields or prices of investments of comparable quality, type of issue, coupon, maturity and rating, market quotes or indications of value from security dealers, evaluations of anticipated cash flows or collateral, general market conditions and other information and analysis, including the obligor’ s credit characteristics considered relevant. These securities are generally classified as Level 2 or Level 3 depending on the priority of the significant inputs. Regardless of the method employed to value a particular security, all valuations are subject to review by the Funds’ Board of Trustees or its designee.
Refer to Footnote 2 – Fair Value Measurements for further details on the leveling of securities held by the Funds as of the end of the reporting period.
78 Nuveen Investments
Investment Transactions
Investment transactions are recorded on a trade date basis. Realized gains and losses from transactions are determined on the specific identification method. Investments purchased on a when-issued/delayed delivery basis may have extended settlement periods. Any investments so purchased are subject to market fluctuation during this period. The Funds have instructed the custodian to segregate assets with a current value at least equal to the amount of the when-issued/delayed delivery purchase commitments. At November 30, 2010, there were no such outstanding purchase commitments in any of the Funds.
Investment Income
Interest income, which reflects the amortization of premiums and includes accretion of discounts for financial reporting purposes, is recorded on an accrual basis. Investment income also reflects paydown gains and losses, if any.
Income Taxes
Each Fund is a separate taxpayer for federal income tax purposes. Each Fund intends to distribute substantially all of its net investment income and net capital gains to shareholders and to otherwise comply with the requirements of Subchapter M of the Internal Revenue Code applicable to regulated investment companies. Therefore, no federal income tax provision is required. Furthermore, each Fund intends to satisfy conditions that will enable interest from municipal securities, which is exempt from regular federal and designated state income taxes, and in the case of Insured Massachusetts Tax-Free Advantage (NGX) the alternative minimum tax applicable to individuals, to retain such tax-exempt status when distributed to shareholders of the Funds. Net rea lized capital gains and ordinary income distributions paid by the Funds are subject to federal taxation.
For all open tax years and all major taxing jurisdictions, management of the Funds has concluded that there are no significant uncertain tax positions that would require recognition in the financial statements. Open tax years are those that are open for examination by taxing authorities (i.e., generally the last four tax year ends and the interim tax period since then). Furthermore, management of the Funds is also not aware of any tax positions for which it is reasonably possible that the total amounts of unrecognized tax benefits will significantly change in the next twelve months.
Dividends and Distributions to Common Shareholders
Dividends from tax-exempt net investment income are declared monthly. Net realized capital gains and/or market discount from investment transactions, if any, are distributed to shareholders at least annually. Furthermore, capital gains are distributed only to the extent they exceed available capital loss carryforwards.
Distributions to Common shareholders of tax-exempt net investment income, net realized capital gains and/or market discount, if any, are recorded on the ex-dividend date. The amount and timing of distributions are determined in accordance with federal income tax regulations, which may differ from U.S. GAAP.
Auction Rate Preferred Shares
Each Fund is authorized to issue Auction Rate Preferred Shares (“ARPS”). The following Funds have issued and outstanding ARPS, $25,000 stated value per share, which approximates market value, as a means of effecting financial leverage. Each Fund’s ARPS are issued in one Series. The dividend rate paid by the Funds on each Series is determined every seven days, pursuant to a dutch auction process overseen by the auction agent, and is payable at the end of each rate period. As of November 30, 2010, the number of ARPS outstanding for each Fund is as follows:
| | | Connecticut Premium Income (NTC | ) | Massachusetts Premium Income (NMT | ) | Missouri Premium Income (NOM | ) |
| Number of shares: | | | | | | | | | | |
| Series TH | | | 629 | | | 576 | | | 640 | |
Beginning in February 2008, more shares for sale were submitted in the regularly scheduled auctions for the ARPS issued by the Funds than there were offers to buy. This meant that these auctions “failed to clear,’’ and that many ARPS shareholders who wanted to sell their shares in these auctions were unable to do so. ARPS shareholders unable to sell their shares received distributions at the “maximum rate’’ applicable to failed auctions as calculated in accordance with the pre-established terms of the ARPS. As of November 30, 2010, the aggregate amount of outstanding ARPS redeemed, including ARPS noticed for redemption at the end of the reporting period, by each Fund is as follows:
| | | Connecticut Premium Income (NTC | ) | Connecticut Dividend Advantage (NFC | ) | Connecticut Dividend Advantage 2 (NGK | ) | Connecticut Dividend Advantage 3 (NGO | ) |
| ARPS redeemed, at liquidation value | | $ | 22,575,000 | | $ | 19,500,000 | | $ | 17,500,000 | | $ | 32,000,000 | |
Nuveen Investments 79
| | | Notes to |
| | | Financial Statements (Unaudited) (continued) |
| | | Massachusetts Premium Income (NMT | ) | Massachusetts Dividend Advantage (NMB | ) | Insured Massachusetts Tax-Free Advantage (NGX | ) | Missouri Premium Income (NOM | ) |
| ARPS redeemed, at liquidation value | | $ | 19,600,000 | | $ | 15,000,000 | | $ | 20,500,000 | | $ | 16,000,000 | |
MuniFund Term Preferred Shares
The Funds have issued and outstanding MuniFund Term Preferred (“MTP”) Shares, with a $10 stated value per share. Proceeds from the issuance of MTP Shares, net of offering expenses, were used to redeem all, or a portion of, each Fund’s outstanding ARPS. Each Fund’s MTP Shares are issued in one Series. Dividends, which are recognized as interest expense for financial reporting purposes, are paid monthly at a fixed annual rate, subject to adjustments in certain circumstances. The MTP Shares trade on the NYSE. As of November 30, 2010, the number of MTP Shares outstanding, fixed annual rate and NYSE “ticker” symbol for each Fund are as follows:
| | | Connecticut Premium Income (NTC) | | Connecticut Dividend Advantage (NFC) | |
| | | Shares Outstanding | | Fixed Annual Rate | | NYSE Ticker | | Shares Outstanding | | Fixed Annual Rate | | NYSE Ticker | |
| Series 2015 | | | 1,830,000 | | | 2.65 | % | | NTC Pr C | | | 2,047,000 | | | 2.60 | % | | NFC Pr C | |
| | | Connecticut Dividend Advantage 2 (NGK) | | Connecticut Dividend Advantage 3 (NGO) | |
| | | Shares Outstanding | | Fixed Annual Rate | | NYSE Ticker | | Shares Outstanding | | Fixed Annual Rate | | NYSE Ticker | |
| Series 2015 | | | 1,695,000 | | | 2.60 | % | | NGK Pr C | | | 3,200,000 | | | 2.65 | % | | NGO Pr C | |
| | | Massachusetts Premium Income (NMT) | | Massachusetts Dividend Advantage (NMB) | |
| | | Shares Outstanding | | Fixed Annual Rate | | NYSE Ticker | | Shares Outstanding | | Fixed Annual Rate | | NYSE Ticker | |
| Series 2015 | | | 2,021,000 | | | 2.65 | % | | NMT Pr C | | | 1,472,500 | | | 2.60 | % | | NMB Pr C | |
| | | Insured Massachusetts Tax-Free Advantage (NGX) | | Missouri Premium Income (NOM) | |
| | | Shares Outstanding | | Fixed Annual Rate | | NYSE Ticker | | Shares Outstanding | | Fixed Annual Rate | | NYSE Ticker | |
| Series 2015 | | | 2,207,500 | | | 2.65 | % | | NGX Pr C | | | 1,788,000 | | | 2.10 | % | | NOM Pr C | |
Each Fund is obligated to redeem its MTP Shares by the date as specified in its offering document (“Term Redemption Date”), unless earlier redeemed or repurchased by the Fund. MTP Shares are subject to optional and mandatory redemption in certain circumstances. MTP Shares will be subject to redemption at the option of each Fund (“Optional Redemption Date”), subject to a payment of premium for one year following the Optional Redemption Date (“Premium Expiration Date”), and at par thereafter. MTP Shares also will be subject to redemption, at the option of each Fund, at par in the event of certain changes in the credit rating of the MTP Shares. Each Fund may be obligated to redeem certain of the MTP Shares if the Fund f ails to maintain certain asset coverage and leverage ratio requirements and such failures are not cured by the applicable cure date. The redemption price per share is equal to the sum of the liquidation value per share plus any accumulated but unpaid dividends. The Term Redemption Date, Optional Redemption Date and Premium Expiration Date for each Fund’s MTP Shares are as follows:
| | Connecticut Premium Income (NTC) Series 2015 | Connecticut Dividend Advantage (NFC) Series 2015 | Connecticut Dividend Advantage 2 (NGK) Series 2015 | Connecticut Dividend Advantage 3 (NGO) Series 2015 |
| Term Redemption Date | February 1, 2015 | April 1, 2015 | April 1, 2015 | March 1, 2015 |
| Optional Redemption Date | February 1, 2011 | April 1, 2011 | April 1, 2011 | March 1, 2011 |
| Premium Expiration Date | January 31, 2012 | March 31, 2012 | March 31, 2012 | February 29, 2012 |
80 Nuveen Investments
| | Massachusetts Premium Income (NMT) Series 2015 | | Massachusetts Dividend Advantage (NMB) Series 2015 | | Massachusetts Tax-Free Advantage (NGX) Series 2015 | | Insured Missouri Premium Income (NOM) Series 2015 | |
| Term Redemption Date | February 1, 2015 | | April 1, 2015 | | March 1, 2015 | | December 1, 2015 | |
| Optional Redemption Date | February 1, 2011 | | April 1, 2011 | | March 1, 2011 | | December 1, 2011 | |
| Premium Expiration Date | January 31, 2012 | | March 31, 2012 | | February 29, 2012 | | November 30, 2012 | |
The average liquidation value of MTP Shares outstanding for each Fund during the six months ended November 30, 2010, was as follows:
| | | Connecticut Premium Income (NTC | ) | Connecticut Dividend Advantage (NFC | ) | Connecticut Dividend Advantage 2 (NGK | ) | Connecticut Dividend Advantage 3 (NGO | ) |
| Average liquidation value of MTP Shares outstanding | | $ | 18,300,000 | | $ | 20,470,000 | | $ | 16,950,000 | | $ | 32,000,000 | |
| | | Massachusetts Premium Income (NMT | ) | Massachusetts Dividend Advantage (NMB | ) | Insured Massachusetts Tax-Free Advantage (NGX | ) | Missouri Premium Income (NOM | )* |
| Average liquidation value of MTP Shares outstanding | | $ | 20,210,000 | | $ | 14,725,000 | | $ | 22,075,000 | | $ | 17,289,091 | |
| * | For the period November 9, 2010 (issuance date of shares) through November 30, 2010. |
For financial reporting purposes only, the liquidation value of MTP Shares is recorded as a liability on the Statement of Assets and Liabilities. Unpaid dividends on MTP Shares are recognized as a component of “Interest payable” on the Statement of Assets and Liabilities. Dividends paid on MTP Shares are recognized as a component of “Interest expense and amortization of offering costs” on the Statement of Operations.
Net amounts earned by Nuveen as underwriter of each Fund’s MTP Share offering were recorded as reductions of offering costs recognized by the Funds. For the six months ended November 30, 2010, the net amounts earned by Nuveen for each Fund were as follows:
| | | Connecticut Premium Income (NTC | ) | Connecticut Dividend Advantage (NFC | ) | Connecticut Dividend Advantage 2 (NGK | ) | Connecticut Dividend Advantage 3 (NGO | ) |
| Net amounts earned by Nuveen | | $ | — | | $ | 797 | | $ | 1,200 | | $ | — | |
| | | Massachusetts Premium Income (NMT | ) | Massachusetts Dividend Advantage (NMB | ) | Insured Massachusetts Tax-Free Advantage (NGX | ) | Missouri Premium Income (NOM | ) |
| Net amounts earned by Nuveen | | $ | — | | $ | 279 | | $ | — | | $ | — | |
Insurance
Under normal circumstances, Insured Massachusetts Tax-Free Advantage (NGX) invests at least 80% of its managed assets (as defined in Footnote 7 –Management Fees and Other Transactions with Affiliates) in municipal securities that are covered by insurance guaranteeing the timely payment of principal and interest. In addition, the municipal securities in which Insured Massachusetts Tax-Free Advantage (NGX) invests will be investment grade at the time of purchase (including (i) bonds insured by investment grade insurers or are rated investment grade; (ii) unrated bonds that are judged to be investment grade by the Adviser; and (iii) escrowed bonds). Ratings below BBB by one or more national rating agencies are considered to be below investment grade .
Each insured municipal security is covered by Original Issue Insurance, Secondary Market Insurance or Portfolio Insurance. Assuming that the insurer remains credit worthy, the insurance feature of a municipal security guarantees the full payment of principal and interest when due through the life of an insured obligation. Such insurance does not guarantee the market value of the insured obligation or the value of the Fund’s Common shares. Original Issue Insurance and Secondary Market Insurance remain in effect as long as the municipal securities covered thereby remain outstanding and the insurer remains in business, regardless of whether the Fund ultimately disposes of such municipal securities. Consequently, the market value of the municipal sec urities covered by Original Issue Insurance or Secondary Market Insurance may reflect value attributable to the insurance. Portfolio Insurance, in contrast, is effective only while the municipal securities are held by the Fund, and is reflected as an expense over the term of the policy, when applicable. Accordingly, neither the prices used in determining the market value of the underlying municipal securities nor the Common share net asset value of the Fund include value, if any, attributable to the Portfolio Insurance. Each policy of the Portfolio Insurance does, however, give the Fund the right to obtain permanent insurance with respect to the municipal security covered by the Portfolio Insurance policy at the time of its sale.
Nuveen Investments 81
| | | Notes to |
| | | Financial Statements (Unaudited) (continued) |
Inverse Floating Rate Securities
Each Fund is authorized to invest in inverse floating rate securities. An inverse floating rate security is created by depositing a municipal bond, typically with a fixed interest rate, into a special purpose trust created by a broker-dealer. In turn, this trust (a) issues floating rate certificates, in face amounts equal to some fraction of the deposited bond’s par amount or market value, that typically pay short-term tax-exempt interest rates to third parties, and (b) issues to a long-term investor (such as one of the Funds) an inverse floating rate certificate (sometimes referred to as an “inverse floater”) that represents all remaining or residual interest in the trust. The income received by the inverse floater holder varies inve rsely with the short-term rate paid to the floating rate certificates’ holders, and in most circumstances the inverse floater holder bears substantially all of the underlying bond’s downside investment risk and also benefits disproportionately from any potential appreciation of the underlying bond’s value. The price of an inverse floating rate security will be more volatile than that of the underlying bond because the interest rate is dependent on not only the fixed coupon rate of the underlying bond but also on the short-term interest paid on the floating rate certificates, and because the inverse floating rate security essentially bears the risk of loss of the greater face value of the underlying bond.
A Fund may purchase an inverse floating rate security in a secondary market transaction without first owning the underlying bond (referred to as an “externally-deposited inverse floater”), or instead by first selling a fixed-rate bond to a broker-dealer for deposit into the special purpose trust and receiving in turn the residual interest in the trust (referred to as a “self-deposited inverse floater”). The inverse floater held by a Fund gives the Fund the right (a) to cause the holders of the floating rate certificates to tender their notes at par, and (b) to have the broker transfer the fixed-rate bond held by the trust to the Fund, thereby collapsing the trust. An investment in an externally-deposited inverse floater is ident ified in the Portfolio of Investments as “(IF) – Inverse floating rate investment.” An investment in a self-deposited inverse floater is accounted for as a financing transaction. In such instances, a fixed-rate bond deposited into a special purpose trust is identified in the Portfolio of Investments as “(UB) – Underlying bond of an inverse floating rate trust reflected as a financing transaction,” with the Fund accounting for the short-term floating rate certificates issued by the trust as “Floating rate obligations” on the Statement of Assets and Liabilities. In addition, the Fund reflects in “Investment Income” the entire earnings of the underlying bond and related interest paid to the holders of the short-term floating rate certificates as a component of “Interest expense and amortization of offering costs” on the Statement of Operations.
During the six months ended November 30, 2010, each Fund invested in externally-deposited inverse floaters and/or self-deposited inverse floaters.
Each Fund may also enter into shortfall and forbearance agreements (sometimes referred to as a “recourse trust” or “credit recovery swap”) (such agreements referred to herein as “Recourse Trusts”) with a broker-dealer by which a Fund agrees to reimburse the broker-dealer, in certain circumstances, for the difference between the liquidation value of the fixed-rate bond held by the trust and the liquidation value of the floating rate certificates issued by the trust plus any shortfalls in interest cash flows. Under these agreements, a Fund’s potential exposure to losses related to or on inverse floaters may increase beyond the value of a Fund’s inverse floater investments as a Fund may potentially be liable to fulfill all amounts owed to holders of the floating rate certificates. At period end, any such shortfall is recognized as “Unrealized depreciation on Recourse Trusts” on the Statement of Assets and Liabilities.
At November 30, 2010, the Funds were not invested in externally-deposited Recourse Trusts.
The average floating rate obligations outstanding and average annual interest rate and fees related to self-deposited inverse floaters during the six months ended November 30, 2010, were as follows:
| | | Connecticut Premium Income (NTC | ) | Connecticut Dividend Advantage (NFC | ) | Connecticut Dividend Advantage 2 (NGK | ) | Connecticut Dividend Advantage 3 (NGO | ) |
| Average floating rate obligations outstanding | | $ | 7,965,000 | | $ | 3,820,000 | | $ | 3,460,000 | | $ | 5,780,000 | |
| Average annual interest rate and fees | | | 0.78 | % | | 0.77 | % | | 0.77 | % | | 0.75 | % |
| | | Massachusetts Premium Income (NMT | ) | Massachusetts Dividend Advantage (NMB | ) | Insured Massachusetts Tax-Free Advantage (NGX | ) | Missouri Premium Income (NOM | ) |
| Average floating rate obligations outstanding | | $ | 2,450,000 | | $ | 1,050,000 | | $ | 1,500,000 | | $ | 2,225,000 | |
| Average annual interest rate and fees | | | 0.65 | % | | 0.65 | % | | 0.65 | % | | 0.46 | % |
Derivative Financial Instruments
Each Fund is authorized to invest in certain derivative instruments, including foreign currency forwards, futures, options and swap contracts. Although each Fund is authorized to invest in such derivative instruments, and may do so in the future, they did make any such investments during the six months ended November 30, 2010.
82 Nuveen Investments
Market and Counterparty Credit Risk
In the normal course of business each Fund may invest in financial instruments and enter into financial transactions where risk of potential loss exists due to changes in the market (market risk) or failure of the other party to the transaction to perform (counterparty credit risk). The potential loss could exceed the value of the financial assets recorded on the financial statements. Financial assets, which potentially expose each Fund to counterparty credit risk, consist principally of cash due from counterparties on forward, option and swap transactions, when applicable. The extent of each Fund’s exposure to counterparty credit risk in respect to these financial assets approximates their carrying value as recorded on the Statement of Assets an d Liabilities. Futures contracts, when applicable, expose a Fund to minimal counterparty credit risk as they are exchange traded and the exchange’s clearinghouse, which is counterparty to all exchange traded futures, guarantees the futures contracts against default.
Each Fund helps manage counterparty credit risk by entering into agreements only with counterparties the Adviser believes have the financial resources to honor their obligations and by having the Adviser monitor the financial stability of the counterparties. Additionally, counterparties may be required to pledge collateral daily (based on the daily valuation of the financial asset) on behalf of each Fund with a value approximately equal to the amount of any unrealized gain above a pre-determined threshold. Reciprocally, when each Fund has an unrealized loss, the Funds have instructed the custodian to pledge assets of the Funds as collateral with a value approximately equal to the amount of the unrealized loss above a pre-determined threshold. Collatera l pledges are monitored and subsequently adjusted if and when the valuations fluctuate, either up or down, by at least the predetermined threshold amount.
Zero Coupon Securities
Each Fund is authorized to invest in zero coupon securities. A zero coupon security does not pay a regular interest coupon to its holders during the life of the security. Tax-exempt income to the holder of the security comes from accretion of the difference between the original purchase price of the security at issuance and the par value of the security at maturity and is effectively paid at maturity. The market prices of zero coupon securities generally are more volatile than the market prices of securities that pay interest periodically.
Offering Costs
Costs incurred by the Funds in connection with their offerings of MTP Shares were recorded as a deferred charge, which will be amortized over the 5-year life of the shares. Each Fund’s amortized deferred charges are recognized as a component of “Interest expense and amortization of offering costs” on the Statement of Operations. Each Fund’s offering costs incurred were as follows:
| | | Connecticut Premium Income (NTC | ) | Connecticut Dividend Advantage (NFC | ) | Connecticut Dividend Advantage 2 (NGK | ) | Connecticut Dividend Advantage 3 (NGO | ) |
| MTP Shares offering costs | | $ | 553,838 | | $ | 565,076 | | $ | 504,250 | | $ | 750,000 | |
| | | Massachusetts Premium Income (NMT | ) | Massachusetts Dividend Advantage (NMB | ) | Insured Massachusetts Tax-Free Advantage (NGX | ) | Missouri Premium Income (NOM | ) |
| MTP Shares offering costs | | $ | 581,955 | | $ | 465,875 | | $ | 569,951 | | $ | 598,200 | |
Custodian Fee Credit
Each Fund has an arrangement with the custodian bank whereby certain custodian fees and expenses are reduced by net credits earned on each Fund’s cash on deposit with the bank. Such deposit arrangements are an alternative to overnight investments. Credits for cash balances may be offset by charges for any days on which a Fund overdraws its account at the custodian bank.
Indemnifications
Under the Funds’ organizational documents, their officers and trustees are indemnified against certain liabilities arising out of the performance of their duties to the Funds. In addition, in the normal course of business, the Funds enter into contracts that provide general indemnifications to other parties. The Funds’ maximum exposure under these arrangements is unknown as this would involve future claims that may be made against the Funds that have not yet occurred. However, the Funds have not had prior claims or losses pursuant to these contracts and expect the risk of loss to be remote.
Use of Estimates
The preparation of financial statements in conformity with U.S. GAAP requires management to make estimates and assumptions that affect the reported amounts of assets and liabilities at the date of the financial statements and the reported amounts of increases and decreases in net assets applicable to Common shares from operations during the reporting period. Actual results may differ from those estimates.
Nuveen Investments 83
| | | Notes to |
| | | Financial Statements (Unaudited) (continued) |
2. Fair Value Measurements
In determining the fair value of each Fund’s investments, various inputs are used. These inputs are summarized in the three broad levels listed below:
| | Level 1 – | Quoted prices in active markets for identical securities. |
| | Level 2 – | Other significant observable inputs (including quoted prices for similar securities, interest rates, prepayment speeds, credit risk, etc.). |
| | Level 3 – | Significant unobservable inputs (including management’s assumptions in determining the fair value of investments). |
The inputs or methodologies used for valuing securities are not an indication of the risk associated with investing in those securities. The following is a summary of each Fund’s fair value measurements as of November 30, 2010:
| | | | | | | | | | | | | | |
| Connecticut Premium Income (NTC) | | | Level 1 | | | Level 2 | | | Level 3 | | | Total | |
| Investments: | | | | | | | | | | | | | |
| Municipal Bonds | | $ | — | | $ | 115,716,532 | | $ | — | | $ | 115,716,532 | |
| Connecticut Dividend Advantage (NFC) | | | Level 1 | | | Level 2 | | | Level 3 | | | Total | |
| Investments: | | | | | | | | | | | | | |
| Municipal Bonds | | $ | — | | $ | 60,470,194 | | $ | — | | $ | 60,470,194 | |
| Connecticut Dividend Advantage 2 (NGK) | | | Level 1 | | | Level 2 | | | Level 3 | | | Total | |
| Investments: | | | | | | | | | | | | | |
| Municipal Bonds | | $ | — | | $ | 52,742,868 | | $ | — | | $ | 52,742,868 | |
| Connecticut Dividend Advantage 3 (NGO) | | | Level 1 | | | Level 2 | | | Level 3 | | | Total | |
| Investments: | | | | | | | | | | | | | |
| Municipal Bonds | | $ | — | | $ | 97,099,776 | | $ | — | | $ | 97,099,776 | |
| Massachusetts Premium Income (NMT) | | | Level 1 | | | Level 2 | | | Level 3 | | | Total | |
| Investments: | | | | | | | | | | | | | |
| Municipal Bonds | | $ | — | | $ | 103,904,217 | | $ | — | | $ | 103,904,217 | |
| Massachusetts Dividend Advantage (NMB) | | | Level 1 | | | Level 2 | | | Level 3 | | | Total | |
| Investments: | | | | | | | | | | | | | |
| Municipal Bonds | | $ | — | | $ | 42,341,307 | | $ | — | | $ | 42,341,307 | |
| Insured Massachusetts Tax-Free Advantage (NGX) | | | Level 1 | | | Level 2 | | | Level 3 | | | Total | |
| Investments: | | | | | | | | | | | | | |
| Municipal Bonds | | $ | — | | $ | 61,616,231 | | $ | — | | $ | 61,616,231 | |
| Missouri Premium Income (NOM) | | | Level 1 | | | Level 2 | | | Level 3 | | | Total | |
| Investments: | | | | | | | | | | | | | |
| Municipal Bonds | | $ | — | | $ | 47,859,700 | | $ | — | | $ | 47,859,700 | |
The following is a reconciliation of the following Funds’ Level 3 investments held at the beginning and end of the measurement period:
| | | Massachusetts Premium Income (NMT) Level 3 Municipal Bonds | | Massachusetts Dividend Advantage (NMB) Level 3 Municipal Bonds | |
| Balance at the beginning of period | | $ | 344,410 | | $ | 688,820 | |
| Gains (losses): | | | | | | | |
| Net realized gains (losses) | | | (74,766 | ) | | (149,533 | ) |
| Net change in unrealized appreciation (depreciation) | | | 155,590 | | | 311,180 | |
| Net purchases at cost (sales at proceeds) | | | (425,234 | ) | | (850,467 | ) |
| Net discounts (premiums) | | | — | | | — | |
| Net transfers in to (out of) at end of period fair value | | | — | | | — | |
| Balance at the end of period | | $ | — | | $ | — | |
84 Nuveen Investments
3. Derivative Instruments and Hedging Activities
The Funds record derivative instruments at fair value, with changes in fair value recognized on the Statement of Operations, when applicable. Even though the Funds’ investments in derivatives may represent economic hedges, they are not considered to be hedge transactions for financial reporting purposes. The Funds did not invest in derivative instruments during the six months ended November 30, 2010.
4. Fund Shares
Common Shares
Since the inception of the Funds’ repurchase program, the Funds have not repurchased any of their outstanding Common shares.
Transactions in Common shares were as follows:
| | | Connecticut Premium Income (NTC) | | Connecticut Dividend Advantage (NFC) | | Connecticut Dividend Advantage 2 (NGK) | |
| | | Six Months Ended 11/30/10 | | Year Ended 5/31/10 | | Six Months Ended 11/30/10 | | Year Ended 5/31/10 | | Six Months Ended 11/30/10 | | Year Ended 5/31/10 | |
| Common shares issued to shareholders due to reinvestment of distributions | | | — | | | 1,053 | | | 1,764 | | | 3,615 | | | 1,073 | | | 2,074 | |
| | | Connecticut Dividend Advantage 3 (NGO) | | Massachusetts Premium Income (NMT) | | Massachusetts Dividend Advantage (NMB) | |
| | | Six Months Ended 11/30/10 | | Year Ended 5/31/10 | | Six Months Ended 11/30/10 | | Year Ended 5/31/10 | | Six Months Ended 11/30/10 | | Year Ended 5/31/10 | |
| Common shares issued to shareholders due to reinvestment of distributions | | | — | | | 1,261 | | | 5,885 | | | 3,206 | | | 1,252 | | | 2,198 | |
| | | Insured Massachusetts Tax-Free Advantage (NGX) | | Missouri Premium Income (NOM) | |
| | | Six Months Ended 11/30/10 | | Year Ended 5/31/10 | | Six Months Ended 11/30/10 | | Year Ended 5/31/10 | |
| Common shares issued to shareholders due to reinvestment of distributions | | | 977 | | | 1,696 | | | 2,174 | | | 4,352 | |
Preferred Shares
Transactions in ARPS were as follows:
| | | Connecticut Premium Income (NTC) | | Connecticut Dividend Advantage (NFC) | |
| | | Six Months Ended 11/30/10 | | Year Ended 5/31/10 | | Six Months Ended 11/30/10 | | Year Ended 5/31/10 | |
| | | Shares | | Amount | | Shares | | Amount | | Shares | | Amount | | Shares | | Amount | |
| ARPS redeemed and/or noticed for redemption: | | | | | | | | | | | | | | | | | | | | | | | | | |
| Series T | | | — | | $ | — | | | — | | $ | — | | | — | | $ | — | | | 609 | | $ | 17,250,000 | |
| Series TH | | | — | | | — | | | 709 | | | 17,725,000 | | | — | | | — | | | — | | | — | |
| Total | | | — | | $ | — | | | 709 | | $ | 17,725,000 | | | — | | $ | — | | | 609 | | $ | 17,250,000 | |
| | | Connecticut Dividend Advantage 2 (NGK) | | Connecticut Dividend Advantage 3 (NGO) | |
| | | Six Months Ended 11/30/10 | | Year Ended 5/31/10 | | Six Months Ended 11/30/10 | | Year Ended 5/31/10 | |
| | | Shares | | Amount | | Shares | | Amount | | Shares | | Amount | | Shares | | Amount | |
| ARPS redeemed and/or noticed for redemption: | | | | | | | | | | | | | | | | | | | | | | | | | |
| Series W | | | — | | $ | — | | | 618 | | $ | 15,450,000 | | | — | | $ | — | | | — | | $ | — | |
| Series F | | | — | | | — | | | — | | | — | | | — | | | — | | | 1,131 | | | 28,275,000 | |
| Total | | | — | | $ | — | | | 618 | | $ | 15,450,000 | | | — | | $ | — | | | 1,131 | | $ | 28,275,000 | |
Nuveen Investments 85
| | | Notes to |
| | | Financial Statements (Unaudited) (continued) |
| | | Massachusetts Premium Income (NMT) | | Massachusetts Dividend Advantage (NMB) | |
| | | Six Months Ended 11/30/10 | | Year Ended 5/31/10 | | Six Months Ended 11/30/10 | | Year Ended 5/31/10 | |
| | | Shares | | Amount | | Shares | | Amount | | Shares | | Amount | | Shares | | Amount | |
| ARPS redeemed and/or noticed for redemption: | | | | | | | | | | | | | | | | | | | | | | | | | |
| Series T | | | — | | $ | — | | | — | | $ | — | | | — | | $ | — | | | 570 | | $ | 14,250,000 | |
| Series TH | | | — | | | — | | | 784 | | | 19,600,000 | | | — | | | — | | | — | | | — | |
| Total | | | — | | $ | — | | | 784 | | $ | 19,600,000 | | | — | | $ | — | | | 570 | | $ | 14,250,000 | |
| | | Insured Massachusetts Tax-Free Advantage (NGX) | | Missouri Premium Income (NOM) | |
| | | Six Months Ended 11/30/10 | | Year Ended 5/31/10 | | Six Months Ended 11/30/10 | | Year Ended 5/31/10 | |
| | | Shares | | Amount | | Shares | | Amount | | Shares | | Amount | | Shares | | Amount | |
| ARPS redeemed and/or noticed for redemption: | | | | | | | | | | | | | | | | | | | | | | | | | |
| Series W | | | — | | $ | — | | | 820 | | $ | 20,500,000 | | | — | | $ | — | | | — | | $ | — | |
| Series TH | | | — | | | — | | | — | | | — | | | 640 | | | 16,000,000 | | | — | | | — | |
| Total | | | — | | $ | — | | | 820 | | $ | 20,500,000 | | | 640 | | $ | 16,000,000 | | | — | | $ | — | |
Transactions in MTP Shares were as follows:
| | | Connecticut Premium Income (NTC) | | Connecticut Dividend Advantage (NFC) | |
| | | Six Months Ended 11/30/10 | | Year Ended 5/31/10 | | Six Months Ended 11/30/10 | | Year Ended 5/31/10 | |
| | | Shares | | Amount | | Shares | | Amount | | Shares | | Amount | | Shares | | Amount | |
| MTP Shares issued: | | | | | | | | | | | | | | | | | | | | | | | | | |
| Series 2015 | | | — | | $ | — | | | 1,830,000 | | $ | 18,300,000 | | | — | | $ | — | | | 2,047,000 | | $ | 20,470,000 | |
| | | Connecticut Dividend Advantage 2 (NGK) | | Connecticut Dividend Advantage 3 (NGO) | |
| | | Six Months Ended 11/30/10 | | Year Ended 5/31/10 | | Six Months Ended 11/30/10 | | Year Ended 5/31/10 | |
| | | Shares | | Amount | | Shares | | Amount | | Shares | | Amount | | Shares | | Amount | |
| MTP Shares issued: | | | | | | | | | | | | | | | | | | | | | | | | | |
| Series 2015 | | | — | | $ | — | | | 1,695,000 | | $ | 16,950,000 | | | — | | $ | — | | | 3,200,000 | | $ | 32,000,000 | |
| | | Massachusetts Premium Income (NMT) | | Massachusetts Dividend Advantage (NMB) | |
| | | Six Months Ended 11/30/10 | | Year Ended 5/31/10 | | Six Months Ended 11/30/10 | | Year Ended 5/31/10 | |
| | | Shares | | Amount | | Shares | | Amount | | Shares | | Amount | | Shares | | Amount | |
| MTP Shares issued: | | | | | | | | | | | | | | | | | | | | | | | | | |
| Series 2015 | | | — | | $ | — | | | 2,021,000 | | $ | 20,210,000 | | | — | | $ | — | | | 1,472,500 | | $ | 14,725,000 | |
| | | Insured Massachusetts Tax-Free Advantage (NGX) | | Missouri Premium Income (NOM) | |
| | | Six Months Ended 11/30/10 | | Year Ended 5/31/10 | | Six Months Ended 11/30/10 | | Year Ended 5/31/10 | |
| | | Shares | | Amount | | Shares | | Amount | | Shares | | Amount | | Shares | | Amount | |
| MTP Shares issued: | | | | | | | | | | | | | | | | | | | | | | | | | |
| Series 2015 | | | — | | $ | — | | | 2,207,500 | | $ | 22,075,000 | | | 1,788,000 | | $ | 17,880,000 | | | — | | $ | — | |
86 Nuveen Investments
5. Investment Transactions
Purchases and sales (including maturities but excluding short-term investments) during the six months ended November 30, 2010, were as follows:
| | | Connecticut Premium Income (NTC | ) | Connecticut Dividend Advantage (NFC | ) | Connecticut Dividend Advantage 2 (NGK | ) | Connecticut Dividend Advantage 3 (NGO | ) |
| Purchases | | $ | 5,530,475 | | $ | 2,554,295 | | $ | 2,817,932 | | $ | 5,086,838 | |
| Sales and maturities | | | 6,850,500 | | | 3,023,500 | | | 4,206,600 | | | 6,342,500 | |
| | | Massachusetts Premium Income (NMT | ) | Massachusetts Dividend Advantage (NMB | ) | Insured Massachusetts Tax-Free Advantage (NGX | ) | Missouri Premium Income (NOM | ) |
| Purchases | | $ | 1,493,095 | | $ | 917,227 | | $ | 1,944,263 | | $ | 1,018,131 | |
| Sales and maturities | | | 640,234 | | | 1,080,467 | | | 1,520,000 | | | 1,657,138 | |
6. Income Tax Information
The following information is presented on an income tax basis. Differences between amounts for financial statement and federal income tax purposes are primarily due to timing differences in recognizing taxable market discount, timing differences in recognizing certain gains and losses on investment transactions and the treatment of investments in inverse floating rate securities reflected as financing transactions, if any. To the extent that differences arise that are permanent in nature, such amounts are reclassified within the capital accounts as detailed below. Temporary differences do not require reclassification. Temporary and permanent differences do not impact the net asset values of the Funds.
At November 30, 2010, the cost and unrealized appreciation (depreciation) of investments, as determined on a federal income tax basis, were as follows:
| | | Connecticut Premium Income (NTC | ) | Connecticut Dividend Advantage (NFC | ) | Connecticut Dividend Advantage 2 (NGK | ) | Connecticut Dividend Advantage 3 (NGO | ) |
| Cost of investments | | $ | 106,296,933 | | $ | 55,915,139 | | $ | 48,226,412 | | $ | 90,806,930 | |
| Gross unrealized: | | | | | | | | | | | | | |
| Appreciation | | $ | 3,061,152 | | $ | 1,521,503 | | $ | 1,745,865 | | $ | 2,366,329 | |
| Depreciation | | | (1,605,136 | ) | | (786,729 | ) | | (689,509 | ) | | (1,852,495 | ) |
| Net unrealized appreciation (depreciation) of investments | | $ | 1,456,016 | | $ | 734,774 | | $ | 1,056,356 | | $ | 513,834 | |
| | | Massachusetts Premium Income (NMT | ) | Massachusetts Dividend Advantage (NMB | ) | Insured Massachusetts Tax-Free Advantage (NGX | ) | Missouri Premium Income (NOM | ) |
| Cost of investments | | $ | 100,504,259 | | $ | 41,543,090 | | $ | 58,655,079 | | $ | 46,064,873 | |
| Gross unrealized: | | | | | | | | | | | | | |
| Appreciation | | $ | 3,423,037 | | $ | 867,165 | | $ | 2,032,933 | | $ | 999,214 | |
| Depreciation | | | (2,473,079 | ) | | (1,118,948 | ) | | (571,781 | ) | | (1,428,821 | ) |
| Net unrealized appreciation (depreciation) of investments | | $ | 949,958 | | $ | (251,783 | ) | $ | 1,461,152 | | $ | (429,607 | ) |
Permanent differences, primarily due to federal taxes paid, taxable market discount and distribution character reclassifications, resulted in reclassifications among the Funds’ components of Common share net assets at May 31, 2010, the Funds’ last tax year end, as follows:
| | | Connecticut Premium Income (NTC | ) | Connecticut Dividend Advantage (NFC | ) | Connecticut Dividend Advantage 2 (NGK | ) | Connecticut Dividend Advantage 3 (NGO | ) |
| Paid-in surplus | | $ | (39,747 | ) | $ | (16,159 | ) | $ | (17,103 | ) | $ | (45,073 | ) |
| Undistributed (Over-distribution of) net investment income | | | 38,377 | | | 15,614 | | | 17,103 | | | 45,063 | |
| Accumulated net realized gain (loss) | | | 1,370 | | | 545 | | | — | | | 10 | |
Nuveen Investments 87
| | | Notes to |
| | | Financial Statements (Unaudited) (continued) |
| | | Massachusetts Premium Income (NMT | ) | Massachusetts Dividend Advantage (NMB | ) | Insured Massachusetts Tax-Free Advantage (NGX | ) | Missouri Premium Income (NOM | ) |
| Paid-in surplus | | $ | (41,587 | ) | $ | (18,004 | ) | $ | (34,342 | ) | $ | — | |
| Undistributed (Over-distribution of) net investment income | | | 41,563 | | | 17,660 | | | 34,342 | | | (5 | ) |
| Accumulated net realized gain (loss) | | | 24 | | | 344 | | | — | | | 5 | |
The tax components of undistributed net tax-exempt income, net ordinary income and net long-term capital gains at May 31, 2010, the Funds’ last tax year end, were as follows:
| | | Connecticut Premium Income (NTC | ) | Connecticut Dividend Advantage (NFC | ) | Connecticut Dividend Advantage 2 (NGK | ) | Connecticut Dividend Advantage 3 (NGO | ) |
| Undistributed net tax-exempt income* | | $ | 1,288,968 | | $ | 617,741 | | $ | 559,855 | | $ | 799,489 | |
| Undistributed net ordinary income ** | | | 2,399 | | | 6,433 | | | — | | | — | |
| Undistributed net long-term capital gains | | | 50,047 | | | 9,165 | | | 1,210 | | | — | |
| | | Massachusetts Premium Income (NMT | ) | Massachusetts Dividend Advantage (NMB | ) | Insured Massachusetts Tax-Free Advantage (NGX | ) | Missouri Premium Income (NOM | ) |
| Undistributed net tax-exempt income* | | $ | 1,175,615 | | $ | 469,338 | | $ | 559,768 | | $ | 553,717 | |
| Undistributed net ordinary income ** | | | 1,005 | | | 16,872 | | | 1,015 | | | — | |
| Undistributed net long-term capital gains | | | 188,326 | | | 49,847 | | | — | | | — | |
| * | Undistributed net tax-exempt income (on a tax basis) has not been reduced for the dividend declared May 3, 2010, paid on June 1, 2010. |
| ** | Net ordinary income consists of taxable market discount income and net short-term capital gains, if any. |
The tax character of distributions paid during the Funds’ last tax year ended May 31, 2010, was designated for purposes of the dividends paid deduction as follows:
| | | Connecticut Premium Income (NTC | ) | Connecticut Dividend Advantage (NFC | ) | Connecticut Dividend Advantage 2 (NGK | ) | Connecticut Dividend Advantage 3 (NGO | ) |
| Distributions from net tax-exempt income | | $ | 3,919,054 | | $ | 1,989,927 | | $ | 1,832,795 | | $ | 3,217,850 | |
| Distributions from net ordinary income ** | | | — | | | — | | | — | | | — | |
| Distributions from net long-term capital gains | | | 27,148 | | | — | | | — | | | — | |
| | | Massachusetts Premium Income (NMT | ) | Massachusetts Dividend Advantage (NMB | ) | Insured Massachusetts Tax-Free Advantage (NGX | ) | Missouri Premium Income (NOM | ) |
| Distributions from net tax-exempt income | | $ | 3,896,180 | | $ | 1,576,968 | | $ | 2,164,823 | | $ | 1,628,139 | |
| Distributions from net ordinary income ** | | | — | | | 69,207 | | | — | | | — | |
| Distributions from net long-term capital gains | | | — | | | — | | | — | | | — | |
| ** | Net ordinary income consists of taxable market discount income and net short-term capital gains, if any. |
88 Nuveen Investments
At May 31, 2010, the Funds’ last tax year end, the following Funds had unused capital loss carryforwards available for federal income tax purposes to be applied against future capital gains, if any. If not applied, the carryforwards will expire as follows:
| | | Connecticut Dividend Advantage 3 (NGO | ) | Insured Massachusetts Tax-Free Advantage (NGX | ) | Missouri Premium Income (NOM | ) |
| Expiration: | | | | | | | | | | |
| May 31, 2013 | | $ | 35,642 | | $ | 18,655 | | $ | — | |
| May 31, 2014 | | | 111,331 | | | 427,135 | | | — | |
| May 31, 2015 | | | 211,213 | | | — | | | — | |
| May 31, 2017 | | | 43,691 | | | 215,629 | | | 260,982 | |
| May 31, 2018 | | | 13,130 | | | 24,486 | | | 91,539 | |
| Total | | $ | 415,007 | | $ | 685,905 | | $ | 352,521 | |
During the last tax year ended May 31, 2010, Connecticut Dividend Advantage (NFC) and Connecticut Dividend Advantage 2 (NGK) utilized $1,980 and $443, respectively, of their capital loss carryforwards.
The following Fund elected to defer net realized losses from investments incurred from November 1, 2009 through May 31, 2010, the Fund’s last tax year end, (“post-October losses”) in accordance with federal income tax regulations. Post-October losses are treated as having arisen on the first day of the current fiscal year:
| | | Insured Massachusetts Tax-Free Advantage (NGX | ) |
| Post-October capital losses | | $ | 18,813 | |
7. Management Fees and Other Transactions with Affiliates
Each Fund’s management fee is separated into two components – a fund-level fee, based only on the amount of assets within each individual Fund, and a complex-level fee, based on the aggregate amount of all fund assets managed by the Adviser. This pricing structure enables each Fund’s shareholders to benefit from growth in the assets within their respective Fund as well as from growth in the amount of complex-wide assets managed by the Adviser.
The annual fund-level fee for each Fund, payable monthly, is calculated according to the following schedule:
| Average Daily Managed Assets* | Connecticut Premium Income (NTC) Massachusetts Premium Income (NMT) Missouri Premium Income (NOM) Fund-Level Fee Rate |
| For the first $125 million | .4500 | % |
| For the next $125 million | .4375 | |
| For the next $250 million | .4250 | |
| For the next $500 million | .4125 | |
| For the next $1 billion | .4000 | |
| For the next $3 billion | .3875 | |
| For managed assets over $5 billion | .3750 | |
| Average Daily Managed Assets* | Connecticut Dividend Advantage (NFC) Connecticut Dividend Advantage 2 (NGK) Connecticut Dividend Advantage 3 (NGO) Massachusetts Dividend Advantage (NMB) Insured Massachusetts Tax-Free Advantage (NGX) Fund-Level Fee Rate |
| For the first $125 million | .4500 | % |
| For the next $125 million | .4375 | |
| For the next $250 million | .4250 | |
| For the next $500 million | .4125 | |
| For the next $1 billion | .4000 | |
| For managed assets over $2 billion | .3750 | |
Nuveen Investments 89
| | | Notes to |
| | | Financial Statements (Unaudited) (continued) |
The annual complex-level fee for each Fund, payable monthly, is calculated according to the following schedule:
| Complex-Level Managed Asset Breakpoint Level* | Effective Rate at Breakpoint Level |
| $55 billion | .2000 | % |
| $56 billion | .1996 | |
| $57 billion | .1989 | |
| $60 billion | .1961 | |
| $63 billion | .1931 | |
| $66 billion | .1900 | |
| $71 billion | .1851 | |
| $76 billion | .1806 | |
| $80 billion | .1773 | |
| $91 billion | .1691 | |
| $125 billion | .1599 | |
| $200 billion | .1505 | |
| $250 billion | .1469 | |
| $300 billion | .1445 | |
| * | For the fund-level and complex-level fees, managed assets include closed-end fund assets managed by the Adviser that are attributable to financial leverage. For these purposes, financial leverage includes the funds’ use of preferred stock and borrowings and certain investments in the residual interest certificates (also called inverse floating rate securities) in tender option bond (TOB) trusts, including the portion of assets held by a TOB trust that has been effectively financed by the trust’s issuance of floating rate securities, subject to an agreement by the Adviser as to certain funds to limit the amount of such assets for determining managed assets in certain circumstances. The complex-level fee is calculated based upon the aggregate daily managed assets of all Nuveen funds, with such daily managed assets defined separately for e ach fund in its management agreement, but excluding assets attributable to investments in other Nuveen funds. As of November 30, 2010, the complex-level fee rate was .1824%. |
The management fee compensates the Adviser for overall investment advisory and administrative services and general office facilities. The Funds pay no compensation directly to those of its trustees who are affiliated with the Adviser or to its officers, all of whom receive remuneration for their services to the Funds from the Adviser or its affiliates. The Board of Trustees has adopted a deferred compensation plan for independent trustees that enables trustees to elect to defer receipt of all or a portion of the annual compensation they are entitled to receive from certain Nuveen advised funds. Under the plan, deferred amounts are treated as though equal dollar amounts had been invested in shares of select Nuveen advised funds.
For the first ten years of Connecticut Dividend Advantage’s (NFC) and Massachusetts Dividend Advantage’s (NMB) operations, the Adviser has agreed to reimburse the Funds, as a percentage of average daily managed assets, for fees and expenses in the amounts and for the time periods set forth below:
| Year Ending January 31, | | Year Ending January 31, | |
| 2001* | .30% | 2007 | .25 | % |
| 2002 | .30 | 2008 | .20 | |
| 2003 | .30 | 2009 | .15 | |
| 2004 | .30 | 2010 | .10 | |
| 2005 | .30 | 2011 | .05 | |
| 2006 | .30 | | | |
| * | From the commencement of operations. |
The Adviser has not agreed to reimburse Connecticut Dividend Advantage (NFC) and Massachusetts Dividend Advantage (NMB) for any portion of their fees and expenses beyond January 31, 2011.
For the first ten years of Connecticut Dividend Advantage 2’s (NGK) operations, the Adviser has agreed to reimburse the Fund, as a percentage of average daily managed assets, for fees and expenses in the amounts and for the time periods set forth below:
| Year Ending March 31, | | Year Ending March 31, | |
| 2002* | .30% | 2008 | .25 | % |
| 2003 | .30 | 2009 | .20 | |
| 2004 | .30 | 2010 | .15 | |
| 2005 | .30 | 2011 | .10 | |
| 2006 | .30 | 2012 | .05 | |
| 2007 | .30 | | | |
| * | From the commencement of operations. |
The Adviser has not agreed to reimburse Connecticut Dividend Advantage 2 (NGK) for any portion of its fees and expenses beyond March 31, 2012.
90 Nuveen Investments
For the first eight years of Connecticut Dividend Advantage 3’s (NGO) operations, the Adviser has agreed to reimburse the Fund, as a percentage of average daily managed assets, for fees and expenses in the amounts and for the time periods set forth below:
| Year Ending September 30, | | Year Ending September 30, | |
| 2002* | .32% | 2007 | .32 | % |
| 2003 | .32 | 2008 | .24 | |
| 2004 | .32 | 2009 | .16 | |
| 2005 | .32 | 2010 | .08 | |
| 2006 | .32 | | | |
| * | From the commencement of operations. |
The Adviser has not agreed to reimburse Connecticut Dividend Advantage 3 (NGO) for any portion of its fees and expenses beyond September 30, 2010.
For the first eight years of Insured Massachusetts Tax-Free Advantage’s (NGX) operations, the Adviser has agreed to reimburse the Fund, as a percentage of average daily managed assets, for fees and expenses in the amounts and for the time periods set forth below:
| Year Ending November 30, | | Year Ending November 30, | |
| 2002* | .32% | 2007 | .32 | % |
| 2003 | .32 | 2008 | .24 | |
| 2004 | .32 | 2009 | .16 | |
| 2005 | .32 | 2010 | .08 | |
| 2006 | .32 | | | |
| * | From the commencement of operations. |
The Adviser has not agreed to reimburse Insured Massachusetts Tax-Free Advantage (NGX) for any portion of its fees and expenses beyond November 30, 2010.
8. New Accounting Standards
Fair Value Measurements
On January 21, 2010, the Financial Accounting Standards Board issued changes to the authoritative guidance under U.S. GAAP for fair value measurements. The objective of which is to provide guidance on how investment assets and liabilities are to be valued and disclosed. Specifically, the amendment requires reporting entities to disclose Level 3 activity for purchases, sales, issuances and settlements in the Level 3 roll-forward on a gross basis rather than as one net number. The effective date of the amendment is for interim and annual periods beginning after December 15, 2010. At this time, management is evaluating the implications of this guidance and the impact it will have to the footnote disclosures, if any.
9. Subsequent Events
Preferred Shares
Subsequent to the reporting period, Connecticut Premium Income (NTC) successfully completed the issuance of $17.78 million of 2.55%, Series 2016 MTP. The newly issued MTP Shares trade on the NYSE under the symbol “NTC Pr D.” Immediately following its MTP issuance, Connecticut Premium Income (NTC) noticed for redemption at par its remaining $15.725 million ARPS outstanding using the MTP proceeds.
Subsequent to the reporting period, Massachusetts Premium Income (NMT) successfully completed the issuance of $14.94 million of 2.75%, Series 2016 MTP. The newly-issued MTP Shares trade on the NYSE under the symbol “NMT Pr D.” Immediately following its MTP issuance, Massachusetts Premium Income (NMT) noticed for redemption at par its remaining $14.4 million ARPS outstanding using the MTP proceeds.
Investment Advisory Agreements
Effective January 1, 2011, Nuveen Asset Management, the Funds’ Adviser, has changed its name to Nuveen Fund Advisors, Inc. (“Nuveen Fund Advisors”). Concurrently, Nuveen Fund Advisors has formed a wholly-owned subsidiary, Nuveen Asset Management, LLC, to house its portfolio management capabilities. Nuveen Asset Management, LLC now serves as the Funds’ sub-adviser, and the Funds’ portfolio managers have become employees of Nuveen Asset Management, LLC rather than Nuveen Fund Advisors.
This allocation of responsibilities between Nuveen Fund Advisors and Nuveen Asset Management, LLC affects each Fund within this report. Nuveen Fund Advisors (as each affected Fund’s investment adviser) will compensate Nuveen Asset Management, LLC (as each such Fund’s newly-appointed sub-adviser) for the portfolio management services it provides to the Fund from the Fund’s management fee, which will not change as a result of this restructuring. Nuveen Fund Advisors and Nuveen Asset Management, LLC retain the right to reallocate investment management and advisory responsibilities and fees between themselves in the future.
Nuveen Investments 91
Board Approval of Sub-Advisory
Arrangements (Unaudited)
At a meeting held on May 25-26, 2010 (the “May Meeting”), the Boards of Trustees or Directors (as the case may be) (each a “Board” and each Trustee or Director, a “Board Member”) of the Funds, including a majority of the Independent Board Members, considered and approved the advisory agreements (each an “Advisory Agreement”) between each Fund and Nuveen Asset Management (“NAM”). Since the May Meeting, Nuveen has engaged in an internal restructuring (the “Restructuring”) pursuant to which the portfolio management services provided by NAM to the Funds would be transferred to Nuveen Asset Management, LLC (“NAM LLC”), a newly-organized wholly-owned subsidiary of NAM and NAM would change its name to Nuveen Fund Advisors, Inc. (“NFA”). NAM, under its new name NFA, will continue to serve as investment adviser to the Funds and, in that capacity, will continue to provide various oversight, administrative, compliance and other services. To effectuate the foregoing, NFA will enter into a sub-advisory agreement with NAM LLC on behalf of the Funds (the “Sub-Advisory Agreement”). Under the Sub-Advisory Agreement, NAM LLC, subject to the oversight of NFA and the Board, will furnish an investment program, make investment decisions for, and place all orders for the purchase and sale of securities for the portion of each Fund’s investment portfolio allocated to it by NFA. There will be no change in the advisory fees paid by the Funds. Rather, NFA will pay a portion of the investment advisory fee it receives to NAM LLC for its sub-advisory services. The Independent Board Members reviewed the allocation of fees between NFA and NAM LLC. NFA and NAM LLC do not anticipate any reduction in the nature or level of services provided to the Funds following the Restructuring. The personnel of NFA who engaged in portfolio management activities prior to the spinoff of NAM LLC are not expected to materially change as a result of the spinoff. In light of the foregoing, at a meeting held on November 16-18, 2010, the Board Members, including a majority of the Independent Board Members, approved the Sub-Advisory Agreement on behalf of each Fund. Given that the Restructuring was not expected to reduc e the level or nature of services provided and the advisory fees paid by the Funds were the same, the factors considered and determinations made at the May Meeting in approving the Advisory Agreement were equally applicable to the approval of the Sub-Advisory Agreement. For a discussion of these considerations, please see the shareholder report of the Fund that was first issued after the May Meeting for the period including May 2010.
92 Nuveen Investments
Reinvest Automatically
Easily and Conveniently
Nuveen makes reinvesting easy. A phone call is all it takes to set up your reinvestment account.
Nuveen Closed-End Funds Automatic Reinvestment Plan
Your Nuveen Closed-End Fund allows you to conveniently reinvest distributions in additional Fund shares.
By choosing to reinvest, you’ll be able to invest money regularly and automatically, and watch your investment grow through the power of compounding. Just like distributions in cash, there may be times when income or capital gains taxes may be payable on distributions that are reinvested.
It is important to note that an automatic reinvestment plan does not ensure a profit, nor does it protect you against loss in a declining market.
Easy and convenient
To make recordkeeping easy and convenient, each quarter you’ll receive a statement showing your total distributions, the date of investment, the shares acquired and the price per share, and the total number of shares you own.
How shares are purchased
The shares you acquire by reinvesting will either be purchased on the open market or newly issued by the Fund. If the shares are trading at or above net asset value at the time of valuation, the Fund will issue new shares at the greater of the net asset value or 95% of the then-current market price. If the shares are trading at less than net asset value, shares for your account will be purchased on the open market. If the Plan Agent begins purchasing Fund shares on the open market while shares are trading below net asset value, but the Fund’s shares subsequently trade at or above their net asset value before the Plan Agent is able to complete its purchases, the Plan Agent may cease open-market purchases and may invest the uninvested portion of the distribution in new ly-issued Fund shares at a price equal to the greater of the shares’ net asset value or 95% of the shares’ market value on the last business day immediately prior to the purchase date. Distributions received to purchase shares in the open market will normally be invested shortly after the distribution payment date. No interest will be paid on distributions awaiting reinvestment. Because the market price of the shares may increase before purchases are completed, the average purchase price per share may exceed the market price at the time of valuation, resulting in the acquisition of fewer shares than if the distribution had been paid in shares issued by the Fund. A pro rata
Nuveen Investments 93
Reinvest Automatically
Easily and Conveniently (continued)
portion of any applicable brokerage commissions on open market purchases will be paid by Plan participants. These commissions usually will be lower than those charged on individual transactions.
Flexible
You may change your distribution option or withdraw from the Plan at any time, should your needs or situation change.
You can reinvest whether your shares are registered in your name, or in the name of a brokerage firm, bank, or other nominee. Ask your financial advisor if his or her firm will participate on your behalf. Participants whose shares are registered in the name of one firm may not be able to transfer the shares to another firm and continue to participate in the Plan.
The Fund reserves the right to amend or terminate the Plan at any time. Although the Fund reserves the right to amend the Plan to include a service charge payable by the participants, there is no direct service charge to participants in the Plan at this time.
Call today to start reinvesting distributions
For more information on the Nuveen Automatic Reinvestment Plan or to enroll in or withdraw from the Plan, speak with your financial advisor or call us at (800) 257-8787.
94 Nuveen Investments
Glossary of Terms
Used in this Report
| ■ | Auction Rate Bond: An auction rate bond is a security whose interest payments are adjusted periodically through an auction process, which process typically also serves as a means for buying and selling the bond. Auctions that fail to attract enough buyers for all the shares offered for sale are deemed to have “failed,” with current holders receiving a formula-based interest rate until the next scheduled auction. |
| | |
| ■ | Average Annual Total Return: This is a commonly used method to express an investment’s performance over a particular, usually multi-year time period. It expresses the return that would have been necessary each year to equal the investment’s actual cumulative performance (including change in NAV or market price and reinvested dividends and capital gains distributions, if any) over the time period being considered. |
| | |
| ■ | Average Effective Maturity: The market-value-weighted average of the effective maturity dates of the individual securities including cash. In the case of a bond that has been advance-refunded to a call date, the effective maturity is the date on which the bond is scheduled to be redeemed using the proceeds of an escrow account. In most other cases the effective maturity is the stated maturity date of the security. |
| | |
| ■ | Inverse Floaters: Inverse floating rate securities, also known as inverse floaters, are created by depositing a municipal bond, typically with a fixed interest rate, into a special purpose trust created by a broker-dealer. This trust, in turn, (a) issues floating rate certificates typically paying short-term tax-exempt interest rates to third parties in amounts equal to some fraction of the deposited bond’s par amount or market value, and (b) issues an inverse floating rate certificate (sometimes referred to as an “inverse floater”) to an investor (such as a Fund) interested in gaining investment exposure to a long-term municipal bond. The income received by the holder of the inverse floater varies inversely with the short-term rate paid to the floating ra te certificates’ holders, and in most circumstances the holder of the inverse floater bears substantially all of the underlying bond’s downside investment risk. The holder of the inverse floater typically also benefits disproportionately from any potential appreciation of the underlying bond’s value. Hence, an inverse floater essentially represents an investment in the underlying bond on a leveraged basis. |
Nuveen Investments 95
Glossary of Terms
Used in this Report (continued)
| ■ | Leverage-Adjusted Duration: Duration is a measure of the expected period over which a bond’s principal and interest will be paid, and consequently is a measure of the sensitivity of a bond’s or bond Fund’s value to changes when market interest rates change. Generally, the longer a bond’s or Fund’s duration, the more the price of the bond or Fund will change as interest rates change. Leverage-adjusted duration takes into account the leveraging process for a Fund and therefore is longer than the duration of the Fund’s portfolio of bonds. |
| | |
| ■ | Market Yield (also known as Dividend Yield or Current Yield): An investment’s current annualized dividend divided by its current market price. |
| | |
| ■ | Net Asset Value (NAV): A Fund’s NAV per common share is calculated by subtracting the liabilities of the Fund (including any Preferred shares issued in order to leverage the Fund) from its total assets and then dividing the remainder by the number of common shares outstanding. Fund NAVs are calculated at the end of each business day. |
| | |
| ■ | Pre-refunding: Pre-refunding, also known as advanced refundings or refinancings, is a procedure used by state and local governments to refinance municipal bonds to lower interest expenses. The issuer sells new bonds with a lower yield and uses the proceeds to buy U.S. Treasury securities, the interest from which is used to make payments on the higher-yielding bonds. Because of this collateral, pre-refunding generally raises a bond’s credit rating and thus its value. |
| | |
| ■ | Taxable-Equivalent Yield: The yield necessary from a fully taxable investment to equal, on an after-tax basis, the yield of a municipal bond investment. |
| | |
| ■ | Zero Coupon Bond: A zero coupon bond does not pay a regular interest coupon to its holders during the life of the bond. Tax-exempt income to the holder of the bond comes from accretion of the difference between the original purchase price of the bond at issuance and the par value of the bond at maturity and is effectively paid at maturity. The market prices of zero coupon bonds generally are more volatile than the market prices of bonds that pay interest periodically. |
96 Nuveen Investments
Other Useful Information
Board of Trustees
John P. Amboian
Robert P. Bremner
Jack B. Evans
William C. Hunter
David J. Kundert
William J. Schneider
Judith M. Stockdale
Carole E. Stone
Terence J. Toth
Fund Manager
Nuveen Fund Advisors, Inc.
333 West Wacker Drive
Chicago, IL 60606
Sub-Adviser
Nuveen Asset
Management, LLC
333 West Wacker Drive
Chicago, IL 60606
Custodian
State Street Bank & Trust
Company
Boston, MA
Transfer Agent and
Shareholder Services
State Street Bank & Trust
Company
Nuveen Funds
P.O. Box 43071
Providence, RI 02940-3071
(800) 257-8787
Legal Counsel
Chapman and Cutler LLP
Chicago, IL
Independent Registered
Public Accounting Firm
Ernst & Young LLP
Chicago, IL
Quarterly Portfolio of Investments and Proxy Voting Information
You may obtain (i) each Fund’s quarterly portfolio of investments, (ii) information regarding how each Fund voted proxies relating to portfolio securities held during the most recent twelve-month period ended June 30, and (iii) a description of the policies and procedures that each Fund used to determine how to vote proxies relating to portfolio securities without charge, upon request, by calling Nuveen Investments toll-free at (800) 257-8787 or on Nuveen’s website at www.nuveen.com.
You may also obtain this and other Fund information directly from the Securities and Exchange Commission (SEC). The SEC may charge a copying fee for this information. Visit the SEC on-line at http://www.sec.gov or in person at the SEC’s Public Reference Room in Washington, D.C. Call the SEC at (202) 942-8090 for room hours and operation. You may also request Fund information by sending an e-mail request to publicinfo@sec.gov or by writing to the SEC’s Public References Section at 100 F Street NE, Washington, D.C. 20549.
CEO Certification Disclosure
Each Fund’s Chief Executive Officer has submitted to the New York Stock Exchange (NYSE) the annual CEO certification as required by Section 303A.12(a) of the NYSE Listed Company Manual.
Each Fund has filed with the SEC the certification of its Chief Executive Officer and Chief Financial Officer required by Section 302 of the Sarbanes-Oxley Act.
Common and Preferred Share Information
Each Fund intends to repurchase and/or redeem shares of its own common and/or auction rate preferred stock in the future at such times and in such amounts as is deemed advisable. During the period covered by this report, the Funds repurchased and/or redeemed shares of their common and/or auction rate preferred stock as shown in the accompanying table.
| Fund | Common Shares Repurchased | Preferred Shares Redeemed | |
| NTC | — | — | |
| NFC | — | — | |
| NGK | — | — | |
| NGO | — | — | |
| NMT | — | — | |
| NMB | — | — | |
| NGX | — | — | |
| NOM | — | 640 | * |
| * | Includes auction rate preferred shares noticed for redemption at the end of the reporting period. |
Any future repurchases and/or redemptions will be reported to shareholders in the next annual or semi-annual report.
Nuveen Investments 97
Nuveen Investments:
Serving Investors for Generations
Since 1898, financial advisors and their clients have relied on Nuveen Investments to provide dependable investment solutions through continued adherence to proven, long-term investing principles. Today, we offer a range of high quality equity and fixed-income solutions designed to be integral components of a well-diversified core portfolio.
Focused on meeting investor needs.
Nuveen Investments is a global investment management firm that seeks to help secure the long-term goals of institutions and high net worth investors as well as the consultants and financial advisors who serve them. We market our growing range of specialized investment solutions under the high-quality brands of HydePark, NWQ, Nuveen Asset Management, Santa Barbara, Symphony, Tradewinds and Winslow Capital. In total, Nuveen Investments managed approximately $195 billion of assets as of December 31, 2010.
Find out how we can help you.
To learn more about how the products and services of Nuveen Investments may be able to help you meet your financial goals, talk to your financial advisor, or call us at (800) 257-8787. Please read the information provided carefully before you invest. Investors should consider the investment objective and policies, risk considerations, charges and expenses of any investment carefully. Where applicable, be sure to obtain a prospectus, which contains this and other relevant information. To obtain a prospectus, please contact your securities representative or Nuveen Investments, 333 W. Wacker Dr., Chicago, IL 60606. Please read the prospectus carefully before you inv est or send money. Learn more about Nuveen Funds at: www.nuveen.com/cef
Nuveen makes things e-simple. It only takes a minute to sign up for e-Reports. Once enrolled, you’ll receive an e-mail as soon as your Nuveen Fund information is ready—no more waiting for delivery by regular mail. Just click on the link within the e-mail to see the report and save it on your computer if you wish. Free e-Reports right to your e-mail! www.investordelivery.com If you receive your Nuveen Fund distributions and statements from your financial advisor or brokerage account. OR www.nuveen.com/accountaccess If you receive your Nuveen Fund distributions and statements directly from Nuveen. |
Distributed by
Nuveen Investments, LLC
333 West Wacker Drive
Chicago, IL 60606
www.nuveen.com
ESA-B-1110D