Washington, D.C. 20549
Kevin J. McCarthy
Form N-CSR is to be used by management investment companies to file reports with the Commission not later than 10 days after the transmission to stockholders of any report that is required to be transmitted to stockholders under Rule 30e-1 under the Investment Company Act of 1940 (17 CFR 270.30e-1). The Commission may use the information provided on Form N-CSR in its regulatory, disclosure review, inspection, and policymaking roles.
A registrant is required to disclose the information specified by Form N-CSR, and the Commission will make this information public. A registrant is not required to respond to the collection of information contained in Form N-CSR unless the Form displays a currently valid Office of Management and Budget ("OMB") control number. Please direct comments concerning the accuracy of the information collection burden estimate and any suggestions for reducing the burden to Secretary, Securities and Exchange Commission, 450 Fifth Street, NW, Washington, DC 20549-0609. The OMB has reviewed this collection of information under the clearance requirements of 44 U.S.C. ss. 3507.
ITEM 1. REPORTS TO STOCKHOLDERS.
Life is Complex
Nuveen makes things e-simple.
It only takes a minute to sign up for e-Reports. Once enrolled, you’ll receive an e-mail as soon as your Nuveen Investments Fund information is ready—no more waiting for delivery by regular mail. Just click on the link within the e-mail to see the report and save it on your computer if you wish.
Free e-Reports right to your e-mail!
www.investordelivery.com
If you receive your Nuveen Fund dividends and statements from your financial advisor or brokerage account.
or
www.nuveen.com/accountaccess
If you receive your Nuveen Fund dividends and statements directly from Nuveen.
Table of Contents | |
| |
Chairman’s Letter to Shareholders | 4 |
Portfolio Manager’s Comments | 5 |
Fund Leverage | 8 |
Common Share Information | 9 |
Risk Considerations | 11 |
Performance Overview and Holding Summaries | 12 |
Portfolios of Investments | 15 |
Statement of Assets and Liabilities | 28 |
Statement of Operations | 29 |
Statement of Changes in Net Assets | 30 |
Statement of Cash Flows | 31 |
Financial Highlights | 32 |
Notes to Financial Statements | 35 |
Additional Fund Information | 45 |
Glossary of Terms Used in this Report | 46 |
Reinvest Automatically, Easily and Conveniently | 48 |
Chairman’s Letter to Shareholders
Dear Shareholders,
For better or for worse, the financial markets spent most of the past year waiting for the U.S. Federal Reserve (Fed) to end its accommodative monetary policy. The policy has propped up stock and bond markets since the Great Recession, but the question remains: how will markets behave without its influence? This uncertainty was a considerable source of volatility for stock and bond prices for much of 2015, despite the Fed carefully conveying its intention to raise rates slowly and only when the economy shows evidence of readiness.
As was widely expected, the long-awaited Fed rate hike materialized in mid-December. While the move was interpreted as a vote of confidence on the U.S. economy’s underlying strength, the Fed emphasized that future rate increases will be gradual and guided by its ongoing assessment of financial conditions. Headwinds including rising borrowing costs, softer commodity prices, low inflation, a strong U.S. dollar and a stagnant global economy could necessitate keeping monetary conditions accommodative for longer. Meanwhile, policy makers in Europe and Japan are deploying their available tools to try to bolster their economies’ fragile growth, while Chinese authorities have stepped up efforts to manage China’s slowdown.
Although the new year began with a more pessimistic tone to investor sentiment and elevated volatility in the markets, we caution investors from making long-term decisions based on short-term news. In times like these, you can look to a professional investment manager with the experience and discipline to maintain the proper perspective on short-term events. And if the daily headlines do concern you, I encourage you to reach out to your financial advisor. Your financial advisor can help you evaluate your investment strategies in light of current events, your time horizon and risk tolerance.
On behalf of the other members of the Nuveen Fund Board, we look forward to continuing to earn your trust in the months and years ahead.
Sincerely,
William J. Schneider
Chairman of the Board
January 25, 2016
Portfolio Manager’s Comments
Nuveen Connecticut Premium Income Municipal Fund (NTC)
Nuveen Massachusetts Premium Income Municipal Fund (NMT)
These Funds feature portfolio management by Nuveen Asset Management, LLC, an affiliate of Nuveen Investments, Inc. Portfolio manager Michael S. Hamilton discusses key investment strategies and the six-month performance of the Nuveen Connecticut and Massachusetts Funds. Michael assumed portfolio management responsibility for these Funds in 2011.
What key strategies were used to manage these Funds during the six-month reporting period ended November 30, 2015?
Although anticipation of rising interest rates weighed on fixed income markets during this reporting period, favorable technical and fundamental factors helped the broad municipal market deliver a modest gain for the reporting period overall. (As was widely expected, the U.S. Federal Reserve raised its target federal funds rate at the December meeting, after the close of this reporting period.) During this reporting period, we continued to take a bottom-up approach to discovering sectors that appeared undervalued as well as individual credits that we believed had the potential to perform well over the long term.
Our trading activity continued to focus on pursuing the Funds’ investment objectives. Generally speaking, throughout the six-month reporting period, the Funds maintained their overall positioning strategies in terms of duration and yield curve positioning, credit quality exposures and sector allocations. We’ve also continued to be more cautious in selecting individual securities. As investor demand for municipal securities has increased and created a slight supply-demand imbalance, we’ve started to see underwriters bring new issues to market that are structured with terms more favorable to the issuer and perhaps less advantageous to the investor than in the recent past. We believe this shift in the marketplace merits extra vigilance on our part to ensure that every credit considered for the portfolio offers adequate reward potential for the level of risk to the bondholder. In cases where our convictions have been less certain, we’ve sought compensation for the additional risk or have passed on the deal all together.
To keep the Funds fully invested we continued to focus on purchasing bonds in areas of the market that we expected to perform well as the economy continued to improve. Depending on the issuance and availability of bonds in each state we emphasized intermediate and longer maturities, lower rated credits and sectors offering higher yields. To fund these purchases, we generally reinvested the proceeds from called and maturing bonds. In some cases, we sold bonds that we believed had deteriorating fundamentals or could be traded for a better relative value, as well as from selling short-dated, higher quality issues that we tend to hold over short timeframes as a source of liquidity.
Certain statements in this report are forward-looking statements. Discussions of specific investments are for illustration only and are not intended as recommendations of individual investments. The forward-looking statements and other views expressed herein are those of the portfolio manager as of the date of this report. Actual future results or occurrences may differ significantly from those anticipated in any forward-looking statements, and the views expressed herein are subject to change at any time, due to numerous market and other factors. The Funds disclaim any obligation to update publicly or revise any forward-looking statements or views expressed herein.
Ratings shown are the highest rating given by one of the following national rating agencies: Standard & Poor’s (S&P), Moody’s Investors Service, Inc. (Moody’s) or Fitch, Inc. (Fitch). Credit ratings are subject to change. AAA, AA, A and BBB are investment grade ratings; BB, B, CCC, CC, C and D are below investment grade ratings. Certain bonds backed by U.S. government or agency securities are regarded as having an implied rating equal to the rating of such securities. Holdings designated N/R are not rated by these national rating agencies.
Bond insurance guarantees only the payment of principal and interest on the bond when due, and not the value of the bonds themselves, which will fluctuate with the bond market and the financial success of the issuer and the insurer. Insurance relates specifically to the bonds in the portfolio and not to the share prices of a Fund. No representation is made as to the insurers’ ability to meet their commitments.
Refer to the Glossary of Terms Used in this Report for further definition of the terms used within this section.
Portfolio Manager’s Comments (continued)
Our trading strategy in NTC was fairly active during this reporting period. Issuance in Connecticut’s municipal market was elevated over the six-month reporting period, enabling us to participate in a number of deals, including purchases of local general obligation (GO) bonds, higher education and special tax bonds. We also bought some state GOs at the end of the reporting period, although generally NTC was a net seller of state GOs. We sold some underperforming state GOs to boost the Fund’s income distribution capability, as well as improve the tax efficiency of the overall portfolio. We also pursued a shorter-term tactical strategy that added value during this reporting period. We took advantage of a temporary mispricing in the marketplace by buying some new issues when spreads were wide then selling them into the secondary market as spreads tightened, earning a good profit for the Fund. Notable sales during the reporting period included the reduction of shorter-dated bonds to keep the Fund within its duration target range (these sales included short-dated Puerto Rico credits) and uninsured Virgin Islands paper.
Additions to the Massachusetts Fund came from a diverse group of sectors including retirement centers, transportation (specifically, ports), higher education and hospitals. Generally, the bonds we added offered maturities of 15 years and longer. Selling activity in NMT included the elimination of some bonds with lower book yields to harvest tax losses and boost the Fund’s overall tax efficiency.
As of November 30, 2015, the Funds continued to use inverse floating rate securities. We employ inverse floaters for a variety of reasons, including duration management, income enhancement and total return enhancement.
How did the Funds perform during the six-month reporting period ended November 30, 2015?
The tables in each Fund’s Performance Overview and Holding Summaries section of this report provide the Funds’ total returns for the six-month, one-year, five-year and ten-year periods ended November 30, 2015. Each Fund’s total returns at common share net asset value (NAV) are compared with the performance of a corresponding market index and Lipper classification averages.
For the six months ended November 30, 2015, the total returns at common share NAV for NTC and NMT outperformed the returns for their respective state’s S&P Municipal Bond Index as well as the national S&P Municipal Bond Index. For the same period, NMT outperformed the average return for the Lipper Other States Municipal Debt Funds Classification, while NTC slightly lagged the Lipper average. Shareholders should note that the performance of the Lipper Other States classification represents the overall average of returns for funds from ten states with a wide variety of municipal market conditions, making direct comparisons less meaningful.
For both Funds, duration and yield curve positioning was the most meaningful contributor to relative performance over this reporting period. We continued to overweight the longer parts of the yield curve with corresponding underweights to the shorter end of the curve, which resulted in longer durations than the municipal market in general. This positioning, particularly our underweight to bonds with maturities shorter than six years and overweight to bonds dated eight years and longer, was advantageous in this reporting period as intermediate- and longer-dated bonds generally outperformed shorter-dated bonds.
Credit exposures were another positive contributor to NTC’s relative performance during this reporting period. Particularly beneficial were the Connecticut Fund’s underweight allocation to AA rated bonds, a segment that trailed the broad market, and overweight allocations to A rated and BBB rated bonds, categories that outpaced the broad market.
However, NTC’s sector strategy modestly detracted from relative returns. The Fund maintains an overweight to pre-refunded bonds, which we consider short-term holdings that can be sold to fund the purchase of longer-term holdings. As the pre-refunded sector generally underperformed the broad market during this reporting period, the Fund’s higher weighting in the sector was disadvantageous to relative performance. These relative losses, however, were partially offset by NTC’s more-favorable positioning in tax-supported bonds. Within the tax-supported category, both an overweight to appropriation bonds and an underweight to state GOs added value. The Fund’s overweight allocation to the health care sector, and especially life care bonds, also boosted relative results.
Although NMT’s sector and credit quality strategies had an overall neutral impact on performance during this reporting period, the Fund benefited from some well-timed purchases made during June and July. In this reporting period, the municipal bond market exhibited a typical pattern in which a period of municipal bond scarcity in January and February is followed by abundant issuance in the spring months, which in turn leads to heightened demand June and July. We bought a state GO and a retirement center credit in early June and a Massachusetts Port Authority revenue bond in early July, all of which rose in value as demand for municipal bonds accelerated in the subsequent months.
An Update Involving Puerto Rico
As noted in the Funds’ previous shareholder reports, we continue to monitor situations in the broader municipal market for any impact on the Funds’ holdings and performance: the ongoing economic problems of Puerto Rico is one such case. Puerto Rico’s continued economic weakening, escalating debt service obligations, and long-standing inability to deliver a balanced budget led to multiple downgrades on its debt over the past two years. Puerto Rico has warned investors since 2014 that the island’s debt burden may be unsustainable and the Commonwealth has been exploring various strategies to deal with this burden, including Chapter 9 bankruptcy, which is currently not available by law.
In terms of Puerto Rico holdings, shareholders should note that NTC and NMT had limited exposure to Puerto Rico debt, 2.50% and 0.58%, respectively, during this reporting period most of which is insured or escrowed to maturity. The Puerto Rico credits offered higher yields, added diversification and triple exemption (i.e., exemption from most federal, state and local taxes). Puerto Rico general obligation debt is currently rated Caa2/CC/CC (below investment grade) by Moody’s, S&P and Fitch, respectively, with negative outlooks.
Fund Leverage
IMPACT OF THE FUNDS’ LEVERAGE STRATEGIES ON PERFORMANCE
One important factor impacting the returns of the Funds relative to their comparative benchmarks was the Funds’ use of leverage through their issuance of preferred shares and/or investments in inverse floating rate securities, which represent leveraged investments in underlying bonds. The Funds use leverage because our research has shown that, over time, leveraging provides opportunities for additional income, particularly in the recent market environment where short-term market rates are at or near historical lows, meaning that the short-term rates the Fund has been paying on its leveraging instruments have been much lower than the interest the Fund has been earning on its portfolio of long-term bonds that it has bought with the proceeds of that leverage. However, use of leverage also can expose the Fund to additional price volatility. When a Fund uses leverage, the Fund will experience a greater increase in its net asset value if the municipal bonds acquired through the use of leverage increase in value, but it will also experience a correspondingly larger decline in its net asset value if the bonds acquired through leverage decline in value, which will make the Fund’s net asset value more volatile, and its total return performance more variable over time. In addition, income in levered funds will typically decrease in comparison to unlevered funds when short-term interest rates increase and increase when short-term interest rates decrease. Leverage had a positive impact on the performance of these Funds over this reporting period.
As of November 30, 2015, the Funds’ percentages of leverage are as shown in the accompanying table.
| | NTC | NMT |
Effective Leverage* | 38.26% | 36.94% |
Regulatory Leverage* | 33.49% | 34.77% |
| * | Effective Leverage is a Fund’s effective economic leverage, and includes both regulatory leverage and the leverage effects of certain derivative and other investments in a Fund’s portfolio that increase the Fund’s investment exposure. Currently, the leverage effects of Tender Option Bond (TOB) inverse floater holdings are included in effective leverage values, in addition to any regulatory leverage. Regulatory leverage consists of preferred shares issued or borrowings of a Fund. Both of these are part of a Fund’s capital structure. Regulatory leverage is subject to asset coverage limits set forth in the Investment Company Act of 1940. |
THE FUNDS’ REGULATORY LEVERAGE
As of November 30, 2015, the Funds have issued and outstanding Variable Rate MuniFund Term Preferred (VMTP) Shares as shown in the accompanying table.
| | | | Shares Issued at |
| | Series | | Liquidation Value |
NTC | 2017 | $ | 106,000,000 |
NMT | 2017 | $ | 74,000,000 |
Refer to Notes to Financial Statements, Note 4 — Fund Shares, Preferred Shares for further details on VMTP Shares and each Fund’s respective transactions.
Common Share Information
COMMON SHARE DISTRIBUTION INFORMATION
The following information regarding the Funds’ distributions is current as of November 30, 2015. Each Fund’s distribution levels may vary over time based on each Fund’s investment activity and portfolio investments value changes.
During the current reporting period, each Fund’s distributions to common shareholders were as shown in the accompanying table.
| | | | | | | |
| | | | | | | |
| | | | | | | |
| | | Per Common | |
| | | Share Amounts | |
Ex-Dividend Date | | NTC | | | NMT | |
June 2015 | | $ | 0.0570 | | | $ | 0.0590 | |
July | | | 0.0570 | | | | 0.0590 | |
August | | | 0.0570 | | | | 0.0590 | |
September | | | 0.0570 | | | | 0.0590 | |
October | | | 0.0570 | | | | 0.0590 | |
November 2015 | | | 0.0570 | | | | 0.0590 | |
Market Yield* | | | 5.49 | % | | | 5.20 | % |
Taxable-Equivalent Yield* | | | 8.11 | % | | | 7.61 | % |
| * | Market Yield is based on the Fund’s current annualized monthly dividend divided by the Fund’s current market price as of the end of the reporting period. Taxable-Equivalent Yield represents the yield that must be earned on a fully taxable investment in order to equal the yield of the Fund on an after-tax basis. It is based on a combined federal and state income tax rate of 32.3% and 31.7% for Connecticut and Massachusetts, respectively. When comparing a Fund to investments that generate qualified dividend income, the Taxable-Equivalent Yield would be lower. |
Each Fund in this report seeks to pay regular monthly dividends out of their net investment income at a rate that reflects its past and projected net income performance. To permit each Fund to maintain a more stable monthly dividend, the Fund may pay dividends at a rate that may be more or less than the amount of net income actually earned by the Fund during the period. If a Fund has cumulatively earned more than it has paid in dividends, it will hold the excess in reserve as undistributed net investment income (UNII) as part of the Fund’s net asset value. Conversely, if a Fund has cumulatively paid in dividends more than it has earned, the excess will constitute a negative UNII that will likewise be reflected in the Fund’s net asset value. Each Fund will, over time, pay all its net investment income as dividends to shareholders.
As of November 30, 2015, the Funds had positive UNII balances, based upon our best estimate, for tax purposes and positive UNII balances for financial reporting purposes.
All monthly dividends paid by each Fund during the current reporting period were paid from net investment income. If a portion of the Fund’s monthly distributions was sourced from or comprised of elements other than net investment income, including capital gains and/or a return of capital, shareholders would have received a notice to that effect. For financial reporting purposes the composition and per share amounts of each Fund’s dividends for the reporting period are presented in this report’s Statement of Changes in Net Assets and Financial Highlights, respectively. For income tax purposes, distribution information for each Fund as of its most recent tax year end is presented in Note 6 — Income Tax Information within the Notes to Financial Statements of this report.
Common Share Information (continued)
COMMON SHARE REPURCHASES
During August 2015, the Funds’ Board of Trustees reauthorized an open-market share repurchase program, allowing each Fund to repurchase an aggregate of up to approximately 10% of its outstanding shares.
As of November 30, 2015, and since the inception of the Funds’ repurchase programs, the Funds have cumulatively repurchased and retired common shares as shown in the accompanying table.
| | | | | | | |
| | | NTC | | | NMT | |
Common shares cumulatively repurchased and retired | | | 155,000 | | | | — | |
Common shares authorized for repurchase | | | 1,460,000 | | | | 935,000 | |
| During the current reporting period, the Funds did not repurchased any of their outstanding common shares. | | | | | |
| | |
OTHER COMMON SHARE INFORMATION | | | | | | | | |
| | |
As of November 30, 2015, and during the current reporting period, the Funds’ common share prices were trading at a premium/(discount) to their common share NAVs as shown in the accompanying table. | |
| | |
| | | NTC | | | NMT | |
Common share NAV | | $ | 14.49 | | | $ | 14.86 | |
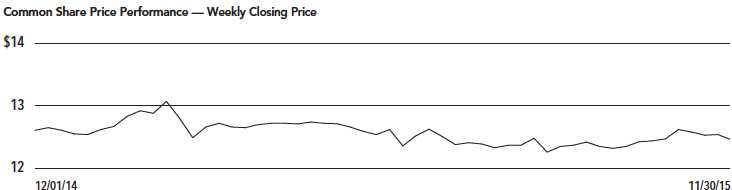
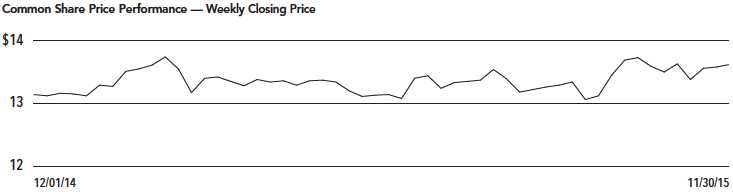
Common share price | | $ | 12.46 | | | $ | 13.62 | |
Premium/(Discount) to NAV | | | (14.01 | )% | | | (8.34 | )% |
6-month average premium/(discount) to NAV | | | (13.48 | )% | | | (8.39 | )% |
Risk Considerations
Nuveen Connecticut Premium Income Municipal Fund (NTC)
Investing in closed-end funds involves risk; principal loss is possible. There is no guarantee the Fund’s investment objectives will be achieved. Closed-end fund shares may frequently trade at a discount or premium to their net asset value. Debt or fixed income securities such as those held by the Fund, are subject to market risk, credit risk, interest rate risk, derivatives risk, liquidity risk, and income risk. As interest rates rise, bond prices fall. Leverage increases return volatility and magnifies the Fund’s potential return and its risks; there is no guarantee a fund’s leverage strategy will be successful. State concentration makes the Fund more susceptible to local adverse economic, political, or regulatory changes affecting municipal bond issuers. These and other risk considerations such as inverse floater risk and tax risk are described in more detail on the Fund’s web page at www.nuveen.com/NTC.
Nuveen Massachusetts Premium Income Municipal Fund (NMT)
Investing in closed-end funds involves risk; principal loss is possible. There is no guarantee the Fund’s investment objectives will be achieved. Closed-end fund shares may frequently trade at a discount or premium to their net asset value. Debt or fixed income securities such as those held by the Fund, are subject to market risk, credit risk, interest rate risk, derivatives risk, liquidity risk, and income risk. As interest rates rise, bond prices fall. Leverage increases return volatility and magnifies the Fund’s potential return and its risks; there is no guarantee a fund’s leverage strategy will be successful. State concentration makes the Fund more susceptible to local adverse economic, political, or regulatory changes affecting municipal bond issuers. These and other risk considerations such as inverse floater risk and tax risk are described in more detail on the Fund’s web page at www.nuveen.com/NMT.
NTC
Nuveen Connecticut Premium Income Municipal Fund
Performance Overview and Holding Summaries as of November 30, 2015
Refer to the Glossary of Terms Used in this Report for further definition of the terms used within this section.
Average Annual Total Returns as of November 30, 2015
| | Cumulative | | Average Annual |
| | 6-Month | | 1-Year | 5-Year | 10-Year |
NTC at Common Share NAV | 3.40% | | 4.54% | 5.15% | 4.89% |
NTC at Common Share Price | 1.48% | | 4.40% | 3.69% | 3.86% |
S&P Municipal Bond Connecticut Index | 2.04% | | 2.45% | 3.42% | 3.97% |
S&P Municipal Bond Index | 2.24% | | 3.14% | 4.95% | 4.69% |
Lipper Other States Municipal Debt Funds Classification Average | 3.43% | | 4.80% | 6.88% | 5.48% |
Past performance is not predictive of future results. Current performance may be higher or lower than the data shown. Returns do not reflect the deduction of taxes that shareholders may have to pay on Fund distributions or upon the sale of Fund shares. Returns at NAV are net of Fund expenses, and assume reinvestment of distributions. Comparative index and Lipper return information is provided for the Fund’s shares at NAV only. Indexes and Lipper averages are not available for direct investment.
This data relates to the securities held in the Fund’s portfolio of investments as of the end of the reporting period. It should not be construed as a measure of performance for the Fund itself. Holdings are subject to change.
Ratings shown are the highest rating given by one of the following national rating agencies: Standard & Poor’s Group, Moody’s Investors Service, Inc. or Fitch, Inc. Credit ratings are subject to change. AAA, AA, A and BBB are investment grade ratings; BB, B, CCC, CC, C and D are below-investment grade ratings. Certain bonds backed by U.S. Government or agency securities are regarded as having an implied rating equal to the rating of such securities. Holdings designated N/R are not rated by these national rating agencies.
Fund Allocation | |
(% of net assets) | |
Long-Term Municipal Bonds | 157.4% |
Other Assets Less Liabilities | 2.1% |
Net Assets Plus Floating Rate Obligations | |
& VMTP Shares, at Liquidation Value | 159.5% |
Floating Rate Obligations | (9.2)% |
VMTP Shares, at Liquidation Value | (50.3)% |
Net Assets | 100% |
Portfolio Composition | |
(% of total investments) | |
Education and Civic Organizations | 20.8% |
Health Care | 20.4% |
Tax Obligation/General | 16.9% |
Tax Obligation/Limited | 14.1% |
Water and Sewer | 10.0% |
U.S. Guaranteed | 9.2% |
Other | 8.6% |
Total | 100% |
Credit Quality | |
(% of total investment exposure) | |
AAA/U.S. Guaranteed | 20.0% |
AA | 51.6% |
A | 21.3% |
BBB | 3.9% |
N/R (not rated) | 3.2% |
Total | 100% |
NMT
Nuveen Massachusetts Premium Income Municipal Fund
Performance Overview and Holding Summaries as of November 30, 2015
Refer to the Glossary of Terms Used in this Report for further definition of the terms used within this section.
Average Annual Total Returns as of November 30, 2015
| | Cumulative | | Average Annual |
| | 6-Month | | 1-Year | 5-Year | 10-Year |
NMT at Common Share NAV | 3.75% | | 4.92% | 6.03% | 5.37% |
NMT at Common Share Price | 6.41% | | 9.38% | 4.45% | 3.64% |
S&P Municipal Bond Massachusetts Index | 2.44% | | 3.24% | 4.54% | 4.73% |
S&P Municipal Bond Index | 2.24% | | 3.14% | 4.95% | 4.69% |
Lipper Other States Municipal Debt Funds Classification Average | 3.43% | | 4.80% | 6.88% | 5.48% |
Past performance is not predictive of future results. Current performance may be higher or lower than the data shown. Returns do not reflect the deduction of taxes that shareholders may have to pay on Fund distributions or upon the sale of Fund shares. Returns at NAV are net of Fund expenses, and assume reinvestment of distributions. Comparative index and Lipper return information is provided for the Fund’s shares at NAV only. Indexes and Lipper averages are not available for direct investment.
This data relates to the securities held in the Fund’s portfolio of investments as of the end of the reporting period. It should not be construed as a measure of performance for the Fund itself. Holdings are subject to change.
Ratings shown are the highest rating given by one of the following national rating agencies: Standard & Poor’s Group, Moody’s Investors Service, Inc. or Fitch, Inc. Credit ratings are subject to change. AAA, AA, A and BBB are investment grade ratings; BB, B, CCC, CC, C and D are below-investment grade ratings. Certain bonds backed by U.S. Government or agency securities are regarded as having an implied rating equal to the rating of such securities. Holdings designated N/R are not rated by these national rating agencies.
Fund Allocation | |
(% of net assets) | |
Long-Term Municipal Bonds | 151.6% |
Other Assets Less Liabilities | 1.7% |
Net Assets Plus VMTP Shares, | |
at Liquidation Value | 153.3% |
VMTP Shares, at Liquidation Value | (53.3)% |
Net Assets | 100% |
Portfolio Composition | |
(% of total investments) | |
Education and Civic Organizations | 27.4% |
Health Care | 19.6% |
Tax Obligation/Limited | 14.7% |
Tax Obligation/General | 10.4% |
U.S. Guaranteed | 7.9% |
Transportation | 6.0% |
Other | 14.0% |
Total | 100% |
Credit Quality | |
(% of total investment exposure) | |
AAA/U.S. Guaranteed | 11.9% |
AA | 53.0% |
A | 22.6% |
BBB | 7.9% |
BB or Lower | 2.7% |
N/R (not rated) | 1.9% |
Total | 100% |
Shareholder Meeting Report
The annual meeting of shareholders was held in the offices of Nuveen Investments on November 17, 2015 for NMT; at this meeting the shareholders were asked to elect Board Members.
| | NMT |
| | Common and | | |
| | Preferred | | |
| | shares | | |
| | voting together | | Preferred |
| | as a class | | Shares |
Approval of the Board Members was reached as follows: | | | |
Jack B. Evans | | | |
For | 8,574,204 | | — |
Withhold | 238,957 | | — |
Total | 8,813,161 | | — |
William C. Hunter | | | |
For | — | | 740 |
Withhold | — | | — |
Total | — | | 740 |
William J. Schneider | | | |
For | — | | 740 |
Withhold | — | | — |
Total | — | | 740 |
Thomas S. Schreier, Jr. | | | |
For | 8,556,590 | | — |
Withhold | 256,571 | | — |
Total | 8,813,161 | | — |
| | |
NTC | |
Nuveen Connecticut Premium Income Municipal Fund |
Portfolio of Investments | November 30, 2015 (Unaudited) |
| | | | | | | | |
| | Principal | | | Optional Call | | | |
| | Amount (000) | | Description (1) | Provisions (2) | Ratings (3) | | Value |
| | | | LONG-TERM INVESTMENTS – 157.4% (100.0% of Total Investments) | | | | |
| | |
| | | | MUNICIPAL BONDS – 157.4% (100.0% of Total Investments) | | | | |
| | |
| | | | Consumer Staples – 1.4% (0.9% of Total Investments) | | | | |
| $ | 3,010 | | Puerto Rico, The Children’s Trust Fund, Tobacco Settlement Asset-Backed Refunding Bonds, | 2/16 at 100.00 | BBB+ | $ | 3,022,100 |
| | | | Series 2002, 5.375%, 5/15/33 | | | | |
| | | | Education and Civic Organizations – 32.7% (20.8% of Total Investments) | | | | |
| | 840 | | Connecticut Health and Educational Facilities Authority, Revenue Bonds, Chase Collegiate | 7/17 at 100.00 | AA | | 871,979 |
| | | | School, Series 2007A, 5.000%, 7/01/27 – RAAI Insured | | | | |
| | 1,000 | | Connecticut Health and Educational Facilities Authority, Revenue Bonds, Connecticut College, | 7/17 at 100.00 | AA– | | 1,019,150 |
| | | | Series 2007G, 4.500%, 7/01/37 – NPFG Insured | | | | |
| | 1,150 | | Connecticut Health and Educational Facilities Authority, Revenue Bonds, Connecticut College, | 7/21 at 100.00 | A2 | | 1,253,857 |
| | | | Series 2011H, 5.000%, 7/01/41 | | | | |
| | | | Connecticut Health and Educational Facilities Authority, Revenue Bonds, Fairfield University, | | | | |
| | | | Series 2010-O: | | | | |
| | 800 | | 5.000%, 7/01/35 | 7/20 at 100.00 | A– | | 897,016 |
| | 4,000 | | 5.000%, 7/01/40 | 7/20 at 100.00 | A– | | 4,485,080 |
| | | | Connecticut Health and Educational Facilities Authority, Revenue Bonds, Loomis Chaffee School, | | | | |
| | | | Series 2005F: | | | | |
| | 440 | | 5.250%, 7/01/18 – AMBAC Insured | No Opt. Call | A2 | | 485,003 |
| | 1,510 | | 5.250%, 7/01/19 – AMBAC Insured | No Opt. Call | A2 | | 1,713,759 |
| | 1,125 | | Connecticut Health and Educational Facilities Authority, Revenue Bonds, Norwich Free Academy, | 7/23 at 100.00 | A1 | | 1,172,835 |
| | | | Series 2013B, 4.000%, 7/01/34 | | | | |
| | 7,030 | | Connecticut Health and Educational Facilities Authority, Revenue Bonds, Quinnipiac University, | 7/25 at 100.00 | A– | | 7,779,679 |
| | | | Series 2015L, 5.000%, 7/01/45 | | | | |
| | | | Connecticut Health and Educational Facilities Authority, Revenue Bonds, Sacred Heart | | | | |
| | | | University, Series 2011G: | | | | |
| | 250 | | 5.125%, 7/01/26 | 7/21 at 100.00 | BBB+ | | 273,095 |
| | 3,260 | | 5.625%, 7/01/41 | 7/21 at 100.00 | BBB+ | | 3,555,095 |
| | | | Connecticut Health and Educational Facilities Authority, Revenue Bonds, Sacred Heart | | | | |
| | | | University, Series 2012H: | | | | |
| | 1,500 | | 5.000%, 7/01/26 – AGM Insured | 7/22 at 100.00 | AA | | 1,680,435 |
| | 1,000 | | 5.000%, 7/01/28 – AGM Insured | 7/22 at 100.00 | AA | | 1,109,240 |
| | | | Connecticut Health and Educational Facilities Authority, Revenue Bonds, The Loomis Chaffee | | | | |
| | | | School Issue, Series 2011-I: | | | | |
| | 560 | | 5.000%, 7/01/23 – AGM Insured | 7/21 at 100.00 | A2 | | 645,501 |
| | 225 | | 5.000%, 7/01/24 – AGM Insured | 7/21 at 100.00 | A2 | | 257,751 |
| | 4,140 | | Connecticut Health and Educational Facilities Authority, Revenue Bonds, Wesleyan University, | 7/20 at 100.00 | AA | | 4,692,317 |
| | | | Series 2010G, 5.000%, 7/01/35 | | | | |
| | 9,950 | | Connecticut Health and Educational Facilities Authority, Revenue Bonds, Yale University, | 7/16 at 100.00 | AAA | | 10,170,094 |
| | | | Series 2007Z-1, 5.000%, 7/01/42 (UB) | | | | |
| | 17,000 | | Connecticut Health and Educational Facilities Authority, Revenue Bonds, Yale University, | 7/17 at 100.00 | AAA | | 18,019,660 |
| | | | Series 2007Z-3, 5.050%, 7/01/42 (UB) (4) | | | | |
| | 5,580 | | Connecticut Health and Educational Facilities Authority, Revenue Bonds, Connecticut State | 11/23 at 100.00 | AA | | 6,446,407 |
| | | | University System, Series 2013N, 5.000%, 11/01/31 | | | | |
| | 515 | | University of Connecticut, Student Fee Revenue Bonds, Refunding Series 2010A, 5.000%, 11/15/27 | 11/19 at 100.00 | Aa2 | | 579,900 |
| | 1,500 | | University of Connecticut, Student Fee Revenue Bonds, Refunding Series 2012A, 5.000%, 11/15/29 | No Opt. Call | Aa2 | | 1,753,770 |
| | 63,375 | | Total Education and Civic Organizations | | | | 68,861,623 |
| | | |
NTC | Nuveen Connecticut Premium Income Municipal Fund | |
| | Portfolio of Investments (continued) | November 30, 2015 (Unaudited) |
| | | | | | | | |
| | Principal | | | Optional Call | | | |
| | Amount (000) | | Description (1) | Provisions (2) | Ratings (3) | | Value |
| | | | Health Care – 32.0% (20.4% of Total Investments) | | | | |
| $ | 3,200 | | Connecticut Health and Educational Facilities Authority Revenue Bonds, Hartford HealthCare, | 7/25 at 100.00 | A | $ | 3,520,864 |
| | | | Series 2015F, 5.000%, 7/01/45 | | | | |
| | 4,540 | | Connecticut Health and Educational Facilities Authority, Revenue Bonds, Ascension Health | 11/19 at 100.00 | AA+ | | 4,981,333 |
| | | | Series 2010A, 5.000%, 11/15/40 | | | | |
| | | | Connecticut Health and Educational Facilities Authority, Revenue Bonds, Bristol Hospital, | | | | |
| | | | Series 2002B: | | | | |
| | 660 | | 5.500%, 7/01/21 – RAAI Insured | 2/16 at 100.00 | AA | | 661,815 |
| | 3,000 | | 5.500%, 7/01/32 – RAAI Insured | 2/16 at 100.00 | AA | | 3,004,590 |
| | 1,010 | | Connecticut Health and Educational Facilities Authority, Revenue Bonds, Catholic Health East | 11/20 at 100.00 | AA | | 1,101,062 |
| | | | Series 2010, 4.750%, 11/15/29 | | | | |
| | 200 | | Connecticut Health and Educational Facilities Authority, Revenue Bonds, Danbury Hospital, | 1/16 at 100.00 | A | | 200,080 |
| | | | Series 2006H, 4.500%, 7/01/33 – AMBAC Insured | | | | |
| | 20 | | Connecticut Health and Educational Facilities Authority, Revenue Bonds, Eastern Connecticut | 2/16 at 100.00 | AA | | 20,068 |
| | | | Health Network, Series 2000A, 6.125%, 7/01/20 – RAAI Insured | | | | |
| | 840 | | Connecticut Health and Educational Facilities Authority, Revenue Bonds, Eastern Connecticut | 2/16 at 100.00 | AA | | 841,378 |
| | | | Health Network, Series 2005, 5.000%, 7/01/25 – RAAI Insured | | | | |
| | | | Connecticut Health and Educational Facilities Authority, Revenue Bonds, Griffin Hospital, | | | | |
| | | | Series 2005B: | | | | |
| | 2,400 | | 5.000%, 7/01/20 – RAAI Insured | 2/16 at 100.00 | A3 | | 2,405,856 |
| | 1,050 | | 5.000%, 7/01/23 – RAAI Insured | 2/16 at 100.00 | A3 | | 1,051,932 |
| | 7,025 | | Connecticut Health and Educational Facilities Authority, Revenue Bonds, Hartford HealthCare, | 7/21 at 100.00 | A | | 7,638,845 |
| | | | Series 2011A, 5.000%, 7/01/41 | | | | |
| | 500 | | Connecticut Health and Educational Facilities Authority, Revenue Bonds, Hartford HealthCare, | No Opt. Call | A | | 549,935 |
| | | | Series 2014E, 5.000%, 7/01/42 | | | | |
| | | | Connecticut Health and Educational Facilities Authority, Revenue Bonds, Hospital For Special | | | | |
| | | | Care, Series 2007C: | | | | |
| | 1,065 | | 5.250%, 7/01/32 – RAAI Insured | 7/17 at 100.00 | AA | | 1,118,239 |
| | 300 | | 5.250%, 7/01/37 – RAAI Insured | 7/17 at 100.00 | AA | | 314,037 |
| | 2,000 | | Connecticut Health and Educational Facilities Authority, Revenue Bonds, Lawrence and Memorial | 7/21 at 100.00 | A | | 2,174,760 |
| | | | Hospitals, Series 2011F, 5.000%, 7/01/36 | | | | |
| | | | Connecticut Health and Educational Facilities Authority, Revenue Bonds, Middlesex Hospital, | | | | |
| | | | Series 2011N: | | | | |
| | 1,105 | | 5.000%, 7/01/25 | 7/21 at 100.00 | A2 | | 1,229,887 |
| | 400 | | 5.000%, 7/01/26 | 7/21 at 100.00 | A2 | | 443,788 |
| | 500 | | 5.000%, 7/01/27 | 7/21 at 100.00 | A2 | | 552,020 |
| | 1,915 | | Connecticut Health and Educational Facilities Authority, Revenue Bonds, Middlesex Hospital, | 7/25 at 100.00 | A2 | | 2,134,785 |
| | | | Series 2015O, 5.000%, 7/01/36 | | | | |
| | 1,275 | | Connecticut Health and Educational Facilities Authority, Revenue Bonds, Stamford Hospital, | 7/20 at 10.00 | A | | 1,407,039 |
| | | | Series 2010-I, 5.000%, 7/01/30 | | | | |
| | 7,000 | | Connecticut Health and Educational Facilities Authority, Revenue Bonds, Stamford Hospital, | 7/22 at 100.00 | A | | 7,508,340 |
| | | | Series 2012J, 5.000%, 7/01/42 | | | | |
| | 3,905 | | Connecticut Health and Educational Facilities Authority, Revenue Bonds, Western Connecticut | 7/21 at 100.00 | A | | 4,335,136 |
| | | | Health, Series 2011M, 5.375%, 7/01/41 | | | | |
| | 4,000 | | Connecticut Health and Educational Facilities Authority, Revenue Bonds, Western Connecticut | 7/21 at 100.00 | A | | 4,411,800 |
| | | | Health, Series 2011N, 5.000%, 7/01/29 | | | | |
| | | | Connecticut Health and Educational Facilities Authority, Revenue Bonds, Yale-New Haven Health | | | | |
| | | | Issue, Series 2014E: | | | | |
| | 2,610 | | 5.000%, 7/01/32 | 7/24 at 100.00 | Aa3 | | 2,985,475 |
| | 2,740 | | 5.000%, 7/01/33 | 7/24 at 100.00 | Aa3 | | 3,123,107 |
| | 900 | | 5.000%, 7/01/34 | 7/24 at 100.00 | Aa3 | | 1,022,931 |
| | 7,475 | | Monroe County Industrial Development Corporation, New York, FHA Insured Mortgage Revenue | 2/21 at 100.00 | AA | | 8,724,970 |
| | | | Bonds, Unity Hospital of Rochester Project, Series 2010, 5.500%, 8/15/40 | | | | |
| | 61,635 | | Total Health Care | | | | 67,464,072 |
| | | | | | | | |
| | Principal | | | Optional Call | | | |
| | Amount (000) | | Description (1) | Provisions (2) | Ratings (3) | | Value |
| | | | Housing/Single Family – 2.9% (1.9% of Total Investments) | | | | |
| $ | 3,900 | | Connecticut Housing Finance Authority, Housing Mortgage Finance Program Bonds, Series 2006D, | 5/16 at 100.00 | AAA | $ | 3,933,657 |
| | | | 4.650%, 11/15/27 | | | | |
| | | | Connecticut Housing Finance Authority, Single Family Housing Mortgage Finance Program Bonds, | | | | |
| | | | Series 2010-A2: | | | | |
| | 630 | | 4.500%, 11/15/30 | 11/19 at 100.00 | AAA | | 658,067 |
| | 1,500 | | 4.750%, 11/15/35 | 11/19 at 100.00 | AAA | | 1,562,520 |
| | 6,030 | | Total Housing/Single Family | | | | 6,154,244 |
| | | | Long-Term Care – 2.5% (1.6% of Total Investments) | | | | |
| | 1,100 | | Connecticut Health and Educational Facilities Authority, Revenue Bonds, Duncaster, Inc., | 8/24 at 100.00 | BBB– | | 1,110,329 |
| | | | Series 2014A, 5.000%, 8/01/44 | | | | |
| | 1,500 | | Connecticut Housing Finance Authority, Special Needs Housing Mortgage Finance Program Special | 2/16 at 100.00 | N/R | | 1,501,140 |
| | | | Obligation Bonds, Series 2002SNH-1, 5.000%, 6/15/32 – AMBAC Insured | | | | |
| | 1,380 | | Connecticut Housing Finance Authority, State Supported Special Obligation Bonds, Refunding | 6/20 at 100.00 | AA | | 1,487,226 |
| | | | Series 2010-16, 5.000%, 6/15/30 | | | | |
| | 1,125 | | Connecticut State Development Authority, Health Facilities Revenue Bonds, Alzheimer’s Resource | 8/17 at 100.00 | N/R | | 1,151,775 |
| | | | Center of Connecticut, Inc., Series 2007, 5.500%, 8/15/27 | | | | |
| | 5,105 | | Total Long-Term Care | | | | 5,250,470 |
| | | | Tax Obligation/General – 26.7% (16.9% of Total Investments) | | | | |
| | | | Bridgeport, Connecticut, General Obligation Bonds, Series 2014A: | | | | |
| | 2,345 | | 5.000%, 7/01/32 – AGM Insured | 7/24 at 100.00 | AA | | 2,688,074 |
| | 1,600 | | 5.000%, 7/01/34 – AGM Insured | 7/24 at 100.00 | AA | | 1,827,584 |
| | 5,100 | | Connecticut State, General Obligation Bonds, Green Series 2014G, 5.000%, 11/15/31 | 11/24 at 100.00 | AA | | 5,878,668 |
| | 2,290 | | Connecticut State, General Obligation Bonds, Refunding Series 2012E, 5.000%, 9/15/32 | 9/22 at 100.00 | AA | | 2,639,294 |
| | 3,500 | | Connecticut State, General Obligation Bonds, Series 2006A, 4.750%, 12/15/24 | 12/16 at 100.00 | AA | | 3,650,780 |
| | 2,100 | | Connecticut State, General Obligation Bonds, Series 2006E, 5.000%, 12/15/20 | 12/16 at 10.00 | AA | | 2,200,065 |
| | 1,000 | | Connecticut State, General Obligation Bonds, Series 2011D, 5.000%, 11/01/31 | 11/21 at 100.00 | AA | | 1,157,830 |
| | 2,600 | | Connecticut State, General Obligation Bonds, Series 2014A, 5.000%, 3/01/31 | 3/24 at 100.00 | AA | | 2,969,356 |
| | 3,500 | | Connecticut State, General Obligation Bonds, Series 2014F, 5.000%, 11/15/34 | 11/24 at 100.00 | AA | | 3,990,210 |
| | 1,000 | | Hartford, Connecticut, General Obligation Bonds, Refunding Series 2013A, 5.000%, 4/01/31 | 4/23 at 100.00 | AA– | | 1,124,480 |
| | 870 | | Hartford, Connecticut, General Obligation Bonds, Series 2009A, 5.000%, 8/15/28 | 8/19 at 100.00 | AA | | 958,749 |
| | 2,000 | | Hartford, Connecticut, General Obligation Bonds, Series 2013B, 5.000%, 4/01/33 | 4/23 at 100.00 | AA– | | 2,243,380 |
| | 2,150 | | New Haven, Connecticut, General Obligation Bonds, Series 2006, 5.000%, 11/01/17 – AMBAC Insured | 11/16 at 100.00 | A– | | 2,233,485 |
| | | | New Haven, Connecticut, General Obligation Bonds, Series 2015: | | | | |
| | 790 | | 5.000%, 9/01/32 – AGM Insured | 9/25 at 100.00 | AA | | 894,833 |
| | 1,620 | | 5.000%, 9/01/33 – AGM Insured | 9/25 at 100.00 | AA | | 1,829,239 |
| | 500 | | 5.000%, 9/01/35 – AGM Insured | 9/25 at 100.00 | AA | | 561,050 |
| | 985 | | New Haven, Connecticut, General Obligation Bonds, Series 2014A, 5.000%, 8/01/33 – AGM Insured | 8/24 at 100.00 | AA | | 1,100,866 |
| | 900 | | North Haven, Connecticut, General Obligation Bonds, Series 2006, 5.000%, 7/15/24 | No Opt. Call | Aa1 | | 1,103,193 |
| | 3,890 | | Oregon State, General Obligation Bonds, Oregon University System Projects, Series 2011G, | 8/21 at 100.00 | AA+ | | 4,521,892 |
| | | | 5.000%, 8/01/36 | | | | |
| | 2,500 | | Stamford, Connecticut, General Obligation Bonds, Refunding Series 2014, 3.000%, 8/15/22 | 8/21 at 100.00 | AAA | | 2,692,225 |
| | 2,630 | | State of Connecticut General Obligation Bonds 2015 Series F, 5.000%, 11/15/34 (WI/DD, | 11/25 at 100.00 | AA | | 3,033,258 |
| | | | Settling 12/01/15) | | | | |
| | 600 | | Stratford, Connecticut, General Obligation Bonds, Series 2014, 5.000%, 12/15/32 | 12/22 at 100.00 | AA | | 683,820 |
| | | | Suffield, Connecticut, General Obligation Bonds, Series 2005: | | | | |
| | 800 | | 5.000%, 6/15/17 | No Opt. Call | AA+ | | 853,544 |
| | 820 | | 5.000%, 6/15/19 | No Opt. Call | AA+ | | 931,922 |
| | 1,400 | | 5.000%, 6/15/21 | No Opt. Call | AA+ | | 1,666,798 |
| | | |
NTC | Nuveen Connecticut Premium Income Municipal Fund | |
| | Portfolio of Investments (continued) | November 30, 2015 (Unaudited) |
| | | | | | | | |
| | Principal | | | Optional Call | | | |
| | Amount (000) | | Description (1) | Provisions (2) | Ratings (3) | | Value |
| | | | Tax Obligation/General (continued) | | | | |
| | | | Waterbury, Connecticut, General Obligation Bonds, Lot A Series 2015: | | | | |
| $ | 445 | | 5.000%, 8/01/30 (WI/DD, Settling 12/02/15) – BAM Insured | 8/25 at 100.00 | AA | $ | 515,123 |
| | 390 | | 5.000%, 8/01/31 (WI/DD, Settling 12/02/15) – BAM Insured | 8/25 at 100.00 | AA | | 448,991 |
| | 610 | | 5.000%, 8/01/32 (WI/DD, Settling 12/02/15) – BAM Insured | 8/25 at 100.00 | AA | | 699,536 |
| | 445 | | 5.000%, 8/01/33 (WI/DD, Settling 12/02/15) – BAM Insured | 8/25 at 100.00 | AA | | 509,917 |
| | 445 | | 5.000%, 8/01/34 (WI/DD, Settling 12/02/15) – BAM Insured | 8/25 at 100.00 | AA | | 507,536 |
| | 49,825 | | Total Tax Obligation/General | | | | 56,115,698 |
| | | | Tax Obligation/Limited – 22.2% (14.1% of Total Investments) | | | | |
| | | | Connecticut State, Special Tax Obligation Bonds, Transportation Infrastructure Purposes, | | | | |
| | | | Series 2014A: | | | | |
| | 3,835 | | 5.000%, 9/01/33 | 9/24 at 100.00 | AA | | 4,466,356 |
| | 1,000 | | 5.000%, 9/01/34 | 9/24 at 100.00 | AA | | 1,159,590 |
| | 2,500 | | Connecticut State, Special Tax Obligation Transportation Infrastructure Purposes Bonds, Series | No Opt. Call | AA | | 2,854,675 |
| | | | 2012A, 5.000%, 1/01/33 | | | | |
| | 3,855 | | Connecticut State, Special Tax Obligation Transportation Infrastructure Purposes Bonds, Series | 10/23 at 100.00 | AA | | 4,453,759 |
| | | | 2013A, 5.000%, 10/01/33 | | | | |
| | 1,380 | | Connecticut State, Special Tax Obligation Transportation Infrastructure Purposes Bonds, Series | 8/25 at 100.00 | AA | | 1,616,435 |
| | | | 2015A, 5.000%, 8/01/33 | | | | |
| | 1,000 | | Connecticut, Certificates of Participation, Juvenile Training School, Series 2001, | 2/16 at 100.00 | AA– | | 1,002,620 |
| | | | 5.000%, 12/15/30 | | | | |
| | | | Government of Guam, Business Privilege Tax Bonds, Series 2011A: | | | | |
| | 840 | | 5.250%, 1/01/36 | 1/22 at 100.00 | A | | 925,730 |
| | 3,200 | | 5.125%, 1/01/42 | 1/22 at 100.00 | A | | 3,475,424 |
| | 3,000 | | Harbor Point Infrastructure Improvement District, Connecticut, Special Obligation Revenue | 4/20 at 100.00 | N/R | | 3,566,640 |
| | | | Bonds, Harbor Point Project, Series 2010A, 7.875%, 4/01/39 | | | | |
| | 2,550 | | Puerto Rico Municipal Finance Agency, Series 2005C, 5.000%, 8/01/16 – AGM Insured | 2/16 at 100.00 | AA | | 2,558,645 |
| | 1,500 | | Puerto Rico Municipal Finance Agency, Series 2002A, 5.250%, 8/01/21 – AGM Insured | 2/16 at 100.00 | AA | | 1,505,370 |
| | 1,300 | | University of Connecticut, General Obligation Bonds, Series 2006A, 5.000%, 2/15/19 – | 2/16 at 100.00 | AA | | 1,312,805 |
| | | | FGIC Insured | | | | |
| | 2,600 | | University of Connecticut, General Obligation Bonds, Series 2010A, 5.000%, 2/15/28 | 2/20 at 100.00 | AA | | 2,943,616 |
| | | | University of Connecticut, General Obligation Bonds, Series 2013A: | | | | |
| | 2,290 | | 5.000%, 8/15/20 | No Opt. Call | AA | | 2,662,537 |
| | 2,500 | | 5.000%, 8/15/32 | 8/23 at 100.00 | AA | | 2,871,375 |
| | 760 | | University of Connecticut, General Obligation Bonds, Series 2014A, 5.000%, 2/15/31 | 2/24 at 100.00 | AA | | 880,620 |
| | 1,415 | | University of Connecticut, General Obligation Bonds, Series 2015A, 5.000%, 2/15/34 | No Opt. Call | AA | | 1,632,542 |
| | | | Virgin Islands Public Finance Authority, Gross Receipts Taxes Loan Note, Refunding | | | | |
| | | | Series 2012A: | | | | |
| | 2,275 | | 5.000%, 10/01/32 | No Opt. Call | BBB+ | | 2,464,940 |
| | 1,790 | | 5.000%, 10/01/32 – AGM Insured | No Opt. Call | AA | | 1,971,452 |
| | 2,150 | | Virgin Islands Public Finance Authority, Matching Fund Loan Notes Revenue Bonds, Senior Lien | 10/20 at 100.00 | BBB | | 2,344,167 |
| | | | Series 2010A, 5.000%, 10/01/29 | | | | |
| | 41,740 | | Total Tax Obligation/Limited | | | | 46,669,298 |
| | | | Transportation – 0.3% (0.1% of Total Investments) | | | | |
| | 450 | | Virgin Islands Port Authority, Marine Revenue Bonds, Refunding Series 2014B, 5.000%, 9/01/44 | 9/24 at 100.00 | BBB+ | | 488,120 |
| | | | U.S. Guaranteed – 14.4% (9.2% of Total Investments) (5) | | | | |
| | | | Connecticut Health and Educational Facilities Authority, Child Care Facilities Program Revenue | | | | |
| | | | Bonds, Series 2006F: | | | | |
| | 2,525 | | 5.000%, 7/01/31 (Pre-refunded 7/01/16) – AGC Insured | 7/16 at 100.00 | AA (5) | | 2,593,301 |
| | 2,930 | | 5.000%, 7/01/36 (Pre-refunded 7/01/16) – AGC Insured | 7/16 at 100.00 | AA (5) | | 3,009,257 |
| | 2,500 | | Connecticut Health and Educational Facilities Authority, Revenue Bonds, Middlesex Hospital, | 7/16 at 100.00 | A2 (5) | | 2,567,625 |
| | | | Series 2006, 5.000%, 7/01/32 (Pre-refunded 7/01/16) – AGM Insured | | | | |
| | | | | | | | |
| | Principal | | | Optional Call | | | |
| | Amount (000) | | Description (1) | Provisions (2) | Ratings (3) | | Value |
| | | | U.S. Guaranteed (5) (continued) | | | | |
| $ | 4,405 | | Connecticut Health and Educational Facilities Authority, Revenue Bonds, Quinnipiac University, | 7/17 at 100.00 | AA– (5) | $ | 4,705,025 |
| | | | Series 2007-I, 5.000%, 7/01/25 (Pre-refunded 7/01/17) – NPFG Insured | | | | |
| | | | Connecticut Health and Educational Facilities Authority, Revenue Bonds, Renbrook School, | | | | |
| | | | Series 2007A: | | | | |
| | 465 | | 5.000%, 7/01/30 (Pre-refunded 7/01/17) – AMBAC Insured | 7/17 at 100.00 | N/R (5) | | 496,671 |
| | 735 | | 5.000%, 7/01/37 (Pre-refunded 7/01/17) – AMBAC Insured | 7/17 at 100.00 | N/R (5) | | 785,061 |
| | 775 | | Connecticut Health and Educational Facilities Authority, Revenue Bonds, William W. Backus | 7/18 at 100.00 | AA (5) | | 857,352 |
| | | | Hospital, Series 2005F, 5.125%, 7/01/35 (Pre-refunded 7/01/18) – AGM Insured | | | | |
| | 4,010 | | Connecticut Health and Educational Facilities Authority, Revenue Bonds, Yale-New Haven | 7/16 at 100.00 | Aa3 (5) | | 4,118,471 |
| | | | Hospital, Series 2006J-1, 5.000%, 7/01/31 (Pre-refunded 7/01/16) – AMBAC Insured | | | | |
| | 1,240 | | Connecticut Health and Educational Facilities Authority, Revenue Bonds, Yale-New Haven | 7/20 at 100.00 | Aa3 (5) | | 1,474,484 |
| | | | Hospital, Series 2010M, 5.500%, 7/01/40 (Pre-refunded 7/01/20) | | | | |
| | 5,000 | | Connecticut State, Special Tax Obligation Transportation Infrastructure Bonds, Series 2007A, | 8/17 at 100.00 | AA (5) | | 5,359,900 |
| | | | 5.000%, 8/01/27 (Pre-refunded 8/01/17) – AMBAC Insured | | | | |
| | 870 | | Hartford, Connecticut, General Obligation Bonds, Series 2009A, 5.000%, 8/15/28 | 8/19 at 100.00 | AA (5) | | 993,383 |
| | | | (Pre-refunded 8/15/19) | | | | |
| | 40 | | New Haven, Connecticut, General Obligation Bonds, Series 2002A, 5.250%, 11/01/17 – AMBAC | 2/16 at 100.00 | A– (5) | | 41,587 |
| | | | Insured (ETM) | | | | |
| | 1,010 | | Puerto Rico Public Finance Corporation, Commonwealth Appropriation Bonds, Series 1998A, | No Opt. Call | Aaa | | 1,204,183 |
| | | | 5.125%, 6/01/24 – AMBAC Insured (ETM) | | | | |
| | 1,725 | | Stamford, Connecticut, Special Obligation Revenue Bonds, Mill River Corridor Project, Series | 4/21 at 100.00 | N/R (5) | | 2,199,358 |
| | | | 2011aA, 7.000%, 4/01/41 (Pre-refunded 4/01/21) | | | | |
| | 28,230 | | Total U.S. Guaranteed | | | | 30,405,658 |
| | | | Utilities – 6.5% (4.1% of Total Investments) | | | | |
| | 4,375 | | Connecticut Development Authority, Water Facility Revenue Bonds, Aquarion Water Company | 9/17 at 100.00 | N/R | | 4,484,200 |
| | | | Project, Series 2007, 5.100%, 9/01/37 – SYNCORA GTY Insured (Alternative Minimum Tax) | | | | |
| | | | Connecticut Municipal Electric Energy Cooperative, Power Supply System Revenue Bonds, Tender | | | | |
| | | | Option Bond Trust 1164: | | | | |
| | 1,295 | | 17.242%, 1/01/32 (IF) (4) | 1/23 at 100.00 | Aa3 | | 2,013,492 |
| | 410 | | 17.082%, 1/01/38 (IF) (4) | 1/23 at 100.00 | Aa3 | | 594,557 |
| | | | Connecticut Transmission Municipal Electric Energy Cooperative, Transmission System Revenue | | | | |
| | | | Bonds, Series 2012A: | | | | |
| | 655 | | 5.000%, 1/01/31 | 1/22 at 100.00 | Aa3 | | 737,058 |
| | 500 | | 5.000%, 1/01/32 | 1/22 at 100.00 | Aa3 | | 561,150 |
| | 2,830 | | 5.000%, 1/01/42 | 1/22 at 100.00 | Aa3 | | 3,131,027 |
| | 2,115 | | Eastern Connecticut Resource Recovery Authority, Solid Waste Revenue Bonds, Wheelabrator | 1/16 at 100.00 | A– | | 2,134,014 |
| | | | Lisbon Project, Series 1993A, 5.500%, 1/01/20 (Alternative Minimum Tax) | | | | |
| | 12,180 | | Total Utilities | | | | 13,655,498 |
| | | | Water and Sewer – 15.8% (10.0% of Total Investments) | | | | |
| | | | Greater New Haven Water Pollution Control Authority, Connecticut, Regional Wastewater System | | | | |
| | | | Revenue Bonds, Refunding Series 2014B: | | | | |
| | 500 | | 5.000%, 8/15/30 | 8/24 at 100.00 | A+ | | 579,855 |
| | 1,000 | | 5.000%, 8/15/31 | 8/24 at 100.00 | A+ | | 1,154,720 |
| | 500 | | 5.000%, 8/15/32 | 8/24 at 100.00 | A+ | | 575,700 |
| | 55 | | Greater New Haven Water Pollution Control Authority, Connecticut, Regional Wastewater System | 11/16 at 100.00 | AA– | | 55,194 |
| | | | Revenue Bonds, Series 2005A, 5.000%, 8/15/35 – NPFG Insured | | | | |
| | 2,050 | | Guam Government Waterworks Authority, Water and Wastewater System Revenue Bonds, Series 2010, | 7/20 at 100.00 | A– | | 2,247,600 |
| | | | 5.625%, 7/01/40 | | | | |
| | 6,815 | | Hartford County Metropolitan District, Connecticut, Clean Water Project Revenue Bonds, Green | 11/24 at 100.00 | AA | | 7,805,697 |
| | | | Bond Series 2014A, 5.000%, 11/01/42 | | | | |
| | | |
NTC | Nuveen Connecticut Premium Income Municipal Fund | |
| | Portfolio of Investments (continued) | November 30, 2015 (Unaudited) |
| | | | | | | | |
| | Principal | | | Optional Call | | | |
| | Amount (000) | | Description (1) | Provisions (2) | Ratings (3) | | Value |
| | | | Water and Sewer (continued) | | | | |
| | | | Hartford County Metropolitan District, Connecticut, Clean Water Project Revenue Bonds, | | | | |
| | | | Series 2013A: | | | | |
| $ | 4,100 | | 5.000%, 4/01/36 | 4/22 at 100.00 | AA | $ | 4,610,081 |
| | 2,500 | | 5.000%, 4/01/39 | 4/22 at 100.00 | AA | | 2,795,650 |
| | 795 | | South Central Connecticut Regional Water Authority Water System Revenue Bonds, Thirtieth | 8/24 at 100.00 | Aa3 | | 899,344 |
| | | | Series 2014A, 5.000%, 8/01/44 | | | | |
| | 1,840 | | South Central Connecticut Regional Water Authority, Water System Revenue Bonds, Twentieth | 8/16 at 100.00 | AA– | | 1,891,465 |
| | | | Series, 2007A, 5.000%, 8/01/30 – NPFG Insured | | | | |
| | 4,870 | | South Central Connecticut Regional Water Authority, Water System Revenue Bonds, | 8/21 at 100.00 | Aa3 | | 5,558,715 |
| | | | Twentieth-Sixth Series, 2011, 5.000%, 8/01/41 | | | | |
| | 4,000 | | South Central Connecticut Regional Water Authority, Water System Revenue Bonds, Twenty-Seventh | No Opt. Call | Aa3 | | 4,500,760 |
| | | | Series 2012, 5.000%, 8/01/33 | | | | |
| | 500 | | Stamford, Connecticut, Water Pollution Control System and Facility Revenue Bonds, Series | 8/23 at 100.00 | AA+ | | 578,741 |
| | | | 2013A, 5.250%, 8/15/43 | | | | |
| | 29,525 | | Total Water and Sewer | | | | 33,253,522 |
| $ | 301,105 | | Total Long-Term Investments (cost $314,718,646) | | | | 331,340,303 |
| | | | Floating Rate Obligations – (9.2)% | | | | (19,370,000) |
| | | | Variable Rate MuniFund Term Preferred Shares, at Liquidation Value – (50.3)% (6) | | | | (106,000,000) |
| | | | Other Assets Less Liabilities – 2.1% | | | | 4,577,841 |
| | | | Net Assets Applicable to Common Shares – 100% | | | $ | 210,548,144 |
| (1) | All percentages shown in the Portfolio of Investments are based on net assets applicable to Common shares unless otherwise noted. |
| (2) | Optional Call Provisions: Dates (month and year) and prices of the earliest optional call or redemption. There may be other call provisions at varying prices at later dates. Certain mortgage-backed securities may be subject to periodic principal paydowns. |
| (3) | Ratings: Using the highest of Standard & Poor’s Group (“Standard & Poor’s”), Moody’s Investors Service, Inc. (“Moody’s”) or Fitch, Inc. (“Fitch”) rating. Ratings below BBB by Standard & Poor’s, Baa by Moody’s or BBB by Fitch are considered to be below investment grade. Holdings designated N/R are not rated by any of these national rating agencies. |
| (4) | Investment, or portion of investment, has been pledged to collateralize the net payment obligations for investments in inverse floating rate transactions. |
| (5) | Backed by an escrow or trust containing sufficient U.S. Government or U.S. Government agency securities, which ensure the timely payment of principal and interest. Certain bonds backed by U.S. Government or agency securities are recognized as having an implied rating equal to the rating of such securities. |
| (6) | Variable Rate MuniFund Term Preferred Shares, at Liquidation Value as a percentage of Total Investments is 32.0%. (ETM) Escrowed to maturity. |
| (IF) | Inverse floating rate investment. |
| (UB) | Underlying bond of an inverse floating rate trust reflected as a financing transaction. See Notes to Financial Statements, Note 3 – Portfolio Securities and Investments in Derivatives, Inverse Floating Rate Securities for more information. |
| (WI/DD) | Investment, or portion of investment, purchased on a when-issued or delayed delivery basis. |
See accompanying notes to financial statements.
| | |
NMT | |
Nuveen Massachusetts Premium Income Municipal Fund |
Portfolio of Investments | November 30, 2015 (Unaudited) |
| | | | | | | | |
| | Principal | | | Optional Call | | | |
| | Amount (000) | | Description (1) | Provisions (2) | Ratings (3) | | Value |
| | | | LONG-TERM INVESTMENTS – 151.6% (100.0% of Total Investments) | | | | |
| | |
| | | | MUNICIPAL BONDS – 151.6% (100.0% of Total Investments) | | | | |
| | |
| | | | Consumer Discretionary – 1.0% (0.7% of Total Investments) | | | | |
| $ | 1,905 | | Boston Industrial Development Financing Authority, Massachusetts, Senior Revenue Bonds, | 2/16 at 100.00 | Caa3 | $ | 1,352,550 |
| | | | Crosstown Center Project, Series 2002, 6.500%, 9/01/35 (Alternative Minimum Tax) (4) | | | | |
| | | | Education and Civic Organizations – 41.5% (27.4% of Total Investments) | | | | |
| | | | Massachusetts Development Finance Agency, Revenue Bonds, Boston University, Tender Option | | | | |
| | | | Bond Trust 1163: | | | | |
| | 1,880 | | 17.206%, 10/01/48 (IF) (5) | 10/23 at 100.00 | A+ | | 2,764,897 |
| | 575 | | 17.105%, 10/01/48 (IF) (5) | 10/23 at 100.00 | A+ | | 845,313 |
| | 2,150 | | Massachusetts Development Finance Agency Revenue Bonds, Lesley University Issue Series B-1 and | 7/21 at 100.00 | AA | | 2,420,599 |
| | | | B-2, 5.250%, 7/01/33 – AGM Insured | | | | |
| | 2,200 | | Massachusetts Development Finance Agency, Revenue Bonds, Boston College Issue, Series 2013S, | 7/23 at 100.00 | AA– | | 2,491,720 |
| | | | 5.000%, 7/01/38 | | | | |
| | 750 | | Massachusetts Development Finance Agency, Revenue Bonds, Boston University, Series 2009V-1, | 10/19 at 100.00 | A+ | | 843,750 |
| | | | 5.000%, 10/01/29 | | | | |
| | 1,400 | | Massachusetts Development Finance Agency, Revenue Bonds, Emerson College, Series 2010A, | 1/20 at 100.00 | BBB+ | | 1,472,730 |
| | | | 5.000%, 1/01/40 | | | | |
| | | | Massachusetts Development Finance Agency, Revenue Bonds, MCPHS University Issue, Series 2015H: | | | | |
| | 450 | | 3.500%, 7/01/35 | 7/25 at 100.00 | AA– | | 452,957 |
| | 190 | | 5.000%, 7/01/37 | 7/25 at 100.00 | AA– | | 217,531 |
| | 550 | | Massachusetts Development Finance Agency, Revenue Bonds, Northeastern University, Series 2012, | No Opt. Call | A2 | | 632,968 |
| | | | 5.000%, 10/01/31 | | | | |
| | | | Massachusetts Development Finance Agency, Revenue Bonds, Northeastern University, Series 2014A: | | | | |
| | 875 | | 5.000%, 3/01/39 | 3/24 at 100.00 | A2 | | 982,328 |
| | 1,400 | | 5.000%, 3/01/44 | 3/24 at 100.00 | A2 | | 1,562,078 |
| | 500 | | Massachusetts Development Finance Agency, Revenue Bonds, Simmons College, Series 2013J, | No Opt. Call | BBB+ | | 546,940 |
| | | | 5.250%, 10/01/39 | | | | |
| | 1,000 | | Massachusetts Development Finance Agency, Revenue Bonds, Sterling and Francine Clark Art | 7/21 at 100.00 | AA | | 1,095,670 |
| | | | Institute, Series 2011A, 5.000%, 7/01/41 | | | | |
| | 1,230 | | Massachusetts Development Finance Agency, Revenue Bonds, Sterling and Francine Clark Art | 7/25 at 100.00 | AA | | 1,428,030 |
| | | | Institute, Series 2015, 5.000%, 7/01/33 | | | | |
| | 3,000 | | Massachusetts Development Finance Agency, Revenue Bonds, The Broad Institute, Series 2011A, | 4/21 at 100.00 | AA– | | 3,473,369 |
| | | | 5.250%, 4/01/37 | | | | |
| | 875 | | Massachusetts Development Finance Agency, Revenue Bonds, Tufts University, Series 2015Q, | 8/25 at 100.00 | Aa2 | | 1,019,008 |
| | | | 5.000%, 8/15/38 | | | | |
| | 2,095 | | Massachusetts Development Finance Agency, Revenue Bonds, Worcester Polytechnic Institute, | 9/17 at 100.00 | AA– | | 2,220,197 |
| | | | Series 2007, 5.000%, 9/01/37 – NPFG Insured | | | | |
| | 1,365 | | Massachusetts Development Finance Agency, Revenue Bonds, Worcester Polytechnic Institute, | 9/22 at 100.00 | A+ | | 1,513,089 |
| | | | Series 2012, 5.000%, 9/01/50 | | | | |
| | 3,000 | | Massachusetts Development Finance Authority, Revenue Bonds, WGBH Educational Foundation, | No Opt. Call | A | | 3,724,919 |
| | | | Series 2002A, 5.750%, 1/01/42 – AMBAC Insured | | | | |
| | 9,950 | | Massachusetts Development Finance Authority, Revenue Bonds, WGBH Educational Foundation, | 1/18 at 100.00 | AA | | 10,596,748 |
| | | | Series 2008A, 5.000%, 1/01/42 – AGC Insured | | | | |
| | | | Massachusetts Development Finance Authority, Revenue Refunding Bonds, Boston University, | | | | |
| | | | Series 1999P: | | | | |
| | 1,090 | | 6.000%, 5/15/29 | No Opt. Call | A1 | | 1,353,159 |
| | 1,000 | | 6.000%, 5/15/59 | 5/29 at 105.00 | A1 | | 1,249,500 |
| | | |
NMT | Nuveen Massachusetts Premium Income Municipal Fund |
| | Portfolio of Investments (continued) | November 30, 2015 (Unaudited) |
| | | | | | | | |
| | Principal | | | Optional Call | | | |
| | Amount (000) | | Description (1) | Provisions (2) | Ratings (3) | | Value |
| | | | Education and Civic Organizations (continued) | | | | |
| $ | 35 | | Massachusetts Educational Finance Authority, Educational Loan Revenue Bonds, Series 2001E, | No Opt. Call | AAA | $ | 35,142 |
| | | | 5.300%, 1/01/16 – AMBAC Insured (Alternative Minimum Tax) | | | | |
| | 350 | | Massachusetts Educational Financing Authority, Education Loan Revenue Bonds, Series 2008H, | 1/18 at 100.00 | AA | | 368,172 |
| | | | 6.350%, 1/01/30 – AGC Insured (Alternative Minimum Tax) | | | | |
| | 795 | | Massachusetts Educational Financing Authority, Educational Loan Revenue, Series 2011J, 5.625%, | 7/21 at 100.00 | AA | | 869,054 |
| | | | 7/01/33 (Alternative Minimum Tax) | | | | |
| | 255 | | Massachusetts Health and Educational Facilities Authority, Revenue Bonds, Northeastern | 10/20 at 100.00 | A2 | | 285,223 |
| | | | University, Series 2010A, 4.875%, 10/01/35 | | | | |
| | 1,500 | | Massachusetts Health and Educational Facilities Authority, Revenue Bonds, Springfield College, | 10/19 at 100.00 | Baa1 | | 1,629,870 |
| | | | Series 2010, 5.500%, 10/15/31 | | | | |
| | 2,030 | | Massachusetts Health and Educational Facilities Authority, Revenue Bonds, Wheaton College | 1/20 at 100.00 | A2 | | 2,255,127 |
| | | | Issues, Series 2010F, 5.000%, 1/01/41 | | | | |
| | 75 | | Massachusetts Health and Educational Facilities Authority, Revenue Bonds, Williams College, | 7/16 at 100.00 | AA+ | | 76,764 |
| | | | Series 2007L, 5.000%, 7/01/31 | | | | |
| | 500 | | Massachusetts Health and Educational Facilities Authority, Revenue Refunding Bonds, Suffolk | 7/19 at 100.00 | BBB | | 557,315 |
| | | | University Issue, Series 2009A, 5.750%, 7/01/39 | | | | |
| | 2,000 | | University of Massachusetts Building Authority, Project Revenue Bonds, Senior Series 2014-1, | 11/24 at 100.00 | Aa2 | | 2,290,740 |
| | | | 5.000%, 11/01/44 | | | | |
| | 4,000 | | University of Massachusetts Building Authority, Project Revenue Bonds, Senior Series 2015-1, | 11/25 at 100.00 | Aa2 | | 4,648,319 |
| | | | 5.000%, 11/01/40 | | | | |
| | 1,510 | | University of Massachusetts Building Authority, Senior Lien Project Revenue Bonds, Series | No Opt. Call | Aa2 | | 1,674,333 |
| | | | 2009-1, 5.000%, 5/01/39 | | | | |
| | 50,575 | | Total Education and Civic Organizations | | | | 57,597,559 |
| | | | Health Care – 29.6% (19.6% of Total Investments) | | | | |
| | 1,000 | | Massachusetts Development Finance Agency Revenue Bonds, Bay state Medical Center Issue, Series | 7/24 at 100.00 | A+ | | 1,105,310 |
| | | | 2014N, 5.000%, 7/01/44 | | | | |
| | 1,000 | | Massachusetts Development Finance Agency Revenue Bonds, Children’s Hospital Issue, Series | 10/24 at 100.00 | AA | | 1,133,120 |
| | | | 2014P, 5.000%, 10/01/46 | | | | |
| | 2,500 | | Massachusetts Development Finance Agency Revenue Bonds, Lahey Health System Obligated Group | 8/25 at 100.00 | A+ | | 2,800,825 |
| | | | Issue, Series 2015F, 5.000%, 8/15/45 | | | | |
| | 1,410 | | Massachusetts Development Finance Agency, Hospital Revenue Bonds, Cape Cod Healthcare | 11/23 at 100.00 | A | | 1,595,246 |
| | | | Obligated Group, Series 2013, 5.250%, 11/15/41 | | | | |
| | | | Massachusetts Development Finance Agency, Revenue Bonds, Berkshire Health Systems, Series | | | | |
| | | | 2012G: | | | | |
| | 895 | | 5.000%, 10/01/29 | 10/21 at 100.00 | A | | 988,886 |
| | 700 | | 5.000%, 10/01/31 | 10/21 at 100.00 | A | | 768,712 |
| | | | Massachusetts Development Finance Agency, Revenue Bonds, CareGroup Issue, Series 2015H-1: | | | | |
| | 900 | | 5.000%, 7/01/30 | 7/25 at 100.00 | A– | | 1,021,275 |
| | 1,000 | | 5.000%, 7/01/32 | 7/25 at 100.00 | A– | | 1,125,140 |
| | 500 | | 5.000%, 7/01/33 | 7/25 at 100.00 | A– | | 560,400 |
| | 1,000 | | Massachusetts Development Finance Agency, Revenue Bonds, Covenant Health System Obligated | 7/22 at 100.00 | A | | 1,093,980 |
| | | | Group, Series 2012, 5.000%, 7/01/31 | | | | |
| | 1,080 | | Massachusetts Development Finance Agency, Revenue Bonds, Milford Regional Medical Center | 7/23 at 100.00 | BBB– | | 1,185,613 |
| | | | Issue, Series 2014F, 5.750%, 7/15/43 | | | | |
| | 2,200 | | Massachusetts Development Finance Agency, Revenue Bonds, Partners HealthCare System, Series | 7/20 at 100.00 | AA | | 2,491,786 |
| | | | 2011K-6, 5.375%, 7/01/41 | | | | |
| | 1,000 | | Massachusetts Development Finance Agency, Revenue Bonds, Partners HealthCare System, Series | 7/21 at 100.00 | AA | | 1,141,320 |
| | | | 2012L, 5.000%, 7/01/36 | | | | |
| | | | | | | | |
| | Principal | | | Optional Call | | | |
| | Amount (000) | | Description (1) | Provisions (2) | Ratings (3) | | Value |
| | | | Health Care (continued) | | | | |
| $ | 820 | | Massachusetts Development Finance Agency, Revenue Bonds, Southcoast Health System Obligated | 7/23 at 100.00 | A– | $ | 905,616 |
| | | | Group Issue, Series 2013F, 5.000%, 7/01/37 | | | | |
| | | | Massachusetts Development Finance Agency, Revenue Bonds, The Lowell General Hospital, | | | | |
| | | | Series 2013G: | | | | |
| | 1,000 | | 5.000%, 7/01/37 | 7/23 at 100.00 | BBB+ | | 1,069,230 |
| | 2,200 | | 5.000%, 7/01/44 | 7/23 at 100.00 | BBB+ | | 2,334,530 |
| | 500 | | Massachusetts Development Finance Agency, Revenue Bonds, UMass Memorial Health, Series 2011H, | 7/21 at 100.00 | BBB+ | | 553,665 |
| | | | 5.500%, 7/01/31 | | | | |
| | 500 | | Massachusetts Health and Educational Facilities Authority Revenue Bonds, Quincy Medical Center | 1/18 at 100.00 | N/R | | 1,225 |
| | | | Issue, Series 2008A, 6.500%, 1/15/38 (7) | | | | |
| | 945 | | Massachusetts Health and Educational Facilities Authority, Partners HealthCare System Inc., | 7/17 at 100.00 | AA | | 1,000,944 |
| | | | Series 2007G, 5.000%, 7/01/32 | | | | |
| | 160 | | Massachusetts Health and Educational Facilities Authority, Revenue Bonds, Baystate Medical | 7/19 at 100.00 | A+ | | 179,597 |
| | | | Center, Series 2009I, 5.750%, 7/01/36 | | | | |
| | 500 | | Massachusetts Health and Educational Facilities Authority, Revenue Bonds, Cape Cod Healthcare | 11/19 at 100.00 | AA | | 559,580 |
| | | | Obligated Group, Series 2004D, 5.125%, 11/15/35 – AGC Insured | | | | |
| | | | Massachusetts Health and Educational Facilities Authority, Revenue Bonds, Caregroup Inc., | | | | |
| | | | Series B1 Capital Asset Program Converted June 13,2008: | | | | |
| | 3,380 | | 5.375%, 2/01/26 – NPFG Insured | 8/18 at 100.00 | AA– | | 3,706,169 |
| | 600 | | 5.375%, 2/01/27 – NPFG Insured | 8/18 at 100.00 | AA– | | 657,900 |
| | 770 | | 5.375%, 2/01/28 – NPFG Insured | 8/18 at 100.00 | AA– | | 841,264 |
| | | | Massachusetts Health and Educational Facilities Authority, Revenue Bonds, Caregroup Inc., | | | | |
| | | | Series B2, Capital Asset Program, Converted June 9, 2009: | | | | |
| | 2,000 | | 5.375%, 2/01/27 – NPFG Insured | 8/18 at 100.00 | AA– | | 2,193,000 |
| | 1,500 | | 5.375%, 2/01/28 – NPFG Insured | 8/18 at 100.00 | AA– | | 1,638,825 |
| | 2,000 | | Massachusetts Health and Educational Facilities Authority, Revenue Bonds, Children’s Hospital, | 12/19 at 100.00 | AA | | 2,263,240 |
| | | | Series 2009M, 5.500%, 12/01/39 | | | | |
| | 2,500 | | Massachusetts Health and Educational Facilities Authority, Revenue Bonds, Dana-Farber Cancer | 12/18 at 100.00 | A1 | | 2,719,825 |
| | | | Institute, Series 2008K, 5.000%, 12/01/37 | | | | |
| | 1,495 | | Massachusetts Health and Educational Facilities Authority, Revenue Bonds, Milford Regional | 7/17 at 100.00 | BBB– | | 1,521,417 |
| | | | Medical Center, Series 2007E, 5.000%, 7/15/32 | | | | |
| | 1,980 | | Massachusetts Health and Educational Facilities Authority, Revenue Bonds, UMass Memorial | 2/16 at 100.00 | BBB+ | | 1,985,782 |
| | | | Health Care, Series 2005D, 5.000%, 7/01/33 | | | | |
| | 38,035 | | Total Health Care | | | | 41,143,422 |
| | | | Housing/Multifamily – 3.7% (2.4% of Total Investments) | | | | |
| | 500 | | Boston Housing Authority, Massachusetts, Capital Program Revenue Bonds, Series 2008, 5.000%, | 4/18 at 100.00 | AA | | 544,100 |
| | | | 4/01/20 – AGM Insured | | | | |
| | 2,510 | | Massachusetts Development Finance Authority, Multifamily Housing Revenue Bonds, Emerson | 7/17 at 100.00 | BB– | | 2,547,399 |
| | | | Manor Project, Series 2007, 4.800%, 7/20/48 | | | | |
| | 2,000 | | Massachusetts Housing Finance Agency, Housing Bonds, Series 2003H, 5.125%, 6/01/43 | 2/16 at 100.00 | AA– | | 2,001,880 |
| | 5,010 | | Total Housing/Multifamily | | | | 5,093,379 |
| | | | Housing/Single Family – 1.6% (1.1% of Total Investments) | | | | |
| | 2,150 | | Massachusetts Housing Finance Agency, Single Family Housing Revenue Bonds, Series 2006-126, | 6/16 at 100.00 | AA | | 2,161,460 |
| | | | 4.625%, 6/01/32 (Alternative Minimum Tax) | | | | |
| | | | Long-Term Care – 3.5% (2.3% of Total Investments) | | | | |
| | 460 | | Massachusetts Development Finance Agency, Massachusetts, Berkshire Retirement Community | No Opt. Call | A– | | 516,364 |
| | | | Lennox, Series 2015, 5.000%, 7/01/31 | | | | |
| | 285 | | Massachusetts Development Finance Agency, Revenue Bonds, Carleton-Willard Village, Series | 12/19 at 100.00 | A– | | 319,417 |
| | | | 2010, 5.625%, 12/01/30 | | | | |
| | 1,000 | | Massachusetts Development Finance Agency, Revenue Bonds, Loomis Communities, Series 2013A, | 1/23 at 100.00 | BBB– | | 1,108,620 |
| | | | 5.250%, 1/01/26 | | | | |
| | | |
NMT | Nuveen Massachusetts Premium Income Municipal Fund |
| | Portfolio of Investments (continued) | November 30, 2015 (Unaudited) |
| | | | | | | | |
| | Principal | | | Optional Call | | | |
| | Amount (000) | | Description (1) | Provisions (2) | Ratings (3) | | Value |
| | | | Long-Term Care (continued) | | | | |
| $ | 500 | | Massachusetts Development Finance Agency, Revenue Bonds, North Hill Communities Issue, Series | 11/23 at 100.00 | N/R | $ | 548,170 |
| | | | 2013A, 6.250%, 11/15/28 | | | | |
| | 2,410 | | Massachusetts Development Finance Agency, Revenue Bonds, Orchard Cove, Series 2007, 5.250%, | 4/16 at 101.00 | N/R | | 2,436,124 |
| | | | 10/01/26 | | | | |
| | 4,655 | | Total Long-Term Care | | | | 4,928,695 |
| | | | Tax Obligation/General – 15.8% (10.4% of Total Investments) | | | | |
| | 2,000 | | Hampden-Wilbraham Regional School District, Hampden County, Massachusetts, General Obligation | 2/21 at 100.00 | Aa3 | | 2,200,580 |
| | | | Bonds, Series 2011, 5.000%, 2/15/41 | | | | |
| | 1,250 | | Hudson, Massachusetts, General Obligation Bonds, Municipal Purpose Loan Series 2011, | 2/20 at 100.00 | AA | | 1,408,488 |
| | | | 5.000%, 2/15/32 | | | | |
| | 1,010 | | Massachusetts Bay Transportation Authority, General Obligation Transportation System Bonds, | No Opt. Call | AA+ | | 1,203,011 |
| | | | Series 1991A, 7.000%, 3/01/21 | | | | |
| | 2,440 | | Massachusetts State, General Obligation Bonds, Consolidated Loan, Refunding Series 2014C, | No Opt. Call | AA+ | | 2,956,182 |
| | | | 5.000%, 8/01/22 | | | | |
| | 1,500 | | Massachusetts State, General Obligation Bonds, Consolidated Loan, Series 2004B, 5.250%, | No Opt. Call | AA+ | | 1,810,125 |
| | | | 8/01/21 – AGM Insured | | | | |
| | 2,000 | | Massachusetts State, General Obligation Bonds, Consolidated Loan, Series 2015C, 5.000%, 7/01/45 | 7/25 at 100.00 | AA+ | | 2,311,200 |
| | 1,000 | | Newburyport, Massachusetts, General Obligation Bonds, Municipal Purpose Loan, Refunding Series | 1/23 at 100.00 | AAA | | 1,074,320 |
| | | | 2013, 4.000%, 1/15/30 | | | | |
| | 1,775 | | North Reading, Massachusetts, General Obligation Bonds, Municipal Purpose Loan Series 2012, | 5/22 at 100.00 | Aa2 | | 1,987,521 |
| | | | 5.000%, 5/15/35 – AMBAC Insured | | | | |
| | 1,760 | | Norwell, Massachusetts, General Obligation Bonds, Series 2003, 5.000%, 11/15/20 – FGIC Insured | No Opt. Call | AAA | | 2,032,008 |
| | | | Quincy, Massachusetts, General Obligation Bonds, State Qualified Municipal Purpose Loan | | | | |
| | | | Series 2011: | | | | |
| | 1,280 | | 5.125%, 12/01/33 | 12/20 at 100.00 | Aa2 | | 1,457,459 |
| | 2,000 | | 5.250%, 12/01/38 | 12/20 at 100.00 | Aa2 | | 2,289,080 |
| | 1,220 | | Worcester, Massachusetts, General Obligation Bonds, Series 2005A, 5.000%, 7/01/19 – | 2/16 at 100.00 | AA– | | 1,255,099 |
| | | | FGIC Insured | | | | |
| | 19,235 | | Total Tax Obligation/General | | | | 21,985,073 |
| | | | Tax Obligation/Limited – 22.3% (14.7% of Total Investments) | | | | |
| | | | Government of Guam, Business Privilege Tax Bonds, Series 2011A: | | | | |
| | 2,000 | | 5.250%, 1/01/36 | 1/22 at 100.00 | A | | 2,204,120 |
| | 1,310 | | 5.125%, 1/01/42 | 1/22 at 100.00 | A | | 1,422,752 |
| | | | Government of Guam, Business Privilege Tax Bonds, Series 2012B-1: | | | | |
| | 400 | | 5.000%, 1/01/37 | 1/22 at 100.00 | A | | 433,304 |
| | 1,055 | | 5.000%, 1/01/42 | 1/22 at 100.00 | A | | 1,135,053 |
| | 855 | | Martha’s Vineyard Land Bank, Massachusetts, Revenue Bonds, Refunding Green Series 2014, | 11/24 at 100.00 | AA | | 981,437 |
| | | | 5.000%, 5/01/33 – BAM Insured | | | | |
| | 1,000 | | Massachusetts Bay Transportation Authority, Assessment Bonds, Series 2012A, 5.000%, 7/01/41 | 7/22 at 100.00 | AAA | | 1,150,010 |
| | 770 | | Massachusetts Bay Transportation Authority, Sales Tax Revenue Bonds, Refunding Senior Lien | No Opt. Call | AA+ | | 928,766 |
| | | | Series 2004C, 5.250%, 7/01/21 | | | | |
| | | | Massachusetts College Building Authority, Project Revenue Bonds, Green Series 2014B: | | | | |
| | 360 | | 5.000%, 5/01/39 | 5/24 at 100.00 | AA | | 411,772 |
| | 1,610 | | 5.000%, 5/01/44 | 5/24 at 100.00 | AA | | 1,830,007 |
| | 2,500 | | Massachusetts College Building Authority, Project Revenue Bonds, Series 2008A, 5.000%, 5/01/33 – | 5/18 at 100.00 | AA | | 2,709,425 |
| | | | AGC Insured | | | | |
| | 1,000 | | Massachusetts College Building Authority, Project Revenue Refunding Bonds, Series 2003B, | No Opt. Call | Aa2 | | 1,244,680 |
| | | | 5.375%, 5/01/23 – SYNCORA GTY Insured | | | | |
| | 855 | | Massachusetts College Building Authority, Revenue Bonds, Refunding Series 2012B, | 5/22 at 100.00 | AA | | 956,805 |
| | | | 5.000%, 5/01/37 | | | | |
| | | | | | | | |
| | Principal | | | Optional Call | | | |
| | Amount (000) | | Description (1) | Provisions (2) | Ratings (3) | | Value |
| | | | Tax Obligation/Limited (continued) | | | | |
| $ | $ 1,875 | | Massachusetts School Building Authority, Dedicated Sales Tax Revenue Bonds, Senior Series | 5/23 at 100.00 | AA+ | $ | 2,160,431 |
| | | | 2013A, 5.000%, 5/15/38 | | | | |
| | 1,350 | | Massachusetts School Building Authority, Dedicated Sales Tax Revenue Bonds, Senior Series | 8/25 at 100.00 | AA+ | | 1,575,059 |
| | | | 2015C, 5.000%, 8/15/37 (WI/DD, Settling 12/15/15) | | | | |
| | 1,875 | | Massachusetts School Building Authority, Dedicated Sales Tax Revenue Bonds, Series 2007A, | 8/17 at 100.00 | AA+ | | 1,991,081 |
| | | | 5.000%, 8/15/37 – AMBAC Insured | | | | |
| | | | Massachusetts School Building Authority, Dedicated Sales Tax Revenue Bonds, Series 2011B: | | | | |
| | 975 | | 5.000%, 10/15/35 | No Opt. Call | AA+ | | 1,127,909 |
| | 1,000 | | 5.000%, 10/15/41 | 10/21 at 100.00 | AA+ | | 1,156,120 |
| | 1,070 | | Massachusetts State, Special Obligation Dedicated Tax Revenue Bonds, Series 2005, 5.000%, | No Opt. Call | AA– | | 1,224,743 |
| | | | 1/01/20 – FGIC Insured | | | | |
| | 1,500 | | Massachusetts, Transportation Fund Revenue Bonds, Accelerated Bridge Program, Series 2013A, | 6/21 at 100.00 | AAA | | 1,735,065 |
| | | | 5.000%, 6/01/38 | | | | |
| | | | Virgin Islands Public Finance Authority, Gross Receipts Taxes Loan Note, Refunding | | | | |
| | | | Series 2012A: | | | | |
| | 2,700 | | 5.000%, 10/01/32 | No Opt. Call | BBB+ | | 2,925,423 |
| | 520 | | 5.000%, 10/01/32 – AGM Insured | No Opt. Call | AA | | 572,712 |
| | 1,000 | | Virgin Islands Public Finance Authority, Matching Fund Loan Notes Revenue Bonds, Series 2012A, | 10/22 at 100.00 | AA | | 1,101,370 |
| | | | 5.000%, 10/01/32 – AGM Insured | | | | |
| | 27,580 | | Total Tax Obligation/Limited | | | | 30,978,044 |
| | | | Transportation – 9.1% (6.0% of Total Investments) | | | | |
| | 400 | | Massachusetts Department of Transportation, Metropolitan Highway System Revenue Bonds, | 1/20 at 100.00 | AA+ | | 452,224 |
| | | | Commonwealth Contract Assistance Secured, Refunding Series 2010B, 5.000%, 1/01/35 | | | | |
| | 1,000 | | Massachusetts Port Authority, Airport System Revenue Bonds, Series 2010A, 5.000%, 7/01/30 | 7/20 at 100.00 | AA | | 1,143,570 |
| | 1,000 | | Massachusetts Port Authority, Revenue Bonds, Series 2012B, 5.000%, 7/01/33 | 7/22 at 100.00 | AA | | 1,158,380 |
| | | | Massachusetts Port Authority, Revenue Bonds, Series 2014A: | | | | |
| | 1,000 | | 5.000%, 7/01/39 | 7/24 at 100.00 | AA | | 1,144,680 |
| | 2,500 | | 5.000%, 7/01/44 | 7/24 at 100.00 | AA | | 2,843,500 |
| | | | Massachusetts Port Authority, Revenue Bonds, Series 2015A: | | | | |
| | 715 | | 5.000%, 7/01/40 | 7/25 at 100.00 | AA | | 828,828 |
| | 1,000 | | 5.000%, 7/01/45 | 7/25 at 100.00 | AA | | 1,151,130 |
| | 1,400 | | Massachusetts Port Authority, Special Facilities Revenue Bonds, BOSFUEL Corporation, Series | 7/17 at 100.00 | AA– | | 1,463,672 |
| | | | 2007, 5.000%, 7/01/32 – FGIC Insured (Alternative Minimum Tax) | | | | |
| | 1,225 | | Massachusetts Port Authority, Special Facilities Revenue Bonds, Delta Air Lines Inc., Series | 1/16 at 100.00 | N/R | | 1,228,210 |
| | | | 2001A, 5.000%, 1/01/27 – AMBAC Insured (Alternative Minimum Tax) | | | | |
| | 730 | | Metropolitan Boston Transit Parking Corporation, Massachusetts, Systemwide Senior Lien Parking | 7/21 at 100.00 | A+ | | 826,791 |
| | | | Revenue Bonds, Series 2011, 5.000%, 7/01/41 | | | | |
| | 330 | | Virgin Islands Port Authority, Marine Revenue Bonds, Refunding Series 2014B, 5.000%, 9/01/44 | 9/24 at 100.00 | BBB+ | | 357,954 |
| | 11,300 | | Total Transportation | | | | 12,598,939 |
| | | | U.S. Guaranteed – 12.0% (7.9% of Total Investments) (8) | | | | |
| | 685 | | Massachusetts Bay Transportation Authority, General Obligation Transportation System Bonds, | 3/17 at 100.00 | N/R (8) | | 717,784 |
| | | | Series 1991A, 7.000%, 3/01/21 (ETM) | | | | |
| | | | Massachusetts Bay Transportation Authority, Sales Tax Revenue Bonds, Senior Lien Series 2006C: | | | | |
| | 25 | | 5.000%, 7/01/26 (Pre-refunded 7/01/18) | 7/18 at 100.00 | AA+ (8) | | 27,618 |
| | 975 | | 5.000%, 7/01/26 (Pre-refunded 7/01/18) | 7/18 at 100.00 | AA+ (8) | | 1,077,083 |
| | 575 | | Massachusetts College Building Authority, Project Revenue Bonds, Series 2006A, 5.000%, 5/01/31 | 5/16 at 100.00 | Aa2 (8) | | 586,506 |
| | | | (Pre-refunded 5/01/16) – AMBAC Insured | | | | |
| | 2,185 | | Massachusetts Development Finance Agency, Revenue Bonds, Draper Laboratory, Series 2008, | 9/18 at 100.00 | Aa3 (8) | | 2,478,052 |
| | | | 5.875%, 9/01/30 (Pre-refunded 9/01/18) | | | | |
| | | |
NMT | Nuveen Massachusetts Premium Income Municipal Fund |
| | Portfolio of Investments (continued) | November 30, 2015 (Unaudited) |
| | | | | | | | |
| | Principal | | | Optional Call | | | |
| | Amount (000) | | Description (1) | Provisions (2) | Ratings (3) | | Value |
| | | | U.S. Guaranteed (8) (continued) | | | | |
| $ | 155 | | Massachusetts Development Finance Agency, Revenue Bonds, Northern Berkshire Community | 12/15 at 4.00 | N/R (8) | $ | 4,628 |
| | | | Services Inc., Series 2012A, 6.000%, 2/15/43 (Pre-refunded 12/31/15) (6), (7) | | | | |
| | 124 | | Massachusetts Development Finance Agency, Revenue Bonds, Northern Berkshire Community | 12/15 at 3.00 | N/R (8) | | 3,684 |
| | | | Services Inc., Series 2012B, 0.000%, 2/15/43 (Pre-refunded 12/31/15) (6), (7) | | | | |
| | 176 | | Massachusetts Development Finance Agency, Revenue Bonds, Northern Berkshire Community | 12/15 at 3.00 | N/R (8) | | 5,246 |
| | | | Services Inc., Series 2012C, 0.000%, 2/15/43 (Pre-refunded 12/31/15) (6), (7) | | | | |
| | 1,055 | | Massachusetts Health and Educational Facilities Authority, Partners HealthCare System Inc., | 7/17 at 100.00 | N/R (8) | | 1,128,597 |
| | | | Series 2007G, 5.000%, 7/01/32 (Pre-refunded 7/01/17) | | | | |
| | 410 | | Massachusetts Health and Educational Facilities Authority, Revenue Bonds, CareGroup Inc., | 7/21 at 100.00 | AA– (8) | | 474,239 |
| | | | Series 1998A, 5.000%, 7/01/25 (Pre-refunded 7/01/21) – NPFG Insured | | | | |
| | 3,000 | | Massachusetts Health and Educational Facilities Authority, Revenue Bonds, Lahey Medical | 8/17 at 100.00 | A+ (8) | | 3,233,910 |
| | | | Center, Series 2007D, 5.250%, 8/15/28 (Pre-refunded 8/15/17) | | | | |
| | 350 | | Massachusetts Health and Educational Facilities Authority, Revenue Bonds, Tufts University, | 8/18 at 100.00 | Aa2 (8) | | 391,836 |
| | | | Series 2008O, 5.375%, 8/15/38 (Pre-refunded 8/15/18) | | | | |
| | 515 | | Massachusetts Health and Educational Facilities Authority, Revenue Bonds, Williams College, | 7/16 at 100.00 | N/R (8) | | 529,147 |
| | | | Series 2007L, 5.000%, 7/01/31 (Pre-refunded 7/01/16) | | | | |
| | 1,000 | | Massachusetts State, General Obligation Bonds, Consolidated Loan, Series 2009A, 5.000%, | 3/19 at 100.00 | AA+ (8) | | 1,118,880 |
| | | | 3/01/21 (Pre-refunded 3/01/19) | | | | |
| | | | Massachusetts Water Pollution Abatement Trust, Pooled Loan Program Bonds, Series 2006-12: | | | | |
| | 785 | | 4.375%, 8/01/31 (Pre-refunded 8/01/16) | 8/16 at 100.00 | N/R (8) | | 806,336 |
| | 1,215 | | 4.375%, 8/01/31 (Pre-refunded 8/01/16) | 8/16 at 100.00 | AAA | | 1,248,024 |
| | 95 | | Massachusetts Water Resources Authority, General Revenue Bonds, Series 2005A, 5.000%, 8/01/28 | 8/17 at 100.00 | Aa1 (8) | | 101,899 |
| | | | (Pre-refunded 8/01/17) NPFG | | | | |
| | 1,500 | | Massachusetts Water Resources Authority, General Revenue Bonds, Series 2006A, 5.000%, 8/01/31 | 8/16 at 100.00 | AA+ (8) | | 1,547,040 |
| | | | (Pre-refunded 8/01/16) – AMBAC Insured | | | | |
| | 1,065 | | Puerto Rico, Highway Revenue Bonds, Highway and Transportation Authority, Series 2003AA, | No Opt. Call | A3 (8) | | 1,229,117 |
| | | | 5.500%, 7/01/19 – NPFG Insured (ETM) | | | | |
| | 15,890 | | Total U.S. Guaranteed | | | | 16,709,626 |
| | | | Utilities – 4.6% (3.0% of Total Investments) | | | | |
| | 2,580 | | Guam Power Authority, Revenue Bonds, Series 2010A, 5.000%, 10/01/37 – AGM Insured | 10/20 at 100.00 | AA | | 2,902,990 |
| | 1,265 | | Massachusetts Clean Energy Cooperative Corporation, Revenue Bonds, Massachusetts Municipal | 7/23 at 100.00 | A1 | | 1,446,553 |
| | | | Lighting Plant Cooperative, Series 2013, 5.000%, 7/01/32 | | | | |
| | 2,010 | | Massachusetts Development Finance Agency, Resource Recovery Revenue Refunding Bonds, Covanta | 11/17 at 100.00 | BB+ | | 2,010,101 |
| | | | Energy Project, Series 2012B, 4.875%, 11/01/42 | | | | |
| | 5,855 | | Total Utilities | | | | 6,359,644 |
| | | | Water and Sewer – 6.9% (4.5% of Total Investments) | | | | |
| | 500 | | Boston Water and Sewerage Commission, Massachusetts, General Revenue Bonds, Senior Lien | 11/19 at 100.00 | AA+ | | 563,310 |
| | | | Refunding Series 2010A, 5.000%, 11/01/30 | | | | |
| | 565 | | Guam Waterworks Authority, Water and Wastewater System Revenue Bonds, Refunding Series 2014A, | 7/24 at 100.00 | A– | | 630,698 |
| | | | 5.000%, 7/01/29 | | | | |
| | 415 | | Lynn Water and Sewer Commission, Massachusetts, General Revenue Bonds, Series 2003A, 5.000%, | 2/16 at 100.00 | AA– | | 416,419 |
| | | | 12/01/32 – NPFG Insured | | | | |
| | 2,300 | | Massachusetts Clean Water Trust, State Revolving Fund Bonds, Green 18 Series 2015, | 2/24 at 100.00 | AAA | | 2,625,634 |
| | | | 5.000%, 2/01/45 | | | | |
| | 60 | | Massachusetts Water Pollution Abatement Trust, Pooled Loan Program Bonds, Series 2003-9, | 2/16 at 100.00 | AAA | | 60,245 |
| | | | 5.000%, 8/01/22 | | | | |
| | 400 | | Massachusetts Water Pollution Abatement Trust, Revenue Bonds, MWRA Loan Program, | 2/16 at 100.00 | AAA | | 401,716 |
| | | | Series 2002A, 5.250%, 8/01/20 | | | | |
| | 1,000 | | Massachusetts Water Resources Authority, General Revenue Bonds, Series 2002J, 5.250%, | No Opt. Call | AA+ | | 1,150,970 |
| | | | 8/01/19 – AGM Insured | | | | |
| | | | | | | | |
| | Principal | | | Optional Call | | | |
| | Amount (000) | | Description (1) | Provisions (2) | Ratings (3) | | Value |
| | | | Water and Sewer (continued) | | | | |
| $ | 1,405 | | Massachusetts Water Resources Authority, General Revenue Bonds, Series 2005A, 5.000%, 8/01/28 | 8/17 at 100.00 | AA+ | $ | 1,494,189 |
| | 1,000 | | Massachusetts Water Resources Authority, General Revenue Bonds, Series 2006A, 4.000%, 8/01/46 | 8/16 at 100.00 | AA+ | | 1,002,230 |
| | 720 | | Springfield Water and Sewer Commission, Massachusetts, General Revenue Bonds, Refunding | 11/20 at 100.00 | AA | | 824,774 |
| | | | Series 2010B, 5.000%, 11/15/30 – AGC Insured | | | | |
| | | | Springfield Water and Sewer Commission, Massachusetts, General Revenue Bonds, Series 2014A: | | | | |
| | 185 | | 5.000%, 7/15/22 | No Opt. Call | AA– | | 222,544 |
| | 150 | | 5.000%, 7/15/23 | No Opt. Call | AA– | | 182,244 |
| | 8,700 | | Total Water and Sewer | | | | 9,574,973 |
| $ | 190,890 | | Total Long-Term Investments (cost $197,874,497) | | | | 210,483,364 |
| | | | Variable Rate MuniFund Term Preferred Shares, at Liquidation Value – (53.3)% (9) | | | | (74,000,000) |
| | | | Other Assets Less Liabilities – 1.7% | | | | 2,368,311 |
| | | | Net Assets Applicable to Common Shares – 100% | | | $ | 138,851,675 |
| (1) | All percentages shown in the Portfolio of Investments are based on net assets applicable to Common shares unless otherwise noted. |
| (2) | Optional Call Provisions: Dates (month and year) and prices of the earliest optional call or redemption. There may be other call provisions at varying prices at later dates. Certain mortgage-backed securities may be subject to periodic principal paydowns. |
| (3) | Ratings: Using the highest of Standard & Poor’s Group (”Standard & Poor’s”), Moody’s Investors Service, Inc. (”Moody’s”) or Fitch, Inc. (”Fitch”) rating. Ratings below BBB by Standard & Poor’s, Baa by Moody’s or BBB by Fitch are considered to be below investment grade. Holdings designated N/R are not rated by any of these national rating agencies. |
| (4) | On September 1, 2013, the Fund’s Adviser determined it was unlikely that this borrower would fulfill its entire obligation on this security, and therefore reduced the security’s interest rate of accrual from 6.500% to 5.200%. |
| (5) | Investment, or portion of investment, has been pledged to collateralize the net payment obligations for investments in inverse floating rate transactions. |
| (6) | Investment valued at fair value using methods determined in good faith by, or at the discretion of, the Board. For fair value measurement disclosure purposes, investment classified as Level 3. See Notes to Financial Statements, Note 2 – Investment Valuation and Fair Value Measurements for more information. |
| (7) | At or subsequent to the end of the reporting period, this security is non-income producing. Non-income producing, in the case of a fixed-income security, generally denotes that the issuer has (1) defaulted on the payment of principal or interest, (2) is under the protection of the Federal Bankruptcy Court or (3) the Fund’s Adviser has concluded that the issue is not likely to meet its future interest payment obligations and has ceased accruing additional income on the Fund’s records. |
| (8) | Backed by an escrow or trust containing sufficient U.S. Government or U.S. Government agency securities, which ensure the timely payment of principal and interest. Certain bonds backed by U.S. Government or agency securities are regarded as having an implied rating equal to the rating of such securities. |
| (9) | Variable Rate MuniFund Term Preferred Shares, at Liquidation Value as a percentage of Total Investments is 35.2%. |
| (ETM) | Escrowed to maturity. |
| (IF) | Inverse floating rate investment. |
| (WI/DD) | Investment, or portion of investment, purchased on a when-issued or delayed delivery basis. |
See accompanying notes to financial statements.
| | | |
Statement of | | |
Assets and Liabilities | November 30, 2015 (Unaudited) |
| |
| | |
| | | Connecticut | | | Massachusetts | |
| | | Premium | | | Premium | |
| | | Income | | | Income | |
| | | (NTC) | | | (NMT) | |
Assets | | | | | | |
Long-term investments, at value (cost $314,718,646 and $197,874,497, respectively) | | $ | 331,340,303 | | | $ | 210,483,364 | |
Cash | | | 1,315,754 | | | | 1,685,329 | |
Receivable for: | | | | | | | | |
Interest | | | 4,752,660 | | | | 2,963,384 | |
Investments sold | | | 5,219,355 | | | | — | |
Deferred offering costs | | | 57,514 | | | | 73,977 | |
Other assets | | | 11,297 | | | | 1,575 | |
Total assets | | | 342,696,883 | | | | 215,207,629 | |
Liabilities | | | | | | | | |
Floating rate obligations | | | 19,370,000 | | | | — | |
Payable for: | | | | | | | | |
Dividends | | | 800,182 | | | | 532,929 | |
Interest | | | 83,639 | | | | 57,173 | |
Investments purchased | | | 5,613,146 | | | | 1,553,027 | |
Variable Rate MuniFund Term Preferred (“VMTP”) Shares, at liquidation value | | | 106,000,000 | | | | 74,000,000 | |
Accrued expenses: | | | | | | | | |
Management fees | | | 164,719 | | | | 105,911 | |
Trustees fees | | | 10,622 | | | | 756 | |
Other | | | 106,431 | | | | 106,158 | |
Total liabilities | | | 132,148,739 | | | | 76,355,954 | |
Net assets applicable to common shares | | $ | 210,548,144 | | | $ | 138,851,675 | |
Common shares outstanding | | | 14,533,976 | | | | 9,346,877 | |
Net asset value (“NAV”) per common share outstanding | | $ | 14.49 | | | $ | 14.86 | |
Net assets applicable to common shares consist of: | | | | | | | | |
Common shares, $0.01 par value per share | | $ | 145,340 | | | $ | 93,469 | |
Paid-in surplus | | | 200,695,362 | | | | 129,988,237 | |
Undistributed (Over-distribution of) net investment income | | | 581,977 | | | | 467,555 | |
Accumulated net realized gain (loss) | | | (7,496,192 | ) | | | (4,306,453 | ) |
Net unrealized appreciation (depreciation) | | | 16,621,657 | | | | 12,608,867 | |
Net assets applicable to common shares | | $ | 210,548,144 | | | $ | 138,851,675 | |
Authorized shares: | | | | | | | | |
Common | | Unlimited | | | Unlimited | |
Preferred | | Unlimited | | | Unlimited | |
See accompanying notes to financial statements.
| | | | | | | |
Statement of | | | | | | |
Operations | | Six Months Ended November 30, 2015 (Unaudited) | |
| | |
| | |
| | | Connecticut | | | Massachusetts | |
| | | Premium | | | Premium | |
| | | Income | | | Income | |
| | | (NTC) | | | (NMT) | |
Investment Income | | $ | 6,760,781 | | | $ | 4,387,270 | |
Expenses | | | | | | | | |
Management fees | | | 1,002,769 | | | | 643,643 | |
Interest expense and amortization of offering costs | | | 596,555 | | | | 377,886 | |
Custodian fees | | | 20,080 | | | | 16,672 | |
Trustees fees | | | 3,967 | | | | 2,661 | |
Professional fees | | | 15,753 | | | | 18,012 | |
Shareholder reporting expenses | | | 14,699 | | | | 8,283 | |
Shareholder servicing agent fees | | | 11,692 | | | | 10,134 | |
Stock exchange listing fees | | | 3,984 | | | | 3,984 | |
Investor relations expenses | | | 8,084 | | | | 5,818 | |
Other | | | 30,983 | | | | 14,710 | |
Total expenses | | | 1,708,566 | | | | 1,101,803 | |
Net investment income (loss) | | | 5,052,215 | | | | 3,285,467 | |
Realized and Unrealized Gain (Loss) | | | | | | | | |
Net realized gain (loss) from investments | | | 352,461 | | | | (76,999 | ) |
Change in net unrealized appreciation (depreciation) of investments | | | 1,534,285 | | | | 1,822,209 | |
Net realized and unrealized gain (loss) | | | 1,886,746 | | | | 1,745,210 | |
Net increase (decrease) in net assets applicable to common shares from operations | | $ | 6,938,961 | | | $ | 5,030,677 | |
See accompanying notes to financial statements.
| | | | | | | | | | | | | |
Statement of | | | | | | | | | | | | |
Changes in Net Assets | | | | | | | | | | | (Unaudited) | |
| | |
| | |
| | | Connecticut | | | Massachusetts | |
| | | Premium Income (NTC) | | | Premium Income (NMT) | |
| | | Six Months | | | Year | | | Six Months | | | Year | |
| | | Ended | | | Ended | | | Ended | | | Ended | |
| | | 11/30/15 | | | 5/31/15 | | | 11/30/15 | | | 5/31/15 | |
Operations | | | | | | | | | | | | |
Net investment income (loss) | | $ | 5,052,215 | | | $ | 10,248,489 | | | $ | 3,285,467 | | | $ | 6,247,262 | |
Net realized gain (loss) from investments | | | 352,461 | | | | 704,598 | | | | (76,999 | ) | | | 209,352 | |
Change in net unrealized appreciation | | | | | | | | | | | | | | | | |
(depreciation) of investments | | | 1,534,285 | | | | (780,480 | ) | | | 1,822,209 | | | | 466,272 | |
Net increase (decrease) in net assets | | | | | | | | | | | | | | | | |
applicable to common shares | | | | | | | | | | | | | | | | |
from operations | | | 6,938,961 | | | | 10,172,607 | | | | 5,030,677 | | | | 6,922,886 | |
Distributions to Common Shareholders | | | | | | | | | | | | | | | | |
From net investment income | | | (4,970,620 | ) | | | (9,962,073 | ) | | | (3,308,794 | ) | | | (6,312,065 | ) |
From accumulated net realized gains | | | — | | | | — | | | | — | | | | — | |
Decrease in net assets applicable to | | | | | | | | | | | | | | | | |
common shares from distributions | | | | | | | | | | | | | | | | |
to common shareholders | | | (4,970,620 | ) | | | (9,962,073 | ) | | | (3,308,794 | ) | | | (6,312,065 | ) |
Capital Share Transactions | | | | | | | | | | | | | | | | |
Common shares: | | | | | | | | | | | | | | | | |
Issued in the reorganizations | | | — | | | | — | | | | — | | | | 66,532,407 | |
Net proceeds from shares | | | | | | | | | | | | | | | | |
issued to shareholders due to | | | | | | | | | | | | | | | | |
reinvestment of distributions | | | — | | | | — | | | | — | | | | — | |
Cost of shares repurchased and retired | | | — | | | | (1,192,296 | ) | | | — | | | | — | |
Net increase (decrease) in net assets | | | | | | | | | | | | | | | | |
applicable to common shares | | | | | | | | | | | | | | | | |
from capital share transactions | | | — | | | | (1,192,296 | ) | | | — | | | | 66,532,407 | |
Net increase (decrease) in net assets | | | | | | | | | | | | | | | | |
applicable to common shares | | | 1,968,341 | | | | (981,762 | ) | | | 1,721,883 | | | | 67,143,228 | |
Net assets applicable to common | | | | | | | | | | | | | | | | |
shares at the beginning of period | | | 208,579,803 | | | | 209,561,565 | | | | 137,129,792 | | | | 69,986,564 | |
Net assets applicable to common | | | | | | | | | | | | | | | | |
shares at the end of period | | $ | 210,548,144 | | | $ | 208,579,803 | | | $ | 138,851,675 | | | $ | 137,129,792 | |
Undistributed (Over-distribution of) | | | | | | | | | | | | | | | | |
net investment income at the | | | | | | | | | | | | | | | | |
end of period | | $ | 581,977 | | | $ | 500,382 | | | $ | 467,555 | | | $ | 490,882 | |
See accompanying notes to financial statements.
| | | | | | | |
Statement of | | | | | | |
Cash Flows | | Six Months Ended November 30, 2015 (Unaudited) | |
| | |
| | |
| | | Connecticut | | | Massachusetts | |
| | | Premium | | | Premium | |
| | | Income | | | Income | |
| | | (NTC) | | | (NMT) | |
Cash Flows from Operating Activities: | | | | | | |
Net Increase (Decrease) in Net Assets Applicable to Common Shares from Operations | | $ | 6,938,961 | | | $ | 5,030,677 | |
Adjustments to reconcile the net increase (decrease) in net assets applicable to common shares from operations | | | | | | | | |
to net cash provided by (used in) operating activities: | | | | | | | | |
Purchases of investments | | | (21,351,567 | ) | | | (16,886,774 | ) |
Proceeds from sales and maturities of investments | | | 19,668,164 | | | | 15,732,493 | |
Investment transactions adjustments, net | | | (55,211 | ) | | | — | |
Taxes paid on undistributed capital gains | | | (582 | ) | | | — | |
Amortization/(Accretion) of premiums and discounts, net | | | 940,856 | | | | 610,169 | |
Amortization of deferred offering costs | | | 23,030 | | | | 19,944 | |
(Increase) Decrease in: | | | | | | | | |
Receivable for interest | | | 21,959 | | | | 122,637 | |
Receivable for investments sold | | | (4,858,146 | ) | | | — | |
Other assets | | | 1,838 | | | | 3,284 | |
Increase (Decrease) in: | | | | | | | | |
Payable for interest | | | (11,471 | ) | | | (7,968 | ) |
Payable for investments purchased | | | 5,613,146 | | | | 1,553,027 | |
Accrued management fees | | | (5,233 | ) | | | (3,057 | ) |
Accrued Trustees fees | | | 1,249 | | | | (27 | ) |
Accrued other expenses | | | (15,438 | ) | | | (86,942 | ) |
Net realized (gain) loss from investments | | | (352,461 | ) | | | 76,999 | |
Change in net unrealized (appreciation) depreciation of investments | | | (1,534,285 | ) | | | (1,822,209 | ) |
Net cash provided by (used in) operating activities | | | 5,024,809 | | | | 4,342,253 | |
Cash Flows from Financing Activities: | | | | | | | | |
Cash distributions paid to common shareholders | | | (4,969,177 | ) | | | (3,308,092 | ) |
Net cash provided by (used in) financing activities | | | (4,969,177 | ) | | | (3,308,092 | ) |
Net Increase (Decrease) in Cash | | | 55,632 | | | | 1,034,161 | |
Cash at the beginning of period | | | 1,260,122 | | | | 651,168 | |
Cash at the end of period | | $ | 1,315,754 | | | $ | 1,685,329 | |
| | | Connecticut | | | Massachusetts | |
| | | Premium | | | Premium | |
| | | Income | | | Income | |
Supplemental Disclosure of Cash Flow Information | | (NTC) | | | (NMT) | |
Cash paid for interest (excluding amortization of offering costs) | | $ | 584,995 | | | $ | 364,080 | |
See accompanying notes to financial statements.
| | | | | | | | | | | | | | | | | | | | | | | | | | | | | | | | | | | | | |
Financial | | | | | | | | | | | | | | | | | | | | | | | | | | | | | | | | | | |
| | |
| | | Highlights (Unaudited) | | | | | | | | | | | | | | | | | | | | | | | | | |
| | |
| | |
| | |
| | |
Selected data for a common share outstanding throughout each period: | | | | | | | | | | | | | | | | |
| | |
| | |
| | | | | | | | | | | | | | | | | | | | | Less Distributions to | | | | | | | | | | |
| | | | | | Investment Operations | | | Common Shareholders | | | Common Share | |
| | | | | | | | | | | | | | | Distributions | | | | | | | | | | | | | | | | | | | | | | |
| | | | | | | | | | | | | | | from | | | | | | | | | | | | | | | | | | | | | | |
| | | | | | | | | | | | Distributions | | | Accumu- | | | | | | | | | | | | | | | | | | | | | | |
| | | | | | | | | | | | from Net | | | lated Net | | | | | | | | | From | | | | | | | | | | | | | |
| | | | | | | | | Net | | | Investment | | | Realized | | | | | | | | | Accum- | | | | | | Discount | | | | | | | |
| | | Beginning | | | Net | | | Realized/ | | | Income to | | | Gains to | | | | | | From | | | ulated | | | | | | Per | | | | | | | |
| | | Common | | | Investment | | | Unrealized | | | ARPS | | | ARPS | | | | | | Net | | | Net | | | | | | Share | | | | | | Ending | |
| | | Share | | | Income | | | Gain | | | Share- | | | Share- | | | | | | Investment | | | Realized | | | | | | Repurchased | | | Ending | | | Share | |
| | | NAV | | | (Loss) | | | (Loss) | | | holders(a) | | | holders(a) | | | Total | | | Income | | | Gains | | | Total | | | and Retired | | | NAV | | | Price | |
Connecticut Premium Income (NTC) | | | | | | | | | | | | | | | | | | | | | | | | | | | | | | | | | | |
Year Ended 5/31: | | | | | | | | | | | | | | | | | | | | | | | | | | | | | | | | | | | | |
2016(f) | | $ | 14.35 | | | $ | 0.35 | | | $ | 0.13 | | | $ | — | | | $ | — | | | $ | 0.48 | | | $ | (0.34 | ) | | $ | — | | | $ | (0.34 | ) | | $ | — | | | $ | 14.49 | | | $ | 12.46 | |
2015 | | | 14.33 | | | | 0.70 | | | | (0.01 | ) | | | — | | | | — | | | | 0.69 | | | | (0.68 | ) | | | — | | | | (0.68 | ) | | | 0.01 | | | | 14.35 | | | | 12.62 | |
2014 | | | 15.00 | | | | 0.60 | | | | (0.59 | ) | | | — | | | | — | | | | 0.01 | | | | (0.68 | ) | | | — | * | | | (0.68 | ) | | | — | * | | | 14.33 | | | | 12.68 | |
2013 | | | 15.34 | | | | 0.56 | | | | (0.19 | ) | | | — | | | | — | | | | 0.37 | | | | (0.70 | ) | | | (0.01 | ) | | | (0.71 | ) | | | — | | | | 15.00 | | | | 13.65 | |
2012 | | | 14.22 | | | | 0.58 | | | | 1.29 | | | | — | | | | — | | | | 1.87 | | | | (0.71 | ) | | | (0.04 | ) | | | (0.75 | ) | | | — | | | | 15.34 | | | | 14.19 | |
2011 | | | 14.56 | | | | 0.67 | | | | (0.29 | ) | | | (0.01 | ) | | | — | | | | 0.37 | | | | (0.71 | ) | | | — | | | | (0.71 | ) | | | — | | | | 14.22 | | | | 13.18 | |
Massachusetts Premium Income (NMT) | | | | | | | | | | | | | | | | | | | | | | | | | | | | | | | | | | | | | | | | | |
Year Ended 5/31: | | | | | | | | | | | | | | | | | | | | | | | | | | | | | | | | | | | | | | | | | | | | | | | | |
2016(f) | | | 14.67 | | | | 0.35 | | | | 0.19 | | | | — | | | | — | | | | 0.54 | | | | (0.35 | ) | | | — | | | | (0.35 | ) | | | — | | | | 14.86 | | | | 13.62 | |
2015 | | | 14.65 | | | | 0.65 | | | | 0.05 | | | | — | | | | — | | | | 0.70 | | | | (0.68 | ) | | | — | | | | (0.68 | ) | | | — | | | | 14.67 | | | | 13.14 | |
2014 | | | 15.12 | | | | 0.58 | | | | (0.37 | ) | | | — | | | | — | | | | 0.21 | | | | (0.67 | ) | | | (0.01 | ) | | | (0.68 | ) | | | — | | | | 14.65 | | | | 13.33 | |
2013 | | | 15.45 | | | | 0.62 | | | | (0.19 | ) | | | — | | | | — | | | | 0.43 | | | | (0.71 | ) | | | (0.05 | ) | | | (0.76 | ) | | | — | | | | 15.12 | | | | 13.64 | |
2012 | | | 14.16 | | | | 0.67 | | | | 1.44 | | | | — | | | | — | | | | 2.11 | | | | (0.77 | ) | | | (0.05 | ) | | | (0.82 | ) | | | — | | | | 15.45 | | | | 15.12 | |
2011 | | | 14.48 | | | | 0.75 | | | | (0.24 | ) | | | (0.01 | ) | | | — | | | | 0.50 | | | | (0.78 | ) | | | (0.04 | ) | | | (0.82 | ) | | | — | | | | 14.16 | | | | 13.59 | |
| (a) | The amounts shown for Auction Rate Preferred Shares (“ARPS”) are based on common share equivalents. |
| (b) | Total Return Based on Common Share NAV is the combination of changes in common share NAV, reinvested dividend income at NAV and reinvested capital gains distributions at NAV, if any. The last dividend declared in the period, which is typically paid on the first business day of the following month, is assumed to be reinvested at the ending NAV. The actual reinvest price for the last dividend declared in the period may often be based on the Fund’s market price (and not its NAV), and therefore may be different from the price used in the calculation. Total returns are not annualized. Total Return Based on Common Share Price is the combination of changes in the market price per share and the effect of reinvested dividend income and reinvested capital gains distributions, if any, at the average price paid per share at the time of reinvestment. The last dividend declared in the period, which is typically paid on the first business day of the following month, is assumed to be reinvested at the ending market price. The actual reinvestment for the last dividend declared in the period may take place over several days, and in some instances may not be based on the market price, so the actual reinvestment price may be different from the price used in the calculation. Total returns are not annualized. |
| | | | | | | | | | | | | | | | | |
| | | | | | | Common Share Supplemental Data/ | |
| | | | | | | Ratios Applicable to Common Shares | |
Common Share | | | | | | | | | | | | | |
Total Returns | | | | | | Ratios to Average Net Assets(c) | | |
| | |
| | |
| | |
| | |
| | | | | | | | | | | | | | | | | |
| | | | Based | | | Ending | | | | | | Net | | | | |
Based | | | on | | | Net | | | | | | Investment | | | Portfolio | |
on | | | Share | | | Assets | | | | | | Income | | | Turnover | |
NAV(b) | | | Price(b) | | | | (000 | ) | | Expenses(d) | | | (Loss) | | | Rate(e) | |
| | |
| | |
| | 3.40 | % | | | 1.48 | % | | $ | 210,548 | | | | 1.64 | %** | | | 4.85 | %** | | | 6 | % |
| | 4.96 | | | | 5.03 | | | | 208,580 | | | | 1.68 | | | | 4.85 | | | | 15 | |
| | 0.41 | | | | (1.72 | ) | | | 209,562 | | | | 2.88 | | | | 4.33 | | | | 17 | |
| | 2.35 | | | | 1.02 | | | | 220,267 | | | | 2.68 | | | | 4.05 | | | | 12 | |
| | 13.45 | | | | 13.59 | | | | 82,318 | | | | 3.08 | | | | 3.93 | | | | 11 | |
| | 2.63 | | | | (0.39 | ) | | | 76,284 | | | | 2.41 | | | | 4.73 | | | | 9 | |
| | |
| | 3.75 | | | | 6.41 | | | | 138,852 | | | | 1.61 | ** | | | 4.79 | ** | | | 8 | |
| | 4.84 | | | | 3.75 | | | | 137,130 | | | | 1.96 | | | | 4.57 | | | | 14 | |
| | 1.61 | | | | 2.96 | | | | 69,987 | | | | 3.09 | | | | 4.17 | | | | 18 | |
| | 2.81 | | | | (5.18 | ) | | | 72,250 | | | | 2.86 | | | | 3.99 | | | | 10 | |
| | 15.29 | | | | 17.78 | | | | 73,758 | | | | 3.03 | | | | 4.48 | | | | 12 | |
| | 3.58 | | | | (3.48 | ) | | | 67,605 | | | | 2.51 | | | | 5.30 | | | | 6 | |
| (c) | Ratios do not reflect the effect of dividend payments to ARPS shareholders, during periods when ARPS were outstanding. Net Investment Income (Loss) ratios reflect income earned and expenses incurred on assets attributable to ARPS and other subsequent forms of preferred shares issued by the Fund, where applicable. |
| (d) | The expense ratios reflect, among other things, all interest expense and other costs related to preferred shares (as described in Note 4 – Fund Shares, Preferred Shares) and/or the interest expense deemed to have been paid by the Fund on the floating rate certificates issued by the special purpose trusts for the self-deposited inverse floaters held by the Fund (as described in Note 3 – Portfolio Securities and Investments in Derivatives, Inverse Floating Rate Securities), where applicable, as follows: |
| | | | |
| Connecticut Premium Income (NTC) | | | |
Year Ended 5/31: | | | |
2016(f) | | | 0.57 | %** |
2015 | | | 0.58 | |
2014 | | | 1.71 | |
2013 | | | 1.55 | |
2012 | | | 1.54 | |
2011 | | | 1.20 | |
Massachusetts Premium Income (NMT) | | | |
Year Ended 5/31: | | | |
2016(f) | | | 0.55 | %** |
2015 | | | 0.86 | |
2014 | | | 1.71 | |
2013 | | | 1.64 | |
2012 | | | 1.74 | |
2011 | | | 1.28 | |
| (e) | Portfolio Turnover Rate is calculated based on the lesser of long-term purchases or sales (as disclosed in Note 5 – Investment Transactions) divided by the average long-term market value during the period. |
| (f) | For the six months ended November 30, 2015. |
| * | Rounds to less than $0.01 per share. |
See accompanying notes to financial statements.
| | | | | | | | | | | | | |
Financial Highlights (Unaudited) (continued) | | | | | | | | | | | | |
| | |
| | |
| | |
| | |
| | | MTP Shares | | | VMTP Shares | |
| | | at the End of Period (a) | | | at the End of Period | |
| | |
| | | Aggregate | | | Asset | | | Aggregate | | | Asset | |
| | | Amount | | | Coverage | | | Amount | | | Coverage | |
| | | Outstanding | | | Per $10 | | | Outstanding | | | Per $100,000 | |
| | | | (000 | ) | | Share | | | | (000 | ) | | Share | |
Connecticut Premium Income (NTC) | | | | | | | | | | | | | | |
Year Ended 5/31: | | | | | | | | | | | | | | |
2016(c) | | $ | — | | | $ | — | | | $ | 106,000 | | | $ | 298,630 | |
2015 | | | — | | | | — | | | | 106,000 | | | | 296,773 | |
2014 | | | — | | | | — | | | | 106,000 | | | | 297,700 | |
2013 | | | 105,500 | | | | 30.88 | | | | — | | | | — | |
2012 | | | 36,080 | | | | 32.82 | | | | — | | | | — | |
2011 | | | 36,080 | | | | 31.14 | | | | — | | | | — | |
Massachusetts Premium Income (NMT) | | | | | | | | | | | | | | | | |
Year Ended 5/31: | | | | | | | | | | | | | | | | |
2016(c) | | | — | | | | — | | | | 74,000 | | | | 287,637 | |
2015 | | | — | | | | — | | | | 74,000 | | | | 285,311 | |
2014 | | | 36,645 | | | | 29.10 | | | | — | | | | — | |
2013 | | | 36,645 | | | | 29.72 | | | | — | | | | — | |
2012 | | | 36,645 | | | | 30.13 | | | | — | | | | — | |
2011 | | | 36,645 | | | | 28.45 | | | | — | | | | — | |
(a) The Ending and Average Market Value Per Share for each Series of the Fund’s MTP Shares were as follows: | | | | | | | | | | | | | |
| | | 2015 | | | 2014 | | | 2013 | | | 2012 | | | 2011 | |
Connecticut Premium Income (NTC) | | | | | | | | | | | | | | | |
Series 2015 (NTC PRC) | | | | | | | | | | | | | | | |
Ending Market Value per Share | | $ | — | | | $ | — | | | $ | 10.06 | | | $ | 10.05 | | | $ | 10.07 | |
Average Market Value per Share | | | — | | | 10.03 | ΩΩ | | | 10.07 | | | | 10.08 | | | | 10.04 | |
Series 2016 (NTC PRD) | | | | | | | | | | | | | | | | | | | | |
Ending Market Value per Share | | | — | | | | — | | | | 10.07 | | | | 10.10 | | | | 10.00 | |
Average Market Value per Share | | | — | | | 10.03 | ΩΩ | | | 10.11 | | | | 10.06 | | | 9.88 | ^ |
Series 2015 (NTC PRE) (b) | | | | | | | | | | | | | | | | | | | | |
Ending Market Value per Share | | | — | | | | — | | | | 10.07 | | | | — | | | | — | |
Average Market Value per Share | | | — | | | 10.03 | ΩΩ | | | 10.06 | Ω | | | — | | | | — | |
Series 2015-1 (NTC PRF) (b) | | | | | | | | | | | | | | | | | | | | |
Ending Market Value per Share | | | — | | | | — | | | | 10.06 | | | | — | | | | — | |
Average Market Value per Share | | | — | | | 10.03 | ΩΩ | | | 10.07 | Ω | | | — | | | | — | |
Series 2015-1 (NTC PRG) (b) | | | | | | | | | | | | | | | | | | | | |
Ending Market Value per Share | | | — | | | | — | | | | 10.08 | | | | — | | | | — | |
Average Market Value per Share | | | — | | | 10.03 | ΩΩ | | | 10.08 | Ω | | | — | | | | — | |
Massachusetts Premium Income (NMT) | | | | | | | | | | | | | | | | | | | | |
Series 2015 (NMT PRC) | | | | | | | | | | | | | | | | | | | | |
Ending Market Value per Share | | $ | — | | | $ | 10.06 | | | $ | 10.07 | | | $ | 10.10 | | | $ | 10.02 | |
Average Market Value per Share | | 10.02 | ΩΩΩ | | | 10.04 | | | | 10.09 | | | | 10.08 | | | | 10.02 | |
Series 2016 (NMT PRD) | | | | | | | | | | | | | | | | | | | | |
Ending Market Value per Share | | | — | | | | 10.06 | | | | 10.12 | | | | 10.10 | | | | 10.00 | |
Average Market Value per Share | | 10.03 | ΩΩΩ | | | 10.06 | | | | 10.11 | | | | 10.08 | | | 9.97 | ^^ |
Series 2015 (NMT PRE) (b) | | | | | | | | | | | | | | | | | | | | |
Ending Market Value per Share | | | — | | | | 10.06 | | | | 10.09 | | | | 10.10 | | | | 13.53 | |
Average Market Value per Share | | | 10.00 | Δ | | | 10.04 | | | | 10.08 | | | | 10.07 | | | | 14.03 | |
Series 2015-1 (NMT PRF) (b) | | | | | | | | | | | | | | | | | | | | |
Ending Market Value per Share | | | — | | | | 10.02 | | | | 10.05 | | | | 10.10 | | | | 13.62 | |
Average Market Value per Share | | | 10.00 | Δ | | | 10.04 | | | | 10.09 | | | | 10.08 | | | | 14.48 | |
(b) MTP Shares issued in connection with the reorganizations. (c) For the six months ended November 30, 2015.
^ For the period December 15, 2010 (first issuance date of shares) through May 31, 2011.
^^ For the period January 20, 2011 (first issuance date of shares) through May 31, 2011.
Ω For the period July 9, 2012 (effective date of the reorganizations) through May 31, 2013.
ΩΩ For the period June 1, 2013 through March 3, 2014.
ΩΩΩ For the period June 1, 2014 through July 11, 2014.
Δ For the period June 9, 2014 (effective date of the reorganizations) through July 11, 2014.
Notes to
Financial Statements (Unaudited)
1. General Information and Significant Accounting Policies
General Information
Fund Information
The state funds covered in this report and their corresponding New York Stock Exchange (“NYSE”) symbols are as follows (each a “Fund” and collectively, the “Funds”):
• Nuveen Connecticut Premium Income Municipal Fund (NTC) (“Connecticut Premium Income (NTC)”)
• Nuveen Massachusetts Premium Income Municipal Fund (NMT) (“Massachusetts Premium Income (NMT)”)
The Funds are registered under the Investment Company Act of 1940, as amended, as diversified closed-end management investment companies. Connecticut Premium Income (NTC) and Massachusetts Premium Income (NMT) were organized as Massachusetts business trusts on January 12, 1993.
The end of the reporting period for the Funds is November 30, 2015, and the period covered by these Notes to Financial Statements is the six months ended November 30, 2015 (the “current fiscal period”).
Investment Adviser
The Funds’ investment adviser is Nuveen Fund Advisors, LLC (the “Adviser”), a wholly-owned subsidiary of Nuveen Investments, Inc. (“Nuveen”). The Adviser is responsible for each Fund’s overall investment strategy and asset allocation decisions. The Adviser has entered into sub-advisory agreements with Nuveen Asset Management, LLC (the “Sub-Adviser”), a subsidiary of the Adviser, under which the Sub-Adviser manages the investment portfolios of the Funds.
Investment Objectives and Principal Investment Strategies
Each Fund seeks to provide current income exempt from both regular federal and designated state income taxes by investing primarily in a portfolio of municipal obligations issued by state and local government authorities within a single state or certain U.S. territories.
Significant Accounting Policies
Each Fund is an investment company and follows accounting and reporting guidance under Financial Accounting Standards Board (FASB) Accounting Standards Codification (ASC) Topic 946 “Financial Services – Investment Companies.” The following is a summary of significant accounting policies followed by the Funds in the preparation of their financial statements in accordance with U.S. generally accepted accounting principles (“U.S. GAAP”).
Investment Transactions
Investment transactions are recorded on a trade date basis. Realized gains and losses from investment transactions are determined on the specific identification method, which is the same basis used for federal income tax purposes. Investments purchased on a when-issued/delayed delivery basis may have extended settlement periods. Any investments so purchased are subject to market fluctuation during this period. The Funds have earmarked securities in their portfolios with a current value at least equal to the amount of the when-issued/delayed delivery purchase commitments.
As of the end of the reporting period, the Funds’ outstanding when-issued/delayed delivery purchase commitments were as follows:
| | Connecticut | Massachusetts |
| | Premium | Premium |
| | Income | Income |
| | (NTC) | (NMT) |
Outstanding when-issued/delayed delivery purchase commitments | $5,613,146 | $1,553,027 |
Investment Income
Investment income, which reflects the amortization of premiums and accretion of discounts for financial reporting purposes, is recorded on an accrual basis. Investment income also reflects paydown gains and losses, if any.
Notes to Financial Statements (Unaudited) (continued)
Professional Fees
Professional fees presented on the Statement of Operations consist of legal fees incurred in the normal course of operations, audit fees, tax consulting fees and, in some cases, workout expenditures. Workout expenditures are incurred in an attempt to protect or enhance an investment or to pursue other claims or legal actions on behalf of Fund shareholders. If a refund is received for workout expenditures paid in a prior reporting period, such amounts will be recognized as “Legal fee refund” on the Statement of Operations.
Dividends and Distributions to Common Shareholders
Dividends from net investment income are declared monthly. Net realized capital gains and/or market discount from investment transactions, if any, are distributed to shareholders at least annually. Furthermore, capital gains are distributed only to the extent they exceed available capital loss carryforwards.
Distributions to common shareholders of net investment income, net realized capital gains and/or market discount, if any, are recorded on the ex-dividend date. The amount and timing of distributions are determined in accordance with federal income tax regulations, which may differ from U.S. GAAP.
Indemnifications
Under the Funds’ organizational documents, their officers and trustees are indemnified against certain liabilities arising out of the performance of their duties to the Funds. In addition, in the normal course of business, the Funds enter into contracts that provide general indemnifications to other parties. The Funds’ maximum exposure under these arrangements is unknown as this would involve future claims that may be made against the Funds that have not yet occurred. However, the Funds have not had prior claims or losses pursuant to these contracts and expect the risk of loss to be remote.
Netting Agreements
In the ordinary course of business, the Funds may enter into transactions subject to enforceable International Swaps and Derivative Association, Inc. (“ISDA”) master agreements or other similar arrangements (“netting agreements”). Generally, the right to offset in netting agreements allows each Fund to offset certain securities and derivatives with a specific counterparty with any collateral received or delivered to that counterparty based on the terms of the agreements. Generally, each Fund manages its cash collateral and securities collateral on a counterparty basis.
The Funds’ investments subject to netting agreements as of the end of the reporting period, if any, are further described in Note 3 – Portfolio Securities and Investments in Derivatives.
Use of Estimates
The preparation of financial statements in conformity with U.S. GAAP requires management to make estimates and assumptions that affect the reported amounts of assets and liabilities at the date of the financial statements and the reported amounts of increases and decreases in net assets applicable to common shares from operations during the reporting period. Actual results may differ from those estimates.
2. Investment Valuation and Fair Value Measurements
The fair valuation input levels as described below are for fair value measurement purposes.
Fair value is defined as the price that would be received upon selling an investment or transferring a liability in an orderly transaction to an independent buyer in the principal or most advantageous market for the investment. A three-tier hierarchy is used to maximize the use of observable market data and minimize the use of unobservable inputs and to establish classification of fair value measurements for disclosure purposes. Observable inputs reflect the assumptions market participants would use in pricing the asset or liability. Observable inputs are based on market data obtained from sources independent of the reporting entity. Unobservable inputs reflect the reporting entity’s own assumptions about the assumptions market participants would use in pricing the asset or liability. Unobservable inputs are based on the best information available in the circumstances. The following is a summary of the three-tiered hierarchy of valuation input levels.
Level 1 – Inputs are adjusted and prices are determined using quoted prices in active markets for identical securities.
Level 2 – Prices are determined using other significant observable inputs (including quoted prices for similar securities, interest rates, prepayment speeds, credit risk, etc.).
Level 3 – Prices are determined using significant unobservable inputs (including management’s assumptions in determining the fair value of investments).
Prices of fixed income securities are provided by a pricing service approved by the Funds’ Board of Trustees (the “Board”). The pricing service establishes a security’s fair value using methods that may include consideration of the following: yields or prices of investments of comparable quality, type of issue, coupon, maturity and rating, market quotes or indications of value from security dealers, evaluations of anticipated cash flows or collateral, general market conditions and other information and analysis, including the obligor’s credit characteristics considered relevant. These securities are generally classified as Level 2. In pricing certain securities, particularly less liquid and lower quality securities, the pricing service may consider information about a security, its issuer or market activity, provided by the Adviser. These securities are generally classified as Level 2 or Level 3 depending on the priority of the significant inputs.
Certain securities may not be able to be priced by the pre-established pricing methods as described above. Such securities may be valued by the Board and/or its appointee at fair value. These securities generally include, but are not limited to, restricted securities (securities which may not be publicly sold without registration under the Securities Act of 1933, as amended) for which a pricing service is unable to provide a market price; securities whose trading has been formally suspended; debt securities that have gone into default and for which there is no current market quotation; a security whose market price is not available from a pre-established pricing source; a security with respect to which an event has occurred that is likely to materially affect the value of the security after the market has closed but before the calculation of a Fund’s net asset value (“NAV”) (as may be the case in non-U.S. markets on which the security is primarily traded) or make it difficult or impossible to obtain a reliable market quotation; and a security whose price, as provided by the pricing service, is not deemed to reflect the security’s fair value. As a general principle, the fair value of a security would appear to be the amount that the owner might reasonably expect to receive for it in a current sale. A variety of factors may be considered in determining the fair value of such securities, which may include consideration of the following: yields or prices of investments of comparable quality, type of issue, coupon, maturity and rating, market quotes or indications of value from security dealers, evaluations of anticipated cash flows or collateral, general market conditions and other information and analysis, including the obligor’s credit characteristics considered relevant. These securities are generally classified as Level 2 or Level 3 depending on the priority of the significant inputs. Regardless of the method employed to value a particular security, all valuations are subject to review by the Board and/or its appointee.
The inputs or methodologies used for valuing securities are not an indication of the risks associated with investing in those securities. The following is a summary of each Fund’s fair value measurements as of the end of the reporting period:
| | | | | |
Connecticut Premium Income (NTC) | Level 1 | Level 2 | Level 3 | Total |
Long-Term Investments*: | | | | |
Municipal Bonds | $ — | $331,340,303 | $ — | $331,340,303 |
Massachusetts Premium Income (NMT) | | | | |
Long-Term Investments*: | | | | |
Municipal Bonds | $ — | $210,469,806 | $13,558** | $210,483,364 |
* Refer to the Fund’s Portfolio of Investments for industry classifications.
** Refer to the Fund’s Portfolio of Investments for securities classified as Level 3.
The Board is responsible for the valuation process and has appointed the oversight of the daily valuation process to the Adviser’s Valuation Committee. The Valuation Committee, pursuant to the valuation policies and procedures adopted by the Board, is responsible for making fair value determinations, evaluating the effectiveness of the Funds’ pricing policies and reporting to the Board. The Valuation Committee is aided in its efforts by the Adviser’s dedicated Securities Valuation Team, which is responsible for administering the daily valuation process and applying fair value methodologies as approved by the Valuation Committee. When determining the reliability of independent pricing services for investments owned by the Funds, the Valuation Committee, among other things, conducts due diligence reviews of the pricing services and monitors the quality of security prices received through various testing reports conducted by the Securities Valuation Team.
The Valuation Committee will consider pricing methodologies it deems relevant and appropriate when making a fair value determination, based on the facts and circumstances specific to the portfolio instrument. Fair value determinations generally will be derived as follows, using public or private market information:
| (i) | If available, fair value determinations shall be derived by extrapolating from recent transactions or quoted prices for identical or comparable securities. |
| (ii) | If such information is not available, an analytical valuation methodology may be used based on other available information including, but not limited to: analyst appraisals, research reports, corporate action information, issuer financial statements and shelf registration statements. Such analytical valuation methodologies may include, but are not limited to: multiple of earnings, discount from market value of a similar freely-traded security, discounted cash flow analysis, book value or a multiple thereof, risk premium/yield analysis, yield to maturity and/or fundamental investment analysis. |
The purchase price of a portfolio instrument will be used to fair value the instrument only if no other valuation methodology is available or deemed appropriate, and it is determined that the purchase price fairly reflects the instrument’s current value.
For each portfolio security that has been fair valued pursuant to the policies adopted by the Board, the fair value price is compared against the last available and next available market quotations. The Valuation Committee reviews the results of such testing and fair valuation occurrences are reported to the Board.
Notes to Financial Statements (Unaudited) (continued)
3. Portfolio Securities and Investments in Derivatives
Portfolio Securities
Inverse Floating Rate Securities
Each Fund is authorized to invest in inverse floating rate securities. An inverse floating rate security is created by depositing a municipal bond (referred to as an “Underlying Bond”), typically with a fixed interest rate, into a special purpose tender option bond (“TOB”) trust (referred to as the “TOB Trust”) created by or at the direction of one or more Funds. In turn, the TOB Trust issues (a) floating rate certificates (referred to as “Floaters”), in face amounts equal to some fraction of the Underlying Bond’s par amount or market value, and (b) an inverse floating rate certificate (referred to as an “Inverse Floater”) that represents all remaining or residual interest in the TOB Trust. Floaters typically pay short-term tax-exempt interest rates to third parties who are also provided a right to tender their certificate and receive its par value, which may be paid from the proceeds of a remarketing of the Floaters, by a loan to the TOB Trust from a third party liquidity provider (“Liquidity Provider”), or by the sale of assets from the TOB Trust. The Inverse Floater is issued to a long term investor, such as one or more of the Funds. The income received by the Inverse Floater holder varies inversely with the short-term rate paid to holders of the Floaters, and in most circumstances the Inverse Floater holder bears substantially all of the Underlying Bond’s downside investment risk and also benefits disproportionately from any potential appreciation of the Underlying Bond’s value. The value of an Inverse Floater will be more volatile than that of the Underlying Bond because the interest rate is dependent on not only the fixed coupon rate of the Underlying Bond but also on the short-term interest paid on the Floaters, and because the Inverse Floater essentially bears the risk of loss (and possible gain) of the greater face value of the Underlying Bond.
The Inverse Floater held by a Fund gives the Fund the right to (a) cause the holders of the Floaters to tender their certificates at par, (or slightly more than par in certain circumstances) and (b) have the trustee of the TOB Trust (the “Trustee”) transfer the Underlying Bond held by the TOB Trust to the Fund, thereby collapsing the TOB Trust.
The Fund may acquire an Inverse Floater in a transaction where it (a) transfers an Underlying Bond that it owns to a TOB Trust created by a third party or (b) transfers an Underlying Bond that it owns, or that it has purchased in a secondary market transaction for the purpose of creating an Inverse Floater, to a TOB Trust created at its direction, and in return receives the Inverse Floater of the TOB Trust (referred to as a “self-deposited Inverse Floater”). A Fund may also purchase an Inverse Floater in a secondary market transaction from a third party creator of the TOB Trust without first owning the Underlying Bond (referred to as an “externally-deposited Inverse Floater”).
An investment in a self-deposited Inverse Floater is accounted for as a “financing” transaction (i.e., a secured borrowing). For a self-deposited Inverse Floater, the Underlying Bond deposited into the TOB Trust is identified in the Fund’s Portfolio of Investments as “(UB) – Underlying bond of an inverse floating rate trust reflected as a financing transaction,” with the Fund recognizing as liabilities, labeled “Floating rate obligations” on the Statement of Assets and Liabilities, (a) the liquidation value of Floaters issued by the TOB Trust, and (b) the amount of any borrowings by the TOB Trust from a Liquidity Provider to enable the TOB Trust to purchase outstanding Floaters in lieu of a remarketing. In addition, the Fund recognizes in “Investment Income” the entire earnings of the Underlying Bond, and recognizes (a) the interest paid to the holders of the Floaters or on the TOB Trust’s borrowings, and (b) other expenses related to remarketing, administration, trustee, liquidity and other services to a TOB Trust, as a component of “Interest expense and amortization of offering costs” on the Statement of Operations.
In contrast, an investment in an externally-deposited Inverse Floater is accounted for as a purchase of the Inverse Floater and is identified in the Fund’s Portfolio of Investments as “(IF) – Inverse floating rate investment.” For an externally-deposited Inverse Floater, a Fund’s Statement of Assets and Liabilities recognizes the Inverse Floater and not the Underlying Bond as an asset, and the Fund does not recognize the Floaters, or any related borrowings from a Liquidity Provider, as a liability. Additionally, the Fund reflects in “Investment Income” only the net amount of earnings on the Inverse Floater (net of the interest paid to the holders of the Floaters or the Liquidity Provider as lender, and the expenses of the Trust), and does not show the amount of that interest paid or the expenses of the TOB Trust as described above as interest expense on the Statement of Operations.
Fees paid upon the creation of a TOB Trust for self-deposited Inverse Floaters and externally-deposited Inverse Floaters are recognized as part of the cost basis of the Inverse Floater and are capitalized over the term of the TOB Trust.
As of the end of the reporting period, the aggregate value of Floaters issued by each Fund’s TOB Trust for self-deposited Inverse Floaters and externally-deposited Inverse Floaters was as follows:
| | | | | | | |
| | | Connecticut | | | Massachusetts | |
| | | Premium | | | Premium | |
| | | Income | | | Income | |
Floating Rate Obligations Outstanding | | (NTC) | | | (NMT) | |
| | |
Floating rate obligations: self-deposited Inverse Floaters | | $ | 19,370,000 | | | $ | — | |
Floating rate obligations: externally-deposited Inverse Floaters | | | 5,085,000 | | | | 7,325,000 | |
Total | | $ | 24,455,000 | | | $ | 7,325,000 | |
During the current fiscal period, the average amount of Floaters (including any borrowings from a Liquidity Provider) outstanding, and the average annual interest rate and fees related to self-deposited Inverse Floaters, were as follows:
| | | Connecticut | | | Massachusetts | |
| | | Premium | | | Premium | |
| | | Income | | | Income | |
Self-Deposited Inverse Floaters | | (NTC) | | | (NMT) | |
| | |
Average floating rate obligations outstanding | | $ | 16,234,754 | | | $ | — | |
Average annual interest rate and fees | | | 0.65 | % | | | — | % |
TOB Trusts are supported by a liquidity facility provided by a Liquidity Provider pursuant to which the Liquidity Provider agrees, in the event that Floaters are (a) tendered to the Trustee for remarketing and the remarketing does not occur, or (b) subject to mandatory tender pursuant to the terms of the TOB Trust agreement, to either purchase Floaters or to provide the Trustee with an advance from a loan facility to fund the purchase of Floaters by the TOB Trust. In certain circumstances, the Liquidity Provider may otherwise elect to have the Trustee sell the Underlying Bond to retire the Floaters that were tendered and not remarketed prior to providing such a loan. In these circumstances, the Liquidity Provider remains obligated to provide a loan to the extent that the proceeds of the sale of the Underlying Bond are not sufficient to pay the purchase price of the Floaters.
The size of the commitment under the loan facility for a given TOB Trust is at least equal to the balance of that TOB Trust’s outstanding Floaters plus any accrued interest. In consideration of the loan facility, fee schedules are in place and are charged by the Liquidity Provider(s). Any loans made by the Liquidity Provider will be secured by the purchased Floaters held by the TOB Trust. Interest paid on any outstanding loan balances will be effectively borne by the Fund that owns the Inverse Floaters of the TOB Trust that has incurred the borrowing and may be at a rate that is greater than the rate that would have been paid had the Floaters been successfully remarketed.
As described above, any amounts outstanding under a liquidity facility are recognized as a component of “Floating rate obligations” on the Statement of Assets and Liabilities by the Fund holding the corresponding Inverse Floaters issued by the borrowing TOB Trust. As of the end of the reporting period, there were no loans outstanding under any such facility.
Each Fund may also enter into shortfall and forbearance agreements (sometimes referred to as a “recourse arrangement” or “credit recovery swap”) (TOB Trusts involving such agreements are referred to herein as “Recourse Trusts”), under which a Fund agrees to reimburse the Liquidity Provider for the Trust’s Floaters, in certain circumstances, for the amount (if any) by which the liquidation value of the Underlying Bond held by the TOB Trust may fall short of the sum of the liquidation value of the Floaters issued by the TOB Trust plus any amounts borrowed by the TOB Trust from the Liquidity Provider, plus any shortfalls in interest cash flows. Under these agreements, a Fund’s potential exposure to losses related to or on an Inverse Floater may increase beyond the value of the Inverse Floater as a Fund may potentially be liable to fulfill all amounts owed to holders of the Floaters or the Liquidity Provider. Any such shortfall amount in the aggregate is recognized as “Unrealized depreciation on Recourse Trusts” on the Statement of Assets and Liabilities.
As of the end of the reporting period, each Fund’s maximum exposure to the Floaters issued by Recourse Trusts for self-deposited Inverse Floaters and externally-deposited Inverse Floaters was as follows:
| | | | | | | |
| | | Connecticut | | | Massachusetts | |
| | | Premium | | | Premium | |
| | | Income | | | Income | |
Floating Rate Obligations – Recourse Trusts | | (NTC) | | | (NMT) | |
Maximum exposure to Recourse Trusts: self deposited Inverse Floaters | | $ | 12,750,000 | | | $ | — | |
Maximum exposure to Recourse Trusts: externally deposited Inverse Floaters | | | 5,085,000 | | | | 7,325,000 | |
Total | | $ | 17,835,000 | | | $ | 7,325,000 | |
Zero Coupon Securities
A zero coupon security does not pay a regular interest coupon to its holders during the life of the security. Income to the holder of the security comes from accretion of the difference between the original purchase price of the security at issuance and the par value of the security at maturity and is effectively paid at maturity. The market prices of zero coupon securities generally are more volatile than the market prices of securities that pay interest periodically.
Investments in Derivatives
In addition to the inverse floating rate securities in which each Fund may invest, which are considered portfolio securities for financial reporting purposes, each Fund is authorized to invest in certain derivative instruments such as futures, options and swap contracts. Each Fund limits its investments in futures, options on futures and swap contracts to the extent necessary for the Adviser to claim the exclusion from registration by the Commodity Futures Trading Commission as a commodity pool operator with respect to the Fund. The Funds record derivative instruments at fair value, with changes in fair value recognized on the Statement of Operations, when applicable. Even though the Funds’ investments in derivatives may represent economic hedges, they are not considered to be hedge transactions for financial reporting purposes.
Notes to Financial Statements (Unaudited) (continued)
Although the Funds are authorized to invest in derivative instruments and may do so in the future, they did not make any such investments during the current fiscal period.
Market and Counterparty Credit Risk
In the normal course of business each Fund may invest in financial instruments and enter into financial transactions where risk of potential loss exists due to changes in the market (market risk) or failure of the other party to the transaction to perform (counterparty credit risk). The potential loss could exceed the value of the financial assets recorded on the financial statements. Financial assets, which potentially expose each Fund to counterparty credit risk, consist principally of cash due from counterparties on forward, option and swap transactions, when applicable. The extent of each Fund’s exposure to counterparty credit risk in respect to these financial assets approximates their carrying value as recorded on the Statement of Assets and Liabilities.
Each Fund helps manage counterparty credit risk by entering into agreements only with counterparties the Adviser believes have the financial resources to honor their obligations and by having the Adviser monitor the financial stability of the counterparties. Additionally, counterparties may be required to pledge collateral daily (based on the daily valuation of the financial asset) on behalf of each Fund with a value approximately equal to the amount of any unrealized gain above a pre-determined threshold. Reciprocally, when each Fund has an unrealized loss, the Funds have instructed the custodian to pledge assets of the Funds as collateral with a value approximately equal to the amount of the unrealized loss above a pre-determined threshold. Collateral pledges are monitored and subsequently adjusted if and when the valuations fluctuate, either up or down, by at least the pre-determined threshold amount.
4. Fund Shares | | | | |
Common Share Transactions | | | | |
Transactions in common shares during the Funds’ current and prior fiscal period were as follows: |
| | Connecticut | | Massachusetts |
| | Premium Income (NTC) | | Premium Income (NMT) |
| | Six Months | Year | | Six Months | Year |
| | Ended | Ended | | Ended | Ended |
| | 11/30/15 | 5/31/15 | | 11/30/15 | 5/31/15 |
Common shares: | | | | | |
Issued in the reorganizations | — | — | | — | 4,569,950 |
Repurchased and retired | — | (95,000) | | — | — |
Weighted average common share: | | | | | |
Price per share repurchased and retired | — | $12.53 | | — | — |
Discount per share repurchased and retired | — | 13.26% | | — | — |
Preferred Shares
Variable Rate MuniFund Term Preferred Shares
The following Funds have issued and outstanding Variable Rate MuniFund Term Preferred (“VMTP”) Shares, with a $100,000 liquidation value per share. VMTP Shares are issued via private placement and are not publicly available.
| | | | |
As of the end of the reporting period, VMTP Shares outstanding, at liquidation value, for each Fund were as follows: | | |
| |
| | | | Shares |
| | | | Outstanding at |
| | | Shares | $100,000 Per Share |
Fund | Series | Outstanding | Liquidation Value |
Connecticut Premium Income (NTC) | 2017 | 1,060 | $106,000,000 |
Massachusetts Premium Income (NMT) | 2017 | 740 | $ 74,000,000 |
Each Fund is obligated to redeem its VMTP Shares by the date as specified in its offering document (“Term Redemption Date”), unless earlier redeemed or repurchased by the Fund. VMTP Shares are subject to optional and mandatory redemption in certain circumstances. The VMTP Shares are subject to redemption at the option of the Fund (“Optional Redemption Date”), subject to payment of premium for one year following the date of issuance (“Premium Expiration Date”), and at par thereafter. Each Fund may be obligated to redeem certain of the VMTP Shares if a Fund fails to maintain certain asset coverage and leverage ratio requirements and such failures are not cured by the applicable cure date. The redemption price per share is equal to the sum of the liquidation value per share plus any accumulated but unpaid dividends. The Term Redemption Date, Optional Redemption Date and Premium Expiration Date for each Fund’s series of VMTP Shares are as follows:
| | | Term | Optional | Premium |
Fund | Series | Redemption Date | Redemption Date | Expiration Date |
Connecticut Premium Income (NTC) | 2017 | March 1, 2017 | March 1, 2015 | February 28, 2015 |
Massachusetts Premium Income (NMT) | 2017 | August 1, 2017 | July 1, 2015 | June 30, 2015 |
The average liquidation value of VMTP Shares outstanding and annualized dividend rate for each Fund during the current fiscal period were as follows:
| | | | | | |
| | Connecticut | | | Massachusetts | |
| | Premium | | | Premium | |
| | Income | | | Income | |
| | (NTC) | | | (NMT) | |
Average liquidation value of VMTP Shares outstanding | $ | 106,000,000 | | | $ | 74,000,000 | |
Annualized dividend rate | | 0.98 | % | | | 0.96 | % |
VMTP Shares generally do not trade, and market quotations are generally not available. VMTP Shares are short-term or short/intermediate-term instruments that pay a variable dividend rate tied to a short-term index, plus an additional fixed “spread” amount established at the time of issuance. The fair value of VMTP Shares is expected to be approximately their liquidation par value so long as the fixed “spread” on the VMTP Shares remains roughly in line with the “spread” rates being demanded by investors on instruments having similar terms in the current market environment. In present market conditions, the Funds’ Adviser has determined that fair value of VMTP Shares is their liquidation value, but their fair value could vary if market conditions change materially. For financial reporting purposes, the liquidation value of VMTP Shares is a liability and is recognized as “Variable Rate MuniFund Term Preferred (“VMTP”) Shares, at liquidation value” on the Statement of Assets and Liabilities.
Dividends on the VMTP shares (which are treated as interest payments for financial reporting purposes) are set weekly. Unpaid dividends on VMTP Shares are recognized as a component of “Interest payable” on the Statement of Assets and Liabilities, when applicable. Dividends accrued on VMTP Shares are recognized as a component of “Interest expense and amortization of offering costs” on the Statement of Operations.
Costs incurred by the Funds in connection with each Fund’s offering of VMTP Shares were recorded as a deferred charge, which are amortized over the life of the shares and are recognized as components of “Deferred offering costs” on the Statement of Assets and Liabilities and “Interest expense and amortization of offering costs” on the Statement of Operations.
Preferred Share Transactions
Transactions in preferred shares for the Funds during the current and prior fiscal period, where applicable, are noted in the following tables.
Transactions in MTP Shares for the Funds, where applicable, were as follows: |
| | |
| | Year Ended |
| | May 31, 2015 |
| | | | NYSE | | | | | | |
Massachusetts Premium Income (NMT) | Series | | Ticker | | Shares | | | Amount | |
MTP Shares issued in connection with reorganizations: | 2015 | | NMT PRE | | | 1,472,500 | | | $ | 14,725,000 | |
| | 2015-1 | | NMT PRF | | | 2,207,500 | | | | 22,075,000 | |
| | |
MTP Shares redeemed: | 2015 | | NMT PRC | | | (2,021,000 | ) | | | (20,210,000 | ) |
| | 2016 | | NMT PRD | | | (1,643,500 | ) | | | (16,435,000 | ) |
| | 2015-1 | | NMT PRE | | | (1,472,500 | ) | | | (14,725,000 | ) |
| | 2015-1 | | NMT PRF | | | (2,207,500 | ) | | | (22,075,000 | ) |
Net increase (decrease) | | | | | | (3,664,500 | ) | | $ | (36,645,000 | ) |
Transactions in VMTP Shares for the Funds, where applicable, were as follows:
| | Year Ended |
| | May 31, 2015 |
Massachusetts Premium Income (NMT) | Series | Shares | Amount |
VMTP Shares issued | 2017 | 740 | $74,000,000 |
5. Investment Transactions
Long-term purchases and sales (including maturities) during the current fiscal period were as follows:
| | Connecticut | Massachusetts |
| | Premium | Premium |
| | Income | Income |
| | (NTC) | (NMT) |
Purchases | $21,351,567 | $16,886,774 |
Sales and maturities | 19,668,164 | 15,732,493 |
Notes to Financial Statements (Unaudited) (continued)
6. Income Tax Information
Each Fund is a separate taxpayer for federal income tax purposes. Each Fund intends to distribute substantially all of its net investment income and net capital gains to shareholders and to otherwise comply with the requirements of Subchapter M of the Internal Revenue Code applicable to regulated investment companies. Therefore, no federal income tax provision is required. Furthermore, each Fund intends to satisfy conditions that will enable interest from municipal securities, which is exempt from regular federal and designated state income taxes, to retain such tax-exempt status when distributed to shareholders of the Funds. Net realized capital gains and ordinary income distributions paid by the Funds are subject to federal taxation.
For all open tax years and all major taxing jurisdictions, management of the Funds has concluded that there are no significant uncertain tax positions that would require recognition in the financial statements. Open tax years are those that are open for examination by taxing authorities (i.e., generally the last four tax year ends and the interim tax period since then). Furthermore, management of the Funds is also not aware of any tax positions for which it is reasonably possible that the total amounts of unrecognized tax benefits will significantly change in the next twelve months.
The following information is presented on an income tax basis. Differences between amounts for financial statement and federal income tax purposes are primarily due to timing differences in recognizing taxable market discount, timing differences in recognizing certain gains and losses on investment transactions and the treatment of investments in inverse floating rate securities reflected as financing transactions, if any. To the extent that differences arise that are permanent in nature, such amounts are reclassified within the capital accounts as detailed below. Temporary differences do not require reclassification. Temporary and permanent differences do not impact the NAVs of the Funds.
As of November 30, 2015, the cost and unrealized appreciation (depreciation) of investments, as determined on a federal income tax basis, were as follows:
| | Connecticut | Massachusetts |
| | Premium | Premium |
| | Income | Income |
| | (NTC) | (NMT) |
| |
Cost of investments | $295,509,807 | $197,759,383 |
Gross unrealized: | | |
Appreciation | $ 16,986,081 | $ 13,445,294 |
Depreciation | (525,599) | (721,313) |
Net unrealized appreciation (depreciation) of investments | $ 16,460,482 | $ 12,723,981 |
Permanent differences, primarily due to federal taxes paid, nondeductible offering costs, reorganization adjustments and nondeductible reorganization expenses resulted in reclassifications among the Funds’ components of common share net assets as of May 31, 2015, the Funds’ last tax year end, as follows:
| | Connecticut | Massachusetts |
| | Premium | Premium |
| | Income | Income |
| | (NTC) | (NMT) |
Paid-in surplus | $(67,130) | $2,209,763 |
Undistributed (Over-distribution of) net investment income | 65,916 | 340,327 |
Accumulated net realized gain (loss) | 1,214 | (2,550,090) |
The tax components of undistributed net tax-exempt income, net ordinary income and net long-term capital gains as of May 31, 2015, the Funds’ last tax year end, were as follows:
| | Connecticut | Massachusetts |
| | Premium | Premium |
| | Income | Income |
| | (NTC) | (NMT) |
Undistributed net tax-exempt income1 | $1,301,804 | $1,040,183 |
Undistributed net ordinary income2 | 37,635 | — |
Undistributed net long-term capital gains | — | — |
| 1 | Undistributed net tax-exempt income (on a tax basis) has not been reduced for the dividend declared on May 1, 2015, paid on June 1, 2015. |
| 2 | Net ordinary income consists of taxable market discount income and net short-term capital gains, if any. |
The tax character of distributions paid during the Funds’ last tax year ended May 31, 2015, was designated for purposes of the dividends paid deduction as follows:
| | Connecticut | Massachusetts |
| | Premium | Premium |
| | Income | Income |
| | (NTC) | (NMT) |
Distributions from net tax-exempt income | $11,016,828 | $6,899,372 |
Distributions from net ordinary income2 | 2,907 | 329 |
Distributions from net long-term capital gains | — | — |
| 2 | Net ordinary income consists of taxable market discount income and net short-term capital gains, if any. |
As of May 31, 2015, the Funds’ last tax year end, the Funds had unused capital loss carryforwards available for federal income tax purposes to be applied against future capital gains, if any. If not applied, the carryforwards will expire as shown in the following table. The losses not subject to expiration will be utilized first by a Fund.
| | Connecticut | Massachusetts |
| | Premium | Premium |
| | Income | Income |
| | (NTC) | (NMT)3 |
Expiration: | | |
May 31, 2016 | $ — | $ 215,629 |
May 31, 2017 | — | 24,486 |
May 31, 2018 | — | 62,941 |
Not subject to expiration | 7,594,672 | 3,987,452 |
Total | $7,594,672 | $4,290,508 |
| 3 | A portion of Massachusetts Premium Income’s (NMT) capital loss carryforward is subject to an annual limitation under the Internal Revenue Code and related regulations. |
During the Funds’ last tax year ended May 31, 2015, Massachusetts Premium Income (NMT) utilized $145,029 of its capital loss carryforward.
7. Management Fees and Other Transactions with Affiliates
Each Fund’s management fee compensates the Adviser for overall investment advisory and administrative services and general office facilities. The Sub-Adviser is compensated for its services to the Funds from the management fees paid to the Adviser.
Each Fund’s management fee consists of two components – a fund-level fee, based only on the amount of assets within each individual Fund, and a complex-level fee, based on the aggregate amount of all eligible fund assets managed by the Adviser. This pricing structure enables Fund shareholders to benefit from growth in the assets within their respective Fund as well as from growth in the amount of complex-wide assets managed by the Adviser.
The annual Fund-level fee, payable monthly, for each Fund is calculated according to the following schedule: |
| | Connecticut Premium Income (NTC) |
| | Massachusetts Premium Income (NMT) |
Average Daily Managed Assets* | Fund-Level Fee |
For the first $125 million | 0.4500% |
For the next $125 million | 0.4375 |
For the next $250 million | 0.4250 |
For the next $500 million | 0.4125 |
For the next $1 billion | 0.4000 |
For the next $3 billion | 0.3875 |
For managed assets over $5 billion | 0.3750 |
| | |
Notes to Financial Statements (Unaudited) (continued) | |
| |
| |
| |
The annual complex-level fee, payable monthly, for each Fund is calculated according to the following schedule: | |
Complex-Level Managed Asset Breakpoint Level* | Effective Rate at Breakpoint Level |
$55 billion | 0.2000% |
$56 billion | 0.1996 |
$57 billion | 0.1989 |
$60 billion | 0.1961 |
$63 billion | 0.1931 |
$66 billion | 0.1900 |
$71 billion | 0.1851 |
$76 billion | 0.1806 |
$80 billion | 0.1773 |
$91 billion | 0.1691 |
$125 billion | 0.1599 |
$200 billion | 0.1505 |
$250 billion | 0.1469 |
$300 billion | 0.1445 |
| * | For the fund-level and complex-level fees, managed assets include closed-end fund assets managed by the Adviser that are attributable to certain types of leverage. For these purposes, leverage includes the funds’ use of preferred stock and borrowings and certain investments in the residual interest certificates (also called inverse floating rate securities) in tender option bond (TOB) trusts, including the portion of assets held by a TOB trust that has been effectively financed by the trust’s issuance of floating rate securities, subject to an agreement by the Adviser as to certain funds to limit the amount of such assets for determining managed assets in certain circumstances. The complex-level fee is calculated based upon the aggregate daily managed assets of all Nuveen Funds that constitute “eligible assets.” Eligible assets do not include assets attributable to investments in other Nuveen Funds or assets in excess of $2 billion added to the Nuveen Fund complex in connection with the Adviser’s assumption of the management of the former First American Funds effective January 1, 2011. As of November 30, 2015, the complex-level fee for each Fund was 0.1639%. |
The Funds pay no compensation directly to those of its trustees who are affiliated with the Adviser or to its officers, all of whom receive remuneration for their services to the Funds from the Adviser or its affiliates. The Board has adopted a deferred compensation plan for independent trustees that enables trustees to elect to defer receipt of all or a portion of the annual compensation they are entitled to receive from certain Nuveen-advised funds. Under the plan, deferred amounts are treated as though equal dollar amounts had been invested in shares of select Nuveen-advised funds.
8. Borrowing Arrangements
During the current fiscal period, the Funds, along with certain other funds managed by the Adviser (“Participating Funds”), established a 364-day, $2.53 billion standby credit facility with a group of lenders, under which the Participating Funds may borrow for various purposes other than leveraging for investment purposes. A large portion of this facility’s capacity (and its associated costs as described below) is currently dedicated for use by a small number of Participating Funds, which does not include any of the Funds covered by this shareholder report. The remaining capacity under the facility (and the corresponding portion of the facility’s annual costs) is separately dedicated to most of the other open-end funds in the Nuveen fund family, along with a number of Nuveen closed-end funds, including all of the Funds covered by this shareholder report. The credit facility expires in July 2016 unless extended or renewed.
The credit facility has the following terms: a fee of 0.15% per annum on unused commitment amounts, and interest at a rate equal to the higher of (a) one-month LIBOR (London Inter-Bank Offered Rate) plus 1.25% per annum or (b) the Fed Funds rate plus 1.25% per annum on amounts borrowed. Participating Funds paid administration, legal and arrangement fees, which are recognized as a component of “other expenses” on the Statement of Operations, and along with commitment fees, have been allocated among such Participating Funds based upon the relative proportions of the facility’s aggregate capacity reserved for them and other factors deemed relevant by the Adviser and the Board of each Participating Fund.
During the current fiscal period, none of the Funds utilized this facility.
Additional
Fund Information
| | | | | | |
Board of Trustees | | | | | |
William Adams IV* | Jack B. Evans | William C. Hunter | David J. Kundert | John K. Nelson | William J. Schneider |
Thomas S. Schreier, Jr.* | Judith M. Stockdale | Carole E. Stone | Virginia L. Stringer** | Terence J. Toth | |
| * | Interested Board Member. |
| ** | Retired from the Funds’ Board of Trustees effective December 31, 2015. |
Fund Manager | Custodian | Legal Counsel | Independent Registered | Transfer Agent and |
Nuveen Fund Advisors, LLC | State Street Bank | Chapman and Cutler LLP | Public Accounting Firm | Shareholder Services |
333 West Wacker Drive | & Trust Company | Chicago, IL 60603 | KPMG LLP | State Street Bank |
Chicago, IL 60606 | Boston, MA 02111 | | Chicago, IL 60601 | & Trust Company |
| | | | | Nuveen Funds |
| | | | | P.O. Box 43071 |
| | | | | Providence, RI 02940-3071 |
| | | | | (800) 257-8787 |
Quarterly Form N-Q Portfolio of Investments Information
Each Fund is required to file its complete schedule of portfolio holdings with the Securities and Exchange Commission (SEC) for the first and third quarters of each fiscal year on Form N-Q. You may obtain this information directly from the SEC. Visit the SEC on-line at http://www.sec.gov or in person at the SEC’s Public Reference Room in Washington, D.C. Call the SEC toll-free at (800) SEC-0330 for room hours and operation.
Nuveen Funds’ Proxy Voting Information
You may obtain (i) information regarding how each fund voted proxies relating to portfolio securities held during the most recent twelve-month period ended June 30, without charge, upon request, by calling Nuveen Investments toll-free at (800) 257-8787 or on Nuveen’s website at www.nuveen.com and (ii) a description of the policies and procedures that each fund used to determine how to vote proxies relating to portfolio securities without charge, upon request, by calling Nuveen Investments toll free at (800) 257-8787. You may also obtain this information directly from the SEC. Visit the SEC on-line at http://www.sec.gov.
CEO Certification Disclosure
Each Fund’s Chief Executive Officer (CEO) has submitted to the New York Stock Exchange (NYSE) the annual CEO certification as required by Section 303A.12(a) of the NYSE Listed Company Manual. Each Fund has filed with the SEC the certification of its CEO and Chief Financial Officer required by Section 302 of the Sarbanes-Oxley Act.
Common Share Repurchases
Each Fund intends to repurchase, through its open-market share repurchase program, shares of its own common stock at such times and in such amounts as is deemed advisable. During the period covered by this report, each Fund repurchased shares of its common stock, as shown in the accompanying table. Any future repurchases will be reported to shareholders in the next annual or semi-annual report.
| | NTC | NMT |
Common shares repurchased | — | — |
FINRA BrokerCheck
The Financial Industry Regulatory Authority (FINRA) provides information regarding the disciplinary history of FINRA member firms and associated investment professionals. This information as well as an investor brochure describing FINRA BrokerCheck is available to the public by calling the FINRA BrokerCheck Hotline number at (800) 289-9999 or by visiting www.FINRA.org.
Glossary of Terms
Used in this Report
■ | Auction Rate Bond: An auction rate bond is a security whose interest payments are adjusted periodically through an auction process, which process typically also serves as a means for buying and selling the bond. Auctions that fail to attract enough buyers for all the shares offered for sale are deemed to have “failed,” with current holders receiving a formula-based interest rate until the next scheduled auction. |
■ | Average Annual Total Return: This is a commonly used method to express an investment’s performance over a particular, usually multi-year time period. It expresses the return that would have been necessary each year to equal the investment’s actual cumulative performance (including change in NAV or market price and reinvested dividends and capital gains distributions, if any) over the time period being considered. |
■ | Duration: Duration is a measure of the expected period over which a bond’s principal and interest will be paid, and consequently is a measure of the sensitivity of a bond’s or bond fund’s value to changes when market interest rates change. Generally, the longer a bond’s or fund’s duration, the more the price of the bond or fund will change as interest rates change. |
■ | Effective Leverage: Effective leverage is a fund’s effective economic leverage, and includes both regulatory leverage (see leverage) and the leverage effects of certain derivative investments in the fund’s portfolio. Currently, the leverage effects of Tender Option Bond (TOB) inverse floater holdings are included in effective leverage values, in addition to any regulatory leverage. |
■ | Escrowed to Maturity Bond: When proceeds of a refunding issue are deposited in an escrow account for investment in an amount sufficient to pay the principal and interest on the issue being refunded. In some cases, though, an issuer may expressly reserve its right to exercise an early call of bonds that have been escrowed to maturity. |
■ | Inverse Floating Rate Securities: Inverse floating rate securities, also known as inverse floaters or tender option bonds (TOBs), are created by depositing a municipal bond, typically with a fixed interest rate, into a special purpose trust. This trust, in turn, (a) issues floating rate certificates typically paying short-term tax-exempt interest rates to third parties in amounts equal to some fraction of the deposited bond’s par amount or market value, and (b) issues an inverse floating rate certificate (sometimes referred to as an “inverse floater”) to an investor (such as a Fund) interested in gaining investment exposure to a long-term municipal bond. The income received by the holder of the inverse floater varies inversely with the short-term rate paid to the floating rate certificates’ holders, and in most circumstances the holder of the inverse floater bears substantially all of the underlying bond’s downside investment risk. The holder of the inverse floater typically also benefits disproportionately from any potential appreciation of the underlying bond’s value. Hence, an inverse floater essentially represents an investment in the underlying bond on a leveraged basis. |
■ | Leverage: Leverage is created whenever a fund has investment exposure (both reward and/or risk) equivalent to more than 100% of the investment capital. |
■ | Lipper Other States Municipal Debt Funds Classification Average: Calculated using the returns of all closed-end funds in this category. Lipper returns account for the effects of management fees and assume reinvestment of distributions, but do not reflect any applicable sales charges. |
■ | Net Asset Value (NAV) Per Share: A fund’s Net Assets is equal to its total assets (securities, cash, accrued earnings and receivables) less its total liabilities. NAV per share is equal to the fund’s Net Assets divided by its number of shares outstanding. |
■ | Pre-Refunding: Pre-Refunding, also known as advanced refundings or refinancings, is a procedure used by state and local governments to refinance municipal bonds to lower interest expenses. The issuer sells new bonds with a lower yield and uses the proceeds to buy U.S. Treasury securities, the interest from which is used to make payments on the higher-yielding bonds. Because of this collateral, pre-refunding generally raises a bond’s credit rating and thus its value. |
■ | Regulatory Leverage: Regulatory Leverage consists of preferred shares issued by or borrowings of a fund. Both of these are part of a fund’s capital structure. Regulatory leverage is subject to asset coverage limits set in the Investment Company Act of 1940. |
■ | S&P Municipal Bond Connecticut Index: An unleveraged, market value-weighted index designed to measure the performance of the tax-exempt, investment-grade Connecticut municipal bond market. Index returns assume reinvestment of distributions, but do not reflect any applicable sales charges or management fees. |
■ | S&P Municipal Bond Index: An unleveraged, market value-weighted index designed to measure the performance of the tax-exempt, investment-grade U.S. municipal bond market. Index returns assume reinvestment of distributions, but do not reflect any applicable sales charges or management fees. |
■ | S&P Municipal Bond Massachusetts Index: An unleveraged, market value-weighted index designed to measure the performance of the tax-exempt, investment-grade Massachusetts municipal bond market. Index returns assume reinvestment of distributions, but do not reflect any applicable sales charges or management fees. |
■ | Total Investment Exposure: Total investment exposure is a fund’s assets managed by the Adviser that are attributable to financial leverage. For these purposes, financial leverage includes a fund’s use of preferred stock and borrowings and investments in the residual interest certificates (also called inverse floating rate securities) in tender option bond (TOB) trusts, including the portion of assets held by a TOB trust that has been effectively financed by the trust’s issuance of floating rate securities. |
■ | Zero Coupon Bond: A zero coupon bond does not pay a regular interest coupon to its holders during the life of the bond. Income to the holder of the bond comes from accretion of the difference between the original purchase price of the bond at issuance and the par value of the bond at maturity and is effectively paid at maturity. The market prices of zero coupon bonds generally are more volatile than the market prices of bonds that pay interest periodically. |
Reinvest Automatically,
Easily and Conveniently
Nuveen makes reinvesting easy. A phone call is all it takes to set up your reinvestment account.
Nuveen Closed-End Funds Automatic Reinvestment Plan
Nuveen Closed-End Fund allows you to conveniently reinvest distributions in additional Fund shares. By choosing to reinvest, you’ll be able to invest money regularly and automatically, and watch your investment grow through the power of compounding. Just like distributions in cash, there may be times when income or capital gains taxes may be payable on distributions that are reinvested. It is important to note that an automatic reinvestment plan does not ensure a profit, nor does it protect you against loss in a declining market.
Easy and convenient
To make recordkeeping easy and convenient, each month you’ll receive a statement showing your total distributions, the date of investment, the shares acquired and the price per share, and the total number of shares you own.
How shares are purchased
The shares you acquire by reinvesting will either be purchased on the open market or newly issued by the Fund. If the shares are trading at or above net asset value at the time of valuation, the Fund will issue new shares at the greater of the net asset value or 95% of the then-current market price. If the shares are trading at less than net asset value, shares for your account will be purchased on the open market. If the Plan Agent begins purchasing Fund shares on the open market while shares are trading below net asset value, but the Fund’s shares subsequently trade at or above their net asset value before the Plan Agent is able to complete its purchases, the Plan Agent may cease open-market purchases and may invest the uninvested portion of the distribution in newly-issued Fund shares at a price equal to the greater of the shares’ net asset value or 95% of the shares’ market value on the last business day immediately prior to the purchase date. Distributions received to purchase shares in the open market will normally be invested shortly after the distribution payment date. No interest will be paid on distributions awaiting reinvestment. Because the market price of the shares may increase before purchases are completed, the average purchase price per share may exceed the market price at the time of valuation, resulting in the acquisition of fewer shares than if the distribution had been paid in shares issued by the Fund. A pro rata portion of any applicable brokerage commissions on open market purchases will be paid by Plan participants. These commissions usually will be lower than those charged on individual transactions.
Flexible
You may change your distribution option or withdraw from the Plan at any time, should your needs or situation change. You can reinvest whether your shares are registered in your name, or in the name of a brokerage firm, bank, or other nominee. Ask your investment advisor if his or her firm will participate on your behalf. Participants whose shares are registered in the name of one firm may not be able to transfer the shares to another firm and continue to participate in the Plan. The Fund reserves the right to amend or terminate the Plan at any time. Although the Fund reserves the right to amend the Plan to include a service charge payable by the participants, there is no direct service charge to participants in the Plan at this time.
Call today to start reinvesting distributions
For more information on the Nuveen Automatic Reinvestment Plan or to enroll in or withdraw from the Plan, speak with your financial advisor or call us at (800) 257-8787.
Notes
Notes
Notes
Nuveen Investments:
Serving Investors for Generations
Since 1898, financial advisors and their clients have relied on Nuveen Investments to provide dependable investment solutions through continued adherence to proven, long-term investing principles. Today, we offer a range of high quality equity and fixed-income solutions designed to be integral components of a well-diversified core portfolio.
Focused on meeting investor needs.
Nuveen Investments provides high-quality investment services designed to help secure the long-term goals of institutional and individual investors as well as the consultants and financial advisors who serve them. Nuveen Investments markets a wide range of specialized investment solutions which provide investors access to capabilities of its high-quality boutique investment affiliates—Nuveen Asset Management, Symphony Asset Management, NWQ Investment Management Company, Santa Barbara Asset Management, Tradewinds Global Investors, Winslow Capital Management and Gresham Investment Management. In total, Nuveen Investments managed approximately $225 billion as of December 31, 2015.
Find out how we can help you.
To learn more about how the products and services of Nuveen Investments may be able to help you meet your financial goals, talk to your financial advisor, or call us at (800) 257-8787. Please read the information provided carefully before you invest. Investors should consider the investment objective and policies, risk considerations, charges and expenses of any investment carefully. Where applicable, be sure to obtain a prospectus, which contains this and other relevant information. To obtain a prospectus, please contact your securities representative or Nuveen Investments, 333 W. Wacker Dr., Chicago, IL 60606. Please read the prospectus carefully before you invest or send money.
Learn more about Nuveen Funds at: www.nuveen.com/cef
Distributed by Nuveen Investments, LLC | 333 West Wacker Drive | Chicago, IL 60606 | www.nuveen.com
ESA-B-115D 13129-INV-B-01/17
ITEM 2. CODE OF ETHICS.
Not applicable to this filing.
ITEM 3. AUDIT COMMITTEE FINANCIAL EXPERT.
Not applicable to this filing.
ITEM 4. PRINCIPAL ACCOUNTANT FEES AND SERVICES.
Not applicable to this filing.
ITEM 5. AUDIT COMMITTEE OF LISTED REGISTRANTS.
Not applicable to this filing.
ITEM 6. SCHEDULE OF INVESTMENTS.
(a) See Portfolio of Investments in Item 1.
(b) Not applicable.
ITEM 7. DISCLOSURE OF PROXY VOTING POLICIES AND PROCEDURES FOR CLOSED-END MANAGEMENT INVESTMENT COMPANIES.
Not applicable to this filing.
ITEM 8. PORTFOLIO MANAGERS OF CLOSED-END MANAGEMENT INVESTMENT COMPANIES.
Not applicable to this filing.
ITEM 9. PURCHASES OF EQUITY SECURITIES BY CLOSED-END MANAGEMENT INVESTMENT COMPANY AND AFFILIATED PURCHASERS.
Not applicable.
ITEM 10. SUBMISSION OF MATTERS TO A VOTE OF SECURITY HOLDERS.
There have been no material changes to the procedures by which shareholders may recommend nominees to the registrant's Board implemented after the registrant last provided disclosure in response to this Item.
ITEM 11. CONTROLS AND PROCEDURES.
ITEM 12. EXHIBITS.
File the exhibits listed below as part of this Form.
Pursuant to the requirements of the Securities Exchange Act of 1934 and the Investment Company Act of 1940, the registrant has duly caused this report to be signed on its behalf by the undersigned, thereunto duly authorized.
Kevin J. McCarthy
Pursuant to the requirements of the Securities Exchange Act of 1934 and the Investment Company Act of 1940, this report has been signed below by the following persons on behalf of the registrant and in the capacities and on the dates indicated.
Gifford R. Zimmerman
Stephen D. Foy