Chair’s LetterDear Shareholders,
Financial markets finished 2019 on a high note, despite the challenges of a weak start to the year, a slower global economy and heightened geopolitical risks. While global manufacturing languished, consumers remained resilient amid tight labor markets, growing wages and tame inflation. Global business sentiment, however, was less optimistic due to trade frictions and weaker global demand, and across advanced economies, growth in corporate profits and earnings was subdued in 2019. Nevertheless, the Federal Reserve’s (Fed) pivot to easing monetary conditions, along with liquidity provided by other central banks around the world, provided confidence that the economic cycle could be extended. Additionally, the year ended with a reduction in trade tensions and Brexit uncertainty, although the direction of policy and sentiment from here remains difficult to predict.
While we continue to anticipate muted economic growth and increased market volatility, we note that recession fears appear to have receded. The U.S. economy held steady in the third quarter, and fourth quarter economic indicators have provided upside surprises. Consumer confidence remains underpinned by low unemployment and modest wage growth. Looser financial conditions, in part driven by the Fed’s three interest rate cuts in 2019, have revived momentum in the housing market and should continue to encourage borrowing by consumers and businesses. Outside the U.S., Germany avoided a recession in the second half of 2019 and other eurozone economic indicators are pointing to stabilization and improving sentiment. Consumer spending in Europe and Japan, like in the U.S., has remained supported by jobs growth and rising wages.
At Nuveen, we still see investment opportunities in the maturing economic environment, but we are taking a selective approach. If you’re concerned about where the markets are headed from here, we encourage you to work with your financial advisor to review your time horizon, risk tolerance and investment goals. On behalf of the other members of the Nuveen Fund Board, we look forward to continuing to earn your trust in the months and years ahead.
Sincerely,
Terence J. Toth
Chair of the Board
January 21, 2020
4
Portfolio Managers’ CommentsNuveen Georgia Quality Municipal Income Fund (NKG)Nuveen Maryland Quality Municipal Income Fund (NMY)Nuveen Massachusetts Quality Municipal Income Fund (NMT)Nuveen Minnesota Quality Municipal Income Fund (NMS)Nuveen Missouri Quality Municipal Income Fund (NOM)Nuveen Virginia Quality Municipal Income Fund (NPV) These Funds feature portfolio management by Nuveen Asset Management, LLC (NAM), an affiliate of Nuveen, LLC. Portfolio managers Daniel J. Close, CFA, Stephen J. Candido, CFA, Christopher L. Drahn, CFA, and Michael S. Hamilton discuss key investment strategies and the six-month performance of these six Nuveen Funds. Dan has managed the Nuveen Georgia Fund since 2007. Steve assumed portfolio management responsibility for the Maryland and Virginia Funds in 2016. Chris has managed the Missouri Fund since 2011 and assumed responsibility for the Minnesota Fund in 2016. Michael assumed portfolio management responsibility for the Massachusetts Fund in 2011.
What key strategies were used to manage the Funds during the six-month reporting period ended November 30, 2019?
Each Fund seeks to provide current income exempt from both regular federal and designated state income taxes by investing primarily in a portfolio of municipal obligations issued by state and local government authorities within a single state or certain U.S. territories. Under normal market conditions, each Fund invests at least 80% of the sum of its net assets and the amount of any borrowings for investment purposes in municipal bonds that pay interest that is exempt from regular federal personal income tax and a single state’s personal income tax. The Funds may invest up to 20% in municipal securities that are exempt from regular federal income tax, but not from that single state’s income tax if, in the portfolio manager’s judgement, such purchases are expected to enhance the Fund’s after-tax total return potential. The Nuveen Minnesota Quality Municipal Income Fund (NMS) may invest only to a lesser extent in bonds not exempt from Minnesota income tax, in order to conform to a requirement imposed by the State of Minnesota that a fund derive at least 95% of its exempt-interest dividends from bonds of issuers located in Minnesota in order for the fund’s dividends to be exempt from those Minnesota income taxes. To the extent that the Fund invests in bonds of municipal issuers located in other states, the Fund’s dividends may not be exempt from state personal income tax.
This material is not intended to be a recommendation or investment advice, does not constitute a solicitation to buy, sell or hold a security or an investment strategy and is not provided in a fiduciary capacity. The information provided does not take into account the specific objectives or circumstances of any particular investor, or suggest any specific course of action. Investment decisions should be made based on an investor’s objectives and circumstances and in consultation with his or her advisors.Certain statements in this report are forward-looking statements. Discussions of specific investments are for illustration only and are not intended as recommendations of individual investments. The forward-looking statements and other views expressed herein are those of the portfolio managers as of the date of this report. Actual future results or occurrences may differ significantly from those anticipated in any forward-looking statements, and the views expressed herein are subject to change at any time, due to numerous market and other factors. The Funds disclaim any obligation to update publicly or revise any forward-looking statements or views expressed herein.
For financial reporting purposes, the ratings disclosed are the highest rating given by one of the following national rating agencies: Standard & Poor’s Group (S&P), Moody’s Investors Service, Inc. (Moody’s) or Fitch, Inc. (Fitch). This treatment of split-rated securities may differ from that used for other purposes, such as for Fund investment policies. Credit ratings are subject to change. AAA, AA, A and BBB are investment grade ratings, while BB, B, CCC, CC, C and D are below investment grade ratings. Holdings designated N/R are not rated by these national rating agencies.
Bond insurance guarantees only the payment of principal and interest on the bond when due, and not the value of the bonds themselves, which will fluctuate with the bond market and the financial success of the issuer and the insurer. Insurance relates specifically to the bonds in the portfolio and not to the share prices of a Fund. No representation is made as to the insurers’ ability to meet their commitments.
Refer to the Glossary of Terms Used in this Report for further definition of the terms used within this section.
5
Portfolio Managers’ Comments (continued)
Municipal bonds performed well during the six-month reporting period. Bond prices rose as interest rates fell, under pressure from concerns about a slower economic environment and the ongoing trade tensions between the U.S. and China. With interest rates staying at low levels, investors continued to seek higher yield investments, including municipal bonds. The elevated demand and a moderate pace of supply, along with benign credit conditions, helped keep municipal credit spreads stable to narrowing. Investors also tended to favor the incremental yield offered by longer duration and lower credit quality municipal bonds, which helped credits with these characteristics outperform the broad market.
Compared to the national municipal market, the Georgia, Maryland, Massachusetts and Virginia municipal markets underperformed and Missouri’s market outperformed, while Minnesota performed in line with the national market. During this time, we continued to take a bottom-up approach to discovering sectors that appeared undervalued as well as individual credits that we believed had the potential to perform well over the long term.
Our trading activity continued to focus on pursuing the Funds’ investment objectives. We continued to seek bonds in areas of the market that we expected to perform well as the economy continued to improve. While the supply available in each state varied, to the extent possible, the Funds’ overall positioning emphasized intermediate and longer maturities, lower rated credits and sectors offering higher yields.
In NKG, we were comfortable with the Fund’s positioning coming into the reporting period. We worked to reinvest the proceeds from called and maturing bonds to keep the Fund fully invested. We bought three in-state credits: a prepaid gas bond issued for Main Street Natural Gas Inc., a hospital bond issued for Children’s Healthcare of Atlanta and a local general obligation (GO) bond for Valdosta and Lowndes County Hospital Authority. There were no notable sales from NKG’s portfolio during the reporting period.
NMY found attractive opportunities to invest in higher grade bonds early in the reporting period as the interest rates rally began, including longer dated issues for Anne Arundel Health System and Washington Suburban Sanitation District and higher grade housing bonds for the Maryland Community Development Administration. We also added to the Maryland Fund’s high yield exposure with purchases of Maryland Economic Development Corporation AFCO Cargo, a new cargo leasing facility at Baltimore Washington International Airport, Puerto Rico sales tax revenue bonds known as COFINAs, Puerto Rico Aqueduct and Sewer Authority (PRASA) and Baltimore Harbor Point Project, a mixed use real estate development. All additions in this reporting period were in-state bonds. To fund the new opportunities, we sold some shorter dated bonds and used call and maturity proceeds.
NMT continued to add to Puerto Rico COFINAs, particularly structures with longer (20- to 30-year) maturities. Other purchases included credits issued for a local school district, higher education, hospitals, housing and charter schools. The proceeds from maturing bonds provided most of the cash to buy new bonds.
In Minnesota, state issuance increased substantially in the recent six-month reporting period (June 2019 to November 2019) compared to the prior six months (December 2018 to May 2019). A new issue for Minneapolis-St. Paul Metropolitan Airport priced in August 2019, and we bought the bond for NMS in the secondary market after yields had moved somewhat higher in the fall. We added a lower investment grade rated credit for St. Paul Community of Peace Charter School and two non-rated credits, Wayzata Folkstone Senior Living Community and Maple Plain Haven Homes Senior Housing. All four bonds bought in this reporting period offered incremental yield. Overall, NMS’s sector positions remained unchanged during the reporting period, with overweight allocations to health care and higher education and underweight allocations to state GOs.
6
Trading activity in NOM was muted in this reporting period, as we had a relatively small amount of cash from called and maturing bonds to be put to work. Much of the activity occurred within the Fund’s Puerto Rico exposure. COFINAs were the first major credit to exit Puerto Rico’s bankruptcy-like restructuring process and new bonds were issued with improved security features. NOM’s old COFINA bonds experienced calls and we bought some of the new replacement bonds.
In NPV, we remained patient for opportunities to reinvest a modest level of proceeds from maturing bonds. We added to the Virginia Fund’s high yield exposure with COFINA and PRASA credits, both of which performed well during the reporting period, and bonds for Fort Norfolk Retirement Community, Inc., a high end continuing care retirement community (CCRC). In the transportation sector, we bought Metropolitan Washington DC Airports Authority and Metropolitan Washington DC Airports Dulles Toll Road. We also purchased an out of state hospital bond for CommonSpririt, a national Catholic hospital system, because it appeared to be a compelling opportunity even after the out of state tax differences. To buy these bonds, we sold some shorter dated, lower embedded yield paper, for example Virginia Electric and Power, as well as used the proceeds from maturing bonds, such as Virginia Ports Authority.
As of November 30, 2019, NKG, NMY, NMT, NOM and NPV continued to use inverse floating rate securities. We employ inverse floaters for a variety of reasons, including duration management, income enhancement and total return enhancement.
How did the Funds perform during the six-month reporting period ended November 30, 2019?
The tables in each Fund’s Performance Overview and Holding Summaries section of this report provide the Funds’ total returns for the six-month, one-year, five-year and ten-year periods ended November 30, 2019. Each Fund’s total returns at common share net asset value (NAV) are compared with the performance of corresponding market indexes.
For the six-month reporting period ended November 30, 2019, the total return at common share NAV for all six Funds outperformed their respective state’s S&P Municipal Bond Index and the national S&P Municipal Bond Index.
The Funds’ performance was affected by duration and yield curve positioning, credit ratings allocations, sector allocations and credit selection. In addition, the use of regulatory leverage was a factor affecting performance of the Funds. Leverage is discussed in more detail later in the Fund Leverage section of this report.
Duration and yield curve positioning was beneficial to all six Funds in this reporting period, as the Funds maintained longer duration profiles than their benchmark indexes, which enabled the Funds to benefit more in the falling interest rate environment, and emphasized longer maturities, which outperformed shorter maturity bonds. NKG was most helped by an overweight to 8- to 10-year duration bonds and an underweight to 0- to 2-year duration bonds. For NMY, overweight allocations to longer duration bonds in general were advantageous but especially strong was the overweight to 8- to 10-year durations and an underweight to the shortest durations. NMT’s overweight allocations to 6-year and longer duration bonds and underweight allocations across the 2- to 6-year duration categories were positive contributors, as longer duration bonds outperformed intermediate duration bonds. For NMS, the overweight allocation to the longest durations was the main contributor. NOM’s duration and yield curve positioning was modestly positive as the Fund’s overall duration profile was longer than its benchmark but by less so than other Funds. We have continued to hold bonds with higher embedded yields to support NOM’s dividend, even as their durations naturally drifted lower as the bonds
7
Portfolio Managers’ Comments (continued)
approach their maturity date. As a result, NOM’s duration positioning has tended to be a smaller contributor than it is for the other Funds. In NPV, the largest contribution came from durations of 8 years and longer, followed by an underweight to the 2- to 6-year segment.
Credit ratings allocations had a positive impact on the Funds’ performance in this reporting period. The Funds were generally positioned with heavier weightings among lower rated bonds, which outperformed, and less emphasis on high grade bonds, which lagged. In NKG, the overweight to BBB rated bonds was the strongest contributor, offsetting a small detraction from the overweight to AA rated credits, which underperformed. NMY’s overweight allocations to BBB and below investment grade bonds (including Puerto Rico, tobacco settlement, real estate project and CCRC bonds) were the largest positive contributors, and a sizeable underweight to AAA and AA rated paper also helped. NMT’s overweight allocation to BBB and lower rated credits, including non-rated bonds, and the underweight allocation to the highest grade (AAA and AA rated) paper were the most beneficial. For NMS, overweight allocations to single A, BBB and non-rated bonds added value. NOM’s credit quality positioning contributed marginally to performance, driven by overweight allocations to BBB and BB rated bonds. In NPV, overweights to BBB and non-rated bonds and an underweight to AAA rated credits helped. However, NPV’s underweight allocation to single A rated credits was a slight detractor as the single A segment outperformed the benchmark index.
Sector allocations were favorable for most of the Funds during this reporting period. NKG’s performance was negatively impacted from its allocation to Georgia state GOs but was helped by an overweight to the higher education sector. For NMY, the overweight to health care sector (including hospitals, life care and nursing homes) was the top contributor. NMY’s out of state tobacco settlement bonds (Maryland does not offer tobacco bonds) helped as higher yielding, lower rated credits outperformed. The Maryland Fund’s underweight to the tax supported sector was also beneficial. Within the tax supported sector, NMY has maintained a meaningful underweight to state GOs, which look less opportunistic to us given the size of the state’s pension funding shortfall. NMT’s allocation to the tax supported sector aided performance, particularly the Fund’s position in dedicated tax bonds such as COFINAs. However, the health care sector was a slight detractor from the Massachusetts Fund due to the underperformance of some life care credits that were older portfolio positions and had shorter durations rather than credit or sector related. For NMS and NOM, sector positioning was not a material factor driving performance in this reporting period. In NPV, the large overweight to the transportation sector was a large positive contributor, as was the overweight to tobacco settlement bonds. Also advantageous was the Virginia Fund’s overweight to the aggregated health care sector (including hospitals, CCRCs, life care and nursing homes). We note that although we have deemphasized CCRCs, where default rates have been relatively higher, NPV owns selected lower rated, higher yielding CCRC names that have performed well as spreads contracted. Additionally, NPV’s sizeable underweight to the tax supported sector helped performance.
8
Among individual credits, the best performers in this reporting period were holdings with longer durations and offering higher yields, while shorter dated, high quality bonds such as pre-refunded bonds lagged. NKG benefited from strong security selection, especially among single A and BBB rated credits and among its tender option bond (TOB) holdings due to their longer durations. For NMY, the top performers included zero coupon bonds (especially zero coupon tobacco settlement bonds), longer dated health care credits (MedStar Health, Trinity Health and Peninsula Regional Medical Center), high yield names (St. Mary’s University, COFINAs and Vantage House, a CCRC in Howard County). NMT’s positions in COFINA bonds led performance, with additional contributions from several lower rated health care bonds (CareGroup, Lowell General Hospital and Dana-Farber Cancer Institute), U.S. territory bonds issued for Guam Waterworks Authority and a non-call bond issued for WGBH Educational Foundation. Non-callable structures maintain long duration profiles over the life of the bond, which was beneficial in this reporting period when long duration bonds outperformed. For NMS, long duration holdings also did well. Tightening credit spreads in St. Paul Port Authority Gerdau Steel Mill Project bonds and in health care names such as Fairview Hospital and Essentia Health helped these bonds perform well. A long duration Western Minnesota Municipal Power Agency bond which was advance refunded was another strong performer. For NOM, in addition to longer duration holdings, some of the better performers included senior living holdings such as Lutheran Senior Services bonds, as Missouri senior living issuance subsided and credit spreads tightened in the secondary market, and an A.T. Still University bond which was advance refunded. NPV’s top contributors included Metropolitan Washington DC Airports Dulles Toll Road zero coupon bonds, I-66 toll road, Chesapeake Bay Bridge and Tunnel, TOBs, tobacco settlement bonds, Peninsula Town Center, Hampton Road Sanitation District (which saw strong price appreciation due to its advance refunding) and COFINAs.
9
IMPACT OF THE FUNDS’ LEVERAGE STRATEGIES ON PERFORMANCE
One important factor impacting the returns of the Funds’ common shares relative to their comparative benchmarks was the Funds’ use of leverage through their issuance of preferred shares and/or investments in inverse floating rate securities, which represent leveraged investments in underlying bonds. The Funds use leverage because our research has shown that, over time, leveraging provides opportunities for additional income. The opportunity arises when short-term rates that the Fund pays on its leveraging instruments are lower than the interest the Fund earns on its portfolio of long-term bonds that it has bought with the proceeds of that leverage. This has been particularly true in the recent market environment where short-term rates have been low by historical standards.
However, use of leverage can expose Fund common shares to additional price volatility. When a Fund uses leverage, the Fund’s common shares will experience a greater increase in their net asset value if the municipal bonds acquired through the use of leverage increase in value, but will also experience a correspondingly larger decline in their net asset value if the bonds acquired through leverage decline in value, which will make the shares’ net asset value more volatile, and total return performance more variable, over time.
In addition, common share income in levered funds will typically decrease in comparison to unlevered funds when short-term interest rates increase and increase when short-term interest rates decrease. In recent quarters, fund leverage expenses have generally tracked the overall movement of short-term tax-exempt interest rates. While fund leverage expenses are somewhat higher than their all-time lows after the 2007-2009 financial crisis, which has contributed to a reduction in common share net income and long-term total return potential, leverage nevertheless continues to provide the opportunity for incremental common share income. Management believes that the potential benefits from leverage continue to outweigh the associated increase in risk and volatility previously described.
Leverage from issuance of preferred shares had a positive impact on the total return performance of all six Funds over the reporting period. The use of leverage through inverse floating rate securities had a negligible impact on the total return performance of the Funds over the reporting period.
As of November 30, 2019, the Funds’ percentages of leverage are as shown in the accompanying table.
| | | | | | | |
| NKG | NMY | NMT | NMS | NOM | NPV |
Effective Leverage* | 34.78% | 37.63% | 36.89% | 37.17% | 36.24% | 35.70% |
Regulatory Leverage* | 28.54% | 34.29% | 34.72% | 37.17% | 35.48% | 32.39% |
| |
*
| Effective Leverage is a Fund’s effective economic leverage, and includes both regulatory leverage and the leverage effects of certain derivative and other investments in a Fund’s portfolio that increase the Fund’s investment exposure. Currently, the leverage effects of Tender Option Bond (TOB) inverse floater holdings are included in effective leverage values, in addition to any regulatory leverage. Regulatory leverage consists of preferred shares issued or borrowings of a Fund. Both of these are part of a Fund’s capital structure. A Fund, however, may from time to time borrow on a typically transient basis in connection with its day-to-day operations, primarily in connection with the need to settle portfolio trades. Such incidental borrowings are excluded from the calculation of a Fund’s effective leverage ratio. Regulatory leverage is subject to asset coverage limits set forth in the Investment Company Act of 1940. |
10
THE FUNDS’ REGULATORY LEVERAGE
As of November 30, 2019, the Funds have issued and outstanding preferred shares as shown in the accompanying table.
| | | | | | | | | | |
| | | | | Variable Rate | | | | |
| | Variable Rate | | | Remarketed | | | | |
| | Preferred* | | | Preferred** | | | | |
| | Shares Issued at | | | Shares Issued at | | | | |
| | Liquidation Preference | | | Liquidation Preference | | | Total | |
NKG | | $ | 58,500,000 | | | $ | — | | | $ | 58,500,000 | |
NMY | | $ | 182,000,000 | | | $ | — | | | $ | 182,000,000 | |
NMT | | $ | 74,000,000 | | | $ | — | | | $ | 74,000,000 | |
NMS | | $ | 52,800,000 | | | $ | — | | | $ | 52,800,000 | |
NOM | | $ | 18,000,000 | | | $ | — | | | $ | 18,000,000 | |
NPV | | $ | 128,000,000 | | | $ | — | | | $ | 128,000,000 | |
| | |
* | Preferred shares of the Fund featuring a floating rate dividend based on a predetermined formula or spread to an index rate. Includes the following preferred shares AMTP, iMTP, MFP-VRM and VRDP in Special Rate Mode, where applicable. See Notes to Financial Statements, Note 5 – Fund Shares, Preferred Shares for further details. |
**
| Preferred shares of the Fund featuring floating rate dividends set by a remarketing agent via a regular remarketing. Includes the following preferred shares VRDP not in Special Rate Mode, MFP-VRRM and MFP-VRDM, where applicable. See Notes to Financial Statements, Note 5 – Fund Shares, Preferred Shares for further details. |
Refer to Notes to Financial Statements, Note 5 – Fund Shares, Preferred Shares for further details on preferred shares and each Fund’s respective transactions.
11
COMMON SHARE DISTRIBUTION INFORMATION
The following information regarding the Funds’ distributions is current as of November 30, 2019. Each Fund’s distribution levels may vary over time based on each Fund’s investment activity and portfolio investments value changes.
During the current reporting period, each Fund’s distributions to common shareholders were as shown in the accompanying table.
| | | | | | | | | | | | | | | | | | | |
| | | Per Common Share Amounts | |
| Monthly Distribution (Ex-Dividend Date) | | NKG | | | NMY | | | NMT | | | NMS | | | NOM | | | NPV | |
June 2019 | | $ | 0.0370 | | | $ | 0.0440 | | | $ | 0.0410 | | | $ | 0.0490 | | | $ | 0.0430 | | | $ | 0.0435 | |
July | | | 0.0370 | | | | 0.0440 | | | | 0.0410 | | | | 0.0490 | | | | 0.0430 | | | | 0.0435 | |
August | | | 0.0370 | | | | 0.0440 | | | | 0.0410 | | | | 0.0490 | | | | 0.0430 | | | | 0.0435 | |
September | | | 0.0370 | | | | 0.0440 | | | | 0.0410 | | | | 0.0490 | | | | 0.0430 | | | | 0.0435 | |
October | | | 0.0370 | | | | 0.0440 | | | | 0.0410 | | | | 0.0490 | | | | 0.0430 | | | | 0.0435 | |
November 2019 | | | 0.0370 | | | | 0.0440 | | | | 0.0410 | | | | 0.0490 | | | | 0.0430 | | | | 0.0435 | |
| Total Distributions from Net Investment Income | | $ | 0.2220 | | | $ | 0.2640 | | | $ | 0.2460 | | | $ | 0.2940 | | | $ | 0.2580 | | | $ | 0.2610 | |
| | |
| Yields | | | | | | | | | | | | | | | | | | | | | | | | |
Market Yield* | | | 3.56 | % | | | 3.93 | % | | | 3.50 | % | | | 4.22 | % | | | 3.57 | % | | | 3.62 | % |
Taxable-Equivalent Yield* | | | 6.66 | % | | | 7.31 | % | | | 6.48 | % | | | 8.57 | % | | | 6.61 | % | | | 6.77 | % |
| |
*
| Market Yield is based on the Fund’s current annualized monthly dividend divided by the Fund’s current market price as of the end of the reporting period. Taxable-Equivalent Yield represents the yield that must be earned on a fully taxable investment in order to equal the yield of the Fund on an after-tax basis. It is based on a combined federal and state income tax rate of 46.6%, 46.6%, 45.9%, 50.7%, 46.2% and 46.6% for NKG, NMY, NMT, NMS, NOM and NPV, respectively. Your actual combined federal and state income tax rate may differ from the assumed rate. The Taxable- Equivalent Yield also takes into account the percentage of the Fund’s income generated and paid by the Fund (based on payments made during the previous calendar year) that was either exempt from federal income tax but not from state income tax (e.g., income from an out-of-state municipal bond), or was exempt from neither federal nor state income tax. Separately, if the comparison were instead to investments that generate qualified dividend income, which is taxable at a rate lower than an individual’s ordinary graduated tax rate, the fund’s Taxable-Equivalent Yield would be lower.
|
Each Fund seeks to pay regular monthly dividends out of its net investment income at a rate that reflects its past and projected net income performance. To permit each Fund to maintain a more stable monthly dividend, the Fund may pay dividends at a rate that may be more or less than the amount of net income actually earned by the Fund during the period. Distributions to common shareholders are determined on a tax basis, which may differ from amounts recorded in the accounting records. In instances where the monthly dividend exceeds the earned net investment income, the Fund would report a negative undistributed net ordinary income. Refer to Note 6 – Income Tax Information for additional information regarding the amounts of undistributed net ordinary income and undistributed net long-term capital gains and the character of the actual distributions paid by the Fund during the period.
All monthly dividends paid by each Fund during the current reporting period were paid from net investment income. If a portion of the Fund’s monthly distributions is sourced or comprised of elements other than net investment income, including capital gains and/or a return of capital, shareholders will be notified of those sources. For financial reporting purposes, the per share amounts of each Fund’s distributions for the reporting period are presented in this report’s Financial Highlights. For income tax purposes, distribution information for each Fund as of its most recent tax year end is presented in Note 6 – Income Tax Information within the Notes to Financial Statements of this report.
CHANGE IN METHOD OF PUBLISHING NUVEEN CLOSED-END FUND DISTRIBUTION AMOUNTS
During November 2019, the Nuveen Closed-End Funds discontinued the practice of announcing Fund distribution amounts and timing via press release. Instead, information about the Nuveen Closed-End Funds’ monthly and quarterly periodic distributions to shareholders are posted and can be found on Nuveen’s enhanced closed-end fund resource page, which is at www.nuveen.com/closed-end-fund-distributions, along with other Nuveen closed-end fund product updates. Shareholders can
12
expect regular distribution information to be posted on www.nuveen.com on the first business day of each month. To ensure that our shareholders have timely access to the latest information, a subscribe function can be activated at this link here, or at this web page (www.nuveen.com/en-us/people/about-nuveen/for-the-media).
COMMON SHARE REPURCHASES
During August 2019, the Funds’ Board of Trustees reauthorized an open-market share repurchase program, allowing each Fund to repurchase an aggregate of up to approximately 10% of its outstanding shares.
As of November 30, 2019, and since the inception of the Funds’ repurchase programs, the Funds have cumulatively repurchased and retired their outstanding common shares as shown in the accompanying table.
| | | | | | | |
| NKG | NMY | NMT | NMS | NOM | NPV |
Common shares cumulatively repurchased and retired | 149,500 | 1,005,000 | 26,148 | 10,000 | — | 55,000 |
Common shares authorized for repurchase | 1,040,000 | 2,310,000 | 930,000 | 580,000 | 235,000 | 1,790,000 |
During the current reporting period, the Funds did not repurchase any of their outstanding common shares.
OTHER COMMON SHARE INFORMATION
As of November 30, 2019, and during the current reporting period, the Funds’ common share prices were trading at a premium/(discount) to their common share NAVs as shown in the accompanying table.
| | | | | | | | | | | | | | | | | | | |
| | NKG | | | NMY | | | NMT | | | NMS | | | NOM | | | NPV | |
Common share NAV | | $ | 14.08 | | | $ | 15.10 | | | $ | 14.93 | | | $ | 15.44 | | | $ | 13.96 | | | $ | 14.95 | |
Common share price | | $ | 12.47 | | | $ | 13.42 | | | $ | 14.04 | | | $ | 13.92 | | | $ | 14.45 | | | $ | 14.41 | |
Premium/(Discount) to NAV | | | (11.43 | )% | | | (11.13 | )% | | | (5.96 | )% | | | (9.84 | )% | | | 3.51 | % | | | (3.61 | )% |
6-month average premium/(discount) to NAV | | | (11.59 | )% | | | (12.17 | )% | | | (8.15 | )% | | | (9.13 | )% | | | 0.15 | % | | | (8.99 | )% |
13
Risk Considerations and Investment Policy Updates
Risk Considerations
Fund shares are not guaranteed or endorsed by any bank or other insured depository institution, and are not federally insured by the Federal Deposit Insurance Corporation.
Nuveen Georgia Quality Municipal Income Fund (NKG)
Investing in closed-end funds involves risk; principal loss is possible. There is no guarantee the Fund’s investment objectives will be achieved. Closed-end fund shares may frequently trade at a discount or premium to their net asset value. Debt or fixed income securities such as those held by the Fund, are subject to market risk, credit risk, interest rate risk, derivatives risk, liquidity risk, and income risk. As interest rates rise, bond prices fall. Leverage increases return volatility and magnifies the Fund’s potential return and its risks; there is no guarantee a fund’s leverage strategy will be successful. State concentration makes the Fund more susceptible to local adverse economic, political, or regulatory changes affecting municipal bond issuers. These and other risk considerations such as inverse floater risk and tax risk are described in more detail on the Fund’s web page at www.nuveen.com/NKG.
Nuveen Maryland Quality Municipal Income Fund (NMY)
Investing in closed-end funds involves risk; principal loss is possible. There is no guarantee the Fund’s investment objectives will be achieved. Closed-end fund shares may frequently trade at a discount or premium to their net asset value. Debt or fixed income securities such as those held by the Fund, are subject to market risk, credit risk, interest rate risk, derivatives risk, liquidity risk, and income risk. As interest rates rise, bond prices fall. Leverage increases return volatility and magnifies the Fund’s potential return and its risks; there is no guarantee a fund’s leverage strategy will be successful. State concentration makes the Fund more susceptible to local adverse economic, political, or regulatory changes affecting municipal bond issuers. These and other risk considerations such as inverse floater risk and tax risk are described in more detail on the Fund’s web page at www.nuveen.com/NMY.
Nuveen Massachusetts Quality Municipal Income Fund (NMT)
Investing in closed-end funds involves risk; principal loss is possible. There is no guarantee the Fund’s investment objectives will be achieved. Closed-end fund shares may frequently trade at a discount or premium to their net asset value. Debt or fixed income securities such as those held by the Fund, are subject to market risk, credit risk, interest rate risk, derivatives risk, liquidity risk, and income risk. As interest rates rise, bond prices fall. Leverage increases return volatility and magnifies the Fund’s potential return and its risks; there is no guarantee a fund’s leverage strategy will be successful. State concentration makes the Fund more susceptible to local adverse economic, political, or regulatory changes affecting municipal bond issuers. These and other risk considerations such as inverse floater risk and tax risk are described in more detail on the Fund’s web page at www.nuveen.com/NMT.
Nuveen Minnesota Quality Municipal Income Fund (NMS)
Investing in closed-end funds involves risk; principal loss is possible. There is no guarantee the Fund’s investment objectives will be achieved. Closed-end fund shares may frequently trade at a discount or premium to their net asset value. Debt or fixed income securities such as those held by the Fund, are subject to market risk, credit risk, interest rate risk, derivatives risk, liquidity risk, and income risk. As interest rates rise, bond prices fall. Leverage increases return volatility and magnifies the Fund’s potential return
14
and its risks; there is no guarantee a fund’s leverage strategy will be successful. State concentration makes the Fund more susceptible to local adverse economic, political, or regulatory changes affecting municipal bond issuers. These and other risk considerations such as inverse floater risk and tax risk are described in more detail on the Fund’s web page at www.nuveen.com/NMS.
Nuveen Missouri Quality Municipal Income Fund (NOM)
Investing in closed-end funds involves risk; principal loss is possible. There is no guarantee the Fund’s investment objectives will be achieved. Closed-end fund shares may frequently trade at a discount or premium to their net asset value. Debt or fixed income securities such as those held by the Fund, are subject to market risk, credit risk, interest rate risk, derivatives risk, liquidity risk, and income risk. As interest rates rise, bond prices fall. Leverage increases return volatility and magnifies the Fund’s potential return and its risks; there is no guarantee a fund’s leverage strategy will be successful. State concentration makes the Fund more susceptible to local adverse economic, political, or regulatory changes affecting municipal bond issuers. These and other risk considerations such as inverse floater risk and tax risk are described in more detail on the Fund’s web page at www.nuveen.com/NOM.
Nuveen Virginia Quality Municipal Income Fund (NPV)
Investing in closed-end funds involves risk; principal loss is possible. There is no guarantee the Fund’s investment objectives will be achieved. Closed-end fund shares may frequently trade at a discount or premium to their net asset value. Debt or fixed income securities such as those held by the Fund, are subject to market risk, credit risk, interest rate risk, derivatives risk, liquidity risk, and income risk. As interest rates rise, bond prices fall. Leverage increases return volatility and magnifies the Fund’s potential return and its risks; there is no guarantee a fund’s leverage strategy will be successful. State concentration makes the Fund more susceptible to local adverse economic, political or regulatory changes affecting municipal bond issuers. These and other risk considerations such as inverse floater risk and tax risk are described in more detail on the Fund’s web page at www.nuveen.com/NPV.
Investment Policy Updates
Change in Investment Policy
Each of the Funds has recently adopted the following policy regarding limits to investments in illiquid securities:
While there are no such limits imposed by applicable regulations, certain Nuveen Closed-End Funds formerly had investment policies that placed limits on a Fund’s ability to invest in illiquid securities. All exchange-listed Nuveen Closed-End Funds now have no formal limit on their ability to invest in such illiquid securities, but each Fund’s portfolio management team will monitor such investments in the regular, overall management of the Fund’s portfolio securities.
New Temporary Investment Policy
Each of the Funds has adopted the following policy regarding its temporary investments:
Each Fund may temporarily depart from its normal investment policies and strategies – for instance, by allocating up to 100% of its assets to cash equivalents, short-term investments, or municipal bonds that do not comply with a Fund’s Name Policy – in response to adverse or unusual market, economic, political or other conditions. Such conditions could include a temporary decline in the availability of municipal bonds that comply with a Fund’s Name Policy. During these periods, the weighted average maturity of a Fund’s investment portfolio may fall below the defined range described in the respective Fund Summary under “Principal Investment Strategies”, and a Fund may not achieve its investment objective of current income that is exempt from regular federal and state personal income tax.
15
| | |
| Nuveen Georgia Quality Municipal |
| Income Fund |
| Performance Overview and Holding Summaries as of |
| November 30, 2019 |
| | | | | |
Refer to the Glossary of Terms Used in this Report for further definition of the terms used within this section.
|
| Average Annual Total Returns as of November 30, 2019 |
|
| Cumulative | Average Annual |
| 6-Month | 1-Year | 5-Year | 10-Year |
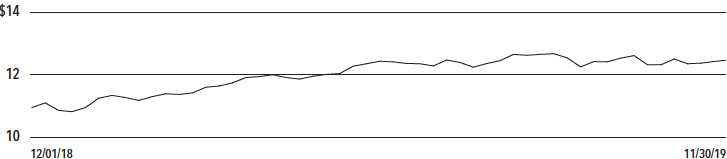
NKG at Common Share NAV | 3.20% | 11.79% | 3.99% | 4.57% |
NKG at Common Share Price | 1.87% | 18.50% | 4.17% | 4.53% |
S&P Municipal Bond Georgia Index | 2.13% | 7.45% | 3.13% | 4.02% |
S&P Municipal Bond Index | 2.31% | 8.13% | 3.55% | 4.44% |
Past performance is not predictive of future results. Current performance may be higher or lower than the data shown. Returns do not reflect the deduction of taxes that shareholders may have to pay on Fund distributions or upon the sale of Fund shares. Returns at NAV are net of Fund expenses, and assume reinvestment of distributions. Comparative index return information is provided for the Fund’s shares at NAV only. Indexes are not available for direct investment.
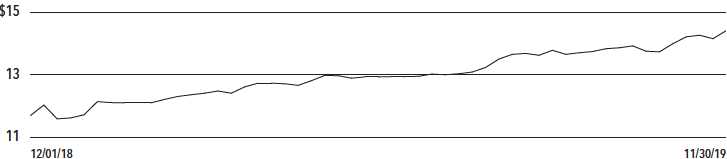
Common Share Price Performance — Weekly Closing Price
16
This data relates to the securities held in the Fund’s portfolio of investments as of the end of the reporting period. It should not be construed as a measure of performance for the Fund itself. Holdings are subject to change.
For financial reporting purposes, the ratings disclosed are the highest rating given by one of the following national rating agencies: Standard & Poor’s Group, Moody’s Investors Service, Inc. or Fitch, Inc. This treatment of split-rated securities may differ from that used for other purposes, such as for Fund investment policies. Credit ratings are subject to change. AAA, AA, A and BBB are investment grade ratings; BB, B, CCC, CC, C and D are below-investment grade ratings. Holdings designated N/R are not rated by these national rating agencies.
| | |
| Fund Allocation | |
| (% of net assets) | |
Long-Term Municipal Bonds | 150.8% |
Short-Term Municipal Bonds | 0.2% |
Other Assets Less Liabilities | 2.3% |
| Net Assets Plus Floating Rate Obligations | |
| & AMTP Shares, net of deferred | |
| offering costs | 153.3% |
Floating Rate Obligations | (13.4)% |
AMTP Shares, net of deferred | |
offering costs | (39.9)% |
| Net Assets | 100% |
| | |
| States and Territories | |
| (% of total municipal bonds) | |
Georgia | 90.4% |
Florida | 2.5% |
West Virginia | 1.8% |
Colorado | 1.5% |
Illinois | 1.2% |
Nevada | 1.0% |
Puerto Rico | 0.9% |
Washington | 0.7% |
| Total | 100% |
| | |
| Portfolio Composition | |
| (% of total investments) | |
Tax Obligation/General | 21.3% |
Tax Obligation/Limited | 16.8% |
Water and Sewer | 15.0% |
Health Care | 11.5% |
Utilities | 11.4% |
Education and Civic Organizations | 10.6% |
Transportation | 7.2% |
U.S. Guaranteed | 5.6% |
Other | 0.6% |
| Total | 100% |
| | |
| Portfolio Credit Quality | |
| (% of total investment exposure) | |
U.S. Guaranteed | 5.7% |
AAA | 6.8% |
AA | 59.8% |
A | 17.5% |
BBB | 7.8% |
N/R (not rated) | 2.4% |
| Total | 100% |
17
| | |
| NMY | Nuveen Maryland Quality Municipal |
| Income Fund |
| Performance Overview and Holding Summaries as of |
| November 30, 2019 |
| | | | | |
Refer to the Glossary of Terms Used in this Report for further definition of the terms used within this section.
|
| Average Annual Total Returns as of November 30, 2019 |
|
| Cumulative | Average Annual |
| 6-Month | 1-Year | 5-Year | 10-Year |
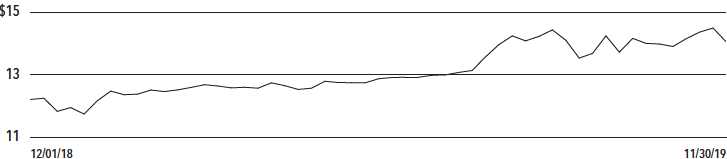
NMY at Common Share NAV | 3.75% | 12.59% | 4.78% | 5.15% |
NMY at Common Share Price | 7.02% | 19.51% | 6.16% | 4.80% |
S&P Municipal Bond Maryland Index | 2.01% | 7.11% | 2.99% | 3.67% |
S&P Municipal Bond Index | 2.31% | 8.13% | 3.55% | 4.44% |
Past performance is not predictive of future results. Current performance may be higher or lower than the data shown. Returns do not reflect the deduction of taxes that shareholders may have to pay on Fund distributions or upon the sale of Fund shares. Returns at NAV are net of Fund expenses, and assume reinvestment of distributions. Comparative index return information is provided for the Fund’s shares at NAV only. Indexes are not available for direct investment.
Common Share Price Performance — Weekly Closing Price
18
This data relates to the securities held in the Fund’s portfolio of investments as of the end of the reporting period. It should not be construed as a measure of performance for the Fund itself. Holdings are subject to change.
For financial reporting purposes, the ratings disclosed are the highest rating given by one of the following national rating agencies: Standard & Poor’s Group, Moody’s Investors Service, Inc. or Fitch, Inc. This treatment of split-rated securities may differ from that used for other purposes, such as for Fund investment policies. Credit ratings are subject to change. AAA, AA, A and BBB are investment grade ratings; BB, B, CCC, CC, C and D are below-investment grade ratings. Holdings designated N/R are not rated by these national rating agencies.
| | |
| Fund Allocation | |
| (% of net assets) | |
Long-Term Municipal Bonds | 158.4% |
Other Assets Less Liabilities | 1.8% |
| Net Assets Plus Floating Rate Obligations | |
| & AMTP Shares, net of deferred | |
| offering costs | 160.2% |
Floating Rate Obligations | (8.1)% |
AMTP Shares, net of deferred | |
offering costs | (52.1)% |
| Net Assets | 100% |
| | |
| States and Territories | |
| (% of total municipal bonds) | |
Maryland | 82.1% |
Guam | 4.6% |
Puerto Rico | 3.7% |
California | 2.8% |
Virgin Islands | 1.9% |
District of Columbia | 1.9% |
New York | 1.6% |
New Jersey | 0.5% |
Pennsylvania | 0.4% |
Texas | 0.4% |
Ohio | 0.1% |
Alaska | 0.0% |
| Total | 100% |
| | |
| Portfolio Composition | |
| (% of total investments) | |
Health Care | 23.4% |
Tax Obligation/Limited | 21.2% |
Transportation | 8.0% |
Tax Obligation/General | 7.3% |
Education and Civic Organizations | 6.0% |
U.S. Guaranteed | 6.0% |
Long-Term Care | 5.5% |
Water and Sewer | 5.4% |
Housing/Multifamily | 5.4% |
Other | 11.8% |
| Total | 100% |
| | |
| Portfolio Credit Quality | |
| (% of total investment exposure) | |
U.S. Guaranteed | 6.0% |
AAA | 5.6% |
AA | 29.7% |
A | 22.9% |
BBB | 18.5% |
BB or Lower | 6.6% |
N/R (not rated) | 10.7% |
| Total | 100% |
19
| | |
| NMT | Nuveen Massachusetts Quality Municipal |
| Income Fund |
| Performance Overview and Holding Summaries as of |
| November 30, 2019 |
| | | | | |
Refer to the Glossary of Terms Used in this Report for further definition of the terms used within this section.
|
Average Annual Total Returns as of November 30, 2019
|
|
| Cumulative | Average Annual |
| 6-Month | 1-Year | 5-Year | 10-Year |
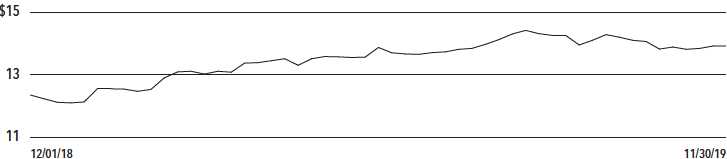
NMT at Common Share NAV | 3.04% | 11.48% | 4.43% | 5.36% |
NMT at Common Share Price | 11.30% | 19.96% | 6.09% | 5.36% |
S&P Municipal Bond Massachusetts Index | 2.18% | 8.01% | 3.26% | 3.99% |
S&P Municipal Bond Index | 2.31% | 8.13% | 3.55% | 4.44% |
Past performance is not predictive of future results. Current performance may be higher or lower than the data shown. Returns do not reflect the deduction of taxes that shareholders may have to pay on Fund distributions or upon the sale of Fund shares. Returns at NAV are net of Fund expenses, and assume reinvestment of distributions. Comparative index return information is provided for the Fund’s shares at NAV only. Indexes are not available for direct investment.
Common Share Price Performance — Weekly Closing Price
20
This data relates to the securities held in the Fund’s portfolio of investments as of the end of the reporting period. It should not be construed as a measure of performance for the Fund itself. Holdings are subject to change.
For financial reporting purposes, the ratings disclosed are the highest rating given by one of the following national rating agencies: Standard & Poor’s Group, Moody’s Investors Service, Inc. or Fitch, Inc. This treatment of split-rated securities may differ from that used for other purposes, such as for Fund investment policies. Credit ratings are subject to change. AAA, AA, A and BBB are investment grade ratings; BB, B, CCC, CC, C and D are below investment grade ratings. Holdings designated N/R are not rated by these national rating agencies.
| | |
| Fund Allocation | |
| (% of net assets) | |
Long-Term Municipal Bonds | 151.1% |
Other Assets Less Liabilities | 1.9% |
| Net Assets Plus VRDP Shares, | |
| net of deferred offering costs | 153.0% |
VRDP Shares, net of deferred | |
| offering costs | (53.0)% |
| Net Assets | 100% |
| | |
| States and Territories | |
| (% of total municipal bonds) | |
Massachusetts | 92.4% |
Guam | 4.9% |
Puerto Rico | 1.9% |
Virgin Islands | 0.8% |
| Total | 100% |
| | |
| Portfolio Composition | |
| (% of total investments) | |
Education and Civic Organizations | 29.2% |
Health Care | 21.1% |
Tax Obligation/Limited | 13.3% |
Tax Obligation/General | 11.3% |
U.S. Guaranteed | 10.3% |
Transportation | 6.3% |
Water and Sewer | 5.1% |
Other | 3.4% |
| Total | 100% |
| | |
| Portfolio Credit Quality | |
| (% of total investment exposure) | |
U.S. Guaranteed | 9.5% |
AAA | 3.7% |
AA | 51.1% |
A | 21.2% |
BBB | 8.4% |
BB or Lower | 4.2% |
N/R (not rated) | 1.9% |
| Total | 100% |
21
| | |
| NMS | Nuveen Minnesota Quality Municipal |
| Income Fund |
| Performance Overview and Holding Summaries as of |
| November 30, 2019 |
| | | | | |
Refer to the Glossary of Terms Used in this Report for further definition of the terms used within this section.
|
Average Annual Total Returns as of November 30, 2019
|
|
| Cumulative | Average Annual |
| 6-Month | 1-Year | 5-Year | 10-Year |
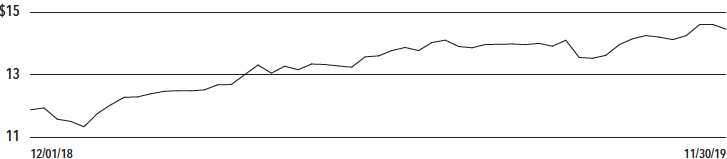
NMS at Common Share NAV | 3.60% | 12.94% | 4.66% | 6.50% |
NMS at Common Share Price | 3.26% | 19.39% | 3.73% | 4.91% |
S&P Municipal Bond Minnesota Index | 2.31% | 8.04% | 3.23% | 4.03% |
S&P Municipal Bond Index | 2.31% | 8.13% | 3.55% | 4.44% |
Past performance is not predictive of future results. Current performance may be higher or lower than the data shown. Returns do not reflect the deduction of taxes that shareholders may have to pay on Fund distributions or upon the sale of Fund shares. Returns at NAV are net of Fund expenses, and assume reinvestment of distributions. Comparative index return information is provided for the Fund’s shares at NAV only. Indexes are not available for direct investment.
Common Share Price Performance — Weekly Closing Price
22
This data relates to the securities held in the Fund’s portfolio of investments as of the end of the reporting period. It should not be construed as a measure of performance for the Fund itself. Holdings are subject to change.
For financial reporting purposes, the ratings disclosed are the highest rating given by one of the following national rating agencies: Standard & Poor’s Group, Moody’s Investors Service, Inc. or Fitch, Inc. This treatment of split-rated securities may differ from that used for other purposes, such as for Fund investment policies. Credit ratings are subject to change. AAA, AA, A and BBB are investment grade ratings; BB, B, CCC, CC, C and D are below-investment grade ratings. Holdings designated N/R are not rated by these national rating agencies.
| | |
| Fund Allocation | |
| (% of net assets) | |
Long-Term Municipal Bonds | 155.9% |
Short-Term Municipal Bonds | 2.4% |
Other Assets Less Liabilities | 0.7% |
| Net Assets Plus AMTP Shares, | |
| net of deferred offering costs | 159.0% |
AMTP Shares, net of deferred | |
offering costs | (59.0)% |
| Net Assets | 100% |
| | |
| States and Territories | |
| (% of total municipal bonds) | |
Minnesota | 99.7% |
Guam | 0.3% |
| Total | 100% |
| | |
| Portfolio Composition | |
| (% of total investments) | |
Health Care | 22.0% |
Education and Civic Organizations | 19.5% |
Tax Obligation/General | 17.0% |
Tax Obligation/Limited | 9.6% |
Long-Term Care | 9.4% |
Utilities | 8.5% |
Other | 14.0% |
| Total | 100% |
| | |
| Portfolio Credit Quality | |
| (% of total investment exposure) | |
U.S. Guaranteed | 4.4% |
AAA | 15.5% |
AA | 20.0% |
A | 25.8% |
BBB | 11.1% |
BB or Lower | 7.5% |
N/R (not rated) | 15.7% |
| Total | 100% |
23
| | |
| NOM | Nuveen Missouri Quality Municipal |
| Income Fund |
| Performance Overview and Holding Summaries as of |
| November 30, 2019 |
| | | | | |
Refer to the Glossary of Terms Used in this Report for further definition of the terms used within this section.
|
Average Annual Total Returns as of November 30, 2019
|
|
| Cumulative | Average Annual |
| 6-Month | 1-Year | 5-Year | 10-Year |
NOM at Common Share NAV | 2.74% | 10.13% | 4.37% | 5.74% |
NOM at Common Share Price | 5.36% | 26.47% | 3.67% | 5.30% |
S&P Municipal Bond Missouri Index | 2.36% | 7.97% | 3.57% | 4.54% |
S&P Municipal Bond Index | 2.31% | 8.13% | 3.55% | 4.44% |
Past performance is not predictive of future results. Current performance may be higher or lower than the data shown. Returns do not reflect the deduction of taxes that shareholders may have to pay on Fund distributions or upon the sale of Fund shares. Returns at NAV are net of Fund expenses, and assume reinvestment of distributions. Comparative index return information is provided for the Fund’s shares at NAV only. Indexes are not available for direct investment.
Common Share Price Performance — Weekly Closing Price
24
This data relates to the securities held in the Fund’s portfolio of investments as of the end of the reporting period. It should not be construed as a measure of performance for the Fund itself. Holdings are subject to change.
For financial reporting purposes, the ratings disclosed are the highest rating given by one of the following national rating agencies: Standard & Poor’s Group, Moody’s Investors Service, Inc. or Fitch, Inc. This treatment of split-rated securities may differ from that used for other purposes, such as for Fund investment policies. Credit ratings are subject to change. AAA, AA, A and BBB are investment grade ratings; BB, B, CCC, CC, C and D are below-investment grade ratings. Holdings designated N/R are not rated by these national rating agencies.
| | |
| Fund Allocation | |
| (% of net assets) | |
Long-Term Municipal Bonds | 155.0% |
Other Assets Less Liabilities | 1.1% |
| Net Assets Plus Floating Rate Obligations | |
| & MFP Shares, net of deferred | |
| offering costs | 156.1% |
Floating Rate Obligations | (1.8)% |
MFP Shares, net of deferred | |
offering costs | (54.3)% |
| Net Assets | 100% |
| | |
| States and Territories | |
| (% of total municipal bonds) | |
Missouri | 96.9% |
Guam | 1.7% |
Puerto Rico | 1.4% |
| Total | 100% |
| | |
| Portfolio Composition | |
| (% of total investments) | |
Health Care | 23.6% |
Tax Obligation/Limited | 16.1% |
Tax Obligation/General | 15.9% |
U.S. Guaranteed | 12.9% |
Education and Civic Organizations | 10.9% |
Long-Term Care | 7.6% |
Water and Sewer | 6.2% |
Other | 6.8% |
| Total | 100% |
| | |
| Portfolio Credit Quality | |
| (% of total investment exposure) | |
U.S. Guaranteed | 8.5% |
AAA | 5.7% |
AA | 42.9% |
A | 20.2% |
BBB | 9.9% |
BB or Lower | 4.5% |
N/R (not rated) | 8.3% |
| Total | 100% |
25
| | |
| NPV | Nuveen Virginia Quality Municipal |
| Income Fund |
| Performance Overview and Holding Summaries as of |
| November 30, 2019 |
| | | | | |
Refer to the Glossary of Terms Used in this Report for further definition of the terms used within this section.
|
Average Annual Total Returns as of November 30, 2019
|
|
| Cumulative | Average Annual |
| 6-Month | 1-Year | 5-Year | 10-Year |
NPV at Common Share NAV | 3.70% | 12.85% | 4.64% | 5.23% |
NPV at Common Share Price | 13.66% | 29.28% | 6.14% | 4.97% |
S&P Municipal Bond Virginia Index | 2.16% | 7.62% | 3.33% | 3.93% |
S&P Municipal Bond Index | 2.31% | 8.13% | 3.55% | 4.44% |
Past performance is not predictive of future results. Current performance may be higher or lower than the data shown. Returns do not reflect the deduction of taxes that shareholders may have to pay on Fund distributions or upon the sale of Fund shares. Returns at NAV are net of Fund expenses, and assume reinvestment of distributions. Comparative index return information is provided for the Fund’s shares at NAV only. Indexes are not available for direct investment.
Common Share Price Performance — Weekly Closing Price
26
This data relates to the securities held in the Fund’s portfolio of investments as of the end of the reporting period. It should not be construed as a measure of performance for the Fund itself. Holdings are subject to change.
For financial reporting purposes, the ratings disclosed are the highest rating given by one of the following national rating agencies: Standard & Poor’s Group, Moody’s Investors Service, Inc. or Fitch, Inc. This treatment of split-rated securities may differ from that used for other purposes, such as for Fund investment policies. Credit ratings are subject to change. AAA, AA, A and BBB are investment grade ratings; BB, B, CCC, CC, C and D are below-investment grade ratings. Holdings designated N/R are not rated by these national rating agencies.
| | |
| Fund Allocation | |
| (% of net assets) | |
Long-Term Municipal Bonds | 153.7% |
Other Assets Less Liabilities | 1.7% |
| Net Assets Plus Floating Rate Obligations | |
| & VRDP Shares, net of deferred | |
| offering costs | 155.4% |
Floating Rate Obligations | (7.6)% |
VRDP Shares, net of deferred | |
offering costs | (47.8)% |
| Net Assets | 100% |
| | |
| States and Territories | |
| (% of total municipal bonds) | |
Virginia | 78.0% |
District of Columbia | 8.5% |
Puerto Rico | 4.7% |
Guam | 3.3% |
Virgin Islands | 2.5% |
Colorado | 0.9% |
Washington | 0.7% |
Pennsylvania | 0.5% |
Tennessee | 0.5% |
Wisconsin | 0.2% |
New York | 0.2% |
| Total | 100% |
| | |
| Portfolio Composition | |
| (% of total investments) | |
Transportation | 28.8% |
Tax Obligation/Limited | 21.3% |
Health Care | 13.0% |
U.S. Guaranteed | 10.5% |
Education and Civic Organizations | 8.1% |
Other | 18.3% |
| Total | 100% |
| | |
| Portfolio Credit Quality | |
| (% of total investment exposure) | |
U.S. Guaranteed | 9.5% |
AAA | 6.1% |
AA | 40.5% |
A | 12.1% |
BBB | 14.9% |
BB or Lower | 9.0% |
N/R (not rated) | 7.9% |
| Total | 100% |
27
Shareholder Meeting Report
The annual meeting of shareholders was held in the offices of Nuveen on December 5, 2019 for NMT; at this meeting the shareholders were asked to elect Board Members.
| | | | |
| | NMT | |
| Common and | | |
| Preferred | | |
| shares voting | | |
| together | | Preferred |
| as a class | | Shares |
| Approval of the Board Members was reached as follows: | | | |
Judith M. Stockdale | | | |
| For | 8,363,583 | | — |
| Withhold | 239,640 | | — |
| Total | 8,603,223 | | — |
Carole E. Stone | | | |
| For | 8,357,523 | | — |
| Withhold | 245,700 | | — |
| Total | 8,603,223 | | — |
Margaret L. Wolff | | | |
| For | 8,295,461 | | — |
| Withhold | 307,762 | | — |
| Total | 8,603,223 | | — |
William C. Hunter | | | |
| For | — | | 740 |
| Withhold | — | | — |
| Total | — | | 740 |
Albin F. Moschner | | | |
| For | — | | 740 |
| Withhold | — | | — |
| Total | — | | 740 |
28
| | |
| Nuveen Georgia Quality Municipal |
| Income Fund |
| Portfolio of Investments |
| November 30, 2019 (Unaudited) |
| | | | | | |
| Principal | | | Optional Call | | |
| Amount (000) | | Description (1) | Provisions (2) | Ratings (3) | Value |
| | LONG-TERM INVESTMENTS – 150.8% (99.9% of Total Investments) | | | |
| | MUNICIPAL BONDS – 150.8% (99.9% of Total Investments) | | | |
| | Education and Civic Organizations – 16.0% (10.6% of Total Investments) | | | |
| $ 1,600 | | Cobb County Development Authority, Georgia, Revenue Bonds, KSU University II Real Estate | 7/21 at 100.00 | AA | $ 1,682,640 |
| | Foundation, LLC Project, Series 2011, 5.000%, 7/15/41 – AGM Insured | | | |
| 3,000 | | Colorado State Board of Governors, Colorado State University Auxiliary Enterprise System | 3/28 at 100.00 | AA | 3,331,560 |
| | Revenue Bonds, Refunding Series 2017E, 4.000%, 3/01/43 | | | |
| 1,340 | | Douglas County Development Authority, Georgia, Charter School Revenue Bonds, Brighten | 10/23 at 100.00 | N/R | 1,433,639 |
| | Academy Project, Series 2013B, 7.000%, 10/01/43 | | | |
| 3,000 | | Fulton County Development Authority, Georgia, Revenue Bonds, Robert W Woodruff Arts | 3/26 at 100.00 | A2 | 3,513,630 |
| | Center, Inc. Project, Refunding Series 2015A, 5.000%, 3/15/36 | | | |
| 1,530 | | Gwinnett County Development Authority, Georgia, Revenue Bonds, Georgia Gwinnett College | 7/27 at 100.00 | A+ | 1,833,996 |
| | Student Housing Project, Refunding Series 2017B, 5.000%, 7/01/37 | | | |
| 3,000 | | Private Colleges and Universities Authority, Georgia, Revenue Bonds, Emory University, | 10/23 at 100.00 | AA | 3,381,780 |
| | Refunding Series 2013A, 5.000%, 10/01/43 | | | |
| 2,000 | | Private Colleges and Universities Authority, Georgia, Revenue Bonds, Emory University, | 10/26 at 100.00 | AA | 2,368,260 |
| | Refunding Series 2016A, 5.000%, 10/01/46 (UB) (4) | | | |
| 1,325 | | Private Colleges and Universities Authority, Georgia, Revenue Bonds, Mercer University, | 10/22 at 100.00 | Baa1 | 1,438,645 |
| | Refunding Series 2012C, 5.250%, 10/01/30 | | | |
| 1,000 | | Private Colleges and Universities Authority, Georgia, Revenue Bonds, Mercer University, | 10/21 at 100.00 | Baa1 | 1,047,970 |
| | Series 2012A, 5.000%, 10/01/32 | | | |
| 3,000 | | Private Colleges and Universities Authority, Georgia, Revenue Bonds, Savannah College of | 4/24 at 100.00 | A+ | 3,360,360 |
| | Art & Design Projects, Series 2014, 5.000%, 4/01/44 | | | |
| 20,795 | | Total Education and Civic Organizations | | | 23,392,480 |
| | Health Care – 17.2% (11.4% of Total Investments) | | | |
| | Baldwin County Hospital Authority, Georgia, Revenue Bonds, Oconee Regional Medical | | | |
| | Center, Series 1998: | | | |
| 205 | | 5.250%, 12/01/22 (5),(6) | 12/19 at 100.00 | N/R | 17,531 |
| 745 | | 5.375%, 12/01/28 (5),(6) | 12/19 at 100.00 | N/R | 63,709 |
| 3,245 | | Brookhaven Development Authority, Georgia, Revenue Bonds, Children’s Healthcare of | 7/29 at 100.00 | AA+ | 3,600,749 |
| | Atlanta, Inc. Project, Series 2019A, 4.000%, 7/01/49 | | | |
| 715 | | Coweta County Development Authority, Georgia, Revenue Bonds, Piedmont Healthcare, Inc. | 6/20 at 100.00 | AA– | 729,672 |
| | Project, Series 2010, 5.000%, 6/15/40 | | | |
| 3,485 | | Development Authority of Fulton County Revenue Bonds, Georgia, Piedmont Healthcare, Inc. | 7/26 at 100.00 | AA– | 4,027,266 |
| | Project, Series 2016A, 5.000%, 7/01/46 | | | |
| | Fulton County Development Authority, Georgia, Hospital Revenue Bonds, Wellstar Health | | | |
| | System, Inc. Project, Series 2017A: | | | |
| 1,780 | | 5.000%, 4/01/36 | 4/27 at 100.00 | A | 2,115,512 |
| 1,000 | | 5.000%, 4/01/37 | 4/27 at 100.00 | A | 1,183,190 |
| | Gainesville and Hall County Hospital Authority, Georgia, Revenue Anticipation | | | |
| | Certificates, Northeast Georgia Health Services Inc., Series 2010B: | | | |
| 235 | | 5.000%, 2/15/33 | 2/20 at 100.00 | AA | 236,706 |
| 235 | | 5.125%, 2/15/40 | 2/20 at 100.00 | AA | 236,716 |
| 930 | | 5.250%, 2/15/45 | 2/20 at 100.00 | AA | 936,928 |
| | Gainesville and Hall County Hospital Authority, Georgia, Revenue Anticipation | | | |
| | Certificates, Northeast Georgia Health Services Inc., Series 2017B: | | | |
| 3,000 | | 5.500%, 2/15/42 (UB) (4) | 2/27 at 100.00 | AA | 3,693,540 |
| 5,500 | | 5.250%, 2/15/45 (UB) (4) | 2/27 at 100.00 | AA | 6,591,750 |
| 1,620 | | Greene County Development Authority, Georgia, Health System Revenue Bonds, Catholic | 11/22 at 100.00 | AA– | 1,773,041 |
| | Health East Issue, Series 2012, 5.000%, 11/15/37 | | | |
| 22,695 | | Total Health Care | | | 25,206,310 |
29
| | |
| NKG | Nuveen Georgia Quality Municipal Income Fund |
| Portfolio of Investments (continued) |
| November 30, 2019 (Unaudited) |
| | | | | | |
| Principal | | | Optional Call | | |
| Amount (000) | | Description (1) | Provisions (2) | Ratings (3) | Value |
| | Housing/Multifamily – 0.9% (0.6% of Total Investments) | | | |
| $ 1,205 | | Atlanta Urban Residential Finance Authority, Georgia, Multifamily Housing Revenue Bonds, | 11/23 at 100.00 | BBB+ | $ 1,255,586 |
| | Trestletree Village Apartments, Series 2013A, 4.500%, 11/01/35 | | | |
| | Tax Obligation/General – 32.2% (21.3% of Total Investments) | | | |
| 4,000 | | Bryan County School District, Georgia, General Obligation Bonds, Series 2018, 5.000%, | 8/26 at 100.00 | AA+ | 4,724,840 |
| | 8/01/42 (UB) (4) | | | |
| 3,000 | | Carroll City-County Hospital Authority, Georgia, Revenue Anticipation Certificates, | 7/25 at 100.00 | AA | 3,419,490 |
| | Tanner Medical Center, Inc. Project, Series 2015, 5.000%, 7/01/41 | | | |
| 2,000 | | Clark County School District, Nevada, General Obligation Bonds, Limited Tax Building | 6/28 at 100.00 | A+ | 2,215,820 |
| | Series 2018A, 4.000%, 6/15/37 | | | |
| | East Point Building Authority, Georgia, Revenue Bonds, Water & Sewer Project, Refunding | | | |
| | Series 2017: | | | |
| 1,000 | | 5.000%, 2/01/29 – AGM Insured | 2/27 at 100.00 | AA | 1,225,330 |
| 650 | | 5.000%, 2/01/35 – AGM Insured | 2/27 at 100.00 | AA | 779,636 |
| 2,350 | | Evanston, Illinois, General Obligation Bonds, Corporate Purpose Series 2016A, | 6/28 at 100.00 | AA+ | 2,571,816 |
| | 4.000%, 12/01/43 | | | |
| 2,000 | | Floyd County Hospital Authority, Georgia, Revenue Anticipation Certificates, Floyd | 7/26 at 100.00 | Aa2 | 2,360,940 |
| | Medical Center, Series 2016, 5.000%, 7/01/35 | | | |
| 3,000 | | Forsyth County Water and Sewerage Authority, Georgia, Revenue Bonds, Refunding & | 4/25 at 100.00 | AAA | 3,471,900 |
| | Improvement Series 2015, 5.000%, 4/01/44 | | | |
| 3,000 | | Gainesville and Hall County Hospital Authority, Georgia, Revenue Anticipation | 2/25 at 100.00 | AA | 3,500,460 |
| | Certificates, Northeast Georgia Health Services Inc., Series 2014A, 5.500%, 8/15/54 | | | |
| 5 | | Georgia Environmental Loan Acquisition Corporation, Local Government Loan Securitization | 3/21 at 100.00 | Aaa | 5,000 |
| | Bonds, Loan Pool Series 2011, 5.125%, 3/15/31 | | | |
| 3,550 | | Georgia State, General Obligation Bonds, Series 2015A, 5.000%, 2/01/28 | 2/25 at 100.00 | AAA | 4,205,046 |
| 3,500 | | Gwinnett County School District, Georgia, General Obligation Bonds, Series 2013, | 2/23 at 100.00 | AAA | 3,879,155 |
| | 5.000%, 2/01/36 | | | |
| 170 | | Jackson County School District, Georgia, General Obligation Bonds, School Series 2019, | 3/29 at 100.00 | AA+ | 217,167 |
| | 5.000%, 3/01/32 | | | |
| 345 | | Lamar County School District, Georgia, General Obligation Bonds, Series 2017, | 9/27 at 100.00 | Aa1 | 423,701 |
| | 5.000%, 3/01/33 | | | |
| | Liberty County Industrial Authority, Georgia, Revenue Bonds, Series 2014: | | | |
| 251 | | 5.500%, 7/15/23 | 7/21 at 100.00 | N/R | 251,405 |
| 601 | | 5.500%, 7/15/30 | 7/21 at 100.00 | N/R | 602,683 |
| 659 | | 5.500%, 1/15/36 | 7/21 at 100.00 | N/R | 661,540 |
| 500 | | Paulding County, Georgia, General Obligation Bonds, Series 2017, 5.000%, 2/01/31 | 2/28 at 100.00 | Aa1 | 625,380 |
| 3,000 | | Sandy Springs Public Facilities Authority, Georgia, Revenue Bonds, Sandy Springs City | 5/26 at 100.00 | Aaa | 3,535,590 |
| | Center Project, Series 2015, 5.000%, 5/01/47 | | | |
| | Valdosta and Lowndes County Hospital Authority, Georgia, Revenue Anticipation | | | |
| | Certificates, Refunding Series 2019A: | | | |
| 500 | | 5.000%, 10/01/34 | 10/29 at 100.00 | Aa2 | 630,420 |
| 370 | | 5.000%, 10/01/36 | 10/29 at 100.00 | Aa2 | 463,784 |
| 195 | | 5.000%, 10/01/37 | 10/29 at 100.00 | Aa2 | 243,438 |
| | Vidalia School District, Toombs County, Georgia, General Obligation Bonds, Series 2016: | | | |
| 500 | | 5.000%, 8/01/30 | 2/26 at 100.00 | Aa1 | 601,090 |
| 400 | | 5.000%, 8/01/31 | 2/26 at 100.00 | Aa1 | 479,100 |
| 3,500 | | West Virginia State, General Obligation Bonds, State Road Competitive Series 2018B, | 6/28 at 100.00 | Aa2 | 3,899,875 |
| | 4.000%, 6/01/42 | | | |
| 2,000 | | Winder-Barrow Industrial Building Authority, Revenue Bonds, Georgia, City of Winder Project, | 12/21 at 100.00 | A1 | 2,140,380 |
| | Refunding Series 2012, 5.000%, 12/01/29 – AGM Insured | | | |
| 41,046 | | Total Tax Obligation/General | | | 47,134,986 |
30
| | | | | | |
| Principal | | | Optional Call | | |
| Amount (000) | | Description (1) | Provisions (2) | Ratings (3) | Value |
| | Tax Obligation/Limited – 25.3% (16.8% of Total Investments) | | | |
| | Atlanta and Fulton County Recreation Authority, Georgia, Revenue Bonds, Zoo Atlanta | | | |
| | Parking Facility Project, Series 2017: | | | |
| $ 1,180 | | 5.000%, 12/01/34 | 12/27 at 100.00 | AA+ | $ 1,453,028 |
| 1,260 | | 5.000%, 12/01/36 | 12/27 at 100.00 | AA+ | 1,543,853 |
| 3,250 | | Atlanta Development Authority, Georgia, Revenue Bonds, New Downtown Atlanta Stadium | 7/25 at 100.00 | Aa3 | 3,801,687 |
| | Project, Senior Lien Series 2015A-1, 5.250%, 7/01/44 | | | |
| 575 | | Atlanta, Georgia, Tax Allocation Bonds Atlanta Station Project, Refunding Series 2017, | No Opt. Call | A3 | 668,489 |
| | 5.000%, 12/01/24 | | | |
| | Atlanta, Georgia, Tax Allocation Bonds, Beltline Project, Series 2016D: | | | |
| 1,200 | | 5.000%, 1/01/30 | 1/27 at 100.00 | A2 | 1,442,196 |
| 1,525 | | 5.000%, 1/01/31 | 1/27 at 100.00 | A2 | 1,825,135 |
| 725 | | Atlanta, Georgia, Tax Allocation Bonds, Perry Bolton Project Series 2014, 5.000%, 7/01/41 | 7/23 at 100.00 | A– | 794,651 |
| 5,160 | | Cobb-Marietta Coliseum and Exhibit Hall Authority, Georgia, Revenue Bonds, Refunding | No Opt. Call | Baa2 | 5,919,294 |
| | Series 1993, 5.625%, 10/01/26 – NPFG Insured | | | |
| 405 | | Cobb-Marietta Coliseum and Exhibit Hall Authority, Georgia, Revenue Bonds, Refunding | No Opt. Call | AA– | 465,151 |
| | Series 2005, 5.500%, 10/01/26 – NPFG Insured | | | |
| 3,020 | | Georgia Local Governments, Certificates of Participation, Georgia Municipal Association, | No Opt. Call | Baa2 | 3,468,621 |
| | Series 1998A, 4.750%, 6/01/28 – NPFG Insured | | | |
| 700 | | Georgia State Road and Tollway Authority, Federal Highway Grant Anticipation Revenue | 6/27 at 100.00 | AA | 868,924 |
| | Bonds, Series 2017A, 5.000%, 6/01/29 | | | |
| | Metropolitan Atlanta Rapid Transit Authority, Georgia, Sales Tax Revenue Bonds, Third | | | |
| | Indenture, Series 2015B: | | | |
| 1,000 | | 5.000%, 7/01/41 | 7/26 at 100.00 | AA+ | 1,187,890 |
| 3,000 | | 5.000%, 7/01/42 | 7/26 at 100.00 | AA+ | 3,560,040 |
| 5,000 | | Miami-Dade County, Florida, Transit System Sales Surtax Revenue Bonds, Series 2018, | 7/28 at 100.00 | AA | 5,531,400 |
| | 4.000%, 7/01/48 | | | |
| 2,037 | | Puerto Rico Sales Tax Financing Corporation, Sales Tax Revenue Bonds, Restructured | 7/28 at 100.00 | N/R | 2,108,764 |
| | 2018A-1, 4.550%, 7/01/40 | | | |
| 810 | | Tift County Hospital Authority, Georgia, Revenue Anticipation Certificates Series 2012, | 12/22 at 100.00 | Aa2 | 884,650 |
| | 5.000%, 12/01/38 | | | |
| 1,500 | | Washington State Convention Center Public Facilities District, Lodging Tax Revenue | 7/28 at 100.00 | A1 | 1,593,390 |
| | Bonds, Series 2018, 4.000%, 7/01/58 | | | |
| 32,347 | | Total Tax Obligation/Limited | | | 37,117,163 |
| | Transportation – 10.9% (7.2% of Total Investments) | | | |
| 2,000 | | Atlanta, Georgia, Airport General Revenue Bonds, Refunding Series 2011B, 5.000%, 1/01/30 (AMT) | 1/21 at 100.00 | AA– | 2,074,740 |
| 2,000 | | Atlanta, Georgia, Airport General Revenue Bonds, Refunding Series 2012B, 5.000%, 1/01/31 | 1/22 at 100.00 | AA– | 2,149,940 |
| 2,810 | | Atlanta, Georgia, Airport General Revenue Bonds, Series 2012C, 5.000%, 1/01/42 (AMT) | 1/22 at 100.00 | AA– | 2,988,435 |
| | Atlanta, Georgia, Airport Passenger Facilities Charge and General Revenue Bonds, | | | |
| | Refunding Subordinate Lien Series 2014A: | | | |
| 2,575 | | 5.000%, 1/01/32 | 1/24 at 100.00 | AA– | 2,919,381 |
| 3,750 | | 5.000%, 1/01/34 | 1/24 at 100.00 | AA– | 4,238,850 |
| 1,500 | | Clayton County Development Authority, Georgia, Special Facilities Revenue Bonds, Delta | 6/20 at 100.00 | Baa3 | 1,553,040 |
| | Air Lines, Inc. Project, Series 2009A, 8.750%, 6/01/29 | | | |
| 14,635 | | Total Transportation | | | 15,924,386 |
| | U.S. Guaranteed – 8.5% (5.6% of Total Investments) (7) | | | |
| 2,000 | | Chatham County Hospital Authority, Georgia, Seven Mill Tax Pledge Revenue Bonds, | 1/22 at 100.00 | N/R | 2,156,760 |
| | Memorial Health University Medical Center, Inc., Refunding & Improvement Series 2012A, | | | |
| | 5.000%, 1/01/31 (Pre-refunded 1/01/22) | | | |
| 600 | | Clarke County Hospital Authority, Georgia, Hospital Revenue Certificates, Athens | 1/22 at 100.00 | AA | 647,676 |
| | Regional Medical Center, Series 2012, 5.000%, 1/01/32 (Pre-refunded 1/01/22) | | | |
31
| | | | | |
| NKG | Nuveen Georgia Quality Municipal Income Fund | |
| Portfolio of Investments (continued) | | | |
| November 30, 2019 (Unaudited) | | | |
|
|
|
| Principal | | | Optional Call | | |
| Amount (000) | | Description (1) | Provisions (2) | Ratings (3) | Value |
| | U.S. Guaranteed (7) (continued) | | | |
| $ 625 | | Fulton County Development Authority, Georgia, Revenue Bonds, Georgia Tech Foundation | 5/22 at 100.00 | AA+ | $ 683,306 |
| | Technology Square Project, Refunding Series 2012A, 5.000%, 11/01/31 (Pre-refunded 5/01/22) | | | |
| | Gainesville and Hall County Hospital Authority, Georgia, Revenue Anticipation | | | |
| | Certificates, Northeast Georgia Health Services Inc., Series 2010B: | | | |
| 765 | | 5.000%, 2/15/33 (Pre-refunded 2/15/20) | 2/20 at 100.00 | N/R | 770,959 |
| 765 | | 5.125%, 2/15/40 (Pre-refunded 2/15/20) | 2/20 at 100.00 | N/R | 771,151 |
| 3,015 | | 5.250%, 2/15/45 (Pre-refunded 2/15/20) | 2/20 at 100.00 | N/R | 3,039,994 |
| 1,500 | | Habersham County Hospital Authority, Georgia, Revenue Anticipation Certificates, Series | 2/24 at 100.00 | Aa3 | 1,715,550 |
| | 2014B, 5.000%, 2/01/37 (Pre-refunded 2/01/24) | | | |
| 290 | | Metropolitan Atlanta Rapid Transit Authority, Georgia, Sales Tax Revenue Bonds, | No Opt. Call | N/R | 297,993 |
| | Refunding Series 1992P, 6.250%, 7/01/20 – AMBAC Insured (ETM) | | | |
| 2,260 | | Valdosta and Lowndes County Hospital Authority, Georgia, Revenue Certificates, South | 10/21 at 100.00 | Aa2 | 2,416,460 |
| | Georgia Medical Center Project, Series 2011B, 5.000%, 10/01/41 (Pre-refunded 10/01/21) | | | |
| 11,820 | | Total U.S. Guaranteed | | | 12,499,849 |
| | Utilities – 17.2% (11.4% of Total Investments) | | | |
| 1,975 | | Burke County Development Authority, Georgia, Pollution Control Revenue Bonds, Georgia | No Opt. Call | A– | 2,007,528 |
| | Power Company, Fourth Series 1994, 2.250%, 10/01/32 (Mandatory Put 5/25/23) | | | |
| 1,250 | | Burke County Development Authority, Georgia, Pollution Control Revenue Bonds, Oglethorpe | 2/28 at 100.00 | BBB+ | 1,332,288 |
| | Power Corporation Vogtle Project, Series 2017C, 4.125%, 11/01/45 | | | |
| 1,250 | | Burke County Development Authority, Georgia, Pollution Control Revenue Bonds, Oglethorpe | 2/28 at 100.00 | BBB+ | 1,332,288 |
| | Power Corporation Vogtle Project, Series 2017D, 4.125%, 11/01/45 | | | |
| 1,750 | | Dalton, Georgia, Combined Utilities Revenue Bonds, Series 2017, 5.000%, 3/01/33 | 3/27 at 100.00 | A2 | 2,080,645 |
| 3,000 | | Georgia Municipal Electric Authority, General Power Revenue Bonds, Series 2012GG, | 1/23 at 100.00 | A1 | 3,248,310 |
| | 5.000%, 1/01/43 | | | |
| | Main Street Natural Gas Inc., Georgia, Gas Project Revenue Bonds, Series 2006B: | | | |
| 1,055 | | 5.000%, 3/15/20 | No Opt. Call | A+ | 1,065,434 |
| 1,300 | | 5.000%, 3/15/21 | No Opt. Call | A+ | 1,356,186 |
| 1,500 | | 5.000%, 3/15/22 | No Opt. Call | A+ | 1,613,430 |
| 2,000 | | Main Street Natural Gas Inc., Georgia, Gas Project Revenue Bonds, Series 2007A, | No Opt. Call | A+ | 2,155,460 |
| | 5.000%, 3/15/22 | | | |
| 1,000 | | Main Street Natural Gas Inc., Georgia, Gas Supply Revenue Bonds, Series 2019A, | No Opt. Call | A3 | 1,361,860 |
| | 5.000%, 5/15/49 | | | |
| 1,525 | | Main Street Natural Gas Inc., Georgia, Gas Supply Revenue Bonds, Series 2019B, | 9/24 at 100.43 | Aa1 | 1,699,490 |
| | 4.000%, 8/01/49 (Mandatory Put 12/02/24) | | | |
| 2,000 | | Main Street Natural Gas Inc., Georgia, Gas Supply Revenue Bonds, Variable Rate Demand | 6/23 at 100.40 | Aa2 | 2,173,900 |
| | Bonds Series 2018A, 4.000%, 4/01/48 (Mandatory Put 9/01/23) | | | |
| 1,500 | | Municipal Electric Authority of Georgia, Project One Revenue Bonds, Subordinate Lien | No Opt. Call | A2 | 1,096,590 |
| | Series 2015A, 0.000%, 1/01/32 | | | |
| 2,260 | | Municipal Electric Authority of Georgia, Project One Revenue Bonds, Subordinate Lien | 7/26 at 100.00 | AA | 2,679,772 |
| | Series 2016A, 5.000%, 1/01/30 – BAM Insured | | | |
| 23,365 | | Total Utilities | | | 25,203,181 |
| | Water and Sewer – 22.6% (15.0% of Total Investments) | | | |
| 4,000 | | Atlanta, Georgia, Water and Wastewater Revenue Bonds, Refunding Series 2018A, 5.000%, | 11/27 at 100.00 | Aa2 | 4,887,440 |
| | 11/01/39 (UB) (4) | | | |
| 5,000 | | Atlanta, Georgia, Water and Wastewater Revenue Bonds, Refunding Series 2018B, | 11/27 at 100.00 | Aa2 | 6,043,850 |
| | 5.000%, 11/01/47 | | | |
| 260 | | Atlanta, Georgia, Water and Wastewater Revenue Bonds, Series 2004, 5.750%, 11/01/30 – | No Opt. Call | AA | 364,946 |
| | AGM Insured | | | |
| 5 | | Cherokee County Water and Sewerage Authority, Georgia, Revenue Bonds, Series 2001, | 12/19 at 100.00 | AA | 5,014 |
| | 5.000%, 8/01/35 – AGM Insured | | | |
32
| | | | | | |
| Principal | | | Optional Call | | |
| Amount (000) | | Description (1) | Provisions (2) | Ratings (3) | Value |
| | Water and Sewer (continued) | | | |
| $ 500 | | Columbus, Georgia, Water and Sewerage Revenue Bonds, Refunding Series 2014A, | 5/24 at 100.00 | AA+ | $ 573,350 |
| | 5.000%, 5/01/31 | | | |
| 500 | | Columbus, Georgia, Water and Sewerage Revenue Bonds, Series 2016, 5.000%, 5/01/36 | 5/26 at 100.00 | AA+ | 594,690 |
| | DeKalb County, Georgia, Water and Sewerage Revenue Bonds, Refunding Series 2006B: | | | |
| 6,000 | | 5.250%, 10/01/32 – AGM Insured (UB) (4) | 10/26 at 100.00 | AA | 7,405,260 |
| 300 | | 5.000%, 10/01/35 – AGM Insured | 10/26 at 100.00 | AA | 360,726 |
| 5,350 | | DeKalb County, Georgia, Water and Sewerage Revenue Bonds, Second Resolution Series | 10/21 at 100.00 | Aa3 | 5,725,677 |
| | 2011A, 5.250%, 10/01/41 | | | |
| 1,000 | | Fulton County, Georgia, Water and Sewerage Revenue Bonds, Refunding Series 2013, | 1/23 at 100.00 | AA | 1,104,040 |
| | 5.000%, 1/01/33 | | | |
| 435 | | Midgeville, Georgia, Water and Sewerage Revenue Refunding Bonds, Series 1996, 6.000%, | No Opt. Call | AA | 453,022 |
| | 12/01/21 – AGM Insured | | | |
| | Oconee County, Georgia, Water and Sewer Revenue Bonds, Series 2017A: | | | |
| 155 | | 5.000%, 9/01/35 | 9/27 at 100.00 | AA | 190,086 |
| 535 | | 5.000%, 9/01/37 | 9/27 at 100.00 | AA | 651,587 |
| 2,000 | | South Fulton Municipal Regional Water and Sewer Authority, Georgia, Revenue Bonds, | 1/24 at 100.00 | AA | 2,270,380 |
| | Refunding Series 2014, 5.000%, 1/01/30 | | | |
| 2,315 | | Walton County Water and Sewerage Authority, Georgia, Revenue Bonds, Oconee-Hard Creek | 2/26 at 100.00 | Aa2 | 2,542,264 |
| | Reservoir Project, Series 2016, 4.000%, 2/01/38 | | | |
| 28,355 | | Total Water and Sewer | | | 33,172,332 |
| $ 196,263 | | Total Long-Term Investments (cost $207,692,600) | | | 220,906,273 |
|
| Principal | | | Optional Call | | |
| Amount (000) | | Description (1) | Provisions (2) | Ratings (3) | Value |
| | SHORT-TERM INVESTMENTS – 0.2% (0.1% of Total Investments) | | | |
| | MUNICIPAL BONDS – 0.2% (0.1% of Total Investments) | | | |
| | Health Care – 0.2% (0.1% of Total Investments) | | | |
| $ 231 | | Baldwin County Hospital Authority, Georgia, Revenue Bonds, Oconee Regional Medical Center, | No Opt. Call | N/R | $ 257,797 |
| | Series 2016, 6.500%, 3/31/17 (5), (6) | | | |
| $ 231 | | Total Short-Term Investments (cost $231,260) | | | 257,797 |
| | Total Investments (cost $207,923,860) – 151.0% | | | 221,164,070 |
| | Floating Rate Obligations – (13.4)% | | | (19,600,000) |
| | Adjustable Rate MuniFund Term Preferred Shares, net of deferred offering costs – (39.9)% (8) | | | (58,364,506) |
| | Other Assets Less Liabilities – 2.3% | | | 3,244,823 |
| | Net Asset Applicable to Common Shares – 100% | | | $ 146,444,387 |
33
| | |
| NKG | Nuveen Georgia Quality Municipal Income Fund |
| Portfolio of Investments (continued) |
| November 30, 2019 (Unaudited) |
| | |
(1) | All percentages shown in the Portfolio of Investments are based on net assets applicable to common shares unless otherwise noted. |
(2) | Optional Call Provisions: Dates (month and year) and prices of the earliest optional call or redemption. There may be other call provisions at varying prices at later dates. Certain mortgage-backed securities may be subject to periodic principal paydowns. |
(3) | For financial reporting purposes, the ratings disclosed are the highest of Standard & Poor’s Group (“Standard & Poor’s”), Moody’s Investors Service, Inc. (“Moody’s”) or Fitch, Inc. (“Fitch”) rating. This treatment of split-rated securities may differ from that used for other purposes, such as for Fund investment policies. Ratings below BBB by Standard & Poor’s, Baa by Moody’s or BBB by Fitch are considered to be below investment grade. Holdings designated N/R are not rated by any of these national rating agencies. |
(4) | Investment, or portion of investment, has been pledged to collateralize the net payment obligations for investments in inverse floating rate transactions. |
(5) | Investment valued at fair value using methods determined in good faith by, or at the discretion of, the Board. For fair value measurement disclosure purposes, investment classified as Level 3. See Notes to Financial Statements, Note 3 – Investment Valuation and Fair Value Measurements for more information. |
(6) | Defaulted security. A security whose issuer has failed to fully pay principal and/or interest when due, or is under the protection of bankruptcy. |
(7) | Backed by an escrow or trust containing sufficient U.S. Government or U.S. Government agency securities, which ensure the timely payment of principal and interest. |
(8) | Adjustable Rate MuniFund Term Preferred Shares, net of deferred offering cost as a percentage of Total Investments is 26.4%. |
AMT | Alternative Minimum Tax |
ETM | Escrowed to maturity |
UB | Underlying bond of an inverse floating rate trust reflected as a financing transaction. See Notes to Financial Statements, Note 4 – Portfolio Securities and Investments in Derivatives, Inverse Floating Rate Securities for more information. |
| See accompanying notes to financial statements. |
34
| | |
| NMY | Nuveen Maryland Quality Municipal |
| Income Fund |
| Portfolio of Investments |
| November 30, 2019 (Unaudited) |
| | | | | | |
| Principal | | | Optional Call | | |
| Amount (000) | | Description (1) | Provisions (2) | Ratings (3) | Value |
| | LONG-TERM INVESTMENTS – 158.4% (100.0% of Total Investments) | | | |
| | MUNICIPAL BONDS – 158.4% (100.0% of Total Investments) | | | |
| | Consumer Discretionary – 3.4% (2.1% of Total Investments) | | | |
| $ 9,215 | | Baltimore, Maryland, Convention Center Hotel Revenue Bonds, Refunding Series 2017, | 9/27 at 100.00 | BBB– | $ 10,486,762 |
| | 5.000%, 9/01/46 | | | |
| 2,000 | | Maryland Economic Development Corporation, Revenue Bonds, Chesapeake Bay Hyatt | 12/19 at 100.00 | N/R | 1,290,000 |
| | Conference Center, Series 2006A, 5.000%, 12/01/31 (4) | | | |
| 11,215 | | Total Consumer Discretionary | | | 11,776,762 |
| | Consumer Staples – 5.2% (3.3% of Total Investments) | | | |
| 595 | | Buckeye Tobacco Settlement Financing Authority, Ohio, Tobacco Settlement Asset-Backed | 12/19 at 100.00 | B– | 598,064 |
| | Revenue Bonds, Senior Lien, Series 2007A-2, 5.875%, 6/01/47 | | | |
| 3,270 | | Children’s Trust Fund, Puerto Rico, Tobacco Settlement Asset-Backed Bonds, Refunding | 12/19 at 100.00 | Ba1 | 3,327,879 |
| | Series 2002, 5.500%, 5/15/39 | | | |
| 13,000 | | District of Columbia Tobacco Settlement Corporation, Tobacco Settlement Asset-Backed | 12/19 at 19.63 | N/R | 2,508,610 |
| | Bonds, Series 2006A, 0.000%, 6/15/46 | | | |
| | Guam Economic Development & Commerce Authority, Tobacco Settlement Asset-Backed Bonds, | | | |
| | Series 2007A: | | | |
| 1,940 | | 5.250%, 6/01/32 | 12/19 at 100.00 | N/R | 1,940,000 |
| 2,915 | | 5.625%, 6/01/47 | 12/19 at 100.00 | N/R | 2,914,883 |
| 1,815 | | New York Counties Tobacco Trust VI, New York, Tobacco Settlement Pass-Through Bonds, | No Opt. Call | BBB | 1,960,091 |
| | Series 2016A-1, 5.625%, 6/01/35 | | | |
| 100 | | Northern Tobacco Securitization Corporation, Alaska, Tobacco Settlement Asset-Backed | 12/19 at 100.00 | B3 | 100,231 |
| | Bonds, Series 2006A, 5.000%, 6/01/46 | | | |
| 1,405 | | Tobacco Settlement Financing Corporation, New Jersey, Tobacco Settlement Asset-Backed | 6/28 at 100.00 | BBB+ | 1,596,263 |
| | Bonds, Series 2018A, 5.000%, 6/01/46 | | | |
| 450 | | Tobacco Settlement Financing Corporation, Virgin Islands, Tobacco Settlement | 12/19 at 100.00 | A3 | 450,914 |
| | Asset-Backed Bonds, Series 2001, 5.000%, 5/15/31 | | | |
| 2,850 | | TSASC Inc., New York, Tobacco Asset-Backed Bonds, Series 2006, 5.000%, 6/01/45 | 6/27 at 100.00 | CCC+ | 2,836,976 |
| 28,340 | | Total Consumer Staples | | | 18,233,911 |
| | Education and Civic Organizations – 9.6% (6.0% of Total Investments) | | | |
| | Frederick County, Maryland, Educational Facilities Revenue Bonds, Mount Saint Mary’s | | | |
| | University Inc., Series 2017A: | | | |
| 1,500 | | 5.000%, 9/01/37, 144A | 9/27 at 100.00 | BB+ | 1,698,075 |
| 3,250 | | 5.000%, 9/01/45, 144A | 9/27 at 100.00 | BB+ | 3,627,065 |
| 700 | | Maryland Health and Higher Educational Facilities Authority, Revenue Bonds, Goucher | 7/22 at 100.00 | A– | 754,201 |
| | College, Series 2012A, 5.000%, 7/01/34 | | | |
| | Maryland Health and Higher Educational Facilities Authority, Revenue Bonds, Goucher | | | |
| | College, Series 2017A: | | | |
| 1,100 | | 5.000%, 7/01/37 | 7/27 at 100.00 | A– | 1,290,003 |
| 1,200 | | 5.000%, 7/01/44 | 7/27 at 100.00 | A– | 1,389,168 |
| | Maryland Health and Higher Educational Facilities Authority, Revenue Bonds, Green Street | | | |
| | Academy, Series 2017A: | | | |
| 265 | | 5.125%, 7/01/37, 144A | 7/27 at 100.00 | N/R | 281,112 |
| 500 | | 5.250%, 7/01/47, 144A | 7/27 at 100.00 | N/R | 526,450 |
| | Maryland Health and Higher Educational Facilities Authority, Revenue Bonds, Johns | | | |
| | Hopkins University, Series 2012A: | | | |
| 1,145 | | 5.000%, 7/01/30 | 7/22 at 100.00 | AA+ | 1,251,829 |
| 1,050 | | 5.000%, 7/01/37 | 7/22 at 100.00 | AA+ | 1,145,445 |
35
| | | | | | |
| NMY | | Nuveen Maryland Quality Municipal Income Fund | |
| | Portfolio of Investments (continued) | | | |
| | November 30, 2019 (Unaudited) | | | |
|
|
|
|
| Principal | | | Optional Call | | |
| Amount (000) | | Description (1) | Provisions (2) | Ratings (3) | Value |
| | Education and Civic Organizations (continued) | | | |
| | Maryland Health and Higher Educational Facilities Authority, Revenue Bonds, Johns | | | |
| | Hopkins University, Series 2013B: | | | |
| $ 500 | | 5.000%, 7/01/38 | 7/23 at 100.00 | AA+ | $ 557,715 |
| 4,375 | | 4.250%, 7/01/41 | 7/23 at 100.00 | AA+ | 4,714,281 |
| 1,250 | | Maryland Health and Higher Educational Facilities Authority, Revenue Bonds, Loyola | 10/22 at 100.00 | A | 1,355,413 |
| | University Maryland, Series 2012A, 5.000%, 10/01/39 | | | |
| | Maryland Health and Higher Educational Facilities Authority, Revenue Bonds, Loyola | | | |
| | University Maryland, Series 2014: | | | |
| 1,000 | | 4.000%, 10/01/45 | 10/24 at 100.00 | A | 1,062,180 |
| 1,250 | | 5.000%, 10/01/45 | 10/24 at 100.00 | A | 1,405,787 |
| | Maryland Health and Higher Educational Facilities Authority, Revenue Bonds, Maryland | | | |
| | Institute College of Art, Series 2012: | | | |
| 1,500 | | 5.000%, 6/01/34 | 6/22 at 100.00 | Baa1 | 1,613,355 |
| 3,000 | | 5.000%, 6/01/47 | 6/22 at 100.00 | Baa1 | 3,198,480 |
| | Maryland Health and Higher Educational Facilities Authority, Revenue Bonds, Maryland | | | |
| | Institute College of Art, Series 2016: | | | |
| 175 | | 5.000%, 6/01/36 | 6/26 at 100.00 | Baa1 | 203,971 |
| 2,500 | | 4.000%, 6/01/42 | 6/26 at 100.00 | Baa1 | 2,695,675 |
| | Maryland Health and Higher Educational Facilities Authority, Revenue Bonds, Maryland | | | |
| | Institute College of Art, Series 2017: | | | |
| 525 | | 5.000%, 6/01/35 | 6/26 at 100.00 | Baa1 | 613,179 |
| 1,000 | | 5.000%, 6/01/42 | 6/26 at 100.00 | Baa1 | 1,151,670 |
| 625 | | Morgan State University, Maryland, Student Tuition and Fee Revenue Bonds, Academic Fees | 7/22 at 100.00 | A+ | 679,156 |
| | and Auxiliary Facilities, Refunding Series 2012, 5.000%, 7/01/29 | | | |
| 2,115 | | Morgan State University, Maryland, Student Tuition and Fee Revenue Refunding Bonds, | No Opt. Call | A+ | 2,170,984 |
| | Academic Fees and Auxiliary Facilities, Series 1993, 6.100%, 7/01/20 – NPFG Insured | | | |
| 30,525 | | Total Education and Civic Organizations | | | 33,385,194 |
| | Energy – 1.3% (0.9% of Total Investments) | | | |
| 4,560 | | Maryland Economic Development Corporation, Port Facilities Revenue Bonds, CNX Marine | 9/20 at 100.00 | BB– | 4,678,378 |
| | Terminals Inc. Port of Baltimore Facility, Refunding Series 2010, 5.750%, 9/01/25 | | | |
| | Financials – 0.0% (0.0% of Total Investments) | | | |
| 232 | | Puerto Rico Urgent Interest Fund Corp (COFINA), National Custodial Taxable Trust Unit, | No Opt. Call | N/R | 31,918 |
| | Series 2007A Sr. Bond, 0.000%, 8/01/41 (5) | | | |
| 2,705 | | Puerto Rico Urgent Interest Fund Corp (COFINA), National Custodial Taxable-Exempt Trust | No Opt. Call | N/R | 135,247 |
| | Unit, Series 2007A Sr. Bonds, 0.000%, 8/01/41 (5) | | | |
| 2,937 | | Total Financials | | | 167,165 |
| | Health Care – 37.1% (23.4% of Total Investments) | | | |
| | Maryland Health and Higher Educational Facilities Authority, Maryland, Hospital Revenue | | | |
| | Bonds, Meritus Medical Center, Series 2015: | | | |
| 990 | | 4.000%, 7/01/32 | 7/25 at 100.00 | A– | 1,072,091 |
| 2,470 | | 4.250%, 7/01/35 | 7/25 at 100.00 | A– | 2,692,004 |
| 1,740 | | 5.000%, 7/01/45 | 7/25 at 100.00 | A– | 1,974,343 |
| | Maryland Health and Higher Educational Facilities Authority, Revenue Bonds Doctors | | | |
| | Community Hospital, Series 2017B: | | | |
| 250 | | 5.000%, 7/01/34 | 7/27 at 100.00 | Baa3 | 287,370 |
| 4,820 | | 5.000%, 7/01/38 | 7/27 at 100.00 | Baa3 | 5,463,422 |
| | Maryland Health and Higher Educational Facilities Authority, Revenue Bonds, Mercy | | | |
| | Medical Center, Series 2016A: | | | |
| 90 | | 5.000%, 7/01/36 | 7/26 at 100.00 | Baa1 | 103,927 |
| 1,450 | | 5.000%, 7/01/38 | 7/26 at 100.00 | Baa1 | 1,666,137 |
| 585 | | 4.000%, 7/01/42 | 7/26 at 100.00 | Baa1 | 620,001 |
36
| | | | | | |
| Principal | | | Optional Call | | |
| Amount (000) | | Description (1) | Provisions (2) | Ratings (3) | Value |
| | Health Care (continued) | | | |
| | Maryland Health and Higher Educational Facilities Authority, Revenue Bonds, Adventist | | | |
| | Healthcare, Series 2011A: | | | |
| $ 1,350 | | 6.250%, 1/01/31 | 1/22 at 100.00 | Baa3 | $ 1,476,495 |
| 375 | | 6.125%, 1/01/36 | 1/22 at 100.00 | Baa3 | 407,029 |
| 3,270 | | Maryland Health and Higher Educational Facilities Authority, Revenue Bonds, Adventist | 1/27 at 100.00 | Baa3 | 3,818,379 |
| | Healthcare, Series 2016A, 5.500%, 1/01/46 | | | |
| 1,355 | | Maryland Health and Higher Educational Facilities Authority, Revenue Bonds, Anne Arundel | 7/22 at 100.00 | A | 1,482,153 |
| | Health System Issue, Series 2012, 5.000%, 7/01/24 | | | |
| 2,000 | | Maryland Health and Higher Educational Facilities Authority, Revenue Bonds, Calvert | 7/23 at 100.00 | AA– | 2,187,800 |
| | Health System Issue, Refunding Series 2013, 5.000%, 7/01/38 | | | |
| | Maryland Health and Higher Educational Facilities Authority, Revenue Bonds, Carroll | | | |
| | Hospital Center, Series 2012A: | | | |
| 1,000 | | 4.000%, 7/01/30 | 7/22 at 100.00 | A1 | 1,057,480 |
| 1,775 | | 5.000%, 7/01/37 | 7/22 at 100.00 | A1 | 1,906,865 |
| 4,335 | | Maryland Health and Higher Educational Facilities Authority, Revenue Bonds, Frederick | 7/22 at 100.00 | A– | 4,519,628 |
| | Memorial Hospital Issue, Series 2012A, 4.250%, 7/01/32 | | | |
| 2,500 | | Maryland Health and Higher Educational Facilities Authority, Revenue Bonds, Johns | 5/25 at 100.00 | Aa2 | 2,701,025 |
| | Hopkins Health System Issue, Series 2015A, 4.000%, 5/15/40 | | | |
| | Maryland Health and Higher Educational Facilities Authority, Revenue Bonds, Johns | | | |
| | Hopkins Health System Obligated Group Issue, Series 2011A: | | | |
| 500 | | 5.000%, 5/15/25 | 5/21 at 100.00 | Aa2 | 528,095 |
| 500 | | 5.000%, 5/15/26 | 5/21 at 100.00 | Aa2 | 527,870 |
| 2,000 | | Maryland Health and Higher Educational Facilities Authority, Revenue Bonds, LifeBridge | 7/26 at 100.00 | A+ | 2,318,860 |
| | Health Issue, Series 2016, 5.000%, 7/01/47 | | | |
| | Maryland Health and Higher Educational Facilities Authority, Revenue Bonds, LifeBridge | | | |
| | Health Issue, Series 2017: | | | |
| 1,000 | | 5.000%, 7/01/33 | 7/27 at 100.00 | A+ | 1,211,010 |
| 500 | | 4.000%, 7/01/42 | 7/27 at 100.00 | A+ | 547,465 |
| 1,000 | | 5.000%, 7/01/44 | 7/27 at 100.00 | A+ | 1,181,680 |
| | Maryland Health and Higher Educational Facilities Authority, Revenue Bonds, LifeBridge | | | |
| | Health System, Series 2015: | | | |
| 1,500 | | 4.000%, 7/01/35 | 7/25 at 100.00 | A+ | 1,621,920 |
| 1,125 | | 5.000%, 7/01/40 | 7/25 at 100.00 | A+ | 1,293,289 |
| 2,975 | | 4.125%, 7/01/47 | 7/25 at 100.00 | A+ | 3,172,778 |
| 2,500 | | Maryland Health and Higher Educational Facilities Authority, Revenue Bonds, MedStar | 2/25 at 100.00 | A | 2,848,700 |
| | Health Issue, Series 2015, 5.000%, 8/15/38 | | | |
| 6,000 | | Maryland Health and Higher Educational Facilities Authority, Revenue Bonds, MedStar | 5/27 at 100.00 | A | 7,072,800 |
| | Health Issue, Series 2017A, 5.000%, 5/15/42 | | | |
| 2,850 | | Maryland Health and Higher Educational Facilities Authority, Revenue Bonds, Mercy | 7/22 at 100.00 | Baa1 | 3,062,866 |
| | Medical Center, Series 2011, 5.000%, 7/01/31 | | | |
| | Maryland Health and Higher Educational Facilities Authority, Revenue Bonds, Peninsula | | | |
| | Regional Medical Center Issue, Refunding Series 2015: | | | |
| 1,000 | | 5.000%, 7/01/39 | 7/24 at 100.00 | A | 1,126,950 |
| 5,500 | | 5.000%, 7/01/45 | 7/24 at 100.00 | A | 6,168,305 |
| | Maryland Health and Higher Educational Facilities Authority, Revenue Bonds, Trinity | | | |
| | Health Credit Group, Series 2017MD: | | | |
| 1,000 | | 5.000%, 12/01/46 | 6/27 at 100.00 | AA– | 1,180,730 |
| 3,260 | | 5.000%, 12/01/46 (UB) (6) | 6/27 at 100.00 | AA– | 3,849,180 |
| | Maryland Health and Higher Educational Facilities Authority, Revenue Bonds, University | | | |
| | of Maryland Medical System Issue, Series 2013A: | | | |
| 4,665 | | 4.000%, 7/01/43 | 7/22 at 100.00 | A | 4,828,415 |
| 11,500 | | 5.000%, 7/01/43 | 7/22 at 100.00 | A | 12,348,355 |
| 1,000 | | Maryland Health and Higher Educational Facilities Authority, Revenue Bonds, University | 7/25 at 100.00 | A | 1,148,320 |
| | of Maryland Medical System Issue, Series 2015, 5.000%, 7/01/35 | | | |
37
| | |
| NMY | Nuveen Maryland Quality Municipal Income Fund |
| Portfolio of Investments (continued) |
| November 30, 2019 (Unaudited) |
| | | | | | |
| Principal | | | Optional Call | | |
| Amount (000) | | Description (1) | Provisions (2) | Ratings (3) | Value |
| | Health Care (continued) | | | |
| $ 5,500 | | Maryland Health and Higher Educational Facilities Authority, Revenue Bonds, University | 7/27 at 100.00 | A | $ 6,469,430 |
| | of Maryland Medical System Issue, Series 2017B, 5.000%, 7/01/39 | | | |
| 2,000 | | Maryland Health and Higher Educational Facilities Authority, Revenue Bonds, University | 1/28 at 100.00 | A | 2,168,040 |
| | of Maryland Medical System Issue, Taxable Series 2017D, 4.000%, 7/01/48 | | | |
| 12,250 | | Maryland Health and Higher Educational Facilities Authority, Revenue Bonds, Western | 7/24 at 100.00 | BBB | 13,784,802 |
| | Maryland Health, Series 2014, 5.250%, 7/01/34 | | | |
| 8,000 | | Montgomery County, Maryland, Revenue Bonds, Trinity Health Credit Group, Refunding | 12/21 at 100.00 | AA– | 8,538,640 |
| | Series 2011MD, 5.000%, 12/01/40 | | | |
| | Montgomery County, Maryland, Revenue Bonds, Trinity Health Credit Group, Series 2015: | | | |
| 6,000 | | 4.000%, 12/01/44 | 6/25 at 100.00 | AA– | 6,503,040 |
| 2,000 | | 5.000%, 12/01/44 (UB) (6) | 6/25 at 100.00 | AA– | 2,286,780 |
| 116,480 | | Total Health Care | | | 129,224,469 |
| | Housing/Multifamily – 8.5% (5.4% of Total Investments) | | | |
| 1,920 | | Anne Arundel County, Maryland, FNMA Multifamily Housing Revenue Bonds, Glenview Gardens | 1/20 at 102.00 | AA+ | 1,963,027 |
| | Apartments Project, Series 2009, 5.000%, 1/01/28 (Mandatory Put 1/01/27) | | | |
| | Howard County Housing Commission, Maryland, Revenue Bonds, Columbia Commons Apartments, | | | |
| | Series 2014A: | | | |
| 1,500 | | 4.000%, 6/01/34 | 6/24 at 100.00 | A+ | 1,588,905 |
| 1,550 | | 5.000%, 6/01/44 | 6/24 at 100.00 | A+ | 1,696,832 |
| 1,860 | | Howard County Housing Commission, Maryland, Revenue Bonds, Gateway Village Apartments, | 6/26 at 100.00 | A+ | 1,974,185 |
| | Series 2016, 4.000%, 6/01/46 | | | |
| | Howard County Housing Commission, Maryland, Revenue Bonds, The Verona at Oakland Mills | | | |
| | Project, Series 2013: | | | |
| 3,000 | | 5.000%, 10/01/28 | 10/23 at 100.00 | A+ | 3,338,460 |
| 2,000 | | 4.625%, 10/01/28 | 10/23 at 100.00 | A+ | 2,191,900 |
| 1,000 | | Howard County Housing Commission, Maryland, Revenue Bonds, Woodfield Oxford Square | 12/27 at 100.00 | A+ | 1,164,310 |
| | Apartments, Series 2017, 5.000%, 12/01/42 | | | |
| 1,195 | | Maryland Community Development Administration Department of Housing and Community | 1/24 at 100.00 | AA+ | 1,243,888 |
| | Development, Housing Revenue Bonds, Series 2014D, 3.900%, 7/01/40 | | | |
| 680 | | Maryland Community Development Administration Department of Housing and Community | 1/27 at 100.00 | AA+ | 708,492 |
| | Development, Housing Revenue Bonds, Series 2017C, 3.550%, 7/01/42 | | | |
| 1,000 | | Maryland Community Development Administration, Department of Housing and Community | 12/24 at 100.00 | Aaa | 1,048,110 |
| | Development, Multifamily Development Revenue Bonds, Marlborough Apartments, Series 2014I, | | | |
| | 3.450%, 12/15/31 | | | |
| | Maryland Economic Development Corporation, Senior Student Housing Revenue Bonds, Towson | | | |
| | University Project, Refunding Series 2017: | | | |
| 1,100 | | 5.000%, 7/01/36 | 7/27 at 100.00 | BBB | 1,275,659 |
| 470 | | 5.000%, 7/01/37 | 7/21 at 100.00 | BBB | 490,628 |
| | Maryland Economic Development Corporation, Student Housing Revenue Bonds, Salisbury | | | |
| | University Project, Refunding Series 2013: | | | |
| 500 | | 5.000%, 6/01/27 | 6/23 at 100.00 | Baa3 | 542,820 |
| 500 | | 5.000%, 6/01/34 | 6/23 at 100.00 | Baa3 | 537,855 |
| 1,510 | | Maryland Economic Development Corporation, Student Housing Revenue Bonds, Sheppard Pratt | 7/22 at 100.00 | BBB– | 1,599,120 |
| | University Village, Series 2012, 5.000%, 7/01/33 | | | |
| 495 | | Maryland Economic Development Corporation, Student Housing Revenue Bonds, University of | 7/25 at 100.00 | BBB– | 539,169 |
| | Maryland – Baltimore Project, Refunding Senior Lien Series 2015, 5.000%, 7/01/39 | | | |
| 1,160 | | Maryland Economic Development Corporation, Student Housing Revenue Bonds, University of | 12/19 at 100.00 | AA | 1,160,870 |
| | Maryland, Baltimore County Project, Refunding Series 2016, 3.600%, 7/01/35 – AGM Insured | | | |
38
| | | | | | |
| Principal | | | Optional Call | | |
| Amount (000) | | Description (1) | Provisions (2) | Ratings (3) | Value |
| | Housing/Multifamily (continued) | | | |
| | Maryland Economic Development Corporation, Student Housing Revenue Bonds, University of | | | |
| | Maryland, College Park Project, Refunding Series 2016: | | | |
| $ 875 | | 5.000%, 6/01/30 – AGM Insured | 6/26 at 100.00 | AA | $ 1,046,806 |
| 240 | | 5.000%, 6/01/31 – AGM Insured | 6/26 at 100.00 | AA | 286,572 |
| 2,405 | | 5.000%, 6/01/35 – AGM Insured | 6/26 at 100.00 | AA | 2,836,048 |
| 780 | | 5.000%, 6/01/43 – AGM Insured | 6/26 at 100.00 | AA | 908,739 |
| 1,500 | | Montgomery County Housing Opportunities Commission, Maryland, Multifamily Housing | 7/24 at 100.00 | Aaa | 1,570,905 |
| | Development Bonds, Series 2014A, 3.875%, 7/01/39 | | | |
| 27,240 | | Total Housing/Multifamily | | | 29,713,300 |
| | Housing/Single Family – 7.2% (4.5% of Total Investments) | | | |
| 2,385 | | Maryland Community Development Administration Department of Housing and Community | 3/26 at 100.00 | Aa2 | 2,478,325 |
| | Development, Residential Revenue Bonds, Series 2011B, 3.250%, 3/01/36 | | | |
| 2,365 | | Maryland Community Development Administration Department of Housing and Community | 9/23 at 100.00 | Aa2 | 2,531,094 |
| | Development, Residential Revenue Bonds, Series 2014A, 4.300%, 9/01/32 | | | |
| | Maryland Community Development Administration Department of Housing and Community | | | |
| | Development, Residential Revenue Bonds, Series 2014C: | | | |
| 3,000 | | 3.400%, 3/01/31 | 3/24 at 100.00 | Aa2 | 3,120,360 |
| 1,165 | | 3.750%, 3/01/39 | 3/24 at 100.00 | Aa2 | 1,209,561 |
| 1,500 | | Maryland Community Development Administration Department of Housing and Community | 9/25 at 100.00 | Aa2 | 1,591,395 |
| | Development, Residential Revenue Bonds, Series 2015A, 3.800%, 9/01/35 | | | |
| 4,900 | | Maryland Community Development Administration Department of Housing and Community | 9/27 at 100.00 | Aa2 | 5,333,013 |
| | Development, Residential Revenue Bonds, Series 2018A, 4.100%, 9/01/38 (UB) (6) | | | |
| 1,865 | | Maryland Community Development Administration Department of Housing and Community | 3/28 at 100.00 | Aa2 | 1,994,095 |
| | Development, Residential Revenue Bonds, Series 2019A, 3.750%, 9/01/39 | | | |
| 1,280 | | Maryland Community Development Administration Department of Housing and Community | 9/28 at 100.00 | Aa2 | 1,314,701 |
| | Development, Residential Revenue Bonds, Series 2019B, 3.350%, 9/01/42 | | | |
| 2,000 | | Maryland Community Development Administration Department of Housing and Community | 3/29 at 100.00 | AA+ | 2,005,920 |
| | Development, Residential Revenue Bonds, Series 2019C, 3.000%, 3/01/42 | | | |
| 2,000 | | Maryland Community Development Administration Department of Housing and Community | 7/29 at 100.00 | AA+ | 2,037,200 |
| | Development, Residential Revenue Bonds, Taxable Series 2019D, 3.350%, 7/01/49 | | | |
| 1,410 | | Montgomery County Housing Opportunities Commission, Maryland, Single Family Mortgage | 7/26 at 100.00 | Aa2 | 1,490,652 |
| | Revenue Bonds, Series 2017A, 3.650%, 7/01/37 | | | |
| 23,870 | | Total Housing/Single Family | | | 25,106,316 |
| | Long-Term Care – 8.7% (5.5% of Total Investments) | | | |
| | Baltimore County, Maryland, Revenue Bonds, Oak Crest Village, Series 2016: | | | |
| 2,220 | | 5.000%, 1/01/37 | 1/26 at 100.00 | A | 2,567,918 |
| 1,000 | | 3.625%, 1/01/37 | 1/26 at 100.00 | A | 1,055,640 |
| 2,050 | | Gaithersburg, Maryland, Economic Development Revenue Bonds, Asbury Methodist Homes Inc., | 1/20 at 100.00 | BBB | 2,057,688 |
| | Series 2009B, 6.000%, 1/01/23 | | | |
| 3,000 | | Gaithersburg, Maryland, Economic Development Revenue Bonds, Asbury Methodist Obligated | 1/24 at 104.00 | BBB | 3,385,890 |
| | Group Project, Refunding Series 2018A, 5.000%, 1/01/36 | | | |
| 1,290 | | Howard County, Maryland, Retirement Community Revenue Bonds, Vantage House, Refunding | 4/27 at 100.00 | N/R | 1,386,428 |
| | Series 2016, 5.000%, 4/01/46 | | | |
| 1,710 | | Howard County, Maryland, Retirement Community Revenue Bonds, Vantage House, Refunding | 4/27 at 100.00 | N/R | 1,869,817 |
| | Series 2017, 5.000%, 4/01/36 | | | |
| | Maryland Health and Higher Educational Facilities Authority, Revenue Bonds, Charlestown | | | |
| | Community Issue, Series 2016A: | | | |
| 2,125 | | 5.000%, 1/01/36 | 7/26 at 100.00 | A | 2,502,952 |
| 4,090 | | 5.000%, 1/01/45 | 7/26 at 100.00 | A | 4,731,966 |
| 2,480 | | Maryland Health and Higher Educational Facilities Authority, Revenue Bonds, Mercy Ridge | 12/19 at 100.00 | A | 2,483,596 |
| | Retirement Community, Series 2007, 4.750%, 7/01/34 | | | |
39
| | | | | | |
| NMY | | Nuveen Maryland Quality Municipal Income Fund | |
| | Portfolio of Investments (continued) | | | |
| | November 30, 2019 (Unaudited) | | | |
|
|
|
|
| Principal | | | Optional Call | | |
| Amount (000) | | Description (1) | Provisions (2) | Ratings (3) | Value |
| | Long-Term Care (continued) | | | |
| $ 1,050 | | Prince George’s County, Maryland, Revenue Bonds, Collington Episcopal Life Care | 4/27 at 100.00 | N/R | $ 1,151,451 |
| | Community Inc., Series 2017, 5.250%, 4/01/37 | | | |
| 1,340 | | Rockville Mayor and Council, Maryland, Economic Development Revenue Bonds, Ingleside | 11/24 at 103.00 | BB | 1,500,840 |
| | King Farm Project, Refunding Series 2017, 5.000%, 11/01/35 | | | |
| 795 | | Rockville Mayor and Council, Maryland, Economic Development Revenue Bonds, Ingleside | 11/24 at 103.00 | BB | 900,648 |
| | King Farm Project, Refunding Series 2017A-2, 5.000%, 11/01/31 | | | |
| 1,000 | | Rockville Mayor and Council, Maryland, Economic Development Revenue Bonds, Ingleside | 11/24 at 103.00 | BB | 1,113,660 |
| | King Farm Project, Series 2017A-1, 5.000%, 11/01/37 | | | |
| | Rockville Mayor and Council, Maryland, Economic Development Revenue Bonds, Series 2017B: | | | |
| 500 | | 5.000%, 11/01/42 | 11/24 at 103.00 | BB | 551,970 |
| 1,000 | | 5.000%, 11/01/47 | 11/24 at 103.00 | BB | 1,100,560 |
| | Washington County Commissioners, Maryland, Revenue Bonds, Diakon Lutheran Social | | | |
| | Ministries Project, Series 2019B: | | | |
| 1,000 | | 5.000%, 1/01/29 | No Opt. Call | BBB+ | 1,208,690 |
| 500 | | 5.000%, 1/01/32 | 1/29 at 100.00 | BBB+ | 596,885 |
| 27,150 | | Total Long-Term Care | | | 30,166,599 |
| | Tax Obligation/General – 11.6% (7.3% of Total Investments) | | | |
| 5,240 | | Huntington Beach Union High School District, Orange County, California, General | No Opt. Call | AA | 4,160,036 |
| | Obligation Bonds, Series 2005, 0.000%, 8/01/30 – AGM Insured | | | |
| 3,645 | | Maryland State, General Obligation Bonds, State and Local Facilities Loan, First Series | No Opt. Call | AAA | 4,097,928 |
| | 2017A, 5.000%, 3/15/23 | | | |
| 3,510 | | Montgomery County, Maryland, General Obligation Bonds, Refunding Consolidated Public | No Opt. Call | AAA | 3,758,297 |
| | Improvement Series 2017C, 5.000%, 10/01/21 | | | |
| 4,930 | | Patterson Joint Unified School District, Stanislaus County, California, General | No Opt. Call | AA | 2,537,224 |
| | Obligation Bonds, 2008 Election Series 2009B, 0.000%, 8/01/42 – AGM Insured | | | |
| | Prince George’s County, Maryland, General Obligation Consolidated Public Improvement | | | |
| | Bonds, Series 2014A: | | | |
| 3,000 | | 4.000%, 9/01/30 | 9/24 at 100.00 | AAA | 3,333,060 |
| 3,000 | | 4.000%, 9/01/31 | 9/24 at 100.00 | AAA | 3,326,520 |
| 14,985 | | San Ysidro School District, San Diego County, California, General Obligation Bonds, 1997 | No Opt. Call | AA | 7,724,618 |
| | Election Series 2012G, 0.000%, 8/01/40 – AGM Insured | | | |
| | Washington Suburban Sanitary District, Montgomery and Prince George’s Counties, | | | |
| | Maryland, General Obligation Bonds, Consolidated Public Improvement, Second Series 2016: | | | |
| 1,000 | | 5.000%, 6/01/27 | 6/26 at 100.00 | AAA | 1,225,600 |
| 2,000 | | 5.000%, 6/01/35 | 6/26 at 100.00 | AAA | 2,398,820 |
| 2,500 | | Washington Suburban Sanitary District, Montgomery and Prince George’s Counties, Maryland, | No Opt. Call | AAA | 3,002,550 |
| | General Obligation Bonds, Consolidated Public Improvement, Series 2017, 5.000%, 6/15/25 | | | |
| 2,500 | | Washington Suburban Sanitary District, Montgomery and Prince George’s Counties, Maryland, | 6/28 at 100.00 | AAA | 2,827,175 |
| | General Obligation Bonds, Consolidated Public Improvement, Series 2018, 4.000%, 6/01/39 | | | |
| 7,000 | | Wylie Independent School District, Collin County, Texas, General Obligation Bonds, | 8/25 at 35.55 | Aaa | 2,118,130 |
| | Capital Appreciation Series 2015, 0.000%, 8/15/50 | | | |
| 53,310 | | Total Tax Obligation/General | | | 40,509,958 |
| | Tax Obligation/Limited – 33.5% (21.2% of Total Investments) | | | |
| 1,000 | | Anne Arundel County, Maryland, General Obligation Bonds, Consolidated General | 10/29 at 100.00 | AAA | 1,254,160 |
| | Improvement, Series 2019, 5.000%, 10/01/44 | | | |
| 1,200 | | Anne Arundel County, Maryland, Special Tax District Revenue Bonds, Villages of | 7/23 at 100.00 | AA | 1,339,404 |
| | Dorchester & Farmington Village Projects, Series 2013, 5.000%, 7/01/32 | | | |
| 1,450 | | Baltimore, Maryland, Special Obligation Bonds, Center/West Development Project, Series | 6/26 at 100.00 | N/R | 1,542,611 |
| | 2017A, 5.500%, 6/01/43 | | | |
40
| | | | | | |
| Principal | | | Optional Call | | |
| Amount (000) | | Description (1) | Provisions (2) | Ratings (3) | Value |
| | Tax Obligation/Limited (continued) | | | |
| | Baltimore, Maryland, Special Obligation Bonds, Consolidated Tax Increment Financing, | | | |
| | Series 2015: | | | |
| $ 525 | | 5.000%, 6/15/30 | 6/24 at 100.00 | BBB+ | $ 591,775 |
| 425 | | 5.000%, 6/15/33 | 6/24 at 100.00 | BBB+ | 474,606 |
| | Baltimore, Maryland, Special Obligation Bonds, East Baltimore Research Park Project, | | | |
| | Series 2017A: | | | |
| 1,270 | | 4.500%, 9/01/33 | 9/27 at 100.00 | N/R | 1,373,340 |
| 240 | | 5.000%, 9/01/38 | 9/27 at 100.00 | N/R | 265,769 |
| | Baltimore, Maryland, Special Obligation Bonds, Harbor Point Project, Refunding Series 2016: | | | |
| 1,895 | | 5.000%, 6/01/36 | 6/26 at 100.00 | N/R | 2,020,297 |
| 250 | | 5.125%, 6/01/43 | 6/26 at 100.00 | N/R | 267,570 |
| 2,000 | | Baltimore, Maryland, Special Obligation Bonds, Harbor Point Project, Refunding Series | 6/29 at 100.00 | N/R | 2,012,800 |
| | 2019A, 3.625%, 6/01/46, 144A | | | |
| 350 | | Baltimore, Maryland, Special Obligation Bonds, Harbor Point Project, Refunding Series | 6/23 at 100.00 | N/R | 350,907 |
| | 2019B, 3.875%, 6/01/46, 144A | | | |
| | Brunswick, Frederick County, Maryland, Special Obligation Bonds, Brunswick Crossing | | | |
| | Special Taxing District, Refunding Series 2019: | | | |
| 450 | | 4.000%, 7/01/29 | 1/29 at 100.00 | N/R | 477,958 |
| 740 | | 5.000%, 7/01/36 | 1/29 at 100.00 | N/R | 827,498 |
| | Frederick County, Maryland, Lake Linganore Village Community Development Special | | | |
| | Obligation Bonds, Series 2001A: | | | |
| 21 | | 5.600%, 7/01/20 – RAAI Insured | 12/19 at 100.00 | AA | 21,072 |
| 450 | | 5.700%, 7/01/29 – RAAI Insured | 12/19 at 100.00 | AA | 451,548 |
| | Fredrick County, Maryland, Special Obligation Bonds, Urbana Community Development | | | |
| | Authority, Series 2010A: | | | |
| 5,340 | | 5.000%, 7/01/30 | 7/20 at 100.00 | A– | 5,451,072 |
| 2,350 | | 5.000%, 7/01/40 | 7/20 at 100.00 | A– | 2,394,767 |
| 2,000 | | Government of Guam, Business Privilege Tax Bonds, Refunding Series 2015D, | 11/25 at 100.00 | BB | 2,242,020 |
| | 5.000%, 11/15/34 | | | |
| | Government of Guam, Business Privilege Tax Bonds, Series 2011A: | | | |
| 500 | | 5.000%, 1/01/31 | 1/22 at 100.00 | BB | 524,280 |
| 1,000 | | 5.250%, 1/01/36 | 1/22 at 100.00 | BB | 1,051,760 |
| | Guam Government, Limited Obligation Section 30 Revenue Bonds, Series 2016A: | | | |
| 1,000 | | 5.000%, 12/01/23 | No Opt. Call | BB | 1,110,680 |
| 2,275 | | 5.000%, 12/01/32 | 12/26 at 100.00 | BB | 2,603,305 |
| 1,000 | | 5.000%, 12/01/33 | 12/26 at 100.00 | BB | 1,142,410 |
| 1,000 | | 5.000%, 12/01/36 | 12/26 at 100.00 | BB | 1,135,210 |
| 1,175 | | 5.000%, 12/01/46 | 12/26 at 100.00 | BB | 1,310,877 |
| 1,420 | | Howard County, Maryland, Special Obligation Bonds, Annapolis Junction Town Center | 2/24 at 100.00 | N/R | 1,476,218 |
| | Project, Series 2014, 6.100%, 2/15/44 | | | |
| | Howard County, Maryland, Special Obligation Bonds, Downtown Columbia Project, | | | |
| | Series 2017A: | | | |
| 1,500 | | 4.125%, 2/15/34, 144A | 2/26 at 100.00 | N/R | 1,585,200 |
| 1,550 | | 4.375%, 2/15/39, 144A | 2/26 at 100.00 | N/R | 1,644,457 |
| 850 | | 4.500%, 2/15/47, 144A | 2/26 at 100.00 | N/R | 899,393 |
| 1,260 | | Huntington Beach Union High School District, Orange County, California, Certificates of | No Opt. Call | AA | 832,583 |
| | Participation, Capital Project, Series 2007, 0.000%, 9/01/35 – AGM Insured | | | |
| | Hyattsville, Maryland, Special Obligation Bonds, University Town Center Project, Series 2016: | | | |
| 2,125 | | 5.000%, 7/01/31 | 7/25 at 100.00 | N/R | 2,248,739 |
| 1,640 | | 5.000%, 7/01/34 | 7/25 at 100.00 | N/R | 1,723,722 |
| 720 | | Maryland Community Development Administration, Local Government Infrastructure Bonds, | 6/29 at 100.00 | Aa3 | 791,446 |
| | Subordinate Obligation Series 2019B-2, 4.000%, 6/01/49 | | | |
41
| | |
| NMY | Nuveen Maryland Quality Municipal Income Fund |
| Portfolio of Investments (continued) |
| November 30, 2019 (Unaudited) |
| | | | | | |
| Principal | | | Optional Call | | |
| Amount (000) | | Description (1) | Provisions (2) | Ratings (3) | Value |
| | Tax Obligation/Limited (continued) | | | |
| | Maryland Economic Development Corporation, Special Obligation Bonds, Metro Centre Owings | | | |
| | Mills Project, Series 2017: | | | |
| $ 585 | | 4.375%, 7/01/36 | 1/27 at 100.00 | N/R | $ 614,958 |
| 355 | | 4.500%, 7/01/44 | 1/27 at 100.00 | N/R | 373,211 |
| | Maryland Stadium Authority, Lease Revenue Bonds, Baltimore City Public Schools | | | |
| | Construction & Revitalization Program, Series 2016: | | | |
| 4,395 | | 5.000%, 5/01/33 | 5/26 at 100.00 | AA | 5,227,677 |
| 3,650 | | 5.000%, 5/01/35 | 5/26 at 100.00 | AA | 4,325,943 |
| 5,100 | | 5.000%, 5/01/46 (UB) (6) | 5/26 at 100.00 | AA | 5,922,171 |
| | Maryland Stadium Authority, Lease Revenue Bonds, Baltimore City Public Schools | | | |
| | Construction & Revitalization Program, Series 2018A: | | | |
| 2,000 | | 5.000%, 5/01/35 | 5/28 at 100.00 | AA | 2,452,580 |
| 2,000 | | 5.000%, 5/01/36 (UB) (6) | 5/28 at 100.00 | AA | 2,446,200 |
| 6,250 | | 5.000%, 5/01/42 (UB) (6) | 5/28 at 100.00 | AA | 7,519,500 |
| 2,000 | | New Jersey Transportation Trust Fund Authority, Transportation System Bonds, Series | No Opt. Call | A– | 1,354,700 |
| | 2009A, 0.000%, 12/15/32 | | | |
| 320 | | Prince George’s County Revenue Authority, Maryland, Special Obligation Bonds, | 1/26 at 100.00 | N/R | 341,952 |
| | Suitland-Naylor Road Project, Series 2016, 5.000%, 7/01/46, 144A | | | |
| 4,500 | | Prince George’s County, Maryland, Certificates of Participation, University of Maryland | 10/28 at 100.00 | AA+ | 5,476,680 |
| | Capital Region Medical Center, Series 2018, 5.000%, 10/01/43 (UB) (6) | | | |
| 5,711 | | Prince George’s County, Maryland, Special Obligation Bonds, National Harbor Project, | 12/19 at 100.00 | N/R | 5,733,616 |
| | Series 2005, 5.200%, 7/01/34 | | | |
| | Prince George’s County, Maryland, Special Obligation Bonds, Westphalia Town Center | | | |
| | Project, Series 2018: | | | |
| 1,300 | | 5.125%, 7/01/39, 144A | 7/28 at 100.00 | N/R | 1,443,689 |
| 2,200 | | 5.250%, 7/01/48, 144A | 7/28 at 100.00 | N/R | 2,441,516 |
| 2,214 | | Prince George’s County, Maryland, Special Tax District Bonds, Victoria Falls Project, | 12/19 at 100.00 | N/R | 2,218,804 |
| | Series 2005, 5.250%, 7/01/35 | | | |
| 1,100 | | Puerto Rico Highway and Transportation Authority, Highway Revenue Bonds, Series 2007N, | No Opt. Call | C | 1,227,336 |
| | 5.500%, 7/01/29 – AMBAC Insured | | | |
| 2,100 | | Puerto Rico Municipal Finance Agency, Series 2002A, 5.250%, 8/01/21 – AGM Insured | 12/19 at 100.00 | AA | 2,137,695 |
| 1,100 | | Puerto Rico Public Finance Corporation, Commonwealth Appropriation Bonds, Series 1998A, | No Opt. Call | Aaa | 1,198,175 |
| | 5.125%, 6/01/24 – AMBAC Insured | | | |
| | Puerto Rico Sales Tax Financing Corporation, Sales Tax Revenue Bonds, Restructured 2018A-1: | | | |
| 53 | | 0.000%, 7/01/24 | No Opt. Call | N/R | 46,473 |
| 90 | | 0.000%, 7/01/27 | No Opt. Call | N/R | 71,701 |
| 88 | | 0.000%, 7/01/29 | 7/28 at 98.64 | N/R | 65,188 |
| 114 | | 0.000%, 7/01/31 | 7/28 at 91.88 | N/R | 78,048 |
| 128 | | 0.000%, 7/01/33 | 7/28 at 86.06 | N/R | 81,311 |
| 1,093 | | 4.500%, 7/01/34 | 7/25 at 100.00 | N/R | 1,168,319 |
| 2,097 | | 4.550%, 7/01/40 | 7/28 at 100.00 | N/R | 2,170,877 |
| 1,221 | | 0.000%, 7/01/46 | 7/28 at 41.38 | N/R | 322,796 |
| 995 | | 0.000%, 7/01/51 | 7/28 at 30.01 | N/R | 195,070 |
| 349 | | 4.750%, 7/01/53 | 7/28 at 100.00 | N/R | 361,163 |
| 1,882 | | 5.000%, 7/01/58 | 7/28 at 100.00 | N/R | 1,977,511 |
| | Puerto Rico Sales Tax Financing Corporation, Sales Tax Revenue Bonds, Taxable | | | |
| | Restructured Cofina Project Series 2019A-2: | | | |
| 1,500 | | 4.329%, 7/01/40 | 7/28 at 100.00 | N/R | 1,524,360 |
| 3 | | 4.536%, 7/01/53 | 7/28 at 100.00 | N/R | 3,048 |
| 50 | | 4.784%, 7/01/58 | 7/28 at 100.00 | N/R | 51,573 |
42
| | | | | | |
| Principal | | | Optional Call | | |
| Amount (000) | | Description (1) | Provisions (2) | Ratings (3) | Value |
| | Tax Obligation/Limited (continued) | | | |
| | Puerto Rico, Highway Revenue Bonds, Highway and Transportation Authority, Refunding | | | |
| | Series 2007CC: | | | |
| $ 765 | | 5.500%, 7/01/28 – NPFG Insured | No Opt. Call | Baa2 | $ 837,836 |
| 2,300 | | 5.500%, 7/01/30 – AGM Insured | No Opt. Call | AA | 2,639,250 |
| 1,800 | | Virgin Islands Public Finance Authority, Federal Highway Grant Anticipation Loan Note | 9/25 at 100.00 | A | 1,982,484 |
| | Revenue Bonds, Series 2015, 5.000%, 9/01/33, 144A | | | |
| 2,000 | | Virgin Islands Public Finance Authority, Gross Receipts Taxes Loan Note, Refunding | 12/19 at 100.00 | Baa2 | 2,032,320 |
| | Series 2006, 5.000%, 10/01/27 – FGIC Insured | | | |
| 2,240 | | Virgin Islands Public Finance Authority, Gross Receipts Taxes Loan Note, Working Capital | 10/24 at 100.00 | AA | 2,512,070 |
| | Series 2014A, 5.000%, 10/01/34 – AGM Insured, 144A | | | |
| 1,035 | | Virgin Islands Public Finance Authority, Matching Fund Loan Notes Revenue Bonds, Senior | 12/19 at 100.00 | AA | 1,056,870 |
| | Lien Series 2009A-1, 5.000%, 10/01/29 – AGM Insured | | | |
| 1,730 | | Virgin Islands Public Finance Authority, Matching Fund Loan Notes Revenue Bonds, Senior | No Opt. Call | AA | 1,885,838 |
| | Lien, Refunding Series 2013B, 5.000%, 10/01/24 – AGM Insured | | | |
| 109,384 | | Total Tax Obligation/Limited | | | 116,959,963 |
| | Transportation – 12.7% (8.0% of Total Investments) | | | |
| 60 | | Baltimore, Maryland, Revenue Refunding Bonds, Parking System Facilities, Series 1998A, | No Opt. Call | A1 | 62,553 |
| | 5.250%, 7/01/21 – FGIC Insured | | | |
| 125 | | Guam International Airport Authority, Revenue Bonds, Series 2013C, 6.375%, 10/01/43 (AMT) | 10/23 at 100.00 | BBB+ | 144,240 |
| | Guam Port Authority, Port Revenue Bonds, Private Activity Series 2018B: | | | |
| 510 | | 5.000%, 7/01/32 (AMT) | 7/28 at 100.00 | A | 611,261 |
| 355 | | 5.000%, 7/01/33 (AMT) | 7/28 at 100.00 | A | 424,445 |
| 600 | | Maryland Economic Development Corporation Economic Development Revenue Bonds, Terminal | 6/29 at 100.00 | Baa3 | 712,554 |
| | Project, Series 2019A, 5.000%, 6/01/49 (AMT) | | | |
| | Maryland Economic Development Corporation Economic Development Revenue Bonds, | | | |
| | Transportation Facilities Project, Refunding Series 2017A: | | | |
| 1,000 | | 5.000%, 6/01/31 | 6/28 at 100.00 | Baa3 | 1,214,250 |
| 1,125 | | 5.000%, 6/01/32 | 6/28 at 100.00 | Baa3 | 1,362,150 |
| 3,360 | | 5.000%, 6/01/35 | 6/28 at 100.00 | Baa3 | 4,047,926 |
| 1,500 | | Maryland Economic Development Corporation, Air Cargo Obligated Group Revenue Bonds, AFCO | 7/29 at 100.00 | BBB | 1,633,605 |
| | Airport Real Estate Group, Series 2019, 4.000%, 7/01/44 (AMT) | | | |
| | Maryland Economic Development Corporation, Parking Facilities Revenue Bonds Baltimore | | | |
| | City Project, Subordinate Parking Facilities Revenue Bonds, Series 2018C: | | | |
| 1,250 | | 4.000%, 6/01/48 | 6/28 at 100.00 | BBB– | 1,298,375 |
| 1,115 | | 4.000%, 6/01/58 | 6/28 at 100.00 | BBB– | 1,149,866 |
| 3,725 | | Maryland Economic Development Corporation, Parking Facilities Revenue Bonds, Baltimore | 6/28 at 100.00 | BBB | 4,145,701 |
| | City Project, Senior Parking Facilities Revenue Bonds, Series 2018A, 5.000%, 6/01/58 | | | |
| | Maryland Economic Development Corporation, Private Activity Revenue Bonds AP, Purple | | | |
| | Line Light Rail Project, Green Bonds, Series 2016D: | | | |
| 2,000 | | 5.000%, 9/30/28 (AMT) | 9/26 at 100.00 | BBB | 2,345,060 |
| 1,000 | | 5.000%, 9/30/31 (AMT) | 9/26 at 100.00 | BBB | 1,157,240 |
| 2,200 | | 5.000%, 3/31/41 (AMT) | 9/26 at 100.00 | BBB | 2,487,782 |
| 3,625 | | 5.000%, 3/31/46 (AMT) | 9/26 at 100.00 | BBB | 4,066,815 |
| 2,200 | | 5.000%, 3/31/51 (AMT) | 9/26 at 100.00 | BBB | 2,463,472 |
| | Maryland Health and Higher Educational Facilities Authority, Parking Facilities Revenue | | | |
| | Bonds, Johns Hopkins Hospital, Series 2001: | | | |
| 1,300 | | 5.000%, 7/01/27 – AMBAC Insured | 12/19 at 100.00 | N/R | 1,313,091 |
| 1,000 | | 5.000%, 7/01/34 – AMBAC Insured | 12/19 at 100.00 | N/R | 1,010,090 |
| 405 | | Maryland Health and Higher Educational Facilities Authority, Parking Facilities Revenue | 12/19 at 100.00 | N/R | 405,915 |
| | Bonds, Johns Hopkins Medical Institutions, Series 1996, 5.500%, 7/01/26 – AMBAC Insured | | | |
43
| | | | | | |
| NMY | | Nuveen Maryland Quality Municipal Income Fund | |
| | Portfolio of Investments (continued) | | | |
| | November 30, 2019 (Unaudited) | | | |
|
|
|
|
| Principal | | | Optional Call | | |
| Amount (000) | | Description (1) | Provisions (2) | Ratings (3) | Value |
| | Transportation (continued) | | | |
| | New York Transportation Development Corporation, New York, Special Facility Revenue Bonds, | | | |
| | American Airlines, Inc. John F Kennedy International Airport Project, Refunding Series 2016: | | | |
| $ 175 | | 5.000%, 8/01/26 (AMT) | 8/21 at 100.00 | BB | $ 183,549 |
| 680 | | 5.000%, 8/01/31 (AMT) | 8/21 at 100.00 | BB | 710,818 |
| 3,000 | | New York Transportation Development Corporation, Special Facilities Bonds, LaGuardia | 7/24 at 100.00 | BBB | 3,313,440 |
| | Airport Terminal B Redevelopment Project, Series 2016A, 5.000%, 7/01/46 (AMT) | | | |
| | Port Authority of New York and New Jersey, Special Project Bonds, JFK International Air | | | |
| | Terminal LLC, Sixth Series 1997: | | | |
| 10 | | 5.750%, 12/01/22 – NPFG Insured (AMT) | 12/19 at 100.00 | BBB+ | 10,448 |
| 70 | | 5.750%, 12/01/25 – NPFG Insured (AMT) | 12/19 at 100.00 | BBB+ | 72,673 |
| 1,000 | | Washington Metropolitan Area Transit Authority, District of Columbia, Gross Revenue | 7/27 at 100.00 | AA– | 1,224,400 |
| | Bonds, Refunding Crossover Series 2017A-2, 5.000%, 7/01/33 | | | |
| | Washington Metropolitan Area Transit Authority, District of Columbia, Gross Revenue | | | |
| | Bonds, Series 2017B: | | | |
| 1,500 | | 5.000%, 7/01/29 | 7/27 at 100.00 | AA– | 1,865,040 |
| 3,000 | | 5.000%, 7/01/42 | 7/27 at 100.00 | AA– | 3,590,040 |
| 1,000 | | Washington Metropolitan Area Transit Authority, District of Columbia, Gross Revenue | 7/27 at 100.00 | AA– | 1,206,380 |
| | Bonds, Series 2018, 5.000%, 7/01/38 | | | |
| 38,890 | | Total Transportation | | | 44,233,179 |
| | U.S. Guaranteed – 9.5% (6.0% of Total Investments) (7) | | | |
| | Baltimore, Maryland, General Obligation Bonds, Consolidated Public Improvements, | | | |
| | Series 2011A: | | | |
| 1,000 | | 5.000%, 10/15/29 (Pre-refunded 10/15/21) | 10/21 at 100.00 | AA | 1,072,430 |
| 1,200 | | 5.000%, 10/15/30 (Pre-refunded 10/15/21) | 10/21 at 100.00 | AA | 1,286,916 |
| 2,000 | | Baltimore, Maryland, Revenue Bonds, Water Projects, Refunding Series 1994A, 5.000%, | No Opt. Call | AA– | 2,237,140 |
| | 7/01/24 – FGIC Insured (ETM) | | | |
| 2,875 | | Baltimore, Maryland, Revenue Bonds, Water Projects, Refunding Series 1998A, 5.000%, | No Opt. Call | AA | 3,360,760 |
| | 7/01/28 – FGIC Insured (ETM) | | | |
| 5,895 | | Maryland Economic Development Corporation, Economic Development Revenue Bonds, | 6/20 at 100.00 | N/R | 6,028,581 |
| | Transportation Facilities Project, Series 2010A, 5.750%, 6/01/35 (Pre-refunded 6/01/20) | | | |
| 2,445 | | Maryland Health and Higher Educational Facilities Authority, Revenue Bonds Doctors | 7/20 at 100.00 | N/R | 2,510,428 |
| | Community Hospital, Refunding Series 2010, 5.750%, 7/01/38 (Pre-refunded 7/01/20) | | | |
| | Maryland Health and Higher Educational Facilities Authority, Revenue Bonds, Charlestown | | | |
| | Community Issue, Series 2010: | | | |
| 1,695 | | 6.125%, 1/01/30 (Pre-refunded 1/01/21) | 1/21 at 100.00 | N/R | 1,783,547 |
| 5,070 | | 6.250%, 1/01/45 (Pre-refunded 1/01/21) | 1/21 at 100.00 | N/R | 5,341,600 |
| 2,845 | | Maryland Health and Higher Educational Facilities Authority, Revenue Bonds, Helix | No Opt. Call | N/R | 3,295,676 |
| | Health, Series 1997, 5.000%, 7/01/27 – AMBAC Insured (ETM) | | | |
| 4,450 | | Maryland Health and Higher Educational Facilities Authority, Revenue Bonds, Johns Hopkins | 5/20 at 100.00 | AA– | 4,527,875 |
| | Health System Obligated Group Issue, Series 2010, 5.000%, 5/15/40 (Pre-refunded 5/15/20) | | | |
| | Maryland Health and Higher Educational Facilities Authority, Revenue Bonds, LifeBridge | | | |
| | Health System, Series 2011: | | | |
| 500 | | 5.750%, 7/01/31 (Pre-refunded 7/01/21) | 7/21 at 100.00 | A+ | 535,285 |
| 1,000 | | 6.000%, 7/01/41 (Pre-refunded 7/01/21) | 7/21 at 100.00 | A+ | 1,074,300 |
| 30,975 | | Total U.S. Guaranteed | | | 33,054,538 |
| | Utilities – 1.6% (1.0% of Total Investments) | | | |
| 2,000 | | Beaver County Industrial Development Authority, Pennsylvania, Pollution Control Revenue | No Opt. Call | N/R | 2,145,000 |
| | Refunding Bonds, FirstEnergy Nuclear Generation Project, Series 2006A, 4.375%, 1/01/35 | | | |
| | (Mandatory Put 7/01/22) (4) | | | |
| 1,250 | | Guam Power Authority, Revenue Bonds, Series 2012A, 5.000%, 10/01/30 – AGM Insured | 10/22 at 100.00 | AA | 1,364,162 |
44
| | | | | | |
| Principal | | | Optional Call | | |
| Amount (000) | | Description (1) | Provisions (2) | Ratings (3) | Value |
| | Utilities (continued) | | | |
| | Guam Power Authority, Revenue Bonds, Series 2014A: | | | |
| $ 600 | | 5.000%, 10/01/39 | 10/24 at 100.00 | AA | $ 676,938 |
| 575 | | 5.000%, 10/01/44 | 10/24 at 100.00 | AA | 644,955 |
| 730 | | Virgin Islands Water and Power Authority, Electric System Revenue Bonds, Refunding | 12/19 at 100.00 | CCC | 702,625 |
| | Series 2007A, 5.000%, 7/01/24 | | | |
| 5,155 | | Total Utilities | | | 5,533,680 |
| | Water and Sewer – 8.5% (5.4% of Total Investments) | | | |
| 2,480 | | Baltimore, Maryland, Project and Revenue Refunding Bonds, Water Projects, Series 2013B, | 1/24 at 100.00 | AA– | 2,801,507 |
| | 5.000%, 7/01/38 | | | |
| 1,000 | | Baltimore, Maryland, Revenue Bonds, Storm Water Projects, Series 2019A, 5.000%, 7/01/49 | 7/29 at 100.00 | Aa2 | 1,233,450 |
| 2,000 | | Baltimore, Maryland, Revenue Bonds, Wastewater Projects, Series 2011A, 5.000%, 7/01/41 | 7/21 at 100.00 | AA | 2,104,400 |
| 2,000 | | Baltimore, Maryland, Revenue Bonds, Wastewater Projects, Series 2019A, 5.000%, 7/01/49 | 7/29 at 100.00 | AA | 2,466,900 |
| | Baltimore, Maryland, Revenue Bonds, Wastewater Projects, Subordinate Series 2017A: | | | |
| 2,000 | | 5.000%, 7/01/46 | No Opt. Call | AA– | 2,365,720 |
| 2,000 | | 5.000%, 7/01/46 (UB) | 1/27 at 100.00 | AA– | 2,365,720 |
| 490 | | Baltimore, Maryland, Revenue Bonds, Water Projects, Refunding Series 1994A, 5.000%, | No Opt. Call | AA– | 520,184 |
| | 7/01/24 – FGIC Insured | | | |
| 2,500 | | Baltimore, Maryland, Revenue Bonds, Water Projects, Subordinate Series 2014A, | 1/25 at 100.00 | A+ | 2,854,325 |
| | 5.000%, 7/01/44 | | | |
| 6,000 | | Baltimore, Maryland, Revenue Bonds, Water Projects, Subordinate Series 2017A, | 1/27 at 100.00 | AA– | 7,150,440 |
| | 5.000%, 7/01/41 (UB) | | | |
| 1,300 | | Guam Government Waterworks Authority, Water and Wastewater System Revenue Bonds, | 7/24 at 100.00 | A– | 1,437,202 |
| | Refunding Series 2014A, 5.000%, 7/01/35 | | | |
| 1,240 | | Guam Government Waterworks Authority, Water and Wastewater System Revenue Bonds, | 7/27 at 100.00 | A– | 1,431,456 |
| | Refunding Series 2017, 5.000%, 7/01/40 | | | |
| 2,030 | | Guam Government Waterworks Authority, Water and Wastewater System Revenue Bonds, Series | 7/23 at 100.00 | A– | 2,225,773 |
| | 2013, 5.500%, 7/01/43 | | | |
| 245 | | Guam Government Waterworks Authority, Water and Wastewater System Revenue Bonds, Series | 7/26 at 100.00 | A– | 288,858 |
| | 2016, 5.000%, 7/01/27 | | | |
| 500 | | Puerto Rico Aqueduct and Sewerage Authority, Revenue Bonds, Senior Lien Series 2012A, | 7/22 at 100.00 | C | 533,125 |
| | 6.000%, 7/01/47 | | | |
| 25,785 | | Total Water and Sewer | | | 29,779,060 |
| $ 535,816 | | Total Long-Term Investments (cost $516,412,122) | | | 552,522,472 |
| | Floating Rate Obligations – (8.1)% | | | (28,405,000) |
| | Adjustable Rate MuniFund Term Preferred Shares, net of deferred offering costs – (52.1)% (8) | | | (181,819,390) |
| | Other Assets Less Liabilities – 1.8% | | | 6,477,005 |
| | Net Asset Applicable to Common Shares – 100% | | | $ 348,775,087 |
45
| | |
| NMY | Nuveen Maryland Quality Municipal Income Fund |
| Portfolio of Investments (continued) |
| November 30, 2019 (Unaudited) |
| | |
(1) | All percentages shown in the Portfolio of Investments are based on net assets applicable to common shares unless otherwise noted. |
(2) | Optional Call Provisions: Dates (month and year) and prices of the earliest optional call or redemption. There may be other call provisions at varying prices at later dates. Certain mortgage-backed securities may be subject to periodic principal paydowns. |
(3) | For financial reporting purposes, the ratings disclosed are the highest of Standard & Poor’s Group (“Standard & Poor’s”), Moody’s Investors Service, Inc. (“Moody’s”) or Fitch, Inc. (“Fitch”) rating. This treatment of split-rated securities may differ from that used for other purposes, such as for Fund investment policies. Ratings below BBB by Standard & Poor’s, Baa by Moody’s or BBB by Fitch are considered to be below investment grade. Holdings designated N/R are not rated by any of these national rating agencies. |
(4) | Defaulted security. A security whose issuer has failed to fully pay principal and/or interest when due, or is under the protection of bankruptcy. |
(5) | Effective February 12, 2019, the par value of the original bonds was replaced with taxable and tax exempt Puerto Rico Sales Tax Financing Corporation (commonly known as COFINA) bond units that are collateralized by a bundle of zero and coupon paying bonds. The quantity shown represents units in a trust, which were assigned according to the original bond’s accreted value. These securities do not have a stated coupon interest rate and income will be recognized through accretion of the discount associated with the trust units. The factor at which these units accrete can also decrease, primarily for principal payments generated from coupon payments received or dispositions of the underlying bond collateral. The quantity of units will not change as a result of these principal payments. |
(6) | Investment, or portion of investment, has been pledged to collateralize the net payment obligations for investments in inverse floating rate transactions. |
(7) | Backed by an escrow or trust containing sufficient U.S. Government or U.S. Government agency securities, which ensure the timely payment of principal and interest. |
(8) | Adjustable Rate MuniFund Term Preferred Shares, net of deferred offering cost as a percentage of Total Investments is 32.9%. |
144A | Investment is exempt from registration under Rule 144A of the Securities Act of 1933, as amended. These investments may only be resold in transactions exempt from registration, which are normally those transactions with qualified institutional buyers. |
AMT | Alternative Minimum Tax |
ETM | Escrowed to maturity |
UB | Underlying bond of an inverse floating rate trust reflected as a financing transaction. See Notes to Financial Statements, Note 4 – Portfolio Securities and Investments in Derivatives. Inverse Floating Rate Securities for more information. |
| See accompanying notes to financial statements. |
46
| | |
| NMT | Nuveen Massachusetts Quality Municipal |
| Income Fund |
| Portfolio of Investments |
| November 30, 2019 (Unaudited) |
| | | | | | |
| Principal | | | Optional Call | | |
| Amount (000) | | Description (1) | Provisions (2) | Ratings (3) | Value |
| | LONG-TERM INVESTMENTS – 151.1% (100.0% of Total Investments) | | | |
| | MUNICIPAL BONDS – 151.1% (100.0% of Total Investments) | | | |
| | Education and Civic Organizations – 44.1% (29.2% of Total Investments) | | | |
| $ 210 | | Lowell, Massachusetts, Collegiate Charter School Revenue Bonds, Series 2019, 5.000%, | 6/26 at 100.00 | N/R | $ 224,076 |
| | 6/15/49, (WI/DD, Settling 12/03/19) | | | |
| | Massachusetts Development Finance Agency, Revenue Bonds, Boston University, Tender | | | |
| | Option Bond Trust 2016-XG0070: | | | |
| 1,880 | | 14.960%, 10/01/48, 144A (IF) (4) | 10/23 at 100.00 | AA– | 2,713,366 |
| 575 | | 14.879%, 10/01/48, 144A (IF) (4) | 10/23 at 100.00 | AA– | 829,575 |
| 3,515 | | Massachusetts Development Finance Agency, Revenue Bonds, Berklee College of Music, | 10/26 at 100.00 | A | 4,178,316 |
| | Series 2016, 5.000%, 10/01/39 | | | |
| 2,200 | | Massachusetts Development Finance Agency, Revenue Bonds, Boston College, Series 2013S, | 7/23 at 100.00 | AA– | 2,456,388 |
| | 5.000%, 7/01/38 | | | |
| 730 | | Massachusetts Development Finance Agency, Revenue Bonds, Boston College, Series 2017T, | 7/27 at 100.00 | AA– | 877,533 |
| | 5.000%, 7/01/42 | | | |
| | Massachusetts Development Finance Agency, Revenue Bonds, Emerson College, Series 2017A: | | | |
| 2,000 | | 5.000%, 1/01/34 | 1/28 at 100.00 | BBB+ | 2,377,980 |
| 2,240 | | 5.000%, 1/01/37 | 1/28 at 100.00 | BBB+ | 2,642,192 |
| 1,955 | | Massachusetts Development Finance Agency, Revenue Bonds, Lesley University, Series 2016, | 7/26 at 100.00 | A– | 2,288,152 |
| | 5.000%, 7/01/35 | | | |
| | Massachusetts Development Finance Agency, Revenue Bonds, MCPHS University Issue, | | | |
| | Series 2015H: | | | |
| 450 | | 3.500%, 7/01/35 | 7/25 at 100.00 | AA | 472,505 |
| 190 | | 5.000%, 7/01/37 | 7/25 at 100.00 | AA | 220,322 |
| 1,200 | | Massachusetts Development Finance Agency, Revenue Bonds, Merrimack College, Series 2017, | 7/26 at 100.00 | BBB– | 1,348,524 |
| | 5.000%, 7/01/47 | | | |
| 550 | | Massachusetts Development Finance Agency, Revenue Bonds, Northeastern University, Series | 10/22 at 100.00 | A1 | 601,793 |
| | 2012, 5.000%, 10/01/31 | | | |
| | Massachusetts Development Finance Agency, Revenue Bonds, Northeastern University, | | | |
| | Series 2014A: | | | |
| 875 | | 5.000%, 3/01/39 | 3/24 at 100.00 | A1 | 993,991 |
| 1,400 | | 5.000%, 3/01/44 | 3/24 at 100.00 | A1 | 1,584,030 |
| 500 | | Massachusetts Development Finance Agency, Revenue Bonds, Simmons College, Series 2013J, | 10/23 at 100.00 | BBB+ | 555,555 |
| | 5.250%, 10/01/39 | | | |
| 1,230 | | Massachusetts Development Finance Agency, Revenue Bonds, Sterling and Francine Clark Art | 7/25 at 100.00 | AA | 1,449,666 |
| | Institute, Series 2015, 5.000%, 7/01/33 | | | |
| 450 | | Massachusetts Development Finance Agency, Revenue Bonds, Suffolk University, Refunding | 7/29 at 100.00 | Baa2 | 544,901 |
| | Series 2019, 5.000%, 7/01/36 | | | |
| | Massachusetts Development Finance Agency, Revenue Bonds, The Broad Institute, | | | |
| | Series 2017: | | | |
| 2,200 | | 5.000%, 4/01/35 | 10/27 at 100.00 | AA– | 2,713,062 |
| 1,250 | | 5.000%, 4/01/36 | 10/27 at 100.00 | AA– | 1,537,700 |
| 875 | | Massachusetts Development Finance Agency, Revenue Bonds, Tufts University, Series 2015Q, | 8/25 at 100.00 | Aa2 | 1,018,806 |
| | 5.000%, 8/15/38 | | | |
| 1,325 | | Massachusetts Development Finance Agency, Revenue Bonds, Wheaton College, Series 2017H, | 1/28 at 100.00 | A3 | 1,563,911 |
| | 5.000%, 1/01/42 | | | |
| 1,510 | | Massachusetts Development Finance Agency, Revenue Bonds, Woods Hole Oceanographic | 6/28 at 100.00 | AA– | 1,821,181 |
| | Institution, Series 2018, 5.000%, 6/01/43 | | | |
| 1,365 | | Massachusetts Development Finance Agency, Revenue Bonds, Worcester Polytechnic | 9/22 at 100.00 | A1 | 1,472,658 |
| | Institute, Series 2012, 5.000%, 9/01/50 | | | |
47
| | | | | |
| NMT | Nuveen Massachusetts Quality Municipal Income Fund |
| Portfolio of Investments (continued) | | | |
| November 30, 2019 (Unaudited) | | | |
|
|
|
|
| Principal | | | Optional Call | | |
| Amount (000) | | Description (1) | Provisions (2) | Ratings (3) | Value |
| | Education and Civic Organizations (continued) | | | |
| $ 840 | | Massachusetts Development Finance Agency, Revenue Bonds, Worcester Polytechnic | 9/26 at 100.00 | A1 | $ 999,180
|
| | Institute, Series 2016, 5.000%, 9/01/37 | | | |
| | Massachusetts Development Finance Agency, Revenue Bonds, Worcester Polytechnic | | | |
| | Institute, Series 2017: | | | |
| 550 | | 5.000%, 9/01/42 | 9/27 at 100.00 | A1 | 652,850 |
| 700 | | 5.000%, 9/01/47 | 9/27 at 100.00 | A1 | 825,804 |
| 2,500 | | Massachusetts Development Finance Agency, Revenue Bonds, Worcester Polytechnic | 9/27 at 100.00 | A1 | 2,967,500 |
| | Institute, Series 2017B, 5.000%, 9/01/42 | | | |
| 1,000 | | Massachusetts Development Finance Agency, Revenue Bonds, Worcester Polytechnic | 9/29 at 100.00 | A1 | 1,111,650 |
| | Institute, Series 2019, 4.000%, 9/01/44 | | | |
| 500 | | Massachusetts Development Finance Authority, Revenue Bonds, Suffolk University, | 7/27 at 100.00 | Baa2 | 586,825 |
| | Refunding Series 2017, 5.000%, 7/01/35 | | | |
| 3,000 | | Massachusetts Development Finance Authority, Revenue Bonds, WGBH Educational Foundation, | No Opt. Call | AA– | 4,445,520 |
| | Series 2002A, 5.750%, 1/01/42 – AMBAC Insured | | | |
| 2,495 | | Massachusetts Development Finance Authority, Revenue Bonds, WGBH Educational Foundation, | 7/26 at 100.00 | AA– | 2,939,983 |
| | Series 2016, 5.000%, 1/01/40 | | | |
| | Massachusetts Development Finance Authority, Revenue Refunding Bonds, Boston University, | | | |
| | Series 1999P: | | | |
| 1,090 | | 6.000%, 5/15/29 | No Opt. Call | Aa3 | 1,416,891 |
| 1,000 | | 6.000%, 5/15/59 | 5/29 at 105.00 | Aa3 | 1,317,000 |
| 350 | | Massachusetts Educational Financing Authority, Education Loan Revenue Bonds, Series | 7/21 at 100.00 | AA | 360,892 |
| | 2011J, 5.625%, 7/01/33 (AMT) | | | |
| 255 | | Massachusetts Health and Educational Facilities Authority, Revenue Bonds, Northeastern | 10/20 at 100.00 | A1 | 261,663 |
| | University, Series 2010A, 4.875%, 10/01/35 | | | |
| 2,000 | | University of Massachusetts Building Authority, Project Revenue Bonds, Senior Series | 11/24 at 100.00 | Aa2 | 2,298,240 |
| | 2014-1, 5.000%, 11/01/44 | | | |
| 4,000 | | University of Massachusetts Building Authority, Project Revenue Bonds, Senior Series | 11/25 at 100.00 | Aa2 | 4,699,680 |
| | 2015-1, 5.000%, 11/01/40 | | | |
| 50,955 | | Total Education and Civic Organizations | | | 61,369,861 |
| | Health Care – 31.8% (21.1% of Total Investments) | | | |
| 1,000 | | Massachusetts Development Finance Agency Revenue Bonds, Children?s Hospital Issue, | 10/24 at 100.00 | AA | 1,124,060 |
| | Series 2014P, 5.000%, 10/01/46 | | | |
| 1,340 | | Massachusetts Development Finance Agency Revenue Bonds, South Shore Hospital, Series | 7/26 at 100.00 | BBB+ | 1,531,258 |
| | 2016I, 5.000%, 7/01/41 | | | |
| 1,410 | | Massachusetts Development Finance Agency, Hospital Revenue Bonds, Cape Cod Healthcare | 11/23 at 100.00 | AA– | 1,565,297 |
| | Obligated Group, Series 2013, 5.250%, 11/15/41 | | | |
| 1,000 | | Massachusetts Development Finance Agency, Revenue Bonds, Baystate Medical Center Issue, | 7/24 at 100.00 | A+ | 1,116,820 |
| | Series 2014N, 5.000%, 7/01/44 | | | |
| | Massachusetts Development Finance Agency, Revenue Bonds, Berkshire Health Systems, | | | |
| | Series 2012G: | | | |
| 895 | | 5.000%, 10/01/29 | 10/21 at 100.00 | AA– | 953,819 |
| 700 | | 5.000%, 10/01/31 | 10/21 at 100.00 | AA– | 744,037 |
| 500 | | Massachusetts Development Finance Agency, Revenue Bonds, Boston Medical Center Issue, | 7/26 at 100.00 | BBB | 581,885 |
| | Series 2016E, 5.000%, 7/01/32 | | | |
| 1,675 | | Massachusetts Development Finance Agency, Revenue Bonds, CareGroup Issue, Refunding | 7/26 at 100.00 | A | 2,002,563 |
| | Series 2016-I, 5.000%, 7/01/30 | | | |
| | Massachusetts Development Finance Agency, Revenue Bonds, CareGroup Issue, Series 2015H-1: | | | |
| 900 | | 5.000%, 7/01/30 | 7/25 at 100.00 | A | 1,053,189 |
| 1,000 | | 5.000%, 7/01/32 | 7/25 at 100.00 | A | 1,164,330 |
| 500 | | 5.000%, 7/01/33 | 7/25 at 100.00 | A | 581,180 |
48
| | | | | | |
| Principal | | | Optional Call | | |
| Amount (000) | | Description (1) | Provisions (2) | Ratings (3) | Value |
| | Health Care (continued) | | | |
| | Massachusetts Development Finance Agency, Revenue Bonds, CareGroup Issue, Series 2018J-2: | | | |
| $ 1,500 | | 5.000%, 7/01/38 | 7/28 at 100.00 | A | $ 1,807,680 |
| 2,000 | | 5.000%, 7/01/43 | 7/28 at 100.00 | A | 2,367,580 |
| 1,000 | | Massachusetts Development Finance Agency, Revenue Bonds, Covenant Health System | 7/22 at 100.00 | BBB | 1,055,940 |
| | Obligated Group, Series 2012, 5.000%, 7/01/31 | | | |
| 2,800 | | Massachusetts Development Finance Agency, Revenue Bonds, Dana-Farber Cancer Institute | 12/26 at 100.00 | A1 | 3,273,032 |
| | Issue, Series 2016N, 5.000%, 12/01/46 | | | |
| 3,500 | | Massachusetts Development Finance Agency, Revenue Bonds, Lahey Health System Obligated | 8/25 at 100.00 | A | 3,988,495 |
| | Group Issue, Series 2015F, 5.000%, 8/15/45 | | | |
| 1,080 | | Massachusetts Development Finance Agency, Revenue Bonds, Milford Regional Medical Center | 7/23 at 100.00 | BB+ | 1,176,509 |
| | Issue, Series 2014F, 5.750%, 7/15/43 | | | |
| 3,450 | | Massachusetts Development Finance Agency, Revenue Bonds, Partners HealthCare System | 7/26 at 100.00 | AA– | 4,016,042 |
| | Issue, Series 2016Q, 5.000%, 7/01/47 | | | |
| | Massachusetts Development Finance Agency, Revenue Bonds, Partners HealthCare System | | | |
| | Issue, Series 2017S-1: | | | |
| 2,200 | | 5.000%, 7/01/37 | 1/28 at 100.00 | AA– | 2,670,822 |
| 2,100 | | 4.000%, 7/01/41 | 1/28 at 100.00 | AA– | 2,341,605 |
| 5 | | Massachusetts Development Finance Agency, Revenue Bonds, Partners HealthCare System, | 7/21 at 100.00 | AA– | 5,271 |
| | Series 2012L, 5.000%, 7/01/36 | | | |
| 820 | | Massachusetts Development Finance Agency, Revenue Bonds, Southcoast Health System | 7/23 at 100.00 | BBB+ | 899,015 |
| | Obligated Group Issue, Series 2013F, 5.000%, 7/01/37 | | | |
| | Massachusetts Development Finance Agency, Revenue Bonds, The Lowell General Hospital, | | | |
| | Series 2013G: | | | |
| 1,000 | | 5.000%, 7/01/37 | 7/23 at 100.00 | BBB+ | 1,105,810 |
| 2,200 | | 5.000%, 7/01/44 | 7/23 at 100.00 | BBB+ | 2,411,068 |
| 610 | | Massachusetts Development Finance Agency, Revenue Bonds, UMass Memorial Health Care | 1/27 at 100.00 | A– | 712,407 |
| | Obligated Group Issue, Series 2017K, 5.000%, 7/01/38 | | | |
| | Massachusetts Development Finance Agency, Revenue Bonds, UMass Memorial Health Care | | | |
| | Obligated Group Issue, Series 2017L: | | | |
| 400 | | 3.625%, 7/01/37 | 7/27 at 100.00 | A– | 422,248 |
| 1,095 | | 5.000%, 7/01/44 | 7/27 at 100.00 | A– | 1,274,131 |
| 445 | | Massachusetts Development Finance Agency, Revenue Bonds, UMass Memorial Health Care, | 7/26 at 100.00 | A– | 520,049 |
| | Series 2016I, 5.000%, 7/01/36 | | | |
| 25 | | Massachusetts Development Finance Agency, Revenue Bonds, UMass Memorial Health, Series | 7/21 at 100.00 | BBB+ | 26,565 |
| | 2011H, 5.500%, 7/01/31 | | | |
| 280 | | Massachusetts Development Finance Agency, Revenue Bonds, Wellforce Issue, Series 2019A, | 1/29 at 100.00 | BBB+ | 328,908 |
| | 5.000%, 7/01/44 | | | |
| 1,495 | | Massachusetts Health and Educational Facilities Authority, Revenue Bonds, Milford | 12/19 at 100.00 | BB+ | 1,508,799 |
| | Regional Medical Center, Series 2007E, 5.000%, 7/15/32 | | | |
| 38,925 | | Total Health Care | | | 44,330,414 |
| | Housing/Multifamily – 1.1% (0.7% of Total Investments) | | | |
| 495 | | Boston Housing Authority, Massachusetts, Capital Program Revenue Bonds, Series 2008, | 12/19 at 100.00 | AA | 500,500 |
| | 5.000%, 4/01/20 – AGM Insured | | | |
| 215 | | Massachusetts Housing Finance Agency, Housing Bonds, Series 2003H, 5.125%, 6/01/43 | 12/19 at 100.00 | AA | 217,866 |
| 745 | | Massachusetts Housing Finance Agency, Housing Bonds, Series 2019B-1, 3.100%, 12/01/44 | 12/28 at 100.00 | AA | 756,495 |
| 1,455 | | Total Housing/Multifamily | | | 1,474,861 |
| | Long-Term Care – 3.0% (2.0% of Total Investments) | | | |
| | Massachusetts Development Finance Agency Revenue Refunding Bonds, NewBridge on the | | | |
| | Charles, Inc Issue, Series 2017: | | | |
| 1,040 | | 4.125%, 10/01/42, 144A | 10/22 at 105.00 | BB+ | 1,092,863 |
| 250 | | 5.000%, 10/01/47, 144A | 10/22 at 105.00 | BB+ | 274,940 |
49
| | |
| NMT | Nuveen Massachusetts Quality Municipal Income Fund |
| Portfolio of Investments (continued) |
| November 30, 2019 (Unaudited) |
| | | | | | |
| Principal | | | Optional Call | | |
| Amount (000) | | Description (1) | Provisions (2) | Ratings (3) | Value |
| | Long-Term Care (continued) | | | |
| $ 460 | | Massachusetts Development Finance Agency, Revenue Bonds, Berkshire Retirement Community | 7/25 at 100.00 | A+ | $ 527,730 |
| | Lennox, Series 2015, 5.000%, 7/01/31 | | | |
| 1,000 | | Massachusetts Development Finance Agency, Revenue Bonds, Loomis Communities, Series | 1/23 at 100.00 | BBB | 1,099,500 |
| | 2013A, 5.250%, 1/01/26 | | | |
| 1,000 | | Massachusetts Development Finance Agency, Revenue Bonds, Orchard Cove, Inc, Refunding | 10/24 at 104.00 | BBB+ | 1,123,530 |
| | Series 2019, 5.000%, 10/01/49 | | | |
| 3,750 | | Total Long-Term Care | | | 4,118,563 |
| | Tax Obligation/General – 17.1% (11.3% of Total Investments) | | | |
| 1,250 | | Hudson, Massachusetts, General Obligation Bonds, Municipal Purpose Loan Series 2011, | 2/20 at 100.00 | AA | 1,258,675 |
| | 5.000%, 2/15/32 | | | |
| 640 | | Massachusetts Bay Transportation Authority, General Obligation Transportation System | No Opt. Call | Aa1 | 668,576 |
| | Bonds, Series 1991A, 7.000%, 3/01/21 | | | |
| 1,500 | | Massachusetts State, General Obligation Bonds, Consolidated Loan, Series 2004B, 5.250%, | No Opt. Call | Aa1 | 1,602,420 |
| | 8/01/21 – AGM Insured | | | |
| 2,000 | | Massachusetts State, General Obligation Bonds, Consolidated Loan, Series 2015C, | 7/25 at 100.00 | Aa1 | 2,315,720 |
| | 5.000%, 7/01/45 | | | |
| 3,895 | | Massachusetts State, General Obligation Bonds, Consolidated Loan, Series 2017F, | 11/27 at 100.00 | Aa1 | 4,672,364 |
| | 5.000%, 11/01/46 | | | |
| 4,000 | | Massachusetts State, General Obligation Bonds, Consolidated Loan, Series 2019A, | 1/29 at 100.00 | Aa1 | 5,018,360 |
| | 5.250%, 1/01/44 | | | |
| 1,775 | | North Reading, Massachusetts, General Obligation Bonds, Municipal Purpose Loan Series | 5/22 at 100.00 | Aa2 | 1,926,337 |
| | 2012, 5.000%, 5/15/35 | | | |
| 880 | | Norwell, Massachusetts, General Obligation Bonds, Series 2003, 5.000%, 11/15/20 – | No Opt. Call | AAA | 912,173 |
| | FGIC Insured | | | |
| 1,950 | | Pentucket Regional School District, Massachusetts, General Obligation Bonds, Series | 9/27 at 100.00 | Aa2 | 1,976,266 |
| | 2019, 3.000%, 9/01/42 | | | |
| | Quincy, Massachusetts, General Obligation Bonds, State Qualified Municipal Purpose Loan | | | |
| | Series 2011: | | | |
| 1,280 | | 5.125%, 12/01/33 | 12/20 at 100.00 | Aa2 | 1,329,126 |
| 2,000 | | 5.250%, 12/01/38 | 12/20 at 100.00 | Aa2 | 2,078,420 |
| 21,170 | | Total Tax Obligation/General | | | 23,758,437 |
| | Tax Obligation/Limited – 20.1% (13.3% of Total Investments) | | | |
| | Government of Guam, Business Privilege Tax Bonds, Series 2011A: | | | |
| 2,000 | | 5.250%, 1/01/36 | 1/22 at 100.00 | BB | 2,103,520 |
| 1,310 | | 5.125%, 1/01/42 | 1/22 at 100.00 | BB | 1,367,286 |
| | Government of Guam, Business Privilege Tax Bonds, Series 2012B-1: | | | |
| 400 | | 5.000%, 1/01/37 | 1/22 at 100.00 | BB | 417,568 |
| 1,115 | | 5.000%, 1/01/42 | 1/22 at 100.00 | BB | 1,159,823 |
| 855 | | Martha’s Vineyard Land Bank, Massachusetts, Revenue Bonds, Refunding Green Series 2014, | 11/24 at 100.00 | AA | 992,553 |
| | 5.000%, 5/01/33 – BAM Insured | | | |
| 500 | | Martha’s Vineyard Land Bank, Massachusetts, Revenue Bonds, Refunding Green Series 2017, | 5/27 at 100.00 | AA | 604,890 |
| | 5.000%, 5/01/35 | | | |
| 1,000 | | Massachusetts Bay Transportation Authority, Assessment Bonds, Series 2012A, | 7/22 at 100.00 | AAA | 1,087,180 |
| | 5.000%, 7/01/41 | | | |
| 770 | | Massachusetts Bay Transportation Authority, Sales Tax Revenue Bonds, Refunding Senior | No Opt. Call | AA | 819,842 |
| | Lien Series 2004C, 5.250%, 7/01/21 | | | |
| 1,610 | | Massachusetts College Building Authority, Project Revenue Bonds, Green Series 2014B, | 5/24 at 100.00 | Aa2 | 1,809,044 |
| | 5.000%, 5/01/44 | | | |
| 1,000 | | Massachusetts College Building Authority, Project Revenue Bonds, Refunding Series 2003B, | No Opt. Call | Aa2 | 1,140,650 |
| | 5.375%, 5/01/23 – SYNCORA GTY Insured | | | |
50
| | | | | | |
| Principal | | | Optional Call | | |
| Amount (000) | | Description (1) | Provisions (2) | Ratings (3) | Value |
| | Tax Obligation/Limited (continued) | | | |
| $ 1,350 | | Massachusetts School Building Authority, Dedicated Sales Tax Revenue Bonds, Senior | 8/25 at 100.00 | AAA | $ 1,587,681 |
| | Refunding Series 2015C, 5.000%, 8/15/37 | | | |
| 1,875 | | Massachusetts School Building Authority, Dedicated Sales Tax Revenue Bonds, Senior | 5/23 at 100.00 | AAA | 2,090,213 |
| | Series 2013A, 5.000%, 5/15/38 | | | |
| 2,000 | | Massachusetts School Building Authority, Dedicated Sales Tax Revenue Bonds, Subordinated | 2/28 at 100.00 | AA+ | 2,456,480 |
| | Series 2018A, 5.250%, 2/15/48 | | | |
| 1,500 | | Massachusetts School Building Authority, Dedicated Sales Tax Revenue Bonds, Subordinated | 2/29 at 100.00 | AA+ | 1,843,800 |
| | Series 2019A, 5.000%, 2/15/44 | | | |
| 1,070 | | Massachusetts State, Special Obligation Dedicated Tax Revenue Bonds, Refunding Series | No Opt. Call | A1 | 1,073,199 |
| | 2005, 5.000%, 1/01/20 – FGIC Insured | | | |
| 1,500 | | Massachusetts State, Transportation Fund Revenue Bonds, Rail Enhancement Program, Series | 6/25 at 100.00 | AA+ | 1,748,895 |
| | 2015A, 5.000%, 6/01/45 | | | |
| | Puerto Rico Sales Tax Financing Corporation, Sales Tax Revenue Bonds, Restructured 2018A-1: | | | |
| 863 | | 4.550%, 7/01/40 | 7/28 at 100.00 | N/R | 893,404 |
| 4,845 | | 0.000%, 7/01/51 | 7/28 at 30.01 | N/R | 949,862 |
| 1,259 | | 5.000%, 7/01/58 | 7/28 at 100.00 | N/R | 1,322,894 |
| 775 | | Puerto Rico Sales Tax Financing Corporation, Sales Tax Revenue Bonds, Taxable | 7/28 at 100.00 | N/R | 799,382 |
| | Restructured Cofina Project Series 2019A-2, 4.784%, 7/01/58 | | | |
| 520 | | Virgin Islands Public Finance Authority, Gross Receipts Taxes Loan Note, Refunding | 10/22 at 100.00 | AA | 566,368 |
| | Series 2012A, 5.000%, 10/01/32 – AGM Insured | | | |
| 1,000 | | Virgin Islands Public Finance Authority, Matching Fund Loan Notes Revenue Bonds, Series | 10/22 at 100.00 | AA | 1,089,170 |
| | 2012A, 5.000%, 10/01/32 – AGM Insured | | | |
| 29,117 | | Total Tax Obligation/Limited | | | 27,923,704 |
| | Transportation – 9.5% (6.3% of Total Investments) | | | |
| 400 | | Massachusetts Department of Transportation, Metropolitan Highway System Revenue Bonds, | 1/20 at 100.00 | AA+ | 401,208 |
| | Commonwealth Contract Assistance Secured, Series 2010B, 5.000%, 1/01/35 | | | |
| 2,500 | | Massachusetts Port Authority, Revenue Bonds, Refunding Series 2017A, 5.000%, | 7/27 at 100.00 | AA | 2,935,025 |
| | 7/01/47 (AMT) | | | |
| 1,000 | | Massachusetts Port Authority, Revenue Bonds, Series 2010A, 5.000%, 7/01/30 | 7/20 at 100.00 | AA | 1,021,630 |
| 1,000 | | Massachusetts Port Authority, Revenue Bonds, Series 2012B, 5.000%, 7/01/33 | 7/22 at 100.00 | AA | 1,089,310 |
| | Massachusetts Port Authority, Revenue Bonds, Series 2014A: | | | |
| 1,000 | | 5.000%, 7/01/39 | 7/24 at 100.00 | AA | 1,145,300 |
| 2,500 | | 5.000%, 7/01/44 | 7/24 at 100.00 | AA | 2,850,400 |
| | Massachusetts Port Authority, Revenue Bonds, Series 2015A: | | | |
| 715 | | 5.000%, 7/01/40 | 7/25 at 100.00 | AA | 832,989 |
| 1,000 | | 5.000%, 7/01/45 | 7/25 at 100.00 | AA | 1,157,290 |
| 1,000 | | Massachusetts Port Authority, Special Facilities Revenue Bonds, BOSFUEL Corporation, | 7/29 at 100.00 | A1 | 1,094,320 |
| | Series 2019A, 4.000%, 7/01/44 (AMT) | | | |
| 730 | | Metropolitan Boston Transit Parking Corporation, Massachusetts, Systemwide Parking | 7/21 at 100.00 | A+ | 769,391 |
| | Revenue Bonds, Senior Lien Series 2011, 5.000%, 7/01/41 | | | |
| 11,845 | | Total Transportation | | | 13,296,863 |
| | U.S. Guaranteed – 15.6% (10.3% of Total Investments) (5) | | | |
| 2,580 | | Guam Power Authority, Revenue Bonds, Series 2010A, 5.000%, 10/01/37 (Pre-refunded | 10/20 at 100.00 | AA | 2,662,870 |
| | 10/01/20) – AGM Insured | | | |
| 2,000 | | Hampden-Wilbraham Regional School District, Hampden County, Massachusetts, General | 2/21 at 100.00 | Aa3 | 2,093,440 |
| | Obligation Bonds, Series 2011, 5.000%, 2/15/41 (Pre-refunded 2/15/21) | | | |
| 855 | | Massachusetts College Building Authority, Revenue Bonds, Refunding Series 2012B, 5.000%, | 5/22 at 100.00 | Aa2 | 933,472 |
| | 5/01/37 (Pre-refunded 5/01/22) | | | |
| | Massachusetts Development Finance Agency, Revenue Bonds, Emerson College, Series 2010A: | | | |
| 1,275 | | 5.000%, 1/01/40 (Pre-refunded 1/01/20) | 1/20 at 100.00 | N/R | 1,278,901 |
| 125 | | 5.000%, 1/01/40 (Pre-refunded 1/01/20) | 1/20 at 100.00 | BBB+ | 125,383 |
51
| | |
| NMT | Nuveen Massachusetts Quality Municipal Income Fund |
| Portfolio of Investments (continued) |
| November 30, 2019 (Unaudited) |
| | | | | | |
| Principal | | | Optional Call | | |
| Amount (000) | | Description (1) | Provisions (2) | Ratings (3) | Value |
| | U.S. Guaranteed (5) (continued) | | | |
| $ 2,150 | | Massachusetts Development Finance Agency, Revenue Bonds, Lesley University, Series | 7/21 at 100.00 | AA | $ 2,288,460 |
| | 2011B-1, 5.250%, 7/01/33 (Pre-refunded 7/01/21) – AGM Insured | | | |
| 434 | | Massachusetts Development Finance Agency, Revenue Bonds, North Hill Communities Issue, | 11/23 at 100.00 | N/R | 504,182 |
| | Series 2013A, 6.250%, 11/15/28 (Pre-refunded 11/15/23), 144A | | | |
| 2,200 | | Massachusetts Development Finance Agency, Revenue Bonds, Partners HealthCare System, | 7/20 at 100.00 | AA– | 2,253,482 |
| | Series 2011K-6, 5.375%, 7/01/41 (Pre-refunded 7/01/20) | | | |
| 995 | | Massachusetts Development Finance Agency, Revenue Bonds, Partners HealthCare System, | 7/21 at 100.00 | N/R | 1,055,197 |
| | Series 2012L, 5.000%, 7/01/36 (Pre-refunded 7/01/21) | | | |
| 1,000 | | Massachusetts Development Finance Agency, Revenue Bonds, Sterling and Francine Clark Art | 7/21 at 100.00 | AA | 1,060,500 |
| | Institute, Series 2011A, 5.000%, 7/01/41 (Pre-refunded 7/01/21) | | | |
| 3,000 | | Massachusetts Development Finance Agency, Revenue Bonds, The Broad Institute, Series | 4/21 at 100.00 | Aa3 | 3,164,850 |
| | 2011A, 5.250%, 4/01/37 (Pre-refunded 4/01/21) | | | |
| 475 | | Massachusetts Development Finance Agency, Revenue Bonds, UMass Memorial Health, Series | 7/21 at 100.00 | N/R | 507,442 |
| | 2011H, 5.500%, 7/01/31 (Pre-refunded 7/01/21) | | | |
| 410 | | Massachusetts Health and Educational Facilities Authority, Revenue Bonds, CareGroup Inc, | 7/21 at 100.00 | N/R | 430,180 |
| | Series 1998A, 5.000%, 7/01/25 (Pre-refunded 7/01/21) – NPFG Insured | | | |
| 1,000 | | Massachusetts School Building Authority, Dedicated Sales Tax Revenue Bonds, Series | 10/21 at 100.00 | AAA | 1,072,430 |
| | 2011B, 5.000%, 10/15/41 (Pre-refunded 10/15/21) | | | |
| 1,500 | | Massachusetts State, Transportation Fund Revenue Bonds, Rail Enhancement Program, Series | 6/21 at 100.00 | AA+ | 1,587,165 |
| | 2013A, 5.000%, 6/01/38 (Pre-refunded 6/01/21) | | | |
| 720 | | Springfield Water and Sewer Commission, Massachusetts, General Revenue Bonds, Refunding | 11/20 at 100.00 | AA | 746,669 |
| | Series 2010B, 5.000%, 11/15/30 (Pre-refunded 11/15/20) – AGC Insured | | | |
| 20,719 | | Total U.S. Guaranteed | | | 21,764,623 |
| | Utilities – 1.0% (0.7% of Total Investments) | | | |
| 1,265 | | Massachusetts Clean Energy Cooperative Corporation, Revenue Bonds, Massachusetts | 7/23 at 100.00 | AA– | 1,421,835 |
| | Municipal Lighting Plant Cooperative, Series 2013, 5.000%, 7/01/32 | | | |
| | Water and Sewer – 7.8% (5.1% of Total Investments) | | | |
| 565 | | Guam Government Waterworks Authority, Water and Wastewater System Revenue Bonds, | 7/24 at 100.00 | A– | 632,489 |
| | Refunding Series 2014A, 5.000%, 7/01/29 | | | |
| 1,250 | | Guam Government Waterworks Authority, Water and Wastewater System Revenue Bonds, | 7/27 at 100.00 | A– | 1,452,788 |
| | Refunding Series 2017, 5.000%, 7/01/37 | | | |
| 420 | | Guam Government Waterworks Authority, Water and Wastewater System Revenue Bonds, Series | 7/26 at 100.00 | A– | 473,403 |
| | 2016, 5.000%, 1/01/46 | | | |
| 415 | | Lynn Water and Sewer Commission, Massachusetts, General Revenue Bonds, Series 2003A, | 12/19 at 100.00 | A1 | 416,212 |
| | 5.000%, 12/01/32 – NPFG Insured | | | |
| 1,000 | | Massachusetts Clean Water Trust, State Revolving Fund Bonds, Green 18 Series 2015, | 2/24 at 100.00 | AAA | 1,126,830 |
| | 5.000%, 2/01/45 | | | |
| 60 | | Massachusetts Water Pollution Abatement Trust, Pooled Loan Program Bonds, Series 2003-9, | 12/19 at 100.00 | AAA | 60,175 |
| | 5.000%, 8/01/22 | | | |
| 140 | | Massachusetts Water Pollution Abatement Trust, Revenue Bonds, MWRA Loan Program, Series | 12/19 at 100.00 | AAA | 140,435 |
| | 2002A, 5.250%, 8/01/20 | | | |
| 500 | | Massachusetts Water Resources Authority, General Revenue Bonds, Refunding Series 2016B, | 8/26 at 100.00 | AA+ | 596,780 |
| | 5.000%, 8/01/40 | | | |
| 1,230 | | Massachusetts Water Resources Authority, General Revenue Bonds, Series 2017B, | 8/27 at 100.00 | AA+ | 1,486,701 |
| | 5.000%, 8/01/42 | | | |
| 2,000 | | Massachusetts Water Resources Authority, General Revenue Bonds, Series 2019B, | 8/29 at 100.00 | AA+ | 2,489,260 |
| | 5.000%, 8/01/44 | | | |
| 1,000 | | Springfield Water and Sewer Commission, Massachusetts, General Revenue Bonds, Series | 4/27 at 100.00 | AA | 1,213,390 |
| | 2017C, 5.000%, 4/15/37 | | | |
52
| | | | | | |
| Principal | | | Optional Call | | |
| Amount (000) | | Description (1) | Provisions (2) | Ratings (3) | Value |
| | Water and Sewer (continued) | | | |
| $ 635 | | Springfield Water and Sewer Commission, Massachusetts, General Revenue Bonds, Series | 4/29 at 100.00 | AA | $ 723,240 |
| | 2019E, 4.000%, 4/15/38 | | | |
| 9,215 | | Total Water and Sewer | | | 10,811,703 |
| $ 188,416 | | Total Long-Term Investments (cost $195,366,628) | | | 210,270,864 |
| | Variable Rate Demand Preferred Shares, net of deferred offering costs – (53.0)% (6) | | | (73,734,155) |
| | Other Assets Less Liabilities – 1.9% | | | 2,612,237 |
| | Net Asset Applicable to Common Shares – 100% | | | $ 139,148,946 |
| | |
(1) | All percentages shown in the Portfolio of Investments are based on net assets applicable to common shares unless otherwise noted. |
(2) | Optional Call Provisions: Dates (month and year) and prices of the earliest optional call or redemption. There may be other call provisions at varying prices at later dates. Certain mortgage-backed securities may be subject to periodic principal paydowns. |
(3) | For financial reporting purposes, the ratings disclosed are the highest of Standard & Poor’s Group (“Standard & Poor’s”), Moody’s Investors Service, Inc. (“Moody’s”) or Fitch, Inc. (“Fitch”) rating. This treatment of split-rated securities may differ from that used for other purposes, such as for Fund investment policies. Ratings below BBB by Standard & Poor’s, Baa by Moody’s or BBB by Fitch are considered to be below investment grade. Holdings designated N/R are not rated by any of these national rating agencies. |
(4) | Investment, or portion of investment, has been pledged to collateralize the net payment obligations for investments in inverse floating rate transactions. |
(5) | Backed by an escrow or trust containing sufficient U.S. Government or U.S. Government agency securities, which ensure the timely payment of principal and interest. |
(6) | Variable Rate Demand Preferred Shares, net of deferred offering costs as a percentage of Total Investments is 35.1%. |
144A | Investment is exempt from registration under Rule 144A of the Securities Act of 1933, as amended. These investments may only be resold in transactions exempt from registration, which are normally those transactions with qualified institutional buyers. |
AMT | Alternative Minimum Tax |
IF | Inverse floating rate security issued by a tender option bond (“TOB”) trust, the interest rate on which varies inversely with the Securities Industry Financial Markets Association (SIFMA) short-term rate, which resets weekly, or a similar short-term rate, and is reduced by the expenses related to the TOB trust. |
WI/DD | Purchased on a when-issued or delayed delivery basis. |
| See accompanying notes to financial statements. |
53
| | |
| NMS | Nuveen Minnesota Quality Municipal |
| Income Fund |
| Portfolio of Investments |
| November 30, 2019 (Unaudited) |
| | | | | | |
| Principal | | | Optional Call | | |
| Amount (000) | | Description (1) | Provisions (2) | Ratings (3) | Value |
| | LONG-TERM INVESTMENTS – 155.9% (98.5% of Total Investments) | | | |
| | MUNICIPAL BONDS – 155.9% (98.5% of Total Investments) | | | |
| | Consumer Staples – 0.8% (0.5% of Total Investments) | | | |
| $ 700 | | Moorhead, Minnesota, Recovery Zone Facility Revenue Bonds, American Crystal Sugar | 6/20 at 100.00 | BBB+ | $ 710,906 |
| | Company Project, Series 2010, 5.650%, 6/01/27 | | | |
| | Education and Civic Organizations – 30.5% (19.3% of Total Investments) | | | |
| 50 | | City of Ham Lake, Minnesota, Charter School Lease Revenue Bonds, DaVinci Academy | 7/24 at 102.00 | N/R | 53,209 |
| | Project, Series 2016A, 5.000%, 7/01/36 | | | |
| 500 | | City of Ham Lake, Minnesota, Charter School Lease Revenue Bonds, DaVinci Academy | 7/24 at 102.00 | N/R | 515,750 |
| | Project,Series 2016A, 4.000%, 7/01/28 | | | |
| 830 | | City of Woodbury, Minnesota, Charter School Lease Revenue Bonds, Math and Science | 12/20 at 102.00 | BBB– | 861,457 |
| | Academy Building Company, Series 2012A, 5.000%, 12/01/43 | | | |
| 250 | | Deephaven, Minnesota, Charter School Lease Revenue Bonds, Eagle Ridge Academy Project, | 7/25 at 100.00 | BB+ | 271,195 |
| | Series 2015A, 5.250%, 7/01/40 | | | |
| 570 | | Forest Lake, Minnesota, Charter School Lease Revenue Bonds, Lakes International Language | 8/22 at 102.00 | BB+ | 610,265 |
| | Academy, Series 2014A, 5.750%, 8/01/44 | | | |
| 750 | | Forest Lake, Minnesota, Charter School Lease Revenue Bonds, Lakes International Language | 8/27 at 102.00 | BB+ | 828,143 |
| | Academy, Series 2019A, 5.250%, 8/01/43 | | | |
| 100 | | Greenwood, Minnesota, Charter School Lease Revenue Bonds, Main Street School of | 7/26 at 100.00 | N/R | 101,960 |
| | Performing Arts Project, Series 2016A, 5.000%, 7/01/47 | | | |
| 2,200 | | Hugo, Minnesota, Charter School Lease Revenue Bonds, Noble Academy Project, Series | 7/24 at 100.00 | BB+ | 2,308,020 |
| | 2014A, 5.000%, 7/01/44 | | | |
| 1,575 | | Independence, Minnesota, Charter School Lease Revenue Bonds, Beacon Academy Project, | 7/26 at 100.00 | N/R | 1,623,415 |
| | Series 2016A, 5.000%, 7/01/46 | | | |
| | Minneapolis, Minnesota, Charter School Lease Revenue Bonds, Yinghua Academy Project, | | | |
| | Series 2013A: | | | |
| 300 | | 6.000%, 7/01/33 | 7/23 at 100.00 | BB+ | 327,327 |
| 1,425 | | 6.000%, 7/01/43 | 7/23 at 100.00 | BB+ | 1,534,825 |
| | Minnesota Higher Education Facilities Authority, Revenue Bonds, Bethel University, | | | |
| | Refunding Series 2017: | | | |
| 750 | | 5.000%, 5/01/37 | 5/27 at 100.00 | BBB– | 867,000 |
| 2,000 | | 5.000%, 5/01/47 | 5/27 at 100.00 | BBB– | 2,271,500 |
| 1,580 | | Minnesota Higher Education Facilities Authority, Revenue Bonds, Carleton College, | 3/27 at 100.00 | Aa2 | 1,754,590 |
| | Refunding Series 2017, 4.000%, 3/01/42 | | | |
| 1,000 | | Minnesota Higher Education Facilities Authority, Revenue Bonds, College of Saint | 12/29 at 100.00 | Baa2 | 1,100,890 |
| | Scholastica, Inc, Refunding Series 2019, 4.000%, 12/01/40 | | | |
| 305 | | Minnesota Higher Education Facilities Authority, Revenue Bonds, College of St Benedict, | 3/26 at 100.00 | Baa1 | 320,866 |
| | Series 2016-8K, 4.000%, 3/01/43 | | | |
| 600 | | Minnesota Higher Education Facilities Authority, Revenue Bonds, Macalester College, | 3/27 at 100.00 | Aa3 | 655,380 |
| | Refunding Series 2017, 4.000%, 3/01/48 | | | |
| 225 | | Minnesota Higher Education Facilities Authority, Revenue Bonds, Saint Catherine | 10/28 at 100.00 | Baa1 | 261,371 |
| | University, Refunding Series 2018A, 5.000%, 10/01/45 | | | |
| 770 | | Minnesota Higher Education Facilities Authority, Revenue Bonds, University of Saint | 10/29 at 100.00 | A2 | 951,281 |
| | Thomas, Series 2019, 5.000%, 10/01/40 | | | |
| 705 | | Otsego, Minnesota, Charter School Lease Revenue Bonds, Kaleidoscope Charter School | 9/24 at 100.00 | BB– | 731,445 |
| | Project, Series 2014A, 5.000%, 9/01/44 | | | |
| 450 | | Ramsey, Anoka County, Minnesota, Lease Revenue Bonds, PACT Charter School Project, | 12/21 at 100.00 | BBB– | 473,963 |
| | Series 2004A, 5.500%, 12/01/33 | | | |
54
| | | | | | |
| Principal | | | Optional Call | | |
| Amount (000) | | Description (1) | Provisions (2) | Ratings (3) | Value |
| | Education and Civic Organizations (continued) | | | |
| $ 300 | | Rice County, Minnesota Educational Facility Revenue Bonds, Shattuck Saint Mary’s School | No Opt. Call | BB+ | $ 314,808 |
| | Project, Series 2015, 5.000%, 8/01/22, 144A | | | |
| 1,250 | | Saint Paul Housing & Redevelopment Authority, Minnesota, Charter School Lease Revenue | 12/29 at 100.00 | BBB– | 1,297,037 |
| | Bonds, Community of Peace Academy Project, Series 2019, 4.000%, 12/01/49 | | | |
| 500 | | Saint Paul Housing & Redevelopment Authority, Minnesota, Charter School Lease Revenue | 9/20 at 101.00 | BB+ | 511,590 |
| | Bonds, Hmong Education Reform Company, Series 2012A, 5.250%, 9/01/32 | | | |
| 1,100 | | Saint Paul Housing & Redevelopment Authority, Minnesota, Charter School Lease Revenue | 9/21 at 100.00 | BBB– | 1,176,406 |
| | Bonds, Nova Classical Academy, Series 2011A, 6.375%, 9/01/31 | | | |
| | Saint Paul Housing & Redevelopment Authority, Minnesota, Charter School Lease Revenue | | | |
| | Bonds, Twin Cities Academy Project, Series 2015A: | | | |
| 360 | | 5.300%, 7/01/45 | 7/25 at 100.00 | BB | 387,652 |
| 510 | | 5.375%, 7/01/50 | 7/25 at 100.00 | BB | 549,749 |
| 1,680 | | Saint Paul Housing & Redevelopment Authority, Minnesota, Charter School Lease Revenue | 7/23 at 100.00 | BB+ | 1,768,049 |
| | Bonds, Twin Cities German Immersion School, Series 2013A, 5.000%, 7/01/44 | | | |
| 800 | | Saint Paul Housing and Redevelopment Authority, Minnesota, Charter School Revenue Bonds, | 12/22 at 100.00 | BBB– | 836,888 |
| | Higher Ground Academy Charter School, Series 2013A, 5.000%, 12/01/33 | | | |
| 390 | | Saint Paul Housing and Redevelopment Authority, Minnesota, Lease Revenue Bonds, Saint | 3/23 at 100.00 | BB+ | 392,952 |
| | Paul Conservatory for Performing Artists Charter School Project, Series 2013A, 4.625%, 3/01/43 | | | |
| 1,000 | | Savage, Minnesota Charter School Lease Revenue Bonds, Aspen Academy Project, Series | 10/26 at 100.00 | N/R | 1,009,140 |
| | 2016A, 5.000%, 10/01/41 | | | |
| 500 | | St Paul Housing and Redevelopment Authority, Minnesota, Charter School Revenue Bonds, | 12/26 at 102.00 | BBB– | 548,060 |
| | Higher Ground Academy Charter School, Series 2018, 5.125%, 12/01/49 | | | |
| 25,325 | | Total Education and Civic Organizations | | | 27,216,183 |
| | Health Care – 32.7% (20.7% of Total Investments) | | | |
| 250 | | Chippewa County, Minnesota, Gross Revenue Hospital Bonds, Montevideo Hospital Project, | 3/26 at 100.00 | N/R | 267,545 |
| | Refunding Series 2016, 4.000%, 3/01/32 | | | |
| 180 | | City of Plato, Minnesota, Health Care Facilities Revenue Bonds, Glencoe Regional Health | 4/27 at 100.00 | BBB | 203,078 |
| | Services Project, Series 2017, 5.000%, 4/01/41 | | | |
| | Duluth Economic Development Authority, Minnesota, Health Care Facilities Revenue Bonds, | | | |
| | Essentia Health Obligated Group, Series 2018A: | | | |
| 700 | | 5.000%, 2/15/43 | 2/28 at 100.00 | A– | 834,351 |
| 3,250 | | 5.000%, 2/15/48 | 2/28 at 100.00 | A– | 3,858,660 |
| 2,000 | | 5.000%, 2/15/53 | 2/28 at 100.00 | A– | 2,358,560 |
| 500 | | 5.000%, 2/15/58 | 2/28 at 100.00 | A– | 587,620 |
| | Glencoe, Minnesota, Health Care Facilities Revenue Bonds, Glencoe Regional Health | | | |
| | Services Project, Series 2013: | | | |
| 400 | | 4.000%, 4/01/27 | 4/22 at 100.00 | BBB | 416,720 |
| 230 | | 4.000%, 4/01/31 | 4/22 at 100.00 | BBB | 238,581 |
| 500 | | Maple Grove, Minnesota, Health Care Facilities Revenue Refunding Bonds, North Memorial | 9/25 at 100.00 | Baa1 | 539,360 |
| | Health Care, Series 2015, 4.000%, 9/01/35 | | | |
| | Maple Grove, Minnesota, Health Care Facility Revenue Bonds, North Memorial Health Care, | | | |
| | Series 2017: | | | |
| 200 | | 5.000%, 5/01/31 | 5/27 at 100.00 | Baa1 | 239,374 |
| 165 | | 5.000%, 5/01/32 | 5/27 at 100.00 | Baa1 | 196,741 |
| | Minneapolis, Minnesota, Health Care System Revenue Bonds, Fairview Health Services, | | | |
| | Series 2015A: | | | |
| 265 | | 4.000%, 11/15/40 | 11/25 at 100.00 | A+ | 286,810 |
| 1,000 | | 5.000%, 11/15/44 | 11/25 at 100.00 | A+ | 1,150,940 |
| | Minneapolis, Minnesota, Health Care System Revenue Bonds, Fairview Health Services, | | | |
| | Series 2018A: | | | |
| 1,500 | | 4.000%, 11/15/48 | 11/28 at 100.00 | A+ | 1,641,030 |
| 1,500 | | 5.000%, 11/15/49 | 11/28 at 100.00 | A+ | 1,788,585 |
55
| | | | | |
| NMS | Nuveen Minnesota Quality Municipal Income Fund | |
| Portfolio of Investments (continued) | | | |
| November 30, 2019 (Unaudited) | | | |
|
|
|
|
| Principal | | | Optional Call | | |
| Amount (000) | | Description (1) | Provisions (2) | Ratings (3) | Value |
| | Health Care (continued) | | | |
| $ 710 | | Northern Itasca Hospital District, Minnesota, Health Facilities Gross Revenue Bonds, | 12/20 at 100.00 | N/R | $ 716,781 |
| | Refunding Series 2013A, 4.400%, 12/01/33 | | | |
| | Northern Itasca Hospital District, Minnesota, Health Facilities Gross Revenue Bonds, | | | |
| | Series 2013C: | | | |
| 240 | | 4.500%, 12/01/25 | 12/20 at 100.00 | N/R | 244,121 |
| 190 | | 4.750%, 12/01/27 | 12/20 at 100.00 | N/R | 193,618 |
| 160 | | 5.000%, 12/01/28 | 12/20 at 100.00 | N/R | 163,179 |
| 310 | | 5.400%, 12/01/33 | 12/20 at 100.00 | N/R | 316,383 |
| 915 | | Rochester, Minnesota, Health Care Facilities Revenue Bonds, Mayo Clinic, Series 2018A, | 5/28 at 100.00 | AA | 1,023,784 |
| | 4.000%, 11/15/48 | | | |
| 30 | | Saint Cloud, Minnesota, Health Care Revenue Bonds, CentraCare Health System Project, | 5/20 at 100.00 | AA– | 30,458 |
| | Series 2010A, 5.125%, 5/01/30 | | | |
| 635 | | Saint Cloud, Minnesota, Health Care Revenue Bonds, CentraCare Health System, Series | 5/26 at 100.00 | AA– | 695,979 |
| | 2016A, 4.000%, 5/01/37 | | | |
| | Saint Cloud, Minnesota, Health Care Revenue Bonds, CentraCare Health System, | | | |
| | Series 2019: | | | |
| 500 | | 5.000%, 5/01/48 | 5/29 at 100.00 | AA– | 605,340 |
| 750 | | 4.000%, 5/01/49 | 5/29 at 100.00 | AA– | 825,870 |
| 4,000 | | Saint Paul Housing and Redevelopment Authority, Minnesota, Health Care Facility Revenue | 7/25 at 100.00 | A+ | 4,325,120 |
| | Bonds, HealthPartners Obligated Group, Refunding Series 2015A, 4.000%, 7/01/35 | | | |
| | Saint Paul Housing and Redevelopment Authority, Minnesota, Health Care Revenue Bonds, | | | |
| | Fairview Health Services, Series 2017A: | | | |
| 245 | | 4.000%, 11/15/36 | 11/27 at 100.00 | A+ | 273,173 |
| 240 | | 4.000%, 11/15/37 | 11/27 at 100.00 | A+ | 265,718 |
| 2,170 | | 4.000%, 11/15/43 | 11/27 at 100.00 | A+ | 2,372,960 |
| 1,000 | | Saint Paul Port Authority, Minnesota, Lease Revenue Bonds, Regions Hospital Parking Ramp | 12/19 at 100.00 | N/R | 1,001,950 |
| | Project, Series 2007-1, 5.000%, 8/01/36 | | | |
| | Shakopee, Minnesota, Health Care Facilities Revenue Bonds, Saint Francis Regional | | | |
| | Medical Center, Refunding Series 2014: | | | |
| 765 | | 4.000%, 9/01/31 | 9/24 at 100.00 | A | 818,925 |
| 630 | | 5.000%, 9/01/34 | 9/24 at 100.00 | A | 703,546 |
| 26,130 | | Total Health Care | | | 29,184,860 |
| | Housing/Multifamily – 4.3% (2.7% of Total Investments) | | | |
| 1,700 | | Coon Rapids, Minnesota, Multifamily Housing Revenue Bonds, Tralee Terrace Apartments | 6/20 at 100.00 | Aaa | 1,722,559 |
| | Project, Series 2010, 4.500%, 6/01/26 | | | |
| | Minnesota Housing Finance Agency, Rental Housing Revenue Bonds, Series 2011: | | | |
| 355 | | 5.050%, 8/01/31 | 8/21 at 100.00 | AA+ | 371,614 |
| 1,700 | | 5.450%, 8/01/41 | 8/21 at 100.00 | AA+ | 1,777,469 |
| 3,755 | | Total Housing/Multifamily | | | 3,871,642 |
| | Housing/Single Family – 1.0% (0.6% of Total Investments) | | | |
| 14 | | Minneapolis-Saint Paul Housing Finance Board, Minnesota, Single Family Mortgage Revenue | 12/19 at 100.00 | AA+ | 14,159 |
| | Bonds, City Living Series 2006A-4, 5.000%, 11/01/38 (AMT) | | | |
| 125 | | Minnesota Housing Finance Agency, Homeownership Finance Bonds, Mortgage-Backed | 7/21 at 100.00 | Aaa | 125,551 |
| | Securities Program, Series 2011D, 4.700%, 1/01/31 | | | |
| 55 | | Minnesota Housing Finance Agency, Residential Housing Finance Bonds, Series 2013C, | 1/23 at 100.00 | AA+ | 56,647 |
| | 3.900%, 7/01/43 | | | |
| 35 | | Minnesota Housing Finance Agency, Residential Housing Finance Bonds, Series 2014C, | 7/24 at 100.00 | AA+ | 36,534 |
| | 3.500%, 1/01/32 | | | |
| 130 | | Minnesota Housing Finance Agency, Residential Housing Finance Bonds, Series 2015F, | 7/25 at 100.00 | AA+ | 137,609 |
| | 3.300%, 7/01/29 | | | |
| 320 | | Minnesota Housing Finance Agency, Residential Housing Finance Bonds, Series 2017A, | 1/27 at 100.00 | AA+ | 324,438 |
| | 3.200%, 7/01/30 (AMT) | | | |
56
| | | | | | |
| Principal | | | Optional Call | | |
| Amount (000) | | Description (1) | Provisions (2) | Ratings (3) | Value |
| | Housing/Single Family (continued) | | | |
| $ 170 | | Minnesota Housing Finance Agency, Residential Housing Finance Bonds, Series 2018A, | 7/27 at 100.00 | AA+ | $ 180,202 |
| | 3.625%, 7/01/32 (AMT) | | | |
| 849 | | Total Housing/Single Family | | | 875,140 |
| | Industrials – 2.3% (1.5% of Total Investments) | | | |
| | Minneapolis, Minnesota, Limited Tax Supported Development Revenue Bonds, Common Bond | | | |
| | Fund Series 2013-1: | | | |
| 1,400 | | 4.500%, 6/01/33 | 6/21 at 100.00 | A+ | 1,456,672 |
| 600 | | 4.750%, 6/01/39 | 6/21 at 100.00 | A+ | 626,934 |
| 2,000 | | Total Industrials | | | 2,083,606 |
| | Long-Term Care – 14.9% (9.4% of Total Investments) | | | |
| 805 | | Anoka, Minnesota, Health Care and Housing Facility Revenue Bonds, The Homestead at | 11/24 at 100.00 | N/R | 847,560 |
| | Anoka, Inc Project, Series 2014, 5.125%, 11/01/49 | | | |
| 380 | | Center City, Minnesota, Health Care Facilities Revenue Bonds, Hazelden Betty Ford | 11/24 at 100.00 | Baa1 | 399,733 |
| | Foundation Project, Series 2014, 4.000%, 11/01/39 | | | |
| 875 | | Cold Spring, Minnesota, Health Care Facilities Revenue Bonds, Assumption Home, Inc, | 3/20 at 100.00 | N/R | 877,319 |
| | Refunding Series 2013, 5.200%, 3/01/43 | | | |
| | Columbus, Minnesota, Senior Housing Revenue Bonds, Richfield Senior Housing, Inc, | | | |
| | Refunding Series 2015: | | | |
| 175 | | 5.250%, 1/01/40 | 1/23 at 100.00 | N/R | 176,822 |
| 850 | | 5.250%, 1/01/46 | 1/23 at 100.00 | N/R | 856,435 |
| 500 | | Dakota County Community Development Agency, Minnesota, Senior Housing Revenue Bonds, | 8/22 at 100.00 | N/R | 519,265 |
| | Walker Highview Hills LLC Project, Refunding Series 2016A, 5.000%, 8/01/51, 144A | | | |
| 1,000 | | Maple Plain, Minnesota Senior Housing and Healthcare Revenue Bonds, Haven Homes, Inc | 7/25 at 102.00 | N/R | 1,066,130 |
| | Project, Series 2019, 5.000%, 7/01/54 | | | |
| 1,350 | | Minneapolis, Minnesota, Revenue Bonds, Walker Minneapolis Campus Project, Refunding | 11/22 at 100.00 | N/R | 1,384,303 |
| | Series 2012, 4.750%, 11/15/28 | | | |
| 750 | | Minneapolis, Minnesota, Senior Housing and Healthcare Revenue Bonds, Ecumen Abiitan Mill | 5/23 at 100.00 | N/R | 785,438 |
| | City Project, Series 2015, 5.250%, 11/01/45 | | | |
| 500 | | Rochester, Minnesota, Health Care and Housing Revenue Bonds, Samaritan Bethany, Inc | 8/25 at 100.00 | N/R | 527,670 |
| | Project, Refunding Series 2017A, 5.000%, 8/01/48 | | | |
| 215 | | Saint Joseph, Minnesota, Senior Housing and Healthcare Revenue Bonds, Woodcrest of | 7/24 at 102.00 | N/R | 225,797 |
| | Country Manor Project, Series 2019 A, 5.000%, 7/01/55 | | | |
| 1,300 | | Saint Louis Park, Minnesota, Health Care Facilities Revenue Bonds, Mount Olivet Careview | 6/26 at 100.00 | N/R | 1,373,944 |
| | Home Project, Series 2016B, 4.900%, 6/01/49 | | | |
| 500 | | Saint Paul Housing and Redevelopment Authority Minnesota, Senior Housing and Health Care | 5/23 at 100.00 | N/R | 512,620 |
| | Revenue Bonds, Episcopal Homes Project, Series 2013, 5.125%, 5/01/48 | | | |
| 1,070 | | Saint Paul Housing and Redevelopment Authority, Minnesota, Nursing Home Revenue Bonds, | 4/20 at 100.00 | N/R | 1,073,090 |
| | Episcopal Homes of Minnesota, Series 2006, 5.630%, 10/01/33 | | | |
| 100 | | Saint Paul Housing and Redevelopment Authority, Minnesota, Senior Housing and Health | 11/20 at 100.00 | N/R | 100,632 |
| | Care Revenue Bonds, Episcopal Homes Project, Refunding Series 2012A, 5.150%, 11/01/42 | | | |
| | Saint Paul Park, Minnesota, Senior Housing and Health Care Revenue Bonds, Presbyterian | | | |
| | Homes Bloomington Project, Refunding Series 2017: | | | |
| 500 | | 4.125%, 9/01/34 | 9/24 at 100.00 | N/R | 526,495 |
| 350 | | 4.125%, 9/01/35 | 9/24 at 100.00 | N/R | 367,595 |
| 585 | | Sauk Rapids, Minnesota, Health Care and Housing Facilities Revenue Bonds, Good Shepherd | 1/23 at 100.00 | N/R | 603,006 |
| | Lutheran Home, Refunding Series 2013, 5.125%, 1/01/39 | | | |
| 1,000 | | Wayzata, Minnesota Senior Housing Revenue Bonds, Folkestone Senior Living Community, | 8/24 at 102.00 | N/R | 1,097,320 |
| | Refunding Series 2019, 5.000%, 8/01/54 | | | |
| 12,805 | | Total Long-Term Care | | | 13,321,174 |
57
| | |
| NMS | Nuveen Minnesota Quality Municipal Income Fund |
| Portfolio of Investments (continued) |
| November 30, 2019 (Unaudited) |
| | | | | | |
| Principal | | | Optional Call | | |
| Amount (000) | | Description (1) | Provisions (2) | Ratings (3) | Value |
| | Materials – 3.1% (1.9% of Total Investments) | | | |
| $ 2,650 | | Saint Paul Port Authority, Minnesota, Solid Waste Disposal Revenue Bonds, Gerdau Saint | 10/22 at 100.00 | BBB– | $ 2,740,869 |
| | Paul Steel Mill Project, Series 2012-7, 4.500%, 10/01/37 (AMT), 144A | | | |
| | Tax Obligation/General – 26.9% (17.0% of Total Investments) | | | |
| 1,000 | | Bloomington Independent School District 271, Hennepin County, Minnesota, General | 2/27 at 100.00 | AAA | 1,110,450 |
| | Obligation Bonds, Facilities Maintenance, Series 2017A, 4.000%, 2/01/40 | | | |
| | Brainerd Independent School District 181, Crow Wing County, Minnesota, General | | | |
| | Obligation Bonds, Facilities Maintenance Series 2018D: | | | |
| 1,015 | | 4.000%, 2/01/38 | 2/27 at 100.00 | AAA | 1,127,421 |
| 1,055 | | 4.000%, 2/01/39 | 2/27 at 100.00 | AAA | 1,168,011 |
| | Brainerd Independent School District 181, Crow Wing County, Minnesota, General | | | |
| | Obligation Bonds, School Building Series 2018A: | | | |
| 500 | | 4.000%, 2/01/38 | 2/27 at 100.00 | AAA | 555,380 |
| 1,000 | | 4.000%, 2/01/42 | 2/27 at 100.00 | AAA | 1,101,850 |
| 1,020 | | Brooklyn Center Independent School District 286, Minnesota, General Obligation Bonds, | 2/27 at 100.00 | Aa2 | 1,108,893 |
| | Series 2018A, 4.000%, 2/01/43 | | | |
| 300 | | Circle Pines Independent School District 12, Centennial, Minnesota, General Obligation | 2/25 at 67.23 | AAA | 177,363 |
| | Bonds, School Building Series 2015A, 0.000%, 2/01/35 | | | |
| 1,000 | | Cloquet Independent School District 94, Carlton and Sant Louis Counties, Minnesota, | 2/25 at 100.00 | Aa2 | 1,081,030 |
| | General Obligation Bonds, School Building Series 2015B, 4.000%, 2/01/36 | | | |
| 500 | | Forest Lake, Washington County, Minnesota, General Obligation Bonds, Series 2019A, | 2/29 at 100.00 | AA+ | 585,650 |
| | 4.000%, 2/01/32, (WI/DD, Settling 12/12/19) | | | |
| | Hermantown Independent School District 700, Minnesota, General Obligation Bonds, School | | | |
| | Building Series 2015A: | | | |
| 940 | | 0.000%, 2/01/37 | 2/24 at 56.07 | Aa2 | 474,136 |
| 1,075 | | 0.000%, 2/01/38 | 2/24 at 53.49 | Aa2 | 516,570 |
| 2,000 | | Independent School District 621, Mounds View, Minnesota, General Obligation Bonds, | 2/27 at 100.00 | AAA | 2,198,180 |
| | School Building Series 2018A, 4.000%, 2/01/42 | | | |
| 585 | | Independent School District 625, St Paul, Minnesota, General Obligation Bonds, School | 2/27 at 100.00 | AAA | 612,507 |
| | Building Series 2019A, 3.000%, 2/01/32 | | | |
| 345 | | Lake Crystal, Minnesota, General Obligation Bonds, Series 2019A, 3.000%, 12/15/33 | 12/27 at 100.00 | AA | 363,934 |
| 1,500 | | Mankato Independent School District 77, Minnesota, General Obligation Bonds, School | 2/24 at 100.00 | AAA | 1,636,065 |
| | Building Series 2014A, 4.000%, 2/01/30 | | | |
| 500 | | Minneapolis Special School District 1, Hennepin County, Minnesota, General Obligation | 2/28 at 100.00 | AAA | 571,125 |
| | Bonds, Long-Term Facilities Maintenance Series 2017B, 4.000%, 2/01/36 | | | |
| 1,345 | | Minneapolis, Minnesota, General Obligation Bonds, Improvement & Various Purpose Series | 12/26 at 100.00 | AAA | 1,494,362 |
| | 2018, 4.000%, 12/01/40 | | | |
| 1,000 | | Richfield Independent School District 280, Hennepin County, Minnesota, General | 2/27 at 100.00 | AAA | 1,103,510 |
| | Obligation Bonds, School Buildings Series 2018A, 4.000%, 2/01/40 | | | |
| 1,000 | | Roseville Independent School District 623, Ramsey County, Minnesota, General Obligation | 2/27 at 100.00 | Aa2 | 1,109,350 |
| | Bonds, Series 1994, 4.000%, 2/01/37 | | | |
| 1,000 | | Saint James Independent School District 840, Minnesota, General Obligation Bonds, School | 2/26 at 100.00 | AAA | 1,093,080 |
| | Building Series 2015B, 4.000%, 2/01/45 | | | |
| 1,000 | | Sartell Independent School District 748, Stearns County, Minnesota, General Obligation | 2/25 at 62.98 | Aa2 | 548,210 |
| | Bonds, School Building Capital Appreciation Series 2016B, 0.000%, 2/01/39 | | | |
| 1,500 | | Sibley East Independent School District 2310, Sibley, Minnesota, General Obligation | 2/25 at 100.00 | Aa2 | 1,610,010 |
| | Bonds, School Building Series 2015A, 4.000%, 2/01/40 | | | |
| 1,970 | | Wayzata Independent School District 284, Hennepin County, Minnesota, General Obligation | 2/23 at 100.00 | AAA | 2,051,026 |
| | Bonds, School Building Series 2014A, 3.500%, 2/01/31 | | | |
| 500 | | West Saint Paul-Mendota Heights-Eagan Independent School District 197, Dakota County, | 2/27 at 100.00 | AAA | 556,000 |
| | Minnesota, General Obligation Bonds, School Building Series 2018A, 4.000%, 2/01/39 | | | |
| 23,650 | | Total Tax Obligation/General | | | 23,954,113 |
58
| | | | | | |
| Principal | | | Optional Call | | |
| Amount (000) | | Description (1) | Provisions (2) | Ratings (3) | Value |
| | Tax Obligation/Limited – 15.2% (9.6% of Total Investments) | | | |
| $ 1,000 | | Anoka-Hennepin Independent School District 11, Minnesota, Certificates of Participation, | 2/23 at 100.00 | A+ | $ 1,040,670 |
| | Series 2015A, 4.000%, 2/01/41 | | | |
| 1,600 | | Duluth Independent School District 709, Minnesota, Certificates of Participation, | 2/22 at 77.70 | Aa2 | 1,182,464 |
| | Capital Appreciation Series 2012A, 0.000%, 2/01/28 – AGM Insured | | | |
| 125 | | Minneapolis, Minnesota, Tax Increment Revenue Bonds, Grant Park Project, Refunding | 3/23 at 100.00 | N/R | 128,871 |
| | Series 2015, 4.000%, 3/01/30 | | | |
| 500 | | Minneapolis, Minnesota, Tax Increment Revenue Bonds, Ivy Tower Project, Series 2015, | 3/24 at 100.00 | N/R | 524,185 |
| | 5.000%, 3/01/29 | | | |
| 375 | | Minnesota Housing Finance Agency, Housing Infrastructure State Appropriation Bonds, | 8/25 at 100.00 | AA+ | 412,714 |
| | Series 2016C, 4.000%, 8/01/35 | | | |
| 200 | | Minnesota Housing Finance Agency, Housing Infrastructure State Appropriation Bonds, | 8/27 at 100.00 | AA+ | 226,670 |
| | Series 2017A, 4.000%, 8/01/35 | | | |
| 500 | | Minnesota Housing Finance Agency, Housing Infrastructure State Appropriation Bonds, | 8/28 at 100.00 | AA+ | 546,220 |
| | Series 2018D, 4.000%, 8/01/39 | | | |
| 2,230 | | Minnesota Housing Finance Agency, Nonprofit Housing Bonds, State Appropriation Series | 8/21 at 100.00 | AA+ | 2,364,915 |
| | 2011, 5.000%, 8/01/31 | | | |
| 1,000 | | Northeast Metropolitan Intermediate School District 916, White Bear Lake, Minnesota, | 2/25 at 100.00 | A2 | 1,052,490 |
| | Certificates of Participation, Series 2015A, 3.750%, 2/01/36 | | | |
| 750 | | Northeast Metropolitan Intermediate School District 916, White Bear Lake, Minnesota, | 2/25 at 100.00 | A2 | 802,605 |
| | Certificates of Participation, Series 2015B, 4.000%, 2/01/42 | | | |
| | Saint Cloud Independent School District 742, Stearns County, Minnesota, Certificates of | | | |
| | Participation, Saint Cloud Area Public Schools, Series 2017A: | | | |
| 145 | | 5.000%, 2/01/32 | 2/25 at 100.00 | A1 | 167,890 |
| 500 | | 4.000%, 2/01/38 | 2/25 at 100.00 | A1 | 538,290 |
| | Saint Paul Housing and Redevelopment Authority, Minnesota, Multifamily Housing Revenue | | | |
| | Bonds, 2700 University at Westgate Station, Series 2015B: | | | |
| 455 | | 4.875%, 4/01/30 | 4/23 at 100.00 | N/R | 470,852 |
| 895 | | 5.250%, 4/01/43 | 4/23 at 100.00 | N/R | 920,489 |
| | Saint Paul Housing and Redevelopment Authority, Minnesota, Upper Landing Project Tax | | | |
| | Increment Revenue Refunding Bonds, Series 2012: | | | |
| 500 | | 5.000%, 9/01/26 | 3/20 at 102.00 | N/R | 512,175 |
| 500 | | 5.000%, 3/01/29 | 3/20 at 102.00 | N/R | 511,890 |
| 1,150 | | Saint Paul Independent School District 625, Ramsey County, Minnesota, Certificates of | 2/29 at 100.00 | AAA | 1,337,818 |
| | Participation, Series 2019B, 4.000%, 2/01/31 | | | |
| 800 | | Saint Paul, Minnesota, Sales Tax Revenue Bonds, Series 2014G, 3.750%, 11/01/33 | 11/24 at 100.00 | A+ | 853,728 |
| 13,225 | | Total Tax Obligation/Limited | | | 13,594,936 |
| | Transportation – 3.4% (2.1% of Total Investments) | | | |
| 750 | | Minneapolis-St Paul Metropolitan Airports Commission, Minnesota, Airport Revenue Bonds, | 7/29 at 100.00 | A+ | 906,922 |
| | Refunding Subordinate Lien Series 2019B, 5.000%, 1/01/49 (AMT) | | | |
| 1,600 | | Minneapolis-St Paul Metropolitan Airports Commission, Minnesota, Airport Revenue Bonds, | 1/27 at 100.00 | AA– | 1,891,552 |
| | Senior Lien Series 2016C, 5.000%, 1/01/46 | | | |
| 200 | | Minneapolis-St Paul Metropolitan Airports Commission, Minnesota, Airport Revenue Bonds, | 1/20 at 100.00 | A+ | 200,426 |
| | Subordinate Lien Series 2010D, 4.000%, 1/01/23 (AMT) | | | |
| 2,550 | | Total Transportation | | | 2,998,900 |
| | U.S. Guaranteed – 6.9% (4.4% of Total Investments) (4) | | | |
| 390 | | Anoka County, Minnesota, Charter School Lease Revenue Bonds, Spectrum Building Company, | 6/20 at 102.00 | N/R | 405,156 |
| | Series 2012A, 5.000%, 6/01/43 (Pre-refunded 6/01/20) | | | |
| 470 | | Saint Cloud, Minnesota, Health Care Revenue Bonds, CentraCare Health System Project, | 5/20 at 100.00 | N/R | 477,656 |
| | Series 2010A, 5.125%, 5/01/30 (Pre-refunded 5/01/20) | | | |
| 580 | | St Paul Housing and Redevelopment Authority, Minnesota, Hospital Revenue Bonds, | 11/25 at 100.00 | N/R | 702,119 |
| | HealthEast Inc, Series 2015A, 5.000%, 11/15/44 (Pre-refunded 11/15/25) | | | |
59
| | | | | |
| NMS | Nuveen Minnesota Quality Municipal Income Fund | |
| Portfolio of Investments (continued) | | | |
| November 30, 2019 (Unaudited) | | | |
|
|
|
| Principal | | | Optional Call | | |
| Amount (000) | | Description (1) | Provisions (2) | Ratings (3) | Value |
| | U.S. Guaranteed (4) (continued) | | | |
| $ 2,000 | | University of Minnesota, General Revenue Bonds, Series 2011A, 5.250%, 12/01/29 | 12/20 at 100.00 | Aa1 | $ 2,081,460 |
| | (Pre-refunded 12/01/20) | | | |
| | Western Minnesota Municipal Power Agency, Minnesota, Power Supply Revenue Bonds, | | | |
| | Series 2014A: | | | |
| 1,000 | | 4.000%, 1/01/40 (Pre-refunded 1/01/24) | 1/24 at 100.00 | Aa3 | 1,114,480 |
| 1,200 | | 5.000%, 1/01/46 (Pre-refunded 1/01/24) | 1/24 at 100.00 | Aa3 | 1,385,076 |
| 5,640 | | Total U.S. Guaranteed | | | 6,165,947 |
| | Utilities – 13.4% (8.5% of Total Investments) | | | |
| 500 | | Minnesota Municipal Power Agency, Electric Revenue Bonds, Refunding Series 2014A, | 10/24 at 100.00 | A1 | 539,960 |
| | 4.000%, 10/01/33 | | | |
| 965 | | Minnesota Municipal Power Agency, Electric Revenue Bonds, Series 2016, 5.000%, 10/01/35 | 10/26 at 100.00 | A1 | 1,152,133 |
| 1,200 | | Rochester, Minnesota, Electric Utility Revenue Bonds, Refunding Series 2017A, | 12/26 at 100.00 | Aa3 | 1,415,028 |
| | 5.000%, 12/01/47 | | | |
| 500 | | Saint Paul Port Authority, Minnesota, District Energy Revenue Bonds, Series 2017-3, | 10/27 at 100.00 | A– | 548,645 |
| | 4.000%, 10/01/42 | | | |
| | Southern Minnesota Municipal Power Agency, Power Supply System Revenue Bonds, | | | |
| | Series 1994A: | | | |
| 1,100 | | 0.000%, 1/01/23 – NPFG Insured | No Opt. Call | A+ | 1,054,537 |
| 3,070 | | 0.000%, 1/01/24 – NPFG Insured | No Opt. Call | A+ | 2,893,321 |
| 100 | | 0.000%, 1/01/26 – NPFG Insured | No Opt. Call | A+ | 90,362 |
| 3,500 | | Western Minnesota Municipal Power Agency, Minnesota, Power Supply Revenue Bonds, Series | 7/28 at 100.00 | Aa3 | 4,257,155 |
| | 2018A, 5.000%, 1/01/49 | | | |
| 10,935 | | Total Utilities | | | 11,951,141 |
| | Water and Sewer – 0.5% (0.3% of Total Investments) | | | |
| 415 | | Guam Government Waterworks Authority, Water and Wastewater System Revenue Bonds, | 7/27 at 100.00 | A– | 479,076 |
| | Refunding Series 2017, 5.000%, 7/01/40 | | | |
| $ 130,629 | | Total Long-Term Investments (cost $130,229,317) | | | 139,148,493 |
|
| Principal | | | Optional Call | | |
| Amount (000) | | Description (1) | Provisions (2) | Ratings (3) | Value |
| | SHORT-TERM INVESTMENTS – 2.4% (1.5% of Total Investments) | | | |
| | MUNICIPAL BONDS – 2.4% (1.5% of Total Investments) | | | |
| | Education and Civic Organizations – 0.4% (0.2% of Total Investments) | | | |
| $ 300 | | Minneapolis, Minnesota, Revenue Bonds, University Gateway Project, Variable Rate Demand | 2/20 at 100.00 | A-1 | $ 300,000 |
| | Obligation Series 1997B, 1.500%, 12/01/27 (Mandatory Put 1/09/20) (5) | | | |
| | Health Care – 2.0% (1.3% of Total Investments) | | | |
| 1,800 | | Rochester, Minnesota, Health Care Facilities Revenue Bonds, Variable Rate Demand Obligation, | 1/20 at 100.00 | A-1+ | 1,800,000 |
| | Mayo Clinic, Series 2011, 0.950%, 11/15/38 (Mandatory Put 1/15/20) (5) | | | |
| $ 2,100 | | Total Short-Term Investments (cost $2,100,000) | | | 2,100,000 |
| | Total Investments (cost $132,329,317) – 158.3% | | | 141,248,493 |
| | Adjustable Rate MuniFund Term Preferred Shares, net of deferred offering costs – (59.0)% (6) | | | (52,664,544) |
| | Other Assets Less Liabilities – 0.7% | | | 668,537 |
| | Net Asset Applicable to Common Shares – 100% | | | $ 89,252,486 |
60
| | |
(1) | All percentages shown in the Portfolio of Investments are based on net assets applicable to common shares unless otherwise noted. |
(2) | Optional Call Provisions: Dates (month and year) and prices of the earliest optional call or redemption. There may be other call provisions at varying prices at later dates. Certain mortgage-backed securities may be subject to periodic principal paydowns. |
(3) | For financial reporting purposes, the ratings disclosed are the highest of Standard & Poor’s Group (“Standard & Poor’s”), Moody’s Investors Service, Inc. (“Moody’s”) or Fitch, Inc. (“Fitch”) rating. This treatment of split-rated securities may differ from that used for other purposes, such as for Fund investment policies. Ratings below BBB by Standard & Poor’s, Baa by Moody’s or BBB by Fitch are considered to be below investment grade. Holdings designated N/R are not rated by any of these national rating agencies. |
(4) | Backed by an escrow or trust containing sufficient U.S. Government or U.S. Government agency securities, which ensure the timely payment of principal and interest. |
(5) | Investment has a maturity of greater than one year, but has variable rate and/or demand features which qualify it as a short-term investment. The rate disclosed, as well as the reference rate and spread, where applicable, is that in effect as of the end of the reporting period. This rate changes periodically based on market conditions or a specified market index. |
(6) | Adjustable Rate MuniFund Term Preferred Shares, net of deferred offering cost as a percentage of Total Investments is 37.3%. |
144A | Investment is exempt from registration under Rule 144A of the Securities Act of 1933, as amended. These investments may only be resold in transactions exempt from registration, which are normally those transactions with qualified institutional buyers. |
AMT | Alternative Minimum Tax |
WI/DD | Purchased on a when-issued or delayed delivery basis. |
| See accompanying notes to financial statements. |
61
| | |
| NOM | Nuveen Missouri Quality Municipal |
| Income Fund |
| Portfolio of Investments |
| November 30, 2019 (Unaudited) |
| | | | | | |
| Principal | | | Optional Call | | |
| Amount (000) | | Description (1) | Provisions (2) | Ratings (3) | Value |
| | LONG-TERM INVESTMENTS – 155.0% (100.0% of Total Investments) | | | |
| | MUNICIPAL BONDS – 155.0% (100.0% of Total Investments) | | | |
| | Consumer Staples – 4.1% (2.6% of Total Investments) | | | |
| $ 1,055 | | Missouri Development Finance Board, Solid Waste Disposal Revenue Bonds, Procter and | No Opt. Call | AA– | $ 1,333,668 |
| | Gamble Inc., Series 1999, 5.200%, 3/15/29 (AMT) | | | |
| | Education and Civic Organizations – 16.9% (10.9% of Total Investments) | | | |
| 300 | | Curators of the University of Missouri, System Facilities Revenue Bonds, Series 2014A, | 11/24 at 100.00 | AA+ | 328,431 |
| | 4.000%, 11/01/33 | | | |
| 410 | | Missouri Health and Educational Facilities Authority, Educational Facilities Revenue | 6/23 at 100.00 | A1 | 456,096 |
| | Bonds, Kansas City University of Medicine and Biosciences, Series 2013A, 5.000%, 6/01/33 | | | |
| 750 | | Missouri Health and Educational Facilities Authority, Educational Facilities Revenue | 5/23 at 100.00 | BBB | 810,052 |
| | Bonds, Saint Louis College of Pharmacy, Series 2013, 5.500%, 5/01/43 | | | |
| 600 | | Missouri Health and Educational Facilities Authority, Educational Facilities Revenue | 10/22 at 100.00 | BBB– | 629,886 |
| | Bonds, Southwest Baptist University Project, Series 2012, 5.000%, 10/01/33 | | | |
| 725 | | Missouri Health and Educational Facilities Authority, Educational Facilities Revenue | 10/23 at 100.00 | A+ | 814,574 |
| | Bonds, University of Central Missouri, Series 2013C-2, 5.000%, 10/01/34 | | | |
| 1,000 | | Missouri Health and Educational Facilities Authority, Revenue Bonds, Saint Louis | 10/25 at 100.00 | AA– | 1,078,210 |
| | University, Series 2015A, 4.000%, 10/01/42 | | | |
| 500 | | Missouri Health and Educational Facilities Authority, Revenue Bonds, Saint Louis | 4/29 at 100.00 | AA– | 606,580 |
| | University, Series 2019A, 5.000%, 10/01/46 | | | |
| 550 | | Missouri Health and Educational Facilities Authority, Revenue Bonds, Washington | 11/21 at 100.00 | AA+ | 587,208 |
| | University, Series 2011B, 5.000%, 11/15/37 | | | |
| 115 | | Missouri Health and Educational Facilities Authority, Revenue Bonds, Webster University, | 4/27 at 100.00 | Baa1 | 119,969 |
| | Refunding Series 2017, 4.000%, 4/01/34 | | | |
| 100 | | Saline County Industrial Development Authority, Missouri, First Mortgage Revenue Bonds, | 10/23 at 100.00 | N/R | 103,332 |
| | Missouri Valley College, Series 2017, 4.500%, 10/01/40 | | | |
| 5,050 | | Total Education and Civic Organizations | | | 5,534,338 |
| | Financials – 0.0% (0.0% of Total Investments) | | | |
| 43 | | Puerto Rico Urgent Interest Fund Corp (COFINA), National Custodial Taxable Trust Unit, | No Opt. Call | N/R | 5,978 |
| | Series 2007A Sr. Bond, 0.000%, 8/01/41 (4) | | | |
| 132 | | Puerto Rico Urgent Interest Fund Corp (COFINA), National Custodial Taxable-Exempt Trust | No Opt. Call | N/R | 6,601 |
| | Unit, Series 2007A Sr. Bonds, 0.000%, 8/01/41 (4) | | | |
| 175 | | Total Financials | | | 12,579 |
| | Health Care – 36.6% (23.6% of Total Investments) | | | |
| 300 | | Boone County, Missouri, Hospital Revenue Bonds, Boone Hospital Center, Refunding Series | 8/26 at 100.00 | BBB | 317,976 |
| | 2016, 5.000%, 8/01/30 | | | |
| 400 | | Cape Girardeau County Industrial Development Authority, Missouri, Health Facilities | 3/27 at 100.00 | BBB– | 457,964 |
| | Revenue Bonds, Southeasthealth, Series 2017A, 5.000%, 3/01/36 | | | |
| 170 | | Clinton County Industrial Development Authority, Missouri, Health Facilities Revenue | 12/25 at 100.00 | N/R | 178,580 |
| | Bonds, Cameron Regional Medical Center, Inc., Series 2017B, 4.400%, 12/01/34 | | | |
| 250 | | Hannibal Industrial Development Authority, Missouri, Health Facilities Revenue Bonds, | 10/27 at 100.00 | A– | 286,348 |
| | Hannibal Regional Healthcare System, Series 2017, 5.000%, 10/01/47 | | | |
| 200 | | Joplin Industrial Development Authority, Missouri, Health Facilities Revenue Bonds, | 2/21 at 100.00 | A | 208,444 |
| | Freeman Health System, Series 2011, 5.500%, 2/15/31 | | | |
| 315 | | Joplin Industrial Development Authority, Missouri, Health Facilities Revenue Bonds, | 2/24 at 100.00 | A | 351,282 |
| | Freeman Health System, Series 2015, 5.000%, 2/15/35 | | | |
| 500 | | Missouri Health and Educational Facilities Authority, Health Facilities Revenue Bonds, | 1/25 at 100.00 | AA | 532,955 |
| | BJC Health System, Series 2015A, 4.000%, 1/01/45 | | | |
62
| | | | | | |
| Principal | | | Optional Call | | |
| Amount (000) | | Description (1) | Provisions (2) | Ratings (3) | Value |
| | Health Care (continued) | | | |
| $ 500 | | Missouri Health and Educational Facilities Authority, Health Facilities Revenue Bonds, | 7/26 at 100.00 | AA | $ 539,855 |
| | BJC Health System, Variable Rate Demand Obligation Series 2013C, 4.000%, 1/01/50 (Mandatory | | | |
| | Put 1/01/46) | | | |
| 750 | | Missouri Health and Educational Facilities Authority, Health Facilities Revenue Bonds, | 1/28 at 100.00 | AA | 812,378 |
| | BJC Health System, Series 2017D, 4.000%, 1/01/58 (UB) (5) | | | |
| 540 | | Missouri Health and Educational Facilities Authority, Health Facilities Revenue Bonds, | 11/20 at 100.00 | Baa2 | 555,638 |
| | Capital Region Medical Center, Series 2011, 5.000%, 11/01/27 | | | |
| 1,730 | | Missouri Health and Educational Facilities Authority, Health Facilities Revenue Bonds, | 11/23 at 100.00 | A2 | 1,886,547 |
| | CoxHealth, Series 2013A, 5.000%, 11/15/44 | | | |
| 415 | | Missouri Health and Educational Facilities Authority, Health Facilities Revenue Bonds, | 11/25 at 100.00 | A2 | 482,774 |
| | CoxHealth, Series 2015A, 5.000%, 11/15/32 | | | |
| 335 | | Missouri Health and Educational Facilities Authority, Health Facilities Revenue Bonds, | 2/22 at 100.00 | AA– | 356,283 |
| | Heartland Regional Medical Center, Series 2012, 5.000%, 2/15/37 | | | |
| 290 | | Missouri Health and Educational Facilities Authority, Health Facilities Revenue Bonds, | 11/22 at 100.00 | AA– | 302,125 |
| | Mercy Health, Series 2012, 4.000%, 11/15/42 | | | |
| 550 | | Missouri Health and Educational Facilities Authority, Health Facilities Revenue Bonds, | 11/24 at 100.00 | AA– | 589,913 |
| | Mercy Health, Series 2014F, 4.250%, 11/15/48 | | | |
| 515 | | Missouri Health and Educational Facilities Authority, Health Facilities Revenue Bonds, | 11/27 at 100.00 | AA– | 609,348 |
| | Mercy Health, Series 2017C, 5.000%, 11/15/47 | | | |
| 500 | | Missouri Health and Educational Facilities Authority, Health Facilities Revenue Bonds, | 12/21 at 100.00 | A+ | 533,565 |
| | Saint Luke’s Episcopal and Presbyterian Hospitals, Series 2011, 5.000%, 12/01/25 | | | |
| 2,000 | | Missouri Health and Educational Facilities Authority, Health Facility Revenue Bonds, | 11/20 at 100.00 | A+ | 2,061,140 |
| | Saint Luke’s Health System, Series 2010A, 5.000%, 11/15/30 | | | |
| 350 | | Missouri Health and Educational Facilities Authority, Revenue Bonds, Children’s Mercy | 5/25 at 102.00 | A+ | 371,836 |
| | Hospital, Series 2017A, 4.000%, 5/15/48 | | | |
| 500 | | Saint Louis County Industrial Development Authority, Missouri, Health Facilities Revenue | 11/25 at 100.00 | N/R | 549,255 |
| | Bonds, Ranken-Jordan Project, Refunding & Improvement Series 2016, 5.000%, 11/15/46 | | | |
| 11,110 | | Total Health Care | | | 11,984,206 |
| | Housing/Single Family – 0.6% (0.4% of Total Investments) | | | |
| 175 | | Missouri Housing Development Commission, Single Family Mortgage Revenue Bonds, First | 11/26 at 100.00 | AA+ | 187,028 |
| | Place Homeownership Loan Program, Series 2017A-2, 3.800%, 11/01/37 | | | |
| | Long-Term Care – 11.7% (7.6% of Total Investments) | | | |
| 190 | | Bridgeton Industrial Development Authority, Missouri, Senior Housing Revenue Bonds, The | 5/25 at 100.00 | N/R | 193,048 |
| | Sarah Community Project, Refunding Series 2016, 4.000%, 5/01/33 | | | |
| 250 | | Bridgeton Industrial Development Authority, Missouri, Senior Housing Revenue Bonds, The | 12/19 at 100.00 | N/R | 250,085 |
| | Sarah Community Project, Series 2013, 4.500%, 5/01/28 | | | |
| 100 | | Kirkwood Industrial Development Authority, Missouri, Retirement Community Revenue Bonds, | 5/27 at 100.00 | BB | 113,633 |
| | Aberdeen Heights Project, Refunding Series 2017A, 5.250%, 5/15/37 | | | |
| 250 | | Lees Summit Industrial Development Authority, Missouri, Revenue Bonds, John Knox Village | 8/24 at 100.00 | BB+ | 269,807 |
| | Obligated Group, Series 2014A, 5.250%, 8/15/39 | | | |
| 250 | | Missouri Health and Educational Facilities Authority, Revenue Bonds, Lutheran Senior | 2/21 at 100.00 | BBB | 261,680 |
| | Services Projects, Series 2011, 6.000%, 2/01/41 | | | |
| | Missouri Health and Educational Facilities Authority, Revenue Bonds, Lutheran Senior | | | |
| | Services Projects, Series 2014A: | | | |
| 385 | | 5.000%, 2/01/35 | 2/24 at 100.00 | BBB | 423,011 |
| 500 | | 5.000%, 2/01/44 | 2/24 at 100.00 | BBB | 542,915 |
| 300 | | Missouri Health and Educational Facilities Authority, Revenue Bonds, Lutheran Senior | 2/26 at 100.00 | BBB | 336,618 |
| | Services Projects, Series 2016B, 5.000%, 2/01/46 | | | |
| 200 | | Missouri Health and Educational Facilities Authority, Revenue Bonds, Lutheran Senior | 2/24 at 104.00 | BBB | 224,706 |
| | Services Projects, Series 2019A, 5.000%, 2/01/42 | | | |
| 100 | | Missouri Health and Educational Facilities Authority, Revenue Bonds, Lutheran Senior | 2/29 at 100.00 | BBB | 104,665 |
| | Services Projects, Series 2019C, 4.000%, 2/01/48 | | | |
63
| | | | | |
| NOM | Nuveen Missouri Quality Municipal Income Fund | |
| Portfolio of Investments (continued) | | | |
| November 30, 2019 (Unaudited) | | | |
|
|
|
|
| Principal | | | Optional Call | | |
| Amount (000) | | Description (1) | Provisions (2) | Ratings (3) | Value |
| | Long-Term Care (continued) | | | |
| | Saint Louis County Industrial Development Authority, Missouri, Revenue Bonds, Friendship | | | |
| | Village of Sunset Hills, Series 2012: | | | |
| $ 250 | | 5.000%, 9/01/32 | 9/22 at 100.00 | BB+ | $ 265,647 |
| 250 | | 5.000%, 9/01/42 | 9/22 at 100.00 | BB+ | 262,933 |
| 430 | | Saint Louis County Industrial Development Authority, Missouri, Revenue Bonds, Friendship | 9/23 at 100.00 | BB+ | 477,481 |
| | Village of Sunset Hills, Series 2013A, 5.875%, 9/01/43 | | | |
| 100 | | Saint Louis County Industrial Development Authority, Missouri, Revenue Bonds, Saint | 12/25 at 100.00 | N/R | 109,001 |
| | Andrew’s Resources for Seniors, Series 2015A, 5.125%, 12/01/45 | | | |
| 3,555 | | Total Long-Term Care | | | 3,835,230 |
| | Tax Obligation/General – 24.6% (15.9% of Total Investments) | | | |
| 500 | | Branson Reorganized School District R-4, Taney County, Missouri, General Obligation | 3/22 at 100.00 | A+ | 531,715 |
| | Bonds, School Building Series 2012, 4.375%, 3/01/32 | | | |
| | Clay County Public School District 53, Liberty, Missouri, General Obligation Bonds, | | | |
| | Series 2018: | | | |
| 1,000 | | 4.000%, 3/01/34 | 3/26 at 100.00 | AA | 1,111,480 |
| 335 | | 4.000%, 3/01/36 | 3/26 at 100.00 | AA | 370,051 |
| 340 | | Clay County Reorganized School District R-II Smithville, Missouri, General Obligation | 3/27 at 100.00 | AA+ | 380,110 |
| | Bonds, Refunding Series 2015, 4.000%, 3/01/36 | | | |
| 500 | | Fort Zumwalt School District, Callaway County, Missouri, General Obligation Bonds, | 3/24 at 100.00 | AA+ | 548,225 |
| | Refunding & Improvement Series 2015, 4.000%, 3/01/32 | | | |
| 200 | | Fort Zumwalt School District, Callaway County, Missouri, General Obligation Bonds, | 3/27 at 100.00 | AA+ | 241,360 |
| | Refunding & Improvement Series 2018, 5.000%, 3/01/36 | | | |
| | Independence School District, Jackson County, Missouri, General Obligation Bonds, | | | |
| | Series 2010: | | | |
| 30 | | 5.000%, 3/01/27 | 3/20 at 100.00 | N/R | 30,268 |
| 590 | | 5.000%, 3/01/27 | 3/20 at 100.00 | AA+ | 595,268 |
| 500 | | Jackson County Reorganized School District 4, Blue Springs, Missouri, General Obligation | 3/21 at 100.00 | AA– | 522,120 |
| | Bonds, School Building Series 2013A, 5.000%, 3/01/31 | | | |
| 1,000 | | Joplin Schools, Missouri, General Obligation Bonds, Refunding, Direct Deposit Program | 3/27 at 100.00 | AA+ | 1,140,180 |
| | Series 2017, 4.000%, 3/01/32 | | | |
| 300 | | Kansas City, Missouri, General Obligation Bonds, Refunding & Improvement Series 2018A, | 2/28 at 100.00 | AA | 341,892 |
| | 4.000%, 2/01/35 | | | |
| 1,000 | | Valley Park Fire Protection District, Missouri, General Obligation Bonds, Series 2019, | 3/27 at 100.00 | AA | 1,116,540 |
| | 4.000%, 3/01/39 | | | |
| 1,000 | | Washington School District, Franklin County, Missouri, General Obligation Bonds, | 3/27 at 100.00 | AA+ | 1,127,050 |
| | Missouri Direct Deposit Program, Series 2019, 4.000%, 3/01/35 | | | |
| 7,295 | | Total Tax Obligation/General | | | 8,056,259 |
| | Tax Obligation/Limited – 25.0% (16.1% of Total Investments) | | | |
| 910 | | Bi-State Development Agency of the Missouri-Illinois Metropolitan District, Mass Transit | 10/22 at 100.00 | AA+ | 1,000,217 |
| | Sales Tax Appropriation Bonds, Refunding Combined Lien Series 2013A, 5.000%, 10/01/33 | | | |
| 500 | | Bi-State Development Agency of the Missouri-Illinois Metropolitan District, Mass Transit | 10/29 at 100.00 | AA+ | 565,780 |
| | Sales Tax Appropriation Bonds, Refunding Combined Lien Series 2019, 4.000%, 10/01/48 | | | |
| 350 | | Blue Springs, Missouri, Special Obligation Tax Increment Bonds, Adams Farm Project, | 6/24 at 100.00 | N/R | 359,394 |
| | Special Districts Refunding & Improvement Series 2015A, 4.750%, 6/01/30 | | | |
| 145 | | Clay, Jackson & Platte Counties Consolidated Public Library District 3, Missouri, | 3/26 at 100.00 | Aa3 | 159,348 |
| | Certificates of Participation, Mid-Continent Public Library Project, Series 2018, | | | |
| | 4.000%, 3/01/35 | | | |
| 250 | | Conley Road Transportation District, Missouri, Transportation Sales Tax Revenue Bonds, | 5/25 at 100.00 | N/R | 260,835 |
| | Series 2017, 5.125%, 5/01/41 | | | |
| 350 | | Fenton Missouri Fire Protection District, Missouri, General Obligation Bonds, Series | 3/27 at 100.00 | AA+ | 390,789 |
| | 2019, 4.000%, 3/01/39 | | | |
64
| | | | | | |
| Principal | | | Optional Call | | |
| Amount (000) | | Description (1) | Provisions (2) | Ratings (3) | Value |
| | Tax Obligation/Limited (continued) | | | |
| $ 315 | | Fulton, Missouri, Tax Increment Revenue Bonds, Fulton Commons Redevelopment Project, | 12/19 at 100.00 | N/R | $ 214,200 |
| | Series 2006, 5.000%, 6/01/28 (6) | | | |
| 430 | | Government of Guam, Business Privilege Tax Bonds, Series 2012B-1, 5.000%, 1/01/42 | 1/22 at 100.00 | BB | 447,286 |
| | Howard Bend Levee District, St Louis County, Missouri, Levee District Improvement Bonds, | | | |
| | Series 2013B: | | | |
| 250 | | 4.875%, 3/01/33 | 3/23 at 100.00 | BB+ | 258,580 |
| 200 | | 5.000%, 3/01/38 | 3/23 at 100.00 | BB+ | 206,632 |
| 485 | | Jackson County, Missouri, Special Obligation Bonds, Truman Medical Center Project, | 12/21 at 100.00 | Aa3 | 513,368 |
| | Series 2011B, 4.350%, 12/01/23 | | | |
| 300 | | Kansas City Industrial Development Authority, Missouri, Downtown Redevelopment District | 9/21 at 100.00 | AA– | 317,868 |
| | Revenue Bonds, Series 2011A, 5.000%, 9/01/32 | | | |
| 140 | | Kansas City Industrial Development Authority, Missouri, Sales Tax Revenue Bonds, Ward | No Opt. Call | N/R | 146,069 |
| | Parkway Center Community Improvement District, Senior Refunding & Improvement Series 2016, | | | |
| | 4.250%, 4/01/26, 144A | | | |
| 325 | | Kansas City, Missouri, Special Obligation Bonds, Downtown Redevelopment District, Series | 9/23 at 100.00 | AA– | 362,723 |
| | 2014C, 5.000%, 9/01/33 | | | |
| | Land Clearance for Redevelopment Authority of Kansas City, Missouri, Project Revenue | | | |
| | Bonds, Convention Center Hotel Project – TIF Financing, Series 2018B: | | | |
| 100 | | 5.000%, 2/01/40, 144A | 2/28 at 100.00 | N/R | 110,340 |
| 100 | | 5.000%, 2/01/50, 144A | 2/28 at 100.00 | N/R | 108,638 |
| 245 | | Missouri Development Finance Board, Infrastructure Facilities Revenue Bonds, City of | 6/23 at 100.00 | A | 259,210 |
| | Branson – Branson Landing Project, Series 2015A, 4.000%, 6/01/34 | | | |
| 325 | | Osage Beach, Missouri, Tax Increment Revenue Bonds, Prewitts Point Project, Series 2006, | 12/19 at 100.00 | N/R | 320,684 |
| | 5.000%, 5/01/23 | | | |
| 140 | | Plaza at Noah’s Ark Community Improvement District, Saint Charles, Missouri, Tax | 5/21 at 100.00 | N/R | 141,670 |
| | Increment and Improvement District Revenue Bonds, Series 2015, 5.000%, 5/01/30 | | | |
| | Puerto Rico Sales Tax Financing Corporation, Sales Tax Revenue Bonds, | | | |
| | Restructured 2018A-1: | | | |
| 2 | | 4.550%, 7/01/40 | 7/28 at 100.00 | N/R | 2,070 |
| 59 | | 0.000%, 7/01/46 | 7/28 at 41.38 | N/R | 15,598 |
| 356 | | 0.000%, 7/01/51 | 7/28 at 30.01 | N/R | 69,794 |
| 17 | | 4.750%, 7/01/53 | 7/28 at 100.00 | N/R | 17,592 |
| 153 | | 5.000%, 7/01/58 | 7/28 at 100.00 | N/R | 160,765 |
| | Puerto Rico Sales Tax Financing Corporation, Sales Tax Revenue Bonds, Taxable | | | |
| | Restructured Cofina Project Series 2019A-2: | | | |
| 432 | | 4.329%, 7/01/40 | 7/28 at 100.00 | N/R | 439,016 |
| 9 | | 4.784%, 7/01/58 | 7/28 at 100.00 | N/R | 9,283 |
| 50 | | Saint Charles County Industrial Development Authority, Missouri, Sales Tax Revenue | 11/29 at 102.00 | N/R | 49,789 |
| | Bonds, Wentzville Parkway Regional Community Improvement District Project, Series 2019B, | | | |
| | 4.250%, 11/01/49, 144A | | | |
| 250 | | Saint Louis County Industrial Development Authority, Missouri, Sales Tax Revenue Bonds, | 7/24 at 100.00 | N/R | 257,462 |
| | Chesterfield Blue Valley Community Improvement District Project, Series 2014A, 5.250%, | | | |
| | 7/01/44, 144A | | | |
| 600 | | Springfield, Missouri, Special Obligation Bonds, Sewer System Improvements Project, | 4/25 at 100.00 | Aa2 | 657,384 |
| | Series 2015, 4.000%, 4/01/35 | | | |
| 100 | | The Industrial Development Authority of the City of Saint Louis, Missouri, Development | 11/26 at 100.00 | N/R | 109,003 |
| | Financing Revenue Bonds, Ballpark Village Development Project, Series 2017A, 4.750%, 11/15/47 | | | |
| 215 | | Transportation Development District, Missouri, Transportation Sales Tax Revenue Bonds, | 6/26 at 100.00 | BBB | 232,765 |
| | Series 2017, 4.500%, 6/01/36 | | | |
| 8,103 | | Total Tax Obligation/Limited | | | 8,164,152 |
| | Transportation – 1.2% (0.8% of Total Investments) | | | |
| 335 | | Guam International Airport Authority, Revenue Bonds, Series 2013B, 5.500%, 10/01/33 – | 10/23 at 100.00 | AA | 383,133 |
| | AGM Insured | | | |
65
| | | | | |
| NOM | Nuveen Missouri Quality Municipal Income Fund | |
| Portfolio of Investments (continued) | | | |
| November 30, 2019 (Unaudited) | | | |
|
|
|
| Principal | | | Optional Call | | |
| Amount (000) | | Description (1) | Provisions (2) | Ratings (3) | Value |
| | U.S. Guaranteed – 19.9% (12.9% of Total Investments) (7) | | | |
| $ 2,000 | | Metropolitan St Louis Sewerage District, Missouri, Wastewater System Revenue Bonds, | 5/22 at 100.00 | AAA | $ 2,186,080 |
| | Series 2012A, 5.000%, 5/01/42 (Pre-refunded 5/01/22) | | | |
| 630 | | Missouri Health and Educational Facilities Authority, Revenue Bonds, AT Still University | 10/21 at 100.00 | A– | 676,337 |
| | of Health Sciences, Series 2011, 5.250%, 10/01/41 (Pre-refunded 10/01/21) | | | |
| 510 | | Missouri Health and Educational Facilities Authority, Revenue Bonds, AT Still University | 10/23 at 100.00 | A– | 582,282 |
| | of Health Sciences, Series 2014, 5.000%, 10/01/39 (Pre-refunded 10/01/23) | | | |
| 600 | | Missouri Health and Educational Facilities Authority, Revenue Bonds, Webster University, | 4/21 at 100.00 | Baa1 | 630,180 |
| | Series 2011, 5.000%, 4/01/36 (Pre-refunded 4/01/21) | | | |
| | Missouri Joint Municipal Electric Utility Commission, Power Supply System Revenue Bonds, | | | |
| | MoPEP Facilities, Series 2012: | | | |
| 400 | | 5.000%, 1/01/32 (Pre-refunded 1/01/21) | 1/21 at 100.00 | A2 | 416,356 |
| 425 | | 5.000%, 1/01/37 (Pre-refunded 1/01/21) | 1/21 at 100.00 | A2 | 442,378 |
| 100 | | Saint Louis County Industrial Development Authority, Missouri, Revenue Bonds, Friendship | 9/22 at 100.00 | N/R | 110,141 |
| | Village of Chesterfield, Series 2012, 5.000%, 9/01/42 (Pre-refunded 9/01/22) | | | |
| 920 | | Springfield Public Building Corporation, Missouri, Lease Revenue Bonds, Jordan Valley | 2/20 at 100.00 | N/R | 959,137 |
| | Park Projects, Series 2000A, 6.125%, 6/01/21 – AMBAC Insured (ETM) | | | |
| 500 | | St Louis County, Missouri, GNMA Collateralized Mortgage Revenue Bonds, Series 1993D, | No Opt. Call | AA+ | 512,505 |
| | 5.650%, 7/01/20 (AMT) (ETM) | | | |
| 6,085 | | Total U.S. Guaranteed | | | 6,515,396 |
| | Utilities – 4.7% (3.0% of Total Investments) | | | |
| 350 | | Missouri Joint Municipal Electric Utility Commission, Power Project Revenue Bonds, Plum | 1/25 at 100.00 | A | 403,000 |
| | Point Project, Refunding Series 2014A, 5.000%, 1/01/32 | | | |
| 500 | | Missouri Joint Municipal Electric Utility Commission, Power Project Revenue Bonds, Plum | 1/26 at 100.00 | A | 549,330 |
| | Point Project, Refunding Series 2015A, 4.000%, 1/01/35 | | | |
| 500 | | Missouri Joint Municipal Electric Utility Commission, Power Supply System Revenue Bonds, | 6/27 at 100.00 | A2 | 588,815 |
| | MoPEP Facilities, Series 2018, 5.000%, 12/01/43 | | | |
| 1,350 | | Total Utilities | | | 1,541,145 |
| | Water and Sewer – 9.7% (6.2% of Total Investments) | | | |
| 250 | | Camden County Public Water Supply District 4, Missouri, Certificates of Participation, | 1/25 at 100.00 | A– | 277,540 |
| | Series 2017, 5.000%, 1/01/47 | | | |
| 150 | | Franklin County Public Water Supply District 3, Missouri, Certificates of Participation, | 12/24 at 100.00 | A+ | 163,171 |
| | Series 2017, 4.000%, 12/01/37 | | | |
| 160 | | Kansas City, Missouri, Sanitary Sewer System Revenue Bonds, Improvement Series 2018A, | 1/28 at 100.00 | AA | 182,176 |
| | 4.000%, 1/01/35 | | | |
| 125 | | Metropolitan St Louis Sewerage District, Missouri, Wastewater System Revenue Bonds, | 5/26 at 100.00 | AAA | 146,780 |
| | Refunding & Improvement Series 2016C, 5.000%, 5/01/46 | | | |
| 450 | | Metropolitan St Louis Sewerage District, Missouri, Wastewater System Revenue Bonds, | 5/27 at 100.00 | AAA | 536,499 |
| | Refunding & Improvement Series 2017A, 5.000%, 5/01/47 | | | |
| 500 | | Missouri Environmental Improvement and Energy Resources Authority, Water Facility | 1/25 at 100.00 | Aa3 | 574,055 |
| | Revenue Bonds, Tri-County Water Authority, Series 2015, 5.000%, 1/01/40 | | | |
| 585 | | Saint Charles County Public Water Supply District 2, Missouri, Certificates of | 12/25 at 100.00 | AA+ | 690,183 |
| | Participation, Refunding Series 2016C, 5.000%, 12/01/32 | | | |
| 550 | | Saint Charles County Public Water Supply District 2, Missouri, Certificates of | 12/25 at 100.00 | AA+ | 597,531 |
| | Participation, Series 2018, 4.000%, 12/01/39 | | | |
| 2,770 | | Total Water and Sewer | | | 3,167,935 |
| $ 47,058 | | Total Long-Term Investments (cost $47,531,533) | | | 50,715,069 |
| | Floating Rate Obligations – (1.8)% | | | (600,000) |
| | MuniFund Preferred Shares, net of deferred offering costs – (54.3)% (8) | | | (17,775,140) |
| | Other Assets Less Liabilities – 1.1% | | | 386,985 |
| | Net Asset Applicable to Common Shares – 100% | | | $ 32,726,914 |
66
| | |
(1) | All percentages shown in the Portfolio of Investments are based on net assets applicable to common shares unless otherwise noted. |
(2) | Optional Call Provisions: Dates (month and year) and prices of the earliest optional call or redemption. There may be other call provisions at varying prices at later dates. Certain mortgage-backed securities may be subject to periodic principal paydowns. |
(3) | For financial reporting purposes, the ratings disclosed are the highest of Standard & Poor’s Group (“Standard & Poor’s”), Moody’s Investors Service, Inc. (“Moody’s”) or Fitch, Inc. (“Fitch”) rating. This treatment of split-rated securities may differ from that used for other purposes, such as for Fund investment policies. Ratings below BBB by Standard & Poor’s, Baa by Moody’s or BBB by Fitch are considered to be below investment grade. Holdings designated N/R are not rated by any of these national rating agencies. |
(4) | Effective February 12, 2019, the par value of the original bonds was replaced with taxable and tax exempt Puerto Rico Sales Tax Financing Corporation (commonly known as COFINA) bond units that are collateralized by a bundle of zero and coupon paying bonds. The quantity shown represents units in a trust, which were assigned according to the original bond’s accreted value. These securities do not have a stated coupon interest rate and income will be recognized through accretion of the discount associated with the trust units. The factor at which these units accrete can also decrease, primarily for principal payments generated from coupon payments received or dispositions of the underlying bond collateral. The quantity of units will not change as a result of these principal payments. |
(5) | Investment, or portion of investment, has been pledged to collateralize the net payment obligations for investments in inverse floating rate transactions. |
(6) | Defaulted security. A security whose issuer has failed to fully pay principal and/or interest when due, or is under the protection of bankruptcy. |
(7) | Backed by an escrow or trust containing sufficient U.S. Government or U.S. Government agency securities, which ensure the timely payment of principal and interest. |
(8) | MuniFund Preferred Shares, net of deferred offering costs as a percentage of Total Investments is 35.0%. |
144 A | Investment is exempt from registration under Rule 144A of the Securities Act of 1933, as amended. These investments may only be resold in transactions exempt from registration, which are normally those transactions with qualified institutional buyers. |
AMT | Alternative Minimum Tax |
ETM | Escrowed to maturity |
UB | Underlying bond of an inverse floating rate trust reflected as a financing transaction. See Notes to Financial Statements, Note 4 – Portfolio Securities and Investments in Derivatives, Inverse Floating Rate Securities for more information. |
| See accompanying notes to financial statements. |
67
| | |
| NPV | Nuveen Virginia Quality Municipal |
| Income Fund |
| Portfolio of Investments |
| November 30, 2019 (Unaudited) |
| | | | | | |
| Principal | | | Optional Call | | |
| Amount (000) | | Description (1) | Provisions (2) | Ratings (3) | Value |
| | LONG-TERM INVESTMENTS – 153.7% (100.0% of Total Investments) | | | |
| | MUNICIPAL BONDS – 153.7% (100.0% of Total Investments) | | | |
| | Consumer Staples – 4.6% (3.0% of Total Investments) | | | |
| | Guam Economic Development & Commerce Authority, Tobacco Settlement Asset-Backed Bonds, | | | |
| | Series 2007A: | | | |
| $ 550 | | 5.250%, 6/01/32 | 1/20 at 100.00 | N/R | $ 550,000 |
| 700 | | 5.625%, 6/01/47 | 12/19 at 100.00 | N/R | 699,972 |
| 4,135 | | Tobacco Settlement Financing Corporation of Virginia, Tobacco Settlement Asset Backed | 12/19 at 100.00 | B– | 4,146,206 |
| | Bonds, Series 2007B1, 5.000%, 6/01/47 | | | |
| 6,645 | | Tobacco Settlement Financing Corporation of Virginia, Tobacco Settlement Asset-Backed | 6/21 at 100.00 | B– | 6,682,677 |
| | Bonds, Series 2007B2, 5.200%, 6/01/46 | | | |
| 100 | | Tobacco Settlement Financing Corporation, Virgin Islands, Tobacco Settlement | 12/19 at 100.00 | A3 | 100,203 |
| | Asset-Backed Bonds, Series 2001, 5.000%, 5/15/31 | | | |
| 12,130 | | Total Consumer Staples | | | 12,179,058 |
| | Education and Civic Organizations – 12.5% (8.1% of Total Investments) | | | |
| 1,615 | | Alexandria Industrial Development Authority, Virginia, Educational Facilities Revenue | 1/22 at 100.00 | A1 | 1,669,732 |
| | Bonds, Episcopal High School, Series 2012, 3.750%, 1/01/30 | | | |
| | Alexandria Industrial Development Authority, Virginia, Educational Facilities Revenue | | | |
| | Bonds, Episcopal High School, Series 2017: | | | |
| 1,105 | | 4.000%, 1/01/37 | 1/27 at 100.00 | A1 | 1,223,368 |
| 565 | | 4.000%, 1/01/40 | 1/27 at 100.00 | A1 | 621,037 |
| 520 | | Amherst Industrial Development Authority, Virginia, Revenue Bonds, Sweet Briar College, | 12/19 at 100.00 | BB– | 520,135 |
| | Series 2006, 5.000%, 9/01/26 | | | |
| 1,000 | | Industrial Development Authority of the City of Lexington, Virginia, Washington and Lee | 1/28 at 100.00 | AA | 1,218,310 |
| | University, Educational Facility Revenue Bonds, Refunding Series 2018A, 5.000%, 1/01/43 | | | |
| 500 | | Montgomery County Economic Development Authority, Virginia, Revenue Bonds, Virginia Tech | 6/27 at 100.00 | Aa2 | 564,595 |
| | Foundation, Refunding Series 2017A, 4.000%, 6/01/36 | | | |
| | Montgomery County Economic Development Authority, Virginia, Revenue Bonds, Virginia Tech | | | |
| | Foundation, Refunding Series 2019A: | | | |
| 500 | | 4.000%, 6/01/37 | 6/29 at 100.00 | Aa2 | 573,025 |
| 905 | | 4.000%, 6/01/39 | 6/29 at 100.00 | Aa2 | 1,032,614 |
| 750 | | Roanoke Economic Development Authority, Virginia, Educational Facilities Revenue Bonds, | 9/28 at 100.00 | BBB+ | 879,052 |
| | Lynchburg College, Series 2018A, 5.000%, 9/01/43 | | | |
| 2,500 | | The Rector and Visitors of the University of Virginia, General Pledge Revenue Bonds, | 4/25 at 100.00 | AAA | 2,903,225 |
| | Green Series 2015A-2, 5.000%, 4/01/45 | | | |
| | The Rector and Visitors of the University of Virginia, General Pledge Revenue Bonds, | | | |
| | Refunding Series 2017A: | | | |
| 9,000 | | 5.000%, 4/01/42 (UB) (4) | 4/27 at 100.00 | AAA | 10,924,020 |
| 1,515 | | 5.000%, 4/01/42 | 4/27 at 100.00 | AAA | 1,838,877 |
| 1,000 | | Virginia College Building Authority, Educational Facilities Revenue Bonds, Marymount | 7/25 at 100.00 | BB+ | 1,069,630 |
| | University Project, Green Series 2015B, 5.000%, 7/01/45, 144A | | | |
| | Virginia College Building Authority, Educational Facilities Revenue Bonds, Marymount | | | |
| | University Project, Refunding Series 2015A: | | | |
| 1,500 | | 5.000%, 7/01/35, 144A | 7/25 at 100.00 | BB+ | 1,628,115 |
| 4,000 | | 5.000%, 7/01/45, 144A | 7/25 at 100.00 | BB+ | 4,278,520 |
| 150 | | Virginia College Building Authority, Educational Facilities Revenue Bonds, Washington | No Opt. Call | AA | 153,739 |
| | and Lee University, Series 2001, 5.375%, 1/01/21 | | | |
| 1,460 | | Virginia College Building Authority, Educational Facilities Revenue Bonds, Washington | 1/25 at 100.00 | AA | 1,679,292 |
| | and Lee University, Series 2015A, 5.000%, 1/01/40 | | | |
68
| | | | | | |
| Principal | | | Optional Call | | |
| Amount (000) | | Description (1) | Provisions (2) | Ratings (3) | Value |
| | Education and Civic Organizations (continued) | | | |
| $ 500 | | Virginia Small Business Finance Authority, Educational Facilities Revenue Bonds, Roanoke | 4/20 at 100.00 | BBB+ | $ 506,850 |
| | College, Series 2011, 5.750%, 4/01/41 | | | |
| 29,085 | | Total Education and Civic Organizations | | | 33,284,136 |
| | Financials – 0.1% (0.1% of Total Investments) | | | |
| 290 | | Puerto Rico Urgent Interest Fund Corp (COFINA), National Custodial Taxable Trust Unit, | No Opt. Call | N/R | 39,869 |
| | Series 2007A Sr. Bond, 0.000%, 8/01/41 (5) | | | |
| 2,881 | | Puerto Rico Urgent Interest Fund Corp (COFINA), National Custodial Taxable-Exempt Trust | No Opt. Call | N/R | 144,028 |
| | Unit, Series 2007A Sr. Bond, 0.000%, 8/01/41 (5) | | | |
| 3,171 | | Total Financials | | | 183,897 |
| | Health Care – 20.0% (13.0% of Total Investments) | | | |
| 5,000 | | Arlington County Industrial Development Authority, Virginia, Hospital Facility Revenue | 7/20 at 100.00 | AA– | 5,089,750 |
| | Bonds, Virginia Hospital Center Arlington Health System, Refunding Series 2010, 5.000%, 7/01/31 | | | |
| 1,755 | | Chattanooga Health, Educational and Housing Facility Board, Tennessee, Revenue Bonds, | 8/29 at 100.00 | BBB+ | 1,890,802 |
| | CommonSpirit Health, Series 2019A-1, 4.000%, 8/01/44 | | | |
| 1,000 | | Chesapeake Hospital Authority, Virginia, Hospital Facility Revenue Bonds, Chesapeake | 7/29 at 100.00 | A | 1,120,880 |
| | Regional Medical Center, Series 2019, 4.000%, 7/01/39 | | | |
| 1,000 | | Fairfax County Industrial Development Authority, Virginia, Healthcare Revenue Bonds, | 5/22 at 100.00 | AA+ | 1,079,980 |
| | Inova Health System, Series 2012A, 5.000%, 5/15/40 | | | |
| 2,000 | | Fairfax County Industrial Development Authority, Virginia, Healthcare Revenue Bonds, | 5/28 at 100.00 | AA+ | 2,203,660 |
| | Inova Health System, Series 2018A, 4.000%, 5/15/48 | | | |
| 4,950 | | Fairfax County Industrial Development Authority, Virginia, Hospital Revenue Refunding | No Opt. Call | AA+ | 5,370,898 |
| | Bonds, Inova Health System, Series 1993A, 5.000%, 8/15/23 | | | |
| 2,500 | | Fredericksburg Economic Development Authority, Virginia, Hospital Facilities Revenue | No Opt. Call | A3 | 2,802,925 |
| | Bonds, MediCorp Health System, Series 2007, 5.250%, 6/15/23 | | | |
| 3,500 | | Industrial Development Authority of the City of Newport News, Virginia, Health System | 7/25 at 100.00 | N/R | 3,822,805 |
| | Revenue Bonds, Riverside Health System, Series 2015A, 5.330%, 7/01/45, 144A | | | |
| | Lynchburg Economic Development Authority, Virginia, Hospital Revenue Bonds, Centra | | | |
| | Health Obligated Group, Refunding Series 2017A: | | | |
| 155 | | 5.000%, 1/01/31 | 1/27 at 100.00 | A | 185,168 |
| 2,000 | | 5.000%, 1/01/47 | 1/27 at 100.00 | A | 2,323,100 |
| 1,000 | | Norfolk Economic Development Authority, Virginia, Hospital Facility Revenue Bonds, | 11/28 at 100.00 | AA | 1,106,170 |
| | Sentara Healthcare Systems, Refunding Series 2018B, 4.000%, 11/01/48 | | | |
| 3,155 | | Prince William County Industrial Development Authority, Virginia, Health Care Facilities | 11/22 at 100.00 | AA– | 3,402,541 |
| | Revenue Bonds, Novant Health Obligated Group-Prince William Hospital, Refunding Series 2013B, | | | |
| | 5.000%, 11/01/46 | | | |
| | Stafford County Economic Development Authority, Virginia, Hospital Facilities Revenue | | | |
| | Bonds, Mary Washington Healthcare Obligated Group, Refunding Series 2016: | | | |
| 1,000 | | 5.000%, 6/15/32 | 6/26 at 100.00 | A3 | 1,182,170 |
| 1,440 | | 5.000%, 6/15/35 | 6/26 at 100.00 | A3 | 1,688,789 |
| 1,360 | | 4.000%, 6/15/37 | 6/26 at 100.00 | A3 | 1,457,430 |
| 3,200 | | Virginia Commonwealth University Health System Authority, General Revenue Bonds, Series | 7/27 at 100.00 | AA– | 3,783,968 |
| | 2017B, 5.000%, 7/01/46 | | | |
| 2,975 | | Virginia Small Business Finance Authority, Healthcare Facilities Revenue Bonds, Sentara | 5/20 at 100.00 | AA | 3,018,703 |
| | Healthcare, Refunding Series 2010, 5.000%, 11/01/40 | | | |
| 2,700 | | Washington Health Care Facilities Authority, Revenue Bonds, CommonSpirit Health, Series | 8/29 at 100.00 | BBB+ | 2,908,926 |
| | 2019A-1, 4.000%, 8/01/44 | | | |
| 2,335 | | Winchester Economic Development Authority, Virginia, Hospital Revenue Bonds, Valley | 1/24 at 100.00 | A+ | 2,553,486 |
| | Health System Obligated Group, Refunding Series 2014A, 5.000%, 1/01/44 | | | |
69
| | |
| NPV | Nuveen Virginia Quality Municipal Income Fund |
| Portfolio of Investments (continued) |
| November 30, 2019 (Unaudited) |
| | | | | | |
| Principal | | | Optional Call | | |
| Amount (000) | | Description (1) | Provisions (2) | Ratings (3) | Value |
| | Health Care (continued) | | | |
| | Winchester Economic Development Authority, Virginia, Hospital Revenue Bonds, Valley | | | |
| | Health System Obligated Group, Refunding Series 2015: | | | |
| $ 1,500 | | 5.000%, 1/01/33 | 1/26 at 100.00 | A+ | $ 1,759,800 |
| 1,000 | | 5.000%, 1/01/35 | 1/26 at 100.00 | A+ | 1,166,910 |
| 2,000 | | 4.000%, 1/01/37 | 1/26 at 100.00 | A+ | 2,182,520 |
| 1,215 | | 5.000%, 1/01/44 | 1/26 at 100.00 | A+ | 1,382,476 |
| 48,740 | | Total Health Care | | | 53,483,857 |
| | Housing/Multifamily – 6.1% (4.0% of Total Investments) | | | |
| 1,000 | | Richmond Redevelopment and Housing Authority, Virginia, Multi-Family Housing Revenue | 1/27 at 100.00 | N/R | 1,054,330 |
| | Bonds, American Tobacco Apartments, Series 2017, 5.550%, 1/01/37, 144A | | | |
| 530 | | Virginia Housing Development Authority, Rental Housing Bonds, Series 2010C, | 2/20 at 100.00 | AA+ | 532,767 |
| | 4.550%, 8/01/32 | | | |
| 1,000 | | Virginia Housing Development Authority, Rental Housing Bonds, Series 2012A, | 3/21 at 100.00 | AA+ | 1,016,910 |
| | 3.625%, 3/01/32 | | | |
| | Virginia Housing Development Authority, Rental Housing Bonds, Series 2015A: | | | |
| 1,000 | | 3.500%, 3/01/35 | 3/24 at 100.00 | AA+ | 1,040,420 |
| 1,000 | | 3.625%, 3/01/39 | 3/24 at 100.00 | AA+ | 1,036,940 |
| 900 | | Virginia Housing Development Authority, Rental Housing Bonds, Series 2015C, | 8/24 at 100.00 | AA+ | 942,579 |
| | 4.000%, 8/01/45 | | | |
| 2,750 | | Virginia Housing Development Authority, Rental Housing Bonds, Series 2015E, | 12/24 at 100.00 | AA+ | 2,877,022 |
| | 3.750%, 12/01/40 | | | |
| 1,500 | | Virginia Housing Development Authority, Rental Housing Bonds, Series 2016B, | 5/25 at 100.00 | AA+ | 1,556,955 |
| | 3.350%, 5/01/36 | | | |
| 1,700 | | Virginia Housing Development Authority, Rental Housing Bonds, Series 2017A, | 3/26 at 100.00 | AA+ | 1,790,372 |
| | 3.875%, 3/01/47 | | | |
| 3,000 | | Virginia Housing Development Authority, Rental Housing Bonds, Series 2019A, | 3/28 at 100.00 | AA+ | 3,199,020 |
| | 3.800%, 9/01/44 | | | |
| 1,320 | | Waynesboro Redevelopment and Housing Authority, Virginia, Multifamily Housing Revenue | 4/20 at 100.00 | AA+ | 1,331,009 |
| | Bonds, Epworth Manor, GNMA Collateralized Series 2010, 5.000%, 10/20/51 | | | |
| 15,700 | | Total Housing/Multifamily | | | 16,378,324 |
| | Long-Term Care – 7.1% (4.6% of Total Investments) | | | |
| 900 | | Alexandria Industrial Development Authority, Virginia, Residential Care Facilities | 10/25 at 100.00 | BBB+ | 997,587 |
| | Mortgage Revenue Bonds, Goodwin House Incorporated, Series 2015, 5.000%, 10/01/45 | | | |
| | Fairfax County Economic Development Authority, Virginia, Residential Care Facilities | | | |
| | Mortgage Revenue Bonds, Goodwin House, Inc., Series 2016A: | | | |
| 1,965 | | 5.000%, 10/01/36 | 10/24 at 102.00 | BBB+ | 2,201,999 |
| 700 | | 4.000%, 10/01/42 | 10/24 at 102.00 | BBB+ | 731,591 |
| 1,000 | | Fairfax County Economic Development Authority, Virginia, Residential Care Facilities | 12/23 at 100.00 | BBB+ | 1,081,020 |
| | Revenue Bonds, Vinson Hall LLC, Series 2013A, 5.000%, 12/01/42 | | | |
| 875 | | Henrico County Economic Development Authority, Virginia, Residential Care Facility | 10/20 at 100.00 | N/R | 883,846 |
| | Revenue Bonds, Westminster Canterbury of Richmond, Refunding Series 2015, 4.000%, 10/01/35 | | | |
| 1,000 | | Lexington Industrial Development Authority, Virginia, Residential Care Facility Revenue | 1/25 at 102.00 | BBB– | 1,046,420 |
| | Bonds, Kendal at Lexington Retirement Community Inc., Refunding Series 2016, 4.000%, 1/01/37 | | | |
| 1,000 | | Lexington Industrial Development Authority, Virginia, Residential Care Facility Revenue | 1/23 at 103.00 | BBB– | 1,078,930 |
| | Bonds, Kendal at Lexington Retirement Community Inc., Refunding Series 2017A, 5.000%, 1/01/42 | | | |
| | Norfolk Redevelopment and Housing Authority, Virginia, Fort Norfolk Retirement | | | |
| | Community, Inc., Harbor’s Edge Project, Series 2019A: | | | |
| 1,325 | | 5.000%, 1/01/49 | 1/24 at 104.00 | N/R | 1,437,373 |
| 2,000 | | 5.250%, 1/01/54 | 1/24 at 104.00 | N/R | 2,184,360 |
| | Prince William County Industrial Development Authority, Virginia, Residential Care | | | |
| | Facility Revenue Bonds, Westminster at Lake Ridge, Refunding Series 2016: | | | |
| 670 | | 5.000%, 1/01/37 | 1/25 at 102.00 | BBB | 753,381 |
| 2,000 | | 5.000%, 1/01/46 | 1/25 at 102.00 | BBB | 2,218,940 |
70
| | | | | | |
| Principal | | | Optional Call | | |
| Amount (000) | | Description (1) | Provisions (2) | Ratings (3) | Value |
| | Long-Term Care (continued) | | | |
| $ 1,000 | | Roanoke Economic Development Authority, Virginia, Residential Care Facility Mortgage | 12/22 at 100.00 | N/R | $ 1,037,480 |
| | Revenue Refunding Bonds, Virginia Lutheran Homes Brandon Oaks Project, Series 2012, | | | |
| | 4.625%, 12/01/27 | | | |
| | Suffolk Economic Development Authority, Virginia, Retirement Facilities First Mortgage | | | |
| | Revenue Bonds, Lake Prince Center, Inc./United Church Homes and Services Obligated Group, | | | |
| | Refunding Series 2016: | | | |
| 1,000 | | 5.000%, 9/01/26 | 9/24 at 102.00 | N/R | 1,121,730 |
| 1,920 | | 5.000%, 9/01/31 | 9/24 at 102.00 | N/R | 2,114,688 |
| 17,355 | | Total Long-Term Care | | | 18,889,345 |
| | Tax Obligation/General – 1.9% (1.3% of Total Investments) | | | |
| 2,035 | | Arlington County, Virginia, General Obligation Bonds, Refunding Series 2014B, | No Opt. Call | AAA | 2,245,032 |
| | 5.000%, 8/15/22 | | | |
| 830 | | Bristol, Virginia, General Obligation Bonds, Refunding & Improvement Series 2010, | 7/20 at 100.00 | Aa1 | 848,999 |
| | 5.000%, 7/15/25 | | | |
| 1,510 | | Fairfax County, Virginia, General Obligation Bonds, Refunding Public Improvement Series | No Opt. Call | AAA | 1,529,434 |
| | 2011A, 5.000%, 4/01/20 | | | |
| 380 | | Richmond, Virginia, General Obligation Bonds, Refunding & Public Improvement Series | No Opt. Call | AA+ | 526,657 |
| | 2017D, 5.000%, 3/01/33 | | | |
| 4,755 | | Total Tax Obligation/General | | | 5,150,122 |
| | Tax Obligation/Limited – 32.8% (21.3% of Total Investments) | | | |
| | Arlington County Industrial Development Authority, Virginia, Revenue Bonds, Refunding | | | |
| | County Projects, Series 2017: | | | |
| 1,730 | | 5.000%, 2/15/35 | 8/27 at 100.00 | Aa1 | 2,122,364 |
| 1,340 | | 5.000%, 2/15/37 | 8/27 at 100.00 | Aa1 | 1,632,455 |
| | Buena Vista Public Recreational Facilities Authority, Virginia, Lease Revenue Bonds, | | | |
| | Golf Course Project, Series 2005A: | | | |
| 365 | | 5.250%, 7/15/25 – ACA Insured | 12/19 at 100.00 | N/R | 363,982 |
| 520 | | 5.500%, 7/15/35 – ACA Insured | 12/19 at 100.00 | N/R | 495,362 |
| 600 | | Dulles Town Center Community Development Authority, Loudon County, Virginia Special | 3/22 at 100.00 | N/R | 608,568 |
| | Assessment Refunding Bonds, Dulles Town Center Project, Series 2012, 4.250%, 3/01/26 | | | |
| 100 | | Embrey Mill Community Development Authority, Virginia, Special Assessment Revenue Bonds, | 3/25 at 100.00 | N/R | 104,510 |
| | Series 2015, 5.600%, 3/01/45, 144A | | | |
| 1,000 | | Fairfax County Economic Development Authority, Virginia, County Facilities Revenue | 10/27 at 100.00 | AA+ | 1,237,300 |
| | Bonds, Refunding Series 2017B, 5.000%, 10/01/33 | | | |
| 1,500 | | Fairfax County Economic Development Authority, Virginia, Revenue Bonds, Metrorail | 4/27 at 100.00 | AA+ | 1,790,055 |
| | Parking System Project, Series 2017, 5.000%, 4/01/42 | | | |
| 4,000 | | Government of Guam, Business Privilege Tax Bonds, Refunding Series 2015D, | 11/25 at 100.00 | BB | 4,484,040 |
| | 5.000%, 11/15/34 | | | |
| | Government of Guam, Business Privilege Tax Bonds, Series 2011A: | | | |
| 1,020 | | 5.000%, 1/01/31 | 1/22 at 100.00 | BB | 1,069,531 |
| 500 | | 5.250%, 1/01/36 | 1/22 at 100.00 | BB | 525,880 |
| 1,000 | | Guam Government, Limited Obligation Section 30 Revenue Bonds, Series 2016A, | 12/26 at 100.00 | BB | 1,140,200 |
| | 5.000%, 12/01/34 | | | |
| | Hampton Roads Transportation Accountability Commission, Virginia, Hampton Roads | | | |
| | Transportation Fund Revenue Bonds, Senior Lien Series 2018A: | | | |
| 4,000 | | 5.000%, 7/01/48 (UB) (4) | 1/28 at 100.00 | AA+ | 4,841,480 |
| 2,000 | | 5.000%, 7/01/52 | 1/28 at 100.00 | AA+ | 2,411,480 |
| 13,000 | | 5.000%, 7/01/52 (UB) (4) | 1/28 at 100.00 | AA+ | 15,674,620 |
| 1,000 | | 5.500%, 7/01/57 | 1/28 at 100.00 | AA+ | 1,237,540 |
| 960 | | Lower Magnolia Green Community Development Authority, Virginia, Special Assessment | 3/25 at 100.00 | N/R | 994,378 |
| | Bonds, Series 2015, 5.000%, 3/01/45, 144A | | | |
71
| | |
| NPV | Nuveen Virginia Quality Municipal Income Fund |
| Portfolio of Investments (continued) |
| November 30, 2019 (Unaudited) |
| | | | | | |
| Principal | | | Optional Call | | |
| Amount (000) | | Description (1) | Provisions (2) | Ratings (3) | Value |
| | Tax Obligation/Limited (continued) | | | |
| | Peninsula Town Center Community Development Authority, Virginia, Special Obligation | | | |
| | Bonds, Refunding Series 2018: | | | |
| $ 360 | | 4.500%, 9/01/28, 144A | 9/27 at 100.00 | N/R | $ 397,825 |
| 3,000 | | 5.000%, 9/01/45, 144A | 9/27 at 100.00 | N/R | 3,321,330 |
| 645 | | Puerto Rico Highway and Transportation Authority, Highway Revenue Bonds, Series 2007N, | No Opt. Call | C | 719,665 |
| | 5.500%, 7/01/29 – AMBAC Insured | | | |
| 5,875 | | Puerto Rico Infrastructure Financing Authority, Special Tax Revenue Bonds, Refunding | No Opt. Call | C | 4,030,720 |
| | Series 2005C, 0.000%, 7/01/28 – AMBAC Insured | | | |
| 5,085 | | Puerto Rico Infrastructure Financing Authority, Special Tax Revenue Bonds, Series 2005A, | No Opt. Call | C | 3,308,098 |
| | 0.000%, 7/01/29 – AMBAC Insured | | | |
| | Puerto Rico Sales Tax Financing Corporation, Sales Tax Revenue Bonds, | | | |
| | Restructured 2018A-1: | | | |
| 57 | | 0.000%, 7/01/24 | No Opt. Call | N/R | 49,981 |
| 96 | | 0.000%, 7/01/27 | No Opt. Call | N/R | 76,481 |
| 94 | | 0.000%, 7/01/29 | 7/28 at 98.64 | N/R | 69,632 |
| 121 | | 0.000%, 7/01/31 | 7/28 at 91.88 | N/R | 82,840 |
| 136 | | 0.000%, 7/01/33 | 7/28 at 86.06 | N/R | 86,393 |
| 1,173 | | 4.500%, 7/01/34 | 7/25 at 100.00 | N/R | 1,253,832 |
| 50 | | 4.550%, 7/01/40 | 7/28 at 100.00 | N/R | 51,762 |
| 1,301 | | 0.000%, 7/01/46 | 7/28 at 41.38 | N/R | 343,945 |
| 1,059 | | 0.000%, 7/01/51 | 7/28 at 30.01 | N/R | 207,617 |
| 371 | | 4.750%, 7/01/53 | 7/28 at 100.00 | N/R | 383,929 |
| 4,940 | | 5.000%, 7/01/58 | 7/28 at 100.00 | N/R | 5,190,705 |
| | Puerto Rico Sales Tax Financing Corporation, Sales Tax Revenue Bonds, Taxable | | | |
| | Restructured Cofina Project Series 2019A-2: | | | |
| 1,000 | | 4.329%, 7/01/40 | 7/28 at 100.00 | N/R | 1,016,240 |
| 4 | | 4.536%, 7/01/53 | 7/28 at 100.00 | N/R | 4,064 |
| 62 | | 4.784%, 7/01/58 | 7/28 at 100.00 | N/R | 63,951 |
| 760 | | Puerto Rico, Highway Revenue Bonds, Highway and Transportation Authority, Refunding | No Opt. Call | Baa2 | 832,360 |
| | Series 2007CC, 5.500%, 7/01/28 – NPFG Insured | | | |
| 1,500 | | Virgin Islands Public Finance Authority, Federal Highway Grant Anticipation Loan Note | 9/25 at 100.00 | A | 1,652,070 |
| | Revenue Bonds, Series 2015, 5.000%, 9/01/33, 144A | | | |
| 2,240 | | Virgin Islands Public Finance Authority, Gross Receipts Taxes Loan Note, Working Capital | 10/24 at 100.00 | AA | 2,512,070 |
| | Series 2014A, 5.000%, 10/01/34 – AGM Insured, 144A | | | |
| 1,380 | | Virgin Islands Public Finance Authority, Matching Fund Loan Notes Revenue Bonds, Senior | No Opt. Call | AA | 1,504,310 |
| | Lien, Refunding Series 2013B, 5.000%, 10/01/24 – AGM Insured | | | |
| 1,665 | | Virgin Islands Public Finance Authority, Matching Fund Loan Notes Revenue Bonds, Senior | No Opt. Call | AA | 1,814,983 |
| | Lien, Series 2013A, 5.000%, 10/01/24 – AGM Insured | | | |
| 1,725 | | Virgin Islands Public Finance Authority, Matching Fund Loan Notes Revenue Bonds, Series | 10/22 at 100.00 | AA | 1,878,818 |
| | 2012A, 5.000%, 10/01/32 – AGM Insured | | | |
| 3,500 | | Virginia Commonwealth Transportation Board, Federal Transportation Grant Anticipation | 9/26 at 100.00 | AA+ | 4,283,265 |
| | Revenue Notes, Series 2016, 5.000%, 9/15/30 | | | |
| 2,000 | | Virginia Public Building Authority, Public Facilities Revenue Bonds, Series 2019B, | 8/29 at 100.00 | AA+ | 2,272,840 |
| | 4.000%, 8/01/38 (AMT) | | | |
| 2,000 | | Virginia Public School Authority, School Financing Bonds, 1997 Resolution, Series 2015A, | 8/25 at 100.00 | AA+ | 2,406,740 |
| | 5.000%, 8/01/26 | | | |
| 1,250 | | Virginia Resources Authority, Infrastructure Revenue Bonds, Pooled Financing Program, | 11/22 at 100.00 | AAA | 1,371,450 |
| | Series 2012A, 5.000%, 11/01/42 | | | |
| 120 | | Virginia Small Business Finance Authority, Tourism Development Financing Program Revenue | 4/28 at 112.76 | N/R | 142,687 |
| | Bonds, Downtown Norfolk and Virginia Beach Oceanfront Hotel Projects, Series 2018A, 8.375%, | | | |
| | 4/01/41, 144A | | | |
| 1,000 | | Virginia Transportation Board, Transportation Revenue Bonds, Capital Projects, Series | 5/22 at 100.00 | AA+ | 1,058,960 |
| | 2012, 4.000%, 5/15/37 | | | |
72
| | | | | | |
| Principal | | | Optional Call | | |
| Amount (000) | | Description (1) | Provisions (2) | Ratings (3) | Value |
| | Tax Obligation/Limited (continued) | | | |
| $ 1,000 | | Virginia Transportation Board, Transportation Revenue Bonds, Capital Projects, Series | 5/27 at 100.00 | AA+ | $ 1,110,140 |
| | 2017, 4.000%, 5/15/42 | | | |
| 1,000 | | Virginia Transportation Board, Transportation Revenue Bonds, Capital Projects, Series | 5/28 at 100.00 | AA+ | 1,138,780 |
| | 2018, 4.000%, 5/15/38 | | | |
| 1,835 | | Western Virginia Regional Jail Authority, Virginia, Facility Revenue Bonds, Refunding | 12/26 at 100.00 | Aa2 | 2,206,753 |
| | Series 2016, 5.000%, 12/01/36 | | | |
| 83,039 | | Total Tax Obligation/Limited | | | 87,578,981 |
| | Transportation – 44.3% (28.8% of Total Investments) | | | |
| | Capital Region Airport Commission, Virginia, Airport Revenue Bonds, Refunding | | | |
| | Series 2016A: | | | |
| 775 | | 5.000%, 7/01/32 | 7/26 at 100.00 | A2 | 914,880 |
| 375 | | 4.000%, 7/01/34 | 7/26 at 100.00 | A2 | 415,710 |
| 400 | | 4.000%, 7/01/35 | 7/26 at 100.00 | A2 | 442,504 |
| 250 | | 4.000%, 7/01/38 | 7/26 at 100.00 | A2 | 274,588 |
| | Chesapeake Bay Bridge and Tunnel District, Virginia, General Resolution Revenue Bonds, | | | |
| | First Tier Series 2016: | | | |
| 1,705 | | 5.000%, 7/01/41 – AGM Insured | 7/26 at 100.00 | AA | 2,013,810 |
| 8,320 | | 5.000%, 7/01/46 | 7/26 at 100.00 | BBB | 9,620,083 |
| | Chesapeake, Virginia, Transportation System Senior Toll Road Revenue Bonds, Capital | | | |
| | Appreciation Series 2012B: | | | |
| 2,000 | | 0.000%, 7/15/32 (6) | 7/28 at 100.00 | BBB | 2,006,700 |
| 4,125 | | 0.000%, 7/15/40 (6) | 7/28 at 100.00 | BBB | 4,095,217 |
| 1,000 | | 0.000%, 7/15/40 – AGM Insured (6) | 7/28 at 100.00 | AA | 1,002,400 |
| 2,000 | | Metropolitan Washington Airports Authority, Virginia, Dulles Toll Road Revenue Bonds, | 10/28 at 100.00 | A | 2,454,540 |
| | Dulles Metrorail & Capital Improvement Projects, Refunding First Senior Lien Series 2019A, | | | |
| | 5.000%, 10/01/37 | | | |
| 3,800 | | Metropolitan Washington Airports Authority, Virginia, Dulles Toll Road Revenue Bonds, | 4/22 at 100.00 | A– | 4,059,008 |
| | Dulles Metrorail & Capital Improvement Projects, Refunding Second Senior Lien Series 2014A, | | | |
| | 5.000%, 10/01/53 | | | |
| | Metropolitan Washington Airports Authority, Virginia, Dulles Toll Road Revenue Bonds, | | | |
| | Dulles Metrorail & Capital improvement Projects, Second Senior Lien Series 2009B: | | | |
| 4,000 | | 0.000%, 10/01/26 – AGC Insured | No Opt. Call | AA | 3,443,680 |
| 11,825 | | 0.000%, 10/01/34 – AGC Insured | No Opt. Call | AA | 7,699,139 |
| 1,135 | | 0.000%, 10/01/36 – AGC Insured | No Opt. Call | AA | 687,912 |
| 5,010 | | 0.000%, 10/01/39 – AGC Insured | No Opt. Call | AA | 2,692,675 |
| 6,700 | | Metropolitan Washington Airports Authority, Virginia, Dulles Toll Road Revenue Bonds, | 10/28 at 100.00 | A– | 8,967,414 |
| | Dulles Metrorail Capital Appreciation, Second Senior Lien Series 2010B, 6.500%, 10/01/44 | | | |
| 750 | | Metropolitan Washington DC Airports Authority, Airport System Revenue Bonds, Refunding | 10/20 at 100.00 | AA– | 772,635 |
| | Series 2010B, 5.000%, 10/01/26 (AMT) | | | |
| | Metropolitan Washington DC Airports Authority, Airport System Revenue Bonds, | | | |
| | Series 2010A: | | | |
| 3,400 | | 5.000%, 10/01/30 | 10/20 at 100.00 | AA– | 3,507,474 |
| 420 | | 5.000%, 10/01/35 | 10/20 at 100.00 | AA– | 433,314 |
| 7,300 | | Metropolitan Washington DC Airports Authority, Airport System Revenue Bonds, Refunding | 10/26 at 100.00 | AA– | 8,623,490 |
| | Series 2016A, 5.000%, 10/01/35 (AMT) | | | |
| 375 | | Metropolitan Washington DC Airports Authority, Airport System Revenue Bonds, Refunding | 10/27 at 100.00 | AA– | 450,863 |
| | Series 2017, 5.000%, 10/01/34 (AMT) | | | |
| | Metropolitan Washington DC Airports Authority, Airport System Revenue Bonds, Refunding | | | |
| | Series 2018A: | | | |
| 2,000 | | 5.000%, 10/01/32 (AMT) | 10/28 at 100.00 | AA– | 2,459,060 |
| 3,290 | | 5.000%, 10/01/36 (AMT) | 10/28 at 100.00 | AA– | 3,999,488 |
| 2,000 | | 5.000%, 10/01/38 (AMT) | 10/28 at 100.00 | AA– | 2,416,000 |
| 4,000 | | Metropolitan Washington DC Airports Authority, Airport System Revenue Bonds, Refunding | 10/29 at 100.00 | AA– | 4,890,520 |
| | Series 2019A, 5.000%, 10/01/40 (AMT) | | | |
73
| | |
| NPV | Nuveen Virginia Quality Municipal Income Fund |
| Portfolio of Investments (continued) |
| November 30, 2019 (Unaudited) |
| | | | | | |
| Principal | | | Optional Call | | |
| Amount (000) | | Description (1) | Provisions (2) | Ratings (3) | Value |
| | Transportation (continued) | | | |
| | New York Transportation Development Corporation, New York, Special Facility Revenue | | | |
| | Bonds, American Airlines, Inc. John F Kennedy International Airport Project, Refunding | | | |
| | Series 2016: | | | |
| $ 150 | | 5.000%, 8/01/26 (AMT) | 8/21 at 100.00 | BB | $ 157,328 |
| 595 | | 5.000%, 8/01/31 (AMT) | 8/21 at 100.00 | BB | 621,965 |
| 1,740 | | Norfolk Airport Authority, Virginia, Airport Revenue Bonds, Series 2019, 5.000%, 7/01/43 | 7/29 at 100.00 | A | 2,150,884 |
| 1,890 | | Richmond Metropolitan Authority, Virginia, Revenue Refunding Bonds, Expressway System, | No Opt. Call | A | 1,992,079 |
| | Series 2002, 5.250%, 7/15/22 – FGIC Insured | | | |
| 9,035 | | Virginia Small Business Financing Authority, Private Activity Revenue Bonds, Transform | 6/27 at 100.00 | BBB | 10,323,391 |
| | 66 P3 Project, Senior Lien Series 2017, 5.000%, 12/31/52 (AMT) | | | |
| 2,500 | | Virginia Small Business Financing Authority, Senior Lien Revenue Bonds, 95 Express Lanes | 1/22 at 100.00 | BBB | 2,659,225 |
| | LLC Project, Series 2012, 5.000%, 1/01/40 (AMT) | | | |
| 2,285 | | Virginia Small Business Financing Authority, Senior Lien Revenue Bonds, 95 Express Lanes | 1/22 at 100.00 | BBB | 2,426,190 |
| | LLC Project, Series 2019, 5.000%, 7/01/49 (AMT) | | | |
| | Virginia Small Business Financing Authority, Senior Lien Revenue Bonds, Elizabeth River | | | |
| | Crossing, Opco LLC Project, Series 2012: | | | |
| 750 | | 5.250%, 1/01/32 (AMT) | 7/22 at 100.00 | BBB | 815,272 |
| 5,025 | | 6.000%, 1/01/37 (AMT) | 7/22 at 100.00 | BBB | 5,552,876 |
| 5,700 | | 5.500%, 1/01/42 (AMT) | 7/22 at 100.00 | BBB | 6,192,708 |
| | Washington Metropolitan Area Transit Authority, District of Columbia, Gross Revenue | | | |
| | Bonds, Series 2017B: | | | |
| 3,000 | | 5.000%, 7/01/36 | 7/27 at 100.00 | AA– | 3,639,510 |
| 2,000 | | 5.000%, 7/01/42 | 7/27 at 100.00 | AA– | 2,393,360 |
| 1,000 | | Washington Metropolitan Area Transit Authority, District of Columbia, Gross Revenue | 7/27 at 100.00 | AA– | 1,194,750 |
| | Bonds, Series 2018, 5.000%, 7/01/43 | | | |
| 112,625 | | Total Transportation | | | 118,462,642 |
| | U.S. Guaranteed – 16.1% (10.5% of Total Investments) (7) | | | |
| 610 | | Bristol, Virginia, General Obligation Bonds, Refunding & Improvement Series 2010, | 7/20 at 100.00 | N/R | 624,420 |
| | 5.000%, 7/15/25 (Pre-refunded 7/15/20) | | | |
| 1,490 | | Bristol, Virginia, General Obligation Utility System Revenue Bonds, Series 2002, 5.000%, | No Opt. Call | AA | 1,647,478 |
| | 11/01/24 – AGM Insured (ETM) | | | |
| 430 | | Bristol, Virginia, Utility System Revenue Refunding Bonds, Series 2001, 5.000%, 7/15/21 – | No Opt. Call | AA | 446,319 |
| | AGM Insured (ETM) | | | |
| 1,030 | | Chesapeake Bay Bridge and Tunnel Commission, Virginia, General Resolution Revenue Bonds, | No Opt. Call | Baa2 | 1,217,522 |
| | Refunding Series 1998, 5.500%, 7/01/25 – NPFG Insured (ETM) | | | |
| 2,145 | | Chesterfield County Economic Development Authority, Virginia, Revenue Bonds, Bon Secours | 11/20 at 100.00 | AA | 2,216,235 |
| | Health, Series 2010C-2, 5.000%, 11/01/42 (Pre-refunded 11/01/20) – AGC Insured | | | |
| 3,375 | | Colorado Health Facilities Authority, Colorado, Revenue Bonds, Catholic Health | 1/23 at 100.00 | BBB+ | 3,782,430 |
| | Initiatives, Series 2013A, 5.250%, 1/01/40 (Pre-refunded 1/01/23) | | | |
| 4,150 | | Fairfax County Economic Development Authority, Virginia, Transportation District | 4/20 at 100.00 | Aaa | 4,203,576 |
| | Improvement Revenue Bonds, Silver Line Phase 1 Project, Series 2011, 5.000%, 4/01/27 | | | |
| | (Pre-refunded 4/01/20) | | | |
| | Hampton Roads Sanitation District, Virginia, Wastewater Revenue Bonds, Series 2012A: | | | |
| 1,295 | | 5.000%, 1/01/39 (Pre-refunded 1/01/21) | 1/21 at 100.00 | N/R | 1,348,665 |
| 5,205 | | 5.000%, 1/01/39 (Pre-refunded 1/01/21) | 1/21 at 100.00 | AA+ | 5,420,695 |
| | Hampton Roads Sanitation District, Virginia, Wastewater Revenue Bonds, Subordinate | | | |
| | Series 2018A: | | | |
| 1,415 | | 5.000%, 10/01/40 (Pre-refunded 10/01/27) | 10/27 at 100.00 | AA+ | 1,787,810 |
| 1,010 | | 5.000%, 10/01/42 (Pre-refunded 10/01/27) | 10/27 at 100.00 | AA+ | 1,276,105 |
| 1,000 | | 5.000%, 10/01/43 (Pre-refunded 10/01/27) | 10/27 at 100.00 | AA+ | 1,263,470 |
| 410 | | Henrico County Industrial Development Authority, Virginia, Healthcare Revenue Bonds, Bon | No Opt. Call | A+ | 424,350 |
| | Secours Health System, Series 1996, 6.250%, 8/15/20 – NPFG Insured (ETM) | | | |
74
| | | | | | |
| Principal | | | Optional Call | | |
| Amount (000) | | Description (1) | Provisions (2) | Ratings (3) | Value |
| | U.S. Guaranteed (7) (continued) | | | |
| $ 1,630 | | Norfolk, Virginia, General Obligation Bonds, Refunding Series 2017C, 5.000%, 9/01/30 | 3/27 at 100.00 | AA+ | $ 2,040,532 |
| | (Pre-refunded 3/01/27) | | | |
| | Portsmouth, Virginia, General Obligation Bonds, Refunding Series 2010D: | | | |
| 5,900 | | 5.000%, 7/15/34 (Pre-refunded 7/15/20) | 7/20 at 100.00 | N/R | 6,041,305 |
| 150 | | 5.000%, 7/15/34 (Pre-refunded 7/15/20) | 7/20 at 100.00 | AA | 153,641 |
| 1,630 | | Prince William County Industrial Development Authority, Virginia, Student Housing | 9/21 at 100.00 | A+ | 1,740,970 |
| | Revenue Bonds, George Mason University Foundation Prince William Housing LLC Project, Series | | | |
| | 2011A, 5.125%, 9/01/41 (Pre-refunded 9/01/21) | | | |
| 710 | | Puerto Rico, Highway Revenue Bonds, Highway and Transportation Authority, Series 2005BB, | No Opt. Call | A2 | 782,193 |
| | 5.250%, 7/01/22 – AGM Insured (ETM) | | | |
| 1,200 | | Virginia College Building Authority, Educational Facilities Revenue Bonds, 21st Century | 2/21 at 100.00 | AA+ | 1,240,452 |
| | College Program, Series 2011A, 4.000%, 2/01/29 (Pre-refunded 2/01/21) | | | |
| 4,010 | | Virginia Resources Authority, Infrastructure Revenue Bonds, Pooled Financing Program, | 11/22 at 100.00 | N/R | 4,453,145 |
| | Series 2012A, 5.000%, 11/01/42 (Pre-refunded 11/01/22) | | | |
| 1,020 | | Wisconsin Health and Educational Facilities Authority, Revenue Bonds, Aurora Health | 4/20 at 100.00 | Aa3 | 1,036,861 |
| | Care, Inc., Series 2010A, 5.625%, 4/15/39 (Pre-refunded 4/15/20) | | | |
| 39,815 | | Total U.S. Guaranteed | | | 43,148,174 |
| | Utilities – 4.9% (3.2% of Total Investments) | | | |
| 2,000 | | Beaver County Industrial Development Authority, Pennsylvania, Pollution Control Revenue | No Opt. Call | N/R | 2,145,000 |
| | Refunding Bonds, FirstEnergy Nuclear Generation Project, Series 2006A, 4.375%, 1/01/35 | | | |
| | (Mandatory Put 7/01/22) (8) | | | |
| | Guam Power Authority, Revenue Bonds, Series 2012A: | | | |
| 1,500 | | 5.000%, 10/01/30 – AGM Insured | 10/22 at 100.00 | AA | 1,636,995 |
| 495 | | 5.000%, 10/01/34 | 10/22 at 100.00 | BBB | 528,076 |
| | Richmond, Virginia, Public Utility Revenue Bonds, Refunding Series 2016A: | | | |
| 5,000 | | 5.000%, 1/15/33 | 1/26 at 100.00 | AA | 5,963,000 |
| 1,000 | | 5.000%, 1/15/35 | 1/26 at 100.00 | AA | 1,187,400 |
| 730 | | Virgin Islands Water and Power Authority, Electric System Revenue Bonds, Refunding | 12/19 at 100.00 | CCC | 702,625 |
| | Series 2007A, 5.000%, 7/01/24 | | | |
| 1,000 | | Virginia Small Business Financing Authority, Solid Waste Disposal Revenue Bonds, Covanta | 7/23 at 100.00 | B | 1,062,110 |
| | Project, Series 2018, 5.000%, 1/01/48 (AMT) (Mandatory Put 7/01/38) , 144A | | | |
| 11,725 | | Total Utilities | | | 13,225,206 |
| | Water and Sewer – 3.3% (2.1% of Total Investments) | | | |
| 1,675 | | Guam Government Waterworks Authority, Water and Wastewater System Revenue Bonds, | 7/27 at 100.00 | A– | 1,933,620 |
| | Refunding Series 2017, 5.000%, 7/01/40 | | | |
| 810 | | Guam Government Waterworks Authority, Water and Wastewater System Revenue Bonds, Series | 7/23 at 100.00 | A– | 888,117 |
| | 2013, 5.500%, 7/01/43 | | | |
| 3,000 | | Norfolk, Virginia, Water Revenue Bonds, Series 2015A, 5.250%, 11/01/44 | 11/24 at 100.00 | AA+ | 3,513,240 |
| 1,000 | | Norfolk, Virginia, Water Revenue Bonds, Series 2017, 5.000%, 11/01/42 | 11/27 at 100.00 | AA+ | 1,218,570 |
| 625 | | Puerto Rico Aqueduct and Sewerage Authority, Revenue Bonds, Senior Lien Series 2012A, | 7/22 at 100.00 | C | 653,906 |
| | 5.250%, 7/01/42 | | | |
| 1,000 | | Virginia Resources Authority, Water and Sewerage System Revenue Bonds, Goochland | 11/22 at 63.13 | AA | 589,250 |
| | County – Tuckahoe Creek Service District Project, Series 2012, 0.000%, 11/01/34 | | | |
| 8,110 | | Total Water and Sewer | | | 8,796,703 |
| $ 386,250 | | Total Long-Term Investments (cost $379,529,102) | | | 410,760,445 |
| | Floating Rate Obligations – (7.6)% | | | (20,350,000) |
| | Variable Rate Demand Preferred Shares, net of deferred offering costs – (47.8)% (9) | | | (127,640,592) |
| | Other Assets Less Liabilities – 1.7% | | | 4,463,611 |
| | Net Asset Applicable to Common Shares – 100% | | | $ 267,233,464 |
75
| | |
| NPV | Nuveen Virginia Quality Municipal Income Fund |
| Portfolio of Investments (continued) |
| November 30, 2019 (Unaudited) |
| | |
(1) | All percentages shown in the Portfolio of Investments are based on net assets applicable to common shares unless otherwise noted. |
(2) | Optional Call Provisions: Dates (month and year) and prices of the earliest optional call or redemption. There may be other call provisions at varying prices at later dates. Certain mortgage-backed securities may be subject to periodic principal paydowns. |
(3) | For financial reporting purposes, the ratings disclosed are the highest of Standard & Poor’s Group (“Standard & Poor’s”), Moody’s Investors Service, Inc. (“Moody’s”) or Fitch, Inc. (“Fitch”) rating. This treatment of split-rated securities may differ from that used for other purposes, such as for Fund investment policies. Ratings below BBB by Standard & Poor’s, Baa by Moody’s or BBB by Fitch are considered to be below investment grade. Holdings designated N/R are not rated by any of these national rating agencies. |
(4) | Investment, or portion of investment, has been pledged to collateralize the net payment obligations for investments in inverse floating rate transactions. |
(5) | Effective February 12, 2019, the par value of the original bonds was replaced with taxable and tax exempt Puerto Rico Sales Tax Financing Corporation (commonly known as COFINA) bond units that are collateralized by a bundle of zero and coupon paying bonds. The quantity shown represents units in a trust, which were assigned according to the original bond’s accreted value. These securities do not have a stated coupon interest rate and income will be recognized through accretion of the discount associated with the trust units. The factor at which these units accrete can also decrease, primarily for principal payments generated from coupon payments received or dispositions of the underlying bond collateral. The quantity of units will not change as a result of these principal payments. |
(6) | Step-up coupon bond, a bond with a coupon that increases (“steps up”), usually at regular intervals, while the bond is outstanding. The rate shown is the coupon as of the end of the reporting period. |
(7) | Backed by an escrow or trust containing sufficient U.S. Government or U.S. Government agency securities, which ensure the timely payment of principal and interest. |
(8) | Defaulted security. A security whose issuer has failed to fully pay principal and/or interest when due, or is under the protection of bankruptcy. |
(9) | Variable Rate Demand Preferred Shares, net of deferred offering costs as a percentage of Total Investments is 31.1%. |
144A | Investment is exempt from registration under Rule 144A of the Securities Act of 1933, as amended. These investments may only be resold in transactions exempt from registration, which are normally those transactions with qualified institutional buyers. |
AMT | Alternative Minimum Tax |
ETM | Escrowed to maturity |
UB | Underlying bond of an inverse floating rate trust reflected as a financing transaction. See Notes to Financial Statements, Note 4 – Portfolio Securities and Investments in Derivatives, Inverse Floating Rate Securities for more information. |
| See accompanying notes to financial statements. |
76
Statement of Assets and Liabilities
November 30, 2019 (Unaudited)
| | | | | | | | | | |
| | NKG | | | NMY | | | NMT | |
| Assets | | | | | | | | | |
Long-term investments, at value (cost $207,692,600, $516,412,122 and $195,366,628, respectively) | | $ | 220,906,273 | | | $ | 552,522,472 | | | $ | 210,270,864 | |
Short-term investments, at value (cost $231,260, $ — and $ —, respectively) | | | 257,797 | | | | — | | | | — | |
Cash | | | 920,231 | | | | — | | | | — | |
Receivable for: | | | | | | | | | | | | |
| Interest | | | 2,977,364 | | | | 8,499,954 | | | | 2,973,011 | |
| Investments sold | | | 200,000 | | | | 3,334,148 | | | | 1,285,490 | |
Other assets | | | 872 | | | | 31,744 | | | | 2,614 | |
| Total assets | | | 225,262,537 | | | | 564,388,318 | | | | 214,531,979 | |
| Liabilities | | | | | | | | | | | | |
Cash overdraft | | | — | | | | 3,365,975 | | | | 763,068 | |
Floating rate obligations | | | 19,600,000 | | | | 28,405,000 | | | | — | |
Payable for: | | | | | | | | | | | | |
| Dividends | | | 376,980 | | | | 989,684 | | | | 371,820 | |
| Interest | | | 245,825 | | | | 564,949 | | | | 117,042 | |
| Investments purchased | | | — | | | | — | | | | 222,335 | |
| Offering costs | | | 66,075 | | | | 68,943 | | | | — | |
Adjustable Rate MuniFund Term Preferred (“AMTP”) Shares, net of deferred offering costs | | | | | | | | | | | | |
| (liquidation preference $58,500,000, $182,000,000 and $ —, respectively) | | | 58,364,506 | | | | 181,819,390 | | | | — | |
MuniFund Preferred (“MFP”) Shares, net of deferred offering costs | | | | | | | | | | | | |
| (liquidation preference $ —, $ — and $ —, respectively) | | | — | | | | — | | | | — | |
Variable Rate Demand Preferred (“VRDP”) Shares, net of deferred offering costs | | | | | | | | | | | | |
| (liquidation preference $ —, $ — and $74,000,000, respectively) | | | — | | | | — | | | | 73,734,155 | |
Accrued expenses: | | | | | | | | | | | | |
| Management fees | | | 110,464 | | | | 269,390 | | | | 108,488 | |
| Trustees fees | | | 2,107 | | | | 35,535 | | | | 2,194 | |
| Other | | | 52,193 | | | | 94,365 | | | | 63,931 | |
| Total liabilities | | | 78,818,150 | | | | 215,613,231 | | | | 75,383,033 | |
Net assets applicable to common shares | | $ | 146,444,387 | | | $ | 348,775,087 | | | $ | 139,148,946 | |
Common shares outstanding | | | 10,399,813 | | | | 23,099,664 | | | | 9,322,751 | |
Net asset value (“NAV”) per common share outstanding | | $ | 14.08 | | | $ | 15.10 | | | $ | 14.93 | |
| | |
| Net assets applicable to common shares consist of: | | | | | | | | | | | | |
Common shares, $0.01 par value per share | | $ | 103,998 | | | $ | 230,997 | | | $ | 93,228 | |
Paid-in surplus | | | 137,139,032 | | | | 324,922,804 | | | | 129,291,642 | |
Total distributable earnings | | | 9,201,357 | | | | 23,621,286 | | | | 9,764,076 | |
Net assets applicable to common shares | | $ | 146,444,387 | | | $ | 348,775,087 | | | $ | 139,148,946 | |
Authorized shares: | | | | | | | | | | | | |
| Common | | Unlimited | | | Unlimited | | | Unlimited | |
| Preferred | | Unlimited | | | Unlimited | | | Unlimited | |
See accompanying notes to financial statements.
77
| |
| Statement of Assets and Liabilities (continued) |
|
|
|
| | |
| | NMS | | | NOM | | | NPV | |
| Assets | | | | | | | | | |
Long-term investments, at value (cost $130,229,317, $47,531,533 and $379,529,102, respectively) | | $ | 139,148,493 | | | $ | 50,715,069 | | | $ | 410,760,445 | |
Short-term investments, at value (cost $2,100,000, $ — and $ —, respectively) | | | 2,100,000 | | | | — | | | | — | |
Cash | | | 87,549 | | | | 13,936 | | | | 910,743 | |
Receivable for: | | | | | | | | | | | | |
| Interest | | | 1,700,614 | | | | 556,970 | | | | 5,449,846 | |
| Investments sold | | | 30,643 | | | | 5,016 | | | | 362,640 | |
Other assets | | | 881 | | | | 7,315 | | | | 28,930 | |
| Total assets | | | 143,068,180 | | | | 51,298,306 | | | | 417,512,604 | |
| Liabilities | | | | | | | | | | | | |
Cash overdraft | | | — | | | | — | | | | — | |
Floating rate obligations | | | — | | | | 600,000 | | | | 20,350,000 | |
Payable for: | | | | | | | | | | | | |
| Dividends | | | 277,546 | | | | 97,029 | | | | 740,928 | |
| Interest | | | 89,216 | | | | 40,051 | | | | 461,211 | |
| Investments purchased | | | 581,750 | | | | — | | | | 764,125 | |
| Offering costs | | | 85,461 | | | | — | | | | — | |
Adjustable Rate MuniFund Term Preferred (“AMTP”) Shares, net of deferred offering costs | | | | | | | | | | | | |
| (liquidation preference $52,800,000, $ —,and $ —, respectively) | | | 52,664,544 | | | | — | | | | — | |
MuniFund Preferred (“MFP”) Shares, net of deferred offering costs | | | | | | | | | | | | |
| (liquidation preference $ —, $18,000,000 and $ —, respectively) | | | — | | | | 17,775,140 | | | | — | |
Variable Rate Demand Preferred (“VRDP”) Shares, net of deferred offering costs | | | | | | | | | | | | |
| (liquidation preference $ —, $ — and $128,000,000, respectively) | | | — | | | | — | | | | 127,640,592 | |
Accrued expenses: | | | | | | | | | | | | |
| Management fees | | | 70,345 | | | | 25,488 | | | | 201,634 | |
| Trustees fees | | | 1,458 | | | | 522 | | | | 26,268 | |
| Other | | | 45,374 | | | | 33,162 | | | | 94,382 | |
| Total liabilities | | | 53,815,694 | | | | 18,571,392 | | | | 150,279,140 | |
Net assets applicable to common shares | | $ | 89,252,486 | | | $ | 32,726,914 | | | $ | 267,233,464 | |
Common shares outstanding | | | 5,782,386 | | | | 2,345,018 | | | | 17,878,247 | |
Net asset value (“NAV”) per common share outstanding | | $ | 15.44 | | | $ | 13.96 | | | $ | 14.95 | |
| | |
| Net assets applicable to common shares consist of: | | | | | | | | | | | | |
Common shares, $0.01 par value per share | | $ | 57,824 | | | $ | 23,450 | | | $ | 178,782 | |
Paid-in surplus | | | 80,906,861 | | | | 30,620,851 | | | | 250,144,899 | |
Total distributable earnings | | | 8,287,801 | | | | 2,082,613 | | | | 16,909,783 | |
Net assets applicable to common shares | | $ | 89,252,486 | | | $ | 32,726,914 | | | $ | 267,233,464 | |
Authorized shares: | | | | | | | | | | | | |
| Common | | Unlimited | | | Unlimited | | | Unlimited | |
| Preferred | | Unlimited | | | Unlimited | | | Unlimited | |
See accompanying notes to financial statements.
78
| |
|
|
| Six Months Ended November 30, 2019 (Unaudited) |
|
|
|
| | |
| | NKG | | | NMY | | | NMT | |
| Investment Income | | $ | 4,075,000 | | | $ | 10,678,939 | | | $ | 3,992,353 | |
| Expenses | | | | | | | | | | | | |
Management fees | | | 685,028 | | | | 1,646,260 | | | | 663,970 | |
Interest expense and amortization of offering costs | | | 833,226 | | | | 2,409,315 | | | | 820,824 | |
Custodian fees | | | 14,471 | | | | 32,886 | | | | 17,354 | |
Trustees fees | | | 2,792 | | | | 7,236 | | | | 2,907 | |
Professional fees | | | 16,015 | | | | 22,085 | | | | 14,744 | |
Shareholder reporting expenses | | | 10,996 | | | | 21,388 | | | | 9,269 | |
Shareholder servicing agent fees | | | 7,701 | | | | 10,596 | | | | 508 | |
Stock exchange listing fees | | | 3,440 | | | | 3,440 | | | | 3,440 | |
Investor relations expenses | | | 6,029 | | | | 14,840 | | | | 6,170 | |
Other | | | 17,292 | | | | 43,654 | | | | 18,040 | |
Total expenses | | | 1,596,990 | | | | 4,211,700 | | | | 1,557,226 | |
Net investment income (loss) | | | 2,478,010 | | | | 6,467,239 | | | | 2,435,127 | |
| Realized and Unrealized Gain (Loss) | | | | | | | | | | | | |
Net realized gain (loss) from investments | | | (35,719 | ) | | | 455,200 | | | | 42,133 | |
Change in net unrealized appreciation (depreciation) of investments | | | 2,158,916 | | | | 5,890,832 | | | | 1,683,695 | |
Net realized and unrealized gain (loss) | | | 2,123,197 | | | | 6,346,032 | | | | 1,725,828 | |
Net increase (decrease) in net assets applicable to common shares | | | | | | | | | | | | |
| from operations | | $ | 4,601,207 | | | $ | 12,813,271 | | | $ | 4,160,955 | |
See accompanying notes to financial statements.
79
| |
| Statement of Operations (continued) |
|
|
|
| |
| | |
| | NMS | | | NOM | | | NPV | |
| Investment Income | | $ | 2,815,574 | | | $ | 1,018,627 | | | $ | 7,772,406 | |
| Expenses | | | | | | | | | | | | |
Management fees | | | 429,724 | | | | 156,023 | | | | 1,232,019 | |
Interest expense and amortization of offering costs | | | 624,458 | | | | 211,905 | | | | 1,673,512 | |
Custodian fees | | | 15,231 | | | | 10,037 | | | | 26,003 | |
Trustees fees | | | 1,933 | | | | 691 | | | | 5,392 | |
Professional fees | | | 17,957 | | | | 13,307 | | | | 26,343 | |
Shareholder reporting expenses | | | 8,317 | | | | 5,353 | | | | 18,324 | |
Shareholder servicing agent fees | | | 7,406 | | | | 7,412 | | | | 3,035 | |
Stock exchange listing fees | | | 3,440 | | | | 3,444 | | | | 3,440 | |
Investor relations expenses | | | 4,256 | | | | 1,783 | | | | 11,206 | |
Other | | | 14,768 | | | | 13,011 | | | | 40,932 | |
Total expenses | | | 1,127,490 | | | | 422,966 | | | | 3,040,206 | |
Net investment income (loss) | | | 1,688,084 | | | | 595,661 | | | | 4,732,200 | |
| Realized and Unrealized Gain (Loss) | | | | | | | | | | | | |
Net realized gain (loss) from investments | | | 135,607 | | | | 22,986 | | | | 255,009 | |
Change in net unrealized appreciation (depreciation) of investments | | | 1,317,153 | | | | 262,775 | | | | 4,710,571 | |
Net realized and unrealized gain (loss) | | | 1,452,760 | | | | 285,761 | | | | 4,965,580 | |
Net increase (decrease) in net assets applicable to common shares | | | | | | | | | | | | |
| from operations | | $ | 3,140,844 | | | $ | 881,422 | | | $ | 9,697,780 | |
See accompanying notes to financial statements.
80
Statement of Changes in Net Assets
(Unaudited)
| | | | | | | | | | | | | |
| | NKG | | | NMY | |
| | Six Months | | | Year | | | Six Months | | | Year | |
| | Ended | | | Ended | | | Ended | | | Ended | |
| | 11/30/19 | | | 5/31/19 | | | 11/30/19 | | | 5/31/19 | |
| Operations | | | | | | | | | | | | |
Net investment income (loss) | | $ | 2,478,010 | | | $ | 4,839,423 | | | $ | 6,467,239 | | | $ | 12,560,036 | |
Net realized gain (loss) from investments | | | (35,719 | ) | | | (791,963 | ) | | | 455,200 | | | | (1,232,606 | ) |
Change in net unrealized appreciation (depreciation) of investments | | | 2,158,916 | | | | 5,780,144 | | | | 5,890,832 | | | | 12,354,292 | |
Net increase (decrease) in net assets applicable to common shares | | | | | | | | | | | | | | | | |
| from operations | | | 4,601,207 | | | | 9,827,604 | | | | 12,813,271 | | | | 23,681,722 | |
| Distributions to Common Shareholders | | | | | | | | | | | | | | | | |
Dividends | | | (2,308,758 | ) | | | (4,517,765 | ) | | | (6,098,311 | ) | | | (12,245,568 | ) |
Decrease in net assets applicable to | | | | | | | | | | | | | | | | |
| common shares from distributions | | | | | | | | | | | | | | | | |
| to common shareholders | | | (2,308,758 | ) | | | (4,517,765 | ) | | | (6,098,311 | ) | | | (12,245,568 | ) |
| Capital Share Transactions | | | | | | | | | | | | | | | | |
Common shares: | | | | | | | | | | | | | | | | |
| Net proceeds from shares issued | | | | | | | | | | | | | | | | |
| to shareholders due to | | | | | | | | | | | | | | | | |
| reinvestment of distributions | | | — | | | | — | | | | — | | | | — | |
| Cost of shares repurchased and retired | | | — | | | | (1,642,533 | ) | | | — | | | | (2,918,158 | ) |
Net increase (decrease) in net assets | | | | | | | | | | | | | | | | |
| applicable to common shares from | | | | | | | | | | | | | | | | |
| capital share transactions | | | — | | | | (1,642,533 | ) | | | — | | | | (2,918,158 | ) |
Net increase (decrease) in net assets | | | | | | | | | | | | | | | | |
| applicable to common shares | | | 2,292,449 | | | | 3,667,306 | | | | 6,714,960 | | | | 8,517,996 | |
Net assets applicable to common | | | | | | | | | | | | | | | | |
| shares at the beginning of period | | | 144,151,938 | | | | 140,484,632 | | | | 342,060,127 | | | | 333,542,131 | |
Net assets applicable to common | | | | | | | | | | | | | | | | |
| shares at the end of period | | $ | 146,444,387 | | | $ | 144,151,938 | | | $ | 348,775,087 | | | $ | 342,060,127 | |
See accompanying notes to financial statements.
81
Statement of Changes in Net Assets (Unaudited) (continued)
| | | | | | | | | | | | | |
| | NMT
| | | NMS
| |
| | Six Months | | | Year | | | Six Months | | | Year | |
| | Ended | | | Ended | | | Ended | | | Ended | |
| | 11/30/19 | | | 5/31/19 | | | 11/30/19 | | | 5/31/19 | |
| Operations | | | | | | | | | | | | |
Net investment income (loss) | | $ | 2,435,127 | | | $ | 4,875,152 | | | $ | 1,688,084 | | | $ | 3,569,638 | |
Net realized gain (loss) from investments | | | 42,133 | | | | (762,614 | ) | | | 135,607 | | | | (377,996 | ) |
Change in net unrealized appreciation (depreciation) of investments | | | 1,683,695 | | | | 4,696,560 | | | | 1,317,153 | | | | 3,251,354 | |
Net increase (decrease) in net assets applicable to common shares | | | | | | | | | | | | | | | | |
| from operations | | | 4,160,955 | | | | 8,809,098 | | | | 3,140,844 | | | | 6,442,996 | |
| Distributions to Common Shareholders | | | | | | | | | | | | | | | | |
Dividends | | | (2,293,397 | ) | | | (4,689,887 | ) | | | (1,700,021 | ) | | | (3,576,981 | ) |
Decrease in net assets applicable to | | | | | | | | | | | | | | | | |
| common shares from distributions | | | | | | | | | | | | | | | | |
| to common shareholders | | | (2,293,397 | ) | | | (4,689,887 | ) | | | (1,700,021 | ) | | | (3,576,981 | ) |
| Capital Share Transactions | | | | | | | | | | | | | | | | |
Common shares: | | | | | | | | | | | | | | | | |
| Net proceeds from shares issued | | | | | | | | | | | | | | | | |
| to shareholders due to | | | | | | | | | | | | | | | | |
| reinvestment of distributions | | | — | | | | — | | | | — | | | | — | |
| Cost of shares repurchased and retired | | | — | | | | (305,767 | ) | | | — | | | | (121,032 | ) |
Net increase (decrease) in net assets | | | | | | | | | | | | | | | | |
| applicable to common shares from | | | | | | | | | | | | | | | | |
| capital share transactions | | | — | | | | (305,767 | ) | | | — | | | | (121,032 | ) |
Net increase (decrease) in net assets | | | | | | | | | | | | | | | | |
| applicable to common shares | | | 1,867,558 | | | | 3,813,444 | | | | 1,440,823 | | | | 2,744,983 | |
Net assets applicable to common | | | | | | | | | | | | | | | | |
| shares at the beginning of period | | | 137,281,388 | | | | 133,467,944 | | | | 87,811,663 | | | | 85,066,680 | |
Net assets applicable to common | | | | | | | | | | | | | | | | |
| shares at the end of period | | $ | 139,148,946 | | | $ | 137,281,388 | | | $ | 89,252,486 | | | $ | 87,811,663 | |
See accompanying notes to financial statements.
82
| | | | | | | | | | | | | |
| | NOM
| | | NPV
| |
| | Six Months | | | Year | | | Six Months | | | Year | |
| | Ended | | | Ended | | | Ended | | | Ended | |
| | 11/30/19 | | | 5/31/19 | | | 11/30/19 | | | 5/31/19 | |
| Operations | | | | | | | | | | | | |
Net investment income (loss) | | $ | 595,661 | | | $ | 1,223,981 | | | $ | 4,732,200 | | | $ | 9,564,575 | |
Net realized gain (loss) from investments | | | 22,986 | | | | 152,623 | | | | 255,009 | | | | (837,682 | ) |
Change in net unrealized appreciation (depreciation) of investments | | | 262,775 | | | | 671,591 | | | | 4,710,571 | | | | 9,418,868 | |
Net increase (decrease) in net assets applicable to common shares | | | | | | | | | | | | | | | | |
| from operations | | | 881,422 | | | | 2,048,195 | | | | 9,697,780 | | | | 18,145,761 | |
| Distributions to Common Shareholders | | | | | | | | | | | | | | | | |
Dividends | | | (604,958 | ) | | | (1,209,776 | ) | | | (4,666,223 | ) | | | (9,479,610 | ) |
Decrease in net assets applicable to | | | | | | | | | | | | | | | | |
| common shares from distributions | | | | | | | | | | | | | | | | |
| to common shareholders | | | (604,958 | ) | | | (1,209,776 | ) | | | (4,666,223 | ) | | | (9,479,610 | ) |
| Capital Share Transactions | | | | | | | | | | | | | | | | |
Common shares: | | | | | | | | | | | | | | | | |
| Net proceeds from shares issued | | | | | | | | | | | | | | | | |
| to shareholders due to | | | | | | | | | | | | | | | | |
| reinvestment of distributions | | | 6,868 | | | | — | | | | — | | | | — | |
| Cost of shares repurchased and retired | | | — | | | | — | | | | — | | | | (639,145 | ) |
Net increase (decrease) in net assets | | | | | | | | | | | | | | | | |
| applicable to common shares from | | | | | | | | | | | | | | | | |
| capital share transactions | | | 6,868 | | | | — | | | | — | | | | (639,145 | ) |
Net increase (decrease) in net assets | | | | | | | | | | | | | | | | |
| applicable to common shares | | | 283,332 | | | | 838,419 | | | | 5,031,557 | | | | 8,027,006 | |
Net assets applicable to common | | | | | | | | | | | | | | | | |
| shares at the beginning of period | | | 32,443,582 | | | | 31,605,163 | | | | 262,201,907 | | | | 254,174,901 | |
Net assets applicable to common | | | | | | | | | | | | | | | | |
| shares at the end of period | | $ | 32,726,914 | | | $ | 32,443,582 | | | $ | 267,233,464 | | | $ | 262,201,907 | |
See accompanying notes to financial statements.
83
| |
|
|
| Six Months Ended November 30, 2019 (Unaudited) |
|
|
|
| | |
| | NKG | | | NMY | | | NMT | |
| Cash Flows from Operating Activities: | | | | | | | | | |
| Net Increase (Decrease) in Net Assets Applicable to Common Shares from Operations | | $ | 4,601,207 | | | $ | 12,813,271 | | | $ | 4,160,955 | |
Adjustments to reconcile the net increase (decrease) in net assets applicable to common | | | | | | | | | | | | |
| shares from operations to net cash provided by (used in) operating activities: | | | | | | | | | | | | |
Purchases of investments | | | (6,485,075 | ) | | | (33,163,354 | ) | | | (13,841,103 | ) |
Proceeds from sales and maturities of investments | | | 4,097,728
| | | | 38,808,422 | | | | 13,657,414 | |
Proceeds from (Purchase of) short-term investments, net | | | — | | | | — | | | | — | |
Taxes paid | | | (100 | ) | | | (4,224 | ) | | | (2,265 | ) |
Amortization (Accretion) of premiums and discounts, net | | | 754,242 | | | | 1,125,167 | | | | 759,276 | |
Amortization of deferred offering costs | | | 7,542 | | | | 10,053 | | | | 4,888 | |
(Increase) Decrease in: | | | | | | | | | | | | |
| Receivable for interest | | | (136,291 | ) | | | (201,679 | ) | | | 32,242 | |
| Receivable for investments sold | | | 1,840,513
| | | | (2,226,638 | ) | | | (1,285,490 | ) |
| Other assets | | | 3,339 | | | | (124 | ) | | | 6,834 | |
Increase (Decrease) in: | | | | | | | | | | | | |
| Payable for interest | | | 125,018 | | | | 167,821 | | | | 117,042 | |
| Payable for investments purchased | | | — | | | | (1,684,730 | ) | | | 222,335 | |
| Payable for offering costs | | | — | | | | (71 | ) | | | — | |
| Accrued management fees | | | (5,509 | ) | | | (6,041 | ) | | | (2,839 | ) |
| Accrued Trustees fees | | | 161 | | | | 3,872 | | | | 161 | |
| Accrued other expenses | | | (4,750 | ) | | | (6,885 | ) | | | (9,633 | ) |
Net realized (gain) loss from investments | | | 35,719 | | | | (455,200 | ) | | | (42,133 | ) |
Change in net unrealized (appreciation) depreciation of investments | | | (2,158,916 | ) | | | (5,890,832 | ) | | | (1,683,695 | ) |
Net cash provided by (used in) operating activities | | | 2,674,828
| | | | 9,288,828 | | | | 2,093,989 | |
| Cash Flows from Financing Activities: | | | | | | | | | | | | |
Proceeds from borrowings | | | — | | | | 8,700,000 | | | | — | |
(Repayments) of borrowings | | | — | | | | (8,700,000 | ) | | | — | |
Increase (Decrease) in cash overdraft | | | — | | | | (3,192,216 | ) | | | 198,756 | |
Cash distributions paid to common shareholders | | | (2,308,674 | ) | | | (6,096,612 | ) | | | (2,292,745 | ) |
Net cash provided by (used in) financing activities | | | (2,308,674 | ) | | | (9,288,828 | ) | | | (2,093,989 | ) |
| Net Increase (Decrease) in Cash | | | 366,154 | | | | — | | | | — | |
Cash at the beginning of period | | | 554,077 | | | | — | | | | — | |
Cash at the end of period | | $ | 920,231 | | | $ | — | | | $ | — | |
| | |
| Supplemental Disclosure of Cash Flow Information | | NKG | | | NMY | | | NMT | |
Cash paid for interest (excluding amortization of offering costs) | | $ | 700,666 | | | $ | 2,231,440 | | | $ | 698,894 | |
Non-cash financing activities not included herein consist of reinvestments of | | | | | | | | | | | | |
| common share distributions | | | — | | | | — | | | | — | |
See accompanying notes to financial statements.
84
| | | | | | | | | | |
| | NMS | | | NOM | | | NPV | |
| Cash Flows from Operating Activities: | | | | | | | | | |
| Net Increase (Decrease) in Net Assets Applicable to Common Shares from Operations | | $ | 3,140,844 | | | $ | 881,422 | | | $ | 9,697,780 | |
Adjustments to reconcile the net increase (decrease) in net assets applicable to common | | | | | | | | | | | | |
| shares from operations to net cash provided by (used in) operating activities: | | | | | | | | | | | | |
Purchases of investments | | | (9,637,700 | ) | | | (1,578,765 | ) | | | (27,753,377 | ) |
Proceeds from sales and maturities of investments | | | 8,200,188 | | | | 2,293,566 | | | | 25,547,966 | |
Proceeds from (Purchase of) short-term investments, net | | | 900,000 | | | | 205,000 | | | | 395,000 | |
Taxes paid | | | — | | | | (743 | ) | | | (2,292 | ) |
Amortization (Accretion) of premiums and discounts, net | | | 23,431 | | | | 84,538 | | | | 626,064 | |
Amortization of deferred offering costs | | | 7,541 | | | | 4,048 | | | | 7,607 | |
(Increase) Decrease in: | | | | | | | | | | | | |
| Receivable for interest | | | 18,611 | | | | (19,008 | ) | | | (449,541 | ) |
| Receivable for investments sold | | | (10,779 | ) | | | 654,874 | | | | 4,105,076 | |
| Other assets | | | 3,293 | | | | (252 | ) | | | (2,757 | ) |
Increase (Decrease) in: | | | | | | | | | | | | |
| Payable for interest | | | (25,642 | ) | | | 40,051 | | | | 461,211 | |
| Payable for investments purchased | | | 581,750 | | | | (1,651,530 | ) | | | (5,845,041 | ) |
| Payable for offering costs | | | (72 | ) | | | — | | | | — | |
| Accrued management fees | | | (1,743 | ) | | | (746 | ) | | | (5,431 | ) |
| Accrued Trustees fees | | | 107 | | | | 34 | | | | 2,875 | |
| Accrued other expenses | | | (8,465 | ) | | | (12,119 | ) | | | 6,694 | |
Net realized (gain) loss from investments | | | (135,607 | ) | | | (22,986 | ) | | | (255,009 | ) |
Change in net unrealized (appreciation) depreciation of investments | | | (1,317,153 | ) | | | (262,775 | ) | | | (4,710,571 | ) |
Net cash provided by (used in) operating activities | | | 1,738,604 | | | | 614,609 | | | | 1,826,254 | |
| Cash Flows from Financing Activities: | | | | | | | | | | | | |
Proceeds from borrowings | | | — | | | | — | | | | — | |
(Repayments) of borrowings | | | — | | | | — | | | | — | |
Increase (Decrease) in cash overdraft | | | — | | | | (2,562 | ) | | | — | |
Cash distributions paid to common shareholders | | | (1,700,078 | ) | | | (598,111 | ) | | | (4,661,571 | ) |
Net cash provided by (used in) financing activities | | | (1,700,078 | ) | | | (600,673 | ) | | | (4,661,571 | ) |
| Net Increase (Decrease) in Cash | | | 38,526 | | | | 13,936 | | | | (2,835,317 | ) |
Cash at the beginning of period | | | 49,023 | | | | — | | | | 3,746,060 | |
Cash at the end of period | | $ | 87,549 | | | $ | 13,936 | | | $ | 910,743 | |
| | |
| Supplemental Disclosure of Cash Flow Information | | NMS | | | NOM | | | NPV | |
Cash paid for interest (excluding amortization of offering costs) | | $ | 642,560 | | | $ | 167,806 | | | $ | 1,204,694 | |
Non-cash financing activities not included herein consists of reinvestments of | | | | | | | | | | | | |
| common share distributions | | | — | | | | 6,868 | | | | — | |
See accompanying notes to financial statements.
85
Financial Highlights
(Unaudited)
| |
Selected data for a common share outstanding throughout each period: |
|
|
|
| | |
| | | | | Investment Operations | | | Less Distributions to Common Shareholders | | | Common Share | |
| | | Beginning Common Share NAV | | | Net Investment Income (Loss) | | | Net Realized/ Unrealized Gain (Loss) | | | Total | | | From Net Investment Income | | | From Accumu- lated Net Realized Gains | | | Total | | | Discount Per Share Repurchased and Retired | | | Ending NAV | | | Ending Share Price | |
| NKG | | | | | | | | | | | | | | | | | | | | | | | | | | | | | | |
Year Ended 5/31:
| | | | | | | | | | | | | | | | | | | | | | |
2020(e) | | $ | 13.86 | | | $ | 0.24 | | | $ | 0.20 | | | $ | 0.44 | | | $ | (0.22 | ) | | $ | — | | | $ | (0.22 | ) | | $ | — | | | $ | 14.08 | | | $ | 12.47 | |
2019 | | | 13.32 | | | | 0.46 | | | | 0.48 | | | | 0.94 | | | | (0.43 | ) | | | — | | | | (0.43 | ) | | | 0.03 | | | | 13.86 | | | | 12.46 | |
2018 | | | 13.80 | | | | 0.49 | | | | (0.46 | ) | | | 0.03 | | | | (0.51 | ) | | | — | | | | (0.51 | ) | | | — | | | | 13.32 | | | | 11.38 | |
2017 | | | 14.40 | | | | 0.55 | | | | (0.55 | ) | | | — | | | | (0.60 | ) | | | — | | | | (0.60 | ) | | | — | | | | 13.80 | | | | 13.28 | |
2016 | | | 13.98 | | | | 0.68 | | | | 0.38 | | | | 1.06 | | | | (0.64 | ) | | | — | | | | (0.64 | ) | | | — | | | | 14.40 | | | | 14.28 | |
2015 | | | 13.98 | | | | 0.67 | | | | (0.03 | ) | | | 0.64 | | | | (0.64 | ) | | | — | | | | (0.64 | ) | | | — | | | | 13.98 | | | | 12.81 | |
| | |
| NMY | | | | | | | | | | | | | | | | | | | | | | | | | | | | | | | | | | | | | | | | |
Year Ended 5/31:
| | | | | | | | | | | | | | | | | | | | | | | | | | | | | |
2020(e) | | | 14.81 | | | | 0.28 | | | | 0.27 | | | | 0.55 | | | | (0.26 | ) | | | — | | | | (0.26 | ) | | | — | | | | 15.10 | | | | 13.42 | |
2019 | | | 14.29 | | | | 0.54 | | | | 0.49 | | | | 1.03 | | | | (0.53 | ) | | | — | | | | (0.53 | ) | | | 0.02 | | | | 14.81 | | | | 12.79 | |
2018 | | | 14.65 | | | | 0.56 | | | | (0.32 | ) | | | 0.24 | | | | (0.60 | ) | | | — | | | | (0.60 | ) | | | — | * | | | 14.29 | | | | 12.21 | |
2017 | | | 15.08 | | | | 0.61 | | | | (0.38 | ) | | | 0.23 | | | | (0.66 | ) | | | — | | | | (0.66 | ) | | | — | | | | 14.65 | | | | 13.08 | |
2016 | | | 14.59 | | | | 0.67 | | | | 0.47 | | | | 1.14 | | | | (0.67 | ) | | | — | | | | (0.67 | ) | | | 0.02 | | | | 15.08 | | | | 13.65 | |
2015 | | | 14.64 | | | | 0.68 | | | | (0.10 | ) | | | 0.58 | | | | (0.67 | ) | | | — | | | | (0.67 | ) | | | 0.04 | | | | 14.59 | | | | 12.53 | |
| | |
(a) | Total Return Based on Common Share NAV is the combination of changes in common share NAV, reinvested dividend income at NAV and reinvested capital gains distributions at NAV, if any. The last dividend declared in the period, which is typically paid on the first business day of the following month, is assumed to be reinvested at the ending NAV. The actual reinvest price for the last dividend declared in the period may often be based on the Fund’s market price (and not its NAV), and therefore may be different from the price used in the calculation. Total returns are not annualized. |
| Total Return Based on Common Share Price is the combination of changes in the market price per share and the effect of reinvested dividend income and reinvested capital gains distributions, if any, at the average price paid per share at the time of reinvestment. The last dividend declared in the period, which is typically paid on the first business day of the following month, is assumed to be reinvested at the ending market price. The actual reinvestment for the last dividend declared in the period may take place over several days, and in some instances may not be based on the market price, so the actual reinvestment price may be different from the price used in the calculation. Total returns are not annualized. |
86
| | | | | | | | | | | | | | | | | |
| | | | | | | Common Share Supplemental Data/ Ratios Applicable to Common Shares
| |
Common Share Total Returns | | | | | | Ratios to Average Net Assets(b) | | | | |
| | |
Based on NAV(a) | | | Based on Share Price(a) | | | Ending Net Assets (000) | | | Expenses(c) | | | Net Investment Income (Loss) | | | Portfolio Turnover Rate(d) | |
| | |
| | |
| | 3.20 | % | | | 1.87 | % | | $ | 146,444 | | | | 2.18 | %** | | | 3.39 | %** | | | 2 | % |
| | 7.49 | | | | 13.72 | | | | 144,152 | | | | 2.45 | | | | 3.50 | | | | 20 | |
| | 0.22 | | | | (10.74 | ) | | | 140,485 | | | | 2.19 | | | | 3.64 | | | | 15 | |
| | 0.07 | | | | (2.76 | ) | | | 145,577 | | | | 2.10 | | | | 3.94 | | | | 13 | |
| | 7.80 | | | | 16.94 | | | | 151,860 | | | | 1.60 | | | | 4.83 | | | | 13 | |
| | 4.65 | | | | 3.76 | | | | 147,441 | | | | 1.62 | | | | 4.77 | | | | 7 | |
| | |
| | |
| | |
| | 3.75 | | | | 7.02 | | | | 348,775 | | | | 2.42 | ** | | | 3.72 | ** | | | 6 | |
| | 7.56 | | | | 9.40 | | | | 342,060 | | | | 2.61 | | | | 3.82 | | | | 17 | |
| | 1.68 | | | | (2.10 | ) | | | 333,542 | | | | 2.25 | | | | 3.91 | | | | 20 | |
| | 1.61 | | | | 0.69 | | | | 342,427 | | | | 2.08 | | | | 4.14 | | | | 42 | |
| | 8.13 | | | | 14.77 | | | | 352,581 | | | | 1.55 | | | | 4.56 | | | | 19 | |
| | 4.28 | | | | 2.29 | | | | 344,300 | | | | 1.55 | | | | 4.65 | | | | 23 | |
| | |
(b) | Net Investment Income (Loss) ratios reflect income earned and expenses incurred on assets attributable to preferred shares issued by the Fund. |
(c) | The expense ratios reflect, among other things, all interest expense and other costs related to preferred shares (as described in Note 5 – Fund Shares, Preferred Shares) and/or the interest expense deemed to have been paid by the Fund on the floating rate certificates issued by the special purpose trusts for the self-deposited inverse floaters held by the Fund (as described in Note 4 – Portfolio Securities and Investments in Derivatives, Inverse Floating Rate Securities), where applicable, as follows: |
| | | | | |
| NKG | | | NMY | |
Year Ended 5/31: | | Year Ended 5/31: |
2020(e) | 1.14%** | | 2020(e) | 1.38%** |
2019 | 1.36 | | 2019 | 1.56 |
2018 | 1.11 | | 2018 | 1.21 |
2017 | 1.03 | | 2017 | 1.04 |
2016 | 0.55 | | 2016 | 0.55 |
2015 | 0.54 | | 2015 | 0.52 |
| | |
(d) | Portfolio Turnover Rate is calculated based on the lesser of long-term purchases or sales (as disclosed in Note 4 – Portfolio Securities and Investments in Derivatives, Investment Transactions) divided by the average long-term market value during the period. |
(e) | For the six months ended November 30, 2019. |
* | Rounds to less than $0.01 per share. |
** | Annualized. |
See accompanying notes to financial statements.
87
| |
| Financial Highlights (Unaudited) (continued) |
|
|
|
|
Selected data for a common share outstanding throughout each period: |
|
|
|
| | |
| | | | | Investment Operations
| | | Less Distributions to Common Shareholders | | | Common Share
| |
| | | Beginning Common Share NAV | | | Net Investment Income (Loss)
| | | Net Realized/ Unrealized Gain (Loss) | | | Distributions from Net Investment Income to Preferred Share- holders(a) | | | Distributions from Accumulated Net Realized Gains to Preferred Share- holders(a) | | | Total
| | | From Net Investment Income | | | From Accumu- lated Net Realized Gains | | | Total | | | Premium per Share Sold through
Shelf Offering | | | Discount per Share Repurchased and Retired | | | Ending NAV | | | Ending Share Price | |
| NMT | | | | | | | | | | | | | | | | | | | | | | | | | | | | | | | | | | | | | | | |
Year Ended 5/31:
| | | | | | | | | | | | | | | | | | | | | | |
2020(h) | | $ | 14.73 | | | $ | 0.26 | | | $ | 0.19 | | | $ | — | | | $ | — | | | $ | 0.45 | | | $ | (0.25 | ) | | $ | — | | | $ | (0.25 | ) | | $ | — | | | $ | — | | | $ | 14.93 | | | $ | 14.04 | |
2019 | | | 14.28 | | | | 0.52 | | | | 0.42 | | | | — | | | | — | | | | 0.94 | | | | (0.50 | ) | | | — | | | | (0.50 | ) | | | — | | | | 0.01 | | | | 14.73 | | | | 12.84 | |
2018 | | | 14.72 | | | | 0.59 | | | | (0.40 | ) | | | — | | | | — | | | | 0.19 | | | | (0.63 | ) | | | — | | | | (0.63 | ) | | | — | | | | — | | | | 14.28 | | | | 12.64 | |
2017 | | | 15.34 | | | | 0.64 | | | | (0.58 | ) | | | — | | | | — | | | | 0.06 | | | | (0.68 | ) | | | — | | | | (0.68 | ) | | | — | | | | — | | | | 14.72 | | | | 13.90 | |
2016 | | | 14.67 | | | | 0.69 | | | | 0.69 | | | | — | | | | — | | | | 1.38 | | | | (0.71 | ) | | | — | | | | (0.71 | ) | | | — | | | | — | | | | 15.34 | | | | 14.99 | |
2015 | | | 14.65 | | | | 0.65 | | | | 0.05 | | | | — | | | | — | | | | 0.70 | | | | (0.68 | ) | | | — | | | | (0.68 | ) | | | — | | | | — | | | | 14.67 | | | | 13.14 | |
| | |
| NMS | | | | | | | | | | | | | | | | | | | | | | | | | | | | | | | | | | | | | | | | | | | | | | | | | | | | |
Year Ended 5/31:
| | | | | | | | | | | | | | | | | | | | | | | | | | | | | |
2020(h) | | | 15.19 | | | | 0.29 | | | | 0.25 | | | | — | | | | — | | | | 0.54 | | | | (0.29 | ) | | | — | | | | (0.29 | ) | | | — | | | | — | | | | 15.44 | | | | 13.92 | |
2019 | | | 14.69 | | | | 0.62 | | | | 0.50 | | | | — | | | | — | | | | 1.12 | | | | (0.62 | ) | | | — | | | | (0.62 | ) | | | — | | | | — | * | | | 15.19 | | | | 13.76 | |
2018 | | | 15.08 | | | | 0.70 | | | | (0.37 | ) | | | — | | | | — | | | | 0.33 | | | | (0.74 | ) | | | — | | | | (0.74 | ) | | | 0.02 | | | | — | | | | 14.69 | | | | 13.60 | |
2017 | | | 15.78 | | | | 0.70 | | | | (0.62 | ) | | | — | | | | — | | | | 0.08 | | | | (0.79 | ) | | | — | | | | (0.79 | ) | | | 0.01 | | | | — | | | | 15.08 | | | | 16.18 | |
2016 | | | 15.46 | | | | 0.80 | | | | 0.33 | | | | — | | | | — | | | | 1.13 | | | | (0.81 | ) | | | — | | | | (0.81 | ) | | | — | | | | — | | | | 15.78 | | | | 15.99 | |
2015(f) | | | 15.50 | | | | 0.74 | | | | 0.03 | | | | — | | | | — | | | | 0.77 | | | | (0.81 | ) | | | — | | | | (0.81 | ) | | | — | | | | — | | | | 15.46 | | | | 14.95 | |
Year Ended 6/30:
| | | | | | | | | | | | | | | | | | | | | | | | | | | | | |
2014(g) | | | 14.25 | | | | 0.71 | | | | 1.29 | | | | (0.01 | ) | | | — | | | | 1.99 | | | | (0.74 | ) | | | — | | | | (0.74 | ) | | | — | | | | — | | | | 15.50 | | | | 16.48 | |
Year Ended 8/31:
| | | | | | | | | | | | | | | | | | | | | | | | | | | | | |
2013 | | | 16.16 | | | | 0.90 | | | | (1.90 | ) | | | (0.02 | ) | | | — | | | | (1.02 | ) | | | (0.89 | ) | | | — | | | | (0.89 | ) | | | — | | | | — | | | | 14.25 | | | | 14.82 | |
| | |
(a) | The amounts shown are based on common share equivalents. Represents distributions paid on Remarketed Preferred Shares (“RPS”) for NMS. |
(b) | Total Return Based on Common Share NAV is the combination of changes in common share NAV, reinvested dividend income at NAV and reinvested capital gains distributions at NAV, if any. The last dividend declared in the period, which is typically paid on the first business day of the following month, is assumed to be reinvested at the ending NAV. The actual reinvest price for the last dividend declared in the period may often be based on the Fund’s market price (and not its NAV), and therefore may be different from the price used in the calculation. Total returns are not annualized. |
| Total Return Based on Common Share Price is the combination of changes in the market price per share and the effect of reinvested dividend income and reinvested capital gains distributions, if any, at the average price paid per share at the time of reinvestment. The last dividend declared in the period, which is typically paid on the first business day of the following month, is assumed to be reinvested at the ending market price. The actual reinvestment for the last dividend declared in the period may take place over several days, and in some instances may not be based on the market price, so the actual reinvestment price may be different from the price used in the calculation. Total returns are not annualized. |
88
| | | | | | | | | | | | | | | | | |
| | | | | | | Common Share Supplemental Data/ Ratios Applicable to Common Shares
| |
Common Share Total Returns
| | | | | | Ratios to Average Net Assets(c) | | | | |
| | |
Based on NAV(b) | | | Based on Share Price(b) | | | Ending Net Assets (000) | | | Expenses(d) | | | Net Investment Income (Loss) | | | Portfolio Turnover Rate(e) | |
| | |
| | |
| | 3.04 | % | | | 11.30 | % | | $ | 139,149 | | | | 2.24 | %** | | | 3.50 | %** | | | 7 | % |
| | 6.87 | | | | 5.80 | | | | 137,281 | | | | 2.45 | | | | 3.70 | | | | 16 | |
| | 1.29 | | | | (4.84 | ) | | | 133,468 | | | | 2.13 | | | | 4.04 | | | | 17 | |
| | 0.43 | | | | (2.78 | ) | | | 137,639 | | | | 1.91 | | | | 4.29 | | | | 12 | |
| | 9.64 | | | | 20.01 | | | | 143,395 | | | | 1.62 | | | | 4.65 | | | | 13 | |
| | 4.84 | | | | 3.75 | | | | 137,130 | | | | 1.96 | | | | 4.57 | | | | 14 | |
| | |
| | |
| | |
| | 3.60 | | | | 3.26 | | | | 89,252 | | | | 2.53 | ** | | | 3.79 | ** | | | 6 | |
| | 7.88 | | | | 6.13 | | | | 87,812 | | | | 2.75 | | | | 4.25 | | | | 30 | |
| | 2.37 | | | | (11.55 | ) | | | 85,067 | | | | 2.40 | | | | 4.66 | | | | 13 | |
| | 0.68 | | | | 6.41 | | | | 84,726 | | | | 2.47 | | | | 4.59 | | | | 19 | |
| | 7.47 | | | | 12.84 | | | | 87,942 | | | | 1.69 | | | | 5.14 | | | | 17 | |
| | 5.02 | | | | (4.37 | ) | | | 86,150 | | | | 1.80 | ** | | | 5.19 | ** | | | 14 | |
| | |
| | 14.33 | | | | 16.61 | | | | 64,277 | | | | 1.64 | ** | | | 5.75 | ** | | | 8 | |
| | |
| | (6.77 | ) | | | (10.99 | ) | | | 59,100 | | | | 1.35 | | | | 5.68 | | | | 11 | |
| | |
(c) | Ratios do not reflect the effect of dividend payments to RPS shareholders, during periods when RPS were outstanding; Net Investment Income (Loss) ratios reflect income earned and expenses incurred on assets attributable to RPS and other subsequent forms of preferred shares issued by the Fund, where applicable. For the years ended June 30, 2014 and prior, NMS includes the RPS of Minnesota Municipal Income Portfolio (MXA). |
(d) | The expense ratios reflect, among other things, all interest expense and other costs related to preferred shares (as described in Note 5 – Fund Shares, Preferred Shares) and/or the interest expense deemed to have been paid by the Fund on the floating rate certificates issued by the special purpose trusts for the self-deposited inverse floaters held by the Fund (as described in Note 4 – Portfolio Securities and Investments in Derivatives, Inverse Floating Rate Securities), where applicable, as follows: |
| | | | | |
| NMT | | | NMS | |
Year Ended 5/31:
| | Year Ended 5/31:
|
2020(h) | 1.18%** | | 2020(h) | 1.40%** |
2019 | 1.30 | | 2019 | 1.59 |
2018 | 1.00 | | 2018 | 1.06 |
2017 | 0.83 | | 2017 | 1.29 |
2016 | 0.58 | | 2016 | 0.62 |
2015 | 0.86 | | 2015(f) | 0.61** |
| | | Year Ended 6/30:
|
| | | 2014(g) | 0.18** |
| | | Year Ended 8/31:
|
| | | 2013 | — |
| | |
(e) | Portfolio Turnover Rate is calculated based on the lesser of long-term purchases or sales (as disclosed in Note 4 – Portfolio Securities and Investments in Derivatives, Investment Transactions) divided by the average long-term market value during the period. |
(f) | For the eleven months ended May 31, 2015. |
(g) | For the ten months ended June 30, 2014. |
(h) | For the six months ended November 30, 2019. |
* | Rounds to less than $0.01 per share. |
** | Annualized. |
See accompanying notes to financial statements.
89
| |
| Financial Highlights (Unaudited) (continued) |
|
|
|
|
Selected data for a common share outstanding throughout each period: |
|
|
| | |
| | | | | Investment Operations | | | Less Distributions to Common Shareholders | | | Common Share | |
| | | Beginning Common Share NAV | | | Net Investment Income (Loss) | | | Net Realized/ Unrealized Gain (Loss) | | | Total | | | From Net Investment Income | | | Accumu- lated Net Realized Gains | | | Return of Capital | | | Total | | | Discount Per Share Repurchased and Retired | | | Ending NAV | | | Ending Share Price | |
| NOM | | | | | | | | | | | | | | | | | | | | | | | | | | | | | | | | | |
Year Ended 5/31:
| | | | | | | | | | | | | | | | | | | | | | |
2020(f) | | $ | 13.84 | | | $ | 0.25 | | | $ | 0.13 | | | $ | 0.38 | | | $ | (0.26 | ) | | $ | — | | | $ | — | | | $ | (0.26 | ) | | $ | — | | | $ | 13.96 | | | $ | 14.45 | |
2019 | | | 13.48 | | | | 0.52 | | | | 0.36 | | | | 0.88 | | | | (0.52 | ) | | | — | | | | — | | | | (0.52 | ) | | | — | | | | 13.84 | | | | 13.97 | |
2018 | | | 13.95 | | | | 0.57 | | | | (0.41 | ) | | | 0.16 | | | | (0.62 | ) | | | — | | | | (0.01 | ) | | | (0.63 | ) | | | — | | | | 13.48 | | | | 13.34 | |
2017 | | | 14.45 | | | | 0.65 | | | | (0.44 | ) | | | 0.21 | | | | (0.71 | ) | | | — | | | | — | | | | (0.71 | ) | | | — | | | | 13.95 | | | | 16.20 | |
2016 | | | 13.91 | | | | 0.72 | | | | 0.55 | | | | 1.27 | | | | (0.73 | ) | | | — | | | | — | | | | (0.73 | ) | | | — | | | | 14.45 | | | | 16.03 | |
2015 | | | 14.19 | | | | 0.62 | | | | (0.17 | ) | | | 0.45 | | | | (0.73 | ) | | | — | | | | — | | | | (0.73 | ) | | | — | | | | 13.91 | | | | 15.27 | |
| NPV | | | | | | | | | | | | | | | | | | | | | | | | | | | | | | | | | | | | | | | | | | | | |
Year Ended 5/31:
| | | | | | | | | | | | | | | | | | | | | | | | | | | | | |
2020(f) | | | 14.67 | | | | 0.26 | | | | 0.28 | | | | 0.54 | | | | (0.26 | ) | | | — | | | | — | | | | (0.26 | ) | | | — | | | | 14.95 | | | | 14.41 | |
2019 | | | 14.17 | | | | 0.53 | | | | 0.49 | | | | 1.02 | | | | (0.53 | ) | | | — | | | | — | | | | (0.53 | ) | | | 0.01 | | | | 14.67 | | | | 12.92 | |
2018 | | | 14.49 | | | | 0.56 | | | | (0.32 | ) | | | 0.24 | | | | (0.56 | ) | | | — | | | | — | | | | (0.56 | ) | | | — | | | | 14.17 | | | | 12.35 | |
2017 | | | 15.00 | | | | 0.58 | | | | (0.50 | ) | | | 0.08 | | | | (0.59 | ) | | | — | | | | — | | | | (0.59 | ) | | | — | | | | 14.49 | | | | 13.25 | |
2016 | | | 14.50 | | | | 0.66 | | | | 0.53 | | | | 1.19 | | | | (0.69 | ) | | | — | | | | — | | | | (0.69 | ) | | | — | | | | 15.00 | | | | 14.43 | |
2015 | | | 14.47 | | | | 0.72 | | | | 0.06 | | | | 0.78 | | | | (0.75 | ) | | | — | | | | — | | | | (0.75 | ) | | | — | | | | 14.50 | | | | 13.39 | |
| | |
(a) | Total Return Based on Common Share NAV is the combination of changes in common share NAV, reinvested dividend income at NAV and reinvested capital gains distributions at NAV, if any. The last dividend declared in the period, which is typically paid on the first business day of the following month, is assumed to be reinvested at the ending NAV. The actual reinvest price for the last dividend declared in the period may often be based on the Fund’s market price (and not its NAV), and therefore may be different from the price used in the calculation. Total returns are not annualized. |
| Total Return Based on Common Share Price is the combination of changes in the market price per share and the effect of reinvested dividend income and reinvested capital gains distributions, if any, at the average price paid per share at the time of reinvestment. The last dividend declared in the period, which is typically paid on the first business day of the following month, is assumed to be reinvested at the ending market price. The actual reinvestment for the last dividend declared in the period may take place over several days, and in some instances may not be based on the market price, so the actual reinvestment price may be different from the price used in the calculation. Total returns are not annualized. |
90
| | | | | | | | | | | | | | | | | |
| | | | | | | Common Share Supplemental Data/ Ratios Applicable to Common Shares
| |
Common Share Total Returns
| | | | | | Ratios to Average Net Assets(b) | | | | |
| | |
Based on NAV(a) | | | Based on Share Price(a) | | | Ending Net Assets (000) | | | Expenses(c) | | | Net Investment Income (Loss) | | | Portfolio Turnover Rate(e) | |
| | |
| | |
| | 2.74 | % | | | 5.36 | % | | $ | 32,727 | | | | 2.58 | %** | | | 3.64 | %** | | | 3 | % |
| | 6.70 | | | | 9.06 | | | | 32,444 | | | | 2.72 | | | | 3.90 | | | | 23 | |
| | 1.15 | | | | (13.89 | ) | | | 31,605 | | | | 2.54 | | | | 4.15 | | | | 20 | |
| | 1.53 | | | | 5.77 | | | | 32,658 | | | | 2.27 | | | | 4.65 | | | | 14 | |
| | 9.40 | | | | 10.34 | | | | 33,777 | | | | 1.94 | | | | 5.13 | | | | 5 | |
| | 3.21 | | | | 6.50 | | | | 32,467 | | | | 2.80 | | | | 4.38 | | | | 8 | |
| | |
| | |
| | 3.70 | | | | 13.66 | | | | 267,233 | | | | 2.28 | ** | | | 3.55 | ** | | | 6 | |
| | 7.49 | | | | 9.23 | | | | 262,202 | | | | 2.48 | | | | 3.81 | | | | 21 | |
| | 1.70 | | | | (2.62 | ) | | | 254,175 | | | | 2.07 | | | | 3.92 | | | | 22 | |
| | 0.63 | | | | (4.14 | ) | | | 259,831 | | | | 1.97 | | | | 3.98 | | | | 38 | |
| | 8.41 | | | | 13.22 | | | | 268,960 | | | | 1.64 | | | | 4.51 | | | | 18 | |
| | 5.45 | | | | 5.72 | | | | 260,104 | | | | 1.67(d | ) | | | 4.91(d | ) | | | 17 | |
| | |
(b) | Net Investment Income (Loss) ratios reflect income earned and expenses incurred on assets attributable to preferred shares issued by the Fund. |
(c) | The expense ratios reflect, among other things, all interest expense and other costs related to preferred shares (as described in Note 5 – Fund Shares, Preferred Shares) and/or the interest expense deemed to have been paid by the Fund on the floating rate certificates issued by the special purpose trusts for the self-deposited inverse floaters held by the Fund, (as described in Note 4 – Portfolio Securities and Investments in Derivatives, Inverse Floating Rate Securities), where applicable, as follows: |
| | | | | |
| NOM | | | NPV | |
Year Ended 5/31:
| | Year Ended 5/31:
|
2020(f) | 1.29%** | | 2020(f) | 1.26%** |
2019 | 1.40 | | 2019 | 1.42 |
2018 | 1.19 | | 2018 | 1.02 |
2017 | 0.99 | | 2017 | 0.94 |
2016 | 0.69 | | 2016 | 0.62 |
2015 | 1.44 | | 2015 | 0.59 |
| | |
(d) | During the period ended May 31, 2015, the Adviser voluntarily reimbursed the Fund for certain expenses incurred in connection with a common shares equity shelf program. As a result, the Expenses and Net Investment Income (Loss) Ratios to Average Net Assets reflect this voluntary expense reimbursement from Adviser. The Expenses and Net Investment Income (Loss) Ratios to Average Net Assets excluding this expense reimbursement from Adviser were as follows: |
| | | | |
| Ratios to Average Net Assets | |
| | Net Investment | |
| NPV | Expenses | Income (Loss) | |
Year Ended 5/31:
| | |
| 2015 | 1.70% | 4.88% | |
| | |
(e) | Portfolio Turnover Rate is calculated based on the lesser of long-term purchases or sales (as disclosed in Note 4 – Portfolio Securities and Investments in Derivatives, Investment Transactions) divided by the average long-term market value during the period. |
(f) | For the six months ended November 30, 2019. |
* | Rounds to less than $0.01 per share. |
** | Annualized. |
See accompanying notes to financial statements.
91
| |
| Financial Highlights (Unaudited) (continued) |
|
|
|
| | |
| | AMTP Shares at the End of Period | | | VMTP Shares at the End of Period | |
| | Aggregate Amount Outstanding (000) | | | Asset Coverage Per $100,000 Share | | | Aggregate Amount Outstanding (000) | | | Coverage Per $100,000 | |
| NKG | | | | | | | | | | | | |
Year Ended 5/31:
| | | | | | | |
2020(a) | | $ | 58,500 | | | $ | 350,332 | | | $ | — | | | $ | — | |
2019 | | | 58,500 | | | | 346,414 | | | | — | | | | | |
2018 | | | — | | | | — | | | | 82,000 | | | | 271,323 | |
2017 | | | — | | | | — | | | | 82,000 | | | | 277,532 | |
2016 | | | — | | | | — | | | | 75,000 | | | | 302,480 | |
2015 | | | — | | | | — | | | | 75,000 | | | | 296,588 | |
| | |
| NMY | | | | | | | | | | | | | | | | |
Year Ended 5/31:
| | | | | | | | | |
2020(a) | | | 182,000 | | | | 291,635 | | | | — | | | | | |
2019 | | | 182,000 | | | | 287,945 | | | | — | | | | | |
2018 | | | — | | | | — | | | | 197,000 | | | | 269,311 | |
2017 | | | — | | | | — | | | | 197,000 | | | | 273,821 | |
2016 | | | — | | | | — | | | | 167,000 | | | | 311,126 | |
2015 | | | — | | | | — | | | | 167,000 | | | | 306,168 | |
|
(a)
| For the six months ended November 30, 2019. |
See accompanying notes to financial statements.
92
| | | | | | | | | | | | | | | | | | | | | | | | | | | | | | | |
| | AMTP Shares at the End of Period | | | RPS at the End of Period | | | MTP Shares at the End of Period(a) | | | VMTP Shares at the End of Period | | | VRDP Shares at the End of Period | |
| | Aggregate Amount Outstanding (000) | | | Asset Coverage Per $100,000 Share | | | Aggregate Amount Outstanding (000) | | | Asset Coverage Per $25,000 Share | | | Aggregate Amount Outstanding (000) | | | Asset Coverage Per $10 Share | | | Aggregate Amount Outstanding (000) | | | Asset Coverage Per $100,000 Share | | | Aggregate Amount Outstanding (000) | | | Asset Coverage Per $100,000 Share | |
| NMT | | | | | | | | | | | | | | | | | | | | | | | | | | | | | | |
Year Ended 5/31: | | | | | | | | | | | | | | | | | | | |
2020(e) | | $ | — | | | $ | — | | | $ | — | | | $ | — | | | $ | — | | | $ | — | | | $ | — | | | $ | — | | | $ | 74,000 | | | $ | 288,039 | |
2019 | | | — | | | | — | | | | — | | | | — | | | | — | | | | — | | | | — | | | | — | | | | 74,000 | | | | 285,515 | |
2018 | | | — | | | | — | | | | — | | | | — | | | | — | | | | — | | | | — | | | | — | | | | 74,000 | | | | 280,362 | |
2017 | | | — | | | | — | | | | — | | | | — | | | | — | | | | — | | | | — | | | | — | | | | 74,000 | | | | 285,999 | |
2016 | | | — | | | | — | | | | — | | | | — | | | | — | | | | — | | | | 74,000 | | | | 293,776 | | | | — | | | | — | |
2015 | | | — | | | | — | | | | — | | | | — | | | | — | | | | — | | | | 74,000 | | | | 285,311 | | | | — | | | | — | |
| | |
| NMS | | | | | | | | | | | | | | | | | | | | | | | | | | | | | | | | | | | | | | | | |
Year Ended 5/31: | | | | | | | | | | | | | | | | | | | | | | | | | |
2020(e) | | | 52,800 | | | | 269,039 | | | | — | | | | — | | | | — | | | | — | | | | — | | | | — | | | | — | | | | — | |
2019 | | | 52,800 | | | | 266,310 | | | | — | | | | — | | | | — | | | | — | | | | — | | | | — | | | | — | | | | — | |
2018 | | | — | | | | — | | | | — | | | | — | | | | — | | | | — | | | | 52,800 | | | | 261,111 | | | | — | | | | — | |
2017 | | | — | | | | — | | | | — | | | | — | | | | — | | | | — | | | | 52,800 | | | | 260,466 | | | | — | | | | — | |
2016 | | | — | | | | — | | | | — | | | | — | | | | — | | | | — | | | | 44,100 | | | | 299,415 | | | | — | | | | — | |
2015(c) | | | — | | | | — | | | | — | | | | — | | | | — | | | | — | | | | 44,100 | | | | 295,352 | | | | — | | | | — | |
Year Ended 6/30:
| | | | | | | | | | | | | | | | | | | | | | | | | |
2014(d) | | | — | | | | — | | | | — | | | | — | | | | — | | | | — | | | | 31,100 | | | | 307 | * | | | — | | | | — | |
Year Ended 8/31: | | | | | | | | | | | | | | | | | | | | | | | | | |
2013 | | | — | | | | — | | | | 31,100 | | | | 73 | * | | | — | | | | — | | | | — | | | | — | | | | — | | | | — | |
| | |
* | Rounded to the nearest thousand (000). |
(a) | The Ending and Average Market Value Per Share for each Series of the Fund’s MTP Shares were as follows: |
| | | | |
| | 2015 | |
| NMT | | | |
| Series 2015 (NMT PRC) | | | |
Ending Market Value per Share | | | — | |
Average Market Value per Share | | | 10.02 | |
| Series 2016 (NMT PRD) | | | | |
Ending Market Value per Share | | | — | |
Average Market Value per Share | | | 10.03 | Ω |
| Series 2015 (NMT PRE) (b) | | | | |
Ending Market Value per Share | | | — | |
Average Market Value per Share | | | 10.00 | Δ |
| Series 2015-1 (NMT PRF) (b) | | | | |
Ending Market Value per Share | | | — | |
Average Market Value per Share | | | 10.00 | Δ |
| | |
(b) | MTP Shares issued in connection with the reorganizations. |
(c) | For the eleven months ended May 31, 2015. |
(d) | For the ten months ended June 30, 2014. |
(e) | For the six months ended November 30, 2019. |
| Ω | For the period June 1, 2014 through July 11, 2014. |
Δ | For the period June 9, 2014 (effective date of the reorganizations) through July 11, 2014. |
See accompanying notes to financial statements.
93
| |
| Financial Highlights (Unaudited) (continued) |
|
|
|
| | |
| | MFP Shares at the End of Period | | | MTP Shares at the End of Period(a) | | | VMTP Shares at the End of Period | | | VRDP Shares at the End of Period | |
| | Aggregate Amount Outstanding (000) | | | Asset Coverage Per $100,000 Share | | | Aggregate Amount Outstanding (000) | | | Asset Coverage Per $10 Share | | | Aggregate Amount Outstanding (000) | | | Asset Coverage Per $100,000 Share | | | Aggregate Amount Outstanding (000) | | | Asset Coverage Per $100,000 Share | |
| NOM | | | | | | | | | | | | | | | | | | | | | | | | |
Year Ended 5/31:
| | | | | | | | | | | | | |
2020(b) | | $ | 18,000 | | | $ | 281,816 | | | $ | — | | | $ | — | | | $ | — | | | $ | — | | | $ | — | | | $ | — | |
2019 | | | 18,000 | | | | 280,242 | | | | — | | | | — | | | | — | | | | — | | | | — | | | | — | |
2018 | | | 18,000 | | | | 275,584 | | | | — | | | | — | | | | — | | | | — | | | | — | | | | — | |
2017 | | | — | | | | — | | | | — | | | | — | | | | 18,000 | | | | 281,436 | | | | — | | | | — | |
2016 | | | — | | | | — | | | | — | | | | — | | | | 18,000 | | | | 287,651 | | | | — | | | | — | |
2015 | | | — | | | | — | | | | — | | | | — | | | | 18,000 | | | | 280,372 | | | | — | | | | — | |
| | |
| NPV | | | | | | | | | | | | | | | | | | | | | | | | | | | | | | | | |
Year Ended 5/31:
| | | | | | | | | | | | | | | | | |
2020(b) | | | — | | | | — | | | | — | | | | — | | | | — | | | | — | | | | 128,000 | | | | 308,776 | |
2019 | | | — | | | | — | | | | — | | | | — | | | | — | | | | — | | | | 128,000 | | | | 304,845 | |
2018 | | | — | | | | — | | | | — | | | | — | | | | — | | | | — | | | | 128,000 | | | | 298,574 | |
2017 | | | — | | | | — | | | | — | | | | — | | | | — | | | | — | | | | 128,000 | | | | 302,993 | |
2016 | | | — | | | | — | | | | — | | | | — | | | | — | | | | — | | | | 128,000 | | | | 310,125 | |
2015 | | | — | | | | — | | | | — | | | | — | | | | — | | | | — | | | | 128,000 | | | | 303,206 | |
| | |
(a) | The Ending and Average Market Value Per Share for each Series of the Fund’s MTP Shares were as follows: |
| | | | |
| | 2015 | |
| | |
| NOM | | | |
| Series 2015 (NOM PRC) | | | |
Ending Market Value per Share | | $ | — | |
Average Market Value per Share | | | 10.03 | Δ |
| | |
(b) | For the six months ended November 30, 2019. |
| For the period June 1, 2014, through February 9, 2015. |
See accompanying notes to financial statements.
94
Notes to
Financial Statements
(Unaudited)
1. General Information
Fund Information
The state funds covered in this report and their corresponding New York Stock Exchange (“NYSE”) symbols are as follows (each a “Fund” and collectively, the “Funds”):
| • | Nuveen Georgia Quality Municipal Income Fund (NKG) |
| • | Nuveen Maryland Quality Municipal Income Fund (NMY) |
| • | Nuveen Massachusetts Quality Municipal Income Fund (NMT) |
| • | Nuveen Minnesota Quality Municipal Income Fund (NMS) |
| • | Nuveen Missouri Quality Municipal Income Fund (NOM) |
| • | Nuveen Virginia Quality Municipal Income Fund (NPV) |
The Funds are registered under the Investment Company Act of 1940 (the “1940 Act”), as amended, as diversified closed-end management investment companies. NKG, NMS and NOM were organized as Massachusetts business trusts on October 26, 2001, April 28, 2014 and March 29, 1993, respectively. NMY, NMT and NPV were organized as Massachusetts business trusts on January 12, 1993.
The end of the reporting period for the Funds is November 30, 2019, and the period covered by these Notes to Financial Statements is the six months ended November 30, 2019 (the “current fiscal period”).
Investment Adviser
The Funds’ investment adviser is Nuveen Fund Advisors, LLC (the “Adviser”), a subsidiary of Nuveen, LLC (“Nuveen”). Nuveen is the investment management arm of Teachers Insurance and Annuity Association of America (TIAA). The Adviser has overall responsibility for management of the Funds, oversees the management of the Funds’ portfolios, manages the Funds’ business affairs and provides certain clerical, bookkeeping and other administrative services, and if necessary, asset allocation decisions. The Adviser has entered into sub-advisory agreements with Nuveen Asset Management, LLC (the “Sub-Adviser”), a subsidiary of the Adviser, under which the Sub-Adviser manages the investment portfolios of the Funds.
2. Significant Accounting Policies
The accompanying financial statements were prepared in accordance with accounting principles generally accepted in the United States of America (“U.S. GAAP”), which may require the use of estimates made by management and the evaluation of subsequent events. Actual results may differ from those estimates. Each Fund is an investment company and follows the accounting guidance in the Financial Accounting Standards Board (“FASB”) Accounting Standards Codification 946, Financial Services—Investment Companies. The net asset value (“NAV”) for financial reporting purposes may differ from the NAV for processing security and common share transactions. The NAV for financial reporting purposes includes security and common share transactions through the date of the report. Total return is computed based on the NAV used for processing security and common share transactions. The following is a summary of the significant accounting policies consistently followed by the Funds.
Compensation
The Funds pay no compensation directly to those of its trustees who are affiliated with the Adviser or to its officers, all of whom receive remuneration for their services to the Funds from the Adviser or its affiliates. The Funds’ Board of Trustees (“the Board”) has adopted a deferred compensation plan for independent trustees that enables trustees to elect to defer receipt of all or a portion of the annual compensation they are entitled to receive from certain Nuveen-advised funds. Under the plan, deferred amounts are treated as though equal dollar amounts had been invested in shares of select Nuveen-advised funds.
Distributions to Common Shareholders
Distributions to common shareholders are recorded on the ex-dividend date. The amount, character and timing of distributions are determined in accordance with federal income tax regulations, which may differ from U.S. GAAP.
Indemnifications
Under the Funds’ organizational documents, their officers and trustees are indemnified against certain liabilities arising out of the performance of their duties to the Funds. In addition, in the normal course of business, the Funds enter into contracts that provide general indemnifications to other parties.
95
Notes to Financial Statements (Unaudited) (continued)
The Funds’ maximum exposure under these arrangements is unknown as this would involve future claims that may be made against the Funds that have not yet occurred. However, the Funds have not had prior claims or losses pursuant to these contracts and expect the risk of loss to be remote.
Investments and Investment Income
Securities transactions are accounted for as of the trade date for financial reporting purposes. Realized gains and losses on securities transactions are based upon the specific identification method. Investment income is comprised of interest income, which reflects the amortization of premiums and accretion of discounts for financial reporting purposes, and is recorded on an accrual basis. Investment income also reflects payment-in-kind (“PIK”) interest and paydown gains and losses, if any. PIK interest represents income received in the form of securities in lieu of cash.
Netting Agreements
In the ordinary course of business, the Funds may enter into transactions subject to enforceable International Swaps and Derivatives Association, Inc. (ISDA) master agreements or other similar arrangements (“netting agreements”). Generally, the right to offset in netting agreements allows each Fund to offset certain securities and derivatives with a specific counterparty, when applicable, as well as any collateral received or delivered to that counterparty based on the terms of the agreements. Generally, each Fund manages its cash collateral and securities collateral on a counterparty basis.
The Funds’ investments subject to netting agreements as of the end of the reporting period, if any, are further described in Note 4 – Portfolio Securities and Investments in Derivatives.
New Accounting Pronouncements and Rule Issuances
FASB Accounting Standards Update (“ASU”) 2017-08 (“ASU 2017-08”) Premium Amortization on Purchased Callable Debt Securities
The FASB has issued ASU 2017-08, which shortens the premium amortization period for purchased non-contingently callable debt securities. ASU 2017-08 specifies that the premium amortization period ends at the earliest call date, for purchased non-contingently callable debt securities. ASU 2017-08 effective for fiscal years, and interim periods within those fiscal years, beginning after December 15, 2018. During the current fiscal period, ASU 2017-08 became effective for the Funds and it did not have a material impact on the Funds’ financial statements.
Fair Value Measurement: Disclosure Framework
During August 2018, the FASB issued ASU 2018-13 (“ASU 2018-13”), Fair Value Measurement: Disclosure Framework – Changes to the Disclosure Requirements for Fair Value Measurements. ASU 2018-13 modifies the disclosures required by Topic 820, Fair Value Measurements. The amendments in ASU 2018-13 are effective for all entities for fiscal years, and interim periods within those fiscal years, beginning after December 15, 2019. Management early implemented this guidance and it did not have a material impact on the Funds’ financial statements.
3. Investment Valuation and Fair Value Measurements
The fair valuation input levels as described below are for fair value measurement purposes.
The Funds’ investments in securities is recorded at their estimated fair value. Fair value is defined as the price that would be received upon selling an investment or transferring a liability in an orderly transaction to an independent buyer in the principal or most advantageous market for the investment. A three-tier hierarchy is used to maximize the use of observable market data and minimize the use of unobservable inputs and to establish classification of fair value measurements for disclosure purposes. Observable inputs reflect the assumptions market participants would use in pricing the asset or liability. Observable inputs are based on market data obtained from sources independent of the reporting entity. Unobservable inputs reflect the reporting entity’s own assumptions about the assumptions market participants would use in pricing the asset or liability. Unobservable inputs are based on the best information available in the circumstances. The following is a summary of the three-tiered hierarchy of valuation input levels.
Level 1 – Inputs are unadjusted and prices are determined using quoted prices in active markets for identical securities.
Level 2 – Prices are determined using other significant observable inputs (including quoted prices for similar securities, interest rates, credit spreads, etc.).
Level 3 – Prices are determined using significant unobservable inputs (including management’s assumptions in determining the fair value of investments).
Prices of fixed income securities are provided by an independent pricing service (“pricing service”) approved by the Board. The pricing service establishes a security’s fair value using methods that may include consideration of the following: yields or prices of investments of comparable quality, type of issue, coupon, maturity and rating, market quotes or indications of value from security dealers, evaluations of anticipated cash flows or collateral, general market conditions and other information and analysis, including the obligor’s credit characteristics considered relevant. These securities are generally classified as Level 2. In pricing certain securities, particularly less liquid and lower quality securities, the pricing service may consider information about a security, its issuer or market activity, provided by the Adviser. These securities are generally classified as Level 2 or Level 3 depending on the observability of the significant inputs.
96
Certain securities may not be able to be priced by the pre-established pricing methods as described above. Such securities may be valued by the Board and/or its appointee at fair value. These securities generally include, but are not limited to, restricted securities (securities which may not be publicly sold without registration under the Securities Act of 1933, as amended) for which a pricing service is unable to provide a market price; securities whose trading has been formally suspended; debt securities that have gone into default and for which there is no current market quotation; a security whose market price is not available from a pre-established pricing source; a security with respect to which an event has occurred that is likely to materially affect the value of the security after the market has closed but before the calculation of a Fund’s NAV (as may be the case in non-U.S. markets on which the security is primarily traded) or make it difficult or impossible to obtain a reliable market quotation; and a security whose price, as provided by the pricing service, is not deemed to reflect the security’s fair value. As a general principle, the fair value of a security would appear to be the amount that the owner might reasonably expect to receive for it in a current sale. A variety of factors may be considered in determining the fair value of such securities, which may include consideration of the following: yields or prices of investments of comparable quality, type of issue, coupon, maturity and rating, market quotes or indications of value from security dealers, evaluations of anticipated cash flows or collateral, general market conditions and other information and analysis, including the obligor’s credit characteristics considered relevant. These securities are generally classified as Level 2 or Level 3 depending on the observability of the significant inputs. Regardless of the method employed to value a particular security, all valuations are subject to review by the Board and/or its appointee.
The inputs or methodologies used for valuing securities are not an indication of the risks associated with investing in those securities. The following is a summary of each Fund’s fair value measurements as of the end of the reporting period:
| | | | | | | | | | | | | |
| NKG | | Level 1 | | | Level 2 | | | Level 3 | | | Total | |
Long-Term Investments*: | | | | | | | | | | | | |
| Municipal Bonds | | $ | — | | | $ | 220,825,033 | | | $ | 81,240 | ** | | $ | 220,906,273 | |
Short-Term Investments*: | | | | | | | | | | | | | | | | |
| Municipal Bonds | | | — | | | | — | | | | 257,797 | ** | | | 257,797 | |
Total | | $ | — | | | $ | 220,825,033 | | | $ | 339,037 | | | $ | 221,164,070 | |
| NMY | | | | | | | | | | | | | | | | |
Long-Term Investments*: | | | | | | | | | | | | | | | | |
| Municipal Bonds | | $ | — | | | $ | 552,522,472 | | | $ | — | | | $ | 552,522,472 | |
| NMT | | | | | | | | | | | | | | | | |
Long-Term Investments*: | | | | | | | | | | | | | | | | |
| Municipal Bonds | | $ | — | | | $ | 210,270,864 | | | $ | — | | | $ | 210,270,864 | |
| NMS | | | | | | | | | | | | | | | | |
Long-Term Investments*: | | | | | | | | | | | | | | | | |
| Municipal Bonds | | $ | — | | | $ | 139,148,493 | | | $ | — | | | $ | 139,148,493 | |
Short-Term Investments*: | | | | | | | | | | | | | | | | |
| Municipal Bonds | | | — | | | | 2,100,000 | | | | — | | | | 2,100,000 | |
Total | | $ | — | | | $ | 141,248,493 | | | $ | — | | | $ | 141,248,493 | |
| NOM | | | | | | | | | | | | | | | | |
Long-Term Investments*: | | | | | | | | | | | | | | | | |
| Municipal Bonds | | $ | — | | | $ | 50,715,069 | | | $ | — | | | $ | 50,715,069 | |
| NPV | | | | | | | | | | | | | | | | |
Long-Term Investments*: | | | | | | | | | | | | | | | | |
| Municipal Bonds | | $ | — | | | $ | 410,760,445 | | | $ | — | | | $ | 410,760,445 | |
| | |
* | Refer to the Fund’s Portfolio of Investments for industry classifications. |
** | Refer to the Fund’s Portfolio of Investments for securities classified as Level 3. |
4. Portfolio Securities and Investments in Derivatives
Portfolio Securities
Inverse Floating Rate Securities
Each Fund is authorized to invest in inverse floating rate securities. An inverse floating rate security is created by depositing a municipal bond (referred to as an “Underlying Bond”), typically with a fixed interest rate, into a special purpose tender option bond (“TOB”) trust (referred to as the “TOB Trust”) created by or at the direction of one or more Funds. In turn, the TOB Trust issues (a) floating rate certificates (referred to as “Floaters”) in face amounts equal to some fraction of the Underlying Bond’s par amount or market value, and (b) an inverse floating rate certificate (referred to as an
97
Notes to Financial Statements (Unaudited) (continued)
“Inverse Floater”) that represents all remaining or residual interest in the TOB Trust. Floaters typically pay short-term tax-exempt interest rates to third parties who are also provided a right to tender their certificate and receive its par value, which may be paid from the proceeds of a remarketing of the Floaters, by a loan to the TOB Trust from a third party liquidity provider (“Liquidity Provider”), or by the sale of assets from the TOB Trust. The Inverse Floater is issued to a long term investor, such as one or more of the Funds. The income received by the Inverse Floater holder varies inversely with the short-term rate paid to holders of the Floaters, and in most circumstances the Inverse Floater holder bears substantially all of the Underlying Bond’s downside investment risk and also benefits disproportionately from any potential appreciation of the Underlying Bond’s value. The value of an Inverse Floater will be more volatile than that of the Underlying Bond because the interest rate is dependent on not only the fixed coupon rate of the Underlying Bond but also on the short-term interest paid on the Floaters, and because the Inverse Floater essentially bears the risk of loss (and possible gain) of the greater face value of the Underlying Bond.
The Inverse Floater held by a Fund gives the Fund the right to (a) cause the holders of the Floaters to tender their certificates at par (or slightly more than par in certain circumstances), and (b) have the trustee of the TOB Trust (the “Trustee”) transfer the Underlying Bond held by the TOB Trust to the Fund, thereby collapsing the TOB Trust.
The Fund may acquire an Inverse Floater in a transaction where it (a) transfers an Underlying Bond that it owns to a TOB Trust created by a third party or (b) transfers an Underlying Bond that it owns, or that it has purchased in a secondary market transaction for the purpose of creating an Inverse Floater, to a TOB Trust created at its direction, and in return receives the Inverse Floater of the TOB Trust (referred to as a “self-deposited Inverse Floater”). A Fund may also purchase an Inverse Floater in a secondary market transaction from a third party creator of the TOB Trust without first owning the Underlying Bond (referred to as an “externally-deposited Inverse Floater”).
An investment in a self-deposited Inverse Floater is accounted for as a “financing” transaction (i.e., a secured borrowing). For a self-deposited Inverse Floater, the Underlying Bond deposited into the TOB Trust is identified in the Fund’s Portfolio of Investments as “(UB) – Underlying bond of an inverse floating rate trust reflected as a financing transaction,” with the Fund recognizing as liabilities, labeled “Floating rate obligations” on the Statement of Assets and Liabilities, (a) the liquidation value of Floaters issued by the TOB Trust, and (b) the amount of any borrowings by the TOB Trust from a Liquidity Provider to enable the TOB Trust to purchase outstanding Floaters in lieu of a remarketing. In addition, the Fund recognizes in “Investment Income” the entire earnings of the Underlying Bond, and recognizes (a) the interest paid to the holders of the Floaters or on the TOB Trust’s borrowings, and (b) other expenses related to remarketing, administration, trustee, liquidity and other services to a TOB Trust, as a component of “Interest expense and amortization of offering costs” on the Statement of Operations. Earnings due from the Underlying Bond and interest due to the holders of the Floaters as of the end of the reporting period are recognized as components of “Receivable for interest” and “Payable for interest” on the Statement of Assets and Liabilities, respectively.
In contrast, an investment in an externally-deposited Inverse Floater is accounted for as a purchase of the Inverse Floater and is identified in the Fund’s Portfolio of Investments as “(IF) – Inverse floating rate investment.” For an externally-deposited Inverse Floater, a Fund’s Statement of Assets and Liabilities recognizes the Inverse Floater and not the Underlying Bond as an asset, and the Fund does not recognize the Floaters, or any related borrowings from a Liquidity Provider, as a liability. Additionally, the Fund reflects in “Investment Income” only the net amount of earnings on the Inverse Floater (net of the interest paid to the holders of the Floaters or the Liquidity Provider as lender, and the expenses of the Trust), and does not show the amount of that interest paid or the expenses of the TOB Trust as described above as interest expense on the Statement of Operations.
Fees paid upon the creation of a TOB Trust for self-deposited Inverse Floaters and externally-deposited Inverse Floaters are recognized as part of the cost basis of the Inverse Floater and are capitalized over the term of the TOB Trust.
As of the end of the reporting period, the aggregate value of Floaters issued by each Fund’s TOB Trust for self-deposited Inverse Floaters and externally-deposited Inverse Floaters was as follows:
| | | | | | | | | | | | | | | | | | | |
| Floating Rate Obligations Outstanding | | NKG | | | NMY | | | NMT | | | NMS | | | NOM | | | NPV | |
Floating rate obligations: self-deposited Inverse Floaters | | $ | 19,600,000 | | | $ | 28,405,000 | | | $ | — | | | $ | — | | | $ | 600,000 | | | $ | 20,350,000 | |
Floating rate obligations: externally-deposited Inverse Floaters | | | — | | | | — | | | | 7,325,000 | | | | — | | | | — | | | | — | |
Total | | $ | 19,600,000 | | | $ | 28,405,000 | | | $ | 7,325,000 | | | $ | — | | | $ | 600,000 | | | $ | 20,350,000 | |
During the current fiscal period, the average amount of Floaters (including any borrowings from a Liquidity Provider) outstanding, and average annual interest rate and fees related to self-deposited Inverse Floaters, were as follows:
| | | | | | | | | | | | | | | | | | | |
| Self-Deposited Inverse Floaters | | NKG | | | NMY | | | NMT | | | NMS | | | NOM | | | NPV | |
Average floating rate obligations outstanding | | $ | 19,600,000 | | | $ | 28,405,000 | | | $ | — | | | $ | — | | | $ | 600,000 | | | $ | 20,350,000 | |
Average annual interest rate and fees | | | 1.84 | % | | | 1.87 | % | | | — | % | | | — | % | | | 1.83 | % | | | 1.90 | % |
TOB Trusts are supported by a liquidity facility provided by a Liquidity Provider pursuant to which the Liquidity Provider agrees, in the event that Floaters are (a) tendered to the Trustee for remarketing and the remarketing does not occur, or (b) subject to mandatory tender pursuant to the terms of the TOB Trust agreement, to either purchase Floaters or to provide the Trustee with an advance from a loan facility to fund the purchase of Floaters
98
by the TOB Trust. In certain circumstances, the Liquidity Provider may otherwise elect to have the Trustee sell the Underlying Bond to retire the Floaters that were tendered and not remarketed prior to providing such a loan. In these circumstances, the Liquidity Provider remains obligated to provide a loan to the extent that the proceeds of the sale of the Underlying Bond is not sufficient to pay the purchase price of the Floaters.
The size of the commitment under the loan facility for a given TOB Trust is at least equal to the balance of that TOB Trust’s outstanding Floaters plus any accrued interest. In consideration of the loan facility, fee schedules are in place and are charged by the Liquidity Provider(s). Any loans made by the Liquidity Provider will be secured by the purchased Floaters held by the TOB Trust. Interest paid on any outstanding loan balances will be effectively borne by the Fund that owns the Inverse Floaters of the TOB Trust that has incurred the borrowing and may be at a rate that is greater than the rate that would have been paid had the Floaters been successfully remarketed.
As described above, any amounts outstanding under a liquidity facility are recognized as a component of “Floating rate obligations” on the Statement of Assets and Liabilities by the Fund holding the corresponding Inverse Floaters issued by the borrowing TOB Trust. As of the end of the reporting period, there were no loans outstanding under such facilities for any of the Funds as of the end of the reporting period.
Each Fund may also enter into shortfall and forbearance agreements (sometimes referred to as a “recourse arrangement”) (TOB Trusts involving such agreements are referred to herein as “Recourse Trusts”), under which a Fund agrees to reimburse the Liquidity Provider for the Trust’s Floaters, in certain circumstances, for the amount (if any) by which the liquidation value of the Underlying Bond held by the TOB Trust may fall short of the sum of the liquidation value of the Floaters issued by the TOB Trust plus any amounts borrowed by the TOB Trust from the Liquidity Provider, plus any shortfalls in interest cash flows. Under these agreements, a Fund’s potential exposure to losses related to or on an Inverse Floater may increase beyond the value of the Inverse Floater as a Fund may potentially be liable to fulfill all amounts owed to holders of the Floaters or the Liquidity Provider. Any such shortfall amount in the aggregate is recognized as “Unrealized depreciation on Recourse Trusts” on the Statement of Assets and Liabilities.
As of the end of the reporting period, each Fund’s maximum exposure to the Floaters issued by Recourse Trusts for self-deposited Inverse Floaters and externally-deposited Inverse Floaters was as follows:
| | | | | | | | | | | | | | | | | | | |
| Floating Rate Obligations – Recourse Trusts | | NKG | | | NMY | | | NMT | | | NMS | | | NOM | | | NPV | |
Maximum exposure to Recourse Trusts: self-deposited Inverse Floaters | | $ | 19,600,000 | | | $ | 28,405,000 | | | $ | — | | | $ | — | | | $ | 600,000 | | | $ | 20,350,000 | |
Maximum exposure to Recourse Trusts: externally-deposited Inverse Floaters | | | — | | | | — | | | | 7,325,000 | | | | — | | | | — | | | | — | |
Total | | $ | 19,600,000 | | | $ | 28,405,000 | | | $ | 7,325,000 | | | $ | — | | | $ | 600,000 | | | $ | 20,350,000 | |
Zero Coupon Securities
A zero coupon security does not pay a regular interest coupon to its holders during the life of the security. Income to the holder of the security comes from accretion of the difference between the original purchase price of the security at issuance and the par value of the security at maturity and is effectively paid at maturity. The market prices of zero coupon securities generally are more volatile than the market prices of securities that pay interest periodically.
Investment Transactions
Long-term purchases and sales (including maturities) during the current fiscal period were as follows:
| | | | | | | | | | | | | | | | | | | |
| | NKG | | | NMY | | | NMT | | | NMS | | | NOM | | | NPV | |
Purchases | | $ | 6,485,075 | | | $ | 33,163,354 | | | $ | 13,841,103 | | | $ | 9,637,700 | | | $ | 1,578,765 | | | $ | 27,753,377 | |
Sales and maturities | | | 4,097,728 | | | | 38,808,422 | | | | 13,657,414 | | | | 8,200,188 | | | | 2,293,566 | | | | 25,547,966 | |
Investments purchased on a when-issued/delayed delivery basis may have extended settlement periods. Any investments so purchased are subject to market fluctuation during this period. The Funds have earmarked securities in their portfolios with a current value at least equal to the amount of the when-issued/delayed delivery purchase commitments.
As of the end of the reporting period, the following Funds’ outstanding when-issued/delayed delivery purchase commitments were as follows:
| | | | | | | |
| | NMT | | | NMS | |
Outstanding when-issued/delayed delivery purchase commitments | | $ | 222,335 | | | $ | 581,750 | |
Investments in Derivatives
In addition to the inverse floating rate securities in which each Fund may invest, which are considered portfolio securities for financial reporting purposes, each Fund is authorized to invest in certain other derivative instruments such as futures, options and swap contracts. Each Fund limits its investments in futures, options on futures and swap contracts to the extent necessary for the Adviser to claim exclusion from registration by the Commodity Futures Trading Commission as a commodity pool operator with respect to the Fund. The Funds record derivative instruments at fair value,
99
Notes to Financial Statements (Unaudited) (continued)
with changes in fair value recognized on the Statement of Operations, when applicable. Even though the Funds’ investments in derivatives may represent economic hedges, they are not considered to be hedge transactions for financial reporting purposes.
Although the Funds are authorized to invest in derivative instruments and may do so in the future, they did not make any such investments during the current fiscal period.
Market and Counterparty Credit Risk
In the normal course of business each Fund may invest in financial instruments and enter into financial transactions where risk of potential loss exists due to changes in the market (market risk) or failure of the other party to the transaction to perform (counterparty credit risk). The potential loss could exceed the value of the financial assets recorded on the financial statements. Financial assets, which potentially expose each Fund to counterparty credit risk, consist principally of cash due from counterparties on forward, option and swap transactions, when applicable. The extent of each Fund’s exposure to counterparty credit risk in respect to these financial assets approximates their carrying value as recorded on the Statement of Assets and Liabilities.
Each Fund helps manage counterparty credit risk by entering into agreements only with counterparties the Adviser believes have the financial resources to honor their obligations and by having the Adviser monitor the financial stability of the counterparties. Additionally, counterparties may be required to pledge collateral daily (based on the daily valuation of the financial asset) on behalf of each Fund with a value approximately equal to the amount of any unrealized gain above a pre-determined threshold. Reciprocally, when each Fund has an unrealized loss, the Funds have instructed the custodian to pledge assets of the Funds as collateral with a value approximately equal to the amount of the unrealized loss above a pre-determined threshold. Collateral pledges are monitored and subsequently adjusted if and when the valuations fluctuate, either up or down, by at least the pre-determined threshold amount.
5. Fund Shares
Common Shares
Common Shares Equity Shelf Programs and Offering Costs
NMS has filed a registration statement with the Securities and Exchange Commission (“SEC”) authorizing the Fund to issue additional common shares through one or more equity shelf programs (“Shelf Offering”), which became effective with the SEC during a prior fiscal period.
Under this Shelf Offering, the Fund, subject to market conditions, may raise additional equity capital by issuing additional common shares from time to time in varying amounts and by different offering methods at a net price at or above the Fund’s NAV per common share. In the event the Fund’s Shelf Offering registration statement is no longer current, the Fund may not issue additional common shares until a post-effective amendment to the registration statement has been filed with the SEC.
Additional authorized common shares, common shares sold and offering proceeds, net of offering costs under the Fund’s Shelf Offering during the Fund’s current and prior fiscal period were as follows:
| | | | | | | |
| | NMS | |
| | Six Months | | | Year | |
| | Ended | | | Ended | |
| | 11/30/19 | | | 5/31/19 | |
Additional authorized common shares | | | — | | | | 500,000 | * |
Common shares sold | | | — | | | | — | |
Offering proceeds, net of offering costs | | $ | — | | | $ | — | |
|
*
| Represents additional authorized common shares for the period June 1, 2018 through March 29, 2019. |
Costs incurred by the Fund in connection with its initial shelf registrations are recorded as a prepaid expense and recognized as “Deferred offering costs” on the Statement of Assets and Liabilities. These costs are amortized pro rata as shares are sold and are recognized as a component of “Proceeds from shelf offering, net of offering costs” on the Statement of Changes in Net Assets. Any deferred offering costs remaining one year after the effectiveness of the initial shelf registration will be expensed. Costs incurred by the Fund to keep the shelf registration current are expensed as incurred and recognized as a component of “Other expenses” on the Statement of Operations.
100
Common Share Transactions
Transactions in common shares for the Funds during the Funds’ current and prior fiscal period, where applicable. were as follows:
| | | | | | | | | | | | | | | | | | | |
| | NKG
| | | NMY | | | NMT | |
| | Six Months | | | Year | | | Six Months | | | Year | | | Six Months | | | Year | |
| | Ended | | | Ended | | | Ended | | | Ended | | | Ended | | | Ended | |
| | 11/30/19 | | | 5/31/19 | | | 11/30/19 | | | 5/31/19 | | | 11/30/19 | | | 5/31/19 | |
Common shares: | | | | | | | | | | | | | | | | | | |
| Repurchased and retired | | | — | | | | (149,500 | ) | | | — | | | | (247,500 | ) | | | — | | | | (26,148 | ) |
Weighted average common share: | | | | | | | | | | | | | | | | | | | | | | | | |
| Price per share repurchased and retired | | | — | | | $ | 10.97 | | | | — | | | $ | 11.77 | | | | — | | | $ | 11.67 | |
| Discount per share repurchased and retired | | | — | | | | 15.65 | % | | | — | | | | 15.60 | % | | | — | | | | 15.20 | % |
| | |
| | NMS
| | | NOM | | | NPV | |
| | Six Months | | | Year | | | Six Months | | | Year | | | Six Months | | | Year | |
| | Ended | | | Ended | | | Ended | | | Ended | | | Ended | | | Ended | |
| | 11/30/19 | | | 5/31/19 | | | 11/30/19 | | | 5/31/19 | | | 11/30/19 | | | 5/31/19 | |
Common shares: | | | | | | | | | | | | | | | | | | | | | | | | |
| Issued to shareholders due to reinvestment of distributions | | | — | | | | — | | | | 492 | | | | — | | | | — | | | | — | |
| Repurchased and retired | | | — | | | | (10,000 | ) | | | — | | | | — | | | | — | | | | (55,000 | ) |
Weighted average common share: | | | | | | | | | | | | | | | | | | | | | | | | |
| Price per share repurchased and retired | | | — | | | $ | 12.08 | | | | — | | | | — | | | | — | | | $ | 11.60 | |
| Discount per share repurchased and retired | | | — | | | | 15.12 | % | | | — | | | | — | | | | — | | | | 15.41 | % |
Preferred Shares
Adjustable Rate MuniFund Term Preferred Shares
The following Funds have issued and have outstanding Adjustable Rate MuniFund Term Preferred (“AMTP”) Shares, with a $100,000 liquidation preference per share. AMTP Shares are issued via private placement and are not publically available.
The details of the each Funds’ AMTP Shares outstanding as of the end of the reporting period, were as follows:
| | | | | | | | | | | |
| | | | | | | | | Liquidation | |
| | | | | | | | | Preference, | |
| | | Shares | | | Liquidation | | | net of deferred | |
| Fund | Series | | Outstanding | | | Preference | | | offering costs | |
| NKG | 2028 | | | 585 | | | $ | 58,500,000 | | | $ | 58,364,506 | |
| NMY | 2028 | | | 1,820 | | | $ | 182,000,000 | | | $ | 181,819,390 | |
| NMS | 2028 | | | 528 | | | $ | 52,800,000 | | | $ | 52,664,544 | |
Each Fund is obligated to redeem its AMTP Shares by the date as specified in its offering document (“Term Redemption Date”), unless earlier redeemed by the Fund. AMTP Shares are subject to optional and mandatory redemption in certain circumstances. The AMTP Shares may be redeemed at the option of the Fund, subject to payment of premium for approximately six months following the date of issuance (“Premium Expiration Date”), and at the redemption price per share thereafter. The redemption price per share is equal to the sum of the liquidation preference per share plus any accumulated but unpaid dividends.
AMTP Shares are short-term or short/intermediate-term instruments that pay a variable dividend rate tied to a short-term index, plus an additional fixed “spread” amount which is initially established at the time of issuance and may be adjusted in the future based upon a mutual agreement between the majority owner and the Fund. From time-to-time the majority owner may propose to the Fund an adjustment to the dividend rate. Should the majority owner and the Fund fail to agree upon an adjusted dividend rate, and such proposed dividend rate adjustment is not withdrawn, the Fund will be required to redeem all outstanding shares upon the end of a notice period.
101
Notes to Financial Statements (Unaudited) (continued)
In addition, the Fund may be obligated to redeem a certain amount of the AMTP Shares if the Fund fails to maintain certain asset coverage and leverage ratio requirements and such failures are not cured by the applicable cure date. The Term Redemption Date and Premium Expiration Date for each Fund’s AMTP Shares are as follows:
| | | | | |
| Notice | | Term | Premium |
| Fund | Period | Series | Redemption Date | Expiration Date |
| NKG | 540-day | 2028 | December 1 2028* | February 13, 2019 |
| NMY | 360-day | 2028 | December 1 2028* | November 30, 2019 |
| NMS | 360-day | 2028 | December 1 2028* | November 30, 2019 |
| | |
*
| Subject to early termination by either the Fund or the holder. |
The average liquidation preference of AMTP Shares outstanding and annualized dividend rate for each Fund during the current fiscal period were as follows:
| | | | | | | | | | |
| | NKG | | | NMY | | | NMS | |
Average liquidation preference of AMTP shares outstanding | | $ | 58,500,000 | | | $ | 182,000,000 | | | $ | 52,800,000 | |
Annualized dividend rate | | | 2.21 | % | | | 2.34 | % | | | 2.34 | % |
AMTP Shares are subject to restrictions on transfer, generally do not trade, and market quotations are generally not available. The fair value of AMTP Shares is expected to be approximately their liquidation preference so long as the fixed “spread” on the AMTP Shares remains roughly in line with the “spread” being demanded by investors on instruments having similar terms in the current market environment. In present market conditions, the Funds’ Adviser has determined that the fair value of AMTP Shares is approximately their liquidation preference, but their fair value could vary if market conditions change materially. For financial reporting purposes, the liquidation preference of AMTP Shares is a liability and is recognized as a component of “Adjustable Rate MuniFund Term Preferred (“AMTP”) Shares, net of deferred offering costs” on the Statement of Assets and Liabilities.
AMTP Share dividends are treated as interest payments for financial reporting purposes. Unpaid dividends on AMTP Shares are recognized as a component of “Interest payable” on the Statement of Assets and Liabilities. Dividends accrued on AMTP Shares are recognized as a component of “Interest expense and amortization of offering costs” on the Statement of Operations.
Costs incurred in connection with each Fund’s offering of AMTP Shares were recorded as deferred charges, which are amortized over the life of the shares and are recognized as components of “Adjustable Rate MuniFund Term Preferred (“AMTP”) Shares, net of deferred offering costs” on the Statement of Assets and Liabilities and “Interest expense and amortization of offering costs” on the Statement of Operations.
MuniFund Preferred Shares
NOM has issued and has outstanding MuniFund Preferred (“MFP”) Shares, with a $100,000 liquidation preference per share. These MFP Shares were issued via private placement and are not publicly available.
The Fund is obligated to redeem its MFP Shares by the date as specified in its offering documents (“Term Redemption Date”), unless earlier redeemed by the Fund. MFP Shares are initially issued in a pre-specified mode, however, MFP Shares can be subsequently designated as an alternative mode at a later date at the discretion of the Fund. The modes within MFP Shares detail the dividend mechanics and are described as follows. At a subsequent date, the Fund may establish additional mode structures with the MFP Share.
| • | Variable Rate Remarketed Mode (“VRRM”) – Dividends for MFP Shares within this mode will be established by a remarketing agent; therefore, the market value of the MFP Shares is expected to approximate its liquidation preference. Shareholders have the ability to request a best- efforts tender of its shares upon seven days notice. If the remarketing agent is unable to identify an alternative purchaser, the shares will be retained by the shareholder requesting tender and the subsequent dividend rate will increase to its step-up dividend rate. If after one consecutive year of unsuccessful remarketing attempts, the Fund will be required to designate an alternative mode or redeem the shares.
The Fund will pay a remarketing fee on the aggregate principal amount of all MFP shares while designated in VRRM. Payments made by the Fund to the remarketing agent are recognized as “Remarketing fees” on the Statement of Operations. |
| • | Variable Rate Mode (“VRM”) – Dividends for MFP Shares designated in this mode are based upon a short-term index plus an additional fixed “spread” amount established at the time of issuance or renewal / conversion of its mode. At the end of the period of the mode, the Fund will be required to either extend the term of the mode, designate an alternative mode or redeem the MFP Shares.
The fair value of MFP Shares while in VRM are expected to approximate their liquidation preference so long as the fixed “spread” on the shares remains roughly in line with the “spread’ being demanded by investors on instruments having similar terms in the current market. In current market conditions, the Adviser has determined that the fair value of the shares are approximately their liquidation preference, but their fair value could vary if market conditions change materially. |
102
| • | Variable Rate Demand Mode (“VRDM”) – Dividends for MFP Shares designated in this mode will be established by a remarketing agent; therefore, the market value of the MFP Shares is expected to approximate its liquidation preference. While in this mode, shares will have an unconditional liquidity feature that enable its shareholders to require a liquidity provider, which the Fund has entered into a contractual agreement, to purchase shares in the event that the shares are not able to be successfully remarketed. In the event that shares within this mode are unable to be successfully remarketed and are purchased by the liquidity provider, the dividend rate will be the maximum rate which is designed to escalate according to a specified schedule in order to enhance the remarketing agent’s ability to successfully remarket the shares. The Fund is required to redeem any shares that are still owned by a liquidity provider after six months of continuous, unsuccessful remarketing. The Fund will pay a liquidity and remarketing fee on the aggregate principal amount of all MFP Shares while within VRDM. Payments made by the Fund to the liquidity provider and remarketing agent are recognized as “Liquidity fees” and “Remarketing fees”, respectively, on the Statement of Operations. |
For financial reporting purposes, the liquidation preference of MFP Shares is recorded as a liability and is recognized as a component of “MuniFund Preferred (“MFP”) Shares, net of deferred offering costs” on the Statement of Assets and Liabilities. Dividends on the MFP shares are treated as interest payments for financial reporting purposes. Unpaid dividends on MFP shares are recognized as a component on “Interest payable” on the Statement of Assets and Liabilities. Dividends accrued on MFP Shares are recognized as a component of “Interest expense and amortization of offering costs” on the Statement of Operations.
Subject to certain conditions, MFP Shares may be redeemed, in whole or in part, at any time at the option of the Fund. The Fund may also be required to redeem certain MFP shares if the Fund fails to maintain certain asset coverage requirements and such failures are not cured by the applicable cure date. The redemption price per share in all circumstances is equal to the liquidation preference per share plus any accumulated but unpaid dividends.
Costs incurred in connection with the Fund’s offering of MFP Shares were recorded as a deferred charge and are being amortized over the life of the shares. These offering costs are recognized as a component of “MuniFund Preferred (“MFP”) Shares, net of deferred offering costs” on the Statement of Assets and Liabilities and “Interest expense and amortization of offering costs” on the Statement of Operations.
As of the end of the reporting period, details of the Fund’s MFP Shares outstanding were as follows:
| | | | | | | | |
| | | | Liquidation | | | |
| | | | Preference, | Term | | Mode |
| | Shares | Liquidation | net of deferred | Redemption | | Termination |
| Fund | Series | Outstanding | Preference | offering costs | Date | Mode | Date |
| NOM | A | 180 | $18,000,000 | $17,775,140 | October 1, 2047 | VRM | October 12, 2022 |
The average liquidation preference of MFP Shares outstanding and annualized dividend rate for the Fund during the current fiscal period were as follows:
| | | | |
| | NOM | |
Average liquidation preference of MFP Shares outstanding | | $ | 18,000,000 | |
Annualized dividend rate | | | 2.25 | % |
Variable Rate Demand Preferred Shares
The following Funds have issued and have outstanding Variable Rate Demand Preferred (“VRDP”) Shares, with a $100,000 liquidation preference per share. VRDP Shares are issued via private placement and are not publicly available.
As of the end of the reporting period, details of the Funds’ VRDP Shares outstanding were as follows:
| | | | | | | | |
| | | | | Liquidation | | |
| | | | | Preference, | Special Rate | |
| | Shares | Liquidation | Remarketing | net of deferred | Period | |
| Fund | Series | Outstanding | Preference | Fees* | offering costs | Expiration | Maturity |
| NMT | 1 | 740 | $ 74,000,000 | N/A | $ 73,734,155 | March 1, 2047 | March 1, 2047 |
| NPV | 1 | 1,280 | $128,000,000 | N/A | $127,640,592 | July 22, 2020 | August 3, 2043 |
|
* | Remarketing fees as a percentage of the aggregate principal amount of all VRDP Shares outstanding for each series. |
N/A | Not applicable. Series is considered to be Special Rate VRDP and therefore does not pay a remarketing fee. |
VRDP Shares include a liquidity feature that allows VRDP shareholders to have their shares purchased by a liquidity provider with whom the each Fund has contracted in the event that the VRDP Shares are not able to be successfully remarketed. Each Fund is required to redeem any VRDP Shares that are still owned by the liquidity provider after six months of continuous, unsuccessful remarketing. Each Fund pays an annual remarketing fee on the aggregate principal amount of all VRDP Shares outstanding. Each Fund’s VRDP Shares have successfully remarketed since issuance.
103
Notes to Financial Statements (Unaudited) (continued)
Each Fund’s Series 1 VRDP Shares are considered to be Special Rate VRDP, which are sold to institutional investors. During the special rate period, the VRDP Shares will not be remarketed by a remarketing agent, be subject to optional or mandatory tender events, or be supported by a liquidity provider and are not subject to remarketing fees or liquidity fees. During the special rate period, VRDP dividends will be set monthly as a floating rate based on the predetermined formula. Following the initial special rate period, Special Rate VRDP Shares may transition to traditional VRDP Shares with dividends set at weekly remarketings, and be supported by a designated liquidity provider, or the Board may approve a subsequent special rate period.
Dividends on the VRDP Shares (which are treated as interest payments for financial reporting purposes) are set at a rate established by a remarketing agent; therefore, the market value of the VRDP Shares is expected to approximate its liquidation preference. In the event that VRDP Shares are unable to be successfully remarketed, the dividend rate will be the maximum rate which is designed to escalate according to a specified schedule in order to enhance the remarketing agent’s ability to successfully remarket the VRDP Shares.
Subject to certain conditions, VRDP Shares may be redeemed, in whole or in part, at any time at the option of the each Fund. Each Fund may also redeem certain of the VRDP Shares if the Fund fails to maintain certain asset coverage requirements and such failures are not cured by the applicable cure date. The redemption price per share is equal to the sum of the liquidation preference per share plus any accumulated but unpaid dividends.
The average liquidation preference of VRDP Shares outstanding and annualized dividend rate for each Fund during the current fiscal period were as follows:
| | | | | | | |
| | NMT | | | NPV | |
Average liquidation preference of VRDP Shares outstanding | | $ | 74,000,000 | | | $ | 128,000,000 | |
Annualized dividend rate | | | 2.21 | % | | | 2.30 | % |
For financial reporting purposes, the liquidation preference of VRDP Shares is a liability and is recognized as a component of “Variable Rate Demand Preferred (“VRDP”) Shares, net of deferred offering costs” on the Statement of Assets and Liabilities. Unpaid dividends on VRDP Shares are recognized as a component of “Interest payable” on the Statement of Assets and Liabilities, when applicable. Dividends accrued on VRDP Shares are recognized as a component of “Interest expense and amortization of offering costs” on the Statement of Operations. Costs incurred by the Fund in connection with its offerings of VRDP Shares were recorded as a deferred charge, which are amortized over the life of the shares and are recognized as a component of “Variable Rate Demand Preferred (“VRDP”) Shares, net of deferred offering costs” on the Statement of Assets and Liabilities and “Interest expense and amortization of offering costs” on the Statement of Operations. In addition to interest expense, the Fund also pays a per annum liquidity fee to the liquidity provider, as well as a remarketing fee, which are recognized as “Liquidity fees” and “Remarketing fees,” respectively, on the Statement of Operations.
Preferred Share Transactions
Transactions in preferred shares for the Funds during the Funds’ current and prior fiscal period, where applicable, are noted in the following tables.
Transactions in AMTP Shares for the Funds, where applicable, were as follows:
| | | | | | | | |
| Year Ended May 31, 2019 | |
| NKG | Series | | Shares | | | Amount | |
AMTP Shares issued | 2028 | | | 585 | | | $ | 58,500,000 | |
| | |
| Year Ended May 31, 2019 | |
| NMY | Series | | Shares | | | Amount | |
AMTP Shares issued | 2028 | | | 1,820 | | | $ | 182,000,000 | |
| | |
| Year Ended May 31, 2019 | |
| NMS | Series | | Shares | | | Amount | |
AMTP Shares issued | 2028 | | | 528 | | | $ | 52,800,000 | |
Transactions in VMTP Shares for the Funds, where applicable, were as follows:
| | | | | | | | |
| Year Ended May 31, 2019 | |
| NKG | Series | | Shares | | | Amount | |
VMTP Shares redeemed | 2019 | | | (820 | ) | | $ | (82,000,000 | ) |
104
| | | | | | | | |
| Year Ended May 31, 2019 | |
| NMY | Series | | Shares | | | Amount | |
VMTP Shares redeemed | 2019 | | | (1,970 | ) | | $ | (197,000,000 | ) |
| | |
| Year Ended May 31, 2019 | |
| NMS | Series | | Shares | | | Amount | |
VMTP Shares redeemed | 2019 | | | (528 | ) | | $ | (52,800,000 | ) |
6. Income Tax Information
Each Fund is a separate taxpayer for federal income tax purposes. Each Fund intends to distribute substantially all of its net investment income and net capital gains to shareholders and to otherwise comply with the requirements of Subchapter M of the Internal Revenue Code applicable to regulated investment companies. Therefore, no federal income tax provision is required. Furthermore, each Fund intends to satisfy conditions that will enable interest from municipal securities, which is exempt from regular federal and designated state income taxes, to retain such tax-exempt status when distributed to shareholders of the Funds. Net realized capital gains and ordinary income distributions paid by the Funds are subject to federal taxation.
For all open tax years and all major taxing jurisdictions, management of the Funds has concluded that there are no significant uncertain tax positions that would require recognition in the financial statements. Open tax years are those that are open for examination by taxing authorities (i.e., generally the last four tax year ends and the interim tax period since then). Furthermore, management of the Funds is also not aware of any tax positions for which it is reasonably possible that the total amounts of unrecognized tax benefits will significantly change in the next twelve months.
The following information is presented on an income tax basis. Differences between amounts for financial statement and federal income tax purposes are primarily due to timing differences in recognizing taxable market discount, timing differences in recognizing certain gains and losses on investment transactions and the treatment of investments in inverse floating rate securities reflected as financing transactions, if any. To the extent that differences arise that are permanent in nature, such amounts are reclassified within the capital accounts as detailed below. Temporary differences do not require reclassification. Temporary and permanent differences do not impact the NAVs of the Funds.
The table below presents the cost and unrealized appreciation (depreciation) of each Fund’s investment portfolio, as determined on a federal income tax basis, as of November 30, 2019.
| | | | | | | | | | | | | | | | | | | |
| | NKG | | | NMY | | | NMT | | | NMS | | | NOM | | | NPV | |
Tax cost of investments | | $ | 188,181,609 | | | $ | 487,623,439 | | | $ | 195,351,458 | | | $ | 132,236,828 | | | $ | 46,882,713 | | | $ | 359,022,918 | |
Gross unrealized: | | | | | | | | | | | | | | | | | | | | | | | | |
| Appreciation | | $ | 14,188,518 | | | $ | 37,371,035 | | | $ | 14,970,627 | | | $ | 9,041,655 | | | $ | 3,335,150 | | | $ | 31,583,151 | |
| Depreciation | | | (806,055 | ) | | | (876,998 | ) | | | (51,221 | ) | | | (29,990 | ) | | | (102,794 | ) | | | (195,664 | ) |
Net unrealized appreciation (depreciation) of investments | | $ | 13,382,463 | | | $ | 36,494,037 | | | $ | 14,919,406 | | | $ | 9,011,665 | | | $ | 3,232,356 | | | $ | 31,387,487 | |
Permanent differences, primarily due to taxable market discount, federal taxes paid, nondeductible offering costs and expiration of capital loss carryforwards resulted in reclassifications among the Funds’ components of common share net assets as of May 31, 2019, the Funds’ last tax year end.
The tax components of undistributed net tax-exempt income, net ordinary income and net long-term capital gains as of May 31, 2019, the Funds’ last tax year end, were as follows:
| | | | | | | | | | | | | | | | | | | |
| | NKG | | | NMY | | | NMT | | | NMS | | | NOM | | | NPV | |
Undistributed net tax-exempt income1 | | $ | 413,573 | | | $ | 773,839 | | | $ | 196,312 | | | $ | 117,668 | | | $ | 23,928 | | | $ | 781,077 | |
Undistributed net ordinary income2 | | | 1,775 | | | | 72,541 | | | | 40,864 | | | | — | | | | 13,659 | | | | 43,605 | |
Undistributed net long-term capital gains | | | — | | | | — | | | | — | | | | — | | | | — | | | | — | |
| |
1
| Undistributed net tax-exempt income (on a tax basis) has not been reduced for the dividend declared on May 1, 2019, paid on June 3, 2019. |
2
| Net ordinary income consists of taxable market discount income and net short-term capital gains, if any. |
105
Notes to Financial Statements (Unaudited) (continued)
The tax character of distributions paid during the Funds’ last tax year ended May 31, 2019 was designated for purposes of the dividends paid deduction as follows:
| | | | | | | | | | | | | | | | | | | |
| | NKG | | | NMY | | | NMT | | | NMS | | | NOM | | | NPV | |
Distributions from net tax-exempt income | | $ | 6,188,258 | | | $ | 17,010,459 | | | $ | 6,479,015 | | | $ | 4,937,092 | | | $ | 1,628,103 | | | $ | 12,646,691 | |
Distributions from net ordinary income2 | | | 6,423 | | | | 11,453 | | | | — | | | | — | | | | 11,866 | | | | 7,470 | |
Distributions from net long-term capital gains | | | — | | | | — | | | | — | | | | — | | | | — | | | | — | |
| | |
2
| Net ordinary income consists of taxable market discount income and net short-term capital gains, if any. |
As of May 31, 2019, the Funds’ last tax year end, the Funds had unused capital losses carrying forward available for federal income tax purposes to be applied against future capital gains, if any. The capital losses are not subject to expiration.
| | | | | | | | | | | | | | | | | | | |
| | NKG | | | NMY | | | NMT | | | NMS | | | NOM | | | NPV | |
Not subject to expiration: | | | | | | | | | | | | | | | | | | |
| Short-term | | $ | 1,193,816 | | | $ | 6,816,587 | | | $ | 1,580,494 | | | $ | 173,312 | | | $ | 404,344 | | | $ | 5,236,046 | |
| Long-term | | | 3,020,168 | | | | 6,269,681 | | | | 3,613,690 | | | | 385,436 | | | | 693,007 | | | | 9,588,846 | |
Total | | $ | 4,213,984 | | | $ | 13,086,268 | | | $ | 5,194,184 | | | $ | 558,748 | | | $ | 1,097,351 | | | $ | 14,824,892 | |
During the Funds’ last tax year ended May 31, 2019, NOM utilized $163,117 of its capital loss carryforward.
As of May 31, 2019, the Funds’ last tax year end, $48,370 of NKG’s capital loss carryforward expired.
7. Management Fees and Other Transactions with Affiliates
Management Fees
Each Fund’s management fee compensates the Adviser for overall investment advisory and administrative services and general office facilities. The Sub-Adviser is compensated for its services to the Funds from the management fees paid to the Adviser.
Each Fund’s management fee consists of two components – a fund-level fee, based only on the amount of assets within each individual Fund, and a complex-level fee, based on the aggregate amount of all eligible fund assets managed by the Adviser. This pricing structure enables Fund shareholders to benefit from growth in the assets within their respective Fund as well as from growth in the amount of complex-wide assets managed by the Adviser.
The annual fund-level fee, payable monthly, for each Fund is calculated according to the following schedule:
| | | | |
| Average Daily Managed Assets* | | Fund-Level Fee Rate | |
For the first $125 million | | | 0.4500 | % |
For the next $125 million | | | 0.4375 | |
For the next $250 million | | | 0.4250 | |
For the next $500 million | | | 0.4125 | |
For the next $1 billion | | | 0.4000 | |
For the next $3 billion | | | 0.3750 | |
For managed assets over $5 billion | | | 0.3625 | |
106
The annual complex-level fee, payable monthly, for each Fund is calculated by multiplying the current complex-wide fee rate, determined according to the following schedule by the Fund’s daily managed assets:
| | | | |
| Complex-Level Eligible Asset Breakpoint Level* | | Effective Complex-Level Fee Rate at Breakpoint Level | |
$55 billion | | | 0.2000 | % |
$56 billion | | | 0.1996 | |
$57 billion | | | 0.1989 | |
$60 billion | | | 0.1961 | |
$63 billion | | | 0.1931 | |
$66 billion | | | 0.1900 | |
$71 billion | | | 0.1851 | |
$76 billion | | | 0.1806 | |
$80 billion | | | 0.1773 | |
$91 billion | | | 0.1691 | |
$125 billion | | | 0.1599 | |
$200 billion | | | 0.1505 | |
$250 billion | | | 0.1469 | |
$300 billion | | | 0.1445 | |
| |
*
| For the complex-level fees, managed assets include closed-end fund assets managed by the Adviser that are attributable to certain types of leverage. For these purposes, leverage includes the funds’ use of preferred stock and borrowings and certain investments in the residual interest certificates (also called inverse floating rate securities) in tender option bond (TOB) trusts, including the portion of assets held by a TOB trust that has been effectively financed by the trust’s issuance of floating rate securities, subject to an agreement by the Adviser as to certain funds to limit the amount of such assets for determining managed assets in certain circumstances. The complex-level fee is calculated based upon the aggregate daily managed assets of all Nuveen open-end and closed-end funds that constitute “eligible assets.” Eligible assets do not include assets attributable to investments in other Nuveen funds or assets in excess of a determined amount (originally $2 billion) added to the Nuveen fund complex in connection with the Adviser’s assumption of the management of the former First American Funds effective January 1, 2011, but do not include certain Nuveen Funds that were reorganized into funds advised by an affiliate of the Adviser during the 2019 calendar year. As of November 30, 2019, the complex-level fee for each Fund was 0.1562%. |
Other Transactions with Affiliates
Each Fund is permitted to purchase or sell securities from or to certain other funds managed by the Adviser (“inter-fund trade”) under specified conditions outlined in procedures adopted by the Board. These procedures have been designed to ensure that any inter-fund trade of securities by the Fund from or to another fund that is, or could be, considered an affiliate of the Fund under certain limited circumstances by virtue of having a common investment adviser (or affiliated investment adviser), common officer and/or common trustee complies with Rule 17a-7 of the 1940 Act. Further, as defined under these procedures, each inter-fund trade is effected at the current market price as provided by an independent pricing service. Unsettled inter-fund trades as of the end of the reporting period are recognized as a component of “Receivable for investments sold” and/or “Payable for investments purchased” on the Statement of Assets and Liabilities, when applicable.
During the current fiscal period, the following Funds engaged in inter-fund trades pursuant to these procedures as follows:
| | | | | | | |
| Inter-Fund Trades | | NOM | | | NPV | |
Purchases | | $ | — | | | $ | — | |
Sales | | | 816,885 | | | | 3,098,495 | |
8. Borrowing Arrangements
Committed Line of Credit
The Funds, along with certain other funds managed by the Adviser (“Participating Funds”), have established a 364-day, $2.65 billion standby credit facility with a group of lenders, under which the Participating Funds may borrow for various purposes other than leveraging for investment purposes. Each Participating Fund is allocated a designated proportion of the facility’s capacity (and its associated costs, as described below) based upon a multi-factor assessment of the likelihood and frequency of its need to draw on the facility, the size of the Fund and its anticipated draws, and the potential importance of such draws to the operations and well-being of the Fund, relative to those of the other Funds. A Fund may effect draws on the facility in excess of its designated capacity if and to the extent that other Participating Funds have undrawn capacity. The credit facility expires in June 2020 unless extended or renewed.
The credit facility has the following terms: a fee of 0.15% per annum on unused commitment amounts, and interest at a rate equal to the higher of (a) one-month LIBOR (London Inter-Bank Offered Rate) plus 1.00% per annum or (b) the Fed Funds rate plus 1.00% per annum on amounts borrowed. Participating Funds paid administration, legal and arrangement fees, which are recognized as a component of “Other expenses” on the Statement of Operations, and along with commitment fees, have been allocated among such Participating Funds based upon the relative proportions of the facility’s aggregate capacity reserved for them and other factors deemed relevant by the Adviser and the Board of each Participating Fund.
107
Notes to Financial Statements (Unaudited) (continued)
During the current fiscal period, NMY utilized this facility. The Fund’s maximum outstanding balance during the utilization period was as follows:
| | | | |
| | NMY | |
Maximum outstanding balance | | $ | 8,700,000 | |
During the Fund’s utilization period(s) during the current fiscal period, the average daily balance outstanding and average annual interest rate on the Borrowings were as follows:
| | | | |
| | NMY | |
Utilization period (days outstanding) | | | 13 | |
Average daily balance outstanding | | $ | 7,715,385 | |
Average annual interest rate | | | 3.40 | % |
Borrowings outstanding as of the end of the reporting period are recognized as “Borrowings” on the Statement of Assets and Liabilities, where applicable.
Inter-Fund Borrowing and Lending
The SEC has granted an exemptive order permitting registered open-end and closed-end Nuveen funds to participate in an inter-fund lending facility whereby the Nuveen funds may directly lend to and borrow money from each other for temporary purposes (e.g., to satisfy redemption requests or when a sale of securities “fails,” resulting in an unanticipated cash shortfall) (the “Inter-Fund Program”). The closed-end Nuveen funds, including the Funds covered by this shareholder report, will participate only as lenders, and not as borrowers, in the Inter-Fund Program because such closed-end funds rarely, if ever, need to borrow cash to meet redemptions. The Inter-Fund Program is subject to a number of conditions, including, among other things, the requirements that (1) no fund may borrow or lend money through the Inter-Fund Program unless it receives a more favorable interest rate than is typically available from a bank or other financial institution for a comparable transaction; (2) no fund may borrow on an unsecured basis through the Inter-Fund Program unless the fund’s outstanding borrowings from all sources immediately after the inter-fund borrowing total 10% or less of its total assets; provided that if the borrowing fund has a secured borrowing outstanding from any other lender, including but not limited to another fund, the inter-fund loan must be secured on at least an equal priority basis with at least an equivalent percentage of collateral to loan value; (3) if a fund’s total outstanding borrowings immediately after an inter-fund borrowing would be greater than 10% of its total assets, the fund may borrow through the inter-fund loan on a secured basis only; (4) no fund may lend money if the loan would cause its aggregate outstanding loans through the Inter-Fund Program to exceed 15% of its net assets at the time of the loan; (5) a fund’s inter-fund loans to any one fund shall not exceed 5% of the lending fund’s net assets; (6) the duration of inter-fund loans will be limited to the time required to receive payment for securities sold, but in no event more than seven days; and (7) each inter-fund loan may be called on one business day’s notice by a lending fund and may be repaid on any day by a borrowing fund. In addition, a Nuveen fund may participate in the Inter-Fund Program only if and to the extent that such participation is consistent with the fund’s investment objective and investment policies. The Board is responsible for overseeing the Inter-Fund Program.
The limitations detailed above and the other conditions of the SEC exemptive order permitting the Inter-Fund Program are designed to minimize the risks associated with Inter-Fund Program for both the lending fund and the borrowing fund. However, no borrowing or lending activity is without risk. When a fund borrows money from another fund, there is a risk that the loan could be called on one day’s notice or not renewed, in which case the fund may have to borrow from a bank at a higher rate or take other actions to payoff such loan if an inter-fund loan is not available from another fund. Any delay in repayment to a lending fund could result in a lost investment opportunity or additional borrowing costs.
During the current reporting period, none of the Funds covered by this shareholder report have entered into any inter-fund loan activity.
108
Additional FundInformation | | | | | | | |
| Board of Trustees | | | | | | |
Margo Cook* | Jack B. Evans | William C. Hunter | Albin F. Moschner | John K. Nelson | Judith M. Stockdale |
Carole E. Stone | Terence J. Toth | Margaret L. Wolff | Robert L. Young | | |
|
* Interested Board Member.
|
|
|
| Fund Manager | | Custodian | Legal Counsel | Independent Registered | Transfer Agent and |
Nuveen Fund Advisors, LLC | State Street Bank | Chapman and Cutler LLP
| | Shareholder Services |
333 West Wacker Drive | | & Trust Company | Chicago, IL 60603 | KPMG LLP | | Computershare Trust |
Chicago, IL 60606 | | One Lincoln Street | 200 East Randolph Street | Company, N.A. |
| | Boston, MA 02111 | | Chicago, IL 60601 | 250 Royall Street |
| | | | | | Canton, MA 02021 |
| | | | | | (800) 257-8787 |
Portfolio of Investments Information
Each Fund is required to file its complete schedule of portfolio holdings with the Securities and Exchange Commission (SEC) for the first and third quarters of each fiscal year as an exhibit to its report on Form N-PORT. You may obtain this information on the SEC’s website at http:www.sec.gov.
Nuveen Funds’ Proxy Voting InformationYou may obtain (i) information regarding how each fund voted proxies relating to portfolio securities held during the most recent twelve-month period ended June 30, without charge, upon request, by calling Nuveen toll-free at (800) 257-8787 or on Nuveen’s website at www.nuveen.com and (ii) a description of the policies and procedures that each fund used to determine how to vote proxies relating to portfolio securities without charge, upon request, by calling Nuveen toll free at (800) 257-8787. You may also obtain this information directly from the SEC. Visit the SEC on-line at http://www.sec.gov.
CEO Certification DisclosureEach Fund’s Chief Executive Officer (CEO) has submitted to the New York Stock Exchange (NYSE) the annual CEO certification as required by Section 303A.12(a) of the NYSE Listed Company Manual. Each Fund has filed with the SEC the certification of its CEO and Chief Financial Officer required by Section 302 of the Sarbanes-Oxley Act.
Common Share RepurchasesEach Fund intends to repurchase, through its open-market share repurchase program, shares of its own common stock at such times and in such amounts as is deemed advisable. During the period covered by this report, each Fund repurchased shares of its common stock, as shown in the accompanying table. Any future repurchases will be reported to shareholders in the next annual or semi-annual report.
| | | | | | | |
| NKG | NMY | NMT | NMS | NOM | NPV |
Common shares repurchased | — | — | — | — | — | — |
FINRA BrokerCheck
The Financial Industry Regulatory Authority (FINRA) provides information regarding the disciplinary history of FINRA member firms and associated investment professionals. This information as well as an investor brochure describing FINRA BrokerCheck is available to the public by calling the FINRA BrokerCheck Hotline number at (800) 289-9999 or by visiting www.FINRA.org.