
ICR Presentation January 11, 2022 Executing Our Plan to Drive Profitable Growth 1 Exhibit 99.2

Forward-looking language This presentation contains statements concerning our current expectations, assumptions, plans, estimates, judgments and projections about our business and our industry and other statements that are not historical facts. These statements, including, without limitation, the slide captioned "Q4 2021 Outlook" are “forward-looking statements” within the meaning of the Private Securities Litigation Reform Act of 1995. In most cases, words or phrases such as “anticipates,” “believes,” “could,” “estimates,” “expects,” “intends,” “may,” “will,” “plans,” “path,” “outlook,” “project,” “should,” “strategy,” “potential,” “confident” and similar expressions identify forward-looking statements. These forward-looking statements are based largely on information currently available to our management and are subject to various risks and uncertainties that could cause actual results to differ materially from historical results or those expressed or implied by such forward-looking statements. Although we believe our expectations are based on reasonable estimates and assumptions, they are not guarantees of performance. There is no assurance that our expectations will occur or that our estimates or assumptions will be correct, and we caution investors and all others not to place undue reliance on such forward-looking statements. Factors that could cause actual results to differ include, but are not limited to, those described in Item 1A, “Risk Factors” in our most recent Annual Report on Form 10-K and, from time to time, in Item 1A, “Risk Factors” of our Quarterly Reports on Form 10-Q and the following: The effects of the pandemic, including uncertainties about its depth and duration, new variants of COVID-19 that have emerged, the speed, efficacy and availability of vaccines and treatments, its impact on general economic conditions, consumer behavior and discretionary spending, the effectiveness of any actions taken in response to the pandemic, and the impact of the pandemic on our manufacturing operations; the extent, availability and effectiveness of any pandemic stimulus packages or loan programs, including the CARES Act; the ability of our suppliers, logistics providers, vendors and landlords, to meet their obligations to us in light of financial stress, staffing shortages, liquidity challenges, bankruptcy filings by other industry participants, and supply chain and other disruptions; increases in unemployment rates and taxes; general economic conditions, inflation, consumer confidence, consumer spending patterns and market disruptions including pandemics or significant health hazards, severe weather conditions, natural disasters, terrorist activities, financial crises, political crises or other major events, or the prospect of these events; shifts in consumer behavior, and our ability to adapt, identify and respond to new and changing fashion trends and customer preferences, and to coordinate product development with buying and planning; changes in the general or specialty retail or apparel industries, including market demand and overall level of spending for women’s private branded clothing and related accessories; our ability to secure and maintain customer acceptance of styles and in- store and online concepts; competition in the markets in which we operate, including our ability to remain competitive with customer shipping terms and costs; customer traffic at our stores; fluctuations in foreign currency exchange rates; significant changes in the costs of manufacturing, raw materials, transportation, importing, distribution, labor and advertising; the quality and timeliness of merchandise received from suppliers; our ability to manage our store fleet, including achieving the expected results of store openings or store closures; our ability to appropriately manage our inventory and allocation processes and leverage targeted promotions; our ability to maintain our cost saving discipline; our ability to operate our retail websites in a profitable manner; our ability to successfully identify and implement additional sales and distribution channels; our ability to successfully execute and achieve the expected results of our business and brand strategies, awareness, merchandising and marketing programs including, but not limited to, the Company’s turnaround strategy, retail fleet optimization plan, sales initiatives and multi-channel strategies and five operating priorities for fiscal 2021, which are: 1) continuing our ongoing digital transformation; 2) further refining product through fit, quality, fabric and innovation in each of our brands; 3) driving increased customer engagement through marketing; 4) maintaining our operating and cost discipline; and 5) further enhancing the productivity of our real estate portfolio; our ability to utilize our distribution center and other support facilities in an efficient and effective manner; our reliance on sourcing from foreign suppliers, including significant economic labor, political or other shifts (including the impact of changes in tariffs, taxes or other import regulations, particularly with respect to China, or legislation prohibiting certain imports from China); U.S. and foreign governmental actions and policies and changes thereto; the continuing performance, implementation and integration of our management information systems; the impact of any system failure, cyber security or other data security breaches, including any security breaches resulting in the theft, transfer, or unauthorized disclosure of customer, employee, or company information; our ability to comply with any domestic and foreign information security and privacy laws, regulations and technology platform rules or other obligations related to data privacy and security; the ability to attract, hire, train, motivate and retain qualified employees in an inclusive environment; the successful recruitment of leadership and transition of members of our senior management team; uncertainties regarding future unsolicited offers to buy the Company and actions of activist shareholders and others and our ability to respond effectively; our ability to secure and protect our intellectual property rights and to protect our reputation and brand images; unanticipated changes in legal, regulatory or tax laws; and our ability to comply with the terms of our Credit Agreement, which includes restrictive provisions limiting our flexibility in operating our business and obtaining credit on reasonable terms. These factors should be considered in evaluating forward-looking statements contained herein. All forward-looking statements that are made or attributable to us are expressly qualified in their entirety by this cautionary notice. The forward-looking statements included herein are only made as of the date of this presentation. We undertake no obligation to publicly update or revise any forward-looking statements, whether as a result of new information, future events or otherwise. 2

We Are… Chico’s FAS Founded by women, led by women. With our service and products, we strive to create a world where women never have to compromise, providing solutions to give them confidence and joy. Our portfolio consists of three brands: Chico’s, WHBM and Soma—specialty retailers of women’s apparel, intimates, accessories and related products—found in over 1,200 boutiques throughout the United States and online. 3

4 A Digital-First, Customer-Led Company on a Clear Path to Growth • Continuing our ongoing digital transformation • Further refining product through styling, fabric and innovation • Driving significant increased customer engagement through digital storytelling • Maintaining our operating and cost discipline • Delivering higher productivity in our real estate portfolio 4
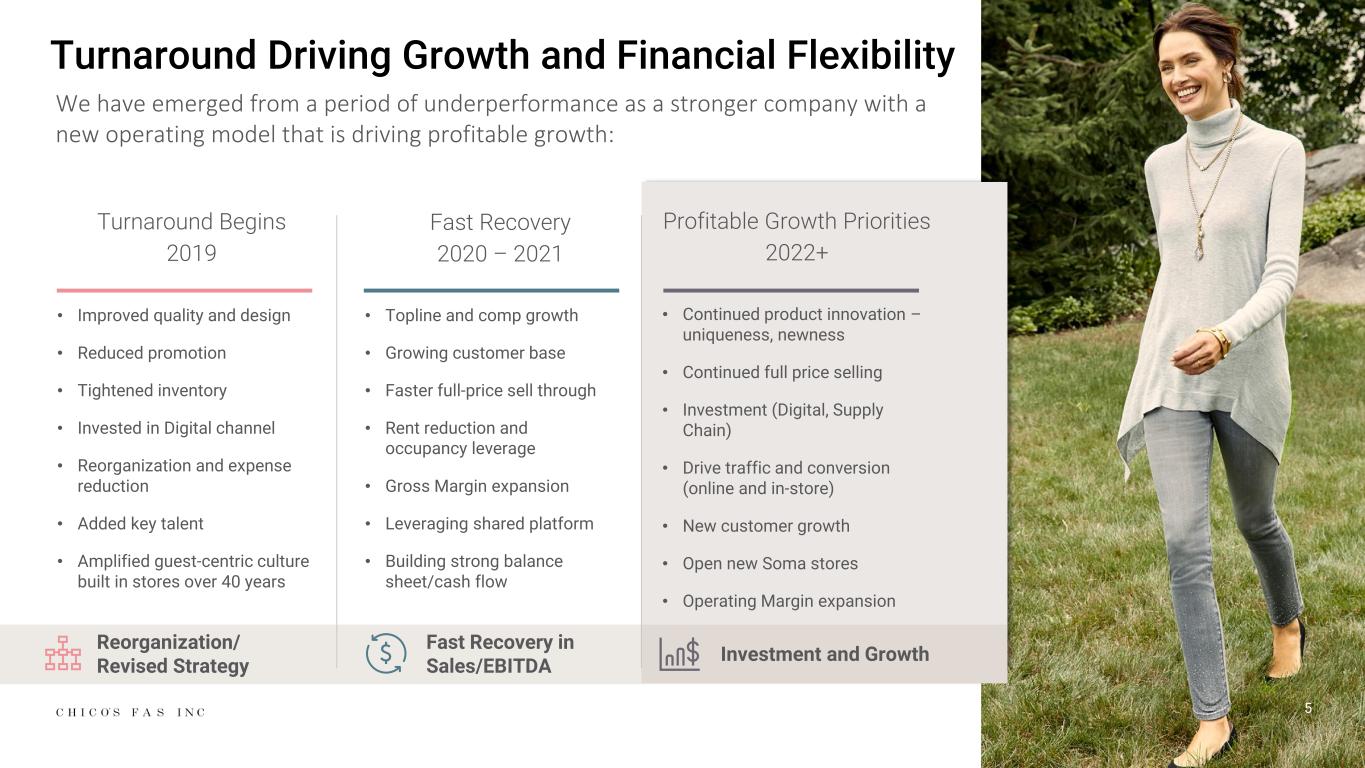
5 Turnaround Driving Growth and Financial Flexibility We have emerged from a period of underperformance as a stronger company with a new operating model that is driving profitable growth: Turnaround Begins 2019 Fast Recovery 2020 – 2021 Profitable Growth Priorities 2022+ • Improved quality and design • Reduced promotion • Tightened inventory • Invested in Digital channel • Reorganization and expense reduction • Added key talent • Amplified guest-centric culture built in stores over 40 years • Topline and comp growth • Growing customer base • Faster full-price sell through • Rent reduction and occupancy leverage • Gross Margin expansion • Leveraging shared platform • Building strong balance sheet/cash flow • Continued product innovation – uniqueness, newness • Continued full price selling • Investment (Digital, Supply Chain) • Drive traffic and conversion (online and in-store) • New customer growth • Open new Soma stores • Operating Margin expansion Reorganization/ Revised Strategy Fast Recovery in Sales/EBITDA Investment and Growth
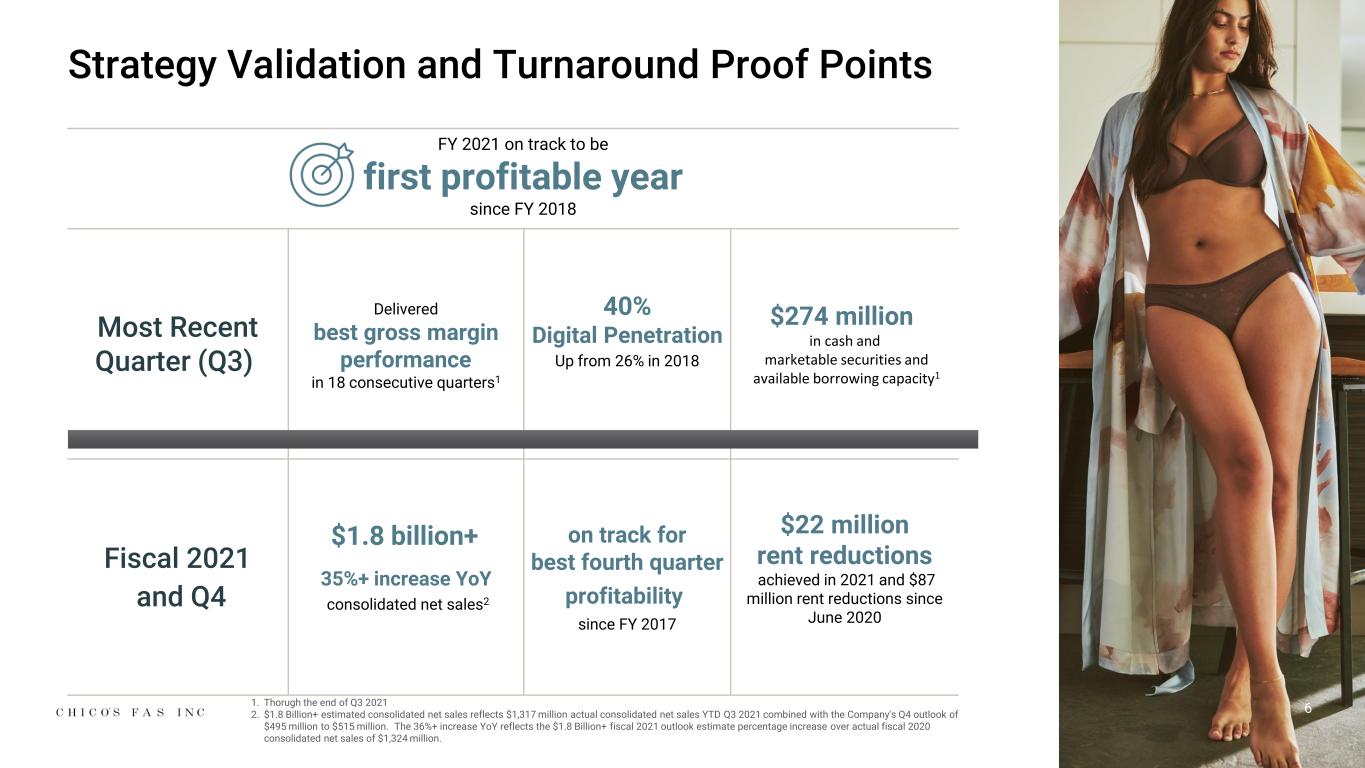
6 Strategy Validation and Turnaround Proof Points 1. Thorugh the end of Q3 2021 2. $1.8 Billion+ estimated consolidated net sales reflects $1,317 million actual consolidated net sales YTD Q3 2021 combined with the Company's Q4 outlook of $495 million to $515 million. The 36%+ increase YoY reflects the $1.8 Billion+ fiscal 2021 outlook estimate percentage increase over actual fiscal 2020 consolidated net sales of $1,324 million. Most Recent Quarter (Q3) Delivered best gross margin performance in 18 consecutive quarters1 40% Digital Penetration Up from 26% in 2018 $274 million in cash and marketable securities and available borrowing capacity1 Fiscal 2021 and Q4 $1.8 billion+ 35%+ increase YoY consolidated net sales2 on track for best fourth quarter profitability since FY 2017 $22 million rent reductions achieved in 2021 and $87 million rent reductions since June 2020 FY 2021 on track to be first profitable year since FY 2018

7 Modernizing Our Unique Heritage to Expand Customer Loyalty and Following

BRAND VISION Inspiring accomplished women to embrace and express their individuality BRAND AND CUSTOMER PERSONALITY Purposeful | Genuine Magnetic | Timeless CUSTOMER VALUES Family Friends Fun Creativity Self-expression BRAND POSITIONING For women who have grown to know themselves, we always have something chic and unique just for them Chico’s Brand Ethos 8

Financial Highlights $601.9M Net Sales 38.4% Net Sales Growth YoY 629 Stores 19.9% Customer Growth YTD 9 Unaudited, Trailing nine months as of 10/30/21

10 Building the Leading Boutique Destination for Versatile Feminine Wardrobing

BRAND VISION Inspiring independent women to embrace both their power and their femininity BRAND AND CUSTOMER PERSONALITY Authentic Smart Stylish Social Determined CUSTOMER VALUES Family Friendship Confidence Achievement Optimism BRAND POSITIONING For women who understand and accept their duality, we offer fashion infused with designer details that are as surprising as she is White House Black Market Brand Ethos 11

Financial Highlights $364.3M Net Sales 34.8% Net Sales Growth YoY 394 Stores 13.0% Customer Growth YTD Unaudited, Trailing nine months as of 10/30/21 12

13 Building One of the Largest Intimate Apparel Brands
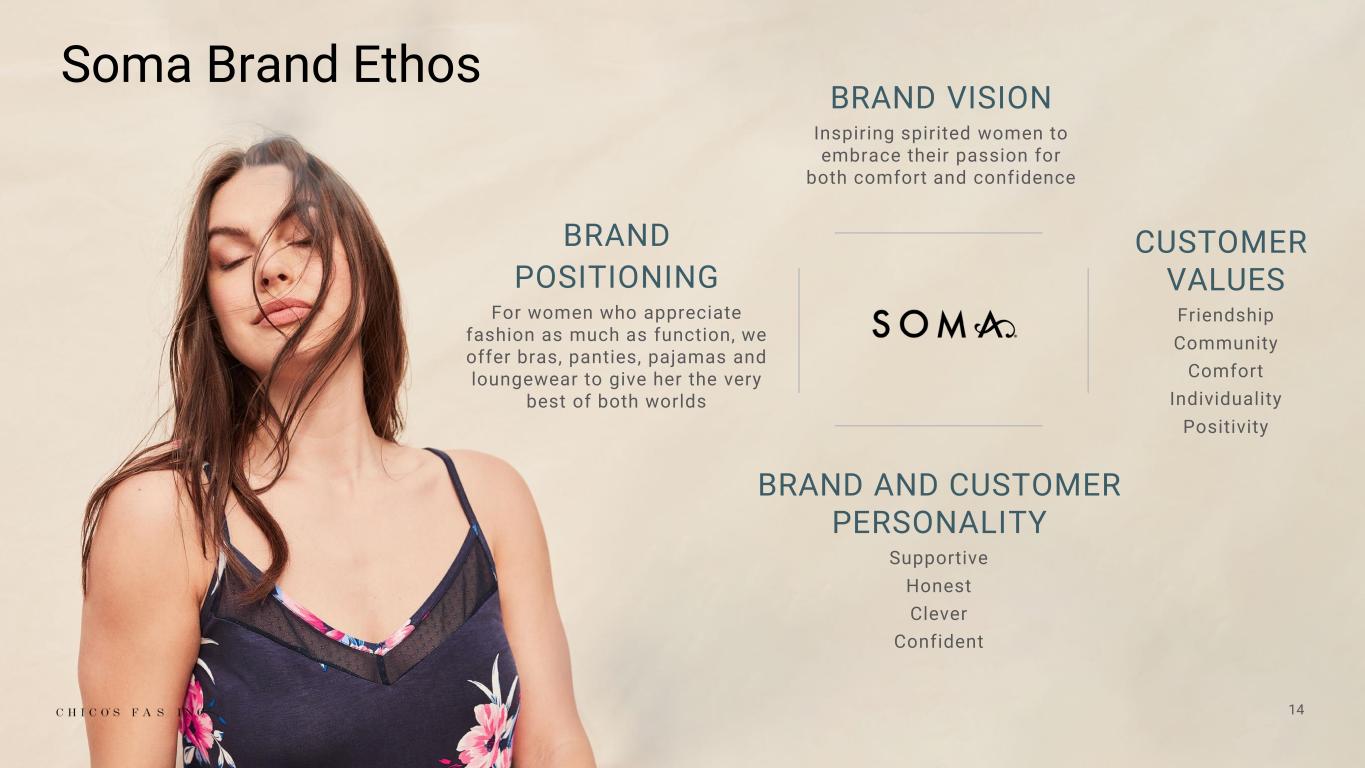
BRAND VISION Inspiring spirited women to embrace their passion for both comfort and confidence BRAND AND CUSTOMER PERSONALITY Supportive Honest Clever Confident CUSTOMER VALUES Friendship Community Comfort Individuality Positivity BRAND POSITIONING For women who appreciate fashion as much as function, we offer bras, panties, pajamas and loungewear to give her the very best of both worlds Soma Brand Ethos 14

Financial Highlights $347.5M Net Sales 49.3% Net Sales Growth YoY 256 Stores 33.0% Customer Growth YTD Unaudited, Trailing nine months as of 10/30/21 15

Compelling Digital & ECOM Capabilities Technology as an Enabler 16
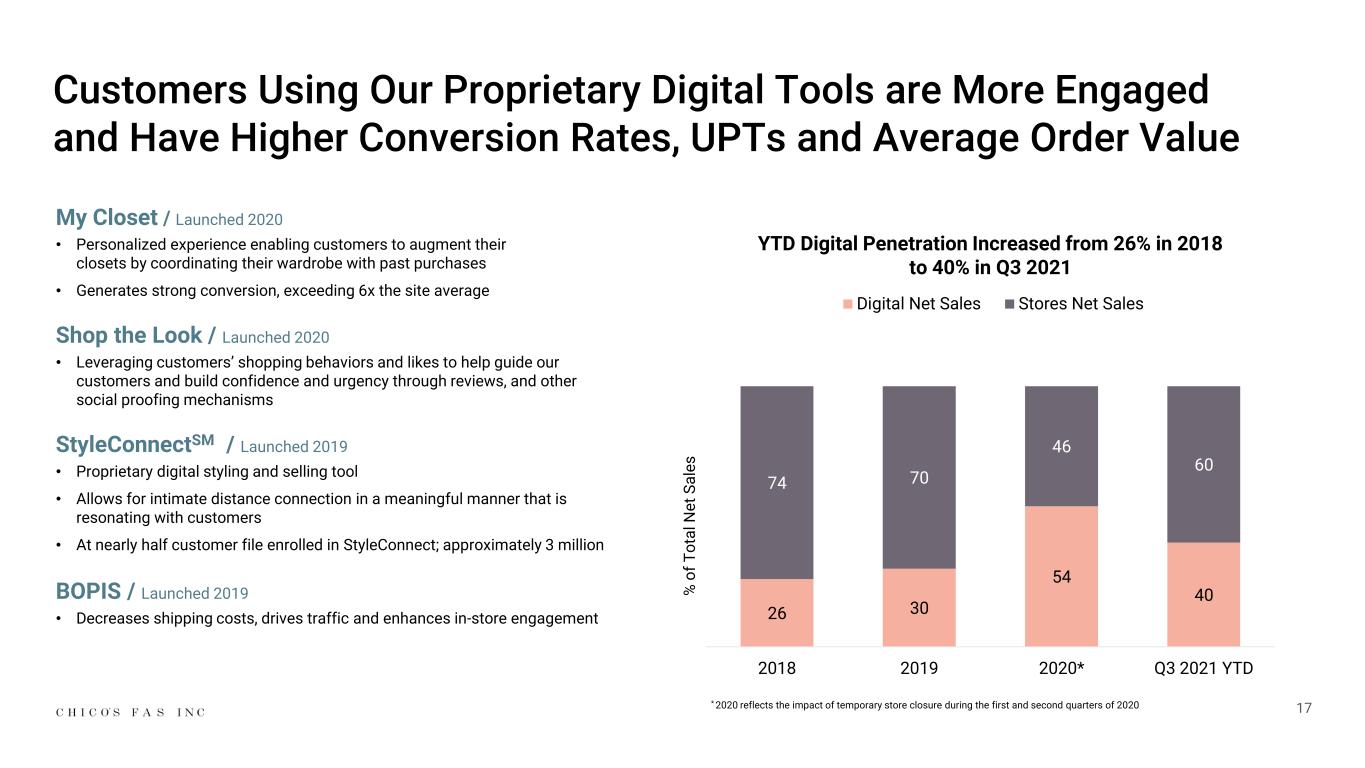
17 Customers Using Our Proprietary Digital Tools are More Engaged and Have Higher Conversion Rates, UPTs and Average Order Value My Closet / Launched 2020 • Personalized experience enabling customers to augment their closets by coordinating their wardrobe with past purchases • Generates strong conversion, exceeding 6x the site average Shop the Look / Launched 2020 • Leveraging customers’ shopping behaviors and likes to help guide our customers and build confidence and urgency through reviews, and other social proofing mechanisms StyleConnectSM / Launched 2019 • Proprietary digital styling and selling tool • Allows for intimate distance connection in a meaningful manner that is resonating with customers • At nearly half customer file enrolled in StyleConnect; approximately 3 million BOPIS / Launched 2019 • Decreases shipping costs, drives traffic and enhances in-store engagement 26 30 54 40 74 70 46 60 2018 2019 2020* Q3 2021 YTD YTD Digital Penetration Increased from 26% in 2018 to 40% in Q3 2021 Digital Net Sales Stores Net Sales % o f T o ta l N e t S a le s * 2020 reflects the impact of temporary store closure during the first and second quarters of 2020
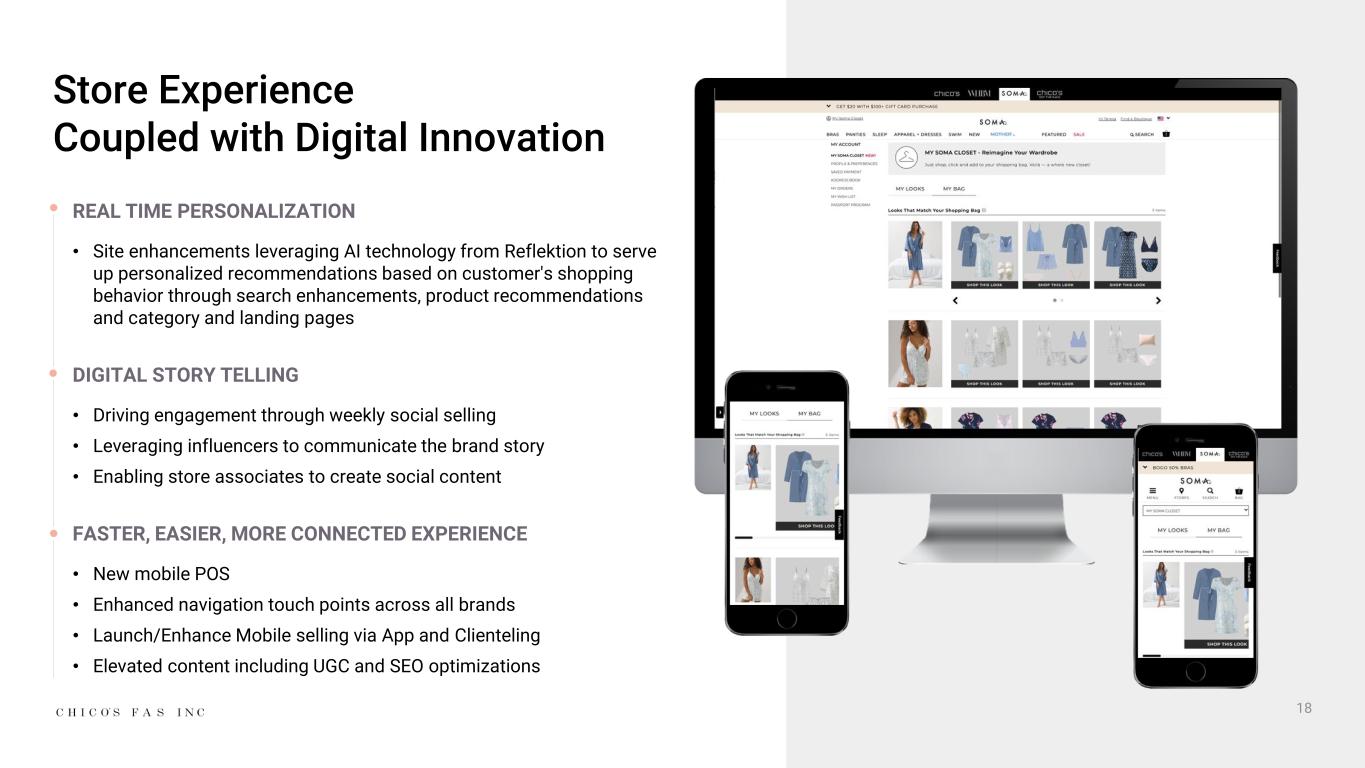
18 Store Experience Coupled with Digital Innovation REAL TIME PERSONALIZATION • Site enhancements leveraging AI technology from Reflektion to serve up personalized recommendations based on customer's shopping behavior through search enhancements, product recommendations and category and landing pages DIGITAL STORY TELLING • Driving engagement through weekly social selling • Leveraging influencers to communicate the brand story • Enabling store associates to create social content FASTER, EASIER, MORE CONNECTED EXPERIENCE • New mobile POS • Enhanced navigation touch points across all brands • Launch/Enhance Mobile selling via App and Clienteling • Elevated content including UGC and SEO optimizations
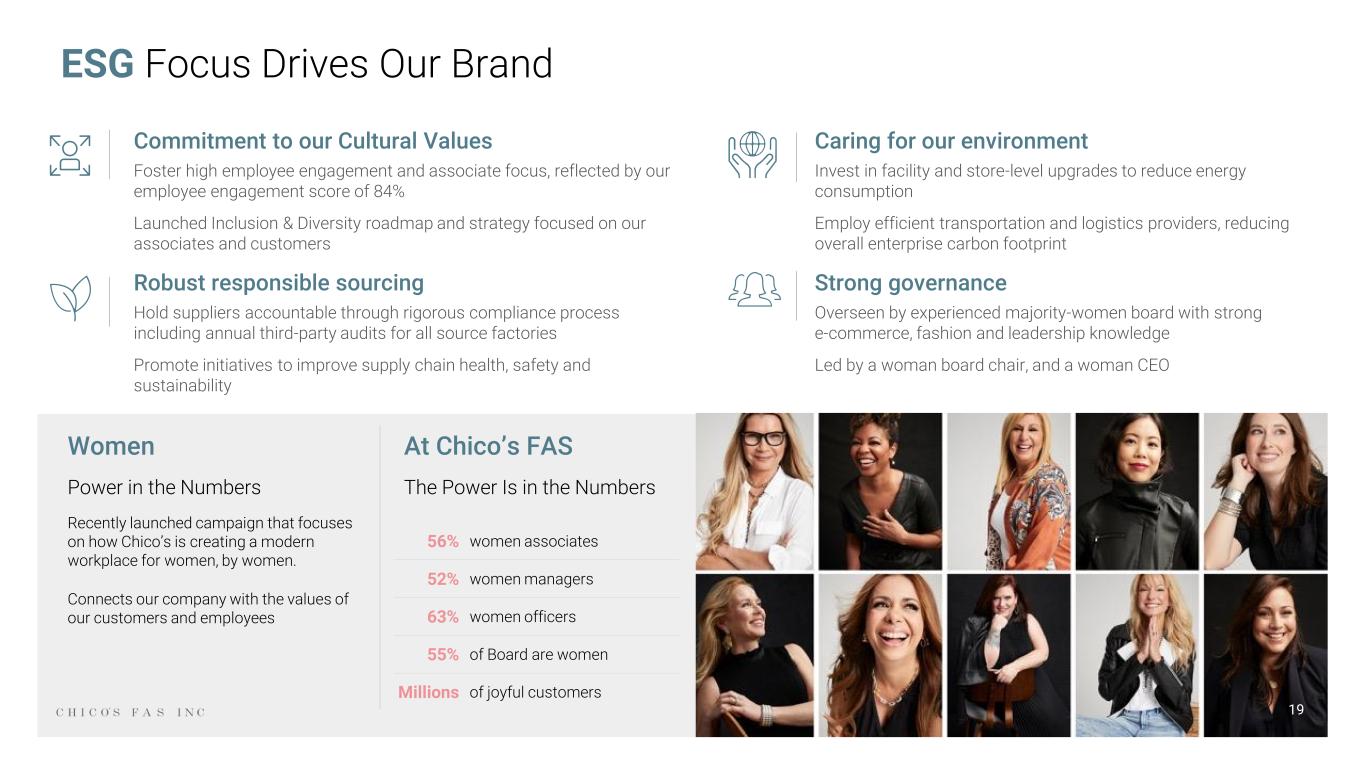
ESG Focus Drives Our Brand Caring for our environment Invest in facility and store-level upgrades to reduce energy consumption Employ efficient transportation and logistics providers, reducing overall enterprise carbon footprint Strong governance Overseen by experienced majority-women board with strong e-commerce, fashion and leadership knowledge Led by a woman board chair, and a woman CEO Women Power in the Numbers Recently launched campaign that focuses on how Chico’s is creating a modern workplace for women, by women. Connects our company with the values of our customers and employees Commitment to our Cultural Values Foster high employee engagement and associate focus, reflected by our employee engagement score of 84% Launched Inclusion & Diversity roadmap and strategy focused on our associates and customers Robust responsible sourcing Hold suppliers accountable through rigorous compliance process including annual third-party audits for all source factories Promote initiatives to improve supply chain health, safety and sustainability 19 At Chico’s FAS The Power Is in the Numbers 56% women associates 52% women managers 63% women officers 55% of Board are women Millions of joyful customers

Financial Update 20
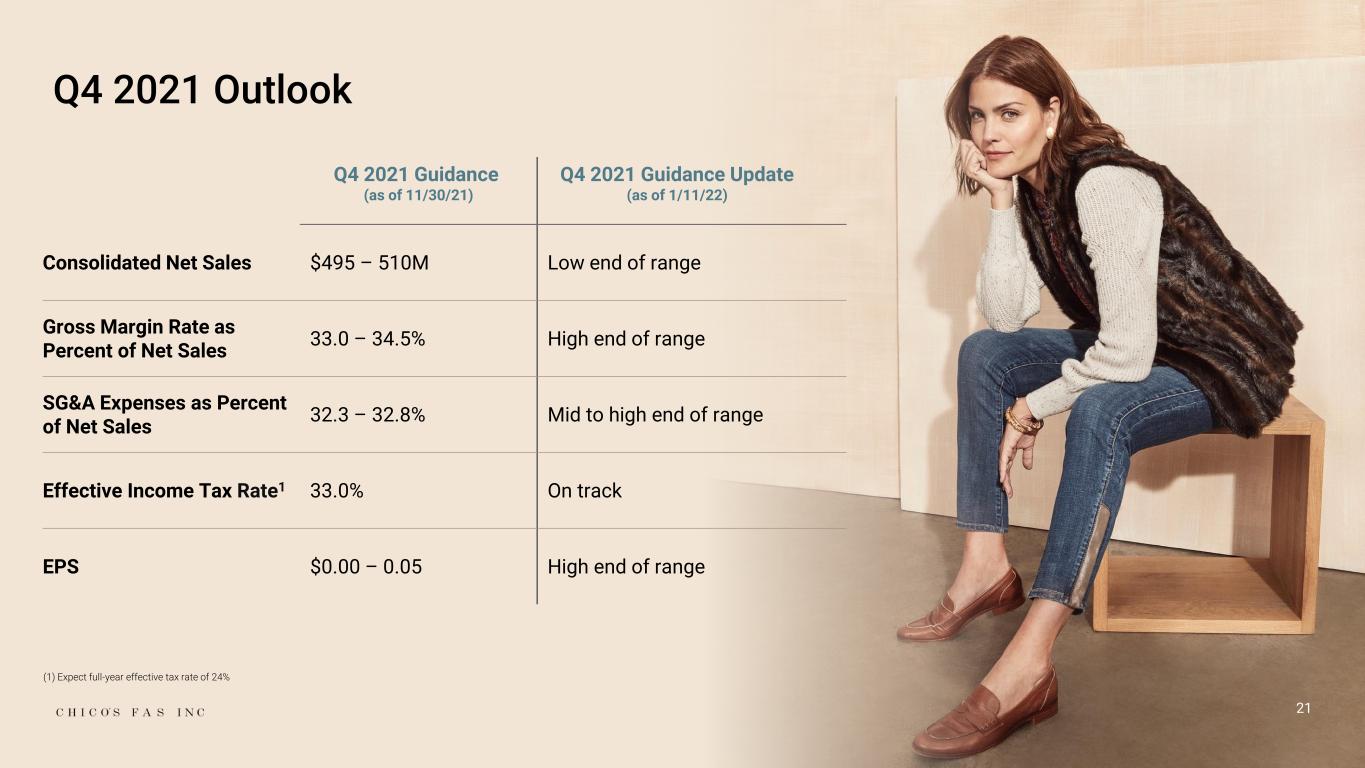
21 Q4 2021 Outlook Q4 2021 Guidance (as of 11/30/21) Q4 2021 Guidance Update (as of 1/11/22) Consolidated Net Sales $495 – 510M Low end of range Gross Margin Rate as Percent of Net Sales 33.0 – 34.5% High end of range SG&A Expenses as Percent of Net Sales 32.3 – 32.8% Mid to high end of range Effective Income Tax Rate1 33.0% On track EPS $0.00 – 0.05 High end of range (1) Expect full-year effective tax rate of 24%
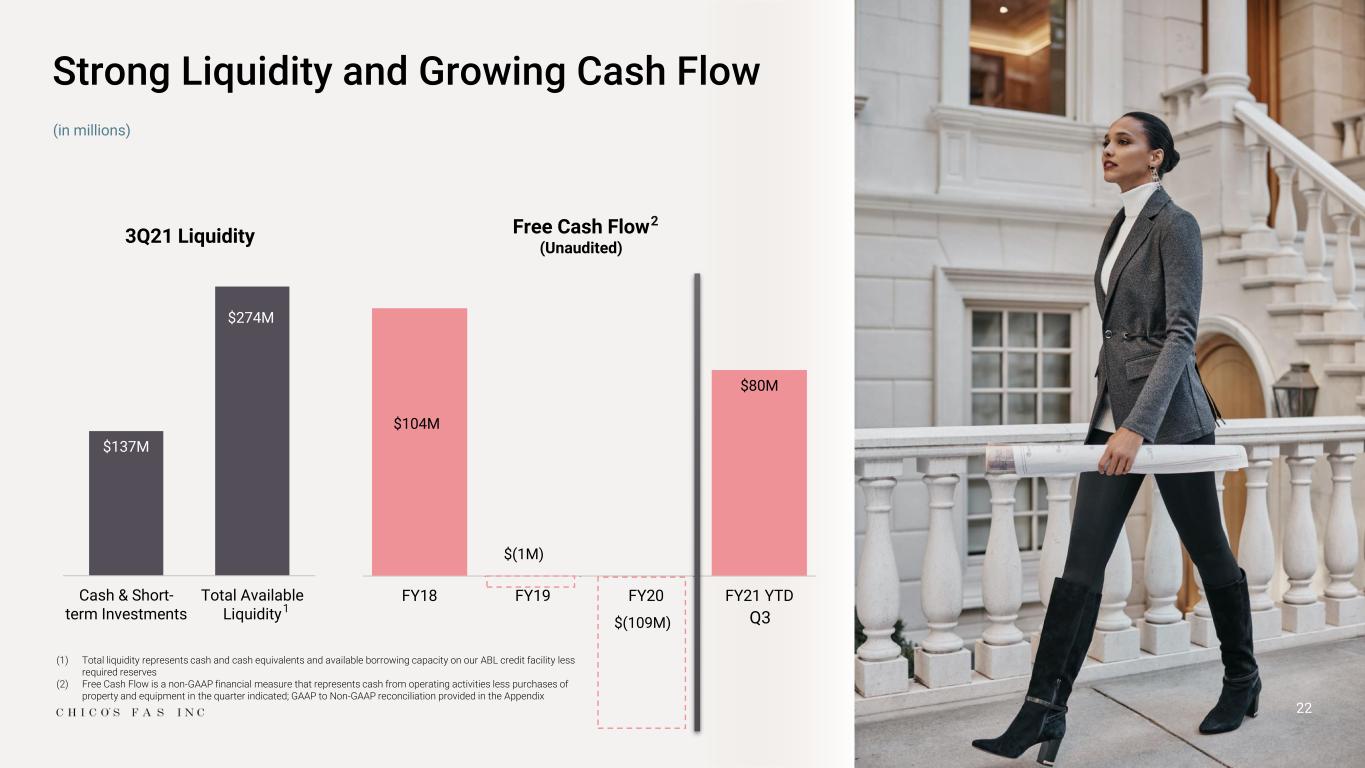
22 Strong Liquidity and Growing Cash Flow $137M $274M Cash & Short- term Investments Total Available Liquidity 3Q21 Liquidity Free Cash Flow (Unaudited) (1) Total liquidity represents cash and cash equivalents and available borrowing capacity on our ABL credit facility less required reserves (2) Free Cash Flow is a non-GAAP financial measure that represents cash from operating activities less purchases of property and equipment in the quarter indicated; GAAP to Non-GAAP reconciliation provided in the Appendix 1 $104M $80M FY18 FY19 FY20 FY21 YTD Q3 $(1M) $(109M) (in millions) 2
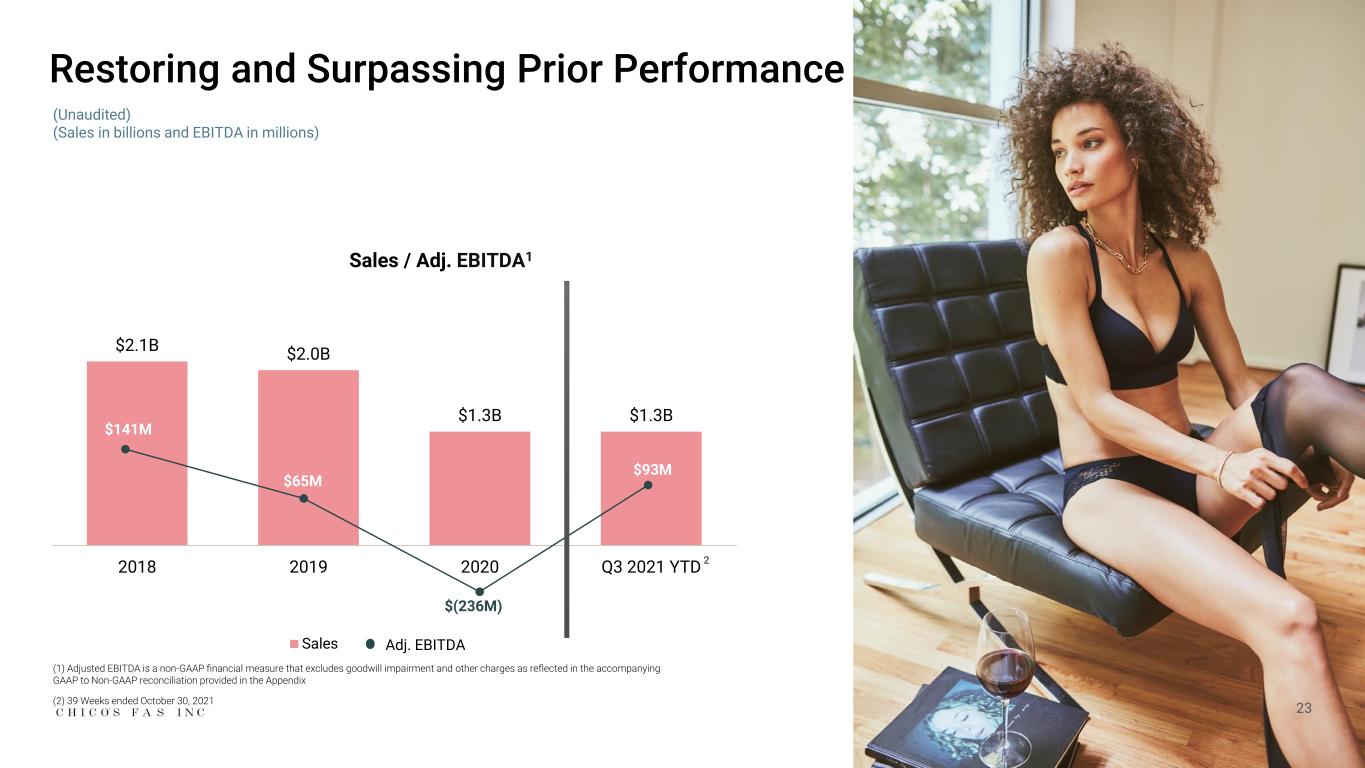
$2.1B $2.0B $1.3B $1.3B 2018 2019 2020 Q3 2021 YTD Sales 23 Restoring and Surpassing Prior Performance $141M $65M $(236M) $93M Sales / Adj. EBITDA1 Adj. EBITDA 2 (Unaudited) (Sales in billions and EBITDA in millions) (1) Adjusted EBITDA is a non-GAAP financial measure that excludes goodwill impairment and other charges as reflected in the accompanying GAAP to Non-GAAP reconciliation provided in the Appendix (2) 39 Weeks ended October 30, 2021
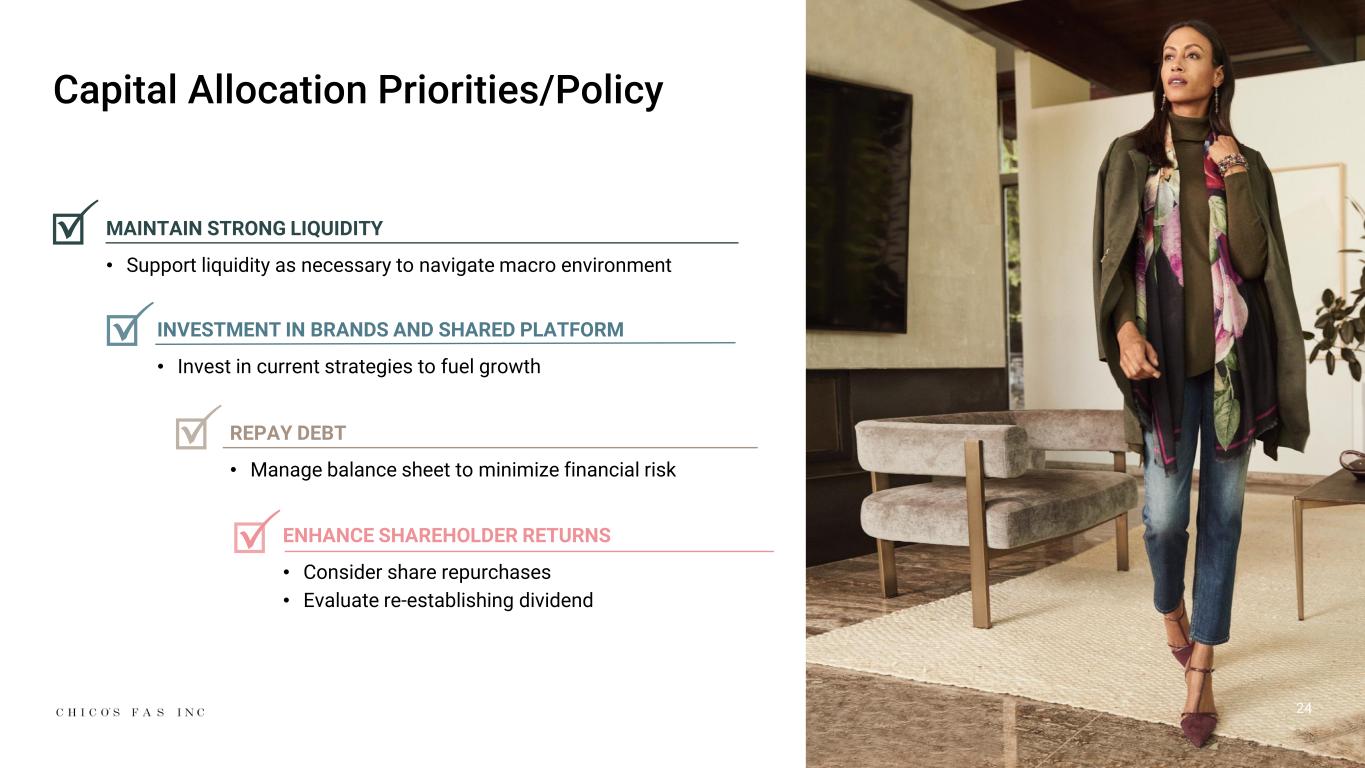
Capital Allocation Priorities/Policy ENHANCE SHAREHOLDER RETURNS • Consider share repurchases • Evaluate re-establishing dividend MAINTAIN STRONG LIQUIDITY • Support liquidity as necessary to navigate macro environment INVESTMENT IN BRANDS AND SHARED PLATFORM • Invest in current strategies to fuel growth REPAY DEBT • Manage balance sheet to minimize financial risk 24

25 Real Estate
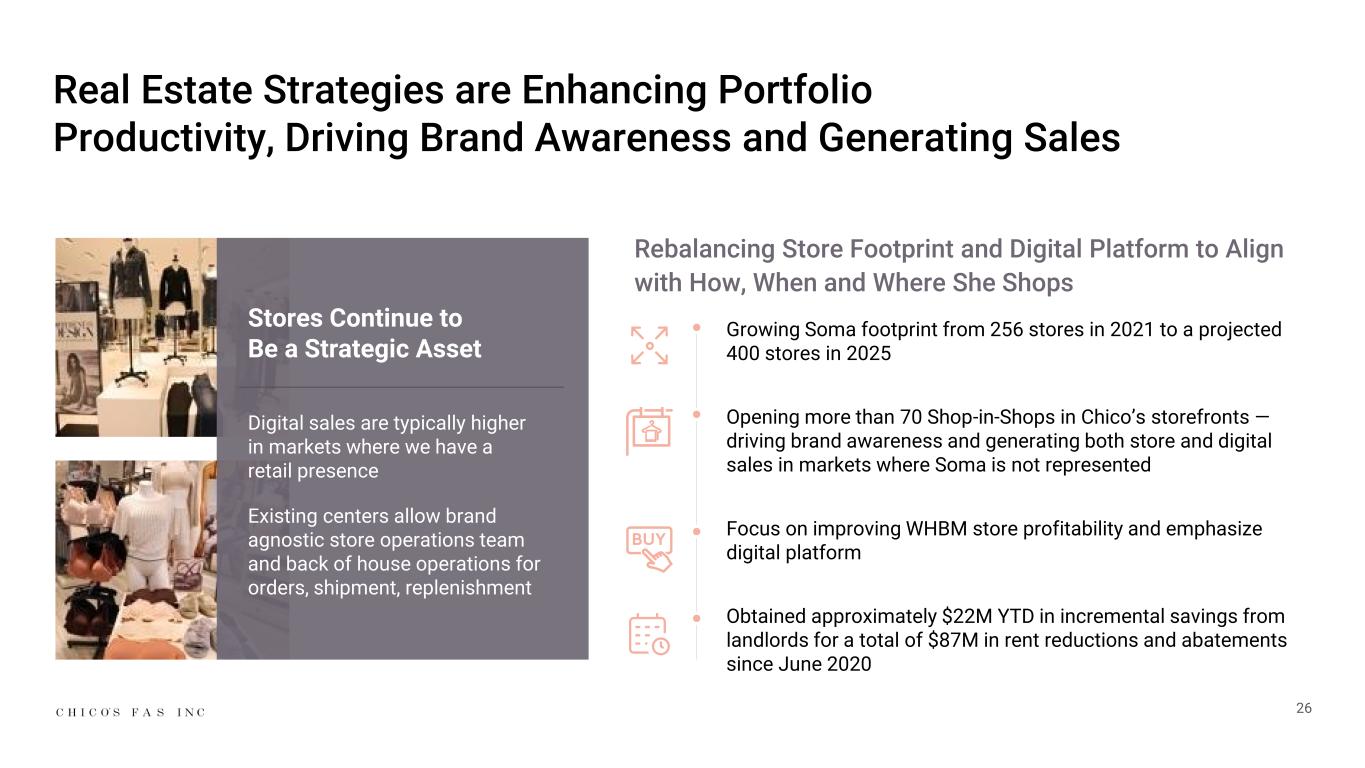
Stores Continue to Be a Strategic Asset Digital sales are typically higher in markets where we have a retail presence Existing centers allow brand agnostic store operations team and back of house operations for orders, shipment, replenishment Growing Soma footprint from 256 stores in 2021 to a projected 400 stores in 2025 Opening more than 70 Shop-in-Shops in Chico’s storefronts — driving brand awareness and generating both store and digital sales in markets where Soma is not represented Focus on improving WHBM store profitability and emphasize digital platform Obtained approximately $22M YTD in incremental savings from landlords for a total of $87M in rent reductions and abatements since June 2020 Rebalancing Store Footprint and Digital Platform to Align with How, When and Where She Shops 26 Real Estate Strategies are Enhancing Portfolio Productivity, Driving Brand Awareness and Generating Sales
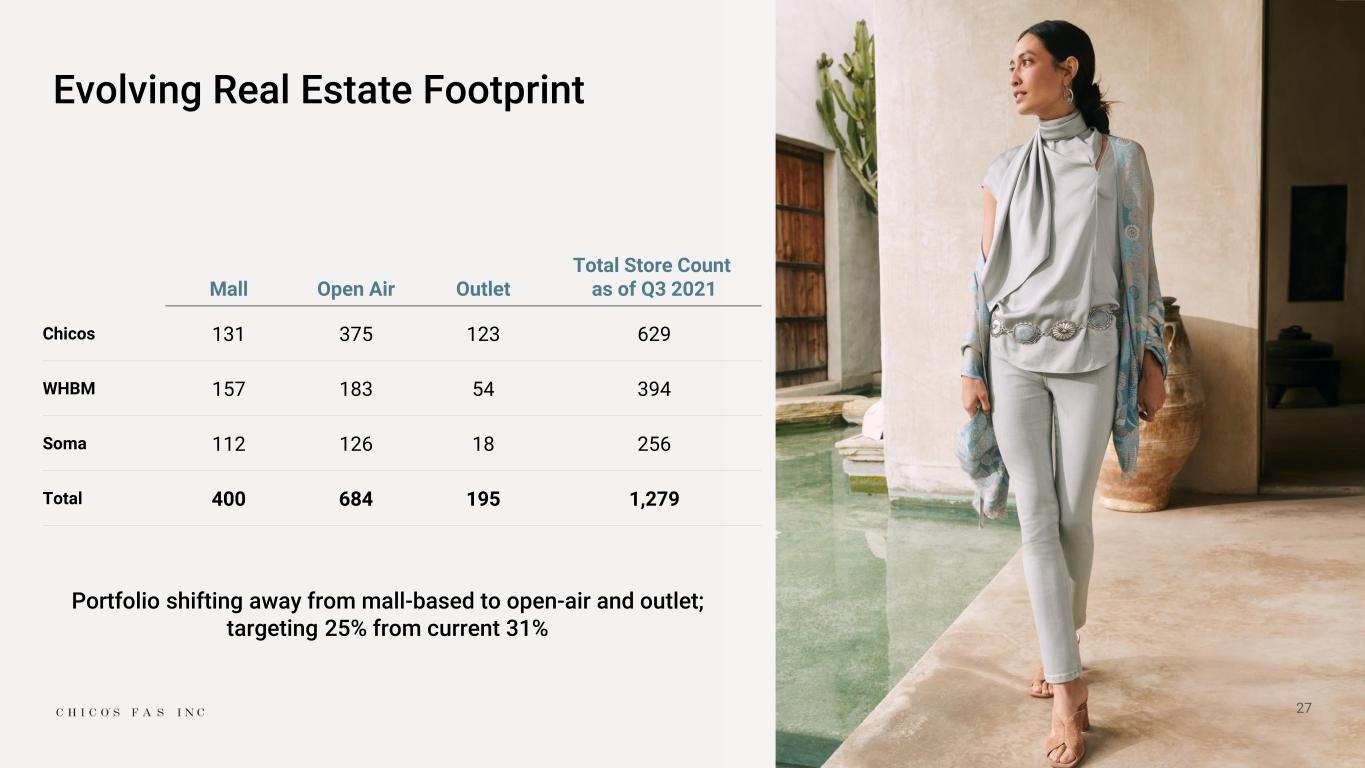
27 Evolving Real Estate Footprint Mall Open Air Outlet Total Store Count as of Q3 2021 Chicos 131 375 123 629 WHBM 157 183 54 394 Soma 112 126 18 256 Total 400 684 195 1,279 Portfolio shifting away from mall-based to open-air and outlet; targeting 25% from current 31%
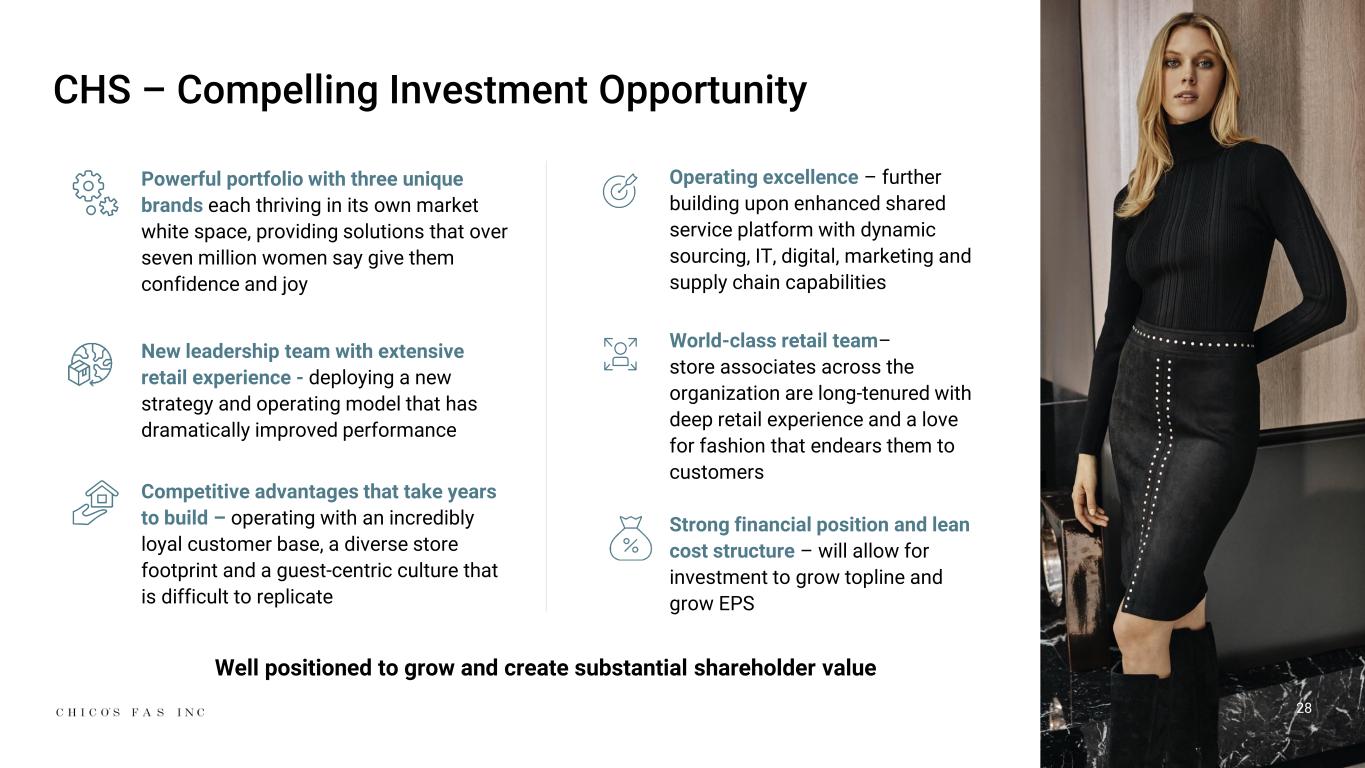
28 CHS – Compelling Investment Opportunity Operating excellence – further building upon enhanced shared service platform with dynamic sourcing, IT, digital, marketing and supply chain capabilities World-class retail team– store associates across the organization are long-tenured with deep retail experience and a love for fashion that endears them to customers Strong financial position and lean cost structure – will allow for investment to grow topline and grow EPS Powerful portfolio with three unique brands each thriving in its own market white space, providing solutions that over seven million women say give them confidence and joy New leadership team with extensive retail experience - deploying a new strategy and operating model that has dramatically improved performance Competitive advantages that take years to build – operating with an incredibly loyal customer base, a diverse store footprint and a guest-centric culture that is difficult to replicate Well positioned to grow and create substantial shareholder value
29 Appendix
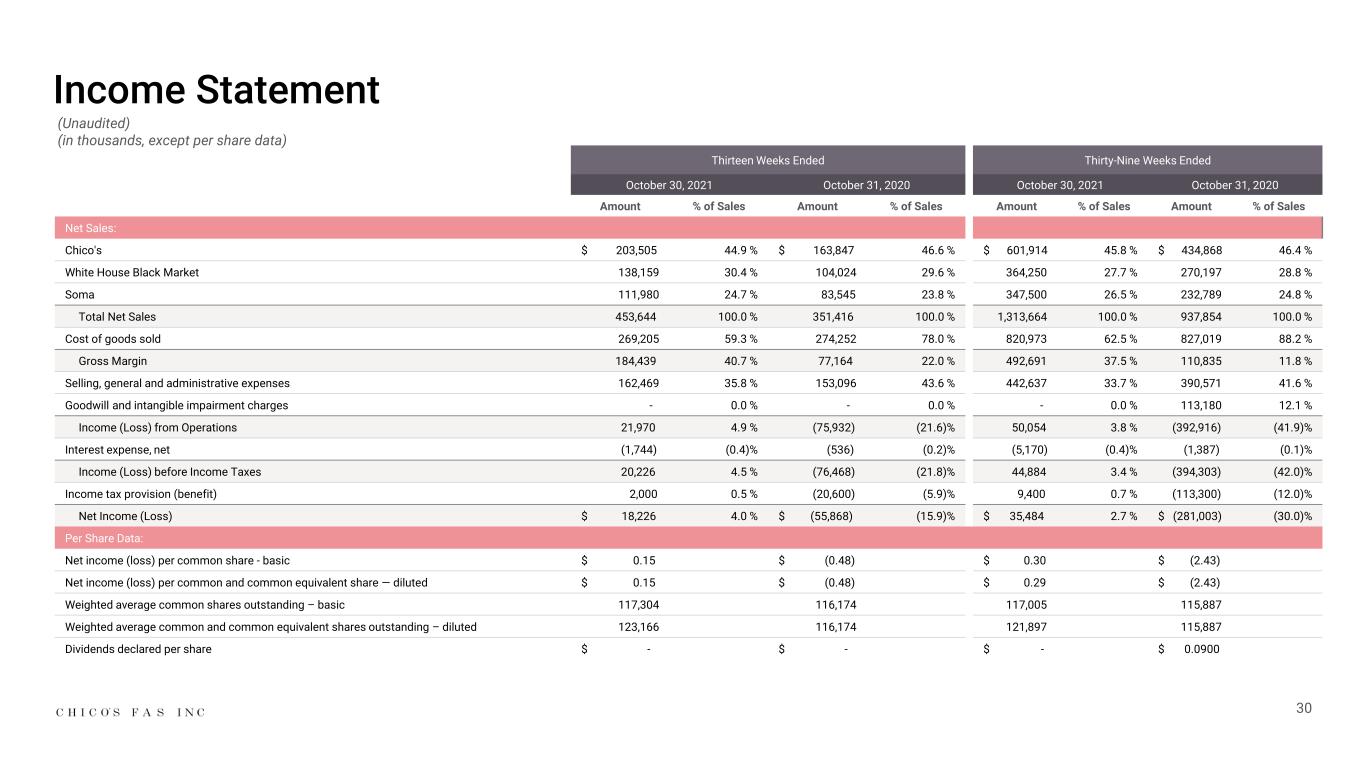
30 Income Statement Thirteen Weeks Ended Thirty-Nine Weeks Ended October 30, 2021 October 31, 2020 October 30, 2021 October 31, 2020 Amount % of Sales Amount % of Sales Amount % of Sales Amount % of Sales Net Sales: Chico's $ 203,505 44.9 % $ 163,847 46.6 % $ 601,914 45.8 % $ 434,868 46.4 % White House Black Market 138,159 30.4 % 104,024 29.6 % 364,250 27.7 % 270,197 28.8 % Soma 111,980 24.7 % 83,545 23.8 % 347,500 26.5 % 232,789 24.8 % Total Net Sales 453,644 100.0 % 351,416 100.0 % 1,313,664 100.0 % 937,854 100.0 % Cost of goods sold 269,205 59.3 % 274,252 78.0 % 820,973 62.5 % 827,019 88.2 % Gross Margin 184,439 40.7 % 77,164 22.0 % 492,691 37.5 % 110,835 11.8 % Selling, general and administrative expenses 162,469 35.8 % 153,096 43.6 % 442,637 33.7 % 390,571 41.6 % Goodwill and intangible impairment charges - 0.0 % - 0.0 % - 0.0 % 113,180 12.1 % Income (Loss) from Operations 21,970 4.9 % (75,932) (21.6)% 50,054 3.8 % (392,916) (41.9)% Interest expense, net (1,744) (0.4)% (536) (0.2)% (5,170) (0.4)% (1,387) (0.1)% Income (Loss) before Income Taxes 20,226 4.5 % (76,468) (21.8)% 44,884 3.4 % (394,303) (42.0)% Income tax provision (benefit) 2,000 0.5 % (20,600) (5.9)% 9,400 0.7 % (113,300) (12.0)% Net Income (Loss) $ 18,226 4.0 % $ (55,868) (15.9)% $ 35,484 2.7 % $ (281,003) (30.0)% Per Share Data: Net income (loss) per common share - basic $ 0.15 $ (0.48) $ 0.30 $ (2.43) Net income (loss) per common and common equivalent share — diluted $ 0.15 $ (0.48) $ 0.29 $ (2.43) Weighted average common shares outstanding – basic 117,304 116,174 117,005 115,887 Weighted average common and common equivalent shares outstanding – diluted 123,166 116,174 121,897 115,887 Dividends declared per share $ - $ - $ - $ 0.0900 (Unaudited) (in thousands, except per share data)
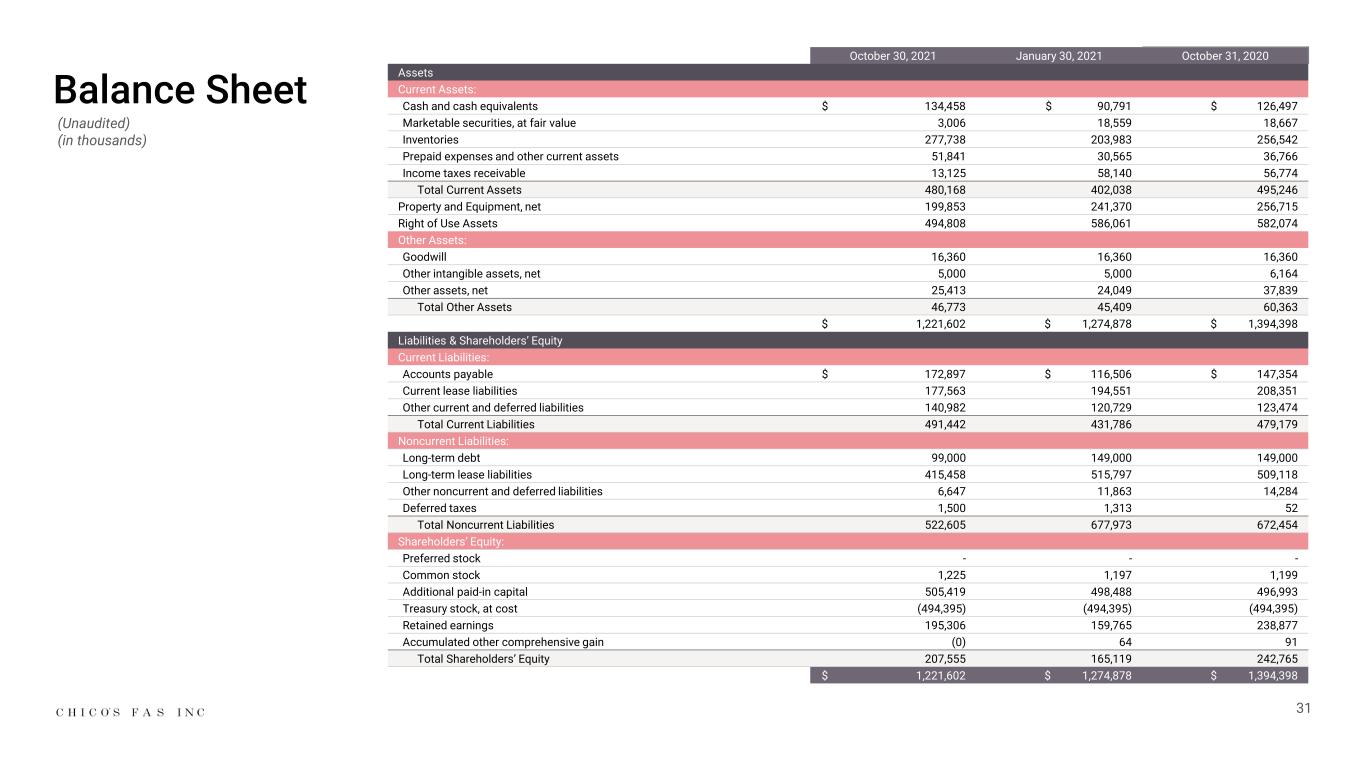
31 Balance Sheet October 30, 2021 January 30, 2021 October 31, 2020 Assets Current Assets: Cash and cash equivalents $ 134,458 $ 90,791 $ 126,497 Marketable securities, at fair value 3,006 18,559 18,667 Inventories 277,738 203,983 256,542 Prepaid expenses and other current assets 51,841 30,565 36,766 Income taxes receivable 13,125 58,140 56,774 Total Current Assets 480,168 402,038 495,246 Property and Equipment, net 199,853 241,370 256,715 Right of Use Assets 494,808 586,061 582,074 Other Assets: Goodwill 16,360 16,360 16,360 Other intangible assets, net 5,000 5,000 6,164 Other assets, net 25,413 24,049 37,839 Total Other Assets 46,773 45,409 60,363 $ 1,221,602 $ 1,274,878 $ 1,394,398 Liabilities & Shareholders’ Equity Current Liabilities: Accounts payable $ 172,897 $ 116,506 $ 147,354 Current lease liabilities 177,563 194,551 208,351 Other current and deferred liabilities 140,982 120,729 123,474 Total Current Liabilities 491,442 431,786 479,179 Noncurrent Liabilities: Long-term debt 99,000 149,000 149,000 Long-term lease liabilities 415,458 515,797 509,118 Other noncurrent and deferred liabilities 6,647 11,863 14,284 Deferred taxes 1,500 1,313 52 Total Noncurrent Liabilities 522,605 677,973 672,454 Shareholders’ Equity: Preferred stock - - - Common stock 1,225 1,197 1,199 Additional paid-in capital 505,419 498,488 496,993 Treasury stock, at cost (494,395) (494,395) (494,395) Retained earnings 195,306 159,765 238,877 Accumulated other comprehensive gain (0) 64 91 Total Shareholders’ Equity 207,555 165,119 242,765 $ 1,221,602 $ 1,274,878 $ 1,394,398 (Unaudited) (in thousands)
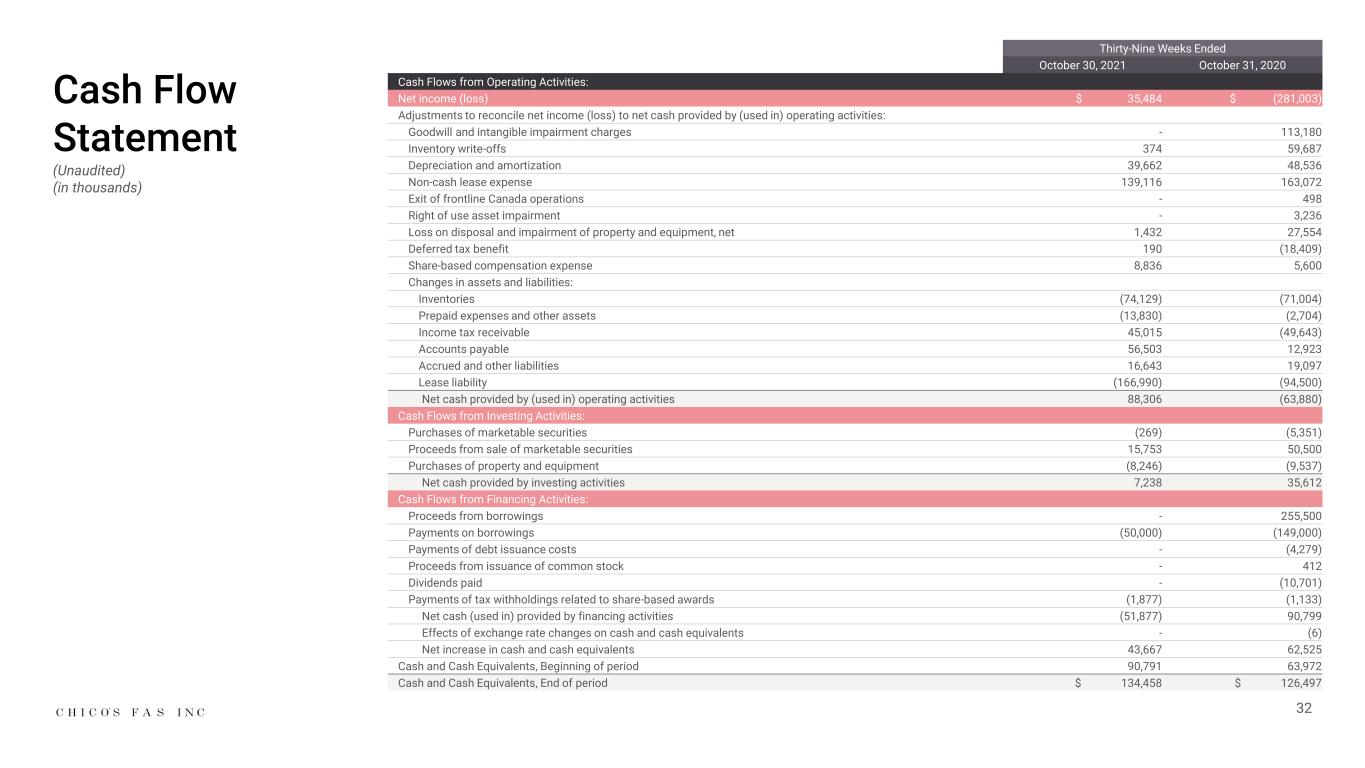
32 Cash Flow Statement Thirty-Nine Weeks Ended October 30, 2021 October 31, 2020 Cash Flows from Operating Activities: Net income (loss) $ 35,484 $ (281,003) Adjustments to reconcile net income (loss) to net cash provided by (used in) operating activities: Goodwill and intangible impairment charges - 113,180 Inventory write-offs 374 59,687 Depreciation and amortization 39,662 48,536 Non-cash lease expense 139,116 163,072 Exit of frontline Canada operations - 498 Right of use asset impairment - 3,236 Loss on disposal and impairment of property and equipment, net 1,432 27,554 Deferred tax benefit 190 (18,409) Share-based compensation expense 8,836 5,600 Changes in assets and liabilities: Inventories (74,129) (71,004) Prepaid expenses and other assets (13,830) (2,704) Income tax receivable 45,015 (49,643) Accounts payable 56,503 12,923 Accrued and other liabilities 16,643 19,097 Lease liability (166,990) (94,500) Net cash provided by (used in) operating activities 88,306 (63,880) Cash Flows from Investing Activities: Purchases of marketable securities (269) (5,351) Proceeds from sale of marketable securities 15,753 50,500 Purchases of property and equipment (8,246) (9,537) Net cash provided by investing activities 7,238 35,612 Cash Flows from Financing Activities: Proceeds from borrowings - 255,500 Payments on borrowings (50,000) (149,000) Payments of debt issuance costs - (4,279) Proceeds from issuance of common stock - 412 Dividends paid - (10,701) Payments of tax withholdings related to share-based awards (1,877) (1,133) Net cash (used in) provided by financing activities (51,877) 90,799 Effects of exchange rate changes on cash and cash equivalents - (6) Net increase in cash and cash equivalents 43,667 62,525 Cash and Cash Equivalents, Beginning of period 90,791 63,972 Cash and Cash Equivalents, End of period $ 134,458 $ 126,497 (Unaudited) (in thousands)
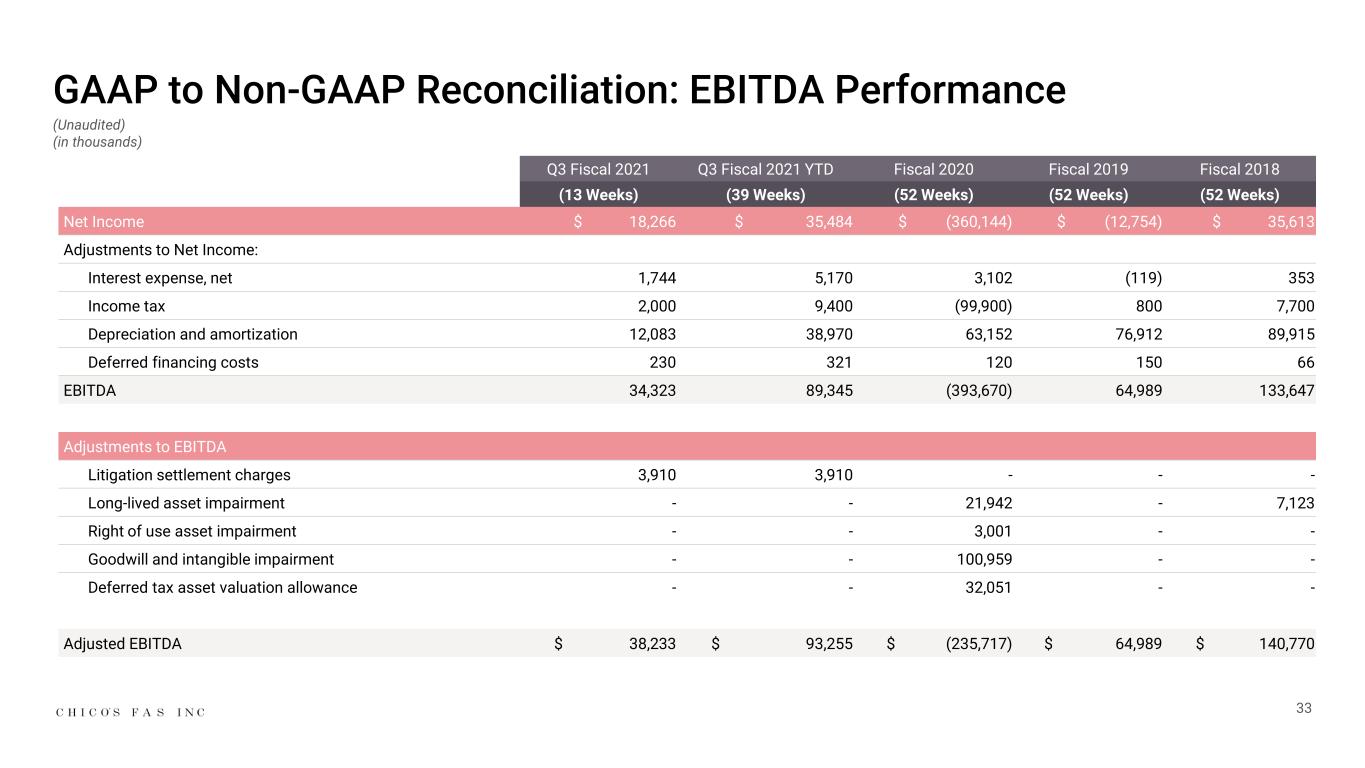
GAAP to Non-GAAP Reconciliation: EBITDA Performance Q3 Fiscal 2021 Q3 Fiscal 2021 YTD Fiscal 2020 Fiscal 2019 Fiscal 2018 (13 Weeks) (39 Weeks) (52 Weeks) (52 Weeks) (52 Weeks) Net Income $ 18,266 $ 35,484 $ (360,144) $ (12,754) $ 35,613 Adjustments to Net Income: Interest expense, net 1,744 5,170 3,102 (119) 353 Income tax 2,000 9,400 (99,900) 800 7,700 Depreciation and amortization 12,083 38,970 63,152 76,912 89,915 Deferred financing costs 230 321 120 150 66 EBITDA 34,323 89,345 (393,670) 64,989 133,647 Adjustments to EBITDA Litigation settlement charges 3,910 3,910 - - - Long-lived asset impairment - - 21,942 - 7,123 Right of use asset impairment - - 3,001 - - Goodwill and intangible impairment - - 100,959 - - Deferred tax asset valuation allowance - - 32,051 - - Adjusted EBITDA $ 38,233 $ 93,255 $ (235,717) $ 64,989 $ 140,770 (Unaudited) (in thousands) 33
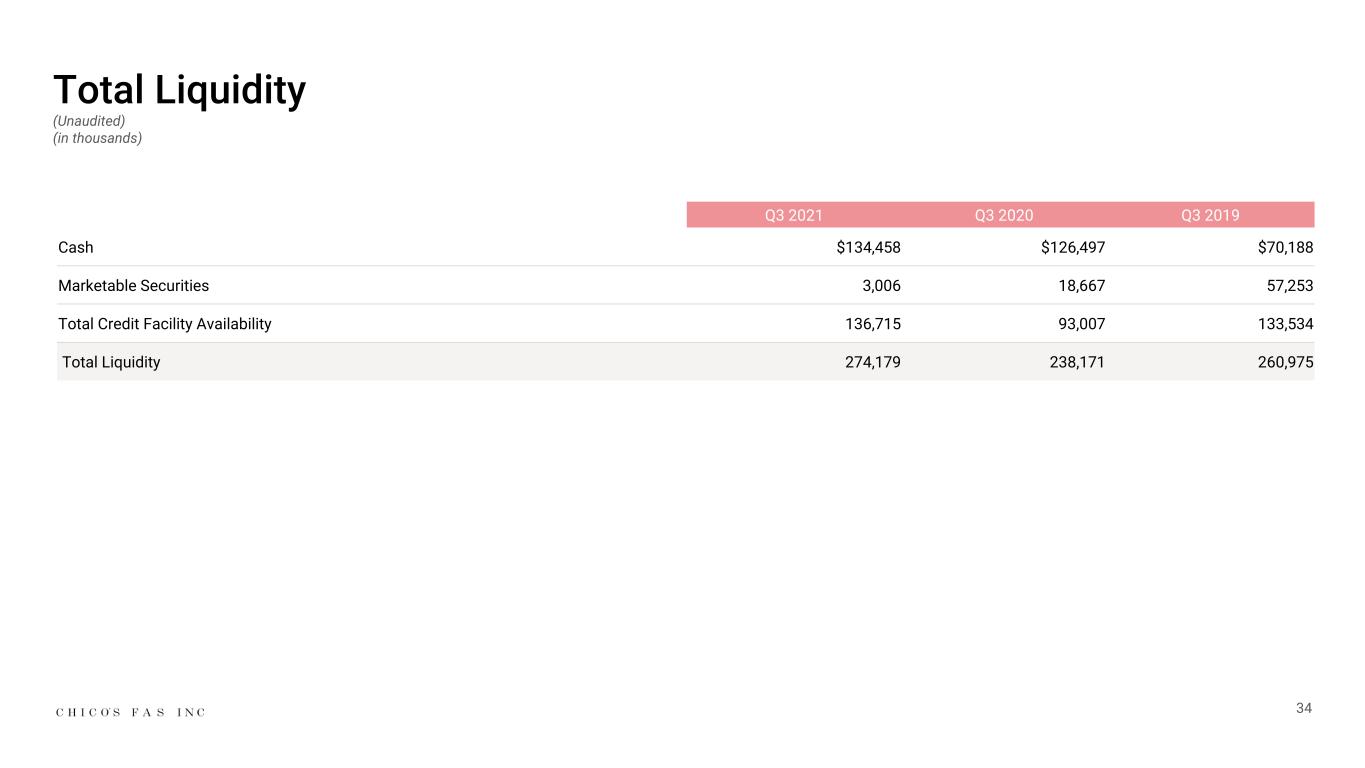
Total Liquidity Q3 2021 Q3 2020 Q3 2019 Cash $134,458 $126,497 $70,188 Marketable Securities 3,006 18,667 57,253 Total Credit Facility Availability 136,715 93,007 133,534 Total Liquidity 274,179 238,171 260,975 (Unaudited) (in thousands) 34
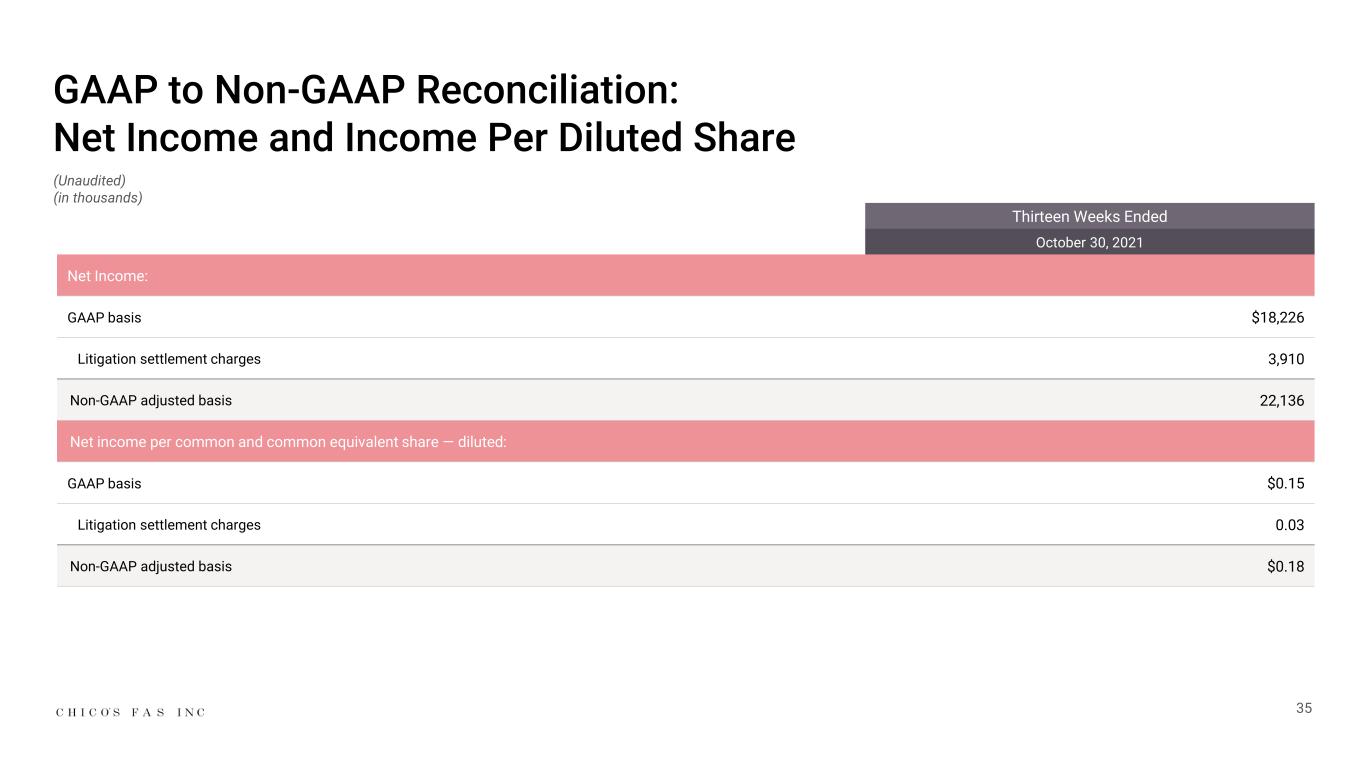
GAAP to Non-GAAP Reconciliation: Net Income and Income Per Diluted Share Thirteen Weeks Ended October 30, 2021 Net Income: GAAP basis $18,226 Litigation settlement charges 3,910 Non-GAAP adjusted basis 22,136 Net income per common and common equivalent share — diluted: GAAP basis $0.15 Litigation settlement charges 0.03 Non-GAAP adjusted basis $0.18 (Unaudited) (in thousands) 35
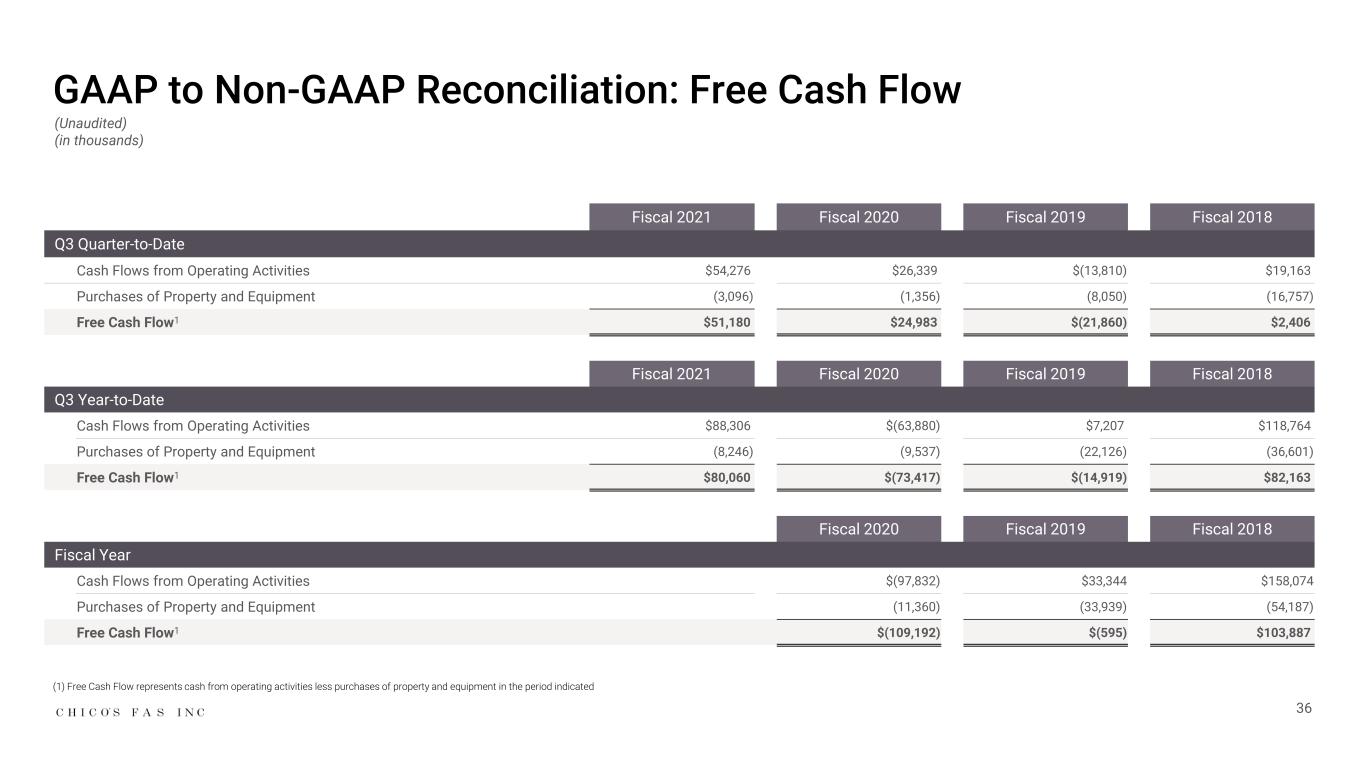
GAAP to Non-GAAP Reconciliation: Free Cash Flow (Unaudited) (in thousands) Fiscal 2021 Fiscal 2020 Fiscal 2019 Fiscal 2018 Q3 Quarter-to-Date Cash Flows from Operating Activities $54,276 $26,339 $(13,810) $19,163 Purchases of Property and Equipment (3,096) (1,356) (8,050) (16,757) Free Cash Flow1 $51,180 $24,983 $(21,860) $2,406 Fiscal 2021 Fiscal 2020 Fiscal 2019 Fiscal 2018 Q3 Year-to-Date Cash Flows from Operating Activities $88,306 $(63,880) $7,207 $118,764 Purchases of Property and Equipment (8,246) (9,537) (22,126) (36,601) Free Cash Flow1 $80,060 $(73,417) $(14,919) $82,163 Fiscal 2020 Fiscal 2019 Fiscal 2018 Fiscal Year Cash Flows from Operating Activities $(97,832) $33,344 $158,074 Purchases of Property and Equipment (11,360) (33,939) (54,187) Free Cash Flow1 $(109,192) $(595) $103,887 36 (1) Free Cash Flow represents cash from operating activities less purchases of property and equipment in the period indicated


