Chico’s FAS Investor Day March 25, 2022 Premier Merchants, Brands and Growth Exhibit 99.2
Forward-Looking Language 2 This presentation contains statements concerning our current expectations, assumptions, plans, estimates, judgments and projections about our business and our industry and other statements that are not historical facts. These statements, including without limitation statements regarding our 2024 goals and targets, are “forward-looking statements” within the meaning of the Private Securities Litigation Reform Act of 1995. In most cases, words or phrases such as “anticipates,” “believes,” “could,” “estimates,” “expects,” “intends,” “may,” “will,” “plans,” “path,” “outlook,” “project,” “target,” “should,” “strategy,” “potential,” “confident” and similar expressions identify forward-looking statements. These forward-looking statements are based largely on information currently available to our management and are subject to various risks and uncertainties that could cause actual results to differ materially from historical results or those expressed or implied by such forward-looking statements. Although we believe our expectations are based on reasonable estimates and assumptions, they are not guarantees of performance. There is no assurance that our expectations will occur or that our estimates or assumptions will be correct, and we caution investors and all others not to place undue reliance on such forward-looking statements. Factors that could cause actual results to differ include, but are not limited to, those described in Item 1A, “Risk Factors” in our most recent Annual Report on Form 10-K and, from time to time, in Item 1A, “Risk Factors” of our Quarterly Reports on Form 10-Q and the following: The effects of the pandemic, including uncertainties about its depth and duration, new variants of COVID-19 that have emerged, the speed, efficacy and availability of vaccines and treatments, its impact on general economic conditions, human capital management, consumer behavior and discretionary spending, the effectiveness of any actions taken in response to the pandemic, and the impact of the pandemic on our manufacturing operations and shipping timelines; the extent, availability and effectiveness of any pandemic stimulus packages or loan programs, including the CARES Act; the ability of our suppliers, logistics providers, vendors and landlords, to meet their obligations to us in light of financial stress, labor shortages, liquidity challenges, bankruptcy filings by other industry participants, and supply chain and other disruptions; increases in unemployment rates; increases in labor shortages and our ability to sufficiently staff our retail stores; general economic conditions, including but not limited to, inflation, deflation, consumer confidence and consumer spending patterns; market disruptions including pandemics or significant health hazards, severe weather conditions, natural disasters, terrorist activities, financial crises, political crises, war and other military conflicts (including the ongoing military conflict between Russia and Ukraine) or other major events, or the prospect of these events; shifts in consumer behavior, and our ability to adapt, identify and respond to new and changing fashion trends and customer preferences, and to coordinate product development with buying and planning; changes in the general or specialty retail or apparel industries, including significant decreases in market demand and the overall level of spending for women’s private branded clothing and related accessories; our ability to secure and maintain customer acceptance of in-store and online concepts and styles; increased competition in the markets in which we operate, including our ability to remain competitive with customer shipping terms and costs; decreases in customer traffic at our stores; fluctuations in foreign currency exchange rates; significant increases in the costs of manufacturing, raw materials, transportation, importing, distribution, labor and advertising; decreases in the quality of merchandise received from suppliers and increases in delivery times for receiving such merchandise; our ability to appropriately manage our store fleet and achieve the expected results of store openings or store closures; our ability to appropriately manage inventory and allocation processes and leverage targeted promotions; our ability to maintain cost saving discipline; our ability to operate our retail websites in a profitable manner; our ability to successfully identify and implement additional sales and distribution channels; our ability to successfully execute and achieve the expected results of our business, brand strategies, brand awareness programs, and merchandising and marketing programs including, but not limited to, the Company’s turnaround strategy, retail fleet optimization plan, sales initiatives, multi-channel strategies and five operating priorities which are: 1) continuing our ongoing digital transformation; 2) further refining product through fit, quality, fabric and innovation in each of our brands; 3) driving increased customer engagement through marketing; 4) maintaining our operating and cost discipline; and 5) further enhancing the productivity of our real estate portfolio; our ability to utilize our distribution center and other support facilities in an efficient and effective manner; our increased reliance on sourcing from foreign suppliers and significant adverse economic, labor, political or other shifts (including adverse changes in tariffs, taxes or other import regulations, particularly with respect to China, or legislation prohibiting certain imports from China); U.S. and foreign governmental actions and policies and changes thereto; the continuing performance, implementation and integration of our management information systems; our ability to successfully update our information systems; the impact of any system failure, cyber security or other data security breaches, including any security breaches resulting in the theft, transfer, or unauthorized disclosure of customer, employee, or company information; our ability to comply with any domestic and foreign information security and privacy laws, regulations and technology platform rules or other obligations related to data privacy and security; our ability to attract, hire, train, motivate and retain qualified employees in an inclusive environment; our ability to successfully recruit leadership or transition members of our senior management team; future unsolicited offers to buy the Company and actions of activist shareholders and others and our ability to respond effectively; our ability to secure and protect our intellectual property rights and to protect our reputation and brand images; unanticipated obligations or changes in estimates arising from new or existing litigation, income taxes and other regulatory proceedings; unanticipated adverse changes in legal, regulatory or tax laws; and our ability to comply with the terms of our Credit Agreement, including the restrictive provisions limiting our flexibility in operating our business and obtaining credit on commercially reasonable terms. These factors should be considered in evaluating forward-looking statements contained herein. All forward-looking statements that are made or attributable to us are expressly qualified in their entirety by this cautionary notice. The forward-looking statements included herein are only made as of the date of this presentation. We undertake no obligation to publicly update or revise any forward-looking statements, including any financial targets and estimates, whether as a result of new information, future events or otherwise.
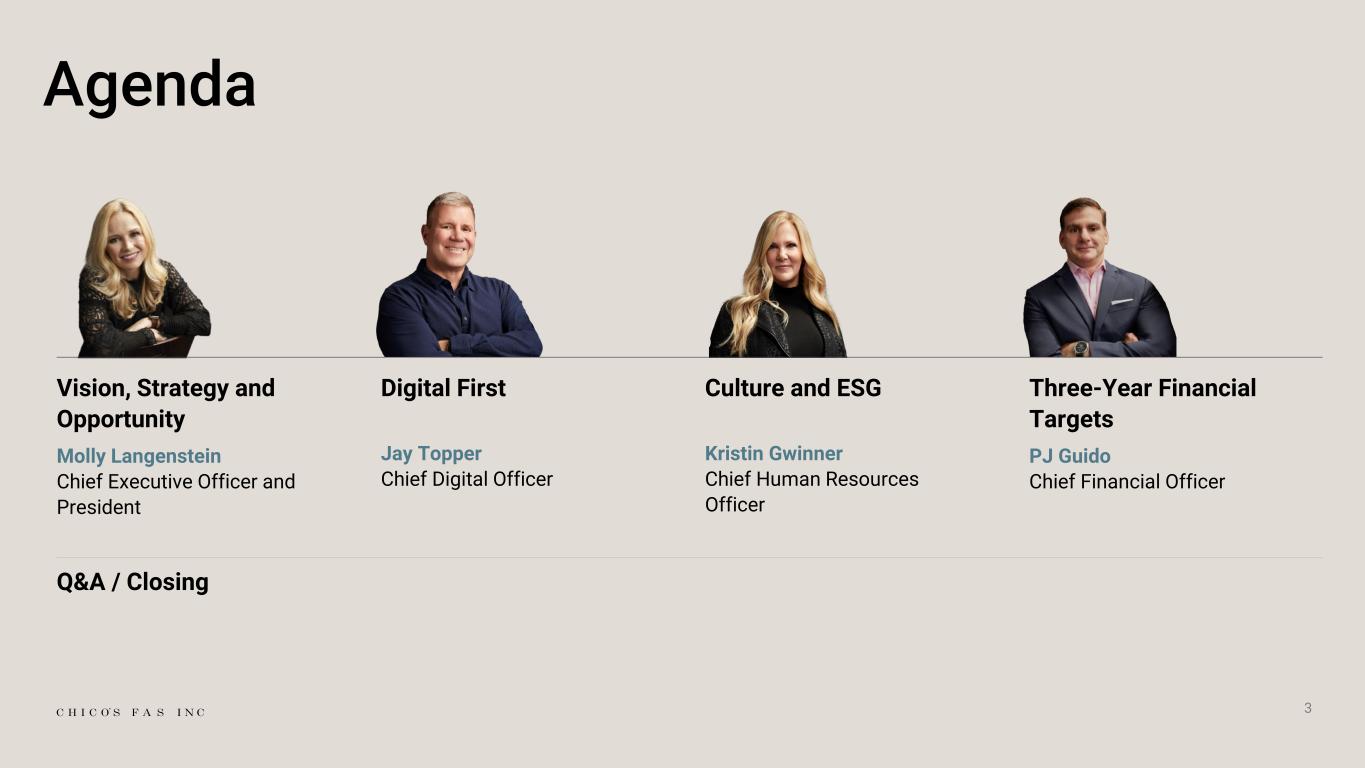
Agenda Vision, Strategy and Opportunity Molly Langenstein Chief Executive Officer and President Digital First Jay Topper Chief Digital Officer Culture and ESG Kristin Gwinner Chief Human Resources Officer Three-Year Financial Targets PJ Guido Chief Financial Officer 3 Q&A / Closing
We Are… Chico’s FAS 4 Our Purpose Providing solutions, building communities and creating memorable experiences to bring women confidence and joy! Our Vision A world where women never have to compromise
5 2019 FOLK ART SPECIALTIES 2022 FASHION ARTISTRY SOLUTIONS We are a new company today
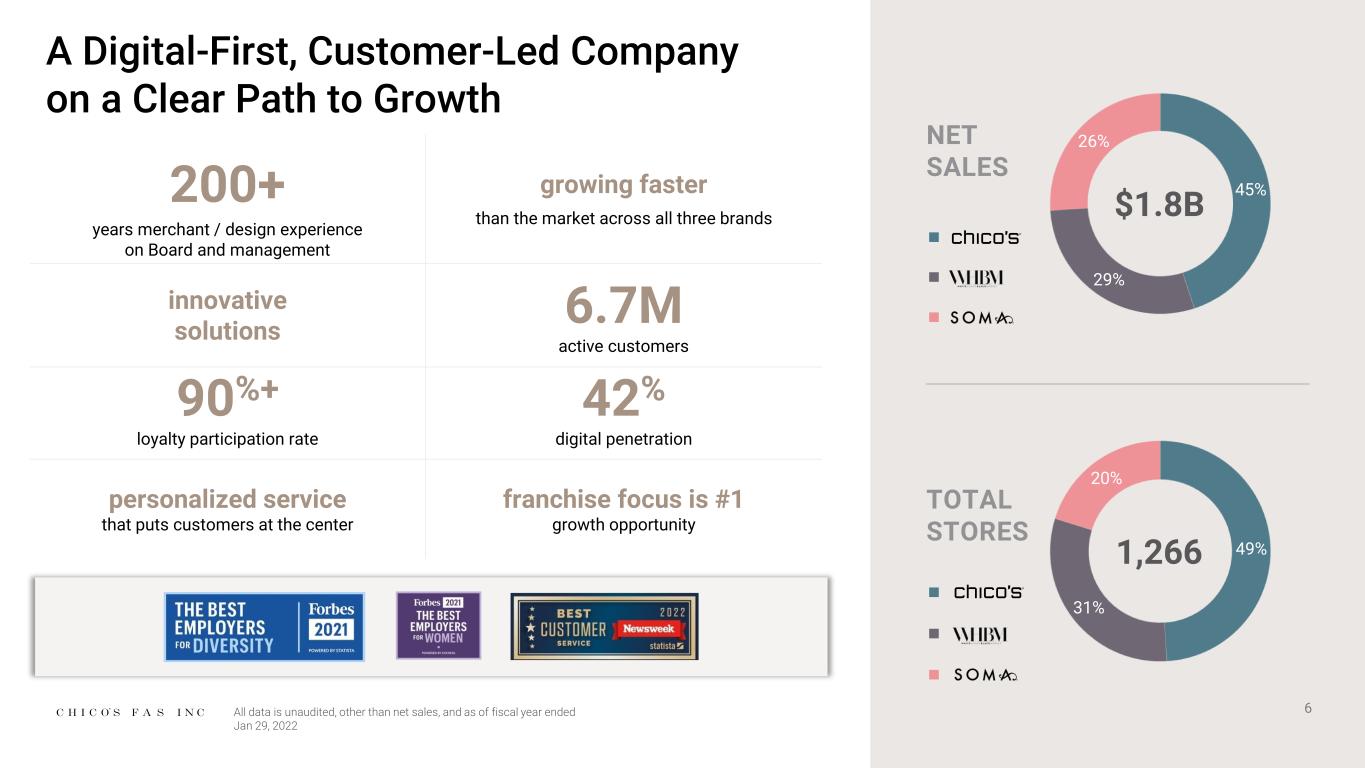
6 A Digital-First, Customer-Led Company on a Clear Path to Growth 200+ years merchant / design experience on Board and management growing faster than the market across all three brands innovative solutions 6.7M active customers 90%+ loyalty participation rate 42% digital penetration personalized service that puts customers at the center franchise focus is #1 growth opportunity 45% 29% 26% 49% 31% 20% $1.8B 1,266 TOTAL STORES NET SALES All data is unaudited, other than net sales, and as of fiscal year ended Jan 29, 2022
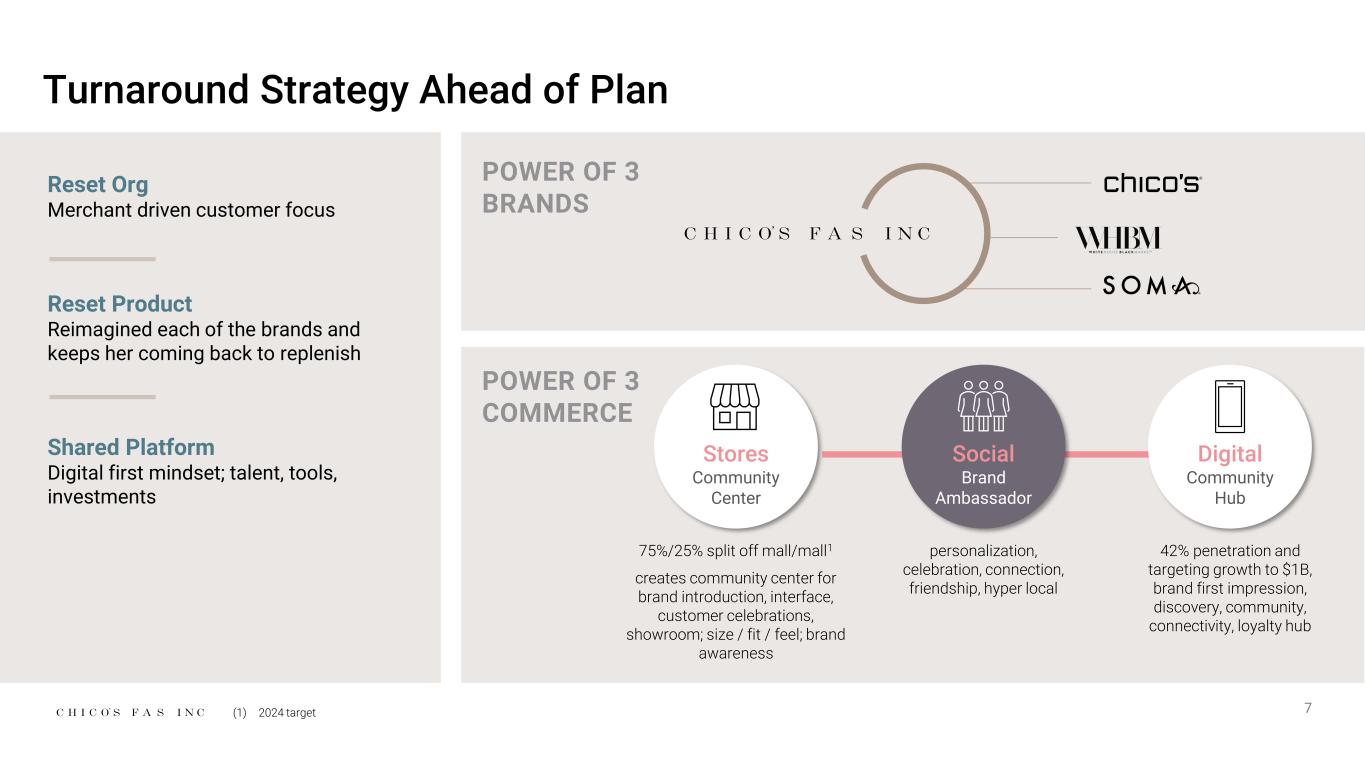
7 Turnaround Strategy Ahead of Plan Reset Org Merchant driven customer focus Reset Product Reimagined each of the brands and keeps her coming back to replenish Shared Platform Digital first mindset; talent, tools, investments POWER OF 3 BRANDS Stores Community Center Digital Community Hub 75%/25% split off mall/mall1 creates community center for brand introduction, interface, customer celebrations, showroom; size / fit / feel; brand awareness personalization, celebration, connection, friendship, hyper local 42% penetration and targeting growth to $1B, brand first impression, discovery, community, connectivity, loyalty hub Social Brand Ambassador POWER OF 3 COMMERCE (1) 2024 target
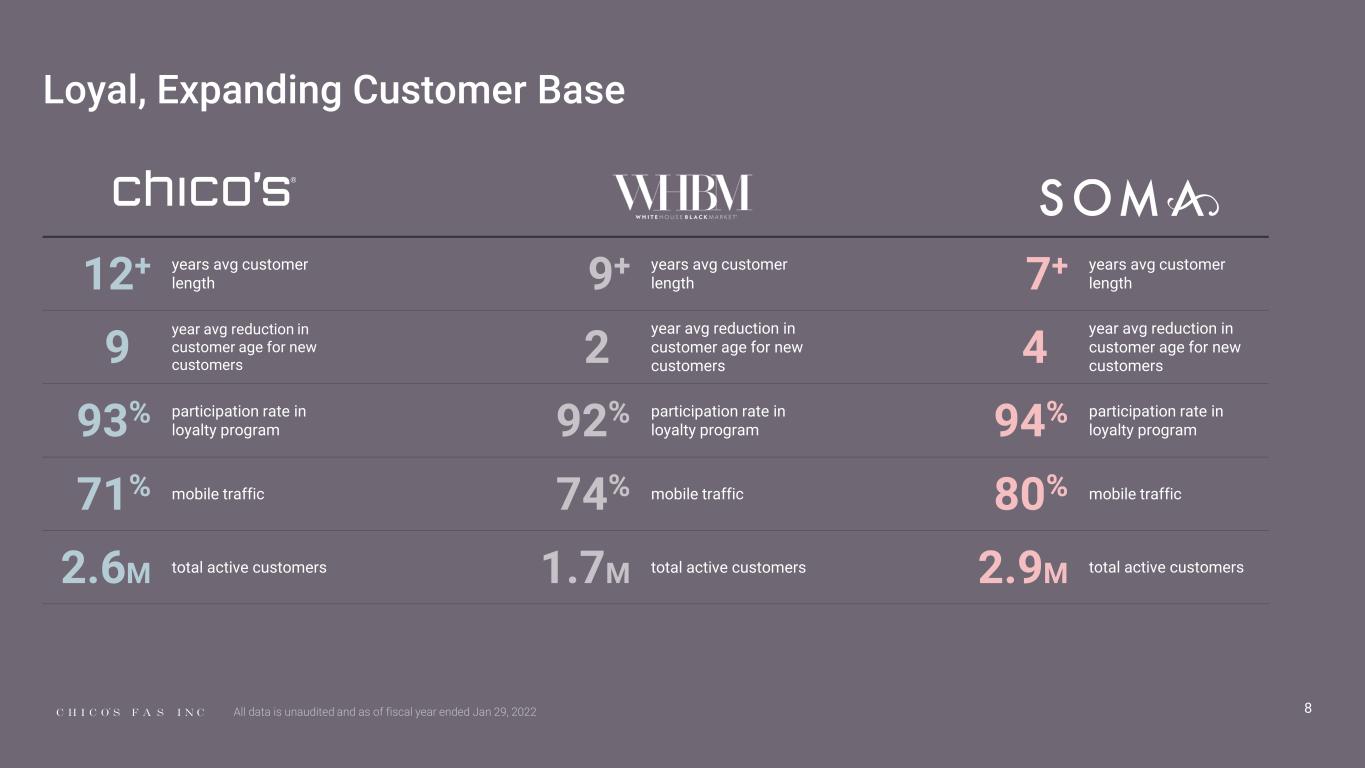
8 Loyal, Expanding Customer Base 12+ years avg customer length 9+ years avg customer length 7+ years avg customer length 9 year avg reduction in customer age for new customers 2 year avg reduction in customer age for new customers 4 year avg reduction in customer age for new customers 93% participation rate in loyalty program 92% participation rate in loyalty program 94% participation rate in loyalty program 71% mobile traffic 74% mobile traffic 80% mobile traffic 2.6M total active customers 1.7M total active customers 2.9M total active customers All data is unaudited and as of fiscal year ended Jan 29, 2022
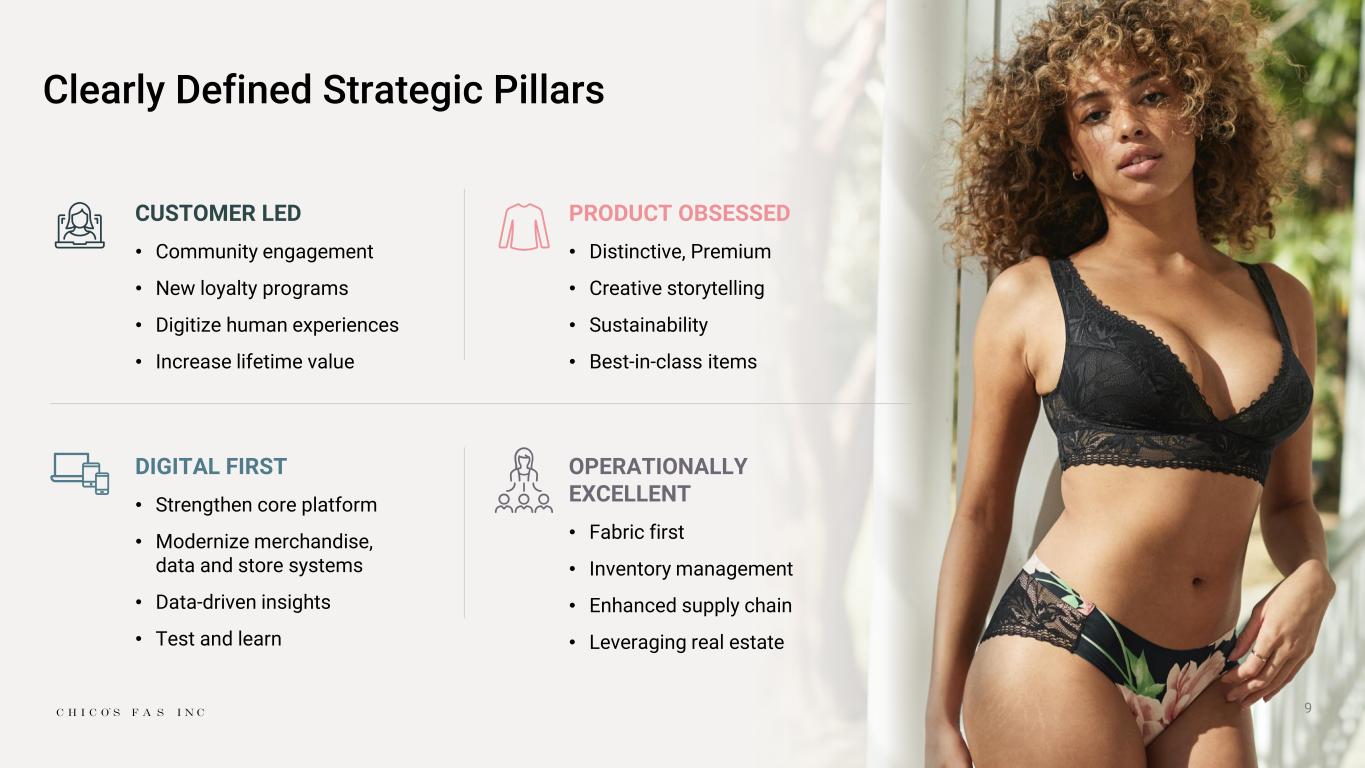
9 Clearly Defined Strategic Pillars CUSTOMER LED • Community engagement • New loyalty programs • Digitize human experiences • Increase lifetime value PRODUCT OBSESSED • Distinctive, Premium • Creative storytelling • Sustainability • Best-in-class items DIGITAL FIRST • Strengthen core platform • Modernize merchandise, data and store systems • Data-driven insights • Test and learn OPERATIONALLY EXCELLENT • Fabric first • Inventory management • Enhanced supply chain • Leveraging real estate
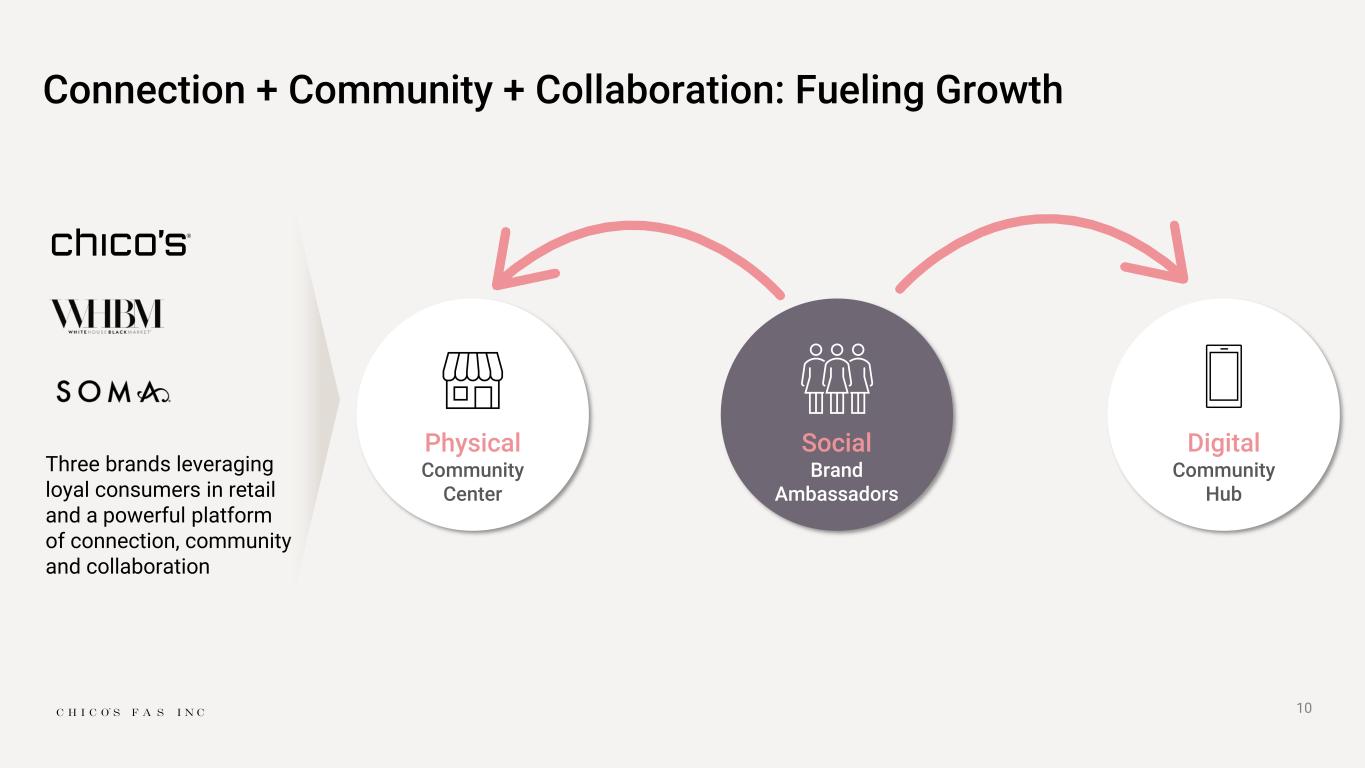
10 Connection + Community + Collaboration: Fueling Growth Three brands leveraging loyal consumers in retail and a powerful platform of connection, community and collaboration Physical Community Center Digital Community Hub Social Brand Ambassadors
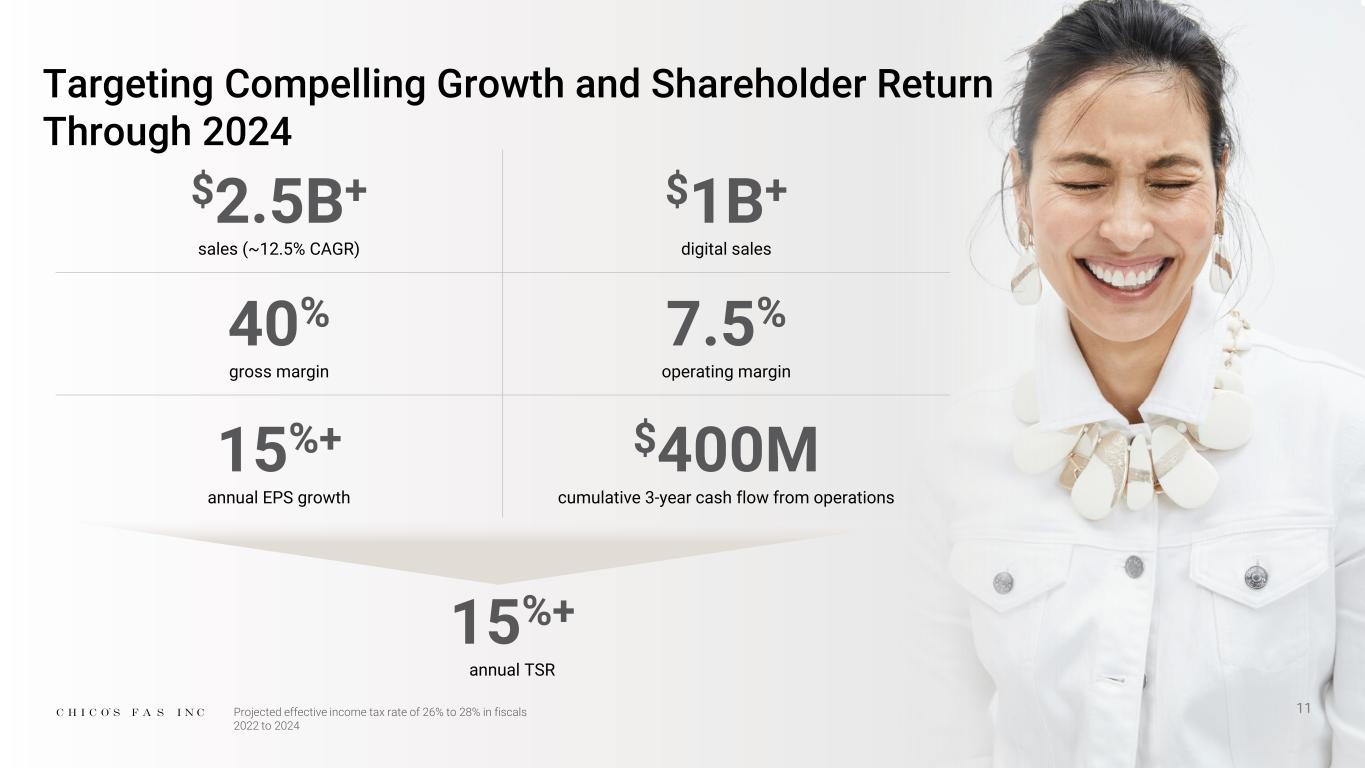
$2.5B+ sales (~12.5% CAGR) $1B+ digital sales 40% gross margin 7.5% operating margin 15%+ annual EPS growth $400M cumulative 3-year cash flow from operations 15%+ annual TSR Targeting Compelling Growth and Shareholder Return Through 2024 11Projected effective income tax rate of 26% to 28% in fiscals 2022 to 2024
Boutique of solution- oriented products, focused on color and fit with core franchises 12
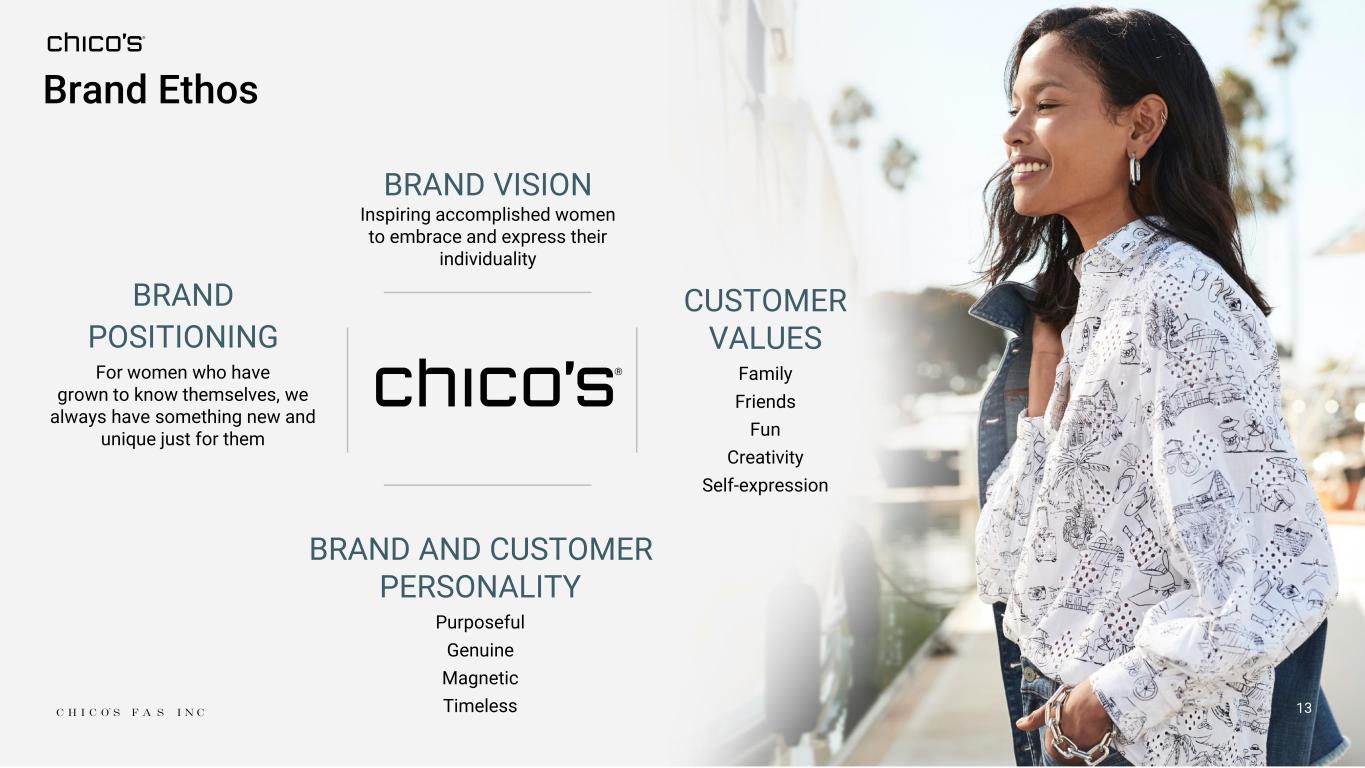
BRAND VISION Inspiring accomplished women to embrace and express their individuality BRAND AND CUSTOMER PERSONALITY Purposeful Genuine Magnetic Timeless CUSTOMER VALUES Family Friends Fun Creativity Self-expression BRAND POSITIONING For women who have grown to know themselves, we always have something new and unique just for them 13 Brand Ethos
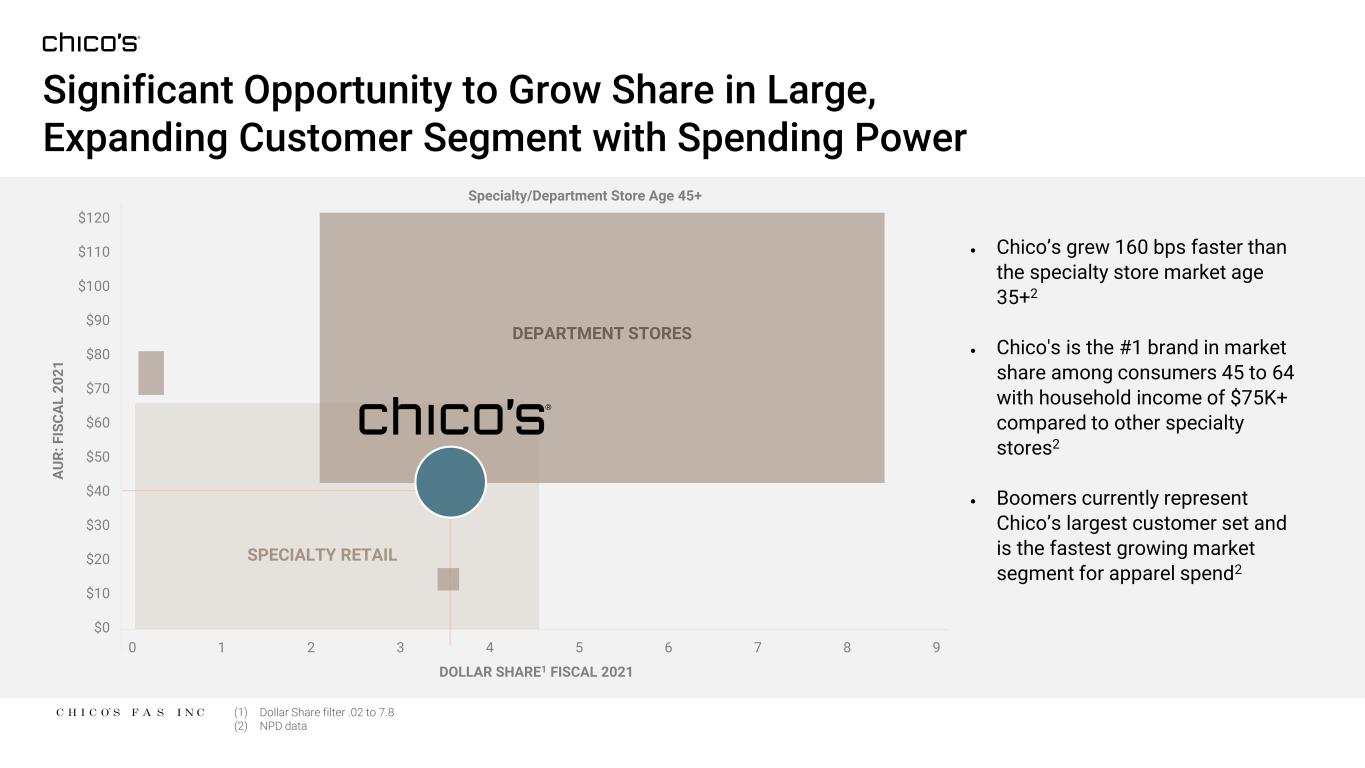
(1) Dollar Share filter .02 to 7.8 (2) NPD data 14 Significant Opportunity to Grow Share in Large, Expanding Customer Segment with Spending Power DEPARTMENT STORES SPECIALTY RETAIL A U R : F IS C A L 2 0 2 1 $120 $110 $100 $90 $80 $70 $60 $50 $40 $30 $20 $10 $0 0 1 2 3 4 5 6 7 8 9 DOLLAR SHARE1 FISCAL 2021 Specialty/Department Store Age 45+ • Chico’s grew 160 bps faster than the specialty store market age 35+2 • Chico's is the #1 brand in market share among consumers 45 to 64 with household income of $75K+ compared to other specialty stores2 • Boomers currently represent Chico’s largest customer set and is the fastest growing market segment for apparel spend2
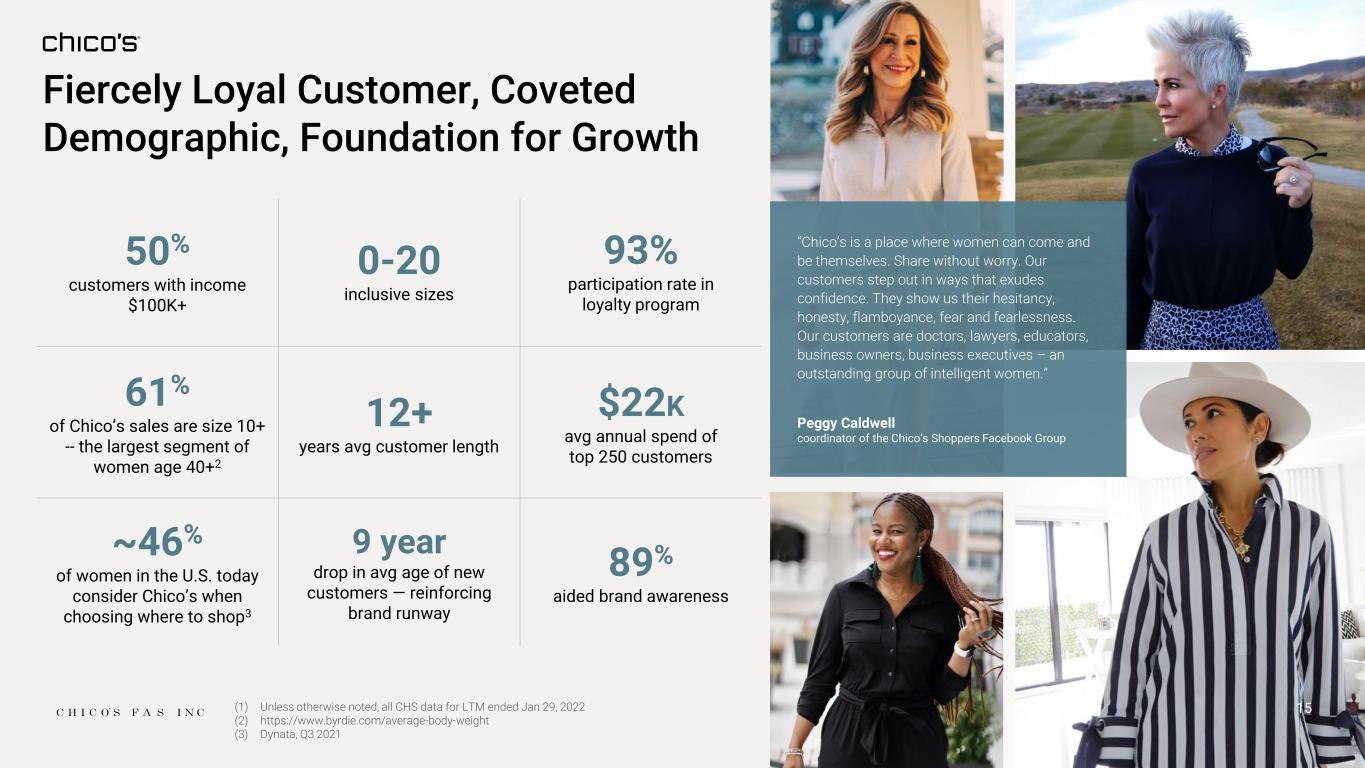
Fiercely Loyal Customer, Coveted Demographic, Foundation for Growth 50% customers with income $100K+ 0-20 inclusive sizes 93% participation rate in loyalty program 61% of Chico’s sales are size 10+ -- the largest segment of women age 40+2 12+ years avg customer length $22K avg annual spend of top 250 customers ~46% of women in the U.S. today consider Chico’s when choosing where to shop3 9 year drop in avg age of new customers — reinforcing brand runway 89% aided brand awareness 15 “Chico’s is a place where women can come and be themselves. Share without worry. Our customers step out in ways that exudes confidence. They show us their hesitancy, honesty, flamboyance, fear and fearlessness. Our customers are doctors, lawyers, educators, business owners, business executives – an outstanding group of intelligent women.” Peggy Caldwell coordinator of the Chico’s Shoppers Facebook Group (1) Unless otherwise noted, all CHS data for LTM ended Jan 29, 2022 (2) https://www.byrdie.com/average-body-weight (3) Dynata, Q3 2021
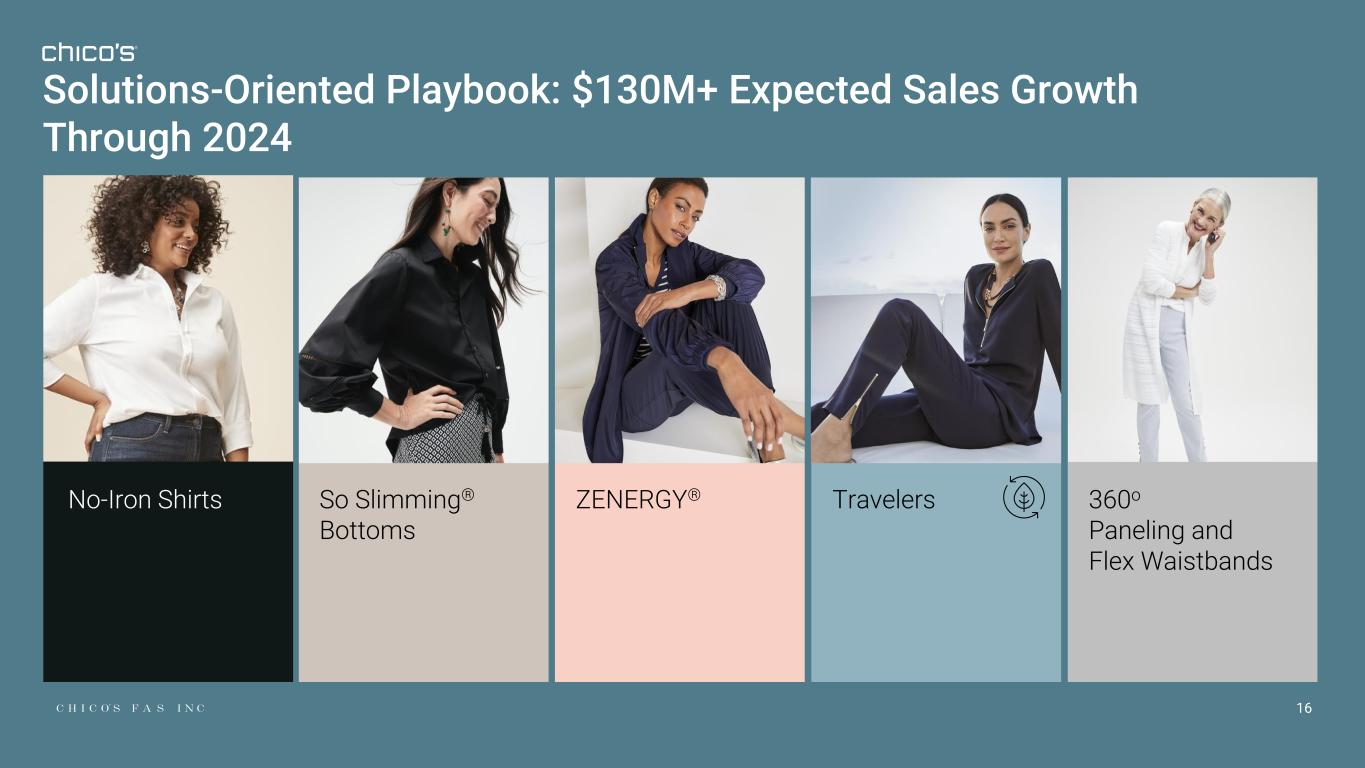
Solutions-Oriented Playbook: $130M+ Expected Sales Growth Through 2024 16 No-Iron Shirts So Slimming® Bottoms ZENERGY® Travelers 360o Paneling and Flex Waistbands
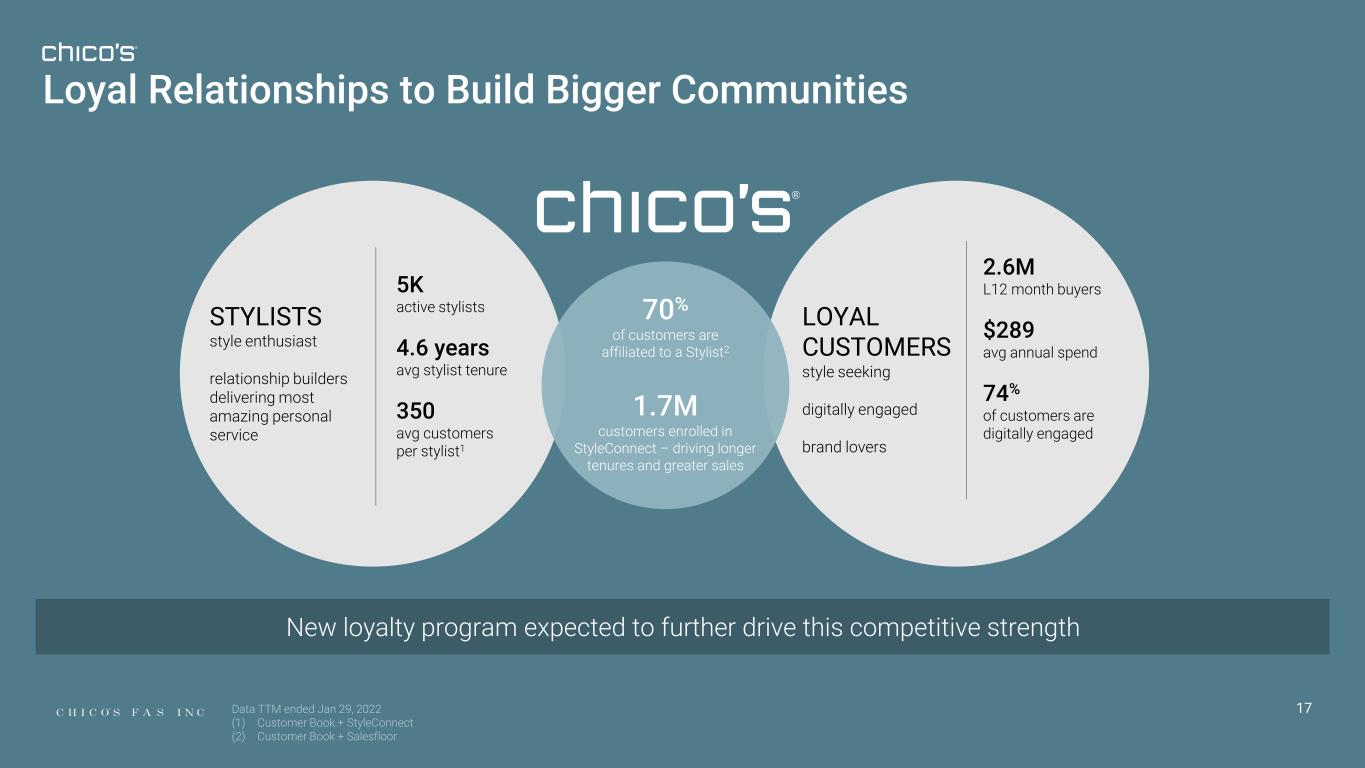
Loyal Relationships to Build Bigger Communities New loyalty program expected to further drive this competitive strength 2.6M L12 month buyers $289 avg annual spend 74% of customers are digitally engaged STYLISTS style enthusiast relationship builders delivering most amazing personal service LOYAL CUSTOMERS style seeking digitally engaged brand lovers 1.7M customers enrolled in StyleConnect – driving longer tenures and greater sales 5K active stylists 4.6 years avg stylist tenure 350 avg customers per stylist1 70% of customers are affiliated to a Stylist2 17Data TTM ended Jan 29, 2022 (1) Customer Book + StyleConnect (2) Customer Book + Salesfloor
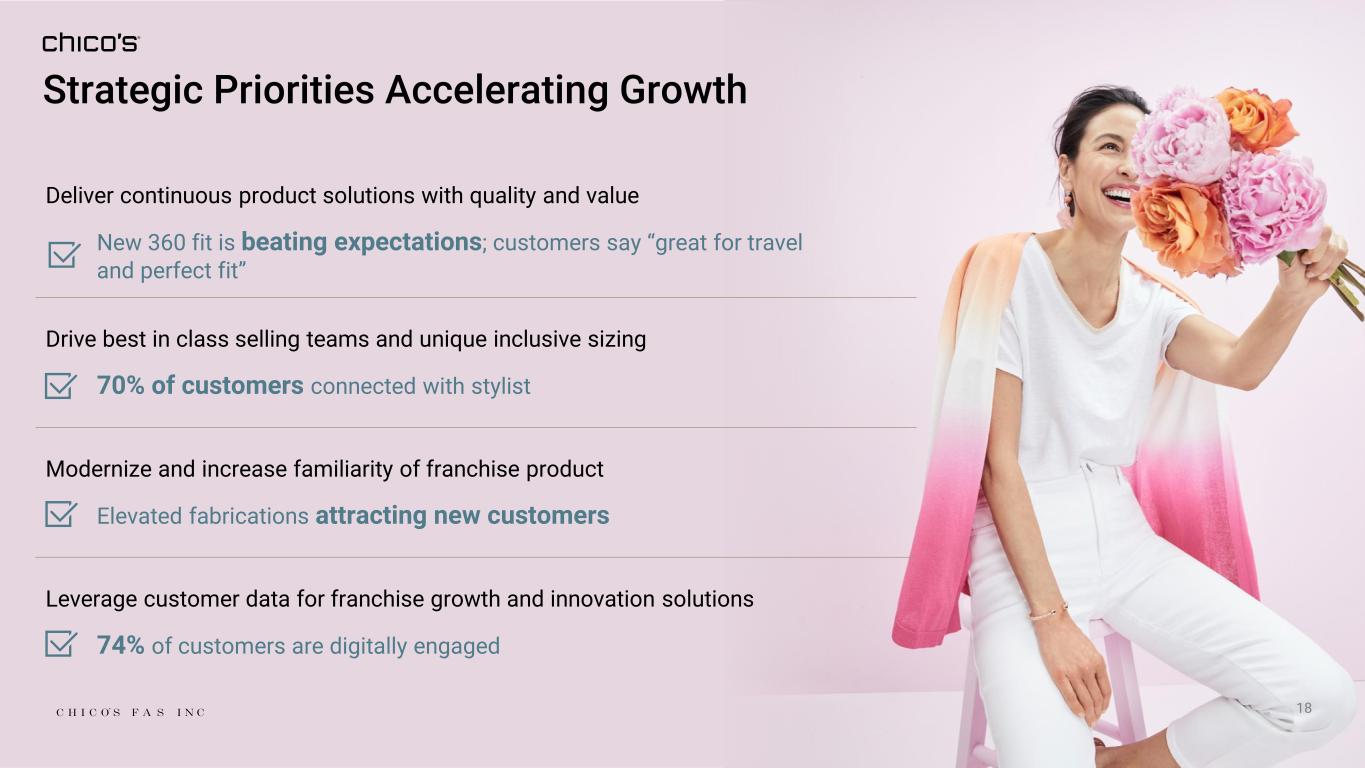
Strategic Priorities Accelerating Growth 18 Deliver continuous product solutions with quality and value New 360 fit is beating expectations; customers say “great for travel and perfect fit” Drive best in class selling teams and unique inclusive sizing 70% of customers connected with stylist Modernize and increase familiarity of franchise product Elevated fabrications attracting new customers Leverage customer data for franchise growth and innovation solutions 74% of customers are digitally engaged
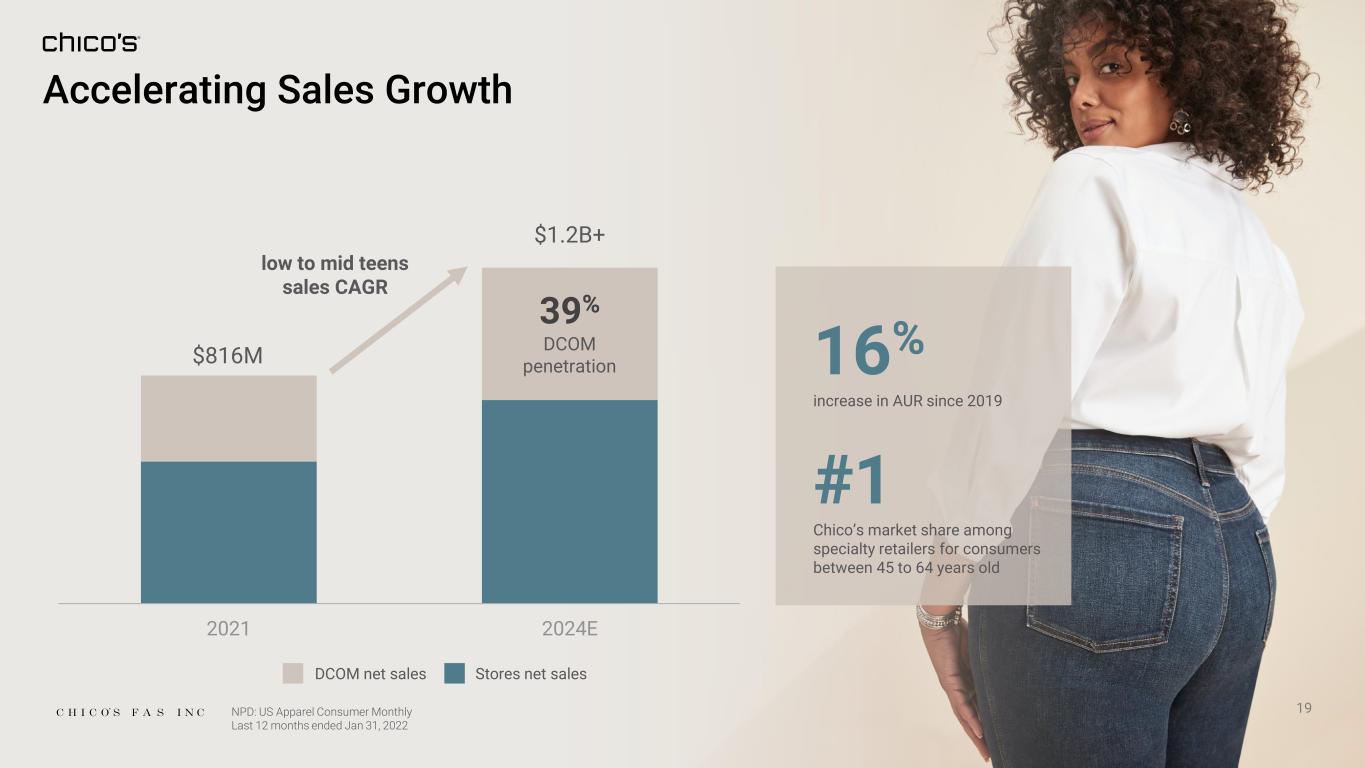
19 Accelerating Sales Growth DCOM net sales Stores net sales 16% increase in AUR since 2019 #1 Chico’s market share among specialty retailers for consumers between 45 to 64 years old 2021 2024E low to mid teens sales CAGR $816M $1.2B+ 39% DCOM penetration NPD: US Apparel Consumer Monthly Last 12 months ended Jan 31, 2022

20 Affordable designer with feminine tailoring focused on core franchises with solutions
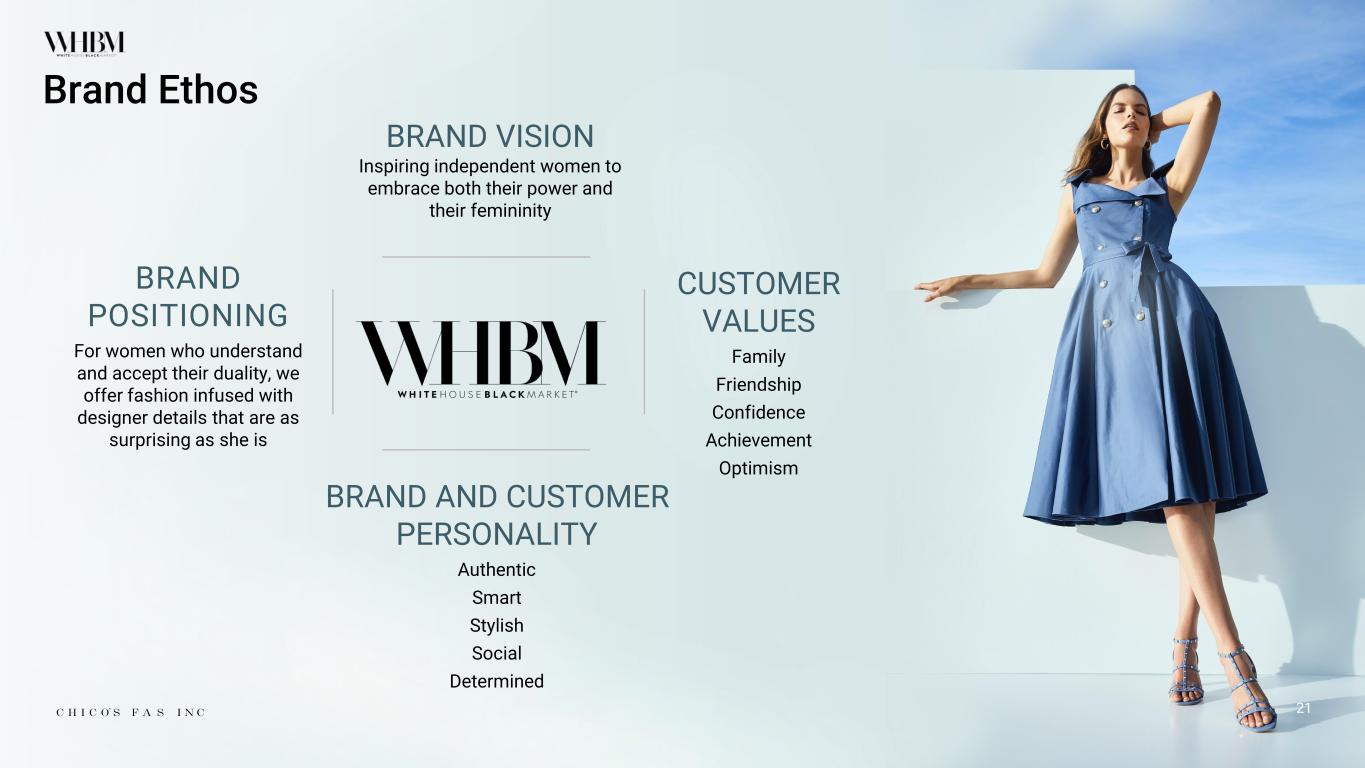
Brand Ethos BRAND VISION Inspiring independent women to embrace both their power and their femininity BRAND AND CUSTOMER PERSONALITY Authentic Smart Stylish Social Determined CUSTOMER VALUES Family Friendship Confidence Achievement Optimism BRAND POSITIONING For women who understand and accept their duality, we offer fashion infused with designer details that are as surprising as she is 21
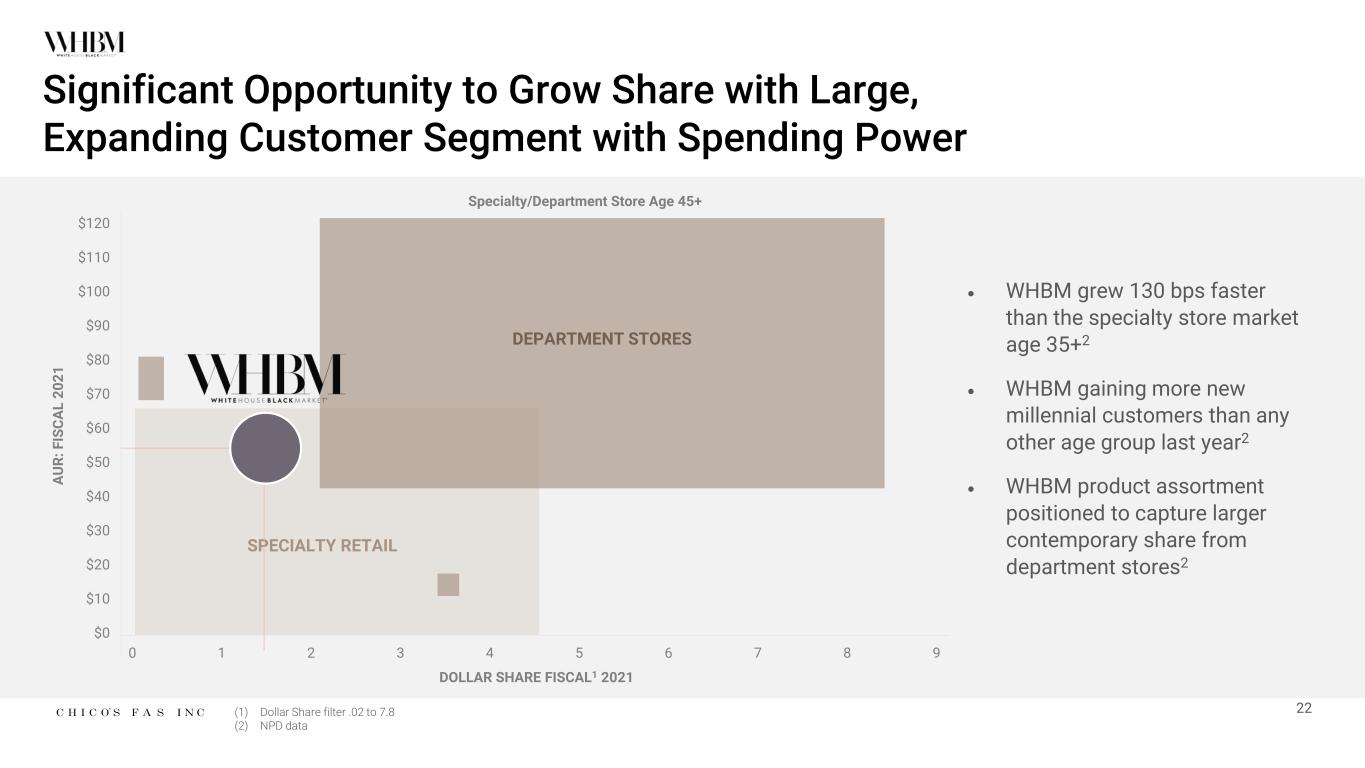
22 Significant Opportunity to Grow Share with Large, Expanding Customer Segment with Spending Power DEPARTMENT STORES SPECIALTY RETAIL A U R : F IS C A L 2 0 2 1 $120 $110 $100 $90 $80 $70 $60 $50 $40 $30 $20 $10 $0 0 1 2 3 4 5 6 7 8 9 DOLLAR SHARE FISCAL1 2021 Specialty/Department Store Age 45+ • WHBM grew 130 bps faster than the specialty store market age 35+2 • WHBM gaining more new millennial customers than any other age group last year2 • WHBM product assortment positioned to capture larger contemporary share from department stores2 (1) Dollar Share filter .02 to 7.8 (2) NPD data
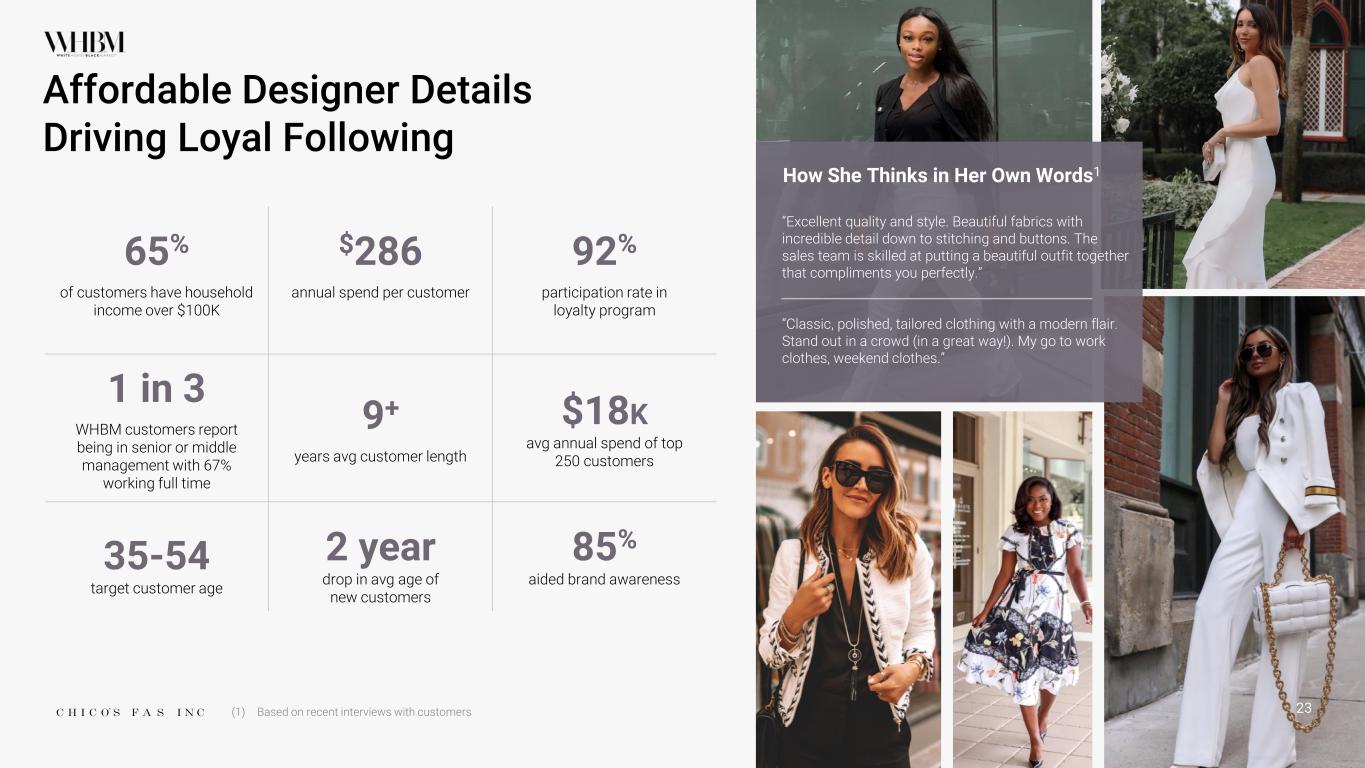
Affordable Designer Details Driving Loyal Following 65% of customers have household income over $100K $286 annual spend per customer 92% participation rate in loyalty program 1 in 3 WHBM customers report being in senior or middle management with 67% working full time 9+ years avg customer length $18K avg annual spend of top 250 customers 35-54 target customer age 2 year drop in avg age of new customers 85% aided brand awareness (1) Based on recent interviews with customers “Excellent quality and style. Beautiful fabrics with incredible detail down to stitching and buttons. The sales team is skilled at putting a beautiful outfit together that compliments you perfectly.” “Classic, polished, tailored clothing with a modern flair. Stand out in a crowd (in a great way!). My go to work clothes, weekend clothes.” How She Thinks in Her Own Words1 23
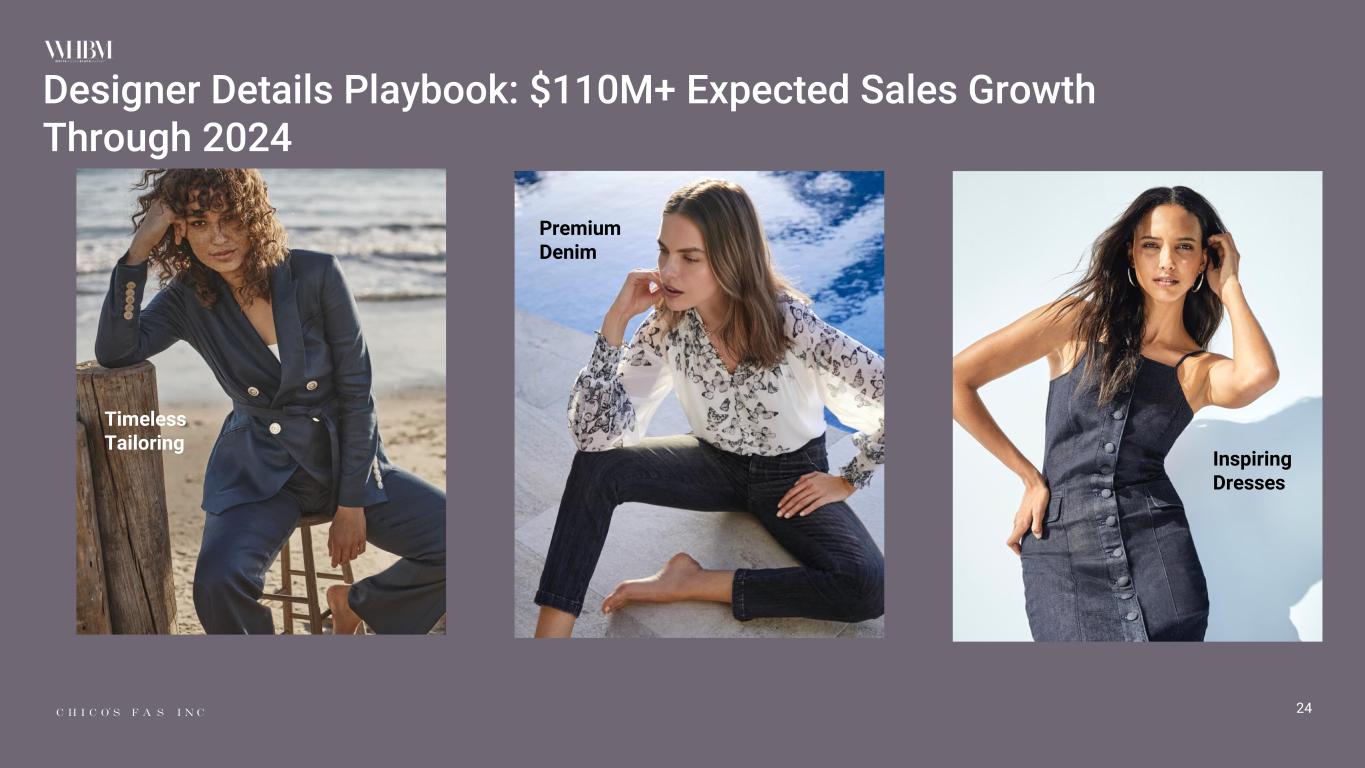
Designer Details Playbook: $110M+ Expected Sales Growth Through 2024 Premium Denim 24 Inspiring Dresses Inspiring Dresses Timeless Tailoring
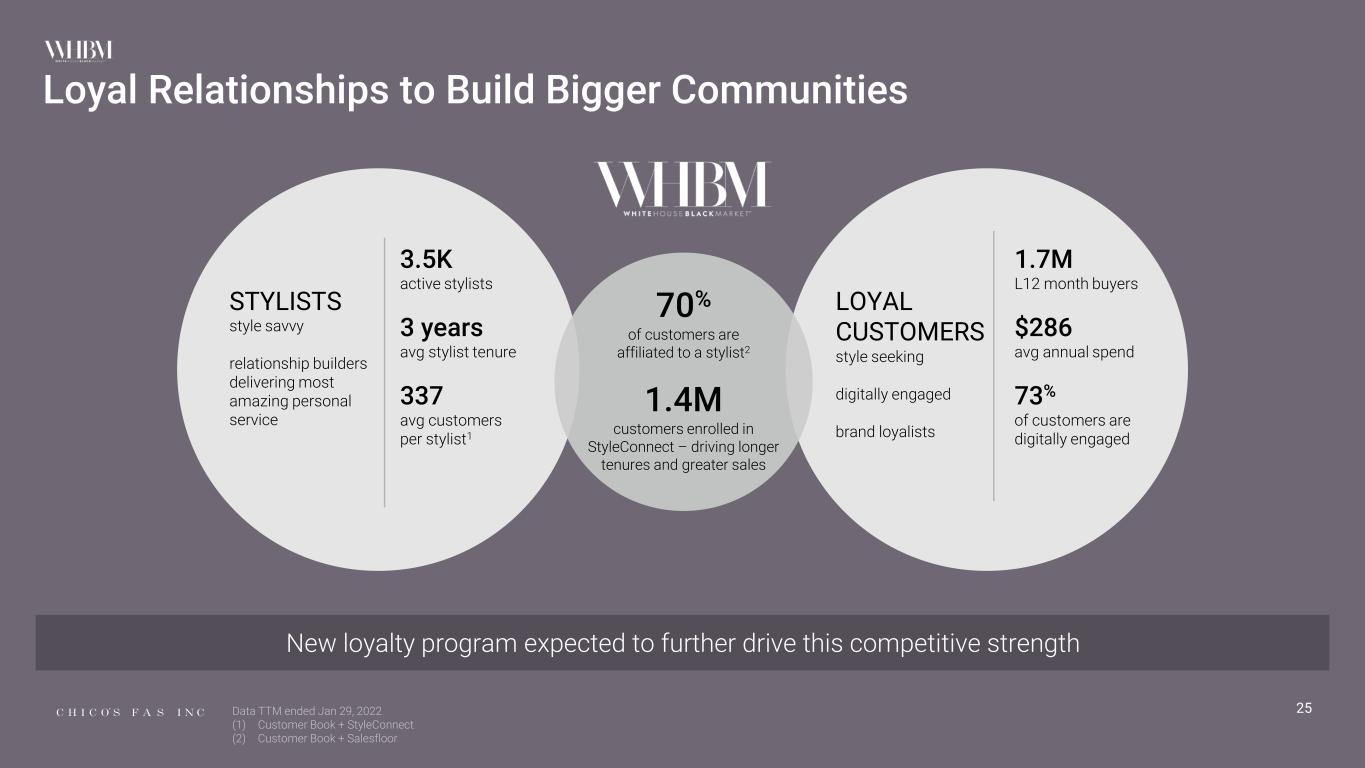
New loyalty program expected to further drive this competitive strength 25 Loyal Relationships to Build Bigger Communities 1.7M L12 month buyers $286 avg annual spend 73% of customers are digitally engaged 1.4M customers enrolled in StyleConnect – driving longer tenures and greater sales 3.5K active stylists 3 years avg stylist tenure 337 avg customers per stylist1 70% of customers are affiliated to a stylist2 STYLISTS style savvy relationship builders delivering most amazing personal service LOYAL CUSTOMERS style seeking digitally engaged brand loyalists Data TTM ended Jan 29, 2022 (1) Customer Book + StyleConnect (2) Customer Book + Salesfloor
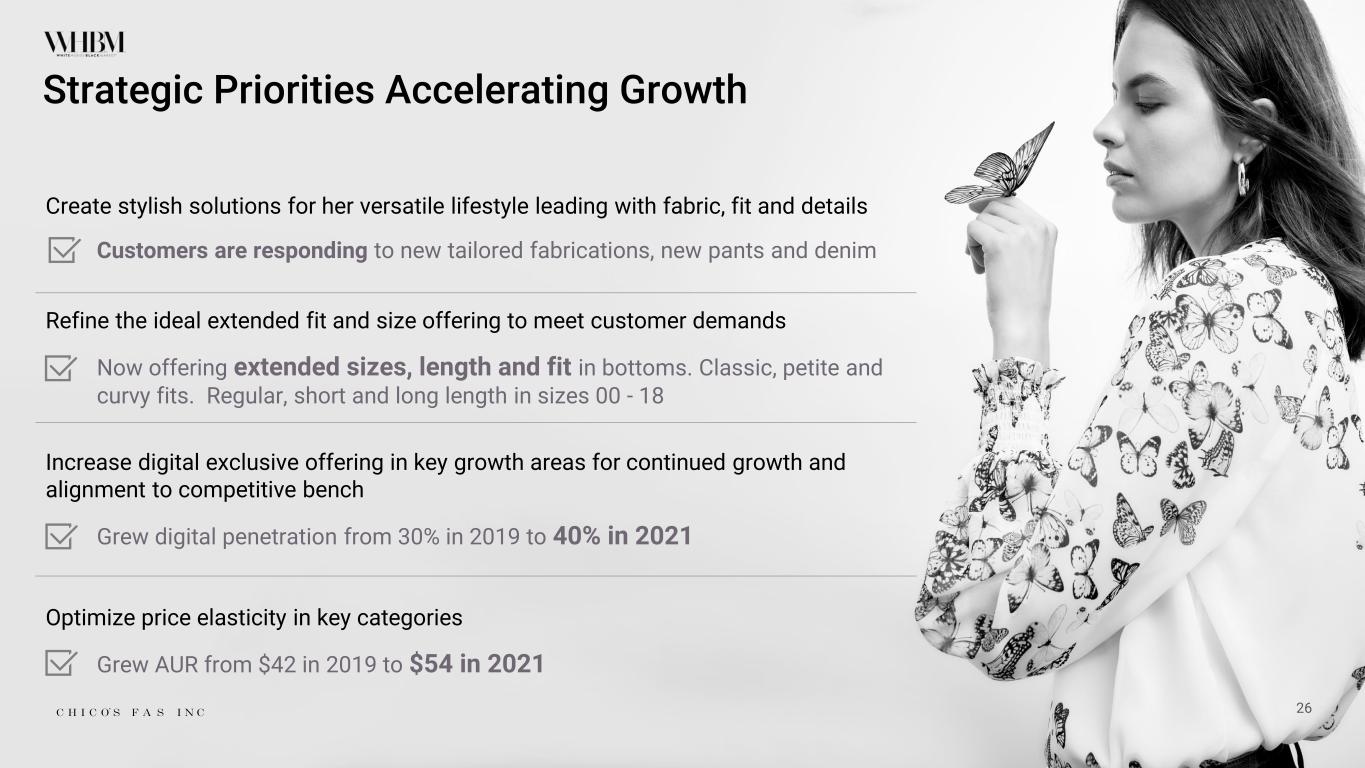
Strategic Priorities Accelerating Growth 26 Create stylish solutions for her versatile lifestyle leading with fabric, fit and details Customers are responding to new tailored fabrications, new pants and denim Refine the ideal extended fit and size offering to meet customer demands Now offering extended sizes, length and fit in bottoms. Classic, petite and curvy fits. Regular, short and long length in sizes 00 - 18 Increase digital exclusive offering in key growth areas for continued growth and alignment to competitive bench Grew digital penetration from 30% in 2019 to 40% in 2021 Optimize price elasticity in key categories Grew AUR from $42 in 2019 to $54 in 2021
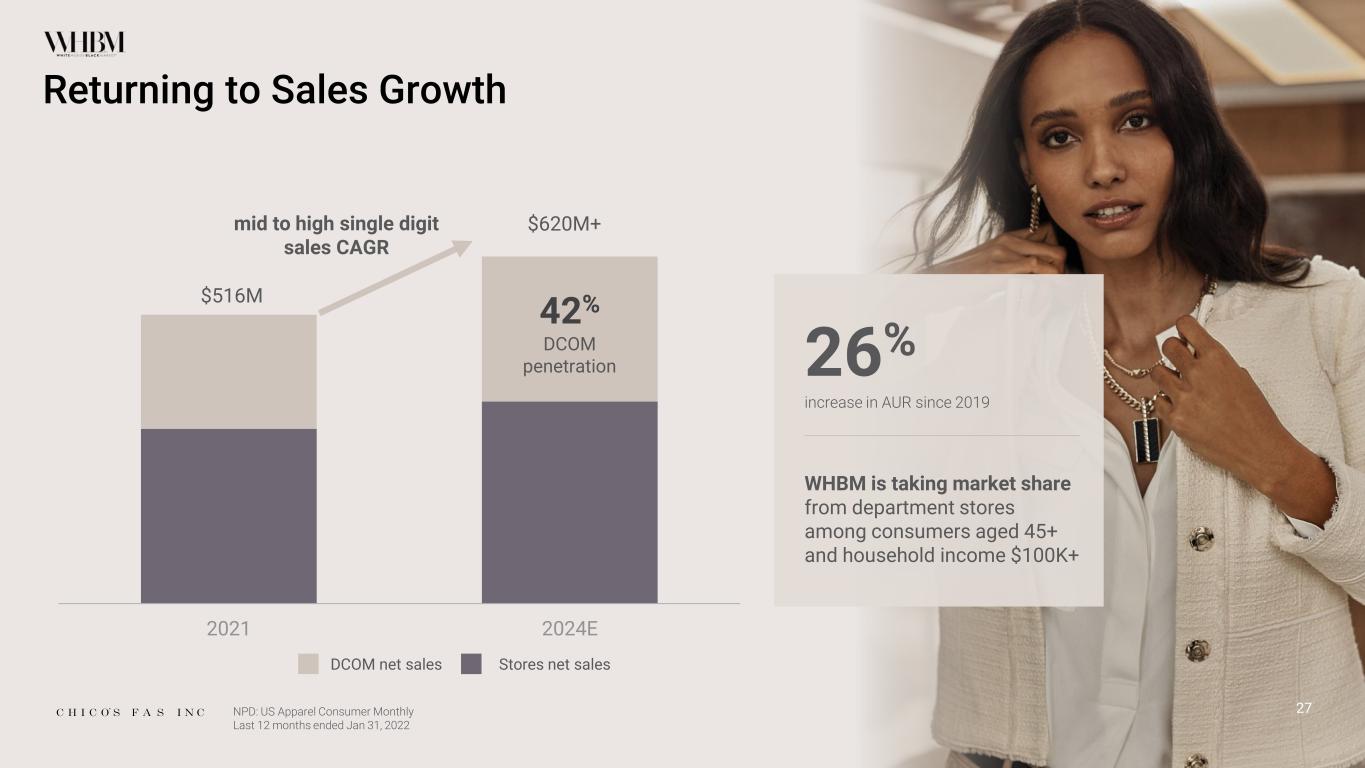
Returning to Sales Growth 27 26% increase in AUR since 2019 WHBM is taking market share from department stores among consumers aged 45+ and household income $100K+ DCOM net sales Stores net sales 2021 2024E mid to high single digit sales CAGR $516M $620M+ 42% DCOM penetration NPD: US Apparel Consumer Monthly Last 12 months ended Jan 31, 2022
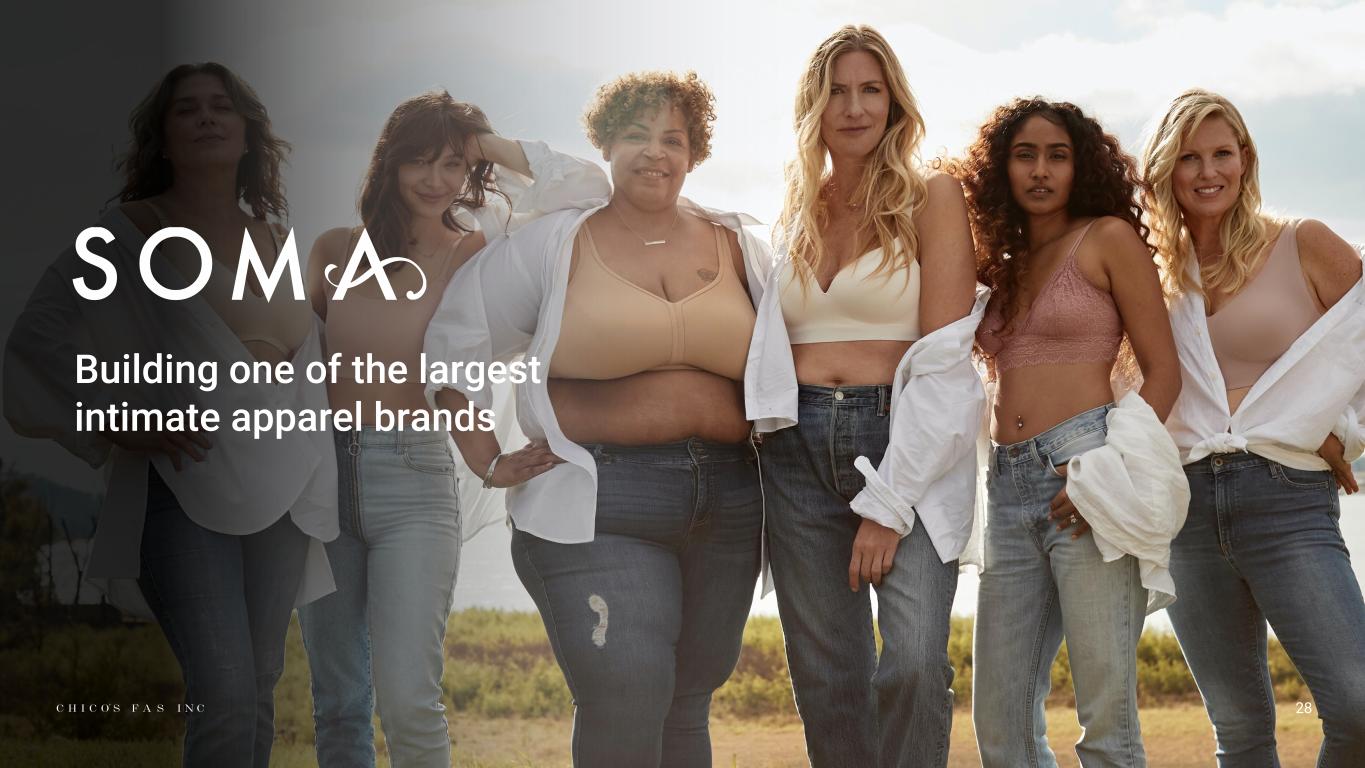
28 Building one of the largest intimate apparel brands
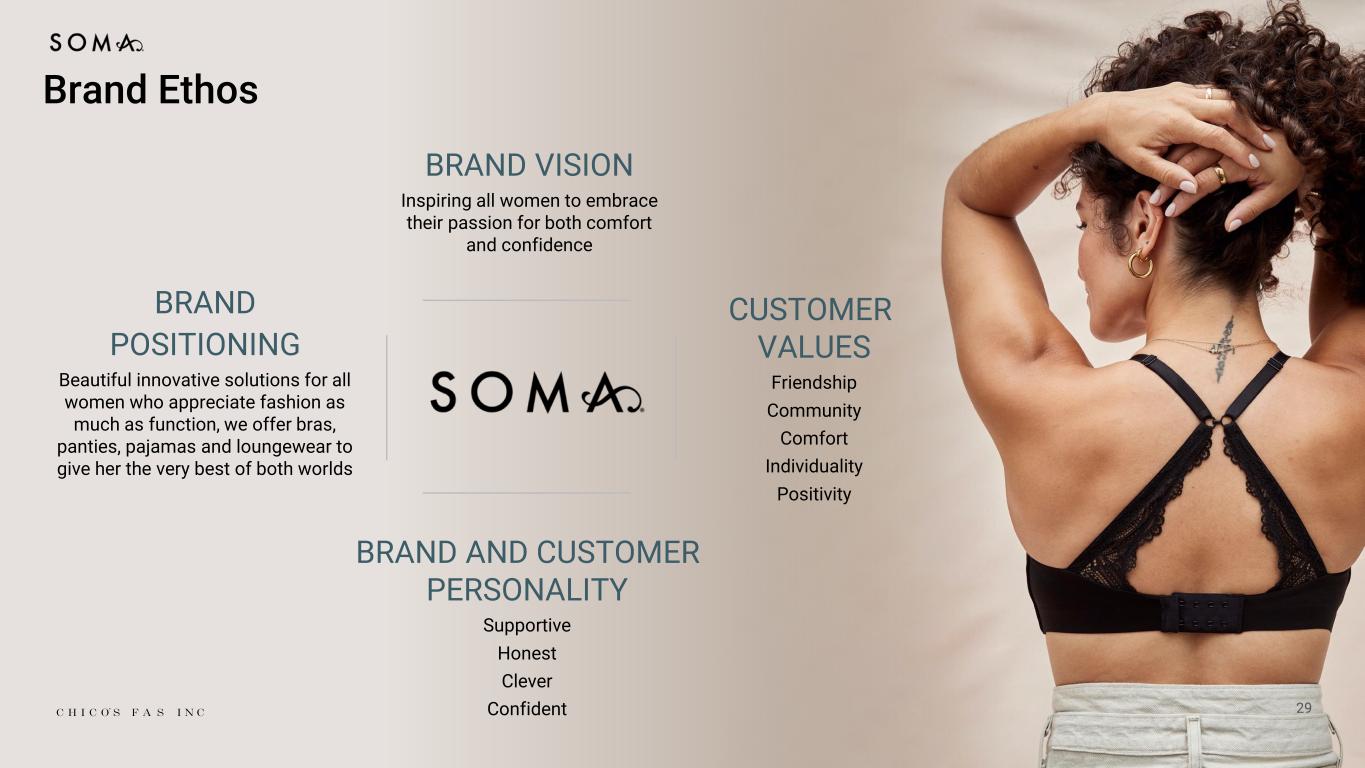
29 BRAND VISION Inspiring all women to embrace their passion for both comfort and confidence BRAND AND CUSTOMER PERSONALITY Supportive Honest Clever Confident CUSTOMER VALUES Friendship Community Comfort Individuality Positivity BRAND POSITIONING Beautiful innovative solutions for all women who appreciate fashion as much as function, we offer bras, panties, pajamas and loungewear to give her the very best of both worlds Brand Ethos
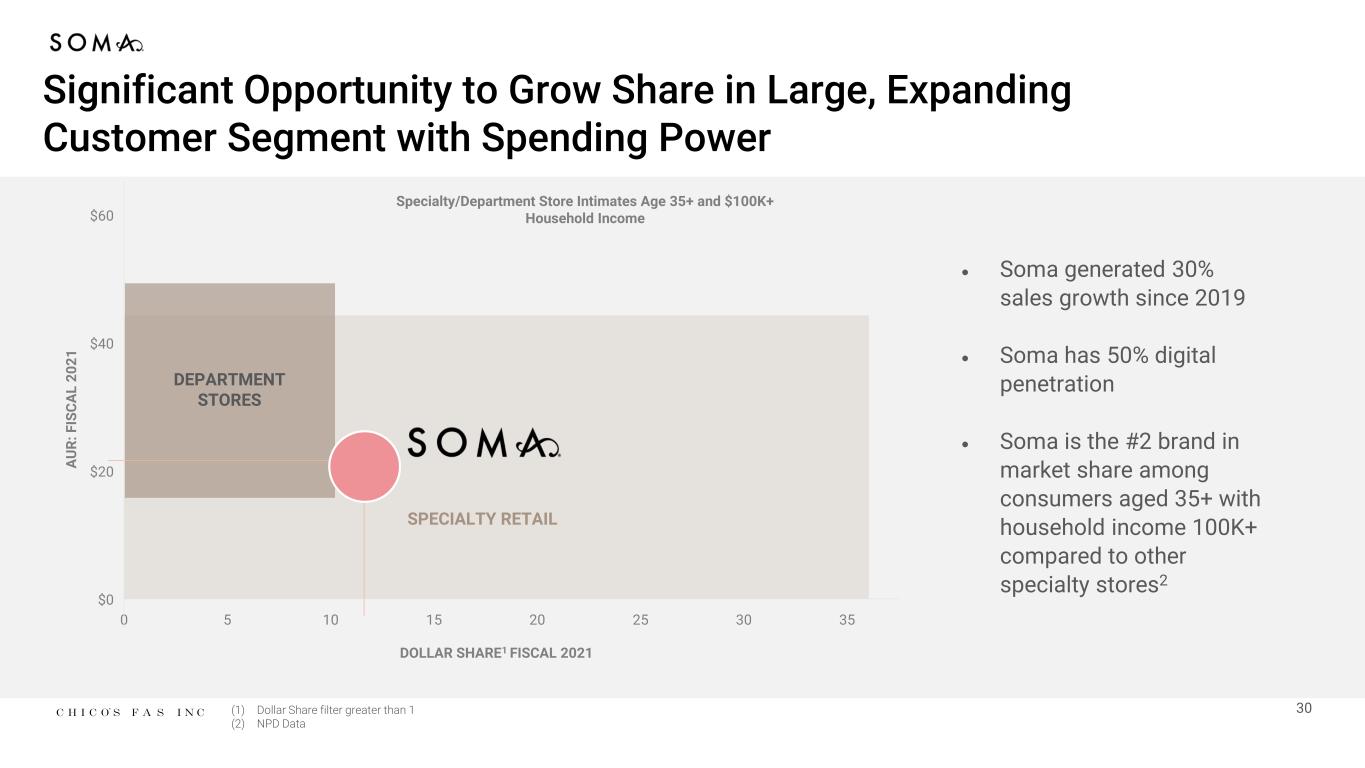
30 Significant Opportunity to Grow Share in Large, Expanding Customer Segment with Spending Power DEPARTMENT STORES $60 $40 $20 $0 DOLLAR SHARE1 FISCAL 2021 0 5 10 15 20 25 30 35 (1) Dollar Share filter greater than 1 (2) NPD Data SPECIALTY RETAIL A U R : F IS C A L 2 0 2 1 • Soma generated 30% sales growth since 2019 • Soma has 50% digital penetration • Soma is the #2 brand in market share among consumers aged 35+ with household income 100K+ compared to other specialty stores2 Specialty/Department Store Intimates Age 35+ and $100K+ Household Income
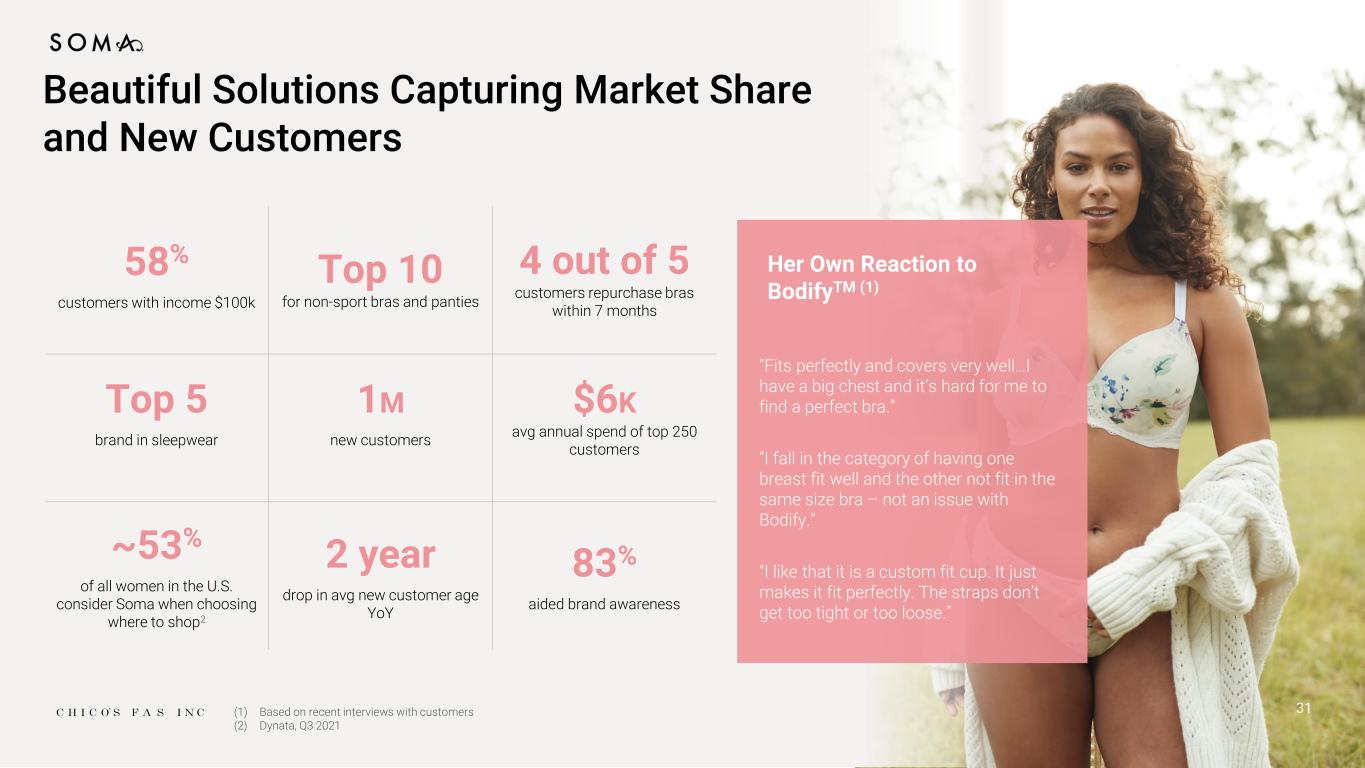
Beautiful Solutions Capturing Market Share and New Customers 58% customers with income $100k Top 10 for non-sport bras and panties 4 out of 5 customers repurchase bras within 7 months Top 5 brand in sleepwear 1M new customers $6K avg annual spend of top 250 customers ~53% of all women in the U.S. consider Soma when choosing where to shop2 2 year drop in avg new customer age YoY 83% aided brand awareness “Fits perfectly and covers very well…I have a big chest and it’s hard for me to find a perfect bra.” “I fall in the category of having one breast fit well and the other not fit in the same size bra – not an issue with Bodify.” “I like that it is a custom fit cup. It just makes it fit perfectly. The straps don’t get too tight or too loose.” 31 Her Own Reaction to BodifyTM (1) (1) Based on recent interviews with customers (2) Dynata, Q3 2021
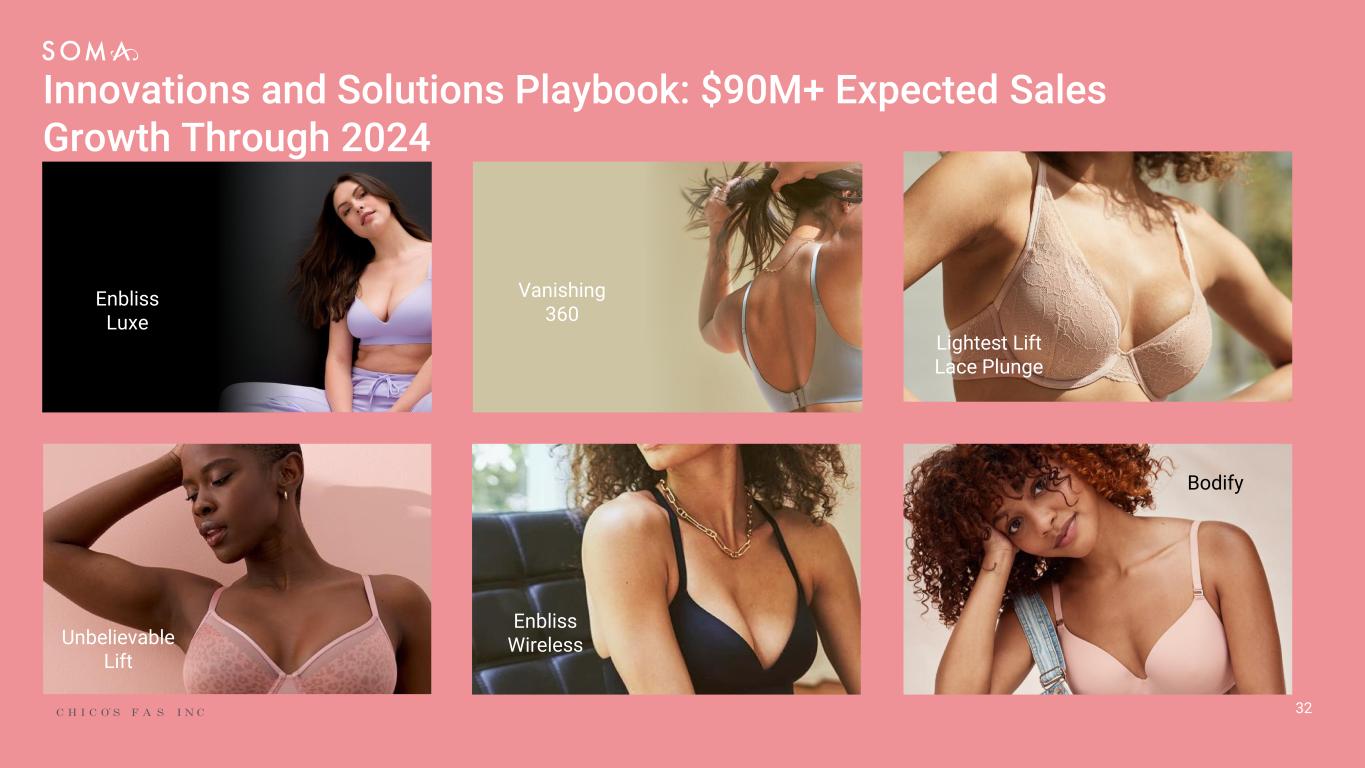
Enbliss Luxe 32 Innovations and Solutions Playbook: $90M+ Expected Sales Growth Through 2024 Enbliss WirelessUnbelievable Lift Vanishing 360 Bodify Lightest Lift Lace Plunge
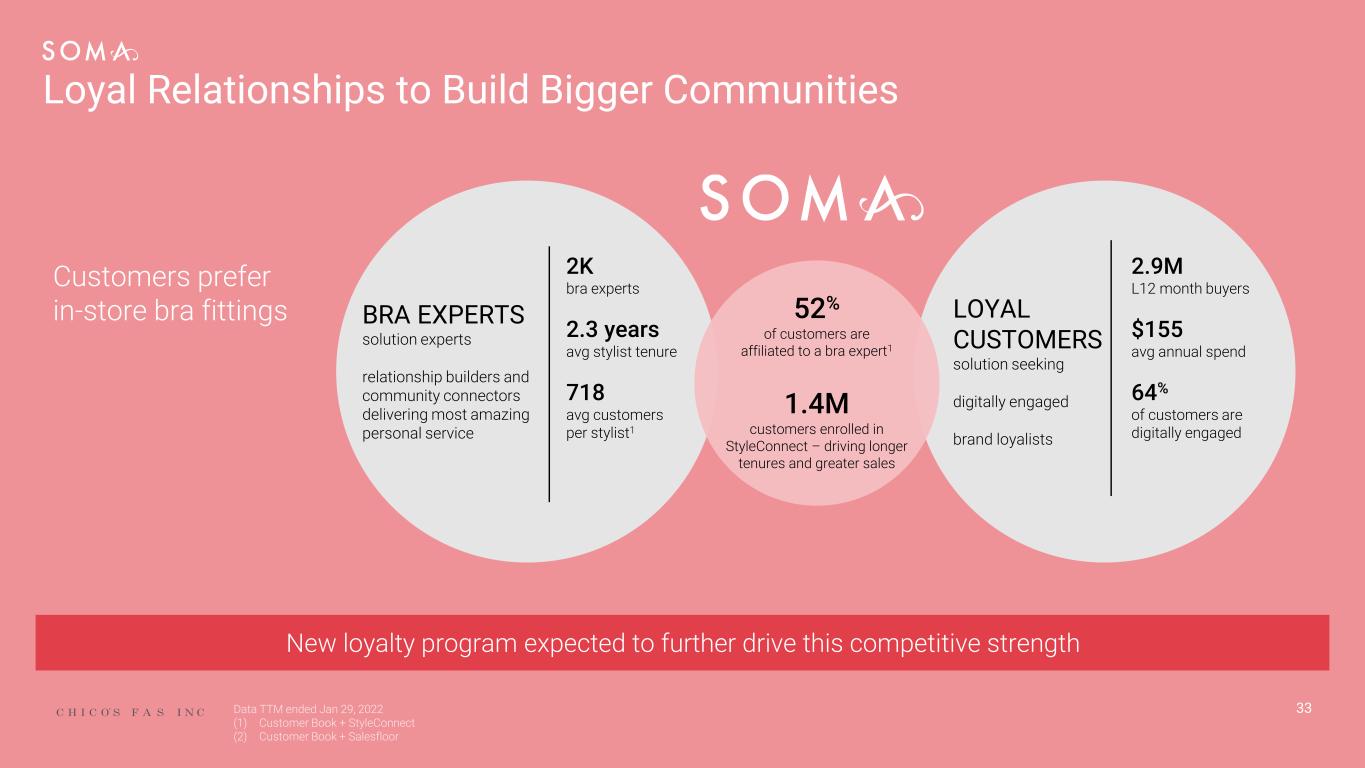
New loyalty program expected to further drive this competitive strength 33 Loyal Relationships to Build Bigger Communities Customers prefer in-store bra fittings 2.9M L12 month buyers $155 avg annual spend 64% of customers are digitally engaged BRA EXPERTS solution experts relationship builders and community connectors delivering most amazing personal service LOYAL CUSTOMERS solution seeking digitally engaged brand loyalists 1.4M customers enrolled in StyleConnect – driving longer tenures and greater sales 2K bra experts 2.3 years avg stylist tenure 718 avg customers per stylist1 52% of customers are affiliated to a bra expert1 Data TTM ended Jan 29, 2022 (1) Customer Book + StyleConnect (2) Customer Book + Salesfloor
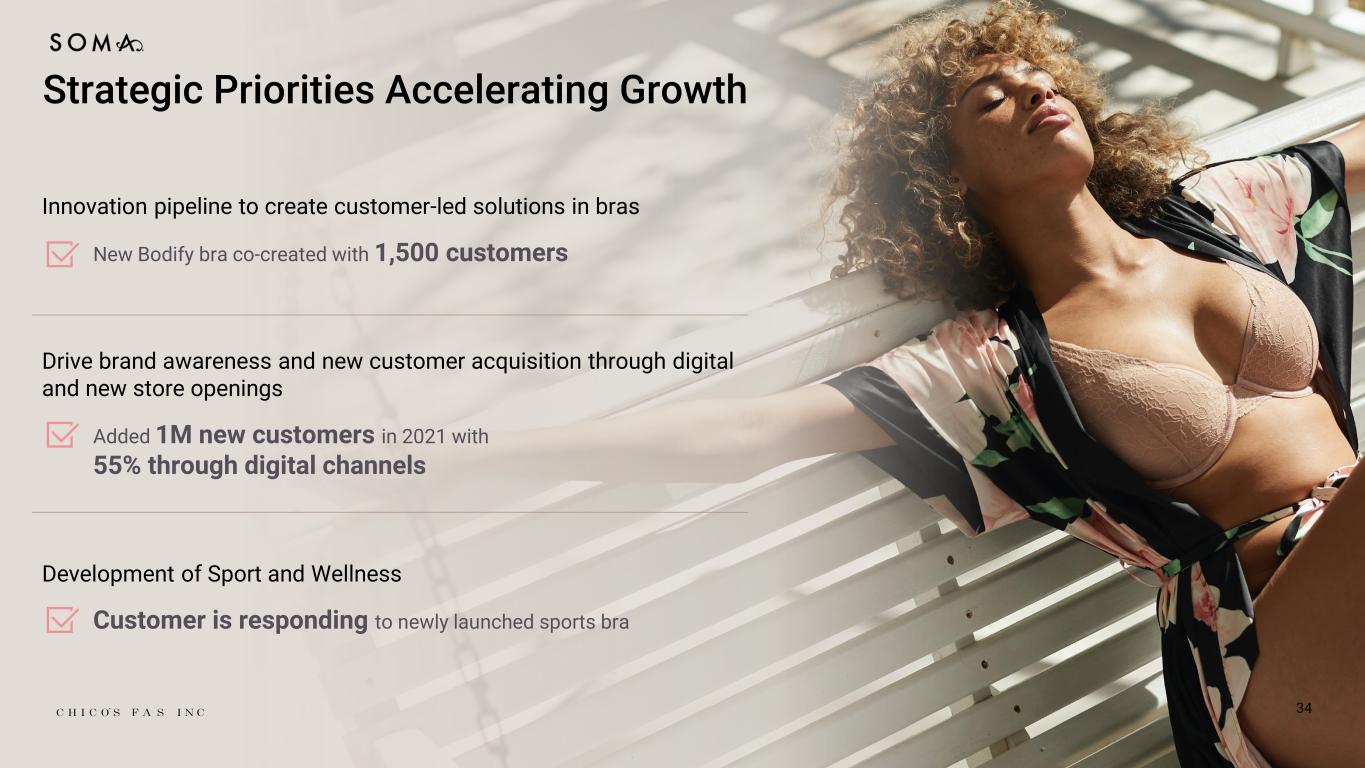
34 Strategic Priorities Accelerating Growth Innovation pipeline to create customer-led solutions in bras New Bodify bra co-created with 1,500 customers Drive brand awareness and new customer acquisition through digital and new store openings Added 1M new customers in 2021 with 55% through digital channels Development of Sport and Wellness Customer is responding to newly launched sports bra
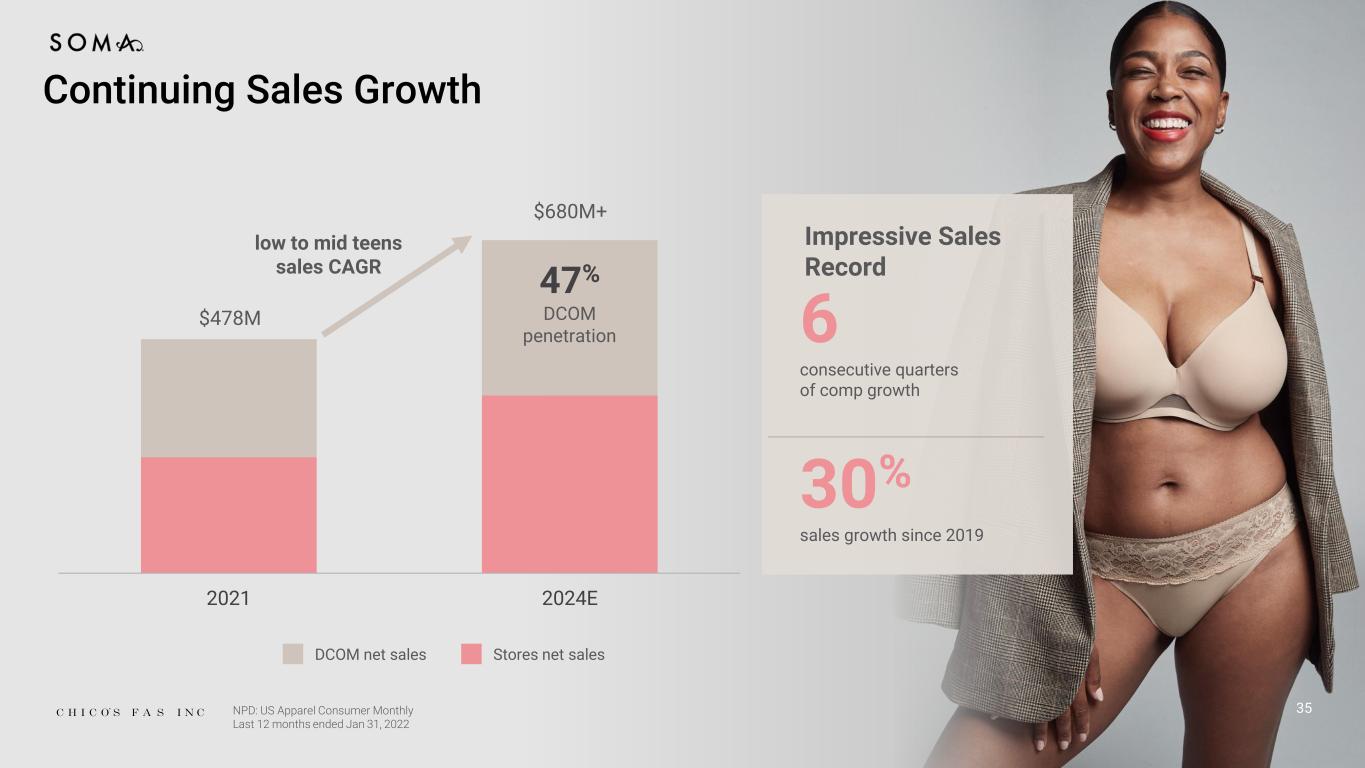
Continuing Sales Growth 35 Impressive Sales Record 6 consecutive quarters of comp growth 30% sales growth since 2019 DCOM net sales Stores net sales 2021 2024E low to mid teens sales CAGR $478M $680M+ 47% DCOM penetration NPD: US Apparel Consumer Monthly Last 12 months ended Jan 31, 2022

36 Digital First Jay Topper Chief Digital Officer
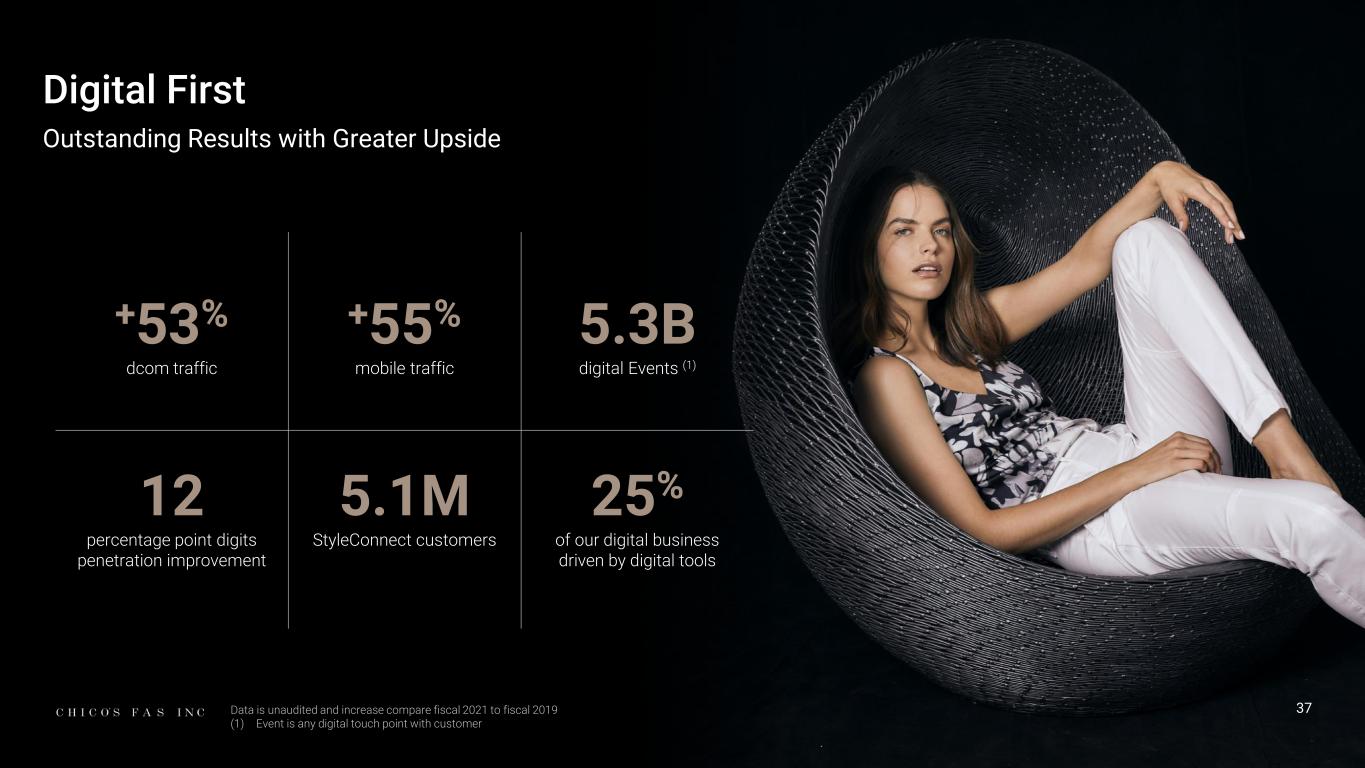
37 Digital First Outstanding Results with Greater Upside Data is unaudited and increase compare fiscal 2021 to fiscal 2019 (1) Event is any digital touch point with customer +53% dcom traffic +55% mobile traffic 5.3B digital Events (1) 12 percentage point digits penetration improvement 5.1M StyleConnect customers 25% of our digital business driven by digital tools
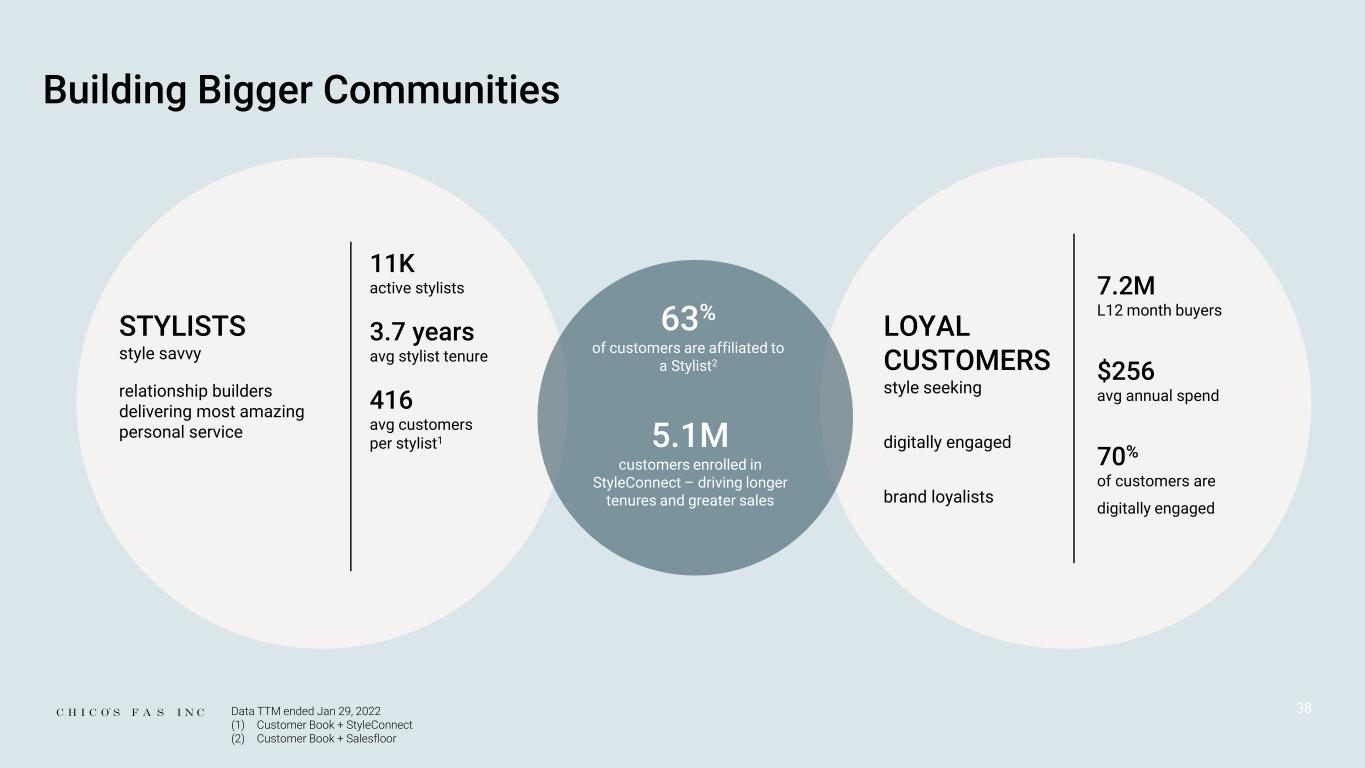
Data TTM ended Jan 29, 2022 (1) Customer Book + StyleConnect (2) Customer Book + Salesfloor 38 Building Bigger Communities 7.2M L12 month buyers $256 avg annual spend 70% of customers are digitally engaged STYLISTS style savvy relationship builders delivering most amazing personal service LOYAL CUSTOMERS style seeking digitally engaged brand loyalists 5.1M customers enrolled in StyleConnect – driving longer tenures and greater sales 11K active stylists 3.7 years avg stylist tenure 416 avg customers per stylist1 63% of customers are affiliated to a Stylist2
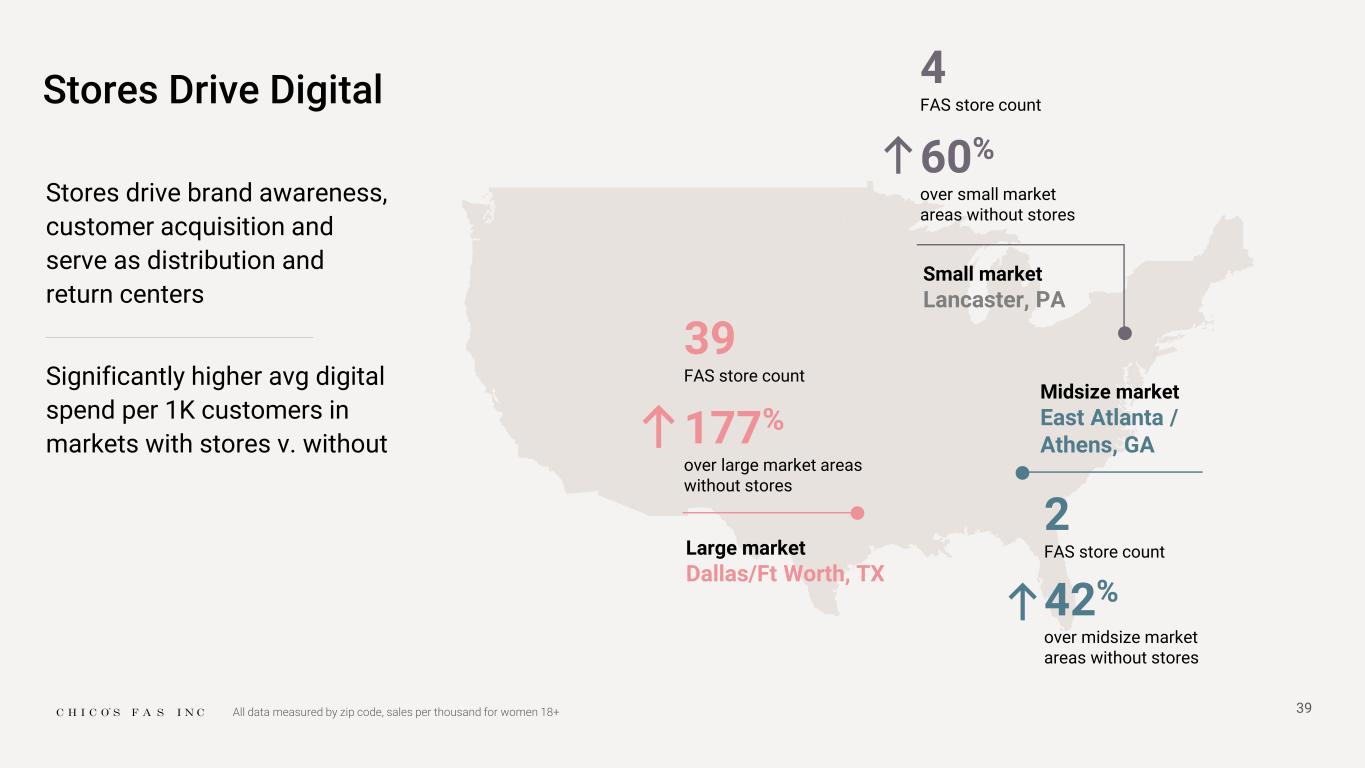
Stores drive brand awareness, customer acquisition and serve as distribution and return centers Significantly higher avg digital spend per 1K customers in markets with stores v. without 39 Stores Drive Digital Large market Dallas/Ft Worth, TX 39 FAS store count 177% over large market areas without stores Midsize market East Atlanta / Athens, GA 2 FAS store count 42% over midsize market areas without stores Small market Lancaster, PA 4 FAS store count 60% over small market areas without stores All data measured by zip code, sales per thousand for women 18+
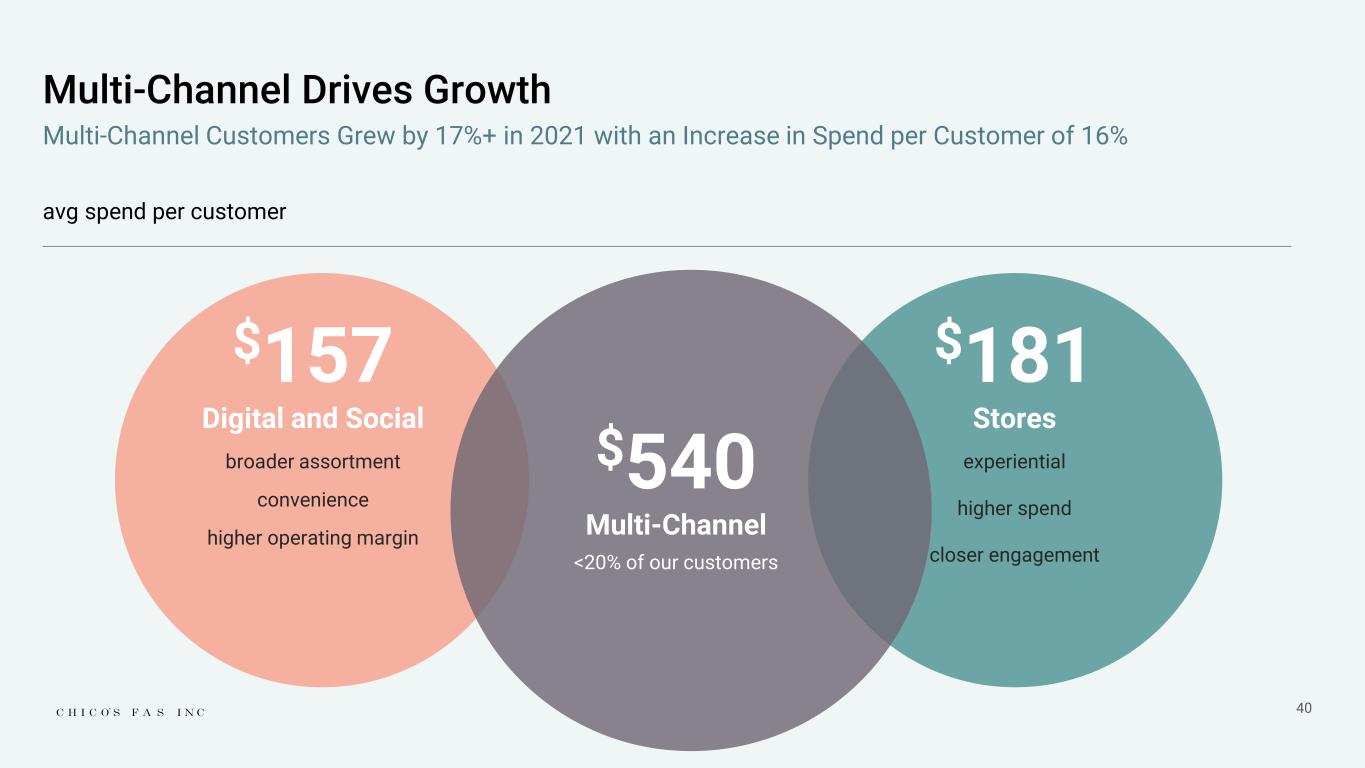
40 Multi-Channel Drives Growth avg spend per customer $157 Digital and Social broader assortment convenience higher operating margin $540 Multi-Channel <20% of our customers $181 Stores experiential higher spend closer engagement Multi-Channel Customers Grew by 17%+ in 2021 with an Increase in Spend per Customer of 16%
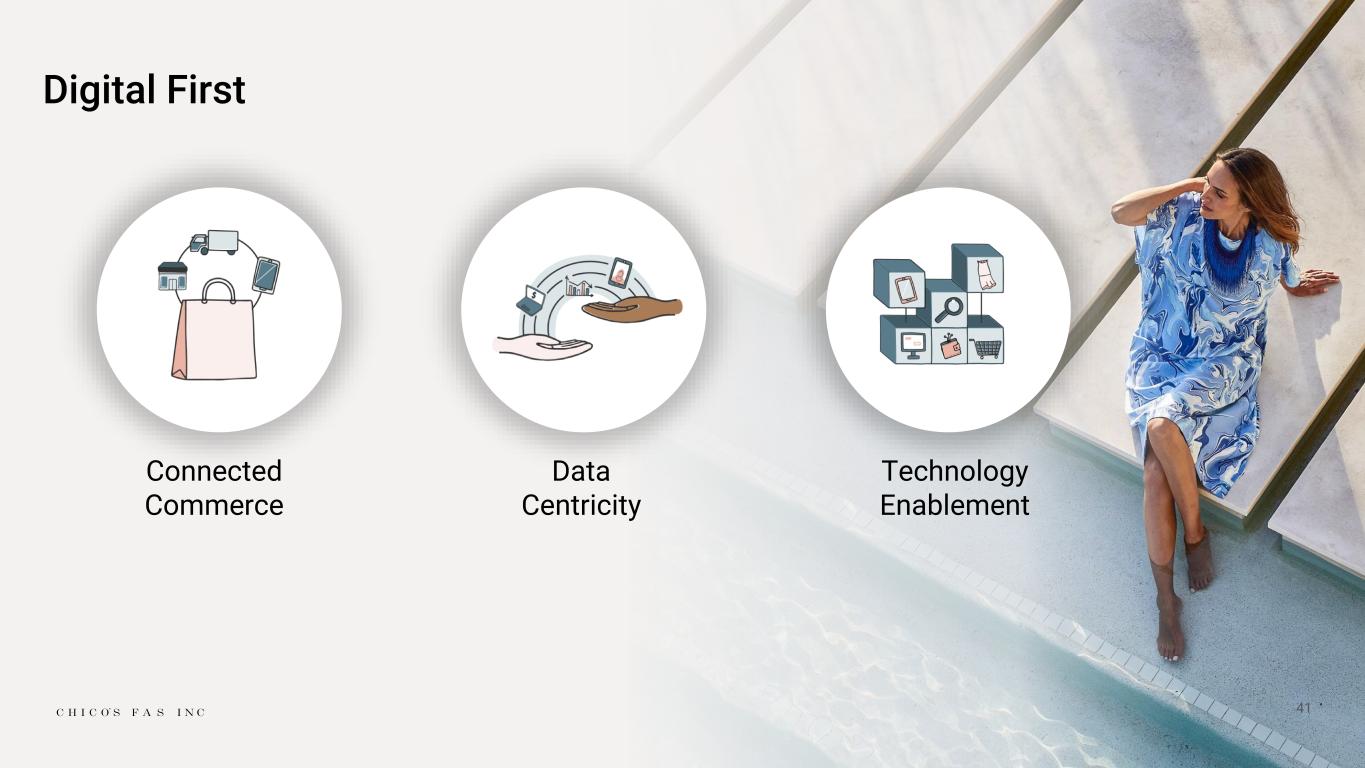
41 Digital First Data Centricity Technology Enablement Connected Commerce

42 Connected Commerce Outstanding Results Today… The positioning of each brand realized at every touch point For women who have grown to know themselves, we always have something new and unique just for them For women who understand and accept their duality, we offer fashion infused with designer details that are as surprising as she is Beautiful innovative solutions for all women who appreciate fashion as much as function, we offer bras, panties, pajamas and loungewear to give her the very best of both worlds
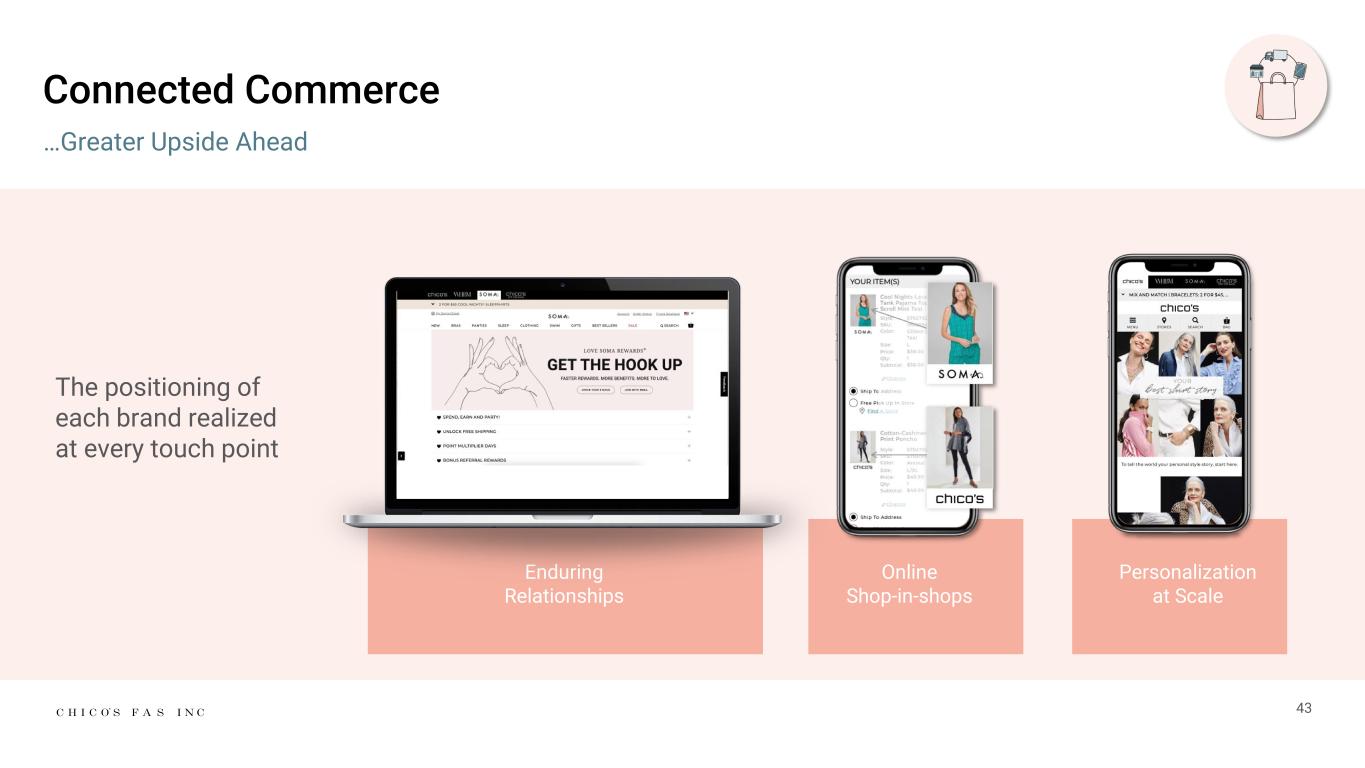
43 Connected Commerce …Greater Upside Ahead Enduring Relationships Online Shop-in-shops Personalization at Scale The positioning of each brand realized at every touch point
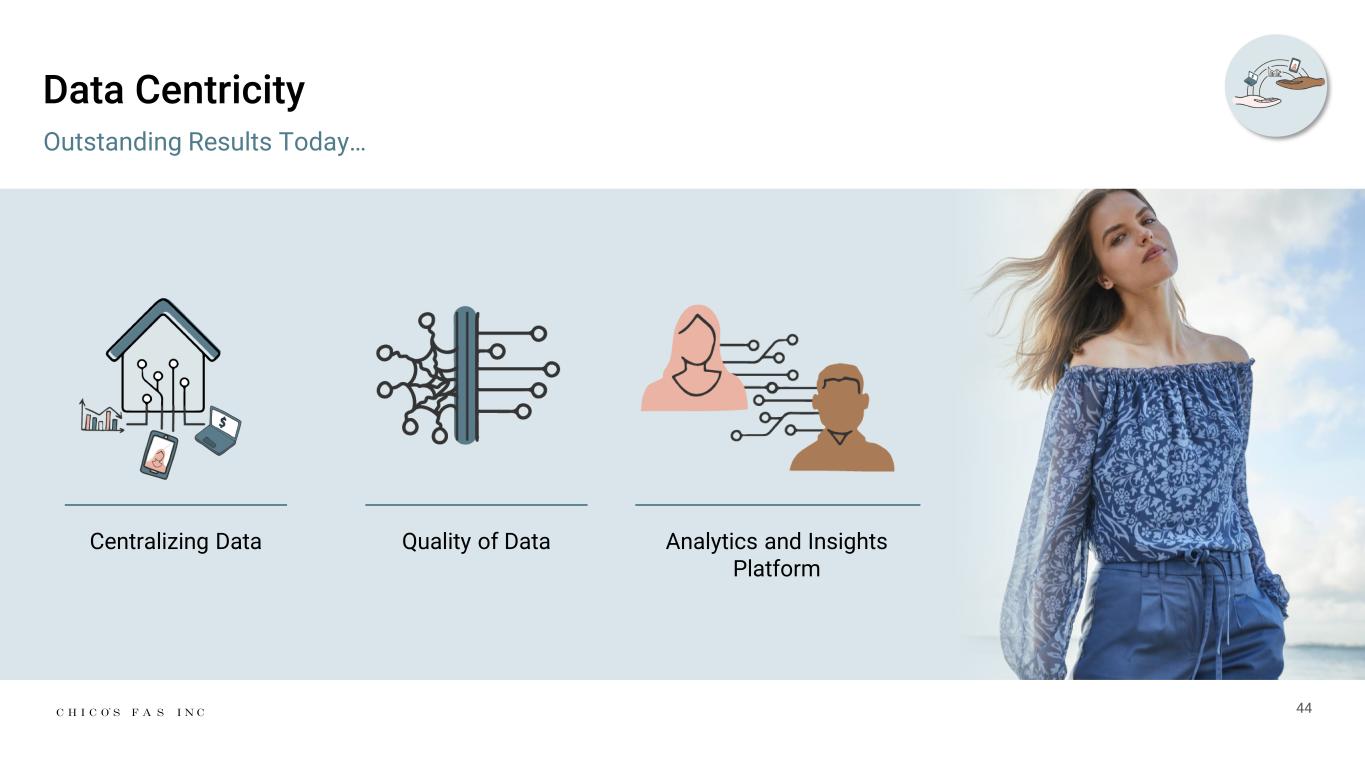
44 Data Centricity Outstanding Results Today… Centralizing Data Quality of Data Analytics and Insights Platform
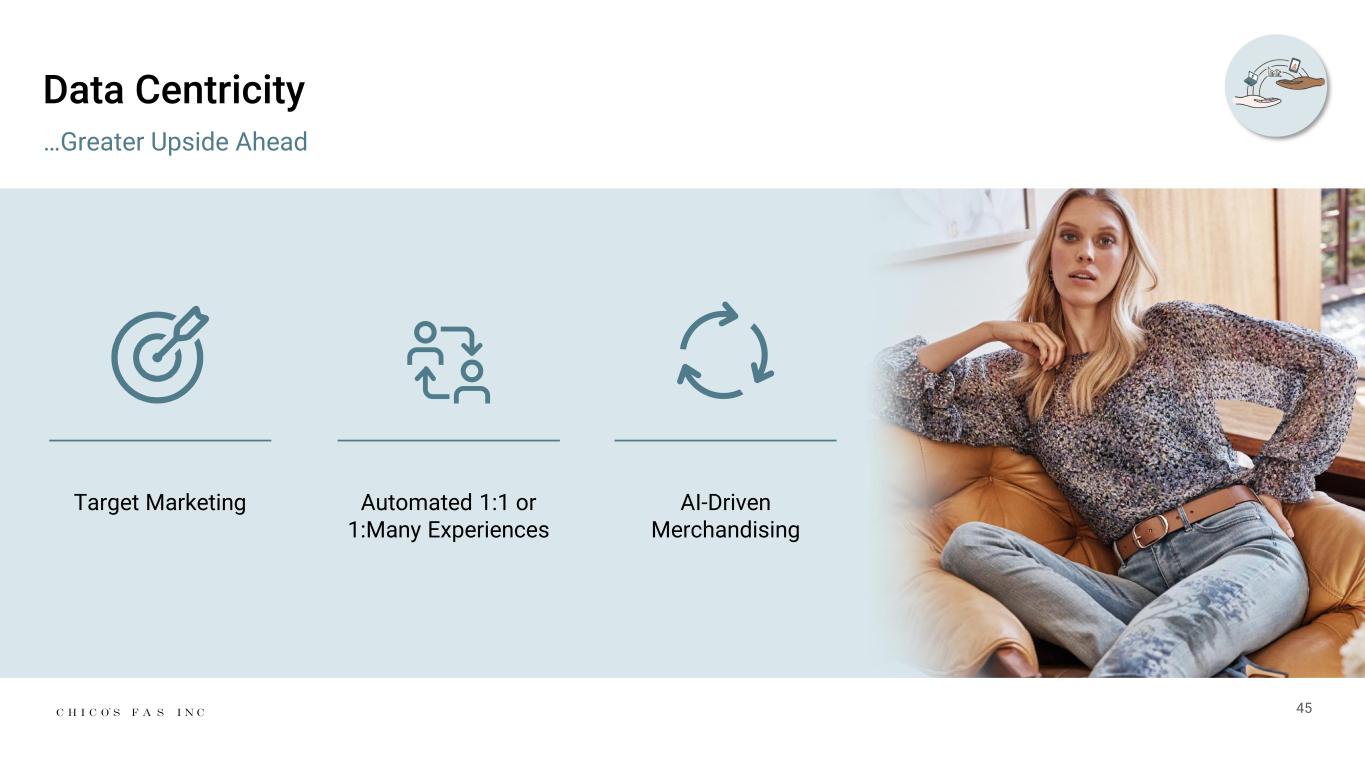
45 Data Centricity …Greater Upside Ahead Target Marketing Automated 1:1 or 1:Many Experiences AI-Driven Merchandising
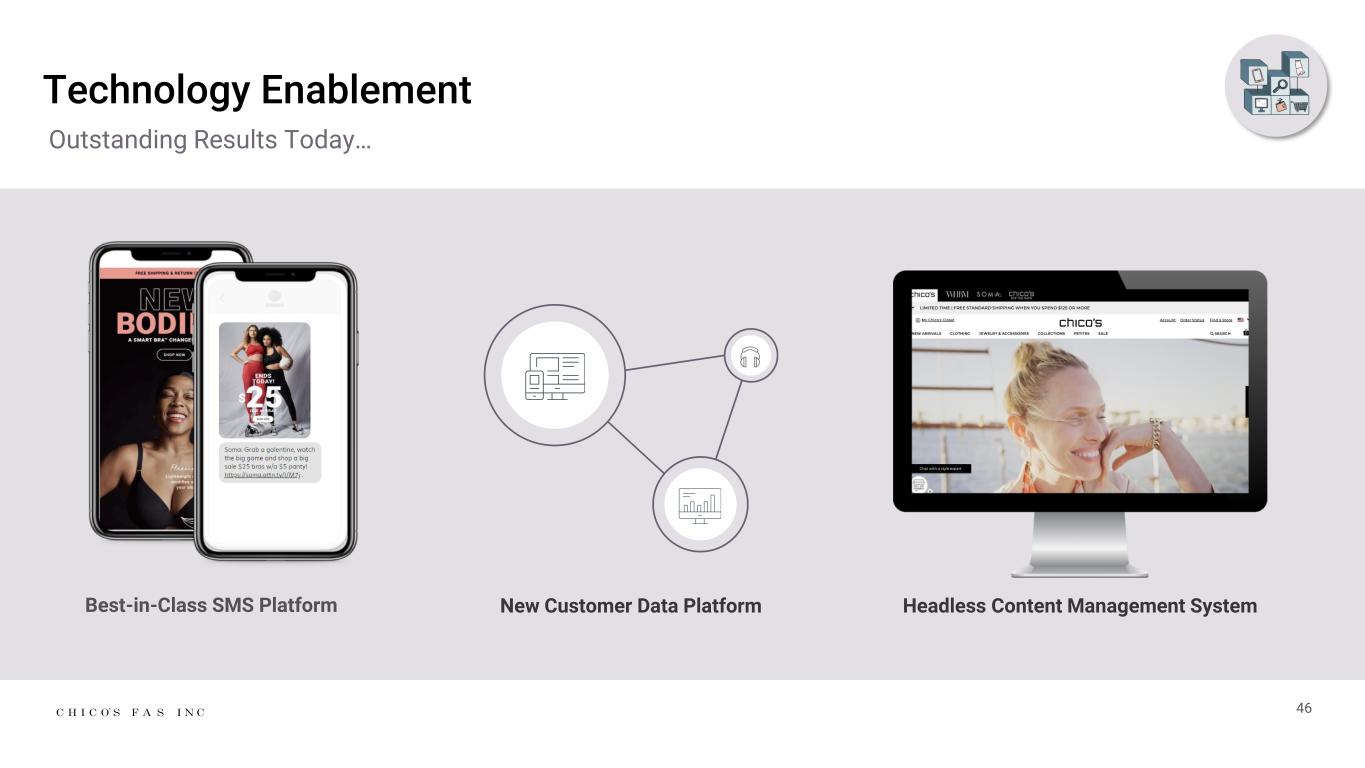
46 Technology Enablement Outstanding Results Today… Best-in-Class SMS Platform New Customer Data Platform Headless Content Management System

47 Technology Enablement Modular Composable Tech Stack AI-Aided Customer Service Enhanced Merchandising Systems …Greater Upside Ahead Payment Identity Management Product Catalog Checkout Promotions Frontend Management Shopping Cart Loyalty Content Management Reviews and Ratings Store Locator Order Management Analytics Support
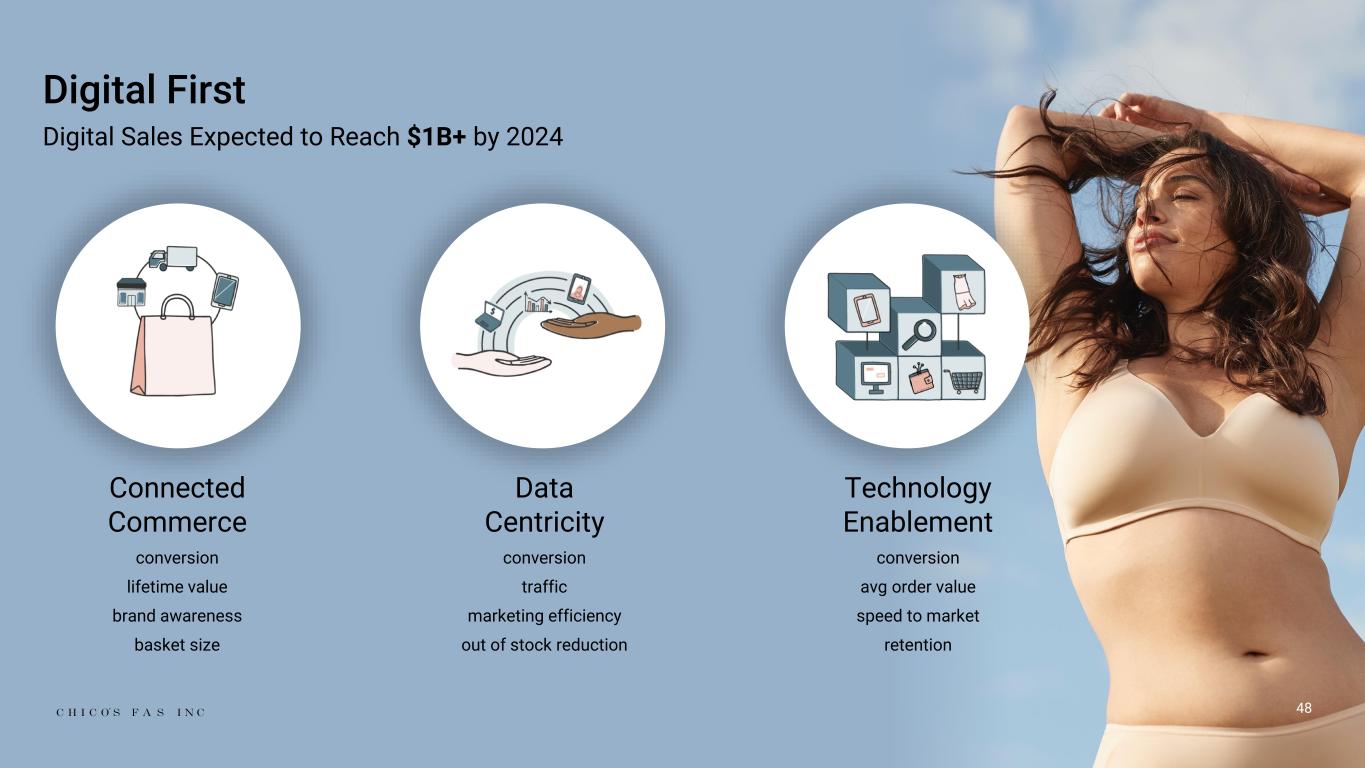
Digital First Data Centricity conversion traffic marketing efficiency out of stock reduction Technology Enablement conversion avg order value speed to market retention Connected Commerce conversion lifetime value brand awareness basket size Digital Sales Expected to Reach $1B+ by 2024 48
49 Culture and ESG Kristin Gwinner Chief Human Resources Officer
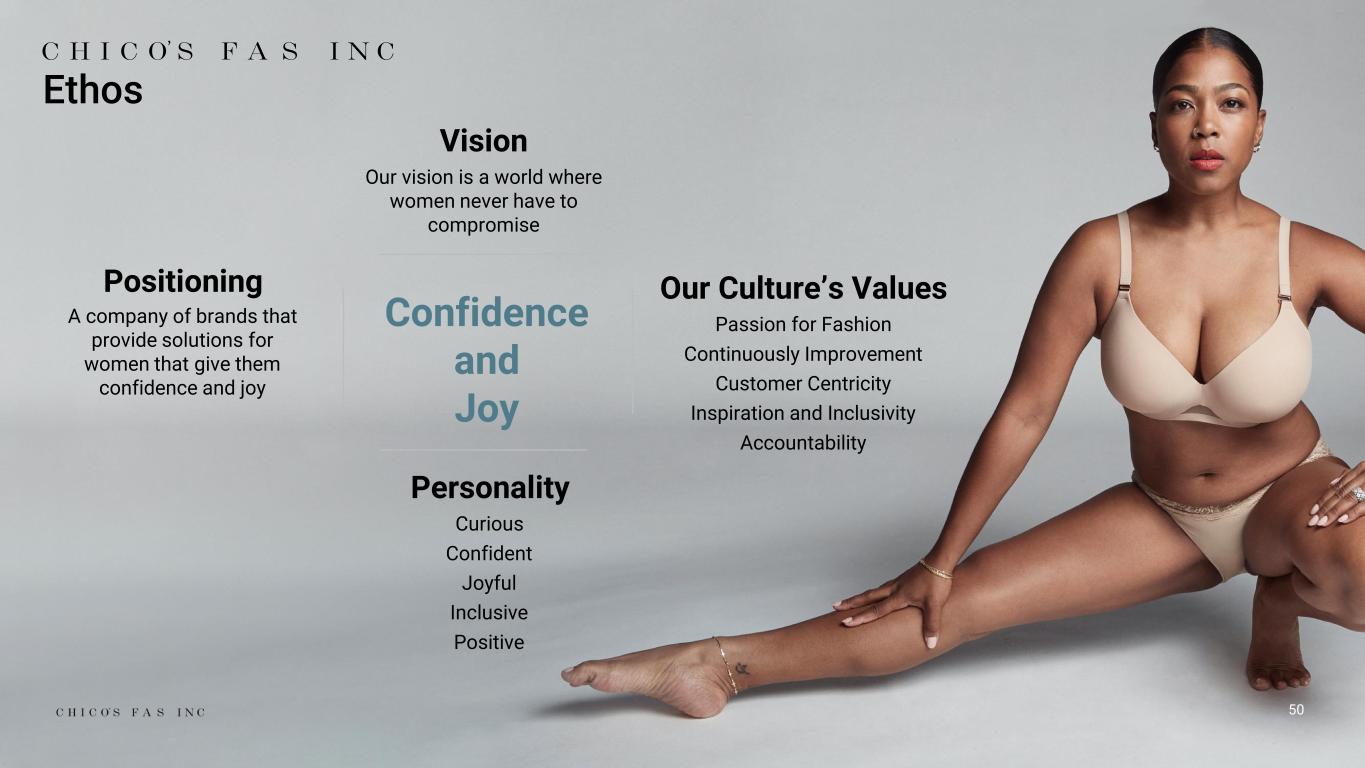
Confidence and Joy Vision Our vision is a world where women never have to compromise Personality Curious Confident Joyful Inclusive Positive Our Culture’s Values Passion for Fashion Continuously Improvement Customer Centricity Inspiration and Inclusivity Accountability Positioning A company of brands that provide solutions for women that give them confidence and joy 50 Ethos
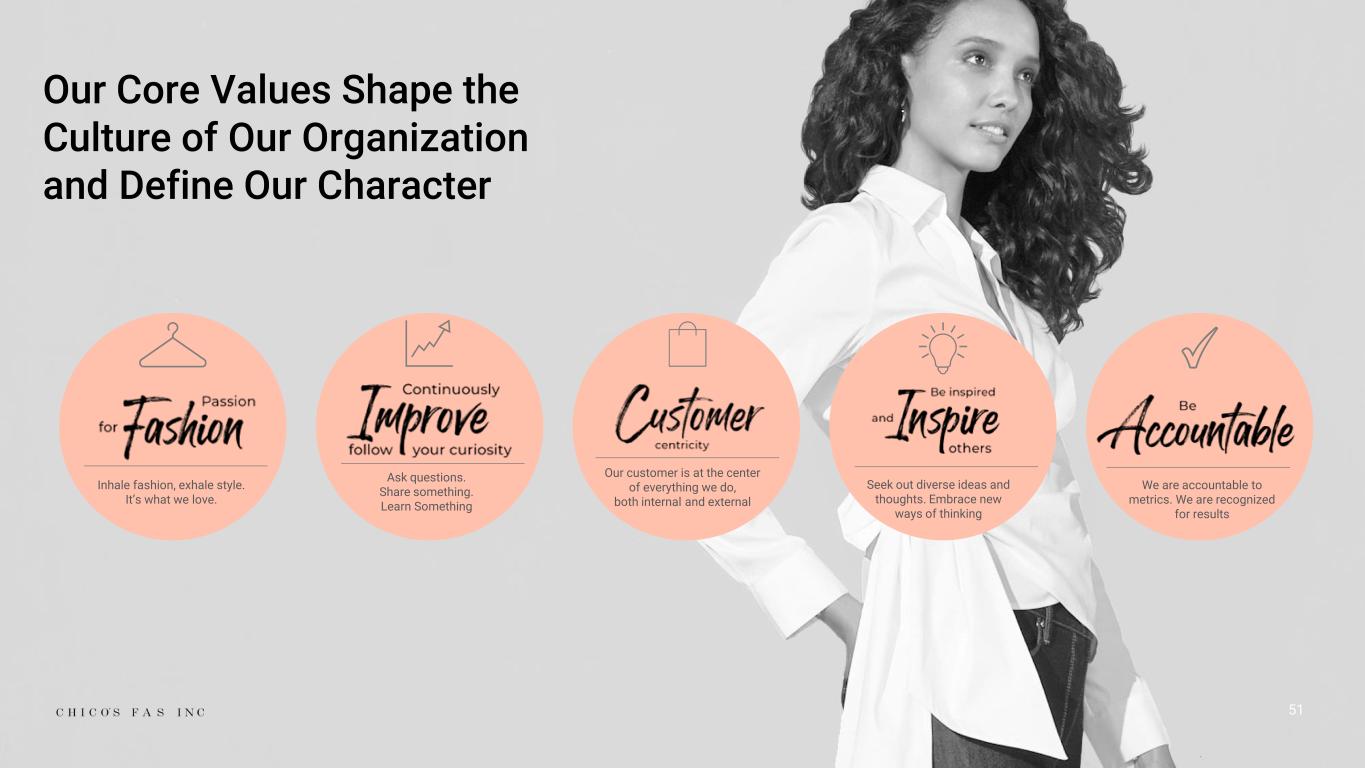
Our Core Values Shape the Culture of Our Organization and Define Our Character 51 Inhale fashion, exhale style. It’s what we love. Ask questions. Share something. Learn Something Our customer is at the center of everything we do, both internal and external Seek out diverse ideas and thoughts. Embrace new ways of thinking We are accountable to metrics. We are recognized for results
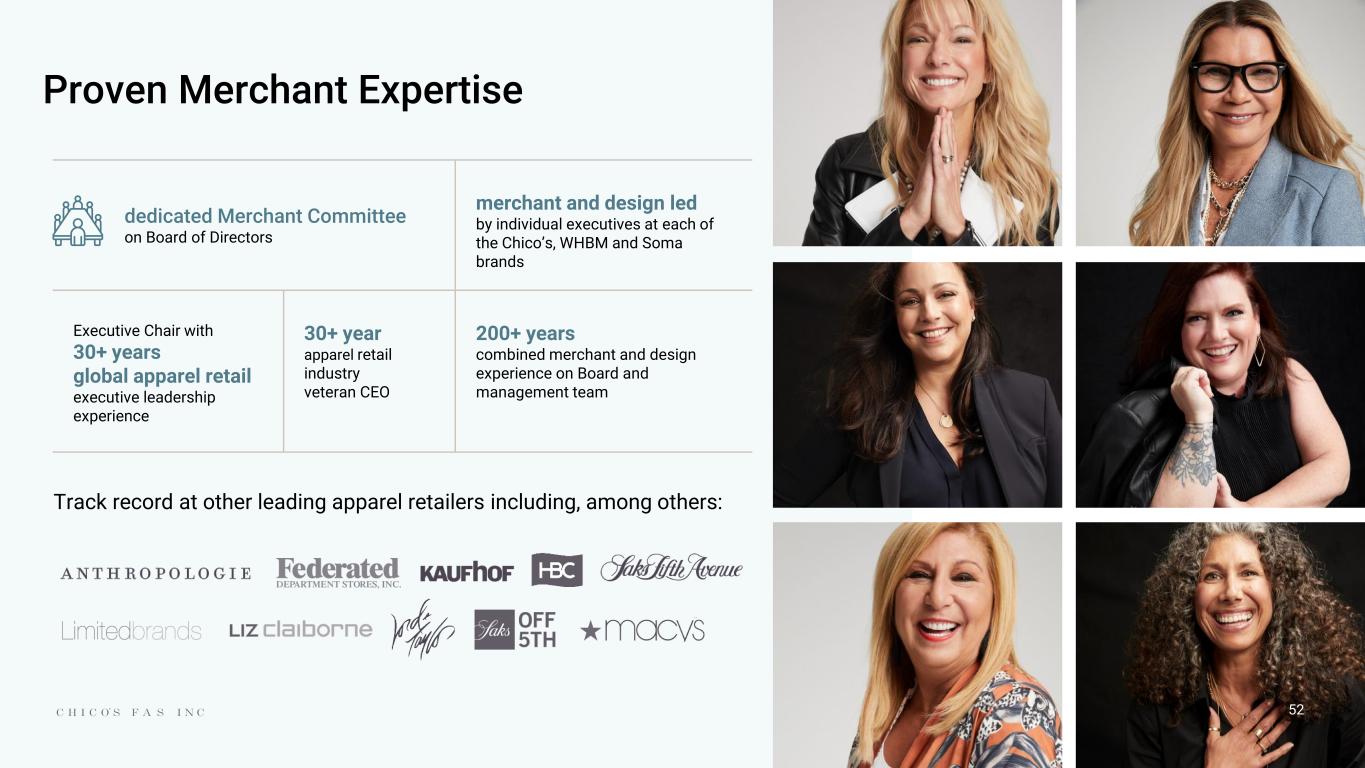
Proven Merchant Expertise dedicated Merchant Committee on Board of Directors merchant and design led by individual executives at each of the Chico’s, WHBM and Soma brands Executive Chair with 30+ years global apparel retail executive leadership experience 30+ year apparel retail industry veteran CEO 200+ years combined merchant and design experience on Board and management team Track record at other leading apparel retailers including, among others: 52
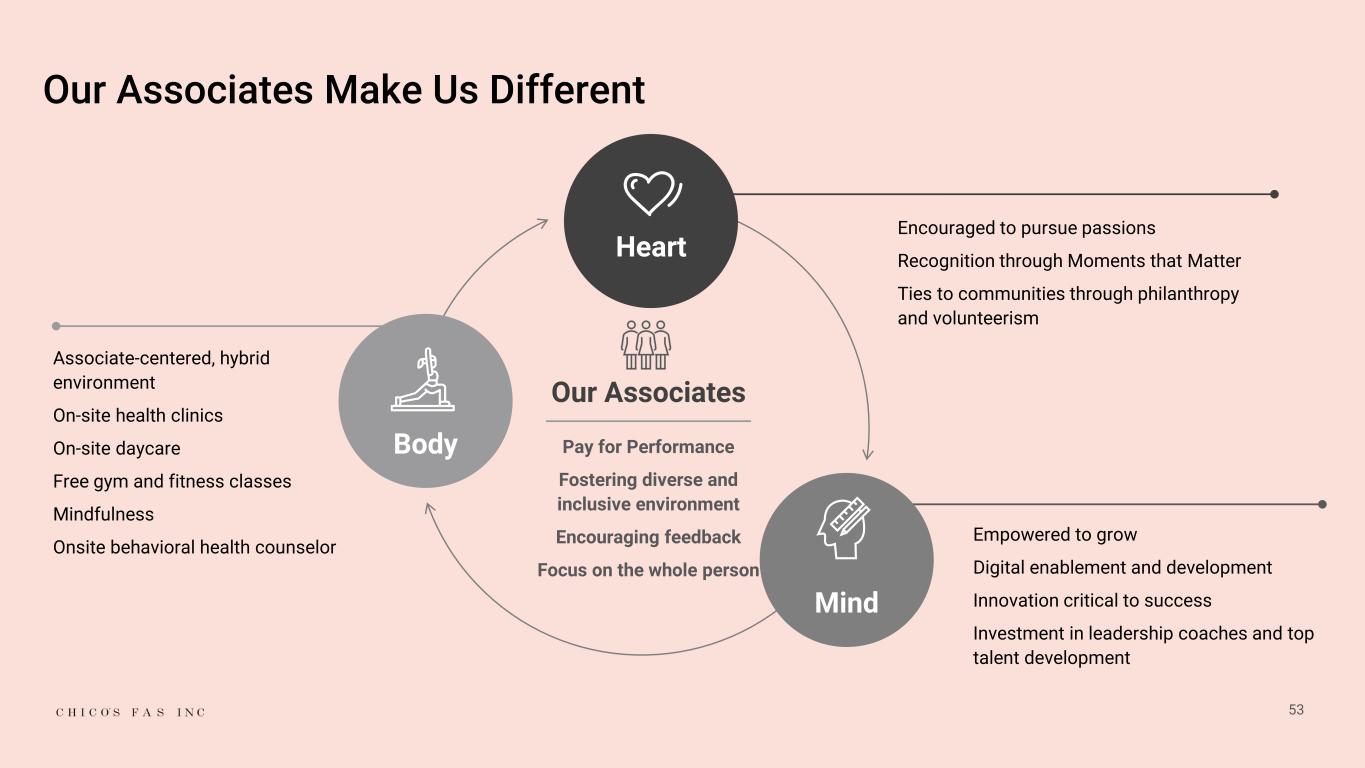
Encouraged to pursue passions Recognition through Moments that Matter Ties to communities through philanthropy and volunteerism Associate-centered, hybrid environment On-site health clinics On-site daycare Free gym and fitness classes Mindfulness Onsite behavioral health counselor Empowered to grow Digital enablement and development Innovation critical to success Investment in leadership coaches and top talent development Heart Mind Body 53 Our Associates Pay for Performance Fostering diverse and inclusive environment Encouraging feedback Focus on the whole person Our Associates Make Us Different
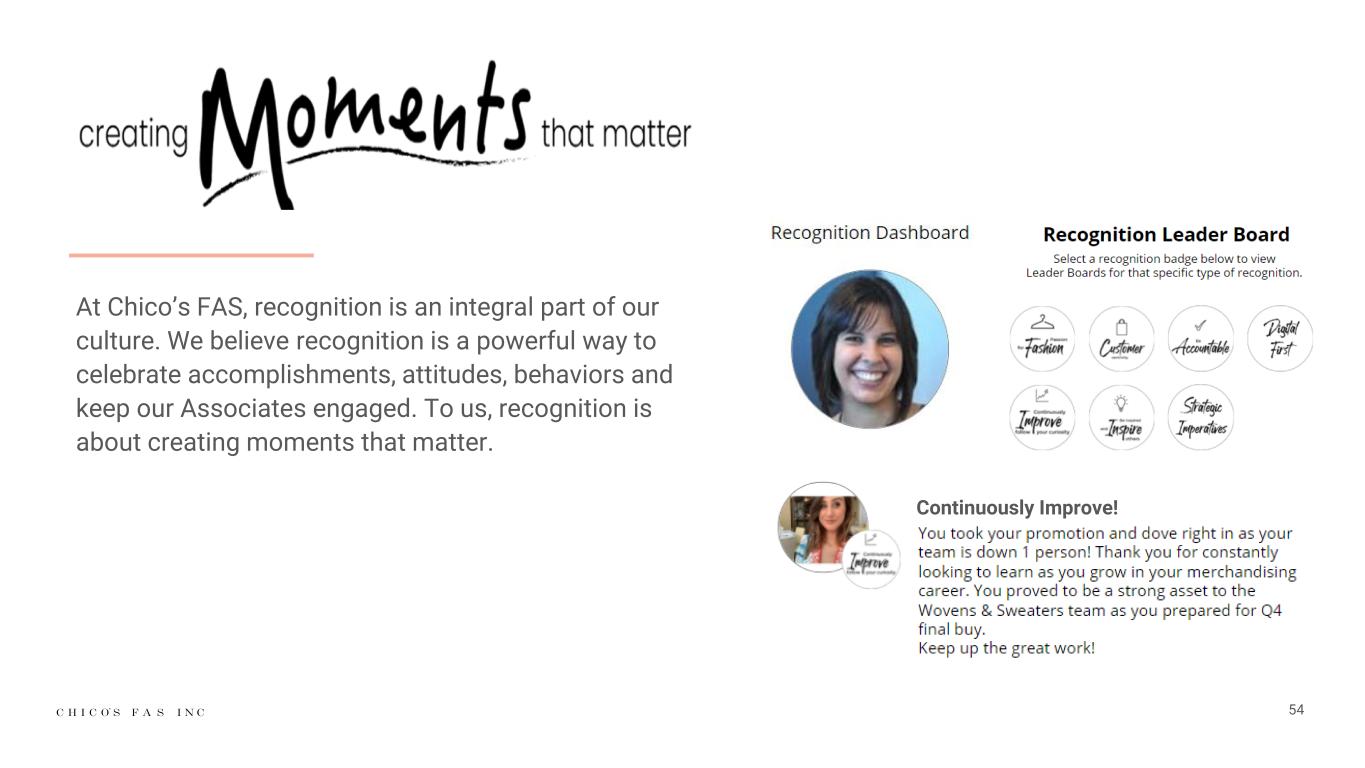
At Chico’s FAS, recognition is an integral part of our culture. We believe recognition is a powerful way to celebrate accomplishments, attitudes, behaviors and keep our Associates engaged. To us, recognition is about creating moments that matter. Continuously Improve! 54
55
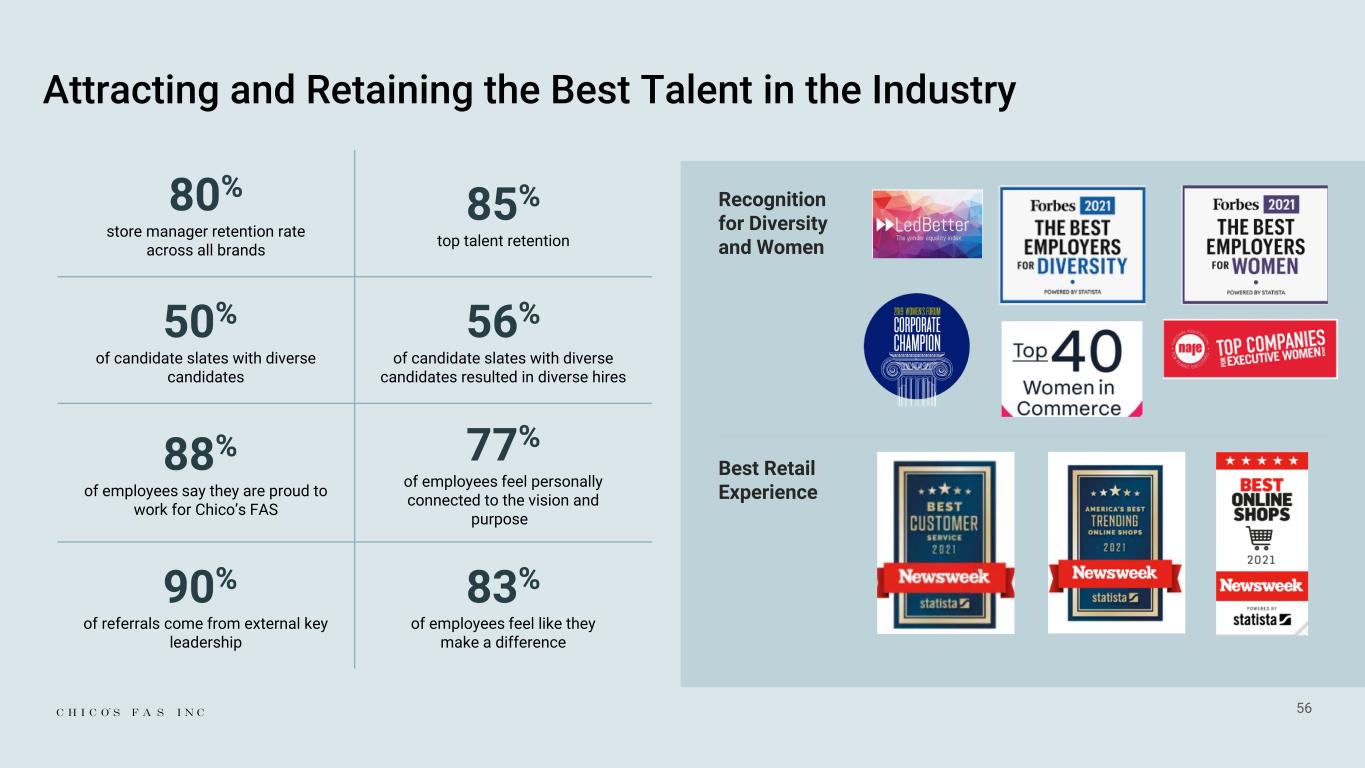
56 Attracting and Retaining the Best Talent in the Industry Recognition for Diversity and Women 80% store manager retention rate across all brands 85% top talent retention 50% of candidate slates with diverse candidates 56% of candidate slates with diverse candidates resulted in diverse hires 88% of employees say they are proud to work for Chico’s FAS 77% of employees feel personally connected to the vision and purpose 90% of referrals come from external key leadership 83% of employees feel like they make a difference Best Retail Experience
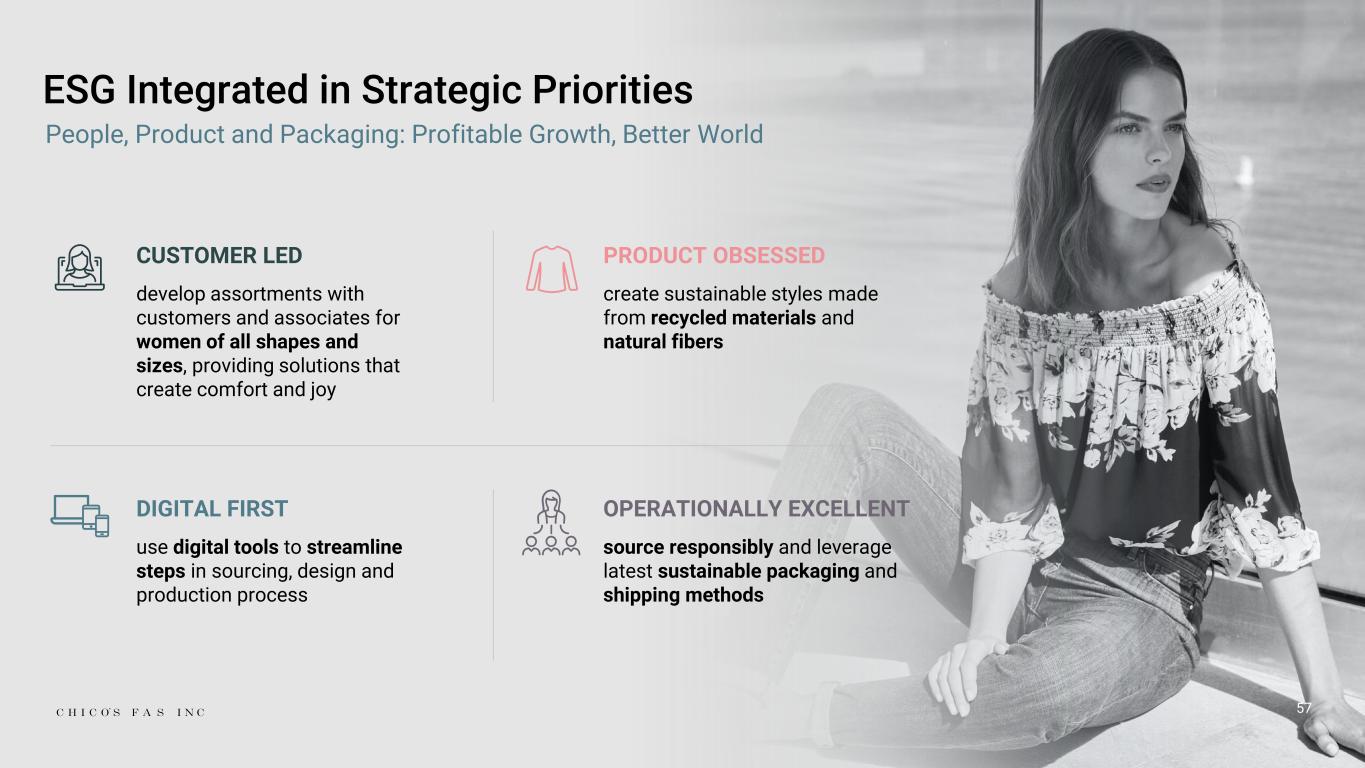
57 ESG Integrated in Strategic Priorities CUSTOMER LED develop assortments with customers and associates for women of all shapes and sizes, providing solutions that create comfort and joy PRODUCT OBSESSED create sustainable styles made from recycled materials and natural fibers DIGITAL FIRST use digital tools to streamline steps in sourcing, design and production process OPERATIONALLY EXCELLENT source responsibly and leverage latest sustainable packaging and shipping methods People, Product and Packaging: Profitable Growth, Better World

58 Environmental 3D Design Technology • Reduced physical samples • Reduced reliance on paper • Increased collaboration in design and development Partner Engagement • Supplier selection program that considers shared commitment to reducing environmental impacts • Robust compliance processes and procedures that hold suppliers accountable to our environmental commitments Responsible Sourcing • Sustainable raw materials with lower chemical footprints and water usage • Integration of fabric innovations that eliminate plastics from landfill and ocean Product Circularity • Soma bra donation / bra recycling programs • Apparel denim donation / denim recycling program
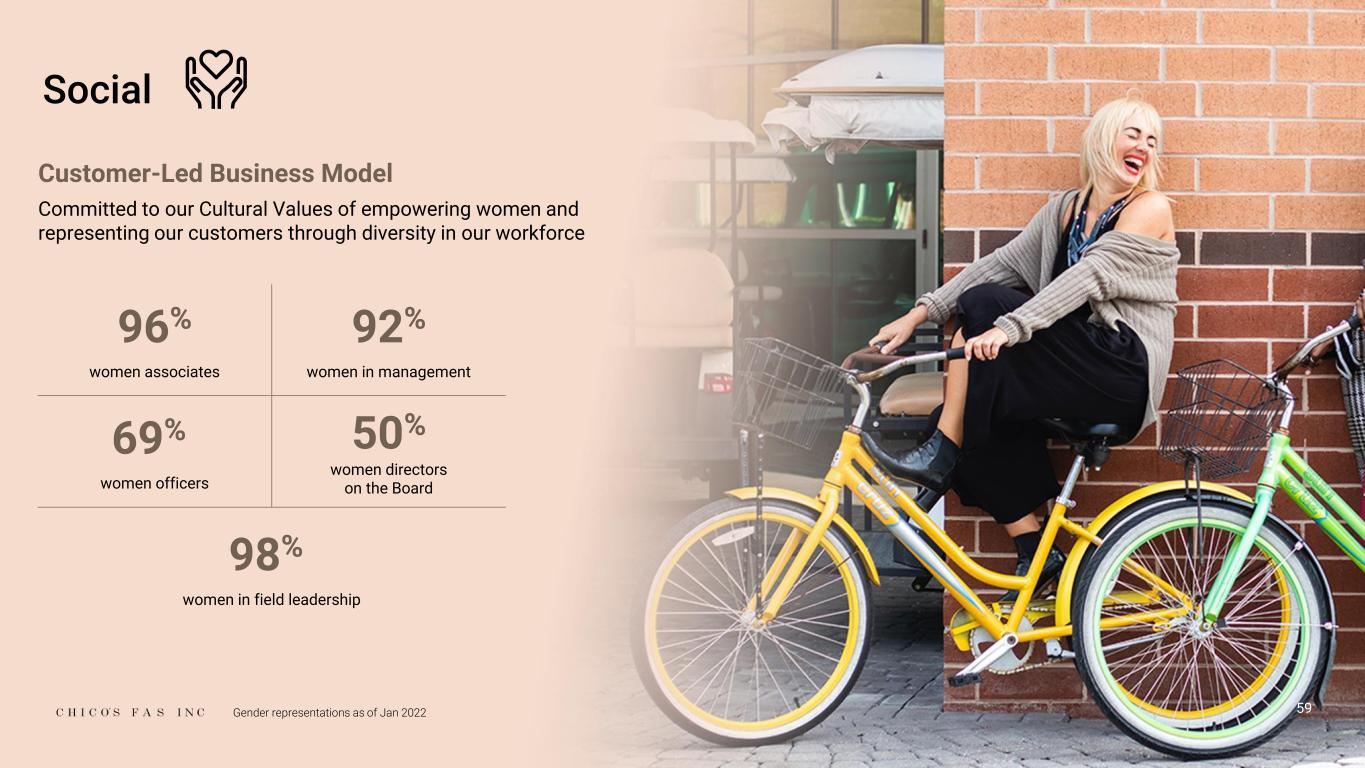
59 Social Customer-Led Business Model Committed to our Cultural Values of empowering women and representing our customers through diversity in our workforce 96% women associates 92% women in management 69% women officers 50% women directors on the Board 98% women in field leadership Gender representations as of Jan 2022
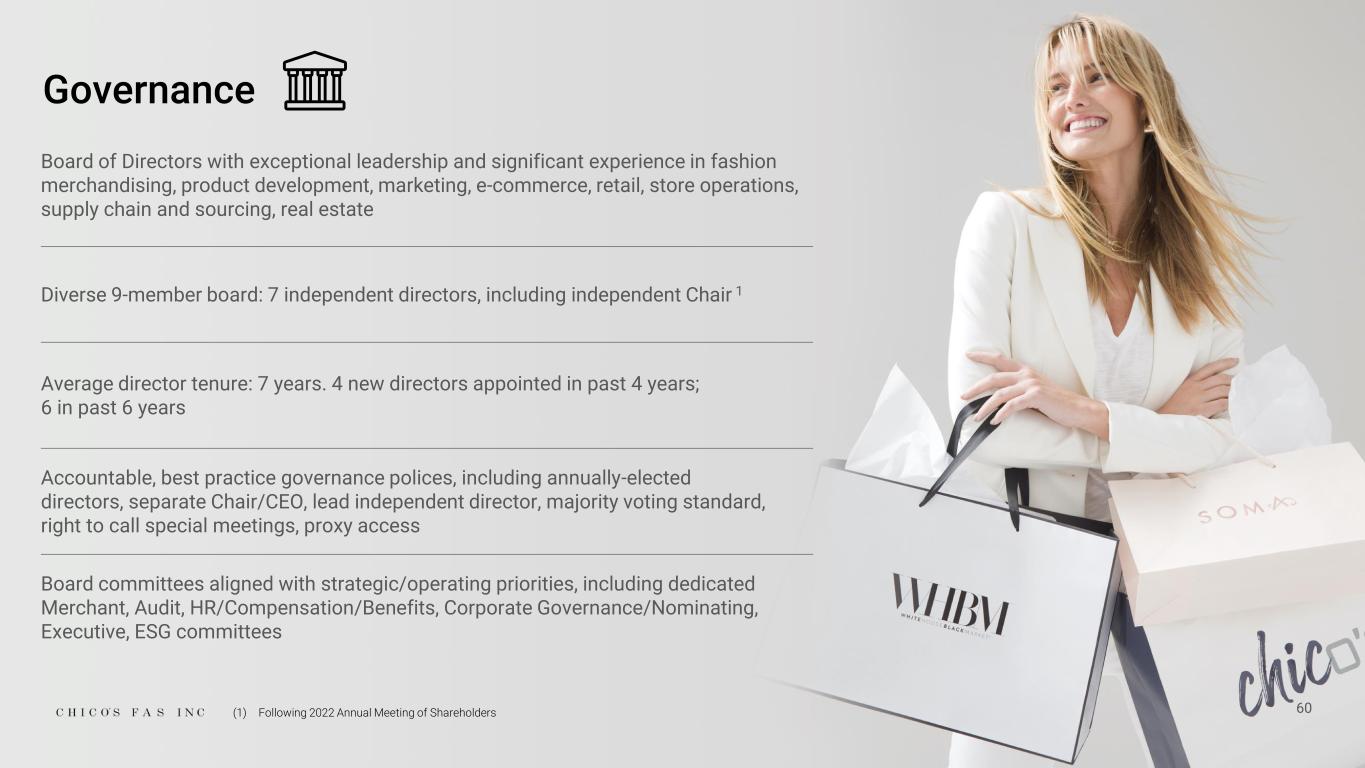
60 Governance Board of Directors with exceptional leadership and significant experience in fashion merchandising, product development, marketing, e-commerce, retail, store operations, supply chain and sourcing, real estate Diverse 9-member board: 7 independent directors, including independent Chair 1 Average director tenure: 7 years. 4 new directors appointed in past 4 years; 6 in past 6 years Accountable, best practice governance polices, including annually-elected directors, separate Chair/CEO, lead independent director, majority voting standard, right to call special meetings, proxy access Board committees aligned with strategic/operating priorities, including dedicated Merchant, Audit, HR/Compensation/Benefits, Corporate Governance/Nominating, Executive, ESG committees (1) Following 2022 Annual Meeting of Shareholders

Three-Year Financial Targets PJ Guido Chief Financial Officer 61
Positioned to Grow and Create Shareholder Value Operating excellence – further building upon enhanced shared service platform with dynamic sourcing, digital and marketing capabilities World-class retail team – store associates across the organization are long-tenured with deep retail experience and a love for fashion that endears them to customers Strong financial position and lean cost structure – will allow for investment to grow topline and grow EPS Powerful portfolio with three unique brands each thriving in its own market white space New leadership team with extensive retail experience – deploying a new strategy and operating model that has dramatically improved performance Competitive advantages that take years to build – operating with an incredibly loyal customer base, a customer-led culture and a diverse store footprint that is hard to replicate 62
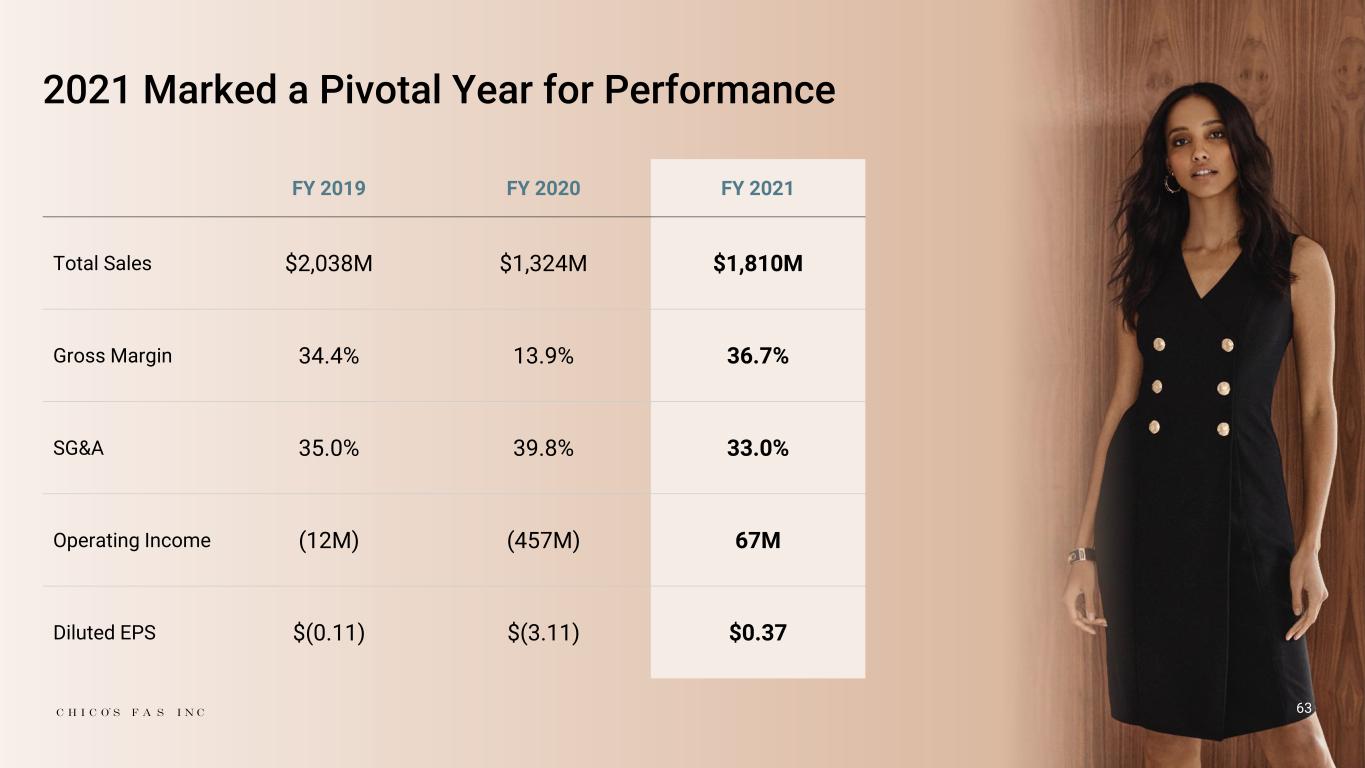
63 2021 Marked a Pivotal Year for Performance FY 2019 FY 2020 FY 2021 Total Sales $2,038M $1,324M $1,810M Gross Margin 34.4% 13.9% 36.7% SG&A 35.0% 39.8% 33.0% Operating Income (12M) (457M) 67M Diluted EPS $(0.11) $(3.11) $0.37
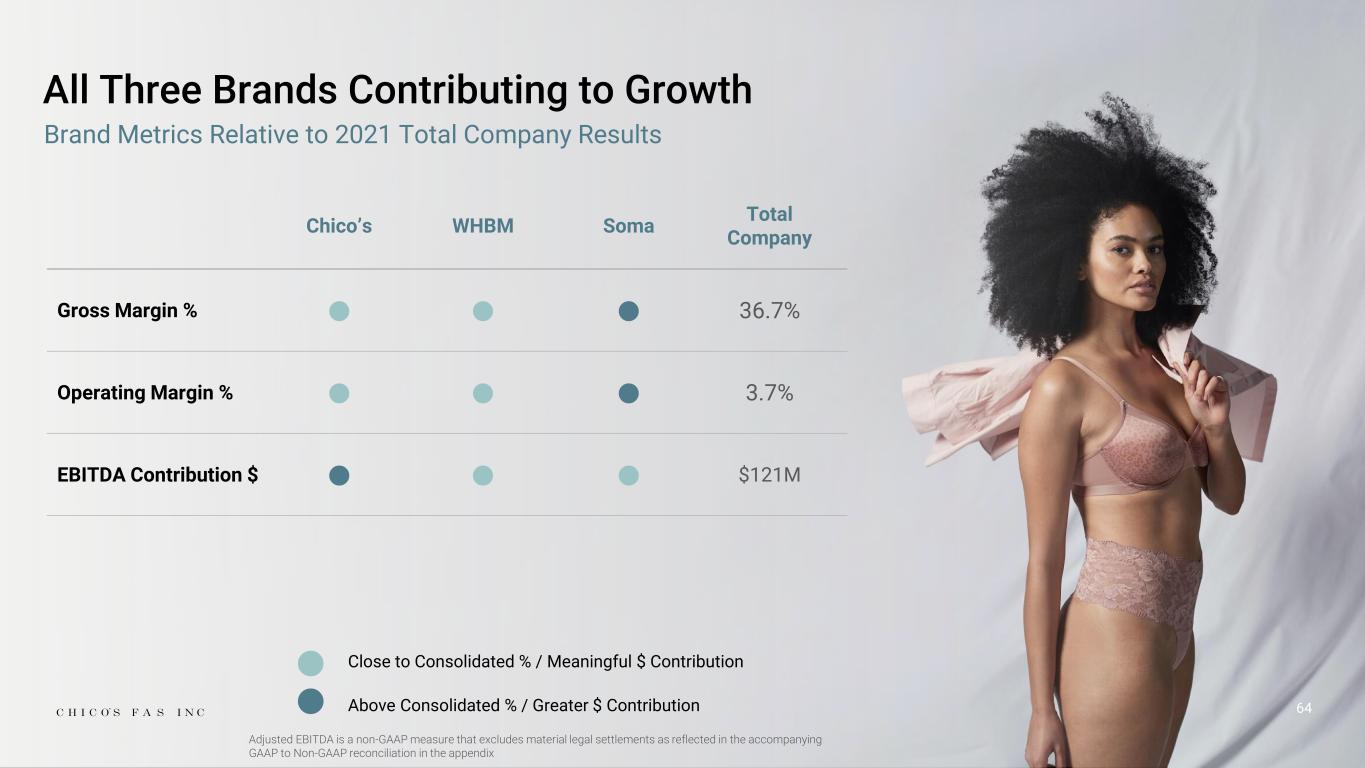
64 All Three Brands Contributing to Growth Close to Consolidated % / Meaningful $ Contribution Above Consolidated % / Greater $ Contribution Chico’s WHBM Soma Total Company Gross Margin % 36.7% Operating Margin % 3.7% EBITDA Contribution $ $121M Brand Metrics Relative to 2021 Total Company Results Adjusted EBITDA is a non-GAAP measure that excludes material legal settlements as reflected in the accompanying GAAP to Non-GAAP reconciliation in the appendix
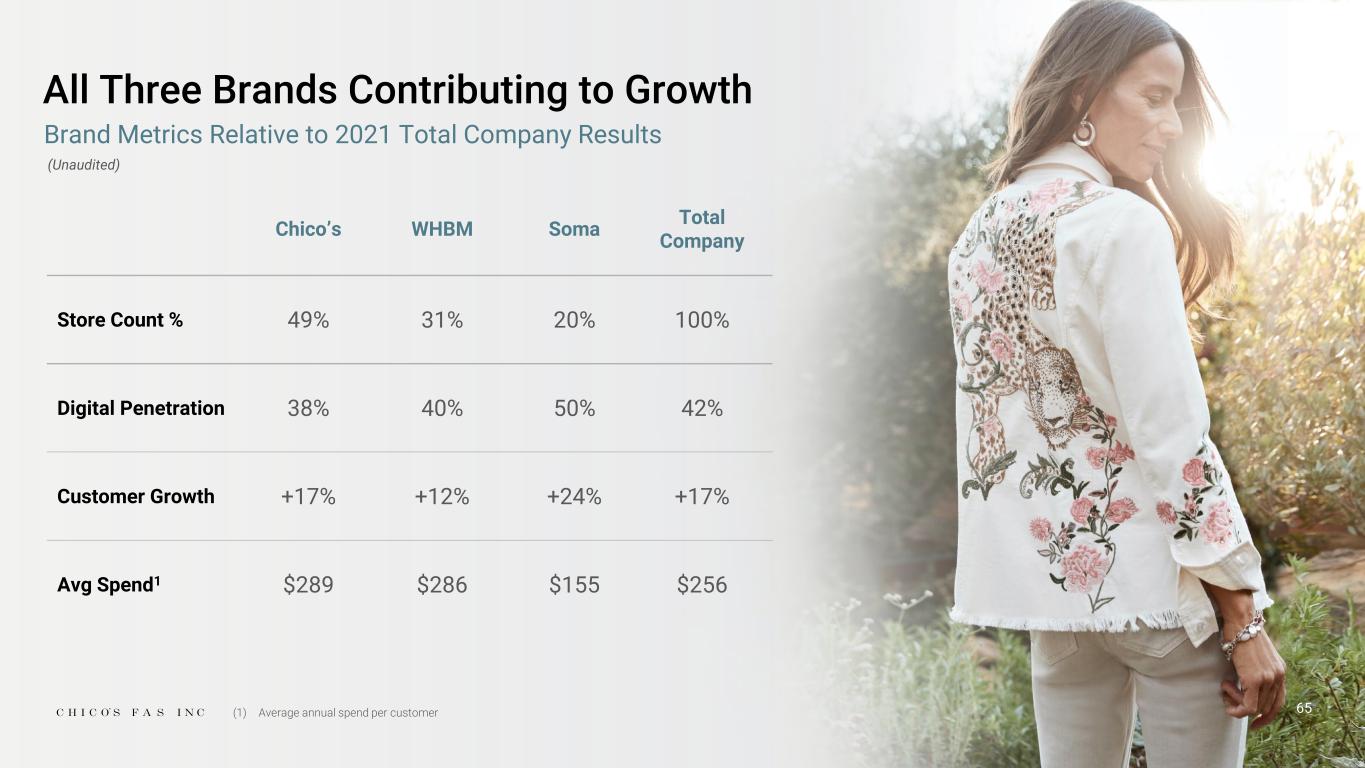
65 All Three Brands Contributing to Growth Chico’s WHBM Soma Total Company Store Count % 49% 31% 20% 100% Digital Penetration 38% 40% 50% 42% Customer Growth +17% +12% +24% +17% Avg Spend1 $289 $286 $155 $256 Brand Metrics Relative to 2021 Total Company Results (1) Average annual spend per customer (Unaudited)
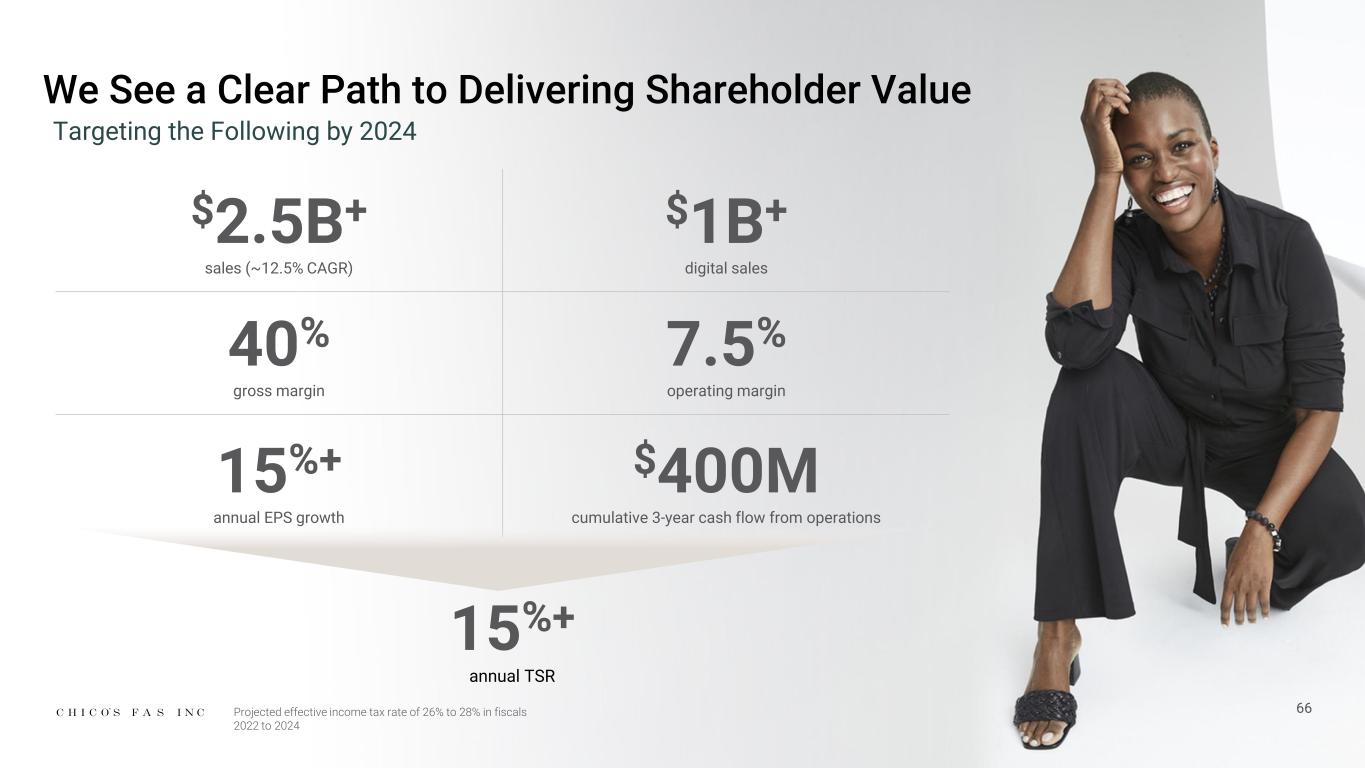
66 We See a Clear Path to Delivering Shareholder Value $2.5B+ sales (~12.5% CAGR) $1B+ digital sales 40% gross margin 7.5% operating margin 15%+ annual EPS growth $400M cumulative 3-year cash flow from operations Targeting the Following by 2024 Projected effective income tax rate of 26% to 28% in fiscals 2022 to 2024 15%+ annual TSR
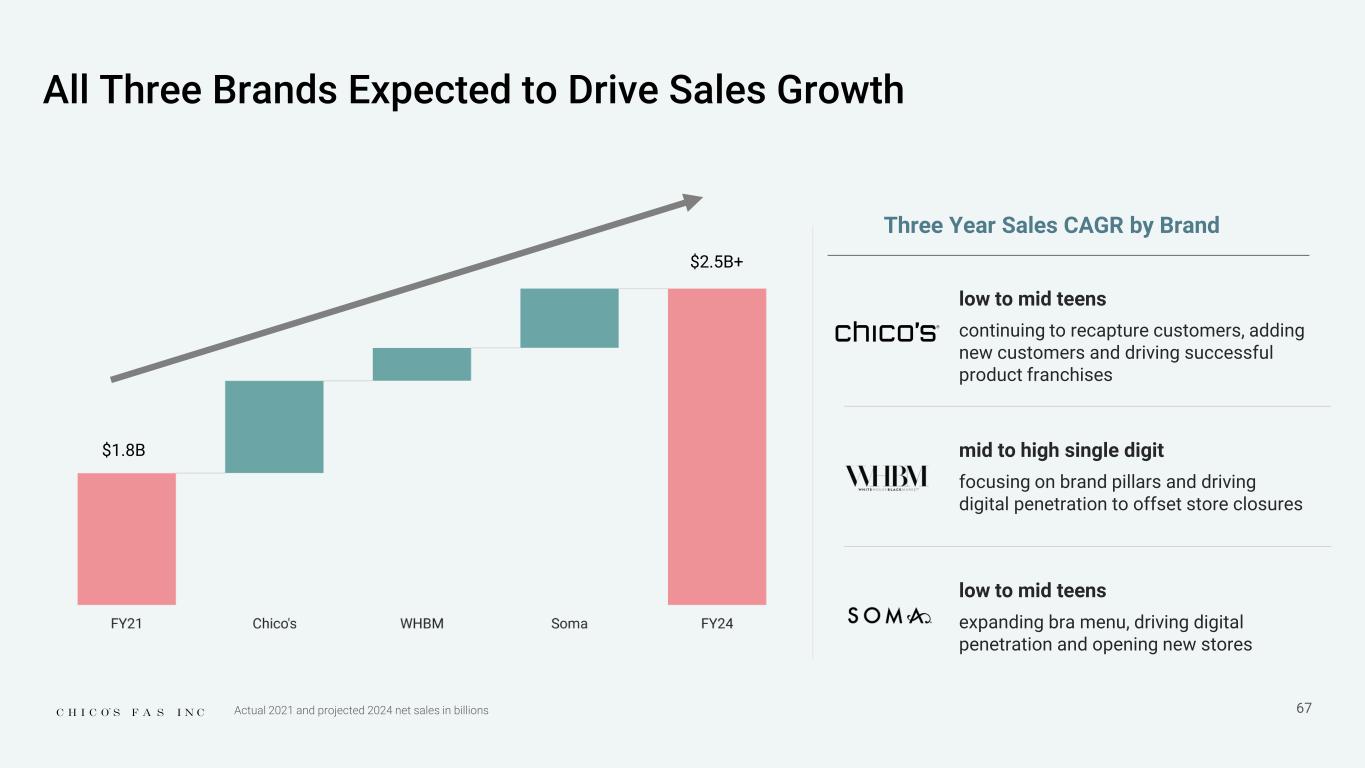
low to mid teens continuing to recapture customers, adding new customers and driving successful product franchises mid to high single digit focusing on brand pillars and driving digital penetration to offset store closures low to mid teens expanding bra menu, driving digital penetration and opening new stores 67 All Three Brands Expected to Drive Sales Growth Actual 2021 and projected 2024 net sales in billions $1.8B Three Year Sales CAGR by Brand $2.5B+
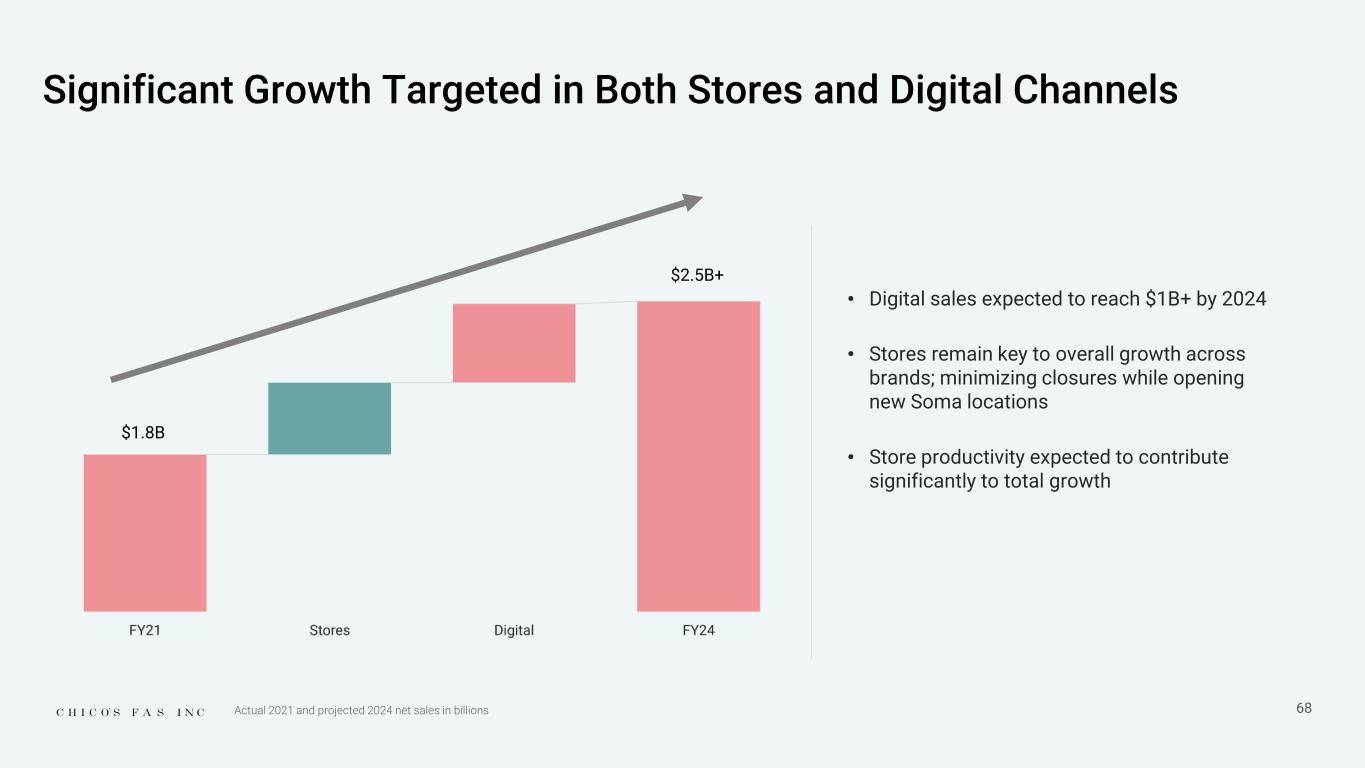
• Digital sales expected to reach $1B+ by 2024 • Stores remain key to overall growth across brands; minimizing closures while opening new Soma locations • Store productivity expected to contribute significantly to total growth 68 Significant Growth Targeted in Both Stores and Digital Channels $1.8B $2.5B+ Actual 2021 and projected 2024 net sales in billions

Key Drivers + Scale + Occupancy leverage + AUR / Pricing - Raw material costs - Freight 69 2021 2024E 36.7% 40.0% +330 bps Targeting 300+ bps of Gross Margin Expansion by 2024
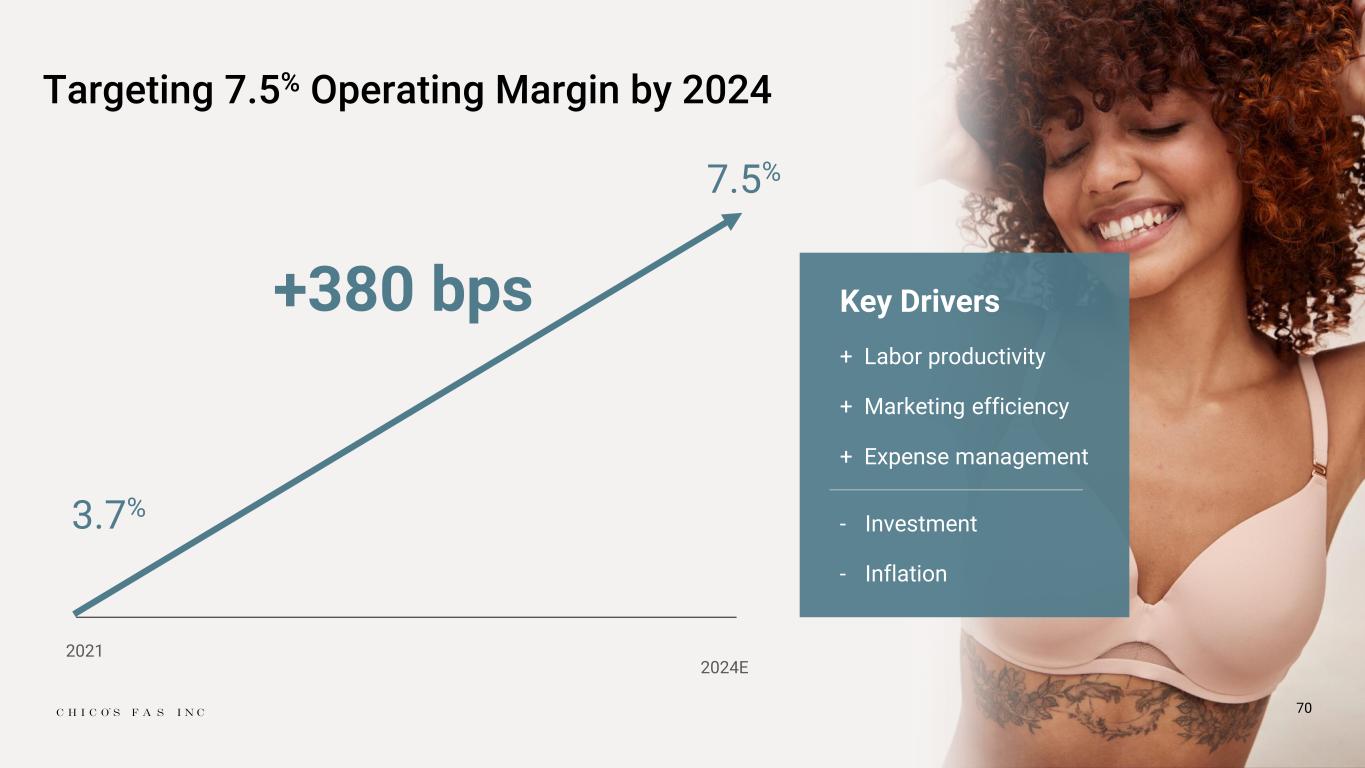
Key Drivers + Labor productivity + Marketing efficiency + Expense management - Investment - Inflation 70 2021 2024E 3.7% 7.5% +380 bps Targeting 7.5% Operating Margin by 2024
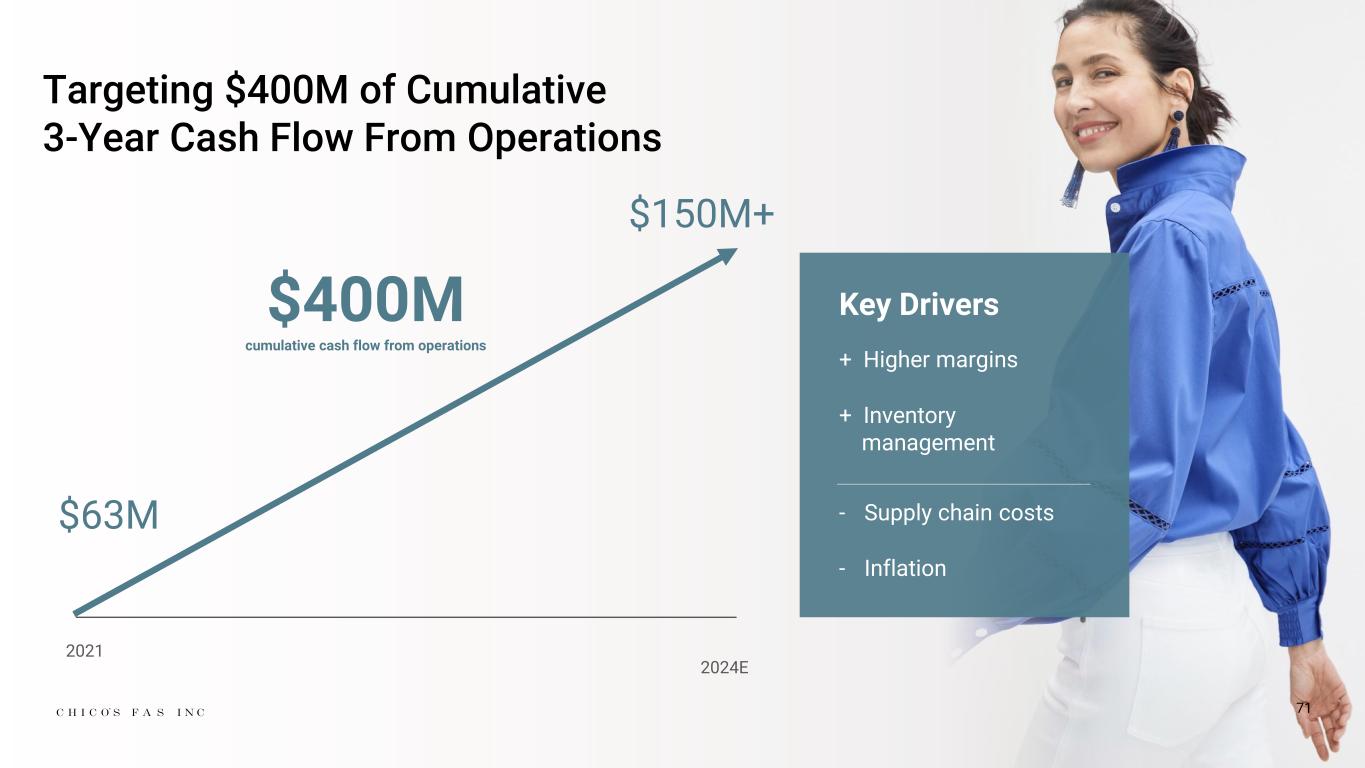
71 2021 2024E $63M $150M+ Targeting $400M of Cumulative 3-Year Cash Flow From Operations $400M cumulative cash flow from operations Key Drivers + Higher margins + Inventory management - Supply chain costs - Inflation
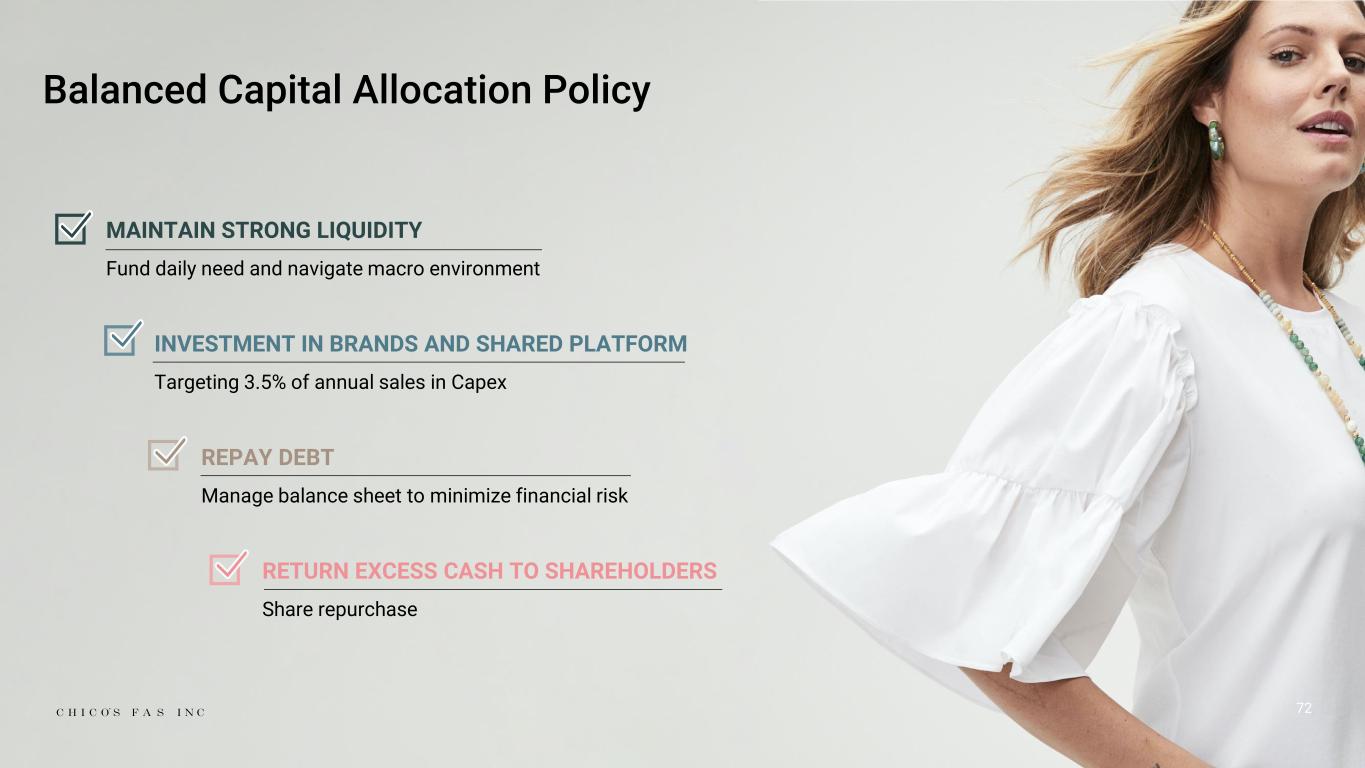
72 Balanced Capital Allocation Policy RETURN EXCESS CASH TO SHAREHOLDERS Share repurchase MAINTAIN STRONG LIQUIDITY Fund daily need and navigate macro environment INVESTMENT IN BRANDS AND SHARED PLATFORM Targeting 3.5% of annual sales in Capex REPAY DEBT Manage balance sheet to minimize financial risk
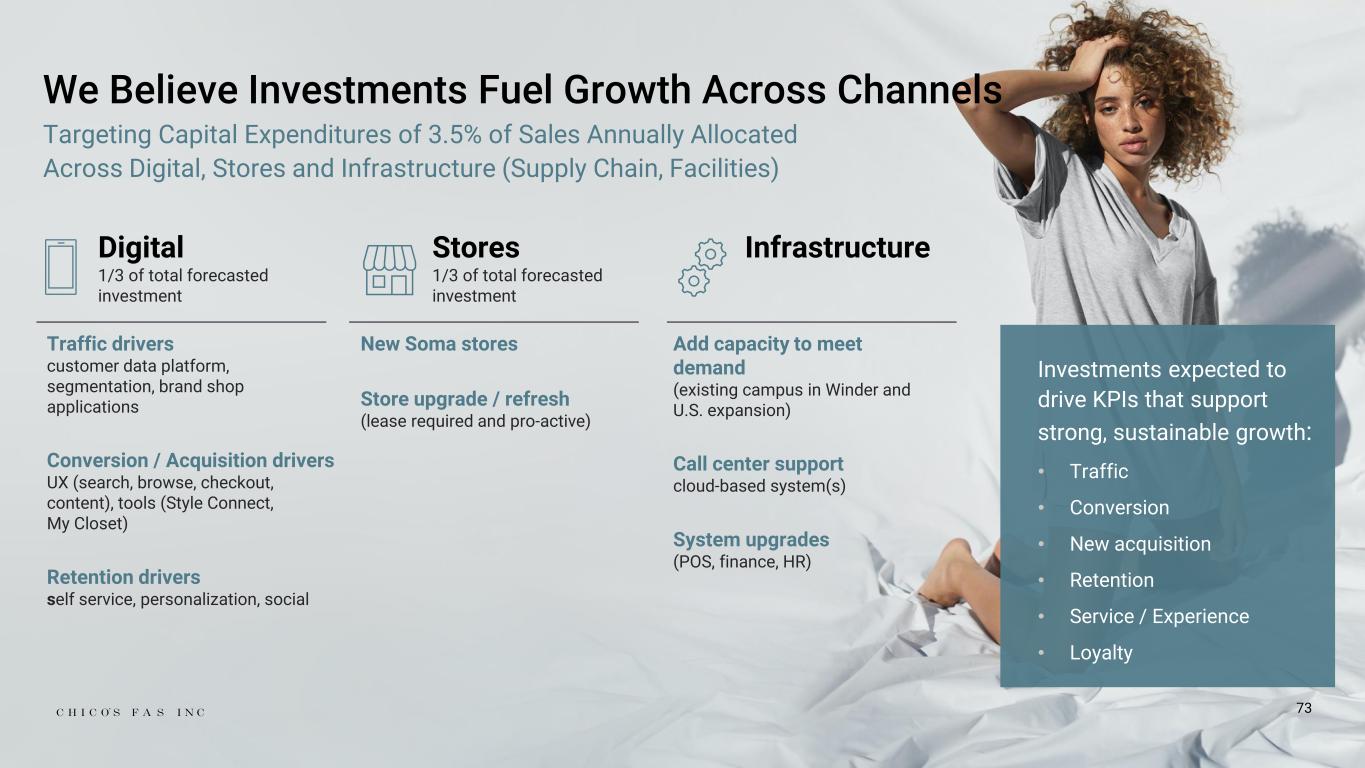
We Believe Investments Fuel Growth Across Channels Targeting Capital Expenditures of 3.5% of Sales Annually Allocated Across Digital, Stores and Infrastructure (Supply Chain, Facilities) Digital 1/3 of total forecasted investment Stores 1/3 of total forecasted investment Infrastructure Traffic drivers customer data platform, segmentation, brand shop applications Conversion / Acquisition drivers UX (search, browse, checkout, content), tools (Style Connect, My Closet) Retention drivers self service, personalization, social New Soma stores Store upgrade / refresh (lease required and pro-active) Add capacity to meet demand (existing campus in Winder and U.S. expansion) Call center support cloud-based system(s) System upgrades (POS, finance, HR) Investments expected to drive KPIs that support strong, sustainable growth: • Traffic • Conversion • New acquisition • Retention • Service / Experience • Loyalty 73
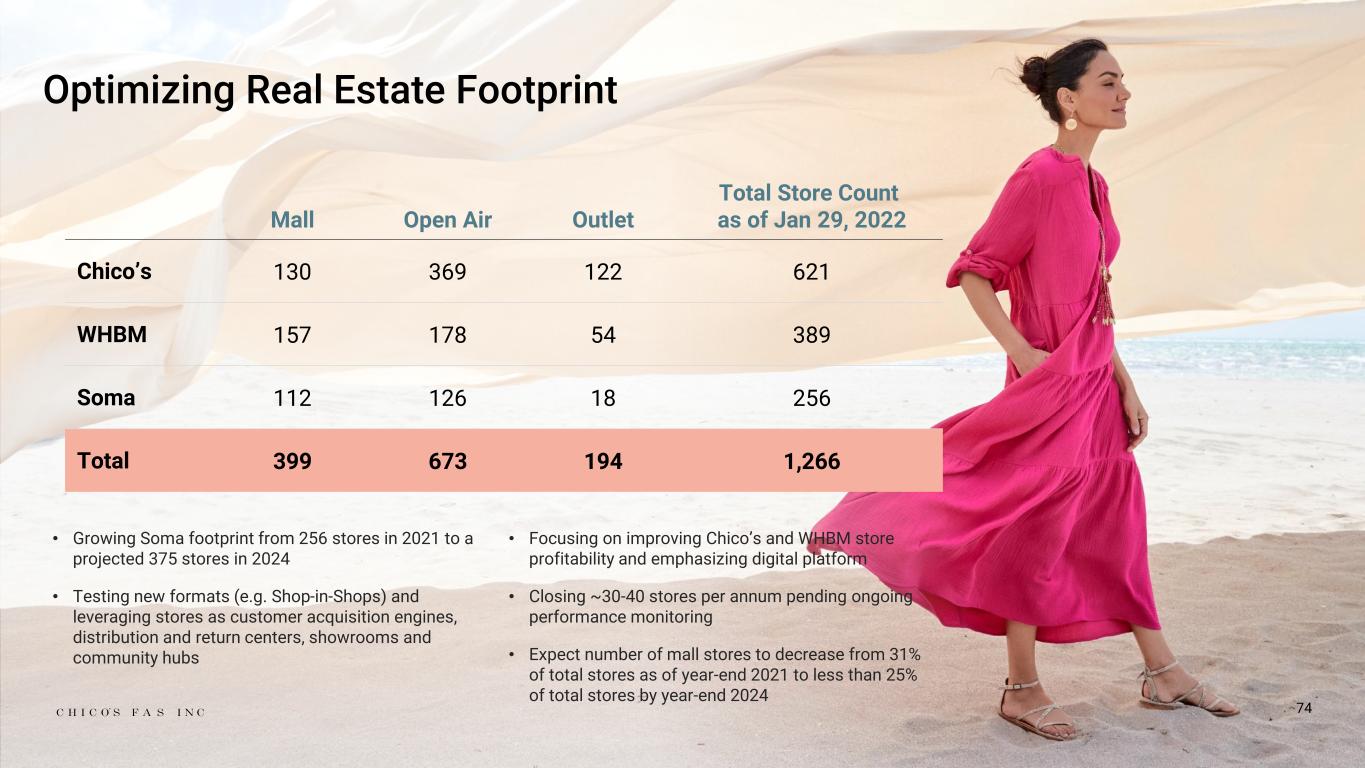
Optimizing Real Estate Footprint • Growing Soma footprint from 256 stores in 2021 to a projected 375 stores in 2024 • Testing new formats (e.g. Shop-in-Shops) and leveraging stores as customer acquisition engines, distribution and return centers, showrooms and community hubs • Focusing on improving Chico’s and WHBM store profitability and emphasizing digital platform • Closing ~30-40 stores per annum pending ongoing performance monitoring • Expect number of mall stores to decrease from 31% of total stores as of year-end 2021 to less than 25% of total stores by year-end 2024 Mall Open Air Outlet Total Store Count as of Jan 29, 2022 Chico’s 130 369 122 621 WHBM 157 178 54 389 Soma 112 126 18 256 Total 399 673 194 1,266 74
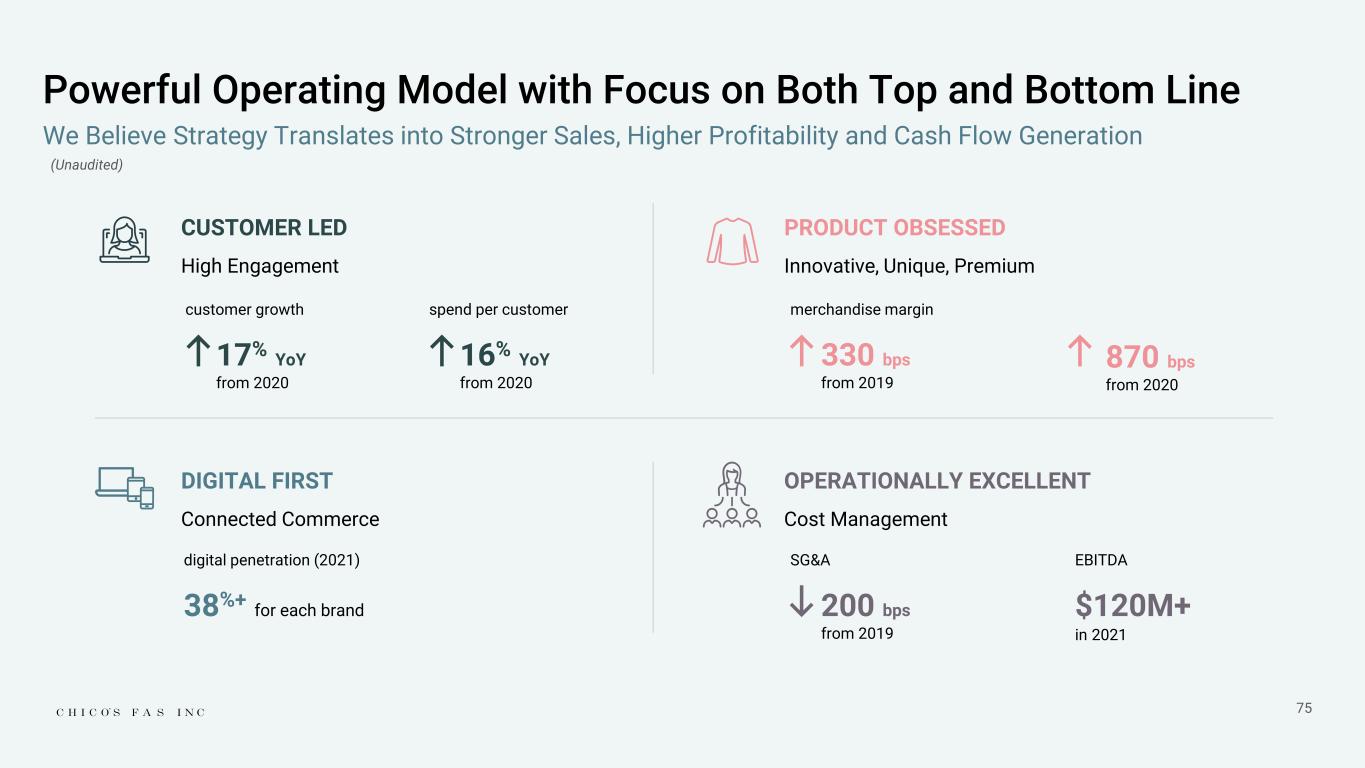
75 Powerful Operating Model with Focus on Both Top and Bottom Line CUSTOMER LED High Engagement PRODUCT OBSESSED Innovative, Unique, Premium DIGITAL FIRST Connected Commerce OPERATIONALLY EXCELLENT Cost Management We Believe Strategy Translates into Stronger Sales, Higher Profitability and Cash Flow Generation customer growth 17% YoY from 2020 spend per customer 16% YoY from 2020 merchandise margin 330 bps from 2019 870 bps from 2020 digital penetration (2021) 38%+ for each brand SG&A 200 bps from 2019 EBITDA $120M+ in 2021 (Unaudited)
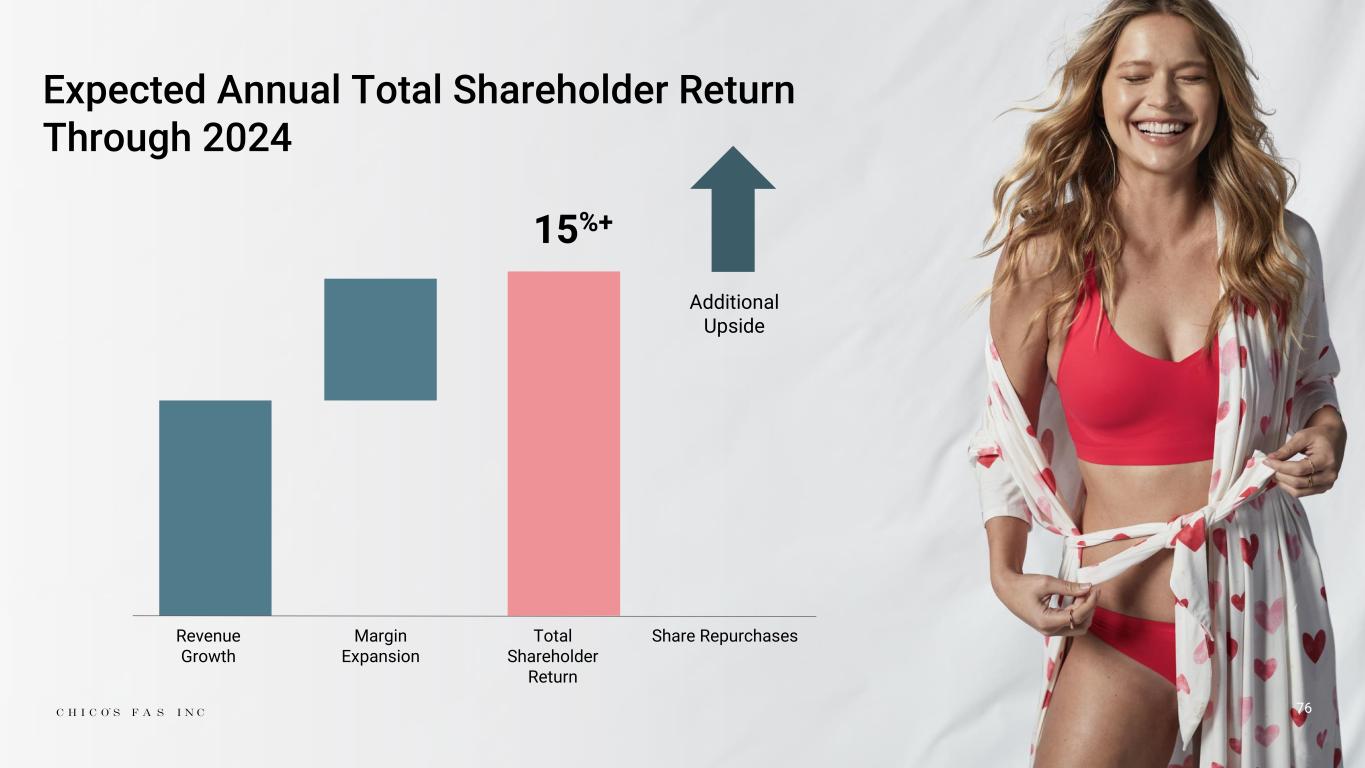
76 Expected Annual Total Shareholder Return Through 2024 Revenue Growth Margin Expansion Total Shareholder Return Share Repurchases 15%+ Additional Upside

77 Q&A
78 Appendix
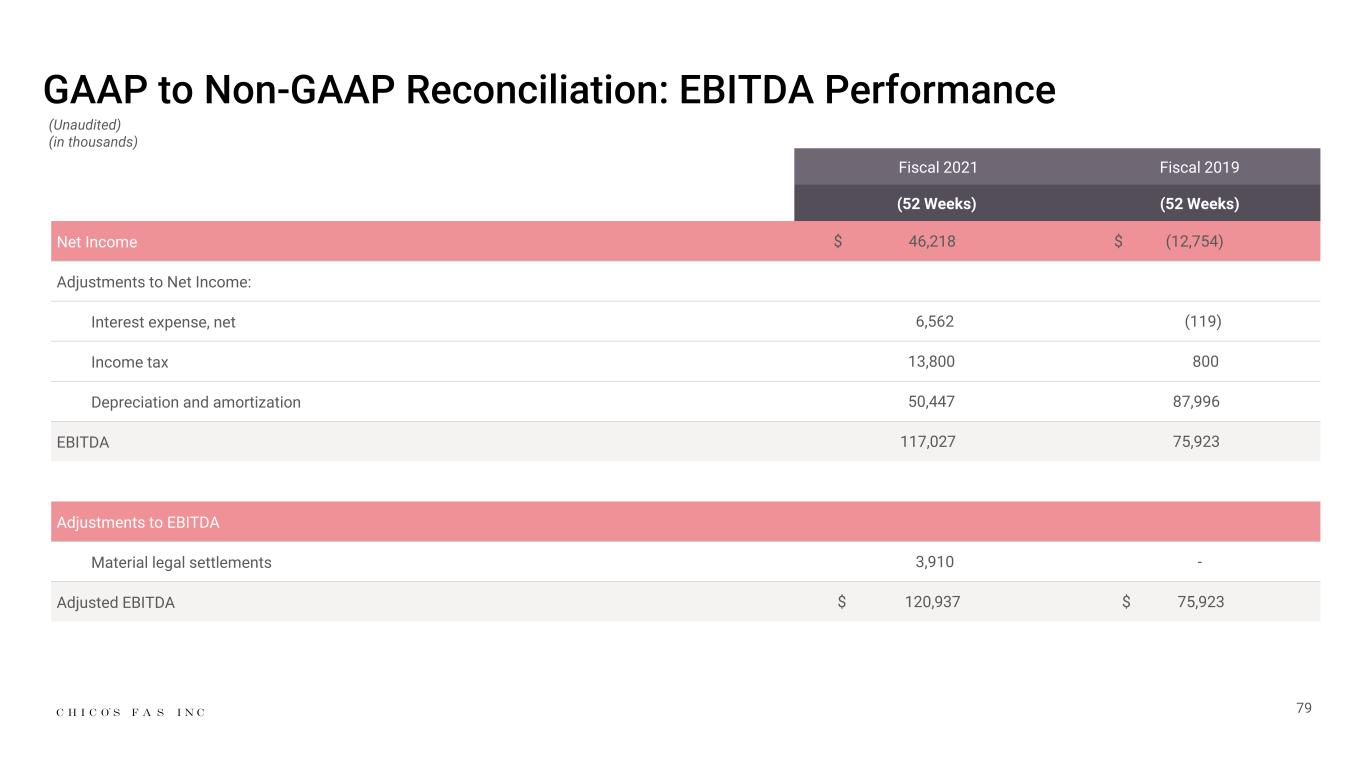
GAAP to Non-GAAP Reconciliation: EBITDA Performance Fiscal 2021 Fiscal 2019 (52 Weeks) (52 Weeks) Net Income $ 46,218 $ (12,754) Adjustments to Net Income: Interest expense, net 6,562 (119) Income tax 13,800 800 Depreciation and amortization 50,447 87,996 EBITDA 117,027 75,923 Adjustments to EBITDA Material legal settlements 3,910 - Adjusted EBITDA $ 120,937 $ 75,923 (Unaudited) (in thousands) 79


