| UNITED STATES |
| SECURITIES AND EXCHANGE COMMISSION |
| Washington, D.C. 20549 |
| FORM N-CSR |
| CERTIFIED SHAREHOLDER REPORT OF REGISTERED MANAGEMENT |
| INVESTMENT COMPANIES |
| Investment Company Act file number 811-7512 |
| DREYFUS PREMIER WORLDWIDE GROWTH FUND, INC. |
| (Exact name of Registrant as specified in charter) |
| c/o The Dreyfus Corporation |
| 200 Park Avenue |
| New York, New York 10166 |
| (Address of principal executive offices) (Zip code) |
| Mark N. Jacobs, Esq. |
| 200 Park Avenue |
| New York, New York 10166 |
| (Name and address of agent for service) |
| Registrant's telephone number, including area code: (212) 922-6000 |
| Date of fiscal year end: | 10/31 | |
| Date of reporting period: | 10/31/06 |
FORM N-CSR
Item 1. Reports to Stockholders.
Save time. Save paper. View your next shareholder report online as soon as it’s available. Log into www.dreyfus.com and sign up for Dreyfus eCommunications. It’s simple and only takes a few minutes.
The views expressed in this report reflect those of the portfolio manager only through the end of the period covered and do not necessarily represent the views of Dreyfus or any other person in the Dreyfus organization. Any such views are subject to change at any time based upon market or other conditions and Dreyfus disclaims any responsibility to update such views.These views may not be relied on as investment advice and, because investment decisions for a Dreyfus fund are based on numerous factors, may not be relied on as an indication of trading intent on behalf of any Dreyfus fund.
Not FDIC-Insured • Not Bank-Guaranteed • May Lose Value
| Contents | ||
| THE FUND | ||
| 2 | Letter from the Chairman | |
| 3 | Discussion of Fund Performance | |
| 6 | Fund Performance | |
| 8 | Understanding Your Fund’s Expenses | |
| 8 | Comparing Your Fund’s Expenses | |
| With Those of Other Funds | ||
| 9 | Statement of Investments | |
| 12 | Statement of Assets and Liabilities | |
| 13 | Statement of Operations | |
| 14 | Statement of Changes in Net Assets | |
| 16 | Financial Highlights | |
| 21 | Notes to Financial Statements | |
| 29 | Report of Independent Registered | |
| Public Accounting Firm | ||
| 30 | Important Tax Information | |
| 31 | Information About the Review and Approval | |
| of the Fund’s Management Agreement | ||
| 36 | Board Members Information | |
| 38 | Officers of the Fund | |
| FOR MORE INFORMATION | ||
| Back Cover | ||
| Dreyfus Premier |
| Worldwide Growth Fund, Inc. |
The Fund

LETTER FROM THE CHAIRMAN
Dear Shareholder:
We are pleased to present this annual report for Dreyfus Premier Worldwide Growth Fund, Inc., covering the 12-month period from November 1, 2005, through October 31, 2006.
Although reports of slower economic growth and declining housing prices in the United States recently have raised economic concerns among both U.S. and international investors, we believe that neither a domestic recession nor a major shortfall in global growth is likely. Stimulative monetary policies among many central banks over the last several years have left a legacy of ample financial liquidity worldwide, which should continue to support global economic growth. Indeed, most nations’ monetary policies have so far tightened only from stimulative to neutral, leaving room for further expansion.
The international equity markets seem to concur with our view that global economic conditions remain sound, as evidenced by higher stock prices over the past 12 months across most geographic regions and market capitalizations. However, investors anticipating more subdued profit growth in a slower-growth economy recently have begun to favor high-quality, multinational companies and other businesses with the ability to sustain profitability in a variety of economic environments. This pattern is consistent with previous mid-cycle slowdowns. As always, we encourage you to discuss the implications of these and other matters with your financial adviser.
For information about how the fund performed during the reporting period, as well as market perspectives, we have provided a Discussion of Fund Performance given by the fund’s portfolio manager.
Thank you for your continued confidence and support.
| 2 |

DISCUSSION OF FUND PERFORMANCE
| Fayez Sarofim, Portfolio Manager Fayez Sarofim & Co., Sub-Investment Adviser |
How did Dreyfus Premier Worldwide Growth Fund perform relative to its benchmark?
For the 12-month period ended October 31, 2006, the fund produced total returns of 18.16% for Class A shares, 17.16% for Class B shares, 17.30% for Class C shares, 18.35% for Class R shares and 17.90% for Class T shares.1 In comparison, the fund’s benchmark, the Morgan Stanley Capital International World Index (“MSCI World Index”), provided a 21.32% total return for the same period.2
Market rallies toward the beginning and end of the reporting period enabled the global stock market to post attractive returns overall. Although the fund participated to a substantial degree in the market’s overall strength, its relative performance was hindered early in the reporting period by its emphasis on large-cap, multinational companies.
What is the fund’s investment approach?
The fund invests primarily in large, well-established, multinational companies that we believe are well-positioned to weather difficult economic climates and thrive during favorable times.We focus on purchasing large-cap,“blue-chip” stocks at a price we consider to be justified by a company’s fundamentals.The result is a portfolio of stocks of prominent companies selected for their sustained patterns of profitability, strong balance sheets, expanding global presence and above-average earnings growth potential.The fund pursues a “buy-and-hold” investment strategy in which we typically buy and sell relatively few stocks during the course of the year, which may help to reduce investors’ tax liabilities and the fund’s trading costs.3
What other factors influenced the fund’s performance?
Generally strong global economic conditions and robust corporate earnings created a favorable environment for most stocks. However, the MSCI World Index’s strength was concentrated mainly in rallies during
| The Fund 3 |
| DISCUSSION OF FUND PERFORMANCE (continued) |
the first two and final four months of the reporting period, and the market produced milder returns during the intervening six months.
The market rally in the closing months of 2005 was led by lower-quality, small-cap companies, which investors continued to favor in an environment of robust global economic growth. In contrast, the market’s gains during the summer and early fall of 2006 were driven by the type of large, high-quality multinational companies in which the fund primarily invests. Signs of intensifying inflationary pressures and slower economic growth in the United States during the spring and summer of 2006 caused many global investors to become less tolerant of risks, and they began to turn their attention toward companies that have demonstrated an ability to produce consistent earnings under a variety of economic conditions.
The fund achieved particularly attractive results among consumer discretionary companies. Publisher McGraw-Hill Cos. exceeded analysts’ earnings expectations due to strength in its education and financial publishing divisions. Luxury purveyor Christian Dior benefited from high levels of demand from affluent customers. Casual restaurant leader McDonalds advanced after the company slowed its domestic expansion and consumers reacted favorably to new, healthier menu items. Media conglomerate News Corp. gained value due to improved advertising sales in its cable and broadcasting networks and the possible resolution of disagreements with a large shareholder.
The fund’s health care companies also fared well. Large pharmaceutical stocks generally rebounded from earlier weakness after addressing product safety and development concerns, helping to boost the stock prices of holdings such as Pfizer, Eli Lilly & Co. and Roche Holdings.
On the other hand, the fund’s relative performance was undermined by lackluster results in the consumer staples area, where the fund maintained an overweighted position. The stocks of pharmacy chain Walgreens, retailing giant Wal-Mart and beverage maker PepsiCo achieved modest gains, but they failed to keep pace with the market averages. Likewise, in the industrials area, modestly positive results from
| 4 |
shares of shipper United Parcel Service and diversified conglomerate General Electric prevented the sector from matching the S&P 500 Index’s overall return for the reporting period. Finally, competitive pressures weighed on semiconductor manufacturer Intel, hindering returns from the technology sector.
In keeping with our buy-and-hold investment approach, we made few changes to the fund’s portfolio during the reporting period.We eliminated the fund’s position in beer maker Anheuser Busch and we sold media giant Time Warner.
What is the fund’s current strategy?
A cooling housing market and more moderate employment gains suggest to us that investors are likely to remain relatively risk averse as concerns persist that a slower U.S. economy could dampen global growth. At the same time, stocks of large, multinational companies remain undervalued compared to historical norms, and their dividend yields are relatively high. Accordingly, we believe that investors may continue to favor larger businesses with track records of consistent earnings, including many of the companies in which the fund invests.
November 15, 2006
| 1 | Total return includes reinvestment of dividends and any capital gains paid, and does not take into | |
| consideration the maximum initial sales charges in the case of Class A and Class T shares, or the | ||
| applicable contingent deferred sales charges imposed on redemptions in the case of Class B and | ||
| Class C shares. Had these charges been reflected, returns would have been lower. Past performance | ||
| is no guarantee of future results. Share price and investment return fluctuate such that upon | ||
| redemption, fund shares may be worth more or less than their original cost. | ||
| 2 | SOURCE: LIPPER INC. — Reflects reinvestment of net dividends and, where applicable, | |
| capital gain distributions.The Morgan Stanley Capital International (MSCI) World Index is an | ||
| unmanaged index of global stock market performance, including the United States, Canada, | ||
| Europe,Australia, New Zealand and the Far East. | ||
| 3 | Achieving tax efficiency is not a part of the fund’s investment objective, and there can be no | |
| guarantee that the fund will achieve any particular level of taxable distributions in future years. In | ||
| periods when the manager has to sell significant amounts of securities (e.g., during periods of | ||
| significant net redemptions or changes in index components) funds can be expected to be less tax | ||
| efficient than during periods of more stable market conditions and asset flows. |
| The Fund 5 |
| FUND PERFORMANCE |
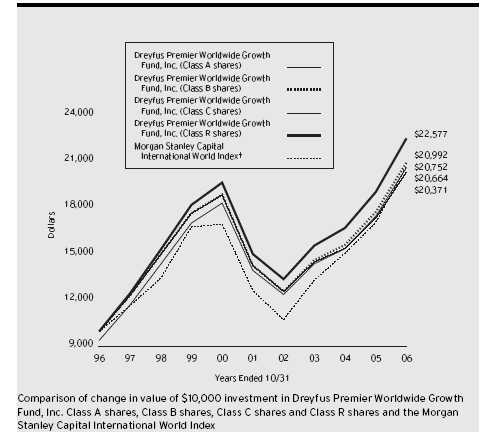
| † Source: Lipper Inc. |
| Past performance is not predictive of future performance. |
| The above graph compares a $10,000 investment made in each of the Class A, Class B, Class C and Class R shares |
| of Dreyfus Premier Worldwide Growth Fund, Inc. on 10/31/96 to a $10,000 investment made in the Morgan Stanley |
| Capital International World Index (the “Index”) on that date.All dividends and capital gain distributions are reinvested. |
| Performance for Class T shares will vary from the performance of Class A, Class B, Class C, and Class R shares shown |
| above due to differences in charges and expenses. |
| The fund’s performance shown in the line graph takes into account the maximum initial sales charge on Class A shares |
| and all other applicable fees and expenses.The Index is an unmanaged index of global stock market performance, |
| including the United States, Canada,Australia, New Zealand and the Far East and includes net dividends reinvested. |
| The Index does not take into account charges, fees and other expenses. Further information relating to fund performance, |
| including expense reimbursements, if applicable, is contained in the Financial Highlights section of the prospectus and |
| elsewhere in this report. |
| 6 |
| Average Annual Total Returns as of 10/31/06 | ||||||||||
| Inception | From | |||||||||
| Date | 1 Year | 5 Years | 10 Years | Inception | ||||||
| Class A shares | ||||||||||
| with maximum sales charge (5.75%) | 11.37% | 6.87% | 7.53% | |||||||
| without sales charge | 18.16% | 8.14% | 8.17% | |||||||
| Class B shares | ||||||||||
| with applicable redemption charge † | 13.16% | 6.99% | 7.70% | |||||||
| without redemption | 17.16% | 7.29% | 7.70% | |||||||
| Class C shares | ||||||||||
| with applicable redemption charge †† | 16.30% | 7.36% | 7.38% | |||||||
| without redemption | 17.30% | 7.36% | 7.38% | |||||||
| Class R shares | 18.35% | 8.47% | 8.48% | |||||||
| Class T shares | ||||||||||
| with applicable sales charge (4.5%) | 9/30/99 | 12.58% | 6.93% | — | 2.59% | |||||
| without sales charge | 9/30/99 | 17.90% | 7.92% | — | 3.26% | |||||
Past performance is not predictive of future performance.The fund’s performance shown in the graph and table does not reflect the deduction of taxes that a shareholder would pay on fund distributions or the redemption of fund shares. Performance for Class B shares assumes the conversion of Class B shares to Class A shares at the end of the sixth year following the date of purchase.
† The maximum contingent deferred sales charge for Class B shares is 4%.After six years Class B shares convert to Class A shares.
The maximum contingent deferred sales charge for Class C shares is 1% for shares redeemed within one year of the date of purchase.
| The Fund 7 |
UNDERSTANDING YOUR FUND’S EXPENSES (Unaudited)
As a mutual fund investor, you pay ongoing expenses, such as management fees and other expenses. Using the information below, you can estimate how these expenses affect your investment and compare them with the expenses of other funds.You also may pay one-time transaction expenses, including sales charges (loads) and redemption fees, which are not shown in this section and would have resulted in higher total expenses. For more information, see your fund’s prospectus or talk to your financial adviser.
Review your fund’s expenses
The table below shows the expenses you would have paid on a $1,000 investment in Dreyfus Premier Worldwide Growth Fund, Inc. from May 1, 2006 to October 31, 2006. It also shows how much a $1,000 investment would be worth at the close of the period, assuming actual returns and expenses.
| Expenses and Value of a $1,000 Investment | ||||||||||
| assuming actual returns for the six months ended October 31, 2006 | ||||||||||
| Class A | Class B | Class C | Class R | Class T | ||||||
| Expenses paid per $1,000 † | $ 6.48 | $ 11.01 | $ 10.28 | $ 5.08 | $ 7.63 | |||||
| Ending value (after expenses) | $1,074.40 | $1,069.90 | $1,070.70 | $1,076.20 | $1,073.60 | |||||
| COMPARING YOUR FUND’S EXPENSES WITH THOSE OF OTHER FUNDS (Unaudited) |
Using the SEC’s method to compare expenses
The Securities and Exchange Commission (SEC) has established guidelines to help investors assess fund expenses. Per these guidelines, the table below shows your fund’s expenses based on a $1,000 investment, assuming a hypothetical 5% annualized return. You can use this information to compare the ongoing expenses (but not transaction expenses or total cost) of investing in the fund with those of other funds.All mutual fund shareholder reports will provide this information to help you make this comparison. Please note that you cannot use this information to estimate your actual ending account balance and expenses paid during the period.
Expenses and Value of a $1,000 Investment assuming a hypothetical 5% annualized return for the six months ended October 31, 2006
| Class A | Class B | Class C | Class R | Class T | ||||||
| Expenses paid per $1,000 † | $ 6.31 | $ 10.71 | $ 10.01 | $ 4.94 | $ 7.43 | |||||
| Ending value (after expenses) | $1,018.95 | $1,014.57 | $1,015.27 | $1,020.32 | $1,017.85 |
† Expenses are equal to the fund’s annualized expense ratio of 1.24% for Class A, 2.11% for Class B, 1.97% for Class C, .97% for Class R and 1.46% for Class T; multiplied by the average account value over the period, multiplied by 184/365 (to reflect the one-half year period).
| 8 |
| STATEMENT OF INVESTMENTS October 31, 2006 |
| Common Stocks—100.1% | Shares | Value ($) | ||
| Banks—2.6% | ||||
| Eurazeo | 63,193 | 8,067,218 | ||
| HSBC Holdings, ADR | 125,000 | 11,933,750 | ||
| 20,000,968 | ||||
| Capital Goods—4.8% | ||||
| Emerson Electric | 110,100 | 9,292,440 | ||
| General Electric | 771,072 | 27,072,338 | ||
| 36,364,778 | ||||
| Consumer Durables & Apparel—4.6% | ||||
| Christian Dior | 330,000 | 35,260,969 | ||
| Consumer Services—1.2% | ||||
| McDonald’s | 220,800 | 9,255,936 | ||
| Diversified Financial Services—9.4% | ||||
| American Express | 132,850 | 7,680,058 | ||
| Ameriprise Financial | 45,970 | 2,367,455 | ||
| Citigroup | 541,284 | 27,150,805 | ||
| Deutsche Bank | 85,300 | 10,777,655 | ||
| JPMorgan Chase & Co. | 254,100 | 12,054,504 | ||
| UBS | 200,000 | 11,950,141 | ||
| 71,980,618 | ||||
| Energy—17.4% | ||||
| BP, ADR | 165,000 | 11,071,500 | ||
| Chevron | 360,800 | 24,245,760 | ||
| ConocoPhillips | 26,000 | 1,566,240 | ||
| Exxon Mobil | 640,008 | 45,709,371 | ||
| Norsk Hydro, ADR | 522,000 | 12,084,300 | ||
| Total, ADR | 554,316 | 37,771,092 | ||
| 132,448,263 | ||||
| Food & Staples Retailing—4.1% | ||||
| Wal-Mart Stores | 173,322 | 8,541,308 | ||
| Walgreen | 523,000 | 22,844,640 | ||
| 31,385,948 |
| The Fund 9 |
| STATEMENT OF INVESTMENTS (continued) |
| Common Stocks (continued) | Shares | Value ($) | ||
| Food, Beverage & Tobacco—22.0% | ||||
| Altria Group | 584,000 | 47,496,720 | ||
| Coca-Cola | 446,100 | 20,841,792 | ||
| Diageo, ADR | 165,000 | 12,287,550 | ||
| Groupe Danone, ADR | 980,000 | 30,762,200 | ||
| LVMH Moet Hennessy Louis Vuitton | 122,175 | 12,734,837 | ||
| Nestle, ADR | 326,600 | 27,904,704 | ||
| PepsiCo | 241,675 | 15,331,862 | ||
| 167,359,665 | ||||
| Household & Personal Products—7.6% | ||||
| Estee Lauder Cos., Cl. A | 20,000 | 807,800 | ||
| L’Oreal, ADR | 1,840,000 | 35,806,400 | ||
| Procter & Gamble | 330,000 | 20,918,700 | ||
| 57,532,900 | ||||
| Insurance—1.9% | ||||
| Assicurazioni Generali | 239,900 | 9,521,510 | ||
| Zurich Financial Services | 20,500 | 5,069,361 | ||
| 14,590,871 | ||||
| Materials—2.9% | ||||
| Air Liquide, ADR | 474,118 | 20,192,686 | ||
| Yara International, ADR | 87,400 | 1,531,248 | ||
| 21,723,934 | ||||
| Media—6.1% | ||||
| CBS, Cl. B | 20,613 | 596,540 | ||
| McGraw-Hill Cos. | 390,800 | 25,077,636 | ||
| News, Cl. A | 784,400 | 16,354,740 | ||
| Pearson | 300,944 | 4,441,213 | ||
| 46,470,129 | ||||
| Pharmaceuticals & Biotechnology—9.8% | ||||
| Abbott Laboratories | 200,300 | 9,516,253 | ||
| Eli Lilly & Co. | 65,700 | 3,679,857 | ||
| Johnson & Johnson | 225,525 | 15,200,385 | ||
| Novartis, ADR | 143,000 | 8,684,390 | ||
| Pfizer | 80,754 | 2,152,094 | ||
| Roche Holding, ADR | 402,000 | 35,191,080 | ||
| 74,424,059 | ||||
| 10 |
| Common Stocks (continued) | Shares | Value ($) | ||||
| Retailing—.0% | ||||||
| Home Depot | 4,505 | 168,172 | ||||
| Semiconductors & Equipment—2.9% | ||||||
| Intel | 1,050,941 | 22,427,081 | ||||
| Software & Services—2.0% | ||||||
| Microsoft | 530,600 | 15,233,526 | ||||
| Transportation—.8% | ||||||
| United Parcel Service, Cl. B | 80,000 | 6,028,000 | ||||
| Total Investments (cost $424,960,760) | 100.1% | 762,655,817 | ||||
| Liabilities, Less Cash and Receivables | (.1%) | (891,393) | ||||
| Net Assets | 100.0% | 761,764,424 | ||||
| ADR—American Depository Receipts. | ||||||
| Portfolio Summary (Unaudited) † | ||||||
| Value (%) | Value (%) | |||||
| Food, Beverage & Tobacco | 22.0 | Capital Goods | 4.8 | |||
| Energy | 17.4 | Consumer Durables & Apparel | 4.6 | |||
| Pharmaceuticals & Biotechnology | 9.8 | Food & Staples Retailing | 4.1 | |||
| Diversified Financial Services | 9.4 | Other | 14.3 | |||
| Household & Personal Products | 7.6 | |||||
| Media | 6.1 | 100.1 | ||||
| † Based on net assets. | ||||||
| See notes to financial statements. | ||||||
| The Fund 11 |
| STATEMENT OF ASSETS AND LIABILITIES October 31, 2006 |
| Cost | Value | |||||||||
| Assets ($): | ||||||||||
| Investments in securities—See Statement of Investments | 424,960,760 | 762,655,817 | ||||||||
| Cash | 101,048 | |||||||||
| Receivable for investment securities sold | 1,235,317 | |||||||||
| Receivable for shares of Common Stock subscribed | 300,036 | |||||||||
| Dividends and interest receivable | 288,038 | |||||||||
| Prepaid expenses | 35,941 | |||||||||
| 764,616,197 | ||||||||||
| Liabilities ($): | ||||||||||
| Due to The Dreyfus Corporation and affiliates—Note 3(c) | 866,845 | |||||||||
| Payable for shares of Common Stock redeemed | 759,422 | |||||||||
| Bank Loan payable—Note 2 | 750,000 | |||||||||
| Interest payable—Note 2 | 13,235 | |||||||||
| Accrued expenses | 462,271 | |||||||||
| 2,851,773 | ||||||||||
| Net Assets ($) | 761,764,424 | |||||||||
| Composition of Net Assets ($): | ||||||||||
| Paid-in capital | 499,738,282 | |||||||||
| Accumulated undistributed investment income—net | 775,960 | |||||||||
| Accumulated net realized gain (loss) on investments | (76,445,598) | |||||||||
| Accumulated net unrealized appreciation (depreciation) | ||||||||||
| on investments and foreign currency transactions | 337,695,780 | |||||||||
| Net Assets ($) | 761,764,424 | |||||||||
| Net Asset Value Per Share | ||||||||||
| Class A | Class B | Class C | Class R | Class T | ||||||
| Net Assets ($) | 570,586,432 | 97,333,688 | 87,963,981 | 1,824,627 | 4,055,696 | |||||
| Shares Outstanding | 13,966,182 | 2,514,399 | 2,305,693 | 44,216 | 100,378 | |||||
| Net Asset Value | ||||||||||
| Per Share ($) | 40.85 | 38.71 | 38.15 | 41.27 | 40.40 | |||||
| See notes to financial statements. | ||||||||||
| 12 |
| STATEMENT OF OPERATIONS Year Ended October 31, 2006 |
| Investment Income ($): | ||
| Income: | ||
| Cash dividends (net of $947,208 foreign taxes withheld at source): | ||
| Unaffiliated issuers | 17,207,361 | |
| Affiliated issuers | 75,664 | |
| Total Income | 17,283,025 | |
| Expenses: | ||
| Investment advisory fee—Note 3(a) | 5,706,940 | |
| Shareholder servicing costs—Note 3(c) | 3,252,945 | |
| Distribution fees—Note 3(b) | 1,566,361 | |
| Custodian fees | 122,652 | |
| Prospectus and shareholders’ reports | 101,886 | |
| Professional fees | 78,844 | |
| Registration fees | 74,342 | |
| Interest expense—Note 2 | 43,524 | |
| Directors’ fees and expenses—Note 3(d) | 21,802 | |
| Loan commitment fees—Note 2 | 5,955 | |
| Miscellaneous | 34,208 | |
| Total Expenses | 11,009,459 | |
| Investment Income—Net | 6,273,566 | |
| Realized and Unrealized Gain (Loss) on Investments—Note 4 ($): | ||
| Net realized gain (loss) on investments and foreign currency transactions | 56,802,780 | |
| Net unrealized appreciation (depreciation) on | ||
| investments and foreign currency transactions | 61,974,486 | |
| Net Realized and Unrealized Gain (Loss) on Investments | 118,777,266 | |
| Net Increase in Net Assets Resulting from Operations | 125,050,832 | |
| See notes to financial statements. |
| The Fund 13 |
STATEMENT OF CHANGES IN NET ASSETS
| Year Ended October 31, | ||||
| 2006 | 2005 | |||
| Operations ($): | ||||
| Investment income—net | 6,273,566 | 8,015,210 | ||
| Net realized gain (loss) on investments | 56,802,780 | 33,189,180 | ||
| Net unrealized appreciation | ||||
| (depreciation) on investments | 61,974,486 | 67,460,152 | ||
| Net Increase (Decrease) in Net Assets | ||||
| Resulting from Operations | 125,050,832 | 108,664,542 | ||
| Dividends to Shareholders from ($): | ||||
| Investment income—net: | ||||
| Class A shares | (8,641,653) | (7,321,525) | ||
| Class B shares | (668,416) | (1,025,755) | ||
| Class C shares | (822,549) | (699,338) | ||
| Class R shares | (18,508) | (55,103) | ||
| Class T shares | (49,825) | (50,334) | ||
| Total Dividends | (10,200,951) | (9,152,055) | ||
| Capital Stock Transactions ($): | ||||
| Net proceeds from shares sold: | ||||
| Class A shares | 114,706,540 | 157,220,944 | ||
| Class B shares | 5,792,423 | 7,416,221 | ||
| Class C shares | 7,524,878 | 7,462,846 | ||
| Class R shares | 944,107 | 847,874 | ||
| Class T shares | 399,458 | 571,798 | ||
| Dividends reinvested: | ||||
| Class A shares | 7,270,834 | 6,146,129 | ||
| Class B shares | 557,353 | 824,732 | ||
| Class C shares | 511,766 | 425,256 | ||
| Class R shares | 17,586 | 54,290 | ||
| Class T shares | 48,467 | 49,270 | ||
| Cost of shares redeemed: | ||||
| Class A shares | (166,931,801) | (153,627,188) | ||
| Class B shares | (81,087,983) | (179,854,616) | ||
| Class C shares | (20,313,029) | (29,170,650) | ||
| Class R shares | (1,379,582) | (2,263,369) | ||
| Class T shares | (642,256) | (1,341,885) | ||
| Increase (Decrease) in Net Assets | ||||
| from Capital Stock Transactions | (132,581,239) | (185,238,348) | ||
| Total Increase (Decrease) in Net Assets | (17,731,358) | (85,725,861) | ||
| Net Assets ($): | ||||
| Beginning of Period | 779,495,782 | 865,221,643 | ||
| End of Period | 761,764,424 | 779,495,782 | ||
| Undistributed investment income—net | 775,960 | 4,707,707 | ||
14
| Year Ended October 31, | ||||
| 2006 | 2005 | |||
| Capital Share Transactions: | ||||
| Class A a | ||||
| Shares sold | 3,018,366 | 4,653,186 | ||
| Shares issued for dividends reinvested | 200,875 | 188,112 | ||
| Shares redeemed | (4,432,471) | (4,509,744) | ||
| Net Increase (Decrease) in Shares Outstanding | (1,213,230) | 331,554 | ||
| Class B a | ||||
| Shares sold | 161,120 | 227,554 | ||
| Shares issued for dividends reinvested | 16,091 | 26,476 | ||
| Shares redeemed | (2,292,606) | (5,619,110) | ||
| Net Increase (Decrease) in Shares Outstanding | (2,115,395) | (5,365,080) | ||
| Class C | ||||
| Shares sold | 216,422 | 234,780 | ||
| Shares issued for dividends reinvested | 15,038 | 13,825 | ||
| Shares redeemed | (580,436) | (918,968) | ||
| Net Increase (Decrease) in Shares Outstanding | (348,976) | (670,363) | ||
| Class R | ||||
| Shares sold | 23,706 | 24,871 | ||
| Shares issued for dividends reinvested | 481 | 1,648 | ||
| Shares redeemed | (37,134) | (65,342) | ||
| Net Increase (Decrease) in Shares Outstanding | (12,947) | (38,823) | ||
| Class T | ||||
| Shares sold | 10,741 | 16,865 | ||
| Shares issued for dividends reinvested | 1,351 | 1,521 | ||
| Shares redeemed | (17,267) | (39,633) | ||
| Net Increase (Decrease) in Shares Outstanding | (5,175) | (21,247) | ||
| a | During the period ended October 31, 2006, 1,175,666 Class B shares representing $41,542,986 were | |
| automatically converted to 1,117,242 Class A shares and during the period ended October 31, 2005, 3,084,710 | ||
| Class B shares representing $98,683,917 were automatically converted to 2,922,904 Class A shares. | ||
| See notes to financial statements. | ||
| The Fund 15 |
FINANCIAL HIGHLIGHTS
The following tables describe the performance for each share class for the fiscal periods indicated.All information (except portfolio turnover rate) reflects financial results for a single fund share.Total return shows how much your investment in the fund would have increased (or decreased) during each period, assuming you had reinvested all dividends and distributions.These figures have been derived from the fund’s financial statements.
| Year Ended October 31, | ||||||||||||
| Class A Shares | 2006 | 2005 | 2004 | 2003 | 2002 | |||||||
| Per Share Data ($): | ||||||||||||
| Net asset value, beginning of period | 35.12 | 31.35 | 29.73 | 25.60 | 28.84 | |||||||
| Investment Operations: | ||||||||||||
| Investment income—net a | .39 | .42 | .23 | .21 | .10 | |||||||
| Net realized and unrealized | ||||||||||||
| gain (loss) on investments | 5.91 | 3.83 | 1.79 | 3.92 | (3.34) | |||||||
| Total from Investment Operations | 6.30 | 4.25 | 2.02 | 4.13 | (3.24) | |||||||
| Distributions: | ||||||||||||
| Dividends from investment income—net | (.57) | (.48) | (.40) | — | — | |||||||
| Net asset value, end of period | 40.85 | 35.12 | 31.35 | 29.73 | 25.60 | |||||||
| Total Return (%) b | 18.16 | 13.63 | 6.85 | 16.13 | (11.24) | |||||||
| Ratios/Supplemental Data (%): | ||||||||||||
| Ratio of total expenses | ||||||||||||
| to average net assets | 1.23 | 1.24 | 1.25 | 1.27 | 1.32 | |||||||
| Ratio of net expenses | ||||||||||||
| to average net assets | 1.23 | 1.24 | 1.25 | 1.27 | 1.32 | |||||||
| Ratio of net investment income | ||||||||||||
| to average net assets | 1.04 | 1.21 | .73 | .79 | .34 | |||||||
| Portfolio Turnover Rate | .30 | .52 | .58 | 1.08 | 1.58 | |||||||
| Net Assets, end of period ($ x 1,000) | 570,586 | 533,041 | 465,536 | 390,243 | 320,717 | |||||||
| a | Based on average shares outstanding at each month end. | |||||||||||
| b | Exclusive of sales charge. | |||||||||||
| See notes to financial statements. | ||||||||||||
| 16 |
| Year Ended October 31, | ||||||||||||
| Class B Shares | 2006 | 2005 | 2004 | 2003 | 2002 | |||||||
| Per Share Data ($): | ||||||||||||
| Net asset value, beginning of period | 33.19 | 29.54 | 28.03 | 24.33 | 27.59 | |||||||
| Investment Operations: | ||||||||||||
| Investment income (loss)—net a | .08 | .17 | (.03) | .00b | (.11) | |||||||
| Net realized and unrealized | ||||||||||||
| gain (loss) on investments | 5.60 | 3.59 | 1.69 | 3.70 | (3.15) | |||||||
| Total from Investment Operations | 5.68 | 3.76 | 1.66 | 3.70 | (3.26) | |||||||
| Distributions: | ||||||||||||
| Dividends from investment income—net | (.16) | (.11) | (.15) | — | — | |||||||
| Net asset value, end of period | 38.71 | 33.19 | 29.54 | 28.03 | 24.33 | |||||||
| Total Return (%) c | 17.16 | 12.73 | 5.96 | 15.21 | (11.82) | |||||||
| Ratios/Supplemental Data (%): | ||||||||||||
| Ratio of total expenses | ||||||||||||
| to average net assets | 2.08 | 2.06 | 2.07 | 2.05 | 2.03 | |||||||
| Ratio of net expenses | ||||||||||||
| to average net assets | 2.08 | 2.06 | 2.07 | 2.05 | 2.03 | |||||||
| Ratio of net investment income | ||||||||||||
| (loss) to average net assets | .23 | .53 | (.10) | .02 | (.39) | |||||||
| Portfolio Turnover Rate | .30 | .52 | .58 | 1.08 | 1.58 | |||||||
| Net Assets, end of period ($ x 1,000) | 97,334 | 153,641 | 295,281 | 432,448 | 509,980 | |||||||
| a | Based on average shares outstanding at each month end. | |||||||||||
| b | Amount represents less than $.01 per share. | |||||||||||
| c | Exclusive of sales charge. | |||||||||||
| See notes to financial statements. | ||||||||||||
| The Fund 17 |
| FINANCIAL HIGHLIGHTS (continued) |
| Year Ended October 31, | ||||||||||||
| Class C Shares | 2006 | 2005 | 2004 | 2003 | 2002 | |||||||
| Per Share Data ($): | ||||||||||||
| Net asset value, beginning of period | 32.82 | 29.30 | 27.82 | 24.13 | 27.36 | |||||||
| Investment Operations: | ||||||||||||
| Investment income (loss)—net a | .11 | .16 | (.01) | .01 | (.10) | |||||||
| Net realized and unrealized | ||||||||||||
| gain (loss) on investments | 5.53 | 3.58 | 1.67 | 3.68 | (3.13) | |||||||
| Total from Investment Operations | 5.64 | 3.74 | 1.66 | 3.69 | (3.23) | |||||||
| Distributions: | ||||||||||||
| Dividends from investment income—net | (.31) | (.22) | (.18) | — | — | |||||||
| Net asset value, end of period | 38.15 | 32.82 | 29.30 | 27.82 | 24.13 | |||||||
| Total Return (%) b | 17.30 | 12.77 | 6.07 | 15.25 | (11.80) | |||||||
| Ratios/Supplemental Data (%): | ||||||||||||
| Ratio of total expenses | ||||||||||||
| to average net assets | 1.96 | 2.01 | 2.02 | 2.02 | 2.01 | |||||||
| Ratio of net expenses | ||||||||||||
| to average net assets | 1.96 | 2.01 | 2.02 | 2.02 | 2.01 | |||||||
| Ratio of net investment income | ||||||||||||
| (loss) to average net assets | .31 | .48 | (.05) | .04 | (.37) | |||||||
| Portfolio Turnover Rate | .30 | .52 | .58 | 1.08 | 1.58 | |||||||
| Net Assets, end of period ($ x 1,000) | 87,964 | 87,120 | 97,433 | 110,960 | 116,415 | |||||||
| a | Based on average shares outstanding at each month end. | |||||||||||
| b | Exclusive of sales charge. | |||||||||||
| See notes to financial statements. | ||||||||||||
| 18 |
| Year Ended October 31, | ||||||||||
| Class R Shares | 2006 | 2005 | 2004 | 2003 | 2002 | |||||
| Per Share Data ($): | ||||||||||
| Net asset value, beginning of period | 35.49 | 31.69 | 29.95 | 25.75 | 28.88 | |||||
| Investment Operations: | ||||||||||
| Investment income—net a | .42 | .59 | .36 | .29 | .24 | |||||
| Net realized and unrealized | ||||||||||
| gain (loss) on investments | 6.01 | 3.80 | 1.81 | 3.91 | (3.37) | |||||
| Total from Investment Operations | 6.43 | 4.39 | 2.17 | 4.20 | (3.13) | |||||
| Distributions: | ||||||||||
| Dividends from investment income—net | (.65) | (.59) | (.43) | — | — | |||||
| Net asset value, end of period | 41.27 | 35.49 | 31.69 | 29.95 | 25.75 | |||||
| Total Return (%) | 18.35 | 14.01 | 7.28 | 16.31 | (10.84) | |||||
| Ratios/Supplemental Data (%): | ||||||||||
| Ratio of total expenses | ||||||||||
| to average net assets | 1.06 | .91 | .85 | .96 | .93 | |||||
| Ratio of net expenses | ||||||||||
| to average net assets | 1.06 | .91 | .85 | .96 | .93 | |||||
| Ratio of net investment income | ||||||||||
| to average net assets | 1.19 | 1.74 | 1.14 | 1.10 | .82 | |||||
| Portfolio Turnover Rate | .30 | .52 | .58 | 1.08 | 1.58 | |||||
| Net Assets, end of period ($ x 1,000) | 1,825 | 2,029 | 3,042 | 3,257 | 3,005 | |||||
| a Based on average shares outstanding at each month end. | ||||||||||
| See notes to financial statements. | ||||||||||
| The Fund 19 |
| FINANCIAL HIGHLIGHTS (continued) |
| Year Ended October 31, | ||||||||||||
| Class T Shares | 2006 | 2005 | 2004 | 2003 | 2002 | |||||||
| Per Share Data ($): | ||||||||||||
| Net asset value, beginning of period | 34.71 | 31.00 | 29.41 | 25.39 | 28.63 | |||||||
| Investment Operations: | ||||||||||||
| Investment income—net a | .30 | .33 | .15 | .13 | .06 | |||||||
| Net realized and unrealized | ||||||||||||
| gain (loss) on investments | 5.86 | 3.78 | 1.78 | 3.89 | (3.30) | |||||||
| Total from Investment Operations | 6.16 | 4.11 | 1.93 | 4.02 | (3.24) | |||||||
| Distributions: | ||||||||||||
| Dividends from investment income—net | (.47) | (.40) | (.34) | — | — | |||||||
| Net asset value, end of period | 40.40 | 34.71 | 31.00 | 29.41 | 25.39 | |||||||
| Total Return (%) b | 17.90 | 13.38 | 6.58 | 15.83 | (11.32) | |||||||
| Ratios/Supplemental Data (%): | ||||||||||||
| Ratio of total expenses | ||||||||||||
| to average net assets | 1.46 | 1.49 | 1.49 | 1.50 | 1.50 | |||||||
| Ratio of net expenses | ||||||||||||
| to average net assets | 1.46 | 1.49 | 1.49 | 1.50 | 1.50 | |||||||
| Ratio of net investment income | ||||||||||||
| to average net assets | .80 | .99 | .49 | .51 | .20 | |||||||
| Portfolio Turnover Rate | .30 | .52 | .58 | 1.08 | 1.58 | |||||||
| Net Assets, end of period ($ x 1,000) | 4,056 | 3,664 | 3,931 | 3,403 | 2,623 | |||||||
| a | Based on average shares outstanding at each month end. | |||||||||||
| b | Exclusive of sales charge. | |||||||||||
| See notes to financial statements. | ||||||||||||
| 20 |
NOTES TO FINANCIAL STATEMENTS
NOTE 1—Significant Accounting Policies:
Dreyfus Premier Worldwide Growth Fund, Inc. (the “fund”) is registered under the Investment Company Act of 1940, as amended (the “Act”), as a diversified open-end management investment company. The fund’s investment objective is to provide investors with long-term capital growth consistent with the preservation of capital.The Dreyfus Corporation (the “Manager” or “Dreyfus”) serves as the fund’s investment adviser. Fayez Sarofim & Co. (“Sarofim”) serves as the fund’s sub-investment adviser. Dreyfus is a wholly-owned subsidiary of Mellon Financial Corporation (“Mellon Financial”).
Dreyfus Service Corporation (the “Distributor”), a wholly-owned subsidiary of Dreyfus, is the distributor of the fund’s shares. The fund is authorized to issue 100 million shares of $.001 par value Common Stock in each of the following classes of shares: Class A, Class B, Class C, Class R and Class T. Class A and Class T shares are subject to a sales charge imposed at the time of purchase. Class B shares are subject to a contingent deferred sales charge (“CDSC”) imposed on Class B share redemptions made within six years of purchase and automatically convert to Class A shares after six years.Class C shares are subject to a CDSC on Class C shares redeemed within one year of purchase and Class R shares are sold at net asset value per share only to institutional investors. Other differences between the classes include the services offered to and the expenses borne by each class and certain voting rights. Income, expenses (other than expenses attributable to a specific class) and realized and unrealized gains or losses on investments are allocated to each class of shares based on its relative net assets.
Effective March 1, 2006, Class A shares of the fund may be purchased at net asset value (“NAV”) without payment of a sales charge:
• By qualified investors who (i) purchase Class A shares directly through the Distributor, and (ii) have, or whose spouse or minor children have, beneficially owned shares and continuously maintained an open account directly through the Distributor in a Dreyfus-managed fund,
| The Fund 21 |
| NOTES TO FINANCIAL STATEMENTS (continued) |
including the fund, or a Founders Asset Managed LLC (“Founders”) managed fund since on or before February 28, 2006. Founders is a wholly-owned subsidiary of the Distributor.
• With the cash proceeds from an investor’s exercise of employment-related stock options, whether invested in the fund directly or indirectly through an exchange from a Dreyfus-managed money market fund, provided that the proceeds are processed through an entity that has entered into an agreement with the Distributor specifically relating to processing stock options. Upon establishing the account in the fund or the Dreyfus-managed money market fund, the investor and the investor’s spouse and minor children become eligible to purchase Class A shares of the fund at NAV, whether or not using the proceeds of the employment-related stock options.
• By members of qualified affinity groups who purchase Class A shares directly through the Distributor, provided that the qualified affinity group has entered into an affinity agreement with the Distributor.
Effective March 1, 2006, Class A and Class T shares of the fund may be purchased at NAV without payment of a sales charge:
• For Dreyfus-sponsored IRA “Rollover Accounts” with the distribution proceeds from qualified and non-qualified retirement plans or a Dreyfus-sponsored 403(b)(7) plan, provided that, in the case of a qualified or non-qualified retirement plan, the rollover is processed through an entity that has entered into an agreement with the Distributor specifically relating to processing rollovers. Upon establishing the Dreyfus-sponsored IRA rollover account in the fund, the shareholder becomes eligible to make subsequent purchases of Class A or Class T shares of the fund at NAV in such account.
Effective June 1, 2006, the fund no longer offers Class B shares, except in connection with dividend reinvestment and permitted exchanges of Class B shares.
The fund’s financial statements are prepared in accordance with U.S. generally accepted accounting principles, which may require the use of management estimates and assumptions. Actual results could differ from those estimates.
| 22 |
The fund enters into contracts that contain a variety of indemnifications. The fund’s maximum exposure under these arrangements is unknown.The fund does not anticipate recognizing any loss related to these arrangements.
(a) Portfolio valuation: Investments in securities are valued at the last sales price on the securities exchange or national securities market on which such securities are primarily traded. Securities listed on the National Market System for which market quotations are available, are valued at the official closing price or, if there is no official closing price that day, at the last sales price. Securities not listed on an exchange or the national securities market, or securities for which there were no transactions, are valued at the average of the most recent bid and asked prices, except for open short positions, where the asked price is used for valuation purposes. Bid price is used when no asked price is available. Investments in registered investment companies are valued at their NAV. When market quotations or official closing prices are not readily available, or are determined not to reflect accurately fair value, such as when the value of a security has been significantly affected by events after the close of the exchange or market on which the security is principally traded (for example, a foreign exchange or market), but before the fund calculates its NAV, the fund may value these investments at fair value as determined in accordance with the procedures approved by the Board of Directors. Fair valuing of securities may be determined with the assistance of a pricing service using calculations based on indices of domestic securities and other appropriate indicators, such as prices of relevant ADR’s and futures contracts. For other securities that are fair valued by the Board of Directors, certain factors may be considered such as: fundamental analytical data, the nature and duration of restrictions on disposition, an evaluation of the forces that influence the market in which the securities are purchased and sold, and public trading in similar securities of the issuer or comparable issuers. Financial futures are valued at the last sales price. Investments denominated in foreign currencies are translated to U.S. dollars at the prevailing rates of exchange. Forward currency exchange contracts are valued at the forward rate.
| The Fund 23 |
| NOTES TO FINANCIAL STATEMENTS (continued) |
On September 20, 2006, the FASB released Statement of Financial Accounting Standards No. 157 “Fair Value Measurements” (“FAS 157”). FAS 157 establishes an authoritative definition of fair value, sets out a framework for measuring fair value, and requires additional disclosures about fair-value measurements.The application of FAS 157 is required for fiscal years beginning after November 15, 2007 and interim periods within those fiscal years. Management does not believe that the application of this standard will have a material impact on the financial statements of the fund.
(b) Foreign currency transactions: The fund does not isolate that portion of the results of operations resulting from changes in foreign exchange rates on investments from the fluctuations arising from changes in market prices of securities held. Such fluctuations are included with the net realized and unrealized gain or loss on investments.
Net realized foreign exchange gains or losses arise from sales and maturities of short-term securities, sales of foreign currencies, currency gains or losses realized on securities transactions and the difference between the amounts of dividends, interest and foreign withholding taxes recorded on the fund’s books and the U.S. dollar equivalent of the amounts actually received or paid. Net unrealized foreign exchange gains and losses arise from changes in the value of assets and liabilities other than investments in securities, resulting from changes in exchange rates. Such gains and losses are included with net realized and unrealized gain or loss on investments.
(c) Securities transactions and investment income: Securities transactions are recorded on a trade date basis. Realized gain and loss from securities transactions are recorded on the identified cost basis. Dividend income is recognized on the ex-dividend date and interest income, including, where applicable, accretion of discount and amortization of premium on investments, is recognized on the accrual basis.
The fund has an arrangement with the custodian bank whereby the fund receives earnings credits from the custodian when positive cash balances are maintained, which are used to offset custody fees. For financial reporting purposes, the fund includes net earnings credits, if any, as an expense offset in the Statement of Operations.
| 24 |
(d) Affiliated issuers: Investments in other investment companies advised by the Manager are defined as “affiliated” in the Act.
(e) Dividends to shareholders: Dividends are recorded on the ex-dividend date. Dividends from investment income-net and dividends from net realized capital gain, if any, are normally declared and paid annually, but the fund may make distributions on a more frequent basis to comply with the distribution requirements of the Internal Revenue Code of 1986, as amended (the “Code”).To the extent that net realized capital gain can be offset by capital loss carryovers, it is the policy of the fund not to distribute such gain. Income and capital gain distributions are determined in accordance with income tax regulations, which may differ from U.S. generally accepted accounting principles.
(f) Federal income taxes: It is the policy of the fund to continue to qualify as a regulated investment company, if such qualification is in the best interests of its shareholders, by complying with the applicable provisions of the Code, and to make distributions of taxable income sufficient to relieve it from substantially all federal income and excise taxes.
On July 13, 2006, the Financial Accounting Standards Board (FASB) released FASB Interpretation No. 48 “Accounting for Uncertainty in Income Taxes” (FIN 48). FIN 48 provides guidance for how uncertain tax positions should be recognized, measured, presented and disclosed in the financial statements. FIN 48 requires the evaluation of tax positions taken or expected to be taken in the course of preparing the fund’s tax returns to determine whether the tax positions are “more-likely-than-not” of being sustained by the applicable tax authority.Tax positions not deemed to meet the more-likely-than-not threshold would be recorded as a tax benefit or expense in the current year. Adoption of FIN 48 is required for fiscal years beginning after December 15, 2006 and is to be applied to all open tax years as of the effective date. Management does not believe that the application of this standard will have a material impact on the financial statements of the fund.
At October 31, 2006, the components of accumulated earnings on a tax basis were as follows: undistributed ordinary income $4,815,452, accumulated capital losses $76,445,598 and unrealized appreciation $333,656,288.
| The Fund 25 |
| NOTES TO FINANCIAL STATEMENTS (continued) |
The accumulated capital loss carryover is available to be applied against future net securities profits, if any, realized subsequent to October 31, 2006. If not applied, $15,947,030 of the carryover expires in fiscal 2008, $14,032,078 expires in fiscal 2010, $28,550,186 expires in fiscal 2011 and $17,916,304 expires in fiscal 2012.
The tax character of distributions paid to shareholders during the fiscal periods ended October 31, 2006 and October 31, 2005, were as follows: ordinary income $10,200,951 and $9,152,055, respectively.
During the period ended October 31,2006,as a result of permanent book to tax differences, primarily due to the tax treatment for foreign currency exchange gains and losses and passive foreign investment companies, the fund decreased accumulated undistributed investment income-net by $4,362 and increased accumulated net realized gain (loss) on investments by the same amount. Net assets were not affected by this reclassification.
NOTE 2—Bank Line of Credit:
The fund participates with other Dreyfus-managed funds in a $350 million redemption credit facility (the “Facility”) to be utilized for temporary or emergency purposes, including the financing of redemptions. In connection therewith, the fund has agreed to pay commitment fees on its pro rata portion of the Facility. Interest is charged to the fund based on prevailing market rates in effect at the time of borrowing.
The average daily amount of borrowings outstanding under the Facility during the period ended October 31,2006,was approximately $820,300, with a related weighted average annualized interest rate of 5.31% .
NOTE 3—Investment Advisory Fee, Sub-Investment Advisory Fee and Other Transactions With Affiliates:
(a) Pursuant to an Investment Advisory Agreement with Dreyfus, the investment advisory fee is computed at the annual rate of .75% of the value of the fund’s average daily net assets and is payable monthly.
| 26 |
Pursuant to a Sub-Investment Advisory Agreement between Dreyfus and Sarofim, Dreyfus has agreed to pay Sarofim a monthly sub-investment advisory fee, computed at the following annual rates:
| Annual Fee as a Percentage of | ||
| Total Net Assets | Average Daily Net Assets | |
| 0 to $25 million | 11% | |
| $25 million up to $75 million | 18% | |
| $75 million up to $200 million | 22% | |
| $200 million up to $300 million | 26% | |
| In excess of $300 million | 275% |
During the period ended October 31, 2006, the Distributor retained $49,990 and $1,241 from commissions earned on sales of the fund’s Class A and Class T shares,respectively,and $277,019 and $13,352 from CDSC on redemptions of the fund’s Class B and Class C shares, respectively.
(b) Under a Distribution Plan (the “Plan”) adopted pursuant to Rule 12b-1 under the Act, Class B, Class C and Class T shares pay the Distributor for distributing their shares at an annual rate of .75% of the value of the average daily net assets of Class B and Class C shares and .25% of the value of the average daily net assets of Class T shares. During the period ended October 31, 2006, Class B, Class C and Class T shares were charged $899,767,$656,923 and $9,671,respectively,pursuant to the Plan.
(c) Under the Shareholder Services Plan, Class A, Class B, Class C and Class T shares pay the Distributor, at an annual rate of .25% of the value of their average daily net assets for the provision of certain services.The services provided may include personal services relating to shareholder accounts, such as answering shareholder inquiries regarding the fund and providing reports and other information, and services related to the maintenance of shareholder accounts.The Distributor may make payments to Service Agents (a securities dealer, financial institution or other industry professional) in respect of these services.The Distributor determines the amounts to be paid to Service Agents. During the
| The Fund 27 |
| NOTES TO FINANCIAL STATEMENTS (continued) |
period ended October 31, 2006, Class A, Class B, Class C and Class T shares were charged $1,370,518, $299,922, $218,974 and $9,671, respectively, pursuant to the Shareholder Services Plan.
The fund compensates Dreyfus Transfer, Inc., a wholly-owned subsidiary of Dreyfus, under a transfer agency agreement for providing personnel and facilities to perform transfer agency services for the fund. During the period ended October 31, 2006, the fund was charged $720,853, pursuant to the transfer agency agreement.
During the period ended October 31, 2006, the fund was charged $4,164 for services performed by the Chief Compliance Officer.
The components of Due to The Dreyfus Corporation and affiliates in the Statement of Assets and Liabilities consist of: investment advisory fees $482,184, Rule 12b-1 distribution plan fees $117,664, shareholder services plan fees $160,275, chief compliance officer fees $1,363 and transfer agency per account fees $105,359.
(d) Each Board member also serves as a Board member of other funds within the Dreyfus complex. Annual retainer fees and attendance fees are allocated to each fund based on net assets.
(e) Pursuant to an exemptive order from the SEC, the fund may invest its available cash balances in affiliated money market mutual funds. Management fees of the underlying money market mutual funds have been waived by Dreyfus.
NOTE 4—Securities Transactions:
The aggregate amount of purchases and sales of investment securities, excluding short-term securities, during the period ended October 31, 2006, amounted to $2,252,728 and $139,533,946, respectively.
At October 31, 2006, the cost of investments for federal income tax purposes was $429,000,252; accordingly, accumulated net unrealized appreciation on investments was $333,655,565, consisting of $351,963,473 gross unrealized appreciation and $18,307,908 gross unrealized depreciation.
| 28 |
REPORT OF INDEPENDENT REGISTERED PUBLIC ACCOUNTING FIRM
| Shareholders and Board of Directors Dreyfus Premier Worldwide Growth Fund, Inc. |
We have audited the accompanying statement of assets and liabilities of Dreyfus Premier Worldwide Growth Fund, Inc., including the statement of investments,as of October 31,2006 and the related statement of operations for the year then ended, the statement of changes in net assets for each of the two years in the period then ended, and financial highlights for each of the years indicated therein. These financial statements and financial highlights are the responsibility of the Fund’s management.Our responsibility is to express an opinion on these financial statements and financial highlights based on our audits.
We conducted our audits in accordance with the standards of the Public Company Accounting Oversight Board (United States).Those standards require that we plan and perform the audit to obtain reasonable assurance about whether the financial statements and financial highlights are free of material misstatement.We were not engaged to perform an audit of the Fund’s internal control over financial reporting.Our audits included consideration of internal control over financial reporting as a basis for designing audit procedures that are appropriate in the circumstances,but not for the purpose of expressing an opinion on the effectiveness of the Fund’s internal control over financial reporting.Accordingly, we express no such opinion.An audit also includes examining, on a test basis, evidence supporting the amounts and disclosures in the financial statements and financial highlights, assessing the accounting principles used and significant estimates made by management, and evaluating the overall financial statement presentation. Our procedures included confirmation of securities owned as of October 31,2006 by correspondence with the custodian.We believe that our audits provide a reasonable basis for our opinion.
In our opinion, the financial statements and financial highlights referred to above present fairly, in all material respects, the financial position of Dreyfus Premier Worldwide Growth Fund, Inc. at October 31, 2006, the results of its operations for the year then ended, the changes in its net assets for each of the two years in the period then ended, and the financial highlights for each of the indicated years, in conformity with U.S. generally accepted accounting principles.
![]()
| New York, New York December 12, 2006 |
| The Fund 29 |
IMPORTANT TAX INFORMATION (Unaudited)
In accordance with federal tax law, the fund hereby designates 100% of the ordinary dividends paid during the fiscal year ended October 31, 2006 as qualifying for the corporate dividends received deduction. For fiscal year ended October 31, 2006, certain dividends paid by the fund may be subject to a maximum tax rate of 15%, as provided for by the Jobs and Growth Tax Relief Reconciliation Act of 2003. Of the distributions paid during the fiscal year, $10,200,951 represents the maximum that may be considered qualified dividend income. Shareholders will receive notification in January 2007 of the percentage applicable to the preparation of their 2006 income tax returns.
| 30 |
INFORMATION ABOUT THE REVIEW AND APPROVAL OF THE FUND’S MANAGEMENT AGREEMENT (Unaudited)
At a meeting of the fund’s Board of Directors held on August 2, 2006, the Board considered the re-approval for an annual period (through September 5, 2007) of the fund’s Investment Management Agreement (“Management Agreement”), pursuant to which the Manager provides the fund with investment advisory and administrative services, and the Sub-Investment Advisory Agreement (the “Sub-Investment Advisory Agreement”) between the Manager and Fayez Sarofim & Co. (“Sarofim & Co.”), with respect to the fund, pursuant to which Sarofim & Co. provides day-to-day management of the fund’s investments subject to the Manager’s oversight. The Board members, none of whom are “interested persons” (as defined in the Investment Company Act of 1940, as amended) of the fund, were assisted in their review by independent legal counsel and met with counsel in executive session separate from representatives of the Manager and Sarofim & Co.
Analysis of Nature, Extent and Quality of Services Provided to the Fund. The Board members received a presentation from representatives of the Manager regarding services provided to the fund and other funds in the Dreyfus fund complex, and discussed the nature, extent and quality of the services provided to the fund pursuant to its Management Agreement, and by Sarofim & Co. pursuant to the Sub-Investment Advisory Agreement.The Manager’s representatives reviewed the fund’s distribution of accounts and the relationships the Manager has with various intermediaries and the different needs of each.The Manager’s representatives noted the distribution channels for the fund as well as the diversity of distribution among the funds in the Dreyfus fund complex, and the Manager’s corresponding need for broad, deep, and diverse resources to be able to provide ongoing shareholder services to each distribution channel, including those of the fund.The Board also reviewed the number of shareholder accounts in the fund, as well as the fund’s asset size.
The Board members also considered Sarofim & Co.’s research and portfolio management capabilities.The Board members considered that the Manager also provides oversight of day-to-day fund operations, including fund accounting and administration and assistance in meeting legal and regulatory requirements, and the Manager’s extensive administrative,
| The Fund 31 |
INFORMATION ABOUT THE REVIEW AND APPROVAL OF THE FUND’S MANAGEMENT AGREEMENT (Unaudited) (continued)
accounting and compliance infrastructure, as well as the Manager’s supervisory activities over Sarofim & Co.
Comparative Analysis of the Fund’s Performance, Management Fee and Expense Ratio. The Board members reviewed the fund’s performance and placed significant emphasis on comparisons to a group of retail, front-end load, global large-cap core, value and growth funds (the “Performance Group”) and to a larger universe of funds, consisting of all retail and institutional global large-cap core funds (the “Performance Universe”), selected and provided by Lipper, Inc., an independent provider of investment company data. The Board noted that they had been provided with a description of the methodology Lipper used to select the Performance Group and Performance Universe as well as the Expense Group and Expense Universe (discussed below). The Board members discussed the results of the comparisons and noted that the fund achieved a range of 1st, 2nd, 3rd, 4th and 5th quintile rankings (the first quintile being the highest performance) among its Performance Group and Performance Universe on a total return basis for the 1-, 2-, 3-, 4-, 5-and 10-year time periods ended June 30, 2006. The Board members discussed with representatives of the Manager and Sarofim & Co. the investment strategy employed in the management of the fund’s assets and how that strategy affected the fund’s relative performance, particularly during periods when the fund had 4th or 5th quintile rankings.A representative of the Manager noted that high quality, mega-cap stocks had been out of favor for a long period of time but recently appear to have come back into favor.The Board members noted that Sarofim & Co. is an experienced Manager with a long-term “buy-and-hold” investment approach to investing in high quality companies that are predominantly “mega-cap” companies. Sarofim & Co.’s considerable reputation, based on following this investment approach, was noted. Dreyfus also provided the Board with the fund’s total return performance and the quartile, percentile and rank (as provided by Lipper) of the fund’s total return within its Lipper category (as provided by Lipper) for the three-month and year-to-date periods ended June 30, 2006.The Board noted that the fund’s total return performance was in Lipper’s first and second quartile (the first quartile being the best performance), respectively, for those periods.
| 32 |
The Board members also discussed the fund’s management fee and expense ratio and reviewed the range of management fees and expense ratios as compared to a comparable group of funds (the “Expense Group”) and a broader group of funds (the “Expense Universe”) each selected and provided by Lipper.The Board noted that the fund’s management fee and total expense ratio were in the first or second quintile (the first quintile reflecting the lowest fees and expense ratio) among its Expense Group and Expense Universe.
Representatives of the Manager reviewed with the Board members the fees paid to the Manager or its affiliates by mutual funds managed by the Manager or its affiliates with similar investment objectives, policies and strategies, and included in the same Lipper category as the fund (the “Similar Funds”), and by other accounts managed by the Manager, Sarofim & Co. or their respective affiliates with similar investment objectives, policies and strategies as the fund (collectively with the Similar Funds, the “Similar Accounts”).The Manager’s representatives explained the nature of the Similar Accounts and the differences, from the Manager’s and Sarofim & Co.’s perspective, as applicable, in providing services to such Similar Accounts as compared to managing and providing services to the fund.The Manager’s representatives also reviewed the costs associated with distribution through intermediaries.The Board analyzed differences in fees paid to the Manager or Sarofim & Co. and discussed the relationship of the fees paid in light of the Manager’s or Sarofim & Co.’s performance and the services provided, noting the fund’s “unitary fee” structure.The Board members considered the relevance of the fee information provided for the Similar Accounts managed by the Manager and Sarofim & Co. to evaluate the appropriateness and reasonableness of the fund’s management fee and sub-investment advisory fee.The Board acknowledged that differences in fees paid by the Similar Accounts seemed to be consistent with the services provided.
The Board considered the fee to Sarofim & Co. in relation to the fee paid to the Manager and the respective services provided by Sarofim & Co. and the Manager.The Board also noted that Sarofim & Co.’s fee is paid by the Manager and not the fund.
| The Fund 33 |
INFORMATION ABOUT THE REVIEW AND APPROVAL OF THE FUND’S MANAGEMENT AGREEMENT (Unaudited) (continued)
Analysis of Profitability and Economies of Scale. The Manager’s representatives reviewed the dollar amount of expenses allocated and profit received by the Manager and the method used to determine such expenses and profit. The Board members evaluated the profitability analysis in light of the relevant circumstances for the fund, including the recent decline in assets, and the extent to which economies of scale would be realized if the fund grows and whether fee levels reflect these economies of scale for the benefit of fund shareholders. The Board members also considered potential benefits to the Manager and Sarofim & Co. from acting as investment adviser and sub-investment adviser, respectively, and reviewed the soft dollar arrangements with respect to trading the fund’s portfolio.
It was noted that the Board members should consider the Manager’s profitability with respect to the fund as part of their evaluation of whether the fees under the Management Agreement bear a reasonable relationship to the mix of services provided by the Manager, including the nature, extent and quality of such services and that a discussion of economies of scale is predicated on increasing assets and that, if a fund’s assets had been decreasing, the possibility that the Manager may have realized any economies of scale would be less. Since the Manager, and not the fund, pays Sarofim & Co. pursuant to the Sub-Investment Advisory Agreement, the Board did not consider Sarofim & Co.’s profitability to be relevant to its deliberations. The Board members also discussed the profitability percentages determined by appropriate court cases to be reasonable given the services rendered to investment companies.They also noted that the profitability percentage for managing the fund was not unreasonable given the services rendered and generally superior service levels provided by the Manager.
At the conclusion of these discussions, the Board agreed that it had been furnished with sufficient information to make an informed business decision with respect to continuation of the fund’s Management Agreement and Sub-Investment Advisory Agreement. Based on the discussions and considerations described above, the Board made the following conclusions and determinations.
| 34 |
• The Board concluded that the nature, extent and quality of the services provided by the Manager and Sarofim & Co. are adequate and appropriate.
• The Board noted that the fund’s recent short-term performance had improved, but remained concerned with the fund’s longer-term performance. However, the Board understood that the fund’s performance was consistent with Sarofim & Co.’s investment approach during all periods, which involves investments in high quality mega-cap companies, and that, for a period of time, such companies have been out of favor but appear to have come back into favor recently. While management assured the Board members that portfolio management had been consistent with the strategy description in fund materials and Sarofim & Co.’s stated investment style, the Board determined to continue to closely monitor performance.
• The Board concluded that the fee paid by the fund to the Manager and by the Manager to Sarofim & Co., were reasonable in light of the considerations described above.
• The Board determined that the economies of scale which may accrue to the Manager and its affiliates in connection with the management of the fund had been adequately considered by the Manager in connection with the management fee rate charged to the fund and that, to the extent in the future it were to be determined that material economies of scale had not been shared with the fund, the Board would seek to have those economies of scale shared with the fund.
The Board members considered these conclusions and determinations, along with information received on a routine and regular basis throughout the year, and, without any one factor being dispositive, the Board determined that re-approval of the fund’s Management Agreement and the Sub-Investment Advisory Agreement between the Manager and Sarofim & Co. was in the best interests of the fund and its shareholders.
| The Fund 35 |
BOARD MEMBERS INFORMATION (Unaudited)
| Joseph S. DiMartino (63) Chairman of the Board (1995) |
| Principal Occupation During Past 5 Years: • Corporate Director and Trustee |
| Other Board Memberships and Affiliations: |
| • The Muscular Dystrophy Association, Director |
| • Century Business Services, Inc., a provider of outsourcing functions for small and medium size |
| companies, Director |
| • The Newark Group, a provider of a national market of paper recovery facilities, paperboard |
| mills and paperboard converting plants, Director |
| • Sunair Services Corporation, engaging in the design, manufacture and sale of high frequency |
| systems for long-range voice and data communications, as well as providing certain |
| outdoor-related services to homes and businesses, Director |
No. of Portfolios for which Board Member Serves: 189
| ——————— |
| Clifford L. Alexander, Jr. (73) |
| Board Member (1993) |
| Principal Occupation During Past 5 Years: |
| • President of Alexander & Associates, Inc., a management consulting firm (January 1981-present) |
| • Chairman of the Board of Moody’s Corporation (October 2000-October 2003) |
Other Board Memberships and Affiliations:
• Mutual of America Life Insurance Company, Director
No. of Portfolios for which Board Member Serves: 60
———————
| Peggy C. Davis (63) Board Member (1993) |
| Principal Occupation During Past 5 Years: |
| • Shad Professor of Law, New York University School of Law (1983-present) |
| • Writer and teacher in the fields of evidence, constitutional theory, family law, socia sciences |
| and the law, legal process and professional methodology and training |
| No. of Portfolios for which Board Member Serves: 71 |
| 36 |
| Ernest Kafka (73) Board Member (1993) |
| Principal Occupation During Past 5 Years: |
| • Physician engaged in private practice specializing in the psychoanalysis of adults and |
| adolescents (1962-present) |
| • Instructor,The New York Psychoanalytic Institute (1981-present) |
| • Associate Clinical Professor of Psychiatry at Cornell Medical School (1987-2002) |
| No. of Portfolios for which Board Member Serves: 23 |
| ——————— |
| Nathan Leventhal (63) Board Member (1993) |
| Principal Occupation During Past 5 Years: |
| • A management consultant for various non-profit organizations (May 2004-present) |
| • Chairman of the Avery-Fisher Artist Program (November 1997-present) |
| Other Board Memberships and Affiliations: • Movado Group, Inc., Director No. of Portfolios for which Board Member Serves: 23 ——————— |
Once elected all Board Members serve for an indefinite term.The address of the Board Members and Officers is in c/o The Dreyfus Corporation, 200 Park Avenue, New York, New York 10166.Additional information about the Board Members is available in the fund’s Statement of Additional Information which can be obtained from Dreyfus free of charge by calling this toll free number: 1-800-554-4611.
Saul B. Klaman, Emeritus Board Member
| The Fund 37 |
OFFICERS OF THE FUND (Unaudited)
STEPHEN E. CANTER, President since March 2000.
Chairman of the Board and Chief Executive Officer of the Manager, and an officer of 90 investment companies (comprised of 189 portfolios) managed by the Manager. Mr. Canter also is a Board member and, where applicable, an Executive Committee Member of the other investment management subsidiaries of Mellon Financial Corporation, each of which is an affiliate of the Manager. He is 61 years old and has been an employee of the Manager since May 1995.
MARK N. JACOBS, Vice President since March 2000.
Executive Vice President, Secretary and General Counsel of the Manager, and an officer of 91 investment companies (comprised of 205 portfolios) managed by the Manager. He is 60 years old and has been an employee of the Manager since June 1977.
MICHAEL A. ROSENBERG, Vice President and Secretary since August 2005.
Associate General Counsel of the Manager, and an officer of 91 investment companies (comprised of 205 portfolios) managed by the Manager. He is 46 years old and has been an employee of the Manager since October 1991.
JAMES BITETTO, Vice President and Assistant Secretary since August 2005.
Associate General Counsel and Assistant Secretary of the Manager, and an officer of 91 investment companies (comprised of 205 portfolios) managed by the Manager. He is 40 years old and has been an employee of the Manager since December 1996.
JONI LACKS CHARATAN, Vice President and Assistant Secretary since August 2005.
Associate General Counsel of the Manager, and an officer of 91 investment companies (comprised of 205 portfolios) managed by the Manager. She is 50 years old and has been an employee of the Manager since October 1988.
JOSEPH M. CHIOFFI, Vice President and Assistant Secretary since August 2005.
Associate General Counsel of the Manager, and an officer of 91 investment companies (comprised of 205 portfolios) managed by the Manager. He is 44 years old and has been an employee of the Manager since June 2000.
JANETTE E. FARRAGHER, Vice President and Assistant Secretary since August 2005.
Associate General Counsel of the Manager, and an officer of 91 investment companies (comprised of 205 portfolios) managed by the Manager. She is 43 years old and has been an employee of the Manager since February 1984.
JOHN B. HAMMALIAN, Vice President and Assistant Secretary since August 2005.
Associate General Counsel of the Manager, and an officer of 91 investment companies (comprised of 205 portfolios) managed by the Manager. He is 43 years old and has been an employee of the Manager since February 1991.
ROBERT R. MULLERY, Vice President and Assistant Secretary since August 2005.
Associate General Counsel of the Manager, and an officer of 91 investment companies (comprised of 205 portfolios) managed by the Manager. He is 54 years old and has been an employee of the Manager since May 1986.
JEFF PRUSNOFSKY, Vice President and Assistant Secretary since August 2005.
Associate General Counsel of the Manager, and an officer of 91 investment companies (comprised of 205 portfolios) managed by the Manager. He is 41 years old and has been an employee of the Manager since October 1990.
JAMES WINDELS, Treasurer since November 2001.
Director – Mutual Fund Accounting of the Manager, and an officer of 91 investment companies (comprised of 205 portfolios) managed by the Manager. He is 48 years old and has been an employee of the Manager since April 1985.
| 38 |
ERIK D. NAVILOFF, Assistant Treasurer since August 2005.
Senior Accounting Manager – Taxable Fixed Income Funds of the Manager, and an officer of 91 investment companies (comprised of 205 portfolios) managed by the Manager. He is 38 years old and has been an employee of the Manager since November 1992.
ROBERT ROBOL, Assistant Treasurer since August 2005.
Senior Accounting Manager – Money Market and Municipal Bond Funds of the Manager, and an officer of 91 investment companies (comprised of 205 portfolios) managed by the Manager. He is 42 years old and has been an employee of the Manager since October 1988.
ROBERT SVAGNA, Assistant Treasurer since December 2002.
Senior Accounting Manager – Equity Funds of the Manager, and an officer of 91 investment companies (comprised of 205 portfolios) managed by the Manager. He is 39 years old and has been an employee of the Manager since November 1990.
GAVIN C. REILLY, Assistant Treasurer since December 2005.
Tax Manager of the Investment Accounting and Support Department of the Manager, and an officer of 91 investment companies (comprised of 205 portfolios) managed by the Manager. He is 38 years old and has been an employee of the Manager since April 1991.
JOSEPH W. CONNOLLY, Chief Compliance Officer since October 2004.
Chief Compliance Officer of the Manager and The Dreyfus Family of Funds (91 investment companies, comprised of 205 portfolios). From November 2001 through March 2004, Mr. Connolly was first Vice-President, Mutual Fund Servicing for Mellon Global Securities Services. In that capacity, Mr. Connolly was responsible for managing Mellon’s Custody, Fund Accounting and Fund Administration services to third-party mutual fund clients. He is 49 years old and has served in various capacities with the Manager since 1980, including manager of the firm’s Fund Accounting Department from 1997 through October 2001.
WILLIAM GERMENIS, Anti-Money Laundering Compliance Officer since September 2002.
Vice President and Anti-Money Laundering Compliance Officer of the Distributor, and the Anti-Money Laundering Compliance Officer of 87 investment companies (comprised of 201 portfolios) managed by the Manager. He is 36 years old and has been an employee of the Distributor since October 1998.
| The Fund 39 |
NOTES
| For More | Information | |
| Dreyfus Premier | Custodian | |
| Worldwide Growth Fund, Inc. | ||
| The Bank of New York | ||
| 200 Park Avenue | ||
| One Wall Street | ||
| New York, NY 10166 | ||
| New York, NY 10286 | ||
| Investment Adviser | Transfer Agent & | |
| The Dreyfus Corporation | Dividend Disbursing Agent | |
| 200 Park Avenue | ||
| Dreyfus Transfer, Inc. | ||
| New York, NY 10166 | ||
| 200 Park Avenue | ||
| Sub-Investment Adviser | New York, NY 10166 | |
| Fayez Sarofim & Co. | Distributor | |
| Two Houston Center | ||
| Dreyfus Service Corporation | ||
| Suite 2907 | ||
| 200 Park Avenue | ||
| Houston,TX 77010 | ||
| New York, NY 10166 | ||
Telephone Call your financial representative or 1-800-554-4611
| The Dreyfus Premier Family of Funds | ||
| 144 Glenn Curtiss Boulevard, Uniondale, NY 11556-0144 |
The fund files its complete schedule of portfolio holdings with the Securities and Exchange Commission (“SEC”) for the first and third quarters of each fiscal year on Form N-Q. The fund’s Forms N-Q are available on the SEC’s website at http://www.sec.gov and may be reviewed and copied at the SEC’s Public Reference Room in Washington, DC. Information on the operation of the Public Reference Room may be obtained by calling 1-202-551-8090.
A description of the policies and procedures that the fund uses to determine how to vote proxies relating to portfolio securities, and information regarding how the fund voted these proxies for the 12-month period ended June 30, 2006, is available at http://www.dreyfus.com and on the SEC’s website at http://www.sec.gov. The description of the policies and procedures is also available without charge, upon request, by calling 1-800-645-6561.

Item 2. Code of Ethics.
The Registrant has adopted a code of ethics that applies to the Registrant's principal executive officer, principal financial officer, principal accounting officer or controller, or persons performing similar functions. There have been no amendments to, or waivers in connection with, the Code of Ethics during the period covered by this Report.
Item 3. Audit Committee Financial Expert.
The Registrant's Board has determined that Joseph S. DiMartino, a member of the Audit Committee of the Board, is an audit committee financial expert as defined by the Securities and Exchange Commission (the "SEC"). Mr. DiMartino is "independent" as defined by the SEC for purposes of audit committee financial expert determinations.
Item 4. Principal Accountant Fees and Services
(a) Audit Fees. The aggregate fees billed for each of the last two fiscal years (the "Reporting Periods") for professional services rendered by the Registrant's principal accountant (the "Auditor") for the audit of the Registrant's annual financial statements, or services that are normally provided by the Auditor in connection with the statutory and regulatory filings or engagements for the Reporting Periods, were $28,797 in 2005 and $30,166 in 2006.
(b) Audit-Related Fees. The aggregate fees billed in the Reporting Periods for assurance and related services by the Auditor that are reasonably related to the performance of the audit of the Registrant's financial statements and are not reported under paragraph (a) of this Item 4 were $-0- in 2005 and $-0- in 2006.
The aggregate fees billed in the Reporting Periods for non-audit assurance and related services by the Auditor to the Registrant's investment adviser (not including any sub-investment adviser whose role is primarily portfolio management and is subcontracted with or overseen by another investment adviser), and any entity controlling, controlled by or under common control with the investment adviser that provides ongoing services to the Registrant ("Service Affiliates"), that were reasonably related to the performance of the annual audit of the Service Affiliate, which required pre-approval by the Audit Committee were $-0- in 2005 and $-0- in 2006.
Note: For the second paragraph in each of (b) through (d) of this Item 4, certain of such services were not pre-approved prior to May 6, 2003, when such services were required to be pre-approved. On and after May 6, 2003, 100% of all services provided by the Auditor were pre-approved as required. For comparative purposes, the fees shown assume that all such services were pre-approved, including services that were not pre-approved prior to the compliance date of the pre-approval requirement.
(c) Tax Fees. The aggregate fees billed in the Reporting Periods for professional services rendered by the Auditor for tax compliance, tax advice and tax planning ("Tax Services") were $3,854 in 2005 and $4,367 in 2006. These services consisted of (i) review or preparation of U.S. federal, state, local and excise tax returns; (ii) U.S. federal, state and local tax planning, advice and assistance regarding statutory, regulatory or administrative developments, (iii) tax advice regarding tax qualification matters and/or treatment of various
financial instruments held or proposed to be acquired or held, and (iv) determination of Passive Foreign Investment Companies.
The aggregate fees billed in the Reporting Periods for Tax Services by the Auditor to Service Affiliates which required pre-approval by the Audit Committee were $-0- in 2005 and $-0- in 2006.
(d) All Other Fees. The aggregate fees billed in the Reporting Periods for products and services provided by the Auditor, other than the services reported in paragraphs (a) through (c) of this Item, were $2,951 in 2005 and $5,294 in 2006. These services consisted of a review of the Registrant's anti-money laundering program.
The aggregate fees billed in the Reporting Periods for Non-Audit Services by the Auditor to Service Affiliates, other than the services reported in paragraphs (b) through (c) of this Item, which required pre-approval by the Audit Committee were $-0- in 2005 and $-0- in 2006.
Audit Committee Pre-Approval Policies and Procedures. The Registrant's Audit Committee has established policies and procedures (the "Policy") for pre-approval (within specified fee limits) of the Auditor's engagements for non-audit services to the Registrant and Service Affiliates without specific case-by-case consideration. Pre-approval considerations include whether the proposed services are compatible with maintaining the Auditor's independence. Pre-approvals pursuant to the Policy are considered annually.
Non-Audit Fees. The aggregate non-audit fees billed by the Auditor for services rendered to the Registrant, and rendered to Service Affiliates, for the Reporting Periods were $755,822 in 2005 and $436,321 in 2006.
Auditor Independence. The Registrant's Audit Committee has considered whether the provision of non-audit services that were rendered to Service Affiliates which were not pre-approved (not requiring pre-approval) is compatible with maintaining the Auditor's independence.
| Item 5. | Audit Committee of Listed Registrants. | |
| Not applicable. [CLOSED-END FUNDS ONLY] | ||
| Item 6. | Schedule of Investments. | |
| Not applicable. | ||
| Item 7. | Disclosure of Proxy Voting Policies and Procedures for Closed-End Management | |
| Investment Companies. | ||
| Not applicable. [CLOSED-END FUNDS ONLY] | ||
| Item 8. | Portfolio Managers of Closed-End Management Investment Companies. | |
| Not applicable. [CLOSED-END FUNDS ONLY, beginning with reports for periods ended | ||
| on and after December 31, 2005] | ||
| Item 9. | Purchases of Equity Securities by Closed-End Management Investment Companies and | |
| Affiliated Purchasers. | ||
| Not applicable. [CLOSED-END FUNDS ONLY] | ||
| Item 10. | Submission of Matters to a Vote of Security Holders. |
The Registrant has a Nominating Committee (the "Committee"), which is responsible for selecting and nominating persons for election or appointment by the Registrant's Board as Board members. The Committee has adopted a Nominating Committee Charter (the "Charter"). Pursuant to the Charter, the Committee will consider recommendations for nominees from shareholders submitted to the Secretary of the Registrant, c/o The Dreyfus Corporation Legal Department, 200 Park Avenue, 8th Floor East, New York, New York 10166. A nomination submission must include information regarding the recommended nominee as specified in the Charter. This information includes all information relating to a recommended nominee that is required to be disclosed in solicitations or proxy statements for the election of Board members, as well as information sufficient to evaluate the factors to be considered by the Committee, including character and integrity, business and professional experience, and whether the person has the ability to apply sound and independent business judgment and would act in the interests of the Registrant and its shareholders.
Nomination submissions are required to be accompanied by a written consent of the individual to stand for election if nominated by the Board and to serve if elected by the shareholders, and such additional information must be provided regarding the recommended nominee as reasonably requested by the Committee.
Item 11. Controls and Procedures.
(a) The Registrant's principal executive and principal financial officers have concluded, based on their evaluation of the Registrant's disclosure controls and procedures as of a date within 90 days of the filing date of this report, that the Registrant's disclosure controls and procedures are reasonably designed to ensure that information required to be disclosed by the Registrant on Form N-CSR is recorded, processed, summarized and reported within the required time periods and that information required to be disclosed by the Registrant in the reports that it files or submits on Form N-CSR is accumulated and communicated to the Registrant's management, including its principal executive and principal financial officers, as appropriate to allow timely decisions regarding required disclosure.
(b) There were no changes to the Registrant's internal control over financial reporting that occurred during the second fiscal quarter of the period covered by this report that have materially affected, or are reasonably likely to materially affect, the Registrant's internal control over financial reporting.
Item 12. Exhibits.
| (a)(1) | Code of ethics referred to in Item 2. | |
| (a)(2) | Certifications of principal executive and principal financial officers as required by Rule 30a-2(a) | |
| under the Investment Company Act of 1940. | ||
| (a)(3) | Not applicable. | |
| (b) | Certification of principal executive and principal financial officers as required by Rule 30a-2(b) | |
| under the Investment Company Act of 1940. | ||
| SIGNATURES |
Pursuant to the requirements of the Securities Exchange Act of 1934 and the Investment Company Act of 1940, the Registrant has duly caused this Report to be signed on its behalf by the undersigned, thereunto duly authorized.
Dreyfus Premier Worldwide Growth Fund, Inc.
| By: | /s/ Stephen E. Canter | |||
| Stephen E. Canter | ||||
| President | ||||
| Date: | December 28, 2006 | |||
| Pursuant to the requirements of the Securities Exchange Act of 1934 and the Investment Company Act of | ||||
| 1940, this Report has been signed below by the following persons on behalf of the Registrant and in the | ||||
| capacities and on the dates indicated. | ||||
| By: | /s/ Stephen E. Canter | |||
| Stephen E. Canter | ||||
| Chief Executive Officer | ||||
| Date: | December 28, 2006 | |||
| By: | /s/ James Windels | |||
| James Windels | ||||
| Chief Financial Officer | ||||
| Date: | December 28, 2006 | |||
| EXHIBIT INDEX | ||||
| (a)(1) | Code of ethics referred to in Item 2. | |||
| (a)(2) | Certifications of principal executive and principal financial officers as required by Rule 30a- | |||
| 2(a) under the Investment Company Act of 1940. (EX-99.CERT) | ||||
| (b) | Certification of principal executive and principal financial officers as required by Rule 30a- | |||
| 2(b) under the Investment Company Act of 1940. (EX-99.906CERT) | ||||
Exhibit (a)(1)